|
| | |
| UNITED STATES |
| SECURITIES AND EXCHANGE COMMISSION |
| Washington, D.C. 20549 |
| |
| FORM 10-Q |
| |
| (Mark One) |
| [X] QUARTERLY REPORT PURSUANT TO SECTION 13 OR 15(d) OF THE SECURITIES EXCHANGE ACT OF 1934 |
For the quarterly period ended September 30, 2012March 31, 2013 |
| OR |
| [ ] TRANSITION REPORT PURSUANT TO SECTION 13 OR 15(d) OF THE SECURITIES EXCHANGE ACT OF 1934 |
| For the transition period from | | to |
| Commission File Number: 001-11307-01 |
Freeport-McMoRan Copper & Gold Inc.
(Exact name of registrant as specified in its charter)
|
| |
| Delaware | 74-2480931 |
| (State or other jurisdiction of | (I.R.S. Employer Identification No.) |
| incorporation or organization) | |
| | |
| 333 North Central Avenue | |
| Phoenix, AZ | 85004-2189 |
| (Address of principal executive offices) | (Zip Code) |
| (602) 366-8100 |
| (Registrant's telephone number, including area code) |
| | |
Indicate by check mark whether the registrant (1) has filed all reports required to be filed by Section 13 or 15(d) of the Securities Exchange Act of 1934 during the preceding 12 months (or for such shorter period that the registrant was required to file such reports), and (2) has been subject to such filing requirements for the past 90 days.
þ Yes ¨ No
Indicate by check mark whether the registrant has submitted electronically and posted on its corporate website, if any, every Interactive Data File required to be submitted and posted pursuant to Rule 405 of Regulation S-T (§ 232.405 of this chapter) during the preceding 12 months (or for such shorter period that the registrant was required to submit and post such files). þ Yes ¨ No
Indicate by check mark whether the registrant is a large accelerated filer, an accelerated filer, a non-accelerated filer, or a smaller reporting company. See the definitions of “large accelerated filer,” “accelerated filer” and “smaller reporting company” in Rule 12b-2 of the Exchange Act.
Large accelerated filer þ Accelerated filer ¨ Non-accelerated filer ¨ Smaller reporting company ¨
Indicate by check mark whether the registrant is a shell company (as defined in Rule 12b-2 of the Exchange Act).
¨ Yes þ No
On October 31, 2012April 30, 2013, there were issued and outstanding 949,318,834949,742,416 shares of the registrant’s common stock, par value $0.10 per share.
FREEPORT-McMoRan COPPER & GOLD INC.
TABLE OF CONTENTS
.
| |
| Part I. | FINANCIAL INFORMATION |
| |
| Item 1. | Financial Statements. |
FREEPORT-McMoRan COPPER & GOLD INC.
CONDENSED CONSOLIDATED BALANCE SHEETS (Unaudited)
| | | | September 30,
2012 | | December 31,
2011 | March 31,
2013 | | December 31,
2012 |
| | (In millions) | (In millions) |
| ASSETS | | | | | | |
| Current assets: | | | | | | |
| Cash and cash equivalents | $ | 3,727 |
| | $ | 4,822 |
| $ | 9,595 |
| | $ | 3,705 |
|
| Trade accounts receivable | 1,424 |
| | 892 |
| 1,082 |
| | 927 |
|
| Other accounts receivable | 242 |
| | 250 |
| 687 |
| | 702 |
|
| Inventories: | | | | | | |
| Mill and leach stockpiles | 1,595 |
| | 1,289 |
| 1,698 |
| | 1,672 |
|
| Materials and supplies, net | 1,465 |
| | 1,354 |
| 1,575 |
| | 1,504 |
|
| Product | 1,374 |
| | 1,226 |
| 1,536 |
| | 1,400 |
|
| Other current assets | 353 |
| | 214 |
| 410 |
| | 387 |
|
| Total current assets | 10,180 |
| | 10,047 |
| 16,583 |
| | 10,297 |
|
| Property, plant, equipment and development costs, net | 20,294 |
| | 18,449 |
| 21,689 |
| | 20,999 |
|
| Long-term mill and leach stockpiles | 1,871 |
| | 1,686 |
| 2,081 |
| | 1,955 |
|
| Long-term receivables | 1,004 |
| | 675 |
| |
| Intangible assets, net | 321 |
| | 325 |
| |
| Other assets | 847 |
| | 888 |
| 2,235 |
| | 2,189 |
|
| Total assets | $ | 34,517 |
| | $ | 32,070 |
| $ | 42,588 |
| | $ | 35,440 |
|
| | | | | | | |
| LIABILITIES AND EQUITY | | | | | | |
| Current liabilities: | | | | | | |
| Accounts payable and accrued liabilities | $ | 2,531 |
| | $ | 2,297 |
| $ | 2,892 |
| | $ | 3,007 |
|
| Dividends payable | 299 |
| | 240 |
| |
| Current portion of reclamation and environmental obligations | 259 |
| | 236 |
| 254 |
| | 241 |
|
| Accrued income taxes | 59 |
| | 163 |
| 125 |
| | 93 |
|
| Current portion of debt | 2 |
| | 4 |
| 4 |
| | 2 |
|
| Total current liabilities | 3,150 |
| | 2,940 |
| 3,275 |
| | 3,343 |
|
| Long-term debt, less current portion | 3,521 |
| | 3,533 |
| 10,088 |
| | 3,525 |
|
| Deferred income taxes | 3,378 |
| | 3,255 |
| 3,580 |
| | 3,490 |
|
| Reclamation and environmental obligations, less current portion | 2,194 |
| | 2,138 |
| 2,130 |
| | 2,127 |
|
| Other liabilities | 1,531 |
| | 1,651 |
| 1,666 |
| | 1,644 |
|
| Total liabilities | 13,774 |
| | 13,517 |
| 20,739 |
| | 14,129 |
|
| Equity: | | | | | | |
| FCX stockholders’ equity: | | | | | | |
| Common stock | 107 |
| | 107 |
| 107 |
| | 107 |
|
| Capital in excess of par value | 19,094 |
| | 19,007 |
| 19,163 |
| | 19,119 |
|
| Retained earnings | 1,953 |
| | 546 |
| 2,750 |
| | 2,399 |
|
| Accumulated other comprehensive loss | (439 | ) | | (465 | ) | (500 | ) | | (506 | ) |
| Common stock held in treasury | (3,576 | ) | | (3,553 | ) | (3,580 | ) | | (3,576 | ) |
| Total FCX stockholders’ equity | 17,139 |
| | 15,642 |
| 17,940 |
| | 17,543 |
|
| Noncontrolling interests | 3,604 |
| | 2,911 |
| 3,909 |
| | 3,768 |
|
| Total equity | 20,743 |
| | 18,553 |
| 21,849 |
| | 21,311 |
|
| Total liabilities and equity | $ | 34,517 |
| | $ | 32,070 |
| $ | 42,588 |
| | $ | 35,440 |
|
The accompanying notes are an integral part of these consolidated financial statements.
FREEPORT-McMoRan COPPER & GOLD INC.
CONSOLIDATED STATEMENTS OF INCOME (Unaudited)
| | | | Three Months Ended | | Nine Months Ended | Three Months Ended |
| | September 30, | | September 30, | March 31, |
| | 2012 | | 2011 | | 2012 | | 2011 | 2013 | | 2012 |
| | (In millions, except per share amounts) | (In millions, except per share amounts) |
| Revenues | $ | 4,417 |
| | $ | 5,195 |
| | $ | 13,497 |
| | $ | 16,718 |
| $ | 4,583 |
| | $ | 4,605 |
|
| Cost of sales: | | | | | | | | | | |
| Production and delivery | 2,592 |
| | 2,570 |
| | 7,642 |
| | 7,504 |
| 2,719 |
| | 2,428 |
|
| Depreciation, depletion and amortization | 298 |
| | 257 |
| | 856 |
| | 756 |
| 329 |
| | 267 |
|
| Total cost of sales | 2,890 |
| | 2,827 |
| | 8,498 |
| | 8,260 |
| 3,048 |
| | 2,695 |
|
| Selling, general and administrative expenses | 110 |
| | 102 |
| | 311 |
| | 323 |
| 113 |
| | 104 |
|
| Exploration and research expenses | 79 |
| | 78 |
| | 214 |
| | 194 |
| 52 |
| | 62 |
|
| Environmental obligations and shutdown costs | (73 | ) | | 38 |
| | 18 |
| | 98 |
| 15 |
| | 10 |
|
| Total costs and expenses | 3,006 |
| | 3,045 |
| | 9,041 |
| | 8,875 |
| 3,228 |
| | 2,871 |
|
| Operating income | 1,411 |
| | 2,150 |
| | 4,456 |
| | 7,843 |
| 1,355 |
| | 1,734 |
|
| Interest expense, net | (42 | ) | | (78 | ) | | (148 | ) | | (250 | ) | (57 | ) | | (63 | ) |
| Losses on early extinguishment of debt | — |
| | — |
| | (168 | ) | | (68 | ) | (45 | ) | | (168 | ) |
| Other (expense) income, net | (15 | ) | | 28 |
| | 23 |
| | 40 |
| |
| Income before income taxes and equity in affiliated | | | | | | | | |
| companies’ net earnings | 1,354 |
| | 2,100 |
| | 4,163 |
| | 7,565 |
| |
| Other expense, net | | (3 | ) | | (13 | ) |
| Income before income taxes and equity in affiliated companies' net earnings | | 1,250 |
| | 1,490 |
|
| Provision for income taxes | (215 | ) | | (808 | ) | | (1,128 | ) | | (2,698 | ) | (428 | ) | | (491 | ) |
| Equity in affiliated companies’ net earnings | 1 |
| | 2 |
| | — |
| | 14 |
| 2 |
| | 2 |
|
| Net income | 1,140 |
| | 1,294 |
| | 3,035 |
| | 4,881 |
| 824 |
| | 1,001 |
|
| Net income attributable to noncontrolling interests | (316 | ) | | (241 | ) | | (737 | ) | | (961 | ) | (176 | ) | | (237 | ) |
| Net income attributable to FCX common stockholders | $ | 824 |
| | $ | 1,053 |
| | $ | 2,298 |
| | $ | 3,920 |
| $ | 648 |
| | $ | 764 |
|
| | | | | | | | | | | |
| Net income per share attributable to FCX common stockholders: | | | | | | | | | | |
| Basic | $ | 0.87 |
| | $ | 1.11 |
| | $ | 2.42 |
| | $ | 4.14 |
| $ | 0.68 |
| | $ | 0.81 |
|
| Diluted | $ | 0.86 |
| | $ | 1.10 |
| | $ | 2.41 |
| | $ | 4.10 |
| $ | 0.68 |
| | $ | 0.80 |
|
| | | | | | | | | | | |
| Weighted-average common shares outstanding: | | | | | | | | | | |
| Basic | 949 |
| | 948 |
| | 949 |
| | 947 |
| 950 |
| | 949 |
|
| Diluted | 953 |
| | 955 |
| | 953 |
| | 955 |
| 953 |
| | 955 |
|
| | | | | | | | | | | |
| Dividends declared per share of common stock | $ | 0.3125 |
| | $ | 0.25 |
| | $ | 0.9375 |
| | $ | 1.25 |
| $ | 0.3125 |
| | $ | 0.3125 |
|
The accompanying notes are an integral part of these consolidated financial statements.
FREEPORT-McMoRan COPPER & GOLD INC.
CONSOLIDATED STATEMENTS OF COMPREHENSIVE INCOME (Unaudited)
| | | | Three Months Ended | | Nine Months Ended | Three Months Ended |
| | September 30, | | September 30, | March 31, |
| | 2012 | | 2011 | | 2012 | | 2011 | 2013 | | 2012 |
| | (In millions) | (In millions) |
| | | | | | | | | | | |
| Net income | $ | 1,140 |
| | $ | 1,294 |
| | $ | 3,035 |
| | $ | 4,881 |
| $ | 824 |
| | $ | 1,001 |
|
| | | | | | | | | | | |
| Other comprehensive income, net of taxes: | | | | | | | | | | |
| Unrealized gains (losses) on securities arising during the period | 1 |
| | (1 | ) | | — |
| | (1 | ) | |
| Translation adjustments arising during the period | — |
| | (2 | ) | | (1 | ) | | (1 | ) | |
| Defined benefit plans: | | | | | | | | | | |
| Amortization of unrecognized amounts included in net | | | | | | | | | | |
| periodic benefit costs | 7 |
| | 5 |
| | 22 |
| | 11 |
| 7 |
| | 7 |
|
| Adjustment to deferred tax valuation allowance | — |
| | — |
| | 5 |
| | — |
| — |
| | 5 |
|
| Unrealized losses on securities arising during the period | | (1 | ) | | — |
|
| Other comprehensive income | 8 |
| | 2 |
| | 26 |
| | 9 |
| 6 |
| | 12 |
|
| | | | | | | | | | | |
| Total comprehensive income | 1,148 |
| | 1,296 |
| | 3,061 |
| | 4,890 |
| 830 |
| | 1,013 |
|
| Total comprehensive income attributable to noncontrolling | | | | | | | | |
| interests | (315 | ) | | (241 | ) | | (737 | ) | | (961 | ) | |
| Total comprehensive income attributable to FCX common | | | | | | | | |
| stockholders | $ | 833 |
| | $ | 1,055 |
| | $ | 2,324 |
| | $ | 3,929 |
| |
| Total comprehensive income attributable to noncontrolling interests | | (176 | ) | | (237 | ) |
| Total comprehensive income attributable to FCX common stockholders | | $ | 654 |
| | $ | 776 |
|
The accompanying notes are an integral part of these consolidated financial statements.
FREEPORT-McMoRan COPPER & GOLD INC.
CONSOLIDATED STATEMENTS OF CASH FLOWS (Unaudited)
| | | | Nine Months Ended | Three Months Ended |
| | September 30, | March 31, |
| | 2012 | | 2011 | 2013 | | 2012 |
| | (In millions) | (In millions) |
| Cash flow from operating activities: | | | | | | |
| Net income | $ | 3,035 |
| | $ | 4,881 |
| $ | 824 |
| | $ | 1,001 |
|
| Adjustments to reconcile net income to net cash provided by operating activities: | | | | | | |
| Depreciation, depletion and amortization | 856 |
| | 756 |
| 329 |
| | 267 |
|
| Stock-based compensation | 77 |
| | 92 |
| 41 |
| | 32 |
|
| Pension plans contributions | (114 | ) | | (29 | ) | (22 | ) | | (52 | ) |
| Net charges for reclamation and environmental obligations, including accretion | 64 |
| | 144 |
| 34 |
| | 35 |
|
| Payments for reclamation and environmental obligations | (148 | ) | | (131 | ) | (36 | ) | | (45 | ) |
| Losses on early extinguishment of debt | 168 |
| | 68 |
| 45 |
| | 168 |
|
| Deferred income taxes | 223 |
| | 419 |
| 136 |
| | 168 |
|
| Increase in long-term mill and leach stockpiles | (184 | ) | | (174 | ) | (126 | ) | | (61 | ) |
| Other, net | 71 |
| | (26 | ) | 36 |
| | 8 |
|
| (Increases) decreases in working capital and other tax payments: | | | | | | |
| Accounts receivable | (603 | ) | | 1,034 |
| (113 | ) | | (482 | ) |
| Inventories | (581 | ) | | (266 | ) | (67 | ) | | (248 | ) |
| Other current assets | (33 | ) | | (152 | ) | (48 | ) | | 40 |
|
| Accounts payable and accrued liabilities | 78 |
| | (101 | ) | (201 | ) | | (64 | ) |
| Accrued income taxes and other tax payments | (400 | ) | | (641 | ) | (1 | ) | | 34 |
|
| Net cash provided by operating activities | 2,509 |
| | 5,874 |
| 831 |
| | 801 |
|
| | | | | | | |
| Cash flow from investing activities: | | | | | | |
| Capital expenditures: | | | | | | |
| North America copper mines | (569 | ) | | (342 | ) | (258 | ) | | (143 | ) |
| South America | (659 | ) | | (431 | ) | (226 | ) | | (152 | ) |
| Indonesia | (624 | ) | | (463 | ) | (191 | ) | | (182 | ) |
| Africa | (428 | ) | | (89 | ) | (57 | ) | | (127 | ) |
| Molybdenum | (197 | ) | | (317 | ) | |
| Molybdenum mines | | (40 | ) | | (93 | ) |
| Other | (41 | ) | | (107 | ) | (33 | ) | | (10 | ) |
| Acquisition of cobalt chemical business, net of cash acquired | | (321 | ) | | — |
|
| Other, net | (19 | ) | | 24 |
| 14 |
| | (7 | ) |
| Net cash used in investing activities | (2,537 | ) | | (1,725 | ) | (1,112 | ) | | (714 | ) |
| | | | | | | |
| Cash flow from financing activities: | | | | | | |
| Proceeds from debt | 3,023 |
| | 37 |
| 6,615 |
| | 3,004 |
|
| Repayments of debt | (3,179 | ) | | (1,303 | ) | (39 | ) | | (3,159 | ) |
| Cash dividends paid: | | | | | | |
| Common stock | (832 | ) | | (1,186 | ) | (297 | ) | | (238 | ) |
| Noncontrolling interests | (76 | ) | | (350 | ) | (35 | ) | | (1 | ) |
| Contributions from noncontrolling interests | 15 |
| | 27 |
| |
| Net (payments for) proceeds from stock-based awards | (3 | ) | | 2 |
| |
| Debt financing costs | | (72 | ) | | (22 | ) |
| Net payments for stock-based awards | | (2 | ) | | (4 | ) |
| Excess tax benefit from stock-based awards | 7 |
| | 23 |
| 1 |
| | 7 |
|
| Other, net | (22 | ) | | (9 | ) | |
| Net cash used in financing activities | (1,067 | ) | | (2,759 | ) | |
| Net cash provided by (used in) financing activities | | 6,171 |
| | (413 | ) |
| | | | | | | |
| Net (decrease) increase in cash and cash equivalents | (1,095 | ) | | 1,390 |
| |
| Net increase (decrease) in cash and cash equivalents | | 5,890 |
| | (326 | ) |
| Cash and cash equivalents at beginning of year | 4,822 |
| | 3,738 |
| 3,705 |
| | 4,822 |
|
| Cash and cash equivalents at end of period | $ | 3,727 |
| | $ | 5,128 |
| $ | 9,595 |
| | $ | 4,496 |
|
The accompanying notes are an integral part of these consolidated financial statements.
FREEPORT-McMoRan COPPER & GOLD INC.
CONSOLIDATED STATEMENT OF EQUITY (Unaudited)
| | | | FCX Stockholders’ Equity | | | | | FCX Stockholders’ Equity | | | | |
| | Common Stock | | | | Retained
Earnings | | Accumu-
lated
Other Compre-
hensive
Loss | | Common Stock Held in Treasury | | Total FCX
Stock-holders' Equity | | | | | Common Stock | | | | Retained
Earnings | | Accumu-
lated
Other Compre-
hensive
Loss | | Common Stock Held in Treasury | | Total FCX
Stock-holders' Equity | | | | |
| | Number of Shares | | At Par Value | | Capital in Excess of Par Value | | Number of Shares | | At Cost | | Non- controlling Interests | | Total Equity | Number of Shares | | At Par Value | | Capital in Excess of Par Value | | Number of Shares | | At Cost | | Non- controlling Interests | | Total Equity |
| | | Retained
Earnings | Accumu-
lated
Other Compre-
hensive
Loss | Total FCX
Stock-holders' Equity | | Retained
Earnings | Accumu-
lated
Other Compre-
hensive
Loss | Total FCX
Stock-holders' Equity |
| | (In millions) | (In millions) |
| | | | | | | | | | | | | | | | | | | | | | | |
| Balance at December 31, 2011 | 1,071 |
| | $ | 107 |
| | $ | 19,007 |
| | $ | 546 |
| | $ | (465 | ) | | 123 |
| | $ | (3,553 | ) | | $ | 15,642 |
| | $ | 2,911 |
| | $ | 18,553 |
| |
| Balance at December 31, 2012 | | 1,073 |
| | $ | 107 |
| | $ | 19,119 |
| | $ | 2,399 |
| | $ | (506 | ) | | 124 |
| | $ | (3,576 | ) | | $ | 17,543 |
| | $ | 3,768 |
| | $ | 21,311 |
|
| Exercised and issued stock-based awards | 2 |
| | — |
| | 14 |
| | — |
| | — |
| | — |
| | — |
| | 14 |
| | — |
| | 14 |
| 1 |
| | — |
| | 2 |
| | — |
| | — |
| | — |
| | — |
| | 2 |
| | — |
| | 2 |
|
| Stock-based compensation | — |
| | — |
| | 77 |
| | — |
| | — |
| | — |
| | — |
| | 77 |
| | — |
| | 77 |
| — |
| | — |
| | 41 |
| | — |
| | — |
| | — |
| | — |
| | 41 |
| | — |
| | 41 |
|
| Tax benefit for stock-based awards | — |
| | — |
| | 6 |
| | — |
| | — |
| | — |
| | — |
| | 6 |
| | — |
| | 6 |
| — |
| | — |
| | 1 |
| | — |
| | — |
| | — |
| | — |
| | 1 |
| | — |
| | 1 |
|
| Tender of shares for stock-based awards | — |
| | — |
| | 7 |
| | — |
| | — |
| | 1 |
| | (23 | ) | | (16 | ) | | — |
| | (16 | ) | — |
| | — |
| | — |
| | — |
| | — |
| | — |
| | (4 | ) | | (4 | ) | | — |
| | (4 | ) |
| Dividends on common stock | — |
| | — |
| | — |
| | (891 | ) | | — |
| | — |
| | — |
| | (891 | ) | | — |
| | (891 | ) | — |
| | — |
| | — |
| | (297 | ) | | — |
| | — |
| | — |
| | (297 | ) | | — |
| | (297 | ) |
| Dividends to noncontrolling interests | — |
| | — |
| | — |
| | — |
| | — |
| | — |
| | — |
| | — |
| | (76 | ) | | (76 | ) | — |
| | — |
| | — |
| | — |
| | — |
| | — |
| | — |
| | — |
| | (35 | ) | | (35 | ) |
| Change in ownership interests | — |
| | — |
| | (17 | ) | | — |
| | — |
| | — |
| | — |
| | (17 | ) | | 17 |
| | — |
| |
| Contributions from noncontrolling interests | — |
| | — |
| | — |
| | — |
| | — |
| | — |
| | — |
| | — |
| | 15 |
| | 15 |
| |
| Total comprehensive income | — |
| | — |
| | — |
| | 2,298 |
| | 26 |
| | — |
| | — |
| | 2,324 |
| | 737 |
| | 3,061 |
| — |
| | — |
| | — |
| | 648 |
| | 6 |
| | — |
| | — |
| | 654 |
| | 176 |
| | 830 |
|
| Balance at September 30, 2012 | 1,073 |
| | $ | 107 |
| | $ | 19,094 |
| | $ | 1,953 |
| | $ | (439 | ) | | 124 |
| | $ | (3,576 | ) | | $ | 17,139 |
| | $ | 3,604 |
| | $ | 20,743 |
| |
| Balance at March 31, 2013 | | 1,074 |
| | $ | 107 |
| | $ | 19,163 |
| | $ | 2,750 |
| | $ | (500 | ) | | 124 |
| | $ | (3,580 | ) | | $ | 17,940 |
| | $ | 3,909 |
| | $ | 21,849 |
|
The accompanying notes are an integral part of these consolidated financial statements.
FREEPORT-McMoRan COPPER & GOLD INC.
NOTES TO CONSOLIDATED FINANCIAL STATEMENTS (Unaudited)
1. GENERAL INFORMATION
The accompanying unaudited consolidated financial statements have been prepared in accordance with the instructions to Form 10-Q and do not include all information and disclosures required by generally accepted accounting principles (GAAP) in the United States (U.S.). Therefore, this information should be read in conjunction with Freeport-McMoRan Copper & Gold Inc.’s (FCX) consolidated financial statements and notes contained in its annual report on Form 10-K for the year ended December 31, 2011 (2011 Annual Report).2012. The information furnished herein reflects all adjustments that are, in the opinion of management, necessary for a fair statement of the results for the interim periods reported. All such adjustments are, in the opinion of management, of a normal recurring nature. Operating results for the three-month and nine-month periodsperiod ended September 30, 2012March 31, 2013, are not necessarily indicative of the results that may be expected for the year ending December 31, 20122013.
2. ACQUISITIONS
Cobalt Chemical Refinery Business. On March 29, 2013, FCX, through a newly formed consolidated joint venture, completed the acquisition of a cobalt chemical refinery in Kokkola, Finland, and the related sales and marketing business. The acquisition provides direct end-market access for the cobalt hydroxide production at Tenke Fungurume Mining S.A.R.L. (TFM or Tenke). The joint venture operates under the name Freeport Cobalt, and FCX is the operator with an effective 56 percent ownership interest. The remaining effective ownership interest is held by its partners in TFM, including 24 percent by Lundin Mining Corporation (Lundin) and 20 percent by La Générale des Carrières et des Mines (Gécamines). Initial consideration paid was $355 million, which included $34 million for cash acquired and is subject to a working capital adjustment, and was funded 70 percent by FCX and 30 percent by Lundin. Under the terms of the acquisition agreement, there is also the potential for additional consideration of up to $110 million over a period of three years, contingent upon the achievement of revenue-based performance targets. The initial estimates of the fair value of assets acquired and liabilities assumed are included in FCX's consolidated financial statements as of March 31, 2013.
Pending Acquisitions. On December 5, 2012, FCX announced definitive agreements to acquire, in separate transactions, Plains Exploration & Production Company (PXP) and McMoRan Exploration Co. (MMR). PXP per-share consideration is equivalent to 0.6531 shares of FCX's common stock and $25.00 in cash (approximately $3.4 billion in cash and 91 million shares of FCX common stock). MMR per-share consideration consists of $14.75 in cash (approximately $3.4 billion in cash, or $2.1 billion net of MMR interests owned by FCX and PXP) and 1.15 units of a royalty trust, which will hold a five percent overriding royalty interest in future production from MMR's existing shallow water ultra-deep prospects. As further discussed in Note 6, in March 2013, FCX issued $6.5 billion of senior notes for net proceeds of $6.4 billion, which will be used, together with a five-year bank term loan that provides for borrowings up to $4.0 billion, to fund the cash portion of the merger consideration for both transactions and the repayment of certain indebtedness of PXP and MMR.
Completion of each transaction is subject to receipt of PXP and MMR stockholder approval of their respective transactions. The PXP transaction is not conditioned on the closing of the MMR transaction, and the MMR transaction is not conditioned on the closing of the PXP transaction. On April 18, 2013, PXP announced that it will hold a special meeting of its stockholders on May 20, 2013, to vote on the proposed acquisition of PXP by FCX. On May 3, 2013, MMR announced it will hold a special meeting of its stockholders on June 3, 2013, to vote on the proposed acquisition of MMR by FCX. Both transactions are expected to close in second-quarter 2013, subject to satisfaction of all conditions to closing.
The information contained in the consolidated financial statements and the notes herein does not reflect FCX's pending acquisitions of PXP or MMR.
3. EARNINGS PER SHARE
FCX’s basic net income per share of common stock was calculated by dividing net income attributable to FCX common stockholders by the weighted-average shares of common stock outstanding during the period. Following is a reconciliation of net income and weighted-average shares of common stock outstanding for purposes of calculating diluted net income per share (in millions, except per share amounts):
| | | | Three Months Ended | | Nine Months Ended | | Three Months Ended | |
| | September 30, | | September 30, | | March 31, | |
| | 2012 | | 2011 | | 2012 | | 2011 | | 2013 | | 2012 | |
| Net income | $ | 1,140 |
| | $ | 1,294 |
| | $ | 3,035 |
| | $ | 4,881 |
| | $ | 824 |
| | $ | 1,001 |
| |
| Net income attributable to noncontrolling interests | (316 | ) | | (241 | ) | | (737 | ) | | (961 | ) | | (176 | ) | | (237 | ) | |
| Net income attributable to FCX common stockholders | $ | 824 |
| | $ | 1,053 |
| | $ | 2,298 |
| | $ | 3,920 |
| | $ | 648 |
| | $ | 764 |
| |
| | | | | | | | | | | | | |
| Weighted-average shares of common stock outstanding | 949 |
| | 948 |
| | 949 |
| | 947 |
| | 950 |
| | 949 |
| |
| Add shares issuable upon exercise or vesting of: | | | | | | | | | |
| Dilutive stock options | 3 |
| | 6 |
| a | 3 |
| a | 7 |
| a | |
| Restricted stock units | 1 |
| | 1 |
| | 1 |
| | 1 |
| | |
| Add shares issuable upon exercise or vesting of | | | | | |
| dilutive stock options and restricted stock units | | 3 |
| | 6 |
| a |
| Weighted-average shares of common stock outstanding | | | | | | | | | | | | |
| for purposes of calculating diluted net income per share | 953 |
| | 955 |
| | 953 |
| | 955 |
| | 953 |
| | 955 |
| |
| | | | | | | | | | | | | |
Diluted net income per share attributable to FCX common stockholders | $ | 0.86 |
| | $ | 1.10 |
| | $ | 2.41 |
| | $ | 4.10 |
| | $ | 0.68 |
| | $ | 0.80 |
| |
| |
| a. | Excluded shares of common stock associated with outstanding stock options with exercise prices less than the average market price of FCX's common stock that were anti-dilutive based on the treasury stock method of approximately three million for the third-quarter 2011, one millionfirst-quarter for the nine months ended September 30, 2012, and two million for the nine months ended September 30, 2011. |
Outstanding stock options with exercise prices greater than the average market price of FCX’s common stock during the period are excluded from the computation of diluted net income per share of common stock. Excluded amounts were approximately 2429 million stock options with a weighted-average exercise price of $42.5241.35 per option for third-quarterfirst-quarter 20122013 and approximately 199 million stock options with a weighted-average exercise price of $43.8050.63 per option for the nine months ended September 30, 2012. Approximately 5 million stock options with a weighted-average exercise price of $55.57 per option were excluded for third-quarterfirst-quarter 2011, and approximately 3 million stock options with a weighted-average exercise price of $55.74 per option were excluded for the nine months ended September 30, 20112012.
| |
3. | INVENTORIES, INCLUDING LONG-TERM MILL AND LEACH STOCKPILES |
4. INVENTORIES, INCLUDING LONG-TERM MILL AND LEACH STOCKPILES
The components of inventories follow (in millions):
|
| | | | | | | |
| | September 30,
2012 | | December 31, 2011 |
Mining operations:a | | | |
| Raw materials | $ | 2 |
| | $ | 1 |
|
Finished goodsb | 820 |
| | 769 |
|
| Atlantic Copper, S.L.U. (Atlantic Copper): | | | |
| Raw materials (concentrates) | 339 |
| | 260 |
|
| Work-in-process | 191 |
| | 187 |
|
| Finished goods | 22 |
| | 9 |
|
| Total product inventories | 1,374 |
| | 1,226 |
|
Total materials and supplies, netc | 1,465 |
| | 1,354 |
|
| Total inventories, excluding mill and leach stockpiles | $ | 2,839 |
| | $ | 2,580 |
|
|
| | | | | | | |
| | March 31,
2013 | | December 31, 2012 |
| Raw materials (primarily concentrates) | $ | 171 |
| | $ | 237 |
|
Work-in-processa | 237 |
| | 252 |
|
Finished goodsb | 1,128 |
| | 911 |
|
| Total product inventories | $ | 1,536 |
| | $ | 1,400 |
|
| | | | |
Total materials and supplies, netc | $ | 1,575 |
| | $ | 1,504 |
|
| |
| a. | FCX's mining operations also have work-in-process inventories (i.e.,that are included in mill and leach stockpiles), which are summarized below. stockpiles. |
| |
| b. | Primarily included molybdenum concentrates and copper concentrates, anodes, cathodes and rod. |
| |
| c. | Materials and supplies inventory was net of obsolescence reserves totaling $2627 million at September 30, 2012March 31, 2013, and December 31, 20112012. |
A summary of mill and leach stockpiles follows (in millions): | | | | September 30,
2012 | | December 31, 2011 | March 31,
2013 | | December 31, 2012 |
| Current: | | | | | | |
| Mill stockpiles | $ | 97 |
| | $ | 69 |
| $ | 112 |
| | $ | 104 |
|
| Leach stockpiles | 1,498 |
| | 1,220 |
| 1,586 |
| | 1,568 |
|
| Total current mill and leach stockpiles | $ | 1,595 |
| | $ | 1,289 |
| $ | 1,698 |
| | $ | 1,672 |
|
Long-term:a | | | | | | |
| Mill stockpiles | $ | 595 |
| | $ | 535 |
| $ | 627 |
| | $ | 615 |
|
| Leach stockpiles | 1,276 |
| | 1,151 |
| 1,454 |
| | 1,340 |
|
| Total long-term mill and leach stockpiles | $ | 1,871 |
| | $ | 1,686 |
| $ | 2,081 |
| | $ | 1,955 |
|
| |
| a. | Metals in stockpiles not expected to be recovered within the next 12 months. |
5. INCOME TAXES
Geographic sources of FCX's provision for income taxes follow (in millions):
| | | | Three Months Ended | | Nine Months Ended | Three Months Ended |
| | September 30, | | September 30, | March 31, |
| | 2012 | | 2011 | | 2012 | | 2011 | 2013 | | 2012 |
| United States operations | $ | 98 |
| | $ | 163 |
| | $ | 291 |
| | $ | 421 |
| $ | 71 |
| | $ | 83 |
|
| International operations | 117 |
| a | 645 |
| | 837 |
| a | 2,277 |
| 357 |
| | 408 |
|
| Total | $ | 215 |
| | $ | 808 |
| | $ | 1,128 |
| | $ | 2,698 |
| $ | 428 |
| | $ | 491 |
|
| |
a. | Included a net tax benefit of $234 million associated with an adjustment to Cerro Verde's deferred income tax liability.
|
FCX’s consolidated effective income tax rate was 2734 percent (for first-quarter2013 and 33 percent excluding Cerro Verde'sfor $234 millionfirst-quarter net deferred tax liability adjustment) for the first nine months of 2012 and 36 percent for the first nine months of 2011. Variations in the relative proportions of jurisdictional income can result in fluctuations to FCX’s consolidated effective income tax rate.
6. DEBT AND EQUITY TRANSACTIONS
On February 14, 2013, FCX entered into an agreement for a $4.0 billion bank term loan (the Term Loan) in connection with the pending acquisitions of PXP and MMR. Borrowings of up to $4.0 billion under the Term Loan will become available to FCX upon the closing of the PXP and/or the MMR acquisitions to fund the cash portion of the merger consideration for both transactions, to refinance certain of PXP's and MMR's outstanding debt, or for general corporate purposes. At the time the PXP transaction closes, PXP will join the Term Loan as a borrower.
The Term Loan will amortize in equal quarterly installments during the second, third and fourth years of the Term Loan in annual amounts equal to 10 percent, 15 percent and 20 percent, respectively, of the original aggregate principal amount, and the remainder will mature five years from the date of the first borrowing. At FCX's option, the Term Loan will bear interest at either an adjusted London Interbank Offered Rate (LIBOR) or an alternate-based rate (as defined under the Term Loan agreement) plus a spread to be determined by reference to FCX's credit ratings (currently LIBOR plus 1.50 percent or the alternate-based rate plus 50 basis points). FCX expects to select LIBOR for amounts borrowed at closing.
Also on February 14, 2013, FCX and PT Freeport Indonesia entered into a new senior unsecured $3.0 billion revolving credit facility, which will refinance and replace FCX's existing revolving credit facility (scheduled to mature on March 30, 2016) upon completion of the pending acquisition of PXP. Interest on the new revolving credit facility will be determined by reference to FCX's credit rating (currently LIBOR plus 1.50 percent). At the time the PXP acquisition closes, PXP will join the revolving credit facility as a borrower. No amounts are currently available to FCX under the new revolving credit facility. At the closing of the acquisition of PXP, the new revolving credit facility will be available for five years in an aggregate principal amount of $3.0 billion, with $500 million available to PT Freeport Indonesia.
WithThe Term Loan and new revolving credit facility both contain customary affirmative covenants and representations, and also contain a number of negative covenants that, among other things, restrict, subject to certain exceptions, the exceptionability of Tenke Fungurume S.A.R.L. (TFM)FCX's subsidiaries that are not borrowers or guarantors to incur additional indebtedness (including guarantee obligations) and FCX's ability or the ability of FCX's subsidiaries to: create liens on assets; enter into sale and leaseback transactions; engage in mergers, liquidations and dissolutions; and sell assets. The Term Loan and new revolving credit facility also contain financial ratios governing maximum total leverage and minimum interest coverage.
On March 7, 2013, in connection with the financing of FCX's pending acquisitions of PXP and MMR, FCX has not electedissued $6.5 billion of senior notes in four tranches. FCX sold $1.5 billion of 2.375% Senior Notes due March 2018 (5-year notes), $1.0 billion of 3.100% Senior Notes due March 2020 (7-year notes), $2.0 billion of 3.875% Senior Notes due March 2023 (10-year notes) and $2.0 billion of 5.450% Senior Notes due March 2043 (30-year notes) for total net proceeds of $6.4 billion. Interest on these notes is payable semiannually on March 15 and September 15, commencing on September 15, 2013. FCX expects to permanently reinvest earningsuse the proceeds from the senior notes, together with available funds from its foreign subsidiaries and has recorded deferred tax liabilities for foreign earnings that are available to be repatriated to the U.S. Cerro Verde previously recorded deferred Peruvian income tax liabilities for income taxes that would become payable if the reinvested profits usedTerm Loan, to fund the initial Cerro Verde sulfide expansion are distributed prioracquisitions of PXP and MMR, including the payment of cash consideration for the acquisitions and the repayment of certain indebtedness. If the PXP acquisition does not close, FCX will be required to redeem all the expirationoutstanding 7-year, 10-year and 30-year notes at 101 percent plus accrued and unpaid interest.
FCX recorded a loss on early extinguishment of Cerro Verde's current stability agreement on December 31, 2013. Reinvested profits are not expected to be distributed prior to December 31, 2013. Accordingly, a net deferred income tax liabilitydebt of $23445 million ($12340 million to net income attributable to FCX common stockholders) in first-quarter 2013 for financing costs incurred for the terminated $9.5 billion acquisition bridge loan facility, which was entered into in December 2012 to provide interim financing for the acquisitions of noncontrolling interests) was reversedPXP and recognized as an income tax benefit in third-quarter 2012.MMR.
In July 2012, Sociedad Minera Cerro Verde S.A.A. (Cerro Verde) signed a new 15-year mining stability agreement with the Peruvian government, which is expected to become effective January 1, 2014, after the current mining stability agreement expires on December 31, 2013. In connection with the new mining stability agreement, Cerro Verde's income tax rate will increase from 30 percent to 32 percent. As a result of the change in the income tax rate, FCX recognized additional deferred tax expense of $26 million ($23 million net of noncontrolling interests) in third-quarter 2012, which relates primarily to the assets recorded in connection with the 2007 acquisition of Freeport-McMoRan Corporation (FMC).
In September 2011, Peru enacted a new mining tax and royalty regime and also created a special mining burden that companies with stability agreements could elect to pay. Cerro Verde elected to pay this special mining burden during the remaining term of its stability agreement. As a result, Cerro Verde recognized additional current and deferred tax expense of $57 million ($50 million net of noncontrolling interests) in third-quarter 2011. The deferred portion of this accrual related primarily to the assets recorded in connection with the 2007 acquisition of FMC.
| |
5. | DEBT AND EQUITY TRANSACTIONS |
In February 2012, FCX sold $500 million of 1.40% Senior Notes due 2015, $500 million of 2.15% Senior Notes due 2017 and $2.0 billion of 3.55% Senior Notes due 2022 for total net proceeds of $2.97 billion. Interest on the 1.40% Senior Notes isThese notes bear interest payable semiannually on February 13 and August 13, which commenced on August 13, 2012. Interest on the 2.15% Senior Notes and the 3.55% Senior Notes is payable semiannually on March 1 and September 1, which commenced on September 1, 2012. These unsecured senior notes rank equally with FCX's other existing and future unsecured and unsubordinated indebtedness.semiannually.
On March 14, 2012, FCX redeemed the remaining $3.0 billion of its outstanding 8.375% Senior Notes due 2017, for which holders received 104.553 percent of the principal amount together with the accrued and unpaid interest. As a result of this redemption, FCX recorded a loss on early extinguishment of debt of $168 million ($149 million to net income attributable to FCX common stockholders orstockholders) in $0.16first-quarter per diluted share) for the first nine months of 2012.
During the first quarter of 2011, FCX entered into a new senior unsecured revolving credit facility, which replaced the revolving credit facilities that were scheduled to mature on March 19, 2012. FCX recognized a loss on early extinguishment of debt totaling $7 million ($6 million to net income attributable to FCX common shareholders or $0.01 per diluted share) for the first nine months of 2011 associated with this transaction.
On April 1, 2011, FCX redeemed its remaining $1.1 billion of outstanding 8.25% Senior Notes due 2015, for which holders received 104.125 percent of the principal amount together with accrued and unpaid interest. As a result of this redemption, FCX recorded a loss on early extinguishment of debt totaling $55 million ($49 million to net income attributable to FCX common stockholders or $0.05 per diluted share) for the first nine months of 2011.
During the second quarter of 2011, FCX purchased in the open market $35 million of its 9.5% Senior Notes due 2031 for $49 million, which resulted in losses on early extinguishment of debt totaling $6 million ($5 million to net income attributable to FCX common stockholders or $0.01 per diluted share) for the first nine months of 2011.
Consolidated interest expense (excluding capitalized interest) totaled $5675 million in third-quarterfirst-quarter 20122013, and $10599 million in third-quarterfirst-quarter 2011, $210 million for the first nine months of 2012 and $325 million for the first nine months of 2011. Capitalized interest totaled $1418 million in third-quarterfirst-quarter 20122013, and $2736 million in third-quarterfirst-quarter 2011, $62 million for the first nine months of 2012 and $75 million for the first nine months of 2011.
On February 7, 2012, the Board of Directors authorized an increase in the cash dividend on FCX's common stock from an annual rate of $1.00 per share to $1.25 per share. On September 26, 2012March 27, 2013, FCX's Board of Directors declared a quarterly dividend of $0.3125 per share, which was paid on NovemberMay 1, 20122013, to common shareholders of record at the close of business on OctoberApril 15, 20122013.
| |
6.
7. FINANCIAL INSTRUMENTS | FINANCIAL INSTRUMENTS |
FCX does not purchase, hold or sell derivative financial instruments unless there is an existing asset or obligation, or it anticipates a future activity that is likely to occur and will result in exposure to market risks, which FCX intends to offset or mitigate. FCX does not enter into any derivative financial instruments for speculative purposes, but has entered into derivative financial instruments in limited instances to achieve specific objectives. These objectives principally relate to managing risks associated with commodity price changes, foreign currency exchange rates and interest rates.
Commodity Contracts. From time to time, FCX has entered into forward, futures and swap contracts to hedge the market risk associated with fluctuations in the prices of commodities it purchases and sells. Derivative financial instruments used by FCX to manage its risks do not contain credit risk-related contingent provisions. As of September 30, 2012March 31, 2013, FCX had no price protection contracts relating to its mine production. A discussion of FCX’s derivative commodity contracts and programs follows.
Derivatives Designated as Hedging Instruments – Fair Value Hedges
Copper Futures and Swap Contracts. Some of FCX's U.S. copper rod customers request a fixed market price instead of the New York Mercantile Exchange (COMEX) average copper price in the month of shipment. FCX hedges this price exposure in a manner that allows it to receive the COMEX average price in the month of shipment while the customers pay the fixed price they requested. FCX accomplishes this by entering into copper futures and swap contracts and then liquidating the copper futures contracts and settling the copper swap contracts during the month of shipment, which generally results in FCX receiving the COMEX average copper price in the month of shipment. Hedging gains or losses from these copper futures and swap contracts are recorded in revenues. FCX did not have any significant gains or losses during the three-month and nine-month periods ended September 30, 2012March 31, 2013 and 20112012, resulting from hedge ineffectiveness. At September 30, 2012March 31, 2013, FCX held copper futures and swap contracts that qualified for hedge accounting for 5357 million pounds at an average contract price of $3.593.54 per pound, with maturities through December 2013March 2014.
A summary of gains (losses) recognized in revenues for derivative financial instruments related to commodity contracts that are designated and qualify as fair value hedge transactions, along with the unrealized gains (losses) on the related hedged item (firm sales commitments) follows (in millions): | | | | Three Months Ended | | Nine Months Ended | Three Months Ended |
| | September 30, | | September 30, | March 31, |
| | 2012 | | 2011 | | 2012 | | 2011 | 2013 | | 2012 |
| Copper futures and swap contracts: | | | | | | | | | | |
| Unrealized gains (losses): | | | | | | | | |
| Unrealized (losses) gains: | | | | |
| Derivative financial instruments | $ | 13 |
| | $ | (62 | ) | | $ | 20 |
| | $ | (72 | ) | $ | (12 | ) | | $ | 18 |
|
| Hedged item | (13 | ) | | 62 |
| | (20 | ) | | 72 |
| 12 |
| | (18 | ) |
| | | | | | | | | | | |
| Realized gains (losses): | | | | | | | | |
| Realized (losses) gains: | | | | |
| Matured derivative financial instruments | 1 |
| | (10 | ) | | (3 | ) | | (4 | ) | (2 | ) | | 10 |
|
Derivatives Not Designated as Hedging Instruments
Embedded Derivatives. As described in Note 1 to FCX’s 2011 Annual Reportannual report on Form 10-K for the year ended December 31, 2012, under “Revenue Recognition,” certain FCX copper concentrate, copper cathode and gold sales contracts provide for provisional pricing primarily based on the London Metal Exchange (LME) price (copper) or the COMEX price (copper) and the London Bullion Market Association (London PM) price (gold) at the time of shipment as specified in the contract. Similarly, FCX purchases copper and molybdenum under contracts that provide for provisional pricing (molybdenum purchases are generally based on an average Metals Week Molybdenum Dealer Oxide price).pricing. FCX applies the normal purchases and normal sales scope exception in accordance with derivatives and hedge accounting guidance to the host sales agreements since the contracts do not allow for net settlement and always result in physical delivery. Sales and purchases with a provisional sales price contain an embedded derivative (i.e., the price settlement mechanism that is settled after the time of delivery) that is required to be bifurcated from the host contract. The host contract is the sale or purchase of the metals contained in the concentrates or cathodes at the then-current LME or COMEX price
(copper), or the London PM price (gold) or the average Metals Week Molybdenum Dealer Oxide price (molybdenum) as defined in the contract. Mark-to-market price fluctuations recorded through the settlement date are reflected in revenues for sales contracts and in cost of sales as production and delivery costs for purchase contracts.
A summary of FCX’s embedded derivatives at September 30, 2012March 31, 2013, follows:
| | | | Open Positions | | Average Price Per Unit | | Maturities Through | Open Positions | | Average Price Per Unit | | Maturities Through |
| | | Contract | | Market | | | Contract | | Market | |
| Embedded derivatives in provisional sales contracts: | | | | | | | | | | | | | | |
| Copper (millions of pounds) | 557 |
| | $ | 3.49 |
| | $ | 3.72 |
| | March 2013 | 491 |
| | $ | 3.57 |
| | $ | 3.41 |
| | August 2013 |
| Gold (thousands of ounces) | 67 |
| | 1,698 |
| | 1,781 |
| | December 2012 | 105 |
| | 1,606 |
| | 1,601 |
| | July 2013 |
| Embedded derivatives in provisional purchase contracts: | | | | | | | | | | | | |
| Copper (millions of pounds) | 326 |
| | 3.50 |
| | 3.72 |
| | January 2013 | 124 |
| | 3.57 |
| | 3.42 |
| | July 2013 |
Copper Forward Contracts. Atlantic Copper, FCX’s wholly owned smelting and refining unit in Spain, enters into forward copper contracts designed to hedge its copper price risk whenever its physical purchases and sales pricing periods do not match. These economic hedge transactions are intended to hedge against changes in copper prices, with the mark-to-market hedging gains or losses recorded in cost of sales. At September 30, 2012March 31, 2013, Atlantic Copper held net forward copper purchasesales contracts for 3116 million pounds at an average contract price of $3.713.48 per pound, with maturities through December 2012June 2013.
A summary of the realized and unrealized gains (losses) recognized in income before income taxes and equity in affiliated companies’ net earnings for commodity contracts that do not qualify as hedge transactions, including embedded derivatives, follows (in millions): | | | | Three Months Ended | | Nine Months Ended | Three Months Ended |
| | September 30, | | September 30, | March 31, |
| | 2012 | | 2011 | | 2012 | | 2011 | 2013 | | 2012 |
Embedded derivatives in provisional sales contractsa | $ | 164 |
| | $ | (657 | ) | | $ | 188 |
| | $ | (682 | ) | $ | (83 | ) | | $ | 184 |
|
Copper forward contractsb | 5 |
| | 4 |
| | 17 |
| | (2 | ) | 3 |
| | 11 |
|
| |
| a. | Amounts recorded in revenues. |
| |
| b. | Amounts recorded in cost of sales as production and delivery costs. |
Unsettled Derivative Financial Instruments
A summary of the fair values of unsettled derivative financial instruments recorded on the consolidated balance sheets follows (in millions):
| | | | September 30,
2012 | | December 31, 2011 | March 31,
2013 | | December 31, 2012 |
| Derivatives designated as hedging instruments | | | | | | |
| Commodity contracts: | | | | | | |
Copper futures and swap contracts:a | | | | | | |
Asset positionb | $ | 11 |
| | $ | 3 |
| $ | — |
| | $ | 5 |
|
Liability positionc | 1 |
| | 13 |
| 8 |
| | 1 |
|
| | | | | | | |
| Derivatives not designated as hedging instruments | | | | | | |
| Commodity contracts: | | | | | | |
Embedded derivatives in provisional sales/purchase contracts:d | | | | | | |
| Asset position | $ | 131 |
| | $ | 72 |
| |
| Liability position | 74 |
| | 82 |
| |
| Gross amounts in an asset position | | $ | 19 |
| | $ | 36 |
|
| Less gross amounts offset in the balance sheet | | — |
| | 8 |
|
| Net amounts in an asset position | | $ | 19 |
| | $ | 28 |
|
| | | | | |
| Gross amounts in a liability position | | $ | 79 |
| | $ | 27 |
|
| Less gross amounts offset in the balance sheet | | — |
| | 8 |
|
| Net amounts in a liability position | | $ | 79 |
| | $ | 19 |
|
| | | | | |
| Copper forward contracts: | | | | | | |
Asset positionb | 1 |
| | 2 |
| $ | 1 |
| | $ | — |
|
Liability positionc | 1 |
| | — |
| |
| |
| a. | FCX receivedpaid $110 million fromto brokers associated with margin requirements (recorded in accounts payable and accrued liabilities) as ofat September 30, 2012March 31, 2013, and FCX paid $317 million at December 31, 2012, for margin requirements (recorded in other current assets) as of December 31, 2011. In addition, FCX held $3 million in margin funding from customers as of December 31, 2011, associated with margin requirements (recorded in accounts payable and accrued liabilities). |
| |
| b. | Amounts recorded in other current assets. |
| |
| c. | Amounts recorded in accounts payable and accrued liabilities. |
| |
| d. | Amounts recorded either asThese derivatives are the only derivatives that are offset in the balance sheet in accordance with accounting guidance. Based on the respective contract, embedded derivatives on provisional sales/purchases are netted with the corresponding outstanding receivable/payable balances. At March 31, 2013, the net amounts were in a net liability position of $60 million, of which a credit of $43 million was netted against trade accounts receivable, orand a credit of $17 million was included in accounts payable and accrued liabilities. At December 31, 2012, the net amounts were in a net asset position of $9 million, of which a debit of $15 million was included in trade accounts payable.receivable, and a credit of $6 million was included in accounts payable and accrued liabilities. |
Foreign Currency Exchange Contracts. As a global company, FCX transacts business in many countries and in many currencies. Foreign currency transactions of FCX’s international subsidiaries increase its risks because exchange rates can change between the time agreements are made and the time foreign currency transactions are settled. FCX may hedge or protect its international subsidiaries’ foreign currency transactions from time to time by entering into forward exchange contracts to lock in or minimize the effects of fluctuations in exchange rates. FCX had no outstanding foreign currency exchange contracts at September 30, 2012.
Interest Rate Swap Contracts. From time to time, FCX or its subsidiaries may enter into interest rate swaps to manage its exposure to interest rate changes and to achieve a desired proportion of fixed-rate versus floating-rate debt based on current and projected market conditions. FCX may enter into fixed-to-floating interest rate swap contracts to protect against changes in the fair value of the underlying fixed-rate debt that result from market interest rate changes and to take advantage of lower interest rates. FCX had no outstanding interest rate swap contracts at September 30, 2012.
Credit Risk. FCX is exposed to credit loss when financial institutions with which FCX has entered into derivative transactions (commodity, foreign exchange and interest rate swaps) are unable to pay. To minimize the risk of such losses, FCX uses counterparties that meet certain credit requirements and periodically reviews the creditworthiness of these counterparties. FCX does not anticipate that any of the counterparties it deals with will default on their obligations. As of September 30, 2012March 31, 2013, FCX did not have any significant credit exposure associated with derivative transactions.
Other Financial Instruments. Other financial instruments include cash and cash equivalents, accounts receivable, investment securities, trust assets, investment securities, accounts payable and accrued liabilities, dividends payable and long-term debt. ReferThe carrying value for cash and cash equivalents, accounts receivable, and accounts payable and accrued liabilities approximates fair value because of their short-term nature and generally negligible credit losses (refer to Note 78 for the fair values of these financial instruments.
Cashinvestment securities, trust assets and Cash Equivalents, Accounts Receivable, Accounts Payable and Accrued Liabilities, and Dividends Payable. The financial statement amount is a reasonable estimate of the fair value because of the short maturity of these instruments and generally negligible credit losseslong-term debt).
Trust AssetsA summary of cash and Investment Securities. The financial statement amount represents the fair value of trust assets and investment securities except for the investment in McMoRan Exploration Co.'s (MMR) 5¾% Convertible Perpetual Preferred Stock, which is recorded at cost.cash equivalents follows (in millions):
Long-Term Debt. The financial statement amount represents cost except for long-term debt acquired in the FMC acquisition, which was recorded at fair value at the acquisition date. |
| | | | | | | | |
| | March 31,
2013 | | December 31, 2012 | |
| Money market funds | $ | 8,367 |
| | $ | 2,991 |
| |
| Time deposits | 697 |
| | 514 |
| |
Overnight repurchase agreementa | 300 |
| | — |
| |
| Cash in banks | 231 |
| | 200 |
| |
| Total cash and cash equivalents | $ | 9,595 |
| | $ | 3,705 |
| |
| |
7.a. | FAIR VALUE MEASUREMENTIn the first quarter of 2013, FCX entered into an overnight repurchase agreement with a financial institution. In connection with the agreement, FCX purchases an undivided interest in U.S. government treasury and/or agency securities at market value, and the financial institution agrees to repurchase the securities on demand (the following business day) at the original purchase price plus a designated interest rate. FCX does not participate in the actual return on the underlying securities. Because of its short-term, highly liquid nature, and the insignificant risk of changes in value, FCX considers this financial instrument a cash equivalent. |
8. FAIR VALUE MEASUREMENT
Fair value accounting guidance includes a hierarchy that prioritizes the inputs to valuation techniques used to measure fair value. The hierarchy gives the highest priority to unadjusted quoted prices in active markets for identical assets or liabilities (Level 1 inputs) and the lowest priority to unobservable inputs (Level 3 inputs). FCX did not have any significant transfers in or out of Levels 1, 2 or 3 for the thirdfirst quarter of-quarter 20122013.
The carrying value for certain FCX financial instruments (i.e., cash, accounts receivable, accounts payable and accrued liabilities, and dividends payable) approximate fair value because of their short-term nature and generally negligible credit losses. A summary of the carrying amount and fair value of FCX’s other financial instruments other than cash and cash equivalents, accounts receivable, and accounts payable and accrued liabilities follows (in millions):
| | | | At September 30, 2012 | At March 31, 2013 |
| | Carrying | | Fair Value | Carrying | | Fair Value |
| | Amount | | Total | | Level 1 | | Level 2 | | Level 3 | Amount | | Total | | Level 1 | | Level 2 | | Level 3 |
| Assets | | | | | | | | | | | | | | | | | | |
Cash equivalents:a | | | | | | | | | | |
| Money market funds | $ | 3,053 |
| | $ | 3,053 |
| | $ | 3,053 |
| | $ | — |
| | $ | — |
| |
| | | | | | | | | | | |
| Investment securities (current and long-term): | | | | | | | | | | | | | | | | | | |
MMR investmentb | 453 |
| | 436 |
| | — |
| | 436 |
| | — |
| $ | 439 |
| | $ | 592 |
| | $ | — |
| | $ | 592 |
| | $ | — |
|
U.S. core fixed income funda,c | | 22 |
| | 22 |
| | — |
| | 22 |
| | — |
|
Money market fundsa, c | 47 |
| | 47 |
| | 47 |
| | — |
| | — |
| 16 |
| | 16 |
| | 16 |
| | — |
| | — |
|
Equity securitiesa, c | 8 |
| | 8 |
| | 8 |
| | — |
| | — |
| 7 |
| | 7 |
| | 7 |
| | — |
| | — |
|
| Total investment securities | 508 |
| | 491 |
| | 55 |
| | 436 |
| | — |
| 484 |
| | 637 |
| | 23 |
| | 614 |
| | — |
|
| | | | | | | | | | | | | | | | | | | |
Trust assets (long-term):a, c | | | | | | | | | | | | | | | | | | |
| U.S. core fixed income fund | 49 |
| | 49 |
| | — |
| | 49 |
| | — |
| 49 |
| | 49 |
| | — |
| | 49 |
| | — |
|
| Government mortgage-backed securities | 41 |
| | 41 |
| | — |
| | 41 |
| | — |
| 40 |
| | 40 |
| | — |
| | 40 |
| | — |
|
| Corporate bonds | 30 |
| | 30 |
| | — |
| | 30 |
| | — |
| 28 |
| | 28 |
| | — |
| | 28 |
| | — |
|
| Government bonds and notes | 21 |
| | 21 |
| | — |
| | 21 |
| | — |
| 19 |
| | 19 |
| | — |
| | 19 |
| | — |
|
| Asset-backed securities | 13 |
| | 13 |
| | — |
| | 13 |
| | — |
| 18 |
| | 18 |
| | — |
| | 18 |
| | — |
|
| Money market funds | 6 |
| | 6 |
| | 6 |
| | — |
| | — |
| 7 |
| | 7 |
| | 7 |
| | — |
| | — |
|
| Municipal bonds | 1 |
| | 1 |
| | — |
| | 1 |
| | — |
| 1 |
| | 1 |
| | — |
| | 1 |
| | — |
|
| Total trust assets | 161 |
| | 161 |
| | 6 |
| | 155 |
| | — |
| 162 |
| | 162 |
| | 7 |
| | 155 |
| | — |
|
| | | | | | | | | | | | | | | | | | | |
Derivatives:a | | | | | | | | | | | | | | | | | | |
| Embedded derivatives in provisional sales/purchase | | | | | | | | | | | | | | | | | | |
contracts in an asset positiond | 131 |
| | 131 |
| | — |
| | 131 |
| | — |
| |
Copper futures and swap contractse | 11 |
| | 11 |
| | 10 |
| | 1 |
| | — |
| |
contracts in a gross asset positiond | | 19 |
| | 19 |
| | — |
| | 19 |
| | — |
|
Copper forward contractse | 1 |
| | 1 |
| | 1 |
| | — |
| | — |
| 1 |
| | 1 |
| | 1 |
| | — |
| | — |
|
| Total derivative assets | 143 |
| | 143 |
| | 11 |
| | 132 |
| | — |
| 20 |
| | 20 |
| | 1 |
| | 19 |
| | — |
|
| | | | | | | | | | | | | | | | | | | |
| Total assets | | | $ | 3,848 |
| | $ | 3,125 |
| | $ | 723 |
| | $ | — |
| | | $ | 819 |
| | $ | 31 |
| | $ | 788 |
| | $ | — |
|
| | | | | | | | | | | | | | | | | | | |
| Liabilities | | | | | | | | | | | | | | | | | | |
Derivatives:a | | | | | | | | | | | | | | | | | | |
| Embedded derivatives in provisional sales/purchase | | | | | | | | | | | | | | | | | | |
contracts in a liability positiond | $ | 74 |
| | $ | 74 |
| | $ | — |
| | $ | 74 |
| | $ | — |
| |
contracts in a gross liability positiond | | $ | 79 |
| | $ | 79 |
| | $ | — |
| | $ | 79 |
| | $ | — |
|
Copper futures and swap contractsf | 1 |
| | 1 |
| | 1 |
| | — |
| | — |
| 8 |
| | 8 |
| | 6 |
| | 2 |
| | — |
|
Copper forward contractsf | 1 |
| | 1 |
| | 1 |
| | — |
| | — |
| |
| Total derivative liabilities | 76 |
| | 76 |
| | 2 |
| | 74 |
| | — |
| 87 |
| | 87 |
| | 6 |
| | 81 |
| | — |
|
| | | | | | | | | | | | | | | | | | | |
Long-term debt, including current portiong | 3,523 |
| | 3,632 |
| | — |
| | 3,632 |
| | — |
| 10,092 |
| | 10,129 |
| | — |
| | 10,129 |
| | — |
|
| | | | | | | | | | | | | | | | | | | |
| Total liabilities | | | $ | 3,708 |
| | $ | 2 |
| | $ | 3,706 |
| | $ | — |
| | | $ | 10,216 |
| | $ | 6 |
| | $ | 10,210 |
| | $ | — |
|
| | | | At December 31, 2011 | At December 31, 2012 |
| | Carrying | | Fair Value | Carrying | | Fair Value |
| | Amount | | Total | | Level 1 | | Level 2 | | Level 3 | Amount | | Total | | Level 1 | | Level 2 | | Level 3 |
| Assets | | | | | | | | | | | | | | | | | | |
Cash equivalents:a | | | | | | | | | | |
| Money market funds | $ | 4,007 |
| | $ | 4,007 |
| | $ | 4,007 |
| | $ | — |
| | $ | — |
| |
| | |
| Investment securities (current and long-term): | | | | | | | | | | | | | | | | | | |
MMR investmentb | 475 |
| | 507 |
| | — |
| | 507 |
| | — |
| $ | 446 |
| | $ | 539 |
| | $ | — |
| | $ | 539 |
| | $ | — |
|
U.S. core fixed income funda,c | | 22 |
| | 22 |
| | — |
| | 22 |
| | — |
|
Money market fundsa, c | | 16 |
| | 16 |
| | 16 |
| | — |
| | — |
|
Equity securitiesa, c | 9 |
| | 9 |
| | 9 |
| | — |
| | — |
| 8 |
| | 8 |
| | 8 |
| | — |
| | — |
|
Money market fundsa, c | 2 |
| | 2 |
| | 2 |
| | — |
| | — |
| |
| Total investment securities | 486 |
| | 518 |
| | 11 |
| | 507 |
| | — |
| 492 |
| | 585 |
| | 24 |
| | 561 |
| | — |
|
| | | | | | | | | | | | | | | | | | | |
Trust assets (long-term):a, c | | | | | | | | | | | | | | | | | | |
| U.S. core fixed income fund | | 50 |
| | 50 |
| | — |
| | 50 |
| | — |
|
| Government mortgage-backed securities | 47 |
| | 47 |
| | — |
| | 47 |
| | — |
| 36 |
| | 36 |
| | — |
| | 36 |
| | — |
|
| U.S. core fixed income fund | 46 |
| | 46 |
| | — |
| | 46 |
| | — |
| |
| Corporate bonds | | 30 |
| | 30 |
| | — |
| | 30 |
| | — |
|
| Government bonds and notes | 21 |
| | 21 |
| | — |
| | 21 |
| | — |
| 24 |
| | 24 |
| | — |
| | 24 |
| | — |
|
| Corporate bonds | 19 |
| | 19 |
| | — |
| | 19 |
| | — |
| |
| Asset-backed securities | | 15 |
| | 15 |
| | — |
| | 15 |
| | — |
|
| Money market funds | 9 |
| | 9 |
| | 9 |
| | — |
| | — |
| 7 |
| | 7 |
| | 7 |
| | — |
| | — |
|
| Asset-backed securities | 9 |
| | 9 |
| | — |
| | 9 |
| | — |
| |
| Municipal bonds | 1 |
| | 1 |
| | — |
| | 1 |
| | — |
| 1 |
| | 1 |
| | — |
| | 1 |
| | — |
|
| Total trust assets | 152 |
| | 152 |
| | 9 |
| | 143 |
| | — |
| 163 |
| | 163 |
| | 7 |
| | 156 |
| | — |
|
| | | | | | | | | | | | | | | | | | | |
Derivatives:a | | | | | | | | | | | | | | | | | | |
| Embedded derivatives in provisional sales/purchase | | | | | | | | | | | | | | | | | | |
contracts in an asset positiond | 72 |
| | 72 |
| | — |
| | 72 |
| | — |
| |
contracts in a gross asset positiond | | 36 |
| | 36 |
| | — |
| | 36 |
| | — |
|
Copper futures and swaps contractse | 3 |
| | 3 |
| | 3 |
| | — |
| | — |
| 5 |
| | 5 |
| | 5 |
| | — |
| | — |
|
Copper forward contractse | 2 |
| | 2 |
| | 1 |
| | 1 |
| | — |
| |
| Total derivative assets | 77 |
| | 77 |
| | 4 |
| | 73 |
| | — |
| 41 |
| | 41 |
| | 5 |
| | 36 |
| | — |
|
| | | | | | | | | | | | | | | | | | | |
| Total assets | | | $ | 4,754 |
| | $ | 4,031 |
| | $ | 723 |
| | $ | — |
| | | $ | 789 |
| | $ | 36 |
| | $ | 753 |
| | $ | — |
|
| | | | | | | | | | | | | | | | | | | |
| Liabilities | | | | | | | | | | | | | | | | | | |
Derivatives:a | | | | | | | | | | | | | | | | | | |
| Embedded derivatives in provisional sales/purchase | | | | | | | | | | | | | | | | | | |
contracts in a liability positiond | $ | 82 |
| | $ | 82 |
| | $ | — |
| | $ | 82 |
| | $ | — |
| |
contracts in a gross liability positiond | | $ | 27 |
| | $ | 27 |
| | $ | — |
| | $ | 27 |
| | $ | — |
|
Copper futures and swap contractsf | 13 |
| | 13 |
| | 11 |
| | 2 |
| | — |
| 1 |
| | 1 |
| | 1 |
| | — |
| | — |
|
| Total derivative liabilities | 95 |
| | 95 |
| | 11 |
| | 84 |
| | — |
| 28 |
| | 28 |
| | 1 |
| | 27 |
| | — |
|
| | | | | | | | | | | | | | | | | | | |
Long-term debt, including current portiong | 3,537 |
| | 3,797 |
| | — |
| | 3,797 |
| | — |
| 3,527 |
| | 3,589 |
| | — |
| | 3,589 |
| | — |
|
| | | | | | | | | | | | | | | | | | | |
| Total liabilities | | | $ | 3,892 |
| | $ | 11 |
| | $ | 3,881 |
| | $ | — |
| | | $ | 3,617 |
| | $ | 1 |
| | $ | 3,616 |
| | $ | — |
|
| |
| a. | Recorded at fair value. |
| |
| b. | Recorded at cost and included in other assets. |
| |
| c. | Current portion included in other current assets and long-term portion included in other assets. |
| |
| d. | Embedded derivatives are recorded in trade accounts receivable and/or accounts payable and accrued liabilities.liabilities (refer to Note 7 for further discussion). |
| |
| e. | Included in other current assets. |
| |
| f. | Included in accounts payable and accrued liabilities. |
| |
| g. | Recorded at cost except for long-term debt acquired in the FMC acquisition, which was recorded at fair value at the acquisition date. |
Valuation Techniques
Money market funds are classified within Level 1 of the fair value hierarchy because they are valued using quoted market prices in active markets.
FCX's investment in MMR's 5¾%5.75% Convertible Perpetual Preferred Stock (MMR investment) is not actively traded; therefore, FCX's investment in the MMR 5¾% Convertible Perpetual Preferred Stock is valued based ontraded. Historically, FCX used a pricing simulation model in determining fair value of the MMR investment; however, because of the definitive agreement to acquire MMR (refer to Note 2), FCX incorporated a discounted cash flow model in determining fair value of the MMR investment at March 31, 2013. Accordingly, FCX primarily valued its MMR investment based on a discounted cash flow model that uses the quoted market prices of MMR's publicly traded common stockrisk-adjusted discount rates as the most
significant observable input and other inputs, such as expected volatility,an expected settlement date, and risk-free interest rate. Therefore,date. FCX continues to classify this investment is classifiedvaluation within Level 2 of the fair value hierarchy.
Fixed income securities (government and agency securities, U.S.(U.S. core fixed income funds, government securities, corporate bonds, asset-backed securities and asset-backed securities)municipal bonds) are valued using a bid evaluation or a mid evaluation. A bid evaluation is an estimated price at which a dealer would pay for a security. A mid evaluation is the average of the estimated price at which a
dealer would sell a security and the estimated price at which a dealer would pay for a security. These evaluations are based on quoted prices, if available, or models that use observable inputs and, as such, are classified within Level 2 of the fair value hierarchy.
Equity securities are valued at the closing price reported on the active market on which the individual securities are traded and, as such, are classified within Level 1 of the fair value hierarchy.
FCX’s embedded derivatives on provisional copper concentrate, copper cathode and gold purchases and sales have critical inputs of quoted monthly LME or COMEX copper forward prices and the London PM gold forward price at each reporting date based on the month of maturity; however, FCX's contracts themselves are not traded on an exchange. Likewise, FCX’s embedded derivatives on provisional molybdenum purchases have critical inputs based on the latest average weekly Metals Week Molybdenum Dealer Oxide prices; however, FCX's contracts themselves are not traded on an exchange. As a result, these derivatives are classified within Level 2 of the fair value hierarchy.
FCX’s derivative financial instruments for copper futures and swap contracts and copper forward contracts that are traded on the respective exchanges are classified within Level 1 of the fair value hierarchy because they are valued using quoted monthly COMEX or LME forward prices at each reporting date based on the month of maturity (refer to Note 67 for further discussion). Certain of these contracts are traded on the over-the-counter market and are classified within Level 2 of the fair value hierarchy.
Long-term debt, including the current portion, is not actively traded and is valued using prices obtained from a readily available pricing source and, as such, is classified within Level 2 of the fair value hierarchy.
The techniques described above may produce a fair value calculation that may not be indicative of net realizable value or reflective of future fair values. Furthermore, while FCX believes its valuation techniques are appropriate and consistent with other market participants, the use of different techniques or assumptions to determine fair value of certain financial instruments could result in a different fair value measurement at the reporting date. There have been no changes in the techniques used at September 30, 2012March 31, 2013., except as otherwise described above.
| |
8. | 9. CONTINGENCIES AND COMMITMENTS |
Environmental. FCX's mining, exploration, production and historical operating activities are subject to stringent laws and regulations governing the protection of the environment. FCX reviews changes in facts and circumstances associated with its environmental and reclamation obligations at least quarterly. There have been no material changes to FCX's environmental and reclamation obligations since year-end 2011. However, updated cost assumptions, including increases and decreases to cost estimates, changes in the anticipated scope and timing of remediation activities and settlement of environmental matters may result in revisions to certain environmental obligations. As a result, FCX recorded adjustments to environmental obligations totaling net credits of $82 million in third-quarter2012 and $36 million during the first nine months of2012, and net charges of $31 million in third-quarter2011 and $35 million during the first nine months of2011.
Gilt Edge Mine Site. On July 12, 2010, FCX was notified by the U.S. Department of Justice, acting at the request of the U.S. Environmental Protection Agency (EPA), that it was preparing to file suit in federal court against two of its wholly owned subsidiaries (Cyprus Mines Corporation and Cyprus Amax Minerals Company) and several other parties to recover costs incurred or to be incurred by the U.S. in remediating hazardous substances at the Gilt Edge mine site in Lawrence County, South Dakota. In September 2011, FCX reached an agreement in principle to settle this matter for an amount that is not material to FCX and less than the amount included for this matter in FCX's aggregate environmental obligations. The consent decree was finalized and approved by the court on October 10, 2012.
Asset Retirement Obligations (AROs). During third-quarter 2012, Cerro Verde updated its closure plan and increased its ARO by $77 million to reflect revised cost estimates and accelerated timing of certain closure activities.
Litigation.There have been no material The following information includes a discussion of updates to previously reported legal proceedings included in Note 13 of FCX's 2011 Annual Report and in Note 8 of FCX's quarterly reportsannual report on Form 10-Q10-K for the periodsyear ended MarchDecember 31, 2012 and June 30, 2012..
Other Contingencies.Shareholder Litigation The Indonesian tax authorities issued assessments for various audit exceptions. In re Freeport-McMoRan Copper & Gold Inc. Derivative Litigation, No. 8145-VCN, consolidated in the Delaware Court of Chancery on January 25, 2013. On March 18, 2013, the Delaware Court of Chancery granted the stipulation made by the parties to allow the plaintiffs in In re Freeport-McMoRan Derivative Litigation, No. CV2012-018351, consolidated in the Arizona Superior Court on February 6, 2013, to intervene in the consolidated Delaware action. On March 18, 2013, the Arizona plaintiffs agreed to seek a permanent stay of the Arizona actions, and on March 20, 2013, the Arizona Superior Court extended the stay until June 7, 2013. On March 21, 2013, the plaintiffs in the consolidated Delaware action informed the Delaware Court of Chancery that they will not seek a preliminary injunction barring either the PXP merger or the MMR merger.
PT Freeport Indonesia's income tax returnsStephen Blau MD Money Purchase Pension Plan Trust v. Moffett et al., No. 8384-VCN, Delaware Court of Chancery, filed March 5, 2013. On March 5, 2013, an additional derivative action challenging the MMR merger and the PXP merger was filed on behalf of FCX by a purported FCX stockholder in the Delaware Court of Chancery. The action names some or all of the following as follows (in millions):defendants: the directors and certain officers of FCX, two FCX subsidiaries, PXP and certain of its directors, and MMR and certain of its directors and officers. The action alleges, among other things, that the FCX directors breached their fiduciary duties to FCX stockholders because they, among other things, pursued their own interests at the expense of stockholders in approving the PXP and MMR mergers. The complaint also alleges that some or all of the following parties aided and abetted the wrongful acts allegedly committed by the directors and certain officers of FCX, two FCX subsidiaries, PXP and certain of its directors, and MMR and certain of its directors and officers. The action seeks as relief, among other things, enjoining defendants temporarily and permanently from taking any steps to accomplish or implement the proposed PXP and MMR mergers under the terms proposed and requiring submission of the proposed PXP and MMR
|
| | | | | | | | | | | | | | |
| Date of assessment | | Tax return year | | Tax assessment | | Interest assessment | | Total |
| October 2010 | | 2005 | | $ | 106 |
| | $ | 52 |
| | $ | 158 |
|
| November 2011 | | 2006 | | 22 |
| | 10 |
| | 32 |
|
| March 2012 | | 2007 | | 91 |
| | 44 |
| | 135 |
|
| Total | | | | $ | 219 |
| | $ | 106 |
| | $ | 325 |
|
mergers to a vote of FCX stockholders, damages, and attorneys' fees and costs. This action has not yet been consolidated into the Delaware action.
In re Plains Exploration & Production Company Stockholder Litigation, No. 8090-VCN, consolidated in the Delaware Court of Chancery on January 15, 2013. On March 22, 2013, the plaintiffs filed a brief in support of their motion for preliminary injunction which was filed on February 15, 2013. The Delaware Court of Chancery held a hearing on May 1, 2013, regarding the plaintiffs' motion for preliminary injunction. A ruling is expected in the near future.
In re McMoRan Exploration Co. Stockholder Litigation, No. 8132-VCN, consolidated in the Delaware Court of Chancery on January 25, 2013. On March 21, 2013, the plaintiffs filed a brief in support of their motion for preliminary injunction which was filed on December 20, 2012.
Langley v. Moffett et al., No. 2012-11904, Civil District Court for the Parish of Orleans of the State of Louisiana, filed December 19, 2012. On April 19, 2013, the Louisiana Civil District Court granted defendants' motion to stay the action pending the resolution of the consolidated action brought by MMR stockholders in the Delaware Court of Chancery.
FCX intends to defend itself vigorously in these matters.
Tax Matters. As reported in Note 13 of FCX's annual report on Form 10-K for the year ended December 31, 2012, PT Freeport Indonesia has filed objections to the assessments. During first-quarter 2012, PT Freeport Indonesia's objections to thereceived assessments related to 2005 were substantially all rejected byfrom the Indonesian tax authorities for additional taxes and in May 2012, appeals were filed withinterest related to various audit exceptions for the years 2005, 2006 and 2007. During first-quarter 2013, PT Freeport Indonesia also received assessments from the Indonesian Tax Court.tax authorities for additional taxes of $59 million and interest of $55 million related to various audit exceptions for 2008. As of September 30, 2012March 31, 2013, PT Freeport Indonesia has paid $158190 million (of which $124148 million is included in long-term receivables)other assets) for the disputed tax assessments relatedassessments. PT Freeport Indonesia has filed objections to the 2005, 2006 and 2007.
Mining Contracts. Effective March 26, 2012, the Democratic Republic of Congo (DRC) government issued a Presidential Decree approving the modifications to TFM's bylaws. As a result, FCX's effective ownership interest in TFM was reduced from 57.75 percent to 56.0 percent2007 assessments because it believes it has properly determined and $50 million of TFM's intercompany loans payable to FMC were converted to equity.paid its taxes.
| |
9. | NEW ACCOUNTING STANDARDS |
10. NEW ACCOUNTING STANDARDS
In MayDecember 2011, the Financial Accounting Standards Board (FASB) issued an Accounting Standards Update (ASU) that requires companies to disclose information regarding offsetting and other arrangements for derivatives and other financial instruments. Additionally, in connection with guidance for fair value measurementsJanuary 2013, FASB issued an ASU that limited the scope of the balance sheet offsetting disclosures to derivatives, repurchase agreements and disclosures. This ASU clarifiessecurities lending transactions to the FASB's intent on current guidance, modifies and changes certain guidance and principles, and expands disclosures concerning Level 3 fair value measurementsextent that they are (i) offset in the fair value hierarchy (including quantitative information about significant unobservable inputs within Level 3 of the fair value hierarchy). In addition, this ASU requires disclosure of the fair value hierarchy for assets and liabilities not measured at fair value in the statement of financial position, but whose fair value is requiredstatements or (ii) subject to be disclosed. This ASU became effective for interim and annual reporting periods beginning after December 15, 2011.an enforceable master netting arrangement or similar arrangement. FCX adopted this guidance effective January 1, 2012.2013.
In June 2011,February 2013, FASB issued an ASU in connection with guidance onthat clarified the presentation ofreclassification requirements from accumulated other comprehensive income. The objective of this ASU isincome to improve the comparability, consistency and transparency of financial reporting and to increase the prominence of items reported in other comprehensivenet income. This ASU requires an entity to present the componentsdisclosure of net income and other comprehensive income and total comprehensive income (includes net income) either in a single continuous statement of comprehensive income or in two separate but consecutive statements. This ASU eliminates the option to present the components of other comprehensive income as part of the statement of equity, but does not change the items that must be reported in other comprehensive income. This ASU became effective for interim and annual reporting periods beginning after December 15, 2011. Effective January 1, 2012, FCX adopted this ASU and presented total comprehensive income in a separate statement. Additionally, in December 2011, FASB deferred the effective date in this ASU for presenting reclassification adjustments for each componentamounts reclassified out of accumulated other comprehensive income in both net income and other comprehensive incomeby component. In addition, an entity is required to present either on the face of the financial statements.statements or in the notes, significant amounts reclassified out of accumulated other comprehensive income by the respective line items of net income, but only if the amount is reclassified in its entirety to net income in the same reporting period. For amounts not reclassified in their entirety to net income, an entity is required to cross-reference to the related note on the face of the financial statements for additional information. FCX adopted this guidance effective January 1, 2013.
11. SUBSEQUENT EVENTS
FCX evaluated events after September 30, 2012March 31, 2013, and through the date the consolidated financial statements were issued, and determined any events or transactions occurring during this period that would require recognition or disclosure are appropriately addressed in these consolidated financial statements.
12. BUSINESS SEGMENTS
FCX has organized its operations into five primary divisions – North America copper mines, South America mining, Indonesia mining, Africa mining and Molybdenum operations.mines. Notwithstanding this structure, FCX internally reports information on a mine-by-mine basis. Therefore, FCX concluded that its operating segments include individual mines or operations. Operating segments that meet certain thresholds are reportable segments. Beginning in first-quarter 2013, the Molybdenum operations division was revised to only report FCX's two molybdenum mines in North America - the Henderson underground mine and the Climax open-pit mine, both in Colorado - as a division (i.e. Molybdenum mines). The molybdenum sales company and related conversion facilities are included with Corporate, Other & Eliminations in the following segment tables. In addition, FCX revised its segment disclosures for the three months ended March 31, 2012, to conform with the current period presentation.
Intersegment Sales. Intersegment sales between FCX’s operations are based on similar arms-length transactions with third parties at the time of the sale. Intersegment sales may not be reflective of the actual prices ultimately realized because of a variety of factors, including additional processing, timing of sales to unaffiliated customers and transportation premiums.
FCX defers recognizing profits on sales from its mining operations to Atlantic Copper and on 25 percent of Indonesia mining sales to PT Smelting until final sales to third parties occur. Quarterly variations in ore grades, the timing of intercompany shipments and changes in product prices result in variability in FCX's net deferred profits and quarterly earnings.
Allocations. FCX allocates certain operating costs, expenses and capital expenditures to its operating divisions and individual segments. However, not all costs and expenses applicable to a mine or operation are allocated. U.S. federal and state income taxes are recorded and managed at the corporate level, whereas foreign income taxes are recorded and managed at the applicable country. In addition, most exploration and research activities are managed at the corporate level, and those costs along with some selling, general and administrative costs are not allocated to the operating divisions or segments. Accordingly, the following segment information reflects management determinations that may not be indicative of what the actual financial performance of each operating division or segment would be if it was an independent entity.
Business Segments
| | | (In millions) | North America Copper Mines | | South America | | Indonesia | | Africa | | | | | | | | | | | North America Copper Mines | | South America | | Indonesia | | Africa | | | | | | | | | | |
| | | | | | | | | | | | | | | | | | | | | | Atlantic | | Corporate, | | | | | | | | | | | | | | | | | | | | | | | Atlantic | | Corporate, | | |
| | | | | | | | | | | | | | | | | | | | | | Copper | | Other & | | | | | | | | | | | | | | | | | | | Molyb- | | | | Copper | | Other & | | |
| | | | Other | | | | Cerro | | Other | | | | | | | | Molyb- | | Rod & | | Smelting | | Elimi- | | FCX | | | Other | | | | Cerro | | Other | | | | | | | | denum | | Rod & | | Smelting | | Elimi- | | FCX |
| | Morenci | | Mines | | Total | | Verde | | Mines | | Total | | Grasberg | | Tenke | | denum | | Refining | | & Refining | | nations | | Total | Morenci | | Mines | | Total | | Verde | | Mines | | Total | | Grasberg | | Tenke | | MInes | | Refining | | & Refining | | nations | | Total |
| Three Months Ended September 30, 2012 | | | | | | | | | | | | | | | | | | | | | | | | | | |
| Three Months Ended March 31, 2013 | | | | | | | | | | | | | | | | | | | | | | | | | | |
| Revenues: | | | | | | | | | | | | | | | | | | | | | | | | | | | | | | | | | | | | | | | | | | | | | | | | | | |
| Unaffiliated customers | $ | 39 |
| | $ | 10 |
| | $ | 49 |
| | $ | 504 |
| | $ | 491 |
| | $ | 995 |
| | $ | 845 |
| a | $ | 365 |
| | $ | 308 |
| | $ | 1,221 |
| | $ | 633 |
| | $ | 1 |
| | $ | 4,417 |
| $ | 80 |
| | $ | 49 |
| | $ | 129 |
| | $ | 290 |
| | $ | 560 |
| | $ | 850 |
| | $ | 864 |
| a | $ | 438 |
| | $ | — |
| | $ | 1,330 |
| | $ | 633 |
| | $ | 339 |
| b | $ | 4,583 |
|
| Intersegment | 456 |
| | 811 |
| | 1,267 |
| | 71 |
| | 126 |
| | 197 |
| | 146 |
| | 2 |
| | — |
| | 7 |
| | 5 |
| | (1,624 | ) | | — |
| 436 |
| | 824 |
| | 1,260 |
| | 109 |
| | 55 |
| | 164 |
| | 67 |
| | — |
| | 143 |
| | 7 |
| | 6 |
| | (1,647 | ) | | — |
|
| Production and delivery | 268 |
| | 492 |
| | 760 |
| | 197 |
| | 333 |
| | 530 |
| | 587 |
| | 172 |
| | 273 |
| | 1,222 |
| | 624 |
| | (1,576 | ) | | 2,592 |
| 297 |
| | 514 |
| | 811 |
| | 171 |
| | 304 |
| | 475 |
| | 563 |
| | 185 |
| | 80 |
| | 1,328 |
| | 628 |
| | (1,351 | ) | | 2,719 |
|
| Depreciation, depletion and amortization | 31 |
| | 57 |
| | 88 |
| | 39 |
| | 35 |
| | 74 |
| | 54 |
| | 42 |
| | 18 |
| | 2 |
| | 11 |
| | 9 |
| | 298 |
| 33 |
| | 69 |
| | 102 |
| | 33 |
| | 38 |
| | 71 |
| | 55 |
| | 58 |
| | 20 |
| | 3 |
| | 10 |
| | 10 |
| | 329 |
|
| Selling, general and administrative expenses | — |
| | 1 |
| | 1 |
| | 1 |
| | 1 |
| | 2 |
| | 31 |
| | 2 |
| | 3 |
| | — |
| | 4 |
| | 67 |
| | 110 |
| — |
| | 1 |
| | 1 |
| | — |
| | 1 |
| | 1 |
| | 26 |
| | 3 |
| | — |
| | — |
| | 5 |
| | 77 |
| | 113 |
|
| Exploration and research expenses | 1 |
| | — |
| | 1 |
| | — |
| | — |
| | — |
| | — |
| | — |
| | — |
| | — |
| | — |
| | 78 |
| | 79 |
| — |
| | — |
| | — |
| | — |
| | — |
| | — |
| | — |
| | — |
| | — |
| | — |
| | — |
| | 52 |
| | 52 |
|
| Environmental obligations and shutdown costs | — |
| | — |
| | — |
| | — |
| | — |
| | — |
| | — |
| | — |
| | — |
| | — |
| | — |
| | (73 | ) | | (73 | ) | — |
| | (4 | ) | | (4 | ) | | — |
| | — |
| | — |
| | — |
| | — |
| | — |
| | — |
| | — |
| | 19 |
| | 15 |
|
| Operating income (loss) | 195 |
| | 271 |
| | 466 |
| | 338 |
| | 248 |
| | 586 |
| | 319 |
| | 151 |
| | 14 |
| | 4 |
| | (1 | ) | | (128 | ) | | 1,411 |
| 186 |
| | 293 |
| | 479 |
| | 195 |
| | 272 |
| | 467 |
| | 287 |
| | 192 |
| | 43 |
| | 6 |
| | (4 | ) | | (115 | ) | | 1,355 |
|
| | | | | | | | | | | | | | | | | | | | | | | | | | | | | | | | | | | | | | | | | | | | | | | | | | | |
| Interest expense, net | 1 |
| | 1 |
| | 2 |
| | — |
| | — |
| | — |
| | 3 |
| | — |
| | — |
| | — |
| | 3 |
| | 34 |
| | 42 |
| 1 |
| | 1 |
| | 2 |
| | — |
| | — |
| | — |
| | 2 |
| | — |
| | — |
| | — |
| | 4 |
| | 49 |
| | 57 |
|
| Provision for (benefit from) income taxes | — |
| | — |
| | — |
| | (88 | ) | b | 72 |
| | (16 | ) | | 111 |
| | 28 |
| | — |
| | — |
| | — |
| | 92 |
| | 215 |
| — |
| | — |
| | — |
| | 64 |
| | 87 |
| | 151 |
| | 120 |
| | 44 |
| | — |
| | — |
| | — |
| | 113 |
| | 428 |
|
| Total assets at September 30, 2012 | 2,297 |
| | 5,528 |
| | 7,825 |
| | 5,704 |
| | 4,232 |
| | 9,936 |
| | 6,393 |
| | 4,490 |
| | 2,580 |
| | 330 |
| | 1,192 |
| | 1,771 |
| | 34,517 |
| |
| Total assets at March 31, 2013 | | 2,589 |
| | 5,917 |
| | 8,506 |
| | 5,968 |
| | 4,359 |
| | 10,327 |
| | 6,862 |
| | 4,894 |
| | 2,033 |
| | 316 |
| | 918 |
| | 8,732 |
| c | 42,588 |
|
| Capital expenditures | 108 |
| | 164 |
| | 272 |
| | 180 |
| | 87 |
| | 267 |
| | 237 |
| | 131 |
| | 44 |
| | 2 |
| | 4 |
| | 14 |
| | 971 |
| 153 |
| | 105 |
| | 258 |
| | 164 |
| | 62 |
| | 226 |
| | 191 |
| | 57 |
| | 40 |
| | 1 |
| | 8 |
| | 24 |
| | 805 |
|
| | | | | | | | | | | | | | | | | | | | | | | | | | | | | | | | | | | | | | | | | | | | | | | | | | | |
| Three Months Ended September 30, 2011 | | | | | | | | | | | | | | | | | | | | | | | | | | |
| Three Months Ended March 31, 2012 | | | | | | | | | | | | | | | | | | | | | | | | | | |
| Revenues: | | | | | | | | | | | | | | | | | | | | | | | | | | | | | | | | | | | | | | | | | | | | | | | | | | |
| Unaffiliated customers | $ | 78 |
| | $ | 44 |
| | $ | 122 |
| | $ | 396 |
| | $ | 570 |
| | $ | 966 |
| | $ | 1,275 |
| a | $ | 275 |
| | $ | 332 |
| | $ | 1,389 |
| | $ | 834 |
| | $ | 2 |
| | $ | 5,195 |
| $ | 13 |
| | $ | 17 |
| | $ | 30 |
| | $ | 449 |
| | $ | 526 |
| | $ | 975 |
| | $ | 953 |
| a | $ | 303 |
| | $ | — |
| | $ | 1,298 |
| | $ | 704 |
| | $ | 342 |
| b | $ | 4,605 |
|
| Intersegment | 450 |
| | 847 |
| | 1,297 |
| | 105 |
| | (18 | ) | | 87 |
| | 87 |
| | 1 |
| | — |
| | 7 |
| | 3 |
| | (1,482 | ) | | — |
| 513 |
| | 913 |
| | 1,426 |
| | 127 |
| | 152 |
| | 279 |
| | (3 | ) | | 2 |
| | 126 |
| | 6 |
| | 8 |
| | (1,844 | ) | | — |
|
| Production and delivery | 252 |
| | 412 |
| | 664 |
| | 196 |
| | 282 |
| | 478 |
| | 503 |
| | 142 |
| | 260 |
| | 1,390 |
| | 826 |
| | (1,693 | ) | | 2,570 |
| 256 |
| | 451 |
| | 707 |
| | 193 |
| | 270 |
| | 463 |
| | 515 |
| | 132 |
| | 70 |
| | 1,297 |
| | 695 |
| | (1,451 | ) | | 2,428 |
|
| Depreciation, depletion and amortization | 27 |
| | 40 |
| | 67 |
| | 32 |
| | 32 |
| | 64 |
| | 62 |
| | 32 |
| | 14 |
| | 2 |
| | 11 |
| | 5 |
| | 257 |
| 31 |
| | 62 |
| | 93 |
| | 30 |
| | 32 |
| | 62 |
| | 46 |
| | 32 |
| | 11 |
| | 2 |
| | 10 |
| | 11 |
| | 267 |
|
| Selling, general and administrative expenses | — |
| | 1 |
| | 1 |
| | 1 |
| | 1 |
| | 2 |
| | 29 |
| | 1 |
| | 3 |
| | — |
| | 5 |
| | 61 |
| | 102 |
| — |
| | 1 |
| | 1 |
| | 1 |
| | 1 |
| | 2 |
| | 33 |
| | 2 |
| | — |
| | — |
| | 5 |
| | 61 |
| | 104 |
|
| Exploration and research expenses | 3 |
| | — |
| | 3 |
| | — |
| | — |
| | — |
| | — |
| | — |
| | 1 |
| | — |
| | — |
| | 74 |
| | 78 |
| — |
| | — |
| | — |
| | — |
| | — |
| | — |
| | — |
| | — |
| | — |
| | — |
| | — |
| | 62 |
| | 62 |
|
| Environmental obligations and shutdown costs | 1 |
| | (15 | ) | | (14 | ) | | — |
| | — |
| | — |
| | — |
| | ��� |
| | — |
| | — |
| | — |
| | 52 |
| | 38 |
| — |
| | — |
| | — |
| | — |
| | — |
| | — |
| | — |
| | — |
| | — |
| | — |
| | — |
| | 10 |
| | 10 |
|
| Operating income (loss) | 245 |
| | 453 |
| | 698 |
| | 272 |
| | 237 |
| | 509 |
| | 768 |
| | 101 |
| | 54 |
| | 4 |
| | (5 | ) | | 21 |
| | 2,150 |
| 239 |
| | 416 |
| | 655 |
| | 352 |
| | 375 |
| | 727 |
| | 356 |
| | 139 |
| | 45 |
| | 5 |
| | 2 |
| | (195 | ) | | 1,734 |
|
| | | | | | | | | | | | | | | | | | | | | | | | | | | | | | | | | | | | | | | | | | | | | | | | | | | |
| Interest expense, net | — |
| | 1 |
| | 1 |
| | — |
| | — |
| | — |
| | 7 |
| | 2 |
| | — |
| | — |
| | 4 |
| | 64 |
| | 78 |
| — |
| | 1 |
| | 1 |
| | 5 |
| | — |
| | 5 |
| | — |
| | — |
| | — |
| | — |
| | 3 |
| | 54 |
| | 63 |
|
| Provision for income taxes | — |
| | — |
| | — |
| | 154 |
| | 48 |
| | 202 |
| | 333 |
| | 20 |
| | — |
| | — |
| | — |
| | 253 |
| | 808 |
| — |
| | — |
| | — |
| | 123 |
| | 117 |
| | 240 |
| | 150 |
| | 29 |
| | — |
| | — |
| | — |
| | 72 |
| | 491 |
|
| Total assets at September 30, 2011 | 1,981 |
| | 4,966 |
| | 6,947 |
| | 4,886 |
| | 3,475 |
| | 8,361 |
| | 5,437 |
| | 3,791 |
| | 2,342 |
| | 323 |
| | 955 |
| | 3,552 |
| | 31,708 |
| |
| Total assets at March 31, 2012 | | 2,146 |
| | 5,255 |
| | 7,401 |
| | 5,300 |
| | 4,127 |
| | 9,427 |
| | 5,613 |
| | 4,138 |
| | 1,906 |
| | 328 |
| | 1,033 |
| | 3,059 |
| | 32,905 |
|
| Capital expenditures | 21 |
| | 117 |
| | 138 |
| | 64 |
| | 110 |
| | 174 |
| | 162 |
| | 49 |
| | 155 |
| | 2 |
| | 5 |
| | 32 |
| | 717 |
| 44 |
| | 99 |
| | 143 |
| | 69 |
| | 83 |
| | 152 |
| | 182 |
| | 127 |
| | 93 |
| | 3 |
| | 3 |
| | 4 |
| | 707 |
|
| |
| a. | Included PT Freeport Indonesia’s sales to PT Smelting totaling $520430 million in third-quarterfirst-quarter 20122013 and $665589 million in third-quarterfirst-quarter 20112012. |
| |
| b. | Included a net creditrevenues from FCX's molybdenum sales company, which included sales of $234 million formolybdenum produced by the reversalmolybdenum mines and by certain of a net deferred tax liability (refer to Note 4 for further discussion). |
|
| | | | | | | | | | | | | | | | | | | | | | | | | | | | | | | | | | | | | | | | | | | | | | | | | | | |
| | | | | | | | | | | | | | | | | | | | | | | | | | |
| (In millions) | North America Copper Mines | | South America | | Indonesia | | Africa | | | | | | | | | | |
| | | | | | | | | | | | | | | | | | | | | | Atlantic | | Corporate, | | |
| | | | | | | | | | | | | | | | | | | | | | Copper | | Other & | | |
| | | | Other | | | | Cerro | | Other | | | | | | | | Molyb- | | Rod & | | Smelting | | Elimi- | | FCX |
| | Morenci | | Mines | | Total | | Verde | | Mines | | Total | | Grasberg | | Tenke | | denum | | Refining | | & Refining | | nations | | Total |
| Nine Months Ended September 30, 2012 | | | | | | | | | | | | | | | | | | | | | | | | | |
| Revenues: | | | | | | | | | | | | | | | | | | | | | | | | | |
| Unaffiliated customers | $ | 157 |
| | $ | 22 |
| | $ | 179 |
| | $ | 1,285 |
| | $ | 1,563 |
| | $ | 2,848 |
| | $ | 2,673 |
| a | $ | 985 |
| | $ | 982 |
| | $ | 3,802 |
| | $ | 2,023 |
| | $ | 5 |
| | $ | 13,497 |
|
| Intersegment | 1,374 |
| | 2,646 |
| | 4,020 |
| | 349 |
| | 265 |
| | 614 |
| | 224 |
| | 9 |
| | — |
| | 20 |
| | 22 |
| | (4,909 | ) | | — |
|
| Production and delivery | 803 |
| | 1,446 |
| | 2,249 |
| | 575 |
| | 908 |
| | 1,483 |
| | 1,676 |
| | 456 |
| | 812 |
| | 3,800 |
| | 1,988 |
| | (4,822 | ) | | 7,642 |
|
| Depreciation, depletion and amortization | 95 |
| | 180 |
| | 275 |
| | 102 |
| | 106 |
| | 208 |
| | 153 |
| | 114 |
| | 47 |
| | 7 |
| | 31 |
| | 21 |
| | 856 |
|
| Selling, general and administrative expenses | 1 |
| | 2 |
| | 3 |
| | 2 |
| | 3 |
| | 5 |
| | 91 |
| | 5 |
| | 9 |
| | — |
| | 14 |
| | 184 |
| | 311 |
|
| Exploration and research expenses | 1 |
| | — |
| | 1 |
| | — |
| | — |
| | — |
| | — |
| | — |
| | 2 |
| | — |
| | — |
| | 211 |
| | 214 |
|
| Environmental obligations and shutdown costs | — |
| | 42 |
| | 42 |
| | — |
| | — |
| | — |
| | — |
| | — |
| | — |
| | — |
| | — |
| | (24 | ) | | 18 |
|
| Operating income (loss) | 631 |
| | 998 |
| | 1,629 |
| | 955 |
| | 811 |
| | 1,766 |
| | 977 |
| | 419 |
| | 112 |
| | 15 |
| | 12 |
| | (474 | ) | | 4,456 |
|
| | | | | | | | | | | | | | | | | | | | | | | | | | |
| Interest expense, net | 1 |
| | 3 |
| | 4 |
| | 5 |
| | — |
| | 5 |
| | 6 |
| | — |
| | — |
| | — |
| | 9 |
| | 124 |
| | 148 |
|
| Provision for income taxes | — |
| | — |
| | — |
| | 131 |
| b | 244 |
| | 375 |
| | 387 |
| | 79 |
| | — |
| | — |
| | — |
| | 287 |
| | 1,128 |
|
| Capital expenditures | 204 |
| | 365 |
| | 569 |
| | 365 |
| | 294 |
| | 659 |
| | 624 |
| | 428 |
| | 197 |
| | 5 |
| | 11 |
| | 25 |
| | 2,518 |
|
| | | | | | | | | | | | | | | | | | | | | | | | | | |
| Nine Months Ended September 30, 2011 | | | | | | | | | | | | | | | | | | | | | | | | | |
| Revenues: | | | | | | | | | | | | | | | | | | | | | | | | | |
| Unaffiliated customers | $ | 371 |
| | $ | 154 |
| | $ | 525 |
| | $ | 1,662 |
| | $ | 1,803 |
| | $ | 3,465 |
| | $ | 4,112 |
| a | $ | 959 |
| | $ | 1,119 |
| | $ | 4,291 |
| | $ | 2,241 |
| | $ | 6 |
| | $ | 16,718 |
|
| Intersegment | 1,274 |
| | 2,540 |
| | 3,814 |
| | 303 |
| | 135 |
| | 438 |
| | 544 |
| | 4 |
| | — |
| | 19 |
| | 11 |
| | (4,830 | ) | | — |
|
| Production and delivery | 719 |
| | 1,204 |
| | 1,923 |
| | 569 |
| | 761 |
| | 1,330 |
| | 1,547 |
| | 422 |
| | 786 |
| | 4,292 |
| | 2,274 |
| | (5,070 | ) | | 7,504 |
|
| Depreciation, depletion and amortization | 85 |
| | 111 |
| | 196 |
| | 102 |
| | 85 |
| | 187 |
| | 179 |
| | 98 |
| | 44 |
| | 6 |
| | 30 |
| | 16 |
| | 756 |
|
| Selling, general and administrative expenses | 1 |
| | 2 |
| | 3 |
| | 3 |
| | 2 |
| | 5 |
| | 100 |
| | 6 |
| | 11 |
| | — |
| | 18 |
| | 180 |
| | 323 |
|
| Exploration and research expenses | 4 |
| | — |
| | 4 |
| | — |
| | — |
| | — |
| | — |
| | — |
| | 3 |
| | — |
| | — |
| | 187 |
| | 194 |
|
| Environmental obligations and shutdown costs | 4 |
| | (15 | ) | | (11 | ) | | — |
| | — |
| | — |
| | — |
| | — |
| | — |
| | 1 |
| | — |
| | 108 |
| | 98 |
|
| Operating income (loss) | 832 |
| | 1,392 |
| | 2,224 |
| | 1,291 |
| | 1,090 |
| | 2,381 |
| | 2,830 |
| | 437 |
| | 275 |
| | 11 |
| | (70 | ) | | (245 | ) | | 7,843 |
|
| | | | | | | | | | | | | | | | | | | | | | | | | | |
| Interest expense, net | 2 |
| | 4 |
| | 6 |
| | 1 |
| | — |
| | 1 |
| | 9 |
| | 5 |
| | — |
| | — |
| | 12 |
| | 217 |
| | 250 |
|
| Provision for income taxes | — |
| | — |
| | — |
| | 476 |
| | 353 |
| | 829 |
| | 1,234 |
| | 100 |
| | — |
| | — |
| | — |
| | 535 |
| | 2,698 |
|
| Capital expenditures | 69 |
| | 273 |
| | 342 |
| | 120 |
| | 311 |
| | 431 |
| | 463 |
| | 89 |
| | 317 |
| | 7 |
| | 29 |
| | 71 |
| | 1,749 |
|
| |
a. | Included PT Freeport Indonesia’s sales to PT Smelting totaling $1.5 billion for the first nine months of 2012North and $2.0 billion for the first nine months of 2011.
South America copper mines. |
| |
b.c. | Included a net credit$7.0 billion of cash and cash equivalents at the parent company and $234477 million for the reversal of a net deferred tax liability (refertotal assets related to Note 4 for further discussion).Freeport Cobalt. |
REPORT OF INDEPENDENT REGISTERED PUBLIC ACCOUNTING FIRM
TO THE BOARD OF DIRECTORS AND STOCKHOLDERS OF
FREEPORT-McMoRan COPPER & GOLD INC.
We have reviewed the condensed consolidated balance sheet of Freeport-McMoRan Copper & Gold Inc. as of September 30, 2012March 31, 2013, and the related consolidated statements of income, and comprehensive income, and cash flows for the three- and nine-month periods ended September 30, 2012March 31, 2013 and 2011, the consolidated statements of cash flows for the nine-month periods ended September 30, 2012 and 2011, and the consolidated statement of equity for the ninethree-month period ended September 30, 2012March 31, 2013. These financial statements are the responsibility of the Company’s management.
We conducted our review in accordance with the standards of the Public Company Accounting Oversight Board (United States). A review of interim financial information consists principally of applying analytical procedures and making inquiries of persons responsible for financial and accounting matters. It is substantially less in scope than an audit conducted in accordance with the standards of the Public Company Accounting Oversight Board, the objective of which is the expression of an opinion regarding the financial statements taken as a whole. Accordingly, we do not express such an opinion.
Based on our review, we are not aware of any material modifications that should be made to the condensed consolidated financial statements referred to above for them to be in conformity with U.S. generally accepted accounting principles.
We have previously audited, in accordance with the standards of the Public Company Accounting Oversight Board (United States), the consolidated balance sheet of Freeport-McMoRan Copper & Gold Inc. as of December 31, 20112012, and the related consolidated statements of income, comprehensive income, cash flows, and equity for the year then ended (not presented herein), and in our report dated February 27, 2012,22, 2013, we expressed an unqualified opinion on those consolidated financial statements. In our opinion, the information set forth in the accompanying condensed consolidated balance sheet as of December 31, 20112012, is fairly stated, in all material respects, in relation to the consolidated balance sheet from which it has been derived.
/s/ ERNST & YOUNG LLP
Phoenix, Arizona
November 2, 2012May 6, 2013
| |
| Item 2. | Management's Discussion and Analysis of Financial Condition and Results of Operations. |
OVERVIEW
In Management’s Discussion and Analysis of Financial Condition and Results of Operations, “we,” “us” and “our” refer to Freeport-McMoRan Copper & Gold Inc. (FCX) and its consolidated subsidiaries. You should read this discussion in conjunction with our financial statements, the related Management’s Discussion and Analysis of Financial Condition and Results of Operations and the discussion of our Business and Properties in our annual report on Form 10-K for the year ended December 31, 20112012, filed with the United States (U.S.) Securities and Exchange Commission (SEC). The results of operations reported and summarized below are not necessarily indicative of future operating results (refer to "Cautionary Statement" for further discussion). References to “Notes” are Notes included in our Notes to Consolidated Financial Statements. Throughout Management's Discussion and Analysis of Financial Condition and Results of Operations all references to earnings or losses per share are on a diluted basis, unless otherwise noted.
PENDING ACQUISTIONS
In December 2012, we announced definitive agreements to acquire, in separate transactions, Plains Exploration & Production Company (PXP) and McMoRan Exploration Co. (MMR). Completion of each transaction is subject to receipt of PXP and MMR stockholder approval of their respective transaction. The PXP transaction is not conditioned on the closing of the MMR transaction, and the MMR transaction is not conditioned on the closing of the PXP transaction. On April 18, 2013, PXP announced that it will hold a special meeting of its stockholders on May 20, 2013, to vote on the proposed acquisition of PXP by FCX. On May 3, 2013, MMR announced it will hold a special meeting of its stockholders on June 3, 2013, to vote on the proposed acquisition of MMR by FCX. Both transactions are expected to close in second-quarter 2013, subject to satisfaction of all conditions to closing. Refer to Note 2 for further discussion of these pending acquisitions.
The information contained in Management's Discussion and Analysis of Financial Condition and Results of Operations does not reflect the pending acquisitions of PXP or MMR.
OVERVIEW
We are one of the world’s largest copper, gold and molybdenum mining companies in terms of reserves and production. Our portfolio of assets includes the Grasberg minerals district in Indonesia, one of the world's largest copper and gold deposits in terms of recoverable reserves, significant mining operations in North and South America, and the Tenke Fungurume (Tenke) minerals district in the Democratic Republic of Congo (DRC). The Grasberg minerals district contains the largest single recoverable copper reserve and the largest single gold reserve of any mine in the world based on the latest available reserve data provided by third-party industry consultants. We also operate Atlantic Copper, our wholly owned copper smelting and refining unit in Spain.
Our resultsOn March 29, 2013, through a newly formed joint venture, we acquired a large-scale cobalt chemical refinery in Kokkola, Finland, and the related sales and marketing business. The joint venture operates under the name Freeport Cobalt, and we are the operator of the joint venture with an effective 56 percent ownership interest. The remaining ownership interest is held by our partners in Tenke Fungurume Mining S.A.R.L. (TFM), including 24 percent by Lundin Mining Corporation (Lundin) and 20 percent by La Générale des Carrières et des Mines (Gécamines). This acquisition enhances our cobalt marketing position, product portfolio and product development capabilities and provides direct end-market access for the cobalt hydroxide production by TFM. Initial consideration paid was third quarter$355 million, including $34 million of acquired cash. Under the terms of the agreement, there is the potential for additional consideration of up to $110 million over a period of three years, contingent upon the achievement of revenue-based performance targets. The acquisition was funded 70 percent by us and first nine months of2012, compared with the 201130 percent periods, primarily reflected lower copper and gold sales volumes. Results for the first nine months of 2012 were also impacted by lower copper prices. Our net income attributableLundin, which amounts will be repaid prior to common stockholders also includes net credits for adjustmentsany shareholder distributions. Refer to Cerro Verde's deferred income taxes and to our environmental and related litigation reserves totalingNote $168 million2 for further discussion.third-quarter2012
We are progressing on major development projects, including the development of the underground ore bodies at Grasberg, and $116 million for the first nine monthsexpansion projects at Morenci and Cerro Verde. Studies are also under way to evaluate a major mill project at El Abra and various mill projects to process significant sulfide ore in North America. The advancement of2012, compared with net charges totaling $73 million for third-quarter2011 and $113 million for the first nine months these studies is designed to position us to invest in production growth within our existing portfolio of2011. assets. Refer to “Consolidated Results”“Operations” for further discussion of our consolidated financial results for the three-current operating and nine-month periods ended September 30, 2012 and 2011.
In May 2012, our Climax molybdenum mine began commercial production. Depending on market conditions, production from the Climax mine may ramp up to a rate of 20 million pounds of molybdenum per year during 2013, with the potential to produce 30 million pounds of molybdenum per year.development activities.
At September 30, 2012March 31, 2013, we had $3.79.6 billion in consolidated cash and cash equivalents and $3.510.1 billion in total debt. In FebruaryDuring first-quarter 2013, we completed $10.5 billion in debt financings associated with the pending acquisitions of PXP and MMR consisting of 2012$6.5 billion, we sold $3.0 billion of senior notes in three tranches withand a weighted average$4.0 billion bank term loan (the Term Loan). No amounts are currently available to FCX under the Term Loan, which will be funded at closing of the acquisitions.
The weighted-average interest rate of approximately threethese financings approximates 3.1 percent. We used the proceeds from this offering, plus cash on hand, to redeem the remaining $3.0 billion of our 8.375% Senior Notes. Refer to "Capital Resources and Liquidity" and Note 5 and “Capital Resources and Liquidity – Financing Activities” for further discussion.
In February 2012, our Board of Directors (the Board) authorized an increase in the cash dividend on our common stock to an annual rate of $1.25 per share ($0.3125 per share quarterly). Refer to Note 56 for further discussion.
At current copper prices, we expect to produce significant operating cash flows, and to use our cash to invest in our development projects including the underground development projects at Grasberg and the expansion projects at Morenci, Cerro Verde and Tenke, as well as to return cash to shareholders through dividends on our common stock dividends and/or share repurchases.stock.
22Refer to "Consolidated Results" for discussion of items impacting our consolidated results for the first quarters of 2013 and 2012.
OUTLOOK
We view the long-term outlook for our business positively, supported by limitations on supplies of copper and by the requirements for copper in the world’s economy. In recent weeks, the price of copper and other commodities have declined as a result of slowing growth in China and weakness in other global economies. We will continue to monitor market developments and adjust our operating strategy as market conditions change. Our financial results vary withas a result of fluctuations in market prices for copper, gold and molybdenum and other factors. World market prices for these commodities have fluctuated historically and are affected by numerous factors beyond our control. Because we cannot control the price of our products, the key measures that management focuses on in operating our business are sales volumes, unit net cash costs and operating cash flow. Discussion of the outlook for each of these measures follows.
Sales Volumes. Following are our projected consolidated sales volumes for the year 2013:
|
| | |
Copper (millions of recoverable pounds): | |
| North America copper mines | 1,445 |
|
| South America mining | 1,335 |
|
| Indonesia mining | 1,085 |
|
| Africa mining | 435 |
|
| 4,300 |
|
Gold (thousands of recoverable ounces): | |
| Indonesia mining | 1,245 |
|
| North and South America mining | 130 |
|
| 1,375 |
|
Molybdenum (millions of recoverable pounds)a | 92 |
|
| |
| a. | Projected molybdenum sales include 52 million pounds produced at our molybdenum mines and 40 million pounds produced at our North and South America copper mines. |
Consolidated sales from mines for the year 2012second-quarter2013 are expected to approximate 3.61.0 billion pounds of copper, 1.0 million ounces of gold and 82 million pounds of molybdenum, including 930 million pounds of copper, 255295 thousand ounces of gold and 20 million pounds of molybdenum for fourth-quarter2012. Expected gold sales for 2012 are approximately 50,000 ounces less than the estimates provided in our quarterly report on Form 10-Q for the period ended June 30, 2012, because of lower gold production at Grasberg. Consolidated sales from mines for the year 2013 are expected to total 4.3 billion pounds of copper, 1.4 million ounces of gold and 9023 million pounds of molybdenum. Projected sales volumes are dependent on a number of factors, including achievement of targeted mining rates, the successful operation of production facilities, the impact of weather conditions and other factors.
Unit Net Cash Costs. Quarterly unit net cash costs will vary with fluctuations in sales volumes and average realized prices for gold and molybdenum. Assuming average prices of $1,7001,400 per ounce of gold and $11 per pound of molybdenum for fourth-quarterthe remainder of 20122013, and achievement of current2012 sales volume and cost estimates, consolidated unit site production and deliverynet cash costs before net noncash and other costs,(net of by-product credits) for our copper mining operations are expected to average $2.03 per pound of copper and unit net cash costs (net of by-product credits) are expected to average $1.501.45 per pound of copper for the year 20122013 (fourth-quarter 2012 consolidated site production and delivery costs are expected to average $2.11 per pound of copper and. Projected unit net cash costs (netfor 2013 are higher than previous estimates primarily because of by-product credits) are expected to average $1.62 per pound of copper).lower gold credits. The impact of price changes duringfor fourth-quarterthe remainder of 20122013 on consolidated unit net cash costs for the year 2012 would approximate $0.0040.015 per pound for each $50 per ounce change in the average price of gold and $0.0040.01 per pound for each $2 per pound change in the average price of molybdenum. Assuming consistent commodity price assumptions,Quarterly unit net cash costs for 2013vary with fluctuations in sales volumes and average realized prices (primarily gold and molybdenum prices), and are expected to be lower than 2012 becausedecline in the second half of 2013 as we gain access to higher grade ore at Grasberg (54 percent of our projected increasedconsolidated copper sales volumes and 63 percent of our projected consolidated gold sales volumes at Grasberg.are expected in the second half of 2013). Refer to “Consolidated Results – Production and Delivery Costs” for further discussion of consolidated production and delivery costs.
Operating Cash Flows. Our operating cash flows vary with prices realized from copper, gold and molybdenum sales, our sales volumes, production costs, income taxes and other working capital changes and other factors. Based on current 2012 sales volume and cost estimates and assuming average prices of $3.703.25 per pound of copper, $1,7001,400 per ounce of gold and $11 per pound of molybdenum for fourth-quarterthe remainder of 20122013, consolidated operating
cash flows (excluding results of the pending PXP and MMR acquisitions) are estimated to approximate $4.05.5 billion for the year 20122013 (net of an estimated(including $1.40.4 billion in net working capital usessources and changes in other tax payments). Projected operating cash flows for the year 20122013 also reflect estimated taxes of $1.6$1.9 billion (refer to “Consolidated Results – Provision for Income Taxes” for further discussion of our projected consolidated effective annual tax rate for 20122013). The impact of price changes for fourth-quarterthe remainder of 20122013 on operating cash flows would approximate $80270 million for each $0.10 per pound change in the average price of copper, $2050 million for each $10050 per ounce change in the average price of gold and $1080 million for each $2 per pound change in the average price of molybdenum.
COPPER, GOLD AND MOLYBDENUM MARKETS
World prices for copper, gold and molybdenum can fluctuate significantly. During the period from January 20022003 through OctoberApril 20122013, the London Metal Exchange (LME) spot copper price varied from a low of $0.640.70 per pound in 20022003 to a record high of $4.60 per pound in February 2011, the London Bullion Market Association (London) gold price fluctuated from a low of $278320 per ounce in 20022003 to a record high of $1,895 per ounce in September 2011, and the Metals Week Molybdenum Dealer Oxide weekly average price ranged from a low of $2.433.28 per pound in 20022003 to a record high of $39.25 per pound in 2005. Copper, gold and molybdenum prices are affected by numerous factors beyond our control as described further in our “Risk Factors” contained in Part I, Item 1A of our annual report on Form 10-K for the year ended December 31, 20112012.
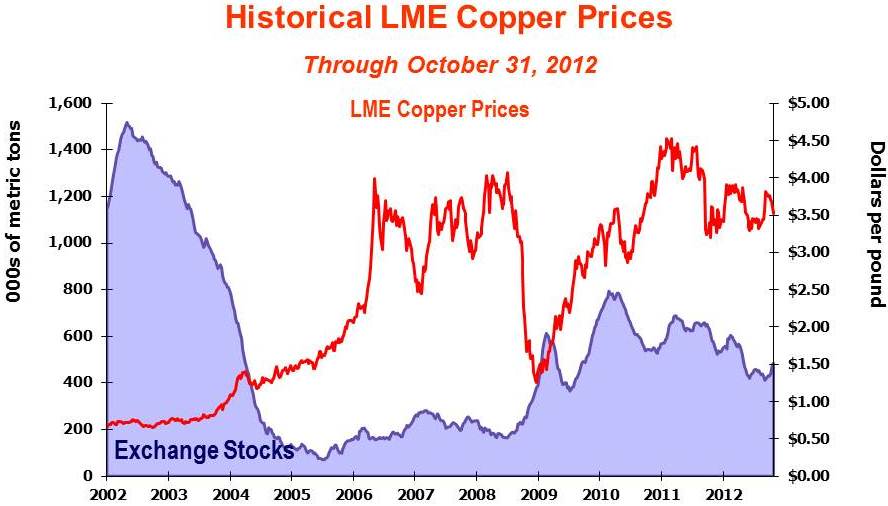
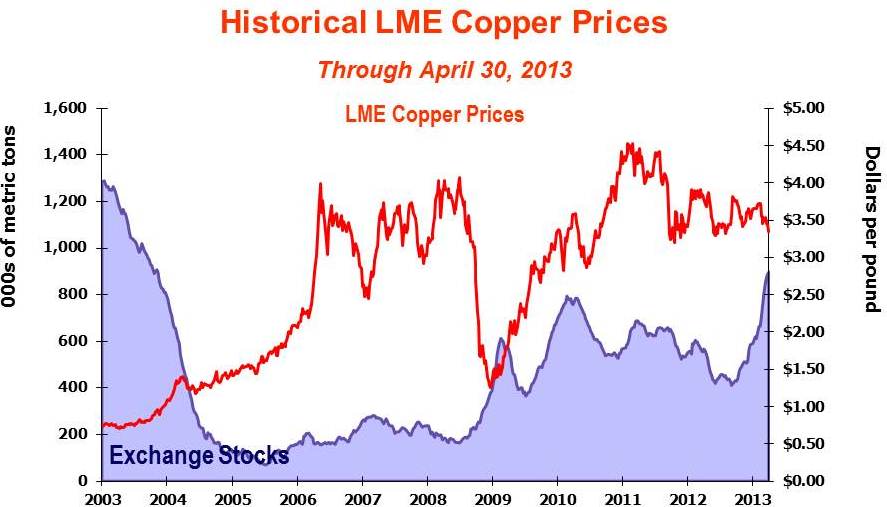
This graph presents LME spot copper prices and the combined reported stocks of copper at the LME, the New York Mercantile Exchange (COMEX) and the Shanghai Futures Exchange from January 20022003 through OctoberApril 20122013. From 2006 through most of 2008, limited supplies, combined with growing demand from China and other emerging economies, resulted in high copper prices and low levels of inventories. In late 2008, slowing consumption, turmoil in the U.S. financial markets and concerns about the global economy led to a sharp decline in copper prices, which reached a low of $1.26 per pound in December 2008. Higher copper prices since the 2008 lowthat time are attributable to a combination of demand from emerging marketsdeveloping economies and limitations on available supply.pro-growth monetary and fiscal policy decisions in Europe, China and the U.S. During third-quarterfirst-quarter 20122013, LME spot copper prices ranged from $3.323.42 per pound to $3.813.74 per pound, averaged $3.503.60 per pound, and closed atwas $3.753.44 per pound on SeptemberMarch 31, 2013.
Subsequent to March 31, 2013, copper prices have been impacted by demand related concerns, with LME spot copper prices closing at $3.21 per pound on April 30, 20122013. While global economic concerns continue to influenceDespite the decline in copper prices and increases in global exchange inventories, have declined, representing less than two weeks of global demand.
Wewe believe the underlying long-term fundamentals of the copper business remain positive, supported by the significant role of copper in the global economy and limited supplies. a challenging supply environment.
Future copper prices are expected to be volatile and are likely to be influenced by demand from China and emerging markets, economic activity in the U.S. and other industrialized countries, the timing of the development of new supplies of copper and production levels of mines and copper smelters. The LME spot copper price closed at $3.55 per pound on October 31, 2012.
This graph presents London p.m.PM gold prices from January 20022003 through OctoberApril 20122013. During third-quarterfirst-quarter 20122013, gold prices ranged from $1,5561,574 per ounce to $1,7851,694 per ounce, averaged $1,6521,632 per ounce and closed atwas $1,7761,598 per ounce on September 30, 2012March 31, 2013. GoldSubsequent to March 31, 2013, gold prices closedhave declined with the London PM gold price closing at $1,7191,469 per ounce on October 31, 2012April 30, 2013. Many analysts believe the outlook for gold is positive amid an uncertain outlook for global growth and the prospects for future inflation associated with accommodative monetary policies and elevated sovereign debt levels.
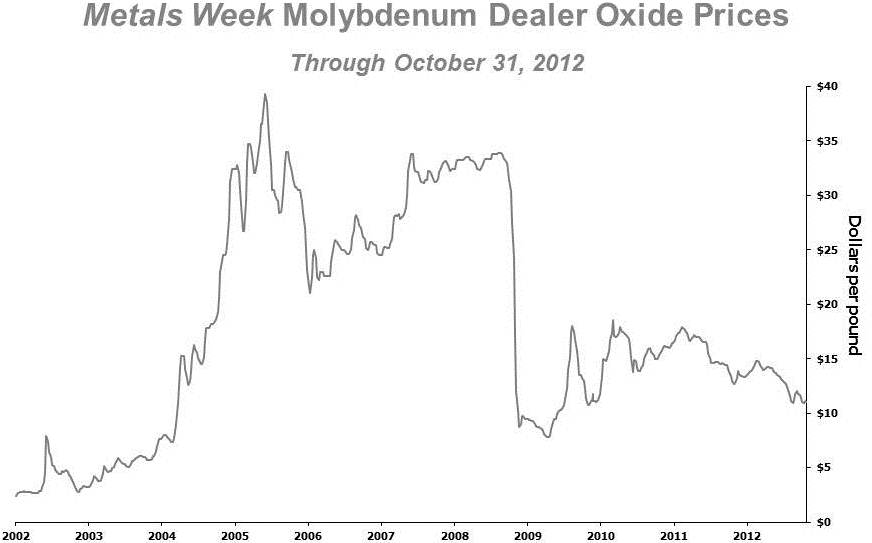
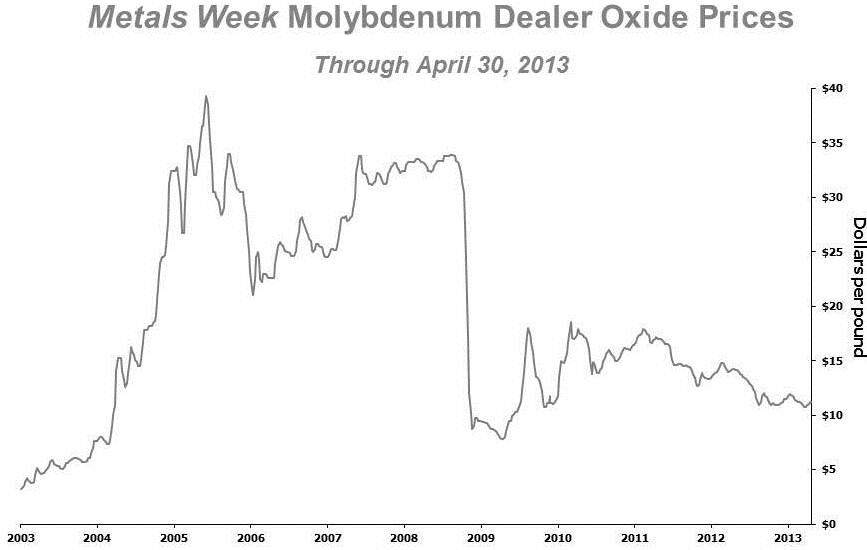
This graph presents the Metals Week Molybdenum Dealer Oxide weekly average prices from January 20022003 through OctoberApril 20122013. In late 2008, molybdenum prices declined significantly as a result of the financial market turmoil and a decline in demand. During third-quarterfirst-quarter 20122013, the weekly average price of molybdenum ranged from $10.9010.75 per pound to $12.9511.95 per pound, averaged $11.9311.35 per pound and closed atwas $11.6510.78 on September 30, 2012March 31, 2013. Average Metals Week Molybdenum Dealer Oxide prices were lower in third-quarter2012, compared with second-quarter 2012, reflecting weaker demand and cautious buying activity in response to the global economic situation. The Metals Week Molybdenum Dealer Oxide weekly average price was $11.0511.20 per pound on October 31, 2012April 30, 2013.
CONSOLIDATED RESULTS
| | | | Three Months Ended | | Nine Months Ended | | Three Months Ended | |
| | September 30, | | September 30, | | March 31, | |
| | 2012 | | 2011 | | 2012 | | 2011 | | 2013 | | 2012 | |
Financial Data (in millions, except per share amounts) | | | | | | | | | | | | |
Revenuesa,b | $ | 4,417 |
| | $ | 5,195 |
| | $ | 13,497 |
| | $ | 16,718 |
| | $ | 4,583 |
| | $ | 4,605 |
| |
Operating incomea,c | $ | 1,411 |
| d | $ | 2,150 |
| d | $ | 4,456 |
| d | $ | 7,843 |
| d | |
| Net income attributable to FCX common stockholders | $ | 824 |
| d,e | $ | 1,053 |
| d,e | $ | 2,298 |
| d,e,f | $ | 3,920 |
| d,e,f | |
Operating incomea | | $ | 1,355 |
| c | $ | 1,734 |
| |
Net income attributable to FCX common stockholdersd | | $ | 648 |
| c,e | $ | 764 |
| e |
| Diluted net income per share attributable to FCX common stockholders | $ | 0.86 |
| d,e | $ | 1.10 |
| d,e | $ | 2.41 |
| d,e,f | $ | 4.10 |
| d,e,f | $ | 0.68 |
| c,e | $ | 0.80 |
| e |
| Diluted weighted-average common shares outstanding | 953 |
| | 955 |
| | 953 |
| | 955 |
| | 953 |
| | 955 |
| |
| Operating cash flows | | $ | 831 |
| f | $ | 801 |
| f |
| Capital expenditures | | $ | 805 |
| | $ | 707 |
| |
| | | | | | | | | | | | | |
| Mining Operating Data | | | | | | | | | | | | |
Copper (millions of recoverable pounds) | | | | | | | | | | | | |
| Production | 938 |
| | 951 |
| | 2,658 |
| | 2,868 |
| | 980 |
| | 833 |
| |
| Sales, excluding purchases | 922 |
| | 947 |
| | 2,676 |
| | 2,875 |
| | 954 |
| | 827 |
| |
| Average realized price per pound | $ | 3.64 |
| | $ | 3.60 |
| | $ | 3.63 |
| | $ | 3.94 |
| | $ | 3.51 |
| | $ | 3.82 |
| |
Site production and delivery costs per poundg | $ | 2.03 |
| | $ | 1.71 |
| | $ | 2.00 |
| | $ | 1.65 |
| | $ | 1.94 |
| | $ | 1.96 |
| |
Unit net cash costs per poundg | $ | 1.62 |
| | $ | 0.80 |
| | $ | 1.46 |
| | $ | 0.84 |
| | $ | 1.57 |
| | $ | 1.26 |
| |
Gold (thousands of recoverable ounces) | | | | | | | | | | | | |
| Production | 204 |
| | 385 |
| | 707 |
| | 1,202 |
| | 235 |
| | 252 |
| |
| Sales, excluding purchases | 202 |
| | 409 |
| | 756 |
| | 1,245 |
| | 214 |
| | 288 |
| |
| Average realized price per ounce | $ | 1,728 |
| | $ | 1,693 |
| | $ | 1,666 |
| | $ | 1,565 |
| | $ | 1,606 |
| | $ | 1,694 |
| |
Molybdenum (millions of recoverable pounds) | | | | | | | | | | | | |
| Production | 20 |
| | 23 |
| | 61 |
| | 65 |
| | 22 |
| | 21 |
| |
| Sales, excluding purchases | 21 |
| | 19 |
| | 62 |
| | 60 |
| | 25 |
| | 21 |
| |
| Average realized price per pound | $ | 13.62 |
| | $ | 16.34 |
| | $ | 14.79 |
| | $ | 17.57 |
| | $ | 12.75 |
| | $ | 15.34 |
| |
| |
| a. | Refer to Note 1112 for a summary of revenues and operating income by business segment. |
| |
| b. | Includes the impact of adjustments to provisionally priced concentrate and cathode sales recognized in prior periods (refer to “Revenues” below for further discussion). |
| |
| c. | Includes charges of $14 million ($10 million to net income attributable to FCX common stockholders or $0.01 per share) for costs associated with the pending acquisitions of PXP and MMR and for the March 2013 acquisition of a cobalt chemical refinery business. |
| |
| d. | We defer recognizing profits on intercompany sales until final sales to third parties occur. Refer to "Operations - Atlantic Copper Smelting & Refining" for a summary of net impacts from changes in these deferrals. |
| |
d. | Includes net (credits) charges for adjustments to environmental obligations and related litigation reserves totaling $(85) million ($(68) million to net income attributable to common stockholders or $(0.07) per share) for third-quarter 2012, $29 million ($23 million to net income attributable to common stockholders or $0.02 per share) for third-quarter2011, $(19) million ($(16) million to net income attributable to common stockholders or $(0.02) per share) for the first nine months of2012 and $78 million ($63 million to net income attributable to common stockholders or $0.07 per share) for the first nine months of2011.
|
| |
| e. | The 2012 periods include a net tax credit of $100 million, net of noncontrolling interests ($0.11 per share), associated with adjustments to Cerro Verde's deferred income taxes. The 2011 periods include a tax charge of $50 million, net of noncontrolling interests ($0.05 per share) for additional taxes associated with Cerro Verde's election to pay a special mining burden during the remaining term of its stability agreement. Refer to Note 4 and "Provision for Income Taxes" below for further discussion of these amounts.
|
| |
f. | Includes losses on early extinguishment of debt totaling $40 million ($0.04 per share) for first-quarter2013 related to the termination of the acquisition bridge loan facilities and $149 million ($0.16 per share) for the first nine months offirst-quarter 2012 associated with the redemption of our remaining 8.375% senior notes. Refer to Note 6 for further discussion. |
| |
| f. | Net of working capital uses and changes in other tax payments of $430 million for first-quarter2013 and $60720 million (for $0.06 per share) for the first nine months offirst-quarter 20112012 (refer to Note 5 for further discussion). |
| |
| g. | Reflects per pound weighted-average production and delivery costs and unit net cash costs (net of by-product credits) for all copper mines, before net noncash and other costs. For reconciliations of the per pound costs by operating division to production and delivery costs applicable to sales reported in our consolidated financial statements, refer to “Operations – Unit Net Cash Costs” and to “Product Revenues and Production Costs.” |
Revenues
Consolidated revenues totaled $4.44.6 billion in both the third-quarterfirst quarters2012 of 2013 and $13.5 billion for the first nine months of2012, compared with $5.2 billion in third-quarter2011and $16.7 billion for the first nine months of2011. Consolidated revenues includeprimarily included the sale of copper concentrates, copper cathodes, copper rod, gold, molybdenum, and other metals by our North and South America copper mines, the sale of copper concentrates (which also contain significant quantities of gold and silver) by our Indonesia mining operations, the sale of copper cathodessilver and cobalt hydroxide by our Africa mining operations, the sale of molybdenum in various forms by our Molybdenum operations, and the sale of copper cathodes, copper anodes, and gold in anodes and slimes by Atlantic Copper.
hydroxide. Following is a summary of changes in our consolidated revenues between periods (in millions):
| | | | Three Months Ended September 30, | | Nine Months Ended September 30, | Three Months Ended March 31, |
| | | | | |
| Consolidated revenues - 2011 periods | $ | 5,195 |
| | $ | 16,718 |
| |
| Higher (lower) price realizations from mining operations: | | | | |
| Consolidated revenues - first-quarter 2012 | | $ | 4,605 |
|
| Higher (lower) sales volumes from mining operations: | | |
| Copper | 37 |
| | (830 | ) | 488 |
|
| Gold | 7 |
| | 76 |
| (125 | ) |
| Molybdenum | (57 | ) | | (174 | ) | 59 |
|
| Silver | (16 | ) | | (40 | ) | 10 |
|
| Cobalt | (14 | ) | | (44 | ) | 5 |
|
| (Lower) higher sales volumes from mining operations: | | | | |
| (Lower) higher price realizations from mining operations: | | |
| Copper | (89 | ) | | (783 | ) | (296 | ) |
| Gold | (351 | ) | | (765 | ) | (19 | ) |
| Molybdenum | 33 |
| | 38 |
| (64 | ) |
| Silver | (27 | ) | | (60 | ) | 1 |
|
| Cobalt | 23 |
| | — |
| (7 | ) |
| Favorable impact of net adjustments to prior period provisionally priced sales | 216 |
| | 132 |
| |
| Lower purchased copper | (51 | ) | | (437 | ) | |
| Lower Atlantic Copper revenues | (199 | ) | | (207 | ) | |
| Unfavorable impact of net adjustments for prior period provisionally priced sales | | (127 | ) |
| Other, including intercompany eliminations | (290 | ) | | (127 | ) | 53 |
|
| Consolidated revenues - 2012 periods | $ | 4,417 |
| | $ | 13,497 |
| |
| Consolidated revenues - first-quarter 2013 | | $ | 4,583 |
|
Price Realizations
Our consolidated revenues vary as a result of fluctuations in the market prices of copper, gold, molybdenum, silver and cobalt. Realized copper prices averaged $3.64 per pound in third-quarter2012 (compared with $3.60 per pound in third-quarter2011) and $3.63 per pound for the first nine months of2012 (compared with $3.94 for the first nine months of2011). Realized gold prices averaged $1,728 per ounce in third-quarter2012 (compared with $1,693 per ounce in third-quarter2011) and $1,666 per ounce for the first nine months of2012 (compared with $1,565 per ounce for the first nine months of2011). Realized molybdenum prices averaged $13.62 per pound in third-quarter2012 (compared with $16.34 per pound in third-quarter2011) and $14.79 per pound for the first nine months of2012 (compared with $17.57 per pound for the first nine months of2011).
Sales Volumes
Consolidated copper sales volumes totaledincreased to 922954 million pounds of copper,in 202first-quarter2013, compared with 827 million pounds in first-quarter2012, primarily reflecting higher production from Indonesia and Africa. Consolidated gold sales volumes decreased to 214 thousand ounces of gold andin first-quarter2013, compared with 288 thousand ounces in first-quarter2012, primarily reflecting anticipated lower ore grades in Indonesia. Consolidated molybdenum sales volumes increased to 25 million pounds in first-quarter2013, compared with 21 million pounds of molybdenum in third-quarterfirst-quarter 2012, compared with 947 million pounds of copper, 409 thousand ounces of gold and 19 million pounds of molybdenum in third-quarter2011. For the first nine months of2012, consolidatedprimarily reflecting stronger sales volumes totaled 2.7 billion pounds of copper, 756 thousand ounces of gold and 62 million pounds of molybdenum, compared with 2.9 billion pounds of copper, 1.2 million ounces of gold and 60 million pounds of molybdenum for the first nine months of2011. Lower consolidated copper and gold sales volumes in the 2012 periods primarily reflected lower ore grades in Indonesia, partly offset by increased production in North Americametallurgical and Africa. Lower copper and gold sales volumes for the first nine months of 2012 also reflected lower production rates in Indonesia resulting from the first-quarter 2012 work interruptions and related temporary suspension of operations, and lower copper volumes in South America.chemical sectors. Refer to “Operations” for further discussion of sales volumes at our operating divisions.
Price Realizations
Our consolidated revenues can vary significantly as a result of fluctuations in the market prices of copper, gold, molybdenum, silver and cobalt. Following is a summary of our average realized prices for the first quarters of2013 and 2012:
|
| | | | | | | |
| | Three Months Ended |
| | March 31, |
| | 2013 | | 2012 |
| Copper (per pound) | $ | 3.51 |
| | $ | 3.82 |
|
| Gold (per ounce) | $ | 1,606 |
| | $ | 1,694 |
|
| Molybdenum (per pound) | $ | 12.75 |
| | $ | 15.34 |
|
| Silver (per ounce) | $ | 30.01 |
| | $ | 29.45 |
|
| Cobalt (per pound) | $ | 7.28 |
| | $ | 8.46 |
|
Provisionally Priced Copper Sales
During the first ninefirst-quarter months of 20122013, 4546 percent of our mined copper was sold in concentrate, 28 percent as cathode and 2726 percent as rod from our North America operations. Substantially all of our copper concentrate and cathode sales contracts provide final copper pricing in a specified future month (generally one to four months from the shipment date) based primarily on quoted LME monthly average spot copper prices. We receive market prices based on prices in the specified future period, which results in price fluctuations recorded through revenues until the date of settlement. We record revenues and invoice customers at the time of shipment based on then-current LME prices, which results in an embedded derivative on our provisionally priced concentrate and cathode sales that is adjusted to fair value through earnings each period, using the period-end forward prices, until final pricing on the date of final pricing.settlement. To the extent final prices are higher or lower than what was recorded on a provisional basis, an increase or decrease to revenues is recorded each reporting period until the date of final pricing. Accordingly, in times of
rising copper prices, our revenues benefit from adjustments to the final pricing of provisionally priced sales pursuant to contracts entered into in prior periods; in times of falling copper prices, the opposite occurs.
Following are the (unfavorable) favorable impacts of net adjustments to the prior years' provisionally priced copper sales for the first quarters of2013 and 2012 (in millions, except per share amounts): |
| | | | | | | |
| | Three Months Ended |
| | March 31, |
| | 2013 | | 2012 |
| Revenues | $ | (11 | ) | | $ | 109 |
|
| Net income attributable to FCX common stockholders | $ | (5 | ) | | $ | 47 |
|
| Net income per share attributable to FCX common stockholders | $ | (0.01 | ) | | $ | 0.05 |
|
At June 30, 2012March 31, 2013, we had provisionally priced copper sales at our copper mining operations, primarily South America and Indonesia, totaling 329340 million pounds of copper (net of intercompany sales and noncontrolling interests) recorded at an average of $3.49 per pound. Higher prices during third-quarter2012 resulted in adjustments to these provisionally priced copper sales that favorably impacted consolidated revenues by $24 million ($12 million to net income attributable to common stockholders or $0.01 per share) in third-quarter2012, compared with adjustments to the June 30, 2011, provisionally priced copper sales that unfavorably impacted third-quarter2011 revenues by $213 million ($100 million to net income attributable to common stockholders or $0.11 per share). Adjustments to the December 31, 2011, provisionally priced copper sales favorably impacted consolidated revenues by $101 million ($43 million to net income attributable to common stockholders or $0.05 per share) for the first nine months of2012, compared with adjustments to the December 31, 2010, provisionally priced copper sales that unfavorably impacted consolidated revenues by $12 million ($5 million to net income attributable to common stockholders or $0.01 per share) for the first nine months of2011.
At September 30, 2012, we had provisionally priced copper sales at our copper mining operations, primarily South America and Indonesia, totaling 325 million pounds of copper (net of intercompany sales and noncontrolling interests) recorded at an average of $3.723.41 per pound, subject to final pricing over the next several months. We estimate that each $0.05 change in the price realized from the September 30, 2012March 31, 2013, provisional price recorded would have a net impact on our 20122013 consolidated revenues of approximately $23 million ($1112 million to net income attributable to common stockholders). The LME spot copper price closed at $3.553.21 per pound on October 31, 2012April 30, 2013.
Purchased Copper
From time to time, we purchase copper cathode to be processed by our Rod & Refining operations when production from our North America copper mines does not meet customer demand.
Atlantic Copper Revenues
The decrease in Atlantic Copper's revenues in the 2012 periods, compared with the 2011 periods, primarily reflected lower production in third-quarter2012 and lower copper realizations for the first nine months of2012. Refer to "Operations - Atlantic Copper Smelting & Refining" for further discussion.
Production and Delivery Costs
Consolidated production and delivery costs totaledincreased to $2.62.7 billion in both the third quarterfirst-quarters of 2012 and 20112013, compared with $7.62.4 billion for thein first nine months offirst-quarter 2012, primarily reflecting higher production in Indonesia and $7.5 billion for the first nine months of2011.Africa and higher costs in North and South America.
Consolidated unit site production and delivery costs before(before net noncash and other costs,costs) for our copper mining operations averaged $2.031.94 per pound of copper in third-quarterfirst-quarter 2012 and $2.00 per pound of copper for the first nine months of20122013, compared with $1.711.96 per pound of copper in third-quarterfirst-quarter 20112012 and $1.65 per pound of copper for the first nine months of2011. Higher unit site production and delivery costs in the 2012 periods, primarily reflected lowerreflecting higher copper sales volumes in Indonesia and Africa, partly offset by higher mining costs.costs in North and South America. Assuming average prices of $1,700 per ounce of gold and $11 per pound of molybdenum for fourth-quarter2012, and achievement of current 2012volume and cost estimates, consolidated unit site production and delivery costs are expected to average $2.03$1.89 per pound of copper for the year 20122013 ($2.11 for fourth-quarter 2012). Consolidated unit net cash costs for 2013 are expected to be lower than 2012 because of projected increased copper and gold volumes at Grasberg. Refer to “Operations – Unit Net Cash Costs” for further discussion of unit net cash costs associated with our operating divisions, and to “Product Revenues and Production Costs” for reconciliations of per pound costs by operating division to production and delivery costs applicable to sales reported in our consolidated financial statements.
Our copper mining operations require significant energy, principally diesel, electricity, coal and natural gas. For the year 2012, energyEnergy costs are expected to approximateapproximated 21 percent of our consolidated copper production costs which reflects projectedin 2012 and are expected to approximate 21 percent for the year 2013, including purchases of approximately 255270 million gallons of diesel fuel; 6,9007,500 gigawatt hours of electricity at our North America, South America and Africa copper mining operations (we generate all of our power at our Indonesia mining operation); 700760 thousand metric tons of coal for our coal power plant in Indonesia; and 1 million MMBTU (million britishBritish thermal units) of natural gas at certain of our North America mines. Energy costs for 2011 approximated 21 percent of our consolidated copper production costs.
Depreciation, Depletion and Amortization
Consolidated depreciation, depletion and amortization expense totaled $298329 million in third-quarterfirst-quarter 20122013, and $856 million for the first nine months of2012, $257267 million in third-quarterfirst-quarter 2011 and $756 million for the first nine months of20112012. Depreciation will vary under the unit of production (UOP) method as a result of increases and decreaseschanges in sales volumes and the related UOP rates at our mining operations. Higher depreciation, depletion and amortization expense for the 2012 periods, compared with the 2011 periods, primarily reflected higher production andindividual mines, which have increased because of asset additions in North America, partly offset by lower production in Indonesia.additions.
Selling, General and Administrative Expenses
Consolidated selling, general and administrative expenses totaledincreased to $110113 million in third-quarterfirst-quarter2013, compared with $104 million in first-quarter 2012, $102 millionprimarily reflecting costs recorded in third-quarterfirst-quarter 20112013, associated with the pending acquisitions of PXP and MMR and for the March 2013 acquisition of the cobalt chemical refinery business. Refer to Note $311 million2 for the first nine monthsfurther discussion of2012 and $323 million for the first nine months of2011. these acquisitions.
Exploration and Research Expenses
Consolidated exploration and research expenses totaled $7952 million in third-quarterfirst-quarter 20122013 and $214 million for the first nine months of2012, compared with $7862 million in third-quarterfirst-quarter 2011 and $194 million for the first nine months of20112012. We are actively conducting exploration activities near our existing mines with a focus on opportunities to expand reserves that will support additional future production capacity in the large mineral districts where we currently operate. ExplorationFavorable exploration results indicate opportunities for what we believe could be significant future potential reserve additions in North and South America and in the Tenke minerals district. The drilling data in North America continues to indicate the potential for expanded sulfide production.
For the year 20122013, exploration and research expenditures are expected to total approximatelyapproximate $290280 million, including approximately $255235 million for exploration. Exploration activities will continue to focus primarily on the potential for future reserve additions in our existing mineral districts. Approximately one-third of the 2013 budget is associated with global greenfield exploration projects.
Environmental Obligations and Shutdown Costs
Environmental obligation costs (credits) reflect net revisions to our long-term environmental obligations, which will vary from period to period because of changes to environmental laws and regulations, the settlement of environmental matters and/or circumstances affecting our operations that could result in significant changes in our estimates. Shutdown costs include care and maintenance costs and any litigation, remediation or related expenditures associated with closed facilities or operations.
EnvironmentalNet charges for environmental obligations and shutdown costs totaled a net credit of $7315 million in third-quarterfirst-quarter 20122013, and net charges ofcompared with $18 million for the first nine months of2012, $3810 million in third-quarterfirst-quarter 2011 and $98 million for the first nine months of20112012. Refer to Note 89 and "Contingencies" for further discussion of environmental obligations and litigation matters associated with closed facilities or operations.
Interest Expense, Net
Consolidated interest expense (excluding capitalized interest) totaleddecreased to $5675 million in third-quarterfirst-quarter 2012 and $210 million for the first nine months of20122013, compared with $10599 million in third-quarterfirst-quarter 20112012, primarily reflecting lower interest related to the February 2012 refinancing transaction, partly offset by $17 million of additional interest expense related to the March 2013 sale of $6.5 billion andof senior notes. Refer to Note $325 million6 for the first nine months of2011. Lower interest expense for the 2012 periods primarily reflected the impact of the first-quarter 2012 refinancing transaction.further discussion.
Capitalized interest is primarily related to the level of expenditures for our development projects and average interest rates on our borrowings, and totaled $1418 million in third-quarterfirst-quarter 20122013 and $62 million for the first nine months of2012, compared with $2736 million in third-quarterfirst-quarter 2011 and $75 million for the first nine months of20112012. Refer to “Operations” for further discussion of current development projects.
Losses on Early Extinguishment of Debt
We recorded lossesLosses on early extinguishment of debt totalingwere $45 million in first-quarter2013 related to the termination of the bridge loan facilities for the pending PXP and MMR acquisitions, and $168 million for thein first nine months offirst-quarter 2012 associated withrelated to the redemption of our remaining outstanding 8.375% Senior Notes. senior notes. Refer to Note 6 for further discussion.
We recorded losses on early extinguishment of debt totaling $68 million for the first nine months of2011 associated with the redemption of our 8.25% Senior Notes, the revolving credit facilities that were replaced in March 2011 by a new senior unsecured revolving credit facility and open-market purchases of our 9.5% Senior Notes.
Refer to Note 5 for further discussion of these transactions.
Provision for Income Taxes
Following is a summary of the approximate amounts in the calculation of our consolidated provision for income taxes for the 2012first quarters of2013 and 20112012 periods (in millions, except percentages):
| | | | Nine Months Ended | | Nine Months Ended | | Three Months Ended | | Three Months Ended | |
| | September 30, 2012 | | September 30, 2011 | | March 31, 2013 | | March 31, 2012 | |
| | Incomea | | Effective Tax Rate | | Income Tax (Provision) Benefit | | Incomea | | Effective Tax Rate | | Income Tax (Provision) Benefit | | Incomea | | Effective Tax Rate | | Income Tax Provision | | Incomea | | Effective Tax Rate | | Income Tax (Provision) Benefit | |
| U.S. | $ | 1,231 |
| | 24% | | $ | (291 | ) | | $ | 1,772 |
| | 24% | | $ | (421 | ) | | $ | 325 |
| | 22% | | $ | (71 | ) | | $ | 339 |
| | 24% | | $ | (83 | ) | |
| South America | 1,675 |
| | 36% | | (609 | ) | b | 2,326 |
| | 36% | | (829 | ) | c | 443 |
| | 34% | | (151 | ) | | 691 |
| | 35% | | (240 | ) | |
| Indonesia | 940 |
| | 41% | | (387 | ) | | 2,870 |
| | 43% | | (1,234 | ) | | 279 |
| | 43% | | (120 | ) | | 351 |
| | 43% | | (150 | ) | |
| Africa | 263 |
| | 30% | | (79 | ) | | 293 |
| | 34% | | (100 | ) | | 143 |
| | 31% | | (44 | ) | | 89 |
| | 33% | | (29 | ) | |
| Eliminations and other | 54 |
| | N/A | | 10 |
| | 304 |
| | N/A | | (127 | ) | | 60 |
| | N/A | | (10 | ) | | 20 |
| | N/A | | 9 |
| |
Annualized rate adjustmentd | N/A |
| | N/A | | (6 | ) | | N/A |
| | N/A | | 13 |
| | |
| | 4,163 |
| | 33% | f | (1,362 | ) | | 7,565 |
| | 36% | | (2,698 | ) | | |
Deferred tax liability adjustmente | — |
| | N/A | | 234 |
| | — |
| | N/A | | — |
| | |
Annualized rate adjustmentb | | — |
| | N/A | | (32 | ) | | — |
| | N/A | | 2 |
| |
| Consolidated FCX | $ | 4,163 |
| | 27% | | $ | (1,128 | ) | | $ | 7,565 |
| | 36% | | $ | (2,698 | ) | | $ | 1,250 |
| | 34% | c | $ | (428 | ) | | $ | 1,490 |
| | 33% | | $ | (491 | ) | |
| |
| a. | Represents income by geographic location before income taxes and equity in affiliated companies’ net earnings. |
| |
| b. | In July 2012, Sociedad Minera Cerro Verde S.A.A. (Cerro Verde) signed a new 15-year mining stability agreement with the Peruvian government, which is expected to become effective after the current mining stability agreement expires on December 31, 2013. In connection with the new mining stability agreement, Cerro Verde's income tax rate will increase from 30 percent to 32 percent. As a result of the change in the income tax rate, we recognized additional deferred tax expense of $26 million ($23 million net of noncontrolling interest) in third-quarter 2012, which relates primarily to the assets recorded in connection with the 2007 acquisition of Freeport-McMoRan Corporation (FMC).
|
| |
c. | In September 2011, Peru enacted a new mining tax and royalty regime and also created a special mining burden that companies with stability agreements could elect to pay. Cerro Verde elected to pay this special mining burden during the remaining term of its stability agreement. As a result, Cerro Verde recognized additional current and deferred tax expense of $57 million ($50 million net of noncontrolling interest) in third-quarter 2011. The deferred portion of this accrual relates primarily to the assets recorded in connection with the 2007 acquisition of FMC.
|
| |
d. | In accordance with applicable accounting rules, we adjust our interim provision for income taxes equal to our estimated annualized tax rate. |
| |
e. | With the exception of Tenke Fungurume S.A.R.L. (TFM), we have not elected to permanently reinvest earnings from our foreign subsidiaries, and we have recorded deferred tax liabilities for foreign earnings that are available to be repatriated to the U.S. Cerro Verde previously recorded deferred Peruvian income tax liabilities for income taxes that would become payable if the reinvested profits used to fund the initial Cerro Verde sulfide expansion are distributed prior to the expiration of Cerro Verde's current stability agreement on December 31, 2013. Reinvested profits are not expected to be distributed prior to December 31, 2013. Accordingly, a net deferred tax liability totaling $234 million ($123 net of noncontrolling interest) was reversed and recognized as an income tax benefit in third-quarter 2012.
|
| |
f.c. | Our consolidated effective income tax rate is a function of the combined effective tax rates for the jurisdictions in which we operate. Accordingly, variations in the relative proportions of jurisdictional income can result in fluctuations to our consolidated effective income tax rate. Assuming average prices of $3.703.25 per pound for copper, $1,7001,400 per ounce for gold and $11 per pound for molybdenum for for fourth-quarterthe remainder of 20122013 and achievement of current sales volume and cost estimates, we estimate our consolidated effective tax rate excludingfor the impactyear 2013 (excluding impacts from the pending acquisitions of the deferred tax liability adjustment in note e,PXP and MMR) will approximate 3334 percent for the fourth quarter and the year 2012.to 35 percent. |
OPERATIONS
North America Copper Mines
We currently operate seven copper mines in North America – Morenci, Bagdad, Safford, Sierrita and Miami in Arizona, and TyroneChino and ChinoTyrone in New Mexico. All of these mining operations are wholly owned, except for Morenci, an unincorporated joint venture in which we own an 85 percent undivided interest.
The North America copper mines include open-pit mining, sulfide ore concentrating, leaching and solution extraction/electrowinning (SX/EW) operations. Molybdenum concentrate is also produced by certain of our North America copper mines (Sierrita, Bagdad, Morenci and Chino). A majority of the copper produced at our North America copper mines is cast into copper rod by our Rod & Refining operations.segment. The remainder of our North America copper sales is in the form of copper cathode or copper concentrate.concentrate, a portion of which is shipped to Atlantic Copper. Molybdenum concentrate is also produced by certain of our North America copper mines (Sierrita, Bagdad, Morenci and Chino), which is sold to our molybdenum sales company at market-based pricing.
Operating and Development Activities. We have completed projects to increaseincreased production atfrom our North America copper mines including restarting certain miningin recent years and milling operations and increasing mining rates at Morenci and Chino. Ramp up activities at Chino are continuing, with annual production of approximately 250 million pounds of copper targeted in 2014. We continue to evaluate a number of opportunities to invest in additional production capacity at several of our North America copper mines. Explorationmines in response to positive exploration results in recent years indicate the potential for significant additional sulfide development in North America.years.
Morenci Mill Expansion. We are engaged in a project to expandexpanding mining and milling capacity at Morenci to process additional sulfide ores identified through exploratory drilling. The approximate $1.4 billion project is targeting incremental annual production of approximately 225 million pounds of copper in 2014 (an approximate 40 percent increase from 2012) through an increase in milling rates from the current level of 50,000 metric tons of ore per day to approximately 115,000 metric tons of ore per day, and mining rates from the current level of 700,000 short tons per day to 900,000 short tons per day. We have received material permitsThe targeted increase in mining rates has been achieved, engineering activities are nearing completion and have commenced engineeringconstruction activities for the new mill and initial construction, and procurement activitiesrelated facilities are in progress. ProjectWe have incurred project costs of $211$441 million have been incurred as of September 30, 2012March 31, 2013 ($184($147 million during the first nine months offirst-quarter 20122013). Considering the large size of this project, actual costs could differ materially from these estimates.
Other Matters. As described further in “Critical Accounting Estimates” contained in Part II, Items 7. and 7A of our annual report on Form 10-K for the year ended December 31, 2011, we record, as inventory, applicable costs for copper contained in mill and leach stockpiles that are expected to be processed in the future based on proven processing techniques. Processes and recovery rates are monitored regularly, and recovery rate estimates are adjusted periodically as additional information becomes available and as related technology changes. During third-quarter2012, we completed an assessment of recovery rates at our Chino leaching operations resulting in a downward revision of those rates and a corresponding reduction of 594 million pounds of estimated recoverable copper in leach stockpiles at Chino.
Operating Data. Following is summary operating data for the North America copper mines for the thirdfirst quarters and first ofnine months of 20122013 and 20112012:
| | | | Three Months Ended | | Nine Months Ended | Three Months Ended |
| | September 30, | | September 30, | March 31, |
| | 2012 | | 2011 | | 2012 | | 2011 | 2013 | | 2012 |
| Operating Data, Net of Joint Venture Interest | | | | | | | | | | |
Copper (millions of recoverable pounds) | | | | | | | | | | |
| Production | 337 |
| | 322 |
| | 1,005 |
| | 917 |
| 343 |
| | 337 |
|
| Sales, excluding purchases | 331 |
| | 307 |
| | 1,030 |
| | 914 |
| 353 |
| | 338 |
|
| Average realized price per pound | $ | 3.58 |
| | $ | 4.05 |
| | $ | 3.66 |
| | $ | 4.19 |
| $ | 3.60 |
| | $ | 3.82 |
|
| | | | | | | | | | | |
Molybdenum (millions of recoverable pounds) | | | | | | | | | | |
Productiona | 8 |
| | 10 |
| | 27 |
| | 27 |
| 8 |
| | 10 |
|
| | | | | | | | | | | |
| 100% Operating Data | | | | | | | | | | |
| SX/EW operations | | | | | | | | | | |
| Leach ore placed in stockpiles (metric tons per day) | 922,100 |
| | 872,200 |
| | 967,700 |
| | 841,700 |
| 1,000,100 |
| | 1,032,900 |
|
| Average copper ore grade (percent) | 0.22 |
| | 0.25 |
| | 0.22 |
| | 0.25 |
| 0.22 |
| | 0.23 |
|
| Copper production (millions of recoverable pounds) | 211 |
| | 199 |
| | 639 |
| | 582 |
| 209 |
| | 218 |
|
| | | | | | | | | | | |
| Mill operations | | | | | | | | | | |
| Ore milled (metric tons per day) | 242,700 |
| | 225,800 |
| | 235,700 |
| | 220,100 |
| 250,600 |
| | 236,000 |
|
| Average ore grade (percent): | | | | | | | | | | |
| Copper | 0.37 |
| | 0.38 |
| | 0.37 |
| | 0.37 |
| 0.39 |
| | 0.37 |
|
| Molybdenum | 0.03 |
| | 0.03 |
| | 0.03 |
| | 0.03 |
| 0.03 |
| | 0.03 |
|
| Copper recovery rate (percent) | 85.4 |
| | 84.5 |
| | 83.5 |
| | 83.5 |
| 84.3 |
| | 80.0 |
|
| Copper production (millions of recoverable pounds) | 150 |
| | 146 |
| | 436 |
| | 404 |
| 158 |
| | 142 |
|
| |
| a. | ReflectsRefer to "Consolidated Results" for our consolidated molybdenum production from certainsales volumes, which includes sales of molybdenum produced at the North America copper mines. Sales of molybdenum are reflected in the Molybdenum division. |
Copper sales volumes from our North America copper mines increased toof 331353 million pounds in third-quarterfirst-quarter2013 were higher than first-quarter 2012 andsales of 1.0 billion pounds for the first nine months of2012, compared with 307338 million pounds in third-quarter2011 and 914 million pounds for the first nine months of2011, primarily reflecting increased production at the Chino mine. The first nine months of2012 also reflect increases in production at the Safford and Miami mines and timing of shipments at Morenci.
For the year 20122013, copper sales volumes from our North America copper mines are expected to approximate 1.31.45 billion pounds, compared with 1.21.35 billion pounds in 2011. Molybdenum production from our North America copper mines is expected to approximate 35 million pounds for the year 2012, compared with 35 million pounds in 2011.primarily reflecting higher production at Morenci and Chino. Refer to "Outlook" for projected molybdenum sales volumes.
Unit Net Cash Costs. Unit net cash costs per pound of copper is a measure intended to provide investors with information about the cash-generating capacity of our mining operations expressed on a basis relating to the primary metal product for our respective operations. We use this measure for the same purpose and for monitoring operating performance by our mining operations. This information differs from measures of performance determined in accordance with generally accepted accounting principles (GAAP) in the U.S. (U.S. GAAP) and should not be considered in isolation or as a substitute for measures of performance determined in accordance with U.S. GAAP. This measure is presented by other metals mining companies, although our measure may not be comparable to similarly titled measures reported by other companies.
Gross Profit per Pound of Copper and Molybdenum
The following tables summarize unit net cash costs and gross profit per pound at our North America copper mines for the thirdfirst quarters and first nine months of 20122013 and 20112012. Refer to “Product Revenues and Production Costs” for an explanation of the “by-product” and “co-product” methods and a reconciliation of unit net cash costs per pound to production and delivery costs applicable to sales reported in our consolidated financial statements.
| | | | Three Months Ended | | Three Months Ended | Three Months Ended | | Three Months Ended |
| | September 30, 2012 | | September 30, 2011 | March 31, 2013 | | March 31, 2012 |
| | By- Product Method | | Co-Product Method | | By- Product Method | | Co-Product Method | By- Product Method | | Co-Product Method | | By- Product Method | | Co-Product Method |
| | | Copper | | Molyb- denuma | | Copper | | Molyb- denuma | | Copper | | Molyb- denum | | Copper | | Molyb- denum |
| Revenues, excluding adjustments | $ | 3.58 |
| | $ | 3.58 |
| | $ | 12.58 |
| | $ | 4.05 |
| | $ | 4.05 |
| | $ | 15.22 |
| $ | 3.60 |
| | $ | 3.60 |
| | $ | 11.75 |
| | $ | 3.82 |
| | $ | 3.82 |
| | $ | 14.16 |
|
| | | | | | | | | | | | | | | | | | | | | | | |
| Site production and delivery, before net noncash and other costs shown below | 1.97 |
| | 1.77 |
| | 8.60 |
| | 1.86 |
| | 1.65 |
| | 6.68 |
| 1.99 |
| | 1.94 |
| | 3.27 |
| | 1.80 |
| | 1.74 |
| | 3.04 |
|
By-product creditsa | (0.32 | ) | | — |
| | — |
| | (0.55 | ) | | — |
| | — |
| |
| By-product credits | | (0.26 | ) | | — |
| | — |
| | (0.41 | ) | | — |
| | — |
|
| Treatment charges | 0.12 |
| | 0.12 |
| | — |
| | 0.11 |
| | 0.11 |
| | — |
| 0.13 |
| | 0.13 |
| | — |
| | 0.12 |
| | 0.11 |
| | — |
|
| Unit net cash costs | 1.77 |
| | 1.89 |
| | 8.60 |
| | 1.42 |
| | 1.76 |
| | 6.68 |
| 1.86 |
| | 2.07 |
| | 3.27 |
| | 1.51 |
| | 1.85 |
| | 3.04 |
|
| Depreciation, depletion and amortization | 0.25 |
| | 0.23 |
| | 0.63 |
| | 0.21 |
| | 0.19 |
| | 0.34 |
| 0.28 |
| | 0.27 |
| | 0.20 |
| | 0.27 |
| | 0.26 |
| | 0.18 |
|
| Noncash and other costs, net | 0.12 |
| | 0.11 |
| | 0.15 |
| | 0.10 |
| | 0.10 |
| | 0.06 |
| 0.09 |
| | 0.09 |
| | 0.03 |
| | 0.06 |
| | 0.06 |
| | 0.01 |
|
| Total unit costs | 2.14 |
| | 2.23 |
| | 9.38 |
| | 1.73 |
| | 2.05 |
| | 7.08 |
| 2.23 |
| | 2.43 |
| | 3.50 |
| | 1.84 |
| | 2.17 |
| | 3.23 |
|
| Revenue adjustments, primarily for pricing on prior period open sales | 0.01 |
| | 0.01 |
| | — |
| | (0.04 | ) | | (0.04 | ) | | — |
| — |
| | — |
| | — |
| | 0.03 |
| | 0.03 |
| | — |
|
| Gross profit per pound | $ | 1.45 |
| | $ | 1.36 |
| | $ | 3.20 |
| | $ | 2.28 |
| | $ | 1.96 |
| | $ | 8.14 |
| $ | 1.37 |
| | $ | 1.17 |
| | $ | 8.25 |
| | $ | 2.01 |
| | $ | 1.68 |
| | $ | 10.93 |
|
| | | | | | | | | | | | | | | | | | | | | | | |
| Copper sales (millions of recoverable pounds) | 330 |
| | 330 |
| | | | 307 |
| | 307 |
| | | 352 |
| | 352 |
| | | | 337 |
| | 337 |
| | |
Molybdenum sales (millions of recoverable pounds)b | | | | | 8 |
| | | | | | 10 |
| |
Molybdenum sales (millions of recoverable pounds)a | | | | | | 8 |
| | | | | | 10 |
|
|
| | | | | | | | | | | | | | | | | | | | | | | |
| | Nine Months Ended | | Nine Months Ended |
| | September 30, 2012 | | September 30, 2011 |
| | By- Product Method | | Co-Product Method | | By- Product Method | | Co-Product Method |
| | | Copper | | Molyb- denuma | | | Copper | | Molyb- denuma |
| Revenues, excluding adjustments | $ | 3.66 |
| | $ | 3.66 |
| | $ | 13.58 |
| | $ | 4.19 |
| | $ | 4.19 |
| | $ | 16.30 |
|
| | | | | | | | | | | | |
| Site production and delivery, before net noncash and other costs shown below | 1.88 |
| | 1.74 |
| | 6.18 |
| | 1.80 |
| | 1.61 |
| | 6.77 |
|
By-product creditsa | (0.37 | ) | | — |
| | — |
| | (0.52 | ) | | — |
| | — |
|
| Treatment charges | 0.12 |
| | 0.11 |
| | — |
| | 0.10 |
| | 0.10 |
| | — |
|
| Unit net cash costs | 1.63 |
| | 1.85 |
| | 6.18 |
| | 1.38 |
| | 1.71 |
| | 6.77 |
|
| Depreciation, depletion and amortization | 0.26 |
| | 0.24 |
| | 0.45 |
| | 0.20 |
| | 0.19 |
| | 0.38 |
|
| Noncash and other costs, net | 0.10 |
| | 0.09 |
| | 0.07 |
| | 0.13 |
| | 0.12 |
| | 0.07 |
|
| Total unit costs | 1.99 |
| | 2.18 |
| | 6.70 |
| | 1.71 |
| | 2.02 |
| | 7.22 |
|
| Revenue adjustments, primarily for pricing on prior period open sales | 0.01 |
| | — |
| | — |
| | — |
| | — |
| | — |
|
| Gross profit per pound | $ | 1.68 |
| | $ | 1.48 |
| | $ | 6.88 |
| | $ | 2.48 |
| | $ | 2.17 |
| | $ | 9.08 |
|
| | | | | | | | | | | | |
| Copper sales (millions of recoverable pounds) | 1,027 |
| | 1,027 |
| | | | 912 |
| | 912 |
| | |
Molybdenum sales (millions of recoverable pounds)b | | | | | 27 | | | | | | 27 |
|
| |
| a. | Molybdenum credits and revenues reflect volumes produced at market-based pricing and also include tolling revenues at Sierrita. |
| |
b. | Reflects sales of molybdenum produced by certain of ourthe North America copper mines.mines to our molybdenum sales company at market-based pricing. |
Our operating North America copper mines have varying cost structures because of differences in ore grades and characteristics, processing costs, by-productsby-product credits and other factors. UnitHigher average unit net cash costs (net of by-product credits) for our North America copper mines averagedof $1.771.86 per pound of copper in third-quarterfirst-quarter 2012 and $1.63 per pound of copper for the first nine months of20122013, compared with $1.421.51 per pound of copper in the third quarter and $1.38 in the first nine months offirst-quarter 20112012. Higher average unit net cash costs in the 2012 periods, primarily reflected higher mining rates and lower molybdenum credits and increased mining rates, partly offset by higher copper sales volumes.credits.
Because certain assets are depreciated on a straight-line basis, North America's average unit depreciation rate variesmay vary with asset additions and the level of copper production and sales.
Assuming achievement of current sales volume and cost estimates and an average price of $11 per pound of molybdenum for for fourth-quarterthe remainder of 20122013, we estimate that average unit site production and delivery costs for our North America copper mines would approximate $1.90 per pound of copper and average unit net cash costs (net of by-product credits) for our North America copper mines would approximate $1.671.89 per pound of copper for the year 20122013, compared with $1.411.67 per pound of copper in 20112012 (fourth-quarter 2012 site production and delivery costs are expected to average $1.96 per pound of copper and unit net cash costs (net of by-product credits) are expected to average $1.77 per pound of copper). North America's projected average unit net cash costs for 2012would change by approximately $0.010.025 per pound for each $2 per pound change in the average price of molybdenum during fourth-quarterthe remainder of 20122013.
South America Mining
We operate four copper mines in South America – Cerro Verde in Peru, and El Abra, Candelaria and Ojos del Salado in Chile. We own a 53.56 percent interest in Cerro Verde, a 51 percent interest in El Abra, and an 80 percent interest in both Candelaria and Ojos del Salado.
South America mining includes open-pit and underground mining, sulfide ore concentrating, leaching and SX/EW operations. Production from our South America mines is sold as copper concentrate or copper cathode under long-term contracts. Our South America mines ship a portion of their copper concentrate and cathode inventories to Atlantic Copper an affiliated smelter.(our wholly owned copper smelter). In addition to copper, the Cerro Verde mine produces molybdenum concentrates, and the Candelaria and Ojos del Salado mines produce gold and silver.silver, and the Cerro Verde mine produces molybdenum concentrates that are sold to our molybdenum sales company at market-based pricing.
Operating and Development Activities. Considering the long-term nature and large size of our South America development projects, actual costs could differ materially from the below estimates.
Cerro Verde Expansion. At Cerro Verde, we are engaged inWe have commenced initial construction activities associated with a large-scale concentrator expansion.expansion at Cerro Verde. The approximateproject, with an estimated cost of $4.4 billion, project wouldwill expand the concentrator facilities from 120,000 metric tons of ore per day to 360,000 metric tons of ore per day and provide incremental annual production of approximately 600 million pounds of copper and 15 million pounds of molybdenum beginning in 2016. An environmental impact assessment was filed in fourth-quarter 2011. Permitting is in an advanced stageConsidering the long-term nature and engineering and procurementlarge size of long-lead items is in progress. We expect to commence construction in 2013.the project, actual costs could vary from these estimates. Project costs of $641 million have been incurred as of March 31, 2013 ($149 million during first-quarter2013).
An agreement has been reached with the Regional Government of Arequipa, the National Government, Servicio de Agua Potable y Alcantarillado de Arequipa S.A. (SEDAPAR) and other local institutions to allow Cerro Verde to finance the engineering and construction of a wastewater treatment plant for Arequipa, should Cerro Verde proceed with the expansion.Arequipa. Once Cerro Verde obtains a license for the treated water it would be used to supplement its existing water supplies to support the concentrator expansion.
El Abra Sulfide. During 2011, we commenced production from El Abra’s sulfide ores. Production from the sulfide ore is expectedWe continue to approximate 300 million pounds of copper per year, replacing the currently depleting oxide copper production. The aggregate capital investment for this project is expectedengage in studies to approximate $800 million through 2015, which included approximately $580 million for the initial phase of the project.
We are also engaged in pre-feasibility studies forevaluate a potential large-scale milling operation at El Abra to process additional sulfide material and to achieve higher recoveries. Exploration results at El Abra indicate the potential forhave identified a significant sulfide resource.
Candelaria Water. As part of our overall strategy to supply water to the Candelaria mine, we completed construction of a pipeline to bring water from a nearby water treatment facility. In addition, we are constructing a desalination plant and pipeline that will supply Candelaria’s longer term water needs. The plant is expected to be completed in early 2013 at a cost of approximately $310 million. Project costs of $278 million have been incurred as of September 30, 2012 ($152 million during the first nine months of2012).
Other Matters. In July 2012, Cerro Verde signed a new 15-year mining stability agreement with the Peruvian government, which is expected to become effective after the current mining stability agreement expires on December 31, 2013. See Note 10 and "Consolidated Results - Provision for Income Taxes" for further discussion.
Operating Data. Following is summary operating data for our South America mining operations for the thirdfirst quarters and first ofnine months of 20122013 and 20112012:
| | | | Three Months Ended | | Nine Months Ended | Three Months Ended |
| | September 30, | | September 30, | March 31, |
| | 2012 | | 2011 | | 2012 | | 2011 | 2013 | | 2012 |
Copper (millions of recoverable pounds) | | | | | | | | | | |
| Production | 311 |
| | 325 |
| | 908 |
| | 969 |
| 298 |
| | 293 |
|
| Sales | 308 |
| | 322 |
| | 895 |
| | 965 |
| 285 |
| | 286 |
|
| Average realized price per pound | $ | 3.68 |
| | $ | 3.45 |
| | $ | 3.63 |
| | $ | 3.82 |
| $ | 3.48 |
| | $ | 3.83 |
|
| | | | | | | | | | | |
Gold (thousands of recoverable ounces) | | | | | | | | | | |
| Production | 20 |
| | 25 |
| | 57 |
| | 73 |
| 21 |
| | 19 |
|
| Sales | 21 |
| | 23 |
| | 56 |
| | 72 |
| 21 |
| | 19 |
|
| Average realized price per ounce | $ | 1,736 |
| | $ | 1,664 |
| | $ | 1,678 |
| | $ | 1,556 |
| $ | 1,617 |
| | $ | 1,680 |
|
| | | | | | | | | | | |
Molybdenum (millions of recoverable pounds) | | | | | | | | | | |
Productiona | 2 |
| | 2 |
| | 6 |
| | 8 |
| 2 |
| | 2 |
|
| | | | | | | | | | | |
| SX/EW operations | | | | | | | | | | |
| Leach ore placed in stockpiles (metric tons per day) | 248,100 |
| | 244,100 |
| | 229,100 |
| | 249,500 |
| 262,800 |
| | 196,300 |
|
| Average copper ore grade (percent) | 0.55 |
| | 0.54 |
| | 0.55 |
| | 0.48 |
| 0.50 |
| | 0.55 |
|
| Copper production (millions of recoverable pounds) | 115 |
| | 111 |
| | 346 |
| | 314 |
| 109 |
| | 118 |
|
| | | | | | | | | | | |
| Mill operations | | | | | | | | | | |
| Ore milled (metric tons per day) | 191,400 |
| | 185,700 |
| | 190,000 |
| | 192,300 |
| 188,600 |
| | 186,000 |
|
| Average ore grade: | | | | | | | | | | |
| Copper (percent) | 0.59 |
| | 0.66 |
| | 0.58 |
| | 0.66 |
| 0.58 |
| | 0.55 |
|
| Gold (grams per metric ton) | 0.09 |
| | 0.12 |
| | 0.09 |
| | 0.12 |
| 0.11 |
| | 0.09 |
|
| Molybdenum (percent) | 0.02 |
| | 0.02 |
| | 0.02 |
| | 0.02 |
| 0.02 |
| | 0.02 |
|
| Copper recovery rate (percent) | 90.7 |
| | 89.1 |
| | 89.5 |
| | 90.0 |
| 90.8 |
| | 89.2 |
|
| Copper production (millions of recoverable pounds) | 196 |
| | 214 |
| | 562 |
| | 655 |
| 189 |
| | 175 |
|
| |
| a. | ReflectsRefer to "Consolidated Results" for our consolidated molybdenum production from Cerro Verde. Salessales volumes, which includes sales of molybdenum are reflected in the Molybdenum division.produced at Cerro Verde. |
CopperConsolidated copper sales volumes from our South America mining operations declined toof 308285 million pounds in third-quarterfirst-quarter2013 approximated first-quarter 2012, compared with sales of 322286 million pounds in third-quarter2011, primarily reflecting loweras higher grade ore grades at Candelaria and timing of shipments. Lower copper sales volumes of 895 million pounds for the first nine months of2012, compared with 965 million pounds for the first nine months of2011, primarily reflectedoffset lower grade ore grades at Candelaria and Cerro Verde, partly offset by increased production at El Abra.Verde.
For the year 20122013, consolidated sales volumes from our South America mining operationsmines are expected to approximate 1.21.34 billion pounds of copper and 95 thousand ounces of gold, compared with2011 sales of 1.31.25 billion pounds of copper and 101 thousand ounces of gold. Molybdenum production from Cerro Verde is expected to approximate 8 million pounds for the yearin 2012, compared with 10 million pounds in 2011.primarily reflect the mining of higher grade ore at Candelaria. Refer to "Outlook" for projected gold and molybdenum sales volumes.
Unit Net Cash Costs. Unit net cash costs per pound of copper is a measure intended to provide investors with information about the cash-generating capacity of our mining operations expressed on a basis relating to the primary metal product for our respective operations. We use this measure for the same purpose and for monitoring operating performance by our mining operations. This information differs from measures of performance determined in accordance with U.S. GAAP and should not be considered in isolation or as a substitute for measures of performance determined in accordance with U.S. GAAP. This measure is presented by other metals mining companies, although our measure may not be comparable to similarly titled measures reported by other companies.
Gross Profit per Pound of Copper
The following tables summarize unit net cash costs and gross profit per pound at the South America mining operations for the thirdfirst quarters and first nine months of 20122013 and 20112012. Unit net cash costs per pound of copper are reflected under the by-product and co-product methods as the South America mining operations also had small amounts of molybdenum, gold and silver sales. Refer to “Product Revenues and Production Costs” for an explanation of the “by-product” and “co-product” methods and a reconciliation of unit net cash costs per pound to production and delivery costs applicable to sales reported in our consolidated financial statements.
| | | | Three Months Ended | | Three Months Ended | Three Months Ended | | Three Months Ended |
| | September 30, 2012 | | September 30, 2011 | March 31, 2013 | | March 31, 2012 |
| | By-Product Method | | Co-Product Method | | By-Product Method | | Co-Product Method | By-Product Method | | Co-Product Method | | By-Product Method | | Co-Product Method |
| Revenues, excluding adjustments | $ | 3.68 |
| | $ | 3.68 |
| | $ | 3.45 |
| | $ | 3.45 |
| $ | 3.48 |
| | $ | 3.48 |
| | $ | 3.83 |
| | $ | 3.83 |
|
| | | | | | | | | | | | | | | |
| Site production and delivery, before net noncash and other costs shown below | 1.63 |
| | 1.51 |
| | 1.38 |
| | 1.25 |
| 1.62 |
| | 1.49 |
| | 1.53 |
| | 1.42 |
|
| By-product credits | (0.25 | ) | | — |
| | (0.36 | ) | | — |
| (0.29 | ) | | — |
| | (0.29 | ) | | — |
|
| Treatment charges | 0.17 |
| | 0.17 |
| | 0.13 |
| | 0.13 |
| 0.18 |
| | 0.18 |
| | 0.16 |
| | 0.16 |
|
| Unit net cash costs | 1.55 |
| | 1.68 |
| | 1.15 |
| | 1.38 |
| 1.51 |
| | 1.67 |
| | 1.40 |
| | 1.58 |
|
| Depreciation, depletion and amortization | 0.24 |
| | 0.23 |
| | 0.20 |
| | 0.19 |
| 0.25 |
| | 0.23 |
| | 0.22 |
| | 0.21 |
|
| Noncash and other costs, net | 0.07 |
| | 0.04 |
| | 0.09 |
| | 0.07 |
| 0.05 |
| | 0.03 |
| | 0.07 |
| | 0.04 |
|
| Total unit costs | 1.86 |
| | 1.95 |
| | 1.44 |
| | 1.64 |
| 1.81 |
| | 1.93 |
| | 1.69 |
| | 1.83 |
|
| Revenue adjustments, primarily for pricing on prior period open sales | 0.07 |
| | 0.07 |
| | (0.45 | ) | | (0.45 | ) | (0.05 | ) | | (0.05 | ) | | 0.38 |
| | 0.38 |
|
| Gross profit per pound | $ | 1.89 |
| | $ | 1.80 |
| | $ | 1.56 |
| | $ | 1.36 |
| $ | 1.62 |
| | $ | 1.50 |
| | $ | 2.52 |
| | $ | 2.38 |
|
| | | | | | | | | | | | | | | |
| Copper sales (millions of recoverable pounds) | 308 |
| | 308 |
| | 322 |
| | 322 |
| 285 |
| | 285 |
| | 286 |
| | 286 |
|
|
| | | | | | | | | | | | | | | |
| | Nine Months Ended | | Nine Months Ended |
| | September 30, 2012 | | September 30, 2011 |
| | By-Product Method | | Co-Product Method | | By-Product Method | | Co-Product Method |
| Revenues, excluding adjustments | $ | 3.63 |
| | $ | 3.63 |
| | $ | 3.82 |
| | $ | 3.82 |
|
| | | | | | | | |
| Site production and delivery, before net noncash and other costs shown below | 1.58 |
| | 1.46 |
| | 1.31 |
| | 1.20 |
|
| By-product credits | (0.26 | ) | | — |
| | (0.36 | ) | | — |
|
| Treatment charges | 0.16 |
| | 0.16 |
| | 0.17 |
| | 0.17 |
|
| Unit net cash costs | 1.48 |
| | 1.62 |
| | 1.12 |
| | 1.37 |
|
| Depreciation, depletion and amortization | 0.24 |
| | 0.22 |
| | 0.19 |
| | 0.18 |
|
| Noncash and other costs, net | 0.07 |
| | 0.05 |
| | 0.07 |
| | 0.06 |
|
| Total unit costs | 1.79 |
| | 1.89 |
| | 1.38 |
| | 1.61 |
|
| Revenue adjustments, primarily for pricing on prior period open sales | 0.12 |
| | 0.12 |
| | 0.01 |
| | (0.01 | ) |
| Gross profit per pound | $ | 1.96 |
| | $ | 1.86 |
| | $ | 2.45 |
| | $ | 2.20 |
|
| | | | | | | | |
| Copper sales (millions of recoverable pounds) | 895 |
| | 895 |
| | 965 |
| | 965 |
|
Our South America mines have varying cost structures because of differences in ore grades and characteristics, processing costs, by-productsby-product credits and other factors. UnitHigher average unit net cash costs (net of by-product credits) for our South America mining operations averagedof $1.551.51 per pound of copper in third-quarterfirst-quarter 2012 and $1.48 per pound for the first nine months of20122013, compared with $1.151.40 per pound in third-quarterfirst-quarter 2011 and $1.12 per pound for the first nine months of2011. Higher average unit net cash costs in the 2012 periods, primarily reflected higher miningcosts for maintenance and input costs, including energy, and lower by-product credits. Unit net cash cost were also impacted by the timing of profit sharing in third-quarter2012 and lower sales volumes for the first nine months of2012.repairs.
Because certain assets are depreciated on a straight-line basis, South America's unit depreciation rate variesmay vary with asset additions and the level of copper production and sales.
Revenue adjustments primarily result from changes in prices on provisionally priced copper sales recognized in prior periods. To the extent prices are higher or lower than what was recorded on a provisional basis, an increase or decrease to revenues is recorded each reporting period until the date of final pricing. Refer to “Consolidated Results - Revenues” for further discussion of adjustments to prior period provisionally priced copper sales.
Assuming achievement of current sales volume and cost estimates and average prices of $1,7001,400 per ounce of gold and $11 per pound of molybdenum for fourth-quarterthe remainder of 20122013, we estimate that average unit site production and delivery costs for our South America mining operations would approximate $1.61 per pound of copper and average unit net cash costs (net of by-product credits) for our South America mining operations would approximate $1.501.44 per pound of copper for the year 20122013, compared with $1.201.50 per pound in 20112012 (fourth-quarter 2012 site production and delivery costs are expected to average $1.70 per pound of copper and unit net cash costs (net of by-product credits) are expected to average $1.53 per pound of copper).
Indonesia Mining
Indonesia mining includes PT Freeport Indonesia’s Grasberg minerals district. We own 90.64 percent of PT Freeport Indonesia, including 9.36 percent owned through our wholly owned subsidiary, PT Indocopper Investama. As previously reported because of the potential benefits of having additional Indonesian ownership in PT Freeport Indonesia's operations, we have agreed to consider a potential sale of a 9.36 percent interest in PT Freeport Indonesia at fair market value (refer to Note 14 inof our annual report on Form 10-K for the year ended December 31, 20112012, for further discussion). We are also consideringwe have agreed to consider a potential offeringsale of our interest in PT Freeport Indocopper Investama at fair market value. PT Freeport Indonesia shares onis currently engaged in discussions with the Indonesia stock exchange.Indonesian government related to its Contract of Work (COW) and intends to conclude that process before proceeding with any further discussions about the potential sale of an interest in PT Indocopper Investama.
PT Freeport Indonesia produces copper concentrates, which contain significant quantities of gold and silver. Substantially all of PT Freeport Indonesia’s copper concentrates are sold under long-term contracts, of which approximately one-half is generally sold to affiliated smelters, Atlantic Copper (our wholly owned copper smelter) and PT Smelting (PT Freeport Indonesia’s 25-percent owned copper smelter and refinery in Indonesia) and the remainder to other third-party customers.
We have established certain unincorporated joint ventures with Rio Tinto plc (Rio Tinto), under which Rio Tinto has a 40 percent interest in certain assets and future production exceeding specified annual amounts of copper, gold and silver. Refer to Note 2 in our annual report on Form 10-K for the year ended December 31, 20112012, for discussion of our joint ventures with Rio Tinto.
For additional discussion of risks associated with our operations in Indonesia, including labor matters, refer to “Risk Factors” contained in Part I, Item 1A. of our annual report on Form 10-K for the year ended December 31, 2012.
Operating and Development Activities. We have several projects in progress in the Grasberg minerals district, primarily related to the development of the large-scale, high-grade underground ore bodies located beneath and nearby the Grasberg open pit.bodies. In aggregate, these underground ore bodies are expected to ramp up over several years to produce approximately 240,000 metric tons of ore per day following the currently anticipated transition from the Grasberg open pit in 2016.2017. Over the next five years, estimated aggregate capital spending on these projects is currently expected to average $700$735 million per year ($550585 million per year net to PT Freeport Indonesia). Considering the long-term nature and large size of these projects, actual costs could differ materiallyvary from these estimates.
The following provides additional information on these projects, including the continued development of the Common Infrastructure project, the Grasberg Block Cave and Big Gossan underground mines,mine and development of the Deep Mill Level Zone (DMLZ) ore body that lies below the Deep Ore Zone (DOZ) underground mine.
Common Infrastructure and Grasberg Block Cave. In 2004, PT Freeport Indonesia commenced its Common Infrastructure project to provide access to its large undeveloped underground ore bodies located in the Grasberg minerals district through a tunnel system located approximately 400 meters deeper than its existing underground tunnel system. In addition to providing access to our underground ore bodies, the tunnel system will enable PT Freeport Indonesia to conduct future exploration in prospective areas associated with currently identified ore bodies. The tunnel system was completed to the Big Gossan terminal, and the Big Gossan mine was brought into production in fourth-quarter 2010. Development of both the DMLZ and Grasberg Block Cave mines is advancing, and access to these underground ore bodies is complete.advancing.
The Grasberg Block Cave underground mine accounts for over one-thirdmore than 40 percent of our recoverable proven and probable reserves in Indonesia. Production at the Grasberg Block Cave mine is currently scheduled to commence in 2017, at the end of mining the Grasberg open pit which is currently(currently expected to continue until 2016. The timingoccur at the end of the transition to the underground Grasberg Block Cave mine will continue to be assessed.2016). Targeted production rates once the Grasberg Block Cave mining operation reaches full capacity are expected to approximate 160,000 metric tons of ore per day.
Aggregate mine development capital for the Grasberg Block Cave mine and associated Common Infrastructure is expected to approximate $4.2$4.4 billion (incurred between 2008 and 2021), with PT Freeport Indonesia’s share totaling approximately $3.8$4.1 billion. Aggregate project costs totaling $788$941 million have been incurred through September 30, 2012March 31, 2013 ($219($81 million during the first nine months offirst-quarter 20122013).
Big Gossan. The Big Gossan underground mine is a high-grade deposit located near PT Freeport Indonesia’s existing milling complex. Production, which began in fourth-quarter 2010, averaged 1,900 metric tons of ore per day in third-quarter2012. Full rates of 7,000 metric tons of ore per day are expected in 2014 (equal to average annual aggregate incremental production of 125 million pounds of copper and 65,000 ounces of gold).
DMLZ. The DMLZ ore body lies below the DOZ mine at the 2,590-meter elevation and represents the downward continuation of mineralization in the Ertsberg East Skarn system and neighboring Ertsberg porphyry. We plan to mine the ore body using a block-cave method with production beginning in 2015, near completion2015. Targeted production rates once the DMLZ mining operation reaches full capacity are expected to approximate 80,000 metric tons of mining at the DOZ mine. ore per day.
Drilling efforts continue to determine the extent of this ore body. Aggregate mine development capital costs for the DMLZ mine are expected to approximate $2.2$2.3 billion (incurred frombetween 2009 to 2020), with PT Freeport Indonesia’s share totaling approximately $1.3$1.4 billion. Aggregate project costs totaling $451$583 million have been incurred through September 30, 2012March 31, 2013 ($182($73 million during the first nine months offirst-quarter 20122013). Targeted production rates once the DMLZ mining operation reaches full capacity are expected to approximate 80,000 metric tons of ore per day.
Other Matters. PT Freeport Indonesia is engaged in discussions with the Indonesian government on its operations, future plans and Contract of Work (COW). We are working cooperatively with the government in its review of PT Freeport Indonesia's COW and to seek an extension of our COW to 2041, pursuant to the terms of the contract. Refer to Note 14 of our annual report on Form 10-K for the year ended December 31, 2011, for further discussion of PT Freeport Indonesia's COW.
Between July 2009 and October 2012, there were 37 shooting incidents in and around the Grasberg minerals district, including along the road leading to our mining and milling operations, which resulted in 15 fatalities and 57 injuries. The investigation of these matters is continuing. We have taken precautionary measures, including limiting use of the road to secured convoys. The Indonesian government has responded with additional security forces and expressed a commitment to protect the safety of the community and our operations. Prolonged limitations on access to the road could adversely affect operations at the mine. The safety of our workforce is a critical concern, and PT Freeport Indonesia is working cooperatively with the Government of Indonesia to address security issues. Refer to "Risk Factors" contained in Part I, Item 1A of our annual report on Form 10-K for the year ended December 31, 2011, for further discussion.
Operating Data. Following is summary operating data for our Indonesia mining operations for the thirdfirst quarters and first nine months of 20122013 and 20112012:
| | | | Three Months Ended | | Nine Months Ended | Three Months Ended |
| | September 30, | | September 30, | March 31, |
| | 2012 | | 2011 | | 2012 | | 2011 | 2013 | | 2012 |
| Operating Data, Net of Joint Venture Interest | | | | | | | | | | |
Copper (millions of recoverable pounds) | | | | | | | | | | |
| Production | 199 |
| | 233 |
| | 495 |
| | 778 |
| 219 |
| | 123 |
|
| Sales | 195 |
| | 253 |
| | 512 |
| | 796 |
| 198 |
| | 134 |
|
| Average realized price per pound | $ | 3.72 |
| | $ | 3.29 |
| | $ | 3.64 |
| | $ | 3.82 |
| $ | 3.43 |
| | $ | 3.81 |
|
| | | | | | | | | | | |
Gold (thousands of recoverable ounces) | | | | | | | | | | |
| Production | 182 |
| | 357 |
| | 641 |
| | 1,123 |
| 212 |
| | 229 |
|
| Sales | 178 |
| | 384 |
| | 691 |
| | 1,168 |
| 191 |
| | 266 |
|
| Average realized price per ounce | $ | 1,728 |
| | $ | 1,695 |
| | $ | 1,665 |
| | $ | 1,565 |
| $ | 1,604 |
| | $ | 1,695 |
|
| | | | | | | | | | | |
| 100% Operating Data | | | | | | | | | | |
Ore milled (metric tons per day):a | | | | | | | | | | |
| Grasberg open pit | 136,500 |
| | 107,000 |
| | 116,700 |
| | 137,200 |
| 137,400 |
| | 80,500 |
|
| DOZ underground mine | 48,300 |
| | 43,900 |
| | 42,300 |
| | 58,900 |
| |
| Big Gossan underground mine | 1,900 |
| | 1,300 |
| | 1,400 |
| | 1,800 |
| |
DOZ underground mineb | | 59,000 |
| | 33,100 |
|
Big Gossan underground minec | | 3,000 |
| | 1,200 |
|
| Total | 186,700 |
| | 152,200 |
| | 160,400 |
| | 197,900 |
| 199,400 |
| | 114,800 |
|
| Average ore grades: | | | | | | | | | | |
| Copper (percent) | 0.63 |
| | 0.90 |
| | 0.61 |
| | 0.80 |
| 0.66 |
| | 0.64 |
|
| Gold (grams per metric ton) | 0.46 |
| | 1.14 |
| | 0.60 |
| | 0.92 |
| 0.52 |
| | 0.84 |
|
| Recovery rates (percent): | | | | | | | | | | |
| Copper | 87.7 |
| | 89.8 |
| | 88.6 |
| | 88.2 |
| 88.5 |
| | 89.6 |
|
| Gold | 71.4 |
| | 82.4 |
| | 76.7 |
| | 81.3 |
| 71.8 |
| | 82.1 |
|
| Production (recoverable): | | | | | | | | | | |
| Copper (millions of pounds) | 199 |
| | 237 |
| | 495 |
| | 803 |
| 219 |
| | 123 |
|
| Gold (thousands of ounces) | 182 |
| | 408 |
| | 641 |
| | 1,261 |
| 212 |
| | 229 |
|
| |
| a. | Amounts represent the approximate average daily throughput processed at PT Freeport Indonesia’s mill facilities from each producing mine. |
| |
| b. | Production from the DOZ underground mine is expected to ramp up to the design rate of 80,000 metric tons of ore per day by the end of 2013. |
| |
| c. | Production from the Big Gossan underground mine is expected to ramp up to 7,000 metric tons of ore per day in 2014. |
SalesCopper sales volumes from our Indonesia mining operations declinedincreased to 195198 million pounds of copper and 178 thousand ounces of gold in third-quarterfirst-quarter 2012 and 512 million pounds of copper and 691 thousand ounces of gold for the first nine months of20122013, compared with 253134 million pounds in first-quarter2012 when labor related disruptions affected operations. Productivity measures have continued to improve resulting in first-quarter 2013 daily mill throughput averaging 199,400 metric tons per day, including 59,000 metric tons per day from the DOZ underground mine.
As expected, Indonesia's first-quarter2013 gold sales of copper and 384191 thousand ounces of gold inwere lower than third-quarter2011 and 796 million pounds of copper and 1.2 million ounces of gold for the first nine months of2011, primarily reflecting anticipated lower ore grades. The first nine months offirst-quarter 2012 were also impacted bygold sales of 266 thousand ounces primarily as a result of lower production rates associated with the first-quarter 2012 work interruptions and the related temporary suspension of operations.ore grades from mine sequencing.
At the Grasberg mine, the sequencing in mining areas with varying ore grades causes fluctuations in the timing of ore production resulting in varying quarterly and annual sales of copper and gold. Consolidated sales volumes from our Indonesia mining operations are expected to approximate 0.71.1 billion pounds of copper and 0.91.25 million ounces of gold for 20122013, compared with 846716 million pounds of copper and 1.3 million915 thousand ounces of gold in 20112012. Indonesia's current sales volume estimates for 2012 are approximately 40 million pounds of copper and 45,000 ounces of gold lower than the estimates provided in our quarterly report on Form 10-Q for the period ended June 30, 2012, because of mine plan changes in the Grasberg open pit, which delayed access to higher grade material, and a slower ramp-up of the DOZ mine. The slower than anticipated ramp-up reflects more extensive repairs required following the 2011 suspension of operations. The DOZ mine is expected to ramp up to 80,000 metric tons of ore per day in 2013. FCX expectsWe expect sales from Indonesia to increase in the second half of 2013 as PT Freeport Indonesia gains access to higher ore grades.grades and achieves the targeted ramp up in production from the DOZ underground mine to approximately 80,000
metric tons per day (57 percent of Indonesia's projected copper sales and 63 percent of Indonesia's projected gold sales are expected in the second half of 2013).
Unit Net Cash Costs. Unit net cash costs per pound of copper is a measure intended to provide investors with information about the cash-generating capacity of our mining operations expressed on a basis relating to the primary metal product for our respective operations. We use this measure for the same purpose and for monitoring operating performance by our mining operations. This information differs from measures of performance determined in accordance with U.S. GAAP and should not be considered in isolation or as a substitute for measures of performance determined in accordance with U.S. GAAP. This measure is presented by other metals mining companies, although our measure may not be comparable to similarly titled measures reported by other companies.
Gross Profit per Pound of Copper and per Ounce of Gold
The following tables summarize the unit net cash costs and gross profit per pound of copper and per ounce of gold at our Indonesia mining operations for the thirdfirst quarters and first nine months of 20122013 and 20112012. Refer to “Production Revenues and Production Costs” for an explanation of “by-product” and “co-product” methods and a reconciliation of unit net cash costs per pound to production and delivery costs applicable to sales reported in our consolidated financial statements.
| | | | Three Months Ended | | Three Months Ended | Three Months Ended | | Three Months Ended |
| | September 30, 2012 | | September 30, 2011 | March 31, 2013 | | March 31, 2012 |
| | By-Product Method | | Co-Product Method | | By-Product Method | | Co-Product Method | By-Product Method | | Co-Product Method | | By-Product Method | | Co-Product Method |
| | | Copper | | Gold | | Copper | | Gold | | Copper | | Gold | | Copper | | Gold |
| Revenues, excluding adjustments | $ | 3.72 |
| | $ | 3.72 |
| | $ | 1,728 |
| | $ | 3.29 |
| | $ | 3.29 |
| | $ | 1,695 |
| $ | 3.43 |
| | $ | 3.43 |
| | $ | 1,604 |
| | $ | 3.81 |
| | $ | 3.81 |
| | $ | 1,695 |
|
| | | | | | | | | | | | | | | | | | | | | | | |
| Site production and delivery, before net noncash and other costs shown below | 2.96 |
| | 2.05 |
| | 951 |
| | 1.98 |
| | 1.09 |
| | 561 |
| 2.61 |
| | 1.77 |
| | 826 |
| | 3.51 |
| | 1.83 |
| | 814 |
|
| Gold and silver credits | (1.66 | ) | | — |
| | — |
| | (2.80 | ) | | — |
| | — |
| (1.63 | ) | | — |
| | — |
| | (3.51 | ) | | — |
| | — |
|
| Treatment charges | 0.22 |
| | 0.15 |
| | 72 |
| | 0.18 |
| | 0.10 |
| | 53 |
| 0.23 |
| | 0.15 |
| | 71 |
| | 0.19 |
| | 0.10 |
| | 44 |
|
| Royalty on metals | 0.13 |
| | 0.09 |
| | 42 |
| | 0.16 |
| | 0.09 |
| | 46 |
| 0.13 |
| | 0.09 |
| | 42 |
| | 0.14 |
| | 0.07 |
| | 32 |
|
| Unit net cash costs (credits) | 1.65 |
| | 2.29 |
| | 1,065 |
| | (0.48 | ) | | 1.28 |
| | 660 |
| |
| Unit net cash costs | | 1.34 |
| | 2.01 |
| | 939 |
| | 0.33 |
| | 2.00 |
| | 890 |
|
| Depreciation and amortization | 0.27 |
| | 0.19 |
| | 88 |
| | 0.25 |
| | 0.13 |
| | 69 |
| 0.28 |
| | 0.19 |
| | 88 |
| | 0.34 |
| | 0.18 |
| | 80 |
|
| Noncash and other costs, net | 0.05 |
| | 0.04 |
| | 15 |
| | 0.01 |
| | 0.01 |
| | 4 |
| 0.26 |
| | 0.18 |
| | 83 |
| | 0.18 |
| | 0.10 |
| | 43 |
|
| Total unit costs (credits) | 1.97 |
| | 2.52 |
| | 1,168 |
| | (0.22 | ) | | 1.42 |
| | 733 |
| |
| Total unit costs | | 1.88 |
| | 2.38 |
| | 1,110 |
| | 0.85 |
| | 2.28 |
| | 1,013 |
|
| Revenue adjustments, primarily for pricing on prior period open sales | 0.04 |
| | 0.04 |
| | 11 |
| | (0.35 | ) | | (0.35 | ) | | 74 |
| 0.01 |
| | 0.01 |
| | (8 | ) | | 0.10 |
| | 0.10 |
| | 10 |
|
| PT Smelting intercompany profit | | 0.02 |
| | 0.02 |
| | 8 |
| | (0.16 | ) | | (0.08 | ) | | (36 | ) |
| Gross profit per pound/ounce | $ | 1.79 |
| | $ | 1.24 |
| | $ | 571 |
| | $ | 3.16 |
| | $ | 1.52 |
| | $ | 1,036 |
| $ | 1.58 |
| | $ | 1.08 |
| | $ | 494 |
| | $ | 2.90 |
| | $ | 1.55 |
| | $ | 656 |
|
| | | | | | | | | | | | | | | | | | | | | | | |
| Copper sales (millions of recoverable pounds) | 195 |
| | 195 |
| | | | 253 |
| | 253 |
| | | 198 |
| | 198 |
| | | | 134 |
| | 134 |
| | |
| Gold sales (thousands of recoverable ounces) | | | | | 178 |
| | | | | | 384 |
| | | | | 191 |
| | | | | | 266 |
|
|
| | | | | | | | | | | | | | | | | | | | | | | |
| | | | | | | | | | | | |
| | Nine Months Ended | | Nine Months Ended |
| | September 30, 2012 | | September 30, 2011 |
| | By-Product Method | | Co-Product Method | | By-Product Method | | Co-Product Method |
| | | Copper | | Gold | | | Copper | | Gold |
| Revenues, excluding adjustments | $ | 3.64 |
| | $ | 3.64 |
| | $ | 1,665 |
| | $ | 3.82 |
| | $ | 3.82 |
| | $ | 1,565 |
|
| | | | | | | | | | | | |
| Site production and delivery, before net noncash and other costs shown below | 3.20 |
| | 1.95 |
| | 892 |
| | 1.91 |
| | 1.17 |
| | 480 |
|
| Gold and silver credits | (2.34 | ) | | — |
| | — |
| | (2.39 | ) | | — |
| | — |
|
| Treatment charges | 0.21 |
| | 0.13 |
| | 58 |
| | 0.18 |
| | 0.11 |
| | 46 |
|
| Royalty on metals | 0.13 |
| | 0.08 |
| | 37 |
| | 0.16 |
| | 0.10 |
| | 41 |
|
| Unit net cash costs (credits) | 1.20 |
| | 2.16 |
| | 987 |
| | (0.14 | ) | | 1.38 |
| | 567 |
|
| Depreciation and amortization | 0.30 |
| | 0.18 |
| | 83 |
| | 0.23 |
| | 0.14 |
| | 56 |
|
| Noncash and other costs, net | 0.08 |
| | 0.05 |
| | 22 |
| | 0.04 |
| | 0.02 |
| | 8 |
|
| Total unit costs | 1.58 |
| | 2.39 |
| | 1,092 |
| | 0.13 |
| | 1.54 |
| | 631 |
|
| Revenue adjustments, primarily for pricing on prior period open sales | 0.03 |
| | 0.03 |
| | 4 |
| | (0.01 | ) | | (0.01 | ) | | (15 | ) |
| Gross profit per pound/ounce | $ | 2.09 |
| | $ | 1.28 |
| | $ | 577 |
| | $ | 3.68 |
| | $ | 2.27 |
| | $ | 919 |
|
| | | | | | | | | | | | |
| Copper sales (millions of recoverable pounds) | 512 |
| | 512 |
| | | | 796 |
| | 796 |
| | |
| Gold sales (thousands of recoverable ounces) | | | | | 691 |
| | | | | | 1,168 |
|
Because of the fixed nature of a large portion of PT Freeport Indonesia’s costs,Indonesia's unit costs vary from period to period depending on volumes of copper and gold sold, as well as average realized gold prices during the period. Unit net cash costs (net of gold and silver credits) for our Indonesia mining operations totaledincreased to $1.651.34 per pound of copper in third-quarterfirst-quarter 20122013 and, compared with $1.200.33 per pound of copper for thein first nine months offirst-quarter 2012, compared with netprimarily reflecting lower gold credits, of $0.48 per pound ofpartly offset by higher copper in third-quarter2011 and $0.14 per pound of copper for the first nine months of2011. Higher unit net cash costs in the 2012 periods primarily reflected lower sales volumes.
Treatment charges vary with the volume of metals sold and the price of copper, and royalties vary with the volume of metals sold and the prices of copper and gold.
Because certain assets are depreciated on a straight-line basis, PT Freeport Indonesia’s unit depreciation rate
varies with the level of copper production and sales.
Revenue adjustments primarily result from changes in prices on provisionally priced copper sales recognized in prior periods. To the extent prices are higher or lower than what was recorded on a provisional basis, an increase or decrease to revenues is recorded each reporting period until the date of final pricing. Refer to “Consolidated Results - Revenues” for further discussion of adjustments to prior period provisionally priced copper sales.
Quarterly unit net cash costs are expected to vary significantly with variations in quarterly metal sales volumes, as well as average realized gold prices during the period. Assuming achievement of current sales volume and cost estimates, and an average gold price of $1,7001,400 per ounce for fourth-quarterthe remainder of 20122013, we estimate that average unit site production and delivery costs for Indonesia would approximate $3.24 per pound of copper and averageIndonesia's unit net cash costs (net of gold and silver credits) would approximate $1.341.00 per pound of copper for the year 20122013, compared with $0.09 per pound in 2011 (fourth-quarter 2012 site production and delivery costs are expected to average $3.35 per pound of copper and unit net cash costs (net of by-product credits) are expected to average $1.70 per pound of copper). Indonesia's unit net cash costs for 2012 would change by $0.020.05 per pound for each $50 per
ounce change in the average price of gold duringfor fourth-quarterthe remainder of 20122013. Assuming consistent commodity price assumptions,Indonesia's projected unit net cash costs for 2013 are higher than previous estimates primarily because of lower gold credits. Because of the fixed nature of a large portion of Indonesia's costs, unit costs vary from quarter to quarter depending on copper and gold sales volumes, as well as average realized gold prices for the quarterly period. Indonesia's unit net cash costs for future periods are expected to be lower than 2012, as PT Freeport Indonesia accesses higher grade ore beginning indecline during the second half of 2013.2013 as it gains access to higher grade ore.
Africa Mining
Africa mining includes theTFM's Tenke copper and cobalt mining concessions in the Katanga province of the DRC. The Tenke mine includes surface mining, leaching and SX/EW operations. Copper production from the Tenke mine is sold as copper cathode. In addition to copper, the Tenke mine produces cobalt hydroxide.
minerals district. We hold an effective 56 percent interest in the Tenke copper and cobalt mining concessions in the Katanga province of the DRC and are the operator of Tenke. Effective March 26,TFM.
The Tenke operation includes surface mining, leaching and SX/EW operations. Copper production from the Tenke minerals district is sold as copper cathode. In addition to copper, the Tenke minerals district produces cobalt hydroxide.
For additional discussion of risks associated with our operations in Africa, refer to “Risk Factors” contained in Part I, Item 1A. of our annual report on Form 10-K for the year ended December 31, 2012 the DRC government issued a Presidential Decree approving modifications to TFM's bylaws. As a result, our and Lundin Mining Corporation's ownership interest in Tenke totals 80 percent (previously 82.5 percent) and Gecamines' ownership interest totals 20 percent (previously 17.5 percent).
Operating and Development Activities. Our investment in the initial project approximated $2 billion, and as of March 31, 2013, we have received intercompany loan repayments including interest,(including interest) of approximately $840 million through September 30, 2012.$946 million.
We are nearing completion of aTFM has completed its second phase of theexpansion project, which includesincluded optimizing the current plant and increasing mine, mill and processing capacity. We are expanding theThe expanded mill rate tois capable of throughput of 14,000 metric tons of ore per day and are completing construction of the related processing facilities that target the addition of approximatelyto enable increasing copper production by 150 million pounds of copperto over 430 million pounds per year in 2013. The approximate $850year. Costs incurred to date total approximately $615 million project includesand included mill upgrades, additional mining equipment and a new tankhouse and a sulphuric acid plant expansion. Construction activities are progressing well and are expected to be substantially complete by year-end 2012. The addition of atankhouse. A second sulphuric acid plant, which was included in the $850 million total estimated project capital cost, is expected to be completedinstalled in 2015. The second phase of the projectexpanded mill facility is being funded primarilyperforming well, with cash generated from operations, and for additional required funds, we are funding 70 percent and Lundin Mining Corporation is funding 30 percent. Project costs of $535 million have been incurred asfirst-quarter2013 average throughput rates of September 30, 201214,600 ($367 million during the first nine months of2012).metric tons per day.
During third-quarter2012, Tenke achieved record mining, milling and copper production rates. Improved performance and the second phase expansion are expected to enable copper production to exceed 400 million pounds for the year 2013, compared with initial design capacity of 250 million pounds per year.
We continue to engage in drilling activities, exploration analyses and metallurgical testing to evaluate the potential of the highly prospective Tenke minerals district at Tenke.district. These analyses are being incorporated in future plans to evaluate opportunities for expansion. Future expansions are subject to a number of factors, including economic and market conditions, and the business and investment climate in the DRC.
Other Matters. Salary scale for TFM's union-represented employees is negotiated outside of the Collective Labor Agreement. In September 2012, TFM successfully renegotiated a 4-year salary scale with union-represented employees.
Operating Data. Following is summary operating data for our Africa mining operations for the thirdfirst quarters and first nine months of 20122013 and 20112012:
| | | | Three Months Ended | | Nine Months Ended | Three Months Ended |
| | September 30, | | September 30, | March 31, |
| | 2012 | | 2011 | | 2012 | | 2011 | 2013 | | 2012 |
Copper (millions of recoverable pounds) | | | | | | | | | | |
| Production | 91 |
| | 71 |
| | 250 |
| | 204 |
| 120 |
| | 80 |
|
| Sales | 88 |
| | 65 |
| | 239 |
| | 200 |
| 118 |
| | 69 |
|
Average realized price per pounda | $ | 3.55 |
| | $ | 3.46 |
| | $ | 3.54 |
| | $ | 3.89 |
| $ | 3.40 |
| | $ | 3.74 |
|
| | | | | | | | | | | |
Cobalt (millions of contained pounds) | | | | | | | | | | |
| Production | 8 |
| | 6 |
| | 20 |
| | 18 |
| 6 |
| | 6 |
|
| Sales | 8 |
| | 6 |
| | 19 |
| | 19 |
| 6 |
| | 5 |
|
| Average realized price per pound | $ | 8.24 |
| | $ | 10.05 |
| | $ | 8.36 |
| | $ | 10.71 |
| $ | 7.28 |
| | $ | 8.46 |
|
| | | | | | | | | | | |
| Ore milled (metric tons per day) | 13,600 |
| | 12,000 |
| | 12,900 |
| | 10,800 |
| 14,600 |
| | 12,200 |
|
| Average ore grades (percent): | | | | | | | | | | |
| Copper | 3.60 |
| | 3.21 |
| | 3.56 |
| | 3.42 |
| 4.44 |
| | 3.61 |
|
| Cobalt | 0.38 |
| | 0.41 |
| | 0.37 |
| | 0.40 |
| 0.32 |
| | 0.38 |
|
| Copper recovery rate (percent) | 92.9 |
| | 91.4 |
| | 91.6 |
| | 92.0 |
| 93.7 |
| | 91.2 |
|
| |
| a. | Includes point-of-sale transportation costs as negotiated in customer contracts. |
Copper sales volumes from our Africa mining operations increased toof 88 million pounds of copper in third-quarter2012 and 239 million pounds of copper for the first nine months of2012, compared with 65118 million pounds in third-quarterfirst-quarter 20112013 andwere higher than 200first-quarter2012 copper sales of 69 million pounds, of copper for the first nine months of2011, primarily reflecting higher mining and milling rates principally related to the ramp-upramp up of the second phase expansion.expansion project and higher ore grades.
For the year 20122013, we expect sales volumes from our Africa mining operations to approximate 330435 million pounds of copper and 2528 million pounds of cobalt, compared with 283336 million pounds of copper and 25 million pounds of cobalt in 20112012.
Unit Net Cash Costs. Unit net cash costs per pound of copper is a measure intended to provide investors with information about the cash-generating capacity of our mining operations expressed on a basis relating to the primary metal product for our respective operations. We use this measure for the same purpose and for monitoring operating performance by our mining operations. This information differs from measures of performance determined in accordance with U.S. GAAP and should not be considered in isolation or as a substitute for measures of performance determined in accordance with U.S. GAAP. This measure is presented by other metals mining companies, although our measure may not be comparable to similarly titled measures reported by other companies.
Gross Profit per Pound of Copper and Cobalt
The following tables summarize the unit net cash costs and gross profit per pound of copper and cobalt at our Africa mining operations for the thirdfirst quarters and first nine months of 20122013 and 20112012. Refer to “Production Revenues and Production Costs” for an explanation of “by-product” and “co-product” methods and a reconciliation of unit net cash costs per pound to production and delivery costs applicable to sales reported in our consolidated financial statements.
| | | | Three Months Ended | | Three Months Ended | Three Months Ended | | Three Months Ended |
| | September 30, 2012 | | September 30, 2011 | March 31, 2013 | | March 31, 2012 |
| | By-Product Method | | Co-Product Method | | By-Product Method | | Co-Product Method | By-Product Method | | Co-Product Method | | By-Product Method | | Co-Product Method |
| | | Copper | | Cobalt | | Copper | | Cobalt | | Copper | | Cobalt | | Copper | | Cobalt |
Revenues, excluding adjustmentsa | $ | 3.55 |
| | $ | 3.55 |
| | $ | 8.24 |
| | $ | 3.46 |
| | $ | 3.46 |
| | $ | 10.05 |
| $ | 3.40 |
| | $ | 3.40 |
| | $ | 7.28 |
| | $ | 3.74 |
| | $ | 3.74 |
| | $ | 8.46 |
|
| | | | | | | | | | | | | | | | | | | | | | | |
| Site production and delivery, before net noncash and other costs shown below | 1.63 |
| | 1.45 |
| | 4.96 |
| | 1.55 |
| | 1.40 |
| | 5.71 |
| 1.39 |
| | 1.33 |
| | 4.18 |
| | 1.50 |
| | 1.44 |
| | 5.14 |
|
Cobalt creditsb | (0.48 | ) | | — |
| | — |
| | (0.51 | ) | | — |
| | — |
| (0.23 | ) | | — |
| | — |
| | (0.33 | ) | | — |
| | — |
|
| Royalty on metals | 0.08 |
| | 0.07 |
| | 0.14 |
| | 0.08 |
| | 0.06 |
| | 0.15 |
| 0.07 |
| | 0.06 |
| | 0.13 |
| | 0.08 |
| | 0.07 |
| | 0.13 |
|
| Unit net cash costs | 1.23 |
| | 1.52 |
| | 5.10 |
| | 1.12 |
| | 1.46 |
| | 5.86 |
| 1.23 |
| | 1.39 |
| | 4.31 |
| | 1.25 |
| | 1.51 |
| | 5.27 |
|
| Depreciation, depletion and amortization | 0.49 |
| | 0.43 |
| | 0.64 |
| | 0.48 |
| | 0.41 |
| | 0.88 |
| 0.49 |
| | 0.46 |
| | 0.69 |
| | 0.46 |
| | 0.42 |
| | 0.66 |
|
| Noncash and other costs, net | 0.07 |
| | 0.06 |
| | 0.08 |
| | 0.29 |
| | 0.25 |
| | 0.53 |
| 0.04 |
| | 0.04 |
| | 0.06 |
| | 0.11 |
| | 0.10 |
| | 0.15 |
|
| Total unit costs | 1.79 |
| | 2.01 |
| | 5.82 |
| | 1.89 |
| | 2.12 |
| | 7.27 |
| 1.76 |
| | 1.89 |
| | 5.06 |
| | 1.82 |
| | 2.03 |
| | 6.08 |
|
| Revenue adjustments, primarily for pricing on prior period open sales | (0.02 | ) | | (0.02 | ) | | 0.05 |
| | (0.01 | ) | | (0.01 | ) | | (0.10 | ) | 0.01 |
| | 0.01 |
| | 0.38 |
| | 0.12 |
| | 0.12 |
| | 0.46 |
|
| Gross profit per pound | $ | 1.74 |
| | $ | 1.52 |
| | $ | 2.47 |
| | $ | 1.56 |
| | $ | 1.33 |
| | $ | 2.68 |
| $ | 1.65 |
| | $ | 1.52 |
| | $ | 2.60 |
| | $ | 2.04 |
| | $ | 1.83 |
| | $ | 2.84 |
|
| | | | | | | | | | | | | | | | | | | | | | | |
| Copper sales (millions of recoverable pounds) | 88 |
| | 88 |
| | | | 65 |
| | 65 |
| | | 118 |
| | 118 |
| | | | 69 |
| | 69 |
| | |
| Cobalt sales (millions of contained pounds) | | | | | 8 |
| | | | | | 6 |
| | | | | 6 |
| | | | | | 5 |
|
|
| | | | | | | | | | | | | | | | | | | | | | | |
| | Nine Months Ended | | Nine Months Ended |
| | September 30, 2012 | | September 30, 2011 |
| | By-Product Method | | Co-Product Method | | By-Product Method | | Co-Product Method |
| | | Copper | | Cobalt | | | Copper | | Cobalt |
Revenues, excluding adjustmentsa | $ | 3.54 |
| | $ | 3.54 |
| | $ | 8.36 |
| | $ | 3.89 |
| | $ | 3.89 |
| | $ | 10.71 |
|
| | | | | | | | | | | | |
| Site production and delivery, before net noncash and other costs shown below | 1.54 |
| | 1.43 |
| | 5.05 |
| | 1.57 |
| | 1.37 |
| | 5.62 |
|
Cobalt creditsb | (0.39 | ) | | — |
| | — |
| | (0.68 | ) | | — |
| | — |
|
| Royalty on metals | 0.08 |
| | 0.06 |
| | 0.13 |
| | 0.09 |
| | 0.07 |
| | 0.18 |
|
| Unit net cash costs | 1.23 |
| | 1.49 |
| | 5.18 |
| | 0.98 |
| | 1.44 |
| | 5.80 |
|
| Depreciation, depletion and amortization | 0.48 |
| | 0.42 |
| | 0.68 |
| | 0.49 |
| | 0.41 |
| | 0.82 |
|
| Noncash and other costs, net | 0.09 |
| | 0.08 |
| | 0.12 |
| | 0.20 |
| | 0.18 |
| | 0.36 |
|
| Total unit costs | 1.80 |
| | 1.99 |
| | 5.98 |
| | 1.67 |
| | 2.03 |
| | 6.98 |
|
| Revenue adjustments, primarily for pricing on prior period open sales | 0.03 |
| | 0.03 |
| | 0.12 |
| | (0.01 | ) | | (0.01 | ) | | 0.12 |
|
| Gross profit per pound | $ | 1.77 |
| | $ | 1.58 |
| | $ | 2.50 |
| | $ | 2.21 |
| | $ | 1.85 |
| | $ | 3.85 |
|
| | | | | | | | | | | | |
| Copper sales (millions of recoverable pounds) | 239 |
| | 239 |
| | | | 200 |
| | 200 |
| | |
| Cobalt sales (millions of contained pounds) | | | | | 19 |
| | | | | | 19 |
|
| |
| a. | Includes point-of-sale transportation costs as negotiated in customer contracts. |
| |
| b. | Net of cobalt downstream processing and freight costs. |
Africa's unitUnit net cash costs (net of cobalt credits) for our Africa operations of $1.23 per pound of copper in third-quarterfirst-quarter2013 were slightly lower than first-quarter 2012 and for the first nine months of2012, were higher than unit net cash costs of $1.121.25 per pound of copper, in third-quarter2011 and $0.98 per poundprimarily reflecting the benefit of copper for the first nine months of2011. Higher unit net cash costs in third-quarter 2012 primarily reflected higher mining and input costs, including sulphuric acid and energy. Higher unit net cash costs in the first nine months of 2012 primarily reflectedsales volumes, partly offset by lower cobalt credits.
Assuming achievement of current sales volume and cost estimates, and an average cobalt market cobalt price of $12 per pound for fourth-quarterthe remainder of 20122013, we estimate that average unit site production and delivery costs for Africa would
approximate $1.53 per pound of copper and average unit net cash costs (net of cobalt credits) would approximate $1.251.18 per pound of copper for the year 20122013, compared with $1.071.23 per pound in 20112012 (fourth-quarter 2012 site production and delivery costs are expected to average $1.50 per pound of copper and. Africa's projected unit net cash costs (net of by-product credits) are expected to average $1.28 per pound of copper). Africa's unit net cash costs for 2012would change by $0.0250.065 per pound for each $2 per pound change in the average price of cobalt during fourth-quarterthe remainder of 20122013.
Molybdenum Mines
We are an integrated producer ofhave two wholly owned molybdenum with mining, sulfide ore concentrating, roasting and processing facilities that produce high-purity, molybdenum-based chemicals, molybdenum metal powder and metallurgical products, which are sold to customers aroundmines in North America – the world. Our molybdenum operations include the wholly owned Henderson underground mine and the Climax open-pit mine, both in Colorado and related conversion facilities.Colorado. The Henderson underground mine producesand Climax mines produce high-purity, chemical-grade molybdenum concentrates, which are typically further processed into value-added molybdenum chemical products. The majority of the molybdenum concentrates produced at the Henderson and Climax mine also produces high quality molybdenum concentrates. The Molybdenum operations include a sales company that purchases and sells molybdenum from our primary molybdenum mines, andas well as from certain of our North and South America copper mines, that also produce molybdenum; and relatedare processed at our own conversion facilities that, at times, roast and/or process material on a toll basis for third-parties.
Operating and Development Activities. The newly commissioned Climax molybdenum mine, which includes a new 25,000 metric ton per day mill facility, began commercial production in May 2012. Depending on market conditions, production from Climax may ramp up to a rate of 20 million pounds of molybdenum per year during 2013, with the potential to produce 30 million pounds of molybdenum per year. We intend to operate our Climax and Henderson mines in a flexible manner to meet market requirements. The cost of the initial phase of the project approximated $760 million.facilities.
Operating Data. Following is summary operating data for the Molybdenum operationsmolybdenum mines for the thirdfirst quarters and first nine months of 20122013 and 20112012:
|
| | | | | | | | | | | | | | | |
| | Three Months Ended | | Nine Months Ended |
| | September 30, | | September 30, |
| | 2012 | | 2011 | | 2012 | | 2011 |
Molybdenum (millions of recoverable pounds) | | | | | | | |
| Production | 10 |
| a | 11 |
| | 28 |
| a | 30 |
|
Sales, excluding purchasesb | 21 |
| | 19 |
| | 62 |
| | 60 |
|
| Average realized price per pound | $ | 13.62 |
| | $ | 16.34 |
| | $ | 14.79 |
| | $ | 17.57 |
|
| | | | | | | | |
| Henderson molybdenum mine | | | | | | | |
| Ore milled (metric tons per day) | 21,400 |
| | 24,500 |
| | 21,100 |
| | 23,300 |
|
| Average molybdenum ore grade (percent) | 0.23 |
| | 0.24 |
| | 0.23 |
| | 0.24 |
|
| Molybdenum production (millions of recoverable pounds) | 9 |
| | 11 |
| | 26 |
| | 30 |
|
|
| | | | | |
| | Three Months Ended |
| | March 31, |
| | 2013a | | 2012a |
| Molybdenum mines operating data | | | |
Molybdenum production (millions of recoverable pounds)b | 12 |
| | 9 |
|
| Ore milled (metric tons per day) | 35,900 |
| | 19,900 |
|
| Average molybdenum ore grade (percent) | 0.20 |
| | 0.25 |
|
| |
| a. | The 2012 periods include production fromReflects operating data for the Henderson and Climax molybdenummines for first-quarter2013, and operating data only for the Henderson mine totalingfor 1 million pounds in third-quarterfirst-quarter 2012 and 2 million pounds for the first nine months of2012 reflecting production since the start of commercial operations in May 2012 (the 2011 periods only reflect production from the Henderson molybdenum mine).
|
| |
| b. | IncludesRefer to "Consolidated Results" for our consolidated molybdenum sales, which includes sales of molybdenum produced at the molybdenum mines, as well as from certain of our North and South America copper mines. |
ConsolidatedThe Climax molybdenum sales volumesmine, which was commissioned in second-quarter 2012 includes a new 25,000 metric ton per day mill facility. Molybdenum production from the Climax mine totaled 215 million pounds in third-quarterfirst-quarter 20122013 and 62is targeted to produce 20 million pounds for the first nine months of2012, compared with 19year 2013 (with potential to produce up to approximately 30 million pounds per year depending on market conditions). We intend to operate the Climax and Henderson mines in a flexible manner to meet market requirements.third-quarter2011
Refer to "Consolidated Results" for our consolidated molybdenum operating data, which includes sales of molybdenum produced at our molybdenum mines and 60 million pounds for the first nine months of2011. For the year 2012, we expect molybdenum sales volumes to approximate 82 million pounds (of which approximately 43 million pounds represents molybdenum production fromat our North and South America copper mines), compared with 79 million pounds in 2011 (of which 45 million pounds representedmines, and refer to "Outlook" for projected consolidated molybdenum production from our North and South America copper mines).sales volumes.
Unit Net Cash Costs. Unit net cash costs per pound of molybdenum is a measure intended to provide investors with information about the cash-generating capacity of our mining operations expressed on a basis relating to the primary metal product for our respective operations. We use this measure for the same purpose and for monitoring operating performance by our mining operations. This information differs from measures of performance determined in accordance with U.S. GAAP and should not be considered in isolation or as a substitute for measures of
performance determined in accordance with U.S. GAAP. This measure is presented by other metals mining companies, although our measure may not be comparable to similarly titled measures reported by other companies.
Gross Profit per Pound of Molybdenum
The following table summarizes the average unit net cash costs and gross profit per pound of molybdenum at our Hendersonthe molybdenum mine for the third quarters and first nine months of2012 and 2011.mines. Refer to “Product Revenues and Production Costs” for a reconciliation of unit net cash costs per pound to production and delivery costs applicable to sales reported in our consolidated financial statements.
| | | | Three Months Ended | | Nine Months Ended | Three Months Ended |
| | September 30, | | September 30, | March 31, |
| | 2012 | | 2011 | | 2012 | | 2011 | 2013a | | 2012a |
| Revenues, excluding adjustments | $ | 13.69 |
| | $ | 15.38 |
| | $ | 14.61 |
| | $ | 16.66 |
| |
Revenues, excluding adjustmentsb | | $ | 12.55 |
| | $ | 15.03 |
|
| | | | | | | | | | | |
| Site production and delivery, before net noncash and other costs shown below | 6.23 |
| | 5.21 |
| | 6.06 |
| | 5.26 |
| 6.37 |
| | 6.00 |
|
| Treatment charges and other | 0.88 |
| | 1.03 |
| | 0.88 |
| | 0.93 |
| 0.95 |
| | 0.88 |
|
| Unit net cash costs | 7.11 |
| | 6.24 |
| | 6.94 |
| | 6.19 |
| 7.32 |
| | 6.88 |
|
| Depreciation, depletion and amortization | 1.00 |
| | 0.94 |
| | 0.95 |
| | 0.90 |
| 1.62 |
| | 0.90 |
|
| Noncash and other costs, net | 0.52 |
| | 0.03 |
| | 0.21 |
| | 0.04 |
| 0.15 |
| | 0.05 |
|
| Total unit costs | 8.63 |
| | 7.21 |
| | 8.10 |
| | 7.13 |
| 9.09 |
| | 7.83 |
|
Gross profita | $ | 5.06 |
| | $ | 8.17 |
| | $ | 6.51 |
| | $ | 9.53 |
| |
| Gross profit | | $ | 3.46 |
| | $ | 7.20 |
|
| | | | | | | | | | | |
Molybdenum sales (millions of recoverable pounds)b | 9 |
| | 11 |
| | 26 |
| | 30 |
| |
Molybdenum production (millions of recoverable pounds)b | | 12 |
| | 9 |
|
| |
| a. | Gross profit reflectsReflects the results of the Henderson and Climax mines for first-quarter2013, and the results of only the Henderson mine for first-quarter2012. |
| |
| b. | Revenues reflect sales of Hendersonthe molybdenum mines' production to our Molybdenummolybdenum sales company based on volumes produced at market-based pricing. On a consolidated basis, the Molybdenum division includes profits on sales as theyrealizations are made to third parties and realizations based on actual contract terms.terms of sales made to third parties. As a result, the actual gross profitour consolidated average realized price per pound of molybdenum (refer to "Consolidated Results") will differ from the amounts reported in this table. |
| |
b. | Reflects production at the Henderson molybdenum mine. |
Henderson’s higherAverage unit net cash costs offor our molybdenum mines was $7.117.32 per pound of molybdenum in third-quarterfirst-quarter 2012 and $6.94 per pound of molybdenum for the first nine months of20122013, compared with $6.246.88 per pound of molybdenum in third-quarterfirst-quarter 2011 and $6.19 per pound of molybdenum for the first nine months of20112012, primarily reflected lowerreflecting higher input costs at Henderson and the addition of production volumes.from Climax.
Assuming achievement of current 2012sales volume and cost estimates, we estimate average unit net cash costs for Hendersonour molybdenum mines to approximateaverage approximately $7.007.25 per pound of molybdenum for the year 20122013, compared with $6.34 (reflecting approximately $7.50 per pound in 2011for Henderson and $6.90 per pound for Climax).
Atlantic Copper Smelting & Refining
Atlantic Copper, our wholly owned subsidiary located in Spain, smelts and refines copper concentrates and markets refined copper and precious metals in slimes. During the first nine months offirst-quarter 20122013, Atlantic Copper purchased approximately 3134 percent of its concentrate requirements from our South America mining operations, approximately 1521 percent from our North America copper mines and approximately 814 percent from our Indonesia mining operations. Through this form of downstream integration, we are assured placement of a significant portion of our concentrate production.
Smelting and refining charges consist of a base rate and, in certain contracts, price participation based on copper prices. Treatment charges for smelting and refining copper concentrates represent a cost to our mining operations, and income to Atlantic Copper and PT Smelting, PT Freeport Indonesia's 25 percent owned smelter and refinery.Smelting. Thus, higher treatment and refining charges benefit our smelter operations and adversely affect our mining operations. Our North America copper mines are less significantly affected by changes in treatment and refining charges because these operations are largely integrated with our wholly owned smelter located in Miami, Arizona.
Atlantic Copper had an operating loss of $1 million in third-quarter2012 and operating income of $12 million for the first nine months of2012, compared with operating losses of $5 million in third-quarter2011 and $70 million for the first nine months of2011. Atlantic Copper’s improved operating results in the 2012 periods, compared with the 2011 periods, primarily reflected higher gold credits. Atlantic Copper's operating results for the first nine months of2011
also reflected higher operating costs primarily associated with the April 2011 scheduled shutdown.
We defer recognizing profits on sales from our mining operations to Atlantic Copper and on 25 percent of Indonesia mining sales to PT Smelting until final sales to third parties occur. Changes in these deferrals attributable to variability in intercompany volumes resulted in net additions (reductions) to net income attributable to common stockholders totaling $25 million ($0.03 per share) in first-quarter2013 and $(32) million ($(0.03) per share) in first-quarter2012. Our net deferred profits on our inventories at Atlantic Copper and PT Smelting to be recognized in future periods’ net income after taxes and noncontrolling interestsattributable to common stockholders totaled $10585 million at September 30, 2012. Changes in these deferrals attributable to variability in intercompany volumes resulted in net reductions to net income attributable to common stockholders totaling $34 million ($0.04 per share) in third-quarter2012 and $69 million ($0.07 per share) for the first nine months of2012, compared with net additions of $99 million ($0.10 per share) in third-quarter2011 and $116 million ($0.12 per share) for the first nine months of2011March 31, 2013. Quarterly variations in ore grades, the timing of intercompany shipments and changes in product prices will result in variability in our net deferred profits and quarterly earnings.
CAPITAL RESOURCES AND LIQUIDITY
Our operating cash flows vary with prices realized from copper, gold and molybdenum sales, our sales volumes, production costs, income taxes, other working capital changes and other factors. StrongIn recent years, strong operating performance and favorable copper and gold prices have enabled us to enhance our financial and liquidity position, reduce debt and pay cash dividends to shareholders, while pursuing growth opportunities. We view the long-term outlook for our business positively, supported by limitations on supplies of copper and by the requirements for copper in the world’s economy, and will continue to adjust our operating strategy as market conditions change.
Cash and Cash EquivalentsDebt
At September 30, 2012, we had consolidated cash and cash equivalentsFollowing is a summary of$3.7 billion. The following table reflects the U.S. and international components of consolidated cash and cash equivalents, including cash available to the parent company, net of noncontrolling interests' share, taxes and other costs at September 30, 2012March 31, 2013, and December 31, 20112012 (in billions):
| | | | September 30, 2012 | | December 31, 2011 | March 31, 2013 | | December 31, 2012 |
Cash at domestic companiesa | $ | 1.2 |
| | $ | 2.4 |
| |
| Cash at domestic companies | | $ | 7.0 |
| a | $ | 1.3 |
|
| Cash at international operations | 2.5 |
| | 2.4 |
| 2.6 |
| | 2.4 |
|
| Total consolidated cash and cash equivalents | 3.7 |
| | 4.8 |
| 9.6 |
| | 3.7 |
|
| Less: Noncontrolling interests’ share | (0.8 | ) | | (0.8 | ) | (0.9 | ) | | (0.8 | ) |
| Cash, net of noncontrolling interests’ share | 2.9 |
| | 4.0 |
| 8.7 |
| | 2.9 |
|
| Less: Withholding taxes and other | (0.2 | ) | | (0.1 | ) | (0.2 | ) | | (0.2 | ) |
| Net cash available to FCX | $ | 2.7 |
| | $ | 3.9 |
| |
| Net cash available | | $ | 8.5 |
| | $ | 2.7 |
|
| |
| a. | Includes cash at our parent companynet proceeds from the March 2013 sale of $6.5 billion of senior notes that will be used to fund a portion of the pending acquisitions of PXP and other North America operations.MMR. |
Cash held at our international operations is generally used to support our foreign operations' capital expenditures, operating expenses, working capital and other tax payments, or other cash needs. At September 30, 2012March 31, 2013, management believed that sufficient liquidity was available in the U.S. With the exception of Tenke,TFM, we have not elected to permanently reinvest earnings from our foreign subsidiaries, and we have recorded deferred tax liabilities for foreign earnings that are available to be repatriated to the U.S. From time to time, our foreign subsidiaries distribute earnings to the U.S. through dividends, which are subject to applicable withholding taxes and noncontrolling interests' share.
Total debt was $10.1 billion at March 31, 2013, and $3.5 billion at December 31, 2012. During first-quarter 2013, we sold $6.5 billion of senior notes (refer to "Financing Activities" below for further discussion) and also entered into an agreement for a Term Loan for up to $4.0 billion to be used for the pending acquisitions of PXP and MMR. No amounts are currently available to us under the Term Loan, which will be funded at the closing of the pending acquisitions of PXP and MMR. The weighted average interest rate of these financings approximates 3.1 percent. Refer to Note 6 for further discussion.
At March 31, 2013, we had no borrowings and $43 million of letters of credit issued under our revolving credit facility, resulting in availability of $1.5 billion. In February 2013, we entered into a new $3.0 billion senior unsecured revolving credit facility, which will refinance and replace our existing revolving credit facility upon completion of the pending acquisition of PXP. Refer to Note 6 for further discussion.
Operating Activities
WeDuring first-quarter2013, we generated operating cash flows totaling $2.5 billion for the first nine months of2012831 million, net of $1.5 billion for working capital uses and other tax payments, compared with operating cash flows totaling $5.9 billion for the first nine months of2011, net of $126430 million for working capital uses and changes in other tax payments. Lower operatingOperating cash flows for the first nine months offirst-quarter 2012, compared with the totaled first nine months of2011$801 million, primarily reflected lower copper and gold sales volumes, lower copper price realizations and an increase innet of $720 million for working capital uses and changes in other tax payments, primarily associated with changes in accounts receivable. As discussed in "Consolidated Results - Revenues," substantially all of our copper concentrate and cathode sales contracts are provisionally priced; accordingly, the quarter-end forward price is a major determinate of recorded revenues and the resulting receivables. At September 30, 2012, our provisionally priced copper sales we recorded at an average of $3.72 per pound of copper, compared with $3.18 per pound at September 30, 2011.payments.
BasedExcluding impacts for pending acquisitions, and based on current mine plans and subject to future copper, gold and molybdenum prices, we expect estimated operating cash flows for the year 20122013 plus available cash to be sufficient to fund our budgeted capital expenditures, dividends, noncontrolling interest distributions and other cash requirements for the year. Refer to
“Outlook” “Outlook” for further discussion of projected operating cash flows for the year 20122013.
Investing Activities
Capital Expenditures.Capital expenditures, including capitalized interest, totaled $2.5 billion805 million for the first nine months offirst-quarter 20122013, compared with $1.7 billion707 million for the first nine months offirst-quarter 20112012,. Higher capital expenditures in first-quarter 2013 primarily reflecting higherreflected increased capital spending associated with the expansion projects at Tenke, Cerro Verde and Morenci.Morenci, partly offset by decreased spending at Tenke related to the second phase expansion. Refer to “Operations” for further discussion.
CapitalExcluding amounts for pending acquisitions, capital expenditures for the year 20122013 are expected to approximate $3.64.4 billion, including $2.22.6 billion for major projects and $1.4 billion for sustaining capital.projects. Major projects for 20122013 primarily include the expansion projects at Cerro Verde and Morenci and underground development activities at Grasberg and the expansion projects at Tenke, Cerro Verde and Morenci.Grasberg. We are also considering additional investments at several of our sites. Capital spending plans will continue to be reviewed and adjusted in response to changes in market conditions and other factors. Refer to "Operations" for further discussion.
Acquisition. Other investing activities in first-quarter 2013 included $321 million (which was net of $34 million of cash acquired) to fund the acquisition of a large-scale cobalt chemical refinery in Kokkola, Finland, and the related sales and marketing business. The acquisition was funded 70 percent by us and 30 percent by Lundin, which amounts will be repaid prior to any shareholder distributions. Refer to Note 2 for further discussion.
Financing Activities
Debt and Equity Transactions. AtIn March 2013, we sold September 30, 2012, debt totaled $3.56.5 billion, and we have no significant debt maturities through 2014. At September 30, 2012, we had no borrowings and $44 million of letterssenior notes in four tranches with a weighted average interest rate of credit issued under our revolving credit facility, resulting in availability of approximately $1.5 billion3.9 percent ($956 million of which could. Net proceeds from this offering will be used to fund the pending acquisitions of PXP and MMR. If the acquisition of PXP is not completed, we will be required to redeem all of the outstanding 7-year, 10-year and 30-year notes (which total $5 billion) at 101 percent plus accrued and unpaid interest. Refer to Note 6for additional letters of credit).further discussion.
In February 2012, we sold $3.0$3.0 billion of senior notes in three tranches with a weighted-average interest rate of approximately three3.0 percent. Net proceeds from this offering, plus cash on hand, were used to redeem the remaining $3.0$3.0 billion of our 8.375% Senior Notes. Refer to Note 56 for further discussion.
In April 2011, we redeemed the remaining $1.1 billion of our outstanding 8.25% Senior Notes. In addition, during second-quarter 2011, we made open-market purchases of $35 million of our 9.5% Senior NotesDividends and repaid the remaining $85 million of our 8.75% Senior Notes, which matured in June 2011 (refer to Note 5 for further discussion).
Annual interest cost savings associated with debt repayments since January 1, 2009, including the first-quarter 2012 refinancing transaction, approximate $415 millionOther Equity Transactions. per year, basedWe paid dividends on current interest rates.
We have an open-market share purchase program for up to 30 million shares, of which 23.7 million shares remain available. There have been no purchases since 2008. The timing of future purchases of our common stock is dependent on many factors, including our operating results, cash flows and financial position; copper, gold and molybdenum prices; the price of our common shares; future development and expansion opportunities; and general economic and market conditions.
Dividends. We paid common stock dividends totaling $832297 million for the first nine months offirst-quarter 20122013 and $1.2 billion238 million for the first nine months offirst-quarter 20112012 (which included $474 million for a supplemental common stock dividend paid in June 2011).
The current annual dividend rate for our common stock is $1.25$1.25 per share ($0.3125 per share quarterly). Refer to Note 56 for further discussion. The declaration of dividends is at the discretion of the Board and will depend upon our financial results, cash requirements, future prospects, the impact of pending acquisitions and other factors deemed relevant by the Board. The Board will continue to review our financial policy on an ongoing basis.
Cash dividends and other distributions paid to noncontrolling interests primarily include the noncontrolling interest owners of PT Freeport Indonesia and our South America mines, and totaled $7635 million for thein first nine months offirst-quarter 20122013 and $3501 million forin first-quarter2012. Higher noncontrolling interest payments in first-quarter2013, compared with first-quarter2012, primarily reflected higher dividends to the first nine monthsnoncontrolling interest holders of2011. our South America mining operations.
CONTRACTUAL OBLIGATIONS
ThereExcept for the issuance of our $6.5 billion senior notes in March 2013, there have been no material changes in our contractual obligations since year-endthe end of 20112012. Refer to Item 7 in our annual report on Form 10-K for the year ended December 31, 20112012, for further information regarding our contractual obligations.
CONTINGENCIES
Environmental and Reclamation Matters
Our mining, exploration, production and historical operating activities are subject to stringent laws and regulations governing the protection of the environment. We perform a comprehensive annual review of our environmental and reclamation obligations and also review changes in facts and circumstances associated with our environmental and reclamationthese obligations at least quarterly. There have been no material changes to our environmental and reclamation obligations since year-endthe end of 20112012. However,; however, updated cost assumptions, including increases and decreases to cost estimates, changes in the anticipated scope and timing of remediation activities and settlement of environmental matters may result in revisions to certain of our environmental obligations. As a result, weWe recorded adjustments to environmental obligations totaling a net creditscredit of $821 million in third-quarterfirst-quarter2013, and there were no adjustments to environmental obligations in first-quarter 2012 and .$36 million during the first nine months of2012, compared with net charges
Refer to Note 13 in our annual report on Form 10-K for the year ended December 31, 2011, for further information regarding our environmental and reclamation obligations.
Litigation and Other Contingencies
Other than as disclosed in Note 8 and Part II, Item 1. "Legal Proceedings" of our quarterly reports on Form 10-Q for the periods ended June 30, 2012, and March 31, 2012, there have been no material changes to our contingencies associated with legal proceedings and other matters since year-end 2011. Refer to Note 13 in our annual report on Form 10-K for the year ended December 31, 20112012, for further information regarding our environmental and reclamation obligations.
Litigation and Other Contingencies
Other than as disclosed in Note 9 and contained in "Legal Proceedings" in Part II, Item 1. of this quarterly report, there have been no material changes to our contingencies associated with legal proceedings and other matters since the end of 2012. Refer to Note 13 and "Legal Proceedings" contained in Part I, Item 3. of our annual report on Form 10-K for the year ended December 31, 2012, for further information regarding legal proceedings and other matters.
NEW ACCOUNTING STANDARDS
We do not expect the impact of recently issued accounting standards to have a significant impact on our future financial statements and disclosures.
PRODUCT REVENUES AND PRODUCTION COSTS
Unit net cash costs per pound of copper and molybdenum are measures intended to provide investors with information about the cash-generating capacity of our mining operations expressed on a basis relating to the primary metal product for the respective operations. We use this measure for the same purpose and for monitoring operating performance by our mining operations. This information differs from measures of performance determined in accordance with U.S. GAAP and should not be considered in isolation or as a substitute for measures of performance determined in accordance with U.S. GAAP. This measure is presented by other metals mining
companies, although our measures may not be comparable to similarly titled measures reported by other companies.
We present gross profit per pound of copper in the following tables using both a “by-product” method and a “co-product” method. We use the by-product method in our presentation of gross profit per pound of copper because (i) the majority of our revenues are copper revenues, (ii) we mine ore, which contains copper, gold, molybdenum and other metals, (iii) it is not possible to specifically assign all of our costs to revenues from the copper, gold, molybdenum and other metals we produce, (iv) it is the method used to compare mining operations in certain industry publications and (v) it is the method used by our management and the Board to monitor operations. In the co-product method presentation below, shared costs are allocated to the different products based on their relative revenue values, which will vary to the extent our metals sales volumes and realized prices change.
We show revenue adjustments for prior period open sales as separate line items. Because these adjustments do not result from current period sales, we have reflected these separately from revenues on current period sales. Noncash and other costs consist of items such as stock-based compensation costs, start-up costs, write-offs of equipment and/or unusual charges. They are removed from site production and delivery costs in the calculation of unit net cash costs. As discussed above, gold, molybdenum and other metal revenues at copper mines are reflected as credits against site production and delivery costs in the by-product method. Following are presentations under both the by-product and co-product methods together with reconciliations to amounts reported in our consolidated financial statements.
North America Copper Mines Product Revenues and Production Costs
| | | Three Months Ended September 30, 2012 | | | | |
| Three Months Ended March 31, 2013 | | | | |
| (In millions) | By-Product | | Co-Product Method | By-Product | | Co-Product Method |
| | Method | | Copper | | Molybdenuma | | Otherb | | Total | Method | | Copper | | Molybdenuma | | Otherb | | Total |
| Revenues, excluding adjustments | $ | 1,183 |
| | $ | 1,183 |
| | $ | 103 |
| | $ | 21 |
| | $ | 1,307 |
| $ | 1,270 |
| | $ | 1,270 |
| | $ | 93 |
| | $ | 20 |
| | $ | 1,383 |
|
| | | | | | | | | | | |
| Site production and delivery, before net noncash and other costs shown below | 649 |
| | 584 |
| | 71 |
| | 13 |
| | 668 |
| 703 |
| | 685 |
| | 26 |
| | 12 |
| | 723 |
|
By-product creditsa | (105 | ) | | — |
| | — |
| | — |
| | — |
| (93 | ) | | — |
| | — |
| | — |
| | — |
|
| Treatment charges | 40 |
| | 39 |
| | — |
| | 1 |
| | 40 |
| 45 |
| | 44 |
| | — |
| | 1 |
| | 45 |
|
| Net cash costs | 584 |
| | 623 |
| | 71 |
| | 14 |
| | 708 |
| 655 |
| | 729 |
| | 26 |
| | 13 |
| | 768 |
|
| Depreciation, depletion and amortization | 84 |
| | 78 |
| | 5 |
| | 1 |
| | 84 |
| 98 |
| | 95 |
| | 1 |
| | 2 |
| | 98 |
|
| Noncash and other costs, net | 40 |
| | 38 |
| | 1 |
| | 1 |
| | 40 |
| 33 |
| | 32 |
| | 1 |
| | — |
| | 33 |
|
| Total costs | 708 |
| | 739 |
| | 77 |
| | 16 |
| | 832 |
| 786 |
| | 856 |
| | 28 |
| | 15 |
| | 899 |
|
| Revenue adjustments, primarily for pricing on prior period open sales | 5 |
| | 5 |
| | — |
| | — |
| | 5 |
| (2 | ) | | (2 | ) | | — |
| | — |
| | (2 | ) |
| Gross profit | $ | 480 |
| | $ | 449 |
| | $ | 26 |
| | $ | 5 |
| | $ | 480 |
| $ | 482 |
| | $ | 412 |
| | $ | 65 |
| | $ | 5 |
| | $ | 482 |
|
| | | | | | | | | | | | | | | | | | | |
| Reconciliation to Amounts Reported | | | | | | | | | | | | | | | | | | |
| | Revenues | | Production and Delivery | | Depreciation, Depletion and Amortization | | | | | Revenues | | Production and Delivery | | Depreciation, Depletion and Amortization | | | | |
| Totals presented above | $ | 1,307 |
| | $ | 668 |
| | $ | 84 |
| | | | | $ | 1,383 |
| | $ | 723 |
| | $ | 98 |
| | | | |
| Treatment charges | N/A |
| | 40 |
| | N/A |
| | | | | — |
| | 45 |
| | — |
| | | | |
| Net noncash and other costs | N/A |
| | 40 |
| | N/A |
| | | | | — |
| | 33 |
| | — |
| | | | |
| Revenue adjustments, primarily for pricing on prior period open sales | 5 |
| | N/A |
| | N/A |
| | | | | (2 | ) | | — |
| | — |
| | | | |
| Eliminations and other | 4 |
| | 12 |
| | 4 |
| | | | | 8 |
| | 10 |
| | 4 |
| | | | |
| North America copper mines | 1,316 |
| | 760 |
| | 88 |
| | | | | 1,389 |
| | 811 |
| | 102 |
| | | | |
| South America mining | 1,192 |
| | 530 |
| | 74 |
| | | | | 1,014 |
| | 475 |
| | 71 |
| | | | |
| Indonesia mining | 991 |
| | 587 |
| | 54 |
| | | | | 931 |
| | 563 |
| | 55 |
| | | | |
| Africa mining | 367 |
| | 172 |
| | 42 |
| | | | | 438 |
| | 185 |
| | 58 |
| | | | |
| Molybdenum | 308 |
| | 273 |
| | 18 |
| | | | | |
| Molybdenum mines | | 143 |
| | 80 |
| | 20 |
| | | | |
| Rod & Refining | 1,228 |
| | 1,222 |
| | 2 |
| | | | | 1,337 |
| | 1,328 |
| | 3 |
| | | | |
| Atlantic Copper Smelting & Refining | 638 |
| | 624 |
| | 11 |
| | | | | 639 |
| | 628 |
| | 10 |
| | | | |
| Corporate, other & eliminations | (1,623 | ) | | (1,576 | ) | | 9 |
| | | | | (1,308 | ) | | (1,351 | ) | | 10 |
| | | | |
| As reported in FCX’s consolidated financial statements | $ | 4,417 |
| | $ | 2,592 |
| | $ | 298 |
| | | | | $ | 4,583 |
| | $ | 2,719 |
| | $ | 329 |
| | | | |
| |
| a. | Molybdenum credits and revenues reflect volumes produced at market-based pricing and also include tolling revenues at Sierrita. pricing. |
| |
| b. | Includes gold and silver product revenues and production costs. |
North America Copper Mines Product Revenues and Production Costs (continued)
| | | Three Months Ended September 30, 2011 | | | | |
| Three Months Ended March 31, 2012 | | | | |
| (In millions) | By-Product | | Co-Product Method | By-Product | | Co-Product Method |
| | Method | | Copper | | Molybdenuma | | Otherb | | Total | Method | | Copper | | Molybdenuma | | Otherb | | Total |
| Revenues, excluding adjustments | $ | 1,240 |
| | $ | 1,240 |
| | $ | 146 |
| | $ | 40 |
| | $ | 1,426 |
| $ | 1,287 |
| | $ | 1,287 |
| | $ | 136 |
| | $ | 21 |
| | $ | 1,444 |
|
| | | | | | | | | | | |
| Site production and delivery, before net noncash and other costs shown below | 569 |
| | 506 |
| | 64 |
| | 15 |
| | 585 |
| 607 |
| | 584 |
| | 29 |
| | 12 |
| | 625 |
|
By-product creditsa | (170 | ) | | — |
| | — |
| | — |
| | — |
| (139 | ) | | — |
| | — |
| | — |
| | — |
|
| Treatment charges | 36 |
| | 34 |
| | — |
| | 2 |
| | 36 |
| 41 |
| | 39 |
| | — |
| | 2 |
| | 41 |
|
| Net cash costs | 435 |
| | 540 |
| | 64 |
| | 17 |
| | 621 |
| 509 |
| | 623 |
| | 29 |
| | 14 |
| | 666 |
|
| Depreciation, depletion and amortization | 64 |
| | 59 |
| | 4 |
| | 1 |
| | 64 |
| 89 |
| | 86 |
| | 2 |
| | 1 |
| | 89 |
|
| Noncash and other costs, net | 31 |
| | 31 |
| | — |
| | — |
| | 31 |
| 21 |
| | 21 |
| | — |
| | — |
| | 21 |
|
| Total costs | 530 |
| | 630 |
| | 68 |
| | 18 |
| | 716 |
| 619 |
| | 730 |
| | 31 |
| | 15 |
| | 776 |
|
| Revenue adjustments, primarily for pricing on prior period open sales | (11 | ) | | (11 | ) | | — |
| | — |
| | (11 | ) | 9 |
| | 9 |
| | — |
| | — |
| | 9 |
|
| Gross profit | $ | 699 |
| | $ | 599 |
| | $ | 78 |
| | $ | 22 |
| | $ | 699 |
| $ | 677 |
| | $ | 566 |
| | $ | 105 |
| | $ | 6 |
| | $ | 677 |
|
| | | | | | | | | | | | | | | | | | | |
| Reconciliation to Amounts Reported | | | | | | | | | | | | | | | | | | |
| | Revenues | | Production and Delivery | | Depreciation, Depletion and Amortization | | | | | Revenues | | Production and Delivery | | Depreciation, Depletion and Amortization | | | | |
| Totals presented above | $ | 1,426 |
| | $ | 585 |
| | $ | 64 |
| | | | | $ | 1,444 |
| | $ | 625 |
| | $ | 89 |
| | | | |
| Treatment charges | N/A |
| | 36 |
| | N/A |
| | | | | — |
| | 41 |
| | — |
| | | | |
| Net noncash and other costs | N/A |
| | 31 |
| | N/A |
| | | | | — |
| | 21 |
| | — |
| | | | |
| Revenue adjustments, primarily for pricing on prior period open sales | (11 | ) | | N/A |
| | N/A |
| | | | | 9 |
| | — |
| | — |
| | | | |
| Eliminations and other | 4 |
| | 12 |
| | 3 |
| | | | | 3 |
| | 20 |
| | 4 |
| | | | |
| North America copper mines | 1,419 |
| | 664 |
| | 67 |
| | | | | 1,456 |
| | 707 |
| | 93 |
| | | | |
| South America mining | 1,053 |
| | 478 |
| | 64 |
| | | | | 1,254 |
| | 463 |
| | 62 |
| | | | |
| Indonesia mining | 1,362 |
| | 503 |
| | 62 |
| | | | | 950 |
| | 515 |
| | 46 |
| | | | |
| Africa mining | 276 |
| | 142 |
| | 32 |
| | | | | 305 |
| | 132 |
| | 32 |
| | | | |
| Molybdenum | 332 |
| | 260 |
| | 14 |
| | | | | |
| Molybdenum mines | | 126 |
| | 70 |
| | 11 |
| | | | |
| Rod & Refining | 1,396 |
| | 1,390 |
| | 2 |
| | | | | 1,304 |
| | 1,297 |
| | 2 |
| | | | |
| Atlantic Copper Smelting & Refining | 837 |
| | 826 |
| | 11 |
| | | | | 712 |
| | 695 |
| | 10 |
| | | | |
| Corporate, other & eliminations | (1,480 | ) | | (1,693 | ) | | 5 |
| | | | | (1,502 | ) | | (1,451 | ) | | 11 |
| | | | |
| As reported in FCX’s consolidated financial statements | $ | 5,195 |
| | $ | 2,570 |
| | $ | 257 |
| | | | | $ | 4,605 |
| | $ | 2,428 |
| | $ | 267 |
| | | | |
| |
| a. | Molybdenum credits and revenues reflect volumes produced at market-based pricing and also include tolling revenues at Sierrita. pricing. |
| |
| b. | Includes gold and silver product revenues and production costs. |
North America Copper Mines Product Revenues and Production Costs (continued)
|
| | | | | | | | | | | | | | | | | | | |
| Nine Months Ended September 30, 2012 | | | |
| (In millions) | By-Product | | Co-Product Method |
| | Method | | Copper | | Molybdenuma | | Otherb | | Total |
| Revenues, excluding adjustments | $ | 3,755 |
| | $ | 3,755 |
| | $ | 363 |
| | $ | 63 |
| | $ | 4,181 |
|
| | | | | | | | | | |
| Site production and delivery, before net noncash and other costs shown below | 1,932 |
| | 1,782 |
| | 165 |
| | 37 |
| | 1,984 |
|
By-product creditsa | (374 | ) | | — |
| | — |
| | — |
| | — |
|
| Treatment charges | 120 |
| | 115 |
| | — |
| | 5 |
| | 120 |
|
| Net cash costs | 1,678 |
| | 1,897 |
| | 165 |
| | 42 |
| | 2,104 |
|
| Depreciation, depletion and amortization | 262 |
| | 247 |
| | 12 |
| | 3 |
| | 262 |
|
| Noncash and other costs, net | 98 |
| | 95 |
| | 2 |
| | 1 |
| | 98 |
|
| Total costs | 2,038 |
| | 2,239 |
| | 179 |
| | 46 |
| | 2,464 |
|
| Revenue adjustments, primarily for pricing on prior period open sales | 6 |
| | 6 |
| | — |
| | — |
| | 6 |
|
| Gross profit | $ | 1,723 |
| | $ | 1,522 |
| | $ | 184 |
| | $ | 17 |
| | $ | 1,723 |
|
| | | | | | | | | | |
| Reconciliation to Amounts Reported | | | | | | | | | |
| | Revenues | | Production and Delivery | | Depreciation, Depletion and Amortization | | | | |
| Totals presented above | $ | 4,181 |
| | $ | 1,984 |
| | $ | 262 |
| | | | |
| Treatment charges | N/A |
| | 120 |
| | N/A |
| | | | |
| Net noncash and other costs | N/A |
| | 98 |
| | N/A |
| | | | |
| Revenue adjustments, primarily for pricing on prior period open sales | 6 |
| | N/A |
| | N/A |
| | | | |
| Eliminations and other | 12 |
| | 47 |
| | 13 |
| | | | |
| North America copper mines | 4,199 |
| | 2,249 |
| | 275 |
| | | | |
| South America mining | 3,462 |
| | 1,483 |
| | 208 |
| | | | |
| Indonesia mining | 2,897 |
| | 1,676 |
| | 153 |
| | | | |
| Africa mining | 994 |
| | 456 |
| | 114 |
| | | | |
| Molybdenum | 982 |
| | 812 |
| | 47 |
| | | | |
| Rod & Refining | 3,822 |
| | 3,800 |
| | 7 |
| | | | |
| Atlantic Copper Smelting & Refining | 2,045 |
| | 1,988 |
| | 31 |
| | | | |
| Corporate, other & eliminations | (4,904 | ) | | (4,822 | ) | | 21 |
| | | | |
| As reported in FCX’s consolidated financial statements | $ | 13,497 |
| | $ | 7,642 |
| | $ | 856 |
| | | | |
| |
a. | Molybdenum credits and revenues reflect volumes produced at market-based pricing and also include tolling revenues at Sierrita. |
| |
b. | Includes gold and silver product revenues and production costs. |
North America Copper Mines Product Revenues and Production Costs (continued)
|
| | | | | | | | | | | | | | | | | | | |
| Nine Months Ended September 30, 2011 | | | |
| (In millions) | By-Product | | Co-Product Method |
| | Method | | Copper | | Molybdenuma | | Otherb | | Total |
| Revenues, excluding adjustments | $ | 3,820 |
| | $ | 3,820 |
| | $ | 429 |
| | $ | 84 |
| | $ | 4,333 |
|
| | | | | | | | | | |
| Site production and delivery, before net noncash and other costs shown below | 1,637 |
| | 1,466 |
| | 178 |
| | 33 |
| | 1,677 |
|
By-product creditsa | (473 | ) | | — |
| | — |
| | — |
| | — |
|
| Treatment charges | 97 |
| | 93 |
| | — |
| | 4 |
| | 97 |
|
| Net cash costs | 1,261 |
| | 1,559 |
| | 178 |
| | 37 |
| | 1,774 |
|
| Depreciation, depletion and amortization | 185 |
| | 173 |
| | 10 |
| | 2 |
| | 185 |
|
| Noncash and other costs, net | 117 |
| | 114 |
| | 2 |
| | 1 |
| | 117 |
|
| Total costs | 1,563 |
| | 1,846 |
| | 190 |
| | 40 |
| | 2,076 |
|
| Revenue adjustments, primarily for pricing on prior period open sales | (1 | ) | | (1 | ) | | — |
| | — |
| | (1 | ) |
| Gross profit | $ | 2,256 |
| | $ | 1,973 |
| | $ | 239 |
| | $ | 44 |
| | $ | 2,256 |
|
| | | | | | | | | | |
| Reconciliation to Amounts Reported | | | | | | | | | |
| | Revenues | | Production and Delivery | | Depreciation, Depletion and Amortization | | | | |
| Totals presented above | $ | 4,333 |
| | $ | 1,677 |
| | $ | 185 |
| | | | |
| Treatment charges | N/A |
| | 97 |
| | N/A |
| | | | |
| Net noncash and other costs | N/A |
| | 117 |
| | N/A |
| | | | |
| Revenue adjustments, primarily for pricing on prior period open sales | (1 | ) | | N/A |
| | N/A |
| | | | |
| Eliminations and other | 7 |
| | 32 |
| | 11 |
| | | | |
| North America copper mines | 4,339 |
| | 1,923 |
| | 196 |
| | | | |
| South America mining | 3,903 |
| | 1,330 |
| | 187 |
| | | | |
| Indonesia mining | 4,656 |
| | 1,547 |
| | 179 |
| | | | |
| Africa mining | 963 |
| | 422 |
| | 98 |
| | | | |
| Molybdenum | 1,119 |
| | 786 |
| | 44 |
| | | | |
| Rod & Refining | 4,310 |
| | 4,292 |
| | 6 |
| | | | |
| Atlantic Copper Smelting & Refining | 2,252 |
| | 2,274 |
| | 30 |
| | | | |
| Corporate, other & eliminations | (4,824 | ) | | (5,070 | ) | | 16 |
| | | | |
| As reported in FCX’s consolidated financial statements | $ | 16,718 |
| | $ | 7,504 |
| | $ | 756 |
| | | | |
| |
a. | Molybdenum credits and revenues reflect volumes produced at market-based pricing and also include tolling revenues at Sierrita. |
| |
b. | Includes gold and silver product revenues and production costs. |
South America Mining Product Revenues and Production Costs
| | | Three Months Ended September 30, 2012 | | | | | | | | |
| Three Months Ended March 31, 2013 | | | | | | | | |
| (In millions) | By-Product | | Co-Product Method | By-Product | | Co-Product Method |
| | Method | | Copper | | Other | | Total | Method | | Copper | | Other | | Total |
| Revenues, excluding adjustments | $ | 1,132 |
| | $ | 1,132 |
| | $ | 84 |
| a | $ | 1,216 |
| $ | 993 |
| | $ | 993 |
| | $ | 87 |
| a | $ | 1,080 |
|
| | | | | | | | | |
| Site production and delivery, before net noncash and other costs shown below | 503 |
| | 464 |
| | 45 |
| | 509 |
| 462 |
| | 425 |
| | 41 |
| | 466 |
|
| By-product credits | (78 | ) | | — |
| | — |
| | — |
| (83 | ) | | — |
| | — |
| | — |
|
| Treatment charges | 52 |
| | 52 |
| | — |
| | 52 |
| 50 |
| | 50 |
| | — |
| | 50 |
|
| Net cash costs | 477 |
| | 516 |
| | 45 |
| | 561 |
| 429 |
| | 475 |
| | 41 |
| | 516 |
|
| Depreciation, depletion and amortization | 74 |
| | 71 |
| | 3 |
| | 74 |
| 71 |
| | 67 |
| | 4 |
| | 71 |
|
| Noncash and other costs, net | 22 |
| | 14 |
| | 8 |
| | 22 |
| 16 |
| | 8 |
| | 8 |
| | 16 |
|
| Total costs | 573 |
| | 601 |
| | 56 |
| | 657 |
| 516 |
| | 550 |
| | 53 |
| | 603 |
|
| Revenue adjustments, primarily for pricing on prior period open sales | 23 |
| | 23 |
| | — |
| | 23 |
| (15 | ) | | (15 | ) | | — |
| | (15 | ) |
| Gross profit | $ | 582 |
| | $ | 554 |
| | $ | 28 |
| | $ | 582 |
| $ | 462 |
| | $ | 428 |
| | $ | 34 |
| | $ | 462 |
|
| | | | | | | | | | | | | | | |
| Reconciliation to Amounts Reported | | | | | | | | | | | | | | |
| | Revenues | | Production and Delivery | | Depreciation, Depletion and Amortization | | | Revenues | | Production and Delivery | | Depreciation, Depletion and Amortization | | |
| Totals presented above | $ | 1,216 |
| | $ | 509 |
| | $ | 74 |
| | | $ | 1,080 |
| | $ | 466 |
| | $ | 71 |
| | |
| Treatment charges | (52 | ) | | N/A |
| | N/A |
| | | (50 | ) | | — |
| | — |
| | |
| Net noncash and other costs | N/A |
| | 22 |
| | N/A |
| | | — |
| | 16 |
| | — |
| | |
| Revenue adjustments, primarily for pricing on prior period open sales | 23 |
| | N/A |
| | N/A |
| | | (15 | ) | | — |
| | — |
| | |
| Eliminations and other | 5 |
| | (1 | ) | | — |
| | | (1 | ) | | (7 | ) | | — |
| | |
| South America mining | 1,192 |
| | 530 |
| | 74 |
| | | 1,014 |
| | 475 |
| | 71 |
| | |
| North America copper mines | 1,316 |
| | 760 |
| | 88 |
| | | 1,389 |
| | 811 |
| | 102 |
| | |
| Indonesia mining | 991 |
| | 587 |
| | 54 |
| | | 931 |
| | 563 |
| | 55 |
| | |
| Africa mining | 367 |
| | 172 |
| | 42 |
| | | 438 |
| | 185 |
| | 58 |
| | |
| Molybdenum | 308 |
| | 273 |
| | 18 |
| | | |
| Molybdenum mines | | 143 |
| | 80 |
| | 20 |
| | |
| Rod & Refining | 1,228 |
| | 1,222 |
| | 2 |
| | | 1,337 |
| | 1,328 |
| | 3 |
| | |
| Atlantic Copper Smelting & Refining | 638 |
| | 624 |
| | 11 |
| | | 639 |
| | 628 |
| | 10 |
| | |
| Corporate, other & eliminations | (1,623 | ) | | (1,576 | ) | | 9 |
| | | (1,308 | ) | | (1,351 | ) | | 10 |
| | |
| As reported in FCX’s consolidated financial statements | $ | 4,417 |
| | $ | 2,592 |
| | $ | 298 |
| | | $ | 4,583 |
| | $ | 2,719 |
| | $ | 329 |
| | |
| |
| a. | Includes gold sales of 21 thousand ounces ($1,7361,617 per ounce average realized price), silver sales of 811988 thousand ounces ($27.9930.45 per ounce average realized price) and; also includes sales of Cerro Verde production to our molybdenum sales of 2 million pounds ($9.719.74 per pound average realized price), which reflects molybdenum produced by Cerro Verde at market-based pricing. |
South America Mining Product Revenues and Production Costs (continued)
| | | Three Months Ended September 30, 2011 | | | | | | | | |
| Three Months Ended March 31, 2012 | | | | | | | | |
| (In millions) | By-Product | | Co-Product Method | By-Product | | Co-Product Method |
| | Method | | Copper | | Other | | Total | Method | | Copper | | Other | | Total |
| Revenues, excluding adjustments | $ | 1,112 |
| | $ | 1,112 |
| | $ | 124 |
| a | $ | 1,236 |
| $ | 1,098 |
| | $ | 1,098 |
| | $ | 90 |
| a | $ | 1,188 |
|
| | | | | | | | | |
| Site production and delivery, before net noncash and other costs shown below | 445 |
| | 402 |
| | 50 |
| | 452 |
| 439 |
| | 405 |
| | 40 |
| | 445 |
|
| By-product credits | (117 | ) | | — |
| | — |
| | — |
| (84 | ) | | — |
| | — |
| | — |
|
| Treatment charges | 43 |
| | 43 |
| | — |
| | 43 |
| 47 |
| | 47 |
| | — |
| | 47 |
|
| Net cash costs | 371 |
| | 445 |
| | 50 |
| | 495 |
| 402 |
| | 452 |
| | 40 |
| | 492 |
|
| Depreciation, depletion and amortization | 64 |
| | 60 |
| | 4 |
| | 64 |
| 62 |
| | 59 |
| | 3 |
| | 62 |
|
| Noncash and other costs, net | 27 |
| | 22 |
| | 5 |
| | 27 |
| 21 |
| | 13 |
| | 8 |
| | 21 |
|
| Total costs | 462 |
| | 527 |
| | 59 |
| | 586 |
| 485 |
| | 524 |
| | 51 |
| | 575 |
|
| Revenue adjustments, primarily for pricing on prior period open sales | (147 | ) | | (147 | ) | | — |
| | (147 | ) | 110 |
| | 109 |
| | 1 |
| | 110 |
|
| Gross profit | $ | 503 |
| | $ | 438 |
| | $ | 65 |
| | $ | 503 |
| $ | 723 |
| | $ | 683 |
| | $ | 40 |
| | $ | 723 |
|
| | | | | | | | | | | | | | | |
| Reconciliation to Amounts Reported | | | | | | | | | | | | | | |
| | Revenues | | Production and Delivery | | Depreciation, Depletion and Amortization | | | Revenues | | Production and Delivery | | Depreciation, Depletion and Amortization | | |
| Totals presented above | $ | 1,236 |
| | $ | 452 |
| | $ | 64 |
| | | $ | 1,188 |
| | $ | 445 |
| | $ | 62 |
| | |
| Treatment charges | (43 | ) | | N/A |
| | N/A |
| | | (47 | ) | | — |
| | — |
| | |
| Net noncash and other costs | N/A |
| | 27 |
| | N/A |
| | | — |
| | 21 |
| | — |
| | |
| Revenue adjustments, primarily for pricing on prior period open sales | (147 | ) | | N/A |
| | N/A |
| | | 110 |
| | — |
| | — |
| | |
| Eliminations and other | 7 |
| | (1 | ) | | — |
| | | 3 |
| | (3 | ) | | — |
| | |
| South America mining | 1,053 |
| | 478 |
| | 64 |
| | | 1,254 |
| | 463 |
| | 62 |
| | |
| North America copper mines | 1,419 |
| | 664 |
| | 67 |
| | | 1,456 |
| | 707 |
| | 93 |
| | |
| Indonesia mining | 1,362 |
| | 503 |
| | 62 |
| | | 950 |
| | 515 |
| | 46 |
| | |
| Africa mining | 276 |
| | 142 |
| | 32 |
| | | 305 |
| | 132 |
| | 32 |
| | |
| Molybdenum | 332 |
| | 260 |
| | 14 |
| | | |
| Molybdenum mines | | 126 |
| | 70 |
| | 11 |
| | |
| Rod & Refining | 1,396 |
| | 1,390 |
| | 2 |
| | | 1,304 |
| | 1,297 |
| | 2 |
| | |
| Atlantic Copper Smelting & Refining | 837 |
| | 826 |
| | 11 |
| | | 712 |
| | 695 |
| | 10 |
| | |
| Corporate, other & eliminations | (1,480 | ) | | (1,693 | ) | | 5 |
| | | (1,502 | ) | | (1,451 | ) | | 11 |
| | |
| As reported in FCX’s consolidated financial statements | $ | 5,195 |
| | $ | 2,570 |
| | $ | 257 |
| | | $ | 4,605 |
| | $ | 2,428 |
| | $ | 267 |
| | |
| |
| a. | Includes gold sales of 2319 thousand ounces ($1,6641,680 per ounce average realized price), silver sales of 834698 thousand ounces ($40.7530.32 per ounce average realized price) and; also includes sales of Cerro Verde production to our molybdenum sales company of 2 million pounds ($13.53 per pound average realized price), which reflects molybdenum produced by Cerro Verde at market-based pricing. |
South America Mining Product Revenues and Production Costs (continued)
|
| | | | | | | | | | | | | | | |
| Nine Months Ended September 30, 2012 | | | | | | | |
| (In millions) | By-Product | | Co-Product Method |
| | Method | | Copper | | Other | | Total |
| Revenues, excluding adjustments | $ | 3,247 |
| | $ | 3,247 |
| | $ | 249 |
| a | $ | 3,496 |
|
| | | | | | | | |
| Site production and delivery, before net noncash and other costs shown below | 1,411 |
| | 1,307 |
| | 122 |
| | 1,429 |
|
| By-product credits | (231 | ) | | — |
| | — |
| | — |
|
| Treatment charges | 147 |
| | 147 |
| | — |
| | 147 |
|
| Net cash costs | 1,327 |
| | 1,454 |
| | 122 |
| | 1,576 |
|
| Depreciation, depletion and amortization | 208 |
| | 197 |
| | 11 |
| | 208 |
|
| Noncash and other costs, net | 63 |
| | 41 |
| | 22 |
| | 63 |
|
| Total costs | 1,598 |
| | 1,692 |
| | 155 |
| | 1,847 |
|
| Revenue adjustments, primarily for pricing on prior period open sales | 105 |
| | 105 |
| | — |
| | 105 |
|
| Gross profit | $ | 1,754 |
| | $ | 1,660 |
| | $ | 94 |
| | $ | 1,754 |
|
| | | | | | | | |
| Reconciliation to Amounts Reported | | | | | | | |
| | Revenues | | Production and Delivery | | Depreciation, Depletion and Amortization | | |
| Totals presented above | $ | 3,496 |
| | $ | 1,429 |
| | $ | 208 |
| | |
| Treatment charges | (147 | ) | | N/A |
| | N/A |
| | |
| Net noncash and other costs | N/A |
| | 63 |
| | N/A |
| | |
| Revenue adjustments, primarily for pricing on prior period open sales | 105 |
| | N/A |
| | N/A |
| | |
| Eliminations and other | 8 |
| | (9 | ) | | — |
| | |
| South America mining | 3,462 |
| | 1,483 |
| | 208 |
| | |
| North America copper mines | 4,199 |
| | 2,249 |
| | 275 |
| | |
| Indonesia mining | 2,897 |
| | 1,676 |
| | 153 |
| | |
| Africa mining | 994 |
| | 456 |
| | 114 |
| | |
| Molybdenum | 982 |
| | 812 |
| | 47 |
| | |
| Rod & Refining | 3,822 |
| | 3,800 |
| | 7 |
| | |
| Atlantic Copper Smelting & Refining | 2,045 |
| | 1,988 |
| | 31 |
| | |
| Corporate, other & eliminations | (4,904 | ) | | (4,822 | ) | | 21 |
| | |
| As reported in FCX’s consolidated financial statements | $ | 13,497 |
| | $ | 7,642 |
| | $ | 856 |
| | |
| |
a. | Includes gold sales of 56 thousand ounces ($1,678 per ounce average realized price), silver sales of 2.2 million ounces ($28.84 per ounce average realized price) and molybdenum sales of 6 million pounds ($11.2612.35 per pound average realized price), which reflects molybdenum produced by Cerro Verde at market-based pricing.
|
South America Mining Product Revenues and Production Costs (continued)
|
| | | | | | | | | | | | | | | |
| Nine Months Ended September 30, 2011 | | | | | | | |
| (In millions) | By-Product | | Co-Product Method |
| | Method | | Copper | | Other | | Total |
| Revenues, excluding adjustments | $ | 3,688 |
| | $ | 3,688 |
| | $ | 372 |
| a | $ | 4,060 |
|
| | | | | | | | |
| Site production and delivery, before net noncash and other costs shown below | 1,268 |
| | 1,159 |
| | 128 |
| | 1,287 |
|
| By-product credits | (353 | ) | | — |
| | — |
| | — |
|
| Treatment charges | 164 |
| | 164 |
| | — |
| | 164 |
|
| Net cash costs | 1,079 |
| | 1,323 |
| | 128 |
| | 1,451 |
|
| Depreciation, depletion and amortization | 187 |
| | 175 |
| | 12 |
| | 187 |
|
| Noncash and other costs, net | 68 |
| | 60 |
| | 8 |
| | 68 |
|
| Total costs | 1,334 |
| | 1,558 |
| | 148 |
| | 1,706 |
|
| Revenue adjustments, primarily for pricing on prior period open sales | 14 |
| | (6 | ) | | 20 |
| | 14 |
|
| Gross profit | $ | 2,368 |
| | $ | 2,124 |
| | $ | 244 |
| | $ | 2,368 |
|
| | | | | | | | |
| Reconciliation to Amounts Reported | | | | | | | |
| | Revenues | | Production and Delivery | | Depreciation, Depletion and Amortization | | |
| Totals presented above | $ | 4,060 |
| | $ | 1,287 |
| | $ | 187 |
| | |
| Treatment charges | (164 | ) | | N/A |
| | N/A |
| | |
| Net noncash and other costs | N/A |
| | 68 |
| | N/A |
| | |
| Revenue adjustments, primarily for pricing on prior period open sales | 14 |
| | N/A |
| | N/A |
| | |
| Eliminations and other | (7 | ) | | (25 | ) | | — |
| | |
| South America mining | 3,903 |
| | 1,330 |
| | 187 |
| | |
| North America copper mines | 4,339 |
| | 1,923 |
| | 196 |
| | |
| Indonesia mining | 4,656 |
| | 1,547 |
| | 179 |
| | |
| Africa mining | 963 |
| | 422 |
| | 98 |
| | |
| Molybdenum | 1,119 |
| | 786 |
| | 44 |
| | |
| Rod & Refining | 4,310 |
| | 4,292 |
| | 6 |
| | |
| Atlantic Copper Smelting & Refining | 2,252 |
| | 2,274 |
| | 30 |
| | |
| Corporate, other & eliminations | (4,824 | ) | | (5,070 | ) | | 16 |
| | |
| As reported in FCX’s consolidated financial statements | $ | 16,718 |
| | $ | 7,504 |
| | $ | 756 |
| | |
| |
a. | Includes gold sales of 72 thousand ounces ($1,556 per ounce average realized price), silver sales of 2.3 million ounces ($38.70 per ounce average realized price) and molybdenum sales of 8 million pounds ($14.59 per pound average realized price), which reflects molybdenum produced by Cerro Verde at market-based pricing.
|
Indonesia Mining Product Revenues and Production Costs
| | | Three Months Ended September 30, 2012 | | | | |
| Three Months Ended March 31, 2013 | | | | |
| (In millions) | By-Product | | Co-Product Method | By-Product | | Co-Product Method |
| | Method | | Copper | | Gold | | Silver | | Total | Method | | Copper | | Gold | | Silver | | Total |
| Revenues, excluding adjustments | $ | 729 |
| | $ | 729 |
| | $ | 307 |
| | $ | 15 |
| a | $ | 1,051 |
| $ | 680 |
| | $ | 680 |
| | $ | 307 |
| | $ | 16 |
| a | $ | 1,003 |
|
| | | | | | | | | | | |
| Site production and delivery, before net noncash and other costs shown below | 578 |
| | 401 |
| | 169 |
| | 8 |
| | 578 |
| 516 |
| | 350 |
| | 158 |
| | 8 |
| | 516 |
|
| Gold and silver credits | (324 | ) | | — |
| | — |
| | — |
| | — |
| (322 | ) | | — |
| | — |
| | — |
| | — |
|
| Treatment charges | 44 |
| | 30 |
| | 13 |
| | 1 |
| | 44 |
| 45 |
| | 30 |
| | 14 |
| | 1 |
| | 45 |
|
| Royalty on metals | 25 |
| | 18 |
| | 7 |
| | — |
| | 25 |
| 26 |
| | 18 |
| | 8 |
| | — |
| | 26 |
|
| Net cash costs | 323 |
| | 449 |
| | 189 |
| | 9 |
| | 647 |
| 265 |
| | 398 |
| | 180 |
| | 9 |
| | 587 |
|
| Depreciation and amortization | 54 |
| | 37 |
| | 16 |
| | 1 |
| | 54 |
| 55 |
| | 37 |
| | 17 |
| | 1 |
| | 55 |
|
| Noncash and other costs, net | 9 |
| | 7 |
| | 2 |
| | — |
| | 9 |
| 52 |
| | 35 |
| | 16 |
| | 1 |
| | 52 |
|
| Total costs | 386 |
| | 493 |
| | 207 |
| | 10 |
| | 710 |
| 372 |
| | 470 |
| | 213 |
| | 11 |
| | 694 |
|
| Revenue adjustments, primarily for pricing on prior period open sales | 7 |
| | 7 |
| | 2 |
| | — |
| | 9 |
| — |
| | — |
| | (1 | ) | | — |
| | (1 | ) |
| PT Smelting intercompany profit | | 5 |
| | 3 |
| | 2 |
| | — |
| | 5 |
|
| Gross profit | $ | 350 |
| | $ | 243 |
| | $ | 102 |
| | $ | 5 |
| | $ | 350 |
| $ | 313 |
| | $ | 213 |
| | $ | 95 |
| | $ | 5 |
| | $ | 313 |
|
| | | | | | | | | | | | | | | | | | | |
| Reconciliation to Amounts Reported | | | | | | | | | | | | | | | | | | |
| | Revenues | | Production and Delivery | | Depreciation, Depletion and Amortization | | | | | Revenues | | Production and Delivery | | Depreciation, Depletion and Amortization | | | | |
| Totals presented above | $ | 1,051 |
| | $ | 578 |
| | $ | 54 |
| | | | | $ | 1,003 |
| | $ | 516 |
| | $ | 55 |
| | | | |
| Treatment charges | (44 | ) | | N/A |
| | N/A |
| | | | | (45 | ) | | — |
| | — |
| | | | |
| Royalty on metals | (25 | ) | | N/A |
| | N/A |
| | | | | (26 | ) | | — |
| | — |
| | | | |
| Net noncash and other costs | N/A |
| | 9 |
| | N/A |
| | | | | — |
| | 52 |
| | — |
| | | | |
| Revenue adjustments, primarily for pricing on prior period open sales | 9 |
| | N/A |
| | N/A |
| | | | | (1 | ) | | — |
| | — |
| | | | |
| PT Smelting intercompany profit | | — |
| | (5 | ) | | — |
| | | | |
| Indonesia mining | 991 |
| | 587 |
| | 54 |
| | | | | 931 |
| | 563 |
| | 55 |
| | | | |
| North America copper mines | 1,316 |
| | 760 |
| | 88 |
| | | | | 1,389 |
| | 811 |
| | 102 |
| | | | |
| South America mining | 1,192 |
| | 530 |
| | 74 |
| | | | | 1,014 |
| | 475 |
| | 71 |
| | | | |
| Africa mining | 367 |
| | 172 |
| | 42 |
| | | | | 438 |
| | 185 |
| | 58 |
| | | | |
| Molybdenum | 308 |
| | 273 |
| | 18 |
| | | | | |
| Molybdenum mines | | 143 |
| | 80 |
| | 20 |
| | | | |
| Rod & Refining | 1,228 |
| | 1,222 |
| | 2 |
| | | | | 1,337 |
| | 1,328 |
| | 3 |
| | | | |
| Atlantic Copper Smelting & Refining | 638 |
| | 624 |
| | 11 |
| | | | | 639 |
| | 628 |
| | 10 |
| | | | |
| Corporate, other & eliminations | (1,623 | ) | | (1,576 | ) | | 9 |
| | | | | (1,308 | ) | | (1,351 | ) | | 10 |
| | | | |
| As reported in FCX’s consolidated financial statements | $ | 4,417 |
| | $ | 2,592 |
| | $ | 298 |
| | | | | $ | 4,583 |
| | $ | 2,719 |
| | $ | 329 |
| | | | |
| |
| a. | Includes silver sales of 469563 thousand ounces ($33.0428.49 per ounce average realized price). |
Indonesia Mining Product Revenues and Production Costs (continued)
| | | Three Months Ended September 30, 2011 | | | | |
| Three Months Ended March 31, 2012 | | | | |
| (In millions) | By-Product | | Co-Product Method | By-Product | | Co-Product Method |
| | Method | | Copper | | Gold | | Silver | | Total | Method | | Copper | | Gold | | Silver | | Total |
| Revenues, excluding adjustments | $ | 831 |
| | $ | 831 |
| | $ | 650 |
| | $ | 27 |
| a | $ | 1,508 |
| $ | 511 |
| | $ | 511 |
| | $ | 451 |
| | $ | 15 |
| a | $ | 977 |
|
| | | | | | | | | | | |
| Site production and delivery, before net noncash and other costs shown below | 499 |
| | 275 |
| | 215 |
| | 9 |
| | 499 |
| 470 |
| | 245 |
| | 217 |
| | 8 |
| | 470 |
|
| Gold and silver credits | (707 | ) | | — |
| | — |
| | — |
| | — |
| (469 | ) | | — |
| | — |
| | — |
| | — |
|
| Treatment charges | 47 |
| | 26 |
| | 20 |
| | 1 |
| | 47 |
| 25 |
| | 13 |
| | 12 |
| | — |
| | 25 |
|
| Royalty on metals | 41 |
| | 23 |
| | 17 |
| | 1 |
| | 41 |
| 18 |
| | 10 |
| | 8 |
| | — |
| | 18 |
|
| Net cash (credits) costs | (120 | ) | | 324 |
| | 252 |
| | 11 |
| | 587 |
| 44 |
| | 268 |
| | 237 |
| | 8 |
| | 513 |
|
| Depreciation and amortization | 62 |
| | 34 |
| | 27 |
| | 1 |
| | 62 |
| 46 |
| | 24 |
| | 21 |
| | 1 |
| | 46 |
|
| Noncash and other costs, net | 4 |
| | 2 |
| | 2 |
| | — |
| | 4 |
| 25 |
| | 13 |
| | 12 |
| | — |
| | 25 |
|
| Total (credits) costs | (54 | ) | | 360 |
| | 281 |
| | 12 |
| | 653 |
| 115 |
| | 305 |
| | 270 |
| | 9 |
| | 584 |
|
| Revenue adjustments, primarily for pricing on prior period open sales | (88 | ) | | (88 | ) | | 28 |
| | 2 |
| | (58 | ) | 13 |
| | 13 |
| | 3 |
| | — |
| | 16 |
|
| PT Smelting intercompany loss | | (20 | ) | | (11 | ) | | (9 | ) | | — |
| | (20 | ) |
| Gross profit | $ | 797 |
| | $ | 383 |
| | $ | 397 |
| | $ | 17 |
| | $ | 797 |
| $ | 389 |
| | $ | 208 |
| | $ | 175 |
| | $ | 6 |
| | $ | 389 |
|
| | | | | | | | | | | | | | | | | | | |
| Reconciliation to Amounts Reported | | | | | | | | | | | | | | | | | | |
| | Revenues | | Production and Delivery | | Depreciation, Depletion and Amortization | | | | | Revenues | | Production and Delivery | | Depreciation, Depletion and Amortization | | | | |
| Totals presented above | $ | 1,508 |
| | $ | 499 |
| | $ | 62 |
| | | | | $ | 977 |
| | $ | 470 |
| | $ | 46 |
| | | | |
| Treatment charges | (47 | ) | | N/A |
| | N/A |
| | | | | (25 | ) | | — |
| | — |
| | | | |
| Royalty on metals | (41 | ) | | N/A |
| | N/A |
| | | | | (18 | ) | | — |
| | — |
| | | | |
| Net noncash and other costs | N/A |
| | 4 |
| | N/A |
| | | | | — |
| | 25 |
| | — |
| | | | |
| Revenue adjustments, primarily for pricing on prior period open sales | (58 | ) | | N/A |
| | N/A |
| | | | | 16 |
| | — |
| | — |
| | | | |
| PT Smelting intercompany loss | | — |
| | 20 |
| | — |
| | | | |
| Indonesia mining | 1,362 |
| | 503 |
| | 62 |
| | | | | 950 |
| | 515 |
| | 46 |
| | | | |
| North America copper mines | 1,419 |
| | 664 |
| | 67 |
| | | | | 1,456 |
| | 707 |
| | 93 |
| | | | |
| South America mining | 1,053 |
| | 478 |
| | 64 |
| | | | | 1,254 |
| | 463 |
| | 62 |
| | | | |
| Africa mining | 276 |
| | 142 |
| | 32 |
| | | | | 305 |
| | 132 |
| | 32 |
| | | | |
| Molybdenum | 332 |
| | 260 |
| | 14 |
| | | | | |
| Molybdenum mines | | 126 |
| | 70 |
| | 11 |
| | | | |
| Rod & Refining | 1,396 |
| | 1,390 |
| | 2 |
| | | | | 1,304 |
| | 1,297 |
| | 2 |
| | | | |
| Atlantic Copper Smelting & Refining | 837 |
| | 826 |
| | 11 |
| | | | | 712 |
| | 695 |
| | 10 |
| | | | |
| Corporate, other & eliminations | (1,480 | ) | | (1,693 | ) | | 5 |
| | | | | (1,502 | ) | | (1,451 | ) | | 11 |
| | | | |
| As reported in FCX’s consolidated financial statements | $ | 5,195 |
| | $ | 2,570 |
| | $ | 257 |
| | | | | $ | 4,605 |
| | $ | 2,428 |
| | $ | 267 |
| | | | |
| |
| a. | Includes silver sales of 807449 thousand ounces ($34.05 per ounce average realized price). |
Indonesia Mining Product Revenues and Production Costs (continued)
|
| | | | | | | | | | | | | | | | | | | |
| Nine Months Ended September 30, 2012 | | | |
| (In millions) | By-Product | | Co-Product Method |
| | Method | | Copper | | Gold | | Silver | | Total |
| Revenues, excluding adjustments | $ | 1,863 |
| | $ | 1,863 |
| | $ | 1,150 |
| | $ | 43 |
| a | $ | 3,056 |
|
| | | | | | | | | | |
| Site production and delivery, before net noncash and other costs shown below | 1,637 |
| | 998 |
| | 616 |
| | 23 |
| | 1,637 |
|
| Gold and silver credits | (1,196 | ) | | — |
| | — |
| | — |
| | — |
|
| Treatment charges | 107 |
| | 65 |
| | 40 |
| | 2 |
| | 107 |
|
| Royalty on metals | 68 |
| | 42 |
| | 25 |
| | 1 |
| | 68 |
|
| Net cash costs | 616 |
| | 1,105 |
| | 681 |
| | 26 |
| | 1,812 |
|
| Depreciation and amortization | 153 |
| | 93 |
| | 58 |
| | 2 |
| | 153 |
|
| Noncash and other costs, net | 39 |
| | 24 |
| | 15 |
| | — |
| | 39 |
|
| Total costs | 808 |
| | 1,222 |
| | 754 |
| | 28 |
| | 2,004 |
|
| Revenue adjustments, primarily for pricing on prior period open sales | 13 |
| | 13 |
| | 3 |
| | — |
| | 16 |
|
| Gross profit | $ | 1,068 |
| | $ | 654 |
| | $ | 399 |
| | $ | 15 |
| | $ | 1,068 |
|
| | | | | | | | | | |
| Reconciliation to Amounts Reported | | | | | | | | | |
| | Revenues | | Production and Delivery | | Depreciation, Depletion and Amortization | | | | |
| Totals presented above | $ | 3,056 |
| | $ | 1,637 |
| | $ | 153 |
| | | | |
| Treatment charges | (107 | ) | | N/A |
| | N/A |
| | | | |
| Royalty on metals | (68 | ) | | N/A |
| | N/A |
| | | | |
| Net noncash and other costs | N/A |
| | 39 |
| | N/A |
| | | | |
| Revenue adjustments, primarily for pricing on prior period open sales | 16 |
| | N/A |
| | N/A |
| | | | |
| Indonesia mining | 2,897 |
| | 1,676 |
| | 153 |
| | | | |
| North America copper mines | 4,199 |
| | 2,249 |
| | 275 |
| | | | |
| South America mining | 3,462 |
| | 1,483 |
| | 208 |
| | | | |
| Africa mining | 994 |
| | 456 |
| | 114 |
| | | | |
| Molybdenum | 982 |
| | 812 |
| | 47 |
| | | | |
| Rod & Refining | 3,822 |
| | 3,800 |
| | 7 |
| | | | |
| Atlantic Copper Smelting & Refining | 2,045 |
| | 1,988 |
| | 31 |
| | | | |
| Corporate, other & eliminations | (4,904 | ) | | (4,822 | ) | | 21 |
| | | | |
| As reported in FCX’s consolidated financial statements | $ | 13,497 |
| | $ | 7,642 |
| | $ | 856 |
| | | | |
| |
a. | Includes silver sales of 1.4 million ounces ($31.0433.08 per ounce average realized price).
|
Indonesia Mining Product Revenues and Production Costs (continued)
|
| | | | | | | | | | | | | | | | | | | |
| Nine Months Ended September 30, 2011 | | | |
| (In millions) | By-Product | | Co-Product Method |
| | Method | | Copper | | Gold | | Silver | | Total |
| Revenues, excluding adjustments | $ | 3,040 |
| | $ | 3,040 |
| | $ | 1,829 |
| | $ | 92 |
| a | $ | 4,961 |
|
| | | | | | | | | | |
| Site production and delivery, before net noncash and other costs shown below | 1,521 |
| | 932 |
| | 561 |
| | 28 |
| | 1,521 |
|
| Gold and silver credits | (1,903 | ) | | — |
| | — |
| | — |
| | — |
|
| Treatment charges | 145 |
| | 89 |
| | 53 |
| | 3 |
| | 145 |
|
| Royalty on metals | 130 |
| | 79 |
| | 48 |
| | 3 |
| | 130 |
|
| Net cash (credits) costs | (107 | ) | | 1,100 |
| | 662 |
| | 34 |
| | 1,796 |
|
| Depreciation and amortization | 179 |
| | 110 |
| | 66 |
| | 3 |
| | 179 |
|
| Noncash and other costs, net | 26 |
| | 16 |
| | 10 |
| | — |
| | 26 |
|
| Total costs | 98 |
| | 1,226 |
| | 738 |
| | 37 |
| | 2,001 |
|
| Revenue adjustments, primarily for pricing on prior period open sales | (12 | ) | | (12 | ) | | (17 | ) | | (1 | ) | | (30 | ) |
| Gross profit | $ | 2,930 |
| | $ | 1,802 |
| | $ | 1,074 |
| | $ | 54 |
| | $ | 2,930 |
|
| | | | | | | | | | |
| Reconciliation to Amounts Reported | | | | | | | | | |
| | Revenues | | Production and Delivery | | Depreciation, Depletion and Amortization | | | | |
| Totals presented above | $ | 4,961 |
| | $ | 1,521 |
| | $ | 179 |
| | | | |
| Treatment charges | (145 | ) | | N/A |
| | N/A |
| | | | |
| Royalty on metals | (130 | ) | | N/A |
| | N/A |
| | | | |
| Net noncash and other costs | N/A |
| | 26 |
| | N/A |
| | | | |
| Revenue adjustments, primarily for pricing on prior period open sales | (30 | ) | | N/A |
| | N/A |
| | | | |
| Indonesia mining | 4,656 |
| | 1,547 |
| | 179 |
| | | | |
| North America copper mines | 4,339 |
| | 1,923 |
| | 196 |
| | | | |
| South America mining | 3,903 |
| | 1,330 |
| | 187 |
| | | | |
| Africa mining | 963 |
| | 422 |
| | 98 |
| | | | |
| Molybdenum | 1,119 |
| | 786 |
| | 44 |
| | | | |
| Rod & Refining | 4,310 |
| | 4,292 |
| | 6 |
| | | | |
| Atlantic Copper Smelting & Refining | 2,252 |
| | 2,274 |
| | 30 |
| | | | |
| Corporate, other & eliminations | (4,824 | ) | | (5,070 | ) | | 16 |
| | | | |
| As reported in FCX’s consolidated financial statements | $ | 16,718 |
| | $ | 7,504 |
| | $ | 756 |
| | | | |
| |
a. | Includes silver sales of 2.5 million ounces ($36.44 per ounce average realized price).
|
Africa Mining Product Revenues and Production Costs
| | | Three Months Ended September 30, 2012 | | | | | | | | |
| Three Months Ended March 31, 2013 | | | | | | | | |
| (In millions) | By-Product | | Co-Product Method | By-Product | | Co-Product Method |
| | Method | | Copper | | Cobalt | | Total | Method | | Copper | | Cobalt | | Total |
Revenues, excluding adjustmentsa | $ | 312 |
| | $ | 312 |
| | $ | 64 |
| | $ | 376 |
| $ | 401 |
| | $ | 401 |
| | $ | 41 |
| | $ | 442 |
|
| | | | | | | | | |
| Site production and delivery, before net noncash and other costs shown below | 143 |
| | 127 |
| | 39 |
| | 166 |
| 164 |
| | 157 |
| | 23 |
| | 180 |
|
Cobalt creditsb | (41 | ) | | — |
| | — |
| | — |
| (27 | ) | | — |
| | — |
| | — |
|
| Royalty on metals | 7 |
| | 6 |
| | 1 |
| | 7 |
| 8 |
| | 7 |
| | 1 |
| | 8 |
|
| Net cash costs | 109 |
| | 133 |
| | 40 |
| | 173 |
| 145 |
| | 164 |
| | 24 |
| | 188 |
|
| Depreciation, depletion and amortization | 42 |
| | 38 |
| | 4 |
| | 42 |
| 58 |
| | 54 |
| | 4 |
| | 58 |
|
| Noncash and other costs, net | 6 |
| | 5 |
| | 1 |
| | 6 |
| 5 |
| | 5 |
| | — |
| | 5 |
|
| Total costs | 157 |
| | 176 |
| | 45 |
| | 221 |
| 208 |
| | 223 |
| | 28 |
| | 251 |
|
| Revenue adjustments, primarily for pricing on prior period open sales | (2 | ) | | (2 | ) | | — |
| | (2 | ) | 2 |
| | 2 |
| | 2 |
| | 4 |
|
| Gross profit | $ | 153 |
| | $ | 134 |
| | $ | 19 |
| | $ | 153 |
| $ | 195 |
| | $ | 180 |
| | $ | 15 |
| | $ | 195 |
|
| | | | | | | | | | | | | | | |
| Reconciliation to Amounts Reported | | | | | | | | | | | | | | |
| | Revenues | | Production and Delivery | | Depreciation, Depletion and Amortization | | | Revenues | | Production and Delivery | | Depreciation, Depletion and Amortization | | |
| Totals presented above | $ | 376 |
| | $ | 166 |
| | $ | 42 |
| | | $ | 442 |
| | $ | 180 |
| | $ | 58 |
| | |
| Royalty on metals | (7 | ) | | N/A |
| | N/A |
| | | (8 | ) | | — |
| | — |
| | |
| Net noncash and other costs | N/A |
| | 6 |
| | N/A |
| | | — |
| | 5 |
| | — |
| | |
| Revenue adjustments, primarily for pricing on prior period open sales | (2 | ) | | N/A |
| | N/A |
| | | 4 |
| | — |
| | — |
| | |
| Africa mining | 367 |
| | 172 |
| | 42 |
| | | 438 |
| | 185 |
| | 58 |
| | |
| North America copper mines | 1,316 |
| | 760 |
| | 88 |
| | | 1,389 |
| | 811 |
| | 102 |
| | |
| South America mining | 1,192 |
| | 530 |
| | 74 |
| | | 1,014 |
| | 475 |
| | 71 |
| | |
| Indonesia mining | 991 |
| | 587 |
| | 54 |
| | | 931 |
| | 563 |
| | 55 |
| | |
| Molybdenum | 308 |
| | 273 |
| | 18 |
| | | |
| Molybdenum mines | | 143 |
| | 80 |
| | 20 |
| | |
| Rod & Refining | 1,228 |
| | 1,222 |
| | 2 |
| | | 1,337 |
| | 1,328 |
| | 3 |
| | |
| Atlantic Copper Smelting & Refining | 638 |
| | 624 |
| | 11 |
| | | 639 |
| | 628 |
| | 10 |
| | |
| Corporate, other & eliminations | (1,623 | ) | | (1,576 | ) | | 9 |
| | | (1,308 | ) | | (1,351 | ) | | 10 |
| | |
| As reported in FCX’s consolidated financial statements | $ | 4,417 |
| | $ | 2,592 |
| | $ | 298 |
| | | $ | 4,583 |
| | $ | 2,719 |
| | $ | 329 |
| | |
| |
| a. | Includes point-of-sale transportation costs as negotiated in customer contracts. |
| |
| b. | Net of cobalt downstream processing and freight costs. |
Africa Mining Product Revenues and Production Costs (continued)
|
| | | | | | | | | | | | | | | |
| Three Months Ended September 30, 2011 | | | | | | | |
| (In millions) | By-Product | | Co-Product Method |
| | Method | | Copper | | Cobalt | | Total |
Revenues, excluding adjustmentsa | $ | 226 |
| | $ | 226 |
| | $ | 56 |
| | $ | 282 |
|
| | | | | | | | |
| Site production and delivery, before net noncash and other costs shown below | 101 |
| | 92 |
| | 31 |
| | 123 |
|
Cobalt creditsb | (34 | ) | | — |
| | — |
| | — |
|
| Royalty on metals | 5 |
| | 4 |
| | 1 |
| | 5 |
|
| Net cash costs | 72 |
| | 96 |
| | 32 |
| | 128 |
|
| Depreciation, depletion and amortization | 32 |
| | 27 |
| | 5 |
| | 32 |
|
| Noncash and other costs, net | 19 |
| | 15 |
| | 4 |
| | 19 |
|
| Total costs | 123 |
| | 138 |
| | 41 |
| | 179 |
|
| Revenue adjustments, primarily for pricing on prior period open sales | (1 | ) | | (1 | ) | | — |
| | (1 | ) |
| Gross profit | $ | 102 |
| | $ | 87 |
| | $ | 15 |
| | $ | 102 |
|
| | | | | | | | |
| Reconciliation to Amounts Reported | | | | | | | |
| | Revenues | | Production and Delivery | | Depreciation, Depletion and Amortization | | |
| Totals presented above | $ | 282 |
| | $ | 123 |
| | $ | 32 |
| | |
| Royalty on metals | (5 | ) | | N/A |
| | N/A |
| | |
| Net noncash and other costs | N/A |
| | 19 |
| | N/A |
| | |
| Revenue adjustments, primarily for pricing on prior period open sales | (1 | ) | | N/A |
| | N/A |
| | |
| Africa mining | 276 |
| | 142 |
| | 32 |
| | |
| North America copper mines | 1,419 |
| | 664 |
| | 67 |
| | |
| South America mining | 1,053 |
| | 478 |
| | 64 |
| | |
| Indonesia mining | 1,362 |
| | 503 |
| | 62 |
| | |
| Molybdenum | 332 |
| | 260 |
| | 14 |
| | |
| Rod & Refining | 1,396 |
| | 1,390 |
| | 2 |
| | |
| Atlantic Copper Smelting & Refining | 837 |
| | 826 |
| | 11 |
| | |
| Corporate, other & eliminations | (1,480 | ) | | (1,693 | ) | | 5 |
| | |
| As reported in FCX’s consolidated financial statements | $ | 5,195 |
| | $ | 2,570 |
| | $ | 257 |
| | |
| |
a. | Includes point-of-sale transportation costs as negotiated in customer contracts. |
| |
b. | Net of cobalt downstream processing and freight costs. |
Africa Mining Product Revenues and Production Costs (continued)
| | | Nine Months Ended September 30, 2012 | | | | | | | | |
| Three Months Ended March 31, 2012 | | | | | | | | |
| (In millions) | By-Product | | Co-Product Method | By-Product | | Co-Product Method |
| | Method | | Copper | | Cobalt | | Total | Method | | Copper | | Cobalt | | Total |
Revenues, excluding adjustmentsa | $ | 845 |
| | $ | 845 |
| | $ | 157 |
| | $ | 1,002 |
| $ | 257 |
| | $ | 257 |
| | $ | 43 |
| | $ | 300 |
|
| | | | | | | | | |
| Site production and delivery, before net noncash and other costs shown below | 368 |
| | 341 |
| | 95 |
| | 436 |
| 103 |
| | 99 |
| | 26 |
| | 125 |
|
Cobalt creditsb | (91 | ) | | — |
| | — |
| | — |
| (23 | ) | | — |
| | — |
| | — |
|
| Royalty on metals | 18 |
| | 16 |
| | 2 |
| | 18 |
| 5 |
| | 5 |
| | — |
| | 5 |
|
| Net cash costs | 295 |
| | 357 |
| | 97 |
| | 454 |
| 85 |
| | 104 |
| | 26 |
| | 130 |
|
| Depreciation, depletion and amortization | 114 |
| | 101 |
| | 13 |
| | 114 |
| 32 |
| | 29 |
| | 3 |
| | 32 |
|
| Noncash and other costs, net | 20 |
| | 18 |
| | 2 |
| | 20 |
| 7 |
| | 6 |
| | 1 |
| | 7 |
|
| Total costs | 429 |
| | 476 |
| | 112 |
| | 588 |
| 124 |
| | 139 |
| | 30 |
| | 169 |
|
| Revenue adjustments, primarily for pricing on prior period open sales | 8 |
| | 8 |
| | 2 |
| | 10 |
| 8 |
| | 8 |
| | 2 |
| | 10 |
|
| Gross profit | $ | 424 |
| | $ | 377 |
| | $ | 47 |
| | $ | 424 |
| $ | 141 |
| | $ | 126 |
| | $ | 15 |
| | $ | 141 |
|
| | | | | | | | | | | | | | | |
| Reconciliation to Amounts Reported | | | | | | | | | | | | | | |
| | Revenues | | Production and Delivery | | Depreciation, Depletion and Amortization | | | Revenues | | Production and Delivery | | Depreciation, Depletion and Amortization | | |
| Totals presented above | $ | 1,002 |
| | $ | 436 |
| | $ | 114 |
| | | $ | 300 |
| | $ | 125 |
| | $ | 32 |
| | |
| Royalty on metals | (18 | ) | | N/A |
| | N/A |
| | | (5 | ) | | — |
| | — |
| | |
| Net noncash and other costs | N/A |
| | 20 |
| | N/A |
| | | — |
| | 7 |
| | — |
| | |
| Revenue adjustments, primarily for pricing on prior period open sales | 10 |
| | N/A |
| | N/A |
| | | 10 |
| | — |
| | — |
| | |
| Africa mining | 994 |
| | 456 |
| | 114 |
| | | 305 |
| | 132 |
| | 32 |
| | |
| North America copper mines | 4,199 |
| | 2,249 |
| | 275 |
| | | 1,456 |
| | 707 |
| | 93 |
| | |
| South America mining | 3,462 |
| | 1,483 |
| | 208 |
| | | 1,254 |
| | 463 |
| | 62 |
| | |
| Indonesia mining | 2,897 |
| | 1,676 |
| | 153 |
| | | 950 |
| | 515 |
| | 46 |
| | |
| Molybdenum | 982 |
| | 812 |
| | 47 |
| | | |
| Molybdenum mines | | 126 |
| | 70 |
| | 11 |
| | |
| Rod & Refining | 3,822 |
| | 3,800 |
| | 7 |
| | | 1,304 |
| | 1,297 |
| | 2 |
| | |
| Atlantic Copper Smelting & Refining | 2,045 |
| | 1,988 |
| | 31 |
| | | 712 |
| | 695 |
| | 10 |
| | |
| Corporate, other & eliminations | (4,904 | ) | | (4,822 | ) | | 21 |
| | | (1,502 | ) | | (1,451 | ) | | 11 |
| | |
| As reported in FCX’s consolidated financial statements | $ | 13,497 |
| | $ | 7,642 |
| | $ | 856 |
| | | $ | 4,605 |
| | $ | 2,428 |
| | $ | 267 |
| | |
| |
| a. | Includes point-of-sale transportation costs as negotiated in customer contracts. |
| |
| b. | Net of cobalt downstream processing and freight costs. |
Africa Mining Product Revenues and Production Costs (continued)
|
| | | | | | | | | | | | | | | |
| Nine Months Ended September 30, 2011 | | | | | | | |
| (In millions) | By-Product | | Co-Product Method |
| | Method | | Copper | | Cobalt | | Total |
Revenues, excluding adjustmentsa | $ | 779 |
| | $ | 779 |
| | $ | 201 |
| | $ | 980 |
|
| | | | | | | | |
| Site production and delivery, before net noncash and other costs shown below | 313 |
| | 275 |
| | 105 |
| | 380 |
|
Cobalt creditsb | (136 | ) | | — |
| | — |
| | — |
|
| Royalty on metals | 18 |
| | 14 |
| | 4 |
| | 18 |
|
| Net cash costs | 195 |
| | 289 |
| | 109 |
| | 398 |
|
| Depreciation, depletion and amortization | 98 |
| | 83 |
| | 15 |
| | 98 |
|
| Noncash and other costs, net | 42 |
| | 35 |
| | 7 |
| | 42 |
|
| Total costs | 335 |
| | 407 |
| | 131 |
| | 538 |
|
| Revenue adjustments, primarily for pricing on prior period open sales | (1 | ) | | (1 | ) | | 2 |
| | 1 |
|
| Gross profit | $ | 443 |
| | $ | 371 |
| | $ | 72 |
| | $ | 443 |
|
| | | | | | | | |
| Reconciliation to Amounts Reported | | | | | | | |
| | Revenues | | Production and Delivery | | Depreciation, Depletion and Amortization | | |
| Totals presented above | $ | 980 |
| | $ | 380 |
| | $ | 98 |
| | |
| Royalty on metals | (18 | ) | | N/A |
| | N/A |
| | |
| Net noncash and other costs | N/A |
| | 42 |
| | N/A |
| | |
| Revenue adjustments, primarily for pricing on prior period open sales | 1 |
| | N/A |
| | N/A |
| | |
| Africa mining | 963 |
| | 422 |
| | 98 |
| | |
| North America copper mines | 4,339 |
| | 1,923 |
| | 196 |
| | |
| South America mining | 3,903 |
| | 1,330 |
| | 187 |
| | |
| Indonesia mining | 4,656 |
| | 1,547 |
| | 179 |
| | |
| Molybdenum | 1,119 |
| | 786 |
| | 44 |
| | |
| Rod & Refining | 4,310 |
| | 4,292 |
| | 6 |
| | |
| Atlantic Copper Smelting & Refining | 2,252 |
| | 2,274 |
| | 30 |
| | |
| Corporate, other & eliminations | (4,824 | ) | | (5,070 | ) | | 16 |
| | |
| As reported in FCX’s consolidated financial statements | $ | 16,718 |
| | $ | 7,504 |
| | $ | 756 |
| | |
| |
a. | Includes point-of-sale transportation costs as negotiated in customer contracts. |
| |
b. | Net of cobalt downstream processing and freight costs. |
Henderson Molybdenum MineMines Product Revenues and Production Costs
| | | | Three Months Ended September 30, | | | Three Months Ended March 31, | | |
| (In millions) | 2012 | | 2011 | | | 2013a | | 2012a | | |
| Revenues, excluding adjustments | $ | 119 |
| | $ | 163 |
| | | $ | 155 |
| | $ | 134 |
| | |
| | | | | | | | | | | |
| Site production and delivery, before net noncash and other costs shown below | 54 |
| | 55 |
| | | 78 |
| | 53 |
| | |
| Treatment charges and other | 8 |
| | 11 |
| | | 12 |
| | 8 |
| | |
| Net cash costs | 62 |
| | 66 |
| | | 90 |
| | 61 |
| | |
| Depreciation, depletion and amortization | 9 |
| | 10 |
| | | 20 |
| | 8 |
| | |
| Noncash and other costs, net | 4 |
| | — |
| | | 2 |
| | 1 |
| | |
| Total costs | 75 |
| | 76 |
| | | 112 |
| | 70 |
| | |
Gross profita | $ | 44 |
| | $ | 87 |
| | | |
| Gross profit | | $ | 43 |
| | $ | 64 |
| | |
| | | | | | | | | | | |
| Reconciliation to Amounts Reported | Revenues | | Production and Delivery | | Depreciation, Depletion and Amortization | Revenues | | Production and Delivery | | Depreciation, Depletion and Amortization |
| Three Months Ended September 30, 2012 | | | | | | |
| Three Months Ended March 31, 2013 | | | | | | |
| Totals presented above | $ | 119 |
| | $ | 54 |
| | $ | 9 |
| $ | 155 |
| | $ | 78 |
| | $ | 20 |
|
| Treatment charges and other | (8 | ) | | N/A |
| | N/A |
| (12 | ) | | — |
| | — |
|
| Net noncash and other costs | N/A |
| | 4 |
| | N/A |
| — |
| | 2 |
| | — |
|
| Henderson mine | 111 |
| | 58 |
| | 9 |
| |
Other molybdenum operations and eliminationsb | 197 |
| | 215 |
| | 9 |
| |
| Molybdenum | 308 |
| | 273 |
| | 18 |
| |
| Molybdenum mines | | 143 |
| | 80 |
| | 20 |
|
| North America copper mines | 1,316 |
| | 760 |
| | 88 |
| 1,389 |
| | 811 |
| | 102 |
|
| South America mining | 1,192 |
| | 530 |
| | 74 |
| 1,014 |
| | 475 |
| | 71 |
|
| Indonesia mining | 991 |
| | 587 |
| | 54 |
| 931 |
| | 563 |
| | 55 |
|
| Africa mining | 367 |
| | 172 |
| | 42 |
| 438 |
| | 185 |
| | 58 |
|
| Rod & Refining | 1,228 |
| | 1,222 |
| | 2 |
| 1,337 |
| | 1,328 |
| | 3 |
|
| Atlantic Copper Smelting & Refining | 638 |
| | 624 |
| | 11 |
| 639 |
| | 628 |
| | 10 |
|
| Corporate, other & eliminations | (1,623 | ) | | (1,576 | ) | | 9 |
| |
Corporate, other & eliminationsb | | (1,308 | ) | | (1,351 | ) | | 10 |
|
| As reported in FCX’s consolidated financial statements | $ | 4,417 |
| | $ | 2,592 |
| | $ | 298 |
| $ | 4,583 |
| | $ | 2,719 |
| | $ | 329 |
|
| | | | | | | | | | | |
| Three Months Ended September 30, 2011 | | | | | | |
| Three Months Ended March 31, 2012 | | | | | | |
| Totals presented above | $ | 163 |
| | $ | 55 |
| | $ | 10 |
| $ | 134 |
| | $ | 53 |
| | $ | 8 |
|
| Treatment charges and other | (11 | ) | | N/A |
| | N/A |
| (8 | ) | | — |
| | — |
|
| Net noncash and other costs | N/A |
| | — |
| | N/A |
| — |
| | 1 |
| | — |
|
| Henderson mine | 152 |
| | 55 |
| | 10 |
| 126 |
| | 54 |
| | 8 |
|
Other molybdenum operations and eliminationsb | 180 |
| | 205 |
| | 4 |
| |
| Molybdenum | 332 |
| | 260 |
| | 14 |
| |
| Climax mine | | — |
| | 16 |
| | 3 |
|
| Molybdenum mines | | 126 |
| | 70 |
| | 11 |
|
| North America copper mines | 1,419 |
| | 664 |
| | 67 |
| 1,456 |
| | 707 |
| | 93 |
|
| South America mining | 1,053 |
| | 478 |
| | 64 |
| 1,254 |
| | 463 |
| | 62 |
|
| Indonesia mining | 1,362 |
| | 503 |
| | 62 |
| 950 |
| | 515 |
| | 46 |
|
| Africa mining | 276 |
| | 142 |
| | 32 |
| 305 |
| | 132 |
| | 32 |
|
| Rod & Refining | 1,396 |
| | 1,390 |
| | 2 |
| 1,304 |
| | 1,297 |
| | 2 |
|
| Atlantic Copper Smelting & Refining | 837 |
| | 826 |
| | 11 |
| 712 |
| | 695 |
| | 10 |
|
| Corporate, other & eliminations | (1,480 | ) | | (1,693 | ) | | 5 |
| |
Corporate, other & eliminationsb | | (1,502 | ) | | (1,451 | ) | | 11 |
|
| As reported in FCX’s consolidated financial statements | $ | 5,195 |
| | $ | 2,570 |
| | $ | 257 |
| $ | 4,605 |
| | $ | 2,428 |
| | $ | 267 |
|
| |
| a. | Gross profitFirst-quarter2013 includes the results of the Henderson and Climax mines; first-quarter2012 reflects salesthe results of only the Henderson production to our Molybdenum sales company based on volumes produced at market-based pricing. On a consolidated basis, the Molybdenum division includes profits on sales as they are made to third parties and realizations based on actual contract terms. As a result, the actual gross profit realized will differ from the amounts reported in this table.mine. |
| |
| b. | Primarily includesIncludes amounts associated with theour molybdenum sales company, which includes sales of molybdenum produced by the molybdenum mines and by certain of our North and South America copper mines. Also includes the results of the Climax molybdenum mine, which commenced commercial production in May 2012. |
Henderson Molybdenum Mine Product Revenues and Production Costs (continued)
|
| | | | | | | | | | | |
| | Nine Months Ended September 30, | | |
| (In millions) | 2012 | | 2011 | | |
| Revenues, excluding adjustments | $ | 383 |
| | $ | 499 |
| | |
| | | | | | |
| Site production and delivery, before net noncash and other costs shown below | 159 |
| | 158 |
| | |
| Treatment charges and other | 23 |
| | 28 |
| | |
| Net cash costs | 182 |
| | 186 |
| | |
| Depreciation, depletion and amortization | 25 |
| | 27 |
| | |
| Noncash and other costs, net | 5 |
| | 1 |
| | |
| Total costs | 212 |
| | 214 |
| | |
Gross profita | $ | 171 |
| | $ | 285 |
| | |
| | | | | | |
| Reconciliation to Amounts Reported | Revenues | | Production and Delivery | | Depreciation, Depletion and Amortization |
| Nine Months Ended September 30, 2012 | | | | | |
| Totals presented above | $ | 383 |
| | $ | 159 |
| | $ | 25 |
|
| Treatment charges and other | (23 | ) | | N/A |
| | N/A |
|
| Net noncash and other costs | N/A |
| | 5 |
| | N/A |
|
| Henderson mine | 360 |
| | 164 |
| | 25 |
|
Other molybdenum operations and eliminationsb | 622 |
| | 648 |
| | 22 |
|
| Molybdenum | 982 |
| | 812 |
| | 47 |
|
| North America copper mines | 4,199 |
| | 2,249 |
| | 275 |
|
| South America mining | 3,462 |
| | 1,483 |
| | 208 |
|
| Indonesia mining | 2,897 |
| | 1,676 |
| | 153 |
|
| Africa mining | 994 |
| | 456 |
| | 114 |
|
| Rod & Refining | 3,822 |
| | 3,800 |
| | 7 |
|
| Atlantic Copper Smelting & Refining | 2,045 |
| | 1,988 |
| | 31 |
|
| Corporate, other & eliminations | (4,904 | ) | | (4,822 | ) | | 21 |
|
| As reported in FCX’s consolidated financial statements | $ | 13,497 |
| | $ | 7,642 |
| | $ | 856 |
|
| | | | | | |
| Nine Months Ended September 30, 2011 | | | | | |
| Totals presented above | $ | 499 |
| | $ | 158 |
| | $ | 27 |
|
| Treatment charges and other | (28 | ) | | N/A |
| | N/A |
|
| Net noncash and other costs | N/A |
| | 1 |
| | N/A |
|
| Henderson mine | 471 |
| | 159 |
| | 27 |
|
Other molybdenum operations and eliminationsb | 648 |
| | 627 |
| | 17 |
|
| Molybdenum | 1,119 |
| | 786 |
| | 44 |
|
| North America copper mines | 4,339 |
| | 1,923 |
| | 196 |
|
| South America mining | 3,903 |
| | 1,330 |
| | 187 |
|
| Indonesia mining | 4,656 |
| | 1,547 |
| | 179 |
|
| Africa mining | 963 |
| | 422 |
| | 98 |
|
| Rod & Refining | 4,310 |
| | 4,292 |
| | 6 |
|
| Atlantic Copper Smelting & Refining | 2,252 |
| | 2,274 |
| | 30 |
|
| Corporate, other & eliminations | (4,824 | ) | | (5,070 | ) | | 16 |
|
| As reported in FCX’s consolidated financial statements | $ | 16,718 |
| | $ | 7,504 |
| | $ | 756 |
|
| |
a. | Gross profit reflects sales of Henderson production to our Molybdenum sales company based on volumes produced at market-based pricing. On a consolidated basis, the Molybdenum division includes profits on sales as they are made to third parties and realizations based on actual contract terms. As a result, the actual gross profit realized will differ from the amounts reported in this table. |
| |
b. | Primarily includes amounts associated with the molybdenum sales company, which includes sales of molybdenum produced by our North and South America copper mines. Also includes the results of the Climax molybdenum mine, which commenced commercial production in May 2012. |
CAUTIONARY STATEMENT
Our discussion and analysis contains forward-looking statements in which we discuss factors we believe may affect our future performance. Forward-looking statements are all statements other than statements of historical facts, such as those statements regarding projected ore grades and milling rates, projected production and sales volumes, projected unit net cash costs, projected operating cash flows, projected capital expenditures, exploration efforts and results, mine production and development plans, the impact of deferred intercompany profits on earnings, liquidity, other financial commitments and tax rates, the impact of copper, gold, molybdenum and cobalt price changes, future dividend payments and potential share purchases. The words “anticipates,” “may,” “can,” “plans,” “believes,” “estimates,” “expects,” “projects,” “intends,” “likely,” “will,” “should,” “to be,” and any similar expressions are intended to identify those assertions as forward-looking statements. The declaration of dividends is at the discretion of our Board of Directors and will depend on our financial results, cash requirements, future prospects, the impact of pending acquisitions and other factors deemed relevant by the Board.
We caution readers that forward-looking statements are not guarantees of future performance and our actual results may differ materially from those anticipated, projected or assumed in the forward-looking statements. Important factors that can cause our actual results to differ materially from those anticipated in the forward-looking statements include commodity prices, mine sequencing, production rates, industry risks, regulatory changes, political risks, the outcome of ongoing discussions with the Indonesian government, the potential effects of violence in Indonesia, the resolution of administrative disputes in the DRC, weather- and climate-related risks, labor relations, environmental risks, litigation results, currency translation risks, risks associated with the completion of pending acquisitions and other factors described in more detail under the heading “Risk Factors” in our Annual Reportannual report on Form 10-K for the year ended December 31, 20112012, filed with the SEC as updated by our subsequent filings with the SEC.
Investors are cautioned that many of the assumptions on which our forward-looking statements are based are likely to change after our forward-looking statements are made, including for example commodity prices, which we cannot control, and production volumes and costs, some aspects of which we may or may not be able to control. Further, we may make changes to our business plans that could or will affect our results. We caution investors that we do not intend to update our forward-looking statements more frequently than quarterly notwithstanding any changes in our assumptions, changes in our business plans, our actual experience, or other changes, and we undertake no obligation to update any forward-looking statements.
| |
| Item 3. | Quantitative and Qualitative Disclosures About Market Risk. |
There have been no material changes in our market risks during the three-month period ended September 30, 2012March 31, 2013. For additional information on market risks, refer to “Disclosures About Market Risks” included in Part II, Item 7A. of our annual report on Form 10-K for the year ended December 31, 20112012. For projected sensitivities of our operating cash flow to changes in commodity prices, refer to “Outlook” in Part I, Item 2. of this quarterly report on Form 10-Q for the period ended September 30, 2012March 31, 2013; for projected sensitivities of our provisionally priced copper sales to changes in commodity prices refer to “Consolidated Results – Revenues” in Part I, Item 2. of this quarterly report on Form 10-Q for the period ended September 30, 2012March 31, 2013.
| |
| Item 4. | Controls and Procedures. |
| |
| (a) | Evaluation of disclosure controls and procedures. Our chief executive officer and chief financial officer, with the participation of management, have evaluated the effectiveness of our “disclosure controls and procedures” (as defined in Rules 13a-15(e) and 15(d)-15(e) under the Securities Exchange Act of 1934) as of the end of the period covered by this quarterly report on Form 10-Q. Based on their evaluation, they have concluded that our disclosure controls and procedures are effective as of September 30, 2012March 31, 2013. |
| |
| (b) | Changes in internal control over financial reporting. During second-quarter 2011, we began a phased implementation of a new enterprise resource planning (ERP) information technology system to upgrade our information technology infrastructure and enhance operating efficiency and effectiveness. Implementation has been completed at our North America, South America, Africa and AfricaIndonesia mining operations, and has recently commenced at our Indonesia mining operations. Wewe expect the initial implementation of the ERP system to be completed at all of our operations over an approximate two-year period.in 2013. During each phase of the implementation, an appropriate level of training of employees, testing of the system and monitoring of the financial results recorded in the system is conducted. Management has updated our system of internal control over financial reporting for the impacted operating business units. |
With the exception of the ERP implementation described above, there has been no change in our internal control over financial reporting that occurred during the quarter ended September 30, 2012March 31, 2013, that materially affected, or is reasonably likely to materially affect, our internal control over financial reporting.
| |
| Part II. | OTHER INFORMATION |
| |
| Item 1. | Legal Proceedings. |
We are involved in numerous legal proceedings that arise in the ordinary course of our business or are associated with environmental issues arising from legacy operations conducted over the years by Freeport-McMoRan Corporation (FMC - formerly Phelps Dodge Corporation) and its affiliates. We are also involved from time to time in other reviews, investigations and proceedings by government agencies, some of which may result in adverse judgments, settlements, fines, penalties, injunctions or other relief.
Management does not believe, based on currently available information, that the outcome of any proceeding reported in Note 13 and incorporated by reference into Part I, Item 3. “Legal Proceedings” of our annual report on Form 10-K for the year ended December 31, 20112012 (as updated by our quarterly reports on Form 10-Q) will have a material adverse effect on our financial condition; although individual outcomes could be material to our operating results for a particular period, depending on the nature and magnitude of the outcome and the operating results for the period. Refer to Note 89 for discussion of updates to previously reported legal proceedings.
Item 1A. Risk Factors.
There have been no material changes to our risk factors during the three-month period ended September 30, 2012March 31, 2013. For additional information on risk factors, refer to Part I, Item 1A. "Risk Factors" of our annual report on Form 10-K for the year ended December 31, 20112012, as updated by Part II, Item 1A. "Risk Factors" of our quarterly report on Form 10-Q for the period ended June 30, 2012..
| |
| Item 2. | Unregistered Sales of Equity Securities and Use of Proceeds. |
| |
| (c) | The following table sets forth information with respect to shares of Freeport-McMoRan Copper & Gold Inc. (FCX) common stock purchased by us during the three months ended September 30, 2012March 31, 2013: |
|
| | | | | | | | | | | | |
| Period | | (a) Total Number
of Shares Purchased
| | (b) Average
Price Paid Per Share
| | (c) Total Number of
Shares Purchased as Part
of Publicly Announced Plans or Programsa
| | (d) Maximum Number
of Shares That May
Yet Be Purchased Under the Plans or Programsa
|
|
| July 1-31, 2012 | | — |
| | — | | — |
| | 23,685,500 |
|
| August 1-31, 2012 | | — |
| | — | | — |
| | 23,685,500 |
|
| September 1-30, 2012 | | — |
| | — | | — |
| | 23,685,500 |
|
| Total | | — |
| | | | — |
| | 23,685,500 |
|
|
| | | | | | | | | | | | | | |
| | Period | | (a) Total Number of Shares Purchased | | (b) Average Price Paid Per Share | | (c) Total Number of Shares Purchased as Part of Publicly Announced Plans or Programsb | | (d) Maximum Number of Shares That May Yet Be Purchased Under the Plans or Programsb |
| |
| | January 1-31, 2013 | | — |
| | $ | — |
| | — |
| | 23,685,500 |
|
| | February 1-28, 2013 | | 15,000 |
| a | $ | 35.16 |
| | — |
| | 23,685,500 |
|
| | March 1-31, 2013 | | — |
| | $ | — |
| | — |
| | 23,685,500 |
|
| | Total | | 15,000 |
| | $ | 35.16 |
| | — |
| | 23,685,500 |
|
| |
| a. | Consists of shares acquired in connection with stock option exercises. |
| |
| b. | On July 21, 2008, our Board of Directors approved an increase in our open-market share purchase program for up to 30 million shares, of which 23.7 million shares remain available for purchase.shares. There have been no purchases under this program since 2008. This program does not have an expiration date. |
| |
| Item 4. | Mine Safety Disclosure. |
The safety and health of all employees is our highest priority. Management believes that safety and health considerations are integral to, and compatible with, all other functions in the organization and that proper safety and health management will enhance production and reduce costs. Our approach towards the safety and health of our workforce is to continuously improve performance through implementing robust management systems and providing adequate training, safety incentive and occupational health programs. The information concerning mine safety violations or other regulatory matters required by Section 1503(a) of the Dodd-Frank Wall Street Reform and Consumer Protection Act and Item 104 of Regulation S-K is included in Exhibit 95.1 to this quarterly report on Form 10-Q.
The exhibits to this report are listed in the Exhibit Index beginning on Page E-1 hereof.
FREEPORT-McMoRan COPPER & GOLD INC.
SIGNATURE
Pursuant to the requirements of the Securities Exchange Act of 1934, the registrant has duly caused this report to be signed on its behalf by the undersigned hereunto duly authorized.
|
| | |
| | FREEPORT-McMoRan COPPER & GOLD INC. |
| | | |
| | By: | /s/ Kathleen L. QuirkC. Donald Whitmire, Jr. |
| | | Kathleen L. QuirkC. Donald Whitmire, Jr. |
| | | Executive Vice President and |
| | | ChiefController - Financial Officer & TreasurerReporting |
| | | (authorized signatory |
| | | and Principal FinancialAccounting Officer) |
Date: November 2, 2012May 6, 2013
|
| | | | | |
| FREEPORT-McMoRan COPPER & GOLD INC. |
| EXHIBIT INDEX |
| | | Filed | |
| Exhibit | | with this | Incorporated by Reference |
| Number | Exhibit Title | Form 10-Q | Form | File No. | Date Filed |
| 3.1 | Composite Certificate of Incorporation of FCX. | | 10-Q | 001-11307-01 | 8/6/2010 |
| 3.2 | Amended and Restated By-Laws of FCX, as amended through February 2, 2010.April 17, 2013 | | 8-K | 001-11307-01 | 2/5/20104/17/2013 |
| 4.1 | Indenture dated as of March 19, 2007, from FCX to The Bank of New York, as Trustee, with respect to the Senior Floating Rate Notes due 2015. | | 8-K | 001-11307-01 | 3/19/2007 |
| 4.2 | Indenture dated as of February 13, 2012 between FCX and U.S. Bank National Association, as trustee. | | 8-K | 001-11307-01 | 2/13/2012 |
4.2 | First Supplemental Indenture dated as of February 13, 2012, between FCXFreeport-McMoRan Copper & Gold Inc. and U.S. Bank National Association, as trustee. | | 8-K | 001-11307-01 | 2/13/2012 |
| 4.3 | SecondFirst Supplemental Indenture dated as of February 13, 2012 between FCXFreeport-McMoRan Copper & Gold Inc. and U.S. Bank National Association, as trustee. | | 8-K | 001-11307-01 | 2/13/2012 |
| 4.4 | ThirdSecond Supplemental Indenture dated as of February 13, 2012 between FCXFreeport-McMoRan Copper & Gold Inc. and U.S. Bank National Association, as trustee. | | 8-K | 001-11307-01 | 2/13/2012 |
| 4.5 | Third Supplemental Indenture dated as of February 13, 2012 between Freeport-McMoRan Copper & Gold Inc. and U.S. Bank National Association, as trustee. | | 8-K | 001-11307-01 | 2/13/2012 |
| 4.6 | Indenture, dated as of March 7, 2013, between Freeport McMoRan Copper & Gold Inc. and U.S. Bank National Association, as trustee. | | 8-K | 001-11307-01 | 3/7/2013 |
| 4.7 | Registration Rights Agreement dated as of March 7, 2013, among Freeport McMoRan Copper & Gold Inc. and J.P. Morgan Securities LLC and Merrill Lynch, Pierce, Fenner & Smith Incorporated, as representatives of the Initial Purchasers, relating to the 2.375% Senior Notes due 2018. | | 8-K | 001-11307-01 | 3/7/2013 |
| 4.8 | Registration Rights Agreement dated as of March 7, 2013, among Freeport McMoRan Copper & Gold Inc. and J.P. Morgan Securities LLC and Merrill Lynch, Pierce, Fenner & Smith Incorporated, as representatives of the Initial Purchasers, relating to the 3.100% Senior Notes due 2020. | | 8-K | 001-11307-01 | 3/7/2013 |
| 4.9 | Registration Rights Agreement dated as of March 7, 2013, among Freeport McMoRan Copper & Gold Inc. and J.P. Morgan Securities LLC and Merrill Lynch, Pierce, Fenner & Smith Incorporated, as representatives of the Initial Purchasers, relating to the 3.875% Senior Notes due 2023. | | 8-K | 001-11307-01 | 3/7/2013 |
| 4.1 | Registration Rights Agreement dated as of March 7, 2013, among Freeport McMoRan Copper & Gold Inc. and J.P. Morgan Securities LLC and Merrill Lynch, Pierce, Fenner & Smith Incorporated, as representatives of the Initial Purchasers, relating to the 5.450% Senior Notes due 2043. | | 8-K | 001-11307-01 | 3/7/2013 |
| 10.1 | Purchase Agreement dated as of February 28, 2013 among Freeport-McMoRan Copper & Gold Inc. and J.P. Morgan Securities LLC and Merrill Lynch, Pierce, Fenner & Smith Incorporated, as representatives of the several initial purchasers named in Schedule 1 thereto. | | 8-K | 001-11307-01 | 3/5/2013 |
| Letter from Ernst & Young LLP regarding unaudited interim financial statements. | X | | | |
| Certification of Principal Executive Officer pursuant to Rule 13a-14(a)/15d – 14(a). | X | | | |
| Certification of Principal Financial Officer pursuant to Rule 13a-14(a)/15d – 14(a). | X | | | |
| Certification of Principal Executive Officer pursuant to 18 U.S.C. Section 1350. | X | | | |
|
| | | | | |
| FREEPORT-McMoRan COPPER & GOLD INC. |
| EXHIBIT INDEX |
| | Filed | |
| Exhibit | | with this | Incorporated by Reference |
| Number | Exhibit Title | Form 10-Q | Form | File No. | Date Filed |
| Certification of Principal Financial Officer pursuant to 18 U.S.C Section 1350. | X | | | |
| Mine Safety and Health Administration Safety Data. | X | | | |
| 101.INS | XBRL Instance Document. | X | | | |
| 101.SCH | XBRL Taxonomy Extension Schema. | X | | | |
| 101.CAL | XBRL Taxonomy Extension Calculation Linkbase. | X | | | |
| 101.DEF | XBRL Taxonomy Extension Definition Linkbase. | X | | | |
| 101.LAB | XBRL Taxonomy Extension Label Linkbase. | X | | | |
| 101.PRE | XBRL Taxonomy Extension Presentation Linkbase. | X | | | |