United States
SECURITIES AND EXCHANGE COMMISSION
Washington, D.C. 20549
FORM 10-Q
(Mark one)
| | | | | |
| ☒ | QUARTERLY REPORT PURSUANT TO SECTION 13 OR 15(d) OF THE SECURITIES EXCHANGE ACT OF 1934 |
For the quarterly period ended September 30, 2023March 31, 2024
OR
| | | | | |
| ☐ | TRANSITION REPORT PURSUANT TO SECTION 13 OR 15(d) OF THE SECURITIES EXCHANGE ACT OF 1934 |
For the transition period from to
Commission file number: 001-11307-01
Freeport-McMoRan Inc.
(Exact name of registrant as specified in its charter)
| | | | | | | | |
| Delaware | | 74-2480931 |
| (State or other jurisdiction of | | (I.R.S. Employer Identification No.) |
| incorporation or organization) | | |
| | | | | | | | | | | | | | | | | | | | |
| 333 North Central Avenue | | | | |
| Phoenix | | AZ | | | | 85004-2189 |
| (Address of principal executive offices) | | | | (Zip Code) |
(602) 366-8100
(Registrant’s telephone number, including area code)
Securities registered pursuant to Section 12(b) of the Act:
| | | | | | | | |
| Title of each class | Trading Symbol(s) | Name of each exchange on which registered |
| Common Stock, par value $0.10 per share | FCX | The New York Stock Exchange |
Indicate by check mark whether the registrant (1) has filed all reports required to be filed by Section 13 or 15(d) of the Securities Exchange Act of 1934 during the preceding 12 months (or for such shorter period that the registrant was required to file such reports), and (2) has been subject to such filing requirements for the past 90 days. ☑ Yes ☐ No
Indicate by check mark whether the registrant has submitted electronically every Interactive Data File required to be submitted pursuant to Rule 405 of Regulation S-T (§ 232.405 of this chapter) during the preceding 12 months (or for such shorter period that the registrant was required to submit such files). ☑ Yes ☐ No
Indicate by check mark whether the registrant is a large accelerated filer, an accelerated filer, a non-accelerated filer, or a smaller reporting company, or an emerging growth company. See the definitions of “large accelerated filer,” “accelerated filer,” “smaller reporting company,” and “emerging growth company” in Rule 12b-2 of the Exchange Act.
| | | | | | | | | | | |
| Large accelerated filer | ☑ | Accelerated filer | ☐ |
| Non-accelerated filer | ☐ | Smaller reporting company | ☐ |
| | Emerging growth company | ☐ |
If an emerging growth company, indicate by check mark if the registrant has elected not to use the extended transition period for complying with any new or revised financial accounting standards provided pursuant to Section 13(a) of the Exchange Act. ☐
Indicate by check mark whether the registrant is a shell company (as defined in Rule 12b-2 of the Exchange Act). ☐ Yes ☑ No
On October 31, 2023,April 30, 2024, there were issued and outstanding 1,433,977,2441,436,489,977 shares of the registrant’s common stock, par value $0.10 per share.
Freeport-McMoRan Inc.
TABLE OF CONTENTS
Part I.FINANCIAL INFORMATION
Item 1.Financial Statements.
Freeport-McMoRan Inc.
CONSOLIDATED BALANCE SHEETS (Unaudited)
| | September 30,
2023 | | December 31,
2022 |
| March 31,
2024 | | | March 31,
2024 | | December 31,
2023 |
| | | (In Millions) | | (In Millions) |
| ASSETS | ASSETS | | | | ASSETS | | | |
| Current assets: | Current assets: | | | | Current assets: | | | |
| Cash and cash equivalents | Cash and cash equivalents | $ | 5,745 | | | $ | 8,146 | |
| Restricted cash and cash equivalents | Restricted cash and cash equivalents | 697 | | | 111 | |
| Trade accounts receivable | Trade accounts receivable | 792 | | | 1,336 | |
| Income and other tax receivables | Income and other tax receivables | 488 | | | 459 | |
| | Inventories: | Inventories: | | |
| Inventories: | |
| Inventories: | | | | |
| Product | Product | 2,415 | | | 1,833 | |
| Materials and supplies, net | Materials and supplies, net | 2,131 | | | 1,964 | |
| Mill and leach stockpiles | Mill and leach stockpiles | 1,403 | | | 1,383 | |
| | Other current assets | Other current assets | 406 | | | 381 | |
| Other current assets | |
| Other current assets | |
| | Total current assets | |
| Total current assets | |
| Total current assets | Total current assets | 14,077 | | | 15,613 | |
| Property, plant, equipment and mine development costs, net | Property, plant, equipment and mine development costs, net | 34,535 | | | 32,627 | |
| | Long-term mill and leach stockpiles | Long-term mill and leach stockpiles | 1,327 | | | 1,252 | |
| | Long-term mill and leach stockpiles | |
| | Long-term mill and leach stockpiles | |
| | Other assets | |
| Other assets | |
| Other assets | Other assets | 1,709 | | | 1,601 | |
| | Total assets | Total assets | $ | 51,648 | | | $ | 51,093 | |
| Total assets | |
| Total assets | |
| | LIABILITIES AND EQUITY | |
| LIABILITIES AND EQUITY | |
| LIABILITIES AND EQUITY | LIABILITIES AND EQUITY | | | | | | |
| Current liabilities: | Current liabilities: | | | | Current liabilities: | | | |
| Accounts payable and accrued liabilities | Accounts payable and accrued liabilities | $ | 3,724 | | | $ | 4,027 | |
| Accrued income taxes | Accrued income taxes | 489 | | | 744 | |
| Current portion of environmental and asset retirement obligations (AROs) | 395 | | | 320 | |
| Current portion of debt | |
| Current portion of environmental and asset retirement obligations | |
| Dividends payable | Dividends payable | 217 | | | 217 | |
| | Current portion of debt | 35 | | | 1,037 | |
| Total current liabilities | |
| Total current liabilities | |
| Total current liabilities | Total current liabilities | 4,860 | | | 6,345 | |
| Long-term debt, less current portion | Long-term debt, less current portion | 9,370 | | | 9,583 | |
| Environmental and AROs, less current portion | 4,645 | | | 4,463 | |
| Environmental and asset retirement obligations, less current portion | |
| Deferred income taxes | Deferred income taxes | 4,399 | | | 4,269 | |
| Other liabilities | Other liabilities | 1,697 | | | 1,562 | |
| | Total liabilities | Total liabilities | 24,971 | | | 26,222 | |
| Total liabilities | |
| Total liabilities | |
| | | Equity: | |
| | Equity: | |
| | Equity: | Equity: | | | | | | |
| Stockholders’ equity: | Stockholders’ equity: | | | | Stockholders’ equity: | | | |
| Common stock | Common stock | 162 | | | 161 | |
| Capital in excess of par value | Capital in excess of par value | 24,833 | | | 25,322 | |
| Accumulated deficit | Accumulated deficit | (2,447) | | | (3,907) | |
| Accumulated other comprehensive loss | Accumulated other comprehensive loss | (317) | | | (320) | |
| Common stock held in treasury | Common stock held in treasury | (5,772) | | | (5,701) | |
| Total stockholders’ equity | Total stockholders’ equity | 16,459 | | | 15,555 | |
| Noncontrolling interests | Noncontrolling interests | 10,218 | | | 9,316 | |
| Total equity | Total equity | 26,677 | | | 24,871 | |
| Total liabilities and equity | Total liabilities and equity | $ | 51,648 | | | $ | 51,093 | |
The accompanying notes are an integral part of these consolidated financial statements.
Freeport-McMoRan Inc.
CONSOLIDATED STATEMENTS OF INCOME (Unaudited)
| | Three Months Ended | |
| Three Months Ended | |
| Three Months Ended | |
| March 31, | |
| March 31, | |
| March 31, | |
| | | Three Months Ended | | Nine Months Ended |
| | September 30, | | September 30, |
| (In Millions, Except Per Share Amounts) | |
| (In Millions, Except Per Share Amounts) | |
| (In Millions, Except Per Share Amounts) | |
| Revenues | |
| Cost of sales: | |
| Cost of sales: | |
| Cost of sales: | |
| Production and delivery | |
| Production and delivery | |
| Production and delivery | |
| Depreciation, depletion and amortization | |
| Depreciation, depletion and amortization | |
| Depreciation, depletion and amortization | |
| | | 2023 | | 2022 | | 2023 | | 2022 |
| | (In Millions, Except Per Share Amounts) |
| Revenues | $ | 5,824 | | | $ | 5,003 | | | $ | 16,950 | | | $ | 17,022 | |
| Cost of sales: | | | | |
| Production and delivery | 3,548 | | | 3,366 | | | 10,260 | | | 9,519 | |
| Depreciation, depletion and amortization (DD&A) | 533 | | | 508 | | | 1,479 | | | 1,504 | |
| Total cost of sales | |
| | Metals inventory adjustments | 5 | | | 25 | | | 7 | | | 43 | |
| | Total cost of sales | |
| | Total cost of sales | Total cost of sales | 4,086 | | | 3,899 | | | 11,746 | | | 11,066 | |
| Selling, general and administrative expenses | Selling, general and administrative expenses | 118 | | | 98 | | | 359 | | | 313 | |
| Mining exploration and research expenses | 30 | | | 38 | | | 103 | | | 87 | |
| Selling, general and administrative expenses | |
| Selling, general and administrative expenses | |
| Exploration and research expenses | |
| Exploration and research expenses | |
| Exploration and research expenses | |
| Environmental obligations and shutdown costs | Environmental obligations and shutdown costs | 98 | | | 6 | | | 239 | | | 51 | |
| Net gain on sales of assets | — | | | — | | | — | | | (2) | |
| Environmental obligations and shutdown costs | |
| Environmental obligations and shutdown costs | |
| | Total costs and expenses | |
| | Total costs and expenses | |
| | Total costs and expenses | Total costs and expenses | 4,332 | | | 4,041 | | | 12,447 | | | 11,515 | |
| Operating income | Operating income | 1,492 | | | 962 | | | 4,503 | | | 5,507 | |
| Operating income | |
| Operating income | |
| Interest expense, net | Interest expense, net | (96) | | | (140) | | | (418) | | | (423) | |
| Net gain on early extinguishment of debt | 5 | | | 20 | | | 10 | | | 28 | |
| Interest expense, net | |
| Interest expense, net | |
| | Other income, net | |
| | Other income, net | |
| | | Other income, net | Other income, net | 71 | | | 25 | | | 183 | | | 67 | |
| Income before income taxes and equity in affiliated companies’ net earnings | Income before income taxes and equity in affiliated companies’ net earnings | 1,472 | | | 867 | | | 4,278 | | | 5,179 | |
| Income before income taxes and equity in affiliated companies’ net earnings | |
| Income before income taxes and equity in affiliated companies’ net earnings | |
| Provision for income taxes | Provision for income taxes | (508) | | | (315) | | | (1,546) | | | (1,710) | |
| Provision for income taxes | |
| Provision for income taxes | |
| Equity in affiliated companies’ net earnings | |
| Equity in affiliated companies’ net earnings | |
| Equity in affiliated companies’ net earnings | Equity in affiliated companies’ net earnings | — | | | 8 | | | 12 | | | 33 | |
| | Net income | Net income | 964 | | | 560 | | | 2,744 | | | 3,502 | |
| | Net income | |
| | Net income | |
| | Net income attributable to noncontrolling interests | |
| | Net income attributable to noncontrolling interests | |
| | Net income attributable to noncontrolling interests | Net income attributable to noncontrolling interests | (510) | | | (156) | | | (1,284) | | | (731) | |
| | Net income attributable to common stockholders | Net income attributable to common stockholders | $ | 454 | | | $ | 404 | | | $ | 1,460 | | | $ | 2,771 | |
| | | Net income attributable to common stockholders | |
| | Net income attributable to common stockholders | |
| | Net income per share attributable to common stockholders: | |
| | Net income per share attributable to common stockholders: | |
| | Net income per share attributable to common stockholders: | Net income per share attributable to common stockholders: | |
| Basic | Basic | $ | 0.31 | | | $ | 0.28 | | | $ | 1.01 | | | $ | 1.91 | |
| Basic | |
| Basic | |
| Diluted | |
| Diluted | |
| Diluted | Diluted | $ | 0.31 | | | $ | 0.28 | | | $ | 1.01 | | | $ | 1.90 | |
| | | Weighted-average shares of common stock outstanding: | Weighted-average shares of common stock outstanding: | |
| | Weighted-average shares of common stock outstanding: | |
| | Weighted-average shares of common stock outstanding: | |
| Basic | Basic | 1,435 | | | 1,431 | | | 1,434 | | | 1,444 | |
| Basic | |
| Basic | |
| Diluted | |
| Diluted | |
| Diluted | Diluted | 1,443 | | | 1,439 | | | 1,443 | | | 1,455 | |
| | Dividends declared per share of common stock | Dividends declared per share of common stock | $ | 0.15 | | | $ | 0.15 | | | $ | 0.45 | | | $ | 0.45 | |
| | Dividends declared per share of common stock | |
| | Dividends declared per share of common stock | |
The accompanying notes are an integral part of these consolidated financial statements.
Freeport-McMoRan Inc.
CONSOLIDATED STATEMENTS OF COMPREHENSIVE INCOME (Unaudited)
| | Three Months Ended | | Nine Months Ended |
| September 30, | | September 30, |
| 2023 | | 2022 | | 2023 | | 2022 |
| (In Millions) |
| | | Three Months Ended | |
| | | Three Months Ended | |
| | | Three Months Ended | |
| | | March 31, | | | | | March 31, |
| | | | | 2024 | | | | | | | 2024 | | 2023 |
| | | | (In Millions) | | | | | | (In Millions) |
| Net income | Net income | $ | 964 | | | $ | 560 | | | $ | 2,744 | | | $ | 3,502 | |
| | Other comprehensive income, net of taxes: | |
| Other comprehensive income, net of taxes: | |
| Other comprehensive income, net of taxes: | Other comprehensive income, net of taxes: | |
| | Defined benefit plans: | Defined benefit plans: | |
| | Prior service costs arising during the period | — | | | — | | | — | | | (1) | |
| Defined benefit plans: | |
| | Defined benefit plans: | |
| | Amortization of unrecognized amounts included in net periodic benefit costs | Amortization of unrecognized amounts included in net periodic benefit costs | 1 | | | 1 | | | 3 | | | 5 | |
| Foreign exchange losses | (1) | | | — | | | — | | | (1) | |
| | Amortization of unrecognized amounts included in net periodic benefit costs | |
| | Amortization of unrecognized amounts included in net periodic benefit costs | |
| Foreign exchange (losses) gains | |
| | Other comprehensive income | Other comprehensive income | — | | | 1 | | | 3 | | | 3 | |
| | Other comprehensive income | |
| | Other comprehensive income | |
| | Total comprehensive income | |
| Total comprehensive income | |
| Total comprehensive income | Total comprehensive income | 964 | | | 561 | | | 2,747 | | | 3,505 | |
| Total comprehensive income attributable to noncontrolling interests | Total comprehensive income attributable to noncontrolling interests | (509) | | | (156) | | | (1,284) | | | (731) | |
| | Total comprehensive income attributable to common stockholders | Total comprehensive income attributable to common stockholders | $ | 455 | | | $ | 405 | | | $ | 1,463 | | | $ | 2,774 | |
| Total comprehensive income attributable to common stockholders | |
| Total comprehensive income attributable to common stockholders | |
The accompanying notes are an integral part of these consolidated financial statements.
Freeport-McMoRan Inc.
CONSOLIDATED STATEMENTS OF CASH FLOWS (Unaudited) | | Three Months Ended | |
| March 31, | |
| March 31, | |
| March 31, | |
| | |
| | | Nine Months Ended | |
| | September 30, | |
| | | 2023 | | 2022 | |
| | | (In Millions) | |
| Cash flow from operating activities: | Cash flow from operating activities: | | | | |
| Cash flow from operating activities: | |
| Cash flow from operating activities: | |
| Net income | |
| Net income | |
| Net income | Net income | $ | 2,744 | | | $ | 3,502 | | |
| Adjustments to reconcile net income to net cash provided by operating activities: | Adjustments to reconcile net income to net cash provided by operating activities: | | | | |
| DD&A | 1,479 | | | 1,504 | | |
| Adjustments to reconcile net income to net cash provided by operating activities: | |
| Adjustments to reconcile net income to net cash provided by operating activities: | |
| Depreciation, depletion and amortization | |
| Depreciation, depletion and amortization | |
| Depreciation, depletion and amortization | |
| | Metals inventory adjustments | 7 | | | 43 | | |
| | Net gain on sales of assets | — | | | (2) | | |
| | Stock-based compensation | Stock-based compensation | 89 | | | 75 | | |
| Net charges for environmental and AROs, including accretion | 383 | | | 180 | | |
| Payments for environmental and AROs | (181) | | | (197) | | |
| | Stock-based compensation | |
| | Stock-based compensation | |
| Net charges for environmental and asset retirement obligations, including accretion | |
| Net charges for environmental and asset retirement obligations, including accretion | |
| Net charges for environmental and asset retirement obligations, including accretion | |
| Payments for environmental and asset retirement obligations | |
| Payments for environmental and asset retirement obligations | |
| Payments for environmental and asset retirement obligations | |
| Net charges for defined pension and postretirement plans | |
| Net charges for defined pension and postretirement plans | |
| Net charges for defined pension and postretirement plans | Net charges for defined pension and postretirement plans | 44 | | | 28 | | |
| Pension plan contributions | Pension plan contributions | (10) | | | (52) | | |
| Net gain on early extinguishment of debt | (10) | | | (28) | | |
| Pension plan contributions | |
| Pension plan contributions | |
| | Deferred income taxes | Deferred income taxes | 130 | | | 83 | | |
| | Deferred profit recognized on PT Freeport Indonesia’s (PT-FI) sales to PT Smelting | (112) | | | (34) | | |
| Deferred income taxes | |
| | Deferred income taxes | |
| | Change in deferred profit on PT Freeport Indonesia’s sales to PT Smelting | |
| | Change in deferred profit on PT Freeport Indonesia’s sales to PT Smelting | |
| | Change in deferred profit on PT Freeport Indonesia’s sales to PT Smelting | |
| | Charges for social investment programs at PT Freeport Indonesia | |
| | Charges for social investment programs at PT Freeport Indonesia | |
| | Charges for social investment programs at PT Freeport Indonesia | |
| Payments for social investment programs at PT Freeport Indonesia | |
| Payments for social investment programs at PT Freeport Indonesia | |
| Payments for social investment programs at PT Freeport Indonesia | |
| | Other, net | |
| | Other, net | |
| | Other, net | Other, net | 109 | | | (52) | | |
| Changes in working capital and other: | Changes in working capital and other: | | | |
| Changes in working capital and other: | |
| Changes in working capital and other: | |
| Accounts receivable | |
| Accounts receivable | |
| Accounts receivable | Accounts receivable | 550 | | | 456 | | |
| Inventories | Inventories | (738) | | | (184) | | |
| Inventories | |
| Inventories | |
| Other current assets | |
| Other current assets | |
| Other current assets | Other current assets | 7 | | | (71) | | |
| Accounts payable and accrued liabilities | Accounts payable and accrued liabilities | (180) | | | 84 | | |
| Accounts payable and accrued liabilities | |
| Accounts payable and accrued liabilities | |
| Accrued income taxes and timing of other tax payments | Accrued income taxes and timing of other tax payments | (352) | | | (1,265) | | |
| Accrued income taxes and timing of other tax payments | |
| Accrued income taxes and timing of other tax payments | |
| Net cash provided by operating activities | |
| Net cash provided by operating activities | |
| Net cash provided by operating activities | Net cash provided by operating activities | 3,959 | | | 4,070 | | |
| | Cash flow from investing activities: | Cash flow from investing activities: | | |
| | Cash flow from investing activities: | |
| | Cash flow from investing activities: | |
| Capital expenditures: | |
| Capital expenditures: | |
| Capital expenditures: | Capital expenditures: | | |
| North America copper mines | North America copper mines | (545) | | | (430) | | |
| South America | (259) | | | (203) | | |
| North America copper mines | |
| North America copper mines | |
| South America operations | |
| South America operations | |
| South America operations | |
| Indonesia mining | |
| Indonesia mining | |
| Indonesia mining | Indonesia mining | (1,274) | | | (1,148) | | |
| Indonesia smelter projects | Indonesia smelter projects | (1,193) | | | (517) | | |
| Indonesia smelter projects | |
| Indonesia smelter projects | |
| Molybdenum mines | |
| Molybdenum mines | |
| Molybdenum mines | Molybdenum mines | (43) | | | (16) | | |
| | Other | Other | (148) | | | (108) | | |
| | Proceeds from sales of assets | 16 | | | 102 | | |
| Other | |
| | Other | |
| | | Loans to PT Smelting for expansion | Loans to PT Smelting for expansion | (109) | | | (51) | | |
| | Other, net | (29) | | | (10) | | |
| | Loans to PT Smelting for expansion | |
| | Loans to PT Smelting for expansion | |
| | Proceeds from sales of assets and other, net | |
| | Proceeds from sales of assets and other, net | |
| | Proceeds from sales of assets and other, net | |
| Net cash used in investing activities | |
| Net cash used in investing activities | |
| Net cash used in investing activities | Net cash used in investing activities | (3,584) | | | (2,381) | | |
| | Cash flow from financing activities: | Cash flow from financing activities: | | | | |
| | Cash flow from financing activities: | |
| | Cash flow from financing activities: | |
| Proceeds from debt | Proceeds from debt | 1,186 | | | 5,366 | | |
| Proceeds from debt | |
| Proceeds from debt | |
| Repayments of debt | |
| Repayments of debt | |
| Repayments of debt | Repayments of debt | (2,397) | | | (4,073) | | |
| | Cash dividends and distributions paid: | Cash dividends and distributions paid: | |
| | Cash dividends and distributions paid: | |
| | Cash dividends and distributions paid: | |
| Common stock | |
| Common stock | |
| Common stock | Common stock | (647) | | | (652) | | |
| Noncontrolling interests | Noncontrolling interests | (407) | | | (625) | | |
| Treasury stock purchases | — | | | (1,347) | | |
| Noncontrolling interests | |
| Noncontrolling interests | |
| | Contributions from noncontrolling interests | |
| | Contributions from noncontrolling interests | |
| | Contributions from noncontrolling interests | Contributions from noncontrolling interests | 50 | | | 142 | | |
| Proceeds from exercised stock options | Proceeds from exercised stock options | 41 | | | 106 | | |
| Proceeds from exercised stock options | |
| Proceeds from exercised stock options | |
| Payments for withholding of employee taxes related to stock-based awards | Payments for withholding of employee taxes related to stock-based awards | (50) | | | (55) | | |
| Debt financing costs and other, net | (2) | | | (41) | | |
| Payments for withholding of employee taxes related to stock-based awards | |
| Payments for withholding of employee taxes related to stock-based awards | |
| | Net cash used in financing activities | Net cash used in financing activities | (2,226) | | | (1,179) | | |
| | Net (decrease) increase in cash, cash equivalents and restricted cash and cash equivalents | (1,851) | | | 510 | | |
| Net cash used in financing activities | |
| | Cash, cash equivalents and restricted cash and cash equivalents at beginning of year | 8,390 | | | 8,314 | | |
| Cash, cash equivalents and restricted cash and cash equivalents at end of period | $ | 6,539 | | | $ | 8,824 | | |
| Net cash used in financing activities | |
| | Net increase (decrease) in cash and cash equivalents and restricted cash and cash equivalents | |
| | Net increase (decrease) in cash and cash equivalents and restricted cash and cash equivalents | |
| | Net increase (decrease) in cash and cash equivalents and restricted cash and cash equivalents | |
| | Cash and cash equivalents and restricted cash and cash equivalents at beginning of year | |
| | Cash and cash equivalents and restricted cash and cash equivalents at beginning of year | |
| | Cash and cash equivalents and restricted cash and cash equivalents at beginning of year | |
| Cash and cash equivalents and restricted cash and cash equivalents at end of period | |
| Cash and cash equivalents and restricted cash and cash equivalents at end of period | |
| Cash and cash equivalents and restricted cash and cash equivalents at end of period | |
The accompanying notes are an integral part of these consolidated financial statements.
Freeport-McMoRan Inc.
CONSOLIDATED STATEMENTS OF EQUITY (Unaudited)
THREE MONTHS ENDED SEPTEMBER 30MARCH 31
| | | | | Stockholders’ Equity | | |
| Common Stock | |
| Number
of
Shares | |
| Number
of
Shares | |
| Number
of
Shares | | | At Par
Value | | Capital in
Excess of
Par Value | | | | Number
of
Shares | | At
Cost | | | Non-
controlling
Interests | | Total
Equity |
| | | |
| | |
| | | (In Millions) |
| Balance at December 31, 2023 | |
| | | | Stockholders’ Equity | | | | |
| | Common Stock | | Accum-ulated Deficit | | Accumu-
lated
Other Compre-
hensive
Loss | | Common Stock
Held in Treasury | | Total
Stock-holders’ Equity | |
| | Number
of
Shares | | At Par
Value | | Capital in
Excess of
Par Value | | Number
of
Shares | | At
Cost | | Non-
controlling
Interests | | Total
Equity |
| | Accum-ulated Deficit | | Accumu-
lated
Other Compre-
hensive
Loss | | Total
Stock-holders’ Equity |
| Exercised and issued stock-based awards | |
| | | (In Millions) |
| Balance at June 30, 2023 | 1,618 | | | $ | 162 | | | $ | 25,028 | | | $ | (2,901) | | | $ | (318) | | | 184 | | | $ | (5,769) | | | $ | 16,202 | | | $ | 9,825 | | | $ | 26,027 | |
| | | Exercised and issued stock-based awards | |
| | Exercised and issued stock-based awards | Exercised and issued stock-based awards | — | | | — | | | 7 | | | — | | | — | | | — | | | — | | | 7 | | | — | | | 7 | |
| Stock-based compensation, including the tender of shares | Stock-based compensation, including the tender of shares | — | | | — | | | 14 | | | — | | | — | | | — | | | (3) | | | 11 | | | — | | | 11 | |
| | Dividends | Dividends | — | | | — | | | (216) | | | — | | | — | | | — | | | — | | | (216) | | | (116) | | | (332) | |
| | Dividends | |
| | Dividends | |
| | Net income attributable to common stockholders | |
| | Net income attributable to common stockholders | |
| | | Net income attributable to common stockholders | Net income attributable to common stockholders | — | | | — | | | — | | | 454 | | | — | | | — | | | — | | | 454 | | | — | | | 454 | |
| Net income attributable to noncontrolling interests | Net income attributable to noncontrolling interests | — | | | — | | | — | | | — | | | — | | | — | | | — | | | — | | | 510 | | | 510 | |
| Other comprehensive income (loss) | — | | | — | | | — | | | — | | | 1 | | | — | | | — | | | 1 | | | (1) | | | — | |
| Balance at September 30, 2023 | 1,618 | | | $ | 162 | | | $ | 24,833 | | | $ | (2,447) | | | $ | (317) | | | 184 | | | $ | (5,772) | | | $ | 16,459 | | | $ | 10,218 | | | $ | 26,677 | |
| | Balance at March 31, 2024 | |
| Balance at March 31, 2024 | |
| Balance at March 31, 2024 | |
| | | | | | | | | | | | | | | | | | | | | | | | | | | | | | | | | | | | | | | | | | | | | | | | | | | | | | | | | | | |
| | Stockholders’ Equity | | | | |
| Common Stock | | | | Accum-ulated Deficit | | Accumu-
lated
Other Compre-
hensive
Loss | | Common Stock
Held in Treasury | | Total
Stock-holders’ Equity | | | | |
| Number
of
Shares | | At Par
Value | | Capital in
Excess of
Par Value | | | | Number
of
Shares | | At
Cost | | | Non-
controlling
Interests | | Total
Equity |
| | | | | | | | | |
| | (In Millions) |
| Balance at June 30, 2022 | 1,612 | | | $ | 161 | | | $ | 25,661 | | | $ | (5,008) | | | $ | (386) | | | 177 | | | $ | (5,539) | | | $ | 14,889 | | | $ | 9,158 | | | $ | 24,047 | |
| | | | | | | | | | | | | | | | | | | |
| | | | | | | | | | | | | | | | | | | |
| | | | | | | | | | | | | | | | | | | |
| | | | | | | | | | | | | | | | | | | |
| | | | | | | | | | | | | | | | | | | |
| | | | | | | | | | | | | | | | | | | |
| Stock-based compensation, including the tender of shares | — | | | — | | | 12 | | | — | | | — | | | — | | | — | | | 12 | | | — | | | 12 | |
| Treasury stock purchases | — | | | — | | | — | | | — | | | — | | | 6 | | | (162) | | | (162) | | | — | | | (162) | |
| | | | | | | | | | | | | | | | | | | |
| | | | | | | | | | | | | | | | | | | |
| Dividends | — | | | — | | | (213) | | | — | | | — | | | — | | | — | | | (213) | | | (112) | | | (325) | |
| | | | | | | | | | | | | | | | | | | |
| | | | | | | | | | | | | | | | | | | |
| | | | | | | | | | | | | | | | | | | |
| Contributions from noncontrolling interests | — | | | — | | | 23 | | | — | | | — | | | — | | | — | | | 23 | | | 25 | | | 48 | |
| | | | | | | | | | | | | | | | | | | |
| | | | | | | | | | | | | | | | | | | |
| Net income attributable to common stockholders | — | | | — | | | — | | | 404 | | | — | | | — | | | — | | | 404 | | | — | | | 404 | |
| Net income attributable to noncontrolling interests | — | | | — | | | — | | | — | | | — | | | — | | | — | | | — | | | 156 | | | 156 | |
| Other comprehensive income | — | | | — | | | — | | | — | | | 1 | | | — | | | — | | | 1 | | | — | | | 1 | |
| Balance at September 30, 2022 | 1,612 | | | $ | 161 | | | $ | 25,483 | | | $ | (4,604) | | | $ | (385) | | | 183 | | | $ | (5,701) | | | $ | 14,954 | | | $ | 9,227 | | | $ | 24,181 | |
Freeport-McMoRan Inc.
CONSOLIDATED STATEMENTS OF EQUITY (Unaudited) (continued)
NINE MONTHS ENDED SEPTEMBER 30
| | | | | | | | | | | | | | | | | | | | | | | | | | | | | | | | | | | | | | | | | | | | | | | | | | | | | | | | | | | |
| | | | | | | | | | | | | | | | | | | |
| | Stockholders’ Equity | | | | |
| Common Stock | | | | Accum-ulated Deficit | | Accumu-
lated
Other Compre-
hensive
Loss | | Common Stock
Held in Treasury | | Total
Stock-holders’ Equity | | | | |
| Number
of
Shares | | At Par
Value | | Capital in
Excess of
Par Value | | | | Number
of
Shares | | At
Cost | | | Non-
controlling
Interests | | Total
Equity |
| | | | | | | | | |
| | (In Millions) |
| Balance at December 31, 2022 | 1,613 | | | $ | 161 | | | $ | 25,322 | | | $ | (3,907) | | | $ | (320) | | | 183 | | | $ | (5,701) | | | $ | 15,555 | | | $ | 9,316 | | | $ | 24,871 | |
| | | | | | | | | | | | | | | | | | | |
| | | | | | | | | | | | | | | | | | | |
| | | | | | | | | | | | | | | | | | | |
| Exercised and issued stock-based awards | 5 | | | 1 | | | 62 | | | — | | | — | | | — | | | — | | | 63 | | | — | | | 63 | |
| Stock-based compensation, including the tender of shares | — | | | — | | | 74 | | | — | | | — | | | 1 | | | (71) | | | 3 | | | (1) | | | 2 | |
| | | | | | | | | | | | | | | | | | | |
| | | | | | | | | | | | | | | | | | | |
| Dividends | — | | | — | | | (649) | | | — | | | — | | | — | | | — | | | (649) | | | (407) | | | (1,056) | |
| | | | | | | | | | | | | | | | | | | |
| Contributions from noncontrolling interests | — | | | — | | | 24 | | | — | | | — | | | — | | | — | | | 24 | | | 26 | | | 50 | |
| Net income attributable to common stockholders | — | | | — | | | — | | | 1,460 | | | — | | | — | | | — | | | 1,460 | | | — | | | 1,460 | |
| Net income attributable to noncontrolling interests | — | | | — | | | — | | | — | | | — | | | — | | | — | | | — | | | 1,284 | | | 1,284 | |
| Other comprehensive income | — | | | — | | | — | | | — | | | 3 | | | — | | | — | | | 3 | | | — | | | 3 | |
| Balance at September 30, 2023 | 1,618 | | | $ | 162 | | | $ | 24,833 | | | $ | (2,447) | | | $ | (317) | | | 184 | | | $ | (5,772) | | | $ | 16,459 | | | $ | 10,218 | | | $ | 26,677 | |
| | | | | | | | | | | | | | | | | | | |
| | | | | | | | | | | | | | | | | | | | | | | | | | | | | | | | | | | | | | | | | | | | | | | | | | | | | | | | | | | |
| | | | | | | | | | | | | | | | | | | |
| | Stockholders’ Equity | | | | |
| Common Stock | | | | Accum-ulated Deficit | | Accumu-
lated
Other Compre-
hensive
Loss | | Common Stock
Held in Treasury | | Total
Stock-holders’ Equity | | | | |
| Number
of
Shares | | At Par
Value | | Capital in
Excess of
Par Value | | | | Number
of
Shares | | At
Cost | | | Non-
controlling
Interests | | Total
Equity |
| | | | | | | | | |
| | (In Millions) |
| Balance at December 31, 2021 | 1,603 | | | $ | 160 | | | $ | 25,875 | | | $ | (7,375) | | | $ | (388) | | | 146 | | | $ | (4,292) | | | $ | 13,980 | | | $ | 9,039 | | | $ | 23,019 | |
| | | | | | | | | | | | | | | | | | | |
| | | | | | | | | | | | | | | | | | | |
| | | | | | | | | | | | | | | | | | | |
| | | | | | | | | | | | | | | | | | | |
| | | | | | | | | | | | | | | | | | | |
| Exercised and issued stock-based awards | 9 | | | 1 | | | 112 | | | — | | | — | | | — | | | — | | | 113 | | | — | | | 113 | |
| Stock-based compensation, including the tender of shares | — | | | — | | | 75 | | | — | | | — | | | 2 | | | (62) | | | 13 | | | (11) | | | 2 | |
| Treasury stock purchases | — | | | — | | | — | | | — | | | — | | | 35 | | | (1,347) | | | (1,347) | | | — | | | (1,347) | |
| | | | | | | | | | | | | | | | | | | |
| | | | | | | | | | | | | | | | | | | |
| Dividends | — | | | — | | | (648) | | | — | | | — | | | — | | | — | | | (648) | | | (605) | | | (1,253) | |
| | | | | | | | | | | | | | | | | | | |
| | | | | | | | | | | | | | | | | | | |
| | | | | | | | | | | | | | | | | | | |
| Contributions from noncontrolling interests | — | | | — | | | 69 | | | — | | | — | | | — | | | — | | | 69 | | | 73 | | | 142 | |
| | | | | | | | | | | | | | | | | | | |
| Net income attributable to common stockholders | — | | | — | | | — | | | 2,771 | | | — | | | — | | | — | | | 2,771 | | | — | | | 2,771 | |
| Net income attributable to noncontrolling interests | — | | | — | | | — | | | — | | | — | | | — | | | — | | | — | | | 731 | | | 731 | |
| Other comprehensive income | — | | | — | | | — | | | — | | | 3 | | | — | | | — | | | 3 | | | — | | | 3 | |
| Balance at September 30, 2022 | 1,612 | | | $ | 161 | | | $ | 25,483 | | | $ | (4,604) | | | $ | (385) | | | 183 | | | $ | (5,701) | | | $ | 14,954 | | | $ | 9,227 | | | $ | 24,181 | |
| | | | | | | | | | | | | | | | | | | |
| | | | | | | | | | | | | | | | | | | | | | | | | | | | | | | | | | | | | | | | | | | | | | | | | | | | | | | | | | | |
| | Stockholders’ Equity | | | | |
| Common Stock | | | | Accum-ulated Deficit | | Accumu-
lated
Other Compre-
hensive
Loss | | Common Stock
Held in Treasury | | Total
Stock-holders’ Equity | | | | |
| Number
of
Shares | | At Par
Value | | Capital in
Excess of
Par Value | | | | Number
of
Shares | | At
Cost | | | Non-
controlling
Interests | | Total
Equity |
| | | | | | | | | |
| | (In Millions) |
| Balance at December 31, 2022 | 1,613 | | | $ | 161 | | | $ | 25,322 | | | $ | (3,907) | | | $ | (320) | | | 183 | | | $ | (5,701) | | | $ | 15,555 | | | $ | 9,316 | | | $ | 24,871 | |
| | | | | | | | | | | | | | | | | | | |
| | | | | | | | | | | | | | | | | | | |
| | | | | | | | | | | | | | | | | | | |
| | | | | | | | | | | | | | | | | | | |
| | | | | | | | | | | | | | | | | | | |
| Exercised and issued stock-based awards | 5 | | | 1 | | | 52 | | | — | | | — | | | — | | | — | | | 53 | | | — | | | 53 | |
| Stock-based compensation, including the tender of shares | — | | | — | | | 46 | | | — | | | — | | | 1 | | | (68) | | | (22) | | | (1) | | | (23) | |
| | | | | | | | | | | | | | | | | | | |
| | | | | | | | | | | | | | | | | | | |
| | | | | | | | | | | | | | | | | | | |
| Dividends | — | | | — | | | (217) | | | — | | | — | | | — | | | — | | | (217) | | | (137) | | | (354) | |
| | | | | | | | | | | | | | | | | | | |
| | | | | | | | | | | | | | | | | | | |
| | | | | | | | | | | | | | | | | | | |
| Contributions from noncontrolling interests | — | | | — | | | 24 | | | — | | | — | | | — | | | — | | | 24 | | | 26 | | | 50 | |
| | | | | | | | | | | | | | | | | | | |
| | | | | | | | | | | | | | | | | | | |
| Net income attributable to common stockholders | — | | | — | | | — | | | 663 | | | — | | | — | | | — | | | 663 | | | — | | | 663 | |
| Net income attributable to noncontrolling interests | — | | | — | | | — | | | — | | | — | | | — | | | — | | | — | | | 386 | | | 386 | |
| Other comprehensive income | — | | | — | | | — | | | — | | | 1 | | | — | | | — | | | 1 | | | 1 | | | 2 | |
| Balance at March 31, 2023 | 1,618 | | | $ | 162 | | | $ | 25,227 | | | $ | (3,244) | | | $ | (319) | | | 184 | | | $ | (5,769) | | | $ | 16,057 | | | $ | 9,591 | | | $ | 25,648 | |
The accompanying notes are an integral part of these consolidated financial statements.
Freeport-McMoRan Inc.
NOTES TO CONSOLIDATED FINANCIAL STATEMENTS (Unaudited)
NOTE 1. GENERAL INFORMATION
The accompanying unaudited consolidated financial statements have been prepared in accordance with the instructions to Form 10-Q and do not include all information and disclosures required by generally accepted accounting principles in the United States (U.S.). Therefore, this information should be read in conjunction with Freeport-McMoRan Inc.’s (FCX) consolidated financial statements and notes contained in its annual report on Form 10-K for the year ended December 31, 2022 (20222023 (2023 Form 10-K). The information furnished herein reflects all adjustments that are, in the opinion of management, necessary for a fair statement of the results for the interim periods reported. All such adjustments are, in the opinion of management, of a normal recurring nature. Operating results for the nine-monththree-month period ended September 30, 2023,March 31, 2024, are not necessarily indicative of the results that may be expected for the year ending December 31, 2023.2024. Dollar amounts in tables are stated in millions, except per share amounts.
PT-FI.Attribution of PT Freeport Indonesia’s Net Income or Loss. FCX’s economic ownership interest in PT-FI is 48.76% and prior to January 1, 2023, FCX’s economic interest in PT-FI approximated 81%. As discussed in Note 3 of FCX’s 20222023 Form 10-K, in accordance with provisions pertaining to PT-FI’s shareholders agreement, FCX's first-quarterbeginning January 1, 2023, the attribution of PT Freeport Indonesia’s (PT-FI) net income included a $35or loss is based on equity ownership percentages (48.76% for FCX, 26.24% for PT Mineral Industri Indonesia (MIND ID) and 25.00% for PT Indonesia Papua Metal Dan Mineral) with certain exceptions, as contemplated by the economics replacement agreement in the PT-FI shareholders agreement.
As further discussed in Note 4, during first-quarter 2024, PT-FI recorded net credits of $215 million net benefit associated with PT-FI sales volumesthe closure of its 2021 corporate income tax audit and resolution of the framework for disputed tax matters. PT-FI’s net income and cash dividends associated with the settlement of this historical tax matter that originated before December 31, 2022, were attributed approximately 81% to FCX at its previous approximateFCX.
As discussed in Note 3 of FCX’s 2023 Form 10-K, because PT-FI did not achieve the Gold Target during the Initial Period (as defined in the PT-FI shareholders agreement), PT-FI’s net income and cash dividends associated with the sale of approximately 190,000 ounces of gold during 2023 were attributed approximately 81% economic ownership interest.to FCX.
Subsequent Events. FCX evaluated events after September 30, 2023,March 31, 2024, and through the date the consolidated financial statements were issued and determined any events and transactions occurring during this period that would require recognition or disclosure are appropriately addressed in these consolidated financial statements.
NOTE 2. EARNINGS PER SHARE
FCX calculates its basic net income per share of common stock under the two-class method and calculates its diluted net income per share of common stock using the more dilutive of the two-class method or the treasury-stock method. Basic net income per share of common stock was computed by dividing net income attributable to common stockholders (after deducting accumulated dividends and undistributed earnings to participating securities) by the weighted-average shares of common stock outstanding during the period. Diluted net income per share of common stock was calculated by including the basic weighted-average shares of common stock outstanding adjusted for the effects of all potential dilutive shares of common stock, unless their effect would be antidilutive.
Reconciliations of net income and weighted-average shares of common stock outstanding for purposes of calculating basic and diluted net income per share follow (in millions, except per share amounts):follow:
| | Three Months Ended | |
| Three Months Ended | |
| Three Months Ended | |
| March 31, | |
| March 31, | |
| March 31, | |
| | Three Months Ended | | Nine Months Ended | |
| | September 30, | | September 30, | |
| | | 2023 | | 2022 | | 2023 | | 2022 | |
| Net income | Net income | $ | 964 | | | $ | 560 | | | $ | 2,744 | | | $ | 3,502 | | |
| Net income | |
| Net income | |
| Net income attributable to noncontrolling interests | Net income attributable to noncontrolling interests | (510) | | | (156) | | | (1,284) | | | (731) | | |
| Net income attributable to noncontrolling interests | |
| Net income attributable to noncontrolling interests | |
| | Undistributed dividends and earnings allocated to participating securities | |
| | Undistributed dividends and earnings allocated to participating securities | |
| | Undistributed dividends and earnings allocated to participating securities | Undistributed dividends and earnings allocated to participating securities | (5) | | | (5) | | | (5) | | | (6) | | |
| | Net income attributable to common stockholders | Net income attributable to common stockholders | $ | 449 | | | $ | 399 | | | $ | 1,455 | | | $ | 2,765 | | |
| | | | Net income attributable to common stockholders | |
| | Net income attributable to common stockholders | |
| | Basic weighted-average shares of common stock outstanding | |
| | Basic weighted-average shares of common stock outstanding | |
| | Basic weighted-average shares of common stock outstanding | Basic weighted-average shares of common stock outstanding | 1,435 | | | 1,431 | | | 1,434 | | | 1,444 | | |
| Add shares issuable upon exercise or vesting of dilutive stock options and restricted stock units (RSUs) | Add shares issuable upon exercise or vesting of dilutive stock options and restricted stock units (RSUs) | 8 | | | 8 | | | 9 | | | 11 | | |
| Add shares issuable upon exercise or vesting of dilutive stock options and restricted stock units (RSUs) | |
| Add shares issuable upon exercise or vesting of dilutive stock options and restricted stock units (RSUs) | |
| Diluted weighted-average shares of common stock outstanding | Diluted weighted-average shares of common stock outstanding | 1,443 | | | 1,439 | | | 1,443 | | | 1,455 | | |
| Diluted weighted-average shares of common stock outstanding | |
| Diluted weighted-average shares of common stock outstanding | |
| | Net income per share attributable to common stockholders: | |
| | Net income per share attributable to common stockholders: | |
| | Net income per share attributable to common stockholders: | Net income per share attributable to common stockholders: | |
| | Basic | Basic | $ | 0.31 | | | $ | 0.28 | | | $ | 1.01 | | | $ | 1.91 | | |
| | Basic | |
| | Basic | |
| | | Diluted | Diluted | $ | 0.31 | | | $ | 0.28 | | | $ | 1.01 | | | $ | 1.90 | | |
| | Diluted | |
| | Diluted | |
Shares associated with outstanding stock options with exercise prices greater than the average market price of FCX’s common stock during the period are excluded from the computation of diluted net income per share of common stock. There were no shares of common stock associated with outstanding stock options excluded in the
third quarter and first nine months of 2023, and 3 million shares and 1 million shares excluded for the third quarter and first nine months of 2022, respectively.first-quarter 2024 or 2023.
NOTE 3. INVENTORIES, INCLUDING LONG-TERM MILL AND LEACH STOCKPILES
The components of inventories follow (in millions):follow:
| | September 30,
2023 | | December 31, 2022 | |
| March 31,
2024 | |
| Current inventories: | |
| Current inventories: | |
| Current inventories: | Current inventories: | | | | |
| Raw materials (primarily copper concentrate) | Raw materials (primarily copper concentrate) | $ | 467 | | | $ | 443 | | |
| Raw materials (primarily copper concentrate) | |
| Raw materials (primarily copper concentrate) | |
| Work-in-process | Work-in-process | 219 | | | 221 | | |
Finished goodsa | 1,729 | | | 1,169 | | |
| Work-in-process | |
| Work-in-process | |
| Finished goods | |
| Finished goods | |
| Finished goods | |
| Total product | |
| Total product | |
| Total product | Total product | $ | 2,415 | | | $ | 1,833 | | |
| Total materials and supplies, netb | $ | 2,131 | | | $ | 1,964 | | |
Total materials and supplies, neta | |
| Total materials and supplies, neta | |
| Total materials and supplies, neta | |
| | Mill stockpiles | |
| | Mill stockpiles | |
| | Mill stockpiles | Mill stockpiles | $ | 165 | | | $ | 216 | | |
| Leach stockpiles | Leach stockpiles | 1,238 | | | 1,167 | | |
| Leach stockpiles | |
| Leach stockpiles | |
| Total current mill and leach stockpiles | |
| Total current mill and leach stockpiles | |
| Total current mill and leach stockpiles | Total current mill and leach stockpiles | $ | 1,403 | | | $ | 1,383 | | |
| | Long-term inventories: | Long-term inventories: | |
| | Long-term inventories: | |
| | Long-term inventories: | |
| Mill stockpiles | |
| Mill stockpiles | |
| Mill stockpiles | Mill stockpiles | $ | 260 | | | $ | 199 | | |
| Leach stockpiles | Leach stockpiles | 1,067 | | | 1,053 | | |
Total long-term mill and leach stockpilesc | $ | 1,327 | | | $ | 1,252 | | |
| Leach stockpiles | |
| Leach stockpiles | |
Total long-term mill and leach stockpilesb | |
Total long-term mill and leach stockpilesb | |
Total long-term mill and leach stockpilesb | |
a.The increase in finished goods inventory at September 30, 2023, was primarily associated with the change in PT-FI's commercial arrangement with PT Smelting (PT-FI’s 39.5% owned copper smelter and refinery in Gresik, Indonesia) from a copper concentrate sales agreement to a tolling arrangement beginning on January 1, 2023, and also included approximately 75 thousand ounces of gold available for sale pending approval of PT-FI’s export license for anode slimes. See Note 8 for further discussion.
b.Materials and supplies inventory was net of obsolescence reserves totaling $31$48 million at September 30, 2023,March 31, 2024, and $39$41 million at December 31, 2022.2023.
c.b.Estimated metals in stockpiles not expected to be recovered within the next 12 months.
NOTE 4. INCOME TAXES
Geographic sources of FCX’s (provision) benefit (provision) for income taxes follow (in millions):follow:
| | | | | | | | | | | | | | |
| Nine Months Ended | |
| September 30, | |
| | 2023 | | 2022 | |
| U.S. operations | $ | 3 | |
| $ | (5) | | |
| International operations | (1,549) | | | (1,705) | | a |
| Total | $ | (1,546) | | | $ | (1,710) | |
|
a.Includes a credit of $31 million, primarily associated with completion of Cerro Verde’s 2016 tax audit. | | | | | | | | | | | | | | |
| Three Months Ended | |
| March 31, | |
| | 2024 | | 2023 | |
| U.S. | $ | (1) | |
| $ | 4 | | |
| International | (511) | | | (503) | | |
| Total | $ | (512) | | | $ | (499) | |
|
FCX’s consolidated effective income tax rate is a function of the various rates in the jurisdictions where it operates and was 36%31% for first-quarter 2024, including a net benefit of $182 million related to closure of PT-FI’s 2021 corporate income tax audit and resolution of the framework for Indonesia disputed tax matters (see below for further discussion), and was 32% for first-quarter 2023. At current copper prices, FCX expects its U.S. jurisdiction to generate net losses for the first nine months of 2023 and 33% for the first nine months of 2022. A higher 2023year 2024 that will not result in a realized tax benefit; accordingly, applicable accounting rules require FCX to adjust its estimated annual effective income tax rate primarily reflectsto exclude the impact of pre-tax, nondeductible charges totaling $142 million for the first nine months of 2023 associated with contested tax rulings issued by the Peruvian Supreme Court. In addition, variations in the relative proportions of jurisdictional income result in fluctuations to FCX’s consolidated effective income tax rate. Because of its U.S. tax position, FCX does not record a tax impact for income or losses generated in the U.S.net losses.
Indonesia Tax Matters. During first-quarter 2024, in conjunction with closure of PT-FI’s 2021 corporate income tax audit and resolution of the framework for disputed tax matters, PT-FI recorded net credits of $215 million, including $199 million to provision for income taxes, $8 million to production and delivery and $8 million to interest expense, net. In addition, FCX recognized a charge of $17 million to provision for income taxes related to withholding taxes and a credit of $26 million in other income, net associated with the reduction in the related accrual to indemnify MIND ID from potential losses arising from historical tax disputes.
Resolution of the framework for disputed tax matters also resulted in a decrease of unrecognized tax benefits of $276 million and a decrease of $43 million in related interest and penalties, as well as a decrease in contingencies related to Indonesia tax matters of $179 million, including a $35 million decrease associated with penalties and interest. Refer to Notes 11 and 12 of FCX’s 2023 Form 10-K for further discussion.
U.S. Inflation Reduction Act of 2022.The provisions of the U.S. Inflation Reduction Act of 2022 (the Act) became applicable to FCX on January 1, 2023. The Act includes, among other provisions, a new Corporate Alternative Minimum Tax (CAMT) of 15% on the adjusted financial statement income (AFSI) of corporations with average AFSI exceeding $1.0 billion over a three-year period. FCX has made interpretations of certain provisions of the Act, and based on these interpretations, determined that the provisions of the Act did not impact FCX’s financial results for first-quarter 2024 or for the first nine months ofyear 2023.
There has been limited guidance released byAlthough the U.S. Department of the Treasury (the Treasury)(Treasury) published guidance in 2023 that provided some additional clarity on how the CAMT provisions of the Act shouldthese rules, regulations are yet to be applied or otherwise administered,published and uncertainty remains regarding their application. In October 2023, the Treasury stated publicly that it expects to issue proposed rules regarding the application of the CAMT by the end of 2023.CAMT. Future guidance released by the Treasury may differ from FCX’s interpretations of the Act, which could be material and may further limit itsFCX’s ability to realize future benefits from its U.S. net operating losses.
Pillar Two of the Global Anti-Base Erosion Rules. In December 2021, the Organisation for Economic Co-operation and Development (OECD) published a framework for Pillar Two of the Global Anti-Base Erosion Rules, which was designed to coordinate participating jurisdictions in updating the international tax system to ensure that large multinational companies pay a minimum level of income tax. Recommendations from the OECD regarding a global minimum income tax and other changes are being considered and/or implemented in jurisdictions where FCX operates. At current metals market prices, FCX believes enactment of the recommended framework in jurisdictions where it operates will result in minimal impacts to its financial results in the near term.
NOTE 5. DEBT AND EQUITY
The components of debt follow (in millions):follow:
| | | | | September 30,
2023 | | December 31, 2022 | | | March 31,
2024 | | December 31, 2023 |
| | Senior notes and debentures: | Senior notes and debentures: | | | | |
| | Senior notes and debentures: | |
| | Senior notes and debentures: | |
| Issued by FCX | |
| Issued by FCX | |
| Issued by FCX | Issued by FCX | | $ | 6,004 | | | $ | 7,225 | |
| Issued by PT-FI | Issued by PT-FI | | 2,980 | | | 2,978 | |
| Issued by Freeport Minerals Corporation | Issued by Freeport Minerals Corporation | | 354 | | | 355 | |
| | Other | Other | | 67 | | | 62 | |
| | Other | |
| | Other | |
| Total debt | Total debt | | 9,405 | | | 10,620 | |
| Less current portion of debt | Less current portion of debt | | (35) | | | (1,037) | |
| Long-term debt | Long-term debt | | $ | 9,370 | | | $ | 9,583 | |
Revolving Credit Facilities.
FCX and PT-FI have a $3.0 billion, unsecured revolving credit facility that matures in October 2027. Under the terms of the revolving credit facility, FCX may obtain loans and issue letters of credit in an aggregate amount of up to $3.0 billion, with PT-FI’s capacity limited to $500 million, and letters of credit issuance limited to $1.5 billion.billion and PT-FI’s capacity limited to $500 million. At September 30, 2023,March 31, 2024, FCX had $7 million in letters of credit issued under its revolving credit facility.
PT-FI has a $1.3$1.75 billion, unsecured revolving credit facility that matures in July 2026November 2028 and Cerro Verde has a $350 million, unsecured revolving credit facility that matures in May 2027.
At September 30, 2023,March 31, 2024, FCX, PT-FI and Cerro Verde had no borrowings outstanding under their respective revolving credit facilities and were in compliance with their respective covenants.
Senior Notes.
In March 2023, FCX repaid in full the outstanding principal balance of its 3.875% Senior Notes totaling $996 million at maturity.
Beginning in 2022 and through November 3, 2023, FCX has purchased $1.3 billion aggregate principal amount of its senior notes in open-market transactions for a total cost of $1.2 billion, including $102 million aggregate principal amount in third-quarter 2023 and $233 million in the first nine months of 2023. A summary of the senior note purchases and related gains on debt extinguishments for the first nine months of 2023 follows (in millions):
| | | | | | | | | | | | | | | | | | | | | | | | | | | | | |
| | | | | | | | | |
| Principal Amount | | Discounts/Deferred Issuance Costs | | Book Value | | Redemption Value | | Gain |
| | | | | | | | | |
| 5.00% Senior Notes due 2027 | $ | 17 | | | $ | — | | | $ | 17 | | | $ | 17 | | | $ | — | |
| 4.125% Senior Notes due 2028 | 61 | | | — | | | 61 | | | 58 | | | 3 | |
| 4.375% Senior Notes due 2028 | 46 | | | 1 | | | 45 | | | 43 | | | 2 | |
| 5.25% Senior Notes due 2029 | 31 | | | — | | | 31 | | | 31 | | | — | |
| 4.25% Senior Notes due 2030 | 50 | | | 1 | | | 49 | | | 46 | | | 3 | |
| 4.625% Senior Notes due 2030 | 28 | | | — | | | 28 | | | 26 | | | 2 | |
| | | | | | | | | |
| | | | | | | | | |
| $ | 233 | | | $ | 2 | | | $ | 231 | | | $ | 221 | | | $ | 10 | |
Interest Expense, Net. Consolidated interest costs (before capitalization) totaled $165$175 million in third-quarter 2023, $182first-quarter 2024 and $207 million in third-quarter 2022, $606 million for the first nine months offirst-quarter 2023, and $524 million for the first nine months of 2022. Consolidated interest costs (before capitalization) for the first nine months of 2023, includes
interest charges totaling $74which included $25 million associated with Cerro Verde’s contested tax rulings issued by the PeruvianPeru Supreme Court.Court in first-quarter 2023.
Capitalized interest added to property, plant, equipment and mine development costs, net, totaled $69$86 million in third-quarter 2023, $42first-quarter 2024 and $56 million in third-quarter 2022, $188 million for the first nine months of 2023 and $101 million for the first nine months of 2022.first-quarter 2023. The increase in capitalized interest costs in the 2023 periods,first-quarter 2024 compared to the 2022 periods,first-quarter 2023, primarily resulted from increased construction and development costs for projects in process, primarily at the Manyar smelter and precious metals refinery in Indonesia (collectively, the Indonesia smelter projects).
Share Repurchase Program and Dividends. Beginning in mid-2021 and through July 11, 2022, FCX acquired 47.8 million shares of its common stock under the share repurchase program for a total cost of $1.8 billion ($38.35 average cost per share). FCXcurrently has $3.2 billion available for repurchases under theits share repurchase program.
On September 20, 2023,March 27, 2024, FCX’s Board of Directors (Board) declared cash dividends totaling $0.15 per share on its common stock (including a $0.075 per share quarterly base cash dividend and a $0.075 per share quarterly variable, performance-based cash dividend), which waswere paid on NovemberMay 1, 2023,2024, to common stockholders of record as of October 13, 2023.April 15, 2024.
The declaration and payment of dividends (base or variable) and timing and amount of any share repurchases are at the discretion of FCX’s Board and management, respectively, and are subject to a number of factors, including not exceeding FCX’s net debt target, capital availability, FCX’s financial results, cash requirements, global economic conditions, changes in laws, contractual restrictions and other factors deemed relevant by FCX’s Board or management, as applicable. FCX’s share repurchase program may be modified, increased, suspended or terminated at any time at the Board’s discretion.
NOTE 6. FINANCIAL INSTRUMENTS
FCX does not purchase, hold or sell derivative financial instruments unless there is an existing asset or obligation, or it anticipates a future activity that is likely to occur and will result in exposure to market risks, which FCX intends to offset or mitigate. FCX does not enter into any derivative financial instruments for speculative purposes but has entered into derivative financial instruments in limited instances to achieve specific objectives. These objectives principally relate to managing risks associated with commodity price changes, foreign currency exchange rates and interest rates.
Commodity Contracts. From time to time, FCX has entered into derivative contracts to hedge the market risk associated with fluctuations in the prices of commodities it purchases and sells. Derivative financial instruments used by FCX to manage its risks do not contain credit risk-related contingent provisions.
A discussion of FCX’s derivative contracts and programs follows.
Derivatives Designated as Hedging Instruments - Fair Value Hedges.
Copper Futures and Swap Contracts. Some of FCX’s U.S. copper rod and cathode customers request a fixed market price instead of the Commodity Exchange Inc. (COMEX) average copper price in the month of shipment. FCX hedges this price exposure in a manner that allows it to receive the COMEX average price in the month of shipment while the customers pay the fixed price they requested. FCX accomplishes this by entering into copper futures or swap contracts. Hedging gains or losses from these copper futures and swap contracts are recorded in revenues. FCX did not have any significant gains or losses resulting from hedge ineffectiveness during the nine-month periods ended September 30, 2023 and 2022.first-quarter 2024 or 2023. At September 30, 2023,March 31, 2024, FCX held copper futures and swap contracts that qualified for hedge accounting for 8591 million pounds at an average contract price of $3.85$3.90 per pound, with maturities through MayDecember 2025.
Summary of Gains (Losses). A summary of the realized and unrealized gains (losses) recognized in revenues for derivative financial instruments related to commodity contracts that are designated and qualify as fair value hedge transactions, including on the related hedged item follows (in millions):follows:
| | | | Three Months Ended | | Nine Months Ended |
| | September 30, | | September 30, |
| | | 2023 | | 2022 | | 2023 | | 2022 |
| March 31, | |
| March 31, | |
| March 31, | |
| | |
| | |
| | |
| Copper futures and swap contracts: | |
| Copper futures and swap contracts: | |
| Copper futures and swap contracts: | Copper futures and swap contracts: | | | | | | | |
| Unrealized gains (losses): | Unrealized gains (losses): | | | | |
| Unrealized gains (losses): | |
| Unrealized gains (losses): | |
| Derivative financial instruments | |
| Derivative financial instruments | |
| Derivative financial instruments | Derivative financial instruments | $ | 2 | | | $ | 17 | | | $ | (9) | | | $ | (61) | |
| Hedged item – firm sales commitments | Hedged item – firm sales commitments | (2) | | | (17) | | | 9 | | | 61 | |
| Hedged item – firm sales commitments | |
| Hedged item – firm sales commitments | |
| | Realized losses: | | | | |
| Realized gains: | |
| | Realized gains: | |
| | Realized gains: | |
| Matured derivative financial instruments | Matured derivative financial instruments | (4) | | | (50) | | | (1) | | | (48) | |
| Matured derivative financial instruments | |
| Matured derivative financial instruments | |
Derivatives Not Designated as Hedging Instruments.
Embedded Derivatives. Certain FCX sales contracts provide for provisional pricing primarily based on the London Metal Exchange (LME) copper price or the COMEX copper price and the London Bullion Market Association (London) gold price at the time of shipment as specified in the contract. FCX receives market prices based on prices in the specified future month, which results in price fluctuations recorded in revenues until the date of settlement.
FCX records revenues and invoices customers at the time of shipment based on then-current LME or COMEX copper prices and the London gold price as specified in the contracts, which results in an embedded derivative (i.e., a pricing mechanism that is finalized after the time of delivery) that is required to be bifurcated from the host contract. The host contract is the sale of the metals contained in the concentrate, cathode or anode slimes at the then-current LME copper, COMEX copper or London gold prices. FCX applies the normal purchases and normal sales scope exception in accordance with derivatives and hedge accounting guidance to the host contract in its concentrate, cathode and anode slime sales agreements since these contracts do not allow for net settlement and always result in physical delivery. The embedded derivative does not qualify for hedge accounting and is adjusted to fair value through earnings each period, using the period-end LME or COMEX copper forward prices and the adjusted London gold price, until the date of final pricing. Similarly, FCX purchases copper under contracts that provide for provisional pricing. Mark-to-market price fluctuations from these embedded derivatives are recorded through the settlement date and are reflected in revenues for sales contracts and in inventory for purchase contracts.
A summary of FCX’s embedded derivatives at September 30, 2023,March 31, 2024, follows:
| | Open Positions | | | Open Positions | | Average Price
Per Unit | | Maturities Through |
| | Open Positions | | Average Price
Per Unit | | Maturities Through |
| | | Contract | | Market | |
| Embedded derivatives in provisional sales contracts: | |
| Embedded derivatives in provisional sales contracts: | |
| Embedded derivatives in provisional sales contracts: | Embedded derivatives in provisional sales contracts: | | | | | | | | | | |
| Copper (millions of pounds) | Copper (millions of pounds) | 553 | | | $ | 3.78 | | | $ | 3.75 | | | February 2024 | Copper (millions of pounds) | 463 | | | $ | | $ | 3.83 | | | $ | | $ | 4.01 | | | August 2024 | | August 2024 |
| Gold (thousands of ounces) | Gold (thousands of ounces) | 209 | | | 1,925 | | | 1,884 | | | December 2023 | Gold (thousands of ounces) | 286 | | | 2,091 | | 2,091 | | | 2,226 | | 2,226 | | | July 2024 | | July 2024 |
| Embedded derivatives in provisional purchase contracts: | Embedded derivatives in provisional purchase contracts: | | | | |
| Copper (millions of pounds) | Copper (millions of pounds) | 165 | | | 3.80 | | | 3.75 | | | January 2024 |
| Copper (millions of pounds) | |
| Copper (millions of pounds) | | 92 | | | 3.83 | | | 4.00 | | | July 2024 |
|
Copper Forward Contracts. Atlantic Copper, FCX’s wholly owned smelting and refining unit in Spain, enters into copper forward contracts designed to hedge its copper price risk whenever its physical purchases and sales pricing periods do not match. These economic hedge transactions are intended to hedge against changes in copper prices, with the mark-to-market hedging gains or losses recorded in production and delivery costs. At September 30, 2023,March 31, 2024, Atlantic Copper held net copper forward purchasesales contracts for 1949 million pounds at an average contract price of $3.77$3.94 per pound, with maturities through November 2023.May 2024.
Summary of Gains (Losses) Gains.. A summary of the realized and unrealized gains (losses) gains recognized in operating income for commodity contracts that do not qualify as hedge transactions, including embedded derivatives, follows (in millions):follows:
| | | | Three Months Ended | | Nine Months Ended |
| | September 30, | | September 30, |
| | | 2023 | | 2022 | | 2023 | | 2022 |
| March 31, | |
| March 31, | |
| March 31, | |
| | |
| | |
| | |
Embedded derivatives in provisional sales contracts:a | |
Embedded derivatives in provisional sales contracts:a | |
Embedded derivatives in provisional sales contracts:a | Embedded derivatives in provisional sales contracts:a | | | | | | | |
| Copper | Copper | $ | (30) | | | $ | (272) | | | $ | 31 | | | $ | (774) | |
| Copper | |
| Copper | |
| Gold and other metals | Gold and other metals | (10) | | | (34) | | | 12 | | | (45) | |
| Gold and other metals | |
| Gold and other metals | |
Copper forward contractsb | |
Copper forward contractsb | |
Copper forward contractsb | Copper forward contractsb | (1) | | | 5 | | | (3) | | | 31 | |
|
a.Amounts recorded in revenues.
b.Amounts recorded in cost of sales as production and delivery costs.
Unsettled Derivative Financial Instruments.
A summary of the fair values of unsettled commodity derivative financial instruments follows (in millions):follows:
| | September 30,
2023 | | December 31, 2022 |
| | March 31,
2024 | | | | March 31,
2024 | | December 31, 2023 |
| Commodity Derivative Assets: | Commodity Derivative Assets: | | | | | Commodity Derivative Assets: | | |
Derivatives designated as hedging instruments: | Derivatives designated as hedging instruments: | | | | | Derivatives designated as hedging instruments: | | |
| Copper futures and swap contracts | Copper futures and swap contracts | | $ | — | | | $ | 3 | |
Derivatives not designated as hedging instruments: | Derivatives not designated as hedging instruments: | | | | | Derivatives not designated as hedging instruments: | | |
| Embedded derivatives in provisional sales/purchase contracts | Embedded derivatives in provisional sales/purchase contracts | | 16 | | | 166 | |
| Copper forward contracts | Copper forward contracts | | — | | | 1 | |
| Total derivative assets | Total derivative assets | | $ | 16 | | | $ | 170 | |
| | Commodity Derivative Liabilities: | Commodity Derivative Liabilities: | |
Derivatives designated as hedging instruments: | |
| Copper futures and swap contracts | | $ | 8 | | | $ | 3 | |
| Commodity Derivative Liabilities: | |
| Commodity Derivative Liabilities: | |
| Derivatives not designated as hedging instruments: | Derivatives not designated as hedging instruments: | |
| Derivatives not designated as hedging instruments: | |
| Derivatives not designated as hedging instruments: | |
| Embedded derivatives in provisional sales/purchase contracts | |
| Embedded derivatives in provisional sales/purchase contracts | |
| Embedded derivatives in provisional sales/purchase contracts | Embedded derivatives in provisional sales/purchase contracts | | 35 | | | 39 | |
| | Copper forward contracts | Copper forward contracts | | 1 | | | — | |
| | Copper forward contracts | |
| | Copper forward contracts | |
| Total derivative liabilities | Total derivative liabilities | | $ | 44 | | | $ | 42 | |
FCX’s commodity contracts have netting arrangements with counterparties with which the right of offset exists, and it is FCX’s policy to generally offset balances by contract on its balance sheet. FCX’s embedded derivatives on provisional sales/purchase contracts are netted with the corresponding outstanding receivable/payable balances.
A summary of these net unsettled commodity contracts that are offset in the balance sheet follows (in millions)(there were no offsetting amounts at March 31, 2024, and December 31, 2023):
| | | Assets | | | | Assets | | Liabilities |
| | March 31,
2024 | | | | March 31,
2024 | | December 31, 2023 | | March 31,
2024 | | December 31, 2023 |
| | | Assets | | Liabilities |
| | September 30,
2023 | | December 31, 2022 | | September 30,
2023 | | December 31, 2022 |
| | Gross amounts recognized: | |
| | Embedded derivatives in provisional | |
| sales/purchase contracts | | $ | 16 | | | $ | 166 | | | $ | 35 | | | $ | 39 | |
| | Copper derivatives | | — | | | 4 | | | 9 | | | 3 | |
| 16 | | | 170 | | | 44 | | | 42 | |
| | Less gross amounts of offset: | |
| | Embedded derivatives in provisional | |
| sales/purchase contracts | | 3 | | | — | | | 3 | | | — | |
| | | 3 | | | — | | | 3 | | | — | |
| | Net amounts presented in balance sheet: | |
| | Amounts presented in balance sheet: | |
| | Amounts presented in balance sheet: | |
| | Amounts presented in balance sheet: | |
| | Embedded derivatives in provisional | |
| | Embedded derivatives in provisional | |
| | Embedded derivatives in provisional | Embedded derivatives in provisional | |
| sales/purchase contracts | sales/purchase contracts | | 13 | | | 166 | | | 32 | | | 39 | |
| sales/purchase contracts | |
| sales/purchase contracts | |
| | Copper derivatives | Copper derivatives | | — | | | 4 | | | 9 | | | 3 | |
| $ | 13 | | | $ | 170 | | | $ | 41 | | | $ | 42 | |
| Copper derivatives | |
| Copper derivatives | |
| | $ | |
| | Balance sheet classification: | Balance sheet classification: | |
| Balance sheet classification: | |
| Balance sheet classification: | |
| Trade accounts receivable | |
| Trade accounts receivable | |
| Trade accounts receivable | Trade accounts receivable | | $ | 5 | | | $ | 163 | | | $ | 20 | | | $ | 7 | |
| Other current assets | Other current assets | | — | | | 4 | | | — | | | — | |
| | Accounts payable and accrued liabilities | Accounts payable and accrued liabilities | | 8 | | | 3 | | | 21 | | | 34 | |
| Other liabilities | | — | | | — | | | — | | | 1 | |
| | $ | 13 | | | $ | 170 | | | $ | 41 | | | $ | 42 | |
| Accounts payable and accrued liabilities | |
| | Accounts payable and accrued liabilities | |
| | | $ | |
| | $ | |
| | $ | |
Credit Risk. FCX is exposed to credit loss when financial institutions with which it has entered into derivative transactions (commodity, foreign exchange and interest rate swaps) are unable to pay. To minimize the risk of such losses, FCX uses counterparties that meet certain credit requirements and periodically reviews the creditworthiness of these counterparties. As of September 30, 2023,March 31, 2024, the maximum amount of credit exposure associated with derivative transactions was $16$136 million.
Other Financial Instruments. Other financial instruments include cash and cash equivalents, restricted cash and cash equivalents, accounts receivable, investment securities, legally restricted trust assets, accounts payable and accrued liabilities, accrued income taxes, dividends payable and debt. The carrying value for these financial instruments classified as current assets or liabilities approximates fair value because of their short-term nature and generally negligible credit losses (refer to Note 7 for the fair values of investment securities, legally restricted funds and debt). In addition, as of September 30, 2023,March 31, 2024, FCX had contingent consideration assets related to the sales of certain oil and gas properties (refer to Note 7 for the related fair values).
Cash and Cash Equivalents and Restricted Cash and Cash Equivalents. The following table provides a reconciliation of total cash and cash equivalents and restricted cash and cash equivalents presented in the consolidated statements of cash flows (in millions):flows:
| | September 30,
2023 | | December 31, 2022 |
| | March 31,
2024 | | | | March 31,
2024 | | December 31, 2023 |
| Balance sheet components: | Balance sheet components: | | | | |
Cash and cash equivalentsa | Cash and cash equivalentsa | | $ | 5,745 | | | $ | 8,146 | |
Cash and cash equivalentsa | |
Cash and cash equivalentsa | |
| | Restricted cash and cash equivalents, current | | 697 | | b | 111 | |
Restricted cash and cash equivalents, currentb | |
Restricted cash and cash equivalents, currentb | |
Restricted cash and cash equivalents, currentb | |
| Restricted cash and cash equivalents, long-term - included in other assets | Restricted cash and cash equivalents, long-term - included in other assets | | 97 | | | 133 | |
| Total cash, cash equivalents and restricted cash and cash equivalents presented in the consolidated statements of cash flows | | $ | 6,539 | | | $ | 8,390 | |
| Total cash and cash equivalents and restricted cash and cash equivalents presented in the consolidated statements of cash flows | |
a.Includes time deposits of $0.3$0.1 billion at September 30, 2023,March 31, 2024, and $0.5$0.3 billion at December 31, 2022,2023, and cash designated for smelter development projects totaling $0.6 billion at September 30, 2023, and $1.8$0.2 billion at December 31, 2022.2023.
b.Includes $0.5(i) $0.9 billion at March 31, 2024, and $1.1 billion at December 31, 2023, associated with 30% of PT-FI’s export proceeds. See Note 8proceeds required to be temporarily deposited in Indonesia banks for further discussion.90 days in accordance with a regulation issued by the Indonesia government and (ii) $147 million at March 31, 2024, and $145 million at December 31, 2023, in assurance bonds to support PT-FI’s commitment for smelter development in Indonesia.
NOTE 7. FAIR VALUE MEASUREMENT
Fair value accounting guidance includes a hierarchy that prioritizes the inputs to valuation techniques used to measure fair value. The hierarchy gives the highest priority to unadjusted quoted prices in active markets for identical assets or liabilities (Level 1) and the lowest priority to unobservable inputs (Level 3). FCX did not have any significant transfers in or out of Level 3 during third-quarter 2023.first-quarter 2024.
FCX’s financial instruments are recorded on the consolidated balance sheets at fair value except for contingent consideration associated with the sale of the Deepwater Gulf of Mexico (GOM) oil and gas properties (which was recorded under the loss recovery approach) and debt. A summary of the carrying amount and fair value of FCX’s financial instruments (including those measured at net asset value (NAV) as a practical expedient), other than cash and cash equivalents, restricted cash and cash equivalents, accounts receivable, accounts payable and accrued liabilities, accrued income taxes and dividends payable (refer to Note 6) follows (in millions):, follows:
| | At September 30, 2023 |
| At March 31, 2024 | | | At March 31, 2024 |
| | | Carrying | | Fair Value | | Carrying | | Fair Value |
| | | Amount | | Total | | NAV | | Level 1 | | Level 2 | | Level 3 | | Amount | | Total | | NAV | | Level 1 | | Level 2 | | Level 3 |
| Assets | Assets | | | | | | | | | | | | Assets | | | | | | | | | |
Investment securities:a,b | Investment securities:a,b | |
| U.S. core fixed income fund | U.S. core fixed income fund | $ | 25 | | | $ | 25 | | | $ | 25 | | | $ | — | | | $ | — | | | $ | — | |
| U.S. core fixed income fund | |
| U.S. core fixed income fund | |
| Equity securities | Equity securities | 5 | | | 5 | | | — | | | 5 | | | — | | | — | |
| | Total | Total | 30 | | | 30 | | | 25 | | | 5 | | | — | | | — | |
| Total | |
| Total | |
| Legally restricted funds:a | |
Legally restricted funds:a | |
Legally restricted funds:a | Legally restricted funds:a | | | | | | | | | | | | | | | | | |
| U.S. core fixed income fund | U.S. core fixed income fund | 61 | | | 61 | | | 61 | | | — | | | — | | | — | |
| Government mortgage-backed securities | Government mortgage-backed securities | 43 | | | 43 | | | — | | | — | | | 43 | | | — | |
| Government bonds and notes | Government bonds and notes | 30 | | | 30 | | | — | | | — | | | 30 | | | — | |
| Corporate bonds | Corporate bonds | 30 | | | 30 | | | — | | | — | | | 30 | | | — | |
| Money market funds | Money market funds | 19 | | | 19 | | | — | | | 19 | | | — | | | — | |
| Asset-backed securities | Asset-backed securities | 15 | | | 15 | | | — | | | — | | | 15 | | | — | |
| Collateralized mortgage-backed securities | Collateralized mortgage-backed securities | 1 | | | 1 | | | — | | | — | | | 1 | | | — | |
| | Total | Total | 199 | | | 199 | | | 61 | | | 19 | | | 119 | | | — | |
| Total | |
| Total | |
| Derivatives:c | |
Derivatives:c | |
Derivatives:c | | | | | | | | | | |
| Embedded derivatives in provisional sales/purchase contracts in a gross asset position | |
| Embedded derivatives in provisional sales/purchase contracts in a gross asset positionc | 16 | | | 16 | | | — | | | — | | | 16 | | | — | |
| Copper futures and swap contracts | |
| Copper futures and swap contracts | |
| Copper futures and swap contracts | |
| Copper forward contracts | |
| | Total | |
| | Total | |
| | | | Total | |
| Contingent consideration for the sale of the Deepwater GOM oil and gas propertiesa | |
Contingent consideration for the sale of the Deepwater GOM oil and gas propertiesa | |
Contingent consideration for the sale of the Deepwater GOM oil and gas propertiesa | Contingent consideration for the sale of the Deepwater GOM oil and gas propertiesa | 55 | | | 47 | | | — | | | — | | | — | | | 47 | |
| | | Liabilities | |
| | Liabilities | |
| | | Liabilities | Liabilities | | | | | | | | | | | | | | | | | |
Derivatives:c | Derivatives:c | | | | | | | | | Derivatives:c | | | | | | | | | |
| Embedded derivatives in provisional sales/purchase contracts in a gross liability position | Embedded derivatives in provisional sales/purchase contracts in a gross liability position | 35 | | | 35 | | | — | | | — | | | 35 | | | — | |
| | Copper futures and swap contracts | 8 | | | 8 | | | — | | | 6 | | | 2 | | | — | |
| | Copper forward contracts | Copper forward contracts | 1 | | | 1 | | | — | | | 1 | | | — | | | — | |
| | | Copper forward contracts | |
| | Copper forward contracts | |
| | Total | |
| | Total | |
| | Total | Total | 44 | | | 44 | | | — | | | 7 | | | 37 | | | — | |
| | Long-term debt, including current portiond | Long-term debt, including current portiond | 9,405 | | | 8,639 | | | — | | | — | | | 8,639 | | | — | |
| | | Long-term debt, including current portiond | |
| Long-term debt, including current portiond | |
|
| | At December 31, 2022 |
| At December 31, 2023 | | | At December 31, 2023 |
| | | Carrying | | Fair Value | | Carrying | | Fair Value |
| | | Amount | | Total | | NAV | | Level 1 | | Level 2 | | Level 3 | | Amount | | Total | | NAV | | Level 1 | | Level 2 | | Level 3 |
| Assets | Assets | | | | | | | | | | | | Assets | | | | | | | | | |
Investment securities:a,b | Investment securities:a,b | |
| U.S. core fixed income fund | U.S. core fixed income fund | $ | 25 | | | $ | 25 | | | $ | 25 | | | $ | — | | | $ | — | | | $ | — | |
| U.S. core fixed income fund | |
| U.S. core fixed income fund | |
| Equity securities | Equity securities | 7 | | | 7 | | | — | | | 7 | | | — | | | — | |
| | Total | Total | 32 | | | 32 | | | 25 | | | 7 | | | — | | | — | |
| Total | |
| Total | |
| Legally restricted funds:a | |
Legally restricted funds:a | |
Legally restricted funds:a | Legally restricted funds:a | | | | | | | | | | | | | | | | | |
| U.S. core fixed income fund | U.S. core fixed income fund | 56 | | | 56 | | | 56 | | | — | | | — | | | — | |
| Government mortgage-backed securities | Government mortgage-backed securities | 37 | | | 37 | | | — | | | — | | | 37 | | | — | |
| Government bonds and notes | Government bonds and notes | 34 | | | 34 | | | — | | | — | | | 34 | | | — | |
| Corporate bonds | Corporate bonds | 31 | | | 31 | | | — | | | — | | | 31 | | | — | |
| Money market funds | |
| Asset-backed securities | Asset-backed securities | 17 | | | 17 | | | — | | | — | | | 17 | | | — | |
| Money market funds | 3 | | | 3 | | | — | | | 3 | | | — | | | — | |
| Collateralized mortgage-backed securities | Collateralized mortgage-backed securities | 3 | | | 3 | | | — | | | — | | | 3 | | | — | |
| | Total | Total | 181 | | | 181 | | | 56 | | | 3 | | | 122 | | | — | |
| Total | |
| Total | |
| Derivatives:c | |
Derivatives:c | |
Derivatives:c | Derivatives:c | | | | | | | | | | | | | | | | | |
| Embedded derivatives in provisional sales/purchase contracts in a gross asset position | Embedded derivatives in provisional sales/purchase contracts in a gross asset position | 166 | | | 166 | | | — | | | — | | | 166 | | | — | |
| Copper futures and swap contracts | Copper futures and swap contracts | 3 | | | 3 | | | — | | | 3 | | | — | | | — | |
| Copper forward contracts | 1 | | | 1 | | | — | | | 1 | | | — | | | — | |
| | Total | |
| | Total | |
| | Total | Total | 170 | | | 170 | | | — | | | 4 | | | 166 | | | — | |
| Contingent consideration for the sale of the Deepwater GOM oil and gas propertiesa | Contingent consideration for the sale of the Deepwater GOM oil and gas propertiesa | 67 | | | 57 | | | — | | | — | | | — | | | 57 | |
Contingent consideration for the sale of the Deepwater GOM oil and gas propertiesa | |
Contingent consideration for the sale of the Deepwater GOM oil and gas propertiesa | |
| | | Liabilities | |
| | Liabilities | |
| | Liabilities | Liabilities | | | | | | | | | | | | | | | | | |
Derivatives:c | Derivatives:c | |
| Embedded derivatives in provisional sales/purchase contracts in a gross liability position | Embedded derivatives in provisional sales/purchase contracts in a gross liability position | 39 | | | 39 | | | — | | | — | | | 39 | | | — | |
| Embedded derivatives in provisional sales/purchase contracts in a gross liability position | |
| Embedded derivatives in provisional sales/purchase contracts in a gross liability position | |
| | Copper forward contracts | |
| | Copper forward contracts | |
| | Copper forward contracts | Copper forward contracts | 3 | | | 3 | | | — | | | — | | | 3 | | | — | |
| | Total | |
| | Total | |
| | Total | Total | 42 | | | 42 | | | — | | | — | | | 42 | | | — | |
| | Long-term debt, including current portiond | Long-term debt, including current portiond | 10,620 | | | 10,097 | | | — | | | — | | | 10,097 | | | — | |
| | Long-term debt, including current portiond | |
| Long-term debt, including current portiond | |
|
a.Current portion included in other current assets and long-term portion included in other assets.
b.Excludes amounts included in restricted cash and cash equivalents and other assets (which approximated fair value), primarily amounts associated with (i) PT-FI’s export proceeds ($0.50.9 billion at September 30,March 31, 2024, and $1.1 billion at December 31, 2023), (ii) an assurance bondbonds to support PT-FI’s commitment for additional smelter development in Indonesia ($135147 million at September 30, 2023,March 31, 2024, and $133$145 million at December 31, 2022)2023) and (iii) PT-FI’s mine closure and reclamation guarantees ($11197 million at September 30, 2023,both March 31, 2024, and $103 million at December 31, 2022)2023).
c.Refer to Note 6 for further discussion and balance sheet classifications.
d.Recorded at cost except for debt assumed in acquisitions, which are recorded at fair value at the respective acquisition dates.
Valuation Techniques. The U.S. core fixed income fund is valued at NAV. The fund strategy seeks total return consisting of income and capital appreciation primarily by investing in a broad range of investment-grade debt securities, including U.S. government obligations, corporate bonds, mortgage-backed securities, asset-backed securities and money market instruments. There are no restrictions on redemptions (which are usually within one business day of notice).
Equity securities are valued at the closing price reported on the active market on which the individual securities are traded and, as such, are classified within Level 1 of the fair value hierarchy.
Fixed income securities (government securities, corporate bonds, asset-backed securities and collateralized mortgage-backed securities) are valued using a bid-evaluation price or a mid-evaluation price. These evaluations are based on quoted prices, if available, or models that use observable inputs and, as such, are classified within Level 2 of the fair value hierarchy.
Money market funds are classified within Level 1 of the fair value hierarchy because they are valued using quoted market prices in active markets.
FCX’s embedded derivatives on provisional copper concentrate, copper cathode and gold purchases and sales are valued using quoted monthly LME or COMEX copper forward prices and the adjusted London gold price at each reporting date based on the month of maturity (refer to Note 6 for further discussion); however, FCX’s contracts themselves are not traded on an exchange. As a result, these derivatives are classified within Level 2 of the fair value hierarchy.
FCX’s derivative financial instruments for copper futures and swap contracts and copper forward contracts that are traded on the respective exchanges are classified within Level 1 of the fair value hierarchy because they are valued using quoted monthly COMEX or LME prices at each reporting date based on the month of maturity (refer to Note 6 for further discussion). Certain of these contracts are traded on the over-the-counter market and are classified within Level 2 of the fair value hierarchy based on COMEX and LME forward prices.
In December 2016, FCX’s sale of its Deepwater GOM oil and gas properties included up to $150 million in contingent consideration (to be received over time) that was recorded at the total amount under the loss recovery approach. The contingent consideration is being received over time as cash flows are realized from a third-party production handling agreement for an offshore platform, with the related payments commencing in 2018. The contingent consideration included in (i) other current assets totaled $17 million at September 30, 2023, and $20 million at December 31, 2022, and (ii) other assets totaled $38 million at September 30, 2023, and $47 million at December 31, 2022. The fair value of this contingent consideration was calculated based on a discounted cash flow model using inputs that include third-party estimates for reserves, production rates and production timing, and discount rates. Because significant inputs are not observable in the market, the contingent consideration is classified within Level 3 of the fair value hierarchy.
Long-term debt, including current portion, is primarily valued using available market quotes and, as such, is classified within Level 2 of the fair value hierarchy.
The techniques described above may produce a fair value that may not be indicative of net realizable value or reflective of future fair values. Furthermore, while FCX believes its valuation techniques are appropriate and consistent with other market participants, the use of different techniques or assumptions to determine fair value of certain financial instruments could result in a different fair value measurement at the reporting date. There have been no changes in the techniques used at September 30, 2023,March 31, 2024, as compared with those techniques used at December 31, 2022.
A summary of the changes in the fair value of FCX’s Level 3 instrument, contingent consideration for the sale of the Deepwater GOM oil and gas properties, during the first nine months of 2023 follows (in millions):
| | | | | | | | | | | | |
| | | | | | |
Fair value at January 1, 2023 | $ | 57 | | | | | | |
Net unrealized gain related to assets still held at the end of the period | 1 | | | | | | |
Settlements | (11) | | | | | | |
Fair value at September 30, 2023 | $ | 47 | | | | | | |
2023.
NOTE 8. CONTINGENCIES AND COMMITMENTS
Environmental
FCX recorded adjustments to environmental obligations totaling $83 million in third-quarter 2023 and $199 million for the first nine months of 2023, primarily related to Pinal Creek in Arizona for a refined engineering evaluation and Newtown Creek in New York based on a focused feasibility study for an early action in the East Branch tributary. Refer to Note 12 of FCX’s 20222023 Form 10-K for further discussion of FCX’s environmental obligations.
There were no other significant updatesFCX recorded adjustments to previously reported environmental matters includedobligations totaling $56 million in first-quarter 2024, primarily for preliminary adjustments associated with an interim action workplan for a former processing facility in Steubenville, Ohio, and for groundwater remediation in Blackwell, Oklahoma associated with a historical smelter site.
Asset Retirement Obligations
Refer to Note 12 of FCX’s 20222023 Form 10-K other than the matters discussed below.for further discussion of FCX’s asset retirement obligations (AROs).
Historical Smelter Sites.Mining Operations. On January 30, 2017,In first-quarter 2024, we recorded ARO additions at mining operations totaling $256 million, primarily associated with revised closure plans and cost estimates to reflect FCX’s commitment to the Global Industry Standard on Tailings Management (Tailings Standard). FCX may record additional ARO adjustments as it continues to update estimates to conform with the Tailings Standard.
Oil and Gas Properties. In first-quarter 2024, Freeport-McMoRan Oil & Gas (FM O&G) recorded charges to production and delivery costs totaling $109 million for assumed oil and gas abandonment obligations resulting from bankruptcies of other companies. FM O&G, as a putative class action titled Juan Duarte, Betsy Duartepredecessor-in-interest in oil and N.D., Infant,natural gas leases, is in the chain of title with unrelated third parties either directly or by Parentsvirtue of divestiture of certain oil and Natural Guardians Juan Duartenatural gas assets previously owned and Betsy Duarte, Leroy Noblesassigned by its subsidiaries. Certain counterparties in these divestiture transactions or third parties in existing leases have filed for bankruptcy protection or undergone associated reorganizations and Betty Nobles, on behalf of themselves and all others similarly situated v. United States Metals Refining Company, Freeport-McMoRanhave not performed the required abandonment obligations. Accordingly, regulations or federal laws require that FM O&G assume such obligations.
Copper & Gold Inc. and Amax Realty Development, Inc., Docket No. 734-17, was filed in the Superior Court of New Jersey. In July 2023, the Court approved an agreement between the parties pursuant to which all claims were settled for an amount not material to FCX.
Litigation
There were no significant updates to previously reported legal proceedings included in Note 12 of FCX’s 20222023 Form 10-K, other than the mattersmatter discussed below.
Louisiana Parishes Coastal Erosion Cases. Certain FCX affiliates were named as defendants, along with numerous co-defendants, in 13 cases out of a total of 42 cases filed in Louisiana state courts by 6 south Louisiana parishes (Cameron, Jefferson, Plaquemines, St. Bernard, St. John the Baptist and Vermilion), alleging that certain oil and gas exploration and production operations and sulfur mining and production operations in coastal Louisiana contaminated and damaged coastal wetlands and caused significant land loss along the Louisiana coast. In 2019, affiliatesThe settlement agreement to resolve these cases was fully executed in fourth-quarter 2022 but there was a delay in finalizing it as a result of FCX reached an agreement in principle to settle all 13 cases and, as of October 2022, all parties have executeda lawsuit challenging the settlement agreement. On March 16,brought in first-quarter 2023 by a non-plaintiff coastal parish included in the settlement (Terrebonne), filed an amended petition(Terrebonne Parish) titled Terrebonne Parish Consolidated Government vs.v. Louisiana Department of Natural Resources et al., Docket No. 185576, in the 32nd Judicial District Court, Terrebonne Parish, State of Louisiana, adding the settling FCX affiliates to a lawsuit that challenges whetherLouisiana. During first-quarter 2024, Terrebonne Parish is validly boundagreed to dismiss its lawsuit and FCX made the $15 million settlement payment in trust (which was accrued for in 2019) in accordance with the terms of the settlement agreement and seeks to have the court declare the settlement void. FCX is evaluating and exploring options to resolve this dispute and will vigorously defend this matter.agreement.
Asbestos and Talc Claims. As previously discussed in Note 12 of FCX’s 2022 Form 10-K, in 2021 Imerys Talc America (Imerys), an affiliate of Imerys S.A., filed the form of a settlement and release agreement to be entered into by Cyprus Amax Minerals Company (CAMC), an indirect wholly owned subsidiary of FCX, Cyprus Mines Corporation (Cyprus Mines), a wholly owned subsidiary of CAMC, FCX, Imerys and the other debtors, tort claimants’ committee and future claims representative in the Imerys bankruptcy. The bankruptcy court continues to temporarily stay approximately 950 talc-related lawsuits against CAMC, Cyprus Mines, FCX and Imerys but there can be no assurance that the bankruptcy court will continue to impose the interim stay.
In accordance with the global settlement agreement, among other things, (1) CAMC agreed to contribute a total of $130 million in cash to a settlement trust in seven annual installments, which will be guaranteed by FCX, and (2) CAMC and Cyprus Mines and their affiliates will contribute to the settlement trust all rights that they have to the proceeds of certain legacy insurance policies as well as indemnity rights they have against Johnson & Johnson. Mediation to resolve open issues in the Imerys and Cyprus Mines bankruptcy cases is ongoing, including the adequacy of the settlement and agreed contribution from CAMC, with a deadline for the parties to complete mediation by December 31, 2023, set by the bankruptcy court.
There can be no assurance that the global settlement will be successfully implemented.
Other Matters
Indonesia Regulatory Matters
Over the past several years, theRefer to Notes 12, 13 and 14 of FCX’s 2023 Form 10-K for further discussion of Indonesia government has enacted various laws and regulations to promote downstream processing of various products, including copper concentrates.regulatory matters.
Export License.Licenses. On June 10, 2023, export licensesIn first-quarter 2024, PT-FI obtained approval for several exporters, including PT-FIrevised quotas for estimated concentrate and PT Smelting, expired. During the second quarter and through July 2023, the Indonesia government issued various regulations to addressanode slime exports of unrefined metals, including regulations by the Ministry of Energy and Mineral Resources (MEMR) to allow continued exports of copper concentrates through May 2024 for companies engaged in ongoing smelter development projects with construction progress greater than 50%, and regulations by the Ministry of Trade on the permitted export of various products, including copper concentrates.
On July 24, 2023,2024. PT-FI was granted an export license through May 2024 for 1.7 million metric tons of copper concentrate.
Through June 10, 2023, PT-FI exported anode slimes under PT Smelting’s export license. A change in regulations during second-quarter 2023 requires PT-FI to follow a new administrative process for the export of anode slimes. The administrative process is advancing, and PT-FI expects to receive approval to resume exports of anode slimes during fourth-quarter 2023.
PT-FI will continue to workworking with the Indonesia government to obtain approvals to continue exports of copper concentrates and anode slimes beyond May 2024 and until the Indonesia smelter projects are fully commissioned and reach designed operating conditions.
Export Duties. Under PT-FI’s special mining license (IUPK),conditions, which was grantedis currently expected by the Indonesia government in 2018, export duties are determined based on regulations that were in effect in 2018 and no duties are required after smelter construction progress reached 50%. In March 2023, the Indonesia government verified that construction progress on the Manyar smelter exceeded 50% and PT-FI's export duties were eliminated effective March 29, 2023.
In July 2023, the Ministry of Finance issued a revised regulation on duties for various exported products, including copper concentrates. The revised regulation assesses export duties for copper concentrates at 7.5% in the second half of 2023 and 10% in 2024 for companies with smelter progress of 70% to 90%. For companies with smelter progress above 90%, export duties would be 5% in the second half of 2023 and 7.5% in 2024. During third-quarter 2023, PT-FI incurred $147 million in export duties under the revised regulation. PT-FI does not believe any export duties should be assessed under the revised regulation and continues to discuss the applicability of the revised regulation with the Indonesia government because of inconsistencies with its IUPK. Additionally, PT-FI is required by the Indonesia government to provide bank guarantees for unpaid export duties, which have been presented as current restricted cash and cash equivalents at September 30, 2023.
Smelter Development Progress. In 2018, PT-FI agreed to expand its domestic smelting and refining capacity to process all of its copper concentrates in Indonesia. PT-FI is advancing the construction of the Indonesia smelter projects and expanding capacity at PT Smelting. PT-FI estimates construction of the Manyar smelter to be complete in mid-2024 followed by commissioning of the facilities and a ramp-up schedule through year-end 2024.
As disclosed in Note 12 of FCX’s 2022 Form 10-K, in March 2022, PT-FI paid the Indonesia government an administrative fine totaling $57 million (which included charges of $41 million recorded in first-quarter 2022) related to smelter development delays in light of the COVID-19 pandemic.
In May 2023, MEMR issued a decree prescribing a revised formula for administrative fines for delays in construction of smelter and refining facilities, taking into account allowances for certain delays associated with the COVID-19 pandemic as verified by a third-party. In mid-July 2023, PT-FI submitted its third-party verified calculation, which resulted in an accrual for a potential administrative fine of $55 million based on the formula prescribed by the decree related to the period from August 2020 through January 2022. PT-FI continues to discuss the applicability of this administrative fine with MEMR. Based on PT-FI’s revised smelter construction schedule, which was accepted by the Indonesia government in connection with the renewal of PT-FI's export license in early 2022, PT-FI does not believe any additional fines should be assessed under the decree.
Smelter Assurance. PT-FI has an assurance bond to support its commitment for additional smelter development in Indonesia, totaling $135 million at September 30, 2023, for which the terms have been fulfilled (refer to Note 7). In August 2023, PT-FI submitted a request to MEMR for release of the assurance bond and is awaiting a response.
The decree issued by MEMR in May 2023 also requires assurance in the form of an escrow account that will be released if smelter development progress reaches 90% of the construction plan by June 10, 2024. During third-quarter 2023, PT-FI deposited $10 million in a joint account with the Indonesia government while it continues to discuss the applicability of the May 2023 decree with the Indonesia government. If the May 2023 decree is determined to be applicable, PT-FI may be required to make an additional refundable deposit of approximately $370 million.
Export Proceeds. In accordance with a regulation issued by the Indonesia government that became effective August 1, 2023, 30% of PT-FI’s gross export proceeds are being temporarily deposited into Indonesia banks for a period of 90 days before withdrawal. At September 30, 2023, FCX had $0.5 billion in current restricted cash and cash equivalents deposited in Indonesia banks in accordance with this regulation.
NOTE 9. BUSINESS SEGMENTS
FCX has organized its mining operations into four primary divisions -– North America copper mines, South America mining,operations, Indonesia miningoperations and Molybdenum mines, and operating segments that meet certain thresholds are reportable segments. Separately disclosed in the following tables are FCX’s reportable segments, which include the
Morenci and Cerro Verde copper mines, the Indonesia operations (including the Grasberg minerals district (Indonesia Mining)and the Indonesia smelter projects that are under construction), the Rod & Refining operations and Atlantic Copper Smelting & Refining.
For comparative purposes, the first-quarter 2023 table has been adjusted to conform with the current year presentation, primarily for the combination of the Grasberg minerals districts and the Indonesia smelter projects that are under construction. The Indonesia smelter projects are expected to become fully operational by year-end 2024 and will exclusively receive concentrate from the Grasberg minerals district, which reflect PT-FI’s integrated and dependent operations within Indonesia (i.e., Indonesia operations). FCX's Chief Operating Decision Maker does, and will, make executive management decisions, including resource allocation and mine planning, for the Indonesia operations as a single business segment.
Intersegment sales between FCX’s business segments are based on terms similar to arms-length transactions with third parties at the time of the sale. Intersegment sales may not be reflective of the actual prices ultimately realized because of a variety of factors, including additional processing, timing of sales to unaffiliated customers and transportation premiums.
FCX defers recognizing profits on intercompany sales from its mining operations to Atlantic Copper (and on 39.5% of PT-FI’s sales to PT Smelting for the 2022 periods) until final sales to third parties occur. Quarterly variations in ore grades, the timing of intercompany shipments and changes in product prices result in variability in FCX’s net deferred profits and quarterly earnings.
Beginning January 1, 2023, PT-FI's commercial arrangement with PT Smelting changed from a copper concentrate sales agreement to a tolling arrangement. Under this arrangement, PT-FI pays PT Smelting a tolling fee to smelt and refine its copper concentrate and PT-FI retains title to all products for sale to third parties (i.e., there are no further sales from PT-FI to PT Smelting). While the new tolling agreement with PT Smelting does not significantly change PT-FI’s economics, it impacts the timing of PT-FI’s sales and working capital requirements.
FCX allocates certain operating costs, expenses and capital expenditures to its operating divisions and individual segments. However, not all costs and expenses applicable to an operation are allocated. U.S. federal and state income taxes are recorded and managed at the corporate level (included in Corporate, Other & Eliminations), whereas foreign income taxes are recorded and managed at the applicable country level. In addition, most mining exploration and research activities are managed on a consolidated basis, and those costs, along with some selling, general and administrative costs, are not allocated to the operating divisions or individual segments. Accordingly, the following Financial Information by Business Segmentsegment information reflects management determinations that may not be indicative of what the actual financial performance of each operating division or segment would be if it was an independent entity.
Product Revenues. FCX’s revenues attributable to the products it sold for the third quarterfirst quarters of 2024 and first nine months of 2023 and 2022 follow (in millions):follow:
| | Three Months Ended | |
| Three Months Ended | |
| Three Months Ended | |
| March 31, | |
| March 31, | |
| March 31, | |
| | Three Months Ended | | Nine Months Ended | |
| | September 30, | | September 30, | |
| | | 2023 | | 2022 | | 2023 | | 2022 | |
| Copper: | Copper: | | | | | | | | |
| Copper: | |
| Copper: | |
| Cathode | |
| Cathode | |
| Cathode | |
| Concentrate | Concentrate | $ | 2,365 | | | $ | 2,091 | | | $ | 6,137 | | | $ | 7,476 | | |
| Cathode | 1,331 | | | 1,255 | | | 4,016 | | | 3,873 | | |
| Concentrate | |
| Concentrate | |
| Rod and other refined copper products | |
| Rod and other refined copper products | |
| Rod and other refined copper products | Rod and other refined copper products | 992 | | | 755 | | | 2,797 | | | 2,942 | | |
Purchased coppera | Purchased coppera | 71 | | | 168 | | | 347 | | | 342 | | |
Purchased coppera | |
Purchased coppera | |
| Gold | |
| Gold | |
| Gold | Gold | 854 | | | 858 | | | 2,384 | | | 2,578 | | |
| Molybdenum | Molybdenum | 479 | | | 304 | | | 1,562 | | | 1,059 | | |
| Molybdenum | |
| Molybdenum | |
Otherb | |
Otherb | |
Otherb | Otherb | 136 | | | 174 | | | 439 | | | 527 | | |
| Adjustments to revenues: | Adjustments to revenues: | |
Treatment chargesc | (151) | | | (132) | | | (394) | | | (404) | | |
| Adjustments to revenues: | |
| Adjustments to revenues: | |
PT-FI export dutiesc | |
PT-FI export dutiesc | |
PT-FI export dutiesc | |
| Treatment charges | |
| Treatment charges | |
| Treatment charges | |
Royalty expensed | Royalty expensed | (80) | | | (83) | | | (234) | | | (289) | | |
PT-FI export dutiese | (133) | | | (81) | | | (147) | | | (263) | | |
Royalty expensed | |
Royalty expensed | |
| Revenues from contracts with customers | Revenues from contracts with customers | 5,864 | | | 5,309 | | | 16,907 | | | 17,841 | | |
Embedded derivativesf | (40) | | | (306) | | | 43 | | | (819) | | |
| Revenues from contracts with customers | |
| Revenues from contracts with customers | |
Embedded derivativese | |
Embedded derivativese | |
Embedded derivativese | |
| Total consolidated revenues | Total consolidated revenues | $ | 5,824 | | | $ | 5,003 | | | $ | 16,950 | | | $ | 17,022 | | |
| Total consolidated revenues | |
| Total consolidated revenues | |
a.FCX purchases copper cathode primarily for processing by its Rod & Refining operations.
b.Primarily includes revenues associated with silver.
c.Treatment chargesPT-FI is currently being assessed export duties for the third quartercopper concentrates at a rate of 7.5% and first nine months of 2023 exclude tolling costs paid to PT Smelting, which are recorded as production costswas paying a 2.5% export duty in the consolidated statements of income.first-quarter 2023.
d.Reflects royalties on sales from PT-FI and Cerro Verde that will vary with the volume of metal sold and prices.
e.Refer to Note 8 for further discussion of PT-FI export duties.
f.Refer to Note 6 for discussion of embedded derivatives related to FCX’s provisionally priced copper concentrate and cathode sales contracts.
Financial Information by Business Segment
| | | | | | | | | | | | | | | | | | | | | | | | | | | | | | | | | | | | | | | | | | | | | | | | | | | | | | | | | | | | | | | | | | | | | | | | | | | | | | | | | |
| | | | | | | | | | | | | | | | | | | | | | | | | | | | | | | | | |
| | | | | | | |
| | | | | | | | | | | | | | | | | | | | | | | |
| (in Millions) | | | | | | | | | | | | | | | | | | | | | | | Atlantic | | | | | | | | Corporate, | | |
| North America Copper Mines | | South America Mining | | | | | | | | | | Copper | | | | | | | | Other | | |
| | | | | | | | | Cerro | | | | | | Indonesia | | | | Molybdenum | | Rod & | | Smelting | | | | | | | | & Elimi- | | FCX |
| Morenci | | | | Other | | Total | | Verde | | Other | | Total | | Mining | | | | Mines | | Refining | | & Refining | | | | | | | | nations | | Total |
| Three Months Ended September 30, 2023 | | | | | | | | | | | | | | | | | | | | | | | | | | | | | | | | | |
| Revenues: | | | | | | | | | | | | | | | | | | | | | | | | | | | | | | | | | |
| Unaffiliated customers | $ | 17 | | | | | $ | 22 | | | $ | 39 | | | $ | 822 | | | $ | 203 | | | $ | 1,025 | | | $ | 2,030 | | | | | $ | — | | | $ | 1,566 | | | $ | 692 | | | | | | | | | $ | 472 | | a | $ | 5,824 | |
| Intersegment | 624 | | | | | 994 | | | 1,618 | | | 219 | | | — | | | 219 | | | 65 | | | | | 147 | | | 12 | | | 8 | | | | | | | | | (2,069) | | | — | |
| Production and delivery | 476 | | | | | 799 | | | 1,275 | | | 648 | | | 178 | | | 826 | | | 667 | |
| | | 120 | | | 1,566 | | | 680 | | | | | | | | | (1,586) | | | 3,548 | |
| DD&A | 47 | | | | | 63 | | | 110 | | | 94 | | | 17 | | | 111 | | | 271 | | | | | 14 | | | 2 | | | 7 | | | | | | | | | 18 | | | 533 | |
| | | | | | | | | | | | | | | | | | | | | | | | | | | | | | | | | |
| Metals inventory adjustments | 4 | | | | | — | | | 4 | | | 1 | | | — | | | 1 | | | — | | | | | — | | | — | | | — | | | | | | | | | — | | | 5 | |
| Selling, general and administrative expenses | — | | | | | 1 | | | 1 | | | 3 | | | — | | | 3 | | | 32 | | | | | — | | | — | | | 6 | | | | | | | | | 76 | | | 118 | |
| Mining exploration and research expenses | — | | | | | 1 | | | 1 | | | — | | | — | | | — | | | — | | | | | — | | | — | | | — | | | | | | | | | 29 | | | 30 | |
| Environmental obligations and shutdown costs | — | | | | | 4 | | | 4 | | | — | | | — | | | — | | | — | | | | | — | | | — | | | — | | | | | | | | | 94 | | | 98 | |
| | | | | | | | | | | | | | | | | | | | | | | | | | | | | | | | | |
| Operating income (loss) | 114 | | | | | 148 | | | 262 | | | 295 | | | 8 | | | 303 | | | 1,125 | | | | | 13 | | | 10 | | | 7 | | | | | | | | | (228) | | | 1,492 | |
| | | | | | | | | | | | | | | | | | | | | | | | | | | | | | | | | |
| Interest expense, net | — | | | | | 1 | | | 1 | | | (10) | | b | — | | | (10) | | | 10 | | | | | — | | | — | | | 8 | | | | | | | | | 87 | | | 96 | |
| Net gain on early extinguishment of debt | — | | | | | — | | | — | | | — | | | — | | | — | | | — | | | | | — | | | — | | | — | | | | | | | | | 5 | | | 5 | |
| Other (expense) income, net | (2) | | | | | (9) | | | (11) | | | (9) | | | 13 | | | 4 | | | 30 | | | | | — | | | — | | | 5 | | | | | | | | | 43 | | | 71 | |
| Provision for (benefit from) income taxes | — | | | | | — | | | — | | | 119 | | | 12 | | | 131 | | | 419 | | | | | — | | | — | | | — | | | | | | | | | (42) | | | 508 | |
| Equity in affiliated companies' net (losses) earnings | — | | | | | — | | | — | | | — | | | — | | | — | | | (2) | | | | | — | | | — | | | — | | | | | | | | | 2 | | | — | |
| Net income attributable to noncontrolling interests | — | | | | | — | | | — | | | 84 | | | 14 | | | 98 | | | 392 | | c | | | — | | | — | | | — | | | | | | | | | 20 | | | 510 | |
| | | | | | | | | | | | | | | | | | | | | | | | | | | | | | | | | |
| Total assets at September 30, 2023 | 3,171 | | | | | 5,799 | | | 8,970 | | | 8,227 | | | 1,893 | | | 10,120 | | | 21,020 | | | | | 1,747 | | | 288 | | | 1,176 | | | | | | | | | 8,327 | | | 51,648 | |
| Capital expenditures | 53 | | | | | 114 | | | 167 | | | 61 | | | 15 | | | 76 | | | 441 | | | | | 21 | | | 2 | | | 20 | | | | | | | | | 451 | | d | 1,178 | |
| | | | | | | | | | | | | | | | | | | | | | | | | | | | | | | | | |
| Three Months Ended September 30, 2022 | | | | | | | | | | | | | | | | | | | | | | | | | | | | | | | | | |
| Revenues: | | | | | | | | | | | | | | | | | | | | | | | | | | | | | | | | | |
| Unaffiliated customers | $ | 18 | | | | | $ | 74 | | | $ | 92 | | | $ | 666 | | | $ | 215 | | | $ | 881 | | | $ | 1,726 | | e | | | $ | — | | | $ | 1,436 | | | $ | 604 | | | | | | | | | $ | 264 | | a | $ | 5,003 | |
| Intersegment | 551 | | | | | 805 | | | 1,356 | |
| 83 | | | — | | | 83 | | | 72 | | | | | 127 | | | 7 | | | 5 | | | | | | | | | (1,650) | | | — | |
| Production and delivery | 408 | | | | | 736 | | | 1,144 | | | 579 | | | 221 | | | 800 | | | 663 | | | | | 94 | | | 1,450 | | | 604 | | | | | | | |
| (1,389) | | | 3,366 | |
| DD&A | 44 | | | | | 56 | | | 100 | | | 84 | | | 14 | | | 98 | | | 265 | | | | | 18 | | | 1 | | | 8 | | | | | | | | | 18 | | | 508 | |
| | | | | | | | | | | | | | | | | | | | | | | | | | | | | | | | | |
| Metals inventory adjustments | 2 | | | | | 1 | | | 3 | | | 2 | | | 20 | | | 22 | | | — | | | | | — | | | — | | | — | | | | | | | | | — | | | 25 | |
| Selling, general and administrative expenses | — | | | | | 1 | | | 1 | | | 2 | | | — | | | 2 | | | 26 | | | | | — | | | — | | | 6 | | | | | | | | | 63 | | | 98 | |
| Mining exploration and research expenses | — | | | | | — | | | — | | | — | | | — | | | — | | | — | | | | | — | | | — | | | — | | | | | | | | | 38 | | | 38 | |
| Environmental obligations and shutdown costs | — | | | | | 1 | | | 1 | | | — | | | — | | | — | | | — | | | | | — | | | — | | | — | | | | | | | | | 5 | | | 6 | |
| | | | | | | | | | | | | | | | | | | | | | | | | | | | | | | | | |
| Operating income (loss) | 115 | | | | | 84 | | | 199 | | | 82 | | | (40) | | | 42 | | | 844 | | | | | 15 | | | (8) | | | (9) | | | | | | | | | (121) | | | 962 | |
| | | | | | | | | | | | | | | | | | | | | | | | | | | | | | | | | |
| Interest expense, net | — | | | | | 1 | | | 1 | | | 5 | | | — | | | 5 | | | 15 | | | | | — | | | — | | | 4 | | | | | | | | | 115 | | | 140 | |
| Net gain on early extinguishment of debt | — | | | | | — | | | — | | | — | | | — | | | — | | | — | | | | | — | | | — | | | — | | | | | | | | | 20 | | | 20 | |
| Other (expense) income, net | — | | | | | (8) | | | (8) | | | (21) | | | 5 | | | (16) | | | 19 | | | | | (1) | | | — | | | 11 | | | | | | | | | 20 | | | 25 | |
| Provision for (benefit from) income taxes | — | | | | | — | | | — | | | 3 | | | (18) | | | (15) | | | 343 | | | | | — | | | — | | | — | | | | | | | | | (13) | | | 315 | |
| Equity in affiliated companies' net earnings | — | | | | | — | | | — | | | — | | | — | | | — | | | 7 | | | | | — | | | — | | | — | | | | | | | | | 1 | | | 8 | |
| Net income attributable to noncontrolling interests | — | | | | | — | | | — | | | 29 | | | 11 | | | 40 | | | 105 | | c | | | — | | | — | | | — | | | | | | | | | 11 | | | 156 | |
| | | | | | | | | | | | | | | | | | | | | | | | | | | | | | | | | |
| Total assets at September 30, 2022 | 2,996 | | | | | 5,456 | | | 8,452 | | | 8,390 | | | 1,826 | | | 10,216 | | | 20,496 | | | | | 1,701 | | | 216 | | | 1,082 | | | | | | | | | 7,764 | | | 49,927 | |
| Capital expenditures | 71 | | | | | 83 | | | 154 | | | 41 | | | 38 | | | 79 | | | 389 | | | | | 7 | | | 2 | | | 17 | | | | | | | | | 188 | | d | 836 | |
Financial Information by Business Segment (continued)
| | (In Millions) | | | | | | | | | | | | | | | |
| | | | | | | | Atlantic | | Corporate, | | |
| | North America Copper Mines | | South America Mining | | | | Copper | | Other | | |
| | | | | | Cerro | | | | | Indonesia | | | Molybdenum | | Rod & | | Smelting | | & Elimi- | | FCX | |
| | Morenci | | | Other | | Total | | Verde | | | Other | | Total | | Mining | | | Mines | | Refining | | & Refining | | nations | | Total | |
| Nine Months Ended September 30, 2023 | | | | | | | | | | | | | | | | | | | | | | | | | |
| | | | | | | | | | | | | | | | | | | | | | | Atlantic | |
| | | | | | | | | | | | | | | | | | | | | | | | Atlantic | |
| | | | | | | | | | | | | | | | | | | | | | | | Atlantic | |
| North America Copper Mines | |
| North America Copper Mines | |
| North America Copper Mines | |
| | | | | | | | | Cerro | |
| | | | | | | | | Cerro | |
| | | | | | | | | Cerro | | | | | | | Indonesia | | | | Molybdenum | | Rod & | | Smelting | | | | | | | | & Elimi- | | FCX |
| Morenci | | | Morenci | | | | Other | | Total | | Verde | | Other | | Total | | Operations | | | | Mines | | Refining | | & Refining | | | | | | | | nations | | Total |
| Three Months Ended March 31, 2024 | | Three Months Ended March 31, 2024 | | | | | | | | | | | | | | | | | | | | | | | | | |
| Revenues: | Revenues: | | | | | | | | | | | | | | | | | | | | | | | | | | | | Revenues: | | | | | | | | | | | | | | | | | | | | | | | | | |
| Unaffiliated customers | Unaffiliated customers | $ | 75 | | | | $ | 133 | | | $ | 208 | | | $ | 2,563 | | | | $ | 627 | | | $ | 3,190 | | | $ | 5,268 | | e | | $ | — | | | $ | 4,552 | | | $ | 2,185 | | | $ | 1,547 | | a | $ | 16,950 | | |
| Intersegment | Intersegment | 1,787 | | | | 2,922 | | | 4,709 | | | 638 | | | | — | | | 638 | | | 432 | | | | 520 | | | 28 | | | 19 | | | (6,346) | | | — | | |
| Production and delivery | Production and delivery | 1,279 | | | | 2,324 | | | 3,603 | | | 1,877 | | | | 539 | | | 2,416 | | | 1,860 | | f | | 321 | | | 4,558 | | | 2,139 | | | (4,637) | | | 10,260 | | |
| DD&A | DD&A | 132 | | | | 180 | | | 312 | | | 302 | | | | 48 | | | 350 | | | 694 | | | | 48 | | | 4 | | | 21 | | | 50 | | | 1,479 | | |
| | Metals inventory adjustments | 5 | | | | — | | | 5 | | | 1 | | | | — | | | 1 | | | — | | | | — | | | — | | | — | | | 1 | | | 7 | | |
| | Selling, general and administrative expenses | Selling, general and administrative expenses | 1 | | | | 2 | | | 3 | | | 7 | | | | — | | | 7 | | | 90 | | | | — | | | — | | | 21 | | | 238 | | | 359 | | |
| Mining exploration and research expenses | — | | | | 2 | | | 2 | | | — | | | | — | | | — | | | — | | | | — | | | — | | | — | | | 101 | | | 103 | | |
| | Selling, general and administrative expenses | |
| | Selling, general and administrative expenses | |
| Exploration and research expenses | |
| Environmental obligations and shutdown costs | Environmental obligations and shutdown costs | — | | | | 26 | | | 26 | | | — | | | | — | | | — | | | — | | | | — | | | — | | | — | | | 213 | | | 239 | | |
| | Operating income (loss) | |
| Operating income (loss) | |
| Operating income (loss) | Operating income (loss) | 445 | | | | 521 | | | 966 | | | 1,014 | | | | 40 | | | 1,054 | | | 3,056 | | | | 151 | | | 18 | | | 23 | | | (765) | | | 4,503 | | |
| | Interest expense, net | Interest expense, net | — | | | | 1 | | | 1 | | | 74 | | b | | — | | | 74 | | | 32 | | | | — | | | — | | | 22 | | | 289 | | | 418 | | |
| Net gain on early extinguishment of debt | — | | | | — | | | — | | | — | | | | — | | | — | | | — | | | | — | | | — | | | — | | | 10 | | | 10 | | |
| Interest expense, net | |
| Interest expense, net | |
| | Other (expense) income, net | |
| Other (expense) income, net | |
| Other (expense) income, net | Other (expense) income, net | (4) | | | | (8) | | | (12) | | | (36) | | | | 11 | | | (25) | | | 92 | | | | (1) | | | (1) | | | — | | | 130 | | | 183 | | |
| Provision for (benefit from) income taxes | Provision for (benefit from) income taxes | — | | | | — | | | — | | | 419 | | | | 19 | | | 438 | | | 1,159 | | | | — | | | — | | | — | | | (51) | | | 1,546 | | |
| Equity in affiliated companies' net earnings | — | | | | — | | | — | | | — | | | | — | | | — | | | 9 | | | | — | | | — | | | — | | | 3 | | | 12 | | |
| Equity in affiliated companies’ net (losses) earnings | |
| Net income (loss) attributable to noncontrolling interests | Net income (loss) attributable to noncontrolling interests | — | | | | — | | | — | | | 242 | | | | 34 | | | 276 | | | 1,031 | | c | | — | | | — | | | — | | | (23) | | | 1,284 | | |
| | Total assets at March 31, 2024 | |
| Total assets at March 31, 2024 | |
| Total assets at March 31, 2024 | |
| Capital expenditures | Capital expenditures | 176 | | | | 369 | | | 545 | | | 179 | | | | 80 | | | 259 | | | 1,274 | | | | 43 | | | 9 | | | 43 | | | 1,289 | | d | 3,462 | | |
| | Nine Months Ended September 30, 2022 | | | | | | | | | | | | | | | | | | | | | | | | | |
| Three Months Ended March 31, 2023 | |
| Three Months Ended March 31, 2023 | |
| Three Months Ended March 31, 2023 | | | | | | | | | | | | | | | | | | | | | | | | | | |
| Revenues: | Revenues: | | | | | | | | | | | | | | | | | | | | | | | | | | | | Revenues: | | | | | | | | | | | | | | | | | | | | | | | | | |
| Unaffiliated customers | Unaffiliated customers | $ | 125 | | | | $ | 159 | | | $ | 284 | | | $ | 2,474 | | | | $ | 555 | | | $ | 3,029 | | | $ | 5,972 | | e | | $ | — | | | $ | 4,932 | | | $ | 1,755 | | | $ | 1,050 | | a | $ | 17,022 | | |
| Intersegment | Intersegment | 1,992 | | | | 2,978 | | | 4,970 | |
| 325 | | | | — | | | 325 | | | 208 | | | | 399 | | | 24 | | | 5 | | | (5,931) | | | — | | |
| Production and delivery | Production and delivery | 1,168 | | | | 2,111 | | | 3,279 | | | 1,702 | | | | 510 | | | 2,212 | | | 1,853 | | f | | 249 | | | 4,969 | | | 1,789 | | g | (4,832) | | | 9,519 | | |
| DD&A | DD&A | 132 | | | | 175 | | | 307 | | | 262 | | | | 35 | | | 297 | | | 775 | | | | 52 | | | 3 | | | 20 | | | 50 | | | 1,504 | | |
| | Metals inventory adjustments | 2 | | | | 8 | | | 10 | | | 11 | | | | 22 | | | 33 | | | — | | | | — | | | — | | | — | | | — | | | 43 | | |
| | Selling, general and administrative expenses | Selling, general and administrative expenses | 1 | | | | 2 | | | 3 | | | 6 | | | | — | | | 6 | | | 83 | | | | — | | | — | | | 19 | | | 202 | | | 313 | | |
| Mining exploration and research expenses | — | | | | 1 | | | 1 | | | — | | | | — | | | — | | | — | | | | — | | | — | | | — | | | 86 | | | 87 | | |
| | Selling, general and administrative expenses | |
| | Selling, general and administrative expenses | |
| Exploration and research expenses | |
| Environmental obligations and shutdown costs | Environmental obligations and shutdown costs | (13) | | | | 1 | | | (12) | | | — | | | | — | | | — | | | — | | | | — | | | — | | | — | | | 63 | | | 51 | | |
| | Net gain on sales of assets | — | | | | — | | | — | | | — | | | | — | | | — | | | — | | | | — | | | — | | | — | | | (2) | | | (2) | | |
| Operating income (loss) | |
| Operating income (loss) | |
| Operating income (loss) | Operating income (loss) | 827 | | | | 839 | | | 1,666 | | | 818 | | | | (12) | | | 806 | | | 3,469 | | | | 98 | | | (16) | | | (68) | | | (448) | | | 5,507 | | |
| | Interest expense, net | Interest expense, net | — | | | | 1 | | | 1 | | | 12 | | | | — | | | 12 | | | 30 | | | | — | | | — | | | 8 | | | 372 | | | 423 | | |
| Net (loss) gain on early extinguishment of debt | — | | | | — | | | — | | | — | | | | — | | | — | | | (10) | | | | — | | | — | | | — | | | 38 | | | 28 | | |
| Interest expense, net | |
| Interest expense, net | |
| | Other (expense) income, net | |
| Other (expense) income, net | |
| Other (expense) income, net | Other (expense) income, net | (1) | | | | (32) | | | (33) | | | (11) | | | | 12 | | | 1 | | | 27 | | | | (1) | | | (1) | | | 29 | | | 45 | | | 67 | | |
| Provision for (benefit from) income taxes | Provision for (benefit from) income taxes | — | | | | — | | | — | | | 298 | | | | (11) | | | 287 | | | 1,363 | | | | — | | | — | | | — | | | 60 | | | 1,710 | | |
| Equity in affiliated companies' net earnings | — | | | | — | | | — | | | — | | | | — | | | — | | | 27 | | | | — | | | — | | | — | | | 6 | | | 33 | | |
| Net income attributable to noncontrolling interests | — | | | | — | | | — | | | 247 | | | | 25 | | | 272 | | | 436 | | c | | — | | | — | | | — | | | 23 | | | 731 | | |
| Equity in affiliated companies’ net earnings (losses) | |
| Net income (loss) attributable to noncontrolling interests | |
| | Total assets at March 31, 2023 | |
| Total assets at March 31, 2023 | |
| Total assets at March 31, 2023 | |
| Capital expenditures | Capital expenditures | 207 | | | | 223 | | | 430 | | | 109 | | | | 94 | | | 203 | | | 1,148 | | | | 16 | | | 6 | | | 60 | | | 559 | | d | 2,422 | | |
Financial Information by Business Segment (continued)
a.Includes revenues from FCX's molybdenum sales company, which includes sales of molybdenum produced by the Molybdenum mines and by certain of the North America copper mines and South America copper mines.operations.
b.The third quarter and first nine months of 2023 includeIncludes a $13net benefit to income taxes totaling $182 million credit for the settlement of interest on Cerro Verde's historical profit sharing liability. The first nine months of 2023 also includes $74 million of interest charges associated with contestedthe closure of PT-FI’s 2021 corporate income tax rulings issued byaudit and resolution of the Peruvian Supreme Court.framework for disputed tax matters.
c.FCX’s economic interest in PT-FI is 48.76% and prior to January 1, 2023, it approximated 81%. Refer to Note 1 for further discussion of first-quarter 2023 gold sales volumes that were attributed approximately 81% to FCX in accordance with the PT-FI shareholders agreement.
d.Primarily includes capital expenditures for the Indonesia smelter projects.
e.Includes PT-FI sales to PT Smelting totaling $572 million in third-quarter 2022, $27 million for the first nine monthsattribution of 2023 (reflecting adjustments to prior period provisionally priced concentrate sales) and $2.3 billion for the first nine months of 2022. Beginning January 1, 2023, there are no sales from PT-FI to PT Smelting (refer to above discussion of the tolling arrangement between PT-FI and PT Smelting).
f.Includes charges for administrative fines of $55 million for the first nine months of 2023 and $41 million for the first nine months of 2022. Refer to Note 8 for further discussion.
g.Includes maintenance charges and idle facility costs associated with major maintenance turnarounds totaling $41 million at Atlantic Copper for the first nine months of 2022.
REPORT OF INDEPENDENT REGISTERED PUBLIC ACCOUNTING FIRM
To the Board of Directors and Stockholders of
Freeport-McMoRan Inc.
Results of Review of Interim Financial Statements
We have reviewed the accompanying consolidated balance sheet of Freeport-McMoRan Inc. (the Company) as of September 30, 2023,March 31, 2024, the related consolidated statements of income, comprehensive income, and equity for the three- and nine-month periods ended September 30, 2023 and 2022, the related consolidated statements of cash flows for the nine-monththree-month periods ended September 30,March 31, 2024 and 2023, and 2022, and the related notes (collectively referred to as the “consolidated interim financial statements”). Based on our reviews, we are not aware of any material modifications that should be made to the consolidated interim financial statements for them to be in conformity with U.S. generally accepted accounting principles.
We have previously audited, in accordance with the standards of the Public Company Accounting Oversight Board (United States) (PCAOB), the consolidated balance sheet of the Company as of December 31, 2022,2023, the related consolidated statements of income, comprehensive income, equity and cash flows for the year then ended, and the related notes (not presented herein); and in our report dated February 15, 2023,2024, we expressed an unqualified audit opinion on those consolidated financial statements. In our opinion, the information set forth in the accompanying consolidated balance sheet as of December 31, 2022,2023, is fairly stated, in all material respects, in relation to the consolidated balance sheet from which it has been derived.
Basis for Review Results
These financial statements are the responsibility of the Company's management. We are a public accounting firm registered with the PCAOB and are required to be independent with respect to the Company in accordance with the U.S. federal securities laws and the applicable rules and regulations of the Securities and Exchange Commission and the PCAOB. We conducted our review in accordance with the standards of the PCAOB. A review of interim financial statements consists principally of applying analytical procedures and making inquiries of persons responsible for financial and accounting matters. It is substantially less in scope than an audit conducted in accordance with the standards of the PCAOB, the objective of which is the expression of an opinion regarding the financial statements taken as a whole. Accordingly, we do not express such an opinion.
/s/ Ernst & Young LLP
Phoenix, Arizona
November 3, 2023May 8, 2024
Item 2.Management’s Discussion and Analysis of Financial Condition and Results of Operations.
In Management’s Discussion and Analysis of Financial Condition and Results of Operations (MD&A), “we,” “us” and “our” refer to Freeport-McMoRan Inc. (FCX) and its consolidated subsidiaries. You should read this discussion in conjunction with our consolidated financial statements, the related MD&A and the discussion of our Business and Properties in our annual report on Form 10-K for the year ended December 31, 2022 (20222023 (2023 Form 10-K), filed with the United States (U.S.) Securities and Exchange Commission (SEC). The results of operations reported and summarized below include forward-looking statements that are not guarantees of future performance and are not necessarily indicative of future operating results (refer to “Cautionary Statement” for further discussion). References to “Notes” are Notes included in our Notes to Consolidated Financial Statements (Unaudited). Throughout MD&A, all references to income or losses per share are on a diluted basis. OurAny references to our website is for information only and the contents of our website or information connected thereto are not incorporated in, or otherwise to be regarded as part of, this Form 10-Q.
OVERVIEW
We are a leading international miningmetals company with headquartersthe objective of being foremost in copper. Headquartered in Phoenix, Arizona. WeArizona, we operate large, long-lived, geographically diverse assets with significant proven and probable mineral reserves of copper, gold and molybdenum. We are one of the world’s largest publicly traded copper producers. Our portfolio of assets includes the Grasberg minerals district in Indonesia, one of the world’s largest copper and gold deposits; and significant mining operations in North America and South America, including the large-scale Morenci minerals district in Arizona and the Cerro Verde operation in Peru.
Our results for the third quarter and first nine months of 2023first-quarter 2024 reflect strong operating performance, with significant increases in consolidated copper and continued execution of our business strategy.gold sales volumes from PT Freeport Indonesia (PT-FI) compared to first-quarter 2023. We remain focused on managing costs efficientlyreliable execution of our plans, enhancing our productivity and continue to advance several important value-enhancing initiatives. Despite near-term global economiccost performance, generating strong cash flow and market uncertainties, we are confident inbuilding value through our long-lived and high-quality asset base and have a favorable outlook on the long-termorganic growth pipeline. Market fundamentals for copper drivenhave been positive, supported by copper’s increasingly important role in the global transitioneconomy and limited available supplies to clean energy. Asmeet growing demand.
With our solid financial position, we are a leading responsible supplierproducer of copper with a strong balance sheetmultiple options for future growth and an experienced team with a proven track record for successful project development, we believe we are well positioned to build long-term value for the benefit of our stakeholders.
accomplishment. Our near-term organic development pipeline is highlighted by our leach innovation initiatives, which we believe have the potentialcontinue to provide substantial value fromadvance through incorporation of new applications, technologies and data analytics to our existing leach material and reduce capital intensity for future projects. During third-quarter 2023, incrementalleaching processes. Incremental copper production from these initiatives totaled 4651 million pounds and we are targeting achievement of an annual run rate of approximately 200in first-quarter 2024, compared with 22 million pounds of copper by the end of 2023, with potentially larger opportunities in the future.first-quarter 2023.
Cerro Verde's concentrator facilities continue to perform well,Construction of the Manyar smelter and precious metals refinery (PMR) (collectively, the Indonesia smelter projects) in Gresik, Indonesia, are advancing on schedule with milling rates averaging 431,300 metric tonsa target of ore per day in third-quarter 2023, a new quarterly record. We also continue to progressMay 2024 for substantial construction completion. Once completed, the Indonesia smelter projects will complement our underground development activities at Grasberg, supporting large-scale, long-lived, low-cost operations. Refer to “Operations” for further discussion.operations in the Grasberg minerals district.
Net income attributable to common stockholders totaled $454$473 million in third-quarter 2023 and $1.5 billion for the first nine months of 2023,first-quarter 2024, compared with $404$663 million in third-quarter 2022 and $2.8 billion for the first nine months of 2022.first-quarter 2023. The increasedecrease in third-quarter 2023,first-quarter 2024, compared to third-quarter 2022,first-quarter 2023, primarily reflects higher copper sales volumes and copper prices, partly offset by a higher income tax provision. The decrease for the first nine months of 2023, compared with the first nine months of 2022, primarily reflects increased costs for maintenance and supplies, partly offset by a lower income tax provision. The 2023 periods were also impacted by the change inattributable to noncontrolling interests at our economic interest in PT Freeport Indonesia (PT-FI) (refer to Note 1 for further discussion).operations. Refer to “Consolidated Results” for further discussion of these impacts.
On July 24, 2023, PT-FI was granted an export license through May 2024 for 1.7 million metric tons of copper concentrate. Through June 10, 2023, PT-FI exported anode slimes under PT Smelting’s export license. A change in regulations during second-quarter 2023 requires PT-FI to follow a new administrative process for the export of anode slimes. The administrative process is advancing, and PT-FI expects to receive approval to resume exports of anode slimes during fourth-quarter 2023. Refer to Note 8 and “Operations – Indonesia Mining” for further discussion of Indonesia regulatory matters.discussion.
At September 30, 2023,March 31, 2024, we had consolidated debt of $9.4 billion and consolidated cash and cash equivalents of $5.7$5.2 billion, ($6.25$6.1 billion including $0.5$0.9 billion of current restricted cash and cash equivalents associated with a
portion of PT-FI's export proceeds required to be temporarily deposited in Indonesia banks).banks. Net debt totaled $3.2 billion ($0.8$0.3 billion, excluding net$3.0 billion of debt for the Manyar smelter and precious metals refinery (PMR) in Indonesia (collectively, the Indonesia smelter projects)).projects. Refer to “Net Debt” for reconciliations of consolidated debt, consolidated cash and cash equivalents and current restricted cash associated with PT-FI's export proceeds to net debt.
Beginning in 2022 and through November 3, 2023, we purchased $1.3 billion aggregate principal amount of our senior notes in open-market transactions for a total cost of $1.2 billion, including $102 million aggregate principal amount in third-quarter 2023 and $233 million in the first nine months of 2023.
At September 30, 2023,March 31, 2024, we had $3.0 billion of availability under our revolving credit facility, and PT-FI and Cerro Verde had $1.3$1.75 billion and $350 million, respectively, of availability under their respective revolving credit facilities.
Refer to Note 5 and “Capital Resources and Liquidity” for further discussion of our debt balances and transactions.
OUTLOOK
As further discussed in “Risk Factors” in Part I, Item 1A. of our 20222023 Form 10-K, our financial results vary as a result of fluctuations in market prices primarily for copper, gold and, to a lesser extent, molybdenum, as well as other factors. World market prices for these commodities have fluctuated historically and are affected by numerous factors beyond our control. Refer to “Markets” below for further discussion. Because we cannot control the prices of our products, the key measures that management focuses on in operating our business are sales volumes, unit net cash costs, operating cash flows and capital expenditures.
Consolidated Sales Volumes
Following are our projected consolidated sales volumes for the year 2023:2024:
| | | | | | | | | | | |
Copper (millions(billions of recoverable pounds): | | | | | |
| North America copper mines | 1,3731.28 | | | | | |
South America miningoperations | 1,1941.15 | | | | | |
Indonesia miningoperations | 1,4891.73 | | a | | | | |
| Total | 4,0564.15 | | b | | | | |
| | | | | |
Gold (millions of recoverable ounces) | 1.742.0 | | a | | | | |
| | | | | |
Molybdenum (millions of recoverable pounds) | 8084 | | c | | a | | |
| | | | | |
a.Projected molybdenumPT-FI’s current export licenses for copper concentrates and anode slimes extend through May 2024. Consolidated sales volume estimates include exports of copper concentrates and anode slimes by PT-FI from June 2024 through December 2024 totaling 0.4 billion pounds of copper and 0.9 million ounces of gold.
b.Does not foot because of rounding.
c.Includes 50 million pounds produced by our North America copper mines and South America copper minesoperations and 3034 million pounds produced by our Molybdenum mines.
Consolidated sales volumes in fourth-quarter 2023second-quarter 2024 are expected to approximate 1.11.0 billion pounds of copper, 580500 thousand ounces of gold and 2021 million pounds of molybdenum. Consolidated copper and gold production volumes for the year 2024 are expected to exceed 2024 sales volumes, reflecting the deferral of approximately 90 million pounds of copper and 120 thousand ounces of gold that will be processed by the Indonesia smelter projects and sold as refined metal in future periods.
PT-FI is working with the Indonesia government to obtain approvals to continue exports of copper concentrates and anode slimes beyond May 2024 and until the Indonesia smelter projects are fully commissioned and reach designed operating conditions, which is currently expected by year-end 2024. We cannot predict if PT-FI will obtain approval timely, if at all, to continue exports of copper concentrates and anode slimes beyond May 2024. If exports were prohibited or limited, or additional financial impacts resulting from Indonesia regulations were to be assessed prior to PT-FI’s Indonesia smelter projects becoming operational by year-end 2024, PT-FI may be required to reduce production levels or be subject to additional costs, which could adversely impact our revenues and operations.
Projected sales volumes are dependent on operational performance,performance; extension of PT-FI’s export licenses for copper concentrates and anode slimes beyond May 2024; the resumptiontiming of anode slime exports at PT-FI,the ramp-up of the Indonesia smelter projects; weather-related conditions, including ongoing El Niño weather impacts; timing of shipments and other factors detailed in the "Cautionary Statement"“Cautionary Statement” below.
For other important factors that could cause results to differ materially from projections, refer to “Risk Factors” contained in Part I, Item 1A. of our 20222023 Form 10-K and Part II, Item 1A. herein.10-K.
Consolidated Unit Net Cash Costs
Assuming average prices of $1,900 per ounce of gold and $20.00 per pound of molybdenum for the remainder of 2023 and achievement of current volume and cost estimates, consolidatedConsolidated unit net cash costs (net of by-product credits) for our copper mines are expected to average $1.63$1.57 per pound of copper for the year 20232024 (including $1.58$1.57 per pound of copper in fourth-quarter 2023). Estimated consolidated unit net cash costssecond-quarter 2024), based on achievement of current volume and cost estimates, and assuming average prices of $2,300 per ounce of gold and $20.00 per pound of molybdenum for the year 2023 include assessmentremainder of a 7.5% export duty at PT-FI during the second half of 2023, which continues to be discussed with the Indonesia government.2024. Quarterly unit net cash costs vary with fluctuations in sales volumes and realized prices, primarily for gold and molybdenum. The impact of price changes during fourth-quarter 2023 on consolidated unit net cash costs for the year 20232024 would approximate $0.02$0.04 per pound of copper for each $100 per ounce change in the average price of gold and $0.01$0.02 per pound of copper for each $2 per pound change in the average price of molybdenum.molybdenum during the remainder of 2024.
Consolidated Operating Cash Flows
Our consolidated operating cash flows vary with sales volumes; prices realized from copper, gold and molybdenum sales; production costs; income taxes; other working capital changes; and other factors. AssumingOur consolidated operating cash flows are estimated to approximate $7.4 billion, net of $0.2 billion of working capital and other uses, for the year 2024, based on current sales volume and cost estimates, extension of PT-FI’s export licenses for copper concentrates and anode slimes beyond May 2024, and assuming average prices of $3.60$4.25 per pound for copper, $1,900$2,300 per ounce for gold and $20.00 per pound for molybdenum in fourth-quarter 2023 and the resumption of anode slime exports at PT-FI, our consolidated operating cash flows are estimated to approximate $5.4 billion (net of $0.5 billion of working capital and other uses) for the year 2023.remainder of 2024. Estimated consolidated operating cash flows for the year 20232024 also reflect an estimated income tax provision of $2.1$2.8 billion (refer to “Consolidated Results – Income Taxes” for further discussion of our projected income tax rate for the year 2023)2024). The impact of price changes during fourth-quarter 2023 on consolidated operating cash flows for the year 20232024 would approximate $115$270 million for each $0.10 per pound change in the average price of copper, $55$105 million for each $100 per ounce change in the average price of gold and $15$90 million for each $2 per pound change in the average price of molybdenum.molybdenum for the remainder of 2024.
Consolidated Capital Expenditures
Capital expenditures are expected to approximate $4.8$4.6 billion for the year 2023 (including $1.92024, including $2.3 billion for major mining projects and $1.6$1.0 billion for the Indonesia smelter projects).projects. Projected capital expenditures for the Indonesia smelter projects in 2024 exclude capitalized interest and $0.3 billion of estimated commissioning and owner’s costs. Projected capital expenditures for major mining projects include $1.3$1.1 billion for planned projects, (primarilyprimarily associated with underground mine development in the Grasberg minerals district and supporting millpotential expansion projects in North America, and power capital costs) and $0.6$1.2 billion for discretionary growth projects (primarily for development of Kucing Liar, a mill recovery project with the installation of a new copper cleaner circuit at PT-FI, and expansion projects at Bagdad and Lone Star).projects. We closely monitor market conditions and will continue to adjust our operating plans, including capital expenditures, to protect our liquidity and preserve our asset values, as necessary.
Capital expenditures for the Indonesia smelter projects for the remainder of 2024 are beingexpected to be funded with PT-FI's senior notes and availability under itsPT-FI’s revolving credit facility.
MARKETS
World pricesPrices for copper, gold and molybdenum are affected by numerous factors beyond our control and can fluctuate significantly. During the period from January 2013 through Septembersignificantly (for further discussion refer to “Risk Factors” contained in Part I, Item 1A. of our 2023 Form 10-K). The following graphs present the London Metal Exchange (LME) copper settlement price, varied from a low of $1.96 per pound in 2016 to a record high of $4.87 per pound in 2022; the London Bullion Market Association (London) PM gold price, fluctuated from a low of $1,049 per ounce in 2015 to a record high of $2,067 per ounce in 2020; and the Platts Metals Daily Molybdenum Dealer Oxide weekly average price ranged from a low of $4.46 per pound in 2015 to a high of $37.42 per pound in 2023. Copper, gold and molybdenum prices are affected by numerous factors beyond our control as described further in “Risk Factors” contained in Part I, Item 1A. of our 2022 Form 10-K and Part II, Item 1A. herein.since January 2014.
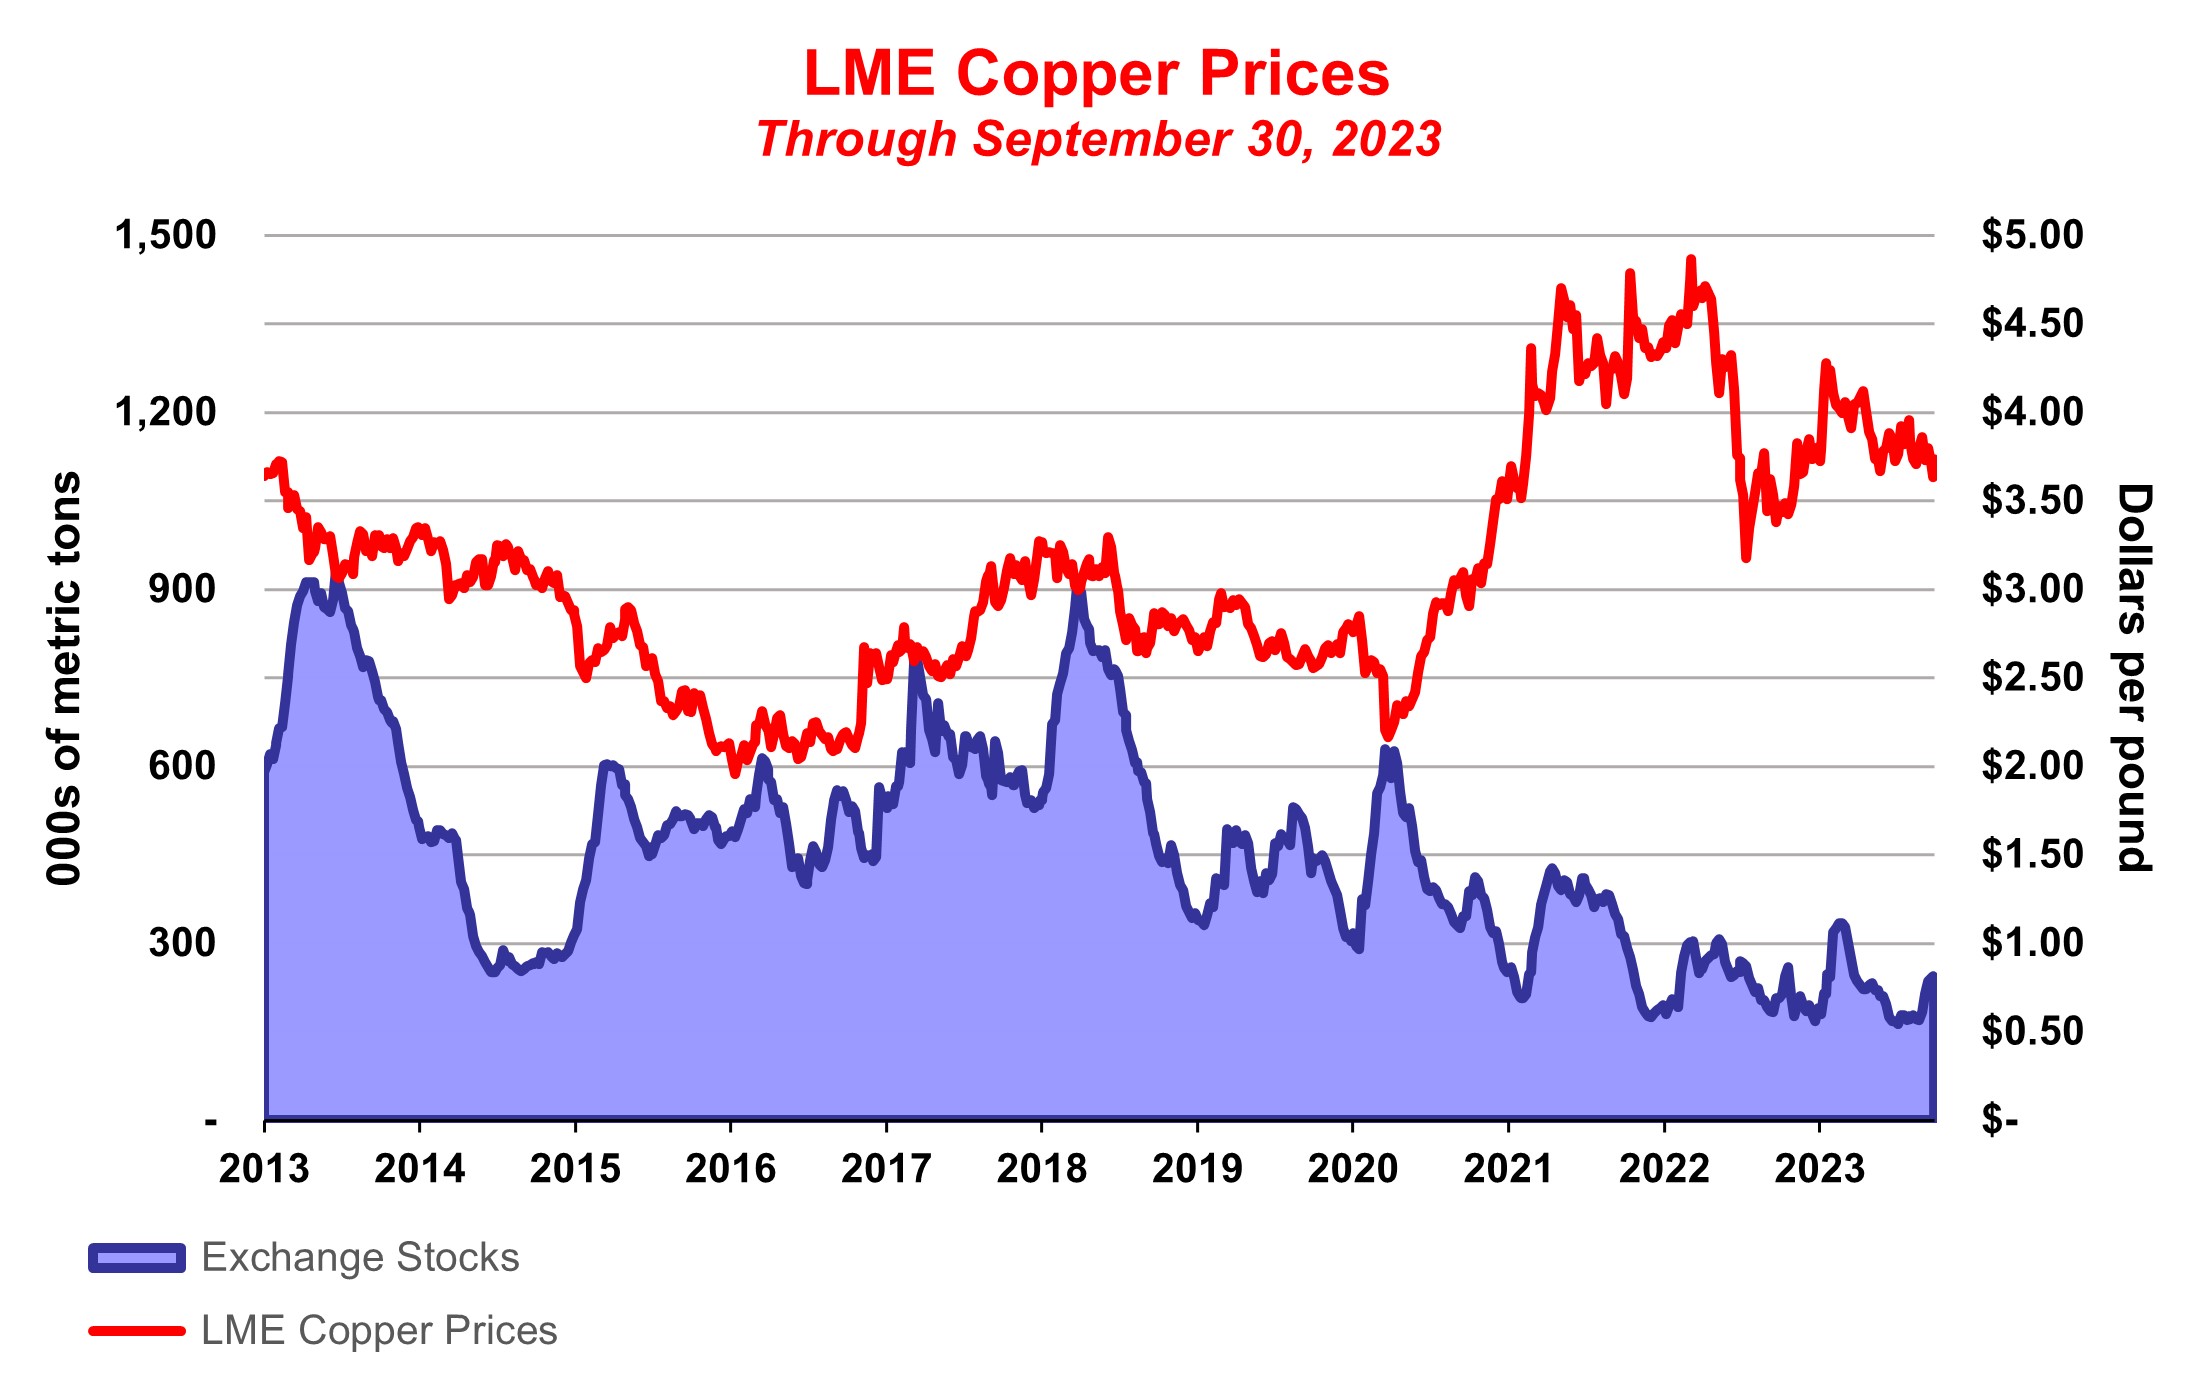
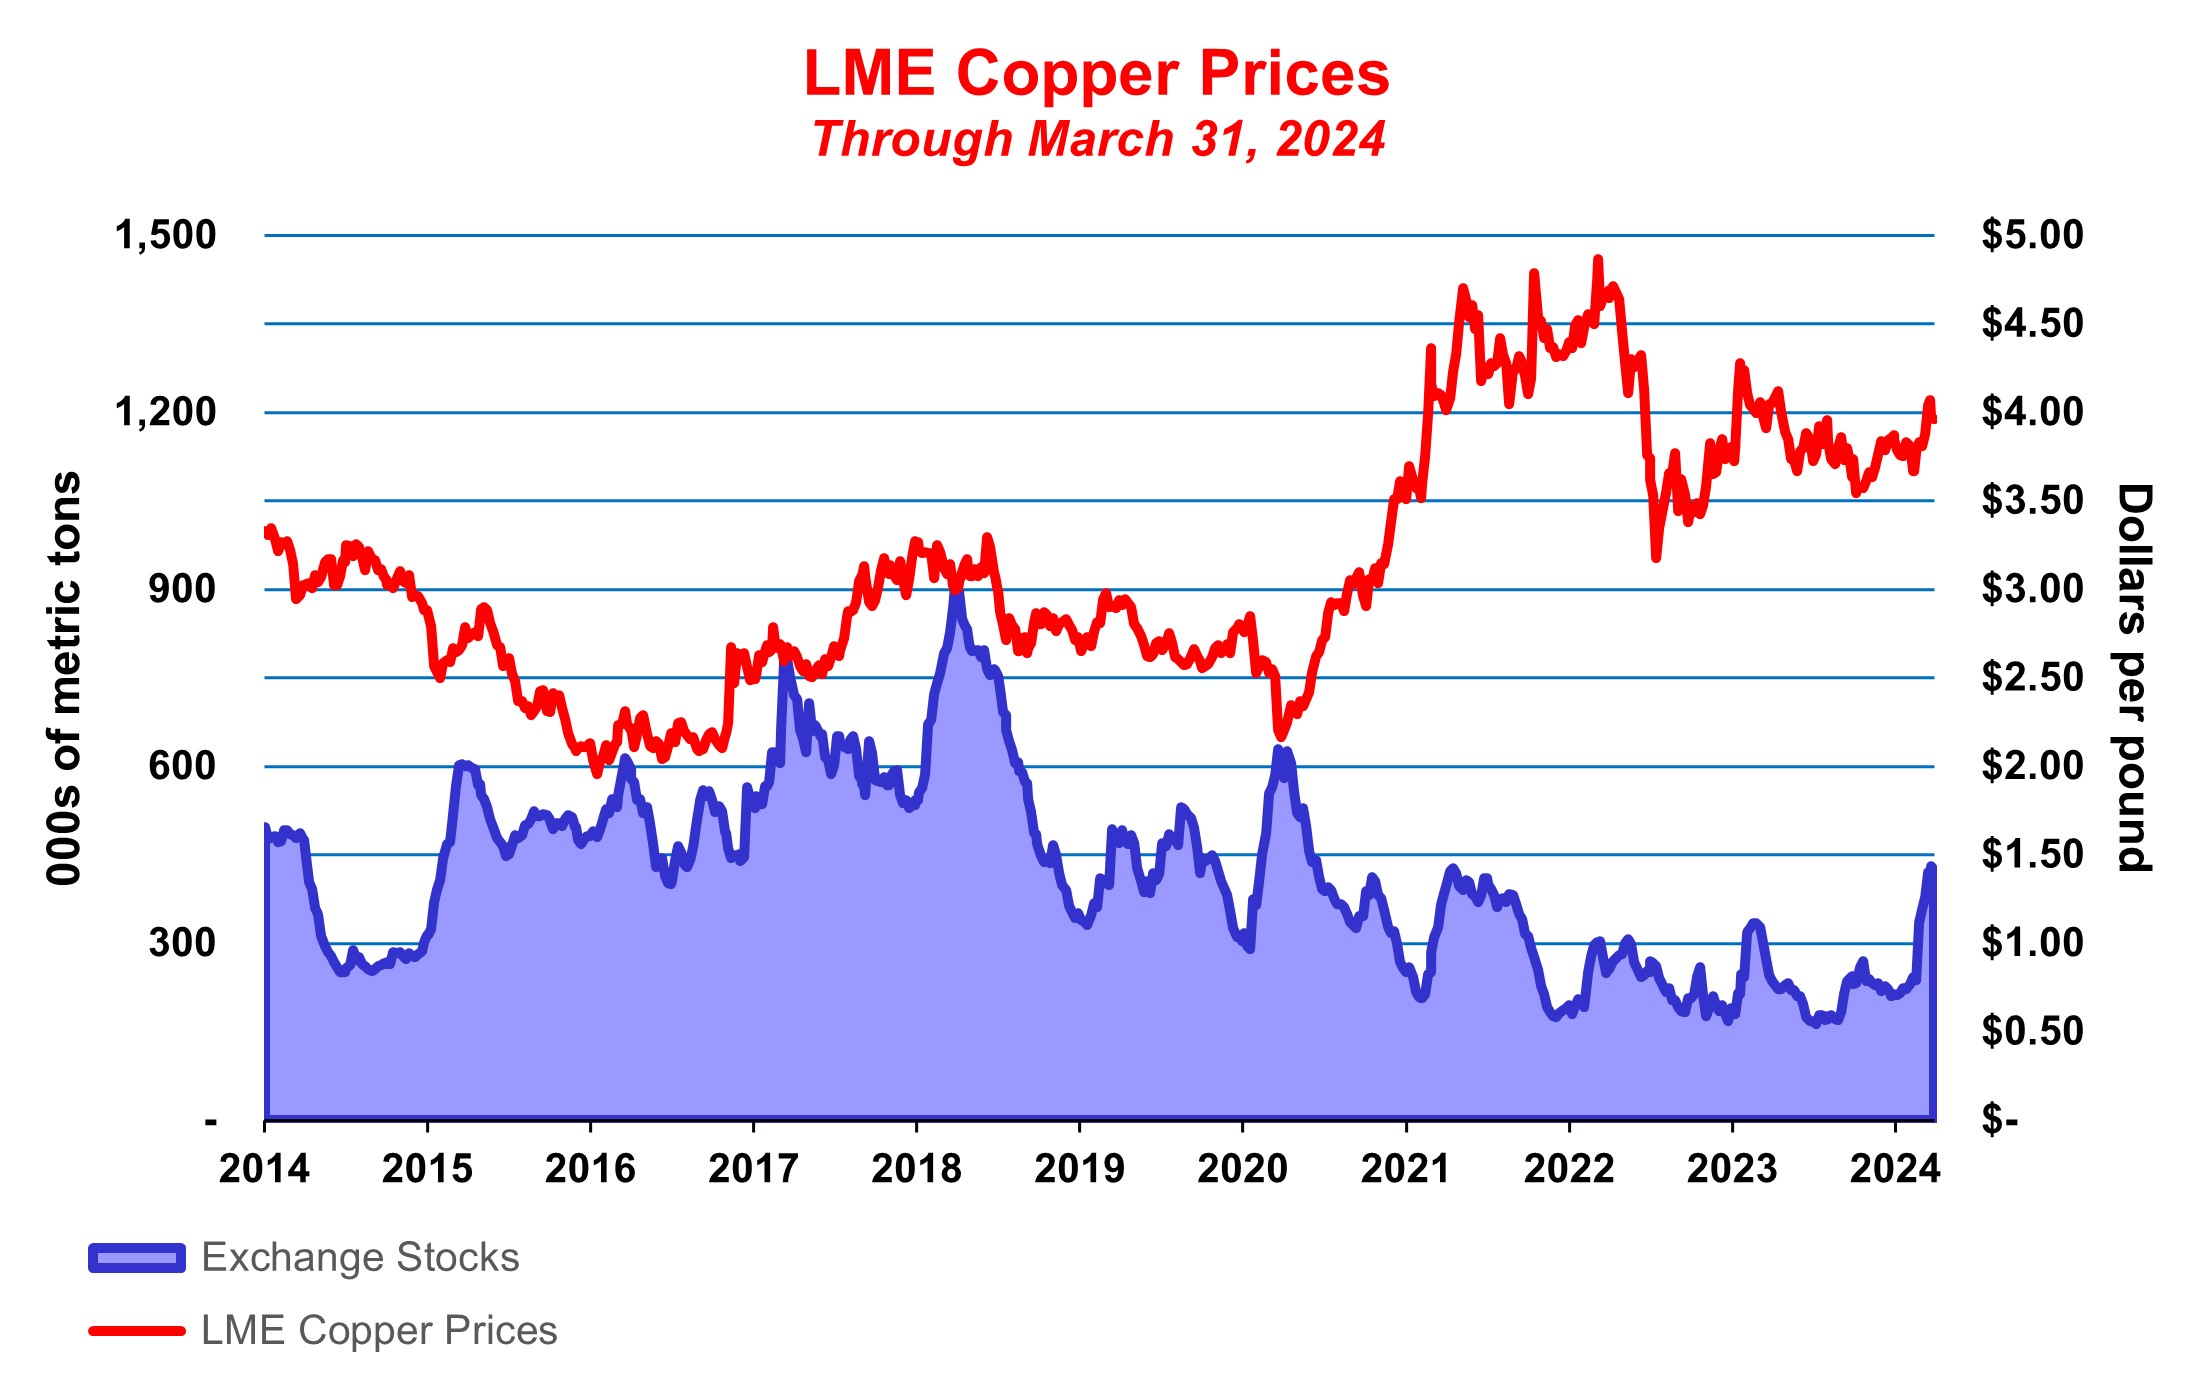
This graph presents LME copper settlement prices and the combined reported stocks of copper at the LME, Commodity Exchange Inc., and the Shanghai Futures Exchange from January 20132014 through September 2023.March 2024. During third-quarter 2023,first-quarter 2024, LME copper settlement prices ranged from a low of $3.64$3.67 per pound to a high of $3.96$4.07 per pound, averaged $3.79$3.83 per pound and settled at $3.73$3.96 per pound on September 29, 2023. VolatilityMarch 28, 2024. Upward momentum in copper prices has continued across the copper market in third-quarter 2023, influenced by China’s mixed economic data and wide-ranging views about the global and U.S. economy. While still relatively low relative to consumption, inventory levels rose during third-quarter 2023, with slightly more than three days of global consumption available at the end of October 2023. Rising inventory levels have translated to copper price declines,second-quarter 2024, and the LME copper settlement price was $3.65$4.52 per pound on October 31, 2023.April 30, 2024, bolstered by expectations of tight supplies and optimism about demand.
We believe long-term fundamentals for copper are favorable and that future demand will be supported by copper’s critical role in the global transition to renewable power, electric vehicles and other carbon-reduction initiatives, and continued urbanization in developing countries. The small number of approved, large-scale projects beyond those that have been announced, the long lead times required to permitcountries and build new mines and declining ore grades at existing operations continue to highlight the fundamental supply challenges for copper.growing connectivity globally.
This graph presents London PM gold prices from January 20132014 through September 2023.March 2024. During third-quarter 2023,first-quarter 2024, London PM gold prices ranged from a low of $1,871$1,985 per ounce to a high of $1,976$2,214 per ounce, averaged $1,928$2,070 per ounce and closed at $1,871$2,214 per ounce on September 29, 2023. Forecasts are divided as analysts evaluate climbing treasury yields,March 28, 2024. Gold prices hit a record high during first-quarter 2024, propelled by U.S. interest rate cut expectations and strong safe-haven demand. In April 2024, a new record high was reached ($2,402 per ounce on April 12, 2024) and the strength of the U.S. dollar, the potential lagged impact of a significant cumulative rate-hiking cycle, and sustained elevated geopolitical risk. The London PM gold price was $1,997$2,307 per ounce on October 31, 2023.April 30, 2024.
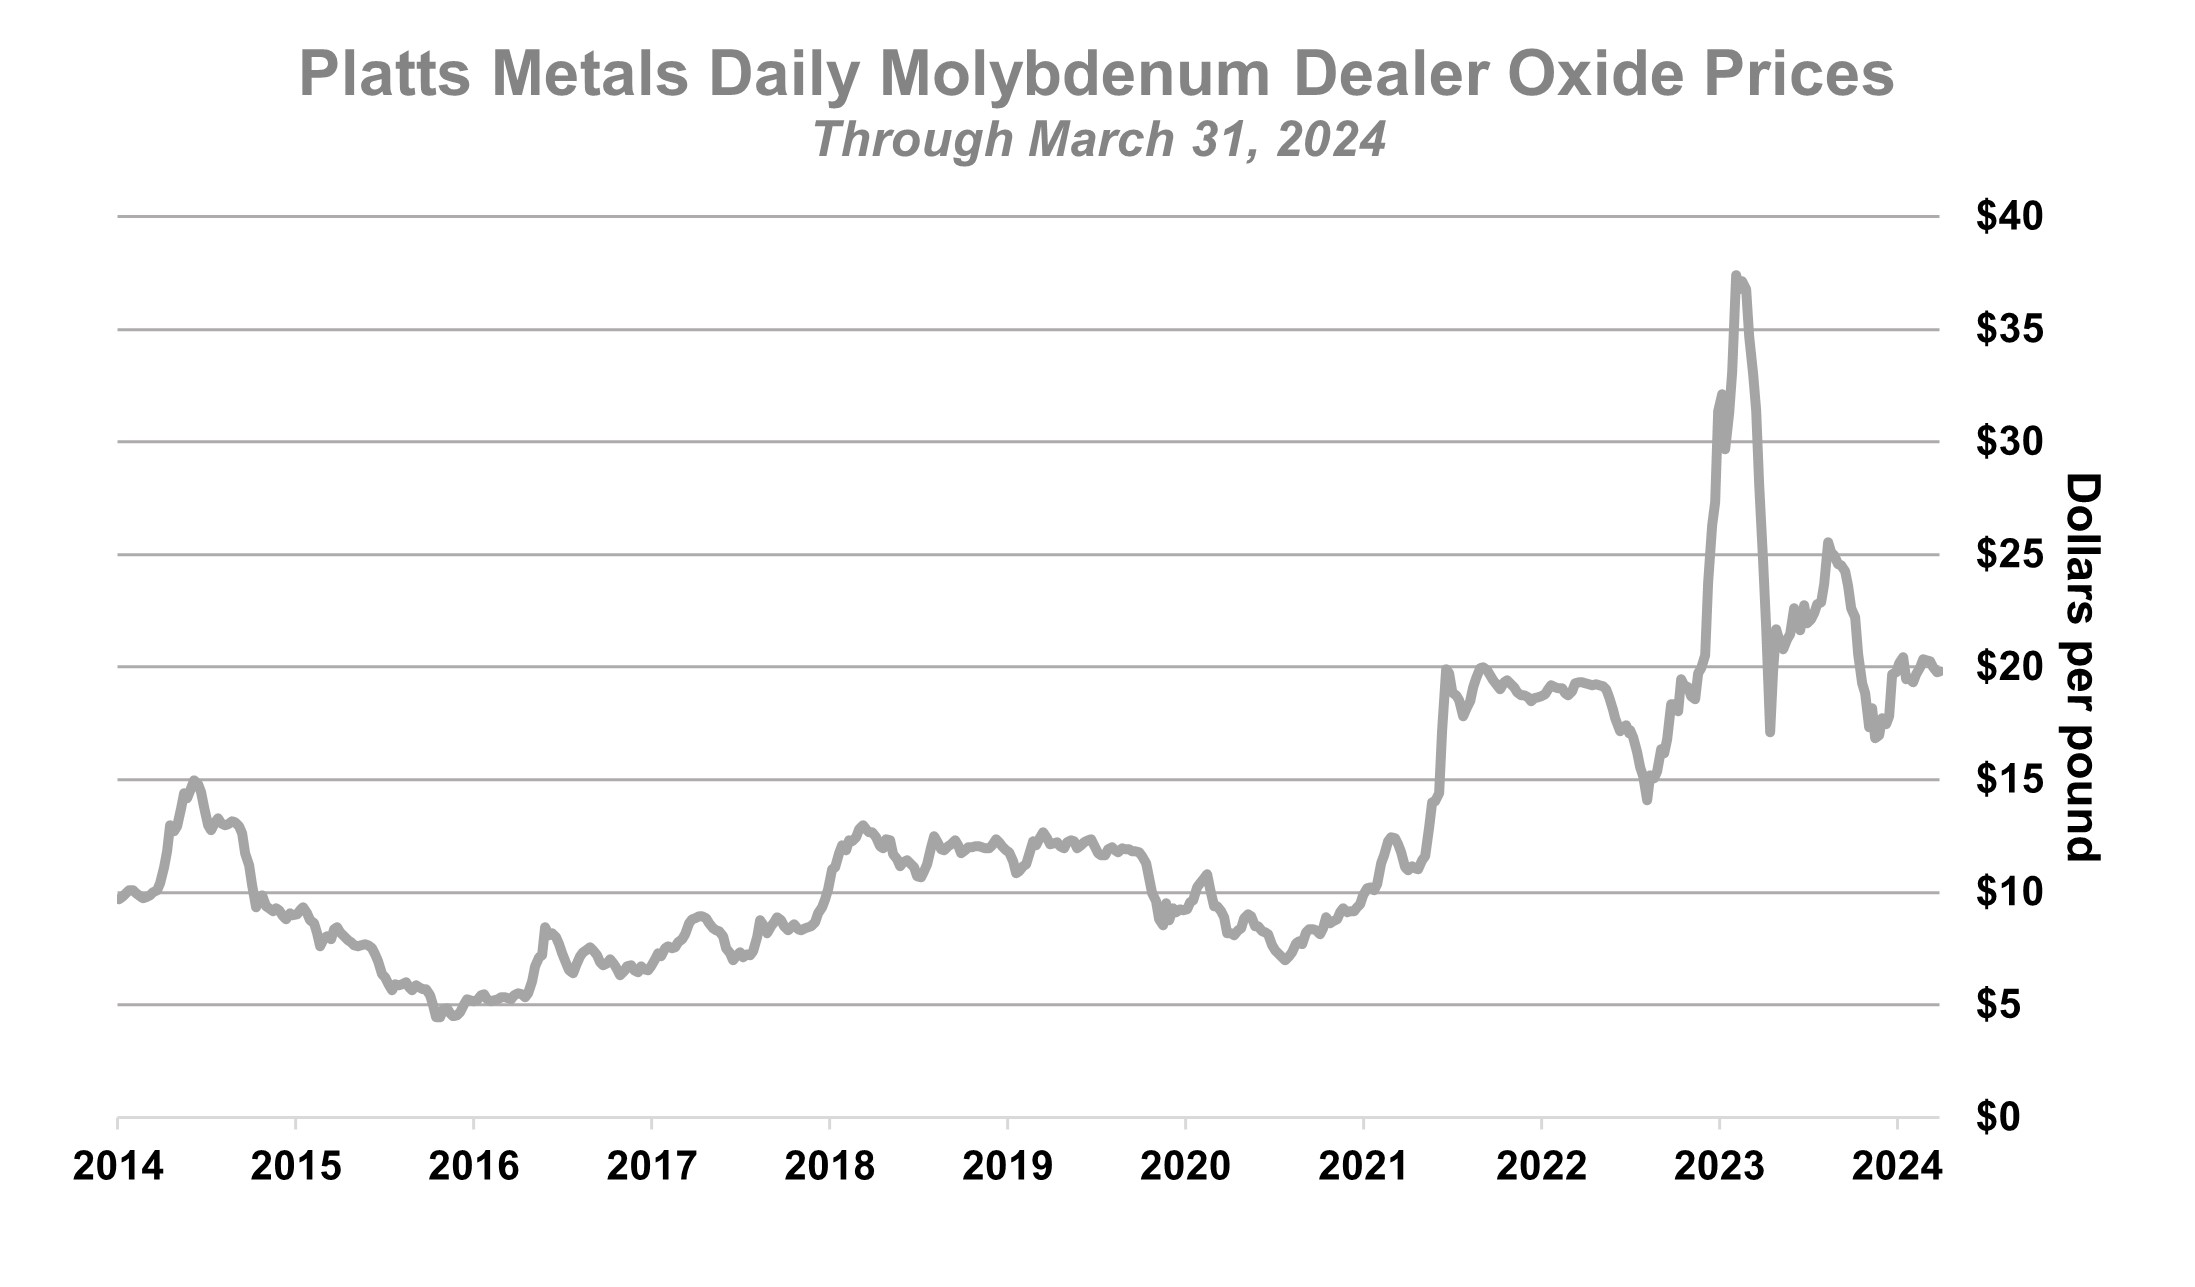
This graph presents the Platts Metals Daily Molybdenum Dealer Oxide weekly average price from January 20132014 through September 2023.March 2024. During third-quarter 2023,first-quarter 2024, the weekly average price of molybdenum ranged from a low of $22.11$19.34 per pound to a high of $25.57$20.42 per pound, averaged $23.78$19.93 per pound and was $22.61$19.81 per pound on
September 29, 2023. March 28, 2024. During third-quarter 2023, there was improved demand from Chinese steel mills, while downstream demand in Europe and North America remained low because of seasonality and economic weakness. Overallfirst-quarter 2024, overall global demand for molybdenum was mixed with steady demand from energy, power generation, aerospace and aerospacedefense sectors, performing better than others, such asand some weakness in the construction sector. We believe long-term fundamentals for molybdenum are positive with favorable demand drivers and limited supply. The Platts Metals Daily Molybdenum Dealer Oxide weekly average price was $18.83$20.63 per pound on October 27, 2023.April 26, 2024.
CONSOLIDATED RESULTS
| | Three Months Ended March 31, | |
| Three Months Ended March 31, | |
| Three Months Ended March 31, | |
| | | Three Months Ended September 30, | | Nine Months Ended September 30, | |
| | | 2023 | | 2022 | | 2023 | | 2022 | |
SUMMARY FINANCIAL DATA | SUMMARY FINANCIAL DATA | (in millions, except per share amounts) | |
SUMMARY FINANCIAL DATA | |
SUMMARY FINANCIAL DATA | |
Revenuesa,b | |
Revenuesa,b | |
Revenuesa,b | Revenuesa,b | $ | 5,824 | | | $ | 5,003 | | | $ | 16,950 | | | $ | 17,022 | | |
Operating incomea | Operating incomea | $ | 1,492 | | | $ | 962 | |
| $ | 4,503 | | | $ | 5,507 | | |
Operating incomea | |
Operating incomea | |
| Net income attributable to common stockc,d | $ | 454 | | e | $ | 404 | | f | $ | 1,460 | | e | $ | 2,771 | | f |
Net income attributable to common stockc | |
| Net income attributable to common stockc | |
| Net income attributable to common stockc | |
| Diluted net income per share of common stock | |
| Diluted net income per share of common stock | |
| Diluted net income per share of common stock | Diluted net income per share of common stock | $ | 0.31 | | | $ | 0.28 | | | $ | 1.01 | | | $ | 1.90 | | |
| | Diluted weighted-average shares of common stock outstanding | Diluted weighted-average shares of common stock outstanding | 1,443 | | | 1,439 | | | 1,443 | | | 1,455 | | |
| Operating cash flowsg | $ | 1,236 | | | $ | 758 | | | $ | 3,959 | | | $ | 4,070 | | |
| | Diluted weighted-average shares of common stock outstanding | |
| | Diluted weighted-average shares of common stock outstanding | |
| Operating cash flowsf | |
| Operating cash flowsf | |
| Operating cash flowsf | |
| Capital expenditures | Capital expenditures | $ | 1,178 | | | $ | 836 | | | $ | 3,462 | | | $ | 2,422 | | |
| At September 30: | |
| Capital expenditures | |
| Capital expenditures | |
| At March 31: | |
| At March 31: | |
| At March 31: | |
| Cash and cash equivalents | |
| Cash and cash equivalents | |
| Cash and cash equivalents | Cash and cash equivalents | $ | 5,745 | | | $ | 8,578 | | | $ | 5,745 | | | $ | 8,578 | | |
| Restricted cash and cash equivalents, current | Restricted cash and cash equivalents, current | $ | 697 | | h | $ | 112 | | | $ | 697 | | h | $ | 112 | | |
| Restricted cash and cash equivalents, current | |
| Restricted cash and cash equivalents, current | |
| Total debt, including current portion | |
| Total debt, including current portion | |
| Total debt, including current portion | Total debt, including current portion | $ | 9,405 | | | $ | 10,690 | | | $ | 9,405 | | | $ | 10,690 | | |
|
a.Refer to Note 9 for a summary of revenues and operating income by operating division.
b.Includes (unfavorable) favorable (unfavorable) adjustments to prior period provisionally priced concentrate and cathode copper sales totaling $4$(7) million ($2(2) million to net income attributable to common stock or less than $0.01 per share)stock) in third-quarter 2023, $(228)first-quarter 2024 and $210 million ($(95)72 million to net income attributable to common stock or $(0.07) per share)stock) in third-quarter 2022, $183 million ($62 million to net income attributable to common stock or $0.04 per share) for the first nine months of 2023 and $58 million ($24 million to net income attributable to common stock or $0.02 per share) for the first nine months of 2022.first-quarter 2023. Refer to Note 6 for further discussion.
c.Our economic interest in PT-FI is 48.76% and prior to January 1, 2023, it approximated 81%.
d.We defer recognizing profits on intercompany sales until final sales to third parties occur. Refer to “Operations – Smelting and Refining” for a summary of net impacts from changes in these deferrals.
e.d.Includes net international tax credits of $181 million, which were offset by charges totaling $117of $109 million ($0.08 per share) in third-quarter 2023 and $368 million ($0.25 per share) for the first nine months of 2023, primarily associated with assumed oil and gas abandonment obligations resulting from bankruptcies of other companies and $56 million of revisions to environmental obligation estimates and asset impairment$16 million of other net charges. Net charges for the first nine months of 2023 also included charges for contested tax rulings issued by the Peruvian Supreme Court and an accrual for a potential administrative fine in Indonesia.
f.e.Includes net credits (charges)charges totaling $29$94 million, ($0.02 per share) in third-quarter 2022 and $(23) million ($(0.02) per share) for the first nine months of 2022. Net credits in third-quarter 2022 were primarily associated with gains on early extinguishment of debtnet adjustments to environmental obligations, contested tax matters and favorable adjustments associated with international tax audits, partly offset by metals inventory adjustments. The first nine months of 2022 also included net charges at PT-FI primarily associated with an administrative fine levied by the Indonesia government and a reserve for exposure associated with export duties.asset impairments in North America.
g.f.Working capital and other uses totaled $483$97 million in third-quarter 2023, $269first-quarter 2024 and $452 million in third-quarter 2022, $713 million for the first nine months of 2023 and $980 million for the first nine months of 2022.first-quarter 2023.
h.g.Includes $0.5$0.9 billion at March 31, 2024, associated with a portion of PT-FI'sPT-FI’s export proceeds required to be temporarily deposited in Indonesia banks for 90 days in accordance with an August 2023a regulation issued by the Indonesia government.
| | Three Months Ended September 30, | | Nine Months Ended September 30, | |
| 2023 | | 2022 | | 2023 | | 2022 | |
| Three Months Ended March 31, | |
| Three Months Ended March 31, | |
| Three Months Ended March 31, | |
| 2024 | |
| 2024 | |
| 2024 | |
| SUMMARY OPERATING DATA | |
| SUMMARY OPERATING DATA | |
| SUMMARY OPERATING DATA | SUMMARY OPERATING DATA | | | | | | |
Copper (millions of recoverable pounds) | Copper (millions of recoverable pounds) | | | | |
Copper (millions of recoverable pounds) | |
Copper (millions of recoverable pounds) | |
Copper (millions of recoverable pounds) | |
Copper (millions of recoverable pounds) | |
Copper (millions of recoverable pounds) | |
Copper (millions of recoverable pounds) | |
Copper (millions of recoverable pounds) | |
Copper (millions of recoverable pounds) | |
| Production | |
| Production | |
| Production | Production | 1,085 | | | 1,056 | | | 3,117 | | | 3,140 | | |
| Sales, excluding purchases | Sales, excluding purchases | 1,109 | | | 1,060 | | | 2,970 | | | 3,171 | | |
| Sales, excluding purchases | |
| Sales, excluding purchases | |
| Average realized price per pound | |
| Average realized price per pound | |
| Average realized price per pound | Average realized price per pound | $ | 3.80 | | | $ | 3.50 | |
| $ | 3.87 | | | $ | 3.88 | | |
Site production and delivery costs per pounda | Site production and delivery costs per pounda | $ | 2.27 | | | $ | 2.35 | | | $ | 2.40 | | | $ | 2.16 | | |
Site production and delivery costs per pounda | |
Site production and delivery costs per pounda | |
Unit net cash costs per pounda | |
Unit net cash costs per pounda | |
Unit net cash costs per pounda | Unit net cash costs per pounda | $ | 1.73 | | | $ | 1.75 | | | $ | 1.65 | | | $ | 1.50 | | |
Gold (thousands of recoverable ounces) | Gold (thousands of recoverable ounces) | | | | |
Gold (thousands of recoverable ounces) | |
Gold (thousands of recoverable ounces) | |
| Production | |
| Production | |
| Production | Production | 532 | | | 448 | | | 1,420 | | | 1,339 | | |
| Sales, excluding purchases | Sales, excluding purchases | 399 | | | 480 | | | 1,164 | | | 1,365 | | |
| Sales, excluding purchases | |
| Sales, excluding purchases | |
| Average realized price per ounce | |
| Average realized price per ounce | |
| Average realized price per ounce | Average realized price per ounce | $ | 1,898 | | | $ | 1,683 | | | $ | 1,932 | | | $ | 1,786 | | |
Molybdenum (millions of recoverable pounds) | Molybdenum (millions of recoverable pounds) | | | | |
Molybdenum (millions of recoverable pounds) | |
Molybdenum (millions of recoverable pounds) | |
| Production | |
| Production | |
| Production | Production | 20 | | | 19 | | | 62 | | | 63 | | |
| Sales, excluding purchases | Sales, excluding purchases | 20 | | | 17 | | | 59 | | | 56 | | |
| Sales, excluding purchases | |
| Sales, excluding purchases | |
| Average realized price per pound | |
| Average realized price per pound | |
| Average realized price per pound | Average realized price per pound | $ | 23.71 | | | $ | 17.05 | | | $ | 26.05 | | | $ | 18.64 | | |
| |
a.Reflects per pound weighted-average production and delivery costs and unit net cash costs (net of by-product credits) for all copper mines, before net noncash and other costs. For reconciliations of per pound unit net cash costs by operating division to production and delivery costs applicable to sales reported in our consolidated financial statements, refer to “Product Revenues and Production Costs.”
Revenues
Consolidated revenues totaled $5.8$6.3 billion in third-quarter 2023, $5.0first-quarter 2024 and $5.4 billion in third-quarter 2022, and $17.0 billion for the first nine months of 2023 and 2022.first-quarter 2023. Revenues from our mining operations and processing facilities primarily include the sale of copper in concentrate, copper cathode, copper rod, gold in concentrate and anode slimes, and molybdenum. Refer to Note 9 for a summary of product revenues.
Following is a summary of changes in our consolidated revenues between periods (in millions):
| | | | | | | | | | | | | | |
| Three Months Ended September 30 | | Nine Months Ended September 30 | |
| | | | |
| Consolidated revenues - 2022 period | $ | 5,003 | | | $ | 17,022 | | |
| Higher (lower) sales volumes: | | | | |
| Copper | 168 | | | (779) | | |
| Gold | (138) | | | (359) | | |
| Molybdenum | 42 | | | 62 | | |
| | | | |
| Higher (lower) average realized prices: | | | | |
| Copper | 333 | | | (30) | | |
| Gold | 86 | | | 171 | | |
| Molybdenum | 134 | | | 441 | | |
| Adjustments for prior period provisionally priced copper sales | 232 | | | 125 | | |
| Higher Atlantic Copper revenues | 91 | | | 444 | | |
| (Lower) higher revenues from purchased copper | (97) | | | 5 | | |
| | | | |
| (Higher) lower treatment charges | (19) | | | 10 | | |
| (Higher) lower royalties and export duties | (49) | | | 171 | | |
| Other, including intercompany eliminations | 38 | | | (333) | | |
| Consolidated revenues - 2023 period | $ | 5,824 | | | $ | 16,950 | | |
| | | | |
| | | | |
| | | | | | | | | | |
| Three Months Ended March 31 | | | |
| | | | |
| Consolidated revenues - 2023 period | $ | 5,389 | | | | |
| Higher sales volumes: | | | | |
| Copper | 1,134 | | | | |
| Gold | 581 | | | | |
| Molybdenum | 31 | | | | |
| | | | |
| (Lower) higher average realized prices: | | | | |
| Copper | (188) | | | | |
| Gold | 111 | | | | |
| Molybdenum | (203) | | | | |
| Adjustments for prior period provisionally priced copper sales | (217) | | | | |
| Lower Atlantic Copper revenues | (83) | | | | |
| Lower revenues from purchased copper | (38) | | | | |
| | | | |
| Higher treatment charges | (28) | | | | |
| Higher royalties and export duties | (199) | | | | |
| Other, including intercompany eliminations | 31 | | | | |
| Consolidated revenues - 2024 period | $ | 6,321 | | | | |
| | | | |
Sales Volumes. Consolidated copper and gold sales volumes increased in third-quarter 2023,first-quarter 2024, compared to third-quarter 2022,first-quarter 2023, primarily as a result ofreflecting higher mining rates. Consolidated gold sales volumes decreased in third-quarter 2023, compared to third-quarter 2022, primarily reflecting the timing of shipments of anode slimes associated with a change in Indonesia administrative requirements for products that were previously being exported by PT Smelting.
Lower consolidated copper and gold sales volumes for the first nine months of 2023, compared to the 2022 period, primarily reflect the deferral of sales recognition related to the PT Smelting tolling arrangement. Lower copper sales
volumes also reflected lowermilling rates and ore grades in North America, and lower gold sales volumes also reflected the timing of shipments of anode slimes in Indonesia.at PT-FI.
Realized Prices. Our consolidated revenues can vary significantly as a result of fluctuations in the market prices of copper, gold and molybdenum. Average realized prices in third-quarter 2023,first-quarter 2024, compared with third-quarter 2022,first-quarter 2023, were 9% higher4% lower for copper, 13%10% higher for gold and 39% higher for molybdenum, and average realized prices for the first nine months of 2023, compared with the first nine months of 2022, were slightly33% lower for copper, 8% higher for gold and 40% higher for molybdenum.
Average realized copper prices include net unfavorablefavorable adjustments to current period provisionally priced copper sales totaling $34$73 million in third-quarter 2023, $44first-quarter 2024 and $21 million in third-quarter 2022, $152 million for the first nine months of 2023 and $832 million for the first nine months of 2022.first-quarter 2023. As discussed in Note 6, substantially all
of our copper concentrate and some cathode sales contracts provide final copper pricing in a specified future month (generally one to four months from the shipment date) based primarily on quoted LME monthly average copper prices.. We record revenues and invoice customers at the time of shipment based on then-current LME prices, which results in an embedded derivative on provisionally priced copper concentrate and cathode sales that is adjusted to fair value through earnings each period, using the period-end forward prices, until final pricing on the date of settlement. To the extent final prices are higher or lower than what was recorded on a provisional basis, an increase or decrease to revenues is recorded each reporting period until the date of final pricing. Accordingly, in times of rising copper prices, our revenues benefit from adjustments to the final pricing of provisionally priced sales pursuant to contracts entered into in prior periods; in times of falling copper prices, the opposite occurs.
Prior Period Provisionally Priced Copper Sales. Net (unfavorable) favorable (unfavorable) adjustments to prior periods’ provisionally priced copper sales (i.e., provisionally priced sales at June 30,December 31, 2023 and 2022, and December 31, 2022 and 2021)2022) recorded in consolidated revenues totaled $4$(7) million in third-quarter 2023, $(228)first-quarter 2024 and $210 million in third-quarter 2022, $183 million for the first nine months of 2023 and $58 million for the first nine months of 2022.first-quarter 2023. Refer to Notes 6 and 9 for a summary of total adjustments to prior period and current period provisionally priced sales.
At September 30, 2023,March 31, 2024, we had provisionally priced copper sales totaling 257229 million pounds of copper (net of intercompany sales and noncontrolling interests) recorded at an average of $3.75$4.01 per pound, subject to final pricing over the next several months. We estimate that each $0.05 change in the price realized from the September 30, 2023,March 31, 2024, recorded provisional price would have an approximate $8$22 million effect on 2024 revenues ($7 million to our 20232024 net income attributable to common stock.stock). The LME copper price settled at $3.65$4.52 per pound on October 31, 2023.April 30, 2024.
Atlantic Copper Revenues. Atlantic Copper revenues totaled $700$673 million in third-quarter 2023 and $2.2 billion for the first nine months of 2023,first-quarter 2024, compared with $609$756 million in third-quarter 2022 and $1.8 billion for the first nine months of 2022. Higherfirst-quarter 2023. Lower revenues in the 2023 periods,first-quarter 2024, compared with the 2022 periods,first-quarter 2023, primarily reflects higherreflect lower copper prices and sales volumes, mostly because of reduced operations during 2022 associated with a scheduled major maintenance turnaround.volumes.
Purchased Copper. We purchase copper cathode primarily for processing by our Rod & Refining operations. Lower revenues associated with purchased copper in first-quarter 2024, compared to first-quarter 2023, primarily reflects
lower volumes. The volumes of copper purchases vary depending on cathode production from our operations and totaled 1842 million pounds in third-quarter 2023,first-quarter 2024 and 48 million pounds in third-quarter 2022, 85 million pounds for the first nine months of 2023 and 86 million pounds for the first nine months of 2022.first-quarter 2023.
Treatment Charges. Revenues from our copper concentrate sales are recorded net of treatment charges (i.e., fees paid to smelters that are generally negotiated annually), which will vary with the sales volumes and the price of copper. The 2023 periods,increase in treatment charges in first-quarter 2024, compared to the 2022 periods, reflect (i) lower treatment charges at PT-FI associated with the change in its commercial arrangement with PT Smelting from afirst-quarter 2023, primarily reflects higher copper concentrate sales agreement to a tolling arrangement (that is, beginning in 2023, costs incurred under the tolling arrangement are recorded as production costs in the consolidated statements of income) and (ii) higher rates for Cerro Verde and PT-FI’s copper concentrates.volumes.
Royalties and Export Duties. Royalties and export duties are primarily associated with PT-FI sales andsales. Royalties will vary with the volume of metal sold and the prices of copper and gold. In late 2022, the export duty rate on PT-FI’s sales declined from 5% to 2.5% as a result of smelter development progress, and effective March 29, 2023, export duties were eliminated upon verification by the Indonesia government that construction progress on the Manyar smelter exceeded 50%. Subsequently, in July 2023, the Indonesia government issued a revised regulation on duties for various exported
products, including copper concentrates, and under the revised regulation, PT-FI is currently being assessed export duties for copper concentrates at a rate of 7.5% (refer, compared to Note 8 for further discussion).
an export duty rate of 2.5% in first-quarter 2023. PT-FI incurred export duties totaling $147$156 million in third-quarter 2023 (associated with the revised regulation by the Indonesia government), $80first-quarter 2024 and $17 million in third-quarter 2022, $165 millionfirst-quarter 2023. Refer to Note 13 of our 2023 Form 10-K for the first nine monthsfurther discussion of 2023 and $245 million for the first nine months of 2022.export duties.
Production and Delivery Costs
Consolidated production and delivery costs totaled $3.5$3.8 billion in third-quarter 2023, $3.4first-quarter 2024 and $3.2 billion in third-quarter 2022, $10.3 billion for the first nine months of 2023 and $9.5 billion for the first nine months of 2022.first-quarter 2023. Higher costs in the 2023 periods,first-quarter 2024, compared to the 2022 periods,first-quarter 2023, primarily reflected increased consolidated operating rates, higher commodity-related costs across our operationsparticularly at PT-FI. Additionally, first-quarter 2024 included charges totaling $109 million associated with assumed oil and increased costsgas abandonment obligations resulting from bankruptcies of labor (including increased contract labor), particularly in North America.other companies (refer to Note 8 for further discussion).
Site Production and Delivery Costs Per Pound. Site production and delivery costs for our copper mining operations primarily include labor, energy and other commodity-based inputs, such as sulfuric acid, explosives, steel, reagents, liners and tires. ConsolidatedLower consolidated site production and delivery costs (before net noncash and other costs) for our copper mines averaged $2.27of $2.32 per pound of copper in third-quarter 2023, $2.35first-quarter 2024, compared to $2.57 per pound of copper in third-quarter 2022, $2.40 per pound of copper for the first nine months offirst-quarter 2023, and $2.16 per pound of copper for the first nine months of 2022.primarily reflects higher metal volumes in Indonesia. Refer to “Operations – Unit Net Cash Costs” and “Operations – Unit Net Cash (Credits) Costs” for further discussion of unit net cash costs (credits) associated with our operating divisions and to “Product Revenues and Production Costs” for reconciliations of per pound costs by operating division to production and delivery costs applicable to sales reported in our consolidated financial statements.
Depreciation, Depletion and Amortization
Depreciation will vary under the unit-of-production (UOP) method as a result of changes in sales volumes and the related UOP rates at our mining operations. ConsolidatedIncreased consolidated depreciation, depletion and amortization (DD&A) totaled $533of $595 million in third-quarter 2023, $508first-quarter 2024, compared to $399 million in third-quarter 2022, and $1.5 billion for the first nine months offirst-quarter 2023, and 2022.primarily reflects higher sales volumes at PT-FI.
Environmental Obligations and Shutdown Costs
Environmental obligation costs reflect net revisions to our long-term environmental obligations, which vary from period to period because of changes to environmental laws and regulations, the settlement of environmental matters and/or circumstances affecting our operations that could result in significant changes in our estimates. Shutdown costs include care-and-maintenance costs and any litigation, remediation or related expenditures associated with closed facilities or operations. Higher netNet charges for environmental obligations and shutdown costs in the 2023 periods, compared to the 2022 periods, primarily reflect net revisions to long-term historical environmental obligations totaling $83totaled $56 million in third-quarter 2023both first-quarter 2024 and $199 million for the first nine months of 2023, compared to net credits of $5 million in third-quarter 2022 and net charges of $8 million for the first nine months of 2022.2023. Refer to Note 8 for further discussion of the 2023 revisions.discussion.
Interest Expense, Net
Consolidated interest costs (before capitalization) totaled $165$175 million in third-quarter 2023, $182first-quarter 2024 and $207 million in third-quarter 2022, $606first-quarter 2023, which included $25 million for the first nine months of 2023 and $524 million for the first nine months of 2022. Consolidated interest costs (before capitalization) for the third quarter and first nine months of 2023, compared to the 2022 periods, reflects the impact of lower average outstanding debt as a result of the repayment of our 3.875% Senior Notes and open-market purchases of our senior notes (refer to Note 5). Higher consolidated interest costs (before capitalization) for the first nine months of 2023, also reflects interest charges totaling $74 million forassociated with Cerro Verde’s contested tax rulings issued by the PeruvianPeru Supreme Court and higher consolidated interest costs associated with PT-FI’s $3.0 billion of senior notes that were issued in April 2022.first-quarter 2023.
Capitalized interest varies with the level of qualifying assets associated with our development projects and average interest rates on our borrowings. CapitalizedHigher capitalized interest totaled $69of $86 million in third-quarter 2023, $42first-quarter 2024, compared to $56 million in third-quarter 2022, $188 million for the first nine months offirst-quarter 2023 and $101 million for the first nine months of 2022. The increase in capitalized interest costs in the 2023 periods, compared to the 2022 periods, resulted from increased construction and development projects in process, primarily for the Indonesia smelter projects. Refer to “Capital Resources and Liquidity – Investing Activities” for discussion of capital expenditures associated with our major development projects.
Other Income, Net
Other income, net, totaled $71$129 million in third-quarter 2023, $25first-quarter 2024 and $88 million in third-quarter 2022, $183 million for the first nine months of 2023 and $67 million for the first nine months of 2022.first-quarter 2023. The increase in other income, net, primarily reflects higher interest income. The first nine monthsa credit of 2023 also include a $69$26 million chargein first-quarter 2024 associated with Cerro Verde’s contestedthe reduction in the accrual to indemnify PT Mineral Industri Indonesia (MIND ID) from potential losses arising from historical tax rulings issued by the Peruvian Supreme Court.disputes (refer to Note 4 for additional discussion) and higher foreign currency exchange gains.
Income Taxes
Following is a summary of the approximate amounts used in the calculation of our consolidated income tax provision (in millions, except percentages):
| | Nine Months Ended September 30, | |
| 2023 | | 2022 | |
| Income (Loss)a | | Effective
Tax Rate | | Income Tax (Provision) Benefit | | Income (Loss)a | | Effective
Tax Rate | | Income Tax (Provision) Benefit | |
| Three Months Ended March 31, | |
| 2024 | |
| 2024 | |
| 2024 | |
| Income (Loss)a | |
| Income (Loss)a | |
| Income (Loss)a | |
U.S.b | |
U.S.b | |
U.S.b | U.S.b | $ | 180 | | | — | % | c | $ | 3 | | | $ | 854 | | | 1 | % | c | $ | (5) | | |
| South America | South America | 961 | | d | 46 | % | | (438) | | | 802 | | | 36 | % | | (287) | | e |
| South America | |
| South America | |
| Indonesia | Indonesia | 3,130 | | | 37 | % | | (1,159) | | | 3,480 | | | 39 | % | | (1,363) | | |
| Indonesia | |
| Indonesia | |
| PT-FI historical tax matters | |
| PT-FI historical tax matters | |
| PT-FI historical tax matters | |
| | Eliminations and other | Eliminations and other | 7 | | | N/A | | — | | | 43 | | | N/A | | (25) | | |
| | Eliminations and other | |
| | Eliminations and other | |
Rate adjustmentf | |
Rate adjustmentf | |
Rate adjustmentf | Rate adjustmentf | — | | | N/A | | 48 | | | — | | | N/A | | (30) | | |
| | Consolidated FCX | Consolidated FCX | $ | 4,278 | | | 36 | % | | $ | (1,546) | | | $ | 5,179 | | | 33 | % | | $ | (1,710) | | |
| | | Consolidated FCX | |
| | Consolidated FCX | |
|
a.Represents income (loss) before income taxes, equity in affiliated companies' net earnings, (losses), and noncontrolling interests.
b.In addition to our North America mining operations,Copper Mines, which had operating income of $153 million in first-quarter 2024 and $364 million in first-quarter 2023 (refer to Note 9), the U.S. jurisdiction reflects legacy non-operating sites and corporate-level expenses, which include interest expense associated with FCX’s senior notes and general and administrative expenses,expenses. Additionally, first-quarter 2024 also included charges of $109 million associated with assumed oil and environmentalgas abandonment obligations, and shutdown costs.both first-quarter 2024 and 2023 included charges of $56 million for revisions to environmental obligation estimates.
c.Includes a valuation allowance release on prior year unbenefited net operating losses. See below for discussion of the provisions of the U.S. Inflation Reduction Act of 2022.
d.Includes net charges associated with Cerro Verde’s contested tax rulings issued by the Peruvian Supreme Court totaling $142 million ($73 million net of noncontrolling interests).Refer to Note 4 for further discussion.
e.Includes a tax creditbenefit of $31$13 million ($16 million net of noncontrolling interest) primarily associated with completion of Cerro Verde'sa favorable Supreme Court ruling in Spain, which reversed a 2016 tax audit.law limiting Atlantic Copper’s use of net operating losses.
f.In accordance with applicable accounting rules, we adjust our interim provision for income taxes equal to our consolidated tax rate.
Refer to Note 4 for discussionAssuming achievement of the U.S. Inflation Reduction Act of 2022 (the Act), which became applicable to us on January 1, 2023.
Assumingcurrent sales volume and cost estimates, and average prices of $3.60$4.25 per pound for copper, $1,900$2,300 per ounce for gold and $20.00 per pound for molybdenum in fourth-quarter 2023 and achievementfor the remainder of current sales volume and cost estimates,2024, we estimate our consolidated effective tax rate for the year 20232024 would approximate 38%35% (which would result in a 44%reflects an estimated effective tax rate in fourth-quarter 2023)of 37% for the remainder of 2024). Changes in projected sales volumes and average prices during 20232024 would incur tax impacts at estimated effective rates of 40%39% for Peru, 36% for Indonesia and 0% for the U.S., which excludes any impact from the Act. Our projected estimated effective tax rate of 0% for the U.S. for the year 20232024 may be adjusted as additional guidance is released by the U.S. Department of the Treasury on key provisions of the Act.U.S. Inflation Reduction Act of 2022 (refer to Note 4 for further discussion).
Noncontrolling Interests
Net income attributable to noncontrolling interests, which is primarily associated with our noncontrolling shareholders at PT-FI, Cerro Verde and El Abra, totaled $510$689 million in third-quarter 2023, $156first-quarter 2024 and $386 million in third-quarter 2022, $1.3 billion for the first nine months of 2023 and $731 million for the first nine months of 2022. Our economic interest in PT-FI is 48.76% and prior to January 1, 2023, it approximated 81%. As discussed in Note 1, first-quarter 2023 net income included a $35 million net benefit associated with PT-FI sales volumes that were attributed to us at our previous approximate 81% economic ownership interest.
Refer(refer to Note 9 for net income attributable to noncontrolling interests for each of our business segments.segments).
AssumingBeginning January 1, 2023, our economic and ownership interest in PT-FI is 48.76%, except for net income associated with the settlement of historical tax matters in first-quarter 2024 and approximately 190 thousand ounces of gold sales in first-quarter 2023, which were attributed based on the economics prior to January 1, 2023 (i.e., approximately 81% to FCX and 19% to MIND ID). Refer to Note 1 for further discussion.
Based on achievement of current sales volume and cost estimates, extension of PT-FI’s export licenses for copper concentrates and anode slimes beyond May 2024, and assuming average prices of $3.60$4.25 per pound of copper, $1,900$2,300 per ounce of gold and $20.00 per pound of molybdenum achievementfor the remainder of current sales volume and cost estimates, and taking into account the change in our economic interest in PT-FI,2024, we estimate that net income attributable to noncontrolling interests is estimated towill approximate
$1.75 $2.7 billion for the year 2023.2024. The impact of price changes on net income attributable to noncontrolling interests for the year 2024 would approximate $0.2 billion for each $0.25 per pound change in the average price of copper for the remainder of 2024. The actual amount will depend on many factors, including relative performance of each business segment, commodity prices, costs and other factors.
OPERATIONS
Responsible Production
Updated Climate Report.2023 Annual Report on Sustainability. In September 2023,April 2024, we published our annual climate report, available2023 Annual Report on Sustainability marking our 23rd year of reporting on our website at sustainability progress. We are committed to building upon our achievements in sustainability and our position as a leading responsible copper producer.
The Copper Mark.fcx.com/sustainability. The climate report details We demonstrate our ongoing progressresponsible production performance through the Copper Mark, a comprehensive assurance framework developed specifically for the copper industry, and recently extended to advance our climate strategy focused on reducing our greenhouse gas (GHG) emissions, enhancing our resilienceother metals including molybdenum. To achieve the Copper Mark, each site is required to climate riskscomplete an independent external assurance process to assess conformance with various environmental, social and contributing responsibly produced copper to the global economy.governance criteria. Awarded sites must be revalidated every three years. We have four 2030 GHG emissions reduction targets that collectively cover nearly 100%achieved, and are committed to maintaining, the Copper Mark and/or Molybdenum Mark, as applicable, at all of our Scope 1 and 2 GHG emissions.sites globally.
Leaching Innovation Initiatives
We are advancingcontinuing to advance a series of initiatives across our North America and South America operations to incorporate new applications, technologies and data analytics to our leaching processes. We believe these leach innovation initiatives provide opportunities to produce incremental copper fromIn late 2023, we achieved our large existing leach stockpiles. Initial results support the potential for incremental low-cost additions to our production and reserve profile and we are targeting aninitial annual run rate target of approximately 200 million pounds of copper per year through these initiatives by the end of 2023. In third-quarter 2023, incrementalcopper. Incremental copper production from these initiatives totaled 4651 million pounds (approximately 90% of the targeted annual rate).in first-quarter 2024, compared with 22 million pounds in first-quarter 2023. We are pursuing opportunities to apply recent operational enhancements on a larger scale and are testing new technology applications that we believe have the potential for significant increases in recoverable metal beyond the initial target.current run rate.
Feasibility and Optimization Studies
We are engaged in various studies associated with potential future expansion projects primarily at our mining operations. The costs for these studies are charged to production and delivery costs as incurred and totaled $42
$34 million in third-quarter 2023, $34first-quarter 2024, compared with $50 million in third-quarter 2022, $137 million for the first nine months of 2023 and $84 million for the first nine months of 2022.first-quarter 2023. We estimate the costs of these studies will approximate $200 million for the year 2023,2024, subject to market conditions and other factors.
North America Copper Mines
We operatemanage seven open-pit copper minesoperations in North America – Morenci, Bagdad, Safford (including Lone Star), Sierrita and Miami in Arizona, and Chino and Tyrone in New Mexico. All of the North America mining operations are wholly owned, except for Morenci. We record our 72% undivided joint venture interest in Morenci using the proportionate consolidation method.
The North America copper minesoperations include open-pit mining, sulfide-ore concentrating, leaching and solution extraction/electrowinning (SX/EW) operations.facilities. A majority of the copper produced at our North America copper minesoperations is cast into copper rod by our Rod & Refining segment. The remainder of our North America copper production is sold as copper cathode or copper concentrate, a portion of which is shipped to Atlantic Copper (our wholly owned smelter). Molybdenum concentrate, gold and silver are also produced by certain of our North America copper minesoperations.
Operating and Development Activities. We have substantial reserves and future opportunities in the U.S., primarily associated with existing mining operations.
We are planning anhave a potential expansion project to more than double the concentrator capacity of the Bagdad operation in northwest ArizonaArizona. Bagdad’s reserve life currently exceeds 80 years and expectsupports an expanded operation. In late 2023, we completed technical and economic studies, which indicated the opportunity to complete a feasibility studyconstruct new concentrating facilities to increase copper production by 200 to 250 million pounds per year, which is more than double Bagdad’s current annual production rate. Estimated incremental project capital costs approximate $3.5 billion (excluding infrastructure that would be required in fourth-quarter 2023.the long-range plans). Expanded operations would provide improved efficiency and reduce unit net cash costs through economies of scale. Project economics indicate that the expansion would require an incentive copper price in the range of $3.50 to $4.00 per pound and would require approximately three to four years to complete. The decision to proceed and timing of the potential expansion will take into account overall copper market conditions, availability of labor and other factors, including progress on conversion of the existing haul truck fleet to autonomous and expanding housing alternatives to support long-range plans. In parallel, we are advancing activities for expanded tailings infrastructure projects and are procuring an autonomous haul truck fleetrequired under long-range plans in order to support Bagdad's long-range plans.advance the potential construction timeline.
AtWe are completing projects at our Safford/Lone Star production from oxide ores is approachingoperation to increase volumes to achieve 300 million pounds of copper per year from oxide ores, which reflects expansion of the initial design capacity of 200 million pounds of copper per year. We haveAdditionally, positive drilling conducted significant exploration drilling in the area in recent years. The positive drilling resultsyears indicate potentiala large, mineralized district with opportunities to expand production to include sulfide ores in the future.significantly. We are advancingcompleting metallurgical testing and mine development planning and are commencing pre-feasibility studies for a potential significant long-term investment for developmentexpansion. Pre-feasibility studies are expected to be completed in late 2025. The decision to proceed and timing of identified large sulfide resources.the potential expansion will take into account results of technical and economic studies, overall copper market conditions and other factors.
A tight labor market and increased competition from other employers in North America continue to represent strategic challenges that have impacted and are continuing to impact production and our ability to further expand
current mining rates. The timing of all future developments will be dependent on market conditions, labor and supply chain considerations and other economic factors.
Operating Data. Following is summary consolidated operating data for the North America copper mines:
| | Three Months Ended March 31, | |
| Three Months Ended March 31, | |
| Three Months Ended March 31, | |
| | | |
| | | Three Months Ended September 30, | | Nine Months Ended September 30, | | |
| | | | 2023 | | 2022 | | 2023 | | 2022 | | |
| Operating Data, Net of Joint Venture Interests | Operating Data, Net of Joint Venture Interests | | | | | | | | | |
| Operating Data, Net of Joint Venture Interests | |
| Operating Data, Net of Joint Venture Interests | |
Copper (millions of recoverable pounds) | |
Copper (millions of recoverable pounds) | |
Copper (millions of recoverable pounds) | Copper (millions of recoverable pounds) | | | | | |
| Production | Production | 344 | | | 373 | | | 1,030 | | | 1,109 | | | |
| Production | |
| Production | |
| Sales, excluding purchases | Sales, excluding purchases | 372 | | | 361 | | | 1,043 | | | 1,131 | | | |
| Sales, excluding purchases | |
| Sales, excluding purchases | |
| Average realized price per pound | |
| Average realized price per pound | |
| Average realized price per pound | Average realized price per pound | $ | 3.86 | | | $ | 3.57 | | | $ | 3.97 | | | $ | 4.17 | |
| |
| Molybdenum (millions of recoverable pounds) | Molybdenum (millions of recoverable pounds) | | | | | |
| Molybdenum (millions of recoverable pounds) | |
| Molybdenum (millions of recoverable pounds) | |
Productiona | |
Productiona | |
Productiona | Productiona | 7 | | | 7 | | | 23 | | | 22 | | | |
| | 100% Operating Data | 100% Operating Data | | | | | |
| | 100% Operating Data | |
| | 100% Operating Data | |
| Leach operations | |
| Leach operations | |
| Leach operations | Leach operations | | | | | |
| Leach ore placed in stockpiles (metric tons per day) | Leach ore placed in stockpiles (metric tons per day) | 688,600 | | | 622,200 | | | 675,600 | | | 684,200 | | | |
| Leach ore placed in stockpiles (metric tons per day) | |
| Leach ore placed in stockpiles (metric tons per day) | |
| Average copper ore grade (%) | Average copper ore grade (%) | 0.22 | | | 0.30 | | | 0.24 | | | 0.29 | | | |
| Average copper ore grade (%) | |
| Average copper ore grade (%) | |
| Copper production (millions of recoverable pounds) | |
| Copper production (millions of recoverable pounds) | |
| Copper production (millions of recoverable pounds) | Copper production (millions of recoverable pounds) | 245 | | | 260 | | | 718 | | | 759 | | | |
| | Mill operations | Mill operations | | | | | |
| | Mill operations | |
| | Mill operations | |
| Ore milled (metric tons per day) | |
| Ore milled (metric tons per day) | |
| Ore milled (metric tons per day) | Ore milled (metric tons per day) | 315,800 | | | 294,600 | | | 309,700 | | | 297,600 | | | |
| Average ore grade (%): | Average ore grade (%): | | |
| Average ore grade (%): | |
| Average ore grade (%): | |
| Copper | |
| Copper | |
| Copper | Copper | 0.30 | | | 0.36 | | | 0.33 | | | 0.37 | | | |
| Molybdenum | Molybdenum | 0.02 | | | 0.02 | | | 0.02 | | | 0.02 | | | |
| Molybdenum | |
| Molybdenum | |
| Copper recovery rate (%) | |
| Copper recovery rate (%) | |
| Copper recovery rate (%) | Copper recovery rate (%) | 81.7 | | | 82.3 | | | 82.0 | | | 82.2 | | | |
| Copper production (millions of recoverable pounds) | Copper production (millions of recoverable pounds) | 155 | | | 174 | | | 481 | | | 538 | | | |
| Copper production (millions of recoverable pounds) | |
| Copper production (millions of recoverable pounds) | |
|
a.Refer to “Consolidated Results” for our consolidated molybdenum sales, volumes, which include sales of molybdenum produced at the North America copper mines.
Our consolidated copper sales volumes from North America totaled 372of 331 million pounds in third-quarterfirst-quarter 2024 approximated first-quarter 2023 361copper sales volumes of 332 million pounds in third-quarter 2022, 1.0 billion pounds for the first nine months of 2023 and 1.1 billion pounds for the nine months of 2022. Copper sales volumes in the 2023 periods, compared with the 2022 periods, primarily reflect lower ore grades. The impact ofreflecting lower ore grades, in third-quarter 2023, compared with third-quarter 2022, waspartly offset by the timing of shipments. improved leach recovery performance. We continue to drive initiatives to enhance productivity and improve equipment reliability to offset declines in ore grades.
North America copper sales are estimated to approximate 1.41.3 billion pounds for the year 2023.2024. Refer to “Outlook” for projected molybdenum sales volumes.
Unit Net Cash Costs. We believe unit net cash costs per pound of copper is a measure that provides investors with information about the cash-generating capacity of our mining operations expressed on a basis relating to the primary metal product for our respective operations. We use this measure for the same purpose and for monitoring operating performance by our mining operations. This information differs from measures of performance determined in accordance with U.S. generally accepted accounting principles (GAAP) and should not be considered in isolation or as a substitute for measures of performance determined in accordance with U.S. GAAP. This measure is presented by other metals mining companies, although our measure may not be comparable to similarly titled measures reported by other companies.
Gross Profit per Pound of Copper and Molybdenum
The following table summarizes unit net cash costs and gross profit per pound at our North America copper mines. Refer to “Product Revenues and Production Costs” for an explanation of the “by-product” and “co-product” methods and a reconciliation of unit net cash costs per pound to production and delivery costs applicable to sales reported in our consolidated financial statements.
| | Three Months Ended March 31, | |
| | | Three Months Ended September 30, | |
| | | 2023 | | 2022 | |
| | | By- Product Method | | Co-Product Method | | By- Product Method | | Co-Product Method | |
| | Copper | | Molyb- denuma | | Copper | | Molyb-
denuma | |
| | |
| | Copper | |
| | Copper | |
| | Copper | |
| Revenues, excluding adjustments | |
| Revenues, excluding adjustments | |
| Revenues, excluding adjustments | Revenues, excluding adjustments | $ | 3.86 | | | $ | 3.86 | | | $ | 22.01 | | | $ | 3.57 | | | $ | 3.57 | | | $ | 16.75 | | |
| Site production and delivery, before net noncash and other costs shown below | Site production and delivery, before net noncash and other costs shown below | 3.01 | | | 2.71 | | | 17.35 | | | 2.76 | | | 2.51 | | | 15.60 | | |
| Site production and delivery, before net noncash and other costs shown below | |
| Site production and delivery, before net noncash and other costs shown below | |
| By-product credits | |
| By-product credits | |
| By-product credits | By-product credits | (0.41) | | | — | | | — | | | (0.30) | | | — | | | — | | |
| Treatment charges | Treatment charges | 0.10 | | | 0.10 | | | — | | | 0.10 | | | 0.09 | | | — | | |
| Treatment charges | |
| Treatment charges | |
| Unit net cash costs | |
| Unit net cash costs | |
| Unit net cash costs | Unit net cash costs | 2.70 | | | 2.81 | | | 17.35 | | | 2.56 | | | 2.60 | | | 15.60 | | |
| DD&A | DD&A | 0.30 | | | 0.26 | | | 1.33 | | | 0.28 | | | 0.25 | | | 0.95 | | |
| Metals inventory adjustments | 0.01 | | | 0.01 | | | — | | | 0.01 | | | 0.01 | | | — | | |
| DD&A | |
| DD&A | |
| | Noncash and other costs, net | |
| | Noncash and other costs, net | |
| | Noncash and other costs, net | Noncash and other costs, net | 0.13 | | b | 0.12 | | | 0.47 | | | 0.10 | | b | 0.09 | | | 0.60 | | |
| Total unit costs | Total unit costs | 3.14 | | | 3.20 | | | 19.15 | | | 2.95 | | | 2.95 | | | 17.15 | | |
| Total unit costs | |
| Total unit costs | |
Revenue adjustments, primarily for pricing on prior period open sales | Revenue adjustments, primarily for pricing on prior period open sales | — | | | — | | | — | | | (0.06) | | | (0.06) | | | — | | |
Revenue adjustments, primarily for pricing on prior period open sales | |
Revenue adjustments, primarily for pricing on prior period open sales | |
| Gross profit per pound | |
| Gross profit per pound | |
| Gross profit per pound | Gross profit per pound | $ | 0.72 | | | $ | 0.66 | | | $ | 2.86 | | | $ | 0.56 | | | $ | 0.56 | | | $ | (0.40) | | |
| | Copper sales (millions of recoverable pounds) | Copper sales (millions of recoverable pounds) | 372 | | | 372 | | | 361 | | | 361 | | | | |
| | Copper sales (millions of recoverable pounds) | |
| | Copper sales (millions of recoverable pounds) | |
Molybdenum sales (millions of recoverable pounds)a | Molybdenum sales (millions of recoverable pounds)a | | 7 | | | | | | | 7 | | |
Molybdenum sales (millions of recoverable pounds)a | |
Molybdenum sales (millions of recoverable pounds)a | |
| | | | | | | | | | | | | | | | | | | | | | | | | | | | | | | | | | | | | | |
| Nine Months Ended September 30, | |
| | 2023 | | 2022 | |
| | By- Product Method | | Co-Product Method | | By- Product Method | | Co-Product Method | |
| | Copper | | Molyb- denuma | | | Copper | | Molyb-
denuma | |
| Revenues, excluding adjustments | $ | 3.97 | | | $ | 3.97 | | | $ | 24.41 | | | $ | 4.17 | | | $ | 4.17 | | | $ | 17.87 | | |
| | | | | | | | | | | | |
Site production and delivery, before net noncash and other costs shown below | 2.96 | | | 2.60 | | | 17.66 | | | 2.54 | | | 2.33 | | | 12.87 | | |
| By-product credits | (0.52) | | | — | | | — | | | (0.33) | | | — | | | — | | |
| Treatment charges | 0.12 | | | 0.12 | | | — | | | 0.10 | | | 0.10 | | | — | | |
| Unit net cash costs | 2.56 | | | 2.72 | | | 17.66 | | | 2.31 | | | 2.43 | | | 12.87 | | |
| DD&A | 0.30 | | | 0.26 | | | 1.27 | | | 0.27 | | | 0.25 | | | 0.88 | | |
| Metals inventory adjustments | 0.01 | | | 0.01 | | | — | | | 0.01 | | | 0.01 | | | — | | |
| Noncash and other costs, net | 0.16 | | b | 0.14 | | | 0.87 | | | 0.09 | | b | 0.08 | | | 0.40 | | |
| Total unit costs | 3.03 | | | 3.13 | | | 19.80 | | | 2.68 | | | 2.77 | | | 14.15 | | |
Revenue adjustments, primarily for pricing on prior period open sales | 0.01 | | | 0.01 | | | — | | | (0.01) | | | (0.01) | | | — | | |
| Gross profit per pound | $ | 0.95 | | | $ | 0.85 | | | $ | 4.61 | | | $ | 1.48 | | | $ | 1.39 | | | $ | 3.72 | | |
| | | | | | | | | | | | |
| Copper sales (millions of recoverable pounds) | 1,048 | | | 1,048 | | | | | 1,131 | | | 1,131 | | | | |
Molybdenum sales (millions of recoverable pounds)a | | | | | 23 | | | | | | | 22 | | |
| | | | | | | | | | | | |
a.Reflects sales of molybdenum produced by certain of the North America copper mines to our molybdenum sales company at market-based pricing.
b.Includes charges totaling $0.05 per pound of copper in first-quarter 2024 and $0.08 per pound of copper in third-quarterfirst-quarter 2023 $0.06for feasibility and optimization studies. First-quarter 2023 also includes charges totaling $0.05 per pound of copper in third-quarter 2022, $0.08 per pound of copper for the first nine months of 2023 and $0.04 per pound of copper for the first nine months of 2022 for feasibility and optimization studies.related to asset impairments.
Our North America copper mines have varying cost structures because of differences in ore grades and characteristics, processing costs, by-product credits and other factors. Average unit net cash costs (net of by-product credits) for the North America copper mines of $2.70$2.98 per pound of copper in third-quarter 2023 and $2.56 per pound for the first nine months of 2023first-quarter 2024 were higher than averagefirst-quarter 2023 unit net cash costs of $2.56$2.45 per pound, in third-quarter 2022 and $2.31 per pound for the first nine months for 2022, primarily reflecting increasedhigher mining costs of labor
(including contract labor), maintenance and supplies, partly offset by higherlower molybdenum by-product credits and lower energy costs.credits.
Because certain assets are depreciated on a straight-line basis, North America’s average unit depreciation rate may vary with asset additions and the level of copper production and sales.
Revenue adjustments primarily result from changes in prices on provisionally priced copper sales recognized in prior periods. Refer to “Consolidated Results – Revenues” for further discussion of adjustments to prior period provisionally priced copper sales.
Assuming an average price of $20.00 per pound of molybdenum in fourth-quarter 2023 and achievement of current sales volume and cost estimates, averageAverage unit net cash costs (net of by-product credits) for our North America copper mines are expected to approximate $2.62$3.00 per pound of copper for the year 2023.2024, based on achievement of current sales volume and cost estimates, and assuming an average price of $20.00 per pound of molybdenum for the remainder of 2024. North America'sAmerica’s average unit net cash costs for the year 20232024 would change by approximately $0.01$0.03 per pound for each $2 per pound change in the average price of molybdenum in fourth-quarter 2023.for the remainder of 2024.
South America Mining
We operatemanage two copper minesoperations in South America – Cerro Verde in Peru (in which we own a 53.56% interest) and El Abra in Chile (in which we own a 51% interest), which are consolidated in our financial statements.
South America miningoperations includes open-pit mining, sulfide-ore concentrating, leaching and SX/EW operations.facilities. Production from our South America minesoperations is sold as copper concentrate or cathode under long-term contracts. Our South America minesoperations also sell a portion of their copper concentrate production to Atlantic Copper. In addition to copper, the Cerro Verde mine produces molybdenum concentrate and silver.
Operating and Development ActivitiesLabor Matters.. During third-quarter 2023,In April 2024, Cerro Verde processed an average of 431,300 metric tons of ore per day through its concentrators,reached a new quarterly record,four-year collective labor agreement (CLA) with one of its two unions and entered into aexpects to begin negotiations in the near term with its other union. Cerro Verde expects to incur nonrecurring charges of approximately $80 million associated with the new power purchase agreement that is expected to transitionCLA, and may incur additional nonrecurring charges in connection with negotiations with its electric power to fully renewable energy sources in 2026.other union.
Development Activities.At the El Abra operations in Chile, we have identifieddrilled out and modeled a large sulfide resource that would support a potential major mill project similar to the large-scale concentrator at Cerro Verde. TechnicalWe are engaged in planning for a potential submission of an environmental impact statement by year-end 2025, subject to ongoing stakeholder engagement and economic evaluations. In parallel, we are updating our technical studies continueand economic models to be evaluated to determine the optimal scope and timing for the sulfide project. Capitalincorporate recent capital cost requirements are being updated to reflect current market conditions. We are advancing plans to invest in water infrastructure to provide options to extend existing operations, while continuing to monitor Chile's regulatory and fiscal matters, as well as trends in capital costs for similar projects.trends.
Operating Data. Following is summary consolidated operating data for South America mining:operations:
| | Three Months Ended March 31, | |
| Three Months Ended March 31, | |
| Three Months Ended March 31, | |
| | | |
| | | Three Months Ended September 30, | | Nine Months Ended September 30, | |
| | | | 2023 | | 2022 | | 2023 | | 2022 | |
Copper (millions of recoverable pounds) | Copper (millions of recoverable pounds) | | | | | | | | |
Copper (millions of recoverable pounds) | |
Copper (millions of recoverable pounds) | |
| Production | |
| Production | |
| Production | Production | 305 | | | 302 | | | 916 | | | 862 | | |
| Sales | Sales | 307 | | | 293 | | | 913 | | | 845 | | |
| Sales | |
| Sales | |
| Average realized price per pound | |
| Average realized price per pound | |
| Average realized price per pound | Average realized price per pound | $ | 3.77 | | | $ | 3.47 | | | $ | 3.82 | | | $ | 3.73 | | |
| | Molybdenum (millions of recoverable pounds) | Molybdenum (millions of recoverable pounds) | | | | |
| Molybdenum (millions of recoverable pounds) | |
| Molybdenum (millions of recoverable pounds) | |
Productiona | |
Productiona | |
Productiona | Productiona | 6 | | | 4 | | | 17 | | | 18 | | |
| | Leach operations | Leach operations | | | | |
| | Leach operations | |
| | Leach operations | |
| Leach ore placed in stockpiles (metric tons per day) | |
| Leach ore placed in stockpiles (metric tons per day) | |
| Leach ore placed in stockpiles (metric tons per day) | Leach ore placed in stockpiles (metric tons per day) | 164,300 | | | 175,200 | | | 190,500 | | | 157,700 | | |
| Average copper ore grade (%) | Average copper ore grade (%) | 0.38 | | | 0.34 | | | 0.34 | | | 0.35 | | |
| Average copper ore grade (%) | |
| Average copper ore grade (%) | |
| Copper production (millions of recoverable pounds) | |
| Copper production (millions of recoverable pounds) | |
| Copper production (millions of recoverable pounds) | Copper production (millions of recoverable pounds) | 77 | | | 85 | | | 237 | | | 217 | | |
| | Mill operations | Mill operations | | | |
| | Mill operations | |
| | Mill operations | |
| Ore milled (metric tons per day) | |
| Ore milled (metric tons per day) | |
| Ore milled (metric tons per day) | Ore milled (metric tons per day) | 431,300 | | | 403,900 | | | 420,700 | | | 408,500 | | |
| Average ore grade (%): | Average ore grade (%): | |
| Average ore grade (%): | |
| Average ore grade (%): | |
| Copper | Copper | 0.34 | | | 0.32 | | | 0.34 | | | 0.32 | | |
| Copper | |
| Copper | |
| Molybdenum | |
| Molybdenum | |
| Molybdenum | Molybdenum | 0.01 | | | 0.01 | | | 0.01 | | | 0.01 | | |
| | Copper recovery rate (%) | Copper recovery rate (%) | 79.8 | | | 85.4 | | | 82.0 | | | 85.5 | | |
| | Copper recovery rate (%) | |
| | Copper recovery rate (%) | |
| Copper production (millions of recoverable pounds) | Copper production (millions of recoverable pounds) | 228 | | | 217 | | | 679 | | | 645 | | |
| Copper production (millions of recoverable pounds) | |
| Copper production (millions of recoverable pounds) | |
a.Refer to “Consolidated Results” for our consolidated molybdenum sales volumes, which include sales of molybdenum produced at Cerro Verde.
Our consolidated copper sales volumes from South America totaled 307operations of 284 million pounds in third-quarter 2023, 293first-quarter 2024 were lower than 302 million pounds in third-quarter 2022, 913 million pounds for the first nine monthsfirst-quarter 2023, primarily reflecting lower volumes of 2023leach ore placed in stockpiles and 845 million pounds for the first nine months of 2022. Higher copper sales volumes in the 2023 periods, compared with the 2022 periods, primarily reflect increasedlower milling rates associated with mill maintenance. Molybdenum production in first-quarter 2024 was significantly lower than first-quarter 2023 as a result of mill maintenance and the impact of certain ore grades at Cerro Verde.types on recoveries. Copper sales from South America miningoperations are expected to approximate 1.21.1 billion pounds for the year 2023.2024, which assume no significant impacts to water availability, which is being monitored closely in light of ongoing El Niño weather patterns. Refer to “Outlook” for projected molybdenum sales volumes.
Unit Net Cash Costs. We believe unit net cash costs per pound of copper is a measure that provides investors with information about the cash-generating capacity of our mining operations expressed on a basis relating to the primary metal product for our respective operations. We use this measure for the same purpose and for monitoring operating performance by our mining operations. This information differs from measures of performance determined in accordance with U.S. GAAP and should not be considered in isolation or as a substitute for measures of performance determined in accordance with U.S. GAAP. This measure is presented by other metals mining companies, although our measure may not be comparable to similarly titled measures reported by other companies.
Gross Profit per Pound of Copper
The following table summarizes unit net cash costs and gross profit per pound of copper at our South America mining operations. Refer to “Product Revenues and Production Costs” for an explanation of the “by-product” and “co-product” methods and a reconciliation of unit net cash costs per pound to production and delivery costs applicable to sales reported in our consolidated financial statements.
| | | | | | | | | | | | | | | | | | | | | | | | | | |
| Three Months Ended September 30, | |
| | 2023 | | 2022 | |
| By-Product
Method | | Co-Product
Method | | By-Product
Method | | Co-Product
Method | |
| Revenues, excluding adjustments | $ | 3.77 | | | $ | 3.77 | | | $ | 3.47 | | | $ | 3.47 | | |
| | | | | | | | |
| Site production and delivery, before net noncash and other costs shown below | 2.57 | | | 2.32 | | | 2.60 | | | 2.47 | | |
| By-product credits | (0.42) | | | — | | | (0.16) | | | — | | |
| Treatment charges | 0.19 | | | 0.19 | | | 0.13 | | | 0.14 | | |
| Royalty on metals | 0.01 | | | 0.01 | | | 0.01 | | | — | | |
| Unit net cash costs | 2.35 | | | 2.52 | | | 2.58 | | | 2.61 | | |
| DD&A | 0.36 | | | 0.32 | | | 0.34 | | | 0.32 | | |
| Metals inventory adjustments | — | | | — | | | 0.07 | | | 0.07 | | |
| Noncash and other costs, net | 0.07 | | a | 0.07 | | | 0.09 | | | 0.08 | | |
| Total unit costs | 2.78 | | | 2.91 | | | 3.08 | | | 3.08 | | |
| Revenue adjustments, primarily for pricing on prior period open sales | 0.01 | | | 0.01 | | | (0.25) | | | (0.25) | | |
| Gross profit per pound | $ | 1.00 | | | $ | 0.87 | | | $ | 0.14 | | | $ | 0.14 | | |
| | | | | | | | |
| Copper sales (millions of recoverable pounds) | 307 | | | 307 | | | 293 | | | 293 | | |
| | Three Months Ended March 31, | |
| | | Nine Months Ended September 30, | |
| | | 2023 | | 2022 | |
| By-Product
Method | | Co-Product
Method | | By-Product
Method | | Co-Product
Method | |
| By-Product
Method | |
| By-Product
Method | |
| By-Product
Method | |
| Revenues, excluding adjustments | |
| Revenues, excluding adjustments | |
| Revenues, excluding adjustments | Revenues, excluding adjustments | $ | 3.82 | | | $ | 3.82 | | | $ | 3.73 | | | $ | 3.73 | | |
| | Site production and delivery, before net noncash and other costs shown below | Site production and delivery, before net noncash and other costs shown below | 2.51 | | | 2.26 | | | 2.50 | | | 2.33 | | |
| | Site production and delivery, before net noncash and other costs shown below | |
| | Site production and delivery, before net noncash and other costs shown below | |
| By-product credits | |
| By-product credits | |
| By-product credits | By-product credits | (0.44) | | | — | | | (0.31) | | | — | | |
| Treatment charges | Treatment charges | 0.20 | | | 0.20 | | | 0.15 | | | 0.15 | | |
| Treatment charges | |
| Treatment charges | |
| Royalty on metals | |
| Royalty on metals | |
| Royalty on metals | Royalty on metals | 0.01 | | | 0.01 | | | 0.01 | | | 0.01 | | |
| Unit net cash costs | Unit net cash costs | 2.28 | | | 2.47 | | | 2.35 | | | 2.49 | | |
| Unit net cash costs | |
| Unit net cash costs | |
| DD&A | DD&A | 0.38 | | | 0.34 | | | 0.35 | | | 0.32 | | |
| Metals inventory adjustments | — | | | — | | | 0.04 | | | 0.04 | | |
| DD&A | |
| DD&A | |
| | Noncash and other costs, net | |
| | Noncash and other costs, net | |
| | Noncash and other costs, net | Noncash and other costs, net | 0.08 | | a | 0.07 | | | 0.07 | | | 0.06 | | |
| Total unit costs | Total unit costs | 2.74 | | | 2.88 | | | 2.81 | | | 2.91 | | |
| Total unit costs | |
| Total unit costs | |
| Revenue adjustments, primarily for pricing on prior period open sales | Revenue adjustments, primarily for pricing on prior period open sales | 0.08 | | | 0.08 | | | 0.04 | | | 0.04 | | |
| Revenue adjustments, primarily for pricing on prior period open sales | |
| Revenue adjustments, primarily for pricing on prior period open sales | |
| Gross profit per pound | |
| Gross profit per pound | |
| Gross profit per pound | Gross profit per pound | $ | 1.16 | | | $ | 1.02 | | | $ | 0.96 | | | $ | 0.86 | | |
| | Copper sales (millions of recoverable pounds) | Copper sales (millions of recoverable pounds) | 913 | | | 913 | | | 845 | | | 845 | | |
| | Copper sales (millions of recoverable pounds) | |
| | Copper sales (millions of recoverable pounds) | |
a.Includes charges totaling $0.04 per pound of copper in first-quarter 2024 and $0.03 per pound of copper in first-quarter 2023 for feasibility and optimization studies.
Our South America minesoperations have varying cost structures because of differences in ore grades and characteristics, processing costs, by-product credits and other factors. Average unit net cash costs (net of by-product credits) for South America miningoperations of $2.35$2.60 per pound of copper in third-quarterfirst-quarter 2024 were higher than first-quarter 2023 and $2.28 per pound for the first nine months of 2023 were lower than average unit net cash costs of $2.58$2.20 per pound, in third-quarter 2022 and $2.35 per pound for the first nine months of 2022,primarily reflecting higherlower molybdenum by-product credits and volumes, partly offset by higher treatment charges.lower copper volumes.
Revenues from Cerro Verde’s copper concentrate sales are recorded net of treatment charges, which will vary with Cerro Verde’s sales volumes and the price of copper. Higher treatment charges in the 2023 periods, compared to the 2022 periods, reflected higher smelting and refining rates.
Because certain assets are depreciated on a straight-line basis, South America’s unit depreciation rate may vary with asset additions and the level of copper production and sales.
Revenue adjustments primarily result from changes in prices on provisionally priced copper sales recognized in prior periods. Refer to “Consolidated Results – Revenues” for further discussion of adjustments to prior period provisionally priced copper sales.
Assuming an average price of $20.00 per pound of molybdenum in fourth-quarter 2023 and achievement of current sales volume and cost estimates, averageAverage unit net cash costs (net of by-product credits) for South America miningoperations are expected to approximate $2.34$2.51 per pound of copper for the year 2023.2024, based on achievement of current sales volume and cost estimates, and assuming an average price of $20.00 per pound of molybdenum for the remainder of 2024.
Indonesia Mining
PT-FI operates one of the world’s largest copper and gold mines at the Grasberg minerals district in Central Papua, Indonesia. PT-FI produces copper concentrate that contains significant quantities of gold and silver. We have a 48.76% ownership interest in PT-FI and manage its mining operations. PT-FI's results are consolidated in our financial statements.
Upon completion and full ramp-up of the Indonesia smelter projects, PT-FI will be a fully integrated producer of refined copper and gold. Other than copper concentrate delivered to PT Smelting for further processing into refined products, most of PT-FI’s copper concentrate is sold under long-term contracts.
Labor Matters. In April 2024, PT-FI reached a new two-year CLA with its three employee unions at its Grasberg minerals district operations. PT-FI did not recognize any significant nonrecurring costs associated with the new CLA.
Regulatory Matters. Over the past several years, the Indonesia government has enacted various laws and regulations related to promote downstream processing of various products, including copper concentrates. In 2018, PT-FI agreed to expand its domestic smelting and refining capacity to process all of its copper concentrates in Indonesia and is advancing the construction of the Indonesia smelter projects and expanding capacity at PT Smeltinghas made substantial progress towards completion (refer to "Indonesia Smelter"“Indonesia Smelting and Refining” below).
On June 10, 2023,PT-FI’s current export licenses for several exporters, including PT-FIcopper concentrate and PT Smelting, expired. On July 24, 2023, PT-FI was granted an export licenseanode slimes extend through May 2024 for 1.7 million metric tons of copper concentrate. Through June 10, 2023, PT-FI exported anode slimes under PT Smelting’s export license. A change in regulations during second-quarter 2023 requires PT-FI to follow a new administrative process for the export of anode slimes. The administrative process is advancing, and PT-FI expects to receive approval to resume exports of anode slimes during fourth-quarter 2023.2024. PT-FI is working with the Indonesia government to obtain approvals to continue exports of copper concentrates and anode slimes beyond May 2024 and until the Indonesia smelter projects are fully commissioned and reach designed operating conditions.conditions, which is currently expected by year-end 2024.
Under PT-FI’s IUPK, export duties are determined based on regulations that were in effect in 2018 and no duties are required after smelter construction progress reached 50%. Effective March 29, 2023, PT-FI’s export duties were eliminated upon verificationPT-FI also continues to discuss the applicability of smelter construction progress by the Indonesia government. In July 2023, the Ministry of Finance issued agovernment’s revised regulation on duties for various exported products, including copper concentrates. Under the revised regulationconcentrates, because of inconsistencies with its special mining license (IUPK). PT-FI is currently being assessed export duties foron copper concentrates at a rate of 7.5%, resulting in and incurred export duties totaling $147$156 million in third-quarter 2023. PT-FI does not believe any export duties should be assessed under the revised regulation and continues to discuss the applicability of the revised regulation with the Indonesia government because of inconsistencies with its IUPK.first-quarter 2024.
Refer to Note 8Notes 12, 13 and 14 of our 2023 Form 10-K for further discussion of the revised export regulation and other Indonesia regulatory matters.
Mining RightsRights.. PT-FI and the The Indonesia government continueis updating regulations that would enable PT-FI to engage in discussions regarding theapply for an extension of PT-FI's mining rights under its IUPK beyond 2041. An extension beyond 2041 would enable continuity of large-scale operations for the benefit of all stakeholders and provide growth options through additional resource development opportunities in the highly attractive Grasberg minerals district.
Operating and Development Activities. Over a multi-year investment period, PT-FI has successfully commissioned three large-scale block caveunderground mines in the Grasberg minerals district (Grasberg Block Cave, Deep Mill Level Zone and Big Gossan), providing annualwhich provided production volumes of approximately 1.60.5 billion pounds of copper and 1.60.5 million ounces of gold.gold in first-quarter 2024. Milling rates for ore from these underground mines averaged 206,600219,500 metric tons of ore per day in third-
quarter 2023, an approximate 10%first-quarter 2024, a 33% increase from 188,700164,800 metric tons of ore per day in third-quarter 2022. During third-quarter 2023, PT-FI successfully commissioned a new crusher to support increased mining rates in the Grasberg Block Cave ore body.first-quarter 2023.
PT-FI’s ongoing project to install additionalIn December 2023, PT-FI completed the installation of new milling facilities is expectedallowing it to be complete in early 2024. The project is expected to increase milling capacity to approximately 240,000 metric tonsfurther leverage the success of ore per day tothe underground mines and provide sustained large scalelarge-scale production volumes. PT-FI is also advancingcompleting a mill recovery project with the installation of a new copper cleaner circuit that is expected to be completed in the second half of 2024 and to provide incremental metal production of approximately 60 million pounds of copper and 40 thousand ounces of gold per year.2024.
PT-FI is advancing plans to transition its existing energy source from coal to liquefied natural gas, which is expected towould meaningfully reduce PT-FI'sPT-FI’s Scope 1 GHGgreenhouse gas emissions at the Grasberg minerals district. PT-FI is planning investments in a new gas-fired combined cycle facility at Grasberg with a targeted start date in 2027.facility. Capital expenditures for the new facilities, to be incurred over the next three to four years, approximate $1 billion which representsrepresenting an incremental cost of $0.4 billion compared to previously planned investments to refurbish the existing coal units.
Kucing LiarLiar.. Long-term mine development activities are ongoing for PT-FI'sPT-FI’s Kucing Liar deposit in the Grasberg minerals district, which is expected to produce over 67 billion pounds of copper and 6 million ounces of gold between 20282029 and the end of 2041. An extension of PT-FI’s operating rights beyond 2041 would extend the life of the project. Pre-production development activities commenced in 2022 and are expected to continue over an approximate 10-year timeframe. Capital investments are estimated to average approximately $400 million per year over this period. At full operating rates of approximately 90,000 metric tons of ore per day, annual production from Kucing Liar is expected to approximate 550560 million pounds of copper and 560520 thousand ounces of gold, providing PT-FI with sustained long-term, large-scale and low-cost production. Kucing Liar will benefit from substantial shared infrastructure and PT-FI'sPT-FI’s experience and long-term success in block-cave mining.
Indonesia SmelterSmelting and Refining.. In connection with PT-FI’s 2018 agreement with the Indonesia government to secure the extension of its long-term mining rights, PT-FI agreed to expand its domestic smelting and refining capacity to process all of its copper concentrates in Indonesia. PT-FI is actively engaged in the following projects for additional domestic smelting capacity:capacity.
•Construction progress of the Manyar smelter in Gresik, Indonesia with(with a capacity to process approximately 1.7 million metric tons of copper concentrate per year. Construction progress currently approximates 84% complete. year) is advancing on schedule with a target of May 2024 for substantial construction completion, which will be followed by a ramp-up period through December 2024.
Construction of the smelter has an estimated cost of $3.0 billion, including $2.8 billion for a construction contract (excluding capitalized interest and $0.3 billion of estimated commissioning and owner’s costs and commissioning)costs) and $0.2 billion for investment in a desalinizationdesalination plant. Construction is expected to be complete in mid-2024 followed by commissioning of the facilities and a ramp-up schedule through year-end 2024.
•Expansion of PT Smelting's capacity by 30% to 1.3 million metric tons of copper concentrate per year, which is expected to be completed by the end of 2023. PT-FI is funding the cost of the expansion, estimated to approximate $250 million, with a loan that will convert to equity and increase PT-FI’s ownership in PT Smelting to a majority ownership interest, which is expected to occur in 2024.
•The PMR is being constructed to process gold and silver from the Manyar smelter and PT Smelting. Construction is in progress with commissioning expected during 2024 at an estimatedthe second half of 2024. Current cost of $575 million, which incorporates recent revisions to scope.estimates total $665 million.
For the first nine months of 2023,During first-quarter 2024, capital expenditures for the Indonesia smelter projects totaled $1.2$0.5 billion and are expected to approximate $1.6$1.0 billion for the year 2023.2024. Projected capital expenditures for the Indonesia smelter projects in 2024 exclude capitalized interest and $0.3 billion of estimated commissioning and owner’s costs. Capital expenditures for the Indonesia smelter projects for the remainder of 2024 are beingexpected to be funded with PT-FI's senior notes and availability under itsPT-FI’s revolving credit facility.
43In December 2023, PT Smelting completed an expansion of its capacity by 30% to 1.3 million metric tons of copper concentrate per year. The project was funded by PT-FI with borrowings totaling approximately $250 million that are expected to convert to equity in late second-quarter 2024, increasing PT-FI’s ownership in PT Smelting to approximately 65% from 39.5%.
Operating Data. Following is summary consolidated operating data for Indonesia mining:operations:
| | Three Months Ended March 31, | |
| Three Months Ended March 31, | |
| Three Months Ended March 31, | |
| | | |
| | | Three Months Ended September 30, | | Nine Months Ended September 30, | |
| | | | 2023 | | 2022 | | 2023 | | 2022 | |
Copper (millions of recoverable pounds) | Copper (millions of recoverable pounds) | | | | | | | | |
Copper (millions of recoverable pounds) | |
Copper (millions of recoverable pounds) | |
| Production | |
| Production | |
| Production | Production | 436 | | | 381 | | | 1,171 | | | 1,169 | | |
| Sales | Sales | 430 | | | 406 | | | 1,014 | | | 1,195 | | |
| Sales | |
| Sales | |
| Average realized price per pound | |
| Average realized price per pound | |
| Average realized price per pound | Average realized price per pound | $ | 3.77 | | | $ | 3.45 | | | $ | 3.81 | | | $ | 3.71 | | |
| Gold (thousands of recoverable ounces) | Gold (thousands of recoverable ounces) | | | | |
| Gold (thousands of recoverable ounces) | |
| Gold (thousands of recoverable ounces) | |
| Production | |
| Production | |
| Production | Production | 528 | | | 445 | | | 1,409 | | | 1,330 | | |
| Sales | Sales | 395 | | | 476 | | | 1,153 | | | 1,356 | | |
| Sales | |
| Sales | |
| Average realized price per ounce | |
| Average realized price per ounce | |
| Average realized price per ounce | Average realized price per ounce | $ | 1,898 | | | $ | 1,683 | | | $ | 1,932 | | | $ | 1,786 | | |
| | Ore extracted and milled (metric tons per day): | Ore extracted and milled (metric tons per day): | | | | |
| | Ore extracted and milled (metric tons per day): | |
| | Ore extracted and milled (metric tons per day): | |
| Grasberg Block Cave underground mine | |
| Grasberg Block Cave underground mine | |
| Grasberg Block Cave underground mine | Grasberg Block Cave underground mine | 131,000 | | | 100,600 | | | 112,000 | | | 100,900 | | |
| Deep Mill Level Zone underground mine | Deep Mill Level Zone underground mine | 76,900 | | | 81,400 | | | 75,700 | | | 79,000 | | |
| Deep Mill Level Zone underground mine | |
| Deep Mill Level Zone underground mine | |
| Big Gossan underground mine | Big Gossan underground mine | 8,100 | | | 7,600 | | | 7,800 | | | 7,500 | | |
| Big Gossan underground mine | |
| Big Gossan underground mine | |
| Other adjustments | |
| Other adjustments | |
| Other adjustments | Other adjustments | (9,400) | | | (900) | | | (2,500) | | | 3,400 | | |
| | Total | Total | 206,600 | | | 188,700 | |
| 193,000 | | | 190,800 | | |
| | Total | |
| | Total | |
| Average ore grades: | |
| Average ore grades: | |
| Average ore grades: | Average ore grades: | | | | | | | | |
| Copper (%) | Copper (%) | 1.21 | | | 1.17 | | | 1.18 | | | 1.20 | | |
| Copper (%) | |
| Copper (%) | |
| Gold (grams per metric ton) | |
| Gold (grams per metric ton) | |
| Gold (grams per metric ton) | Gold (grams per metric ton) | 1.15 | | | 1.07 | | | 1.10 | | | 1.06 | | |
| Recovery rates (%): | Recovery rates (%): | | | |
| Recovery rates (%): | |
| Recovery rates (%): | |
| Copper | |
| Copper | |
| Copper | Copper | 89.5 | | | 90.1 | | | 89.5 | | | 89.8 | | |
| Gold | Gold | 77.8 | | | 77.2 | | | 77.5 | | | 77.9 | | |
| Gold | |
| Gold | |
PT-FI’s consolidated copper sales of 430493 million pounds in third-quarter 2023 were higher than third-quarter 2022of copper sales volumes of 406 million pounds, primarily reflecting higher mining rates and ore grades. PT-FI’s consolidated copper sales of 1.0 billion pounds for the first nine months of 2023 were lower than 1.2 billion pounds for the first nine months of 2022, primarily reflecting the deferral of sales recognition related to the PT Smelting tolling arrangement.
PT-FI’s consolidated gold sales totaled 395 thousand ounces in third-quarter 2023, 476 thousand ounces in third-quarter 2022, 1.2 million ounces for the first nine months of 2023, and 1.4 million ounces for the first nine months of 2022. Lower gold sales volumes in the 2023 periods, compared with the 2022 periods, primarily reflect the timing of shipments of anode slimes associated with a change in administrative requirements for products that were previously being exported by PT Smelting. At September 30, 2023, approximately 75564 thousand ounces of gold in anode slimesfirst-quarter 2024 were included in inventorymore than double first-quarter 2023 sales of 198 million pounds of copper and available for sale pending approval266 thousand ounces of PT-FI’s export license for anode slimes. The first nine months ofgold, primarily reflecting higher mining and milling rates and ore grades. First-quarter 2023 wassales were also impacted by weather-related disruptions and the initial deferral of sales recognition related to the PT Smelting tolling arrangement.
Consolidated sales volumes from PT-FI are expected to approximate 1.51.7 billion pounds of copper and 1.72.0 million ounces of gold for the year 2023, net2024, which includes exports of acopper concentrates and anode slimes from June 2024 through December 2024 totaling 0.4 billion pounds of copper and 0.9 million ounces of gold. Additionally, PT-FI’s consolidated copper and gold production volumes for the year 2024 are expected to exceed 2024 sales volumes, reflecting the deferral of approximately 10090 million pounds of copper and 180120 thousand ounces of gold from mine production under tolling arrangements tothat will be processed by the Indonesia smelter projects and sold as refined metal in future periods. Projected sales volumes are dependent on operational performance, the resumptionperformance; extension of PT-FI’s export licenses for copper concentrates and anode slime exports,
slimes beyond May 2024; weather-related conditionsconditions; and other factors detailed in the “Cautionary Statement.”Statement” below.
Unit Net Cash (Credits) Costs. We believe unit net cash (credits) costs per pound of copper is a measure that provides investors with information about the cash-generating capacity of our mining operations expressed on a basis relating to the primary metal product for our respective operations. We use this measure for the same purpose and for monitoring operating performance by our mining operations. This information differs from measures of performance determined in accordance with U.S. GAAP and should not be considered in isolation or as a substitute for measures of performance determined in accordance with U.S. GAAP. This measure is presented by other metals mining companies, although our measure may not be comparable to similarly titled measures reported by other companies.
Gross Profit per Pound of Copper and per Ounce of Gold
The following table summarizes the unit net cash (credits) costs and gross profit per pound of copper and per ounce of gold at our Indonesia mining operations. Refer to “Product Revenues and Production Costs” for an explanation of “by-product” and “co-product” methods and a reconciliation of unit net cash costscredits per pound to production and delivery costs applicable to sales reported in our consolidated financial statements.
| | Three Months Ended September 30, |
| Three Months Ended March 31, | | | Three Months Ended March 31, |
| | | 2023 | | 2022 | | 2024 | | 2023 |
| | | By-Product Method | | Co-Product Method | | By-Product Method | | Co-Product Method | | By-Product Method | | Co-Product Method | | By-Product Method | | Co-Product Method |
| | | | Copper | | Gold | | Copper | | Gold | | | Copper | | Gold | | | Copper | | Gold |
| Revenues, excluding adjustments | Revenues, excluding adjustments | $ | 3.77 | | | $ | 3.77 | | | $ | 1,898 | | | $ | 3.45 | | | $ | 3.45 | | | $ | 1,683 | |
| | Site production and delivery, before net noncash and other costs shown below | Site production and delivery, before net noncash and other costs shown below | 1.42 | | | 0.96 | | | 484 | | | 1.81 | | | 1.13 | | | 553 | |
| Site production and delivery, before net noncash and other costs shown below | |
| Site production and delivery, before net noncash and other costs shown below | |
| Gold, silver and other by-product credits | Gold, silver and other by-product credits | (1.83) | | | — | | | — | | | (2.00) | | | — | | | — | |
| Treatment charges | Treatment charges | 0.32 | | | 0.22 | | | 109 | | | 0.23 | | | 0.15 | | | 72 | |
| Export duties | Export duties | 0.34 | | | 0.23 | | | 116 | | | 0.20 | | | 0.12 | | | 61 | |
| Royalty on metals | Royalty on metals | 0.19 | | | 0.12 | | | 64 | | | 0.20 | | | 0.12 | | | 67 | |
| Unit net cash costs | 0.44 | | | 1.53 | | | 773 | | | 0.44 | | | 1.52 | | | 753 | |
| Unit net cash (credits) costs | |
| DD&A | DD&A | 0.63 | | | 0.43 | | | 214 | | | 0.65 | | | 0.41 | | | 200 | |
| Noncash and other costs (credits), net | 0.02 | | a | 0.01 | | | 6 | | | (0.02) | | | (0.01) | | | (7) | |
| Noncash and other costs, net | |
| Total unit costs | Total unit costs | 1.09 | | | 1.97 | | | 993 | | | 1.07 | | | 1.92 | | | 946 | |
| Revenue adjustments, primarily for pricing on prior period open sales | Revenue adjustments, primarily for pricing on prior period open sales | — | | | — | | | 8 | | | (0.39) | | | (0.39) | | | (36) | |
| PT Smelting intercompany profit | PT Smelting intercompany profit | — | | | — | | | — | | | 0.15 | | | 0.09 | | | 45 | |
| Gross profit per pound/ounce | Gross profit per pound/ounce | $ | 2.68 | | | $ | 1.80 | | | $ | 913 | | | $ | 2.14 | | | $ | 1.23 | | | $ | 746 | |
| | Copper sales (millions of recoverable pounds) | Copper sales (millions of recoverable pounds) | 430 | | | 430 | | | | | 406 | | | 406 | | | |
| Copper sales (millions of recoverable pounds) | |
| Copper sales (millions of recoverable pounds) | | 493 | | | 493 | | | | | 198 | | | 198 | | | |
| Gold sales (thousands of recoverable ounces) | Gold sales (thousands of recoverable ounces) | | | | | 395 | | | | | | | 476 | |
| | | | | | | | | | | | | | | | | | | | | | | | | | | | | | | | | | | |
| | | | | | | | | | | |
| Nine Months Ended September 30, |
| | 2023 | | 2022 |
| | By-Product Method | | Co-Product Method | | By-Product Method | | Co-Product Method |
| | | Copper | | Gold | | | Copper | | Gold |
| Revenues, excluding adjustments | $ | 3.81 | | | $ | 3.81 | | | $ | 1,932 | | | $ | 3.71 | | | $ | 3.71 | | | $ | 1,786 | |
| | | | | | | | | | | |
| Site production and delivery, before net noncash and other costs shown below | 1.71 | | | 1.07 | | | 542 | | | 1.55 | | | 0.99 | | | 476 | |
| Gold, silver and other by-product credits | (2.32) | | | — | | | — | | | (2.11) | | | — | | | — | |
| Treatment charges | 0.36 | | | 0.22 | | | 113 | | | 0.24 | | | 0.15 | | | 74 | |
| Export duties | 0.16 | | | 0.10 | | | 51 | | | 0.20 | | | 0.13 | | | 63 | |
| Royalty on metals | 0.23 | | | 0.14 | | | 70 | | | 0.24 | | | 0.16 | | | 70 | |
| Unit net cash costs | 0.14 | | | 1.53 | | | 776 | | | 0.12 | | | 1.43 | | | 683 | |
| DD&A | 0.69 | | | 0.43 | | | 216 | | | 0.65 | | | 0.41 | | | 199 | |
| Noncash and other costs, net | 0.11 | | a,b | 0.07 | | | 36 | | | 0.02 | | b | 0.01 | | | 5 | |
| Total unit costs | 0.94 | | | 2.03 | | | 1,028 | | | 0.79 | | | 1.85 | | | 887 | |
| Revenue adjustments, primarily for pricing on prior period open sales | 0.11 | | | 0.11 | | | 15 | | | 0.02 | | | 0.02 | | | 2 | |
| PT Smelting intercompany profit | 0.11 | | | 0.07 | | | 35 | | | 0.03 | | | 0.02 | | | 9 | |
| Gross profit per pound/ounce | $ | 3.09 | | | $ | 1.96 | | | $ | 954 | | | $ | 2.97 | | | $ | 1.90 | | | $ | 910 | |
| | | | | | | | | | | |
| Copper sales (millions of recoverable pounds) | 1,014 | | | 1,014 | | | | | 1,195 | | | 1,195 | | | |
| Gold sales (thousands of recoverable ounces) | | | | | 1,153 | | | | | | | 1,356 | |
| | | | | | | | | | | |
a.Includes charges totaling $0.01$0.03 per pound of copper in third-quarter 2023first-quarter 2024 for the Indonesia smelter projects’ operational readiness and $0.02startup costs and $0.07 per pound of copper for the first nine monthsin first-quarter 2023 for feasibility and optimization studies.
b.Includes a charge totaling $0.05 per pound of copper for the first nine months of 2023 associated with a potential administrative fine. The first nine months of 2022 also includes a charge of $0.03 per pound of copper associated with an administrative fine. Refer to Note 8 for further discussion.
PT-FI'sPT-FI’s unit net cash costs (net ofcredits (including gold, silver and other by-product credits) of $0.44were $0.12 per pound of copper in third-quarter 2023 approximatedfirst-quarter 2024 and $0.08 per pound of copper in first-quarter 2023. The favorable unit net cash costscredits in third-quarter 2022,first-quarter 2024, compared to first-quarter 2023, primarily reflectingreflect higher coppersales volumes, partially offset by lower gold, silver and other by-product credits and higher treatment charges and export duties. PT-FI’s unit net cash costs (net of gold, silver and other by-product credits) of $0.14 per pound of copper for the first nine months of 2023 were higher than unit net cash costs of $0.12 per pound for the first nine months of 2022, primarily reflecting increased underground maintenance costs and higher treatment charges and the impact of lower copper sales volumes, partly offset by higher gold, silver and other by-product credits.
Treatment charges vary with the volume of metals sold and the price of copper, and royalties vary with the volume of metals sold and the prices of copper and gold. The increasePT-FI’s royalties totaled $118 million in treatment charges per pound of copperfirst-quarter 2024 and ounce of gold$58 million in the 2023 periods, compared with the 2022 periods, reflects higher costs associated with the new tolling arrangement with PT Smelting compared to the previous copper concentrate sales agreement. Tolling costs paid to PT Smelting are recorded as production costs in the consolidated statements of income but are reflected as treatment costs above in our unit net cash costs presentation.first-quarter 2023.
PT-FI’s export duties totaled $147 million in third-quarter 2023, $80 million in third-quarter 2022, $165 million for the first nine months of 2023 and $245 million for the first nine months of 2022. In late 2022, the export duty rate on PT-FI’s sales declined from 5% to 2.5% as a result of smelter development progress, and effective March 29, 2023, export duties were eliminated upon verification by the Indonesia government that construction progress on the Manyar smelter exceeded 50%. In July 2023, the Indonesia government issued a revised regulation on duties for various exported products, including copper concentrates, and under the revised regulation, PT-FI is currently being assessed export duties for copper concentrates at a rate of 7.5%., compared to an export duty rate of 2.5% in first-quarter 2023. Export duties totaled $156 million in first-quarter 2024 and $17 million in first-quarter 2023. Refer to Note 813 of our 2023 Form 10-K for further discussion of the revised regulation.
PT-FI’s royalties vary with the volume of metal sold and the prices of copper and gold. PT-FI’s royalties totaled $78 million in third-quarter 2023, $81 million in third-quarter 2022, $228 million for the first nine months of 2023 and $281 million for the first nine months of 2022.export duties.
Because certain assets are depreciated on a straight-line basis, PT-FI’s unit depreciation rate may vary with asset additions and the level of copper production and sales. The change in the DD&A rate per pound
Revenue adjustments primarily result from changes in prices on provisionally priced copper sales recognized in prior periods. Refer to “Consolidated Results – Revenues” for further discussion of adjustments to prior period provisionally priced copper sales.
PT SmeltingSmelting’s intercompany profit for the third quarter and first nine months of 2022in first-quarter 2023 represents the change in the deferral of 39.5% of PT-FI’s profit on sales to PT Smelting. Beginning on January 1,in 2023, PT-FI’s commercial arrangement with PT Smelting changed from a copper concentrate sales agreement to a tolling arrangement. Under this arrangement PT-FI pays PT Smelting a tolling fee to smelt and refine its copper concentrate and PT-FI retains title to all products for sales to third parties. Accordingly, beginning in 2023, there are no further sales from PT-FI to PT Smelting.
Assuming an average gold price of $1,900 per ounce in fourth-quarter 2023 and achievement of current sales volumes and cost estimates,Average unit net cash costscredits (including gold, silver and other by-product credits) for PT-FI are expected to approximate $0.15$0.12 per pound of copper for the year 2023. PT-FI's estimated unit net cash costs2024, based on achievement of current sales volumes and cost estimates, and assuming an average price of $2,300 per ounce of gold for the year 2023 include assessmentremainder of a 7.5% export duty during the second half of 2023, which continues to be discussed with the Indonesia government. PT-FI's2024. PT-FI’s average unit net cash costscredits for the year 20232024 would change by approximately $0.05$0.09 per pound of copper for each $100 per ounce change in the average price of gold for the remainder of 2024.
PT-FI’s projected sales volumes and unit net cash credits for the year 2024 are dependent on operational performance; extension of PT-FI’s export licenses for copper concentrates and anode slimes beyond May 2024; weather-related conditions; and other factors. Refer to “Cautionary Statement” below, and Item 1A. “Risk Factors” contained in fourth-quarter 2023.Part I of our 2023 Form 10-K for further discussion of factors that could cause results to differ materially from projections.
Molybdenum Mines
We operate two wholly owned primary molybdenum minesoperations in Colorado – the Climax open-pit mine and the Henderson underground mine. The Climax and Henderson mines produce high-purity, chemical-grade molybdenum concentrate, which is typically further processed into value-added molybdenum chemical products. The majority of the molybdenum concentrate produced at the Climax and Henderson mines, as well as from our North America copper mines and South America copper mines,operations, is processed at our conversion facilities.
Operating and Development Activities. Production from the Molybdenum minesprimary molybdenum operations totaled 78 million pounds of molybdenum in third-quarter 2023, 8 million pounds in third-quarter 2022, 22 million pounds for the first nine monthseach of 2023first-quarter 2024 and 23 million pounds for the first nine months of 2022.2023. Refer to “Consolidated Results” for our consolidated molybdenum operating data, which includes sales of molybdenum produced at our Molybdenum minesprimary molybdenum operations and from our North America copper mines and South America copper mines.operations. Refer to “Outlook” for projected consolidated molybdenum sales volumes and to “Markets” for a discussion of molybdenum prices.
Unit Net Cash Costs Per Pound of Molybdenum. We believe unit net cash costs per pound of molybdenum is a measure that provides investors with information about the cash-generating capacity of our mining operations expressed on a basis relating to the primary metal product for our respective operations. We use this measure for the same purpose and for monitoring operating performance by our mining operations. This information differs from measures of performance determined in accordance with U.S. GAAP and should not be considered in isolation or as a substitute for measures of performance determined in accordance with U.S. GAAP. This measure is presented by other metals mining companies, although our measure may not be comparable to similarly titled measures reported by other companies.
Average unit net cash costs for the Molybdenum minesprimary molybdenum operations of $18.07$15.80 per pound of molybdenum in third-quarter 2023 and $15.25 per pound for the first nine months of 2023first-quarter 2024 were higher than average unit net cash costs of $12.10$12.24 per pound in third-quarter 2022 and $11.22 per pound for the first nine months of 2022,first-quarter 2023, primarily reflecting lower production volumes associated with ore types mined and higher costs for contract labor costs. Based on current volume and cost estimates, averagemaintenance supplies. Average unit net cash costs for the Molybdenum minesprimary molybdenum operations are expected to approximate $14.47$15.47 per pound of molybdenum for the year 2023.2024, based on achievement of current sales volumes and cost estimates. Refer to “Product Revenues and Production Costs” for a reconciliation of unit net cash costs per pound to production and delivery costs applicable to sales reported in our consolidated financial statements.
Smelting and Refining
Through our downstream integration, we are able to assure placement of a significant portion of our copper concentrate production. We wholly own and operate the Miami smelter in Arizona, Atlantic Copper (a smelter and refinery in Spain), and the El Paso refinery in Texas and Atlantic Copper, a smelter and refinery in Spain. Additionally, Texas.
PT-FI also has a 39.5% ownership interest in PT Smelting, a copper smelter and refinery in Gresik, Indonesia (refer to Note 3 of our 2023 Form 10-K) and expects its ownership to increase to a majority interest upon completion ofcomplete the expansion of PT Smelting’s smelting capacity. Through this form of downstream integration, we are assured placement of a significant portion of ourIndonesia smelter projects in 2024, which will smelt and refine copper concentrate production.from PT-FI as well as process anode slimes. As a result, PT-FI’s operations will be
fully integrated, and treatment charges reflecting the cost of smelting and refining operations will be recorded in production and delivery costs (refer to “Indonesia Mining – Indonesia Smelting and Refining” above).
TreatmentAtlantic Copper smelts and refines copper concentrate and markets refined copper and precious metals in slimes. In first-quarter 2024, Atlantic Copper’s copper concentrate purchases included 42% from our copper mining operations and 58% from third parties. Atlantic Copper’s treatment charges, for smelting and refining copper concentratewhich consist of a base rate per pound of copper and per ounce of gold, and are generally fixed. Treatment chargesfixed and represent a cost to our mining operations and income to Atlantic Copper. HigherCopper (i.e., higher treatment charges benefit our smelter operations and adversely affect our mining operations.Atlantic Copper operations). Our North America copper mines are less significantly affected by changes in treatment charges because these operations are largely integrated with our Miami smelter and El Paso refinery.
Atlantic Copper smelts and refines copper concentrate and markets refined copper and precious metals in slimes. During the first nine months of 2023, Atlantic Copper’s copper concentrate purchases included 38% from our copper mining operations and 62% from third parties.
Beginning on January 1, 2023, PT-FI's commercial arrangement with PT Smelting changed from a copper concentrate sales agreement to a tolling arrangement. Under this arrangement, PT-FI pays PT Smelting a tolling fee (which PT-FI records as production costs in the consolidated statements of income) to smelt and refine its copper concentrate and PT-FI retains title to all products for sale to third parties (i.e., there are no further sales to PT Smelting).
We defer recognizing profits on sales from our mining operations to Atlantic Copper (and on 39.5% of PT-FI’s sales to PT Smelting for the 2022 periods) until final sales to third parties occur. Changes in these deferrals attributable to variability in intercompany volumes resulted in net (reductions) additions to operating income totaling $81$(17) million ($37(5) million to net income attributable to common stock) in third-quarter 2023, $33first-quarter 2024 and $111 million ($1448 million to net income attributable to common stock) in third-quarter 2022, $153 million ($64 millionfirst-quarter 2023. First-quarter 2023 benefited from the recognition of previously deferred profits on PT-FI sales to net income attributablePT Smelting following the change in the commercial arrangements from a concentrate sales agreement to common stock)a tolling agreement (refer to Note 3 of our 2023 Form 10-K for the first nine months of 2023 and $73 million ($37 million to net income attributable to common stock) for the first nine months of 2022.further discussion). Our net deferred profits on our inventories at Atlantic Copper to be recognized in future periods’ net income attributable to common stock totaled $30$63 million at September 30, 2023.March 31, 2024. Quarterly variations in ore grades, the timing of intercompany shipments and changes in product prices will result in variability in our net deferred profits and quarterly earnings.
CAPITAL RESOURCES AND LIQUIDITY
Our consolidated operating cash flows vary with sales volumes; prices realized from copper, gold and molybdenum sales; production costs; income taxes; other working capital changes; and other factors. Our results for the first nine months of 2023 reflect strong operating performance and continued execution of our business strategy.
We remain focused on managing costs efficiently and continue to advance several important value-enhancing initiatives. We believe the actions we have taken in recent years to build a strongsolid balance sheet, successfully expand low-cost operations and maintain flexible organic growth options while maintaining sufficient liquidity, will allow us to continue to execute our business plans in a prudent manner during periods of economic uncertainty while preserving substantial future asset values.
We closely monitor market conditions and will adjust our operating plans to protect liquidity and preserve our asset values, if necessary. We expect to maintain a strong balance sheet and liquidity position as we focus on building long-term value in our business, executing our operating plans safely, responsibly and efficiently, and prudently managing costs and capital expenditures.
Based on current sales volume, cost and metal price estimates discussed in “Outlook,” our available cash and cash equivalents plus our projected consolidated operating cash flows of $5.4$7.4 billion for the year 20232024 exceed our expected consolidated capital expenditures of $4.8$4.6 billion (which includes $1.9 billion for major mining projects and $1.6$1.0 billion for the Indonesia smelter projects that are beingexpected to be funded with availability under PT-FI’s senior notes and its availablerevolving credit facility).
Planned capital expenditures for major mining projects over the next few years are primarily associated with projects in Indonesia, including underground development activities, supporting mill and power capital costs and initial spending on a new gas-fired combined cycle facility. In addition, we are advancing discretionary capital projects associated with the development of the Kucing Liar deposit in Grasberg and an expansion of concentrator capacity at our Bagdad operation.
We have cash on hand and the financial flexibility to fund capital expenditures and our other cash requirements for the next twelve months, including noncontrolling interest distributions, income tax payments, current common stock dividends (base and variable) and any share or debt repurchases. At September 30, 2023,March 31, 2024, we had $5.7$5.2 billion in consolidated cash and cash equivalents (which includes $0.6 billion of PT-FI cash designated for Indonesia smelter projects) and FCX, PT-FI and Cerro Verde have $3.0 billion, $1.3$1.75 billion and $350 million, respectively, of availability under their revolving credit facilities.
At September 30, 2023,March 31, 2024, we had $0.7$1.0 billion in current restricted cash and cash equivalents, which includes (i) $0.5including $0.9 billion associated with PT-FI's export proceeds temporarily deposited in Indonesia banks for 90 days in accordance with a regulation issued by the Indonesia government that became effective August 1, 2023, requiring 30% of export proceeds to be temporarily deposited into Indonesia banks for a period of 90 days before withdrawal, and (ii) $145 million in assurance to support PT-FI’s commitment for smelter development in Indonesia. Refer to Note 8 for further discussion of an additional refundable deposit that PT-FI may be required to make related to smelter development.government.
Financial Policy. Our financial policy is aligned with our strategic objectives of maintaining a strongsolid balance sheet, providing cash returns to shareholders and advancing opportunities for future growth. The policy includes a base dividend and a performance-based payout framework, whereby up to 50% of available cash flows generated after planned capital spending and distributions to noncontrolling interests would be allocated to shareholder returns and the balance to debt reduction and investments in value enhancing growth projects, subject to us maintaining our net debt at a level not to exceed the net debt target of $3.0 billion to $4.0 billion (excluding net project debt for additional smelting capacity in Indonesia)the Indonesia smelter projects). Our Board of Directors (Board) will reviewreviews the structure of the performance-based payout framework at least annually.
At September 30, 2023,March 31, 2024, net debt totaled $0.3 billion (which was net of $0.9 billion of current restricted cash associated with PT-FI’s export proceeds), excluding net$3.0 billion of debt for the Indonesia smelter projects, totaled $0.8 billion.projects. Refer to "Net Debt" for further discussion.
On September 20, 2023,March 27, 2024, our Board declared cash dividends totaling $0.15 per share on our common stock (including a $0.075 per share quarterly base cash dividend and a $0.075 per share quarterly variable, performance-based cash dividend), which waswere paid on NovemberMay 1, 2023,2024, to common stockholders of record as of October 13, 2023.April 15, 2024. Based on current market conditions, the base and variable dividends on our common stock are anticipated to
total $0.60 per share for 20232024 (including the dividends paid on NovemberFebruary 1, 2023)2024, and May 1, 2024), comprised of a $0.30 per share base dividend and $0.30 per share variable dividend. The declaration and payment of dividends (base or variable) is at the discretion of our Board and will depend on our financial results, cash requirements, global economic conditions and other factors deemed relevant by our Board.
Cash
Following is a summary of the U.S. and international components of consolidated cash and cash equivalents available to the parent company, excluding cash committed for the Indonesia smelter projects and net of noncontrolling interests’ share, taxes and other costs at September 30, 2023March 31, 2024 (in billions):
| | | | | | | | | |
| Cash at domestic companies | $ | 3.12.3 | | | |
| Cash at international operations | 2.62.9 | | a | |
| Total consolidated cash and cash equivalents | 5.75.2 | | | |
| Cash for Indonesia smelter projects | (0.6) | | b |
| Noncontrolling interests’ share | (0.9)(1.4) | | | |
| Cash, net of noncontrolling interests’ share | 4.23.8 | | | |
| Withholding taxes | (0.1) | |
| |
| Net cash available | $ | 4.13.7 | | | |
a.Excludes $0.5$0.9 billion of current restricted cash associated with a portion of PT-FI's export proceeds required to be temporarily deposited in Indonesia banks for 90 days in accordance with an August 2023a regulation issued by the Indonesia government, which have been presented as current restricted cash and cash equivalents in FCX's consolidated balance sheet.
b.Estimated remaining net proceeds from PT-FI's senior notes.government.
Cash held at our international operations is generally used to support our foreign operations’ capital expenditures, operating expenses, debt repayments, working capital or other cash needs. Management believes that sufficient liquidity is available in the U.S. from cash balances and availability from our revolving credit facility. We have not elected to permanently reinvest earnings from our foreign subsidiaries, and we have recorded deferred tax liabilities for foreign earnings that are available to be repatriated to the U.S. From time to time, our foreign subsidiaries distribute earnings to the U.S. through dividends that are subject to applicable withholding taxes and noncontrolling interests’ share.
Debt
At September 30, 2023,March 31, 2024, consolidated debt totaled $9.4 billion, with a weighted-average interest rate of 5.2%. Substantially all of our outstanding debt is fixed rate. FCX has
We have $0.7 billion in scheduled senior note maturities through 2026 andin November 2024 with no further senior note maturities until 2027. Our total debt has an average remaining duration of its total debt of approximately 10 years. We
At March 31, 2024, we had no borrowings outstanding and $7 million in letters of credit issued under our $3.0 billion revolving credit facility. Additionally, at September 30, 2023,facility, and there were no amounts were drawnborrowings under PT-FI’s $1.3$1.75 billion revolving credit facility or Cerro Verde’s $350 million revolving credit facility.
Refer to Note 5 for further discussion.
Operating Activities
We generated operating cash flows of $4.0$1.9 billion (net of $0.7$0.1 billion of working capital and other uses) for the first nine months of 2023in first-quarter 2024 and $4.1$1.1 billion (net of $1.0$0.5 billion of working capital and other uses) for the first nine monthsin first-quarter 2023. Higher operating cash flows in first-quarter 2024, compared with first-quarter 2023, primarily reflects higher copper and gold sales volumes and higher gold prices.
Investing Activities
Capital Expenditures. Capital expenditures, including capitalized interest, totaled $3.5$1.3 billion for the first nine months of 2023,in first-quarter 2024, including approximately $1.2 billion for major mining projects, primarily associated with underground development activities in the Grasberg minerals district and $1.2 billion for the Indonesia smelter projects.
Capital expenditures, including capitalized interest, totaled $2.4 billion for the first nine months of 2022, including approximately $1.2$0.4 billion for major mining projects, primarily associated with underground development activities in the Grasberg minerals district, and $0.5 billion for the Indonesia smelter projects.
Proceeds from Sales of Assets. Proceeds from sales of assets totaled $16 million for the first nine months of 2023 and $102 million for the first nine months of 2022. In May 2022, we sold all of the shares we owned in Jervois Global Limited, which we received in connection with the 2021 sale of our remaining cobalt business, for proceeds of $60 million.
Loans to PT SmeltingCapital expenditures, including capitalized interest, totaled $1.1 billion in first-quarter 2023, including $0.4 billion for Expansion.PT-FI made loans to PT Smelting totaling $109 millionmajor mining projects, primarily associated with underground development activities in the Grasberg minerals district, and $0.3 billion for the first nine months of 2023 and $51 million for the first nine months of 2022 to fund PT Smelting’s expansion project.Indonesia smelter projects.
Financing Activities
Debt Transactions. Net repayments of debt totaled $1.2$1.0 billion for the first nine months ofin first-quarter 2023 includingreflecting the repayment of our 3.875% Senior Notes that matured in March 2023 totaling $996 million and open-market purchases of our senior notes for a total cost of $221 million. Refer to Note 5 for additional information.2023.
Net proceeds from debt totaled $1.3 billion for the first nine months of 2022, reflecting net proceeds from PT-FI’s $3.0 billion senior note offering, partly offset by the repayment of borrowings under PT-FI’s term loan ($0.6 billion), Cerro Verde’s term loan ($0.3 billion) and open-market purchases of our senior notes ($0.9 billion).
Cash Dividends on Common Stock. We paid cash dividends on our common stock totaling $647 million for the first nine months$0.2 billion in each of 2023first-quarter 2024 and $652 million for the first nine months of 2022.2023. The declaration and payment of dividends (base or variable) is at the discretion of our Board and will depend on our financial results, cash requirements, global economic conditions and other factors deemed relevant by our Board. Refer to Note 5, Item 1A. “Risk Factors” contained in Part I of our 20222023 Form 10-K, (as updated in Part II, Item 1A. herein), “Cautionary Statement” below and the discussion of our financial policy above.
Cash Dividends and Distributions Paid to Noncontrolling Interests. Cash dividends and distributions paid to noncontrolling interests at our international operations totaled $407$102 million for the first nine months of 2023 and $625 million for the first nine months of 2022. Based on the estimates discussed in “Outlook,” we currently expect cash dividends and distributions paid to noncontrolling interests totaling $0.5 billion for the year 2023.first-quarter 2024 (none in first-quarter 2023). Cash dividends and distributions to noncontrolling interests vary based on the operating results and cash requirements of our consolidated subsidiaries.
Treasury Stock Purchases. Since mid-2021, we have acquired 47.8 million shares of our common stock under our share repurchase program for a total cost of $1.8 billion ($38.35 average cost per share), including 35.1 million shares in the first nine months of 2022 for a total cost of $1.3 billion. No shares have been purchased since July 11, 2022, and we have $3.2 billion available for repurchases under the program. The timing and amount of share repurchases is at the discretion of management and will depend on a variety of factors. The share repurchase program may be modified, increased, suspended or terminated at any time at our Board’s discretion. Refer to Item 1A. “Risk Factors” contained in Part I of our 2022 Form 10-K (as updated in Part II, Item 1A. herein), “Cautionary Statement” below and discussion of our financial policy above.
Contributions from Noncontrolling Interests. We received equity contributions totaling $50 million for the first nine months ofin first-quarter 2023 and $142 million for the first nine months of 2022 from PT Mineral Industri Indonesia (formerly PT Indonesia Asahan Aluminium (Persero), (MIND ID)). Contributions for the first nine months of 2023 wereMIND ID, primarily associated with receipt of the final capital contribution in accordance with the PT-FI shareholders agreement. Contributions for the first nine months of 2022 were associated with MIND ID’s share of capital spending on underground mine development projects in the Grasberg minerals district. Beginning on January 1, 2023, capital spending at PT-FI is being shared in accordance with the shareholders’ ownership interests.
CONTRACTUAL OBLIGATIONS
There have been no material changes in our contractual obligations since December 31, 2022.2023. Refer to Note 13 and Part II, Items 7. and 7A. in our 20222023 Form 10-K for information regarding our contractual obligations.
CONTINGENCIES
Environmental LiabilitiesObligations and Asset Retirement Obligations (AROs)AROs
Our current and historical operating activities are subject to stringentvarious environmental laws and regulations governing the protection of the environment.regulations. We perform a comprehensive annual review of our environmental liabilitiesobligations and AROs and also review changes in facts and circumstances associated with these obligations at least quarterly.
As discussed in Note 8, we recorded charges totaling $199$56 million for revisions to our environmental obligations during the first nine months of 2023,in first-quarter 2024, primarily for preliminary adjustments associated with an interim action workplan for a former processing facility in Steubenville, Ohio, and for groundwater remediation in Blackwell, Oklahoma associated with a historical smelter site. In addition, we recorded ARO additions totaling $365 million in first-quarter 2024, including $256 million at our mining operations primarily associated with revised cost estimates. There have been no significant changes to our AROs since December 31, 2022. Updated cost assumptions, including increasesclosure plans and decreases to cost estimates changes into reflect our commitment to the anticipated scopeGlobal Industry Standard on Tailings Management, and timing$109 million associated with assumed oil and gas abandonment obligations resulting from bankruptcies of remediation activities, and settlementother companies.
of environmental matters may result in additional revisions to certain of our environmental liabilities and AROs. Refer to Note 12 in“Environmental” and “AROs” of our 20222023 Form 10-K for further information regarding ourabout contingencies associated with environmental liabilitiesmatters and AROs.
Litigation and Other Contingencies
There have been no material changessignificant updates to our contingencies associated with legal proceedings, environmental and other matters since December 31, 2022,2023, other than the Indonesia regulatory matters discussed above in “Indonesia Mining - Regulatory Matters” and as disclosed in Note 8. Refer to Note 12 and “Legal Proceedings” contained in Part I, Item 3. of our 20222023 Form 10-K, as updated by Note 8, for further information regarding litigation and other contingencies.
NEW ACCOUNTING STANDARDS
There were no significant updates to previously reported accounting standards included in Note 1 of our 20222023 Form 10-K.
NET DEBT
We believe that net debt provides investors with information related to the performance-based payout framework in our financial policy, which requires us to maintain our net debt at a level not to exceed the net debt target of $3 billion to $4 billion (excluding net project debt for additional smelting capacity in Indonesia)the Indonesia smelter projects). We define net debt as consolidated debt less (i) consolidated cash and cash equivalents and (ii) current restricted cash associated with PT-FI's export proceeds. This information differs from consolidated debt determined in accordance with U.S. GAAP and should not be considered in isolation or as a substitute for consolidated debt determined in accordance with U.S. GAAP. Our net debt, which may not be comparable to similarly titled measures reported by other companies, follows (in billions):
| | | | | | | | | | | | | | |
| As of September 30, 2023 | | As of December 31, 2022 | |
| Current portion of debt | $ | — | | a | $ | 1.0 | | |
| Long-term debt, less current portion | 9.4 | | | 9.6 | | |
| Consolidated debt | 9.4 | |
| 10.6 | | |
| Less: consolidated cash and cash equivalents | 5.7 | | | 8.1 | | |
Less: current restricted cash associated with PT-FI's export proceedsb | 0.5 | | | — | | |
| FCX net debt | 3.2 | | | 2.5 | | |
Less: net debt for Indonesia smelter projectsc | 2.4 | |
| 1.2 | | |
| FCX net debt, excluding Indonesia smelter projects | $ | 0.8 | | | $ | 1.3 | | |
| | | | | | | | | | |
| As of March 31, 2024 | | | |
| Current portion of debt | $ | 0.8 | | | | |
| Long-term debt, less current portion | 8.7 | | | | |
| Consolidated debt | 9.4 | | a | | |
| Less: consolidated cash and cash equivalents | 5.2 | | | | |
Less: current restricted cash associated with PT-FI’s export proceedsb | 0.9 | | | | |
| FCX net debt | 3.3 | | | | |
Less: debt for Indonesia smelter projectsc | 3.0 | |
| | |
| FCX net debt, excluding debt for the Indonesia smelter projects | $ | 0.3 | | | | |
a.Rounds to less than $0.1 billionDoes not foot because of rounding.
b.Effective August 1, 2023, and inIn accordance with a regulation issued by the Indonesia government, 30% of PT-FI’s export proceeds are being temporarily deposited into Indonesia banks for a period of 90 days before withdrawal and have beenare presented as current restricted cash and cash equivalents in FCX'sour consolidated balance sheet. As the 90-day holding period is the only restriction on the cash, FCX haswe have included such amount in the calculation of net debt.
c.Includes consolidated debt of $3.0 billion and consolidated cash and cash equivalents of $0.6 billion as of September 30, 2023, and consolidated debt of $3.0 billion and consolidated cash and cash equivalents of $1.8 billion as of December 31, 2022.Represents senior notes issued by PT-FI.
PRODUCT REVENUES AND PRODUCTION COSTS
We believe unit net cash costs (credits) per pound of copper and molybdenum are measures that provide investors with information about the cash-generating capacity of our mining operations expressed on a basis relating to the primary metal product for the respective operations. We use these measures for the same purpose and for monitoring operating performance by our mining operations. This information differs from measures of performance determined in accordance with U.S. GAAP and should not be considered in isolation or as a substitute for measures of performance determined in accordance with U.S. GAAP. These measures are presented by other metals mining companies, although our measures may not be comparable to similarly titled measures reported by other companies.
We present gross profit per pound of copper in the following tables using both a “by-product” method and a “co-product” method. We use the by-product method in our presentation of gross profit per pound of copper because (i) the majority of our revenues are copper revenues, (ii) we mine ore, which contains copper, gold, molybdenum and other metals, (iii) it is not possible to specifically assign all of our costs to revenues from the copper, gold, molybdenum and other metals we produce and (iv) it is the method used by our management and Board to monitor our mining operations and to compare mining operations in certain industry publications. In the co-product method presentations, shared costs are allocated to the different products based on their relative revenue values, which will vary to the extent our metals sales volumes and realized prices change.
We show revenue adjustments for prior period open sales as a separate line item. Because these adjustments do not result from current period sales, these amounts have been reflected separately from revenues on current period sales. Noncash and other costs, net which are removed from site production and delivery costs in the calculation of unit net cash costs, consist of items such as accretion of AROs, inventory write-offs and adjustments, stock-based compensation costs, long-lived asset impairments, idle facility costs, feasibility and optimization study costs, restructuring and/or unusual charges. As discussed above, gold, molybdenum and other metal revenues at copper mines are reflected as credits against site production and delivery costs in the by-product method. The following schedules are presentations under both the by-product and co-product methods together with reconciliations to amounts reported in our consolidated financial statements.
North America Copper Mines Product Revenues, Production Costs and Unit Net Cash Costs
| | | | | Three Months Ended September 30, 2023 | | | | | |
| (In Millions) | | By-Product | | Co-Product Method | |
| Three Months Ended March 31, 2024 | |
| | Method | | Copper | | Molybdenuma | | Otherb | | Total | |
| | Three Months Ended March 31, 2024 | |
| | Three Months Ended March 31, 2024 | |
| (In millions) | |
| (In millions) | |
| (In millions) | |
| | Method | |
| | Method | |
| | Method | |
| Revenues, excluding adjustments | |
| Revenues, excluding adjustments | |
| Revenues, excluding adjustments | Revenues, excluding adjustments | | $ | 1,435 | | | $ | 1,435 | | | $ | 164 | | | $ | 43 | | | $ | 1,642 | | |
Site production and delivery, before net noncash
and other costs shown below | Site production and delivery, before net noncash
and other costs shown below | | 1,121 | | | 1,008 | | | 129 | | | 35 | | | 1,172 | | |
Site production and delivery, before net noncash
and other costs shown below | |
Site production and delivery, before net noncash
and other costs shown below | |
| By-product credits | |
| By-product credits | |
| By-product credits | By-product credits | | (156) | | | — | | | — | | | — | | | — | | |
| Treatment charges | Treatment charges | | 39 | | | 37 | | | — | | | 2 | | | 39 | | |
| Treatment charges | |
| Treatment charges | |
| Net cash costs | |
| Net cash costs | |
| Net cash costs | Net cash costs | | 1,004 | | | 1,045 | | | 129 | | | 37 | | | 1,211 | | |
| DD&A | DD&A | | 110 | | | 99 | | | 10 | | | 1 | | | 110 | | |
| Metals inventory adjustments | | 4 | | | 4 | | | — | | | — | | | 4 | | |
| DD&A | |
| DD&A | |
| | Noncash and other costs, net | |
| | Noncash and other costs, net | |
| | Noncash and other costs, net | Noncash and other costs, net | | 49 | | c | 44 | | | 4 | | | 1 | | | 49 | | |
| Total costs | Total costs | | 1,167 | | | 1,192 | | | 143 | | | 39 | | | 1,374 | | |
Other revenue adjustments, primarily for pricing
on prior period open sales | | 1 | | | 1 | | | — | | | — | | | 1 | | |
| Total costs | |
| Total costs | |
| | Gross profit | |
| | Gross profit | |
| | Gross profit | Gross profit | | $ | 269 | | | $ | 244 | | | $ | 21 | | | $ | 4 | | | $ | 269 | | |
| | Copper sales (millions of recoverable pounds) | Copper sales (millions of recoverable pounds) | | 372 | | | 372 | | |
| | Copper sales (millions of recoverable pounds) | |
| | Copper sales (millions of recoverable pounds) | |
Molybdenum sales (millions of recoverable pounds)a | |
Molybdenum sales (millions of recoverable pounds)a | |
Molybdenum sales (millions of recoverable pounds)a | Molybdenum sales (millions of recoverable pounds)a | | 7 | | |
| | Gross profit per pound of copper/molybdenum: | Gross profit per pound of copper/molybdenum: | |
| | Gross profit per pound of copper/molybdenum: | |
| | Gross profit per pound of copper/molybdenum: | |
| | Revenues, excluding adjustments | |
| | Revenues, excluding adjustments | |
| | Revenues, excluding adjustments | Revenues, excluding adjustments | | $ | 3.86 | | | $ | 3.86 | | | $ | 22.01 | | |
Site production and delivery, before net noncash
and other costs shown below | Site production and delivery, before net noncash
and other costs shown below | | 3.01 | | | 2.71 | | | 17.35 | | |
Site production and delivery, before net noncash
and other costs shown below | |
Site production and delivery, before net noncash
and other costs shown below | |
| By-product credits | |
| By-product credits | |
| By-product credits | By-product credits | | (0.41) | | | — | | | — | | |
| Treatment charges | Treatment charges | | 0.10 | | | 0.10 | | | — | | |
| Treatment charges | |
| Treatment charges | |
| Unit net cash costs | |
| Unit net cash costs | |
| Unit net cash costs | Unit net cash costs | | 2.70 | | | 2.81 | | | 17.35 | | |
| DD&A | DD&A | | 0.30 | | | 0.26 | | | 1.33 | | |
| Metals inventory adjustments | | 0.01 | | | 0.01 | | | — | | |
| DD&A | |
| DD&A | |
| | Noncash and other costs, net | |
| | Noncash and other costs, net | |
| | Noncash and other costs, net | Noncash and other costs, net | | 0.13 | | c | 0.12 | | | 0.47 | | |
| Total unit costs | Total unit costs | | 3.14 | | | 3.20 | | | 19.15 | | |
Other revenue adjustments, primarily for pricing
on prior period open sales | | — | | | — | | | — | | |
| Total unit costs | |
| Total unit costs | |
| | Gross profit per pound | |
| | Gross profit per pound | |
| | Gross profit per pound | Gross profit per pound | | $ | 0.72 | | | $ | 0.66 | | | $ | 2.86 | | |
| | Reconciliation to Amounts Reported | Reconciliation to Amounts Reported | | | | | | | | | |
| | | |
| Reconciliation to Amounts Reported | |
| | Revenues | | Production and Delivery | | DD&A | | Metals Inventory Adjustments | |
| Reconciliation to Amounts Reported | |
| | | | | | | | | | | |
| | | | | | | | | | | |
| | | | | | | | | | | |
| | Revenues | |
| | Revenues | |
| | Revenues | |
| Totals presented above | |
| Totals presented above | |
| Totals presented above | Totals presented above | | $ | 1,642 | | | $ | 1,172 | | | $ | 110 | | | $ | 4 | | |
| Treatment charges | Treatment charges | | — | | | 39 | | | — | | | — | | | | |
| Treatment charges | |
| Treatment charges | |
| Noncash and other costs, net | Noncash and other costs, net | | — | | | 49 | | | — | | | — | | |
Other revenue adjustments, primarily for pricing
on prior period open sales | | 1 | | | — | | | — | | | — | | |
| Noncash and other costs, net | |
| Noncash and other costs, net | |
| | Eliminations and other | |
| | Eliminations and other | |
| | Eliminations and other | Eliminations and other | | 14 | | | 15 | | | — | | | — | | |
| North America copper mines | North America copper mines | | 1,657 | | | 1,275 | | | 110 | | | 4 | | |
| North America copper mines | |
| North America copper mines | |
Other miningd | |
Other miningd | |
Other miningd | Other miningd | | 5,764 | | | 3,859 | | | 405 | | | 1 | | |
| | Corporate, other & eliminations | Corporate, other & eliminations | | (1,597) | | | (1,586) | | | 18 | | | — | | |
| | Corporate, other & eliminations | |
| | Corporate, other & eliminations | |
| As reported in our consolidated financial statements | |
| As reported in our consolidated financial statements | |
| As reported in our consolidated financial statements | As reported in our consolidated financial statements | | $ | 5,824 | | | $ | 3,548 | | | $ | 533 | | | $ | 5 | | |
|
a.Reflects sales of molybdenum produced by certain of the North America copper mines to our molybdenum sales company at market-based pricing.
b.Includes gold and silver product revenues and production costs.
c.Includes charges totaling $28$15 million ($0.080.05 per pound of copper) for feasibility and optimization studies.
d.Represents the combined total for our other segments as presented in Note 9.
North America Copper Mines Product Revenues, Production Costs and Unit Net Cash Costs
| | | Three Months Ended September 30, 2022 | | | | | |
| (In Millions) | | By-Product | | Co-Product Method | |
| Three Months Ended March 31, 2023 | |
| Three Months Ended March 31, 2023 | |
| Three Months Ended March 31, 2023 | |
| (In millions) | |
| (In millions) | |
| (In millions) | |
| | Method | |
| | Method | |
| | Method | |
| Revenues, excluding adjustments | |
| Revenues, excluding adjustments | |
| Revenues, excluding adjustments | |
Site production and delivery, before net noncash
and other costs shown below | |
Site production and delivery, before net noncash
and other costs shown below | |
Site production and delivery, before net noncash
and other costs shown below | |
| By-product credits | |
| By-product credits | |
| By-product credits | |
| Treatment charges | |
| Treatment charges | |
| Treatment charges | |
| Net cash costs | |
| Net cash costs | |
| Net cash costs | |
| DD&A | |
| DD&A | |
| DD&A | |
| | Noncash and other costs, net | |
| | Noncash and other costs, net | |
| | Noncash and other costs, net | |
| Total costs | |
| Total costs | |
| Total costs | |
Other revenue adjustments, primarily for pricing
on prior period open sales | |
Other revenue adjustments, primarily for pricing
on prior period open sales | |
Other revenue adjustments, primarily for pricing
on prior period open sales | |
| Gross profit | |
| Gross profit | |
| Gross profit | |
| | Copper sales (millions of recoverable pounds) | |
| | Copper sales (millions of recoverable pounds) | |
| | Copper sales (millions of recoverable pounds) | |
Molybdenum sales (millions of recoverable pounds)a | |
Molybdenum sales (millions of recoverable pounds)a | |
Molybdenum sales (millions of recoverable pounds)a | |
| | Gross profit per pound of copper/molybdenum: | |
| | Gross profit per pound of copper/molybdenum: | |
| | Gross profit per pound of copper/molybdenum: | |
| | Revenues, excluding adjustments | |
| | Revenues, excluding adjustments | |
| | Method | | Copper | | Molybdenuma | | Otherb | | Total | |
| Revenues, excluding adjustments | Revenues, excluding adjustments | | $ | 1,293 | | | $ | 1,293 | | | $ | 111 | | | $ | 38 | | | $ | 1,442 | | |
Site production and delivery, before net noncash
and other costs shown below | Site production and delivery, before net noncash
and other costs shown below | | 1,000 | | | 908 | | | 104 | | | 31 | | | 1,043 | | |
Site production and delivery, before net noncash
and other costs shown below | |
Site production and delivery, before net noncash
and other costs shown below | |
| By-product credits | |
| By-product credits | |
| By-product credits | By-product credits | | (106) | | | — | | | — | | | — | | | — | | |
| Treatment charges | Treatment charges | | 35 | | | 33 | | | — | | | 2 | | | 35 | | |
| Net cash costs | | 929 | | | 941 | | | 104 | | | 33 | | | 1,078 | | |
| DD&A | | 99 | | | 91 | | | 6 | | | 2 | | | 99 | | |
| Metals inventory adjustments | | 3 | | | 3 | | | — | | | — | | | 3 | | |
| Noncash and other costs, net | | 38 | | c | 33 | | | 4 | | | 1 | | | 38 | | |
| Total costs | | 1,069 | | | 1,068 | | | 114 | | | 36 | | | 1,218 | | |
Other revenue adjustments, primarily for pricing
on prior period open sales | | (20) | | | (20) | | | — | | | — | | | (20) | | |
| Gross profit (loss) | | $ | 204 | | | $ | 205 | | | $ | (3) | | | $ | 2 | | | $ | 204 | | |
| | Copper sales (millions of recoverable pounds) | | 361 | | | 361 | | |
Molybdenum sales (millions of recoverable pounds)a | | 7 | | |
| | Gross profit (loss) per pound of copper/molybdenum: | |
| | Revenues, excluding adjustments | | $ | 3.57 | | | $ | 3.57 | | | $ | 16.75 | | |
Site production and delivery, before net noncash
and other costs shown below | | 2.76 | | | 2.51 | | | 15.60 | | |
| By-product credits | | (0.30) | | | — | | | — | | |
| Treatment charges | |
| Treatment charges | Treatment charges | | 0.10 | | | 0.09 | | | — | | |
| Unit net cash costs | Unit net cash costs | | 2.56 | | | 2.60 | | | 15.60 | | |
| Unit net cash costs | |
| Unit net cash costs | |
| DD&A | DD&A | | 0.28 | | | 0.25 | | | 0.95 | | |
| Metals inventory adjustments | | 0.01 | | | 0.01 | | | — | | |
| DD&A | |
| DD&A | |
| | Noncash and other costs, net | |
| | Noncash and other costs, net | |
| | Noncash and other costs, net | Noncash and other costs, net | | 0.10 | | c | 0.09 | | | 0.60 | | |
| Total unit costs | Total unit costs | | 2.95 | | | 2.95 | | | 17.15 | | |
| Total unit costs | |
| Total unit costs | |
Other revenue adjustments, primarily for pricing
on prior period open sales | Other revenue adjustments, primarily for pricing
on prior period open sales | | (0.06) | | | (0.06) | | | — | | |
| Gross profit (loss) per pound | | $ | 0.56 | | | $ | 0.56 | | | $ | (0.40) | | |
Other revenue adjustments, primarily for pricing
on prior period open sales | |
Other revenue adjustments, primarily for pricing
on prior period open sales | |
| Gross profit per pound | |
| Gross profit per pound | |
| Gross profit per pound | |
| | Reconciliation to Amounts Reported | Reconciliation to Amounts Reported | | | | | | | | | | | |
| | Revenues | | Production and Delivery | | DD&A | | Metals Inventory Adjustments | | | |
| Reconciliation to Amounts Reported | |
| | Reconciliation to Amounts Reported | |
| | Revenues | |
| | Revenues | |
| | Revenues | |
| Totals presented above | |
| Totals presented above | |
| Totals presented above | Totals presented above | | $ | 1,442 | | | $ | 1,043 | | | $ | 99 | | | $ | 3 | | | | |
| Treatment charges | Treatment charges | | (6) | | | 29 | | | — | | | — | | | | |
| Treatment charges | |
| Treatment charges | |
| Noncash and other costs, net | |
| Noncash and other costs, net | |
| Noncash and other costs, net | Noncash and other costs, net | | — | | | 38 | | | — | | | — | | | | |
Other revenue adjustments, primarily for pricing
on prior period open sales | Other revenue adjustments, primarily for pricing
on prior period open sales | | (20) | | | — | | | — | | | — | | | | |
Other revenue adjustments, primarily for pricing
on prior period open sales | |
Other revenue adjustments, primarily for pricing
on prior period open sales | |
| Eliminations and other | |
| Eliminations and other | |
| Eliminations and other | Eliminations and other | | 32 | | | 34 | | | 1 | | | — | | | | |
| North America copper mines | North America copper mines | | 1,448 | | | 1,144 | | | 100 | | | 3 | | | | |
| North America copper mines | |
| North America copper mines | |
Other miningd | |
Other miningd | |
Other miningd | Other miningd | | 4,941 | | | 3,611 | | | 390 | | | 22 | | |
| | Corporate, other & eliminations | Corporate, other & eliminations | | (1,386) | | | (1,389) | | | 18 | | | — | | | | |
| | Corporate, other & eliminations | |
| | Corporate, other & eliminations | |
| As reported in our consolidated financial statements | |
| As reported in our consolidated financial statements | |
| As reported in our consolidated financial statements | As reported in our consolidated financial statements | | $ | 5,003 | | | $ | 3,366 | | | $ | 508 | | | $ | 25 | | | | |
|
a.Reflects sales of molybdenum produced by certain of the North America copper mines to our molybdenum sales company at market-based pricing.
b.Includes gold and silver product revenues and production costs.
c.Includes charges totaling $20$27 million ($0.060.08 per pound of copper) for feasibility and optimization studies.studies and $16 million ($0.05 per pound of copper) related to asset impairments.
d.Represents the combined total for our other segments as presented in Note 9.
North America Copper Mines Product Revenues, Production Costs and Unit Net Cash Costs
| | | | | | | | | | | | | | | | | | | | | | | | | | | | | | | | | | | |
| | | | | |
| Nine Months Ended September 30, 2023 | | | | | |
| (In Millions) | | By-Product | | Co-Product Method | |
| | Method | | Copper | | Molybdenuma | | Otherb | | Total | |
| Revenues, excluding adjustments | | $ | 4,159 | | | $ | 4,159 | | | $ | 576 | | | $ | 129 | | | $ | 4,864 | | |
Site production and delivery, before net noncash
and other costs shown below | | 3,097 | | | 2,729 | | | 417 | | | 113 | | | 3,259 | | |
| By-product credits | | (543) | | | — | | | — | | | — | | | — | | |
| Treatment charges | | 126 | | | 120 | | | — | | | 6 | | | 126 | | |
| Net cash costs | | 2,680 | | | 2,849 | | | 417 | | | 119 | | | 3,385 | | |
| DD&A | | 312 | | | 276 | | | 30 | | | 6 | | | 312 | | |
| Metals inventory adjustments | | 5 | | | 5 | | | — | | | — | | | 5 | | |
| Noncash and other costs, net | | 175 | | c | 152 | | | 20 | | | 3 | | | 175 | | |
| Total costs | | 3,172 | | | 3,282 | | | 467 | | | 128 | | | 3,877 | | |
Other revenue adjustments, primarily for pricing
on prior period open sales | | 13 | | | 13 | | | — | | | — | | | 13 | | |
| Gross profit | | $ | 1,000 | | | $ | 890 | | | $ | 109 | | | $ | 1 | | | $ | 1,000 | | |
| | | | | | | | | | | |
| Copper sales (millions of recoverable pounds) | | 1,048 | | | 1,048 | | | | | | | | |
Molybdenum sales (millions of recoverable pounds)a | | | | | | 23 | | | | | | |
| | | | | | | | | | | |
| Gross profit per pound of copper/molybdenum: | | | | | | | |
| | | | | | | | | | | |
| Revenues, excluding adjustments | | $ | 3.97 | | | $ | 3.97 | | | $ | 24.41 | | | | | | |
Site production and delivery, before net noncash
and other costs shown below | | 2.96 | | | 2.60 | | | 17.66 | | | | | | |
| By-product credits | | (0.52) | | | — | | | — | | | | | | |
| Treatment charges | | 0.12 | | | 0.12 | | | — | | | | | | |
| Unit net cash costs | | 2.56 | | | 2.72 | | | 17.66 | | | | | | |
| DD&A | | 0.30 | | | 0.26 | | | 1.27 | | | | | | |
| Metals inventory adjustments | | 0.01 | | | 0.01 | | | — | | | | | | |
| Noncash and other costs, net | | 0.16 | | c | 0.14 | | | 0.87 | | | | | | |
| Total unit costs | | 3.03 | | | 3.13 | | | 19.80 | | | | | | |
Other revenue adjustments, primarily for pricing
on prior period open sales | | 0.01 | | | 0.01 | | | — | | | | | | |
| Gross profit per pound | | $ | 0.95 | | | $ | 0.85 | | | $ | 4.61 | | | | | | |
| | | | | | | | | | | |
| Reconciliation to Amounts Reported | | | | | | | | | |
| | | | | | | | Metals | | | |
| | | | Production | | | | Inventory | | | |
| | Revenues | | and Delivery | | DD&A | | Adjustments | | | |
| Totals presented above | | $ | 4,864 | | | $ | 3,259 | | | $ | 312 | | | $ | 5 | | | | |
| Treatment charges | | (9) | | | 117 | | | — | | | — | | | | |
| Noncash and other costs, net | | — | | | 175 | | | — | | | — | | | | |
Other revenue adjustments, primarily for pricing
on prior period open sales | | 13 | | | — | | | — | | | — | | | | |
| Eliminations and other | | 49 | | | 52 | | | — | | | — | | | | |
| North America copper mines | | 4,917 | | | 3,603 | | | 312 | | | 5 | | | | |
Other miningd | | 16,832 | | | 11,294 | | | 1,117 | | | 1 | | | | |
| | | | | | | | | | | |
| | | | | | | | | | | |
| Corporate, other & eliminations | | (4,799) | | | (4,637) | | | 50 | | | 1 | | | | |
| As reported in our consolidated financial statements | | $ | 16,950 | | | $ | 10,260 | | | $ | 1,479 | | | $ | 7 | | | | |
| | | | | | | | | | | |
a.Reflects sales of molybdenum produced by certain of the North America copper mines to our molybdenum sales company at market-based pricing.
b.Includes gold and silver product revenues and production costs.
c.Includes charges totaling $81 million ($0.08 per pound of copper) for feasibility and optimization studies.
d.Represents the combined total for our other mining operations as presented in Note 9.
North America Copper Mines Product Revenues, Production Costs and Unit Net Cash Costs
| | | | | | | | | | | | | | | | | | | | | | | | | | | | | | | | | | | |
| | | | | |
| Nine Months Ended September 30, 2022 | | | | | |
| (In Millions) | | By-Product | | Co-Product Method | |
| | Method | | Copper | | Molybdenuma | | Otherb | | Total | |
| Revenues, excluding adjustments | | $ | 4,720 | |
| $ | 4,720 | | | $ | 393 | | | $ | 95 | | | $ | 5,208 | | |
Site production and delivery, before net noncash
and other costs shown below | | 2,882 | | | 2,643 | | | 283 | | | 70 | | | 2,996 | | |
| By-product credits | | (374) | | | — | | | — | | | — | | | — | | |
| Treatment charges | | 112 | | | 109 | | | — | | | 3 | | | 112 | | |
| Net cash costs | | 2,620 | | | 2,752 | | | 283 | | | 73 | | | 3,108 | | |
| DD&A | | 306 | | | 282 | | | 19 | | | 5 | | | 306 | | |
| Metals inventory adjustments | | 10 | | | 9 | | | 1 | | | — | | | 10 | | |
| Noncash and other costs, net | | 104 | | c | 94 | | | 8 | | | 2 | | | 104 | | |
| Total costs | | 3,040 | | | 3,137 | | | 311 | | | 80 | | | 3,528 | | |
Other revenue adjustments, primarily for pricing
on prior period open sales | | (13) | | | (13) | | | — | | | — | | | (13) | | |
| Gross profit | | $ | 1,667 | | | $ | 1,570 | | | $ | 82 | | | $ | 15 | | | $ | 1,667 | | |
| | | | | | | | | | | |
| Copper sales (millions of recoverable pounds) | | 1,131 | | | 1,131 | | | | | | | | |
Molybdenum sales (millions of recoverable pounds)a | | | | | | 22 | | | | | | |
| | | | | | | | | | | |
| Gross profit per pound of copper/molybdenum: | | | | | | | |
| | | | | | | | | | | |
| Revenues, excluding adjustments | | $ | 4.17 | |
| $ | 4.17 | | | $ | 17.87 | | | | | | |
Site production and delivery, before net noncash
and other costs shown below | | 2.54 | | | 2.33 | | | 12.87 | | | | | | |
| By-product credits | | (0.33) | | | — | | | — | | | | | | |
| Treatment charges | | 0.10 | | | 0.10 | | | — | | | | | | |
| Unit net cash costs | | 2.31 | | | 2.43 | | | 12.87 | | | | | | |
| DD&A | | 0.27 | | | 0.25 | | | 0.88 | | | | | | |
| Metals inventory adjustments | | 0.01 | | | 0.01 | | | — | | | | | | |
| Noncash and other costs, net | | 0.09 | | c | 0.08 | | | 0.40 | | | | | | |
| Total unit costs | | 2.68 | | | 2.77 | | | 14.15 | | | | | | |
Other revenue adjustments, primarily for pricing
on prior period open sales | | (0.01) | | | (0.01) | | | — | | | | | | |
| Gross profit per pound | | $ | 1.48 | | | $ | 1.39 | | | $ | 3.72 | | | | | | |
| | | | | | | | | | | |
| Reconciliation to Amounts Reported | | | | | | | | | |
| | | | | | | | Metals | | | |
| | | | Production | | | | Inventory | | | |
| | Revenues | | and Delivery | | DD&A | | Adjustments | | | |
| Totals presented above | | $ | 5,208 | | | $ | 2,996 | | | $ | 306 | | | $ | 10 | | | | |
| Treatment charges | | (15) | | | 97 | | | — | | | — | | | | |
| Noncash and other costs, net | | — | | | 104 | | | — | | | — | | | | |
Other revenue adjustments, primarily for pricing
on prior period open sales | | (13) | | | — | | | — | | | — | | | | |
| Eliminations and other | | 74 | | | 82 | | | 1 | | | — | | | | |
| North America copper mines | | 5,254 | | | 3,279 | | | 307 | | | 10 | | | | |
Other miningd | | 16,649 | | | 11,072 | | | 1,147 | | | 33 | | | | |
| | | | | | | | | | | |
| | | | | | | | | | | |
| Corporate, other & eliminations | | (4,881) | | | (4,832) | | | 50 | | | — | | | | |
| As reported in our consolidated financial statements | | $ | 17,022 | | | $ | 9,519 | | | $ | 1,504 | | | $ | 43 | | | | |
| | | | | | | | | | | |
a.Reflects sales of molybdenum produced by certain of the North America copper mines to our molybdenum sales company at market-based pricing.
b.Includes gold and silver product revenues and production costs.
c.Includes charges totaling $49 million ($0.04 per pound of copper) for feasibility and optimization studies.
d.Represents the combined total for our other mining operations as presented in Note 9.
South America MiningOperations Product Revenues, Production Costs and Unit Net Cash Costs
| | | | Three Months Ended September 30, 2023 | | | |
| (In Millions) | | By-Product | | Co-Product Method | |
| Three Months Ended March 31, 2024 | |
| | Method | | Copper | | Othera | | Total | |
| | Three Months Ended March 31, 2024 | |
| | Three Months Ended March 31, 2024 | |
| (In millions) | |
| (In millions) | |
| (In millions) | |
| | Method | |
| | Method | |
| | Method | |
| Revenues, excluding adjustments | |
| Revenues, excluding adjustments | |
| Revenues, excluding adjustments | Revenues, excluding adjustments | | $ | 1,159 | | | $ | 1,159 | | | $ | 145 | | | $ | 1,304 | | |
Site production and delivery, before net noncash
and other costs shown below | Site production and delivery, before net noncash
and other costs shown below | | 790 | | | 712 | | | 93 | | | 805 | | |
Site production and delivery, before net noncash
and other costs shown below | |
Site production and delivery, before net noncash
and other costs shown below | |
| By-product credits | |
| By-product credits | |
| By-product credits | By-product credits | | (130) | | | — | | | — | | | — | | |
| Treatment charges | Treatment charges | | 61 | | | 61 | | | — | | | 61 | | |
| Treatment charges | |
| Treatment charges | |
| Royalty on metals | |
| Royalty on metals | |
| Royalty on metals | Royalty on metals | | 2 | | | 2 | | | — | | | 2 | | |
| Net cash costs | Net cash costs | | 723 | | | 775 | | | 93 | | | 868 | | |
| Net cash costs | |
| Net cash costs | |
| DD&A | DD&A | | 110 | | | 98 | | | 12 | | | 110 | | |
| Metals inventory adjustments | | 1 | | | 1 | | | — | | | 1 | | |
| DD&A | |
| DD&A | |
| | Noncash and other costs, net | |
| | Noncash and other costs, net | |
| | Noncash and other costs, net | Noncash and other costs, net | | 21 | | b | 20 | | | 1 | | | 21 | | |
| Total costs | Total costs | | 855 | | | 894 | | | 106 | | | 1,000 | | |
| Total costs | |
| Total costs | |
Other revenue adjustments, primarily for pricing
on prior period open sales | |
Other revenue adjustments, primarily for pricing
on prior period open sales | |
Other revenue adjustments, primarily for pricing
on prior period open sales | Other revenue adjustments, primarily for pricing
on prior period open sales | | 2 | | | 2 | | | — | | | 2 | | |
| Gross profit | Gross profit | | $ | 306 | | | $ | 267 | | | $ | 39 | | | $ | 306 | | |
| Gross profit | |
| Gross profit | |
| | Copper sales (millions of recoverable pounds) | |
| | Copper sales (millions of recoverable pounds) | |
| | Copper sales (millions of recoverable pounds) | Copper sales (millions of recoverable pounds) | | 307 | | | 307 | | |
| | Gross profit per pound of copper: | Gross profit per pound of copper: | |
| | Gross profit per pound of copper: | |
| | Gross profit per pound of copper: | |
| | Revenues, excluding adjustments | |
| | Revenues, excluding adjustments | |
| | Revenues, excluding adjustments | Revenues, excluding adjustments | | $ | 3.77 | | | $ | 3.77 | | |
Site production and delivery, before net noncash
and other costs shown below | Site production and delivery, before net noncash
and other costs shown below | | 2.57 | |
| 2.32 | | |
Site production and delivery, before net noncash
and other costs shown below | |
Site production and delivery, before net noncash
and other costs shown below | |
| By-product credits | |
| By-product credits | |
| By-product credits | By-product credits | | (0.42) | | | — | | |
| Treatment charges | Treatment charges | | 0.19 | | | 0.19 | | |
| Treatment charges | |
| Treatment charges | |
| Royalty on metals | |
| Royalty on metals | |
| Royalty on metals | Royalty on metals | | 0.01 | | | 0.01 | | |
| Unit net cash costs | Unit net cash costs | | 2.35 | | | 2.52 | | |
| Unit net cash costs | |
| Unit net cash costs | |
| DD&A | DD&A | | 0.36 | | | 0.32 | | |
| Metals inventory adjustments | | — | | | — | | |
| DD&A | |
| DD&A | |
| | Noncash and other costs, net | |
| | Noncash and other costs, net | |
| | Noncash and other costs, net | Noncash and other costs, net | | 0.07 | | b | 0.07 | | |
| Total unit costs | Total unit costs | | 2.78 | | | 2.91 | | |
| Total unit costs | |
| Total unit costs | |
Other revenue adjustments, primarily for pricing
on prior period open sales | Other revenue adjustments, primarily for pricing
on prior period open sales | | 0.01 | | | 0.01 | | |
Other revenue adjustments, primarily for pricing
on prior period open sales | |
Other revenue adjustments, primarily for pricing
on prior period open sales | |
| Gross profit per pound | |
| Gross profit per pound | |
| Gross profit per pound | Gross profit per pound | | $ | 1.00 | | | $ | 0.87 | | |
| | Reconciliation to Amounts Reported | Reconciliation to Amounts Reported | | Metals | |
| | Production | | Inventory | |
| Reconciliation to Amounts Reported | |
| | Revenues | | and Delivery | | DD&A | | Adjustments | |
| Reconciliation to Amounts Reported | |
| | | | Production | |
| | | | Production | |
| | | | Production | |
| | Revenues | |
| | Revenues | |
| | Revenues | |
| Totals presented above | |
| Totals presented above | |
| Totals presented above | Totals presented above | | $ | 1,304 | | | $ | 805 | | | $ | 110 | | | $ | 1 | | |
| Treatment charges | Treatment charges | | (61) | | | — | | | — | | | — | | |
| Treatment charges | |
| Treatment charges | |
| Royalty on metals | |
| Royalty on metals | |
| Royalty on metals | Royalty on metals | | (2) | | | — | | | — | | | — | | |
| Noncash and other costs, net | Noncash and other costs, net | | — | | | 21 | | | — | | | — | | |
| Noncash and other costs, net | |
| Noncash and other costs, net | |
Other revenue adjustments, primarily for pricing
on prior period open sales | |
Other revenue adjustments, primarily for pricing
on prior period open sales | |
Other revenue adjustments, primarily for pricing
on prior period open sales | Other revenue adjustments, primarily for pricing
on prior period open sales | | 2 | | | — | | | — | | | — | | |
| Eliminations and other | Eliminations and other | | 1 | | | — | | | 1 | | | — | | |
| South America mining | | 1,244 | | | 826 | | | 111 | | | 1 | | |
| Eliminations and other | |
| Eliminations and other | |
| South America operations | |
| South America operations | |
| South America operations | |
Other miningc | |
Other miningc | |
Other miningc | Other miningc | | 6,177 | | | 4,308 | | | 404 | | | 4 | | |
| | Corporate, other & eliminations | Corporate, other & eliminations | | (1,597) | | | (1,586) | | | 18 | | | — | | |
| | Corporate, other & eliminations | |
| | Corporate, other & eliminations | |
| As reported in our consolidated financial statements | |
| As reported in our consolidated financial statements | |
| As reported in our consolidated financial statements | As reported in our consolidated financial statements | | $ | 5,824 | | | $ | 3,548 | | | $ | 533 | | | $ | 5 | | |
|
a.Includes silver sales of 1.10.8 million ounces ($23.3124.45 per ounce average realized price). Also reflects sales of molybdenum produced by Cerro Verde to our molybdenum sales company at market-based pricing.
b.Includes charges totaling $11 million ($0.030.04 per pound of copper) for feasibility studies.
c.Represents the combined total for our other segments as presented in Note 9.
South America MiningOperations Product Revenues, Production Costs and Unit Net Cash Costs
| | | | | Three Months Ended September 30, 2022 | | | |
| (In Millions) | | By-Product | | Co-Product Method | |
| Three Months Ended March 31, 2023 | |
| | Method | | Copper | | Othera | | Total | |
| | Three Months Ended March 31, 2023 | |
| | Three Months Ended March 31, 2023 | |
| (In millions) | |
| (In millions) | |
| (In millions) | |
| | Method | |
| | Method | |
| | Method | |
| Revenues, excluding adjustments | |
| Revenues, excluding adjustments | |
| Revenues, excluding adjustments | Revenues, excluding adjustments | | $ | 1,017 | | | $ | 1,017 | | | $ | 62 | | | $ | 1,079 | | |
Site production and delivery, before net noncash
and other costs shown below | Site production and delivery, before net noncash
and other costs shown below | | 761 | | | 723 | | | 52 | | | 775 | | |
Site production and delivery, before net noncash
and other costs shown below | |
Site production and delivery, before net noncash
and other costs shown below | |
| By-product credits | |
| By-product credits | |
| By-product credits | By-product credits | | (48) | | | — | | | — | | | — | | |
| Treatment charges | Treatment charges | | 40 | | | 40 | | | — | | | 40 | | |
| Treatment charges | |
| Treatment charges | |
| Royalty on metals | |
| Royalty on metals | |
| Royalty on metals | Royalty on metals | | 2 | | | 2 | | | — | | | 2 | | |
| Net cash costs | Net cash costs | | 755 | | | 765 | | | 52 | | | 817 | | |
| Net cash costs | |
| Net cash costs | |
| DD&A | DD&A | | 99 | | | 93 | | | 6 | | | 99 | | |
| Metals inventory adjustments | | 22 | | | 22 | | | — | | | 22 | | |
| DD&A | |
| DD&A | |
| | Noncash and other costs, net | |
| | Noncash and other costs, net | |
| | Noncash and other costs, net | Noncash and other costs, net | | 25 | | | 23 | | | 2 | | | 25 | | |
| Total costs | Total costs | | 901 | | | 903 | | | 60 | | | 963 | | |
| Total costs | |
| Total costs | |
Other revenue adjustments, primarily for pricing
on prior period open sales | |
Other revenue adjustments, primarily for pricing
on prior period open sales | |
Other revenue adjustments, primarily for pricing
on prior period open sales | Other revenue adjustments, primarily for pricing
on prior period open sales | | (73) | | | (73) | | | — | | | (73) | | |
| Gross profit | Gross profit | | $ | 43 | | | $ | 41 | | | $ | 2 | | | $ | 43 | | |
| Gross profit | |
| Gross profit | |
| | Copper sales (millions of recoverable pounds) | |
| | Copper sales (millions of recoverable pounds) | |
| | Copper sales (millions of recoverable pounds) | Copper sales (millions of recoverable pounds) | | 293 | | | 293 | | |
| | Gross profit per pound of copper: | Gross profit per pound of copper: | |
| | Gross profit per pound of copper: | |
| | Gross profit per pound of copper: | |
| | Revenues, excluding adjustments | |
| | Revenues, excluding adjustments | |
| | Revenues, excluding adjustments | Revenues, excluding adjustments | | $ | 3.47 | | | $ | 3.47 | | |
Site production and delivery, before net noncash
and other costs shown below | Site production and delivery, before net noncash
and other costs shown below | | 2.60 | | | 2.47 | | |
Site production and delivery, before net noncash
and other costs shown below | |
Site production and delivery, before net noncash
and other costs shown below | |
| By-product credits | |
| By-product credits | |
| By-product credits | By-product credits | | (0.16) | | | — | | |
| Treatment charges | Treatment charges | | 0.13 | | | 0.14 | | |
| Treatment charges | |
| Treatment charges | |
| Royalty on metals | |
| Royalty on metals | |
| Royalty on metals | Royalty on metals | | 0.01 | | | — | | |
| Unit net cash costs | Unit net cash costs | | 2.58 | | | 2.61 | | |
| Unit net cash costs | |
| Unit net cash costs | |
| DD&A | DD&A | | 0.34 | | | 0.32 | | |
| Metals inventory adjustments | | 0.07 | | | 0.07 | | |
| DD&A | |
| DD&A | |
| | Noncash and other costs, net | |
| | Noncash and other costs, net | |
| | Noncash and other costs, net | Noncash and other costs, net | | 0.09 | | | 0.08 | | |
| Total unit costs | Total unit costs | | 3.08 | | | 3.08 | | |
| Total unit costs | |
| Total unit costs | |
Other revenue adjustments, primarily for pricing
on prior period open sales | Other revenue adjustments, primarily for pricing
on prior period open sales | | (0.25) | | | (0.25) | | |
Other revenue adjustments, primarily for pricing
on prior period open sales | |
Other revenue adjustments, primarily for pricing
on prior period open sales | |
| Gross profit per pound | |
| Gross profit per pound | |
| Gross profit per pound | Gross profit per pound | | $ | 0.14 | | | $ | 0.14 | | |
| | Reconciliation to Amounts Reported | Reconciliation to Amounts Reported | | Metals | |
| | Production | | Inventory | |
| Reconciliation to Amounts Reported | |
| | Revenues | | and Delivery | | DD&A | | Adjustments | |
| Reconciliation to Amounts Reported | |
| | | | Production | |
| | | | Production | |
| | | | Production | |
| | Revenues | |
| | Revenues | |
| | Revenues | |
| Totals presented above | |
| Totals presented above | |
| Totals presented above | Totals presented above | | $ | 1,079 | | | $ | 775 | | | $ | 99 | | | $ | 22 | | |
| Treatment charges | Treatment charges | | (40) | | | — | | | — | | | — | | |
| Treatment charges | |
| Treatment charges | |
| Royalty on metals | |
| Royalty on metals | |
| Royalty on metals | Royalty on metals | | (2) | | | — | | | — | | | — | | |
| Noncash and other costs, net | Noncash and other costs, net | | — | | | 25 | | | — | | | — | | |
| Noncash and other costs, net | |
| Noncash and other costs, net | |
Other revenue adjustments, primarily for pricing
on prior period open sales | |
Other revenue adjustments, primarily for pricing
on prior period open sales | |
Other revenue adjustments, primarily for pricing
on prior period open sales | Other revenue adjustments, primarily for pricing
on prior period open sales | | (73) | | | — | | | — | | | — | | |
| Eliminations and other | Eliminations and other | | — | | | — | | | (1) | | | — | | |
| South America mining | | 964 | | | 800 | | | 98 | | | 22 | | |
Other miningb | | 5,425 | | | 3,955 | | | 392 | | | 3 | | |
| Eliminations and other | |
| Eliminations and other | |
| South America operations | |
| South America operations | |
| South America operations | |
Other miningc | |
Other miningc | |
Other miningc | |
| | Corporate, other & eliminations | |
| | Corporate, other & eliminations | |
| | Corporate, other & eliminations | Corporate, other & eliminations | | (1,386) | | | (1,389) | | | 18 | | | — | | |
| As reported in our consolidated financial statements | As reported in our consolidated financial statements | | $ | 5,003 | | | $ | 3,366 | | | $ | 508 | | | $ | 25 | | |
| As reported in our consolidated financial statements | |
| As reported in our consolidated financial statements | |
|
a.Includes silver sales of 1.11.0 million ounces ($17.11 per ounce average realized price). Also reflects sales of molybdenum produced by Cerro Verde to our molybdenum sales company at market-based pricing.
b.Represents the combined total for our other segments as presented in Note 9.
South America Mining Product Revenues, Production Costs and Unit Net Cash Costs
| | | | | | | | | | | | | | | | | | | | | | | | | | | | | |
| | | | | |
| Nine Months Ended September 30, 2023 | | | | | |
| (In Millions) | | By-Product | | Co-Product Method | |
| | Method | | Copper | | Othera | | Total | |
| Revenues, excluding adjustments | | $ | 3,492 | | | $ | 3,492 | | | $ | 447 | | | $ | 3,939 | | |
Site production and delivery, before net noncash
and other costs shown below | | 2,297 | | | 2,074 | | | 272 | | | 2,346 | | |
| By-product credits | | (401) | | | — | | | — | | | — | | |
| Treatment charges | | 179 | | | 179 | | | — | | | 179 | | |
| Royalty on metals | | 6 | | | 5 | | | 1 | | | 6 | | |
| Net cash costs | | 2,081 | | | 2,258 | | | 273 | | | 2,531 | | |
| DD&A | | 350 | | | 310 | | | 40 | | | 350 | | |
| Metals inventory adjustments | | 1 | | | 1 | | | — | | | 1 | | |
| Noncash and other costs, net | | 71 | | b | 66 | | | 5 | | | 71 | | |
| Total costs | | 2,503 | | | 2,635 | | | 318 | | | 2,953 | | |
Other revenue adjustments, primarily for pricing
on prior period open sales | | 71 | | | 71 | | | 3 | | | 74 | | |
| Gross profit | | $ | 1,060 | | | $ | 928 | | | $ | 132 | | | $ | 1,060 | | |
| | | | | | | | | |
| Copper sales (millions of recoverable pounds) | | 913 | | | 913 | | | | | | |
| | | | | | | | | |
| Gross profit per pound of copper: | | | | | |
| | | | | | | | | |
| Revenues, excluding adjustments | | $ | 3.82 | | | $ | 3.82 | | | | | | |
Site production and delivery, before net noncash
and other costs shown below | | 2.51 | | | 2.26 | | | | | | |
| By-product credits | | (0.44) | | | — | | | | | | |
| Treatment charges | | 0.20 | | | 0.20 | | | | | | |
| Royalty on metals | | 0.01 | | | 0.01 | | | | | | |
| Unit net cash costs | | 2.28 | | | 2.47 | | | | | | |
| DD&A | | 0.38 | | | 0.34 | | | | | | |
| Metals inventory adjustments | | — | | | — | | | | | | |
| Noncash and other costs, net | | 0.08 | | b | 0.07 | | | | | | |
| Total unit costs | | 2.74 | | | 2.88 | | | | | | |
Other revenue adjustments, primarily for pricing
on prior period open sales | | 0.08 | | | 0.08 | | | | | | |
| Gross profit per pound | | $ | 1.16 | | | $ | 1.02 | | | | | | |
| | | | | | | | | |
| Reconciliation to Amounts Reported | | | | | | | | | |
| | | | | | | | Metals | |
| | | | Production | | | | Inventory | |
| | Revenues | | and Delivery | | DD&A | | Adjustments | |
| Totals presented above | | $ | 3,939 | | | $ | 2,346 | | | $ | 350 | | | $ | 1 | | |
| Treatment charges | | (179) | | | — | | | — | | | — | | |
| Royalty on metals | | (6) | | | — | | | — | | | — | | |
| Noncash and other costs, net | | — | | | 71 | | | — | | | — | | |
Other revenue adjustments, primarily for pricing
on prior period open sales | | 74 | | | — | | | — | | | — | | |
| Eliminations and other | | — | | | (1) | | | — | | | — | | |
| South America mining | | 3,828 | | | 2,416 | | | 350 | | | 1 | | |
Other miningc | | 17,921 | | | 12,481 | | | 1,079 | | | 5 | | |
| | | | | | | | | |
| | | | | | | | | |
| Corporate, other & eliminations | | (4,799) | | | (4,637) | | | 50 | | | 1 | | |
| As reported in our consolidated financial statements | | $ | 16,950 | | | $ | 10,260 | | | $ | 1,479 | | | $ | 7 | | |
| | | | | | | | | |
a.Includes silver sales of 3.2 million ounces ($23.5123.41 per ounce average realized price). Also reflects sales of molybdenum produced by Cerro Verde to our molybdenum sales company at market-based pricing.
b.Includes charges totaling $30$9 million ($0.03 per pound of copper) for feasibility studies.
c.Represents the combined total for our other mining operationssegments as presented in Note 9.
South America Mining Product Revenues, Production Costs and Unit Net Cash Costs
| | | | | | | | | | | | | | | | | | | | | | | | | | | | | |
| | | | | |
| Nine Months Ended September 30, 2022 | | | | | |
| (In Millions) | | By-Product | | Co-Product Method | |
| | Method | | Copper | | Othera | | Total | |
| Revenues, excluding adjustments | | $ | 3,149 | | | $ | 3,149 | | | $ | 302 | | | $ | 3,451 | | |
Site production and delivery, before net noncash
and other costs shown below | | 2,114 | | | 1,968 | | | 188 | | | 2,156 | | |
| By-product credits | | (260) | | | — | | | — | | | — | | |
| Treatment charges | | 124 | | | 124 | | | — | | | 124 | | |
| Royalty on metals | | 7 | | | 6 | | | 1 | | | 7 | | |
| Net cash costs | | 1,985 | | | 2,098 | | | 189 | | | 2,287 | | |
| DD&A | | 297 | | | 272 | | | 25 | | | 297 | | |
| Metals inventory adjustments | | 32 | | | 31 | | | 1 | | | 32 | | |
| Noncash and other costs, net | | 60 | | | 57 | | | 3 | | | 60 | | |
| Total costs | | 2,374 | | | 2,458 | | | 218 | | | 2,676 | | |
Other revenue adjustments, primarily for pricing
on prior period open sales | | 35 | | | 35 | | | — | | | 35 | | |
| Gross profit | | $ | 810 | | | $ | 726 | | | $ | 84 | | | $ | 810 | | |
| | | | | | | | | |
| Copper sales (millions of recoverable pounds) | | 845 | | | 845 | | | | | | |
| | | | | | | | | |
| Gross profit per pound of copper: | | | | | |
| | | | | | | | | |
| Revenues, excluding adjustments | | $ | 3.73 | | | $ | 3.73 | | | | | | |
Site production and delivery, before net noncash
and other costs shown below | | 2.50 | | | 2.33 | | | | | | |
| By-product credits | | (0.31) | | | — | | | | | | |
| Treatment charges | | 0.15 | | | 0.15 | | | | | | |
| Royalty on metals | | 0.01 | | | 0.01 | | | | | | |
| Unit net cash costs | | 2.35 | | | 2.49 | | | | | | |
| DD&A | | 0.35 | | | 0.32 | | | | | | |
| Metals inventory adjustments | | 0.04 | | | 0.04 | | | | | | |
| Noncash and other costs, net | | 0.07 | | | 0.06 | | | | | | |
| Total unit costs | | 2.81 | | | 2.91 | | | | | | |
Other revenue adjustments, primarily for pricing
on prior period open sales | | 0.04 | | | 0.04 | | | | | | |
| Gross profit per pound | | $ | 0.96 | | | $ | 0.86 | | | | | | |
| | | | | | | | | |
| Reconciliation to Amounts Reported | | | | | | | | | |
| | | | | | | | Metals | |
| | | | Production | | | | Inventory | |
| | Revenues | | and Delivery | | DD&A | | Adjustments | |
| Totals presented above | | $ | 3,451 | | | $ | 2,156 | | | $ | 297 | | | $ | 32 | | |
| Treatment charges | | (124) | | | — | | | — | | | — | | |
| Royalty on metals | | (7) | | | — | | | — | | | — | | |
| Noncash and other costs, net | | — | | | 60 | | | — | | | — | | |
Other revenue adjustments, primarily for pricing
on prior period open sales | | 35 | | | — | | | — | | | — | | |
| Eliminations and other | | (1) | | | (4) | | | — | | | 1 | | |
| South America mining | | 3,354 | | | 2,212 | | | 297 | | | 33 | | |
Other miningb | | 18,549 | | | 12,139 | | | 1,157 | | | 10 | | |
| | | | | | | | | |
| | | | | | | | | |
| Corporate, other & eliminations | | (4,881) | | | (4,832) | | | 50 | | | — | | |
| As reported in our consolidated financial statements | | $ | 17,022 | | | $ | 9,519 | | | $ | 1,504 | | | $ | 43 | | |
| | | | | | | | | |
a.Includes silver sales of 3.2 million ounces ($21.24 per ounce average realized price). Also reflects sales of molybdenum produced by Cerro Verde to our molybdenum sales company at market-based pricing.
b.Represents the combined total for our other mining operations as presented in Note 9.
Indonesia MiningOperations Product Revenues, Production Costs and Unit Net Cash (Credits) Costs
| | | | Three Months Ended September 30, 2023 | | | |
| (In Millions) | | Co-Product Method | |
| Three Months Ended March 31, 2024 | |
| | By-Product Method | | Copper | | Gold | | Silver & Othera | | Total | |
| | Three Months Ended March 31, 2024 | |
| | Three Months Ended March 31, 2024 | |
| (In millions) | |
| (In millions) | |
| (In millions) | |
| | By-Product Method | |
| | By-Product Method | |
| | By-Product Method | |
| Revenues, excluding adjustments | |
| Revenues, excluding adjustments | |
| Revenues, excluding adjustments | Revenues, excluding adjustments | | $ | 1,621 | | | $ | 1,621 | | | $ | 749 | | | $ | 32 | | | $ | 2,402 | | |
Site production and delivery, before net noncash
and other costs shown below | Site production and delivery, before net noncash
and other costs shown below | | 612 | | | 413 | | | 191 | | | 8 | | | 612 | | |
Site production and delivery, before net noncash
and other costs shown below | |
Site production and delivery, before net noncash
and other costs shown below | |
| Gold, silver and other by-product credits | |
| Gold, silver and other by-product credits | |
| Gold, silver and other by-product credits | Gold, silver and other by-product credits | | (785) | | | — | | | — | | | — | | | — | | |
| Treatment charges | Treatment charges | | 138 | | | 93 | | | 43 | | | 2 | | | 138 | | |
| Treatment charges | |
| Treatment charges | |
| Export duties | |
| Export duties | |
| Export duties | Export duties | | 147 | | | 99 | | | 46 | | | 2 | | | 147 | | |
| Royalty on metals | Royalty on metals | | 78 | | | 52 | | | 25 | | | 1 | | | 78 | | |
| Net cash costs | | 190 | | | 657 | | | 305 | | | 13 | | | 975 | | |
| Royalty on metals | |
| Royalty on metals | |
| Net cash (credits) costs | |
| Net cash (credits) costs | |
| Net cash (credits) costs | |
| DD&A | |
| DD&A | |
| DD&A | DD&A | | 271 | | | 183 | | | 84 | | | 4 | | | 271 | | |
| | Noncash and other costs, net | Noncash and other costs, net | | 8 | | b | 6 | | | 2 | | | — | | | 8 | | |
| | Noncash and other costs, net | |
| | Noncash and other costs, net | |
| Total costs | Total costs | | 469 | | | 846 | | | 391 | | | 17 | | | 1,254 | | |
| Total costs | |
| Total costs | |
Other revenue adjustments, primarily for pricing
on prior period open sales | |
Other revenue adjustments, primarily for pricing
on prior period open sales | |
Other revenue adjustments, primarily for pricing
on prior period open sales | Other revenue adjustments, primarily for pricing
on prior period open sales | | 1 | | | 1 | | | 3 | | | 1 | | | 5 | | |
| | Gross profit | Gross profit | | $ | 1,153 | | | $ | 776 | | | $ | 361 | | | $ | 16 | | | $ | 1,153 | | |
| | Gross profit | |
| | Gross profit | |
| | Copper sales (millions of recoverable pounds) | Copper sales (millions of recoverable pounds) | | 430 | | | 430 | | |
| | Copper sales (millions of recoverable pounds) | |
| | Copper sales (millions of recoverable pounds) | |
| Gold sales (thousands of recoverable ounces) | |
| Gold sales (thousands of recoverable ounces) | |
| Gold sales (thousands of recoverable ounces) | Gold sales (thousands of recoverable ounces) | | 395 | | |
| | Gross profit per pound of copper/per ounce of gold: | Gross profit per pound of copper/per ounce of gold: | |
| | Gross profit per pound of copper/per ounce of gold: | |
| | Gross profit per pound of copper/per ounce of gold: | |
| | Revenues, excluding adjustments | |
| | Revenues, excluding adjustments | |
| | Revenues, excluding adjustments | Revenues, excluding adjustments | | $ | 3.77 | | | $ | 3.77 | | | $ | 1,898 | | |
Site production and delivery, before net noncash
and other costs shown below | Site production and delivery, before net noncash
and other costs shown below | | 1.42 | | | 0.96 | | | 484 | | |
Site production and delivery, before net noncash
and other costs shown below | |
Site production and delivery, before net noncash
and other costs shown below | |
| Gold, silver and other by-product credits | |
| Gold, silver and other by-product credits | |
| Gold, silver and other by-product credits | Gold, silver and other by-product credits | | (1.83) | | | — | | | — | | |
| Treatment charges | Treatment charges | | 0.32 | | | 0.22 | | | 109 | | |
| Treatment charges | |
| Treatment charges | |
| Export duties | |
| Export duties | |
| Export duties | Export duties | | 0.34 | | | 0.23 | | | 116 | | |
| Royalty on metals | Royalty on metals | | 0.19 | | | 0.12 | | | 64 | | |
| Unit net cash costs | | 0.44 | | | 1.53 | | | 773 | | |
| Royalty on metals | |
| Royalty on metals | |
| Unit net cash (credits) costs | |
| Unit net cash (credits) costs | |
| Unit net cash (credits) costs | |
| DD&A | |
| DD&A | |
| DD&A | DD&A | | 0.63 | | | 0.43 | | | 214 | | |
| | Noncash and other costs, net | Noncash and other costs, net | | 0.02 | | b | 0.01 | | | 6 | | |
| | Noncash and other costs, net | |
| | Noncash and other costs, net | |
| Total unit costs | |
| Total unit costs | |
| Total unit costs | Total unit costs | | 1.09 | | | 1.97 | | | 993 | | |
Other revenue adjustments, primarily for pricing
on prior period open sales | Other revenue adjustments, primarily for pricing
on prior period open sales | | — | | | — | | | 8 | | |
Other revenue adjustments, primarily for pricing
on prior period open sales | |
Other revenue adjustments, primarily for pricing
on prior period open sales | |
| | Gross profit per pound/ounce | |
| | Gross profit per pound/ounce | |
| | Gross profit per pound/ounce | Gross profit per pound/ounce | | $ | 2.68 | | | $ | 1.80 | | | $ | 913 | | |
| | Reconciliation to Amounts Reported | Reconciliation to Amounts Reported | |
| | Production | |
| Reconciliation to Amounts Reported | |
| | Revenues | | and Delivery | | DD&A | |
| Reconciliation to Amounts Reported | |
| | | | Production | |
| | | | Production | |
| | | | Production | |
| | Revenues | |
| | Revenues | |
| | Revenues | |
| Totals presented above | |
| Totals presented above | |
| Totals presented above | Totals presented above | | $ | 2,402 | | | $ | 612 | | | $ | 271 | | |
| Treatment charges | Treatment charges | | (87) | | | 51 | |
| — | | |
| Treatment charges | |
| Treatment charges | |
| Export duties | |
| Export duties | |
| Export duties | Export duties | | (147) | | | — | | | — | | |
| Royalty on metals | Royalty on metals | | (78) | | | — | | | — | | |
| Royalty on metals | |
| Royalty on metals | |
| Noncash and other costs, net | Noncash and other costs, net | | — | | | 8 | | | — | | |
| Noncash and other costs, net | |
| Noncash and other costs, net | |
Other revenue adjustments, primarily for pricing
on prior period open sales | |
Other revenue adjustments, primarily for pricing
on prior period open sales | |
Other revenue adjustments, primarily for pricing
on prior period open sales | Other revenue adjustments, primarily for pricing
on prior period open sales | | 5 | | | — | | | — | | |
| | Eliminations and other | Eliminations and other | | — | | | (4) | | | — | | |
| Indonesia mining | | 2,095 | | | 667 | | | 271 | | |
Other miningc | | 5,326 | | | 4,467 | | | 244 | | |
| | Eliminations and other | |
| | Eliminations and other | |
| Indonesia operations | |
| Indonesia operations | |
| Indonesia operations | |
Other miningd | |
Other miningd | |
Other miningd | |
| | Corporate, other & eliminations | |
| | Corporate, other & eliminations | |
| | Corporate, other & eliminations | Corporate, other & eliminations | | (1,597) | | | (1,586) | | | 18 | | |
| As reported in our consolidated financial statements | As reported in our consolidated financial statements | | $ | 5,824 | | | $ | 3,548 | | | $ | 533 | | |
| As reported in our consolidated financial statements | |
| As reported in our consolidated financial statements | |
|
a.Includes silver sales of 1.32.1 million ounces ($22.9623.90 per ounce average realized price).
b.Includes charges totaling $3$15 million ($0.010.03 per pound of copper) for the Indonesia smelter projects’ operational readiness and startup costs.
c.Represents tolling costs paid to PT Smelting.
d.Represents the combined total for our other segments as presented in Note 9.
Indonesia Operations Product Revenues, Production Costs and Unit Net Cash (Credits) Costs
| | | | | | | | | | | | | | | | | | | | | | | | | | | | | | | | | | | |
| | | | | | | | | | | |
|
|
|
| Three Months Ended March 31, 2023 | | | | | |
| (In millions) | | | | Co-Product Method | |
| | By-Product Method | | Copper | | Gold | | Silver & Othera | | Total | |
| Revenues, excluding adjustments | | $ | 806 | | | $ | 806 | | | $ | 518 | | | $ | 28 | | | $ | 1,352 | | |
Site production and delivery, before net noncash
and other costs shown below | | 399 | | | 238 | | | 153 | | | 8 | | | 399 | | |
| Gold, silver and other by-product credits | | (563) | | | — | | | — | | | — | | | — | | |
| Treatment charges | | 74 | | | 44 | | | 28 | | | 2 | | | 74 | | |
| Export duties | | 17 | | | 10 | | | 7 | | | — | | | 17 | | |
| Royalty on metals | | 58 | | | 37 | | | 20 | | | 1 | | | 58 | | |
| Net cash (credits) costs | | (15) | | | 329 | | | 208 | | | 11 | | | 548 | | |
| DD&A | | 148 | | | 88 | | | 57 | | | 3 | | | 148 | | |
| Noncash and other costs, net | | 30 | | b | 18 | | | 11 | | | 1 | | | 30 | | |
| Total costs | | 163 | | | 435 | | | 276 | | | 15 | | | 726 | | |
Other revenue adjustments, primarily for pricing
on prior period open sales | | 126 | | | 126 | | | 17 | | | — | | | 143 | | |
| PT Smelting intercompany profit | | 112 | | | 67 | | | 43 | | | 2 | | | 112 | | |
| Gross profit | | $ | 881 | | | $ | 564 | | | $ | 302 | | | $ | 15 | | | $ | 881 | | |
| | | | | | | | | | | |
| Copper sales (millions of recoverable pounds) | | 198 | | | 198 | | | | | | | | |
| Gold sales (thousands of recoverable ounces) | | | | | | 266 | | | | | | |
| | | | | | | | | | | |
| Gross profit per pound of copper/per ounce of gold: | | | | | | | |
| | | | | | | | | | | |
| Revenues, excluding adjustments | | $ | 4.07 | | | $ | 4.07 | | | $ | 1,949 | | | | | | |
Site production and delivery, before net noncash
and other costs shown below | | 2.01 | |
| 1.20 | | | 574 | | | | | | |
| Gold, silver and other by-product credits | | (2.84) | | | — | | | — | | | | | | |
| Treatment charges | | 0.37 | | | 0.22 | | | 106 | | | | | | |
| Export duties | | 0.09 | | | 0.05 | | | 25 | | | | | | |
| Royalty on metals | | 0.29 | | | 0.19 | | | 76 | | | | | | |
| Unit net cash (credits) costs | | (0.08) | | | 1.66 | | | 781 | | | | | | |
| DD&A | | 0.75 | | | 0.45 | | | 214 | | | | | | |
| Noncash and other costs, net | | 0.16 | | b | 0.09 | | | 43 | | | | | | |
| Total unit costs | | 0.83 | | | 2.20 | | | 1,038 | | | | | | |
Other revenue adjustments, primarily for pricing
on prior period open sales | | 0.64 | | | 0.64 | | | 65 | | | | | | |
| PT Smelting intercompany profit | | 0.56 | | | 0.34 | | | 162 | | | | | | |
| Gross profit per pound/ounce | | $ | 4.44 | | | $ | 2.85 | | | $ | 1,138 | | | | | | |
| | | | | | | | | | | |
| Reconciliation to Amounts Reported | | | | | | | | | | | |
| | | | Production | | | | | | | |
| | Revenues | | and Delivery | | DD&A | | | | | |
| Totals presented above | | $ | 1,352 | | | $ | 399 | | | $ | 148 | | | | | | |
| Treatment charges | | (52) | | | 22 | | | — | | | | | | |
| Export duties | | (17) | | | — | | | — | | | | | | |
| Royalty on metals | | (58) | | | — | | | — | | | | | | |
| Noncash and other costs, net | | — | | | 30 | | | — | | | | | | |
Other revenue adjustments, primarily for pricing
on prior period open sales | | 143 | | | — | | | — | | | | | | |
| PT Smelting intercompany profit | | — | | | (112) | | | — | | | | | | |
| Eliminations and other | | — | | | (1) | | | — | | | | | | |
| Indonesia operations | | 1,368 | | | 338 | | | 148 | | | | | | |
Other miningc | | 5,614 | | | 4,326 | | | 238 | | | | | | |
| | | | | | | | | | | |
| | | | | | | | | | | |
| Corporate, other & eliminations | | (1,593) | | | (1,499) | | | 13 | | | | | | |
| As reported in our consolidated financial statements | | $ | 5,389 | | | $ | 3,165 | | | $ | 399 | | | | | | |
| | | | | | | | | | | |
a.Includes silver sales of 0.9 million ounces ($23.29 per ounce average realized price).
b.Includes net charges totaling $13 million ($0.07 per pound of copper) for feasibility and optimization studies.
c.Represents the combined total for our other segments as presented in Note 9.
Indonesia Mining Product Revenues, Production Costs and Unit Net Cash Costs
| | | | | | | | | | | | | | | | | | | | | | | | | | | | | | | | | | | |
| | | | | | | | | | | |
|
|
|
| Three Months Ended September 30, 2022 | | | | | |
| (In Millions) | | | | Co-Product Method | |
| | By-Product Method | | Copper | | Gold | | Silver & Othera | | Total | |
| Revenues, excluding adjustments | | $ | 1,400 | | | $ | 1,400 | | | $ | 802 | | | $ | 30 | | | $ | 2,232 | | |
Site production and delivery, before net noncash
and other credits shown below | | 735 | | | 461 | | | 264 | | | 10 | | | 735 | | |
| Gold, silver and other by-product credits | | (814) | | | — | | | — | | | — | | | — | | |
| Treatment charges | | 95 | | | 60 | | | 34 | | | 1 | | | 95 | | |
| Export duties | | 80 | | | 50 | | | 29 | | | 1 | | | 80 | | |
| Royalty on metals | | 81 | | | 48 | | | 32 | | | 1 | | | 81 | | |
| Net cash costs | | 177 | | | 619 | | | 359 | | | 13 | | | 991 | | |
| DD&A | | 265 | | | 167 | | | 95 | | | 3 | | | 265 | | |
| Noncash and other credits, net | | (10) | | b | (7) | | | (3) | | | — | | | (10) | | |
| Total costs | | 432 | | | 779 | | | 451 | | | 16 | | | 1,246 | | |
Other revenue adjustments, primarily for pricing
on prior period open sales | | (158) | | | (158) | | | (17) | | | (1) | | | (176) | | |
| PT Smelting intercompany profit | | 60 | | | 38 | | | 22 | | | — | | | 60 | | |
| Gross profit | | $ | 870 | | | $ | 501 | | | $ | 356 | | | $ | 13 | | | $ | 870 | | |
| | | | | | | | | | | |
| Copper sales (millions of recoverable pounds) | | 406 | | | 406 | | | | | | | | |
| Gold sales (thousands of recoverable ounces) | | | | | | 476 | | | | | | |
| | | | | | | | | | | |
| Gross profit per pound of copper/per ounce of gold: | | | | | | | |
| | | | | | | | | | | |
| Revenues, excluding adjustments | | $ | 3.45 | | | $ | 3.45 | | | $ | 1,683 | | | | | | |
Site production and delivery, before net noncash
and other credits shown below | | 1.81 | |
| 1.13 | | | 553 | | | | | | |
| Gold, silver and other by-product credits | | (2.00) | | | — | | | — | | | | | | |
| Treatment charges | | 0.23 | | | 0.15 | | | 72 | | | | | | |
| Export duties | | 0.20 | | | 0.12 | | | 61 | | | | | | |
| Royalty on metals | | 0.20 | | | 0.12 | | | 67 | | | | | | |
| Unit net cash costs | | 0.44 | | | 1.52 | | | 753 | | | | | | |
| DD&A | | 0.65 | | | 0.41 | | | 200 | | | | | | |
| Noncash and other credits, net | | (0.02) | | b | (0.01) | | | (7) | | | | | | |
| Total unit costs | | 1.07 | | | 1.92 | | | 946 | | | | | | |
Other revenue adjustments, primarily for pricing
on prior period open sales | | (0.39) | | | (0.39) | | | (36) | | | | | | |
| PT Smelting intercompany profit | | 0.15 | | | 0.09 | | | 45 | | | | | | |
| Gross profit per pound/ounce | | $ | 2.14 | | | $ | 1.23 | | | $ | 746 | | | | | | |
| | | | | | | | | | | |
| Reconciliation to Amounts Reported | | | | | | | | | | | |
| | | | Production | | | | | | | |
| | Revenues | | and Delivery | | DD&A | | | | | |
| Totals presented above | | $ | 2,232 | | | $ | 735 | | | $ | 265 | | | | | | |
| Treatment charges | | (95) | | | — | | | — | | | | | | |
| Export duties | | (80) | | | — | | | — | | | | | | |
| Royalty on metals | | (81) | | | — | | | — | | | | | | |
| Noncash and other credits, net | | (2) | | | (12) | | | — | | | | | | |
Other revenue adjustments, primarily for pricing
on prior period open sales | | (176) | | | — | | | — | | | | | | |
| PT Smelting intercompany profit | | — | | | (60) | | | — | | | | | | |
| Indonesia mining | | 1,798 | | | 663 | | | 265 | | | | | | |
Other miningc | | 4,591 | | | 4,092 | | | 225 | | | | | | |
| | | | | | | | | | | |
| | | | | | | | | | | |
| Corporate, other & eliminations | | (1,386) | | | (1,389) | | | 18 | | | | | | |
| As reported in our consolidated financial statements | | $ | 5,003 | | | $ | 3,366 | | | $ | 508 | | | | | | |
| | | | | | | | | | | |
a.Includes silver sales of 1.6 million ounces ($18.58 per ounce average realized price).
b.Includes net credits totaling $21 million ($0.05 per pound of copper) associated with historical tax audits.
c.Represents the combined total for our other segments as presented in Note 9.
Indonesia Mining Product Revenues, Production Costs and Unit Net Cash Costs
| | | | | | | | | | | | | | | | | | | | | | | | | | | | | | | | |
| | | | |
| Nine Months Ended September 30, 2023 | | | | |
| (In Millions) | | | | Co-Product Method |
| | By-Product Method | | Copper | | Gold | | Silver & Othera | | Total |
| Revenues, excluding adjustments | | $ | 3,860 | | | $ | 3,860 | | | $ | 2,227 | | | $ | 106 | | | $ | 6,193 | |
Site production and delivery, before net noncash
and other costs shown below | | 1,736 | | | 1,082 | | | 624 | | | 30 | | | 1,736 | |
| Gold, silver and other by-product credits | | (2,350) | | | — | | | — | | | — | | | — | |
| Treatment charges | | 362 | | | 226 | | | 130 | | | 6 | | | 362 | |
| Export duties | | 165 | | | 103 | | | 59 | | | 3 | | | 165 | |
| Royalty on metals | | 228 | | | 144 | | | 81 | | | 3 | | | 228 | |
| Net cash costs | | 141 | | | 1,555 | | | 894 | | | 42 | | | 2,491 | |
| DD&A | | 694 | | | 433 | | | 249 | | | 12 | | | 694 | |
| | | | | | | | | | |
| Noncash and other costs, net | | 115 | | b | 71 | | | 42 | | | 2 | | | 115 | |
| Total costs | | 950 | | | 2,059 | | | 1,185 | | | 56 | | | 3,300 | |
Other revenue adjustments, primarily for pricing
on prior period open sales | | 114 | | | 114 | | | 18 | | | (1) | | | 131 | |
| PT Smelting intercompany profit | | 112 | | | 70 | | | 40 | | | 2 | | | 112 | |
| Gross profit | | $ | 3,136 | | | $ | 1,985 | | | $ | 1,100 | | | $ | 51 | | | $ | 3,136 | |
| | | | | | | | | | |
| Copper sales (millions of recoverable pounds) | | 1,014 | | | 1,014 | | | | | | | |
| Gold sales (thousands of recoverable ounces) | | | | | | 1,153 | | | | | |
| | | | | | | | | | |
| Gross profit per pound of copper/per ounce of gold: | | | | | | |
| | | | | | | | | | |
| Revenues, excluding adjustments | | $ | 3.81 | | | $ | 3.81 | | | $ | 1,932 | | | | | |
Site production and delivery, before net noncash
and other costs shown below | | 1.71 | | | 1.07 | | | 542 | | | | | |
| Gold, silver and other by-product credits | | (2.32) | | | — | | | — | | | | | |
| Treatment charges | | 0.36 | | | 0.22 | | | 113 | | | | | |
| Export duties | | 0.16 | | | 0.10 | | | 51 | | | | | |
| Royalty on metals | | 0.23 | | | 0.14 | | | 70 | | | | | |
| Unit net cash costs | | 0.14 | | | 1.53 | | | 776 | | | | | |
| DD&A | | 0.69 | | | 0.43 | | | 216 | | | | | |
| | | | | | | | | | |
| Noncash and other costs, net | | 0.11 | | b | 0.07 | | | 36 | | | | | |
| Total unit costs | | 0.94 | | | 2.03 | | | 1,028 | | | | | |
Other revenue adjustments, primarily for pricing
on prior period open sales | | 0.11 | | | 0.11 | | | 15 | | | | | |
| PT Smelting intercompany profit | | 0.11 | | | 0.07 | | | 35 | | | | | |
| Gross profit per pound/ounce | | $ | 3.09 | | | $ | 1.96 | | | $ | 954 | | | | | |
| | | | | | | | | | |
| Reconciliation to Amounts Reported | | | | | | | | | | |
| | | | Production | | | | | | |
| | Revenues | | and Delivery | | DD&A | | | | |
| Totals presented above | | $ | 6,193 | | | $ | 1,736 | | | $ | 694 | | | | | |
| Treatment charges | | (231) | | | 131 | | | — | | | | | |
| Export duties | | (165) | | | — | | | — | | | | | |
| Royalty on metals | | (228) | | | — | | | — | | | | | |
| Noncash and other costs, net | | — | | | 115 | | | — | | | | | |
Other revenue adjustments, primarily for pricing
on prior period open sales | | 131 | | | — | | | — | | | | | |
| PT Smelting intercompany profit | | — | | | (112) | | | — | | | | | |
| Eliminations and other | | — | | | (10) | | | — | | | | | |
| Indonesia mining | | 5,700 | | | 1,860 | | | 694 | | | | | |
Other miningc | | 16,049 | | | 13,037 | | | 735 | | | | | |
| | | | | | | | | | |
| | | | | | | | | | |
| Corporate, other & eliminations | | (4,799) | | | (4,637) | | | 50 | | | | | |
| As reported in our consolidated financial statements | | $ | 16,950 | | | $ | 10,260 | | | $ | 1,479 | | | | | |
| | | | | | | | | | |
a.Includes silver sales of 4.0 million ounces ($23.37 per ounce average realized price).
b.Includes a charge of $55 million ($0.05 per pound of copper) associated with a potential administrative fine and charges totaling $22 million ($0.02 per pound of copper) for feasibility and optimization studies.
c.Represents the combined total for our other mining operations as presented in Note 9.
Indonesia Mining Product Revenues, Production Costs and Unit Net Cash Costs
| | | | | | | | | | | | | | | | | | | | | | | | | | | | | | | | | | | |
| | | | | |
| Nine Months Ended September 30, 2022 | | | | | |
| (In Millions) | | | | Co-Product Method | |
| | By-Product Method | | Copper | | Gold | | Silver & Othera | | Total | |
| Revenues, excluding adjustments | | $ | 4,433 | | | $ | 4,433 | | | $ | 2,422 | | | $ | 98 | | | $ | 6,953 | | |
Site production and delivery, before net noncash
and other costs shown below | | 1,855 | |
| 1,183 | | | 646 | | | 26 | | | 1,855 | | |
| Gold, silver and other by-product credits | | (2,523) | | | — | | | — | | | — | | | — | | |
| Treatment charges | | 287 | | | 183 | | | 100 | | | 4 | | | 287 | | |
| Export duties | | 245 | | | 156 | | | 85 | | | 4 | | | 245 | | |
| Royalty on metals | | 281 | | | 183 | | | 95 | | | 3 | | | 281 | | |
| Net cash costs | | 145 | | | 1,705 | | | 926 | | | 37 | | | 2,668 | | |
| DD&A | | 775 | | | 494 | | | 270 | | | 11 | | | 775 | | |
| | | | | | | | | | | |
| Noncash and other costs, net | | 20 | | b | 13 | | | 7 | | | — | | | 20 | | |
| Total costs | | 940 | | | 2,212 | | | 1,203 | | | 48 | | | 3,463 | | |
Other revenue adjustments, primarily for pricing
on prior period open sales | | 25 | | | 25 | | | 3 | | | — | | | 28 | | |
| PT Smelting intercompany profit | | 34 | | | 21 | | | 12 | | | 1 | | | 34 | | |
| Gross profit | | $ | 3,552 | | | $ | 2,267 | | | $ | 1,234 | | | $ | 51 | | | $ | 3,552 | | |
| | | | | | | | | | | |
| Copper sales (millions of recoverable pounds) | | 1,195 | | | 1,195 | | | | | | | | |
| Gold sales (thousands of recoverable ounces) | | | | | | 1,356 | | | | | | |
| | | | | | | | | | | |
| Gross profit per pound of copper/per ounce of gold: | | | | | | | |
| | | | | | | | | | | |
| Revenues, excluding adjustments | | $ | 3.71 | | | $ | 3.71 | | | $ | 1,786 | | | | | | |
Site production and delivery, before net noncash
and other credits shown below | | 1.55 | | | 0.99 | | | 476 | | | | | | |
| Gold, silver and other by-product credits | | (2.11) | | | — | | | — | | | | | | |
| Treatment charges | | 0.24 | | | 0.15 | | | 74 | | | | | | |
| Export duties | | 0.20 | | | 0.13 | | | 63 | | | | | | |
| Royalty on metals | | 0.24 | | | 0.16 | | | 70 | | | | | | |
| Unit net cash costs | | 0.12 | | | 1.43 | | | 683 | | | | | | |
| DD&A | | 0.65 | | | 0.41 | | | 199 | | | | | | |
| | | | | | | | | | | |
| Noncash and other costs, net | | 0.02 | | b | 0.01 | | | 5 | | | | | | |
| Total unit costs | | 0.79 | | | 1.85 | | | 887 | | | | | | |
Other revenue adjustments, primarily for pricing
on prior period open sales | | 0.02 | | | 0.02 | | | 2 | | | | | | |
| PT Smelting intercompany profit | | 0.03 | | | 0.02 | | | 9 | | | | | | |
| Gross profit per pound/ounce | | $ | 2.97 | | | $ | 1.90 | | | $ | 910 | | | | | | |
| | | | | | | | | | | |
| Reconciliation to Amounts Reported | | | | | | | | | | | |
| | | | Production | | | | | | | |
| | Revenues | | and Delivery | | DD&A | | | | | |
| Totals presented above | | $ | 6,953 | | | $ | 1,855 | | | $ | 775 | | | | | | |
| Treatment charges | | (287) | | | — | | | — | | | | | | |
| Export duties | | (245) | | | — | | | — | | | | | | |
| Royalty on metals | | (281) | | | — | | | — | | | | | | |
| Noncash and other costs, net | | 12 | | | 32 | | | — | | | | | | |
Other revenue adjustments, primarily for pricing
on prior period open sales | | 28 | | | — | | | — | | | | | | |
| PT Smelting intercompany profit | | — | | | (34) | | | — | | | | | | |
| Indonesia mining | | 6,180 | | | 1,853 | | | 775 | | | | | | |
Other miningc | | 15,723 | | | 12,498 | | | 679 | | | | | | |
| | | | | | | | | | | |
| | | | | | | | | | | |
| Corporate, other & eliminations | | (4,881) | | | (4,832) | | | 50 | | | | | | |
| As reported in our consolidated financial statements | | $ | 17,022 | | | $ | 9,519 | | | $ | 1,504 | | | | | | |
| | | | | | | | | | | |
a.Includes silver sales of 4.7 million ounces ($20.80 per ounce average realized price).
b.Includes a net charge of $30 million ($0.02 per pound of copper) consisting of charges associated with a settlement of an administrative fine levied by the Indonesia government and a reserve for exposure associated with export duties in prior periods, partially offset by credits for adjustments to prior year treatment and refining charges and historical tax audits.
c.Represents the combined total for our other mining operations as presented in Note 9.
Molybdenum Mines Product Revenues, Production Costs and Unit Net Cash Costs
| | | | | Three Months Ended March 31, | |
| | Three Months Ended September 30, | | | |
| (In Millions) | 2023 | | 2022 | |
| | Three Months Ended March 31, | |
| | Three Months Ended March 31, | |
| (In millions) | |
| (In millions) | |
| (In millions) | |
| Revenues, excluding adjustmentsa | |
| Revenues, excluding adjustmentsa | |
| Revenues, excluding adjustmentsa | Revenues, excluding adjustmentsa | $ | 153 | | | $ | 134 | | |
Site production and delivery, before net noncash
and other costs shown below | Site production and delivery, before net noncash
and other costs shown below | 116 | | | 91 | | |
Site production and delivery, before net noncash
and other costs shown below | |
Site production and delivery, before net noncash
and other costs shown below | |
| Treatment charges and other | |
| Treatment charges and other | |
| Treatment charges and other | Treatment charges and other | 6 | | | 7 | | |
| Net cash costs | Net cash costs | 122 | | | 98 | | |
| Net cash costs | |
| Net cash costs | |
| DD&A | |
| DD&A | |
| DD&A | DD&A | 14 | | | 18 | | |
| | Noncash and other costs, net | Noncash and other costs, net | 4 | |
| 3 | | |
| | Noncash and other costs, net | |
| | Noncash and other costs, net | |
| Total costs | |
| Total costs | |
| Total costs | Total costs | 140 | | | 119 | | |
| Gross profit | Gross profit | $ | 13 | | | $ | 15 | | |
| Gross profit | |
| Gross profit | |
| Molybdenum sales (millions of recoverable pounds)a | |
| Molybdenum sales (millions of recoverable pounds)a | |
| Molybdenum sales (millions of recoverable pounds)a | Molybdenum sales (millions of recoverable pounds)a | 7 | | | 8 | | |
| | Gross profit per pound of molybdenum: | Gross profit per pound of molybdenum: | |
| | Gross profit per pound of molybdenum: | |
| | Gross profit per pound of molybdenum: | |
| Revenues, excluding adjustmentsa | |
| Revenues, excluding adjustmentsa | |
| Revenues, excluding adjustmentsa | Revenues, excluding adjustmentsa | $ | 22.58 | | | $ | 16.51 | | |
Site production and delivery, before net noncash
and other costs shown below | Site production and delivery, before net noncash
and other costs shown below | 17.20 | | | 11.26 | | |
Site production and delivery, before net noncash
and other costs shown below | |
Site production and delivery, before net noncash
and other costs shown below | |
| Treatment charges and other | |
| Treatment charges and other | |
| Treatment charges and other | Treatment charges and other | 0.87 | | | 0.84 | | |
| Unit net cash costs | Unit net cash costs | 18.07 | | | 12.10 | | |
| Unit net cash costs | |
| Unit net cash costs | |
| DD&A | |
| DD&A | |
| DD&A | DD&A | 2.13 | | | 2.16 | | |
| | Noncash and other costs, net | Noncash and other costs, net | 0.53 | |
| 0.40 | | |
| | Noncash and other costs, net | |
| | Noncash and other costs, net | |
| Total unit costs | Total unit costs | 20.73 | | | 14.66 | | |
| Total unit costs | |
| Total unit costs | |
| Gross profit per pound | |
| Gross profit per pound | |
| Gross profit per pound | Gross profit per pound | $ | 1.85 | | | $ | 1.85 | | |
| | Reconciliation to Amounts Reported | Reconciliation to Amounts Reported | |
| | Production | |
| Three Months Ended September 30, 2023 | Revenues | | and Delivery | | DD&A | |
| Reconciliation to Amounts Reported | |
| | Reconciliation to Amounts Reported | |
| | | Production | |
| | | Production | |
| | | Production | |
| Three Months Ended March 31, 2024 | |
| Three Months Ended March 31, 2024 | |
| Three Months Ended March 31, 2024 | |
| Totals presented above | |
| Totals presented above | |
| Totals presented above | Totals presented above | $ | 153 | | | $ | 116 | | | $ | 14 | | |
| Treatment charges and other | Treatment charges and other | (6) | | | — | | | — | | |
| Treatment charges and other | |
| Treatment charges and other | |
| Noncash and other costs, net | |
| Noncash and other costs, net | |
| Noncash and other costs, net | Noncash and other costs, net | — | | | 4 | | | — | | |
| Molybdenum mines | Molybdenum mines | 147 | | | 120 | | | 14 | | |
| Molybdenum mines | |
| Molybdenum mines | |
Other miningb | |
Other miningb | |
Other miningb | Other miningb | 7,274 | | | 5,014 | | | 501 | | |
| | Corporate, other & eliminations | Corporate, other & eliminations | (1,597) | | | (1,586) | | | 18 | | |
| | Corporate, other & eliminations | |
| | Corporate, other & eliminations | |
| As reported in our consolidated financial statements | |
| As reported in our consolidated financial statements | |
| As reported in our consolidated financial statements | As reported in our consolidated financial statements | $ | 5,824 | | | $ | 3,548 | | | $ | 533 | | |
| | Three Months Ended September 30, 2022 | |
| Three Months Ended March 31, 2023 | |
| | Three Months Ended March 31, 2023 | |
| | Three Months Ended March 31, 2023 | |
| Totals presented above | |
| Totals presented above | |
| Totals presented above | Totals presented above | $ | 134 | | | $ | 91 | | | $ | 18 | | |
| Treatment charges and other | Treatment charges and other | (7) | | | — | | | — | | |
| Treatment charges and other | |
| Treatment charges and other | |
| Noncash and other costs, net | |
| Noncash and other costs, net | |
| Noncash and other costs, net | Noncash and other costs, net | — | | | 3 | | | — | | |
| | Molybdenum mines | Molybdenum mines | 127 | | | 94 | | | 18 | | |
| | Molybdenum mines | |
| | Molybdenum mines | |
Other miningb | |
Other miningb | |
Other miningb | Other miningb | 6,262 | | | 4,661 | | | 472 | | |
| | Corporate, other & eliminations | Corporate, other & eliminations | (1,386) | | | (1,389) | | | 18 | | |
| | Corporate, other & eliminations | |
| | Corporate, other & eliminations | |
| As reported in our consolidated financial statements | |
| As reported in our consolidated financial statements | |
| As reported in our consolidated financial statements | As reported in our consolidated financial statements | $ | 5,003 | | | $ | 3,366 | | | $ | 508 | | |
|
a.Reflects sales of the Molybdenum mines’ production to our molybdenum sales company at market-based pricing. On a consolidated basis, realizations are based on the actual contract terms for sales to third parties; as a result, our consolidated average realized price per pound of molybdenum will differ from the amounts reported in this table.
b.Represents the combined total for our other segments as presented in Note 9. Also includes amounts associated with our molybdenum sales company, which includes sales of molybdenum produced by the Molybdenum mines and by certain of the North America copper mines and South America copper mines.operations.
Molybdenum Mines Product Revenues, Production Costs and Unit Net Cash Costs
| | | | | | | | | | | | | | | | | | | | | | | | | | |
| | | | | | | | |
| | Nine Months Ended September 30, | | |
| (In Millions) | | 2023 | | 2022 | | | | |
| | | | | | | | |
Revenues, excluding adjustmentsa | | $ | 539 | | | $ | 419 | | | | | |
Site production and delivery, before net noncash
and other costs shown below | | 308 | | | 241 | | | | | |
| Treatment charges and other | | 19 | | | 20 | | | | | |
| Net cash costs | | 327 | | | 261 | | | | | |
| DD&A | | 48 | | | 52 | | | | | |
| | | | | | | | |
| Noncash and other costs, net | | 13 | | | 8 | | | | | |
| Total costs | | 388 | | | 321 | | | | | |
| Gross profit | | $ | 151 | | | $ | 98 | | | | | |
| | | | | | | | |
Molybdenum sales (millions of recoverable pounds)a | | 22 | | | 23 | | | | | |
| | | | | | | | |
| Gross profit per pound of molybdenum: | | |
| | | | | | | | |
Revenues, excluding adjustmentsa | | $ | 25.17 | | | $ | 18.01 | | | | | |
Site production and delivery, before net noncash
and other costs shown below | | 14.39 | | | 10.37 | | | | | |
| Treatment charges and other | | 0.86 | | | 0.85 | | | | | |
| Unit net cash costs | | 15.25 | | | 11.22 | | | | | |
| DD&A | | 2.26 | | | 2.23 | | | | | |
| | | | | | | | |
| Noncash and other costs, net | | 0.61 | | | 0.37 | | | | | |
| Total unit costs | | 18.12 | | | 13.82 | | | | | |
| Gross profit per pound | | $ | 7.05 | | | $ | 4.19 | | | | | |
| | | | | | | | |
| Reconciliation to Amounts Reported | | | | | | | | |
| | | | | | | | |
| | | | Production | | | | |
| Nine Months Ended September 30, 2023 | | Revenues | | and Delivery | | DD&A | | |
| Totals presented above | | $ | 539 | | | $ | 308 | | | $ | 48 | | | |
| Treatment charges and other | | (19) | | | — | | | — | | | |
| Noncash and other costs, net | | — | | | 13 | | | — | | | |
| Molybdenum mines | | 520 | | | 321 | | | 48 | | | |
Other miningb | | 21,229 | | | 14,576 | | | 1,381 | | | |
| | | | | | | | |
| | | | | | | | |
| Corporate, other & eliminations | | (4,799) | | | (4,637) | | | 50 | | | |
| As reported in our consolidated financial statements | | $ | 16,950 | | | $ | 10,260 | | | $ | 1,479 | | | |
| | | | | | | | |
| Nine Months Ended September 30, 2022 | | | | | | | | |
| Totals presented above | | $ | 419 | | | $ | 241 | | | $ | 52 | | | |
| Treatment charges and other | | (20) | | | — | | | — | | | |
| Noncash and other costs, net | | — | | | 8 | | | — | | | |
| | | | | | | | |
| | | | | | | | |
| Molybdenum mines | | 399 | | | 249 | | | 52 | | | |
Other miningb | | 21,504 | | | 14,102 | | | 1,402 | | | |
| | | | | | | | |
| | | | | | | | |
| Corporate, other & eliminations | | (4,881) | | | (4,832) | | | 50 | | | |
| As reported in our consolidated financial statements | | $ | 17,022 | | | $ | 9,519 | | | $ | 1,504 | | | |
| | | | | | | | |
a.Reflects sales of the Molybdenum mines’ production to our molybdenum sales company at market-based pricing. On a consolidated basis, realizations are based on the actual contract terms for sales to third parties; as a result, our consolidated average realized price per pound of molybdenum will differ from the amounts reported in this table.
b.Represents the combined total for our other segments as presented in Note 9. Also includes amounts associated with our molybdenum sales company, which includes sales of molybdenum produced by the Molybdenum mines and by certain of the North America and South America copper mines.
CAUTIONARY STATEMENT
Our discussion and analysis contains forward-looking statements in which we discuss our potential future performance, operations and projects. Forward-looking statements are all statements other than statements of historical facts, such as plans, projections, or expectations relating to business outlook, strategy, goals or targets; global market conditions; ore grades and milling rates; production and sales volumes; unit net cash costs (credits) and operating costs; capital expenditures; operating plans; cash flows; liquidity; PT-FI’s financing, construction and completion of additional domestic smelting and refining capacity in Indonesia in accordance with the terms of its IUPK; extension of PT-FI’s IUPK beyond 2041 and2041; export licenses; PT-FI’s resumption of exports of anode slimes; payment of export duties; export volumes; our commitment to deliver responsibly produced copper and molybdenum, including plans to implement, validate and maintain validation of our operating sites under specific frameworks; execution of our energy and climate strategies and the underlying assumptions and estimated impacts on our business and stakeholders related thereto; achievement of 2030 climate targets and 2050 net zero aspiration; improvements in operating procedures and technology innovations and applications; exploration efforts and results; development and production activities, rates and costs; future organic growth opportunities; tax rates; the impact of copper, gold and molybdenum price changes; the impact of deferred intercompany profits on earnings; mineral reserve and mineral resource estimates; final resolution of settlements associated with ongoing legal and environmental proceedings; debt repurchases; and the ongoing implementation of our financial policy and future returns to shareholders, including dividend payments (base or variable) and share repurchases. The words “anticipates,” “may,” “can,” “plans,” “believes,” “estimates,” “expects,” “projects,” “targets,” “intends,” “likely,” “will,” “should,” “could,” “to be,” “potential,” “assumptions,” “guidance,” “aspirations,” “future,” “commitments,” “pursues,” “initiatives,” “objectives,” “opportunities,” “strategy” and any similar expressions are intended to identify those assertions as forward-looking statements. The declaration and payment of dividends (base or variable), and timing and amount of any share repurchases are at the discretion of theour Board and management, respectively, and are subject to a number of factors, including not exceeding our net debt target, capital availability, our financial results, cash requirements, global economic conditions, changes in laws, contractual restrictions and other factors deemed relevant by theour Board or management, as applicable. TheOur share repurchase program may be modified, increased, suspended or terminated at any time at the Board’s discretion.
We caution readers that forward-looking statements are not guarantees of future performance and actual results may differ materially from those anticipated, expected, projected or assumed in the forward-looking statements. Important factors that can cause our actual results to differ materially from those anticipated in the forward-looking statements include, but are not limited to, supply of and demand for, and prices of the commodities we produce, primarily copper; PT-FI’s ability to continue to export and sell copper concentrates and anode slimes; changes in export duties, including results of proceedings to dispute export duties; the Indonesia government’s approval of a deferred schedule for completion of additional domestic smelting and refining capacity in Indonesia; production rates; timing of shipments; price and availability of consumables and components we purchase as well as constraints on supply and logistics, and transportation services; changes in our cash requirements, financial position, financing or investment plans; changes in general market, economic, geopolitical, regulatory or industry conditions; reductions in liquidity and access to capital; changes in tax laws and regulations, including the impact of the Act; any major public health crisis;regulations; political and social risks, including the potential effects of violence in Indonesia, civil unrest in Peru, and relations with local communities and Indigenous Peoples; operational risks inherent in mining, with higher inherent risks in underground mining; mine sequencing; changes in mine plans or operational modifications, delays, deferrals or cancellations;cancellations, including the ability to smelt and refine; results of technical, economic or feasibility studies; potential inventory adjustments; potential impairment of long-lived mining assets; satisfaction of requirements in accordance with PT-FI's IUPK to extend mining rights from 2031 through 2041; discussions relating to the extension of PT-FI’s IUPK beyond 2041; cybersecurity incidents;risks; any major public health crisis; labor relations, including labor-related work stoppages and increased costs; compliance with applicable environmental, health and safety laws and regulations; weather- and climate-related risks; environmental risks, including availability of secure water supplies; litigation results; tailings management; our ability to comply with our responsible production commitments under specific frameworks and any changes to such frameworks and other factors described in more detail under the heading “Risk Factors” contained in Part I, Item 1A. of our 20222023 Form 10-K and Part II, Item 1A. herein.10-K.
Investors are cautioned that many of the assumptions upon which our forward-looking statements are based are likely to change after the date the forward-looking statements are made, including for example commodity prices, which we cannot control, and production volumes and costs or technological solutions and innovations, some aspects of which we may not be able to control. Further, we may make changes to our business plans that could affect our results. We caution investors that we undertake no obligation to update any forward-looking statements,
which speak only as of the date made, notwithstanding any changes in our assumptions, changes in business plans, actual experience or other changes.
This report on Form 10-Q also contains measures such as net debt and unit net cash costs (credits) per pound of copper and molybdenum, which are not recognized under U.S. GAAP. Refer to “Operations – Unit Net Cash Costs” and “Operations - Unit Net Cash (Credits) Costs” for further discussion of unit net cash costs (credits) associated with our operating divisions, and to “Product Revenues and Production Costs” for reconciliations of per pound costs by operating division to production and delivery costs applicable to sales reported in our consolidated financial statements. Refer to “Net Debt” for reconciliations of consolidated debt, consolidated cash and cash equivalents, and current restricted cash associated with PT-FI’s export proceeds to net debt.
Item 3.Quantitative and Qualitative Disclosures About Market Risk.
There have been no material changes in our market risks during the nine-monththree-month period ended September 30, 2023.March 31, 2024. For additional information on market risks, refer to “Disclosures About Market Risks” included in Part II, Items 7. and 7A. of our 20222023 Form 10-K. For projected sensitivities of our operating cash flow to changes in commodity prices, refer to “Outlook” in Part I, Item 2. of this quarterly report on Form 10-Q; for projected sensitivities of our provisionally priced copper sales to changes in commodity prices refer to “Consolidated Results – Revenues” in Part I, Item 2. of this quarterly report on Form 10-Q.
Item 4.Controls and Procedures.
(a)Evaluation of disclosure controls and procedures. Our chief executive officer and chief financial officer, with the participation of management, have evaluated the effectiveness of our “disclosure controls and procedures” (as defined in Rules 13a-15(e) and 15d-15(e) under the Securities Exchange Act of 1934) as of the end of the period covered by this quarterly report on Form 10-Q. Based on their evaluation, they have concluded that our disclosure controls and procedures were effective as of September 30, 2023.March 31, 2024.
(b)Changes in internal control over financial reporting. There has been no change in our internal control over financial reporting that occurred during the quarter ended September 30, 2023,March 31, 2024, that has materially affected, or is reasonably likely to materially affect, our internal control over financial reporting.
Part II.OTHER INFORMATION
Item 1.Legal Proceedings.
We are involved in numerous legal proceedings that arise in the ordinary course of our business or are associated with environmental issues. We are also involved periodically in reviews, inquiries, investigations and other proceedings initiated by or involving government agencies, some of which may result in adverse judgments, settlements, fines, penalties, injunctions or other relief.
Management does not believe, based on currently available information, that the outcome of any legal proceeding reported in Part I, Item 3. “Legal Proceedings” and Note 12 of our 20222023 Form 10-K, and Note 8 herein, will have a material adverse effect on our financial condition; although individual or cumulative outcomes could be material to our operating results for a particular period, depending on the nature and magnitude of the outcome and the operating results for the period.
There have been no material changes to legal proceedings previously disclosed in Part I, Item 3. “Legal Proceedings” and Note 12 of our 20222023 Form 10-K, except as described in10-K. Refer to Note 8 herein.for an update on our Louisiana parishes coastal erosion cases.
Item 1A. Risk Factors.
There have been no material changes to our risk factors previously disclosed in Part I, Item 1A. “Risk Factors” of our 20222023 Form 10-K, except for the updated risk factor included below, which should be read in conjunction with the risk factors set forth in our 2022 Form 10-K.
Our information technology systems have been and in the future may be adversely affected by cybersecurity events, disruptions, damage, failure and risks associated with implementation and integration.
Our industry has become increasingly supported by and dependent on digital technologies. Our strategy of operating large, long-lived, geographically diverse assets has been increasingly dependent on our ability to become fully integrated and highly automated. Many of our business and operational processes are heavily dependent on traditional and emerging technology systems to conduct day-to-day operations, improve safety and efficiency, and lower costs.
As our dependence on information systems, including those of our third-party service providers and vendors, grows, we become more vulnerable to an increasing threat of continually evolving cybersecurity risks. In recent years, cybersecurity events have increased in frequency and magnitude and the methods used to gain unauthorized access change frequently, making it increasingly difficult for us to prevent cybersecurity incidents or detect and remediate incidents in a timely and effective manner. Attacks have included and may include, but are not limited to, installation of malicious software, phishing, ransomware, social engineering tactics and credential attacks, insider threats, denial of service attacks, unauthorized access to data and other advanced and sophisticated cybersecurity breaches and threats, including those that increasingly target critical operational technologies and process control networks and those that use artificial intelligence. Such attacks may be perpetrated by a variety of bad actors, some of which may reside in jurisdictions where law enforcement measures to address such attacks are ineffective.
We have experienced targeted and non-targeted cybersecurity events in the past and may experience them in the future. In August 2023, we determined that we were subject to a cybersecurity incident that affected certain of our information systems, resulting in temporary disruptions to parts of our operations. We performed an investigation of the impact of the incident and incurred an immaterial amount of expenses in conjunction with the investigation.However, we cannot guarantee that events of a similar nature will not occur in the future.
Cybersecurity threats could subject us to manipulation or improper use of our systems and networks, production downtimes, loss of sales, communication interruption or other disruptions and delays to our operations or to the transportation of products or infrastructure utilized by our operations, unauthorized release of proprietary, commercially sensitive, confidential or otherwise protected information, a misappropriation or loss of funds, the corruption of data, significant health and safety consequences, environmental damage, loss of intellectual property, fines, penalties, litigation, regulatory or governmental investigation, liability under or termination of our contracts with third parties, damage to our reputation or financial losses from remedial actions, any of which could have a material adverse effect on our cash flows, results of operations and financial condition, and which could adversely impact the effectiveness of our internal controls over financial reporting. We do not maintain cyber risk insurance, and the lack of, or insufficiency of, insurance coverage could adversely affect our cash flows and overall profitability.
While the August 2023 cybersecurity incident and other cybersecurity events have not had a material impact on us, including our financial condition or results of operations, as of September 30, 2023, there can be no assurance that we will not experience any such impact or additional interruptions to our operations in the future. Given the unpredictability of the timing and the evolving nature and scope of information technology disruptions, the various procedures and controls we use to monitor and protect against these threats and to mitigate our potential risks to such threats have not been in some instances and may not be sufficient in preventing future cybersecurity events from materializing. Further, as cybersecurity threats continue to evolve, we may be required to expend significant additional resources to continue to modify or enhance our protective measures or to investigate and remediate vulnerabilities to cybersecurity threats.
We could also be adversely affected by system or network disruptions if new or upgraded information technology systems are defective, not installed properly or not properly integrated into our operations. System modification failures could have a material adverse effect on our business, financial position and results of operations and could, if not successfully implemented, adversely impact the effectiveness of our internal controls over financial reporting.
Further, we increasingly depend on our information technology infrastructure for electronic communications among our locations, personnel, customers and suppliers around the world, including as a result of remote working and flexible working arrangements. These information technology systems, some of which are managed by third parties that we do not control, may be susceptible to damage, disruptions or shutdowns because of failures during the process of upgrading or replacing software, databases or components thereof, cutover activities in our restructuring
and simplification initiatives, power outages, hardware failures, telecommunication failures, user errors, catastrophic events or other problems.
Item 2.Unregistered Sales of Equity Securities and Use of Proceeds, and Issuer Purchases of Equity Securities.Proceeds.
There were no unregistered sales of equity securities during the three monthsquarter ended September 30, 2023.March 31, 2024.
The following table sets forth information with respect to shares of FCX common stock purchased by us during the three monthsquarter ended September 30, 2023March 31, 2024, and the approximate dollar value of shares that may yet be purchased pursuant to our share repurchase program:
| | | | | | | | | | | | | | | | | | | | | | | | | | |
| Period | | (a) Total
Number of
Shares Purchased | | (b) Average
Price Paid Per Share | | (c) Total Number of Shares Purchased as Part of Publicly Announced Plans or Programsa | | (d) Approximate Dollar Value of Shares That May Yet Be Purchased Under the Plans or Programsa |
JulyJanuary 1-31, 20232024 | | — | | | $ | — | | | — | | | $ | 3,164,642,228 | |
August 1-31, 2023February 1-29, 2024 | | — | | | $ | — | | | — | | | $ | 3,164,642,228 | |
September 1-30, 2023March 1-31, 2024 | | — | | | $ | — | | | — | | | $ | 3,164,642,228 | |
| Total | | — | | | $ | — | | | — | | | |
a.On November 1, 2021, our Board approved a share repurchase program authorizing repurchases of up to $3.0 billion of our common stock. On July 19, 2022, our Board authorized an increase in the share repurchase program up to $5.0 billion. The share repurchase program does not obligate us to acquire any specific amount of shares and does not have an expiration date.
Item 4.Mine Safety Disclosures.
TheOur highest priority is the health, safety and well-being of our workforce. We believe health of all employees is our highest priority. Management believes thatand safety and health considerations are integral to, and compatible with,fundamental for, all other functions in theour organization, and we understand that properthe health and safety and health management will enhance production and reduce costs. Our approach towards the safety and health of our workforce is critical to continuously improve performanceour operational efficiency and long-term success. Our global health and safety strategy, “Safe Production Matters,” is focused on fatality prevention, eliminating systemic root causes of incidents and continuous improvement through implementing robust management systems, which are supported by leaders empowering our teams to work safely. Foundational to our Safe Production Matters strategy is our Fatal Risk Management (FRM) program. The goal of our FRM program is to achieve zero workplace fatalities by raising awareness to fatal risks and providing adequate training, safety incentive and occupational health programs.the measures necessary to mitigate them. The information concerning mine safety violations or other regulatory matters required by Section 1503(a) of the Dodd-Frank Wall Street Reform and Consumer Protection Act and Item 104 of Regulation S-K is included in Exhibit 95.1 to this quarterly report on Form 10-Q.
Item 5. Other Information.
During the quarter ended September 30, 2023,March 31, 2024, no director or officer of FCX adopted or terminated any “Rule 10b5-1 trading arrangement” or “non-Rule 10b5-1 trading arrangement,” as such terms are defined in Item 408(a) of Regulation S-K.
Item 6.Exhibits.
| | | | | | | | | | | | | | | | | |
| | | Filed | |
| Exhibit | | with this | Incorporated by Reference |
| Number | Exhibit Title | Form 10-Q | Form | File No. | Date Filed |
| PT-FI Divestment Agreement dated as of September 27, 2018 among FCX, International Support LLC, PT Freeport Indonesia, PT Indocopper Investama and PT Indonesia Asahan Aluminium (Persero). | | 10-Q | 001-11307-01 | 11/9/2018 |
| Supplemental and Amendment Agreement to the PT-FI Divestment Agreement, dated December 21, 2018, among FCX, PT Freeport Indonesia, PT Indonesia Papua Metal Dan Mineral (f/k/a PT Indocopper Investama), PT Indonesia Asahan Aluminium (Persero) and International Support LLC. | | 10-K | 001-11307-01 | 2/15/2019 |
| Amended and Restated Certificate of Incorporation of FCX, effective as of June 8, 2016. | | 8-K | 001-11307-01 | 6/9/2016 |
| Amended and Restated By-Laws of FCX, effective as of June 3, 2020. | | 8-K | 001-11307-01 | 6/3/2020 |
| Letter from Ernst & Young LLP regarding unaudited interim financial statements. | X | | | |
| List of Subsidiary Guarantors and Subsidiary Issuers of Guaranteed Securities. | | 10-K | 001-11307-01 | 2/15/202316/2024 |
| Certification of Principal Executive Officer pursuant to Rule 13a-14(a)/15d – 14(a)15d-14(a). | X | | | |
| Certification of Principal Financial Officer pursuant to Rule 13a-14(a)/15d – 14(a)15d-14(a). | X | | | |
| Certification of Principal Executive Officer pursuant to 18 U.S.C. Section 1350. | X | | | |
| Certification of Principal Financial Officer pursuant to 18 U.S.C Section 1350. | X | | | |
| Mine Safety and Health Administration Safety Data. | X | | | |
| 101.INS | XBRL Instance Document-Document - the XBRL Instance Document does not appear in the Interactive Data File because its XBRL tags are embedded within the Inline XBRL document. | X | | | |
| 101.SCH | Inline XBRL Taxonomy Extension Schema. | X | | | |
| 101.CAL | Inline XBRL Taxonomy Extension Calculation Linkbase. | X | | | |
| 101.DEF | Inline XBRL Taxonomy Extension Definition Linkbase. | X | | | |
| 101.LAB | Inline XBRL Taxonomy Extension Label Linkbase. | X | | | |
| 101.PRE | Inline XBRL Taxonomy Extension Presentation Linkbase. | X | | | |
| 104 | The cover page from this Quarterly Report on Form 10-Q, formatted in Inline XBRL.XBRL and contained in Exhibit 101. | X | | | |
* The registrant agrees to furnish supplementally to the Securities and Exchange Commission (SEC) a copy of any omitted schedule or exhibit upon the request of the SEC in accordance with Item 601(a)(5) of Regulation S-K.
SIGNATURE
Pursuant to the requirements of the Securities Exchange Act of 1934, the registrant has duly caused this report to be signed on its behalf by the undersigned thereunto duly authorized.
| | | | | | | | |
| Freeport-McMoRan Inc. |
| | |
| By: | /s/ Ellie L. Mikes |
| | Ellie L. Mikes |
| | Vice President and Chief Accounting Officer |
| | (authorized signatory |
| | and Principal Accounting Officer) |
Date: November 3, 2023May 8, 2024