(Mark One)
| x | |||||
| QUARTERLY REPORT PURSUANT TO SECTION 13 OR 15(d) OF THE SECURITIES EXCHANGE ACT OF 1934 | |||||
For the quarterly period ended September 30, 2017March 31, 2024
OR
| ¨ | |||||
| TRANSITION REPORT PURSUANT TO SECTION 13 OR 15(d) OF THE SECURITIES EXCHANGE ACT OF 1934 | |||||
For the transition period from to
Commission file number 1-10258
Tredegar Corporation
(Exact Name of Registrant as Specified in Its Charter)
| Virginia | 54-1497771 | |||||||
(State or Other Jurisdiction of Incorporation or Organization) | (I.R.S. Employer Identification No.) | |||||
1100 Boulders Parkway | |||||||||||
| Richmond, | Virginia | 23225 | |||||||||
| (Address of Principal Executive Offices) | (Zip Code) | ||||||||||
Registrant’s Telephone Number, Including Area Code: (804) 330-1000
Securities registered pursuant to Section 12(b) of the Act:
| Title of each class | Trading Symbol(s) | Name of each exchange on which registered | ||||||
| Common stock, no par value | ||||||||
| TG | New York Stock Exchange | |||||||
Indicate by check mark whether the registrant (1) has filed all reports required to be filed by Section 13 or 15(d) of the Securities Exchange Act of 1934 during the preceding 12 months (or for such shorter period that the registrant was required to file such reports), and (2) has been subject to such filing requirements for the past 90 days. Yes x No ¨
Indicate by check mark whether the registrant has submitted electronically and posted on its corporate Web site, if any, every Interactive Data File required to be submitted and posted pursuant to Rule 405 of Regulation S-T (232.405 of this chapter) during the preceding 12 months (or for such shorter period that the registrant was required to submit and post such files). Yes x No ¨
Indicate by check mark whether the registrant is a large accelerated filer, an accelerated filer, a non-accelerated filer, a smaller reporting company, or an emerging growth company. See the definitions of “large accelerated filer,” “accelerated filer,” “smaller reporting company,” and “emerging growth company” in Rule 12b-2 of the Exchange Act.
| Large accelerated filer | ¨ | Accelerated filer | x | Smaller reporting company | |||||||||||||||||||
| Non-accelerated filer | ¨ | Emerging growth company | |||||||||||||||||||||
If an emerging growth company, indicate by check mark if the registrant has elected not to use the extended transition period for complying with any new or revised financial accounting standards provided pursuant to Section 13(a) of the Exchange Act.¨
Indicate by check mark whether the registrant is a shell company (as defined in Rule 12b-2 of the Exchange Act). Yes ¨☐ No x
The number of shares of Common Stock, no par value, outstanding as of October 26, 2017: 33,026,931
May 3, 2024: 34,484,893
Tredegar Corporation
Table of Contents
| Page | |||||||||||
PART I - FINANCIAL INFORMATION
Tredegar Corporation
Condensed Consolidated Balance Sheets
(In Thousands, Except Share Data)
(Unaudited)
| September 30, | December 31, | ||||||
| 2017 | 2016 | ||||||
| Assets | |||||||
| Current assets: | |||||||
| Cash and cash equivalents | $ | 31,850 | $ | 29,511 | |||
| Accounts and other receivables, net of allowance for doubtful accounts and sales returns of $3,124 in 2017 and $3,102 in 2016 | 126,964 | 97,388 | |||||
| Income taxes recoverable | 8,260 | 7,518 | |||||
| Inventories | 82,426 | 66,069 | |||||
| Prepaid expenses and other | 8,354 | 7,738 | |||||
| Total current assets | 257,854 | 208,224 | |||||
| Property, plant and equipment, at cost | 881,139 | 797,630 | |||||
| Less accumulated depreciation | (571,062 | ) | (536,905 | ) | |||
| Net property, plant and equipment | 310,077 | 260,725 | |||||
| Goodwill and other intangibles, net | 188,334 | 151,423 | |||||
| Other assets and deferred charges | 55,683 | 30,790 | |||||
| Total assets | $ | 811,948 | $ | 651,162 | |||
| Liabilities and Shareholders’ Equity | |||||||
| Current liabilities: | |||||||
| Accounts payable | $ | 95,684 | $ | 81,342 | |||
| Accrued expenses | 41,776 | 38,647 | |||||
| Total current liabilities | 137,460 | 119,989 | |||||
| Long-term debt | 177,000 | 95,000 | |||||
| Deferred income taxes | 25,767 | 21,110 | |||||
| Other noncurrent liabilities | 97,807 | 104,280 | |||||
| Total liabilities | 438,034 | 340,379 | |||||
| Commitments and contingencies (Notes 1 and 12) | |||||||
| Shareholders’ equity: | |||||||
| Common stock, no par value (issued and outstanding - 33,026,931 at September 30, 2017 and 32,933,807 at December 31, 2016) | 34,027 | 32,007 | |||||
| Common stock held in trust for savings restoration plan (70,884 shares at September 30, 2017 and 69,622 shares at December 31, 2016) | (1,520 | ) | (1,497 | ) | |||
| Accumulated other comprehensive income (loss): | |||||||
| Foreign currency translation adjustment | (84,153 | ) | (93,970 | ) | |||
| Gain on derivative financial instruments | 1,151 | 863 | |||||
| Pension and other post-retirement benefit adjustments | (84,373 | ) | (90,127 | ) | |||
| Retained earnings | 508,782 | 463,507 | |||||
| Total shareholders’ equity | 373,914 | 310,783 | |||||
| Total liabilities and shareholders’ equity | $ | 811,948 | $ | 651,162 | |||
| March 31, | December 31, | ||||||||||
| 2024 | 2023 | ||||||||||
| Assets | |||||||||||
| Current assets: | |||||||||||
| Cash and cash equivalents | $ | 3,493 | $ | 9,660 | |||||||
| Restricted cash | 1,299 | 3,795 | |||||||||
| Accounts and other receivables, net | 73,032 | 67,938 | |||||||||
| Income taxes recoverable | 793 | 1,182 | |||||||||
| Inventories | 86,822 | 82,037 | |||||||||
| Prepaid expenses and other | 9,438 | 12,065 | |||||||||
| Total current assets | 174,877 | 176,677 | |||||||||
| Property, plant and equipment, at cost | 540,856 | 541,046 | |||||||||
| Less: accumulated depreciation | (362,884) | (357,591) | |||||||||
| Net property, plant and equipment | 177,972 | 183,455 | |||||||||
| Right-of-use leased assets | 16,761 | 11,848 | |||||||||
| Identifiable intangible assets, net | 9,364 | 9,851 | |||||||||
| Goodwill | 35,717 | 35,717 | |||||||||
| Deferred income taxes | 24,320 | 25,034 | |||||||||
| Other assets | 3,520 | 3,879 | |||||||||
| Total assets | $ | 442,531 | $ | 446,461 | |||||||
| Liabilities and Shareholders’ Equity | |||||||||||
| Current liabilities: | |||||||||||
| Accounts payable | $ | 84,925 | $ | 95,023 | |||||||
| Accrued expenses | 23,083 | 24,442 | |||||||||
| Lease liability, short-term | 2,871 | 2,107 | |||||||||
| ABL revolving facility (matures June 30, 2026) | 128,330 | 126,322 | |||||||||
| Income taxes payable | 225 | 1,210 | |||||||||
| Total current liabilities | 239,434 | 249,104 | |||||||||
| Lease liability, long-term | 15,318 | 10,942 | |||||||||
| Long-term debt | 20,000 | 20,000 | |||||||||
| Pension and other postretirement benefit obligations, net | 6,582 | 6,643 | |||||||||
| Other non-current liabilities | 4,382 | 4,119 | |||||||||
| Total liabilities | 285,716 | 290,808 | |||||||||
| Shareholders’ equity: | |||||||||||
| Common stock, no par value (authorized shares 150,000,000, issued and outstanding 34,533,870 shares at March 31, 2024 and 34,408,638 shares at December 31, 2023) | 61,959 | 61,606 | |||||||||
| Common stock held in trust for savings restoration plan (118,543 shares at March 31, 2024 and 118,543 shares at December 31, 2023) | (2,233) | (2,233) | |||||||||
| Accumulated other comprehensive income (loss): | |||||||||||
| Foreign currency translation adjustment | (84,985) | (83,037) | |||||||||
| Gain (loss) on derivative financial instruments | 297 | 801 | |||||||||
| Pension and other postretirement benefit adjustments | 512 | 539 | |||||||||
| Retained earnings | 181,265 | 177,977 | |||||||||
| Total shareholders’ equity | 156,815 | 155,653 | |||||||||
| Total liabilities and shareholders’ equity | $ | 442,531 | $ | 446,461 | |||||||
See accompanying notes to the condensed consolidated financial statements.
2
Tredegar Corporation
Condensed Consolidated Statements of Income (Loss)
(In Thousands, Except Per Share Data)
(Unaudited)
| Three Months Ended September 30, | Nine Months Ended September 30, | ||||||||||||||
| 2017 | 2016 | 2017 | 2016 | ||||||||||||
| Revenues and other items: | |||||||||||||||
| Sales | $ | 247,121 | $ | 207,702 | $ | 715,494 | $ | 623,569 | |||||||
| Other income (expense), net | 34 | 388 | 38,055 | 1,481 | |||||||||||
| 247,155 | 208,090 | 753,549 | 625,050 | ||||||||||||
| Costs and expenses: | |||||||||||||||
| Cost of goods sold | 196,393 | 166,622 | 575,614 | 499,504 | |||||||||||
| Freight | 8,621 | 7,153 | 24,840 | 21,221 | |||||||||||
| Selling, general and administrative | 21,214 | 17,383 | 63,438 | 57,027 | |||||||||||
| Research and development | 4,455 | 4,519 | 14,028 | 14,458 | |||||||||||
| Amortization of intangibles | 1,658 | 1,019 | 4,550 | 2,965 | |||||||||||
| Interest expense | 1,757 | 886 | 4,579 | 2,918 | |||||||||||
| Asset impairments and costs associated with exit and disposal activities, net of adjustments | 361 | 1,129 | 653 | 2,355 | |||||||||||
| Total | 234,459 | 198,711 | 687,702 | 600,448 | |||||||||||
| Income before income taxes | 12,696 | 9,379 | 65,847 | 24,602 | |||||||||||
| Income taxes (benefit) | 4,422 | (2,669 | ) | 9,667 | 1,864 | ||||||||||
| Net income | $ | 8,274 | $ | 12,048 | $ | 56,180 | $ | 22,738 | |||||||
Earnings per share: | |||||||||||||||
| Basic | $ | 0.25 | $ | 0.37 | $ | 1.71 | $ | 0.69 | |||||||
| Diluted | $ | 0.25 | $ | 0.37 | $ | 1.70 | $ | 0.69 | |||||||
| Shares used to compute earnings per share: | |||||||||||||||
| Basic | 32,954 | 32,818 | 32,945 | 32,730 | |||||||||||
| Diluted | 32,954 | 32,828 | 32,952 | 32,733 | |||||||||||
| Dividends per share | $ | 0.11 | $ | 0.11 | $ | 0.33 | $ | 0.33 | |||||||
| Three Months Ended March 31, | |||||||||||||||||||||||
| 2024 | 2023 | ||||||||||||||||||||||
| Revenues and other items: | |||||||||||||||||||||||
| Sales | $ | 175,736 | $ | 191,122 | |||||||||||||||||||
| Other income (expense), net | 8 | 280 | |||||||||||||||||||||
| 175,744 | 191,402 | ||||||||||||||||||||||
| Costs and expenses: | |||||||||||||||||||||||
| Cost of goods sold | 142,043 | 159,525 | |||||||||||||||||||||
| Freight | 6,666 | 6,043 | |||||||||||||||||||||
| Selling, general and administrative | 18,258 | 19,006 | |||||||||||||||||||||
| Research and development | 352 | 1,205 | |||||||||||||||||||||
| Amortization of identifiable intangibles | 464 | 503 | |||||||||||||||||||||
| Pension and postretirement benefits | 54 | 3,418 | |||||||||||||||||||||
| Interest expense | 3,455 | 2,311 | |||||||||||||||||||||
| Asset impairments and costs associated with exit and disposal activities, net of adjustments | 507 | 69 | |||||||||||||||||||||
| Total | 171,799 | 192,080 | |||||||||||||||||||||
| Income (loss) before income taxes | 3,945 | (678) | |||||||||||||||||||||
| Income tax expense (benefit) | 657 | 331 | |||||||||||||||||||||
| Net income (loss) | $ | 3,288 | $ | (1,009) | |||||||||||||||||||
| Earnings (loss) per share: | |||||||||||||||||||||||
| Basic | $ | 0.10 | $ | (0.03) | |||||||||||||||||||
| Diluted | $ | 0.10 | $ | (0.03) | |||||||||||||||||||
| Shares used to compute earnings (loss) per share: | |||||||||||||||||||||||
| Basic | 34,323 | 33,895 | |||||||||||||||||||||
| Diluted | 34,323 | 33,895 | |||||||||||||||||||||
See accompanying notes to the condensed consolidated financial statements.
3
Tredegar Corporation
Condensed Consolidated Statements of Comprehensive Income (Loss)
(In Thousands)
(Unaudited)
| Three Months Ended March 31, | |||||||||||
| 2024 | 2023 | ||||||||||
| Net income (loss) | $ | 3,288 | $ | (1,009) | |||||||
| Other comprehensive income (loss): | |||||||||||
| Unrealized foreign currency translation adjustment (net of tax expense of $221 in 2024 and net of tax expense of $436 in 2023) | (1,948) | 1,120 | |||||||||
| Derivative financial instruments adjustment (net of tax benefit of $140 in 2024 and net of tax expense of $836 in 2023) | (504) | 1,269 | |||||||||
| Amortization of prior service costs and net gains or losses (net of tax benefit of $8 in 2024 and net of tax expense of $637 in 2023) | (27) | 2,287 | |||||||||
| Other comprehensive income (loss) | (2,479) | 4,676 | |||||||||
| Comprehensive income (loss) | $ | 809 | $ | 3,667 | |||||||
| Three Months Ended September 30, | |||||||
| 2017 | 2016 | ||||||
| Net income | $ | 8,274 | $ | 12,048 | |||
| Other comprehensive income (loss): | |||||||
| Foreign currency translation adjustment (net of tax of $251 in 2017 and tax benefit of $77 in 2016) | 7,143 | (719 | ) | ||||
| Derivative financial instruments adjustment (net of tax of $186 in 2017 and tax benefit of $31 in 2016) | 326 | (54 | ) | ||||
| Amortization of prior service costs and net gains or losses (net of tax of $1,057 in 2017 and tax of $1,120 in 2016) | 1,854 | 1,966 | |||||
| Other comprehensive income (loss) | 9,323 | 1,193 | |||||
| Comprehensive income (loss) | $ | 17,597 | $ | 13,241 | |||
| Nine Months Ended September 30, | |||||||
| 2017 | 2016 | ||||||
| Net income | $ | 56,180 | $ | 22,738 | |||
| Other comprehensive income (loss): | |||||||
| Foreign currency translation adjustment (net of tax of $481 in 2017 and tax benefit of $307 in 2016) | 9,817 | 22,929 | |||||
| Derivative financial instruments adjustment (net of tax of $162 in 2017 and tax of $567 in 2016) | 288 | 963 | |||||
| Amortization of prior service costs and net gains or losses (net of tax of $3,279 in 2017 and tax of $3,186 in 2016) | 5,754 | 6,573 | |||||
| Other comprehensive income (loss) | 15,859 | 30,465 | |||||
| Comprehensive income (loss) | $ | 72,039 | $ | 53,203 | |||
See accompanying notes to the condensed consolidated financial statements.
4
Tredegar Corporation
Condensed Consolidated Statements of Cash Flows
(In Thousands)
(Unaudited)
| Nine Months Ended September 30, | |||||||
| 2017 | 2016 | ||||||
| Cash flows from operating activities: | |||||||
| Net income | $ | 56,180 | $ | 22,738 | |||
| Adjustments for noncash items: | |||||||
| Depreciation | 25,072 | 21,004 | |||||
| Amortization of intangibles | 4,550 | 2,965 | |||||
| Deferred income taxes | (104 | ) | (5,122 | ) | |||
| Accrued pension and post-retirement benefits | 7,645 | 8,168 | |||||
| (Gain)/loss on investment accounted for under the fair value method | (24,800 | ) | 200 | ||||
| (Gain)/loss on asset impairments and divestitures | 50 | 412 | |||||
| Net (gain)/loss on disposal of assets | 412 | — | |||||
| Gain from insurance recoveries | — | (1,634 | ) | ||||
| Changes in assets and liabilities, net of effects of acquisitions and divestitures: | |||||||
| Accounts and other receivables | (16,925 | ) | (4,919 | ) | |||
| Inventories | (4,220 | ) | (5,188 | ) | |||
| Income taxes recoverable/payable | (603 | ) | (4,095 | ) | |||
| Prepaid expenses and other | 129 | (514 | ) | ||||
| Accounts payable and accrued expenses | 8,674 | 4,857 | |||||
| Pension and postretirement benefit plan contributions | (4,642 | ) | (7,143 | ) | |||
| Other, net | 2,093 | 2,818 | |||||
| Net cash provided by operating activities | 53,511 | 34,547 | |||||
| Cash flows from investing activities: | |||||||
| Capital expenditures | (37,245 | ) | (30,912 | ) | |||
| Acquisition | (87,110 | ) | — | ||||
| Proceeds from the sale of assets and other | 121 | 1,399 | |||||
| Net cash used in investing activities | (124,234 | ) | (29,513 | ) | |||
| Cash flows from financing activities: | |||||||
| Borrowings | 173,250 | 61,000 | |||||
| Debt principal payments | (91,250 | ) | (73,250 | ) | |||
| Dividends paid | (10,901 | ) | (10,834 | ) | |||
| Debt financing costs | — | (2,509 | ) | ||||
| Proceeds from exercise of stock options and other | 695 | 1,948 | |||||
| Net cash provided by (used in) financing activities | 71,794 | (23,645 | ) | ||||
| Effect of exchange rate changes on cash | 1,268 | 2,811 | |||||
| Increase (decrease) in cash and cash equivalents | 2,339 | (15,800 | ) | ||||
| Cash and cash equivalents at beginning of period | 29,511 | 44,156 | |||||
| Cash and cash equivalents at end of period | $ | 31,850 | $ | 28,356 | |||
| Three Months Ended March 31, | |||||||||||
| 2024 | 2023 | ||||||||||
| Cash flows from operating activities: | |||||||||||
| Net income (loss) | $ | 3,288 | $ | (1,009) | |||||||
| Adjustments for noncash items: | |||||||||||
| Depreciation | 6,252 | 6,340 | |||||||||
| Amortization of identifiable intangibles | 464 | 503 | |||||||||
| Reduction of right-of-use lease asset | 610 | 551 | |||||||||
| Deferred income taxes | 623 | 411 | |||||||||
| Accrued pension and post-retirement benefits | 54 | 3,418 | |||||||||
| Stock-based compensation expense | 686 | 186 | |||||||||
| Gain on investment in kaléo | — | (262) | |||||||||
| Changes in assets and liabilities: | |||||||||||
| Accounts and other receivables | (5,337) | (4,320) | |||||||||
| Inventories | (5,481) | 14,840 | |||||||||
| Income taxes recoverable/payable | (580) | (1,156) | |||||||||
| Prepaid expenses and other | 1,890 | 1,816 | |||||||||
| Accounts payable and accrued expenses | (10,306) | (28,977) | |||||||||
| Lease liability | (689) | (558) | |||||||||
| Pension and postretirement benefit plan contributions | (158) | (154) | |||||||||
| Other, net | 965 | (737) | |||||||||
| Net cash provided by (used in) operating activities | (7,719) | (9,108) | |||||||||
| Cash flows from investing activities: | |||||||||||
| Capital expenditures | (2,461) | (9,025) | |||||||||
| Proceeds from the sale of kaléo | — | 262 | |||||||||
| Proceeds from the sale of assets | 83 | — | |||||||||
| Net cash provided by (used in) investing activities | (2,378) | (8,763) | |||||||||
| Cash flows from financing activities: | |||||||||||
| Borrowings | 179,248 | 37,250 | |||||||||
| Debt principal payments | (177,240) | (19,250) | |||||||||
| Dividends paid | — | (4,419) | |||||||||
| Net cash provided by (used in) financing activities | 2,008 | 13,581 | |||||||||
| Effect of exchange rate changes on cash | (574) | 83 | |||||||||
| Increase (decrease) in cash, cash equivalents and restricted cash | (8,663) | (4,207) | |||||||||
| Cash, cash equivalents and restricted cash at beginning of period | 13,455 | 19,232 | |||||||||
| Cash, cash equivalents and restricted cash at end of period | $ | 4,792 | $ | 15,025 | |||||||
See accompanying notes to the condensed consolidated financial statements.
5
Tredegar Corporation
Condensed Consolidated StatementStatements of Shareholders’ Equity
(In Thousands, Except Share and Per Share Data)
(Unaudited)
The following summarizes the changes in shareholders’ equity for the three month period ended March 31, 2024:
Accumulated Other Comprehensive Income (Loss) | |||||||||||||||||||||||||||
Common Stock | Retained Earnings | Trust for Savings Restoration Plan | Foreign Currency Translation | Gain (Loss) on Derivative Financial Instruments | Pension & Other Post-retirement Benefit Adjust. | Total Shareholders’ Equity | |||||||||||||||||||||
| Balance at January 1, 2017 | $ | 32,007 | $ | 463,507 | $ | (1,497 | ) | $ | (93,970 | ) | $ | 863 | $ | (90,127 | ) | $ | 310,783 | ||||||||||
| Net income | — | 56,180 | — | — | — | — | 56,180 | ||||||||||||||||||||
| Other comprehensive income (loss): | |||||||||||||||||||||||||||
| Foreign currency translation adjustment (net of tax of $481) | — | — | — | 9,817 | — | — | 9,817 | ||||||||||||||||||||
| Derivative financial instruments adjustment (net of tax of $162) | — | — | — | — | 288 | — | 288 | ||||||||||||||||||||
| Amortization of prior service costs and net gains or losses (net of tax of $3,279) | — | — | — | — | — | 5,754 | 5,754 | ||||||||||||||||||||
| Cash dividends declared ($0.33 per share) | — | (10,901 | ) | — | — | — | — | (10,901 | ) | ||||||||||||||||||
| Stock-based compensation expense | 1,298 | — | — | — | — | — | 1,298 | ||||||||||||||||||||
| Issued upon exercise of stock options & other | 695 | — | — | — | — | — | 695 | ||||||||||||||||||||
| Cumulative effect adjustment for adoption of stock-based comp accounting guidance | 27 | (27 | ) | — | — | — | — | — | |||||||||||||||||||
| Tredegar common stock purchased by trust for savings restoration plan | — | 23 | (23 | ) | — | — | — | — | |||||||||||||||||||
| Balance at September 30, 2017 | $ | 34,027 | $ | 508,782 | $ | (1,520 | ) | $ | (84,153 | ) | $ | 1,151 | $ | (84,373 | ) | $ | 373,914 | ||||||||||
| Common Stock | Retained Earnings | Trust for Savings Restoration Plan | Accumulated Other Comprehensive Income (Loss) | Total Shareholders’ Equity | |||||||||||||||||||||||||
| Balance January 1, 2024 | $ | 61,606 | $ | 177,977 | $ | (2,233) | $ | (81,697) | $ | 155,653 | |||||||||||||||||||
| Net income (loss) | — | 3,288 | — | — | 3,288 | ||||||||||||||||||||||||
| Foreign currency translation adjustment | — | — | — | (1,948) | (1,948) | ||||||||||||||||||||||||
| Derivative financial instruments adjustment | — | — | — | (504) | (504) | ||||||||||||||||||||||||
| Amortization of prior service costs and net gains or losses | — | — | — | (27) | (27) | ||||||||||||||||||||||||
| Stock-based compensation expense | 579 | — | — | — | 579 | ||||||||||||||||||||||||
| Repurchase of employee common stock for tax withholdings | (226) | — | — | — | (226) | ||||||||||||||||||||||||
| Balance March 31, 2024 | $ | 61,959 | $ | 181,265 | $ | (2,233) | $ | (84,176) | $ | 156,815 | |||||||||||||||||||
The following summarizes the changes in shareholders’ equity for the three month period ended March 31, 2023:
| Common Stock | Retained Earnings | Trust for Savings Restoration Plan | Accumulated Other Comprehensive Income (Loss) | Total Shareholders’ Equity | |||||||||||||||||||||||||
| Balance at January 1, 2023 | $ | 58,824 | $ | 292,721 | $ | (2,188) | $ | (147,595) | $ | 201,762 | |||||||||||||||||||
| Net income (loss) | — | (1,009) | — | — | (1,009) | ||||||||||||||||||||||||
| Foreign currency translation adjustment | — | — | — | 1,120 | 1,120 | ||||||||||||||||||||||||
| Derivative financial instruments adjustment | — | — | — | 1,269 | 1,269 | ||||||||||||||||||||||||
| Amortization of prior service costs and net gains or losses | — | — | — | 2,287 | 2,287 | ||||||||||||||||||||||||
| Cash dividends declared ($0.13 per share) | — | (4,419) | — | — | (4,419) | ||||||||||||||||||||||||
| Stock-based compensation expense | 853 | — | — | — | 853 | ||||||||||||||||||||||||
| Repurchase of employee common stock for tax withholdings | (254) | (254) | |||||||||||||||||||||||||||
| Tredegar common stock purchased by trust for savings restoration plan | — | 15 | (15) | — | — | ||||||||||||||||||||||||
| Balance at March 31, 2023 | $ | 59,423 | $ | 287,308 | $ | (2,203) | $ | (142,919) | $ | 201,609 | |||||||||||||||||||
See accompanying notes to the condensed consolidated financial statements.
6
TREDEGAR CORPORATION
NOTES TO THE CONDENSED CONSOLIDATED INTERIM FINANCIAL STATEMENTS
(Unaudited)
1. BASIS OF PRESENTATION In the opinion of management, the accompanying condensed consolidated financial statements of Tredegar Corporation and its subsidiaries (“Tredegar,” “the Company,” “we,” “us” or “our”) contain all adjustments necessary to state fairly, in all material respects, Tredegar’s condensed consolidated financial position as of March 31, 2024, the condensed consolidated results of operations for the three months ended March 31, 2024 and 2023, the condensed consolidated cash flows for the three months ended March 31, 2024 and 2023, and the condensed consolidated changes in shareholders’ equity for the three months ended March 31, 2024 and 2023, in accordance with U.S. generally accepted accounting principles (“GAAP”). All such adjustments, unless otherwise detailed in the notes to the condensed consolidated |
The Company operates on a calendar fiscal year except for the Aluminum Extrusions segment, which operates on a 52/53-week fiscal year basis. As such, the fiscal thirdfirst quarter for 20172024 and 20162023 for this segment references 13-week periods ended September 24, 2017March 31, 2024 and September 25, 2016,March 26, 2023, respectively. The Company does not believe the impact of reporting the results of this segment as stated above is material to the consolidated financial results.
The Company may fund or receive cash from the Aluminum Extrusions segment based on Aluminum Extrusion’s cash flows from operations during the intervening period from Aluminum Extrusion’s fiscal quarter end and the Company’s fiscal quarter end.
The condensed consolidated financial position datastatements as of December 31, 20162023 that is included herein was derived from the audited consolidated financial statements provided in the Company’s Annual Report on Form 10-K for the year ended December 31, 20162023 (“20162023 Form 10-K”) but does not include all disclosures required by United States generally accepted accounting principles (“GAAP”).GAAP. These financial statements should be read in conjunction with the audited consolidated financial statements and related notes included in the Company’s 20162023 Form 10-K.
The results of operations for the three and nine months ended September 30, 2017,March 31, 2024, are not necessarily indicative of the results to be expected for the full year. Certain prior year balances
Sale of Flexible Packaging Films
On September 1, 2023, the Company announced that it had entered into a definitive agreement to sell its Flexible Packaging Films business (also referred to as "Terphane") to Oben Group (the “Contingent Terphane Sale”). Completion of the sale is contingent upon the satisfaction of customary closing conditions, including the receipt of certain competition filing approvals by authorities in Brazil and Colombia. On October 27, 2023, the Company filed the requisite competition forms with the Administrative Council for Economic Defense (“CADE”) in Brazil. The regulatory review process is ongoing and in line with the Company’s expectations. CADE’s maximum deadline for completing its review is no later than November 18, 2024. The merger review regarding the transaction was cleared by the Colombian authority in early February 2024.
Closure of PE Films Technical Center
In August 2023, the Company adopted a plan to close the PE Films technical center in Richmond, VA and reduce its efforts to develop and sell films supporting the semiconductor market. Future research & development activities for PE Films will be performed at the production facility in Pottsville, PA. PE Films continues to have been reclassifiednew business opportunities primarily relating to conformsurface protection films that protect components of flat panel and flexible displays. All activities ceased at the PE Films technical center in Richmond, VA as of the end of the first quarter of 2024. The Company recognized expense incurred through March 31, 2024 associated with current year presentation (see Note 13the exit activities of $0.2 million for additional detail)building closure costs. In addition, the Company recognized a non-cash loss on the lease abandonment ($0.3 million).
7
Supply Chain Financing
Accounting standards not yet adopted
In October 2023, the Financial Accounting Standards Board ("FASB") issued Accounting Standards Update ("ASU") 2023-06 to amend various paragraphs in the westernAccounting Standards Codification ("ASC") to primarily reflect the issuance of U.S., designs Securities and manufactures a wide rangeExchange Commission ("SEC") Staff Bulletin No. 33-10532. ASU 2023-06 will impact various disclosure areas, including the statement of extruded aluminum products, including branded flooring trimscash flows, accounting changes and TSLOTSTM, as well as OEM (original equipment manufacturer) components for truck grills, solar panels, fitness equipmenterror corrections, earnings per share, debt, equity, derivatives, and other applications. As a resulttransfers of financial assets. The amendments in this transaction, Futura is now a wholly-owned subsidiary of the William L. Bonnell Company, Inc. (which is a wholly-owned subsidiary of Tredegar) and operates as a division of Bonnell Aluminum, and its results of operations are included in Tredegar’s consolidated financial statements fromASU 2023-06 will be effective on the date of acquisition.
| (in Thousands) | |||
| Accounts receivable | $ | 6,680 | |
| Inventories | 10,342 | ||
| Prepaid expenses and other current assets | 240 | ||
| Property, plant & equipment | 32,662 | ||
| Identifiable intangible assets: | |||
| Customer relationships | 24,000 | ||
| Trade names | 6,700 | ||
| Trade payables & accrued expenses | (8,135 | ) | |
| Total identifiable net assets | 72,489 | ||
| Adjusted Net Purchase Price | 82,860 | ||
| Goodwill | $ | 10,371 | |
In November 2023, the FASB issued ASU 2023-07 to improve reportable segment disclosure and requirements, primarily through the enhanced disclosures about significant segment expenses. ASU 2023-07 expands public entities’ segment disclosures by requiring disclosure of significant segment expenses that are regularly provided to the chief operating decision maker ("CODM") and included within each reported measure of segment profit or loss, an amount and description of its strong name recognitioncomposition for other segment items, and competitive advantageinterim disclosures of a reportable segment’s profit or loss and assets. This ASU is effective for fiscal years beginning after December 15, 2023 and interim period beginning after December 15, 2024, with early adoption permitted. The amendments in this ASU are to be applied retrospectively to all prior periods presented in the financial statements. The Company is currently evaluating the impact of this standard on our consolidated financial statements and related disclosures.
In December 2023, the FASB issued ASU 2023-09 to improve the income tax disclosures related to the rate reconciliation and income taxes paid information and to improve the effectiveness of income tax disclosures. The amendments in this ASU will require the Company to disclose specified additional information in its target markets.
2. ACCOUNTS AND OTHER RECEIVABLES
As of March 31, 2024 and December 31, 2023, accounts and other receivables, net include the following:
| (In thousands) | March 31, 2024 | December 31, 2023 | |||||||||
| Customer receivables | $ | 73,333 | $ | 67,183 | |||||||
| Other receivables | 1,754 | 3,056 | |||||||||
| Total accounts and other receivables | 75,087 | 70,239 | |||||||||
| Less: Allowance for bad debts | (2,055) | (2,301) | |||||||||
| Total accounts and other receivables, net | $ | 73,032 | $ | 67,938 | |||||||
3. INVENTORIES
The components of inventories are as iffollows:
| (In thousands) | March 31, 2024 | December 31, 2023 | |||||||||
| Finished goods | $ | 28,939 | $ | 29,821 | |||||||
| Work-in-process | 9,835 | 7,830 | |||||||||
| Raw materials | 25,182 | 21,939 | |||||||||
| Stores, supplies and other | 22,866 | 22,447 | |||||||||
| Total | $ | 86,822 | $ | 82,037 | |||||||
8
4. PENSION AND OTHER POSTRETIREMENT BENEFITS
Tredegar sponsored a noncontributory defined benefit (pension) plan covering certain current and former U.S. employees. As of January 31, 2018, the acquisitionplan no longer accrued benefits associated with crediting employees for service, thereby freezing all future benefits under the plan. On February 10, 2022, Tredegar announced the initiation of Futura had been consummated ata process to terminate and settle its frozen defined benefit pension plan through lump sum distributions and the beginningpurchase of 2016,annuity contracts. On November 3, 2023, the pension plan termination and is not necessarily indicative of the Company’s financial performance if the acquisition had actually been consummated as of that date, or of future performance. The supplemental unaudited pro forma measures for the three and nine months ended September 30, 2017 and 2016 are presented below:
| Tredegar Pro Forma Results with Futura Acquisition | Three Months Ended | Nine Months Ended | |||||||||||||
| September 30, | September 30, | ||||||||||||||
| (In Thousands, Except Per Share Data) | 2017 | 2016 | 2017 | 2016 | |||||||||||
| Sales | $ | 247,121 | $ | 228,176 | $ | 722,505 | $ | 681,686 | |||||||
| Net income | $ | 8,274 | $ | 13,225 | $ | 55,835 | $ | 25,559 | |||||||
| Earnings per share: | |||||||||||||||
| Basic | $ | 0.25 | $ | 0.40 | $ | 1.69 | $ | 0.78 | |||||||
| Diluted | $ | 0.25 | $ | 0.40 | $ | 1.69 | $ | 0.78 | |||||||
Tredegar also has a non-qualified supplemental pension plan covering certain employees. Effective December 31, 2005, further participation in this plan was terminated and benefit accruals for existing participants were frozen. Pension expense recognized for this plan was immaterial in the three months ended March 31, 2024 and 2023. This information has been included in the pension benefit table below.
The components of net periodic benefit cost for the Company applied at an annual rate of 3.0% to the $87.0 million Initial Cash Funding, minus (v) the pro forma pre-acquisition period income taxes applied at a rate of 39.1% to the pro forma pre-acquisition earnings before income taxes computed from items (ii) through (iv).
| Pension Benefits | Other Post-Retirement Benefits | ||||||||||||||||||||||
| Three Months Ended March 31, | Three Months Ended March 31, | ||||||||||||||||||||||
| (In thousands) | 2024 | 2023 | 2024 | 2023 | |||||||||||||||||||
| Service cost | $ | — | $ | — | $ | 3 | $ | 3 | |||||||||||||||
| Interest cost | 19 | 3,027 | 67 | 71 | |||||||||||||||||||
| Expected return on plan assets | — | (2,607) | — | — | |||||||||||||||||||
| Amortization of prior service costs, (gains) losses and net transition asset | 5 | 2,983 | (40) | (59) | |||||||||||||||||||
| Net periodic benefit cost | $ | 24 | $ | 3,403 | $ | 30 | $ | 15 | |||||||||||||||
Pension and other postretirement liabilities were $7.2 million and $7.3 million at March 31, 2024 and December 31, 2023, respectively ($0.6 million and $0.7 million included in “Accrued expenses” at March 31, 2024 and December 31, 2023, respectively, with the remainder included in “Pension and other postretirement benefit obligations, net” in the condensed consolidated balance sheets).
| (In Thousands) | Severance (a) | Asset Impairments | Other (b) | Total | |||||||||||
| Balance at January 1, 2017 | $ | 1,854 | $ | — | $ | 554 | $ | 2,408 | |||||||
| Changes in 2017: | |||||||||||||||
| Charges | 300 | 50 | 303 | 653 | |||||||||||
| Cash spent | (1,068 | ) | — | (307 | ) | (1,375 | ) | ||||||||
| Charges against assets | — | (50 | ) | — | (50 | ) | |||||||||
| Balance at September 30, 2017 | $ | 1,086 | $ | — | $ | 550 | $ | 1,636 | |||||||
(a) Severance primarily includes severance payments associated with the consolidation of North American PE Films manufacturing facilities. (b) Other primarily includes other shutdown-related costs associated with the shutdown and sale of the Company’s aluminum extrusions manufacturing facility in Kentland, Indiana. | |||||||||||||||
5. EARNINGS PER SHARE
Basic earnings per share is computed by dividing net income (loss) by the restructuring were $1.4 million inweighted average number of shares of common stock outstanding. Diluted earnings per share is computed by dividing net income (loss) by the first nine months of 2017, which includes capital expenditures of $0.1 million. Total cash expenditures for the project since inception were $15.5 million, which includes $11.2 million for capital expenditures. Additional cash payments for remaining accrued costs of approximately $1 million are expected to be paid within the next 12 months.
| September 30, | December 31, | |||||||
| (In Thousands) | 2017 | 2016 | ||||||
| Finished goods | $ | 21,442 | $ | 16,215 | ||||
| Work-in-process | 10,695 | 8,590 | ||||||
| Raw materials | 32,061 | 23,733 | ||||||
| Stores, supplies and other | 18,228 | 17,531 | ||||||
| Total | $ | 82,426 | $ | 66,069 | ||||
| Three Months Ended | Nine Months Ended | ||||||||||
| September 30, | September 30, | ||||||||||
| (In Thousands) | 2017 | 2016 | 2017 | 2016 | |||||||
| Weighted average shares outstanding used to compute basic earnings per share | 32,954 | 32,818 | 32,945 | 32,730 | |||||||
| Incremental dilutive shares attributable to stock options and restricted stock | — | 10 | 7 | 3 | |||||||
| Shares used to compute diluted earnings per share | 32,954 | 32,828 | 32,952 | 32,733 | |||||||
| Three Months Ended March 31, | |||||||||||||||||||||||
| (In thousands) | 2024 | 2023 | |||||||||||||||||||||
| Weighted average shares outstanding used to compute basic earnings per share | 34,323 | 33,895 | |||||||||||||||||||||
| Incremental dilutive shares attributable to stock options and restricted stock | — | — | |||||||||||||||||||||
| Shares used to compute diluted earnings per share | 34,323 | 33,895 | |||||||||||||||||||||
Incremental shares attributable to stock options and restricted stock are computed under the treasury stock method using the average market price during the related period. ForAverage out-of-the-money options to purchase shares that were excluded from the calculation of incremental shares attributable to stock options and restricted stock were 2,870,670 for the three and nine months ended September 30, 2017,March 31, 2024. If the Company had reported net income for the three months ended March 31, 2023, the average out-of-the-money options to purchase shares that were excluded from the calculation of incremental shares attributable to stock options and restricted stock were 479,651 and 386,729, respectively. For the three and nine months ended September 30, 2016, average out-of-the-money options to purchase shares that were excluded from the calculation of incremental shares attributable to stock options and restricted stock were 493,119 and 643,010, respectively.would have been 2,645,365.
9
| (In Thousands) | Foreign currency translation adjustment | Gain (loss) on derivative financial instruments | Pension and other post-retirement benefit adjustments | Total | |||||||||||
| Beginning balance, January 1, 2017 | $ | (93,970 | ) | $ | 863 | $ | (90,127 | ) | $ | (183,234 | ) | ||||
| Other comprehensive income (loss) before reclassifications | 9,817 | 817 | — | 10,634 | |||||||||||
| Amounts reclassified from accumulated other comprehensive income (loss) | — | (529 | ) | 5,754 | 5,225 | ||||||||||
| Net other comprehensive income (loss) - current period | 9,817 | 288 | 5,754 | 15,859 | |||||||||||
| Ending balance, September 30, 2017 | $ | (84,153 | ) | $ | 1,151 | $ | (84,373 | ) | $ | (167,375 | ) | ||||
6. ACCUMULATED OTHER COMPREHENSIVE INCOME (LOSS)
The following table summarizes the after-tax changes in accumulated other comprehensive income (loss) by component for the ninethree months ended September 30, 2016:March 31, 2024.
| (In thousands) | Foreign Currency Translation | Gain (Loss) on Derivative Financial Instruments | Pension & Other Postretirement Benefit Adjust | Total Accumulated Other Comprehensive Income (Loss) | |||||||||||||||||||
| Balance at January 1, 2024 | $ | (83,037) | $ | 801 | $ | 539 | $ | (81,697) | |||||||||||||||
| Other comprehensive income (loss) | (1,727) | 282 | — | (1,445) | |||||||||||||||||||
| Income tax (expense) benefit | (221) | (112) | — | (333) | |||||||||||||||||||
| Other comprehensive income (loss), net of tax | (1,948) | 170 | — | (1,778) | |||||||||||||||||||
| Reclassification adjustment to net income (loss) | — | (927) | (35) | (962) | |||||||||||||||||||
| Income tax (expense) benefit | — | 253 | 8 | 261 | |||||||||||||||||||
| Reclassification adjustment to net income (loss), net of tax | — | (674) | (27) | (701) | |||||||||||||||||||
| Other comprehensive income (loss), net of tax | (1,948) | (504) | (27) | (2,479) | |||||||||||||||||||
| Balance at March 31, 2024 | $ | (84,985) | $ | 297 | $ | 512 | $ | (84,176) | |||||||||||||||
| (In Thousands) | Foreign currency translation adjustment | Gain (loss) on derivative financial instruments | Pension and other post-retirement benefit adjustments | Total | |||||||||||
| Beginning balance, January 1, 2016 | $ | (112,807 | ) | $ | (373 | ) | $ | (95,539 | ) | $ | (208,719 | ) | |||
| Other comprehensive income (loss) before reclassifications | 22,929 | (60 | ) | — | 22,869 | ||||||||||
| Amounts reclassified from accumulated other comprehensive income (loss) | — | 1,023 | 6,573 | 7,596 | |||||||||||
| Net other comprehensive income (loss) - current period | 22,929 | 963 | 6,573 | 30,465 | |||||||||||
| Ending balance, September 30, 2016 | $ | (89,878 | ) | $ | 590 | $ | (88,966 | ) | $ | (178,254 | ) | ||||
| (In thousands) | Foreign Currency Translation | Gain (Loss) on Derivative Financial Instruments | Pension & Other Postretirement Benefit Adjust | Total Accumulated Other Comprehensive Income (Loss) | |||||||||||||||||||
| Balance at January 1, 2023 | $ | (86,079) | $ | (2,480) | $ | (59,036) | $ | (147,595) | |||||||||||||||
| Other comprehensive income (loss) | 1,557 | 3,078 | — | 4,635 | |||||||||||||||||||
| Income tax (expense) benefit | (437) | (1,087) | — | (1,524) | |||||||||||||||||||
| Other comprehensive income (loss), net of tax | 1,120 | 1,991 | — | 3,111 | |||||||||||||||||||
| Reclassification adjustment to net income (loss) | — | (973) | 2,924 | 1,951 | |||||||||||||||||||
| Income tax (expense) benefit | — | 251 | (637) | (386) | |||||||||||||||||||
| Reclassification adjustment to net income (loss), net of tax | — | (722) | 2,287 | 1,565 | |||||||||||||||||||
| Other comprehensive income (loss), net of tax | 1,120 | 1,269 | 2,287 | 4,676 | |||||||||||||||||||
| Balance at March 31, 2023 | $ | (84,959) | $ | (1,211) | $ | (56,749) | $ | (142,919) | |||||||||||||||
| (In Thousands) | Amount reclassified from other comprehensive income (loss) | Location of gain (loss) reclassified from accumulated other comprehensive income (loss) to net income (loss) | |||
| Gain (loss) on derivative financial instruments: | |||||
| Aluminum future contracts, before taxes | $ | 231 | Cost of sales | ||
| Foreign currency forward contracts, before taxes | 15 | Cost of sales | |||
| Total, before taxes | 246 | ||||
| Income tax expense (benefit) | 90 | Income taxes | |||
| Total, net of tax | $ | 156 | |||
| Amortization of pension and other post-retirement benefits: | |||||
| Actuarial gain (loss) and prior service costs, before taxes | $ | (2,911 | ) | (a) | |
| Income tax expense (benefit) | (1,057 | ) | Income taxes | ||
| Total, net of tax | $ | (1,854 | ) | ||
| (In Thousands) | Amount reclassified from other comprehensive income (loss) | Location of gain (loss) reclassified from accumulated other comprehensive income (loss) to net income (loss) | |||
| Gain (loss) on derivative financial instruments: | |||||
| Aluminum future contracts, before taxes | $ | 785 | Cost of sales | ||
| Foreign currency forward contracts, before taxes | 46 | Cost of sales | |||
| Total, before taxes | 831 | ||||
| Income tax expense (benefit) | 302 | Income taxes | |||
| Total, net of tax | $ | 529 | |||
| Amortization of pension and other post-retirement benefits: | |||||
| Actuarial gain (loss) and prior service costs, before taxes | $ | (9,033 | ) | (a) | |
| Income tax expense (benefit) | (3,279 | ) | Income taxes | ||
| Total, net of tax | $ | (5,754 | ) | ||
| (In Thousands) | Amount reclassified from other comprehensive income (loss) | Location of gain (loss) reclassified from accumulated other comprehensive income (loss) to net income (loss) | |||
| Gain (loss) on derivative financial instruments: | |||||
| Aluminum future contracts, before taxes | $ | (160 | ) | Cost of sales | |
| Foreign currency forward contracts, before taxes | 15 | Cost of sales | |||
| Total, before taxes | (145 | ) | |||
| Income tax expense (benefit) | (53 | ) | Income taxes | ||
| Total, net of tax | $ | (92 | ) | ||
| Amortization of pension and other post-retirement benefits: | |||||
| Actuarial gain (loss) and prior service costs, before taxes | $ | (3,086 | ) | (a) | |
| Income tax expense (benefit) | (1,120 | ) | Income taxes | ||
| Total, net of tax | $ | (1,966 | ) | ||
| (In Thousands) | Amount reclassified from other comprehensive income (loss) | Location of gain (loss) reclassified from accumulated other comprehensive income (loss) to net income (loss) | |||
| Gain (loss) on derivative financial instruments: | |||||
| Aluminum future contracts, before taxes | $ | (1,669 | ) | Cost of sales | |
| Foreign currency forward contracts, before taxes | 46 | Cost of sales | |||
| Total, before taxes | (1,623 | ) | |||
| Income tax expense (benefit) | (600 | ) | Income taxes | ||
| Total, net of tax | $ | (1,023 | ) | ||
| Amortization of pension and other post-retirement benefits: | |||||
| Actuarial gain (loss) and prior service costs, before taxes | $ | (9,759 | ) | (a) | |
| Income tax expense (benefit) | (3,186 | ) | Income taxes | ||
| Total, net of tax | $ | (6,573 | ) | ||
7. DERIVATIVES
Tredegar uses derivative financial instruments for the purpose of hedging margin exposure from fixed-price forward sales contracts in Aluminum Extrusions and deferred charges”exposure from currency volatility that exists as part of ongoing business operations in the consolidated balance sheets) was $45.0 million at September 30, 2017Flexible Packaging Films. These derivative financial instruments are designated as and $20.2 million at December 31, 2016. An unrealized loss of $1.3 million wasqualify as cash flow hedges and are recognized in the third quarter of 2016. Unrealized gains of $24.8 million and an unrealized loss of $0.2 million were recognized incondensed consolidated balance sheet at fair value. If individual derivative instruments with the first nine months of 2017 and 2016, respectively. There was no change in the estimated fair value from June 30, 2017 to September 30, 2017, as appreciation in value from the discount rate for one quarter was offset bysame counterparty can be settled on a change in the present value of projected cash flows versus prior projections. Unrealized gains (losses) associated with this investment are included in “Other income (expense), net” in the consolidated statements of income and separately stated in the net sales and operating profit by segment table in Note 10.
| Unaudited (In Thousands) | September 30, 2017 | December 31, 2016 | September 30, 2017 | December 31, 2016 | ||||||||||||
| Assets: | Liabilities & Equity: | |||||||||||||||
| Cash & short-term investments | $ | 104,753 | $ | 102,329 | ||||||||||||
| Restricted cash | 31 | 31 | Current liabilities | $ | 85,086 | $ | 50,134 | |||||||||
| Other current assets | 39,059 | 15,391 | Long term debt, net | 138,305 | 143,380 | |||||||||||
| Property & equipment | 10,399 | 13,011 | Other noncurrent liabilities | 807 | 822 | |||||||||||
| Other long-term assets | 494 | 472 | Equity | (69,462 | ) | (63,102 | ) | |||||||||
| Total assets | $ | 154,736 | $ | 131,234 | Total liabilities & equity | $ | 154,736 | $ | 131,234 | |||||||
| Three Months Ended September 30, | Nine Months Ended September 30, | ||||||||||||||
| Unaudited (In Thousands) | 2017 | 2016 | 2017 | 2016 | |||||||||||
| Revenues | $ | 58,822 | $ | 17,377 | $ | 148,761 | $ | 29,347 | |||||||
Cost of goods sold, R&D and SG&A expenses before depreciation & amortization | (52,072 | ) | (19,046 | ) | (137,411 | ) | (50,442 | ) | |||||||
| Depreciation & amortization | (1,245 | ) | (1,278 | ) | (3,723 | ) | (3,477 | ) | |||||||
| Operating income (loss) | 5,505 | (2,947 | ) | 7,627 | (24,572 | ) | |||||||||
| Gain on contract termination | — | — | — | 18,075 | |||||||||||
| Net interest expense and other net | (4,767 | ) | (4,848 | ) | (14,408 | ) | (14,535 | ) | |||||||
| Income tax benefit (expense) | (244 | ) | — | (734 | ) | (8 | ) | ||||||||
| Net income (loss) | $ | 494 | $ | (7,795 | ) | $ | (7,515 | ) | $ | (21,040 | ) | ||||
In the normal course of business, Aluminum Extrusions enters into fixed-price forward sales contracts with certaina small subset of its customers for the future sale of fixed quantities of aluminum extrusions at scheduled intervals. In order to hedge margin exposure created from the fixing of future sales prices relative to volatile raw material (aluminum) costs, Aluminum Extrusions enters into a combination of forward purchase commitments and futures contracts to acquire or hedge aluminum, based on the
10
scheduled purchases for the firm sales commitments. The fixed-price firm sales commitments and related hedging instruments generally have durations of not moregenerally no longer than 12 months, and themonths. The notional amount of aluminum futures contracts that hedged future purchases of aluminum to meet fixed-price forward sales contract obligations was $7.1$6.8 million (7.4(5.1 million pounds of aluminum) at September 30, 2017March 31, 2024 and $8.0$7.7 million (9.6(5.6 million pounds of aluminum) at December 31, 2016.2023.
The table below summarizes the location and gross amounts of aluminum futures contract fair values (Level 2) in the condensed consolidated balance sheets as of September 30, 2017March 31, 2024 and December 31, 2016:
| September 30, 2017 | December 31, 2016 | ||||||||||
| (In Thousands) | Balance Sheet Account | Fair Value | Balance Sheet Account | Fair Value | |||||||
| Derivatives Designated as Hedging Instruments | |||||||||||
| Asset derivatives: Aluminum futures contracts | Prepaid expenses and other | $ | 792 | Prepaid expenses and other | $ | 308 | |||||
| Liability derivatives: Aluminum futures contracts | Prepaid expenses and other | $ | (25 | ) | Prepaid expenses and other | $ | (37 | ) | |||
| Net asset (liability) | $ | 767 | $ | 271 | |||||||
| March 31, 2024 | December 31, 2023 | ||||||||||||||||||||||
| (In thousands) | Balance Sheet Account | Fair Value | Balance Sheet Account | Fair Value | |||||||||||||||||||
| Derivatives Designated as Hedging Instruments | |||||||||||||||||||||||
Asset derivatives: Aluminum futures contracts | Other assets | 28 | Other assets | — | |||||||||||||||||||
Liability derivatives: Aluminum futures contracts | Accrued expenses | (318) | Accrued expenses | (483) | |||||||||||||||||||
| Aluminum futures contracts | Other non-current liabilities | — | Other non-current liabilities | (9) | |||||||||||||||||||
| Net asset (liability) | $ | (290) | $ | (492) | |||||||||||||||||||
In the event that a counterparty to an aluminum fixed-price forward sales contract chooses not to take delivery of its aluminum extrusions, the customer is contractually obligated to compensate Aluminum Extrusions for any losses on the related aluminum futures and/or forward contracts through the date of cancellation.
The Company's earnings are exposed to foreign currency exchange risk primarily through the translation of the financial statements of subsidiaries that have a functional currency other than the U.S. Dollar. On September 29, 2017,The Company estimates that the net mismatch translation exposure for the Flexible Packaging FilmsFilm's business unit in Brazil (“Terphane Ltda.”) entered into 15 monthlyof its sales and raw materials quoted or priced in U.S. Dollars and its variable conversion, fixed conversion and sales, general and administrative costs (before depreciation and amortization) quoted or priced in Brazilian Real ("R$") will result in an annual net cost of R$139 million for the full year of 2024.
Terphane Ltda. had the following outstanding foreign exchange average forward rate contracts to purchase Brazilian Real (“R$”) and sell U.S. Dollars covering the period from October 2017 through December 2018. as of March 31, 2024:
| USD Notional Amount (000s) | Average Forward Rate Contracted on USD/BRL | R$ Equivalent Amount (000s) | Applicable Month | Estimated % of Terphane Ltda. R$ Operating Cost Exposure Hedged | ||||||||||
| $1,827 | 5.3373 | R$9,751 | Apr-24 | 84% | ||||||||||
| $1,798 | 5.3588 | R$9,635 | May-24 | 83% | ||||||||||
| $1,812 | 5.3708 | R$9,732 | Jun-24 | 84% | ||||||||||
| $1,804 | 5.3848 | R$9,714 | Jul-24 | 84% | ||||||||||
| $1,806 | 5.4014 | R$9,755 | Aug-24 | 84% | ||||||||||
| $1,857 | 5.4107 | R$10,048 | Sep-24 | 87% | ||||||||||
| $1,851 | 5.4225 | R$10,037 | Oct-24 | 87% | ||||||||||
| $1,837 | 5.4403 | R$9,994 | Nov-24 | 86% | ||||||||||
| $1,801 | 5.4580 | R$9,830 | Dec-24 | 85% | ||||||||||
| $16,393 | 5.3984 | R$88,496 | 84% | |||||||||||
These foreign currency exchange contracts have been designated and qualify as cash flow hedges of Terphane Ltda.'s’s forecasted sales to customers quoted or priced in U.S. Dollars over that period. By changing the currency risk associated with these U.S. Dollar sales, the derivatives have the effect of offsetting operating costs quoted or priced in Brazilian Real and decreasing the net exposure to Brazilian Real in the condensed consolidated statements of income.
11
The aggregate notional amounttable below summarizes the location and gross amounts of open foreign exchange contracts at September 30, 2017 was $18.75 million (R$60.7 million). Thecurrency forward rates contracted andcontract fair values (Level 2) in the related market ratescondensed consolidated balance sheets as of September 30, 2017 were the same,March 31, 2024 and accordingly the fair value of all 15 open forward contracts were zero at that date.December 31, 2023:
| March 31, 2024 | December 31, 2023 | |||||||||||||||||||||||||
| (In thousands) | Balance Sheet Account | Fair Value | Balance Sheet Account | Fair Value | ||||||||||||||||||||||
| Derivatives Designated as Hedging Instruments | ||||||||||||||||||||||||||
Asset derivatives: Foreign currency forward contracts | Prepaid expenses and other | $ | 1,154 | Prepaid expenses and other | $ | 2,050 | ||||||||||||||||||||
| Foreign currency forward contracts | Other assets | — | Other assets | 146 | ||||||||||||||||||||||
Liability derivatives: Foreign currency forward contracts | Accrued expenses | (6) | Other non-current liabilities | — | ||||||||||||||||||||||
| Foreign currency forward contracts | Other non-current liabilities | (2) | Other non-current liabilities | — | ||||||||||||||||||||||
| Net asset (liability) | $ | 1,146 | $ | 2,196 | ||||||||||||||||||||||
These derivative contracts involve elements of market risk that are not reflected on the condensed consolidated balance sheet, including the risk of dealing with counterparties and their ability to meet the terms of the contracts. The counterparties to any forward purchase commitments are major aluminum brokers and suppliers, and the counterparties to any aluminum futures contracts are major financial institutions. Fixed-price forward sales contracts are only made available
to the best and most credit-worthy customers. The counterparties to the Company’s foreign currency cash flow hedge contracts are major financial institutions.
The pre-tax effect on net income (loss) and other comprehensive income (loss) of derivative instruments classified as cash flow hedges and described in the previous paragraphs for the three and nine month periods ended September 30, 2017March 31, 2024 and 20162023 is summarized in the table below:
| (In Thousands) | Cash Flow Derivative Hedges | ||||||||||||||
| Aluminum Futures Contracts | Foreign Currency Forwards | ||||||||||||||
| Three Months Ended September 30, | |||||||||||||||
| 2017 | 2016 | 2017 | 2016 | ||||||||||||
| Amount of pretax gain (loss) recognized in other comprehensive income (loss) | $ | 757 | $ | (230 | ) | $ | — | $ | — | ||||||
| Location of gain (loss) reclassified from accumulated other comprehensive income (loss) into net income (loss) (effective portion) | Cost of sales | Cost of sales | Cost of sales | Cost of sales | |||||||||||
| Amount of pretax gain (loss) reclassified from accumulated other comprehensive income (loss) to net income (loss) (effective portion) | $ | 231 | $ | (160 | ) | $ | 15 | $ | 15 | ||||||
| Aluminum Futures Contracts | Foreign Currency Forwards | ||||||||||||||
| Nine Months Ended September 30, | |||||||||||||||
| 2017 | 2016 | 2017 | 2016 | ||||||||||||
| Amount of pre-tax gain (loss) recognized in other comprehensive income (loss) | $ | 1,281 | $ | (93 | ) | $ | — | $ | — | ||||||
| Location of gain (loss) reclassified from accumulated other comprehensive income (loss) into net income (loss) (effective portion) | Cost of sales | Cost of sales | Cost of sales | Cost of sales | |||||||||||
| Amount of pre-tax gain (loss) reclassified from accumulated other comprehensive income (loss) to net income (loss) (effective portion) | $ | 785 | $ | (1,669 | ) | $ | 46 | $ | 46 | ||||||
| Cash Flow Derivative Hedges | ||||||||||||||||||||||||||||||||
| Three Months Ended March 31, | ||||||||||||||||||||||||||||||||
| Aluminum Futures Contracts | Foreign Currency Forwards | |||||||||||||||||||||||||||||||
| (In thousands) | 2024 | 2023 | 2024 | 2023 | ||||||||||||||||||||||||||||
| Amount of pre-tax gain (loss) recognized in other comprehensive income (loss) | $ | 721 | $ | 1,402 | $ | — | $ | (439) | $ | — | $ | 1,676 | ||||||||||||||||||||
| Location of gain (loss) reclassified from accumulated other comprehensive income (loss) into net income (effective portion) | Cost of goods sold | Cost of goods sold | Cost of goods sold | Selling, general & admin | Cost of goods sold | Selling, general & admin | ||||||||||||||||||||||||||
| Amount of pre-tax gain (loss) reclassified from accumulated other comprehensive income (loss) to net income (effective portion) | $ | 519 | $ | 672 | $ | 15 | $ | 393 | $ | 15 | $ | 286 | ||||||||||||||||||||
As of September 30, 2017,March 31, 2024, the Company expects $0.5$0.4 million of unrealized after-tax gains on aluminum and foreign currency derivative instruments reported in accumulated other comprehensive income (loss) to be reclassified to earnings within the next 12 months. For the three and nine month periods ended September 30, 2017March 31, 2024 and 2016,2023, net gains or losses realized, from previously unrealized net gains or losses on hedges that had been discontinued, were not material.
8. INCOME TAXES
Tredegar recorded tax expense (benefit) of $0.7 million on pre-tax income (loss) of $3.9 million in the first three months of 2024. The effective tax rate in the first three months of 2024 was 16.7% and (48.8)% in the first three months of 2023. The change in effective tax rate was primarily due to pre-tax income in the first quarter of 2024 versus a pre-tax loss in the first three months of 2023.
The components of net periodic benefit costeffective tax rate for the pensionfirst three months of 2024 varies from the 21% statutory rate primarily due to foreign rate differences and other post-retirement benefit programs reflected in consolidated results are shown below:
| Pension Benefits | Other Post-Retirement Benefits | ||||||||||||||
| Three Months Ended September 30, | Three Months Ended September 30, | ||||||||||||||
| (In Thousands) | 2017 | 2016 | 2017 | 2016 | |||||||||||
| Service cost | $ | 29 | $ | 54 | $ | 7 | $ | 8 | |||||||
| Interest cost | 3,103 | 3,263 | 73 | 67 | |||||||||||
| Expected return on plan assets | (3,743 | ) | (4,070 | ) | — | — | |||||||||
| Amortization of prior service costs, gains or losses and net transition asset | 2,996 | 3,135 | (84 | ) | (49 | ) | |||||||||
| Net periodic benefit cost | $ | 2,385 | $ | 2,382 | $ | (4 | ) | $ | 26 | ||||||
| Pension Benefits | Other Post-Retirement Benefits | ||||||||||||||
| Nine Months Ended September 30, | Nine Months Ended September 30, | ||||||||||||||
| 2017 | 2016 | 2017 | 2016 | ||||||||||||
| Service cost | $ | 145 | $ | 178 | $ | 25 | $ | 29 | |||||||
| Interest cost | 9,431 | 9,993 | 226 | 236 | |||||||||||
| Expected return on plan assets | (11,216 | ) | (12,027 | ) | — | — | |||||||||
| Amortization of prior service costs, (gains) losses and net transition asset | 9,241 | 9,903 | (207 | ) | (144 | ) | |||||||||
| Net periodic benefit cost | $ | 7,601 | $ | 8,047 | $ | 44 | $ | 121 | |||||||
| Three Months Ended September 30, | Nine Months Ended September 30, | ||||||||||||||
| (In Thousands) | 2017 | 2016 | 2017 | 2016 | |||||||||||
| Net Sales | |||||||||||||||
| PE Films | $ | 89,723 | $ | 82,179 | $ | 265,773 | $ | 251,473 | |||||||
| Flexible Packaging Films | 26,628 | 27,303 | 79,925 | 80,888 | |||||||||||
| Aluminum Extrusions | 122,149 | 91,067 | 344,956 | 269,987 | |||||||||||
| Total net sales | 238,500 | 200,549 | 690,654 | 602,348 | |||||||||||
| Add back freight | 8,621 | 7,153 | 24,840 | 21,221 | |||||||||||
| Sales as shown in the Consolidated Statements of Income | $ | 247,121 | $ | 207,702 | $ | 715,494 | $ | 623,569 | |||||||
| Operating Profit (Loss) | |||||||||||||||
| PE Films: | |||||||||||||||
| Ongoing operations | $ | 11,251 | $ | 9,011 | $ | 30,965 | $ | 23,564 | |||||||
| Plant shutdowns, asset impairments, restructurings and other | (919 | ) | (1,187 | ) | (3,890 | ) | (3,678 | ) | |||||||
| Flexible Packaging Films: | |||||||||||||||
| Ongoing operations | (1,074 | ) | 93 | (3,392 | ) | 1,184 | |||||||||
| Plant shutdowns, asset impairments, restructurings and other | — | — | 11,856 | — | |||||||||||
| Aluminum Extrusions: | |||||||||||||||
| Ongoing operations | 12,601 | 9,427 | 34,201 | 27,786 | |||||||||||
| Plant shutdowns, asset impairments, restructurings and other | (377 | ) | 1,405 | (3,147 | ) | 840 | |||||||||
| Total | 21,482 | 18,749 | 66,593 | 49,696 | |||||||||||
| Interest income | 42 | 70 | 171 | 158 | |||||||||||
| Interest expense | 1,757 | 886 | 4,579 | 2,918 | |||||||||||
| Gain (loss) on investment accounted for under fair value method | — | (1,300 | ) | 24,800 | (200 | ) | |||||||||
| Stock option-based compensation costs | 111 | 31 | 153 | 24 | |||||||||||
| Corporate expenses, net | 6,960 | 7,223 | 20,985 | 22,110 | |||||||||||
| Income before income taxes | 12,696 | 9,379 | 65,847 | 24,602 | |||||||||||
| Income taxes | 4,422 | (2,669 | ) | 9,667 | 1,864 | ||||||||||
| Net income | $ | 8,274 | $ | 12,048 | $ | 56,180 | $ | 22,738 | |||||||
| (In Thousands) | September 30, 2017 | December 31, 2016 | |||||
| PE Films | $ | 295,181 | $ | 278,558 | |||
| Flexible Packaging Films | 153,488 | 156,836 | |||||
| Aluminum Extrusions | 268,994 | 147,639 | |||||
| Subtotal | 717,663 | 583,033 | |||||
| General corporate | 62,435 | 38,618 | |||||
| Cash and cash equivalents | 31,850 | 29,511 | |||||
| Total | $ | 811,948 | $ | 651,162 | |||
Percent of Income Before Income Taxes | |||||
| Nine Months Ended September 30, | 2017 | 2016 | |||
| Income tax expense at federal statutory rate | 35.0 | 35.0 | |||
| Foreign rate differences | 1.5 | 1.1 | |||
| State taxes, net of federal income tax benefit | 1.3 | 0.7 | |||
| Changes in estimates related to prior year tax provision | 0.5 | (1.6 | ) | ||
| Non-deductible expenses | 0.5 | 1.6 | |||
| Valuation allowance for foreign operating loss carry-forwards | 0.4 | 0.3 | |||
| Unremitted earnings from foreign operations | 0.2 | (1.1 | ) | ||
| Valuation allowance for capital loss carry-forwards | — | (0.4 | ) | ||
| Income tax contingency accruals and tax settlements | (0.4 | ) | 1.3 | ||
| Remitted earnings from foreign operations | (0.6 | ) | (23.8 | ) | |
| Research and development tax credit | (0.7 | ) | (1.8 | ) | |
| Domestic production activities deduction | (0.9 | ) | (3.8 | ) | |
| Foreign investment write-up | (3.5 | ) | 0.1 | ||
| Settlement of Terphane acquisition escrow | (6.4 | ) | — | ||
| Worthless stock deduction | (12.2 | ) | — | ||
| Effective income tax rate | 14.7 | 7.6 | |||
12
The Brazilian federal statutory income tax rate is a composite of 34.0% (25.0% of income tax and 9.0% of social contribution on income). Terphane Ltda.’s manufacturing facility in Brazil is the beneficiary of certain income tax incentives that allow for a reduction in the statutory Brazilian federal income tax rate to 15.25% levied on the operating profit on certain of its products. The incentives have been granted for a 10-year period, which has afrom the commencement date of January 1, 2015. No benefit was recognized2015 and expiring at the end of 2024.
9. BUSINESS SEGMENTS
The Company’s business segments are Aluminum Extrusions, PE Films, and Flexible Packaging Films. Information by business segment is reported below. There are no accounting transactions between segments and no allocations to segments.
The Company’s reportable segments are based on its method of internal reporting, which is generally segregated by differences in products. Accounting standards for presentation of segments require an approach based on the way the Company organizes the segments for making operating decisions and how the CODM assesses performance. Earnings before interest, taxes, depreciation and amortization ("EBITDA") from these tax incentivesongoing operations is the key profitability measure used by the CODM (Tredegar’s President and Chief Executive Officer) for purposes of assessing financial performance. The Company uses sales less freight (“net sales”) as its measure of revenues from external customers at the segment level. This measure is separately included in the first nine months of 2017 or 2016.
The following table presents net sales and EBITDA from ongoing operations by segment for the utilization of assumed capital losses onthree months ended March 31, 2024 and 2023:
13
| Three Months Ended March 31, | |||||||||||||||||||||||
| (In thousands) | 2024 | 2023 | |||||||||||||||||||||
| Net Sales | |||||||||||||||||||||||
| Aluminum Extrusions | $ | 114,222 | $ | 133,370 | |||||||||||||||||||
| PE Films | 24,735 | 20,182 | |||||||||||||||||||||
| Flexible Packaging Films | 30,113 | 31,527 | |||||||||||||||||||||
| Total net sales | 169,070 | 185,079 | |||||||||||||||||||||
| Add back freight | 6,666 | 6,043 | |||||||||||||||||||||
| Sales as shown in the condensed consolidated statements of income (loss) | $ | 175,736 | $ | 191,122 | |||||||||||||||||||
| EBITDA from Ongoing Operations | |||||||||||||||||||||||
| Aluminum Extrusions: | |||||||||||||||||||||||
| Ongoing operations: | |||||||||||||||||||||||
| EBITDA | $ | 12,540 | $ | 14,638 | |||||||||||||||||||
| Depreciation & amortization | (4,542) | (4,411) | |||||||||||||||||||||
| EBIT | 7,998 | 10,227 | |||||||||||||||||||||
| Plant shutdowns, asset impairments, restructurings and other | (1,167) | (493) | |||||||||||||||||||||
| PE Films: | |||||||||||||||||||||||
| Ongoing operations: | |||||||||||||||||||||||
| EBITDA | 6,904 | 1,849 | |||||||||||||||||||||
| Depreciation & amortization | (1,329) | (1,643) | |||||||||||||||||||||
| EBIT | 5,575 | 206 | |||||||||||||||||||||
| Plant shutdowns, asset impairments, restructurings and other | (504) | 2 | |||||||||||||||||||||
| Flexible Packaging Films: | |||||||||||||||||||||||
| Ongoing operations: | |||||||||||||||||||||||
| EBITDA | 1,963 | 1,350 | |||||||||||||||||||||
| Depreciation & amortization | (751) | (700) | |||||||||||||||||||||
| EBIT | 1,212 | 650 | |||||||||||||||||||||
| Plant shutdowns, asset impairments, restructurings and other | — | (78) | |||||||||||||||||||||
| Total | 13,114 | 10,514 | |||||||||||||||||||||
| Interest income | 22 | 44 | |||||||||||||||||||||
| Interest expense | 3,455 | 2,311 | |||||||||||||||||||||
| Gain on investment in kaleo, Inc. | — | 262 | |||||||||||||||||||||
| Stock option-based compensation costs | — | 231 | |||||||||||||||||||||
| Corporate expenses, net | 5,736 | 8,956 | |||||||||||||||||||||
| Income (loss) before income taxes | 3,945 | (678) | |||||||||||||||||||||
| Income tax expense (benefit) | 657 | 331 | |||||||||||||||||||||
| Net income (loss) | $ | 3,288 | $ | (1,009) | |||||||||||||||||||
The following table presents identifiable assets by segment at March 31, 2024 and December 31, 2023:
| (In thousands) | March 31, 2024 | December 31, 2023 | |||||||||
| Aluminum Extrusions | $ | 264,300 | $ | 255,756 | |||||||
| PE Films | 57,925 | 56,536 | |||||||||
| Flexible Packaging Films | 81,290 | 84,062 | |||||||||
| Subtotal | 403,515 | 396,354 | |||||||||
| General corporate | 34,224 | 36,652 | |||||||||
| Cash, cash equivalents and restricted cash | 4,792 | 13,455 | |||||||||
| Total | $ | 442,531 | $ | 446,461 | |||||||
14
The following tables disaggregate the Company’s revenue by geographic area and product group for the three months ended March 31, 2024 and 2023:
| Net Sales by Geographic Area (a) | |||||||||||||||||||||||
| Three Months Ended March 31, | |||||||||||||||||||||||
| (In thousands) | 2024 | 2023 | |||||||||||||||||||||
| United States | $ | 132,627 | $ | 150,611 | |||||||||||||||||||
| Exports from the United States to: | |||||||||||||||||||||||
| Asia | 8,825 | 5,732 | |||||||||||||||||||||
| Latin America | 1,331 | 1,859 | |||||||||||||||||||||
| Canada | 4,539 | 4,284 | |||||||||||||||||||||
| Europe | 255 | 860 | |||||||||||||||||||||
| Operations outside the United States: | |||||||||||||||||||||||
| Brazil | 21,331 | 21,628 | |||||||||||||||||||||
| Asia | 162 | 105 | |||||||||||||||||||||
| Total | $ | 169,070 | $ | 185,079 | |||||||||||||||||||
| (a) Export sales relate mostly to PE Films. Operations in Brazil relate to Flexible Packaging Films. | |||||||||||||||||||||||
The Company’s facilities in Pottsville, PA (“PV”) and Guangzhou, China (“GZ”) have a tolling arrangement whereby certain investmentssurface protection films are manufactured in GZ for a fee with raw materials supplied from PV that were recognized in prior years. Income taxes in 2016 included the partial reversal of a valuation allowance of $0.1 million relatedare then shipped by GZ directly to the expected limitations on the utilization of assumed capital losses on certain investments. The Company had a valuation allowance for excess capital losses from investments and other related items of $11.2 million at September 30, 2017. Tredegar continues to evaluate opportunities to utilize these loss carryforwards prior to their expiration at various datescustomers principally in the future. As events and circumstances warrant, allowances will be reversed when it is more likely than not that future taxable income will exceed deductible amounts, thereby resultingAsian market, but paid by customers directly to PV. Amounts associated with this intercompany tolling arrangement are reported in the realization of deferred tax assets.
| Net Sales by Product Group | |||||||||||||||||||||||
| Three Months Ended March 31, | |||||||||||||||||||||||
| (In thousands) | 2024 | 2023 | |||||||||||||||||||||
| Aluminum Extrusions: | |||||||||||||||||||||||
| Nonresidential building & construction | $ | 66,347 | $ | 78,629 | |||||||||||||||||||
| Consumer durables | 7,984 | 10,347 | |||||||||||||||||||||
| Automotive | 10,606 | 12,122 | |||||||||||||||||||||
| Residential building & construction | 7,902 | 11,603 | |||||||||||||||||||||
| Electrical | 5,836 | 8,129 | |||||||||||||||||||||
| Machinery & equipment | 12,195 | 10,724 | |||||||||||||||||||||
| Distribution | 3,352 | 1,816 | |||||||||||||||||||||
| Subtotal | 114,222 | 133,370 | |||||||||||||||||||||
| PE Films: | |||||||||||||||||||||||
| Surface protection films | 17,011 | 12,855 | |||||||||||||||||||||
| Overwrap packaging | 7,724 | 7,327 | |||||||||||||||||||||
| Subtotal | 24,735 | 20,182 | |||||||||||||||||||||
| Flexible Packaging Films | 30,113 | 31,527 | |||||||||||||||||||||
| Total | $ | 169,070 | $ | 185,079 | |||||||||||||||||||
10. DEBT
ABL Facility
On December 27, 2023, the Company entered into Amendment No. 3 (the “ABL Facility”) to the Second Amended and Restated Credit Agreement, which provides the Company with a $180 million senior secured asset-based revolving credit facility that will expire on June 30, 2026. On April 16, 2024, the Company entered into Amendment No. 4 (the "Amendment") that, among other items: (i) moves the ABL Adjustment Date (defined below) from March 31, 2025 to September 30, 2025 and (ii) requires weekly reporting of the borrowing base financial covenant. The ABL Facility is secured by substantially all assets of the Company and its domestic subsidiaries, including equity in certain material first-tier foreign subsidiaries. Availability for
15
borrowings under the ABL Facility is governed by a borrowing base, determined by the application of specified advance rates against eligible assets, including a portion of trade accounts receivable, inventory, cash and cash equivalents, owned real properties, and owned machinery and equipment. Upon the earlier of September 30, 2025 or the date the Company receives the proceeds from the sale of Terphane (the “ABL Adjustment Date”), the $180 million ABL Facility will be reduced to $125 million. As of March 31, 2024, availability under the ABL Facility was $22.2 million, after reducing the borrowing base by the aggregate outstanding borrowings of $128.3 million, standby letters of credit of $13.1 million, and the adoptionMinimum Liquidity (as defined in the ABL Facility) financial covenant.
Outstanding borrowings accrue interest at the rates elected by the Company depending on the type of this guidance didloan and denomination of such borrowing. With respect to revolving loans denominated in U.S. Dollars, the Company may elect interest rates at:
•Alternate Base Rate (“ABR”) plus 2.50% before the ABL Adjustment Date and the applicable ABR Spread (as defined in the ABL Facility) after the ABL Adjustment Date are determined in accordance with an excess availability-based pricing grid. ABR is defined, in part, as the greater of (a) the Prime Rate in effect on such day, (b) the Federal Reserve Bank of New York Rate in effect on such day plus ½ of 1% and (c) the Adjusted Term SOFR Rate (defined below) for a one-month period plus 1%; or
•The Adjusted Term Secured Overnight Financing Rate ("SOFR") Rate plus 3.50% before the ABL Adjustment Date and the applicable Term Benchmark Spread (as defined in the ABL Facility) are determined in accordance with an excess availability-based pricing grid after the ABL Adjustment Date. Adjusted Term SOFR Rate is defined as the Term SOFR Rate plus 0.10%, subject to an initial Floor (as defined in the ABL Facility) of 0%.
Interest rate indices for select non-U.S. dollar borrowings, including borrowings denominated in Euro, Pounds Sterling, Swiss Francs and Japanese Yen, remain consistent with the Second Amended and Restated Credit Agreement.
Based upon the quarterly average of daily availability under the ABL Facility, the interest rate pricing grid applicable after the ABL Adjustment Date will be as follows:
| Pricing under the ABL Facility (Basis Points) | |||||||||||
| Quarter Average of Daily Availability | Term Benchmark Spread | ABR Spread | Commitment Fee* | ||||||||
| > 66% of $125 million aggregate commitment | 225.0 | 125.0 | 40.0 | ||||||||
| ≤ 66% but > 33% of $125 million aggregate commitment | 250.0 | 150.0 | 40.0 | ||||||||
| ≤ 33% of $125 million aggregate commitment | 275.0 | 175.0 | 40.0 | ||||||||
*The Commitment Fee before the ABL Adjustment Date and after the ABL Adjustment Date remain the same as reflected in this table. | |||||||||||
Under the terms of the ABL Facility, certain domestic bank accounts are subject to blocked account agreements, each of which contains a springing feature whereby the lenders may exercise control over those accounts during a cash dominion period (any such period, a “Cash Dominion Period”). A Cash Dominion Period was implemented on the date of the closing of the ABL Facility and will remain in effect at all times prior to the ABL Adjustment Date. After the ABL Adjustment Date, a Cash Dominion Period goes into effect if availability under the ABL Facility falls below 12.5% or an Event of Default (as defined in the ABL Facility) occurs. The Company would then be subject to the Cash Dominion Period until the Event of Default is waived or ABL Facility availability is above 12.5% of the $125 million aggregate commitment for 30 consecutive days. Receipts that have not have a material impact onyet been applied to the ABL Facility are classified as restricted cash in the Company’s consolidated balance sheets.
The financial statements.covenants in the ABL Facility are as follows:
•Until the ABL Adjustment Date, the Company is required to maintain (i) a minimum Credit EBITDA (as defined in the ABL Facility), as of the end of each fiscal month for the 12-month period then ended (presented below) and (ii) a Minimum Liquidity (as defined in the ABL Facility) of $10.0 million.
16
| Minimum Credit EBITDA (In thousands) | |||||
| March 2024 | $ | 16,640 | |||
| April 2024 | 19,780 | ||||
| May 2024 | 19,660 | ||||
| June 2024 | 19,450 | ||||
| July 2024 | 21,860 | ||||
| August 2024 | 22,830 | ||||
| September 2024 | 25,370 | ||||
| October 2024 | 26,070 | ||||
| November 2024 | 27,640 | ||||
| December 2024 | 29,640 | ||||
| January 2025 | 29,740 | ||||
| February 2025 | 29,850 | ||||
| March 2025 | 29,980 | ||||
| April 2025 | 30,340 | ||||
| May 2025 | 30,700 | ||||
| June 2025 | 31,030 | ||||
| July 2025 | 31,370 | ||||
| August 2025 | 31,710 | ||||
| September 2025 | $ | 32,080 | |||
•Following the ABL Adjustment Date, the foregoing financial covenants will cease to exist and will be replaced with a minimum fixed charge coverage ratio of 1.00:1.00 that will be triggered in the event that availability is less than 10% of $125 million commitment amount and continuing thereafter until availability is greater than 10% of the $125 million commitment amount for 30 consecutive days.
In January 2016,addition to the FASB issued amended guidance associated with accountingfinancial covenants, the ABL Facility contains restrictive covenants, including covenants that restrict the Company’s ability to pay dividends and repurchase shares of its common stock.
If at any time the availability under the ABL facility after the ABL Adjustment Date is less than 20% of the maximum aggregate principal amount in effect at such time or an Event of Default occurs, the Company’s current weekly reporting requirements to lenders will continue until the Event of Default is waived, cured or the availability under the ABL facility is above 20% of the maximum aggregate principal amount for equity investments measured at fair value. 30 consecutive days.
The amended guidance requiresABL Facility has customary representations and warranties including, as a condition to each borrowing, that all equity investments to be measured at fair value with changessuch representations and warranties are true and correct in all material respects (including a representation that no Material Adverse Effect (as defined in the fair
In accordance with the fair value option forABL Facility, the lenders have been provided with the Company’s financial instruments. In addition,statements, covenant compliance certificates and projections to facilitate their ongoing assessment of the amendmentsCompany. Accordingly, the Company believes the likelihood that lenders would exercise the subjective acceleration clause whereby prohibiting future borrowings is remote. As of March 31, 2024, the Company was in this update eliminatecompliance with all debt covenants.
Terphane Brazil Loan
On October 26, 2023, Flexible Packaging Film's business unit in Brazil (“Terphane Ltda.”), the requirement to discloseCompany’s wholly owned subsidiary in Brazil, borrowed $20 million secured by certain of its assets (“Terphane Brazil Loan”). This U.S. Dollar borrowing matures on October 30, 2028, with interest payable quarterly at an annual floating interest rate of the fair valueSOFR plus 5.99%. The SOFR rate was 5.31% as of financial instruments measuredMarch 31, 2024. Quarterly principal payments of $1.7 million begin starting in year 3 of the loan. There are no prepayment penalties. The Company expects that the Terphane Brazil Loan will be repaid (and collateral released) upon the closing of the Contingent Terphane Sale. On October 26, 2023, the Company borrowed $20 million from Terphane Ltda. (the “Intercompany Loan”) at amortized cost for entities that are not public business entities and the requirement to disclosesame interest rate as the method(s) and significant assumptions used to estimateTerphane Brazil Loan, thereby transferring the fair value that is required to be disclosed for financial instruments measured at amortized cost on the balance sheet for public business entities. The amended guidance is effective for fiscal years beginning after December 31, 2017, including the interim periods within those fiscal years. The amendments should be applied by means of a cumulative-effect adjustmentfunds to the balance sheet asU.S. The Company will repay the Intercompany Loan in conjunction with the closing of the beginning of the fiscal year of adoption. The amendments related to equity securities without readily determinable fair values (including disclosure requirements) should be applied prospectively to equity investments that exist as of the date of adoption of the update. Early adoption is permitted under limited, specific circumstances. The guidance is not expected to have a material impact on the Company’s consolidated financial statements.Contingent Terphane Sale.
17
Forward-looking and Cautionary Statements
Some of the information contained in this Quarterly Report on Form 10-Q (“("Form 10-Q”10-Q") may constitute “forward-looking statements” within the meaning of the “safe harbor” provisions of the Private Securities Litigation Reform Act of 1995. When usingthe Company uses the words “believe,” “estimate,” “anticipate,” “appear to,” “expect,” “project,” “plan,” “likely,” “may” and similar expressions, Tredegarit does so to identify forward-looking statements. Such statements are based on the Company's then current expectations and are subject to a number of risks and uncertainties that could cause actual results to differ materially from those addressed in the forward-looking statements. It is possible that the Company's actual results and financial condition may differ, possibly materially, from the anticipated results and financial condition indicated in or implied by these forward-looking statements. Accordingly, you should not place undue reliance on these forward-looking statements. Factors that could cause actual results to differ materially from expectations include, without limitation, the following:
•inability to successfully complete strategic dispositions, including the Contingent Terphane Sale, failure to realize the expected benefits of such dispositions and assumption of unanticipated risks in such dispositions;
•inability to successfully transition into an asset-based revolving lending facility;
•noncompliance with any of the financial and other restrictive covenants in the Company's asset-based credit facility;
•the impact of macroeconomic factors, such as inflation, interest rates, recession risks and other lagging effects of the COVID-19 pandemic
•an increase in the operating costs incurred by the Company’s business units, including, for example, the cost of raw materials and energy;
•failure to continue to attract, develop and retain certain key officers or employees;
•disruptions to the Company’s manufacturing facilities, including those resulting from labor shortages;
•inability to develop, efficiently manufacture and deliver new products at competitive prices;
•the impact of the imposition of tariffs and sanctions on imported aluminum ingot used by Bonnell Aluminum;
•failure to prevent foreign companies from evading anti-dumping and countervailing duties;
•unanticipated problems or delays with the implementation of the enterprise resource planning and manufacturing executions systems, or security breaches and other disruptions to the Company's information technology infrastructure;
•loss or gain of sales to significant customers on which ourthe Company’s business is highly dependent;
•failure of ourthe Company’s customers to achieve success or maintain market share;
•failure to protect our intellectual property rights;
•risks of doing business in countries outside the U.S. that affect our substantial international operations;
•political, economic and regulatory factors concerning ourthe Company’s products;
•competition from other manufacturers, including manufacturers in lower-cost countries and manufacturers benefiting from government subsidies;
•impact of fluctuations in foreign exchange rates;
•the termination of anti-dumping duties on products imported to Brazil that compete with products produced by Flexible Packaging;
•an information technology system failure or breach;
•inability to successfully identify, complete or integrate strategic acquisitions; failure to realize the expected benefits of such acquisitions;acquisitions and assumption of unanticipated risks in such acquisitions;
and the other factors discussed in the reports Tredegar files with or furnishes to the Securities and Exchange Commission (“the SEC”(the “SEC”) from time to time, including the risks and important factors set forth in additional detail in “Risk Factors” Part II, Item 5 of the Form 10-Q and in Part I, Item 1A of Tredegar’s 2016
18
Annual Report on Form 10-K for the year ended December 31, 2023 (the “2016“2023 Form 10-K”) filed with the SEC.. Readers are urged to review and consider carefully the disclosures Tredegar makes in its filings with the SEC, including the 2016 Form 10-K.SEC.
Tredegar does not undertake, and expressly disclaims any duty, to update any forward-looking statement to reflect any change in management’s expectations or any change in conditions, assumptions or circumstances on which such statements are based, except as required by applicable law.
References herein to “Tredegar,” “the Company,” “we,” “us” and “our” are to Tredegar Corporation and its subsidiaries, collectively, unless the context otherwise indicates or requires.
| Three Months Ended | Favorable/ (Unfavorable) % Change | Nine Months Ended | Favorable/ (Unfavorable) % Change | ||||||||||||||||||
| (In Thousands, Except Percentages) | September 30, | September 30, | |||||||||||||||||||
| 2017 | 2016 | 2017 | 2016 | ||||||||||||||||||
| Sales volume (lbs) | 34,701 | 33,754 | 2.8 | % | 103,923 | 106,214 | (2.2 | )% | |||||||||||||
| Net sales | $ | 89,723 | $ | 82,179 | 9.2 | % | $ | 265,773 | $ | 251,473 | 5.7 | % | |||||||||
| Operating profit from ongoing operations | $ | 11,251 | $ | 9,011 | 24.9 | % | $ | 30,965 | $ | 23,564 | 31.4 | % | |||||||||
| Three Months Ended | Favorable/ (Unfavorable) % Change | Nine Months Ended | Favorable/ (Unfavorable) % Change | ||||||||||||||||||
| (In Thousands, Except Percentages) | September 30, | September 30, | |||||||||||||||||||
| 2017 | 2016 | 2017 | 2016 | ||||||||||||||||||
| Sales volume (lbs) | 21,640 | 23,204 | (6.7 | )% | 65,668 | 66,222 | (0.8 | )% | |||||||||||||
| Net sales | $ | 26,628 | $ | 27,303 | (2.5 | )% | $ | 79,925 | $ | 80,888 | (1.2 | )% | |||||||||
| Operating profit (loss) from ongoing operations | $ | (1,074 | ) | $ | 93 | NA | $ | (3,392 | ) | $ | 1,184 | NA | |||||||||
| Three Months Ended | Favorable/ (Unfavorable) % Change | Nine Months Ended | Favorable/ (Unfavorable) % Change | ||||||||||||||||||
| (In Thousands, Except Percentages) | September 30, | September 30, | |||||||||||||||||||
| 2017 | 2016 | 2017 | 2016 | ||||||||||||||||||
| Sales volume (lbs) * | 45,241 | 43,549 | 3.9 | % | 132,598 | 129,872 | 2.1 | % | |||||||||||||
| Net sales | $ | 122,149 | $ | 91,067 | 34.1 | % | $ | 344,956 | $ | 269,987 | 27.8 | % | |||||||||
| Operating profit from ongoing operations | $ | 12,601 | $ | 9,427 | 33.7 | % | $ | 34,201 | $ | 27,786 | 23.1 | % | |||||||||
| * Excludes sales volume associated with Futura, acquired on February 15, 2017. | |||||||||||||||||||||
Critical Accounting Policies and Estimates
In the ordinary course of business, the Company makes a number of estimates and assumptions relating to the reporting of results of operations and financial position in the preparation of financial statements in conformity with generally accepted accounting principlesstandards in the United States (“GAAP”("GAAP"). The Company believes the estimates, assumptions and judgments described in the section “Management’s Discussion and Analysis of Financial Condition and Results of Operations – Critical Accounting Policies” ofPolicies and Estimates” in the 20162023 Form 10-K have the greatest potential impact on our financial statements, so Tredegar considers these to be its critical accounting policies. These policies include accounting for impairment of long-lived assets and goodwill, investment accounted for under the fair value method, pension benefits and income taxes. These policies require management to exercise judgments that are often difficult, subjective and complex due to the necessity of estimating the effect of matters that are inherently uncertain. Actual results could differ significantly from those estimates under different assumptions and conditions. The Company believes the consistent application of these policies enables it to provide readers of the financial statements with useful and reliable information about our operating results and financial condition. Since December 31, 2016,2023, there have been no changes in these policies or estimates that have had a material impact on our results of operations or financial position. For more
Business Overview
Tredegar Corporation is an industrial manufacturer with three primary businesses: custom aluminum extrusions for the North American building and construction ("B&C"), automotive and specialty end-use markets through its Aluminum Extrusions segment; surface protection films for high-technology applications in the global electronics industry through its PE Films segment; and specialized polyester films primarily for the Latin American flexible packaging market through its Flexible Packaging Films segment. With approximately 1,900 employees, the Company operates manufacturing facilities in North America, South America, and Asia.
Earnings before interest, taxes, depreciation and amortization ("EBITDA") from ongoing operations is the measure of segment profit and loss used by Tredegar’s chief operating decision maker ("CODM") for purposes of assessing financial performance. The Company uses sales less freight (“net sales”) as its measure of revenues from external customers at the segment level. This measure is separately included in the financial information regularly provided to the CODM.
Earnings before interest and taxes ("EBIT") from ongoing operations is a non-GAAP financial measure included in the reconciliation of segment financial information to consolidated results for the Company in Note 9. It is not intended to represent the stand-alone results for Tredegar's ongoing operations under GAAP and should not be considered as an alternative to net income as defined by GAAP. We believe that EBIT is a widely understood and utilized metric that is meaningful to certain investors and that including this financial metric in the reconciliation of management’s performance metric, EBITDA from ongoing operations, provides useful information to those investors that primarily utilize EBIT to analyze the Company’s core operations.
First quarter 2024 net income (loss) was $3.3 million ($0.10 per diluted share) compared with net income (loss) of $(1.0) million ($(0.03) per diluted share) in the first quarter of 2023.
First Quarter Financial Results Highlights
•EBITDA from ongoing operations for Aluminum Extrusions was $12.5 million in the first quarter of 2024 versus $14.6 million in the first quarter of last year and $8.0 million in the fourth quarter of 2023.
◦Sales volume was 33.8 million pounds in the first quarter of 2024 versus 37.6 million pounds in the first quarter of last year and 32.9 million pounds in the fourth quarter of 2023.
◦Open orders at the end of the first quarter of 2024 were approximately 15 million pounds (versus 27 million pounds in the first quarter of 2023 and 14 million pounds at the end of the fourth quarter of 2023). Net new orders increased 61% and 12% in the first quarter of 2024 versus the first quarter of 2023 and fourth quarter of 2023, respectively.
•EBITDA from ongoing operations for PE Films was $6.9 million in the first quarter of 2024 versus $1.8 million in the first quarter of 2023 and $4.5 million in the fourth quarter of 2023. Sales volume was 10.0 million pounds in the first quarter of 2024 versus 7.4 million pounds in the first quarter of 2023 and 8.5 million pounds in the fourth quarter of 2023.
•EBITDA from ongoing operations for Flexible Packaging Films (also referred to as "Terphane") was $2.0 million during the first quarter of 2024 versus $1.4 million in the first quarter of 2023 and $2.3 million during the fourth quarter of 2023. Sales volume was 22.0 million pounds in the first quarter of 2024 versus 19.8 million pounds in the first quarter 2023 and
19
22.8 million pounds in the fourth quarter of 2023. See the Status of Agreement to Sell Terphane in Results of Operations below for information on new accounting pronouncements see Note 13.
the planned sale of Terphane.
Results of Operations
First Quarter of 2024 Compared with the First Quarter of 2023
The following table presents a bridge of consolidated net income (loss) from the first quarter of 2023 to the first quarter of 2024 with management's related discussion and analysis below the table.
| (In thousands) | ||||||||
| Net income (loss) for the three months ended March 31, 2023 | $ | (1,009) | ||||||
| Income tax expense (benefit) | 331 | |||||||
| Income (loss) before income taxes for the three months ended March 31, 2023 | (678) | |||||||
| Change in income (loss) from increases (decreases) in the following items: | ||||||||
| Sales | (15,386) | |||||||
| Other income (expense), net | (272) | |||||||
| Total | (15,658) | |||||||
| Change in income (loss) from (increases) decreases in the following items: | ||||||||
| Cost of goods sold | 17,482 | |||||||
| Freight | (623) | |||||||
| Selling, general and administrative | 748 | |||||||
| Research and development | 853 | |||||||
| Pension and postretirement benefits | 3,364 | |||||||
| Interest expense | (1,144) | |||||||
| Other | (399) | |||||||
| Total | 20,281 | |||||||
| Income (loss) before income taxes for the three months ended March 31, 2024 | 3,945 | |||||||
| Income tax expense (benefit) | 657 | |||||||
| Net income (loss) for the three months ended March 31, 2024 | $ | 3,288 | ||||||
Sales in the first quarter of 2024 decreased by $15.4 million compared with the thirdfirst quarter of 2016.2023. Net sales increased 9.2%(sales less freight) in Aluminum Extrusions decreased $19.1 million, primarily due to lower sales volume and the pass-through of lower metal costs. Net sales in PE Films increased $4.6 million, primarily due to a market-driven increasevolume increases in surface protection films sales and higher elastic, acquisition distribution layer,both Surface Protection and overwrap product sales.films. Net sales in Flexible Packaging Films decreased 2.5%$1.4 million, primarily due to lower production from manufacturing disruptionsselling prices that the Company believes are driven by excess global capacity and lower export sales volume. Net sales increased 34.1%stronger competition in Aluminum Extrusions primarily due toBrazil, Latin America and the acquisition of Futura,U.S., and unfavorable product mix, partially offset by higher sales volumes and an increase in average selling prices as a result of the pass-through to customers of higher market-driven raw material costs.volume. For more information on net sales and volume, see the Executive Summary.Segment Operations Review below.
Other income (expense), net in the first quarter of 2024 decreased by $0.3 million compared with the first quarter of 2023. The change in other income (expense), net was primarily due to cash consideration of $0.3 million received in January 2023 related to the customary post-closing adjustments on the sale of the investment in kaleo, Inc., which was sold in December 2021.
Consolidated gross profit (sales minus cost of goods sold and freight) as a percentage of sales (gross profit margin) was 17.0%15.4% in the thirdfirst quarter of 20172024 compared to 16.3%13.4% in the thirdfirst quarter of 2016.2023. The gross profit margin in Aluminum Extrusions remained consistent with the prior year period primarily due to lower sales volume, offset by higher net pricing after the pass-through of metal costs changes, lower labor and employee-related costs, lower supply expense, lower utility expense and lower freight expense. Additionally, the timing of the flow through under the first-in first-out method of aluminum raw material costs passed through to customers, previously acquired at higher prices in a quickly changing commodity pricing environment, resulted in a charge of $1.2 million in the first quarter of 2024 versus a benefit of $1.7 million in the first quarter
20
of 2023. The gross profit margin in PE Films increased due to a higher Surface Protection contribution margin associated with higher volume, in surface protection filmsfavorable pricing, operating efficiencies and personal caremanufacturing costs savings, lower fixed costs and cost improvements from overwrap films. The gross profit margin in Flexible Packaging Films decreased significantly due to higher costs in 2017 compared to 2016,slightly increased primarily due to production disruptions at its plant in Cabo, Brazil and the adverse impact of high inflation in Brazil and the appreciation of the Brazilian Real relative to the U.S. Dollar. The gross profit margin in Aluminum Extrusions increased primarily as a result of the operating performance by Futura, higher volumelower raw material costs, lower fixed costs and higher averagesales volume, partially offset by lower selling prices as a result of the pass-through to customers offrom global excess capacity and margin pressures and higher market-driven raw materialvariable costs.
During 2023, the Company settled the pension plan, which decreased the pension and other postretirement expenses for the first quarter of 2024 compared with 10.5%to the first quarter of 2023. See Note 4 for additional information.
Interest expense of $3.5 million in the thirdfirst three months of 2024 increased $1.1 million compared to the first three months of 2023 due to higher average debt levels and interest rates. See Note 10 for additional information.
The effective tax rate used to compute income taxes was 16.7% in the first quarter of last year total SG&A expenses increased as a result2024 compared to (48.8)% in the first quarter of the Futura acquisition2023. See Note 8 for additional information.
Pre-tax gains and related acquisition and integration costs and other business development costs.
| Three Months Ended March 31, | ||||||||
| (In millions) | 2024 | 2023 | ||||||
| Aluminum Extrusions: | ||||||||
| (Gains) losses from sale of assets, investment writedowns and other items: | ||||||||
Consulting expenses for ERP/MES project1 | $ | 0.6 | $ | — | ||||
Storm damage to the Newnan, Georgia plant1 | 0.1 | 0.6 | ||||||
Legal fees associated with the Aluminum Extruders Trade Case1 | 0.2 | — | ||||||
| Total for Aluminum Extrusions | $ | 0.9 | $ | 0.6 | ||||
| PE Films: | ||||||||
| (Gains) losses associated with plant shutdowns, asset impairments and restructurings: | ||||||||
Richmond, Virginia Technical Center closure expenses, including severance3 | $ | 0.2 | $ | — | ||||
Richmond, Virginia Technical Center lease abandonment3 | 0.3 | — | ||||||
| Total for PE Films | $ | 0.5 | $ | — | ||||
| Flexible Packaging Films: | ||||||||
| (Gains) losses associated with plant shutdowns, asset impairments and restructurings: | ||||||||
| Other restructuring costs - severance | $ | — | $ | 0.1 | ||||
| Total for Flexible Packaging Films | $ | — | $ | 0.1 | ||||
| Corporate: | ||||||||
| (Gains) losses from sale of assets, investment writedowns and other items: | ||||||||
Professional fees associated with business development activities1 | $ | 0.5 | $ | 0.3 | ||||
Professional fees associated with remediation activities related to internal control over financial reporting1 | 0.9 | 0.5 | ||||||
Professional fees associated with the transition to the ABL Facility1 | 0.2 | — | ||||||
Stock-based compensation expense associated with the fair value remeasurement of awards granted at the time of the 2020 special dividend1 | — | (0.1) | ||||||
Net periodic benefit cost for the frozen defined benefit pension plan in process of termination2 | — | 3.4 | ||||||
| Total for Corporate | $ | 1.6 | $ | 4.1 | ||||
1. Included in “Selling, general and administrative expenses” in the condensed consolidated statements of income. 2. See Note 4 for additional information. 3. See Note 1 for additional information. | ||||||||
21
Average total debt outstanding and interest rates were as follows:
| Three Months Ended March 31, | |||||||||||
| (In millions, except percentages) | 2024 | 2023 | |||||||||
| Floating-rate debt with interest charged on a rollover basis plus a credit spread: | |||||||||||
| Average total outstanding debt balance | $ | 153.1 | $ | 147.0 | |||||||
| Average interest rate | 9.4 | % | 6.3 | % | |||||||
Segment Operations Review
| Three Months Ended September 30, | |||||||
| (In Millions) | 2017 | 2016 | |||||
| Floating-rate debt with interest charged on a rollover basis at one-month LIBOR plus a credit spread: | |||||||
| Average outstanding debt balance | $ | 189.7 | $ | 99.2 | |||
| Average interest rate | 3.2 | % | 2.3 | % | |||
| Fixed-rate and other debt: | |||||||
| Average outstanding debt balance | $ | — | $ | — | |||
| Average interest rate | n/a | n/a | |||||
| Total debt: | |||||||
| Average outstanding debt balance | $ | 189.7 | $ | 99.2 | |||
| Average interest rate | 3.2 | % | 2.3 | % | |||
A summary of results for Aluminum Extrusions is provided below:
| Three Months Ended | Favorable/ (Unfavorable) % Change | ||||||||||||||||||||||||||||||||||
| (In thousands, except percentages) | March 31, | ||||||||||||||||||||||||||||||||||
| 2024 | 2023 | ||||||||||||||||||||||||||||||||||
| Sales volume (lbs) | 33,841 | 37,562 | (9.9)% | ||||||||||||||||||||||||||||||||
| Net sales | $ | 114,222 | $ | 133,370 | (14.4)% | ||||||||||||||||||||||||||||||
| Ongoing operations: | |||||||||||||||||||||||||||||||||||
| EBITDA | $ | 12,540 | $ | 14,638 | (14.3)% | ||||||||||||||||||||||||||||||
| Depreciation & amortization | (4,542) | (4,411) | (3.0)% | ||||||||||||||||||||||||||||||||
| EBIT* | $ | 7,998 | $ | 10,227 | (21.8)% | ||||||||||||||||||||||||||||||
| Capital expenditures | $ | 1,550 | $ | 7,742 | |||||||||||||||||||||||||||||||
| *See the table in Note 9 for a reconciliation of this non-GAAP measure to the most comparable measure calculated in accordance with GAAP. | |||||||||||||||||||||||||||||||||||
First Nine MonthsQuarter 2024 Results vs. First Quarter 2023 Results
Net sales (sales less freight) in the first quarter of 2017 Compared2024 decreased 14.4% versus the first quarter of 2023 primarily due to lower sales volume and the pass-through of lower metal costs. Sales volume in the first quarter of 2024 decreased 9.9% versus the first quarter of 2023 but increased 2.7% versus the fourth quarter 2023.
Net new orders, which remain low compared to pre-pandemic levels but are growing, increased 61% in the first quarter of 2024 versus the first quarter of 2023, marking the sixth consecutive quarterly increase in incoming orders. Since January 2021, net new orders for the Company's aluminum extruded products have generally tracked the ISM® Manufacturing PMI®. The Company believes that net new orders continue to be below pre-pandemic levels due to higher interest rates, tighter lender requirements and the increase in remote working, which particularly impacts the non-residential B&C end-use market. In addition, data indicates that aluminum extrusion imports increased significantly in recent years, especially during the pandemic, and some of Bonnell Aluminum’s customers may have sourced, and continue to source, aluminum extrusions from producers outside the United States.
Open orders at the end of the first quarter of 2024 were 15 million pounds (versus 14 million pounds at the end of the fourth quarter of 2023 and 27 million pounds at the end of the first quarter of 2023). This level is below the quarterly range of 21 to 27 million pounds in 2019 before pandemic-related disruptions (particularly starting in early 2021 with the re-opening of markets following the rollout of vaccines) that resulted in long lead times, driving a peak in open orders of approximately 100 million pounds during the first quarter of 2022.
The Company is participating as part of a coalition of members of the Aluminum Extruders Council who have filed a trade case with the Department of Commerce (“DOC”) and the U.S. International Trade Commission (“ITC”) against 15 countries in response to alleged large and increasing volumes of unfairly priced imports of aluminum extrusions since 2019. In November 2023, the ITC found that there is a reasonable indication that the American aluminum extrusions industry is materially injured or threatened with injury due to imports from 14 countries, including China. The ITC’s preliminary determination found that subject import volumes were significant and increasing, and that with regard to pricing, subject imports predominantly undersold the domestic product by volume in each year of the period of investigation. On May 2, 2024, the DOC announced its preliminarily determination that aluminum extrusion producers and exporters in 14 countries, including China,sold aluminum extrusions at less-than-fair value in the United States. Final determinations, which are expected by the end of the third quarter of 2024, should provide an additional opportunity for Bonnell to regain market share.
22
EBITDA from ongoing operations in the first quarter of 2024 decreased $2.1 million versus the first quarter of 2023 primarily due to:
•Lower volume ($3.3 million) offset by higher net pricing after the pass-through of metal cost changes ($2.0 million), lower labor and employee-related costs ($0.6 million), lower supply expense ($0.6 million), lower utility expense ($0.4 million), lower SG&A expenses ($0.3 million) and lower freight rates ($0.2 million); and
•The timing of the flow-through under the first-in first-out method of aluminum raw material costs passed through to customers, previously acquired at higher prices in a quickly changing commodity pricing environment, resulted in a charge of $1.2 million in the first quarter of 2024 versus a benefit of $1.7 million in the first quarter of 2023.
Refer to Item 3. Quantitative and Qualitative Disclosures About Market Risk in this Form 10-Q for additional information on aluminum prices.
Projected Capital Expenditures and Depreciation & Amortization
Capital expenditures for Bonnell Aluminum are projected to be $9 million in 2024, including $4 million for productivity projects and $5 million for capital expenditures required to support continuity of operations. The projected spending reflects stringent spending measures that the Company has implemented to control its financial leverage. The multi-year implementation for new enterprise resource planning and manufacturing execution systems ("ERP/MES") has been reorganized with an extended implementation period. As a result, the earliest "go-live" date for the net ERP/MES is 2025. The ERP/MES project commenced in 2022, with spending to-date of approximately $21 million. Depreciation expense is projected to be $16 million in 2024. Amortization expense is projected to be $2 million in 2024.
PE Films
A summary of results for PE Films is provided below:
| Three Months Ended | Favorable/ (Unfavorable) % Change | ||||||||||||||||||||||||||||||||||
| (In thousands, except percentages) | March 31, | ||||||||||||||||||||||||||||||||||
| 2024 | 2023 | ||||||||||||||||||||||||||||||||||
| Sales volume (lbs) | 10,036 | 7,368 | 36.2% | ||||||||||||||||||||||||||||||||
| Net sales | $ | 24,735 | $ | 20,182 | 22.6% | ||||||||||||||||||||||||||||||
| Ongoing operations: | |||||||||||||||||||||||||||||||||||
| EBITDA | $ | 6,904 | $ | 1,849 | 273.4% | ||||||||||||||||||||||||||||||
| Depreciation & amortization | (1,329) | (1,643) | 19.1% | ||||||||||||||||||||||||||||||||
| EBIT* | $ | 5,575 | $ | 206 | NM** | ||||||||||||||||||||||||||||||
| Capital expenditures | $ | 394 | $ | 716 | |||||||||||||||||||||||||||||||
* See the table in Note 9 for a reconciliation of this non-GAAP measure to the most comparable measure calculated in accordance with GAAP. ** Not meaningful ("NM") | |||||||||||||||||||||||||||||||||||
First Nine Months Quarter 2024 Results vs. First Quarter 2023 Results
Net sales in the first quarter of 20162024 were 22.6% higher compared to the first quarter of 2023, with volume increases in both Surface Protection and overwrap films. Surface Protection sales volume in the first quarter of 2024 increased 43% versus the first quarter of 2023 and 30% versus the fourth quarter of 2023. Given recent volume improvements for Surface Protection and other market indicators, the Company believes that the consumer electronics market is now in recovery mode.
EBITDA from ongoing operations in the first quarter of 2024 increased $5.1 million versus the first quarter of 2023, primarily due to:
•A $4.4 million increase from Surface Protection primarily due to higher contribution margin associated with higher volume ($1.0 million), favorable pricing ($0.3 million), operating efficiencies and manufacturing costs savings ($1.9 million), lower fixed costs ($0.4 million), and lower SG&A ($0.7 million, including $0.6 million associated with the closure of the Richmond Technical Center in 2023).
•A $0.7 million increase from overwrap films primarily due to cost improvements.
23
Refer to Item 3. Quantitative and Qualitative Disclosures About Market Risk in this Form 10-Q for additional information on resin prices. Projected Capital Expenditures and Depreciation & Amortization
Capital expenditures for PE Films are projected to be $2 million in 2024, including $1 million for productivity projects and $1 million for capital expenditures required to support continuity of current operations. Depreciation expense is projected to be $5 million in 2024. There is no amortization expense for PE Films.
Flexible Packaging Films
A summary of results for Flexible Packaging Films is provided below:
| Three Months Ended | Favorable/ (Unfavorable) % Change | ||||||||||||||||||||||||||||||||||
| (In thousands, except percentages) | March 31, | ||||||||||||||||||||||||||||||||||
| 2024 | 2023 | ||||||||||||||||||||||||||||||||||
| Sales volume (lbs) | 21,973 | 19,845 | 10.7% | ||||||||||||||||||||||||||||||||
| Net sales | $ | 30,113 | $ | 31,527 | (4.5)% | ||||||||||||||||||||||||||||||
| Ongoing operations: | |||||||||||||||||||||||||||||||||||
| EBITDA | $ | 1,963 | $ | 1,350 | 45.4% | ||||||||||||||||||||||||||||||
| Depreciation & amortization | (751) | (700) | (7.3)% | ||||||||||||||||||||||||||||||||
| EBIT* | $ | 1,212 | $ | 650 | 86.5% | ||||||||||||||||||||||||||||||
| Capital expenditures | $ | 518 | $ | 605 | |||||||||||||||||||||||||||||||
| * See the table in Note 9 for a reconciliation of this non-GAAP measure to the most comparable measure calculated in accordance with GAAP. | |||||||||||||||||||||||||||||||||||
First Quarter 2024 Results vs. First Quarter 2023 Results
Net sales in the first nine monthsquarter of 2017 increased by 14.7%2024 decreased 4.5% compared withto the first nine monthsquarter of 2016. Net sales increased 5.7% in PE Films2023 primarily due to a marketlower selling prices that the Company believes are driven increaseby excess global capacity and strong competition in surface protection films salesBrazil, Latin America and higher personal care films sales,the U.S., and unfavorable product mix, partially offset by known lost businesshigher sales volume.
EBITDA from ongoing operations in the first quarter of 2024 increased $0.6 million versus the first quarter of 2023, primarily due to:
•Lower raw material costs ($1.9 million), lower fixed costs ($1.7 million), higher sales volume ($ 1.0 million) and product transitions. lower SG&A ($0.2 million), partially offset by lower selling prices from global excess capacity and margin pressures ($2.1 million) and higher variable costs ($1.3 million);
•Foreign currency transaction gains ($0.1 million) in the first quarter of 2024 compared to foreign currency transaction losses ($0.1 million) in the first quarter of 2023; and
•Net salesunfavorable foreign currency translation of Real-denominated operating costs ($0.9 million).
Refer to Item 3. Quantitative and Qualitative Disclosures About Market Risk in this Form 10-Q for additional information on polyester fiber and component price trends.
Projected Capital Expenditures and Depreciation & Amortization
Capital expenditures for Flexible Packaging Films decreased 1.2% largely dueare projected to production issuesbe $4 million in 2024 for capital expenditures required to support continuity of current operations. Depreciation expense is projected to be $3 million in 2024. Amortization expense is projected to be $0.1 million in 2024.
Corporate Expenses, Interest & Other
Corporate expenses, net in the third quarter, partially offset by a favorable sales mix. Net sales increased 27.8% in Aluminum Extrusionsfirst three months of 2024 decreased $3.2 million compared to the first three months of 2023 primarily due to the acquisition of Futura and an increase in average selling priceslower pension expense as a result of the pass-through to customers of higher market-driven raw material costs. For more information on net salespension plan termination completed in 2023 ($3.4 million) and volume, see the Executive Summary.
Interest expense increased from $2.9of $3.5 million in the first ninethree months of 20162024 increased $1.1 million compared to $4.6 million in the first ninethree months of 2017. In February 2017,2023 due to higher average debt levels and interest rates.
Status of Agreement to Sell Terphane
On September 1, 2023, the Company borrowed $87announced that it had entered into a definitive agreement to sell Terphane to Oben Group (the “Contingent Terphane Sale”). Completion of the sale is contingent upon the satisfaction of customary closing conditions, including the receipt of certain competition filing approvals by authorities in Brazil and Colombia. On October 27, 2023, the Company filed the requisite competition forms with the Administrative Council for Economic Defense (“CADE”) in
24
Brazil. The regulatory review process is ongoing and in line with the Company’s expectations. CADE’s maximum deadline for completing its review is no later than November 18, 2024. The merger review regarding the transaction was cleared by the Colombian authority in early February 2024.
As of March 31, 2024, the Company has reported results for Terphane as a continuing operation, given the status of the approval process by authorities. If the sale transaction is completed, the Company expects to realize after-tax net debt-free cash proceeds of $85 million under its Credit Agreementafter deducting projected Brazil withholding taxes, escrow funds, U.S. capital gains taxes and transaction costs. Actual after-tax proceeds may differ from estimates due to fundpossible changes in deductions and the acquisition of Futura. Interest expenseCompany's tax situation during the potentially lengthy interim period to the closing date.
Net capitalization and other credit measures are provided in 2016 included the write off of $0.2 million in unamortized loan fees from the credit facility that was refinanced in the first quarter of 2016.Liquidity and Capital Resources below.
| Nine Months Ended September 30, | |||||||
| (In Millions) | 2017 | 2016 | |||||
| Floating-rate debt with interest charged on a rollover basis at one-month LIBOR plus a credit spread: | |||||||
| Average outstanding debt balance | $ | 177.6 | $ | 104.8 | |||
| Average interest rate | 2.9 | % | 2.3 | % | |||
| Fixed-rate and other debt: | |||||||
| Average outstanding debt balance | $ | — | $ | — | |||
| Average interest rate | n/a | n/a | |||||
| Total debt: | |||||||
| Average outstanding debt balance | $ | 177.6 | $ | 104.8 | |||
| Average interest rate | 2.9 | % | 2.3 | % | |||
Liquidity and Capital Resources
•Accounts and other receivables increased $29.6$5.1 million (30.4%(7.5%).
◦Accounts receivableand other receivables in PE FilmsAluminum Extrusions increased by $6.0$7.3 million primarily due to higherincreased sales volume for surface protection films and personal care films, andduring the timingfirst three months of cash receipts.2024. DSO (represents trailing 12 months net sales divided by a rolling 12-month average of accounts and other receivables balances) was approximately 48.643.9 days for the 12 months ended September 30, 2017March 31, 2024 and 45.745.1 days for the 12 months ended December 31, 2016.2023.
◦Accounts receivableand other receivables in Flexible PackagingPE Films wereremained relatively flat. DSO was approximately 53.526.3 days for the 12 months ended September 30, 2017March 31, 2024, which was the same for the 12 months ended December 31, 2023.
◦Accounts and 51.8other receivables in Flexible Packaging Films decreased $2.3 million primarily due to improved collection efforts during the three months ended 2024. DSO was approximately 37.1 days for the 12 months ended March 31, 2024 and 38.1 days for the 12 months ended December 31, 2016.2023.
◦Inventories in Aluminum Extrusions increased by $24.2 million primarily due to the addition of balances from the acquisition of Futura, including the recording of a contingent receivable of $5 million related to
◦Inventories in Flexible PackagingPE Films decreased by approximately $0.2increased $2.9 million primarily due to higher raw materials to support increased sales volume during the timingfirst three months of raw material purchases.2024. DIO was approximately 70.953.6 days for the 12 months ended September 30, 2017March 31, 2024 and 77.057.2 days for the 12 months ended December 31, 2016.2023.
◦Inventories in Aluminum ExtrusionsFlexible Packaging Films increased by $13.0$1.9 million primarily due to the addition of balances from the acquisition of Futura, the restart of the Newnan, Georgia cast house and the timing ofhigher raw material purchases. DIO was approximately 31.1107.8 days for the 12 months ended September 30, 2017March 31, 2024 and 26.5117.7 days for the 12 months ended December 31, 2016.2023.
•Net property, plant and equipment increased $49.4decreased $5.5 million (18.9%) primarily due to property and equipment added from the acquisitiondepreciation expense of Futura of $32.7 million, capital expenditures of $37.2$6.3 million and a $0.9 million unfavorable change in the value of the U.S. dollar relative to foreign currencies, ($6.4 million increase) and partially offset by depreciation expensescapital expenditures of $25.1$1.8 million.
•Deferred income tax assets decreased $0.7 million (2.9%). See Note 8 for more information.
•Accounts payable decreased $10.1 million (10.6%).
◦Accounts payable in Aluminum Extrusions decreased $9.0 million primarily due to balances added from the acquisition of Futura of $41.1 million, partially offset by amortization expense of $4.6 million. Identifiable intangible assets and goodwill associated with the Futura acquisition were $30.7 million and $10.4 million, respectively.
◦Accounts payable in Flexible PackagingPE Films decreased $1.2increased $2.7 million primarily due to the normal volatility associated with the timing of payments.higher raw material purchases. DPO was approximately 42.243.9 days for the 12 months ended September 30, 2017March 31, 2024 and 39.543.4 days for the 12 months ended December 31, 2016.2023.
◦Accounts payable in Aluminum Extrusions increased by $12.5Flexible Packaging Films decreased $3.8 million primarily due to the addition of balances from the acquisition of Futura, negotiation of favorable payment terms and the normal volatility associated with the timing of payments.lower raw material costs. DPO was approximately 48.265.3 days for the 12 months ended September 30, 2017March 31, 2024 and 45.461.7 days for the 12 months ended December 31, 2016.2023.
25
| Net Capitalization and Indebtedness as of September 30, 2017 | |||
| (In Thousands) | |||
| Net capitalization: | |||
| Cash and cash equivalents | $ | 31,850 | |
| Debt: | |||
| Credit Agreement | 177,000 | ||
| Debt, net of cash and cash equivalents | 145,150 | ||
| Shareholders’ equity | 373,914 | ||
| Net capitalization | $ | 519,064 | |
| Indebtedness as defined in Credit Agreement: | |||
| Total debt | $ | 177,000 | |
| Face value of letters of credit | 2,685 | ||
| Other | 422 | ||
| Indebtedness | $ | 180,107 | |
| Pricing Under The Credit Agreement (Basis Points) | |||||
| Indebtedness-to-Adjusted EBITDA Ratio | Credit Spread Over LIBOR | Commitment Fee | |||
| > 3.5x but <= 4.0x | 250 | 45 | |||
| > 3.0x but <= 3.5x | 225 | 40 | |||
| > 2.0x but <= 3.0x | 200 | 35 | |||
| > 1.0x but <= 2.0x | 175 | 30 | |||
| <= 1.0x | 150 | 25 | |||
At September 30, 2017, the interest rate on debt under the Credit Agreement existing at that date was priced at one-month LIBOR plus the applicable credit spread of 175 basis points. Under the Credit Agreement, borrowings are permitted up to $400 million, and approximately $214 million was available to borrow at September 30, 2017 based upon the most restrictive covenants.
| Computations of Adjusted EBITDA, Adjusted EBIT, Leverage Ratio and Interest Coverage Ratio as Defined in the Credit Agreement Along with Related Most Restrictive Covenants as of and for the Twelve Months Ended September 30, 2017 (In Thousands) | |||
| Computations of adjusted EBITDA and adjusted EBIT as defined in the Credit Agreement for the twelve months ended September 30, 2017: | |||
| Net income (loss) | $ | 57,908 | |
| Plus: | |||
| After-tax losses related to discontinued operations | — | ||
| Total income tax expense for continuing operations | 11,020 | ||
| Interest expense | 5,467 | ||
| Depreciation and amortization expense for continuing operations | 38,126 | ||
| All non-cash losses and expenses, plus cash losses and expenses not to exceed $10,000, for continuing operations that are classified as unusual, extraordinary or which are related to plant shutdowns, asset impairments and/or restructurings (cash-related of $9,694) | 12,625 | ||
| Charges related to stock option grants and awards accounted for under the fair value-based method | 185 | ||
| Losses related to the application of the equity method of accounting | — | ||
| Losses related to adjustments in the estimated fair value of assets accounted for under the fair value method of accounting | — | ||
| Minus: | |||
| After-tax income related to discontinued operations | — | ||
| Total income tax benefits for continuing operations | — | ||
| Interest income | (274 | ) | |
| All non-cash gains and income, plus cash gains and income in excess of $10,000, for continuing operations that are classified as unusual, extraordinary or which are related to plant shutdowns, asset impairments and/or restructurings | (2,826 | ) | |
| Income related to changes in estimates for stock option grants and awards accounted for under the fair value-based method | — | ||
| Income related to the application of the equity method of accounting | — | ||
| Income related to adjustments in the estimated fair value of assets accounted for under the fair value method of accounting | (26,600 | ) | |
| Plus cash dividends declared on investments accounted for under the equity method of accounting | — | ||
| Plus or minus, as applicable, pro forma EBITDA adjustments associated with acquisitions and asset dispositions | 3,436 | ||
| Adjusted EBITDA as defined in the Credit Agreement | 99,067 | ||
| Less: Depreciation and amortization expense for continuing operations (including pro forma for acquisitions and asset dispositions) | (40,183 | ) | |
| Adjusted EBIT as defined in the Credit Agreement | $ | 58,884 | |
| Computations of leverage and interest coverage ratios as defined in the Credit Agreement at September 30, 2017: | |||
| Leverage ratio (indebtedness-to-adjusted EBITDA) | 1.82x | ||
| Interest coverage ratio (adjusted EBIT-to-interest expense) | 10.77x | ||
| Most restrictive covenants as defined in the Credit Agreement: | |||
| Maximum permitted aggregate amount of dividends that can be paid by Tredegar during the term of the Credit Agreement ($100,000 plus 50% of net income generated for each quarter beginning January 1, 2016) | $ | 140,323 | |
| Maximum leverage ratio permitted | 4.00 | ||
| Minimum interest coverage ratio permitted | 2.50 | ||
Debt and Credit Agreements
ABL Facility
On December 27, 2023, the Company entered into Amendment No. 3 (the “ABL Facility”) to the Second Amended and Restated Credit Agreement, which provides the Company with a $180 million senior secured asset-based revolving credit facility that will expire on unremitted earningsJune 30, 2026. On April 16, 2024, the Company entered into Amendment No. 4 (the "Amendment") that, among other items: (i) moves the ABL Adjustment Date (defined below) from March 31, 2025 to September 30, 2025 and (ii) requires weekly reporting of the borrowing base financial covenant. The ABL Facility is secured by substantially all assets of the Company and its domestic subsidiaries, including equity in certain material first-tier foreign subsidiaries. Availability for borrowings under the ABL Facility is governed by a borrowing base, determined by the application of specified advance rates against eligible assets, including a portion of trade accounts receivable, inventory, cash and cash equivalents, owned real properties, and owned machinery and equipment. Upon the earlier of September 30, 2025 or the date the Company receives the proceeds from the sale of Terphane (the “ABL Adjustment Date”), the $180 million ABL Facility will be reduced to $125 million. As of March 31, 2024, availability under the ABL Facility was $22.2 million, after reducing the borrowing base by the aggregate outstanding borrowings of $128.3 million, standby letters of credit of $13.1 million, and the Minimum Liquidity (as defined in the ABL Facility) financial covenant.
Under the terms of the ABL Facility, certain domestic bank accounts are subject to blocked account agreements, each of which contains a springing feature whereby the lenders may exercise control over those accounts during a cash dominion period (any such period, a “Cash Dominion Period”). A Cash Dominion Period was implemented on the date of the closing of the ABL Facility and will remain in effect at all times prior to the ABL Adjustment Date. After the ABL Adjustment Date, a Cash Dominion Period goes into effect if availability under the ABL Facility falls below 12.5% or an Event of Default (as defined in the ABL Facility) occurs. The Company would then be subject to the Cash Dominion Period until the Event of Default is waived or ABL Facility availability is above 12.5% of the $125 million aggregate commitment for 30 consecutive days. Receipts that have not yet been applied to the ABL Facility are classified as restricted cash in the Company’s consolidated balance sheets.
The financial covenants in the ABL Facility are as follows:
•Until the ABL Adjustment Date, the Company is required to maintain (i) a minimum Credit EBITDA (as defined in the ABL Facility), as of the end of each fiscal month for the 12-month period then ended (presented below) and (ii) a Minimum Liquidity (as defined in the ABL Facility) of $10.0 million.
26
| Minimum Credit EBITDA (In thousands) | |||||
| March 2024 | $ | 16,640 | |||
| April 2024 | 19,780 | ||||
| May 2024 | 19,660 | ||||
| June 2024 | 19,450 | ||||
| July 2024 | 21,860 | ||||
| August 2024 | 22,830 | ||||
| September 2024 | 25,370 | ||||
| October 2024 | 26,070 | ||||
| November 2024 | 27,640 | ||||
| December 2024 | 29,640 | ||||
| January 2025 | 29,740 | ||||
| February 2025 | 29,850 | ||||
| March 2025 | 29,980 | ||||
| April 2025 | 30,340 | ||||
| May 2025 | 30,700 | ||||
| June 2025 | 31,030 | ||||
| July 2025 | 31,370 | ||||
| August 2025 | 31,710 | ||||
| September 2025 | $ | 32,080 | |||
•Following the ABL Adjustment Date, the foregoing financial covenants will cease to exist and will be replaced with a minimum fixed charge coverage ratio of 1.00:1.00 that will be triggered in the event that availability is less than 10% of $125 million commitment amount and continuing thereafter until availability is greater than 10% of the $125 million commitment amount for 30 consecutive days.
27
The computation of Credit EBITDA, as defined in the ABL Facility, is presented below.
Computations of Credit EBITDA (as defined in the ABL Facility) as of and for the Twelve Months Ended March 31, 2024 * | |||||
| Computations of Credit EBITDA for the twelve months ended March 31, 2024 (in thousands): | |||||
| Net income (loss) | $ | (101,608) | |||
| Plus: | |||||
| After-tax losses related to discontinued operations | — | ||||
| Total income tax expense for continuing operations | — | ||||
| Interest expense | 12,751 | ||||
| Depreciation and amortization expense for continuing operations | 27,554 | ||||
| All non-cash losses and expenses, plus cash losses and expenses not to exceed $10,000, for continuing operations that are classified as unusual, extraordinary or which are related to plant shutdowns, asset impairments and/or restructurings (cash-related of $9,899) | 141,252 | ||||
| Charges related to stock option grants and awards accounted for under the fair value-based method | — | ||||
| Losses related to the application of the equity method of accounting | — | ||||
| Losses related to adjustments in the estimated fair value of assets accounted for under the fair value method of accounting | — | ||||
| Fees, costs and expenses incurred in connection with the amendment process | 184 | ||||
| Terphane sale transaction costs in an amount not to exceed $10,000 | 4,949 | ||||
| Minus: | |||||
| After-tax income related to discontinued operations | — | ||||
| Total income tax benefits for continuing operations | (53,799) | ||||
| Interest income | (500) | ||||
| All non-cash gains and income, plus cash gains and income in excess of $10,000, for continuing operations that are classified as unusual, extraordinary or which are related to plant shutdowns, asset impairments and/or restructurings | — | ||||
| Income related to changes in estimates for stock option grants and awards accounted for under the fair value-based method | — | ||||
| Income related to the application of the equity method of accounting | — | ||||
| Income related to adjustments in the estimated fair value of assets accounted for under the fair value method of accounting | — | ||||
| Plus cash dividends declared on investments in an amount not to exceed $10,000 for such period | — | ||||
| Plus or minus, as applicable, pro forma EBITDA adjustments associated with acquisitions and asset dispositions | — | ||||
| Plus or minus, as applicable, pro forma EBITDA adjustments to pension expense associated with the early payment of pension obligations | 7,284 | ||||
| Credit EBITDA | 38,067 | ||||
*Credit EBITDA is not intended to represent net income (loss) or cash flow from operations as defined by GAAP and should not be considered as an alternative to either net income (loss) or to cash flow. | |||||
28
The computation of the ABL Facility availability and Minimum Liquidity covenant, as defined in the ABL Facility, is presented below.
| (In thousands, except percentages) | March 31, 2024 | December 31, 2023 | |||||||||
| Maximum aggregate principal | $ | 180,000 | $ | 180,000 | |||||||
| Maximum borrowing limit per the Borrowing base as defined in the ABL Facility (includes eligible domestic cash and cash equivalents of $851 as of March 31, 2024 and $3,846 as of December 31, 2023) | $ | 173,601 | $ | 172,286 | |||||||
| ABL Facility outstanding debt (matures on June 30, 2026) | 128,330 | 126,322 | |||||||||
| Outstanding standby letters of credit | 13,080 | 13,080 | |||||||||
| ABL Facility availability | $ | 32,191 | $ | 32,884 | |||||||
| Minimum Liquidity covenant | 10,000 | 10,000 | |||||||||
| ABL Facility availability in excess of Minimum Liquidity covenant | $ | 22,191 | $ | 22,884 | |||||||
In addition to the financial covenants, the ABL Facility contains restrictive covenants, including covenants that restrict the Company’s ability to pay dividends and repurchase shares of its common stock.
As of March 31, 2024, the Company was in compliance with all debt covenants.
Terphane Brazil Loan
On October 26, 2023, Terphane Ltda., the Company’s wholly owned subsidiary in Brazil, borrowed $20 million secured by certain of its assets (“Terphane Brazil Loan”). This U.S. Dollar borrowing matures on October 30, 2028. The Company expects that the Terphane Brazil Loan will be repaid (and collateral released) upon the closing of the Contingent Terphane Sale. On October 26, 2023, the Company borrowed $20 million from Terphane Ltda. (the “Intercompany Loan”) at the same interest rate as the Terphane Brazil Loan, thereby transferring the funds to the U.S. The Company will repay the Intercompany Loan in conjunction with the closing of the Contingent Terphane Sale.
For more information on the ABL Facility and the Terphane Brazil Loan, see Note 10 for additional information.
The Company believes that existing borrowing availability, current cash balances and cash flow from operations will be sufficient to satisfy itsshort term material cash requirements related to working capital, capital expenditure, and dividend requirementsdebt repayments for at least the next 12 months. In the longer term, liquidity will depend on many factors, including the results of operations, the timing and extent of capital expenditures, changes in operating plans, or other events that would cause the Company to seek additional financing in future periods. In addition, the completion of the Contingent Terphane Sale would provide additional liquidity.
Item 3. Quantitative and Qualitative Disclosures About Market Risk.
Tredegar has exposure to the volatility of interest rates, polyethylene and polypropylene resin prices, TerephtalicTerephthalic Acid (“PTA”) and Monoethylene Glycol (“MEG”) prices, aluminum ingot and scrap prices, energy prices, foreign currencies and emerging markets. See Liquidity and Capital Resources above regarding Credit Agreement and interest rate exposures.exposures related to borrowings under the Credit Agreement.
Profit margins in Aluminum Extrusions are sensitive to fluctuations in aluminum ingot and scrap prices as well as natural gas prices (natural gas is the principal energy source used to operate its casting furnaces). Changes in polyethylene resin prices and the timing of those changes could have a significant impact on profit margins in PE Films. Changes in polyester resin, PTA and MEG prices, and the timing of those changes, could have a significant impact on profit margins in Flexible Packaging Films. Profit margins in Aluminum Extrusions are sensitive to fluctuations in aluminum ingot and scrap prices as well as natural gas prices (natural gas is the principal energy source used to operate its casting furnaces). There is no assurance of the Company’s ability to pass through higher raw material and energy costs to its customers.
The volatility of average quarterly prices of low density polyethylene resin in the U.S. (a primary raw material for PE Films) is shown in the chart below.
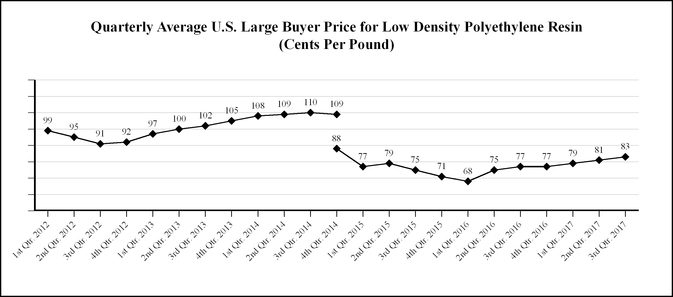
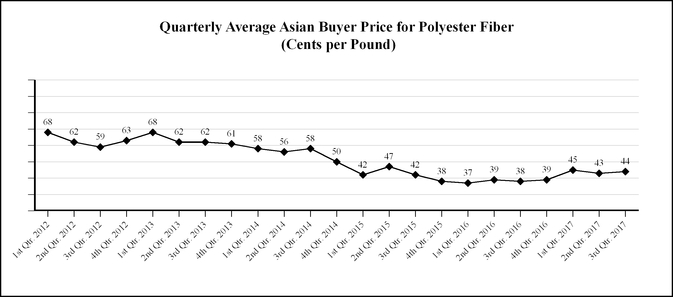
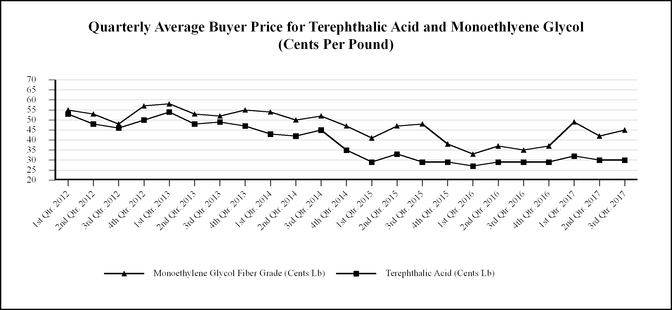
we remain substantially neutral to metal pricing. In the normal course of business, Aluminum Extrusions enters into fixed-price forward sales contracts with certain customers for the sale of fixed quantities of aluminum extrusions at scheduled intervals. In order to hedge its exposure to aluminum price volatility (see the chart below) under these fixed-price arrangements, which generally have a duration of not more than 12 months, the Company enters into a combination of forward purchase commitments and futures contracts to acquire or hedge aluminum, based on the scheduled deliveries. See Note 87 for additional information.
29
The volatility of quarterly average aluminum prices is shown in the chart below.
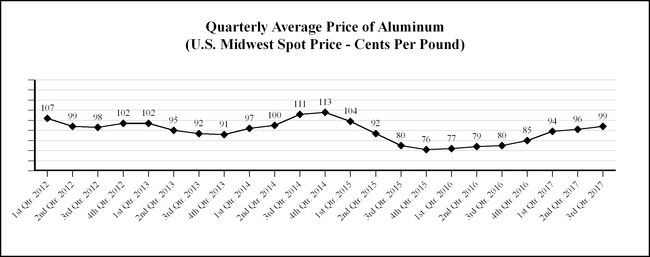
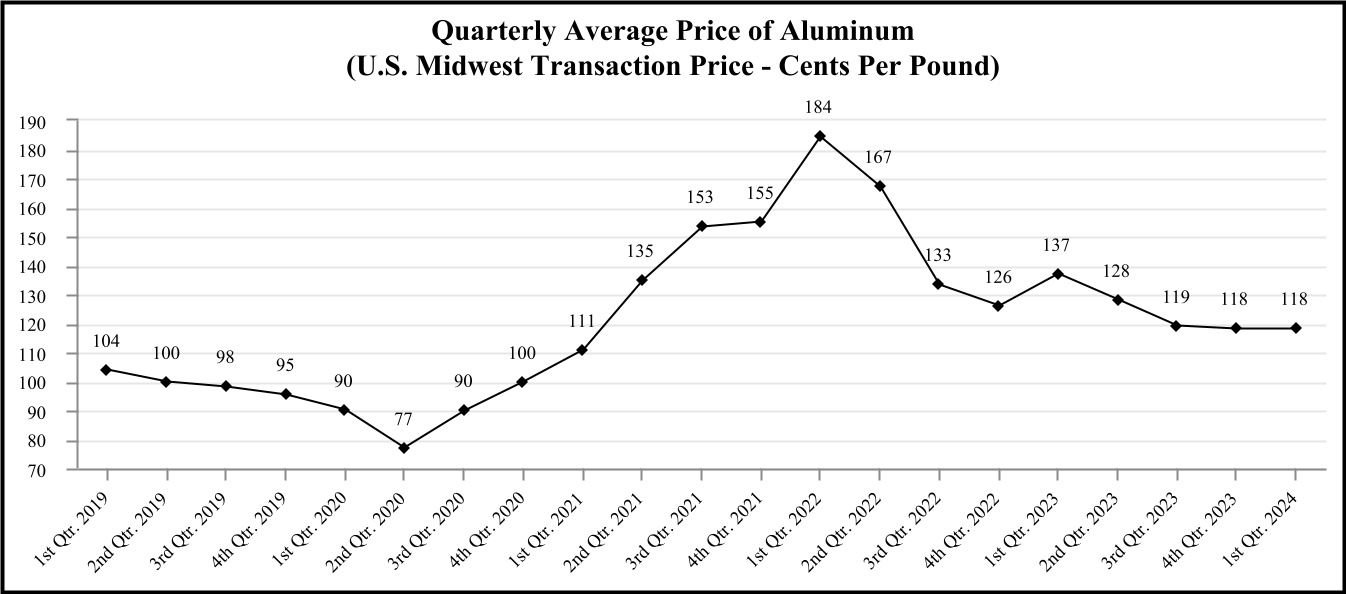
| Source: Quarterly averages computed by the Company using daily Midwest average prices provided by Platts. | ||
The volatility of quarterly average natural gas prices is shown in the chart below.
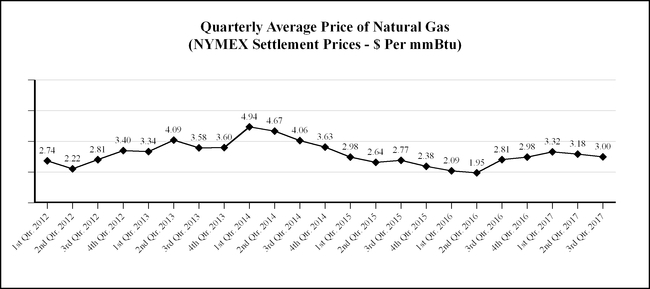
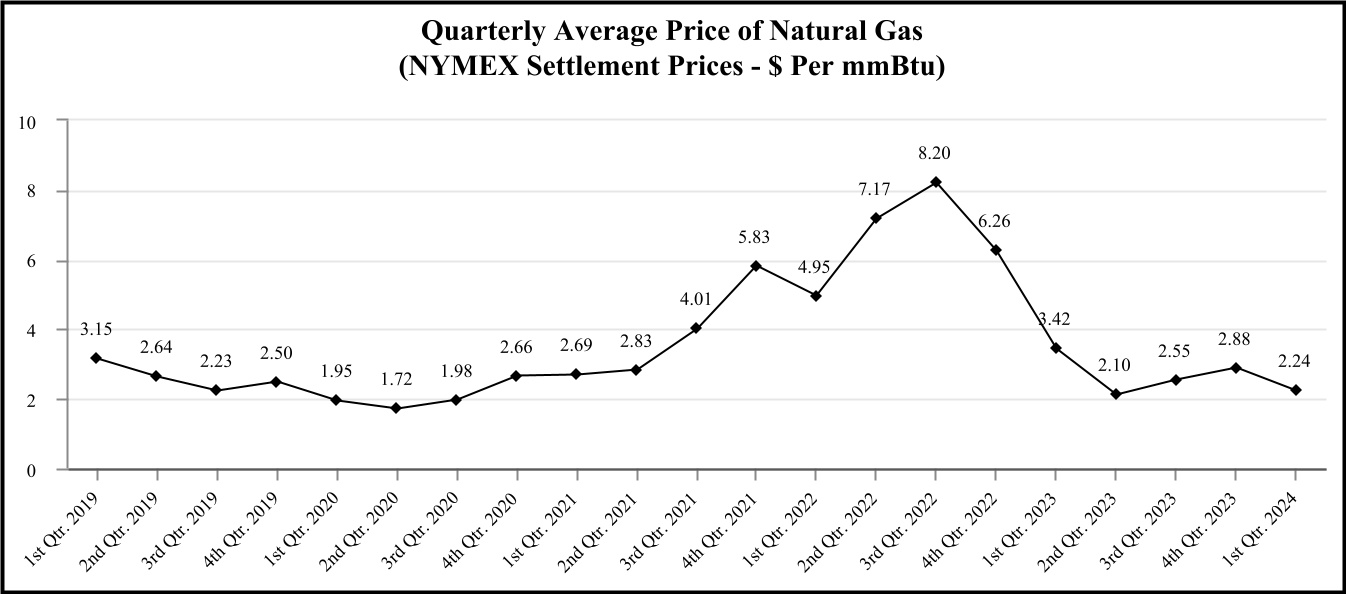
| Source: Quarterly averages computed by Tredegar using monthly NYMEX settlement prices. | ||
30
The Company sellsvolatility of average quarterly prices of polyethylene resin in the U.S. (a primary raw material for PE Films) is shown in the chart below.
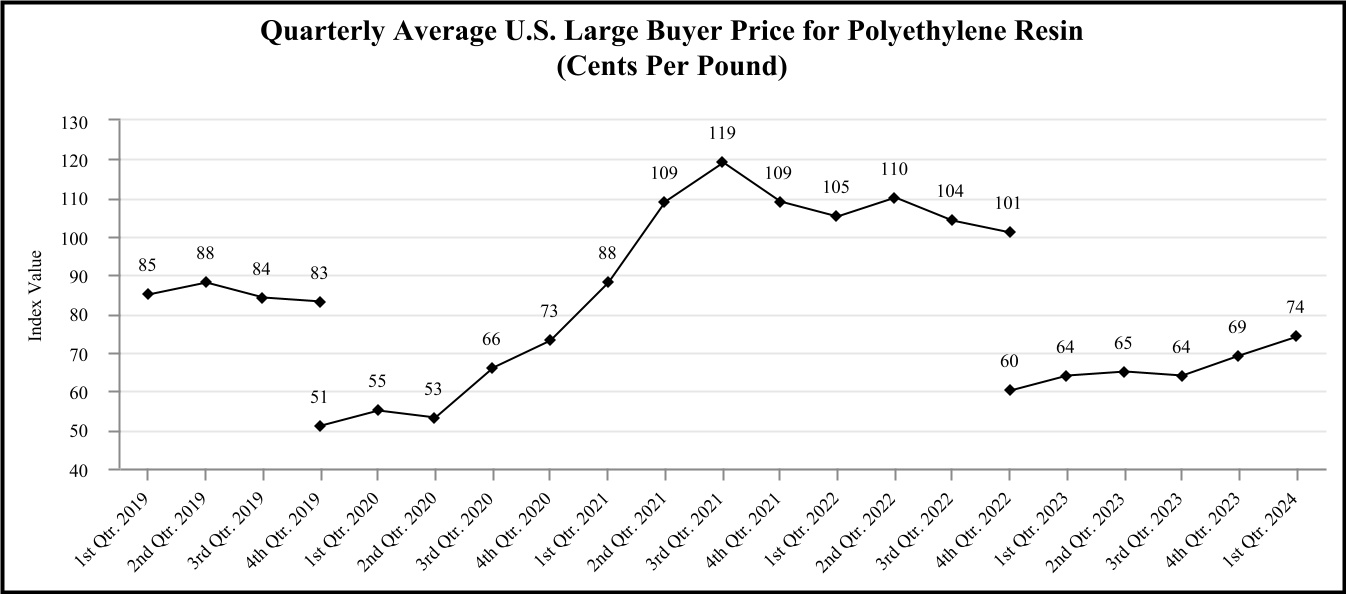
| Source: Quarterly averages computed by Tredegar using monthly data provided by IHS, Inc. In February 2020, IHS reflected a 32 cents per pound non-market adjustment based on their estimate of the growth of discounts in prior periods. The 4th quarter 2019 average rate of $0.51 per pound is shown on a pro forma basis as if the non-market adjustment was made in the fourth quarter of 2019. In January 2023, IHS reflected a 41 cents per pound non-market adjustment based on their estimate of the growth of discounts in the prior periods. The 4th quarter 2022 average rate of $0.60 per pound is shown on a pro forma basis as if the non-market adjustment was made in the fourth quarter of 2022. | ||
The price of resin is driven by several factors, including supply and demand and the price of oil, ethylene and natural gas. Selling prices to customers are set considering numerous factors, including the expected volatility of resin prices. PE Films has index-based pass-through raw material cost arrangements with customers. However, under certain agreements, changes in foreignresin prices are not passed through for a period of 90 days. In response to unprecedented cost increases and supply issues for polyethylene and polypropylene resin, Tredegar Surface Protection implemented a quarterly resin cost pass-through mechanism, effective July 1, 2021, for all products and customers not previously covered by such arrangements. Pricing on the remainder of the business is based upon raw material costs and supply/demand dynamics within the markets through its foreign operations and through exports from U.S. plants. The percentage of sales for manufacturing operations related to foreign markets forthat the first nine months of 2017 and 2016 are as follows:Company competes.
31
| Percentage of Net Sales from Ongoing Operations Related to Foreign Markets* | |||||||||||
| Nine Months Ended September 30, | |||||||||||
| 2017 | 2016 | ||||||||||
Exports From U.S. | Foreign Operations | Exports From U.S. | Foreign Operations | ||||||||
| Canada | 5 | % | — | % | 6 | % | — | % | |||
| Europe | 1 | 9 | 1 | 10 | |||||||
| Latin America | 2 | 9 | — | 11 | |||||||
| Asia | 9 | 2 | 9 | 3 | |||||||
| Total | 17 | % | 20 | % | 16 | % | 24 | % | |||
| * The percentages for foreign markets are relative to Tredegar’s total net sales from ongoing operations | |||||||||||
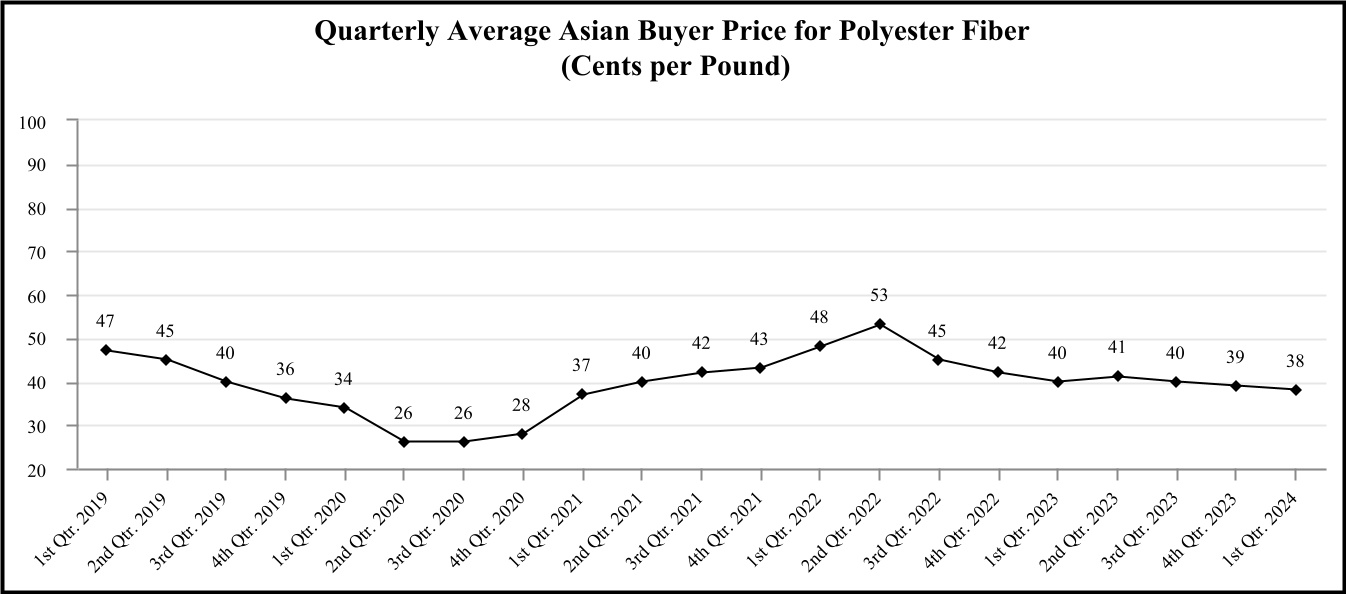
| Source: Quarterly averages computed by Tredegar using monthly data from CMAI Global Index data. | ||
The volatility of average quarterly prices of PTA and MEG in Asia (raw materials used in the production of polyester resins produced by Flexible Packaging Films) is shown in the chart below:
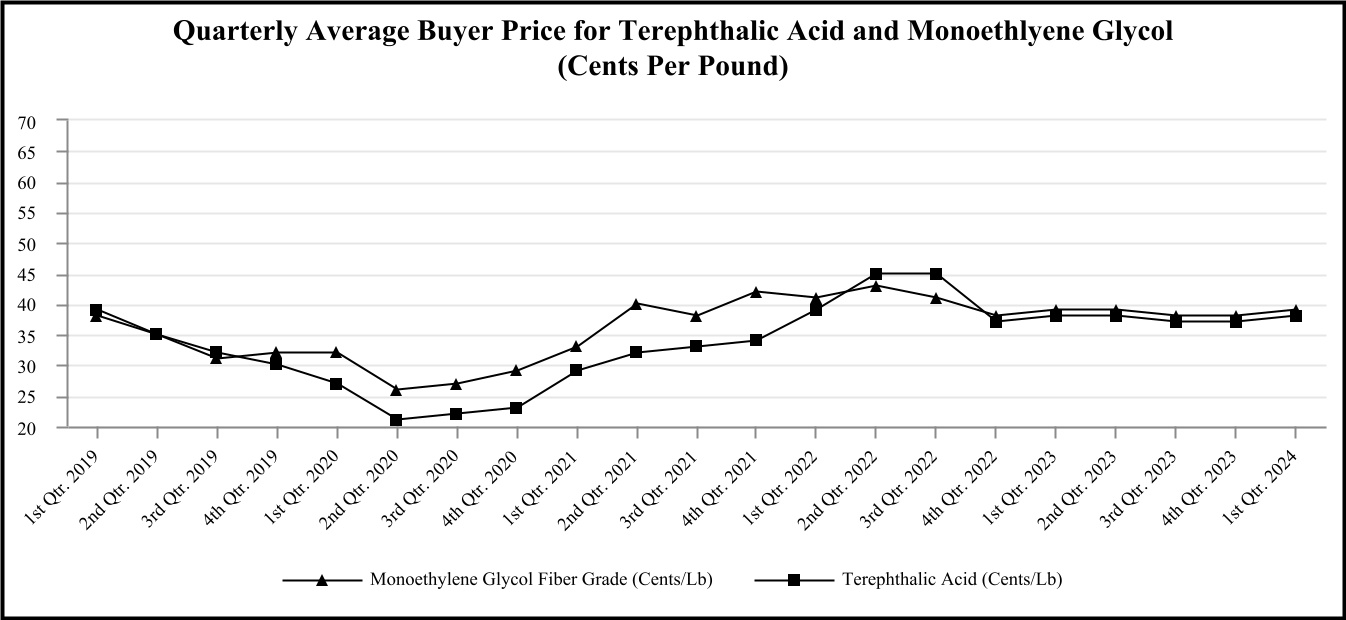
| Source: Quarterly averages computed by Tredegar using monthly data from CMAI Global Index data. | ||
Tredegar attempts to match the pricing and cost of its products in the same currency and generally viewviews the volatility of foreign currencies and emerging markets, and the corresponding impact on earnings and cash flow as part of the overall risk of operating in a global environment (for additional information, see trends for the Euro, Brazilian Real and Chinese Yuan in the charts on the following page). Exports from the U.S. are generally denominated in U.S. Dollars. The Company’s foreign currency exposure on income from continuing foreign operations relates to the Euro, the Chinese Yuan the Hungarian Forint,and the Brazilian Real and the Indian Rupee.Real.
PE Films is generally able to match the currency of its sales and costs for its product lines. For flexible packaging films produced in Brazil, selling prices and key raw material costs are principally determined in U.S. Dollars and are impacted by local economic conditions. Competitionconditions and local and global competitive dynamics. Flexible Packaging Films is exposed to foreign
32
exchange translation risk (its functional currency is the Brazilian Real) because almost 90% of the sales of Flexible Packaging Films business unit in Brazil Terphane’s primary market, has been exacerbated by global overcapacity(“Terphane Ltda.”) and substantially all of its related raw material costs are quoted or priced in the polyester industry generally, and by particularly acute overcapacity in Latin America. Additional PET capacity from a competitor in Latin America came on line in September 2017. These factors have resulted in significant competitive pricing pressures and U.S. Dollar equivalent margin compression. Moreover,Dollars while its variable conversion, fixed conversion and sales, general and administrative costs for operations in Brazil are expected to be adversely impacted by inflation in Brazil that is higher than in the U.S. Flexible Packaging Films is exposed to additional foreign exchange translation risk because almost 90% of Flexible Packaging Films’ Brazilian sales are quoted or priced in U.S. Dollars while a large majority of its Brazilian costsbefore depreciation & amortization (collectively “Terphane Ltda. Operating Costs”) are quoted or priced in Brazilian Real. This mismatch, together with a variety of economic variables impacting currency exchange rates, causes volatility that could negatively or positively impact operating profitEBITDA from ongoing operations for Flexible Packaging Films.
The Company's earnings are exposed to foreign currency exchange risk primarily through the translation of the financial statements of subsidiaries that have a functional currency other than the U.S. Dollar. The Company estimates thatannual net costs of R$139.0 million for the net mismatch translation exposure between Terphane’sTerphane Ltda.’s U.S. Dollar quoted or priced sales and raw material costs and underlying Brazilian Real quoted or priced operating costs (excluding depreciation and amortization) is annual net costs of R$95 million (approximately $30 million annually in equivalent U.S. Dollars or $2.5 million per month). On September 29, 2017, the Flexible Packaging Films business unit in Brazil (“Terphane Ltda.”) entered into 15 monthly Operating Costs. Terphane Ltda. has outstanding foreign exchange average forward rate contracts to purchase Brazilian Real (“R$”) and sell U.S. Dollars covering the period from October 2017 through December 2018. These agreementsto hedge half of the Company’s exposure at monthly average forward rates rangingits exposure. See Note 7 for more information on an approximately linear increasing basis from R$3.164 for each U.S. Dollar in October 2017 to R$3.3148 in December 2018. For example, if in December 2018 the actual average rate was R$3.000 for each U.S. Dollar, then Terphane Ltda. would have a settlement gain on its forward contract of R$393,500, which would help offset the estimated translation loss on the net mismatch exposure of R$787,000 for December 2018. The opposite would occur if the actual average rate were greater than the forward rate. These foreign currency exchangeoutstanding hedging contracts have been designated and qualify as cash flow hedges of Terphane Ltda.'s forecasted sales to customers quoted or priced in U.S. Dollars over that period. By changing the currency risk associated with these U.S. Dollar sales, the derivatives have the effect of offsetting operating costs quoted or priced in Brazilian Real and decreasing the net exposure to Brazilian Real in the consolidated statements of income. The aggregate notional amount of open foreign exchange contracts at September 30, 2017 was $18.75 million (R$60.7 million). The forward rates contracted and the related market rates as of September 30, 2017 were the same, and accordingly the fair value of all 15 open forward contracts were zero at that date.this hedging program.
Tredegar estimates that the change in the value of foreign currencies relative to the U.S. Dollar onfor PE Films had a favorableno impact on operating profitEBITDA from ongoing operations in PE Films of $0.7 million infor the thirdfirst quarter of 2017
2024 compared with the third quartersame period of 2016 and $0.3 million in the first nine months of 2017 compared to the first nine months of 2016.

Trends for the Brazilian Real and Chinese Yuan exchange rates relative to the U.S. Dollar are shown in the chart below.
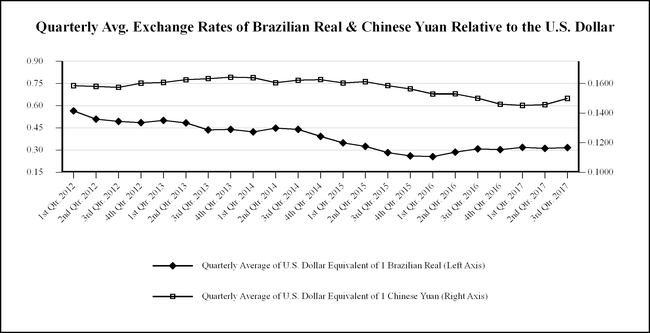
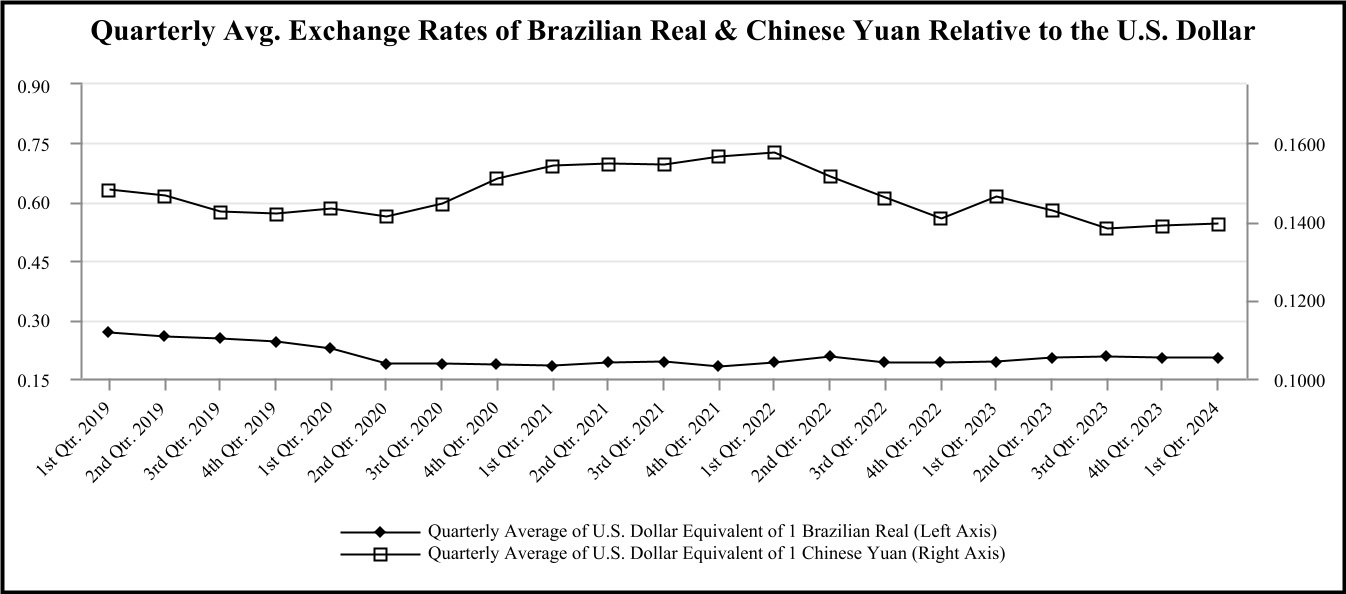
Source: Quarterly averages computed by Tredegar using daily closing data provided by Bloomberg. | ||
Evaluation of Disclosure Controls and Procedures
In connection with the preparation of this Form 10-Q, pursuant to Rule 13a-15(b) under the Securities Exchange Act of 1934, as amended we(the “Exchange Act”), the Company carried out an evaluation with the participation of ourits management, including our principalits Chief Executive Officer (principal executive officerofficer) and principalChief Financial Officer (principal financial officer,officer), of the effectiveness of ourthe design and operation of the Company’s disclosure controls and procedures (as defined under Rule 13a-15(e) and 15d-15(e) under the Securities Exchange Act of 1934)Act) as of the endMarch 31, 2024.
Based on this evaluation of the period covered by this report. Based upon that evaluation, the principal executive officer and principal financial officer concluded that the Company’sour disclosure controls and procedures are effective to ensureas of March 31, 2024, the Company's Chief Executive Officer and Chief Financial Officer concluded that, information required to be disclosed by usas of such date, our disclosure controls and procedures were effective.
Changes in the reports that we file or submit under the Securities Exchange Act of 1934, is recorded, processed, summarized and reported, within the time periods specified in the SEC’s rules and forms, and that such information is accumulated and communicated to our management, including the principal executive officer and principal financial officer, as appropriate, to allow timely decisions regarding required disclosure.Internal Control Over Financial Reporting
There has been no change in the Company’s internal control over financial reporting during the quarter ended September 30, 2017,March 31, 2024, that has materially affected, or is reasonably likely to materially affect, its internal control over financial reporting.reporting (as defined in Rules 13a-15(f) and 15d-15(f) under the Exchange Act).
PART II - OTHER INFORMATION
| Item 1A. Risk Factors. |
As disclosed in “Item 1A. Risk Factors” in our 2016the 2023 Form 10-K, there are a number of risks and uncertainties that can have a material effect on the operating results of our businesses and our financial condition. There are no additional material updates or changes to our other risk factors sincepreviously disclosed in the filing2023 Form 10-K.
33
Item 2. Unregistered Sales of our 2016 Form 10-K, except for the following:Equity Securities and Use of Proceeds.
The imposition of tariffs or duties on imported aluminum products could significantly increase the price of Aluminum Extrusions’ main raw material, which could adversely impact demand for its products. On April 27, 2017, President Trump directed the U.S. Department of Commerce to begin an investigation under Section 232 of the Trade Expansion Act regarding the effects on U.S. economic and national security of aluminum imports into the U.S. It is unknown at this time ifthe President will take any action as a result of the Section 232 investigation, and, if action is taken, what the impact of that action would be on Bonnell. However, the President could impose tariffs on aluminum imports to the U.S. Bonnell AluminumCompany’s Credit Agreement contains financial and other major U.S. aluminum industries are net importers of aluminum raw materials. If high tariffs are imposed on imported aluminum billet purchased by Bonnell, then the aggregate cost of aluminum extrusions produced by Bonnell could rise significantly. Bonnell would expect to be able to pass through the higher aluminum costs to its customers. However,restrictive covenants, including a higher cost for aluminum extrusions could result in product substitutions in place of aluminum extrusions, which could materially and negatively affect Bonnell and other U.S. aluminum extrusion businesses and their results of operations.
Item 5. Other factors that could adversely affectInformation.
Director and Officer Trading Arrangements
During the business include, by waythree months ended March 31, 2024, no director or officer of example, (i) failure by a key customer to achieve success or maintain share in markets in which they sell products containing PE Films’ materials, (ii) key customers rolling out products utilizing technologies developed by others that replace PE Films’ business with such customer, (iii) delays in a key customer rolling out products utilizing new technologies developed by PE Films and (iv) operational decisions by a key customer that result in component substitution, inventory reductions and similar changes. While PE Films is undertaking efforts to expand its customer base, there can be no assurance that such efforts will be successful, or that they will offset any delay or loss of sales and profits associated with these large customers.
| 10.1 | ||||||||
| 31.1 | ||||||||
| 31.2 | ||||||||
| 32.1 | ||||||||
| 32.2 | ||||||||
| 101 | ||||||||
| XBRL Instance Document and Related Items. | ||||||||
| 104 | Cover Page Interactive Data File (formatted in iXBRL and contained in Exhibit 101). | |||||||
| * | Denotes compensatory plans or arrangements or management contracts. | |||||||
34
SIGNATURES
Pursuant to the requirements of the Securities Exchange Act of 1934, the Registrant has duly caused this report to be signed on its behalf by the undersigned thereunto duly authorized.
| Tredegar Corporation | ||||||||||||||||
| (Registrant) | ||||||||||||||||
| Date: | May 9, 2024 | |||||||||||||||
| /s/ John | ||||||||||||||||
| John | ||||||||||||||||
| President and Chief Executive Officer | ||||||||||||||||
| (Principal Executive Officer) | ||||||||||||||||
| Date: | May 9, 2024 | /s/ D. Andrew Edwards | ||||||||||||||
| D. Andrew Edwards | ||||||||||||||||
| Executive Vice President and Chief Financial Officer | ||||||||||||||||
| (Principal Financial Officer) | ||||||||||||||||
| Date: | May 9, 2024 | /s/ Frasier W. Brickhouse, II | ||||||||||||||
| Frasier W. Brickhouse, II | ||||||||||||||||
| Corporate Treasurer and Controller | ||||||||||||||||
| (Principal Accounting Officer) | ||||||||||||||||