UNITED STATES
SECURITIES AND EXCHANGE COMMISSION
Washington, D.C. 20549
FORM 10-Q
(Mark One) | | | | | |
| x | QUARTERLY REPORT PURSUANT TO SECTION 13 OR 15(d) OF THE SECURITIES EXCHANGE ACT OF 1934 |
For the quarterly period ended SeptemberJune 30, 20222023
OR | | | | | |
| ¨ | TRANSITION REPORT PURSUANT TO SECTION 13 OR 15(d) OF THE SECURITIES EXCHANGE ACT OF 1934 |
For the transition period from to
Commission file number 1-10258
Tredegar Corporation
(Exact Name of Registrant as Specified in Its Charter)
| | | | | | | | |
| Virginia | | 54-1497771 |
(State or Other Jurisdiction of
Incorporation or Organization) | | (I.R.S. Employer
Identification No.) |
| | | | | | | | | | | |
| 1100 Boulders Parkway | | |
| Richmond, | Virginia | | 23225 |
| (Address of Principal Executive Offices) | | (Zip Code) |
Registrant’s Telephone Number, Including Area Code: (804) 330-1000
Securities registered pursuant to Section 12(b) of the Act: | | | | | | | | |
| Title of each class | Trading Symbol(s) | Name of each exchange on which registered |
| Common stock, no par value | TG | New York Stock Exchange |
Indicate by check mark whether the registrant (1) has filed all reports required to be filed by Section 13 or 15(d) of the Securities Exchange Act of 1934 during the preceding 12 months (or for such shorter period that the registrant was required to file such reports), and (2) has been subject to such filing requirements for the past 90 days. Yes x No ¨
Indicate by check mark whether the registrant has submitted electronically every Interactive Data File required to be submitted pursuant to Rule 405 of Regulation S-T (232.405 of this chapter) during the preceding 12 months (or for such shorter period that the registrant was required to submit such files). Yes x No ¨
Indicate by check mark whether the registrant is a large accelerated filer, an accelerated filer, a non-accelerated filer, a smaller reporting company, or an emerging growth company. See the definitions of “large accelerated filer,” “accelerated filer,” “smaller reporting company,” and “emerging growth company” in Rule 12b-2 of the Exchange Act. | | | | | | | | | | | | | | | | | | | | | | | |
| Large accelerated filer | | ¨ | Accelerated filer | x | Smaller reporting company | | ☐ |
| | | | | |
| Non-accelerated filer | | ¨ | | Emerging growth company | | ☐ |
If an emerging growth company, indicate by check mark if the registrant has elected not to use the extended transition period for complying with any new or revised financial accounting standards provided pursuant to Section 13(a) of the Exchange Act. ¨
Indicate by check mark whether the registrant is a shell company (as defined in Rule 12b-2 of the Exchange Act). Yes ☐ No x
The number of shares of Common Stock, no par value, outstanding as of NovemberAugust 4, 2022: 34,000,6422023: 34,384,677
Tredegar Corporation
Table of Contents
PART I - FINANCIAL INFORMATION
Item 1. Financial Statements.
Tredegar Corporation
Condensed Consolidated Balance Sheets
(In Thousands, Except Share Data)
(Unaudited) | | | September 30, | | December 31, | | June 30, | | December 31, |
| | 2022 | | 2021 | | 2023 | | 2022 |
| Assets | Assets | | Assets | |
| Current assets: | Current assets: | | Current assets: | |
| Cash and cash equivalents | Cash and cash equivalents | $ | 19,250 | | | $ | 30,521 | | Cash and cash equivalents | $ | 21,193 | | | $ | 19,232 | |
| Accounts and other receivables, net | Accounts and other receivables, net | 110,077 | | | 103,312 | | Accounts and other receivables, net | 79,139 | | | 84,544 | |
| Income taxes recoverable | Income taxes recoverable | 1,834 | | | 2,558 | | Income taxes recoverable | 1,216 | | | 733 | |
| Inventories | Inventories | 114,103 | | | 88,569 | | Inventories | 86,692 | | | 127,771 | |
| Prepaid expenses and other | Prepaid expenses and other | 9,601 | | | 11,275 | | Prepaid expenses and other | 10,214 | | | 10,304 | |
| Current assets of discontinued operations | 151 | | | 178 | | |
| Total current assets | Total current assets | 255,016 | | | 236,413 | | Total current assets | 198,454 | | | 242,584 | |
| Property, plant and equipment, at cost | Property, plant and equipment, at cost | 520,371 | | | 498,311 | | Property, plant and equipment, at cost | 545,048 | | | 531,921 | |
| Less: accumulated depreciation | Less: accumulated depreciation | (340,868) | | | (327,930) | | Less: accumulated depreciation | (355,156) | | | (345,510) | |
| Net property, plant and equipment | Net property, plant and equipment | 179,503 | | | 170,381 | | Net property, plant and equipment | 189,892 | | | 186,411 | |
| Right-of-use leased assets | Right-of-use leased assets | 14,356 | | | 13,847 | | Right-of-use leased assets | 12,794 | | | 14,021 | |
| Identifiable intangible assets, net | Identifiable intangible assets, net | 12,200 | | | 14,152 | | Identifiable intangible assets, net | 10,785 | | | 11,690 | |
| Goodwill | Goodwill | 70,608 | | | 70,608 | | Goodwill | 55,195 | | | 70,608 | |
| Deferred income taxes | Deferred income taxes | 11,820 | | | 15,723 | | Deferred income taxes | 14,610 | | | 13,900 | |
| Other assets | Other assets | 3,155 | | | 2,460 | | Other assets | 3,139 | | | 2,879 | |
| Total assets | Total assets | $ | 546,658 | | | $ | 523,584 | | Total assets | $ | 484,869 | | | $ | 542,093 | |
| Liabilities and Shareholders’ Equity | Liabilities and Shareholders’ Equity | | Liabilities and Shareholders’ Equity | |
| Current liabilities: | Current liabilities: | | Current liabilities: | |
| Accounts payable | Accounts payable | $ | 126,848 | | | $ | 123,760 | | Accounts payable | $ | 82,290 | | | $ | 114,938 | |
| Accrued expenses | Accrued expenses | 36,894 | | | 33,104 | | Accrued expenses | 23,501 | | | 31,603 | |
| Lease liability, short-term | Lease liability, short-term | 2,003 | | | 2,158 | | Lease liability, short-term | 2,163 | | | 2,035 | |
| Income taxes payable | Income taxes payable | 1,391 | | | 9,333 | | Income taxes payable | 579 | | | 1,137 | |
| Current liabilities of discontinued operations | 71 | | | 193 | | |
| Total current liabilities | Total current liabilities | 167,207 | | | 168,548 | | Total current liabilities | 108,533 | | | 149,713 | |
| Lease liability, long-term | Lease liability, long-term | 13,160 | | | 12,831 | | Lease liability, long-term | 11,991 | | | 12,738 | |
| Long-term debt | Long-term debt | 124,000 | | | 73,000 | | Long-term debt | 141,000 | | | 137,000 | |
| Pension and other postretirement benefit obligations, net | Pension and other postretirement benefit obligations, net | 28,464 | | | 78,265 | | Pension and other postretirement benefit obligations, net | 35,747 | | | 35,046 | |
| | Other non-current liabilities | Other non-current liabilities | 6,769 | | | 6,218 | | Other non-current liabilities | 4,449 | | | 5,834 | |
| Total liabilities | Total liabilities | 339,600 | | | 338,862 | | Total liabilities | 301,720 | | | 340,331 | |
| Shareholders’ equity: | Shareholders’ equity: | | Shareholders’ equity: | |
| Common stock, no par value (issued and outstanding 33,982,479 shares at September 30, 2022 and 33,736,629 shares at December 31, 2021) | 57,902 | | | 55,174 | | |
| Common stock held in trust for savings restoration plan (111,861 shares at September 30, 2022 and 108,433 shares at December 31, 2021) | (2,174) | | | (2,135) | | |
| Common stock, no par value (authorized shares 150,000,000, issued and outstanding 34,363,845 shares at June 30, 2023 and 34,000,642 shares at December 31, 2022) | | Common stock, no par value (authorized shares 150,000,000, issued and outstanding 34,363,845 shares at June 30, 2023 and 34,000,642 shares at December 31, 2022) | 60,078 | | | 58,824 | |
| Common stock held in trust for savings restoration plan (116,336 shares at June 30, 2023 and 113,316 shares at December 31, 2022) | | Common stock held in trust for savings restoration plan (116,336 shares at June 30, 2023 and 113,316 shares at December 31, 2022) | (2,218) | | | (2,188) | |
| Accumulated other comprehensive income (loss): | Accumulated other comprehensive income (loss): | | Accumulated other comprehensive income (loss): | |
| Foreign currency translation adjustment | Foreign currency translation adjustment | (87,826) | | | (85,792) | | Foreign currency translation adjustment | (83,338) | | | (86,079) | |
| Gain (loss) on derivative financial instruments | Gain (loss) on derivative financial instruments | (4,877) | | | 901 | | Gain (loss) on derivative financial instruments | (843) | | | (2,480) | |
| Pension and other postretirement benefit adjustments | Pension and other postretirement benefit adjustments | (56,963) | | | (64,613) | | Pension and other postretirement benefit adjustments | (54,463) | | | (59,036) | |
| Retained earnings | Retained earnings | 300,996 | | | 281,187 | | Retained earnings | 263,933 | | | 292,721 | |
| Total shareholders’ equity | Total shareholders’ equity | 207,058 | | | 184,722 | | Total shareholders’ equity | 183,149 | | | 201,762 | |
| Total liabilities and shareholders’ equity | Total liabilities and shareholders’ equity | $ | 546,658 | | | $ | 523,584 | | Total liabilities and shareholders’ equity | $ | 484,869 | | | $ | 542,093 | |
See accompanying notes to the condensed consolidated financial statements.
Tredegar Corporation
Condensed Consolidated Statements of Income (Loss)
(In Thousands, Except Per Share Data)
(Unaudited)
| | | Three Months Ended September 30, | | Nine Months Ended September 30, | | Three Months Ended June 30, | | Six Months Ended June 30, |
| | | 2022 | | 2021 | | 2022 | | 2021 | | 2023 | | 2022 | | 2023 | | 2022 |
| Revenues and other items: | Revenues and other items: | | Revenues and other items: | |
| Sales | Sales | $ | 238,486 | | | $ | 209,517 | | | $ | 749,415 | | | $ | 605,468 | | Sales | $ | 178,167 | | | $ | 274,363 | | | $ | 369,289 | | | $ | 510,929 | |
| Other income (expense), net | Other income (expense), net | 119 | | | 391 | | | 1,113 | | | 9,272 | | Other income (expense), net | (20) | | | 1,342 | | | 260 | | | 1,041 | |
| | 238,605 | | | 209,908 | | | 750,528 | | | 614,740 | | | 178,147 | | | 275,705 | | | 369,549 | | | 511,970 | |
| Costs and expenses: | Costs and expenses: | | Costs and expenses: | |
| Cost of goods sold | Cost of goods sold | 200,582 | | | 170,756 | | | 601,930 | | | 470,733 | | Cost of goods sold | 153,267 | | | 218,088 | | | 312,792 | | | 401,348 | |
| Freight | Freight | 9,500 | | | 7,264 | | | 28,619 | | | 20,531 | | Freight | 7,199 | | | 11,036 | | | 13,243 | | | 19,118 | |
| Selling, general and administrative | Selling, general and administrative | 19,018 | | | 16,767 | | | 59,160 | | | 55,422 | | Selling, general and administrative | 16,889 | | | 18,862 | | | 35,894 | | | 40,143 | |
| Research and development | Research and development | 1,576 | | | 1,613 | | | 4,855 | | | 4,770 | | Research and development | 1,376 | | | 1,754 | | | 2,581 | | | 3,278 | |
| Amortization of identifiable intangibles | Amortization of identifiable intangibles | 653 | | | 724 | | | 1,982 | | | 2,170 | | Amortization of identifiable intangibles | 464 | | | 666 | | | 968 | | | 1,329 | |
| Pension and postretirement benefits | Pension and postretirement benefits | 3,506 | | | 3,540 | | | 10,489 | | | 10,622 | | Pension and postretirement benefits | 3,418 | | | 3,506 | | | 6,837 | | | 6,982 | |
| Interest expense | Interest expense | 1,138 | | | 842 | | | 3,158 | | | 2,555 | | Interest expense | 2,374 | | | 1,234 | | | 4,686 | | | 2,020 | |
| Asset impairments and costs associated with exit and disposal activities, net of adjustments | Asset impairments and costs associated with exit and disposal activities, net of adjustments | 495 | | | 265 | | | 621 | | | 633 | | Asset impairments and costs associated with exit and disposal activities, net of adjustments | — | | | 134 | | | 69 | | | 126 | |
| Goodwill impairment | | Goodwill impairment | 15,413 | | | — | | | 15,413 | | | — | |
| Total | Total | 236,468 | | | 201,771 | | | 710,814 | | | 567,436 | | Total | 200,400 | | | 255,280 | | | 392,483 | | | 474,344 | |
| Income (loss) from continuing operations before income taxes | 2,137 | | | 8,137 | | | 39,714 | | | 47,304 | | |
| Income (loss) before income taxes | | Income (loss) before income taxes | (22,253) | | | 20,425 | | | (22,934) | | | 37,626 | |
| Income tax expense (benefit) | Income tax expense (benefit) | 1,125 | | | 1,908 | | | 7,460 | | | 10,728 | | Income tax expense (benefit) | (3,331) | | | 5,556 | | | (3,000) | | | 6,334 | |
| Net income (loss) from continuing operations | 1,012 | | | 6,229 | | | 32,254 | | | 36,576 | | |
| Income (loss) from discontinued operations, net of tax | 21 | | | (26) | | | 68 | | | (104) | | |
| Net income (loss) | Net income (loss) | $ | 1,033 | | | $ | 6,203 | | | $ | 32,322 | | | $ | 36,472 | | Net income (loss) | $ | (18,922) | | | $ | 14,869 | | | $ | (19,934) | | | $ | 31,292 | |
| | Earnings (loss) per share: | Earnings (loss) per share: | | Earnings (loss) per share: | |
| Basic: | | |
| Continuing operations | $ | 0.03 | | | $ | 0.19 | | | $ | 0.96 | | | $ | 1.09 | | |
| Discontinued operations | — | | | — | | | — | | | — | | |
| Basic earnings (loss) per share | $ | 0.03 | | | $ | 0.19 | | | $ | 0.96 | | | $ | 1.09 | | |
| Diluted: | | |
| Continuing operations | $ | 0.03 | | | $ | 0.19 | | | $ | 0.96 | | | $ | 1.09 | | |
| Discontinued operations | — | | | — | | | — | | | — | | |
| Diluted earnings (loss) per share | $ | 0.03 | | | $ | 0.19 | | | $ | 0.96 | | | $ | 1.09 | | |
| Basic | | Basic | $ | (0.56) | | | $ | 0.44 | | | $ | (0.59) | | | $ | 0.93 | |
| Diluted | | Diluted | $ | (0.56) | | | $ | 0.44 | | | $ | (0.59) | | | $ | 0.93 | |
| | Shares used to compute earnings (loss) per share: | Shares used to compute earnings (loss) per share: | | Shares used to compute earnings (loss) per share: | |
| Basic | Basic | 33,870 | | | 33,620 | | | 33,780 | | | 33,541 | | Basic | 34,079 | | | 33,814 | | | 33,988 | | | 33,734 | |
| Diluted | Diluted | 33,871 | | | 33,649 | | | 33,808 | | | 33,678 | | Diluted | 34,079 | | | 33,854 | | | 33,988 | | | 33,776 | |
See accompanying notes to the condensed consolidated financial statements.
Tredegar Corporation
Condensed Consolidated Statements of Comprehensive Income (Loss)
(In Thousands)
(Unaudited)
| | | Three Months Ended September 30, | | Three Months Ended June 30, |
| | | 2022 | | 2021 | | 2023 | | 2022 |
| Net income (loss) | Net income (loss) | $ | 1,033 | | | $ | 6,203 | | Net income (loss) | $ | (18,922) | | | $ | 14,869 | |
| Other comprehensive income (loss): | Other comprehensive income (loss): | | Other comprehensive income (loss): | |
| Unrealized foreign currency translation adjustment (net of tax benefit of $148 in 2022 and net of tax benefit of $294 in 2021) | (2,340) | | | (2,788) | | |
| Derivative financial instruments adjustment (net of tax benefit of $818 in 2022 and net of tax benefit of $174 in 2021) | (2,547) | | | (717) | | |
| Amortization of prior service costs and net gains or losses (net of tax expense of $712 in 2022 and net of tax expense of $927 in 2021) | 2,556 | | | 3,317 | | |
| Unrealized foreign currency translation adjustment (net of tax expense of $179 in 2023 and net of tax benefit of $482 in 2022) | | Unrealized foreign currency translation adjustment (net of tax expense of $179 in 2023 and net of tax benefit of $482 in 2022) | 1,621 | | | (5,230) | |
| Derivative financial instruments adjustment (net of tax expense of $500 in 2023 and net of tax benefit of $3,359 in 2022) | | Derivative financial instruments adjustment (net of tax expense of $500 in 2023 and net of tax benefit of $3,359 in 2022) | 368 | | | (9,161) | |
| Amortization of prior service costs and net gains or losses (net of tax expense of $637 in 2023 and net of tax expense of $712 in 2022) | | Amortization of prior service costs and net gains or losses (net of tax expense of $637 in 2023 and net of tax expense of $712 in 2022) | 2,286 | | | 2,556 | |
| Other comprehensive income (loss) | Other comprehensive income (loss) | (2,331) | | | (188) | | Other comprehensive income (loss) | 4,275 | | | (11,835) | |
| Comprehensive income (loss) | Comprehensive income (loss) | $ | (1,298) | | | $ | 6,015 | | Comprehensive income (loss) | $ | (14,647) | | | $ | 3,034 | |
| | | Nine Months Ended September 30, | | Six Months Ended June 30, |
| | | 2022 | | 2021 | | 2023 | | 2022 |
| Net income (loss) | Net income (loss) | $ | 32,322 | | | $ | 36,472 | | Net income (loss) | $ | (19,934) | | | $ | 31,292 | |
| Other comprehensive income (loss): | Other comprehensive income (loss): | | Other comprehensive income (loss): | |
| Unrealized foreign currency translation adjustment (net of tax expense of $98 in 2022 and net of tax benefit of $103 in 2021) | (2,034) | | | (1,443) | | |
| Derivative financial instruments adjustment (net of tax benefit of $1,261 in 2022 and net of tax expense of $185 in 2021) | (5,778) | | | 515 | | |
| Amortization of prior service costs and net gains or losses (net of tax expense of $2,136 in 2022 and net of tax expense of $2,773 in 2021) | 7,650 | | | 9,954 | | |
| Unrealized foreign currency translation adjustment (net of tax expense of $615 in 2023 and net of tax expense of $246 in 2022) | | Unrealized foreign currency translation adjustment (net of tax expense of $615 in 2023 and net of tax expense of $246 in 2022) | 2,741 | | | 306 | |
| Derivative financial instruments adjustment (net of tax expense of $1,336 in 2023 and net of tax benefit of $443 in 2022) | | Derivative financial instruments adjustment (net of tax expense of $1,336 in 2023 and net of tax benefit of $443 in 2022) | 1,637 | | | (3,231) | |
| Amortization of prior service costs and net gains or losses (net of tax expense of $1,274 in 2023 and net of tax expense of $1,424 in 2022) | | Amortization of prior service costs and net gains or losses (net of tax expense of $1,274 in 2023 and net of tax expense of $1,424 in 2022) | 4,573 | | | 5,094 | |
| Other comprehensive income (loss) | Other comprehensive income (loss) | (162) | | | 9,026 | | Other comprehensive income (loss) | 8,951 | | | 2,169 | |
| Comprehensive income (loss) | Comprehensive income (loss) | $ | 32,160 | | | $ | 45,498 | | Comprehensive income (loss) | $ | (10,983) | | | $ | 33,461 | |
See accompanying notes to the condensed consolidated financial statements.
Tredegar Corporation
Condensed Consolidated Statements of Cash Flows
(In Thousands)
(Unaudited) | | | Nine Months Ended September 30, | | Six Months Ended June 30, |
| | 2022 | | 2021 | | 2023 | | 2022 |
| Cash flows from operating activities: | Cash flows from operating activities: | | Cash flows from operating activities: | |
| Net income (loss) | Net income (loss) | $ | 32,322 | | | $ | 36,472 | | Net income (loss) | $ | (19,934) | | | $ | 31,292 | |
| Adjustments for noncash items: | Adjustments for noncash items: | | Adjustments for noncash items: | |
| Depreciation | Depreciation | 17,538 | | | 16,169 | | Depreciation | 12,387 | | | 11,536 | |
| Amortization of identifiable intangibles | Amortization of identifiable intangibles | 1,982 | | | 2,170 | | Amortization of identifiable intangibles | 968 | | | 1,329 | |
| Reduction of right-of-use lease asset | Reduction of right-of-use lease asset | 1,590 | | | 1,582 | | Reduction of right-of-use lease asset | 1,075 | | | 1,072 | |
| Goodwill impairment | | Goodwill impairment | 15,413 | | | — | |
| Deferred income taxes | Deferred income taxes | 3,078 | | | 4,120 | | Deferred income taxes | (3,731) | | | 2,516 | |
| Accrued pension and post-retirement benefits | Accrued pension and post-retirement benefits | 10,519 | | | 10,622 | | Accrued pension and post-retirement benefits | 6,837 | | | 7,013 | |
| Stock-based compensation expense | Stock-based compensation expense | 2,575 | | | 3,227 | | Stock-based compensation expense | 521 | | | 1,842 | |
| Gain on investment in kaléo | Gain on investment in kaléo | (1,406) | | | (879) | | Gain on investment in kaléo | (262) | | | (1,406) | |
| Changes in assets and liabilities: | Changes in assets and liabilities: | | Changes in assets and liabilities: | |
| Accounts and other receivables | Accounts and other receivables | (7,222) | | | (11,379) | | Accounts and other receivables | 6,190 | | | (24,172) | |
| Inventories | Inventories | (24,855) | | | (19,902) | | Inventories | 43,013 | | | (31,495) | |
| Income taxes recoverable/payable | Income taxes recoverable/payable | (7,227) | | | 111 | | Income taxes recoverable/payable | (1,060) | | | (6,129) | |
| Prepaid expenses and other | Prepaid expenses and other | (5,365) | | | 3,422 | | Prepaid expenses and other | 2,976 | | | (516) | |
| Accounts payable and accrued expenses | Accounts payable and accrued expenses | 3,624 | | | 12,078 | | Accounts payable and accrued expenses | (39,629) | | | 47,388 | |
| Lease liability | Lease liability | (1,737) | | | (1,566) | | Lease liability | (1,095) | | | (1,166) | |
| Pension and postretirement benefit plan contributions | Pension and postretirement benefit plan contributions | (50,503) | | | (5,510) | | Pension and postretirement benefit plan contributions | (279) | | | (50,314) | |
| Other, net | Other, net | 1,935 | | | 750 | | Other, net | (692) | | | 1,781 | |
| Net cash (used in) provided by operating activities | (23,152) | | | 51,487 | | |
| Net cash provided by (used in) operating activities | | Net cash provided by (used in) operating activities | 22,698 | | | (9,429) | |
| Cash flows from investing activities: | Cash flows from investing activities: | | Cash flows from investing activities: | |
| Capital expenditures | Capital expenditures | (25,527) | | | (19,576) | | Capital expenditures | (15,907) | | | (13,514) | |
| Proceeds from the sale of kaléo | Proceeds from the sale of kaléo | 1,406 | | | — | | Proceeds from the sale of kaléo | 262 | | | 1,406 | |
| Proceeds from the sale of assets | — | | | 4,749 | | |
| Net cash used in investing activities | (24,121) | | | (14,827) | | |
| | Net cash provided by (used in) investing activities | | Net cash provided by (used in) investing activities | (15,645) | | | (12,108) | |
| Cash flows from financing activities: | Cash flows from financing activities: | | Cash flows from financing activities: | |
| Borrowings | Borrowings | 279,250 | | | 69,250 | | Borrowings | 41,250 | | | 221,250 | |
| Debt principal payments | Debt principal payments | (228,250) | | | (76,250) | | Debt principal payments | (37,250) | | | (192,750) | |
| Dividends paid | Dividends paid | (12,552) | | | (12,114) | | Dividends paid | (8,884) | | | (8,135) | |
| Debt financing costs | Debt financing costs | (1,245) | | | — | | Debt financing costs | — | | | (1,245) | |
| Other | Other | (396) | | | 915 | | Other | — | | | (396) | |
| Net cash provided by (used in) financing activities | Net cash provided by (used in) financing activities | 36,807 | | | (18,199) | | Net cash provided by (used in) financing activities | (4,884) | | | 18,724 | |
| Effect of exchange rate changes on cash | Effect of exchange rate changes on cash | (805) | | | (54) | | Effect of exchange rate changes on cash | (208) | | | (246) | |
| Increase (decrease) in cash & cash equivalents | Increase (decrease) in cash & cash equivalents | (11,271) | | | 18,407 | | Increase (decrease) in cash & cash equivalents | 1,961 | | | (3,059) | |
| Cash and cash equivalents at beginning of period | Cash and cash equivalents at beginning of period | 30,521 | | | 11,846 | | Cash and cash equivalents at beginning of period | 19,232 | | | 30,521 | |
| Cash and cash equivalents at end of period | Cash and cash equivalents at end of period | $ | 19,250 | | | $ | 30,253 | | Cash and cash equivalents at end of period | $ | 21,193 | | | $ | 27,462 | |
See accompanying notes to the condensed consolidated financial statements.
Tredegar Corporation
Condensed Consolidated Statements of Shareholders’ Equity
(In Thousands, Except Share and Per Share Data)
(Unaudited)
The following summarizes the changes in shareholders’ equity for the three month period ended SeptemberJune 30, 2022:2023:
| | | Common Stock | | Retained Earnings | | Trust for Savings Restoration Plan | | Accumulated Other Comprehensive Income (Loss) | | Total Shareholders’ Equity | | Common Stock | | Retained Earnings | | Trust for Savings Restoration Plan | | Accumulated Other Comprehensive Income (Loss) | | Total Shareholders’ Equity |
| Balance July 1, 2022 | $ | 56,911 | | | $ | 304,370 | | | $ | (2,161) | | | $ | (147,335) | | | $ | 211,785 | | |
| Balance April 1, 2023 | | Balance April 1, 2023 | $ | 59,423 | | | $ | 287,308 | | | $ | (2,203) | | | $ | (142,919) | | | $ | 201,609 | |
| Net income (loss) | Net income (loss) | — | | | 1,033 | | | — | | | — | | | 1,033 | | Net income (loss) | — | | | (18,922) | | | — | | | — | | | (18,922) | |
| Foreign currency translation adjustment | Foreign currency translation adjustment | — | | | — | | | — | | | (2,340) | | | (2,340) | | Foreign currency translation adjustment | — | | | — | | | — | | | 1,621 | | | 1,621 | |
| Derivative financial instruments adjustment | Derivative financial instruments adjustment | — | | | — | | | — | | | (2,547) | | | (2,547) | | Derivative financial instruments adjustment | — | | | — | | | — | | | 368 | | | 368 | |
| Amortization of prior service costs and net gains or losses | Amortization of prior service costs and net gains or losses | — | | | — | | | — | | | 2,556 | | | 2,556 | | Amortization of prior service costs and net gains or losses | — | | | — | | | — | | | 2,286 | | | 2,286 | |
| Cash dividends declared ($0.13 per share) | Cash dividends declared ($0.13 per share) | — | | | (4,420) | | | — | | | — | | | (4,420) | | Cash dividends declared ($0.13 per share) | — | | | (4,468) | | | — | | | — | | | (4,468) | |
| Stock-based compensation expense | Stock-based compensation expense | 991 | | | — | | | — | | | — | | | 991 | | Stock-based compensation expense | 655 | | | — | | | — | | | — | | | 655 | |
| | Tredegar common stock purchased by trust for savings restoration plan | Tredegar common stock purchased by trust for savings restoration plan | — | | | 13 | | | (13) | | | — | | | — | | Tredegar common stock purchased by trust for savings restoration plan | — | | | 15 | | | (15) | | | — | | | — | |
| Balance September 30, 2022 | $ | 57,902 | | | $ | 300,996 | | | $ | (2,174) | | | $ | (149,666) | | | $ | 207,058 | | |
| Balance June 30, 2023 | | Balance June 30, 2023 | $ | 60,078 | | | $ | 263,933 | | | $ | (2,218) | | | $ | (138,644) | | | $ | 183,149 | |
The following summarizes the changes in shareholders’ equity for the ninesix month period ended SeptemberJune 30, 2022:2023:
| | | Common Stock | | Retained Earnings | | Trust for Savings Restoration Plan | | Accumulated Other Comprehensive Income (Loss) | | Total Shareholders’ Equity | | Common Stock | | Retained Earnings | | Trust for Savings Restoration Plan | | Accumulated Other Comprehensive Income (Loss) | | Total Shareholders’ Equity |
| Balance January 1, 2022 | $ | 55,174 | | | $ | 281,187 | | | $ | (2,135) | | | $ | (149,504) | | | $ | 184,722 | | |
| Balance January 1, 2023 | | Balance January 1, 2023 | $ | 58,824 | | | $ | 292,721 | | | $ | (2,188) | | | $ | (147,595) | | | $ | 201,762 | |
| Net income (loss) | Net income (loss) | — | | | 32,322 | | | — | | | — | | | 32,322 | | Net income (loss) | — | | | (19,934) | | | — | | | — | | | (19,934) | |
| Foreign currency translation adjustment | Foreign currency translation adjustment | — | | | — | | | — | | | (2,034) | | | (2,034) | | Foreign currency translation adjustment | — | | | — | | | — | | | 2,741 | | | 2,741 | |
| Derivative financial instruments adjustment | Derivative financial instruments adjustment | — | | | — | | | — | | | (5,778) | | | (5,778) | | Derivative financial instruments adjustment | — | | | — | | | — | | | 1,637 | | | 1,637 | |
| Amortization of prior service costs and net gains or losses | Amortization of prior service costs and net gains or losses | — | | | — | | | — | | | 7,650 | | | 7,650 | | Amortization of prior service costs and net gains or losses | — | | | — | | | — | | | 4,573 | | | 4,573 | |
| Cash dividends declared ($0.37 per share) | — | | | (12,552) | | | — | | | — | | | (12,552) | | |
| Cash dividends declared ($0.26 per share) | | Cash dividends declared ($0.26 per share) | — | | | (8,884) | | | — | | | — | | | (8,884) | |
| Stock-based compensation expense | Stock-based compensation expense | 3,124 | | | — | | | — | | | — | | | 3,124 | | Stock-based compensation expense | 1,508 | | | — | | | — | | | — | | | 1,508 | |
Repurchase of employee common stock for tax
withholdings | Repurchase of employee common stock for tax
withholdings | (396) | | | — | | | — | | | — | | | (396) | | Repurchase of employee common stock for tax
withholdings | (254) | | | — | | | — | | | — | | | (254) | |
| Tredegar common stock purchased by trust for savings restoration plan | Tredegar common stock purchased by trust for savings restoration plan | — | | | 39 | | | (39) | | | — | | | — | | Tredegar common stock purchased by trust for savings restoration plan | — | | | 30 | | | (30) | | | — | | | — | |
| Balance September 30, 2022 | $ | 57,902 | | | $ | 300,996 | | | $ | (2,174) | | | $ | (149,666) | | | $ | 207,058 | | |
| Balance June 30, 2023 | | Balance June 30, 2023 | $ | 60,078 | | | $ | 263,933 | | | $ | (2,218) | | | $ | (138,644) | | | $ | 183,149 | |
The following summarizes the changes in shareholders’ equity for the three month period ended SeptemberJune 30, 2021: | | | | | | | | | | | | | | | | | | | | | | | | | | | | | |
| | Common
Stock | | Retained
Earnings | | Trust for
Savings
Restoration
Plan | | Accumulated Other
Comprehensive Income (Loss) | | Total
Shareholders’
Equity |
| Balance at July 1, 2021 | $ | 52,940 | | | $ | 261,699 | | | $ | (2,109) | | | $ | (169,190) | | | $ | 143,340 | |
| Net income (loss) | — | | | 6,203 | | | — | | | — | | | 6,203 | |
| Foreign currency translation adjustment | — | | | — | | | — | | | (2,788) | | | (2,788) | |
| Derivative financial instruments adjustment | — | | | — | | | — | | | (717) | | | (717) | |
| Amortization of prior service costs and net gains or losses | — | | | — | | | — | | | 3,317 | | | 3,317 | |
| Cash dividends declared ($0.12 per share) | — | | | (4,042) | | | — | | | — | | | (4,042) | |
| Stock-based compensation expense | 966 | | | — | | | — | | | — | | | 966 | |
| Tredegar common stock purchased by trust for savings restoration plan | — | | | 13 | | | (13) | | | — | | | — | |
| Balance at September 30, 2021 | $ | 53,906 | | | $ | 263,873 | | | $ | (2,122) | | | $ | (169,378) | | | $ | 146,279 | |
| | | | | | | | | | | | | | | | | | | | | | | | | | | | | |
| | Common
Stock | | Retained
Earnings | | Trust for
Savings
Restoration
Plan | | Accumulated Other
Comprehensive Income (Loss) | | Total
Shareholders’
Equity |
| Balance at April 1, 2022 | $ | 55,953 | | | $ | 293,563 | | | $ | (2,148) | | | $ | (135,500) | | | $ | 211,868 | |
| Net income (loss) | — | | | 14,869 | | | — | | | — | | | 14,869 | |
| Foreign currency translation adjustment | — | | | — | | | — | | | (5,230) | | | (5,230) | |
| Derivative financial instruments adjustment | — | | | — | | | — | | | (9,161) | | | (9,161) | |
| Amortization of prior service costs and net gains or losses | — | | | — | | | — | | | 2,556 | | | 2,556 | |
| Cash dividends declared ($0.12 per share) | — | | | (4,075) | | | — | | | — | | | (4,075) | |
| Stock-based compensation expense | 958 | | | — | | | — | | | — | | | 958 | |
| Tredegar common stock purchased by trust for savings restoration plan | — | | | 13 | | | (13) | | | — | | | — | |
| Balance at June 30, 2022 | $ | 56,911 | | | $ | 304,370 | | | $ | (2,161) | | | $ | (147,335) | | | $ | 211,785 | |
The following summarizes the changes in shareholders’ equity for the ninesix month period ended SeptemberJune 30, 2021:2022: | | | | Common
Stock | | Retained
Earnings | | Trust for
Savings
Restoration
Plan | | Accumulated Other
Comprehensive Income (Loss) | | Total
Shareholders’
Equity | | Common
Stock | | Retained
Earnings | | Trust for
Savings
Restoration
Plan | | Accumulated Other
Comprehensive Income (Loss) | | Total
Shareholders’
Equity |
| Balance at January 1, 2021 | $ | 50,066 | | | $ | 239,480 | | | $ | (2,087) | | | $ | (178,404) | | | $ | 109,055 | | |
| Balance at January 1, 2022 | | Balance at January 1, 2022 | $ | 55,174 | | | $ | 281,187 | | | $ | (2,135) | | | $ | (149,504) | | | $ | 184,722 | |
| Net income (loss) | Net income (loss) | — | | | 36,472 | | | — | | | — | | | 36,472 | | Net income (loss) | — | | | 31,292 | | | — | | | — | | | 31,292 | |
| Foreign currency translation adjustment | Foreign currency translation adjustment | — | | | — | | | — | | | (1,443) | | | (1,443) | | Foreign currency translation adjustment | — | | | — | | | — | | | 306 | | | 306 | |
| Derivative financial instruments adjustment | Derivative financial instruments adjustment | — | | | — | | | — | | | 515 | | | 515 | | Derivative financial instruments adjustment | — | | | — | | | — | | | (3,231) | | | (3,231) | |
| Amortization of prior service costs and net gains or losses | Amortization of prior service costs and net gains or losses | — | | | — | | | — | | | 9,954 | | | 9,954 | | Amortization of prior service costs and net gains or losses | — | | | — | | | — | | | 5,094 | | | 5,094 | |
| Cash dividends declared ($0.36 per share) | — | | | (12,114) | | | — | | | — | | | (12,114) | | |
| Cash dividends declared ($0.24 per share) | | Cash dividends declared ($0.24 per share) | — | | | (8,135) | | | — | | | — | | | (8,135) | |
| Stock-based compensation expense | Stock-based compensation expense | 2,925 | | | — | | | — | | | — | | | 2,925 | | Stock-based compensation expense | 2,133 | | | — | | | — | | | — | | | 2,133 | |
| Shares issued upon exercise of stock options | 915 | | | — | | | — | | | — | | | 915 | | |
Repurchase of employee common stock for tax
withholdings | | Repurchase of employee common stock for tax
withholdings | (396) | | | — | | | — | | | — | | | (396) | |
| Tredegar common stock purchased by trust for savings restoration plan | Tredegar common stock purchased by trust for savings restoration plan | — | | | 35 | | | (35) | | | — | | | — | | Tredegar common stock purchased by trust for savings restoration plan | — | | | 26 | | | (26) | | | — | | | — | |
| Balance at September 30, 2021 | $ | 53,906 | | | $ | 263,873 | | | $ | (2,122) | | | $ | (169,378) | | | $ | 146,279 | | |
| Balance at June 30, 2022 | | Balance at June 30, 2022 | $ | 56,911 | | | $ | 304,370 | | | $ | (2,161) | | | $ | (147,335) | | | $ | 211,785 | |
See accompanying notes to the condensed consolidated financial statements.
TREDEGAR CORPORATION
NOTES TO THE CONDENSED CONSOLIDATED FINANCIAL STATEMENTS
(Unaudited)
1. BASIS OF PRESENTATION
In the opinion of management, the accompanying condensed consolidated financial statements of Tredegar Corporation and its subsidiaries (“Tredegar,” “the Company,” “we,” “us” or “our”) contain all adjustments necessary to state fairly, in all material respects, Tredegar’s condensed consolidated financial position as of SeptemberJune 30, 2022,2023, the condensed consolidated results of operations for the three and ninesix months ended SeptemberJune 30, 20222023 and 2021,2022, the condensed consolidated cash flows for the ninesix months ended SeptemberJune 30, 20222023 and 2021,2022, and the condensed consolidated changes in shareholders’ equity for the ninesix months ended SeptemberJune 30, 20222023 and 2021,2022, in accordance with U.S. generally accepted accounting principles (“GAAP”). All such adjustments, unless otherwise detailed in the notes to the condensed consolidated financial statements, are deemed to be of a normal, recurring nature.
The Company operates on a calendar fiscal year except for the Aluminum Extrusions segment, which operates on a 52/53-week fiscal year basis. As such, the fiscal thirdsecond quarter for 20222023 and 20212022 for this segment references 13-week periods ended SeptemberJune 25, 2023 and June 26, 2022, and September 26, 2021.respectively. The Company does not believe the impact of reporting the results of this segment as stated above is material to the consolidated financial results. The Company may fund or receive cash from the Aluminum Extrusions segment based on Aluminum Extrusion’s cash flows from operations during the intervening period from Aluminum Extrusion’s fiscal quarter end and the Company’s fiscal quarter end. There was no intercompany funding with Aluminum Extrusions between SeptemberJune 25, 20222023 and SeptemberJune 30, 2022.2023.
The condensed consolidated financial position datastatements as of December 31, 20212022 that is included herein was derived from the audited consolidated financial statements provided in the Company’s Annual Report on Form 10-K for the year ended December 31, 20212022 (“20212022 Form 10-K”) but does not include all disclosures required by GAAP. These financial statements should be read in conjunction with the audited consolidated financial statements and related notes included in the 20212022 Form 10-K.
The results of operations for the three and ninesix months ended SeptemberJune 30, 2022,2023, are not necessarily indicative of the results to be expected for the full year.
RisksImpairment of Goodwill
The Company assesses goodwill for impairment when events or circumstances indicate that the carrying value may not be recoverable, or, at a minimum, on an annual basis (December 1st of each year). As of June 30, 2023, the Company’s reporting units with goodwill were Surface Protection in PE Films ("Surface Protection") and UncertaintiesFutura in Aluminum Extrusions (“Futura”). No events or circumstances were identified during the second quarter of 2023 that indicate that Futura’s fair value is more likely than not less than its carrying amount.
DuringHowever, manufacturers in the three months ended September 30, 2022, eventssupply chain for consumer electronics continue to experience reduced capacity utilization and circumstances indicated thatinventory corrections. In light of the continued uncertainty about the timing of a recovery for this market and the expected adverse future impact to the Surface Protection reporting unit ("Surface Protection"), which is alsobusiness, the asset group, might be impaired. The Company performed a Step 1 goodwill and long-lived impairment analysis forof the Surface Protection component of PE Films using projections that contemplate the expected market recovery and determinedbusiness conditions, as these events indicated Surface Protection’s fair value is more likely than not less than its carrying amount.
The Company estimated the fair value of Surface Protection at June 30, 2023 by: (i) computing an estimated enterprise value (“EV”) utilizing the discounted cash flow method (the “DCF Method”), (ii) applying adjustments for any surplus or deficient working capital, (iii) adding cash and cash equivalents, and (iv) subtracting interest-bearing debt. The DCF Method was used since Surface Protection’s projections reflect the expected recovery from the weak market demand, competitive pricing and cash flows associated with new surface protection products, applications, customers, production efficiencies, and cost savings.
The analysis concluded that the fair value of Surface Protection exceededwas less than its carrying value. value, thus a non-cash partial goodwill impairment of $15.4 million ($11.9 million after deferred income tax benefits) was recognized during the second quarter of 2023.
Given the uncertain demand for Surface Protections products, it is reasonably possible that the cash flow estimates used in deriving such fair value measurements may change in the future.
As of September 30, 2022, the The Surface Protection reporting unit had goodwill of $41.9 million and $57.3 million as of June 30, 2023 and long-lived identifiable assets of $29.5 million.December 31, 2022, respectively.
Accounting Standards Adopted
In March 2020,No Accounting Standard Updates issued by the Financial Accounting Standards Board ("FASB") issued Accounting Standards Update ("ASU") 2020-04, which provides optional expedients and exceptions for applying GAAP to contracts, hedging relationships and other transactions affected by the discontinuation of the London Interbank Offered Rate or by another reference rate expected to be discontinued because of reference rate reform. The guidance was effective beginning March 12, 2020 and can be applied prospectively through December 31, 2022. In January 2021, the FASB issued ASU 2021-01, which clarified the scope and application of the original guidance. Inwere adopted during the second quarter of 2022, the Company adopted ASU 2020-04, which did not have a material impact on the Company’s consolidated financial statements.2023.
Accounting Standards Not Yet Adopted
In September 2022, the FASB issued ASU 2022-04, which requires that a buyer in a supplier finance program disclose sufficient information about the program to allow a user of financial statements to understand the program’s nature, activity during the period, changes from period to period, and potential magnitude. The guidance is effective for annual periods beginning after December 15, 2022, with early adoption permitted. The Company is currently evaluating the potential impact of adopting this guidance, but does not expect it to have a material impact on the consolidated financial statements.
2. ACCOUNTS AND OTHER RECEIVABLES
As of SeptemberJune 30, 20222023 and December 31, 2021,2022, accounts receivable and other receivables, net include the following: | | | | | | | | | | | |
| September 30, | | December 31, |
| (In thousands) | 2022 | | 2021 |
| Customer receivables | $ | 108,438 | | | $ | 102,090 | |
| Other receivables | 3,959 | | | 2,958 | |
| Total accounts and other receivables | 112,397 | | | 105,048 | |
| Less: Allowance for bad debts | (2,320) | | | (1,736) | |
| Total accounts and other receivables, net | $ | 110,077 | | | $ | 103,312 | |
| | | | | | | | | | | |
| (In thousands) | June 30, 2023 | | December 31, 2022 |
| Customer receivables | $ | 79,112 | | | $ | 83,667 | |
| Other receivables | 2,233 | | | 3,874 | |
| Total accounts and other receivables | 81,345 | | | 87,541 | |
| Less: Allowance for bad debts | (2,206) | | | (2,997) | |
| Total accounts and other receivables, net | $ | 79,139 | | | $ | 84,544 | |
3. INVENTORIES
The components of inventories are as follows: | | (In thousands) | (In thousands) | September 30, 2022 | | December 31, 2021 | (In thousands) | June 30, 2023 | | December 31, 2022 |
| Finished goods | Finished goods | $ | 30,025 | | | $ | 25,199 | | Finished goods | $ | 29,677 | | | $ | 34,686 | |
| Work-in-process | Work-in-process | 17,201 | | | 11,955 | | Work-in-process | 12,678 | | | 15,604 | |
| Raw materials | Raw materials | 49,212 | | | 32,958 | | Raw materials | 23,897 | | | 58,262 | |
| Stores, supplies and other | Stores, supplies and other | 17,665 | | | 18,457 | | Stores, supplies and other | 20,440 | | | 19,219 | |
| Total | Total | $ | 114,103 | | | $ | 88,569 | | Total | $ | 86,692 | | | $ | 127,771 | |
4. PENSION AND OTHER POSTRETIREMENT BENEFITS
Tredegar sponsors a noncontributory defined benefit (pension) plan covering certain current and former U.S. employees. As of January 31, 2018, the plan no longer accrued benefits associated with crediting employees for service, thereby freezing all future benefits under the plan. On February 10, 2022, Tredegar announced the initiation of a process to terminate and settle its frozen defined benefit pension plan, which could take up to 24 months to complete.plan. In connection therewith, on February 9, 2022, the Company contributed $50 million to the pension plan (the “Special Contribution”). The Company estimates that, with the Special Contribution, there will be no required minimum contributions to the pension plan until final settlement.
Tredegar also has a non-qualified supplemental pension plan covering certain employees. Effective December 31, 2005, further participation in this plan was terminated and benefit accruals for existing participants were frozen. Pension expense recognized for this plan was immaterial in the third quarter of 2022three and 2021, respectively.six months ended June 30, 2023 and 2022. This information has been included in the pension benefit table below.
The components of net periodic benefit cost for the pension and other postretirement benefit programs reflected in the condensed consolidated statements of income for the three and ninesix months ended SeptemberJune 30, 20222023 and 2021,2022, are shown below: | | | Pension Benefits | | Other Post-Retirement Benefits | | Pension Benefits | | Other Post-Retirement Benefits |
| | | Three Months Ended September 30, | | Three Months Ended September 30, | | Three Months Ended June 30, | | Three Months Ended June 30, |
| (In thousands) | (In thousands) | 2022 | | 2021 | | 2022 | | 2021 | (In thousands) | 2023 | | 2022 | | 2023 | | 2022 |
| Service cost | Service cost | $ | — | | | $ | — | | | $ | 5 | | | $ | 9 | | Service cost | $ | — | | | $ | — | | | $ | 3 | | | $ | 5 | |
| Interest cost | Interest cost | 2,226 | | | 2,101 | | | 51 | | | 50 | | Interest cost | 3,028 | | | 2,225 | | | 71 | | | 51 | |
| Expected return on plan assets | Expected return on plan assets | (2,044) | | | (2,862) | | | — | | | — | | Expected return on plan assets | (2,607) | | | (2,043) | | | — | | | — | |
| Amortization of prior service costs, (gains) losses and net transition asset | Amortization of prior service costs, (gains) losses and net transition asset | 3,301 | | | 4,268 | | | (33) | | | (24) | | Amortization of prior service costs, (gains) losses and net transition asset | 2,982 | | | 3,302 | | | (59) | | | (34) | |
| Net periodic benefit cost | Net periodic benefit cost | $ | 3,483 | | | $ | 3,507 | | | $ | 23 | | | $ | 35 | | Net periodic benefit cost | $ | 3,403 | | | $ | 3,484 | | | $ | 15 | | | $ | 22 | |
| | | Pension Benefits | | Other Post-Retirement Benefits | | Pension Benefits | | Other Post-Retirement Benefits |
| | | Nine Months Ended September 30, | | Nine Months Ended September 30, | | Six Months Ended June 30, | | Six Months Ended June 30, |
| (In thousands) | (In thousands) | 2022 | | 2021 | | 2022 | | 2021 | (In thousands) | 2023 | | 2022 | | 2023 | | 2022 |
| Service cost | Service cost | $ | — | | | $ | — | | | $ | 15 | | | $ | 26 | | Service cost | $ | — | | | $ | — | | | $ | 6 | | | $ | 10 | |
| Interest cost | Interest cost | 6,676 | | | 6,305 | | | 153 | | | 151 | | Interest cost | 6,056 | | | 4,450 | | | 142 | | | 102 | |
| Expected return on plan assets | Expected return on plan assets | (6,141) | | | (8,587) | | | — | | | — | | Expected return on plan assets | (5,214) | | | (4,098) | | | — | | | — | |
| Amortization of prior service costs, (gains) losses and net transition asset | Amortization of prior service costs, (gains) losses and net transition asset | 9,887 | | | 12,799 | | | (101) | | | (72) | | Amortization of prior service costs, (gains) losses and net transition asset | 5,965 | | | 6,586 | | | (118) | | | (68) | |
| Net periodic benefit cost | Net periodic benefit cost | $ | 10,422 | | | $ | 10,517 | | | $ | 67 | | | $ | 105 | | Net periodic benefit cost | $ | 6,807 | | | $ | 6,938 | | | $ | 30 | | | $ | 44 | |
Pension and other postretirement liabilities were $29.1$36.4 million and $78.9$35.7 million at SeptemberJune 30, 20222023 and December 31, 2021,2022, respectively ($0.7 million included in “Accrued expenses” at SeptemberJune 30, 20222023 and December 31, 2021,2022, respectively, with the remainder included in “Pension and other postretirement benefit obligations, net” in the condensed consolidated balance sheets).
Tredegar funds its other postretirement benefits on a claims-made basis; for 2022,2023, the Company anticipates the amount will be consistent with amounts paid for the year ended December 31, 2021,2022, or approximately $0.5 million.
5. OTHER INCOME (EXPENSE), NET
Other income (expense), net consists of the following: | | | Three Months Ended September 30, | | Nine Months Ended September 30, | | Three Months Ended June 30, | | Six Months Ended June 30, |
| (In thousands) | (In thousands) | 2022 | | 2021 | | 2022 | | 2021 | (In thousands) | 2023 | | 2022 | | 2023 | | 2022 |
Gain on investment in kaléo(a) | Gain on investment in kaléo(a) | $ | — | | | $ | 279 | | | $ | 1,406 | | | $ | 1,197 | | Gain on investment in kaléo(a) | $ | — | | | $ | 1,406 | | | $ | 262 | | | $ | 1,406 | |
| One-time tax credit in Brazil for unemployment/social security insurance non-income taxes resulting from a favorable decision by Brazil's Supreme Court regarding the calculation of such tax | — | | | — | | | — | | | 8,486 | | |
COVID-19-related expenses, net of relief (b) | | COVID-19-related expenses, net of relief (b) | — | | | (96) | | | — | | | (308) | |
| | Other | Other | 119 | | | 112 | | | (293) | | | (411) | | Other | (20) | | | 32 | | | (2) | | | (57) | |
| Total | Total | $ | 119 | | | $ | 391 | | | $ | 1,113 | | | $ | 9,272 | | Total | $ | (20) | | | $ | 1,342 | | | $ | 260 | | | $ | 1,041 | |
| (a) In May 2022, additional cash consideration of $1.4 million was received related to customary post-closing adjustments. See Note 12 for additional information on the sale of the investment in kaléo. | |
(a) In January 2023, additional cash consideration of $0.3 million was received related to the customary post-closing adjustments on the sale of the investment in kaleo, Inc ("kaléo"), which was sold in December 2021. (b) Costs associated with operating under COVID-19 conditions include employee overtime expenses associated with absenteeism, personal protective equipment supplies and facility maintenance. | | (a) In January 2023, additional cash consideration of $0.3 million was received related to the customary post-closing adjustments on the sale of the investment in kaleo, Inc ("kaléo"), which was sold in December 2021. (b) Costs associated with operating under COVID-19 conditions include employee overtime expenses associated with absenteeism, personal protective equipment supplies and facility maintenance. |
In May 2021, the Brazil Supreme Court ruled in a leading case related to the amount of Brazilian value-added tax to exclude from the calculation of unemployment/social security insurance non-income taxes ("PIS/COFINS"). As a result, in the second quarter of 2021, the Company recorded a pre-tax gain of $8.5 million for certain excess PIS/COFINS paid from 2003 to 2021, plus applicable interest, which the Company applied to required Brazilian federal tax payments during 2021.
6. EARNINGS PER SHARE
Basic earnings per share is computed by dividing net income (loss) from continuing and discontinued operations by the weighted average number of shares of common stock outstanding. Diluted earnings per share is computed by dividing net income (loss) from continuing and discontinued operations by the weighted average common and potentially dilutive common equivalent shares outstanding, determined as follows: | | | Three Months Ended | | Nine Months Ended | | Three Months Ended | | Six Months Ended |
| | | September 30, | | September 30, | | June 30, | | June 30, |
| (In thousands) | (In thousands) | 2022 | | 2021 | | 2022 | | 2021 | (In thousands) | 2023 | | 2022 | | 2023 | | 2022 |
| Weighted average shares outstanding used to compute basic earnings per share | Weighted average shares outstanding used to compute basic earnings per share | 33,870 | | | 33,620 | | | 33,780 | | | 33,541 | | Weighted average shares outstanding used to compute basic earnings per share | 34,079 | | | 33,814 | | | 33,988 | | | 33,734 | |
| Incremental dilutive shares attributable to stock options and restricted stock | Incremental dilutive shares attributable to stock options and restricted stock | 1 | | | 29 | | | 28 | | | 137 | | Incremental dilutive shares attributable to stock options and restricted stock | — | | | 40 | | | — | | | 42 | |
| Shares used to compute diluted earnings per share | Shares used to compute diluted earnings per share | 33,871 | | | 33,649 | | | 33,808 | | | 33,678 | | Shares used to compute diluted earnings per share | 34,079 | | | 33,854 | | | 33,988 | | | 33,776 | |
Incremental shares attributable to stock options and restricted stock are computed under the treasury stock method using the average market price during the related period. The Company had a net loss for the three and six months ended June 30, 2023, so there is no dilutive impact for such shares. If the Company had reported net income for the three and six months ended June 30, 2023, average out-of-the-money options to purchase shares that were excluded from the calculation of incremental shares attributable to stock options and restricted stock would have been 3,019,333 and 2,830,849, respectively. The average out-of-the-money options to purchase shares that were excluded from the calculation of incremental shares attributable to stock options and restricted stock were 2,932,3782,525,104 and 2,645,0632,501,406 for the three and ninesix months ended SeptemberJune 30, 2022, respectively, and 2,433,213 and 1,280,376 for the three and nine months ended September 30, 2021, respectively.
7. ACCUMULATED OTHER COMPREHENSIVE INCOME (LOSS)
The changes in accumulated other comprehensive income (loss) by component for the three months ended SeptemberJune 30, 2022.2023.
| | | | | | | | | | | | | | | | | | | | | | | |
| (In thousands) | Foreign Currency Translation | | Gain (Loss) on Derivative Financial Instruments | | Pension & Other Postretirement Benefit Adjust | | Total Accumulated Other Comprehensive Income (Loss) |
| Balance at April 1, 2023 | $ | (84,959) | | | $ | (1,211) | | | $ | (56,749) | | | $ | (142,919) | |
| Other comprehensive income (loss) | 1,800 | | | 2,488 | | | — | | | 4,288 | |
| Income tax (expense) benefit | (179) | | | (945) | | | — | | | (1,124) | |
| Other comprehensive income (loss), net of tax | 1,621 | | | 1,543 | | | — | | | 3,164 | |
| Reclassification adjustment to net income (loss) | — | | | (1,621) | | | 2,923 | | | 1,302 | |
| Income tax (expense) benefit | — | | | 446 | | | (637) | | | (191) | |
| Reclassification adjustment to net income (loss), net of tax | — | | | (1,175) | | | 2,286 | | | 1,111 | |
| Other comprehensive income (loss), net of tax | 1,621 | | | 368 | | | 2,286 | | | 4,275 | |
| Balance at June 30, 2023 | $ | (83,338) | | | $ | (843) | | | $ | (54,463) | | | $ | (138,644) | |
| | | | | | | | | | | | | | | | | | | | | | | |
| (In thousands) | Foreign Currency Translation | | Gain (Loss) on Derivative Financial Instruments | | Pension & Other Postretirement Benefit Adjust | | Total Accumulated Other Comprehensive Income (Loss) |
| Balance at July 1, 2022 | $ | (85,486) | | | $ | (2,330) | | | $ | (59,519) | | | $ | (147,335) | |
| Other comprehensive income (loss) | (2,488) | | | (2,205) | | | — | | | (4,693) | |
| Income tax (expense) benefit | 148 | | | 522 | | | — | | | 670 | |
| Other comprehensive income (loss), net of tax | (2,340) | | | (1,683) | | | — | | | (4,023) | |
| Reclassification adjustment to net income (loss) | — | | | (1,159) | | | 3,268 | | | 2,109 | |
| Income tax (expense) benefit | — | | | 295 | | | (712) | | | (417) | |
| Reclassification adjustment to net income (loss), net of tax | — | | | (864) | | | 2,556 | | | 1,692 | |
| Other comprehensive income (loss), net of tax | (2,340) | | | (2,547) | | | 2,556 | | | (2,331) | |
| Balance at September 30, 2022 | $ | (87,826) | | | $ | (4,877) | | | $ | (56,963) | | | $ | (149,666) | |
The changes in accumulated other comprehensive income (loss) by component for the ninesix months ended SeptemberJune 30, 2023.
| | | | | | | | | | | | | | | | | | | | | | | |
| (In thousands) | Foreign Currency Translation | | Gain (Loss) on Derivative Financial Instruments | | Pension & Other Postretirement Benefit Adjust | | Total Accumulated Other Comprehensive Income (Loss) |
| Balance at January 1, 2023 | $ | (86,079) | | | $ | (2,480) | | | $ | (59,036) | | | $ | (147,595) | |
| Other comprehensive income (loss) | 3,356 | | | 5,565 | | | — | | | 8,921 | |
| Income tax (expense) benefit | (615) | | | (2,031) | | | — | | | (2,646) | |
| Other comprehensive income (loss), net of tax | 2,741 | | | 3,534 | | | — | | | 6,275 | |
| Reclassification adjustment to net income (loss) | — | | | (2,594) | | | 5,847 | | | 3,253 | |
| Income tax (expense) benefit | — | | | 697 | | | (1,274) | | | (577) | |
| Reclassification adjustment to net income (loss), net of tax | — | | | (1,897) | | | 4,573 | | | 2,676 | |
| Other comprehensive income (loss), net of tax | 2,741 | | | 1,637 | | | 4,573 | | | 8,951 | |
| Balance at June 30, 2023 | $ | (83,338) | | | $ | (843) | | | $ | (54,463) | | | $ | (138,644) | |
The changes in accumulated other comprehensive income (loss) by component for the three months ended June 30, 2022.
| | (In thousands) | (In thousands) | Foreign Currency Translation | | Gain (Loss) on Derivative Financial Instruments | | Pension & Other Postretirement Benefit Adjust | | Total Accumulated Other Comprehensive Income (Loss) | (In thousands) | Foreign Currency Translation | | Gain (Loss) on Derivative Financial Instruments | | Pension & Other Postretirement Benefit Adjust | | Total Accumulated Other Comprehensive Income (Loss) |
| Balance at January 1, 2022 | $ | (85,792) | | | $ | 901 | | | $ | (64,613) | | | $ | (149,504) | | |
| Balance at April 1, 2022 | | Balance at April 1, 2022 | $ | (80,256) | | | $ | 6,831 | | | $ | (62,075) | | | $ | (135,500) | |
| Other comprehensive income (loss) | Other comprehensive income (loss) | (1,936) | | | (3,883) | | | — | | | (5,819) | | Other comprehensive income (loss) | (5,712) | | | (11,681) | | | — | | | (17,393) | |
| Income tax (expense) benefit | Income tax (expense) benefit | (98) | | | 442 | | | — | | | 344 | | Income tax (expense) benefit | 482 | | | 3,110 | | | — | | | 3,592 | |
| Other comprehensive income (loss), net of tax | Other comprehensive income (loss), net of tax | (2,034) | | | (3,441) | | | — | | | (5,475) | | Other comprehensive income (loss), net of tax | (5,230) | | | (8,571) | | | — | | | (13,801) | |
| Reclassification adjustment to net income (loss) | Reclassification adjustment to net income (loss) | — | | | (3,156) | | | 9,786 | | | 6,630 | | Reclassification adjustment to net income (loss) | — | | | (840) | | | 3,268 | | | 2,428 | |
| Income tax (expense) benefit | Income tax (expense) benefit | — | | | 819 | | | (2,136) | | | (1,317) | | Income tax (expense) benefit | — | | | 250 | | | (712) | | | (462) | |
| Reclassification adjustment to net income (loss), net of tax | Reclassification adjustment to net income (loss), net of tax | — | | | (2,337) | | | 7,650 | | | 5,313 | | Reclassification adjustment to net income (loss), net of tax | — | | | (590) | | | 2,556 | | | 1,966 | |
| Other comprehensive income (loss), net of tax | Other comprehensive income (loss), net of tax | (2,034) | | | (5,778) | | | 7,650 | | | (162) | | Other comprehensive income (loss), net of tax | (5,230) | | | (9,161) | | | 2,556 | | | (11,835) | |
| Balance at September 30, 2022 | $ | (87,826) | | | $ | (4,877) | | | $ | (56,963) | | | $ | (149,666) | | |
| Balance at June 30, 2022 | | Balance at June 30, 2022 | $ | (85,486) | | | $ | (2,330) | | | $ | (59,519) | | | $ | (147,335) | |
The changes in accumulated other comprehensive income (loss) by component for the threesix months ended SeptemberJune 30, 2021.2022.
| | | | | | | | | | | | | | | | | | | | | | | |
| (In thousands) | Foreign Currency Translation | | Gain (Loss) on Derivative Financial Instruments | | Pension & Other Postretirement Benefit Adjust | | Total Accumulated Other Comprehensive Income (Loss) |
| Balance at July 1, 2021 | $ | (82,804) | | | $ | 3,496 | | | $ | (89,882) | | | $ | (169,190) | |
| Other comprehensive income (loss) | (3,082) | | | 1,245 | | | — | | | (1,837) | |
| Income tax (expense) benefit | 294 | | | (297) | | | — | | | (3) | |
| Other comprehensive income (loss), net of tax | (2,788) | | | 948 | | | — | | | (1,840) | |
| Reclassification adjustment to net income (loss) | — | | | (2,141) | | | 4,244 | | | 2,103 | |
| Income tax (expense) benefit | — | | | 476 | | | (927) | | | (451) | |
| Reclassification adjustment to net income (loss), net of tax | — | | | (1,665) | | | 3,317 | | | 1,652 | |
| Other comprehensive income (loss), net of tax | (2,788) | | | (717) | | | 3,317 | | | (188) | |
| Balance at September 30, 2021 | $ | (85,592) | | | $ | 2,779 | | | $ | (86,565) | | | $ | (169,378) | |
The changes in accumulated other comprehensive income (loss) by component for the nine months ended September 30, 2021.
| | (In thousands) | (In thousands) | Foreign Currency Translation | | Gain (Loss) on Derivative Financial Instruments | | Pension & Other Postretirement Benefit Adjust | | Total Accumulated Other Comprehensive Income (Loss) | (In thousands) | Foreign Currency Translation | | Gain (Loss) on Derivative Financial Instruments | | Pension & Other Postretirement Benefit Adjust | | Total Accumulated Other Comprehensive Income (Loss) |
| Balance at January 1, 2021 | $ | (84,149) | | | $ | 2,264 | | | $ | (96,519) | | | $ | (178,404) | | |
| Balance at January 1, 2022 | | Balance at January 1, 2022 | $ | (85,792) | | | $ | 901 | | | $ | (64,613) | | | $ | (149,504) | |
| Other comprehensive income (loss) | Other comprehensive income (loss) | (1,546) | | | 4,736 | | | — | | | 3,190 | | Other comprehensive income (loss) | 552 | | | (1,678) | | | — | | | (1,126) | |
| Income tax (expense) benefit | Income tax (expense) benefit | 103 | | | (1,064) | | | — | | | (961) | | Income tax (expense) benefit | (246) | | | (80) | | | — | | | (326) | |
| Other comprehensive income (loss), net of tax | Other comprehensive income (loss), net of tax | (1,443) | | | 3,672 | | | — | | | 2,229 | | Other comprehensive income (loss), net of tax | 306 | | | (1,758) | | | — | | | (1,452) | |
| Reclassification adjustment to net income (loss) | Reclassification adjustment to net income (loss) | — | | | (4,037) | | | 12,727 | | | 8,690 | | Reclassification adjustment to net income (loss) | — | | | (1,997) | | | 6,518 | | | 4,521 | |
| Income tax (expense) benefit | Income tax (expense) benefit | — | | | 880 | | | (2,773) | | | (1,893) | | Income tax (expense) benefit | — | | | 524 | | | (1,424) | | | (900) | |
| Reclassification adjustment to net income (loss), net of tax | Reclassification adjustment to net income (loss), net of tax | — | | | (3,157) | | | 9,954 | | | 6,797 | | Reclassification adjustment to net income (loss), net of tax | — | | | (1,473) | | | 5,094 | | | 3,621 | |
| Other comprehensive income (loss), net of tax | Other comprehensive income (loss), net of tax | (1,443) | | | 515 | | | 9,954 | | | 9,026 | | Other comprehensive income (loss), net of tax | 306 | | | (3,231) | | | 5,094 | | | 2,169 | |
| Balance at September 30, 2021 | $ | (85,592) | | | $ | 2,779 | | | $ | (86,565) | | | $ | (169,378) | | |
| Balance at June 30, 2022 | | Balance at June 30, 2022 | $ | (85,486) | | | $ | (2,330) | | | $ | (59,519) | | | $ | (147,335) | |
The amounts reclassified out of accumulated other comprehensive income (loss) related to pension and other postretirement benefits is included in the computation of net periodic pension costs, seecosts. See Note 4 for additional details.
8. DERIVATIVES
Tredegar uses derivative financial instruments for the purpose of hedging margin exposure from fixed-price forward sales contracts in Aluminum Extrusions and exposure from currency volatility that exists as part of ongoing business operations in Flexible Packaging Films. These derivative financial instruments are designated as and qualify as cash flow hedges and are recognized in the condensed consolidated balance sheet at fair value. If individual derivative instruments with the same counterparty can be settled on a net basis, the Company records the corresponding derivative fair values as a net asset or net liability.
In the normal course of business, Aluminum Extrusions enters into fixed-price forward sales contracts with certain customers for the future sale of fixed quantities of aluminum extrusions at scheduled intervals. In order to hedge margin exposure created from the fixing of future sales prices relative to volatile raw material (aluminum) costs, Aluminum Extrusions enters into a combination of forward purchase commitments and futures contracts to acquire or hedge aluminum, based on the scheduled purchases for the firm sales commitments. The fixed-price firm sales commitments and related hedging instruments
have durations generally no longer than 2412 months. The notional amount of aluminum futures contracts that hedged future purchases of aluminum to meet fixed-price forward sales contract obligations was $33.7$17.0 million (18.4(11.1 million pounds of aluminum) at SeptemberJune 30, 20222023 and $22.1$30.7 million (14.9(20.3 million pounds of aluminum) at December 31, 2021.2022.
The table below summarizes the location and gross amounts of aluminum futures contract fair values (Level 2) in the condensed consolidated balance sheets as of SeptemberJune 30, 20222023 and December 31, 2021:2022: | | | | September 30, 2022 | | December 31, 2021 | | June 30, 2023 | | December 31, 2022 |
| (In thousands) | (In thousands) | Balance Sheet
Account | | Fair
Value | | Balance Sheet
Account | | Fair
Value | (In thousands) | Balance Sheet
Account | | Fair
Value | | Balance Sheet
Account | | Fair
Value |
| Derivatives Designated as Hedging Instruments | Derivatives Designated as Hedging Instruments | | Derivatives Designated as Hedging Instruments | |
Asset derivatives: Aluminum futures contracts | Asset derivatives: Aluminum futures contracts | Prepaid expenses and other | | $ | 8 | | | Prepaid expenses and other | | $ | 2,085 | | Asset derivatives: Aluminum futures contracts | Prepaid expenses and other | | $ | — | | | Prepaid expenses and other | | $ | 48 | |
| Liability derivatives: Aluminum futures contracts | Liability derivatives: Aluminum futures contracts | Accrued expenses | | (5,016) | | | Accrued expenses | | (119) | | Liability derivatives: Aluminum futures contracts | Accrued expenses | | (3,050) | | | Accrued expenses | | (3,260) | |
| Aluminum futures contracts | Aluminum futures contracts | Other non-current liabilities | | (1,222) | | | Other non-current liabilities | | — | | Aluminum futures contracts | Other non-current liabilities | | (255) | | | Other non-current liabilities | | (369) | |
| Net asset (liability) | Net asset (liability) | | $ | (6,230) | | | $ | 1,966 | | Net asset (liability) | | $ | (3,305) | | | $ | (3,581) | |
In the event that a counterparty to an aluminum fixed-price forward sales contract chooses not to take delivery of its aluminum extrusions, the customer is contractually obligated to compensate Aluminum Extrusions for any losses on the related aluminum futures and/or forward contracts through the date of cancellation.
The Company's earnings are exposed to foreign currency exchange risk primarily through the translation of the financial statements of subsidiaries that have a functional currency other than the U.S. Dollar. The Company estimates that the net mismatch translation exposure for the Flexible Packaging Film's business unit in Brazil (“Terphane Ltda.”) of its sales and raw materials quoted or priced in U.S. Dollars and its variable conversion, fixed conversion and sales, general and administrative costs (before depreciation and amortization) quoted or priced in Brazilian Real ("R$") iswill result in an annual net costscost of R$150177 million for the full year of 2022.
Terphane Ltda. hashad the following outstanding foreign exchange average forward rate contracts to purchase Brazilian Real and sell U.S. Dollars:Dollars as of June 30, 2023: | | USD Notional Amount (000s) | USD Notional Amount (000s) | Average Forward Rate Contracted on USD/BRL | R$ Equivalent Amount (000s) | Applicable Month | Estimated % of Terphane Ltda. R$ Operating Cost Exposure Hedged | USD Notional Amount (000s) | Average Forward Rate Contracted on USD/BRL | R$ Equivalent Amount (000s) | Applicable Month | Estimated % of Terphane Ltda. R$ Operating Cost Exposure Hedged |
| $1,793 | 5.6264 | R$10,088 | Oct-22 | 78% | |
| $1,784 | 5.6597 | R$10,097 | Nov-22 | 78% | |
| $1,659 | 5.6962 | R$9,450 | Dec-22 | 73% | |
| $1,728 | 5.4310 | R$9,385 | Jan-23 | 64% | |
| $1,822 | 5.4657 | R$9,959 | Feb-23 | 68% | |
| $1,921 | 5.4995 | R$10,565 | Mar-23 | 72% | |
| $1,903 | 5.5379 | R$10,539 | Apr-23 | 72% | |
| $1,873 | 5.5753 | R$10,443 | May-23 | 71% | |
| $1,928 | 5.6118 | R$10,820 | Jun-23 | 74% | |
| | $2,154 | $2,154 | 5.6378 | R$12,144 | Jul-23 | 83% | $2,154 | 5.6378 | R$12,144 | Jul-23 | 83% |
| $2,020 | $2,020 | 5.6831 | R$11,480 | Aug-23 | 78% | $2,020 | 5.6831 | R$11,480 | Aug-23 | 78% |
| $2,071 | $2,071 | 5.7174 | R$11,841 | Sep-23 | 80% | $2,071 | 5.7174 | R$11,841 | Sep-23 | 80% |
| $2,013 | $2,013 | 5.7556 | R$11,586 | Oct-23 | 79% | $2,013 | 5.7556 | R$11,586 | Oct-23 | 79% |
| $2,018 | $2,018 | 5.7836 | R$11,671 | Nov-23 | 79% | $2,018 | 5.7836 | R$11,671 | Nov-23 | 79% |
| $1,786 | $1,786 | 5.8312 | R$10,414 | Dec-23 | 71% | $1,786 | 5.8312 | R$10,414 | Dec-23 | 71% |
| $659 | $659 | 5.7360 | R$3,780 | Jan-24 | 23% | $659 | 5.7360 | R$3,780 | Jan-24 | 23% |
| $659 | $659 | 5.7562 | R$3,793 | Feb-24 | 23% | $659 | 5.7562 | R$3,793 | Feb-24 | 23% |
| $659 | $659 | 5.7774 | R$3,807 | Mar-24 | 23% | $659 | 5.7774 | R$3,807 | Mar-24 | 23% |
| $659 | $659 | 5.8000 | R$3,822 | Apr-24 | 23% | $659 | 5.8000 | R$3,822 | Apr-24 | 23% |
| $659 | $659 | 5.8207 | R$3,836 | May-24 | 24% | $659 | 5.8207 | R$3,836 | May-24 | 24% |
| $659 | $659 | 5.8419 | R$3,850 | Jun-24 | 24% | $659 | 5.8419 | R$3,850 | Jun-24 | 24% |
| $659 | $659 | 5.8636 | R$3,864 | Jul-24 | 24% | $659 | 5.8636 | R$3,864 | Jul-24 | 24% |
| $659 | $659 | 5.8872 | R$3,880 | Aug-24 | 24% | $659 | 5.8872 | R$3,880 | Aug-24 | 24% |
| $659 | $659 | 5.9118 | R$3,896 | Sep-24 | 24% | $659 | 5.9118 | R$3,896 | Sep-24 | 24% |
| $659 | $659 | 5.9350 | R$3,911 | Oct-24 | 24% | $659 | 5.9350 | R$3,911 | Oct-24 | 24% |
| $659 | $659 | 5.9581 | R$3,926 | Nov-24 | 24% | $659 | 5.9581 | R$3,926 | Nov-24 | 24% |
| $659 | $659 | 5.9813 | R$3,942 | Dec-24 | 24% | $659 | 5.9813 | R$3,942 | Dec-24 | 24% |
| $36,381 | 5.6840 | R$206,789 | | 50% | |
| $19,970 | | $19,970 | 5.7808 | R$115,443 | | 40% |
These foreign currency exchange contracts have been designated and qualify as cash flow hedges of Terphane Ltda.’s forecasted sales to customers quoted or priced in U.S. Dollars over that period. By changing the currency risk associated with these U.S. Dollar sales, the derivatives have the effect of offsetting operating costs quoted or priced in Brazilian Real and decreasing the net exposure to Brazilian Real in the condensed consolidated statements of income.
The table below summarizes the location and gross amounts of foreign currency forward contract fair values (Level 2) in the condensed consolidated balance sheets as of SeptemberJune 30, 20222023 and December 31, 2021:2022: | | | | September 30, 2022 | | December 31, 2021 | | June 30, 2023 | | December 31, 2022 |
| (In thousands) | (In thousands) | Balance Sheet
Account | | Fair
Value | | Balance Sheet
Account | | | Fair
Value | (In thousands) | Balance Sheet
Account | | Fair
Value | | Balance Sheet
Account | | | Fair
Value |
| Derivatives Designated as Hedging Instruments | Derivatives Designated as Hedging Instruments | | | | Derivatives Designated as Hedging Instruments | | | |
Asset derivatives: Foreign currency forward contracts | Asset derivatives: Foreign currency forward contracts | Prepaid expenses and other | | $ | 397 | | | Prepaid expenses and other | | | $ | — | | Asset derivatives: Foreign currency forward contracts | Prepaid expenses and other | | $ | 2,974 | | | Prepaid expenses and other | | | $ | 781 | |
| Foreign currency forward contracts | Foreign currency forward contracts | Other assets | | 59 | | | Other assets | | | — | | Foreign currency forward contracts | Other assets | | 723 | | | Other assets | | | 33 | |
Liability derivatives: Foreign currency forward contracts | Liability derivatives: Foreign currency forward contracts | Accrued expenses | | (363) | | | Accrued expenses | | | (1,255) | | Liability derivatives: Foreign currency forward contracts | Accrued expenses | | — | | | Other non-current liabilities | | | (3) | |
| Net asset (liability) | Net asset (liability) | | $ | 93 | | | | | $ | (1,255) | | Net asset (liability) | | $ | 3,697 | | | | | $ | 811 | |
These derivative contracts involve elements of market risk that are not reflected on the condensed consolidated balance sheet, including the risk of dealing with counterparties and their ability to meet the terms of the contracts. The counterparties to any forward purchase commitments are major aluminum brokers and suppliers, and the counterparties to any aluminum futures contracts are major financial institutions. Fixed-price forward sales contracts are only made available to the best and most credit-worthy customers. The counterparties to the Company’s foreign currency cash flow hedge contracts are major financial institutions.
The pre-tax effect on net income (loss) and other comprehensive income (loss) of derivative instruments classified as cash flow hedges and described in the previous paragraphs for the three and ninesix month periods ended SeptemberJune 30, 20222023 and 20212022 is summarized in the table below: | | | Cash Flow Derivative Hedges | | Cash Flow Derivative Hedges |
| | | Three Months Ended September 30, | | Three Months Ended June 30, |
| | | Aluminum Futures Contracts | | Foreign Currency Forwards | | Aluminum Futures Contracts | | Foreign Currency Forwards |
| (In thousands) | (In thousands) | 2022 | | 2021 | | 2022 | | 2021 | (In thousands) | 2023 | | 2022 | | 2023 | | 2022 |
| Amount of pre-tax gain (loss) recognized in other comprehensive income (loss) | Amount of pre-tax gain (loss) recognized in other comprehensive income (loss) | $ | (2,320) | | | $ | 2,919 | | | $ | — | | $ | 115 | | | $ | — | | | $ | (1,670) | | Amount of pre-tax gain (loss) recognized in other comprehensive income (loss) | $ | 557 | | | $ | (9,923) | | | $ | — | | $ | 1,931 | | | $ | — | | | $ | (1,758) | |
| Location of gain (loss) reclassified from accumulated other comprehensive income (loss) into net income (effective portion) | Location of gain (loss) reclassified from accumulated other comprehensive income (loss) into net income (effective portion) | Cost of goods sold | | Cost of goods sold | | Cost of goods sold | Selling, general & admin | | Cost of goods sold | | Selling, general & admin | Location of gain (loss) reclassified from accumulated other comprehensive income (loss) into net income (effective portion) | Cost of goods sold | | Cost of goods sold | | Cost of goods sold | Selling, general & admin | | Cost of goods sold | | Selling, general & admin |
| Amount of pre-tax gain (loss) reclassified from accumulated other comprehensive income (loss) to net income (effective portion) | Amount of pre-tax gain (loss) reclassified from accumulated other comprehensive income (loss) to net income (effective portion) | $ | 837 | | | $ | 2,160 | | | $ | 16 | | $ | 306 | | | $ | 15 | | | $ | (34) | | Amount of pre-tax gain (loss) reclassified from accumulated other comprehensive income (loss) to net income (effective portion) | $ | 885 | | | $ | 293 | | | $ | 15 | | $ | 721 | | | $ | 15 | | | $ | 532 | |
| | | Nine Months Ended September 30, | | Six Months Ended June 30, |
| | | Aluminum Futures Contracts | | Foreign Currency Forwards | | Aluminum Futures Contracts | | Foreign Currency Forwards |
| | | 2022 | | 2021 | | 2022 | | 2021 | | 2023 | | 2022 | | 2023 | | 2022 |
| Amount of pre-tax gain (loss) recognized in other comprehensive income (loss) | Amount of pre-tax gain (loss) recognized in other comprehensive income (loss) | $ | (6,060) | | | $ | 6,629 | | | $ | — | | $ | 2,177 | | | $ | — | | | $ | (1,892) | | Amount of pre-tax gain (loss) recognized in other comprehensive income (loss) | $ | 1,959 | | | $ | (3,741) | | | $ | — | | $ | 3,606 | | | $ | — | | | $ | 2,063 | |
| Location of gain (loss) reclassified from accumulated other comprehensive income (loss) into net income (effective portion) | Location of gain (loss) reclassified from accumulated other comprehensive income (loss) into net income (effective portion) | Cost of goods sold | | Cost of goods sold | | Cost of goods sold | Selling, general & admin | | Cost of goods sold | | Selling, general & admin | Location of gain (loss) reclassified from accumulated other comprehensive income (loss) into net income (effective portion) | Cost of goods sold | | Cost of goods sold | | Cost of goods sold | Selling, general & admin | | Cost of goods sold | | Selling, general & admin |
| Amount of pre-tax gain (loss) reclassified from accumulated other comprehensive income (loss) to net income (effective portion) | Amount of pre-tax gain (loss) reclassified from accumulated other comprehensive income (loss) to net income (effective portion) | $ | 2,135 | | | $ | 4,172 | | | $ | 46 | | $ | 975 | | | $ | 48 | | | $ | (183) | | Amount of pre-tax gain (loss) reclassified from accumulated other comprehensive income (loss) to net income (effective portion) | $ | 1,557 | | | $ | 1,298 | | | $ | 30 | | $ | 1,007 | | | $ | 30 | | | $ | 669 | |
As of SeptemberJune 30, 2022,2023, the Company expects $3.7$1.8 million of unrealized after-tax losses on aluminum and foreign currency derivative instruments reported in accumulated other comprehensive income (loss) to be reclassified to earnings within the next 12 months. For the three and ninesix month periods ended SeptemberJune 30, 20222023 and 2021,2022, net gains or losses realized, from previously unrealized net gains or losses on hedges that had been discontinued, were not material.
9. INCOME TAXES
Tredegar recorded tax expensebenefit of $7.5$3.0 million on pre-tax income from continuing operationsloss of $39.7$22.9 million in the first ninesix months of 2022.2023. Therefore, the effective tax rate in the first ninesix months of 20222023 was 18.8%13.1%, compared to 22.7%16.9% in the first ninesix months of 2021.2022. The decreasechange in the effective tax rate for continuing operations is primarily due to a pre-tax loss in first six months of 2023 versus pre-tax income in first six months of 2022, lower Brazil tax incentives, a discrete charge in the second quarter of 2023 for a Brazil tax law change and a large discrete benefit recorded in the first quarter of 2022, resulting from the implementation of new U.S. tax regulations associated with foreign tax credits published by the U.S. Treasury and Internal Revenue Service on January 4, 2022. These regulations overhauloverhauled various components of the foreign tax credit regime including the determination of creditable foreign taxes and limit the amount of foreign taxes that are creditable against U.S. income taxes. As the result of these regulations, future Brazilian income tax will beunder Brazil tax law in place at that time would have been deductible, but not creditable, in the U.S. The accounting rules require a reduction of the U.S. deferred tax liability previously established related to anticipated future income from Brazil. The tax effect of the reduction of the U.S. deferred tax liability resulted in the discrete tax benefit described above. In the second quarter of 2023, Brazil enacted new tax legislation which will likely cause the Brazil income tax to once again be creditable after 2023. This one-timelaw change caused a partial reversal of the discrete tax benefit is expected to reducerecognized in the effective tax rate for the remainderfirst quarter of 2022 described above, which will be offset by an expected increaseincreased the deferred tax liability related to the effective tax rate as the result of Braziliananticipated future income tax no longer being creditable in the U.S. for the foreseeable future.from Brazil. Total deferred tax assets declinedincreased during the thirdsecond quarter of 20222023 compared to December 31, 20212022 primarily due to changes in other comprehensive income, increase in net operational loss and the projected utilization of foreign tax credits partially offset by the changedecrease in the deferred tax liability discussed above.related to the goodwill impairment that took place in second quarter of 2023.
Tredegar accrues U.S. federal income taxes on unremitted earnings of foreign subsidiaries where required. However, due to changes in the taxation of dividends under the U.S. Tax Cuts and Jobs Act of 2017, Tredegar will only record U.S. federal income taxes on unremitted earnings of its foreign subsidiaries where Tredegar cannot take steps to eliminate any potential tax on future distributions from its foreign subsidiaries.
The Brazilian federal statutory income tax rate is a composite of 34.0% (25.0% of income tax and 9.0% of social contribution on income). Terphane Ltda.’s manufacturing facility in Brazil is the beneficiary of certain income tax incentives that allow for a reduction in the statutory Brazilian federal income tax rate to 15.25% levied on the operating profit on certain of its products. The incentives have been granted for a 13-year10-year period, from the commencement date of January 1, 2015.2015 and expiring at the end of 2024. The benefit from the tax incentives was $0.4 million and $2.6 million in the first ninesix months of 2023 and 2022, and $8.8 million in 2021.respectively.
Tredegar and its subsidiaries file income tax returns in the U.S., various states, and jurisdictions outside the U.S. With exceptions for some U.S. states and non-U.S. jurisdictions, Tredegar and its subsidiaries as of SeptemberJune 30, 20222023 are no longer subject to U.S. federal, state or non-U.S. income tax examinations by tax authorities for years before 2018.
10. BUSINESS SEGMENTS
The Company’s business segments are Aluminum Extrusions, PE Films, and Flexible Packaging Films. Information by business segment is reported below. There are no accounting transactions between segments and no allocations to segments.
The Company’s reportable segments are based on its method of internal reporting, which is generally segregated by differences in products. Accounting standards for presentation of segments require an approach based on the way the Company organizes the segments for making operating decisions and how the chief operating decision maker (“CODM”) assesses performance. EBITDA from ongoing operations is the key profitability measure used by the CODM (Tredegar’s President and Chief Executive Officer) for purposes of assessing financial performance. The Company uses sales less freight (“net sales”) from continuing operations as its measure of revenues from external customers at the segment level. This measure is separately included in the financial information regularly provided to the CODM.
The following table presents net sales and EBITDA from ongoing operations by segment for the three and ninesix months ended SeptemberJune 30, 20222023 and 2021:2022:
| | | Three Months Ended September 30, | | Nine Months Ended September 30, | | Three Months Ended June 30, | | Six Months Ended June 30, |
| (In thousands) | (In thousands) | 2022 | | 2021 | | 2022 | | 2021 | (In thousands) | 2023 | | 2022 | | 2023 | | 2022 |
| Net Sales | Net Sales | | Net Sales | |
| Aluminum Extrusions | Aluminum Extrusions | $ | 161,649 | | | $ | 137,086 | | | $ | 510,066 | | | $ | 394,492 | | Aluminum Extrusions | $ | 121,827 | | | $ | 190,308 | | | $ | 255,197 | | | $ | 348,417 | |
| PE Films | PE Films | 20,059 | | | 28,501 | | | 82,613 | | | 87,885 | | PE Films | 15,918 | | | 31,424 | | | 36,099 | | | 62,555 | |
| Flexible Packaging Films | Flexible Packaging Films | 47,278 | | | 36,666 | | | 128,117 | | | 102,560 | | Flexible Packaging Films | 33,223 | | | 41,595 | | | 64,750 | | | 80,839 | |
| Total net sales | Total net sales | 228,986 | | | 202,253 | | | 720,796 | | | 584,937 | | Total net sales | 170,968 | | | 263,327 | | | 356,046 | | | 491,811 | |
| Add back freight | Add back freight | 9,500 | | | 7,264 | | | 28,619 | | | 20,531 | | Add back freight | 7,199 | | | 11,036 | | | 13,243 | | | 19,118 | |
| Sales as shown in the condensed consolidated statements of income | $ | 238,486 | | | $ | 209,517 | | | $ | 749,415 | | | $ | 605,468 | | |
| Sales as shown in the condensed consolidated statements of income (loss) | | Sales as shown in the condensed consolidated statements of income (loss) | $ | 178,167 | | | $ | 274,363 | | | $ | 369,289 | | | $ | 510,929 | |
| EBITDA from Ongoing Operations | EBITDA from Ongoing Operations | | EBITDA from Ongoing Operations | |
| Aluminum Extrusions: | Aluminum Extrusions: | | Aluminum Extrusions: | |
| Ongoing operations: | Ongoing operations: | | Ongoing operations: | |
| EBITDA | EBITDA | $ | 12,071 | | | $ | 12,038 | | | $ | 57,885 | | | $ | 45,062 | | EBITDA | $ | 10,217 | | | $ | 21,895 | | | $ | 24,855 | | | $ | 45,814 | |
| Depreciation & amortization | Depreciation & amortization | (4,416) | | | (3,900) | | | (12,846) | | | (12,062) | | Depreciation & amortization | (4,158) | | | (4,169) | | | (8,569) | | | (8,430) | |
| EBIT | EBIT | 7,655 | | | 8,138 | | | 45,039 | | | 33,000 | | EBIT | 6,059 | | | 17,726 | | | 16,286 | | | 37,384 | |
| Plant shutdowns, asset impairments, restructurings and other | Plant shutdowns, asset impairments, restructurings and other | (32) | | | (160) | | | (120) | | | (223) | | Plant shutdowns, asset impairments, restructurings and other | 155 | | | 16 | | | (339) | | | (89) | |
| PE Films: | PE Films: | | PE Films: | |
| Ongoing operations: | Ongoing operations: | | Ongoing operations: | |
| EBITDA | EBITDA | 431 | | | 4,821 | | | 14,543 | | | 21,035 | | EBITDA | 814 | | | 7,065 | | | 2,663 | | | 14,112 | |
| Depreciation & amortization | Depreciation & amortization | (1,579) | | | (1,591) | | | (4,733) | | | (4,681) | | Depreciation & amortization | (1,552) | | | (1,559) | | | (3,195) | | | (3,154) | |
| EBIT | EBIT | (1,148) | | | 3,230 | | | 9,810 | | | 16,354 | | EBIT | (738) | | | 5,506 | | | (532) | | | 10,958 | |
| Plant shutdowns, asset impairments, restructurings and other | Plant shutdowns, asset impairments, restructurings and other | (498) | | | (182) | | | (650) | | | (457) | | Plant shutdowns, asset impairments, restructurings and other | — | | | (50) | | | 2 | | | (153) | |
| Goodwill impairment | | Goodwill impairment | (15,413) | | | — | | | (15,413) | | | — | |
| Flexible Packaging Films: | Flexible Packaging Films: | | Flexible Packaging Films: | |
| Ongoing operations: | Ongoing operations: | | Ongoing operations: | |
| EBITDA | EBITDA | 7,830 | | | 7,396 | | | 20,495 | | | 25,296 | | EBITDA | 249 | | | 7,631 | | | 1,599 | | | 12,665 | |
| Depreciation & amortization | Depreciation & amortization | (590) | | | (493) | | | (1,723) | | | (1,466) | | Depreciation & amortization | (711) | | | (583) | | | (1,411) | | | (1,132) | |
| EBIT | EBIT | 7,240 | | | 6,903 | | | 18,772 | | | 23,830 | | EBIT | (462) | | | 7,048 | | | 188 | | | 11,533 | |
| Plant shutdowns, asset impairments, restructurings and other | Plant shutdowns, asset impairments, restructurings and other | (6) | | | (7) | | | (86) | | | 8,407 | | Plant shutdowns, asset impairments, restructurings and other | (1) | | | (37) | | | (79) | | | (80) | |
| Total | Total | 13,211 | | | 17,922 | | | 72,765 | | | 80,911 | | Total | (10,400) | | | 30,209 | | | 113 | | | 59,553 | |
| Interest income | Interest income | 9 | | | 8 | | | 41 | | | 40 | | Interest income | 30 | | | 3 | | | 74 | | | 32 | |
| Interest expense | Interest expense | 1,138 | | | 842 | | | 3,158 | | | 2,555 | | Interest expense | 2,374 | | | 1,234 | | | 4,686 | | | 2,020 | |
| Gain on investment in kaléo | Gain on investment in kaléo | — | | | 279 | | | 1,406 | | | 1,197 | | Gain on investment in kaléo | — | | | 1,406 | | | 262 | | | 1,406 | |
| Stock option-based compensation costs | Stock option-based compensation costs | 271 | | | 675 | | | 1,153 | | | 1,819 | | Stock option-based compensation costs | — | | | 251 | | | 231 | | | 882 | |
| Corporate expenses, net | Corporate expenses, net | 9,674 | | | 8,555 | | | 30,187 | | | 30,470 | | Corporate expenses, net | 9,509 | | | 9,708 | | | 18,466 | | | 20,463 | |
| Income (loss) from continuing operations before income taxes | 2,137 | | | 8,137 | | | 39,714 | | | 47,304 | | |
| Income (loss) before income taxes | | Income (loss) before income taxes | (22,253) | | | 20,425 | | | (22,934) | | | 37,626 | |
| Income tax expense (benefit) | Income tax expense (benefit) | 1,125 | | | 1,908 | | | 7,460 | | | 10,728 | | Income tax expense (benefit) | (3,331) | | | 5,556 | | | (3,000) | | | 6,334 | |
| Income (loss) from continuing operations | 1,012 | | | 6,229 | | | 32,254 | | | 36,576 | | |
| Income (loss) from discontinued operations, net of tax | 21 | | | (26) | | | 68 | | | (104) | | |
| Net income (loss) | Net income (loss) | $ | 1,033 | | | $ | 6,203 | | | $ | 32,322 | | | $ | 36,472 | | Net income (loss) | $ | (18,922) | | | $ | 14,869 | | | $ | (19,934) | | | $ | 31,292 | |
The following table presents identifiable assets by segment at SeptemberJune 30, 20222023 and December 31, 2021:2022: | | (In thousands) | (In thousands) | September 30, 2022 | | December 31, 2021 | (In thousands) | June 30, 2023 | | December 31, 2022 |
| Aluminum Extrusions | Aluminum Extrusions | $ | 302,392 | | | $ | 280,521 | | Aluminum Extrusions | $ | 266,426 | | | $ | 293,308 | |
| PE Films | PE Films | 105,434 | | | 113,613 | | PE Films | 82,191 | | | 102,431 | |
| Flexible Packaging Films | Flexible Packaging Films | 96,676 | | | 75,269 | | Flexible Packaging Films | 91,568 | | | 103,448 | |
| Subtotal | Subtotal | 504,502 | | | 469,403 | | Subtotal | 440,185 | | | 499,187 | |
| General corporate | General corporate | 22,755 | | | 23,482 | | General corporate | 23,491 | | | 23,674 | |
| Cash and cash equivalents | Cash and cash equivalents | 19,250 | | | 30,521 | | Cash and cash equivalents | 21,193 | | | 19,232 | |
| Discontinued operations | 151 | | | 178 | | |
| Total | Total | $ | 546,658 | | | $ | 523,584 | | Total | $ | 484,869 | | | $ | 542,093 | |
The following tables disaggregate the Company’s revenue by geographic area and product group for the three and ninesix months ended SeptemberJune 30, 20222023 and 2021:2022: | | Net Sales by Geographic Area (a) | Net Sales by Geographic Area (a) | Net Sales by Geographic Area (a) |
| | Three Months Ended September 30, | | Nine Months Ended September 30, | | Three Months Ended June 30, | | Six Months Ended June 30, |
| (In thousands) | (In thousands) | 2022 | | 2021 | | 2022 | | 2021 | (In thousands) | 2023 | | 2022 | | 2023 | | 2022 |
| United States | United States | $ | 181,405 | | | $ | 157,969 | | | $ | 577,496 | | | $ | 447,585 | | United States | $ | 133,417 | | | $ | 213,955 | | | $ | 284,027 | | | $ | 396,092 | |
| Exports from the United States to: | Exports from the United States to: | | Exports from the United States to: | |
| Asia | Asia | 7,437 | | | 12,609 | | | 34,582 | | | 43,129 | | Asia | 5,477 | | | 14,680 | | | 11,209 | | | 27,145 | |
| Latin America | Latin America | 2,138 | | | 1,170 | | | 4,824 | | | 3,630 | | Latin America | 1,817 | | | 1,245 | | | 3,676 | | | 2,686 | |
| Canada | Canada | 4,065 | | | 4,107 | | | 12,431 | | | 14,145 | | Canada | 4,955 | | | 4,173 | | | 9,239 | | | 8,366 | |
| Europe | Europe | 1,016 | | | 1,343 | | | 3,464 | | | 3,323 | | Europe | 272 | | | 1,085 | | | 1,132 | | | 2,448 | |
| Operations outside the United States: | Operations outside the United States: | | Operations outside the United States: | |
| Brazil | Brazil | 32,925 | | | 25,055 | | | 87,999 | | | 73,125 | | Brazil | 24,975 | | | 28,189 | | | 46,603 | | | 55,074 | |
| Asia | | Asia | 55 | | | — | | | 160 | | | — | |
| Total | Total | $ | 228,986 | | | $ | 202,253 | | | $ | 720,796 | | | $ | 584,937 | | Total | $ | 170,968 | | | $ | 263,327 | | | $ | 356,046 | | | $ | 491,811 | |
| (a) Export sales relate entirely to PE Films. Operations in Brazil relate entirely to Flexible Packaging Films. | |
| (a) Export sales relate mostly to PE Films. Operations in Brazil relate to Flexible Packaging Films. | | (a) Export sales relate mostly to PE Films. Operations in Brazil relate to Flexible Packaging Films. |
The Company’s facilities in Pottsville, PA (“PV”) and Guangzhou, China (“GZ”) have a tolling arrangement whereby certain surface protection films are manufactured in GZ for a fee with raw materials supplied from PV that are then shipped by GZ directly to customers principally in the Asian market, but paid by customers directly to PV. Amounts associated with this intercompany tolling arrangement are reported in the table above as export sales from the U.S. to Asia, and include net sales of $4.4$3.4 million and $7.4$5.3 million in the third quarterssecond quarter of 20222023 and 2021,2022, respectively, and $16.1$6.8 million and $25.0$11.7 million in the first ninesix months of 20222023 and 2021,2022, respectively.
| | Net Sales by Product Group | Net Sales by Product Group | Net Sales by Product Group |
| | Three Months Ended September 30, | | Nine Months Ended September 30, | | Three Months Ended June 30, | | Six Months Ended June 30, |
| (In thousands) | (In thousands) | 2022 | | 2021 | | 2022 | | 2021 | (In thousands) | 2023 | | 2022 | | 2023 | | 2022 |
| Aluminum Extrusions: | Aluminum Extrusions: | | Aluminum Extrusions: | |
| Nonresidential building & construction | Nonresidential building & construction | $ | 86,659 | | | $ | 68,590 | | | $ | 266,882 | | | $ | 195,941 | | Nonresidential building & construction | $ | 65,784 | | | $ | 99,302 | | | $ | 144,413 | | | $ | 180,223 | |
| Consumer durables | Consumer durables | 16,714 | | | 12,873 | | | 52,409 | | | 39,611 | | Consumer durables | 11,714 | | | 18,805 | | | 22,061 | | | 35,695 | |
| Automotive | Automotive | 11,543 | | | 10,150 | | | 39,857 | | | 32,750 | | Automotive | 11,769 | | | 14,473 | | | 23,891 | | | 28,314 | |
| Residential building & construction | Residential building & construction | 15,136 | | | 13,154 | | | 52,549 | | | 39,755 | | Residential building & construction | 10,056 | | | 20,948 | | | 21,659 | | | 37,413 | |
| Electrical | Electrical | 4,730 | | | 8,015 | | | 21,704 | | | 24,767 | | Electrical | 6,078 | | | 9,687 | | | 14,207 | | | 16,974 | |
| Machinery & equipment | Machinery & equipment | 20,028 | | | 11,611 | | | 48,902 | | | 31,190 | | Machinery & equipment | 11,082 | | | 15,929 | | | 21,806 | | | 28,874 | |
| Distribution | Distribution | 6,839 | | | 12,693 | | | 27,763 | | | 30,478 | | Distribution | 5,344 | | | 11,164 | | | 7,160 | | | 20,924 | |
| Subtotal | Subtotal | 161,649 | | | 137,086 | | | 510,066 | | | 394,492 | | Subtotal | 121,827 | | | 190,308 | | | 255,197 | | | 348,417 | |
| PE Films: | PE Films: | | PE Films: | |
| Surface protection films | Surface protection films | 13,018 | | | 20,905 | | | 58,839 | | | 65,997 | | Surface protection films | 8,643 | | | 23,674 | | | 21,497 | | | 45,822 | |
| Overwrap packaging | Overwrap packaging | 7,041 | | | 7,596 | | | 23,774 | | | 21,888 | | Overwrap packaging | 7,275 | | | 7,750 | | | 14,602 | | | 16,733 | |
| Subtotal | Subtotal | 20,059 | | | 28,501 | | | 82,613 | | | 87,885 | | Subtotal | 15,918 | | | 31,424 | | | 36,099 | | | 62,555 | |
| Flexible Packaging Films | Flexible Packaging Films | 47,278 | | | 36,666 | | | 128,117 | | | 102,560 | | Flexible Packaging Films | 33,223 | | | 41,595 | | | 64,750 | | | 80,839 | |
| Total | Total | $ | 228,986 | | | $ | 202,253 | | | $ | 720,796 | | | $ | 584,937 | | Total | $ | 170,968 | | | $ | 263,327 | | | $ | 356,046 | | | $ | 491,811 | |
11. DIVESTITURESSUPPLY CHAIN FINANCING
Personal Care Films
In 2020,The Company has supply chain finance service agreements with third-party financial institutions to provide platforms that facilitate the ability of participating suppliers to finance payment obligations from the Company completedwith the sale of Personal Care Films for an aggregate purchase price of $60.5 million, subjectthird-party financial institution. The Company’s obligations to customary adjustments. The Company agreed to provide certain transition services relatedits suppliers, including amounts due and scheduled payment dates, are not affected by suppliers’ decisions to finance human resourcesamounts under the supply chain finance agreements. As of June 30, 2023 and information technology ("IT") that ended duringDecember 31, 2022, $14.6 million and $25.9 million, respectively, of the second quarterCompany’s accounts payable were financed by participating suppliers through third-party financial institutions.
12. SUBSEQUENT EVENTS
Closure of 2021, resulting in final cash proceeds of $64.1 million. Personal CarePE Films was previously reported inTechnical Center
On August 3, 2023, the Company adopted a plan to close the PE Films segment.
technical center in Richmond, VA and reduce its efforts to develop and sell films supporting the semiconductor market. Future research & development activities for PE Films will be performed at the facility in Pottsville, PA. PE Films continues to have new business opportunities primarily relating to surface protection films that protect components of flat panel and flexible displays. The following table summarizesCompany anticipates all activities to cease at the financial resultsPE Films technical center in Richmond, VA, by the end of discontinued operations reflected2023. The Company expects to recognize cash costs associated with exit activities of $1.8 million for: (i) severance and related costs ($0.9 million), (ii) vacating the facility lease ($0.6 million payable through June 2025), and (iii) building closure costs ($0.3 million). In addition, the Company expects non-cash asset write-offs and accelerated depreciation of up to $4.5 million. Net annual cash savings of $3.4 million are anticipated, beginning in the condensed consolidated statementsfourth quarter of income2023.
Entry into an Amendment to the Credit Agreement and Suspension of Regular Quarterly Dividend
Subsequent to June 30, 2023, to reduce the risk of potential violations of the primary financial restrictive covenants in its five-year, revolving, secured credit facility that matures on June 29, 2027 (the "Credit Agreement"), the Company (i) suspended its regular quarterly dividend (which had an annual cash outlay of approximately $17.7 million) and (ii) amended the Credit Agreement, effective August 3, 2023, to:
a.Change the fiscal quarter maximum Total Net Leverage Ratio covenant from 4.0x to: (i) 5.0x for the three and nine months endedquarters ending September 30, 20222023 through March 31, 2024, (ii) 4.75x for the quarter ending June 30, 2024, (iii) 4.25 for the quarter ending September 30, 2024, and 2021:(iv) 4.0x for the quarter ending December 31, 2024 and thereafter. | | | | | | | | | | | | | | | | | | | | | | | |
| Three Months Ended September 30, | | Nine Months Ended September 30, |
| (In thousands) | 2022 | | 2021 | | 2022 | | 2021 |
| Costs and expenses: | | | | | | | |
| Selling, general and administrative | (49) | | | 33 | | | (86) | | | 1,251 | |
Adjustment to the fair value estimates used in the disposal of Personal Care Films(a) | — | | | — | | | — | | | (1,118) | |
| Total | (49) | | | 33 | | | (86) | | | 133 | |
| Income (loss) from discontinued operations before income taxes | 49 | | | (33) | | | 86 | | | (133) | |
| Income tax expense (benefit) | 28 | | | (7) | | | 18 | | | (29) | |
| Income (loss) from discontinued operations, net of tax | $ | 21 | | | $ | (26) | | | $ | 68 | | | $ | (104) | |
| (a) Represents a net increase to the estimated fair value of Personal Care Films primarily due to lower costs associated with IT transition-related services to provide the seller developed assets, which did not exist at the time of the sale, to support the seller's IT infrastructure. |
b.Change the fiscal quarter minimum Interest Coverage Ratio covenant from 3.0x to: (i) 2.50x for the quarters ending September 30, 2023 through June 30, 2024, (ii) 2.75x for the quarter ending September 30, 2024, and (iii) 3.0x for the quarter ending December 31, 2024 and thereafter.
c.Reduce the maximum borrowing availability from $375 million to $200 million.
d.Increase the drawn spread by 25 basis points across all levels of the interest rate pricing grid, beginning the quarter ending September 30, 2023.
e.Amend the restricted payments covenant to prohibit dividends and share repurchases during fiscal quarters ending September 30, 2023 through December 31, 2024.
The assets and liabilities of the discontinued operations reflected in the condensed consolidated balance sheets as of September 30, 2022 and December 31, 2021, respectively, were as follows: | | | | | | | | | | | |
| September 30, | | December 31, |
| (In thousands) | 2022 | | 2021 |
| Assets | | | |
Prepaid expenses and other (a) | $ | 151 | | | $ | 178 | |
| | | |
| Liabilities | | | |
Accrued expenses (a) | $ | 71 | | | $ | 193 | |
| (a) The condensed consolidated balance sheet of discontinued operations as of September 30, 2022 includes $0.2 million of other receivables related to the settlement of customary post-closing adjustments and other miscellaneous accrued expenses of $0.1 million. The condensed consolidated balance sheet of discontinued operations as of December 31, 2021 includes $0.2 million of other receivables related to the settlement of customary post-closing adjustments and other miscellaneous accrued expenses of $0.2 million. |
The following table provides significant operating and investing cash flow information for discontinued operations: | | | | | | | | | | | |
| Nine Months Ended September 30, |
| (In thousands) | 2022 | | 2021 |
| Operating activities | | | |
| Other | — | | | (1,118) | |
Assets Held For Sale
In July 2019, the Company committed to a plan to close its manufacturing facility in Lake Zurich, Illinois, which historically was reported by the Company within the Personal Care Films component of its PE Films segment. During the third quarter of 2020, the disposal group carrying value of $4.6 million was reported in "Prepaid expenses and other" in the consolidated balance sheet as the held for sale criteria was met. During the third quarter of 2021, the Company completed the sale of the remaining assets in Lake Zurich, Illinois resulting in total cash proceeds of $4.7 million.
12. INVESTMENTS
In August 2007 and December 2008, the Company made an aggregate investment of $7.5 million in kaleo, Inc. (“kaléo”), a privately held specialty pharmaceutical company dedicated to building innovative solutions for serious and life-threatening medical conditions. Tredegar historically accounted for its investment in kaléo under the fair value option. At the time of the initial investment, the Company elected the fair value option of accounting since its investment objectives were similar to those of venture capitalists, which typically do not have controlling financial interests. kaléo’s stock is not publicly traded.
In the first nine months ended September 30, 2021, a pre-tax gain of $1.2 million was recognized on the Company’s investment in kaléo, which included a $0.3 million dividend received from kaléo. On December 27, 2021, the Company completed the sale of its investment interests in kaléo (Series A-3 Preferred Stock, Series B Preferred Stock and common stock) and received closing cash proceeds of $47.1 million. Subsequently, in May 2022, additional cash consideration of $1.4 million was received related to customary post-closing adjustments, which is reported in “Other income (expense), net” in the condensed consolidated statements of income.
13. DEBT
On June 29, 2022, Tredegar entered into a Second Amended and Restated Credit Agreement (the “Credit Agreement”) that replaced its existing $375 million five-year, secured revolving credit facility that was due to expire on June 28, 2024. The Credit Agreement is a five-year, revolving, secured credit facility that permits aggregate borrowings of $375 million and matures on June 29, 2027.
Borrowings under the Credit Agreement bear an interest rate equal to Secured Overnight Financing Rate ("SOFR") plus a credit spread adjustment of 10 basis points ("Adjusted Term SOFR Rate") and an amount depending on the type of borrowing and commitment fees charged on the unused amount under the Credit Agreement at various Total Net Leverage Ratio levels as follows: | | | | | | | | |
| Pricing Under the Credit Agreement (Basis Points) |
| Total Net Leverage Ratio | Term Benchmark Spread | Commitment
Fee |
| <= 1.0x | 150.0 | | 20 | |
| >1.0x but <=2.0x | 162.5 | | 25 | |
| >2.0x but <=3.0x | 175.0 | | 30 | |
| >3.0x but <=3.5x | 187.5 | | 35 | |
| >3.5x | 200.0 | | 40 | |
At September 30, 2022, $124.0 million of the outstanding debt was principally priced at an interest rate equal to the Adjusted Term SOFR Rate plus the applicable credit spread of 150.0 basis points. Prior to the Credit Agreement, the interest rate was based on London Inter-Bank Offered Rate plus an applicable credit spread.
The primary restrictive covenants in the Credit Agreement include:
•Total Net Leverage Ratio of 4.00x;
•Interest Coverage Ratio of 3.00x; and
•Unlimited payments for dividends and stock repurchases during the term of the Credit Agreement so long as the Total Net Leverage Ratio is equal to or less than 2.00x, and otherwise restrictions on payments for dividends and stock repurchases for the term of the Credit Agreement at $75 million (provided that the $75 million basket will reset at the end of each fiscal quarter when the Total Net Leverage ratio is less than or equal to 2.00x).
Under the Credit Agreement:
•Total Net Leverage Ratio is defined as the ratio of (a)(i) total indebtedness minus (ii) liquidity (the lesser of $50,000,000 and the aggregate amount of cash and cash equivalents) to (b) EBITDA (as defined in Credit Agreement "Credit EBITDA"); and
•Interest Coverage Ratio is defined as the ratio of (a) Credit EBITDA to (b) interest expense.
The Credit Agreement is secured by substantially all of the Company’s and its domestic subsidiaries’ assets, including equity in certain material first-tier foreign subsidiaries. Tredegar was in compliance with all of its debt covenants as of September 30, 2022. Noncompliance with any of the debt covenants may have a material adverse effect on its financial condition or liquidity, in the event such noncompliance cannot be cured or should the Company be unable to obtain a waiver from the lenders. Renegotiation of the covenant through an amendment to the Credit Agreement may effectively cure the noncompliance, but may have an effect on its financial condition or liquidity depending upon how the covenant is renegotiated.
Item 2. Management’s Discussion and Analysis of Financial Condition and Results of Operations.
Forward-looking and Cautionary Statements
Some of the information contained in this Quarterly Report on Form 10-Q ("Form 10-Q") may constitute “forward-looking statements” within the meaning of the “safe harbor” provisions of the Private Securities Litigation Reform Act of 1995. When the Company uses the words “believe,” “estimate,” “anticipate,” “appear to,” “expect,” “project,” “plan,” “likely,” “may” and similar expressions, it does so to identify forward-looking statements. Such statements are based on the Company's then current expectations and are subject to a number of risks and uncertainties that could cause actual results to differ materially from those addressed in the forward-looking statements. It is possible that the Company's actual results and financial condition may differ, possibly materially, from the anticipated results and financial condition indicated in or implied by these forward-looking statements. Accordingly, you should not place undue reliance on these forward-looking statements. Factors that could cause actual results to differ materially from expectations include, without limitation, the following:
•loss or gain of sales to significant customers on which the Company’s business is highly dependent;
•inability to achieve sales to new customers to replace lost business;
•inability to develop, efficiently manufacture and deliver new products at competitive prices;
•failure of the Company’s customers to achieve success or maintain market share;
•failure to protect our intellectual property rights;
•risks of doing business in countries outside the U.S. that affect our international operations;
•political, economic, and regulatory factors concerning the Company’s products;
•uncertain economic conditions in countries in which the Company does business, including continued high inflation and the effects of the Russian invasion of Ukraine;
•competition from other manufacturers, including manufacturers in lower-cost countries and manufacturers benefiting from government subsidies;
•impact of fluctuations in foreign exchange rates;
•movement of pension plan assets and liabilities up through initiating hedging activities to fix underfunding amounts and assumptions thereafter relating to differences between the ultimate settlement benefit obligation and the projected benefit obligation, census data, administrative costs, and the effectiveness of hedging activities and discounts required to liquidate non-public securities held by the plan;activities;
•an increase in the operating costs incurred by the Company’s business units, including, for example, the cost of raw materials and energy;
•unanticipated problems or delays with the implementation of an enterprise resource planning and manufacturing executions systems, or security breaches and other disruptions to the Company's information technology infrastructure;
•inability to successfully identify, complete or integrate strategic acquisitions; failure to realize the expected benefits of such acquisitions and assumption of unanticipated risks in such acquisitions;
•disruptions to the Company’s manufacturing facilities, including those resulting from labor shortages;
•failure to continue to attract, develop and retain certain key officers or employees;
•noncompliance with any of the financial and other restrictive covenants in the Company's revolving credit facility;
•the impact of public health epidemics on employees, production and the global economy, such as the COVID-19 pandemic;
•an information technology system failure or breach;
•the impact of the imposition of tariffs and sanctions on imported aluminum ingot used by Bonnell Aluminum;
•the impact of new tariffs, duties or other trade restrictions imposed as a result of trade tensions between the U.S. and other countries;
•the termination of anti-dumping duties on products imported to Brazil that compete with products produced by Flexible Packaging;
•impairment of the Surface Protection reporting unit's goodwill;
•failure to establish and maintain effective internal control over financial reporting;
and the other factors discussed in the reports Tredegar files with or furnishes to the Securities and Exchange Commission (the “SEC”) from time to time, including the risks and important factors set forth in additional detail in Part I, Item 1A of Tredegar’s Annual Report on Form 10-K for the year ended December 31, 20212022 (the “2021“2022 Form 10-K”). and Part II, Item 1A of this Form 10-Q. Readers are urged to review and consider carefully the disclosures Tredegar makes in its filings with the SEC.
Tredegar does not undertake, and expressly disclaims any duty, to update any forward-looking statement to reflect any change in management’s expectations or any change in conditions, assumptions or circumstances on which such statements are based, except as required by applicable law.
References herein to “Tredegar,” “the Company,” “we,” “us” and “our” are to Tredegar Corporation and its subsidiaries, collectively, unless the context otherwise indicates or requires.
Unless otherwise stated or indicated, all comparisons are to the prior year period. References to "Notes" are to notes to our condensed consolidated financial statements found in Part I, Item 1 of this Form 10-Q.
Critical Accounting Policies and Estimates
In the ordinary course of business, the Company makes a number of estimates and assumptions relating to the reporting of results of operations and financial position in the preparation of financial statements in conformity with GAAP.generally accepted accounting standards in the United States ("GAAP"). The Company believes the estimates, assumptions and judgments described in the section “Management’s Discussion and Analysis of Financial Condition and Results of Operations – Critical Accounting Policies and Estimates” in the 20212022 Form 10-K have the greatest potential impact on our financial statements, so Tredegar considers these to be its critical accounting policies. Since December 31, 2021,2022, there have been no changes in these policies or estimates that have had a material impact on our results of operations or financial position.
Business Overview
Tredegar Corporation is an industrial manufacturer with three primary businesses: custom aluminum extrusions for the North American building and construction ("B&C"), automotive and specialty end-use markets through its Aluminum Extrusions segment; surface protection films for high-technology applications in the global electronics industry through its PE Films segment; and specialized polyester films primarily for the Latin American flexible packaging market through its Flexible Packaging Films segment. With approximately 2,3001,800 employees, the Company operates manufacturing facilities in North America, South America, and Asia.
Earnings before interest, taxes, depreciation and amortization ("EBITDA") from ongoing operations is the measure of segment profit and loss used by Tredegar’s chief operating decision maker ("CODM") for purposes of assessing financial performance. The Company uses sales less freight (“net sales”) from continuing operations as its measure of revenues from external customers at the segment level. This measure is separately included in the financial information regularly provided to the CODM.
Earnings before interest and taxes ("EBIT") from ongoing operations is a non-GAAP financial measure included in the reconciliation of segment financial information to consolidated results for the Company.Company in Note 10. It is not intended to represent the stand-alone results for Tredegar's ongoing operations under generally accepted accounting standards in the United States ("GAAP")GAAP and should not be considered as an alternative to net income as defined by GAAP. We believe that EBIT is a widely understood and utilized metric that is meaningful to certain investors and that including this financial metric in the reconciliation of management’s performance metric, EBITDA from ongoing operations, provides useful information to those investors that primarily utilize EBIT to analyze the Company’s core operations.
Third Quarter Financial Results Highlights
ThirdSecond quarter 20222023 net income from continuing operations(loss) was $1.0$(18.9) million ($0.03(0.56) per diluted share) compared with net income from continuing operations(loss) of $6.2$14.9 million ($0.190.44 per diluted share) in the thirdsecond quarter of 2021.2022.
Second Quarter Financial Results Highlights
•EBITDA from ongoing operations for Aluminum Extrusions was $10.2 million in the second quarter of $12.12023 versus $21.9 million in the second quarter of last year. EBITDA from ongoing operations during the last four quarters has been weak, in a range of $8.9 to $14.6 million.
◦Sales volume of 35.5 million pounds in the second quarter of 2023 was relatively consistent with the thirdfirst quarter of 20212023 and the fourth quarter of 2022 but declined significantly versus 49.0 million pounds in the second quarter of last year.
◦Open orders at the end of the second quarter of 2023 were 20 million pounds (versus 27 million pounds at the end of the first quarter of 2023), which is below the quarterly range of 21 to 27 million pounds in 2019 before pandemic-related disruptions that resulted in excessive open orders, which peaked in the first quarter of 2022 at approximately 100 million pounds.
◦While open orders have declined over the past year, Aluminum Extrusions has realized three sequential quarters of net booking growth.
•EBITDA from ongoing operations for PE Films of $0.4was $0.8 million was $4.4 million lower thanin the thirdsecond quarter of 20212023 versus $7.1 million in the second quarter of 2022 as very weak conditions persisted in the consumer electronics market. EBITDA from ongoing operations during the last four quarters has been low with a range of negative $2.6 million to positive $1.8 million.
•EBITDA from ongoing operations for Flexible Packaging Films of $7.8was $0.2 million was $0.4 million higher thanduring the thirdsecond quarter of 2021
Given recessionary concerns and recent2023 versus $7.6 million in the second quarter of 2022 primarily due to lower sales volume, which the Company believes is mainly due to customer inventory corrections, lower margins and unfavorable cost variances.
The Company recognized a net loss for the second quarter of 2023, with all business segments and their respective markets experiencing depressed conditions, which the Company believes can be traced to the residual impact of the pandemic.
The timing of recovery for our businesses remains uncertain and has been slow in occurring. Debt, net of cash, declined during the third quarter as a result of 2022, the outlook for demand for Aluminum Extrusions’ and PE Films’ products remains uncertain.improvements in working capital, with further improvements anticipated by year end.
Other losses related to asset impairments and costs associated with exit and disposal activities for continuing operations were not material for the three and six months ended SeptemberJune 30, 20222023 and 2021,2022, respectively. Gains and losses associated with plant shutdowns, asset impairments, restructurings and other items are described in Results of Operations below.
Results of Operations
ThirdSecond Quarter of 20222023 Compared with the ThirdSecond Quarter of 20212022
The following table presents a bridge of consolidated net income (loss) from continuing operations from third quarter of 2021 to thirdthe second quarter of 2022 to the second quarter of 2023 with management's related management's discussion and analysis below the table.
| | | | | | | | |
| (In thousands) | | |
Net income from continuing operations(loss) for the three months ended SeptemberJune 30, 20212022 | | $ | 6,22914,869 | |
| Income tax expense (benefit) | | 1,9085,556 | |
Income (loss) from continuing operations before income taxes for the three months ended SeptemberJune 30, 20212022 | | 8,13720,425 | |
| Increase (decrease) in income from increases (decreases) in the following items: | | |
| Sales | | 28,969 (96,196) | |
| Other income (expense), net | | (272)(1,362) | |
| Total | | 28,697 (97,558) | |
| Increase (decrease) in income from (increases) decreases in the following items: | | |
| Cost of goods sold | | (29,826)64,821 | |
| Freight | | (2,236)3,837 | |
| Selling, general and administrative | | (2,251)1,973 | |
| Goodwill impairment | | (15,413) | |
| Other | | (384)(338) | |
| Total | | (34,697)54,880 | |
Income (loss) from continuing operations before income taxes for the three months ended SeptemberJune 30, 20222023 | | 2,137 (22,253) | |
| Income tax expense (benefit) | | 1,125 (3,331) | |
Net income from continuing operations(loss) for the three months ended SeptemberJune 30, 20222023 | | $ | 1,012 (18,922) | |
Sales in the thirdsecond quarter of 2022 increased2023 decreased by $29.0$96.2 million compared with the thirdsecond quarter of 2021.2022. Net sales (sales less freight) in Aluminum Extrusions increased $24.6decreased $68.5 million, primarily due to lower sales volume and the pass-through of lower metal costs, partially offset by an increase in average selling prices to cover higher operating costs, partially offset by the pass-through of lower metal costs. Net sales in PE Films decreased $8.4$15.5 million, primarily due to weakeningcontinuing weak market demand competitive pricing and unfavorable product mix. Net sales in Flexible Packaging Films increased $10.6decreased $8.4 million, primarily due to higherlower sales volume, and higherlower selling prices from the pass-through of higherlower resin costs higher sales volume and favorableunfavorable product mix. For more information on net sales and volume, see the Segment Operations Review below.
Other income (expense), net forwas $(20) thousand in the thirdsecond quarter ended September 30,of 2023 compared to other income (expense), net of $1.3 million in the second quarter of 2022. The change in other income (expense), net is primarily due to cash consideration of $1.4 million received in May 2022 remained consistent withrelated to the third quartercustomary post-closing adjustments on the sale of the investment in kaleo, Inc. ("kaléo"), which was sold in December 2021. See Note 5 for additional information.
Consolidated gross profit (sales minus cost of goods sold and freight) as a percentage of sales (gross profit margin) was 11.9%9.9% in the thirdsecond quarter of 20222023 compared to 15.0%16.5% in the thirdsecond quarter of 2021.2022. The gross profit margin in Aluminum Extrusions decreased primarily due to lower sales volume, higher labor and employee-related costs, lower labor productivity, lower pricing and higher supply expense higherassociated with inflationary costs, partially offset by lower utility costs and higherlower freight rates. Additionally, the timing of the flow through under the first-in first-out method of aluminum raw material costs passed through to customers, previously acquired at higher prices in a quickly changing commodity pricing environment, resulted in a charge of $1.3 million in the thirdsecond quarter of 20222023 versus a benefitcharge of $1.6 million in the thirdsecond quarter of 2021. In addition, the Company recorded an out-of-period adjustment of $2.5 million related to inventory and accrued labor costs.2022. The gross profit margin in PE Films decreased primarily due to a lower Surface Protection contribution margin for non-transitioning products associated with a market slowdown, and customer inventory corrections competitiveand the pass-through lag associated with resin costs, partially offset by overwrap films favorable pricing and previously disclosed customer product transitions.mix. The gross profit margin in Flexible Packaging Films decreased primarily due to higher raw material costs and higher fixed costs, partially offset by higherlower selling prices from the pass-through of higherlower resin costs higherand margin pressures, lower sales volume, favorablehigher fixed costs, higher variable costs and unfavorable product mix, andpartially offset by lower variableraw material costs.
As a percentage of sales, selling, general and administrative (“SG&A”) and research and development ("R&D") expenses were 8.6%10.3% in the thirdsecond quarter of 2022,2023 compared with 8.8%7.5% in the thirdsecond quarter of 2021.2022. While thirdsecond quarter SG&A expenses increased and sales increaseddecreased year-over-year, R&D expenses remained relatively consistent with the prior year. Higheryear period. Lower SG&A spending is primarily due to lower accruals for employee-related compensation and lower stock-based compensation, partially offset by higher professional fees associated with remediation activities related tobusiness development activities.
In the Company's previously disclosed material weaknessessecond quarter of 2023, a non-cash partial goodwill impairment of $15.4 million was recognized, see the PE Films section in internal control over financial reporting and higher employee-related compensation.
below for more information.The effective tax rate used to compute income taxes for continuing operations in the thirdsecond quarter of 20222023 was 52.6%15.0%, compared to 23.5%27.3% in the thirdsecond quarter of 2021.2022. The increasechange in the effective tax rate for continuing operations is primarily due to the implementation of new U.S. tax regulations associated with foreign tax credits published by the U.S. Treasury and Internal Revenue Service on January 4, 2022. These regulations overhaul various components of the foreign tax credit regime, including the determination of creditable foreign taxes, and limit the amount of foreign taxes that are creditable against U.S. income taxes. Brazilian income tax is no longer creditablea pre-tax loss in the U.S.three months ending June 30, 2023 versus pre-tax income in the three months ending June 30, 2022, lower Brazil tax incentives and a discrete charge in the second quarter of 2023 for the foreseeable future under these regulations.a Brazil tax law change. See Note 9 for additional information.
Pre-tax gains and losses associated with plant shutdowns, asset impairments, restructurings and other items for continuing operations in the thirdsecond quarters of 20222023 and 20212022 detailed below are shown in the statements of net sales and EBITDA from ongoing operations by segment table in Note 10 and are included in “Asset impairments and costs associated with exit and disposal activities, net of adjustments” in the condensed consolidated statements of income, unless otherwise noted. | | | | | | | | |
| Three Months Ended September 30, |
| (In millions) | 2022 | 2021 |
| Aluminum Extrusions: | | |
| (Gains) losses from sale of assets, investment writedowns and other items: | | |
Environmental charges at Newnan, Georgia plant3 | $ | — | | $ | 0.1 | |
COVID-19-related expenses, net of relief1 | — | | 0.1 | |
| Total for Aluminum Extrusions | $ | — | | $ | 0.2 | |
| PE Films: | | |
| (Gains) losses associated with plant shutdowns, asset impairments and restructurings: | | |
| Other restructuring costs - severance | $ | 0.5 | | $ | 0.1 | |
| (Gains) losses from sale of assets, investment writedowns and other items: | | |
COVID-19-related expenses1 | — | | 0.1 | |
| Total for PE Films | $ | 0.5 | | $ | 0.2 | |
| | |
| | |
| | |
| | |
| Corporate: | | |
| (Gains) losses associated with plant shutdowns, asset impairments and restructurings: | | |
| (Gain), net of costs associated with the sale of the Lake Zurich manufacturing facility assets | $ | — | | $ | (0.2) | |
| | |
| (Gains) losses from sale of assets, investment writedowns and other items: | | |
Professional fees associated with business development activities and other2 | — | | 0.7 | |
Professional fees associated with internal control over financial reporting2 | 0.8 | | 0.8 | |
| | |
Stock-based compensation expense associated with the fair value remeasurement of awards granted at the time of the 2020 special dividend2 | (0.1) | | (0.1) | |
Transition service fees, net of corporate costs associated with the divested Personal Care Films business1 | — | | 0.1 | |
Net periodic benefit cost for the frozen defined benefit pension plan in process of termination4 | 3.5 | | — | |
| Total for Corporate | $ | 4.2 | | $ | 1.3 | |
1. Included in “Other income (expense), net” in the condensed consolidated statements of income. 2. Included in “Selling, general and administrative expenses” in the condensed consolidated statements of income. 3. Included in “Costs of goods sold” in the condensed consolidated statements of income. 4. See “Corporate Expenses, Interest, & Other” below and Note 4 for additional information. |
| | | | | | | | |
| Three Months Ended June 30, |
| (In millions) | 2023 | 2022 |
| Aluminum Extrusions: | | |
| (Gains) losses from sale of assets, investment writedowns and other items: | | |
Storm damage to the Newnan, Georgia plant2 | $ | (0.2) | | $ | — | |
| Total for Aluminum Extrusions | $ | (0.2) | | $ | — | |
| PE Films: | | |
| (Gains) losses from sale of assets, investment writedowns and other items: | | |
COVID-19-related expenses1 | $ | — | | $ | 0.1 | |
| Goodwill impairment | 15.4 | | — | |
| Total for PE Films | $ | 15.4 | | $ | 0.1 | |
| | |
| | |
| | |
| | |
| Corporate: | | |
| (Gains) losses associated with plant shutdowns, asset impairments and restructurings: | | |
| Other restructuring costs - severance | $ | — | | $ | 0.1 | |
| (Gains) losses from sale of assets, investment writedowns and other items: | | |
Professional fees associated with business development activities2 | 1.6 | | 0.1 | |
Professional fees associated with remediation activities related to internal control over financial reporting2 | 0.5 | | 0.8 | |
Write-down of investment in Harbinger Capital Partners Special Situations Fund1 | 0.2 | | — | |
Stock-based compensation expense associated with the fair value remeasurement of awards granted at the time of the 2020 special dividend2 | (0.1) | | (0.2) | |
Net periodic benefit cost for the frozen defined benefit pension plan in process of termination3 | 3.4 | | 3.5 | |
| Total for Corporate | $ | 5.6 | | $ | 4.3 | |
1. Included in “Other income (expense), net” in the condensed consolidated statements of income. 2. Included in “Selling, general and administrative expenses” in the condensed consolidated statements of income. 3. See “Corporate Expenses, Interest, & Other” below and Note 4 for additional information. |
Average debt outstanding and interest rates were as follows: | | | Three Months Ended September 30, | | Three Months Ended June 30, |
| (In millions, except percentages) | (In millions, except percentages) | 2022 | | 2021 | (In millions, except percentages) | 2023 | | 2022 |
Floating-rate debt with interest charged on a rollover basis plus a credit spread1: | | |
| Floating-rate debt with interest charged on a rollover basis plus a credit spread: | | Floating-rate debt with interest charged on a rollover basis plus a credit spread: | |
| Average outstanding debt balance | Average outstanding debt balance | $ | 111.1 | | | $ | 122.5 | | Average outstanding debt balance | $ | 150.0 | | | $ | 109.9 | |
| Average interest rate | Average interest rate | 3.8 | % | | 1.8 | % | Average interest rate | 6.9 | % | | 2.4 | % |
1. Following the entry into the Second Amended and Restated Credit Agreement on June 29, 2022, borrowings bear an interest rate equal to Secured Overnight Financing Rate ("SOFR") plus a credit spread adjustment of 10 basis points and an amount depending on the type of borrowing and commitment fees charged on the unused amount under the Second Amended and Restated Credit Agreement. Prior to entry into the Second Amended and Restated Credit Agreement, the interest rate was based on London Inter-Bank Offered Rate ("LIBOR") plus an applicable credit spread. See "Liquidity and Capital Resources" below for additional information. | |
First NineSix Months of 2022 Results vs.2023 Compared with the First NineSix Months of 2021 Results2022
The following table presents a bridge of consolidated net income (loss) from continuing operations fromthe first nine months of 2021 to first ninesix months of 2022 to the first six months of 2023 with management's related management's discussion and analysis below the table.
| | | | | | | | |
| (In thousands) | | |
Net income from continuing operations(loss) for the first ninesix months ended SeptemberJune 30, 20212022 | | $ | 36,57631,292 | |
| Income tax expense (benefit) | | 10,7286,334 | |
Income (loss) from continuing operations before income taxes for the first ninesix months ended SeptemberJune 30, 20212022 | | 47,30437,626 | |
| Increase (decrease) in income from increases (decreases) in the following items: | | |
| Sales | | 143,947 (141,640) | |
| Other income (expense), net | | (8,159)(781) | |
| Total | | 135,788 (142,421) | |
| Increase (decrease) in income from (increases) decreases in the following items: | | |
| Cost of goods sold | | (131,197)88,556 | |
| Freight | | (8,088)5,875 | |
| Selling, general and administrative | | (3,738)4,249 | |
| Goodwill impairment | | (15,413) | |
| Other | | (355)(1,406) | |
| Total | | (143,378)81,861 | |
Income (loss) from continuing operations before income taxes for the first ninesix months ended SeptemberJune 30, 20222023 | | 39,714 (22,934) | |
| Income tax expense (benefit) | | 7,460 (3,000) | |
Net income from continuing operations(loss) for the first ninesix months ended SeptemberJune 30, 20222023 | | $ | 32,254 (19,934) | |
Sales in the first ninesix months of 2022 increased2023 decreased by $143.9$141.6 million compared with the first ninesix months of 2021.2022. Net sales (sales less freight) in Aluminum Extrusions increased $115.6decreased $93.2 million, primarily due to an increase in average selling prices to cover higher aluminum raw material costs and higher operating costs, partially offset by lower sales volume. Net sales decreased $5.3 million in PE Films, primarily due to lower sales volume in Surface Protection and overwrap films,the pass-through of lower metal costs, partially offset by an increase in average selling prices associated with the pass-through ofto cover higher market-driven raw materialoperating costs. Net sales in PE Films decreased $26.5 million, primarily due to continuing weak market demand and unfavorable product mix. Net sales in Flexible Packaging Films increased $25.6decreased $16.1 million, primarily due to higherlower sales volume and lower selling prices from the pass-through of higherlower resin costs, partially offset by favorable product mix and higher sales volume.mix. For more information on net sales and volume, see the Segment Operations Review below.
Other income decreased $8.2(expense), net was $0.3 million in the first ninesix months of 20222023 compared to other income (expense), net of $1.0 million in the first ninesix months of 2021,2022. The change in other income (expense), net is primarily due to a 2021 gaincash consideration of $8.5$0.3 million associated with a one-time tax creditreceived in Brazil for unemployment/social security insurance non-income taxes resulting from a favorable decision by Brazil's Supreme Court regardingJanuary 2023 compared to $1.4 million received in May 2022 related to the calculationcustomary post-closing adjustments on the sale of such tax.the investment in kaléo, which was sold in December 2021. See Note 5 for additional information.
Consolidated gross profit (sales minus cost of goods sold and freight) as a percentage of sales (gross profit margin) was 15.9%11.7% in the first ninesix months of 20222023 compared to 18.9%17.7% in the first ninesix months of 2021.2022. The gross profit margin in Aluminum Extrusions remained flat compareddecreased primarily due to lower sales volume, higher labor and employee-related costs, lower labor productivity and higher supply expense, including higher paint expense associated with a shift to more painted product in the first ninequarter of 2023 and inflationary costs for other supplies, partially offset by higher pricing and lower utility costs. Additionally, the timing of the flow through under the first-in first-out method of aluminum raw material costs passed through to customers, previously acquired at lower prices in a quickly changing commodity pricing environment, resulted in a benefit of $0.4 million in the first six months of 2021.2023 versus a benefit of $5.5 million in the first six months of 2022. The gross profit margin in PE Films decreased primarily due to a lower Surface Protection contribution margin related tofor previously disclosed customer product transitions and for non-transitioning products associated with a market slowdown and customer inventory corrections, and competitive pricing pressures, partially offset by the pass-through lag associated with resin costs.favorable pricing and mix for overwrap films. The gross profit margin in Flexible Packaging Films decreased primarily due to higher raw material costs, higher fixed and variable costs, partially offset by higherlower sales volume, lower selling prices from the pass-through of higherlower resin costs and margin pressures, higher sales volumefixed costs, higher variable costs and favorableunfavorable product mix.mix, partially offset by lower raw material costs.
As a percentage of sales, SG&A and R&D expenses were 10.4% in the first six months of 2023, compared with 8.5% in the first ninesix months of 2022, compared with 9.9% in the2022. While first nine months of 2021.half SG&A expenses and sales increaseddecreased year-over-year, while R&D expenses remained relatively consistent with the prior year. Increasedyear period. Lower SG&A spending iswas primarily due to lower accruals for employee-related compensation and lower stock-based compensation, partially offset by higher professional fees associated with remediation activities related tobusiness development activities.
In the Company's previously disclosed material weaknessesfirst half of 2023, a non-cash partial goodwill impairment of $15.4 million was recognized, see the PE Films section in internal control over financial reporting and higher employee-related compensation.Segment Operations Review below for more information.
The effective tax rate used to compute income taxes for continuing operationsthe first six months of 2023 was 13.1%, compared to 16.9% in the first ninesix months of 2022 was 18.8%, compared to 22.7% in the first nine months of 2021.2022. The decreasechange in the effective tax rate for continuing operations is primarily due to a pre-tax loss in first six months of 2023 versus pre-tax income in first six months of 2022, lower Brazil tax incentives, a discrete charge in the second quarter of 2023 for a Brazil tax law change and a large discrete benefit recorded in the first quarter of 2022, resulting from the implementation of new U.S. tax regulations associated with foreign tax credits published by the U.S. Treasury and Internal Revenue Service on January 4, 2022. These regulations overhaul various components of the foreign tax credit regime including the determination of creditable foreign taxes and limit the amount of foreign taxes that are creditable against U.S. income taxes. This one-time discrete benefit is expected to reduce the effective tax rate for the remainder of 2022, which will be offset by an expected increase to the effective tax rate as the result of Brazilian income tax no longer being creditable in the U.S. for the foreseeable future. See Note 9 for additional information.
Pre-tax gains and losses associated with plant shutdowns, asset impairments, restructurings and other items for continuing operations in the first ninesix months of 20222023 and 20212022 detailed below are shown in the statements of net sales and EBITDA from ongoing operations by segment table in Note 10 and are included in “Asset impairments and costs associated with exit and disposal activities, net of adjustments” in the condensed consolidated statements of income, unless otherwise noted. | | | | | | | | |
| Nine Months Ended September 30, |
| (In millions) | 2022 | 2021 |
| Aluminum Extrusions: | | |
| (Gains) losses from sale of assets, investment writedowns and other items: | | |
Environmental charges at Newnan, Georgia plant3 | $ | — | | $ | 0.1 | |
COVID-19-related expenses, net of relief1 | 0.1 | | 0.1 | |
| Total for Aluminum Extrusions | $ | 0.1 | | $ | 0.2 | |
| PE Films: | | |
| (Gains) losses associated with plant shutdowns, asset impairments and restructurings: | | |
| Other restructuring costs - severance | $ | 0.5 | | $ | 0.1 | |
| (Gains) losses from sale of assets, investment writedowns and other items: | | |
COVID-19-related expenses1 | 0.2 | | 0.4 | |
| Total for PE Films | $ | 0.7 | | $ | 0.5 | |
| Flexible Packaging Films: | | |
| (Gain) losses from sale of assets, investment writedowns and other items: | | |
One-time tax credit in Brazil for unemployment/social security insurance non-income taxes resulting from a favorable decision by Brazil's Supreme Court regarding the calculation of such taxes1,5 | $ | — | | $ | (8.5) | |
COVID-19-related expenses1 | 0.1 | | 0.1 | |
| Total for Flexible Packaging Films | $ | 0.1 | | $ | (8.4) | |
| Corporate: | | |
| (Gains) losses associated with plant shutdowns, asset impairments and restructurings: | | |
| (Gain), net of costs associated with the sale of the Lake Zurich manufacturing facility assets | $ | — | | $ | 0.1 | |
| Other restructuring costs - severance | 0.1 | | — | |
| (Gains) losses from sale of assets, investment writedowns and other items: | | |
Professional fees associated with business development activities and other2 | 1.6 | | 2.4 | |
Professional fees associated with internal control over financial reporting2 | 2.0 | | 2.0 | |
Write-down of investment in Harbinger Capital Partners Special Situations Fund1 | — | | 0.5 | |
Stock-based compensation expense associated with the fair value remeasurement of awards granted at the time of the 2020 special dividend2 | (0.3) | | 0.3 | |
Transition service fees, net of corporate costs associated with the divested Personal Care Films business1 | — | | (0.5) | |
Net periodic benefit cost for the frozen defined benefit pension plan in process of termination4 | 10.4 | | — | |
| Total for Corporate | $ | 13.8 | | $ | 4.8 | |
1. Included in “Other income (expense), net” in the condensed consolidated statements of income.
2. Included in “Selling, general and administrative expenses” in the condensed consolidated statements of income.
3. Included in “Costs of goods sold” in the condensed consolidated statements of income.
4. See “Corporate Expenses, Interest, & Other” below and see Note 4 for additional information.
5. See Note 5 for additional information. |
| | | | | | | | |
| Six Months Ended June 30, |
| (In millions) | 2023 | 2022 |
| Aluminum Extrusions: | | |
| (Gains) losses from sale of assets, investment writedowns and other items: | | |
Storm damage to the Newnan, Georgia plant2 | $ | 0.4 | | $ | — | |
COVID-19-related expenses, net of relief1 | — | | 0.1 | |
| Total for Aluminum Extrusions | $ | 0.4 | | $ | 0.1 | |
| PE Films: | | |
| (Gains) losses from sale of assets, investment writedowns and other items: | | |
COVID-19-related expenses1 | $ | — | | $ | 0.2 | |
| Goodwill Impairment | 15.4 | | — | |
| Total for PE Films | $ | 15.4 | | $ | 0.2 | |
| Flexible Packaging Films: | | |
| (Gains) losses associated with plant shutdowns, asset impairments and restructurings: | | |
| Other restructuring costs - severance | $ | 0.1 | | $ | — | |
| Total for Flexible Packaging Films | $ | 0.1 | | $ | — | |
| Corporate: | | |
| (Gains) losses associated with plant shutdowns, asset impairments and restructurings: | | |
| Other restructuring costs - severance | $ | — | | $ | 0.1 | |
| (Gains) losses from sale of assets, investment writedowns and other items: | | |
Professional fees associated with business development activities2 | $ | 1.9 | | $ | 1.6 | |
Professional fees associated with remediation activities related to internal control over financial reporting2 | 1.0 | | 1.2 | |
Write-down of investment in Harbinger Capital Partners Special Situations Fund1 | 0.2 | | — | |
Stock-based compensation expense associated with the fair value remeasurement of awards granted at the time of the 2020 special dividend2 | (0.2) | | (0.2) | |
Net periodic benefit cost for the frozen defined benefit pension plan in process of termination3 | 6.8 | | 6.9 | |
| Total for Corporate | $ | 9.7 | | $ | 9.6 | |
1. Included in “Other income (expense), net” in the condensed consolidated statements of income. 2. Included in “Selling, general and administrative expenses” in the condensed consolidated statements of income. 3. See “Corporate Expenses, Interest, & Other” below and Note 4 for additional information. |
Average debt outstanding and interest rates were as follows: | | | Nine Months Ended September 30, | | Six Months Ended June 30, |
| (In millions, except percentages) | (In millions, except percentages) | 2022 | | 2021 | (In millions, except percentages) | 2023 | | 2022 |
Floating-rate debt with interest charged on a rollover basis plus a credit spread1: | | |
| Floating-rate debt with interest charged on a rollover basis plus a credit spread: | | Floating-rate debt with interest charged on a rollover basis plus a credit spread: | |
| Average outstanding debt balance | Average outstanding debt balance | $ | 108.3 | | | $ | 131.5 | | Average outstanding debt balance | $ | 148.5 | | | $ | 106.9 | |
| Average interest rate | Average interest rate | 2.7 | % | | 1.7 | % | Average interest rate | 6.6 | % | | 2.1 | % |
1. Following the entry into the Second Amended and Restated Credit Agreement on June 29, 2022, borrowings bear an interest rate equal to SOFR plus a credit spread adjustment of 10 basis points and an amount depending on the type of borrowing and commitment fees charged on the unused amount under the Second Amended and Restated Credit Agreement. Prior to entry into the Second Amended and Restated Credit Agreement, the interest rate was based on LIBOR plus an applicable credit spread. See "Liquidity and Capital Resources" below for additional information. | |
Segment Operations Review
Aluminum Extrusions
A summary of results for Aluminum Extrusions is provided below: | | | Three Months Ended | | Favorable/
(Unfavorable)
% Change | | Nine Months Ended | | Favorable/
(Unfavorable)
% Change | | Three Months Ended | | Favorable/
(Unfavorable)
% Change | | Six Months Ended | | Favorable/
(Unfavorable)
% Change |
| (In thousands, except percentages) | (In thousands, except percentages) | September 30, | | September 30, | | (In thousands, except percentages) | June 30, | | June 30, | |
| 2022 | | 2021 | | | | 2021 | | 2023 | | 2022 | | | | 2022 | |
| Sales volume (lbs) | Sales volume (lbs) | 45,457 | | | 45,407 | | | 0.1% | | 138,793 | | | (1.0)% | Sales volume (lbs) | 35,492 | | | 48,960 | | | (27.5)% | | 91,970 | | | (20.6)% |
| Net sales | Net sales | $ | 161,649 | | | $ | 137,086 | | | 17.9% | | $ | 394,492 | | | 29.3% | Net sales | $ | 121,827 | | | $ | 190,308 | | | (36.0)% | | $ | 348,417 | | | (26.8)% |
| Ongoing operations: | Ongoing operations: | | Ongoing operations: | |
| EBITDA | EBITDA | $ | 12,071 | | | $ | 12,038 | | | 0.3% | | $ | 57,885 | | | $ | 45,062 | | | 28.5% | EBITDA | $ | 10,217 | | | $ | 21,895 | | | (53.3)% | | $ | 24,855 | | | $ | 45,814 | | | (45.7)% |
| Depreciation & amortization | Depreciation & amortization | (4,416) | | | (3,900) | | | (13.2)% | | (12,846) | | | (12,062) | | | (6.5)% | Depreciation & amortization | (4,158) | | | (4,169) | | | 0.3% | | (8,569) | | | (8,430) | | | (1.6)% |
| EBIT* | EBIT* | $ | 7,655 | | | $ | 8,138 | | | (5.9)% | | $ | 45,039 | | | $ | 33,000 | | | 36.5% | EBIT* | $ | 6,059 | | | $ | 17,726 | | | (65.8)% | | $ | 16,286 | | | $ | 37,384 | | | (56.4)% |
| Capital expenditures | Capital expenditures | $ | 8,218 | | | $ | 5,183 | | | $ | 15,089 | | | $ | 11,956 | | | Capital expenditures | $ | 5,631 | | | $ | 3,989 | | | $ | 13,373 | | | $ | 6,870 | | |
*See the table in Note 10 for a reconciliation of this non-GAAP measure to the most comparable measure calculated in accordance with GAAP. |
ThirdSecond Quarter 2023 Results vs. Second Quarter 2022 Results vs. Third Quarter 2021 Results
Net sales (sales less freight) in the thirdsecond quarter of 20222023 increased 17.9%decreased 36.0% versus 2021the second quarter of 2022 primarily due to lower sales volume and the pass-through of lower metal costs, partially offset by an increase in average selling prices to cover higher operating costs, partially offset by the pass-through of lower metal costs. Sales volume in the thirdsecond quarter of 2023 declined 27.5% versus the second quarter of 2022. Nonresidential B&C sales volume, which represented 53% of 2022 was flatvolume, declined 23.8% in the second quarter of 2023 versus 2021. the second quarter of 2022. Sales volume in the specialty market, which represented 34%29% of total volume in 2021,2022, decreased 11.0%32.7% in the thirdsecond quarter of 20222023 versus 2021, primarily as a resultthe second quarter of exiting lower-margin business.2022. Sales volume in the automotive market, which represented 8% of total volume in 2021, increased 5.3%2022, decreased 7.8% in the second quarter of 2023 versus the thirdsecond quarter of 2021. No2022.
nresidential B&C sales volume, which represented 51% of 2021 volume, increased 8.5%Beginning in the third quarter of 2022, versus 2021. Thethe Company has observed slowing order input and order cancellations as customers continued to report high inventory levels. In addition, given the recent slowdown inlevels, which carried into 2023. Open orders average labor shortage levels have been significantly diminished. Nonetheless, onboarding new employees has resulted in higher hiring and training costs and production inefficiencies in 2022 versus last year. With a reduced level of incoming orders in the third quarter of 2022, overall open orders at the end of the quarter were 59 million lbs. versus 86 million lbs. at the end of the second quarter of 2023 were 20 million pounds (versus 27 million pounds at the end of the first quarter of 2023 and 86 million pounds at the end of the second quarter 2022). This level is below the quarterly range of 21 to 27 million pounds in 2019 before pandemic-related disruptions that resulted in long lead times driving a peak in open orders of approximately 100 million pounds during the first quarter of 2022. In addition, data indicates that aluminum extrusion imports have increased significantly in recent years, and some of Bonnell Aluminum’s customers may have sourced, and continue to source, aluminum extrusions from producers outside of the United States. The Company is closely monitoring the situation and is prepared to work with the U.S. Government to ensure a fairly traded market. Nonetheless, Bonnell Aluminum has experienced three sequential quarters of net booking growth. Net bookings were 16.9, 19.0, 20.4 and 28.2 million pounds in the third quarter of 2022 through the second quarter of 2023, respectively.
EBITDA from ongoing operations in the thirdsecond quarter of 2022 was flat2023 decreased $11.7 million or 53.3% versus the thirdsecond quarter of 20212022 primarily due to:
•Higher pricingLower volume ($19.6 million, net of the pass-through of aluminum raw material costs)11.9 million), partially offset by: higher labor and employee-related costs ($2.10.7 million), lower labor productivity ($0.5 million), lower pricing ($1.0 million) and higher supply expense associated with inflationary costs ($0.8 million), partially offset by lower utility costs ($1.0 million), lower freight rates ($0.3 million) and lower labor productivity ($1.3 million); higher supply expense, including significant price increases in paint, chemicals, packaging and other supplies ($3.6 million); higher utility costs ($2.0 million); higher freight rates ($1.3 million); and increased selling, general and administrative ("SG&A")&A expenses ($0.81.6 million); and
•The timing of the flow throughflow-through under the first-in first-out method of aluminum raw material costs passed through to customers, previously acquired at higher prices in a quickly changing commodity pricing environment, resulted in a charge of $3.8$1.3 million in the thirdsecond quarter of 20222023 versus a benefitcharge of $1.7$1.6 million in the thirdsecond quarter of 2021. In addition, the Company recorded an out-of-period adjustment of $2.5 million related to inventory and accrued labor costs. 2022.
First NineSix Months of 2023 Results v. First Six Months of 2022 Results vs. First Nine Months of 2021 Results
Net sales in the first ninesix months of 2023 decreased 26.8% versus the first six months of 2022 increased 29.3% versus 2021 primarily due to lower sales volume and the pass-through of lower metal costs, partially offset by an increase in average selling prices to cover higher aluminum raw material costs and higher operating costs, partially offset by lower sales volume. costs. Sales volume in the first ninesix months of 20222023 decreased by 1.0%20.6% versus 2021.the first six months of 2022.
EBITDA from ongoing operations in the first ninesix months of 2023 decreased $21.0 million or 45.7% in comparison to the first six months of 2022 increased $12.8 million in comparison to the first nine months of 2021, primarilyprimarily due to:
•Higher pricing ($53.7 million, net of the pass-through of aluminum raw material costs), partially offset by: lowerLower volume ($0.716.1 million);, higher labor and employee-related costs ($6.02.4 million) and, lower labor productivity ($4.61.0 million); higher maintenance costs ($1.4 million); and higher supply expense, including significant price increaseshigher paint expense associated with a shift to more painted product in paint, chemicals, packaging
the first six months of 2023, and inflationary costs for other supplies ($10.13.0 million);, partially offset by higher utilitiespricing ($2.75.6 million); higher freight rates, lower utility costs ($5.20.6 million); and increasedlower SG&A expenses ($3.20.8 million); and
•The timing of the flow throughflow-through under the first-in first-out method of aluminum raw material costs passed through to customers, previously acquired at lower prices in a quickly changing commodity pricing environment, resulted in a benefit of $1.7$0.4 million in the first ninesix months of 20222023 versus a benefit of $5.8$5.5 million in the first ninesix months of 2021. The benefit in the first nine months of 2022 was net of an adverse impact from the lag in pricing during the first half of 2022 ($0.3 million), in which products committed to customers at a specified price were shipped in a later period. In addition, the Company recorded an out-of-period adjustment of $2.5 million related to inventory and accrued labor costs.2022.
Aluminum Extrusions has adequate supply agreements for aluminum raw materials in 2022 and continues to secure supply sources to meet expected needs in 2023. Refer to Item 3. Quantitative and Qualitative Disclosures About Market Risk in this Form 10-Q for additional information on aluminum prices.
Projected Capital Expenditures and Depreciation & Amortization
Capital expenditures for Bonnell Aluminum are projected to be $30$19 million in 2022, including $152023 versus the previously disclosed projection of $26 million. The Company has implemented stringent spending measures to control its financial leverage (see “Net Debt, Financial Leverage and Debt Covenants” section for more information). In this regard, Bonnell Aluminum has reduced projected capital expenditures in the second half of 2023 to $5 million forto mainly support continuity of current operations versus broader spending of $14 million during the first half of the year. The most significant reduction relates to the multi-year implementation of new enterprise resource planning and manufacturing execution systems ("ERP/MES"), $6 million. This project is being reorganized with an extended implementation period that increases the utilization of existing dedicated internal resources over a longer period in place of more costly external consultants. As a result, the earliest “go-live” date for infrastructure upgrades at the facilities locatednew ERP/MES is likely in Niles, Michigan, Carthage, Tennessee and Newnan, Georgia and $3 million for other strategic projects.2025. The ERP/MES project is expected to cost $28 million over a two-year time span. In addition to strategic projects,commenced in 2022, with spending to-date of approximately $6 million will be required to support continuity of current operations.$21 million. Depreciation expense is projected to be $15 million in 2022.2023. Amortization expense is projected to be $2 million in 2022.
PE Films
A summary of results for PE Films is provided below: | | | Three Months Ended | | Favorable/
(Unfavorable)
% Change | | Nine Months Ended | | Favorable/
(Unfavorable)
% Change | | Three Months Ended | | Favorable/
(Unfavorable)
% Change | | Six Months Ended | | Favorable/
(Unfavorable)
% Change |
| (In thousands, except percentages) | (In thousands, except percentages) | September 30, | | September 30, | | (In thousands, except percentages) | June 30, | | June 30, | |
| 2022 | | 2021 | | | | 2021 | | 2023 | | 2022 | | | | 2022 | |
| Sales volume (lbs) | Sales volume (lbs) | 7,081 | | | 9,283 | | | (23.7)% | | 30,066 | | | (9.3)% | Sales volume (lbs) | 6,245 | | | 9,639 | | | (35.2)% | | 20,192 | | | (32.6)% |
| Net sales | Net sales | $ | 20,059 | | | $ | 28,501 | | | (29.6)% | | $ | 87,885 | | | (6.0)% | Net sales | $ | 15,918 | | | $ | 31,424 | | | (49.3)% | | $ | 62,555 | | | (42.3)% |
| Ongoing operations: | Ongoing operations: | | Ongoing operations: | |
| EBITDA | EBITDA | $ | 431 | | | $ | 4,821 | | | (91.1)% | | $ | 14,543 | | | $ | 21,035 | | | (30.9)% | EBITDA | $ | 814 | | | $ | 7,065 | | | (88.5)% | | $ | 2,663 | | | $ | 14,112 | | | (81.1)% |
| Depreciation & amortization | Depreciation & amortization | (1,579) | | | (1,591) | | | 0.8% | | (4,733) | | | (4,681) | | | (1.1)% | Depreciation & amortization | (1,552) | | | (1,559) | | | 0.4% | | (3,195) | | | (3,154) | | | (1.3)% |
| EBIT* | EBIT* | $ | (1,148) | | | $ | 3,230 | | | (135.5)% | | $ | 9,810 | | | $ | 16,354 | | | (40.0)% | EBIT* | $ | (738) | | | $ | 5,506 | | | (113.4)% | | $ | (532) | | | $ | 10,958 | | | (104.9)% |
| Capital expenditures | Capital expenditures | $ | 793 | | | $ | 1,023 | | | $ | 2,537 | | | $ | 2,757 | | | Capital expenditures | $ | 360 | | | $ | 1,163 | | | $ | 1,075 | | | $ | 1,744 | | |
* See the table in Note 10 for a reconciliation of this non-GAAP measure to the most comparable measure calculated in accordance with GAAP. |
ThirdSecond Quarter 2023 Results vs. Second Quarter 2022 Results vs. Third Quarter 2021 Results
Net sales in the thirdsecond quarter of 20222023 decreased 29.6% 49.3% compared to the thirdsecond quarter of 2021.2022. Sales volume in the second quarter of 2023 decreased in both Surface Protection and overwrap films versus the thirdsecond quarter of 2021.2022. Surface Protection sales volume declined 26% versusin the thirdsecond quarter of 2021 and 37%2023 declined 54.2% versus the second quarter of 2022.2022 and 26.9% versus the first quarter of 2023. Surface Protection sales have beencontinue to be adversely impacted by weak market demand and competitive pricing. Consumer demand for consumer electronics has significantly softened, causing manufacturerswhich began in the third quarter of last year. Manufacturers in the supply chain to experienceare experiencing reduced capacity utilization and inventory corrections. In addition, these market conditions are adversely impacting mix through reduced sales to our highest value-added customers and products.customers. The timing of a recovery in Surface Protection remains uncertain.
EBITDA from ongoing operations in the thirdsecond quarter of 2023 decreased $6.3 million versus the second quarter of 2022, decreased $4.4 million versus the third quarter of 2021, primarily due to:
•A $4.7$7.7 million decrease from Surface Protection:
◦Lower contribution margin associated with a market slowdown and customer inventory corrections ($8.6 million), partially offset by lower SG&A and operating efficiencies ($0.7 million); and
◦The pass-through lag associated with resin costs ($0.1 million charge in the second quarter of 2023 versus a charge of $0.3 million in the second quarter of 2022).
•A $1.4 million increase from overwrap films primarily due to cost improvements.
First Six Months of 2023 Results v. First Six Months of 2022 Results
Net sales in the first six months of 2023 decreased 42.3% compared to the first six months of 2022 primarily due to a decrease in sales volume in Surface Protection, as a result of the factors noted above. Sales volume declined 45.4% in Surface Protection in the first six months of 2023.
EBITDA from ongoing operations in the first six months of 2023 decreased by $11.4 million versus the first six months of 2022, primarily due to:
•A $12.6 million decrease from Surface Protection:
◦Lower contribution margin for non-transitioning products associated with a market slowdown and customer inventory corrections ($4.012.7 million) and competitive pricing ($1.1 million); and for previously disclosed customer product transitions ($1.10.7 million), partially offset by lower SG&A and other employee-related expenses and operating efficiencies ($0.41.2 million);
◦A foreign currency transaction gain of $0.5 million in the third quarter of 2022 versus no gains or losses in the third quarter of 2021; and
◦The pass-through lag associated with resin costs (no benefit or($0.2 million charge in the thirdsecond quarter of 20222023 versus a chargebenefit of $0.6$0.2 million in the thirdsecond quarter of 2021)2022).
•A $0.3$1.1 million increase from overwrap films primarily due to a benefit fromcost improvements ($1.5 million), partially offset by the pass-through lag associated with resin costs (no benefit or(a charge in the third quarter of 2022 versus a charge of $0.4 million in the third quarter of 2021), partially offset by lower sales volume ($0.1 million).
First Nine Months of 2022 Results vs. First Nine Months of 2021 Results
Net sales in the first nine months of 2022 decreased 6% versus the first nine months of 2021 due to lower volume in Surface Protection and overwrap films. Sales volume and revenue declined 7% and 11%, respectively, in Surface Protection. Despite a decline of 11% in sales volume in overwrap films, revenue increased 9% as a result of the pricing impact associated with the pass-through of resin costs.
EBITDA from ongoing operations in the first nine months of 2022 decreased $6.5 million versus the first nine monthsof 2021, primarily due to:
•A $7.2 million decrease from Surface Protection:
◦Lower contribution margin related to previously disclosed customer product transitions ($4.8 million) and for non-transitioning products associated with a market slowdown and customer inventory corrections ($1.6 million) and competitive pricing pressures ($4.4 million), partially offset by lower SG&A expenses ($0.7 million);
◦A foreign currency transaction gain ($1.0 million) in the first nine months of 2022 versus a charge ($0.1 million) in the first nine months of 2021; and
◦The pass-through lag associated with resin costs (benefit of $0.3 million in the first nine months of 2022 versus a charge of $1.3 million in the first nine months of 2021).
•A $0.7 million increase from overwrap films primarily related to a benefit from the pass-through lag associated with resin costs (benefit of $0.2 million in the first ninesix months of 20222023 versus a chargebenefit of $1.3$0.2 million in the first ninesix months of 2021), partially offset by lower sales volume and unfavorable mix ($0.6 million)2022).
Refer to Item 3. Quantitative and Qualitative Disclosures About Market Risk in this Form 10-Q for additional information on resin prices.
Customer Product TransitionsClosure of PE Films Technical Center
On August 3, 2023, the Company adopted a plan to close the PE Films technical center in Richmond, VA and Other Factorsreduce its efforts to develop and sell films supporting the semiconductor market. Future research & development activities for PE Films will be performed at the facility in Pottsville, PA. PE Films continues to have new business opportunities primarily relating to surface protection films that protect components of flat panel and flexible displays. The Company anticipates all activities to cease at the PE Films technical center in Richmond, VA, by the end of 2023. The Company expects to recognize cash costs associated with exit activities of $1.8 million for: (i) severance and related costs ($0.9 million), (ii) vacating the facility lease ($0.6 million payable through June 2025), and (iii) building closure costs ($0.3 million). In addition, the Company expects non-cash asset write-offs and accelerated depreciation of up to $4.5 million. Net annual cash savings of $3.4 million are anticipated, beginning in the fourth quarter of 2023.
Goodwill Impairment in Surface Protection
TheManufacturers in the supply chain for consumer electronics continue to experience reduced capacity utilization and inventory corrections. In light of the continued uncertainty about the timing of a recovery for this market and the expected adverse future impact to the Surface Protection business, the Company performed a goodwill impairment analysis of the Surface Protection component of PE Films supports manufacturersusing projections that contemplate the expected market recovery and business conditions. The analysis concluded that the fair value of optical and other specialty substrates used in flat panel display products. These films are primarily used by customers to protect componentsSurface Protection was less than its carrying value, thus a non-cash partial goodwill impairment of displays in the manufacturing and transportation processes and then discarded.
The Company previously reported the risk that a portion of its film products used in surface protection applications would be made obsolete by customer product transitions to less costly alternative processes or materials. The Company estimates that these transitions, which principally relate to one customer, adversely impacted pre-tax$15.4 million ($11.9 million after deferred income from continuing operations as reported under GAAP and EBITDA from ongoing operations for PE Films by $14.8 milliontax benefits) was recognized during 2021 versus 2020. The transitions, which were complete as of the second quarter of 2022, have resulted in a total decline of $7 million in pre-tax income from continuing operations as reported under GAAP and EBITDA from ongoing operations versus 2021.
The Surface Protection business is continuing to experience competitive pricing pressures, unrelated to the customer product transitions, that are expected to adversely impact pre-tax income from continuing operations as reported under GAAP and EBITDA from ongoing operations by approximately $5 million for full year 2022 versus 2021; these competitive pricing pressures are being exacerbated for the Company's exports to Asia with the strengthening of the U.S. Dollar versus the local currencies of competitors in the region. In addition, the timing of a recovery in the consumer electronics market is highly uncertain. To offset the expected adverse impact of the customer transitions and pricing pressures, the Company is aggressively pursuing sales of new surface protection products, applications and customers and driving production efficiencies and cost savings.2023.
Projected Capital Expenditures and Depreciation & Amortization
Capital expenditures for PE Films are projected to be $3 million in 2022,2023, including $2$1 million for productivity projects and $1$2 million for capital expenditures required to support continuity of current operations. Depreciation expense is projected to be $6 million in 2022.2023. There is no amortization expense for PE Films.
Flexible Packaging Films
A summary of results for Flexible Packaging Films is provided below: | | | Three Months Ended | | Favorable/
(Unfavorable)
% Change | | Nine Months Ended | | Favorable/
(Unfavorable)
% Change | | Three Months Ended | | Favorable/
(Unfavorable)
% Change | | Six Months Ended | | Favorable/
(Unfavorable)
% Change |
| (In thousands, except percentages) | (In thousands, except percentages) | September 30, | | September 30, | | (In thousands, except percentages) | June 30, | | June 30, | |
| 2022 | | 2021 | | | | 2021 | | 2023 | | 2022 | | | | 2022 | |
| Sales volume (lbs) | Sales volume (lbs) | 28,889 | | | 27,029 | | | 6.9% | | 78,666 | | | 4.5% | Sales volume (lbs) | 23,724 | | | 27,315 | | | (13.1)% | | 53,321 | | | (18.3)% |
| Net sales | Net sales | $ | 47,278 | | | $ | 36,666 | | | 28.9% | | $ | 102,560 | | | 24.9% | Net sales | $ | 33,223 | | | $ | 41,595 | | | (20.1)% | | $ | 80,839 | | | (19.9)% |
| Ongoing operations: | Ongoing operations: | | Ongoing operations: | |
| EBITDA | EBITDA | $ | 7,830 | | | $ | 7,396 | | | 5.9% | | $ | 20,495 | | | $ | 25,296 | | | (19.0)% | EBITDA | $ | 249 | | | $ | 7,631 | | | (96.7)% | | $ | 1,599 | | | $ | 12,665 | | | (87.4)% |
| Depreciation & amortization | Depreciation & amortization | (590) | | | (493) | | | (19.7)% | | (1,723) | | | (1,466) | | | (17.5)% | Depreciation & amortization | (711) | | | (583) | | | (22.0)% | | (1,411) | | | (1,132) | | | (24.6)% |
| EBIT* | EBIT* | $ | 7,240 | | | $ | 6,903 | | | 4.9% | | $ | 18,772 | | | $ | 23,830 | | | (21.2)% | EBIT* | $ | (462) | | | $ | 7,048 | | | (106.6)% | | $ | 188 | | | $ | 11,533 | | | (98.4)% |
| Capital expenditures | Capital expenditures | $ | 2,501 | | | $ | 1,895 | | | $ | 7,310 | | | $ | 4,283 | | | Capital expenditures | $ | 878 | | | $ | 3,264 | | | $ | 1,483 | | | $ | 4,809 | | |
* See the table in Note 10 for a reconciliation of this non-GAAP measure to the most comparable measure calculated in accordance with GAAP. |
ThirdSecond Quarter 2023 Results vs. Second Quarter 2022 Results vs. Third Quarter 2021 Results
Net sales in the thirdsecond quarter of 2023 decreased 20.1% compared to the second quarter of 2022 increased 28.9% compared to the third quarter of 2021, primarily due to higherlower sales volume, lower selling prices from the pass-through of higherlower resin costs higherand unfavorable product mix. The Company believes that lower sales volume was primarily due to customer inventory corrections. While sales volume in the second quarter of 2023 was still below expected normalized levels, it improved 20% over the first quarter of the year.
EBITDA from ongoing operations in the second quarter of 2023 decreased $7.4 million versus the second quarter of 2022, primarily due to:
•Lower selling prices from the pass-through of lower resin costs and margin pressures ($2.9 million), lower sales volume ($1.9 million), higher fixed costs ($1.1 million, primarily due to under absorption from lower production volumes), higher variable costs ($1.8 million, including higher costs resulting from quality issues and other costs associated with the shutdown of production lines to adjust production volumes to sales levels) and unfavorable product mix ($0.6 million), partially offset by lower raw material costs ($1.3 million) and lower SG&A expenses ($0.1 million);
•Foreign currency transaction losses ($0.2 million) in the second quarter of 2023 compared to foreign currency transaction gains ($0.6 million) in the second quarter of 2022; and
•Net favorable foreign currency translation of Real-denominated operating costs ($0.2 million).
First Six Months of 2023 Results v. First Six Months of 2022 Results
Net sales in the first six months of 2023 decreased 19.9% compared to the first six months of 2022 primarily due to lower sales volume and lower selling prices from the pass-through of lower resin costs, partially offset by favorable product mix.
EBITDA from ongoing operations in the third quarterfirst six months of 2022 increased by $0.42023 decreased $11.1 million versus the third quarterfirst six months of 2021,2022 primarily due to:
•HigherLower sales volume ($4.9 million), lower selling prices ($6.9 million) from the pass-through of higherlower resin costs higher sales volumeand margin pressures ($0.9 million), favorable product mix ($0.5 million), and lower variable costs ($0.4 million), partially offset by higher raw material costs ($5.63.6 million), higher fixed costs ($0.62.1 million, primarily due to under absorption from lower production volumes), higher variable costs ($0.7 million, including higher costs resulting from quality issues) and unfavorable product mix ($1.3 million), partially offset by lower raw material costs ($1.6 million) and higherlower SG&A expenses ($0.40.1 million);
•Net unfavorable foreign currency translation of Real-denominated operating costs ($1.2 million); and
•Foreign currency transaction gains ($0.1 million) in the third quarter of 2022 compared to foreign currency transaction gains ($0.6 million) in the third quarter of 2021.
First Nine Months of 2022 Results vs. First Nine Months of 2021 Results
Net sales in the first nine months of 2022 increased 24.9% compared to the first nine months of 2021, primarily due to higher selling prices from the pass-through of higher resin costs, favorable product mix and higher sales volume.
EBITDA from ongoing operations in the first nine months of 2022 decreased by $4.8 million versus the first nine months of 2021, primarily due to:
•Higher raw material costs ($16.3 million), higher fixed ($0.7 million) and variable costs ($1.5 million), and higher SG&A expenses ($1.0 million), partially offset by higher selling prices ($15.5 million) from the pass-through of higher resin costs, higher sales volume ($1.9 million) and favorable product mix ($1.3 million);
•Net unfavorable foreign currency translation of Real-denominated operating costs ($3.1 million); and
•Foreign currency transaction losses ($0.30.2 million) in the first nine monthssecond quarter of 20222023 compared to foreign currency transaction gainslosses ($0.60.3 million) in the first nine monthssecond quarter of 2021.2022.
Refer to Item 3. Quantitative and Qualitative Disclosures About Market Risk in this Form 10-Q for additional information on polyester fiber and component price trends.
Projected Capital Expenditures and Depreciation & Amortization
Capital expenditures for Flexible Packaging Films are projected to be $8$6 million in 2022,2023, including $4$2 million for new capacity for value-added products and productivity projects and $4 million for capital expenditures required to support continuity of current operations. Depreciation expense is projected to be $2$3 million in 2022.2023. Amortization expense is projected to be $0.4$0.1 million in 2022.2023.
Corporate Expenses, Interest & Other
Corporate expenses, net in the first ninesix months of 20222023 decreased $0.3$2.0 million compared to the first ninesix months of 20212022 primarily due to lower accruals for employee-related compensation ($2.1 million) and lower stock-based compensation ($0.4 million), partially offset by higher professional fees associated with business development activities ($1.6 million) and lower stock-
based compensation ($1.2 million), offset by higher professional fees associated with remediation activities related to the Company's previously disclosed material weaknesses in internal control over financial reporting ($2.30.6 million).
Interest expense of $3.2$4.7 million in the first ninesix months of 20222023 increased $0.6$2.7 million compared to the first ninesix months of 20212022 due to higher average debt levels and interest rates during the first nine months of 2022, partially offset by lower average debt levels. rates.
Pension expense under GAAP of $10.4$6.8 million in the first ninesix months of 20222023 remained consistent with the first ninesix months of 2021. On2022. In February 10, 2022, Tredegar announced the initiation of a process to terminate and settle its frozen defined benefit pension plan, which could take up to 24 months to complete.plan. In connection therewith, the Company borrowed funds under its revolving credit agreement ("Credit Agreement") and made a $50 million contribution to the pension plan (the “Special Contribution”) to reduce its underfunding and as part of a program within the pension plan to hedge or fix the expected future contributions that will be needed by the Company through the settlement process. The funds borrowed for the Special Contribution were effectively made available with proceeds received in December 2021 from the sale of the Company’s investment in kaléo. In addition, the Company expects to realizerealized income tax cash benefits on the Special Contribution of approximately $11 million in the fourth quarter of 2022.
During the second quarter of 2023, the Company received a favorable IRS determination letter, and government agencies and the Company expect the completion of the settlement process on or about October 31, 2023. Administrative costs for the entire settlement process with respect to the pension plan through the settlement process are estimated at $4 to $5 million.
The estimated underfunding of Tredegar’s frozen defined benefit pension plan was underfunded on a GAAP basis by $69approximately $30 million at June 30, 2023. As of December 31, 2021,2022, the estimated underfunding of $28 million was comprised of investments at fair value of $245$218 million and a projected benefit obligation (“PBO”) of $314$246 million. GAAP accounting requires adjustment for changes in values of assets and the PBO only at the end of each year, even though these values change daily. The Company estimates that the Special Contribution and changes to the values of pension plan assets and liabilities resulted in a decrease in the underfunding on a GAAP basis from $69 millionultimate underfunded amount at December 31, 2021 to approximately $10 million at September 30, 2022. The ultimate settlement benefit obligation may differ from the PBO,current amounts, depending on changes in market factors, forincluding with respect to buyers of pension obligations at the time of settlement.
Prior to the Special Contribution, GAAP pension expense was a reasonable proxy for the Company’s required minimum cash contribution to the pension plan. The Company estimates that, with the Special Contribution, there will be no required minimum cash contributions until final settlement. Pension expense under GAAP is projected to be approximately $14 million in 2022,2023, which is mainly comprised of non-cash amortization of deferred net actuarial losses reflected in the Company’s shareholders’ equity as accumulated other comprehensive losses. Beginning in 2022, and consistent with no expected required minimum cash contributions, no pension expense is included in calculating earnings before interest, taxes, depreciation and amortization as defined in the Company’s revolving credit agreementCredit Agreement ("Credit EBITDA").
Net capitalization and other credit measures are provided in Liquidity and Capital Resources below.
Liquidity and Capital Resources
The Company continues to focus on improving working capital management. Measures such as days sales outstanding (“DSO”), days inventory outstanding (“DIO”) and days payables outstanding (“DPO”) are used to evaluate changes in working capital. Changes in operating assets and liabilities from continuing operations from December 31, 20212022 to SeptemberJune 30, 20222023 are summarized below. Cash flows for discontinued operations have not been separately disclosed in the condensed consolidated statements of cash flows.
•Accounts and other receivables increased $6.8decreased $5.4 million (6.5%(6.4%).
◦Accounts and other receivables in Aluminum Extrusions increased $7.3decreased $6.8 million primarily due to an increase in average selling prices to cover higher operating costs, partially offset by lower sales volume.volume and the pass-through of lower metal costs. DSO (represents trailing 12 months net sales divided by a rolling 12-month average of accounts and other receivables balances) was approximately 48.348.9 days for the 12 months ended SeptemberJune 30, 20222023 and 47.648.7 days for the 12 months ended December 31, 2021.2022.
◦Accounts and other receivables in PE Films decreased $6.8 million due to lower sales volume in both Surface Protection and overwrap films, partially offset by increased overwrap films sales as a result of the pricing impact associated with the pass-through of resin costs.remained relatively flat. DSO was approximately 29.428.8 days for the 12 months ended SeptemberJune 30, 2022 and 28.52023, which was lower compared to 30.3 days for the 12 months ended December 31, 2021.2022 due to shorter customer repayment terms associated with sales of lower margin product during the second quarter of 2023.
◦Accounts and other receivables in Flexible Packaging Films increased $6.2$1.0 million primarily due to higher selling prices from the pass-through of higher resin costs, favorable product mix and higher sales volume.to customers in 2023 that contain unfavorable terms. DSO was approximately 40.839.0 days for the 12 months ended SeptemberJune 30, 20222023 and 40.041.1 days for the 12 months ended December 31, 2021.2022.
•Inventories increased $25.5decreased $41.1 million (28.8%(32.2%).
◦Inventories in Aluminum Extrusions increased $12.8decreased $23.9 million due to increaseddecreased raw material levels due toas a result of slowing order input and order cancellations as customers continue to report high inventory levels, and increased aluminum supplier costs.levels. DIO (represents trailing 12 months costs of goods sold calculated on a first-in first-out basis divided by a rolling 12-month average of inventory balances calculated on the first-in first-out basis) was approximately 48.357.5 days for the 12 months ended SeptemberJune 30, 20222023 and 41.453.6 days for the 12 months ended December 31, 2021.2022.
◦Inventories in PE Films increased $2.9decreased $2.3 million due to lower sales volumeraw materials and higher planned raw material levels from the first half of 2022.finished goods for overwrap films. DIO was approximately 62.668.3 days for the 12 months ended SeptemberJune 30, 20222023 and 62.866.8 days for the 12 months ended December 31, 2021.2022.
◦Inventories in Flexible Packaging Films increased $9.8decreased $14.8 million primarily due to the impactlower raw material purchases and lower finished goods levels as a result of higher average resin prices on raw materials, higher planned finished good levels and the impact from the change in the U.S. dollar value of currencies related to operations outside of the U.S.lower sales volume. DIO was approximately 96.7122.8 days for the 12 months ended SeptemberJune 30, 20222023 and 93.1108.0 days for the 12 months ended December 31, 2021.2022.
•Net property, plant and equipment increased $9.1$3.5 million primarily due to capital expenditures of $28.5 million, partially offset by depreciation expense of $17.5$14.5 million and a $1.1$1.7 million unfavorablefavorable change in the value of the U.S. dollar relative to foreign currencies.currencies, partially offset by depreciation expense of $12.4 million.
•Identifiable intangible assets, net decreased $2.0$0.9 million (13.8%(7.7%) due to amortization expense.
•Deferred income tax assets decreased $3.9increased $0.7 million primarily due to changes in other comprehensive income, increase in net operational losses, and the projected utilization of foreign tax credits partially offset by the changea decrease in the deferred tax liability as a result ofrelated to the implementation of new U.S. tax regulations associated with foreign tax credits published by the U.S. Treasury and Internal Revenue Service on January 4, 2022.goodwill impairment. See Note 9 for additional information.
•Accounts payable increased $3.1decreased $32.6 million (2.5%(28.4%).
◦Accounts payable in Aluminum Extrusions increased $4.8decreased $21.2 million primarily due to the timing of purchasinglower raw materials at higher aluminum pricesmaterial purchases and higher aluminum supplier costs.favorable vendor terms. DPO (represents trailing 12 months costs of goods sold calculated on a first-in first-out basis divided by a rolling 12-month average of accounts payable balances) was approximately 63.356.8 days for the 12 months ended SeptemberJune 30, 20222023 and 60.164.2 days for the 12 months ended December 31, 2021.2022.
◦Accounts payable in PE Films remained relatively flat. DPO was approximately 43.9 days for the 12 months ended June 30, 2023 and 51.0 days for the 12 months ended December 31, 2022.
◦Accounts payable in Flexible Packaging Films decreased $2.5$11.4 million primarily due to lower raw material purchases. DPO was approximately 51.964.3 days for the 12 months ended SeptemberJune 30, 20222023 and 44.072.4 days for the 12 months ended December 31, 2021.2022.
◦Accounts payableNet cash provided by operating activities was $22.7 million in Flexible Packaging Films remained flatthe first six months of 2023 compared to the prior year. DPO was approximately 69.5 days for the 12 months ended September 30, 2022 and 68.2 days for the 12 months ended December 31, 2021.
Netnet cash used in operating activities was $23.2of $9.4 million in the first ninesix months of 2022 compared to net cash provided by operating activities of $51.5 million in the first nine months of 2021.2022. The change in operating activities is primarily due to the Special Contribution ($50 million) and higherimproved working capital due to factors discussed earlier in this section relating to accounts and other receivables, inventories and accounts payable.
Net cash used in investing activities increased during the first nine months of 2022 compared to the first nine months of 2021 due to higher capital expenditure spending ($6.0 million) and cash proceeds received during the three months ended September 30, 2021 from the sale of the Lake Zurich manufacturing facility assets ($4.7 million), partially offset by a gain related to additional cash consideration received during the first nine months of 2022 in connection with the Company's sale of its investment interests kaléo ($1.4 million).
Net cash provided by financing activities was $36.8$15.6 million in the first ninesix months of 2022,2023 compared to net cash used in investing activities of $12.1 million the first six months of 2022. The increase was due to higher capital expenditures ($2.4 million), partially offset by cash consideration of $0.3 million received in January 2023 compared to $1.4 million received in the May 2022 related to the customary post-closing adjustments on the sale of the investment in kaléo, which was sold in December 2021.
Net cash used in financing activities of $18.2was $4.9 million in the first ninesix months of 2021.2023, compared to net cash provided by financing activities of $18.7 million in the first six months of 2022. The change in financing activities iswas primarily due to higher
lower net borrowings ($58.024.5 million) under the Credit Agreement (as defined below)during the first six months of 2023 as compared to fund the first six months of 2022 when the Company borrowed funds and made a $50 million Special Contribution to the pension plan higherin February 2022 and lower deferred financing costs ($1.2 million), repurchases of employee common stock for tax withholdings of $0.4 million in the first nine months of 2022, and $0.9 million of proceeds from the exercise of stock options in the first nine months of 2021..
The Company believes that existing borrowing availability, current cash balances and cash flow from operations will be sufficient to satisfy short term material cash requirements related to working capital, capital expenditures and debt repayments and dividend requirements for at least the next twelve months. In the longer term, liquidity will depend on many factors, including results of operations, the timing and extent of capital expenditures, changes in operating plans or other events that would cause the Company to seek additional financing in future periods.
At SeptemberJune 30, 2022,2023, the Company had cash and cash equivalents of $19.3$21.2 million, including cash and cash equivalents held in locations outside the U.S. of $8.5$13.9 million.
OnAs of June 29, 2022,30, 2023, Tredegar entered into a Second Amended and Restated Credit Agreement (the “Credit Agreement”) that replaced its existing $375 million five-year, secured revolving credit facility that was due to expire on June 28, 2024. The Credit Agreement ishad a five-year, revolving, secured credit facility that permits aggregate borrowings of $375 million and matures on June 29, 2027.
Net capitalization and indebtedness as defined under the Credit Agreement as of SeptemberJune 30, 20222023 were as follows: | | | | | |
Net Capitalization and Indebtedness as of SeptemberJune 30, 20222023 |
| (In thousands) |
| Net capitalization: | |
| Cash and cash equivalents | $ | 19,25021,193 | |
| Debt: | |
| Credit Agreement | 124,000141,000 | |
| Debt, net of cash and cash equivalents | 104,750119,807 | |
| Shareholders’ equity | 207,058183,149 | |
| Net capitalization | $ | 311,808302,956 | |
| Indebtedness as defined in Credit Agreement: | |
| Total debt | $ | 124,000141,000 | |
| Indebtedness | $ | 124,000141,000 | |
Borrowings under the Credit Agreement bear an interest rate equal to Secured Overnight Financing Rate ("SOFR")SOFR plus a credit spread adjustment of 10 basis points ("Adjusted Term SOFR Rate") and an amount depending on the type of borrowing and commitment fees charged on the unused amount under the Credit Agreement at various Total Net Leverage Ratio levels as follows: | | | | | | | | |
| Pricing Under the Credit Agreement (Basis Points) |
| Total Net Leverage Ratio | Term Benchmark Spread | Commitment
Fee |
| <= 1.0x | 150.0 | | 20 | |
| >1.0x but <=2.0x | 162.5 | | 25 | |
| >2.0x but <=3.0x | 175.0 | | 30 | |
| >3.0x but <=3.5x | 187.5 | | 35 | |
| >3.5x | 200.0 | | 40 | |
At SeptemberJune 30, 2022, $124.02023, $141.0 million of the outstanding debt was principally priced at an interest rate equal to the Adjusted Term SOFR Rate plus the applicable credit spread of 150.0175.0 basis points. Prior to the Credit Agreement, the interest rate was based on LIBOR plus an applicable credit spread.
The primary financial restrictive covenants in the Credit Agreement include:
•Total Net Leverage Ratio of 4.00x;
•Interest Coverage Ratio of 3.00x; and
•Unlimited payments for dividends and stock repurchases during the term of the Credit Agreement so long as the Total Net Leverage Ratio is equal to or less than 2.00x, and otherwise restrictions on payments for dividends and stock repurchases for the term of the Credit Agreement at $75 million (provided that the $75 million basket will reset at the end of each fiscal quarter when the Total Net Leverage ratio is less than or equal to 2.00x).
Under the Credit Agreement:
•Total Net Leverage Ratio is defined as the ratio of (a)(i) total indebtedness minus (ii) liquidity (the lesser of $50,000,000 and the aggregate amount of cash and cash equivalents) to (b) Credit EBITDA; and
•Interest Coverage Ratio is defined as the ratio of (a) Credit EBITDA to (b) interest expense.
The Credit Agreement is secured by substantially all of the Company’s and its domestic subsidiaries’ assets, including equity in certain material first-tier foreign subsidiaries. At SeptemberJune 30, 2022,2023, based upon the restrictive covenants within the Credit Agreement, available credit under the Credit Agreement was approximately $249$33 million. Total debt outstanding was $124.0$141.0 million and $73.0$137.0 million as of SeptemberJune 30, 20222023 and December 31, 2021,2022, respectively.
Credit EBITDA is not intended to represent net income (loss) or cash flow from operations as defined by GAAP and should not be considered as an alternative to either net income (loss) or to cash flow. The computations of Credit EBITDA, the Total Net Leverage Ratio and Interest Coverage Ratio as defined in the Credit Agreement are presented below.
| | | | | |
Computations of Credit EBITDA, Total Net Leverage Ratio and Interest Coverage Ratio (in each case, as Defined in the Credit Agreement) Along with Related Primary Restrictive Covenants as of and for the Twelve Months Ended SeptemberJune 30, 20222023 |
Computation of Credit EBITDA for the twelve months ended SeptemberJune 30, 20222023 (In Thousands): |
| Net income (loss) | $ | 53,676 (22,772) | |
| Plus: | |
| After-tax losses related to discontinued operations | — | |
| Total income tax expense for continuing operations | 6,016— | |
| Interest expense | 3,9897,656 | |
| Depreciation and amortization expense for continuing operations | 24,96626,894 | |
All non-cash losses and expenses, plus cash losses and expenses not to exceed $10,000, for continuing operations that are classified as unusual, extraordinary or which are related to plant shutdowns, asset impairments and/or restructurings (cash-related of $8,225)$6,399) | 8,25322,002 | |
| Charges related to stock option grants and awards accounted for under the fair value-based method | 1,829773 | |
| Losses related to the application of the equity method of accounting | — | |
| Losses related to adjustments in the estimated fair value of assets accounted for under the fair value method of accounting | — | |
| Minus: | |
| After-tax income related to discontinued operations | (61)(27) | |
| Total income tax benefits for continuing operations | — (4,945) | |
| Interest income | (74)(99) | |
| All non-cash gains and income, plus cash gains and income in excess of $10,000, for continuing operations that are classified as unusual, extraordinary or which are related to plant shutdowns, asset impairments and/or restructurings | (3,859)— | |
| Income related to changes in estimates for stock option grants and awards accounted for under the fair value-based method | — | |
| Income related to the application of the equity method of accounting | — | |
| Income related to adjustments in the estimated fair value of assets accounted for under the fair value method of accounting | (12,989)(262) | |
| Plus cash dividends declared on investments in an amount not to exceed $10,000 for such period | — | |
| Plus or minus, as applicable, pro forma EBITDA adjustments associated with acquisitions and asset dispositions | — | |
| Plus or minus, as applicable, pro forma EBITDA adjustments to pension expense associated with the early payment of pension obligations | 13,72414,264 | |
| Credit EBITDA | $ | 95,47043,484 | |
Computations of Total Net Leverage Ratio and Interest Coverage Ratio at SeptemberJune 30, 2022:2023: |
| Total Net Leverage Ratio | 1.1x2.76x |
| Interest Coverage Ratio | 23.93x5.68x |
| Primary restrictive covenants: | |
| Unlimited payments for dividends and stock repurchases during the term of the Credit Agreement so long as the Total Net Leverage Ratio is equal to or less than 2.00x, and otherwise restrictions on payments for dividends and stock repurchases for the term of the Credit Agreement at $75 million | Unlimited$ | 75,000 | |
| Maximum Total Net Leverage Ratio permitted | 4.00x |
| Minimum Interest Coverage Ratio permitted | 3.00x |
The Company had Credit EBITDA and a Total Net Leverage Ratio of $43.5 million and 2.76x, respectively, at June 30, 2023, which had significantly deteriorated from the Credit EBITDA and Total Net Leverage Ratio at December 31, 2022 of $84.4 million and 1.39x, respectively.
Tredegar was in compliance with all of its debt covenants as of SeptemberJune 30, 2022.2023. Noncompliance with any of the debt covenants could have a material adverse effect on its financial condition or liquidity, in the event such noncompliance cannot be cured or should the Company be unable to obtain a waiver from the lenders. Renegotiation of the covenant through an amendment to the Credit Agreement could effectively cure the noncompliance, but could have an effect on its financial condition or liquidity depending upon how the covenant is renegotiated. In addition, the Company’s projections indicate further deterioration of the Total Net Leverage Ratio without paying dividends to between 4.0x and 5.0x through the quarter ending March 31, 2024.
Subsequent to June 30, 2023, the Company amended the Credit Agreement. To reduce the risk of potential violations of the primary financial restrictive covenants in the Credit Agreement while the Company's businesses and markets are experiencing a downturn, the Company (i) suspended its regular quarterly dividend (which had an annual cash outlay of approximately $17.7 million) and (ii) amended the Credit Agreement, effective August 3, 2023, to:
Change the fiscal quarter minimum Interest Coverage Ratio covenant from 3.0x to: (i) 2.50x for the quarters ending September 30, 2023 through June 30, 2024, (ii) 2.75x for the quarter ending September 30, 2024, and (iii) 3.0x for the quarter ending December 31, 2024 and thereafter.
d.Increase the drawn spread by 25 basis points across all levels of the interest rate pricing grid, beginning the quarter ending September 30, 2023.
e.Amend the restricted payments covenant to prohibit dividends and share repurchases during fiscal quarters ending September 30, 2023 through December 31, 2024.
To further decrease the risk of a debt covenant violation during a severe cyclical downturn, the Company is investigating the replacement of the existing EBITDA-based credit facility by the end of 2023 with other financing alternatives, including borrowings that would be permitted based on the level of secured receivables, inventories and machinery and equipment and sale and leaseback of existing Company-owned property.
Item 3. Quantitative and Qualitative Disclosures About Market Risk.
Tredegar has exposure to the volatility of interest rates, polyethylene and polypropylene resin prices, Terephthalic Acid (“PTA”) and Monoethylene Glycol (“MEG”) prices, aluminum ingot and scrap prices, energy prices, foreign currencies and emerging markets. See Liquidity and Capital Resources above regarding interest rate exposures related to borrowings under the Credit Agreement.
Profit margins in Aluminum Extrusions are sensitive to fluctuations in aluminum ingot and scrap prices as well as natural gas prices (natural gas is the principal energy source used to operate its casting furnaces). Changes in polyethylene resin prices and the timing of those changes could have a significant impact on profit margins in PE Films. Changes in polyester resin, PTA and MEG prices, and the timing of those changes, could have a significant impact on profit margins in Flexible Packaging Films. There is no assurance of the Company’s ability to pass through higher raw material and energy costs to its customers.
In the normal course of business, Aluminum Extrusions enters into fixed-price forward sales contracts with certain customers for the sale of fixed quantities of aluminum extrusions at scheduled intervals. In order to hedge its exposure to aluminum price volatility (see the chart below) under these fixed-price arrangements, which generally have a duration of not more than 2412 months, the Company enters into a combination of forward purchase commitments and futures contracts to acquire or hedge aluminum, based on the scheduled deliveries. See Note 8 for additional information.
The volatility of quarterly average aluminum prices is shown in the chart below.
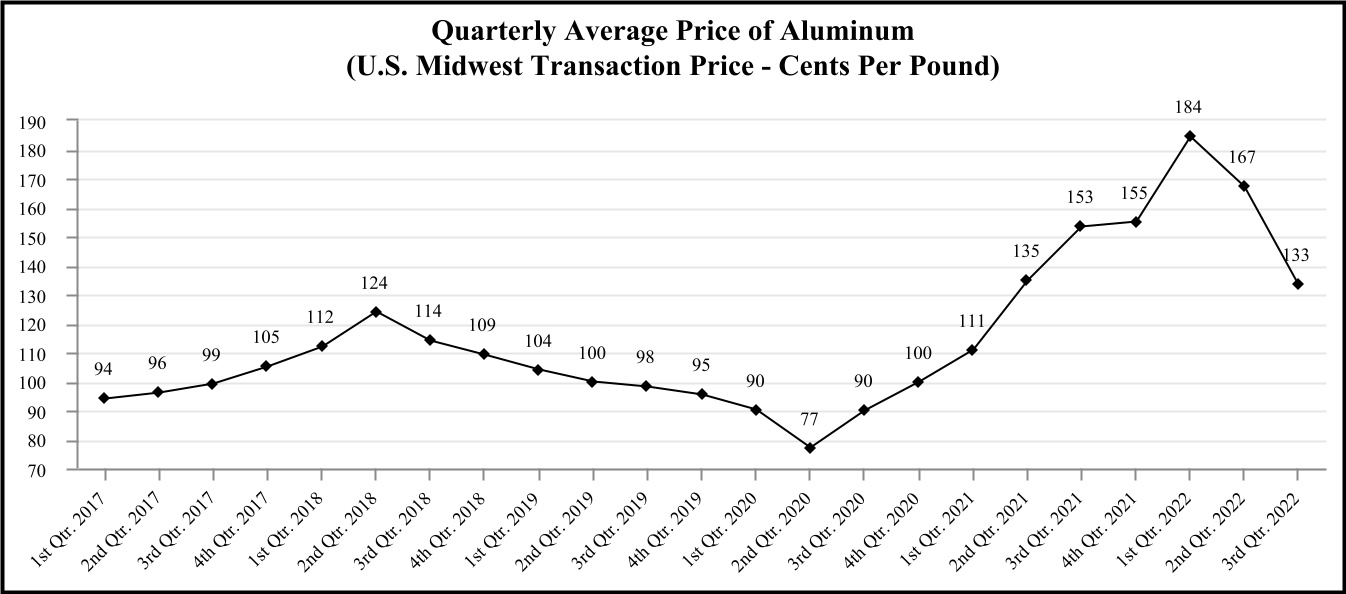
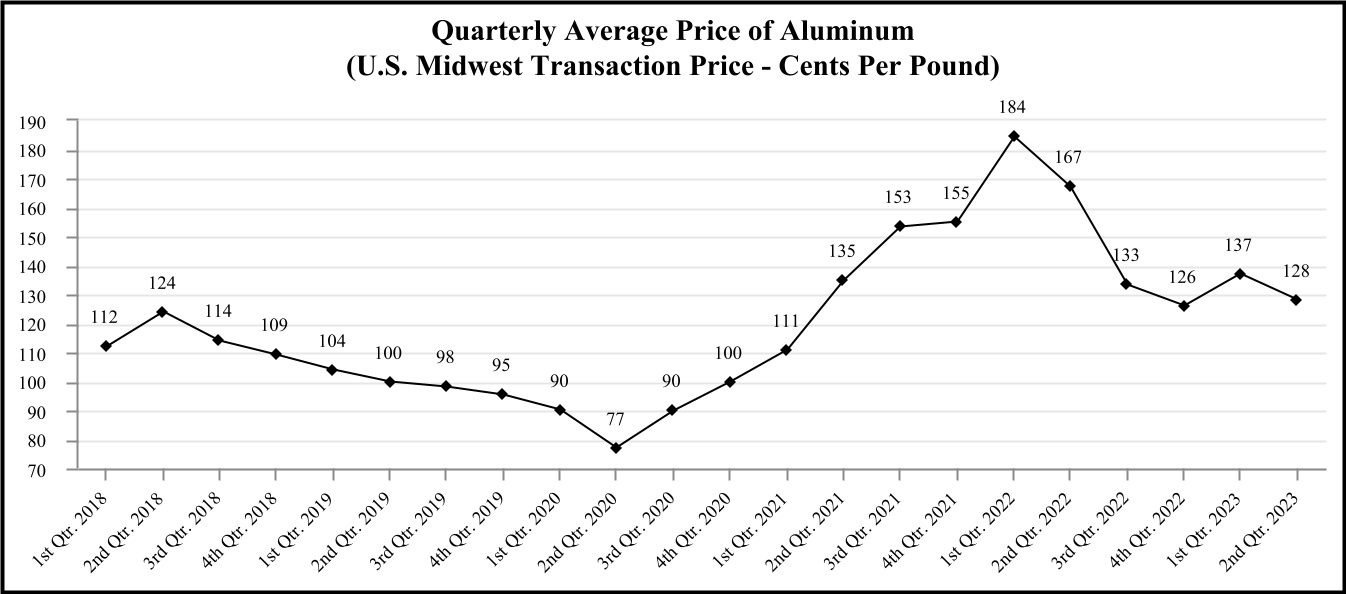
| | |
| Source: Quarterly averages computed by the Company using daily Midwest average prices provided by Platts. |
The volatility of quarterly average natural gas prices is shown in the chart below.
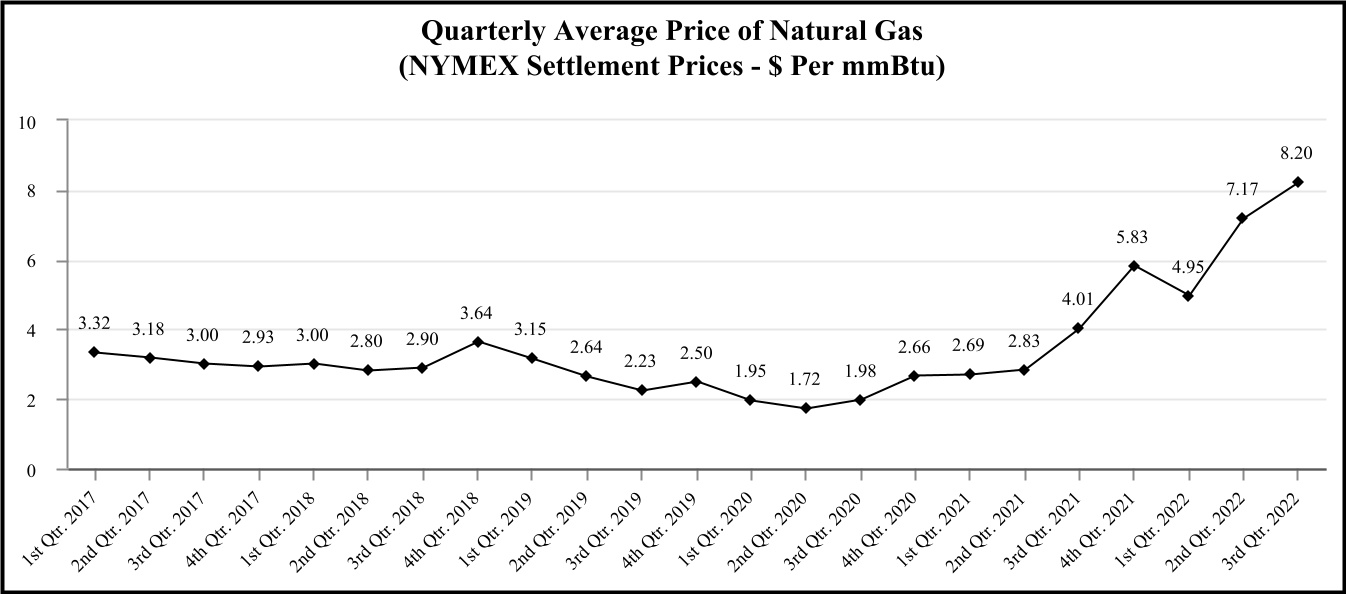
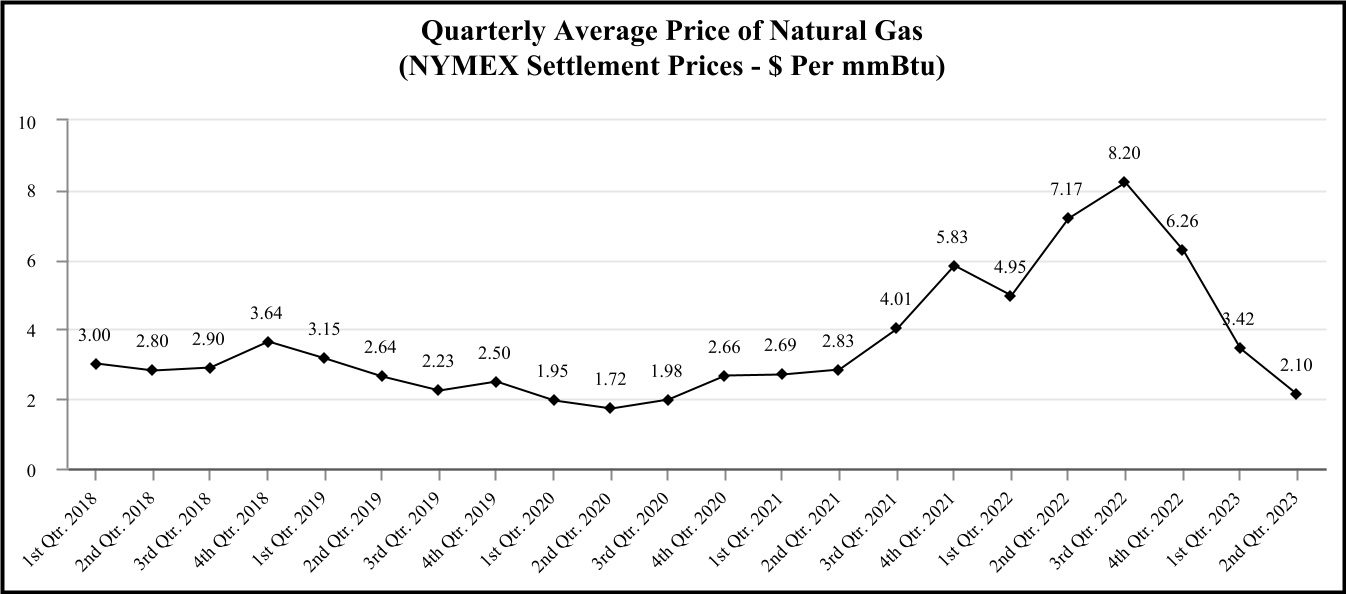
| | |
| Source: Quarterly averages computed by Tredegar using monthly NYMEX settlement prices. |
The volatility of average quarterly prices of polyethylene resin in the U.S. (a primary raw material for PE Films) is shown in the chart below.
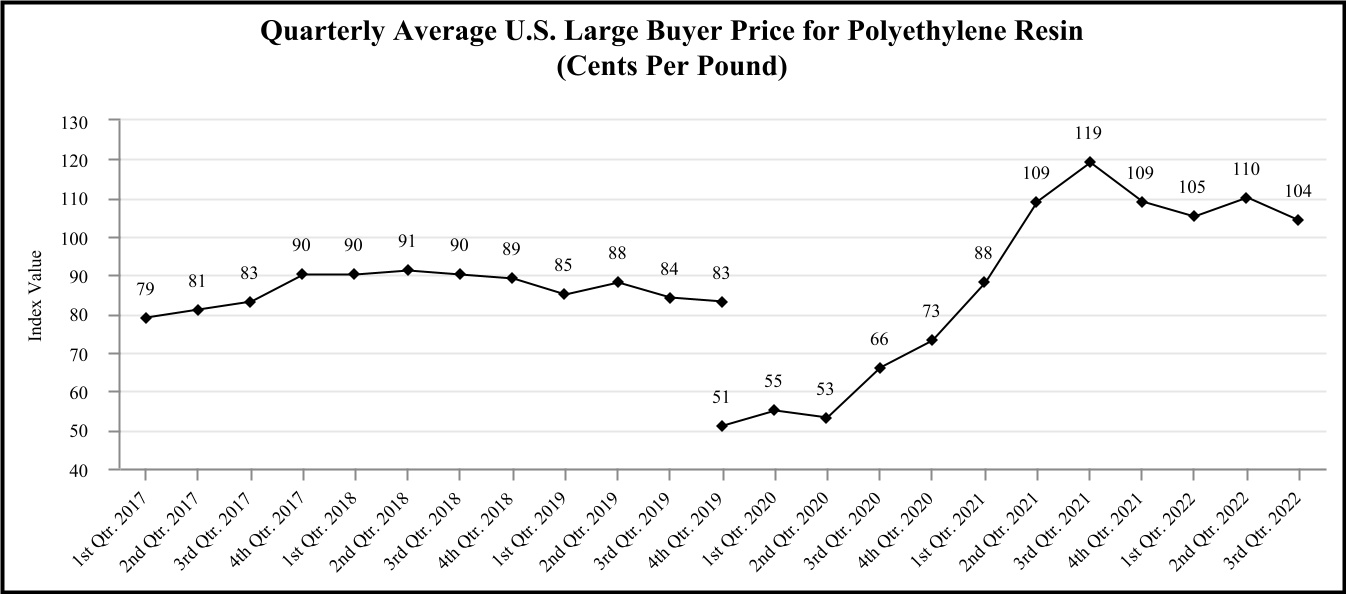
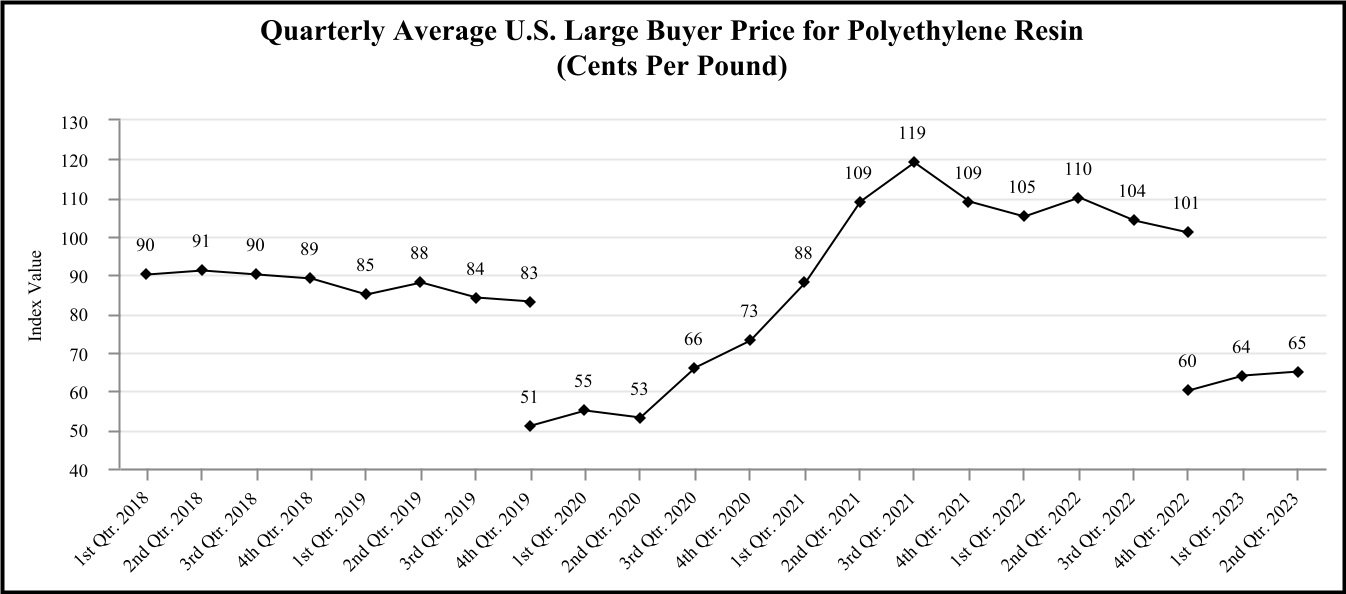
| | |
| Source: Quarterly averages computed by Tredegar using monthly data provided by IHS, Inc. In February 2020, IHS reflected a 32 cents per pound non-market adjustment based on their estimate of the growth of discounts in prior periods. The 4th quarter 2019 average rate of $0.51 per pound is shown on a pro forma basis as if the non-market adjustment was made in the fourth quarter of 2019. In January 2023, IHS reflected a 41 cents per pound non-market adjustment based on their estimate of the growth of discounts in the prior periods. The 4th quarter 2022 average rate of $0.60 per pound is shown on a pro forma basis as if the non-market adjustment was made in the fourth quarter of 2022. |
The price of resin is driven by several factors, including supply and demand and the price of oil, ethylene and natural gas. Selling prices to customers are set considering numerous factors, including the expected volatility of resin prices. PE Films has index-based pass-through raw material cost arrangements with customers. However, under certain agreements, changes in resin prices are not passed through for a period of 90 days. In response to unprecedented cost increases and supply issues for polyethylene and polypropylene resin, Tredegar Surface Protection implemented a quarterly resin cost pass-through mechanism, effective July 1, 2021, for all products and customers not previously covered by such arrangements. Pricing on the remainder of the business is based upon raw material costs and supply/demand dynamics within the markets that the Company competes.
Polyester resins, MEG and PTA used in flexible packaging films produced in Brazil are primarily purchased domestically, with other sources available mostly from Asia and the U.S. Given the nature of these products as commodities, pricing is derived from Asian pricing indexes. The volatility of the average quarterly prices for polyester fibers in Asia, which is
representative of polyester resin (a primary raw material for Flexible Packaging Films) pricing trends, is shown in the chart below:
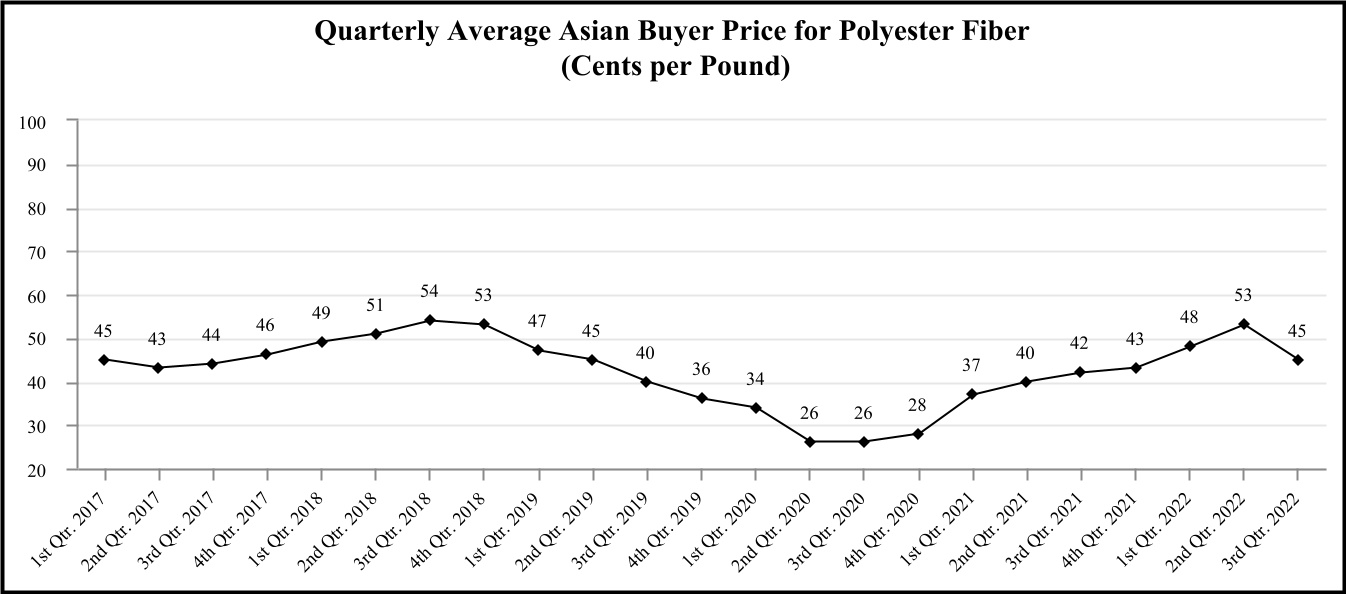
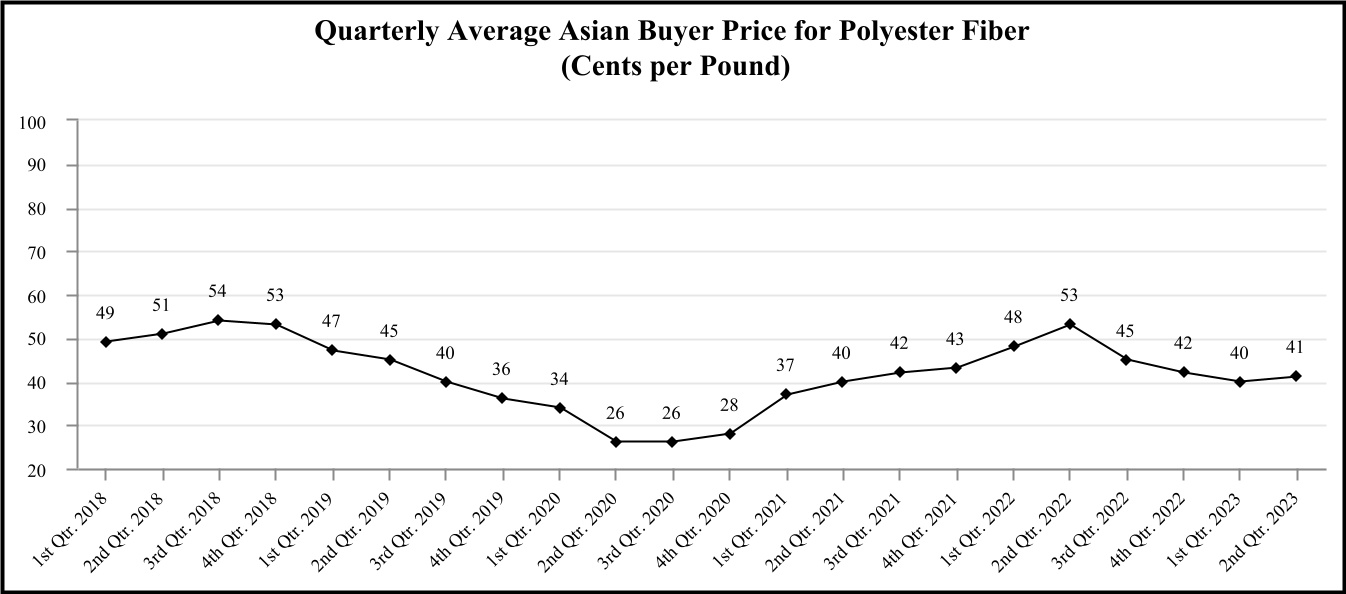
| | |
Source: Quarterly averages computed by Tredegar using monthly data from CMAI Global Index data.
|
The volatility of average quarterly prices of PTA and MEG in Asia (raw materials used in the production of polyester resins produced by Flexible Packaging Films) is shown in the chart below:
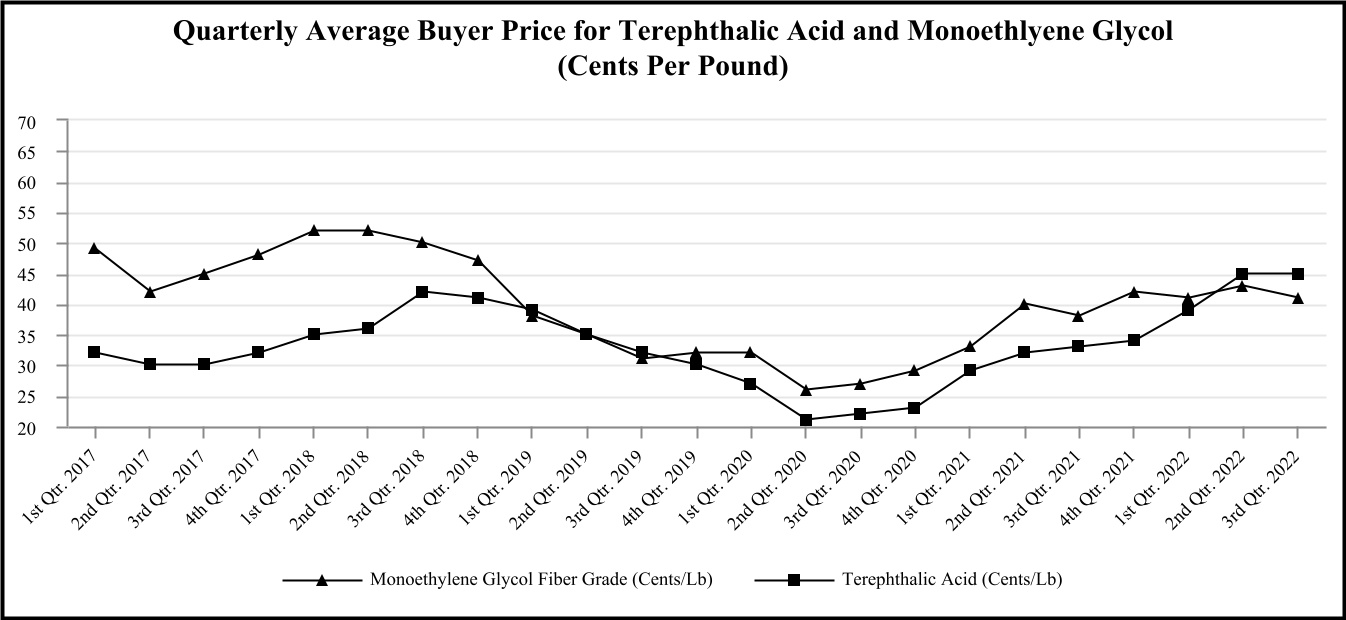
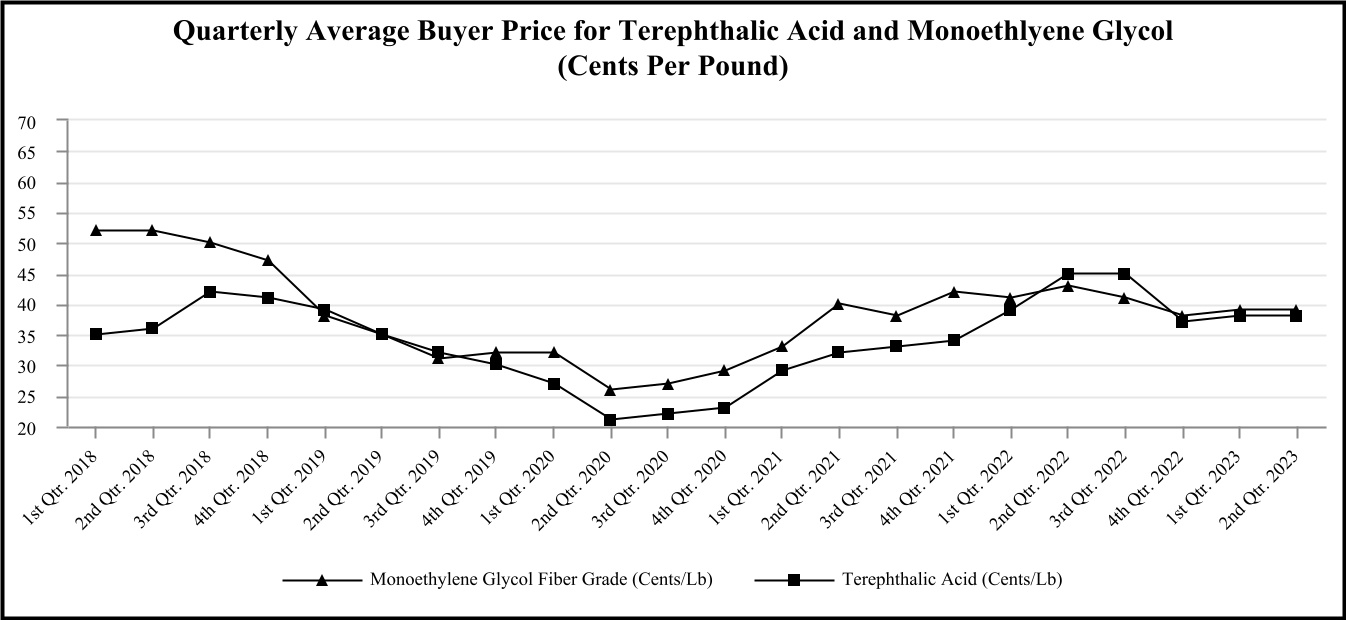
| | |
| Source: Quarterly averages computed by Tredegar using monthly data from CMAI Global Index data. |
Tredegar attempts to match the pricing and cost of its products in the same currency and generally views the volatility of foreign currencies and the corresponding impact on earnings and cash flow as part of the overall risk of operating in a global environment (for additional information, see trends for the Brazilian Real and Chinese Yuan in the charts on the following page). Exports from the U.S. are generally denominated in U.S. Dollars. The Company’s foreign currency exposure on income from continuing foreign operations relates to the Chinese Yuan and the Brazilian Real.
PE Films is generally able to match the currency of its sales and costs for its product lines. For flexible packaging films produced in Brazil, selling prices and key raw material costs are principally determined in U.S. Dollars and are impacted by local economic conditions and local and global competitive dynamics. Flexible Packaging Films is exposed to foreign
exchange translation risk (its functional currency is the Brazilian Real) because almost 90% of the sales of Flexible Packaging Films business unit in Brazil (“Terphane Ltda.”) and substantially all of its related raw material costs are quoted or priced in U.S. Dollars while its variable conversion, fixed conversion and sales, general and administrative costs before depreciation &
amortization (collectively “Terphane Ltda. Operating Costs”) are quoted or priced in Brazilian Real. This mismatch, together with a variety of economic variables impacting currency exchange rates, causes volatility that could negatively or positively impact EBITDA from ongoing operations for Flexible Packaging Films.
The Company estimates annual net costs of R$150177 million for the net mismatch translation exposure between Terphane Ltda.’s U.S. Dollar quoted or priced sales and raw material costs and underlying Brazilian Real quoted or priced Terphane Ltda. Operating Costs. Terphane Ltda. has outstanding foreign exchange average forward rate contracts to purchase Brazilian Real and sell U.S. Dollars to hedge its exposure. See Note 8 for more information on outstanding hedging contracts and this hedging program.
Tredegar estimates that the change in the value of foreign currencies relative to the U.S. Dollar for PE Films had a favorableno impact on EBITDA from ongoing operations for the second quarter of 2023 and an unfavorable impact on EBITDA from ongoing operations of $0.5 million in the third quarter of 2022 and $1.1$0.1 million in the first nine monthshalf of 20222023 compared with the same periods of 2021.2022.
Trends for the Brazilian Real and Chinese Yuan exchange rates relative to the U.S. Dollar are shown in the chart below.
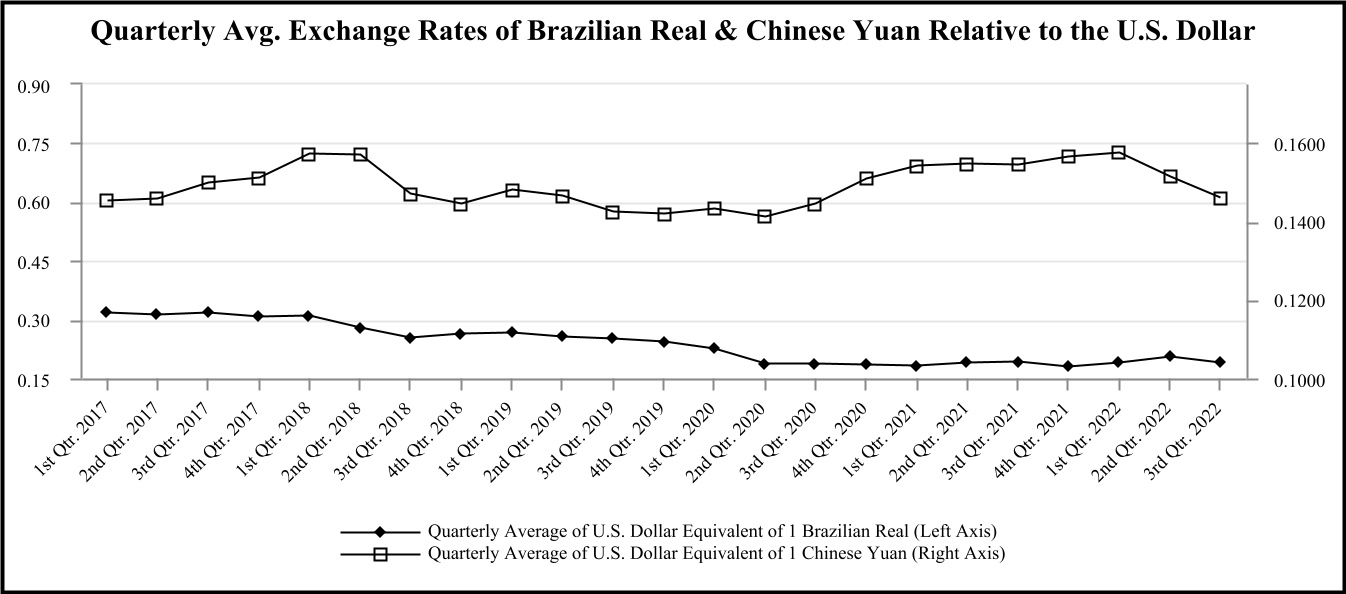

| | |
Source: Quarterly averages computed by Tredegar using daily closing data provided by Bloomberg.
|
Item 4. Controls and Procedures.
On November 1, 2018, the Company filed a Current Report on Form 8-K (the “November 2018 Form 8-K”) to disclose deficienciescertain material weaknesses in internal control over financial reporting. For further information, see the November 2018 Form 8-K and Item 4. “Controls and Procedures” of the Company’s Quarterly Report on Form 10-Q for the quarterly period ended September 30, 2018.
As of December 31, 2022, the results of management’s testing of the design, implementation and operating effectiveness of controls identified that the Company continued to have material weaknesses in its internal control over financial reporting; however, the material weaknesses existing as of December 31, 2022 were limited to certain discrete items within the previously identified material weaknesses. As a result, management revised its original six step remediation plan that was designed with the assistance of management’s outside consultant, an internationally recognized accounting firm. As of June 30, 2023, the Company continues to execute its revised remediation plan, including the implementation of the new and revised internal controls over financial reporting.
Evaluation of Disclosure Controls and Procedures
In connection with the preparation of this Form 10-Q, pursuant to Rule 13a-15(b) under the Securities Exchange Act of 1934, as amended (the “Exchange Act”), the Company carried out an evaluation with the participation of its management, including its Chief Executive Officer (principal executive officer) and Chief Financial Officer (principal financial officer), of the effectiveness of the design and operation of ourthe Company’s disclosure controls and procedures (as defined under Rule 13a-15(e) and 15d-15(e) under the Exchange Act) as of SeptemberJune 30, 2022.2023.
Based on this evaluation, the Company’s Chief Executive Officer and Chief Financial Officer concluded that, because of the material weaknesses in internal control over financial reporting discussed below, the Company’s disclosure controls and procedures were not effective as of SeptemberJune 30, 2022,2023, to ensure: (i) that information required to be disclosed by the Company in the reports that it files or submits under the Exchange Act, is recorded, processed, summarized and reported, within the time periods specified in the SEC’s rules and forms, and (ii) that such information is accumulated and communicated to management, including the Chief Executive Officer and Chief Financial Officer, as appropriate, to allow timely decisions regarding required disclosure.
Management’s Report on Internal Control Over Financial Reporting
The Company’s management is responsible for establishing and maintaining adequate internal control over financial reporting, as such term is defined in Rules 13a-15(f) and 15d-15(f) under the Exchange Act. The Company’s internal control over financial reporting is a process designed by or under the supervision of the Company’s Chief Executive Officer and Chief
Financial Officer, and overseen by the Board of Directors, to provide reasonable assurance regarding the reliability of financial reporting and the preparation of financial statements for external purposes in accordance with GAAP and includes policies and procedures that:
•a.Pertain to the maintenance of records that, in reasonable detail, accurately and fairly reflect the transactions and dispositions of the Company’s assets;
•b.Provide reasonable assurance that transactions are recorded as necessary to permit preparation of financial statements in accordance with GAAP, and that the Company’s receipts and expenditures are being made only in accordance with the authorization of its management and directors; and
•c.Provide reasonable assurance regarding prevention or timely detection of unauthorized acquisition, use or disposition of the Company’s assets that could have a material effect on the financial statements.
Because of its inherent limitations, internal control over financial reporting is not intended to provide absolute assurance that a misstatement of the Company’s consolidated financial statements would be prevented or detected. Also, projections of any evaluation of effectiveness to future periods are subject to the risk that controls may become inadequate because of changes in conditions, or that the degree of compliance with the policies or procedures may deteriorate.
A material weakness is a deficiency, or combination of deficiencies, in internal control over financial reporting, such that there is a reasonable possibility that a material misstatement of the annual or interim financial statements will not be prevented or detected on a timely basis.
Management conducted an evaluation of the effectiveness of the Company’s internal control over financial reporting as of December 31, 2021 using the criteria in Internal Control - Integrated Framework 2013 issued by the Committee of Sponsoring Organizations of the Treadway Commission (the “2013 COSO Framework”). As a result of this evaluation, managementBased on management’s assessment, the Company’s Chief Executive Officer and Chief Financial Officer concluded as disclosed in the 2021 Form 10-K, that the Company’sCompany did not maintain effective internal control over financial reporting was not effective as of December 31, 2021, because of the material weaknesses in internal control over financial reporting discussed below.
•Control Environment:2022. The Company did not have a sufficient number of trainedsufficiently attract, develop, and retain competent resources with assigned responsibility and accountability for the design, operation and documentation ofto fulfill internal control over financial reporting in accordance with the 2013 COSO Framework.
•Risk Assessment:The Company did not have an effective risk assessment process to identifyresponsibilities and evaluate at a sufficient level of detail all relevant risks of material misstatement, including fraud risks.
•Information and Communication: The Company did not have an effective information and communication process that identified and assessed the source of and controls necessary to ensure the reliability of information used in financial reporting and that communicates relevant information about roles and responsibilities for internal control over financial reporting.
•Monitoring Activities: The Company did not have effective monitoring activities to assess the operation of internal control over financial reporting, including the continued appropriateness of control design and level of documentation maintained to support control effectiveness.
•Control Activities: As a consequence of thethese material weaknesses, described above, internal control deficiencies related to the Company did not effectively design, implement and operation ofoperate process-level controls and general information technology controls were determined to be pervasive throughout the Company’sacross its financial reporting processes.
While these material weaknesses did not result in material misstatements of the Company’s consolidated financial statements as of and for the year ended December 31, 2021,2022, these material weaknesses create a reasonable possibility that a material misstatement of account balances or disclosures in annual or interim consolidated financial statements may not be prevented or detected in a timely manner. Accordingly, the Company concluded that the deficiencies represent material weaknesses in its internal control over financial reporting and its internal control over financial reporting was not effective as of December 31, 2021.2022.
The Company’s independent registered public accounting firm, KPMG LLP, which audited the 20212022 consolidated financial statements included in the 20212022 Form 10-K, expressed an adverse opinion on the operating effectiveness of the Company's internal control over financial reporting as of December 31, 2021.reporting.
Remediation Plan and Efforts to Address the Previously Identified Material Weaknesses
To remediate the material weaknesses described above, the Company, with the oversight of the Audit Committee of the Board of Directors (the “Audit Committee”), has been pursuing the six remediation steps as originally identified in the Company’s Annual Report on Form 10-K for the year ended December 31, 2018. The Company’srevised remediation plan was designed with the assistance of management’s outside consultant, an internationally recognized accounting firm.
Through the third quarter of 2022 and as of the date of this report, the Company substantially completed all items previously disclosed as expected to be completed in the third quarter of 2022 including implementing all remainingimplement new and revised internal controls over financial reporting designed as partreporting.
Through the second quarter of 2023, the Company has completed certain steps in its revised remediation plan, including:
a.Conducted interviews with relevant parties and confirmed management’s remediation plan. Management’s testingunderstanding of the internal control activities, including information used in the recording of transactions within the Company's financial reporting processes;
b.Completed a comprehensive review and update to the documentation of relevant processes with respect to the Company’s internal control over financial reporting;
c.Developed internal control remediation plans to enhance controls for deficiencies associated with the material weaknesses above, including an assessment of personnel skills and experience related to the design implementation and operating effectivenessoperation of internal control activities;
d.Substantially implemented all new and revised internal controls to address the previously identified deficiencies associated with the material weaknesses above;
e.Expanded the internal control compliance department with personnel that have appropriate internal control experience and identified resources for positions relevant to internal controls that had previously experienced turnover; and
f.Executed a targeted training withprogram to educate control owners are ongoing. Remediation efforts continueon the requirements of internal control activities, including maintaining adequate documentary evidence for deficiencies notedinternal control activities.
The design and implementation of certain new and revised internal controls associated with expenditure and revenue processes for one remaining manufacturing location of the Aluminum Extrusion business is scheduled for completion in the initial testing of a number of the newly implemented controls. In addition, the Company intends to finalize its ongoing risk assessment in the fourththird quarter of 2022, including2023.
The material weaknesses cannot be considered remediated until the risks arising from fraud.
applicable controls have operated for a sufficient period of time and management has concluded, through testing, that these controls are operating effectively. The Company is committed to the improvement of its internal control over financial reporting and management continues to work with its outside consultant to assist in those efforts, as necessary. The Company continues to monitor the impact of employee turnover the COVID-19 pandemic and other external factors on its remediation plan and its assessment of internal control over financial reporting. The material weaknesses cannot be considered remediated until the applicable controls have operated for a sufficient period of time and management has concluded, through testing, that these controls are operating effectively. The Company cannot assure you when it will remediate the identified material weaknesses, nor can it be certain whether additional actions will be required. Moreover, the Company cannot assure you that additional material weaknesses will not arise in the future.
Changes in Internal Control Over Financial Reporting
The Company is in the process of makingimplementing certain changes in its internal controls to remediate the material weaknesses as described above. The execution of the material aspects of this remediation plan began in the second quarter of 2019. Except as noted above, there has been no change in the Company’s internal control over financial reporting during the quarter ended SeptemberJune 30, 2022,2023, that has materially affected, or is reasonably likely to materially affect, its internal control over financial reporting (as defined in Rules 13a-15(f) and 15d-15(f) under the Exchange Act).
PART II - OTHER INFORMATION
Item 1A. Risk Factors.
As disclosed in “Item 1A. Risk Factors” in the 20212022 Form 10-K, and the Company's Quarterly Report on Form 10-Q for the period ended June 30, 2022 ("Second Quarter 2022 Form 10-Q"), there are a number of risks and uncertainties that can have a material effect on the operating results of our businesses and our financial condition. ThereExcept as set forth below, there are no additional material updates or changes to our risk factors previously disclosed in the 20212022 Form 10-K10-K.
Further impairment of the Surface Protection reporting unit’s goodwill could have a material non-cash adverse impact on our results of operations. The Company assesses goodwill for impairment when events or circumstances indicate that the carrying value may not be recoverable, or, at a minimum, on an annual basis (December 1st of each year). The valuation of goodwill depends on a variety of factors, including macroeconomic conditions, industry and market considerations, cost factors and overall financial performance, as well as Company and reporting unit factors, and goodwill impairment valuations can be sensitive to assumptions associated with such factors. Failure to successfully achieve projections could result in future impairments.
Manufacturers in the supply chain for consumer electronics continue to experience reduced capacity utilization and inventory corrections. In light of the continued uncertainty about the timing of a recovery for this market and the expected adverse future impact to the Surface Protection business, as of June 30, 2023 the Company performed a goodwill impairment analysis of the Surface Protection component of PE Films using projections that contemplate the expected market recovery and business conditions. The analysis concluded that the fair value of Surface Protection was less than its carrying value, thus a non-cash partial goodwill impairment of $15.4 million ($11.9 million after deferred income tax benefits) was recognized during the second quarter of 2023.
Further impairment to the Surface Protection reporting unit’s goodwill may be caused by factors outside the Company’s control, such as increasing competitive pricing pressures, continued weak consumer electronic market demand, lower than expected sales and profit growth rates, and various other factors. Significant and unanticipated changes could require an
additional non-cash charge for impairment in a future period, which may significantly affect the Company’s results of operations in the period of such charge.
Item 2. Unregistered Sales of Equity Securities and Use of Proceeds.
The Company’s Credit Agreement contains financial and other restrictive covenants, including a restriction on the Company’s ability to pay dividends to shareholders. For more information on the Credit Agreement, see “Item 2. Management’s Discussion and Analysis of Financial Condition and Results of Operations - Liquidity and Capital Resources.”
Item 5. Other Information.
Director and Officer Trading Arrangements
During the three months ended June 30, 2023, no director or officer of the Company adopted, terminated or modified a "Rule 10b5-1 trading arrangement" or "non-Rule 10b5-1 trading arrangement," as each term is defined in Item 408(a) of Regulation S-K.
Entry into a Material Definitive Agreement
On August 3, 2023, the Company, as borrower, entered into Amendment No. 2 (the “Second Amendment”) to the Second Quarter 2022 Form 10-Q.Amended and Restated Credit Agreement with the lenders named therein, JPMorgan Chase Bank, N.A., as administrative agent, Citizens Bank, N.A. and PNC Bank, National Association, as co-syndication agents, and Bank of America, N.A., U.S. Bank National Association and Wells Fargo Bank, National Association, as co-documentation agents, and the other lenders party thereto (collectively, the “Lenders”).
The following sets forth a description of the material terms of the Second Amendment:
a.Changed the fiscal quarter maximum Total Net Leverage Ratio covenant from 4.0x to: (i) 5.0x for the quarters ending September 30, 2023 through March 31, 2024, (ii) 4.75x for the quarter ending June 30, 2024, (iii) 4.25 for the quarter ending September 30, 2024, and (iv) 4.0x for the quarter ending December 31, 2024 and thereafter.
b.Changed the fiscal quarter minimum Interest Coverage Ratio covenant from 3.0x to: (i) 2.50x for the quarters ending September 30, 2023 through June 30, 2024, (ii) 2.75x for the quarter ending September 30, 2024, and (iii) 3.0x for the quarter ending December 31, 2024 and thereafter.
c.Reduced the maximum borrowing availability from $375 million to $200 million.
d.Increased the drawn spread by 25 basis points across all levels of the interest rate pricing grid, beginning the quarter ending September 30, 2023.
e.Amended the restricted payments covenant to prohibit dividends and share repurchases during fiscal quarters ending September 30, 2023 through December 31, 2024.
The Company and its affiliates regularly engage the Lenders to provide other banking services. All of these engagements are negotiated at arm’s length.
The foregoing description of the Second Amendment is not complete and is qualified in its entirety by reference to the entire Second Amendment, a copy of which is attached hereto as Exhibit 10.1 and incorporated herein by reference.
Closure of PE Films Technical Center
On August 3, 2023, the Company adopted a plan to close the PE Films technical center in Richmond, VA and reduce its efforts to develop and sell films supporting the semiconductor market. Future research & development activities for PE Films will be performed at the facility in Pottsville, PA. PE Films continues to have new business opportunities primarily relating to surface protection films that protect components of flat panel and flexible displays. The Company anticipates all activities to cease at the PE Films technical center in Richmond, VA, by the end of 2023. The Company expects to recognize cash costs associated with exit activities of $1.8 million for: (i) severance and related costs ($0.9 million), (ii) vacating the facility lease ($0.6 million payable through June 2025), and (iii) building closure costs ($0.3 million). In addition, the Company expects non-cash asset write-offs and accelerated depreciation of up to $4.5 million. Net annual cash savings of $3.4 million are anticipated, beginning in the fourth quarter of 2023.
Item 6. Exhibits. | | | | | | | | |
| 10.1 | | Amendment No. 1 to Second Amended and Restated Credit Agreement, dated as of November 29, 2022, among Tredegar Corporation, as borrower, the lenders named therein, JPMorgan Chase Bank, N.A., as administrative agent, Citizens Bank, N.A. and PNC Bank, National Association, as co-syndication agents, and Bank of America, N.A., U.S. Bank National Association and Wells Fargo Bank, National Association, as co-documentation agents, and the other lenders party thereto. |
| 10.2 | | Amendment No. 2 to Second Amended and Restated Credit Agreement, dated as of August 3, 2023, among Tredegar Corporation, as borrower, the lenders named therein, JPMorgan Chase Bank, N.A., as administrative agent, Citizens Bank, N.A. and PNC Bank, National Association, as co-syndication agents, and Bank of America, N.A., U.S. Bank National Association and Wells Fargo Bank, National Association, as co-documentation agents, and the other lenders party thereto. |
| 31.1 | | |
| 31.2 | | |
| 32.1 | | |
| 32.2 | | |
| 101 | | XBRL Instance Document and Related Items. |
| 104 | | Cover Page Interactive Data File (formatted in iXBRL and contained in Exhibit 101). |
SIGNATURES
Pursuant to the requirements of the Securities Exchange Act of 1934, the Registrant has duly caused this report to be signed on its behalf by the undersigned thereunto duly authorized. | | | | | | | | | | | | | | |
| | | | Tredegar Corporation |
| | | | (Registrant) |
| | |
| Date: | | NovemberAugust 9, 20222023 | | /s/ John M. Steitz |
| | | | John M. Steitz |
| | | | President and Chief Executive Officer |
| | | | (Principal Executive Officer) |
| | | | |
| Date: | | NovemberAugust 9, 20222023 | | /s/ D. Andrew Edwards |
| | | | D. Andrew Edwards |
| | | | Executive Vice President and Chief Financial Officer |
| | | | (Principal Financial Officer) |
| | | | |
| Date: | | NovemberAugust 9, 20222023 | | /s/ Frasier W. Brickhouse, II |
| | | | Frasier W. Brickhouse, II |
| | | | Corporate Treasurer and Controller |
| | | | (Principal Accounting Officer) |