UNITED STATES
SECURITIES AND EXCHANGE COMMISSION
Washington, D.C. 20549
FORM 10-Q
QUARTERLY REPORT PURSUANT TO SECTION 13 OR 15(d) OF |
| |
| ☑ | QUARTERLY REPORT PURSUANT TO SECTION 13 OR 15(d) OF THE SECURITIES EXCHANGE ACT OF 1934 |
For the quarterly period ended June 30, 201829, 2019
OR
|
| |
| ☐ | TRANSITION REPORT PURSUANT TO SECTION 13 OR 15(d) OF THE SECURITIES EXCHANGE ACT OF 1934
|
For the transition period from_ to_
Commission File Number: 0-18059
PTC Inc.
(Exact name of registrant as specified in its charter)
|
| | |
| Massachusetts | | 04-2866152 |
(State or other jurisdiction of incorporation or organization) | | (I.R.S. Employer Identification Number) |
140 Kendrick Street, Needham, 121 Seaport Boulevard, Boston, MA 0249402210
(Address of principal executive offices, including zip code)
(781) (781) 370-5000
(Registrant’s telephone number, including area code)
Indicate by check mark whether the registrant: (1) has filed all reports required to be filed by Section 13 or 15(d) of the Securities Exchange Act of 1934 during the preceding 12 months (or for such shorter period that the registrant was required to file such reports), and (2) has been subject to such filing requirements for the past 90 days. Yes þ☑ No ¨☐
Indicate by check mark whether the registrant has submitted electronically and posted on its corporate Web site, if any, every Interactive Data File required to be submitted and posted pursuant to Rule 405 of Regulation S-T during the preceding 12 months (or for such shorter period that the registrant was required to submit and post such files). Yes þ☑ No ¨☐
Indicate by check mark whether the registrant is a large accelerated filer, an accelerated filer, a non-accelerated filer, a smaller reporting company, or an emerging growth company. See the definitions of “large accelerated filer,” “accelerated filer”,filer,” “smaller reporting company”company,” and "emerging growth company" in Rule 12b-2 of the Exchange Act:
|
| | | | | | | | | | | |
| Large accelerated filer | þ☑ | | Accelerated filer | ¨☐ | | Non-accelerated filer | ¨☐ | | Smaller reporting company | ¨ | |
| | | | | | (Do not check if a smaller
reporting company)
| | | ☐ | |
| | | | | | | | | | Emerging growth company | ¨☐ | |
If an emerging growth company, indicate by check mark if the registrant has elected not to use the extended transition period for complying with any new or revised financial accounting standards provided pursuant to Section 13(a) of the Exchange Act. ¨☐
Indicate by check mark whether the registrant is a shell company (as defined in Rule 12b-2 of the Exchange Act). Yes ¨☐ No þ☑
Securities registered pursuant to Section 12(b) of the Act:
|
| | |
| Title of each class | Trading symbol(s) | Name of each exchange on which registered |
| Common Stock, $.01 par value per share | PTC | NASDAQ Global Select Market |
There were 117,829,713115,179,478 shares of our common stock outstanding on July 27, 2018.August 7, 2019.
PTC Inc.
INDEX TO FORM 10-Q
For the Quarter Ended June 30, 201829, 2019
|
| | |
| | | Page Number |
| Part I—FINANCIAL INFORMATION | |
| Item 1. | | |
| | | |
| | | |
| | | |
| | | |
| | | |
| | |
| Item 2. | | |
| Item 3. | | |
| Item 4. | | |
| | | |
| | |
| Part II—OTHER INFORMATION | |
| Item 1A. | | |
| Item 2. | | |
| Item 6. | | |
| |
PART I—FINANCIAL INFORMATION
| |
| ITEM 1. | UNAUDITED CONDENSED CONSOLIDATED FINANCIAL STATEMENTS |
PTC Inc.
CONSOLIDATED BALANCE SHEETS
(in thousands, except per share data)
(unaudited)
| | | | June 30,
2018 | | September 30,
2017 | June 29,
2019 | | September 30,
2018 |
| ASSETS | | | |
| | |
| Current assets: | | | |
| | |
| Cash and cash equivalents | $ | 266,552 |
| | $ | 280,003 |
| $ | 267,862 |
| | $ | 259,946 |
|
| Short-term marketable securities | 22,356 |
| | 18,408 |
| 33,073 |
| | 25,836 |
|
| Accounts receivable, net of allowance for doubtful accounts of $591 and $1,062 at June 30, 2018 and September 30, 2017, respectively | 130,079 |
| | 152,299 |
| |
| Accounts receivable, net of allowance for doubtful accounts of $822 and $607 at June 29, 2019 and September 30, 2018, respectively | | 321,426 |
| | 129,297 |
|
| Prepaid expenses | 46,600 |
| | 49,913 |
| 69,819 |
| | 48,997 |
|
| Other current assets | 122,625 |
| | 165,933 |
| 60,483 |
| | 169,708 |
|
| Total current assets | 588,212 |
| | 666,556 |
| 752,663 |
| | 633,784 |
|
| Property and equipment, net | 64,456 |
| | 63,600 |
| 107,752 |
| | 80,613 |
|
| Goodwill | 1,182,462 |
| | 1,182,772 |
| 1,245,084 |
| | 1,182,457 |
|
| Acquired intangible assets, net | 214,657 |
| | 257,908 |
| 183,180 |
| | 200,202 |
|
| Long-term marketable securities | 31,816 |
| | 31,907 |
| 21,553 |
| | 30,115 |
|
| Deferred tax assets | 138,958 |
| | 123,166 |
| 189,371 |
| | 165,566 |
|
| Other assets | 35,070 |
| | 34,475 |
| 148,998 |
| | 36,285 |
|
| Total assets | $ | 2,255,631 |
| | $ | 2,360,384 |
| $ | 2,648,601 |
| | $ | 2,329,022 |
|
| LIABILITIES AND STOCKHOLDERS’ EQUITY | | | |
| |
|
| Current liabilities: | | | |
| |
|
| Accounts payable | $ | 37,773 |
| | $ | 35,160 |
| $ | 44,065 |
| | $ | 53,473 |
|
| Accrued expenses and other current liabilities | 58,296 |
| | 80,761 |
| 95,790 |
| | 74,388 |
|
| Accrued compensation and benefits | 87,401 |
| | 110,957 |
| 78,854 |
| | 101,784 |
|
| Accrued income taxes | 6,683 |
| | 5,735 |
| 8,222 |
| | 18,044 |
|
| Deferred revenue | 474,957 |
| | 446,296 |
| 374,291 |
| | 487,590 |
|
| Total current liabilities | 665,110 |
| | 678,909 |
| 601,222 |
| | 735,279 |
|
| Long-term debt | 693,053 |
| | 712,406 |
| 698,916 |
| | 643,268 |
|
| Deferred tax liabilities | 5,862 |
| | 17,880 |
| 37,354 |
| | 5,589 |
|
| Deferred revenue | 8,994 |
| | 12,611 |
| 8,288 |
| | 11,852 |
|
| Other liabilities | 48,227 |
| | 53,142 |
| 87,226 |
| | 58,445 |
|
| Total liabilities | 1,421,246 |
| | 1,474,948 |
| 1,433,006 |
| | 1,454,433 |
|
| Commitments and contingencies (Note 13) |
| |
| |
| Commitments and contingencies (Note 14) | |
| |
|
| Stockholders’ equity: | | | |
| |
|
| Preferred stock, $0.01 par value; 5,000 shares authorized; none issued | — |
| | — |
| — |
| | — |
|
| Common stock, $0.01 par value; 500,000 shares authorized; 115,491 and 115,333 shares issued and outstanding at June 30, 2018 and September 30, 2017, respectively | 1,155 |
| | 1,153 |
| |
| Common stock, $0.01 par value; 500,000 shares authorized; 115,111 and 117,981 shares issued and outstanding at June 29, 2019 and September 30, 2018, respectively | | 1,151 |
| | 1,180 |
|
| Additional paid-in capital | 1,524,399 |
| | 1,609,030 |
| 1,504,512 |
| | 1,558,403 |
|
| Accumulated deficit | (612,600 | ) | | (650,840 | ) | (197,056 | ) | | (599,409 | ) |
| Accumulated other comprehensive loss | (78,569 | ) | | (73,907 | ) | (93,012 | ) | | (85,585 | ) |
| Total stockholders’ equity | 834,385 |
| | 885,436 |
| 1,215,595 |
| | 874,589 |
|
| Total liabilities and stockholders’ equity | $ | 2,255,631 |
| | $ | 2,360,384 |
| $ | 2,648,601 |
| | $ | 2,329,022 |
|
The accompanying notes are an integral part of the condensed consolidated financial statements.
PTC Inc.
CONSOLIDATED STATEMENTS OF OPERATIONS
(in thousands, except per share data)
(unaudited)
| | | | Three months ended | | Nine months ended | Three months ended | | Nine months ended |
| | June 30,
2018 | | July 1,
2017 | | June 30,
2018 | | July 1,
2017 | June 29,
2019 | | June 30,
2018 | | June 29,
2019 | | June 30,
2018 |
| Revenue: | | | | | | | | | | | | | | |
| Subscription | $ | 126,712 |
| | $ | 74,859 |
| | $ | 339,651 |
| | $ | 195,001 |
| |
| Support | 121,127 |
| | 140,428 |
| | 379,007 |
| | 433,624 |
| |
| Total recurring revenue | 247,839 |
| | 215,287 |
| | 718,658 |
| | 628,625 |
| |
| Perpetual license | 25,780 |
| | 32,348 |
| | 82,604 |
| | 94,099 |
| |
| Total subscription, support and license revenue | 273,619 |
| | 247,635 |
| | 801,262 |
| | 722,724 |
| |
| License | | $ | 62,918 |
| | $ | 136,568 |
| | $ | 230,116 |
| | $ | 376,591 |
|
| Support and cloud services | | 190,487 |
| | 137,051 |
| | 566,053 |
| | 424,671 |
|
| Total software revenue | | 253,405 |
| | 273,619 |
| | 796,169 |
| | 801,262 |
|
| Professional services | 41,158 |
| | 43,658 |
| | 128,041 |
| | 134,936 |
| 42,081 |
| | 41,158 |
| | 124,457 |
| | 128,041 |
|
| Total revenue | 314,777 |
| | 291,293 |
| | 929,303 |
| | 857,660 |
| 295,486 |
| | 314,777 |
| | 920,626 |
| | 929,303 |
|
| Cost of revenue: | | | | | | | |
| |
| | | | |
| Cost of license and subscription revenue | 24,010 |
| | 21,648 |
| | 71,505 |
| | 62,333 |
| |
| Cost of support revenue | 22,223 |
| | 23,635 |
| | 67,453 |
| | 69,028 |
| |
| Cost of license revenue | | 13,307 |
| | 11,982 |
| | 38,745 |
| | 35,950 |
|
| Cost of support and cloud services revenue | | 33,785 |
| | 34,291 |
| | 97,856 |
| | 103,128 |
|
| Total cost of software revenue | 46,233 |
| | 45,283 |
| | 138,958 |
| | 131,361 |
| 47,092 |
| | 46,273 |
| | 136,601 |
| | 139,078 |
|
| Cost of professional services revenue | 35,323 |
| | 36,985 |
| | 109,187 |
| | 114,852 |
| 35,613 |
| | 35,360 |
| | 103,360 |
| | 109,298 |
|
| Total cost of revenue | 81,556 |
| | 82,268 |
| | 248,145 |
| | 246,213 |
| 82,705 |
| | 81,633 |
| | 239,961 |
| | 248,376 |
|
| Gross margin | 233,221 |
| | 209,025 |
| | 681,158 |
| | 611,447 |
| 212,781 |
| | 233,144 |
| | 680,665 |
| | 680,927 |
|
| Operating expenses: | | | | | | | |
|
| |
|
| | | | |
| Sales and marketing | 107,741 |
| | 93,101 |
| | 305,386 |
| | 271,568 |
| 108,202 |
| | 107,801 |
| | 316,142 |
| | 305,566 |
|
| Research and development | 61,218 |
| | 59,850 |
| | 187,381 |
| | 175,474 |
| 60,590 |
| | 61,221 |
| | 182,774 |
| | 187,390 |
|
| General and administrative | 33,082 |
| | 35,294 |
| | 101,439 |
| | 108,789 |
| 28,773 |
| | 33,098 |
| | 102,008 |
| | 101,487 |
|
| Amortization of acquired intangible assets | 7,850 |
| | 7,973 |
| | 23,566 |
| | 23,986 |
| 5,920 |
| | 7,850 |
| | 17,786 |
| | 23,566 |
|
| Restructuring and other charges, net | 1,627 |
| | 1,551 |
| | 1,846 |
| | 8,300 |
| (9 | ) | | 1,627 |
| | 45,464 |
| | 1,846 |
|
| Total operating expenses | 211,518 |
| | 197,769 |
| | 619,618 |
| | 588,117 |
| 203,476 |
| | 211,597 |
| | 664,174 |
| | 619,855 |
|
| Operating income | 21,703 |
| | 11,256 |
| | 61,540 |
| | 23,330 |
| 9,305 |
| | 21,547 |
| | 16,491 |
| | 61,072 |
|
| Interest expense | (10,646 | ) | | (10,200 | ) | | (31,072 | ) | | (32,239 | ) | (10,816 | ) | | (10,646 | ) | | (32,475 | ) | | (31,072 | ) |
| Interest income and other expense, net | (1,086 | ) | | (357 | ) | | (2,481 | ) | | 2,049 |
| |
| Other income (expense), net | | 1,026 |
| | (930 | ) | | 2,501 |
| | (2,013 | ) |
| Income (loss) before income taxes | 9,971 |
| | 699 |
| | 27,987 |
| | (6,860 | ) | (485 | ) | | 9,971 |
| | (13,483 | ) | | 27,987 |
|
| Provision (benefit) for income taxes | (7,026 | ) | | 1,650 |
| | (10,809 | ) | | 4,336 |
| 14,273 |
| | (7,026 | ) | | 23,803 |
| | (10,809 | ) |
| Net income (loss) | $ | 16,997 |
| | $ | (951 | ) | | $ | 38,796 |
| | $ | (11,196 | ) | $ | (14,758 | ) | | $ | 16,997 |
| | $ | (37,286 | ) | | $ | 38,796 |
|
| Earnings (loss) per share—Basic | $ | 0.15 |
| | $ | (0.01 | ) | | $ | 0.33 |
| | $ | (0.10 | ) | $ | (0.13 | ) | | $ | 0.15 |
| | $ | (0.32 | ) | | $ | 0.33 |
|
| Earnings (loss) per share—Diluted | $ | 0.14 |
| | $ | (0.01 | ) | | $ | 0.33 |
| | $ | (0.10 | ) | $ | (0.13 | ) | | $ | 0.14 |
| | $ | (0.32 | ) | | $ | 0.33 |
|
| Weighted average shares outstanding—Basic | 115,774 |
| | 115,615 |
| | 115,915 |
| | 115,511 |
| 116,133 |
| | 115,774 |
| | 117,636 |
| | 115,915 |
|
| Weighted average shares outstanding—Diluted | 117,500 |
| | 115,615 |
| | 117,687 |
| | 115,511 |
| 116,133 |
| | 117,500 |
| | 117,636 |
| | 117,687 |
|
The accompanying notes are an integral part of the condensed consolidated financial statements.
PTC Inc.
CONSOLIDATED STATEMENTS OF COMPREHENSIVE INCOME (LOSS)
(in thousands)
(unaudited)
| | | | Three months ended | | Nine months ended | Three months ended | | Nine months ended |
| | June 30,
2018 | | July 1,
2017 | | June 30,
2018 | | July 1,
2017 | June 29,
2019 | | June 30,
2018 | | June 29,
2019 | | June 30,
2018 |
| Net income (loss) | $ | 16,997 |
| | $ | (951 | ) | | $ | 38,796 |
| | $ | (11,196 | ) | $ | (14,758 | ) | | $ | 16,997 |
| | $ | (37,286 | ) | | $ | 38,796 |
|
| Other comprehensive income (loss), net of tax: | | | | | | | | | | | | | | |
Unrealized hedge gain (loss) arising during the period, net of tax of $0.6 million and $0.3 million in the third quarter of 2018 and 2017, respectively, and $0.1 million and $0 million in the first nine months of 2018 and 2017, respectively
| 3,910 |
| | (2,298 | ) | | 950 |
| | 224 |
| |
| Net hedge (gain) loss reclassified into earnings, net of tax of $0 million in both the third quarter of 2018 and 2017, respectively, and $0.3 million and $0.1 million in the first nine months of 2018 and 2017, respectively | 242 |
| | 75 |
| | 2,327 |
| | (777 | ) | |
| Unrealized gain (loss) on hedging instruments | 4,152 |
| | (2,223 | ) | | 3,277 |
| | (553 | ) | |
| Hedge gain (loss) arising during the period, net of tax of $0.2 million and $0.6 million in the third quarter of 2019 and 2018, respectively, and $0 million and $0.1 million in the first nine months of 2019 and 2018, respectively | | (2,644 | ) | | 3,910 |
| | (1,818 | ) | | 950 |
|
| Net hedge (gain) loss reclassified into earnings, net of tax of $0 million in the third quarter of 2019 and 2018, respectively, and $0.1 million and $0.3 million in the first nine months of 2019 and 2018, respectively | | — |
| | 242 |
| | (549 | ) | | 2,327 |
|
| Realized and unrealized gain (loss) on hedging instruments | | (2,644 | ) | | 4,152 |
| | (2,367 | ) | | 3,277 |
|
| Foreign currency translation adjustment, net of tax of $0 for each period | (21,628 | ) | | 17,553 |
| | (8,859 | ) | | 3,893 |
| 4,393 |
| | (21,628 | ) | | (7,209 | ) | | (8,859 | ) |
| Unrealized gain (loss) on marketable securities, net of tax of $0 for each period | 67 |
| | 21 |
| | (379 | ) | | (50 | ) | 175 |
| | 67 |
| | 477 |
| | (379 | ) |
| Amortization of net actuarial pension loss included in net income, net of tax of $0.1 million and $0.2 million in the third quarter of 2018 and 2017, respectively, and $0.5 million and $0.7 million in the first nine months of 2018 and 2017, respectively | 386 |
| | 597 |
| | 1,143 |
| | 1,687 |
| |
| Amortization of net actuarial pension loss included in net income, net of tax of $0.2 million and $0.1 million in the third quarter of 2019 and 2018, respectively, and $0.5 million in the first nine months of 2019 and 2018, respectively | | 418 |
| | 386 |
| | 1,277 |
| | 1,143 |
|
| Change in unamortized pension loss during the period related to changes in foreign currency | 884 |
| | (1,721 | ) | | 156 |
| | (343 | ) | (230 | ) | | 884 |
| | 395 |
| | 156 |
|
| Other comprehensive income (loss) | (16,139 | ) | | 14,227 |
| | (4,662 | ) | | 4,634 |
| 2,112 |
| | (16,139 | ) | | (7,427 | ) | | (4,662 | ) |
| Comprehensive income (loss) | $ | 858 |
| | $ | 13,276 |
| | $ | 34,134 |
| | $ | (6,562 | ) | $ | (12,646 | ) | | $ | 858 |
| | $ | (44,713 | ) | | $ | 34,134 |
|
The accompanying notes are an integral part of the condensed consolidated financial statements.
PTC Inc.
CONSOLIDATED STATEMENTS OF CASH FLOWS
(in thousands)
(unaudited)
| | | | Nine months ended | Nine months ended |
| | June 30,
2018 | | July 1,
2017 | June 29,
2019 | | June 30,
2018 |
| Cash flows from operating activities: | | | | | | |
| Net income (loss) | $ | 38,796 |
| | $ | (11,196 | ) | $ | (37,286 | ) | | $ | 38,796 |
|
| Adjustments to reconcile net income (loss) to net cash provided (used) by operating activities: | | | | |
| Adjustments to reconcile net income to net cash provided by operating activities: | | | | |
| Depreciation and amortization | 65,303 |
| | 64,187 |
| 58,634 |
| | 65,303 |
|
| Stock-based compensation | 52,015 |
| | 56,139 |
| 71,608 |
| | 52,015 |
|
| Other non-cash items, net | 304 |
| | 1,536 |
| (2,721 | ) | | 304 |
|
| Changes in operating assets and liabilities, excluding the effects of acquisitions: | | | | | | |
| Accounts receivable | 21,195 |
| | 34,913 |
| 88,254 |
| | 21,195 |
|
| Accounts payable and accrued expenses | (16,539 | ) | | 2,594 |
| 4,124 |
| | (16,539 | ) |
| Accrued compensation and benefits | (22,348 | ) | | (50,518 | ) | (23,442 | ) | | (22,348 | ) |
| Deferred revenue | 82,794 |
| | 45,985 |
| 25,325 |
| | 82,794 |
|
| Accrued income taxes | (30,005 | ) | | (17,832 | ) | (12,777 | ) | | (30,005 | ) |
| Other current assets and prepaid expenses | (5,434 | ) | | (7,317 | ) | (6,336 | ) | | (4,964 | ) |
| Other noncurrent assets and liabilities | (759 | ) | | (16,028 | ) | 64,546 |
| | (759 | ) |
| Net cash provided by operating activities | 185,322 |
| | 102,463 |
| 229,929 |
| | 185,792 |
|
| Cash flows from investing activities: | | | | | | |
| Additions to property and equipment | (18,666 | ) | | (19,333 | ) | (59,579 | ) | | (18,666 | ) |
| Purchase of intangible asset | (3,000 | ) | | — |
| — |
| | (3,000 | ) |
| Purchases of short- and long-term marketable securities | (18,063 | ) | | (14,173 | ) | (18,950 | ) | | (18,063 | ) |
| Proceeds from maturities of short- and long-term marketable securities | 13,640 |
| | 13,440 |
| 20,677 |
| | 13,640 |
|
| Acquisitions of businesses, net of cash acquired | (3,000 | ) | | (4,960 | ) | (86,737 | ) | | (3,000 | ) |
| Purchases of investments | (1,000 | ) | | — |
| (7,500 | ) | | (1,000 | ) |
| Proceeds from sales of investments | — |
| | 15,218 |
| |
| Net cash used by investing activities | (30,089 | ) | | (9,808 | ) | |
| Settlement of net investment hedges | | 4,509 |
| | — |
|
| Net cash used in investing activities | | (147,580 | ) | | (30,089 | ) |
| Cash flows from financing activities: | | | | | | |
| Borrowings under credit facility | 200,000 |
| | 150,000 |
| 205,000 |
| | 200,000 |
|
| Repayments of borrowings under credit facility | (220,000 | ) | | (190,000 | ) | (150,000 | ) | | (220,000 | ) |
| Repurchases of common stock | (100,000 | ) | | (34,994 | ) | (89,995 | ) | | (100,000 | ) |
| Proceeds from issuance of common stock | 7,472 |
| | 3,978 |
| 4,158 |
| | 7,472 |
|
| Credit facility origination costs | — |
| | (184 | ) | |
| Contingent consideration | (7,750 | ) | | (11,054 | ) | (1,575 | ) | | (7,750 | ) |
| Payments of withholding taxes in connection with vesting of stock-based awards | (44,797 | ) | | (26,244 | ) | |
| Payments of withholding taxes in connection with stock-based awards | | (44,191 | ) | | (44,797 | ) |
| Net cash used in financing activities | (165,075 | ) | | (108,498 | ) | (76,603 | ) | | (165,075 | ) |
| Effect of exchange rate changes on cash and cash equivalents | (3,609 | ) | | (1,397 | ) | |
| Net increase (decrease) in cash and cash equivalents | (13,451 | ) | | (17,240 | ) | |
| Cash and cash equivalents, beginning of period | 280,003 |
| | 277,935 |
| |
| Cash and cash equivalents, end of period | $ | 266,552 |
| | $ | 260,695 |
| |
| Effect of exchange rate changes on cash, cash equivalents and restricted cash | | 2,143 |
| | (3,609 | ) |
| Net increase in cash, cash equivalents, and restricted cash | | 7,889 |
| | (12,981 | ) |
| Cash, cash equivalents, and restricted cash, beginning of period | | 261,093 |
| | 281,209 |
|
| Cash, cash equivalents, and restricted cash, end of period | | $ | 268,982 |
| | $ | 268,228 |
|
The accompanying notes are an integral part of the condensed consolidated financial statements.
PTC Inc.
CONSOLIDATED STATEMENTS OF STOCKHOLDERS’ EQUITY
(in thousands)
(unaudited)
|
| | | | | | | | | | | | | | | | | | | | | | |
| | Three months ended June 29, 2019 |
| | Common Stock | | Additional Paid-in Capital | | Accumulated Deficit | | Accumulated Other Comprehensive Loss | | Total Stockholders’ Equity |
| | Shares | | Amount | |
| Balance as of March 31, 2019 | 118,098 |
| | $ | 1,181 |
| | $ | 1,523,949 |
| | $ | (182,298 | ) | | $ | (95,124 | ) | | $ | 1,247,708 |
|
| Common stock issued for employee stock-based awards | 371 |
| | 4 |
| | (4 | ) | | — |
| | — |
| | — |
|
| Shares surrendered by employees to pay taxes related to stock-based awards | (113 | ) | | (1 | ) | | (9,699 | ) | | — |
| | — |
| | (9,700 | ) |
| Compensation expense from stock-based awards | — |
| | — |
| | 15,234 |
| | — |
| | — |
| | 15,234 |
|
| Net loss | — |
| | — |
| | — |
| | (14,758 | ) | | — |
| | (14,758 | ) |
| Repurchases of common stock | (3,245 | ) | | (33 | ) | | (24,968 | ) | | — |
| | — |
| | (25,001 | ) |
Unrealized loss on net investment hedges, net of tax
| — |
| | — |
| | — |
| | — |
| | (2,644 | ) | | (2,644 | ) |
| Foreign currency translation adjustment | — |
| | — |
| | — |
| | — |
| | 4,393 |
| | 4,393 |
|
| Unrealized gain on marketable securities, net of tax | — |
| | — |
| | — |
| | — |
| | 175 |
| | 175 |
|
| Change in pension benefits, net of tax | — |
| | — |
| | — |
| | — |
| | 188 |
| | 188 |
|
| Balance as of June 29, 2019 | 115,111 |
| | $ | 1,151 |
| | $ | 1,504,512 |
| | $ | (197,056 | ) | | $ | (93,012 | ) | | $ | 1,215,595 |
|
|
| | | | | | | | | | | | | | | | | | | | | | |
| | Nine months ended June 29, 2019 |
| | Common Stock | | Additional Paid-in Capital | | Accumulated Deficit | | Accumulated Other Comprehensive Loss | | Total Stockholders’ Equity |
| | Shares | | Amount | |
| Balance as of October 1, 2018 | 117,981 |
| | $ | 1,180 |
| | $ | 1,558,403 |
| | $ | (599,409 | ) | | $ | (85,585 | ) | | $ | 874,589 |
|
| ASU 2016-16 adoption | — |
| | — |
| | — |
| | 72,261 |
| | — |
| | 72,261 |
|
| ASC 606 adoption | — |
| | — |
| | — |
| | 367,378 |
| | — |
| | 367,378 |
|
| Common stock issued for employee stock-based awards | 1,479 |
| | 15 |
| | (15 | ) | | — |
| | — |
| | — |
|
| Shares surrendered by employees to pay taxes related to stock-based awards | (501 | ) | | (5 | ) | | (44,186 | ) | | — |
| | — |
| | (44,191 | ) |
| Common stock issued | — |
| | — |
| | (140 | ) | | — |
| | — |
| | (140 | ) |
| Common stock issued for employee stock purchase plan | 122 |
| | 1 |
| | 8,797 |
| | — |
| | — |
| | 8,798 |
|
| Compensation expense from stock-based awards | — |
| | — |
| | 71,608 |
| | — |
| | — |
| | 71,608 |
|
| Net loss | — |
| | — |
| | — |
| | (37,286 | ) | | — |
| | (37,286 | ) |
| Repurchases of common stock | (3,970 | ) | | (40 | ) | | (89,955 | ) | | — |
| | — |
| | (89,995 | ) |
| Unrealized loss on cash flow hedges, net of tax | — |
| | — |
| | — |
| | — |
| | (385 | ) | | (385 | ) |
| Unrealized loss on net investment hedges, net of tax | — |
| | — |
| | — |
| | — |
| | (1,982 | ) | | (1,982 | ) |
| Foreign currency translation adjustment | — |
| | — |
| | — |
| | — |
| | (7,209 | ) | | (7,209 | ) |
| Unrealized gain on marketable securities, net of tax | — |
| | — |
| | — |
| | — |
| | 477 |
| | 477 |
|
| Change in pension benefits, net of tax | — |
| | — |
| | — |
| | — |
| | 1,672 |
| | 1,672 |
|
| Balance as of June 29, 2019 | 115,111 |
| | $ | 1,151 |
| | $ | 1,504,512 |
| | $ | (197,056 | ) | | $ | (93,012 | ) | | $ | 1,215,595 |
|
|
| | | | | | | | | | | | | | | | | | | | | | |
| | Three months ended June 30, 2018 |
| | Common Stock | | Additional Paid-in Capital | | Accumulated Deficit | | Accumulated Other Comprehensive Loss | | Total Stockholders’ Equity |
| | Shares | | Amount | |
| Balance as of April 1, 2018 | 116,338 |
| | $ | 1,163 |
| | $ | 1,618,588 |
| | $ | (629,597 | ) | | $ | (62,430 | ) | | $ | 927,724 |
|
| Common stock issued for employee stock-based awards | 428 |
| | 4 |
| | (4 | ) | | — |
| | — |
| | — |
|
| Shares surrendered by employees to pay taxes related to stock-based awards | (128 | ) | | (1 | ) | | (10,854 | ) | | — |
| | — |
| | (10,855 | ) |
| Compensation expense from stock-based awards | — |
| | — |
| | 16,658 |
| | — |
| | — |
| | 16,658 |
|
| Net income | — |
| | — |
| | — |
| | 16,997 |
| | — |
| | 16,997 |
|
| Repurchases of common stock | (1,147 | ) | | (11 | ) | | (99,989 | ) | | — |
| | — |
| | (100,000 | ) |
| Unrealized gain on cash flow hedges, net of tax | — |
| | — |
| | — |
| | — |
| | 4,152 |
| | 4,152 |
|
| Foreign currency translation adjustment | — |
| | — |
| | — |
| | — |
| | (21,628 | ) | | (21,628 | ) |
| Unrealized gain on marketable securities, net of tax | — |
| | — |
| | — |
| | — |
| | 67 |
| | 67 |
|
| Change in pension benefits, net of tax | — |
| | — |
| | — |
| | — |
| | 1,270 |
| | 1,270 |
|
| Balance as of June 30, 2018 | 115,491 |
| | $ | 1,155 |
| | $ | 1,524,399 |
| | $ | (612,600 | ) | | $ | (78,569 | ) | | $ | 834,385 |
|
|
| | | | | | | | | | | | | | | | | | | | | | |
| | Nine months ended June 30, 2018 |
| | Common Stock | | Additional Paid-in Capital | | Accumulated Deficit | | Accumulated Other Comprehensive Loss | | Total Stockholders’ Equity |
| | Shares | | Amount | �� |
| Balance as of October 1, 2017 | 115,333 |
| | $ | 1,153 |
| | $ | 1,609,030 |
| | $ | (650,840 | ) | | $ | (73,907 | ) | | $ | 885,436 |
|
| ASU 2016-09 adoption | — |
| | — |
| | 681 |
| | (556 | ) | | — |
| | 125 |
|
| Common stock issued for employee stock-based awards | 1,805 |
| | 18 |
| | (18 | ) | | — |
| | — |
| | — |
|
| Shares surrendered by employees to pay taxes related to stock-based awards | (658 | ) | | (6 | ) | | (44,791 | ) | | — |
| | — |
| | (44,797 | ) |
| Common stock issued for employee stock purchase plan | 158 |
| | 1 |
| | 7,471 |
| | — |
| | — |
| | 7,472 |
|
| Compensation expense from stock-based awards | — |
| | — |
| | 52,015 |
| | — |
| | — |
| | 52,015 |
|
| Net income | — |
| | — |
| | — |
| | 38,796 |
| | — |
| | 38,796 |
|
| Repurchases of common stock | (1,147 | ) | | (11 | ) | | (99,989 | ) | | — |
| | — |
| | (100,000 | ) |
| Unrealized gain on cash flow hedges, net of tax | — |
| | — |
| | — |
| | — |
| | 3,277 |
| | 3,277 |
|
| Foreign currency translation adjustment | — |
| | — |
| | — |
| | — |
| | (8,859 | ) | | (8,859 | ) |
| Unrealized loss on marketable securities, net of tax | — |
| | — |
| | — |
| | — |
| | (379 | ) | | (379 | ) |
| Change in pension benefits, net of tax | — |
| | — |
| | — |
| | — |
| | 1,299 |
| | 1,299 |
|
| Balance as of June 30, 2018 | 115,491 |
| | $ | 1,155 |
| | $ | 1,524,399 |
| | $ | (612,600 | ) | | $ | (78,569 | ) | | $ | 834,385 |
|
The accompanying notes are an integral part of the condensed consolidated financial statements.
PTC Inc.
NOTES TO CONDENSED CONSOLIDATED FINANCIAL STATEMENTS
(unaudited)
1. Basis of Presentation
General
The accompanying unaudited condensed consolidated financial statements include the accounts of PTC Inc. and its wholly owned subsidiaries and have been prepared by management in accordance with accounting principles generally accepted in the United States of America and in accordance with the rules and regulations of the Securities and Exchange Commission regarding interim financial reporting. Accordingly, they do not include all the information and footnotes required by generally accepted accounting principles for complete financial statements. While we believe that the disclosures presented are adequate in order to make the information not misleading, these unaudited quarterly financial statements should be read in conjunction with our annual consolidated financial statements and related notes included in our Annual Report on Form 10-K for the fiscal year ended September 30, 2017.2018. In the opinion of management, the accompanying unaudited condensed consolidated financial statements contain all adjustments, consisting only of those of a normal recurring nature, necessary for a fair statement of our financial position, results of operations and cash flows at the dates and for the periods indicated. The September 30, 20172018 Consolidated Balance Sheet included herein is derived from our audited consolidated financial statements.
Unless otherwise indicated, all references to a year mean our fiscal year, which ends on September 30. Our fiscal quarters end on a Saturday following a thirteen-week calendar and may result in different quarter end dates year to year. The third quarter of 2019 ended on June 29, 2019 and the third quarter of 2018 ended on June 30, 2018 and the third quarter of 2017 ended on July 1, 2017.2018. The results of operations for the nine months ended June 30, 201829, 2019 are not necessarily indicative of the results expected for the remainder of the fiscal year.
Changes in Presentation and Reclassifications
Effective at the beginning of fiscal 2018, in accordance with the adoption of ASU 2016-09, Compensation - Stock Compensation (Topic 718): Improvements to Employee Share-Based Payment Accounting, excess tax benefits are now classified as an operating activity on the statement of cash flows rather than as a financing activity. The prior period excess tax benefits have been reclassified for comparability.
Segments
In fiscal 2017, we had three operating and reportable segments: (1) the Solutions Group, which included license, subscription, support and cloud services revenue for our core CAD, SLM and PLM products; (2) the IoT Group, which included license, subscription, support and cloud services revenue for our IoT, analytics and augmented reality solutions; and (3) Professional Services, which included consulting, implementation and training revenue.
With a change in our organizational structure to streamline our operations, we merged our Solution Group segment with our IoT Group segment and revised the information that our chief executive officer, who is also our chief operating decision maker ("CODM"), regularly reviews for purposes of allocating resources and assessing performance. As a result, effective with the beginning of the first quarter of fiscalOn October 1, 2018, we changed our operating and reportable segments from three to two: (1) Software Products, which includes license, subscription and related support revenue (including updates and technical support) for all our products; and (2) Professional Services, which includes consulting, implementation and training services.
Revenue and operating income in Note 10. Segment Information have been reclassified to conform to the current period presentation.
Recent Accounting Pronouncements
Recently Adopted Accounting Pronouncements
Stock Compensation
In March 2016, the FASB issued ASU No. 2016-09, Compensation - Stock Compensation (Topic 718): Improvements to Employee Share-Based Payment Accounting. We adopted ASU No. 2016-09 in the first quarter of 2018.
Effective with the adoption, stock-based compensation excess tax benefits or deficiencies are reflected in the Consolidated Statements of Operations as a component of the provision for income taxes when the awards vest or are settled. Previously they were recognized in equity. Upon adoption, under the modified retrospective transition method, we recognized the previously unrecognized excess tax benefits of $37.0 million as increases in deferred tax assets for tax loss carryovers and tax credits, $36.9 million of which were offset by an increase in our U.S. valuation allowance.
Additionally, on our Consolidated Statements of Cash Flows excess tax benefits from stock-based awards will no longer be separately classified as a financing activity apart from other income tax, and will be presented as an operating activity. As a result of the adoption of ASU 2016-09, the Consolidated Statement of Cash Flows for the nine months ended July 1, 2017 was adjusted as follows: a $0.4 million increase to net cash provided by operating activities and a $0.4 million decrease to net cash used in financing activities.
Finally, we have elected to account for forfeitures as they occur, rather than estimate expected forfeitures, which resulted in a cumulative effect adjustment of $0.7 million to reduce retained earnings as of October 1, 2017.
Pending Accounting Pronouncements
Derivative Financial Instruments
In August 2017, the Financial Accounting Standards Board (FASB) issued Accounting Standards Update (ASU) No. 2017-12, "Derivatives and Hedging (Topic 815) Targeted Improvements to Accounting for Hedging Activities", which amends and simplifies existing guidance to allow companies to more accurately present the economic effects of risk management activities in the financial statements. The guidance is effective for annual reporting periods beginning after December 15, 2018 (our fiscal 2020) including interim reporting periods within those annual reporting periods and early adoption is permitted. We are currently evaluating the impact of the new guidance on our consolidated financial statements.
Income Taxes
In October 2016, the FASB issued ASU 2016-16, Income Taxes (Topic 740): Intra-Entity Transfers of Assets Other Than Inventory (“ASU 2016-16”). The purpose of ASU 2016-16 is to simplify the income tax accounting of an intra-entity transfer of an asset other than inventory and to record its effect when the transfer occurs. The guidance is effective for annual reporting periods beginning after December 15, 2017 (our fiscal 2019) including interim reporting periods within those annual reporting periods and early adoption is permitted. We are currently evaluating the impact of the new guidance on our consolidated financial statements. We expect to record a net deferred tax asset of approximately $77 million upon adoption, primarily relating to deductible amortization of intangible assets in Ireland. Post adoption, our effective tax rate will no longer include the benefit of this amortization, which is reflected in our effective tax rate reconciliation under the current guidance.
Leases
In February 2016, the FASB issued ASU No. 2016-02, Leases (Topic 842), which will replace the existing guidance in ASC 840, Leases. The updated standard aims to increase transparency and comparability among organizations by requiring lessees to recognize lease assets and lease liabilities on the balance sheet and to disclose important information about leasing arrangements. ASU 2016-02 is effective for annual periods beginning after December 15, 2018 (our fiscal 2020) and interim periods within those annual periods. Early adoption is permitted and modified retrospective application is required. We are currently evaluating the impact of the new guidance on our consolidated financial statements.
Revenue Recognition
In May 2014, the FASB issued ASU No. 2014-09, Revenue from Contracts with Customers: Topic 606 (ASU 2014-09)(ASC 606). Results for reporting periods beginning on or after October 1, 2018 are presented under ASC 606, while prior period amounts are not adjusted and continue to be reported in accordance with the guidance provided by ASC 985-605, Software-Revenue Recognition and revenues for non-software deliverables in accordance with ASC 605-25, Revenue Recognition, Multiple-Element Arrangements (ASC 605). In connection with the adoption of ASC 606, we changed our presentation of the statement of operations to reflect revenue and associated costs as license, support and cloud services, and professional services. For the prior year period, all components of subscription licenses (including support) are included in license revenue. Prior to our adoption of ASC 606, revenues from subscription licenses and support thereon were not separated and were previously included in subscription revenue in our consolidated statement of operations since we did not have VSOE of fair value for support on subscription sales. In addition, revenue and costs associated with our cloud services, which are immaterial and were previously reported in subscription revenue, are classified as support and cloud services for all periods presented.
Effective at the beginning of fiscal 2019, in accordance with the adoption of ASU 2014-092017-07, Compensation-Retirement Benefits (Topic 715): Improving the Presentation of Net Periodic Pension Cost and Net Periodic Postretirement Benefit Cost, all non-service net periodic pension costs are now presented in Other income (expense), net on the Consolidated Statement of Operations. The prior period non-service net periodic pension cost amounts have been reclassified for comparability.
Effective at the beginning of fiscal 2019, in accordance with the adoption of ASU 2016-18, Statement of Cash Flows (Topic 230): Restricted Cash, restricted cash is now included with cash and cash equivalents on the Consolidated Statements of Cash Flows. The prior period restricted cash amounts have been reclassified for comparability. As of June 29, 2019 and September 30, 2018, $1.1 million of restricted cash was included in other current assets.
Recent Accounting Pronouncements
Recently Adopted Accounting Pronouncements
Revenue Recognition
On October 1, 2018, we adopted ASC 606, which supersedes nearlysubstantially all existing revenue recognition guidance under U.S. GAAP. The FASB has also issued additional standardsWe adopted ASC 606 using the modified retrospective method, under which the cumulative effect of initially applying ASC 606 was recorded as a reduction to provide clarification and implementation guidance on ASU 2014-09.accumulated deficit with no restatement of comparative periods.
The core principle of ASU 2014-09ASC 606 is to recognize revenue when promised goods or services are transferred to a customer in an amount that reflects the consideration that is expected to be received for those goods or services. Under the new guidance, an entity is required to evaluate revenue recognition through a five-step process: (1) identifying a contract with a customer; (2) identifying the performance obligations in the contract; (3) determining the transaction price; (4) allocating the transaction price to the performance obligations in the contract; and (5) recognizing revenue when (or as) the entity satisfies
a performance obligation. The standard also requires disclosure of the nature, amount, timing and uncertainty of revenue and cash flows arising from contracts with customers. In applying the principles of ASU 2014-09, it is possibleASC 606, more judgment and estimates may beare required within the revenue recognition process than is required under existingprevious U.S. GAAP, including identifying performance obligations, estimating the amount of variable consideration to include in the transaction price, and estimating the value of each performance obligation to allocate the total transaction price to each separate performance obligation.
ASU 2014-09 is effective for us in our first quarter of fiscal 2019. Companies may adopt ASU 2014-09 using either the retrospective method, under which each prior reporting period is presented under ASU 2014-09, with the option to elect certain permitted practical expedients, or the modified retrospective method, under which a company adopts ASU 2014-09 from the beginning of the year of initial application with no restatement of comparative periods, with the cumulative effect of initially applying ASU 2014-09 recognized at the date of initial application, with certain additional required disclosures. We currently expect to adopt ASU 2014-09 using the modified retrospective method.
While we are continuing to assess theThe most significant impact of the new standard, we currently believe the most significant impactASC 606 relates to accounting for our subscription arrangements that include term-based on-premise software licenses bundled with support. Under currentprevious GAAP (ASC 605, through September 30, 2018), revenue attributable to these subscription licenses iswas recognized ratably over the term of the arrangement because VSOE does not exist for the undelivered support element as it is not sold separately. Under the new standard, the requirement to have VSOE for undelivered elements to enable the separation of revenue for the delivered software licenses is eliminated. Accordingly, under the new standard we will be required to recognize as revenue a portion of the subscription fee upon delivery of the software license. We currently expect revenueRevenue recognition related to our perpetual licenses and related support contracts, professional services and cloud offerings to remainis substantially unchanged.unchanged, with support and cloud revenue being recorded ratably over the contract term. Due to the complexity of certain of our contracts, the actual revenue recognition treatment required under the new standard may be dependent on contract-specific terms and, therefore, may vary in some instances.
Upon implementation of the new standard in fiscal 2019, we expect to make prospective revisions to contract terms with our customers that will result in shortening the initial, non-cancellable termCertain of our multi-year subscriptions to one year for contract periods that beginsubscription contracts with start dates on or after October 1, 2018. This change will result in2018 contain a limited annual contractual periods for most of our software subscriptions,cancellation right. For such cancellable subscription contracts, we consider each annual period a discrete contract. We recognize the license portion of which will be recognized at the beginning of each annualone-year contract period upon delivery of the licenses and the support portion of which will be recognized ratably over theeach one-year contractual period. As a result, we anticipate one year of subscription revenue will be recognized for each contract each year; however, more of the revenue will be recognizedEarly in the fourth quarter thatof 2019, we discontinued offering the contract period begins and less will be recognized in the subsequent three quarters of the contract than under the current accounting rules.cancellation right for substantially all new contracts.
Under the modified retrospective method, we will evaluateevaluated each contract that iswas ongoing on the adoption dateOctober 1, 2018 as if that contract had been accounted for under ASU 2014-09ASC 606 from contract inception. Some license revenue related to subscription arrangements that would have been recognized in future periods under current GAAP will bewas recast under ASU 2014-09ASC 606 as if the revenue had been recognized in prior periods. Under this transition method, we willdid not adjust historical reported revenue amounts. Instead, the revenue that would have been recognized under this method prior to the adoption date will bewas recorded as an adjustment to retained earningsaccumulated deficit and will not be recognized as revenue in future periods as previously expected. Because we expect that license revenue associated with subscription contracts will beis recognized up front instead of over time under ASU 2014-09, we expectASC 606, a material portion of our deferred revenue will bewas adjusted to retained earningsaccumulated deficit upon adoption. During the first year of adoption, we will record and disclose the amount of this retained earnings adjustment and intend to provide supplemental disclosure of how this revenue would have been recognized under the current rules.
Another significant provision under ASU 2014-09ASC 606 includes the capitalization and amortization of costs associated with obtaining a contract, such as sales commissions. Currently,Prior to October 1, 2018, we expense salesexpensed commissions in the period incurred. Under ASU 2014-09,ASC 606, direct and incremental costs to acquire a contract are capitalized and amortized using a systematic basis over the pattern of transfer of the goods and services to which the asset relates. While we are continuing
Refer to assessNote 2. Revenue from Contracts with Customers for further detail about the impact of this provisionthe adoption of ASC 606 and further disclosures.
Income Taxes
In October 2016, the Financial Accounting Standards Board (FASB) issued Accounting Standards Update (ASU) 2016-16, Income Taxes (Topic 740): Intra-Entity Transfers of Assets Other Than Inventory. The purpose of ASU 2014-09, we likely2016-16 is to simplify the income tax accounting of an intra-entity transfer of an asset other than inventory and to record its effect when the transfer occurs. We adopted this amendment beginning in the first quarter of 2019 using the modified retrospective method with a cumulative effect adjustment to accumulated deficit of $72.3 million, with a corresponding increase of $75.3 million to deferred tax assets, a $6.0 million decrease to income tax assets and a $3.0 million decrease to income tax liabilities. The adjustment primarily relates to deductible amortization of intangible assets in Ireland. Post adoption, our effective tax rate no longer includes the benefit of this amortization.
Pension Accounting
In March 2017, the FASB issued ASU 2017-07, Compensation-Retirement Benefits (Topic 715): Improving the Presentation of Net Periodic Pension Cost and Net Periodic Postretirement Benefit Cost, which provides guidance on the capitalization, presentation and disclosure of net benefit costs related to post-retirement benefit plans. We adopted the new guidance in the first quarter of 2019 on a full retrospective basis, which resulted in the retrospective reclassification of $0.2 million and $0.5 million of non-service net periodic pension cost for the three and nine months ended June 30, 2018, respectively, from line items within cost of revenue and operating expenses into Other income (expense), net on the Consolidated Statement of Operations.
Equity Investments
In January 2016, the FASB issued ASU 2016-01, Recognition and Measurement of Financial Assets and Financial Liabilities, which provides guidance for the recognition, measurement, presentation, and disclosure of financial assets and liabilities and requires equity securities to be measured at fair value, unless the measurement alternative method has been elected for equity investments without readily determinable fair values. Adoption of this guidance in the first quarter of fiscal 2019 did not have a material impact on our consolidated financial statements.
Restricted Cash
In November 2016, the FASB issued ASU 2016-18, Statement of Cash Flows (Topic 230): Restricted Cash. The new guidance requires that a statement of cash flows explain the change during the period in the total of cash, cash equivalents and amounts generally described as restricted cash or restricted cash equivalents. Therefore, amounts generally described as restricted cash and restricted cash equivalents should be included with cash and cash equivalents when reconciling the beginning-of-period and end-of-period total amounts shown on the Statement of Cash Flows. Adoption of this guidance in the first quarter of fiscal 2019 did not have a material impact on our consolidated financial statements.
Pending Accounting Pronouncements
Derivative Financial Instruments
In August 2017, the FASB issued ASU No. 2017-12, "Derivatives and Hedging (Topic 815) Targeted Improvements to Accounting for Hedging Activities", which amends and simplifies existing guidance to allow companies to more accurately present the economic effects of risk management activities in the financial statements. The guidance is effective for annual reporting periods beginning after December 15, 2018 (our fiscal 2020) including interim reporting periods within those annual reporting periods and early adoption is permitted. We are currently evaluating the impact of the new guidance on our consolidated financial statements.
Leases
In February 2016, the FASB issued ASU No. 2016-02, Leases (Topic 842), which will replace the existing guidance in ASC 840, Leases. The updated standard aims to increase transparency and comparability among organizations by requiring lessees to recognize lease assets and lease liabilities on the balance sheet and to disclose important information about leasing arrangements. ASU 2016-02 is effective for annual periods beginning after December 15, 2018 (our fiscal 2020) and interim periods within those annual periods. We plan to adopt ASU 2016-02 effective October 1, 2019. Financial information for the comparative periods will not be recast. We are currently evaluating the impact of our pending adoption of ASU 2016-02 on our consolidated financial statements. We intend to elect the available practical expedients, including carrying forward the classification of our existing leases and our assessment of their remaining lease terms. We have completed the inventory of our leases and policy election and currently
expect that our operating lease commitments will be subject to the new standard and recognized as operating lease liabilities and right-of-use assets upon our adoption of the standard. ASU 2016-02 will materially increase our total assets and total liabilities that we report relative to such amounts prior to adoption. We are currently identifying new processes, systems and controls to meet the accounting and disclosure requirements under the new standard, which will be implemented by the time of adoption.
2. Revenue from Contracts with Customers
Upon adoption of ASC 606, we recorded a decrease in accumulated deficit of $431.9 million ($367.4 million, net of tax) due to the cumulative effect of the ASC 606 adoption, with the impact primarily derived from revenue related to on-premise subscription software licenses.
Nature of Products and Services
Our sources of revenue include: (1) subscription, (2) perpetual license, (3) perpetual support and (4) professional services. Revenue is derived from the licensing of computer software products and from related support and/or professional services contracts. We enter into contracts that include combinations of products, support and professional services, which are accounted for as separate performance obligations with differing revenue recognition patterns.
|
| |
| Performance Obligation | When Performance Obligation is Typically Satisfied |
| Term-based subscriptions | |
| On-premise software licenses | Point in Time: Upon the later of when the software is made available or the subscription term commences |
| Support and cloud-based offerings | Over Time: Ratably over the contractual term; commencing upon the later of when the software is made available or the subscription term commences |
| Perpetual software licenses | Point in Time: when the software is made available |
| Support for perpetual software licenses | Over Time: Ratably over the contractual term |
| Professional services | Over time: As services are provided |
Judgments and Estimates
Our contracts with customers for subscriptions typically include commitments to transfer term-based on-premise software licenses bundled with support and/or cloud services. On-premise software is determined to be a distinct performance obligation from support which is sold for the same term of the subscription. For subscription arrangements which include cloud services, we assess whether the cloud component is highly interrelated with on-premise term software licenses. Other than a limited population of subscriptions, the cloud component is not currently deemed to be interrelated with the on-premise term software and, as a result, cloud services are accounted for as a distinct performance obligation from the software and support components of the subscription.
Judgment is required to capitalize incremental costs suchallocate the transaction price to each performance obligation. We use the estimated standalone selling price method to allocate the transaction price for items that are not sold separately. The estimated standalone selling price is determined using all information reasonably available to us, including market conditions and other observable inputs. The corresponding revenues are recognized as commissionsthe related performance obligations are satisfied. We determined that 50% to 55% of the estimated standalone selling price for subscriptions that contain distinct license and amortizesupport performance obligations are attributable to software licenses and 45% to 50%, depending upon the product offering, is attributable to support for those costs overlicenses.
Our multi-year, non-cancellable on-premise subscription contracts provide customers with an annual right to exchange software within the periodoriginal subscription with other software. Although the capitalizedexchange right is limited to software products within a similar product grouping, the exchange right is not limited to products with substantially similar features and functionality as those originally delivered. We determined that this right to exchange previously delivered software for different software represents variable consideration to be accounted for as a liability. We have identified a standard portfolio of contracts with common characteristics and applied the expected value method of determining variable consideration associated with this right. Additionally, where there are isolated situations that are outside of the standard portfolio of contracts due to contract size, longer contract duration, or other unique contractual terms, we use the most likely amount method to determine the amount of variable consideration. In both circumstances, the amount of variable consideration included in the transaction price is constrained by an amount where it is probable that a significant reversal in the amount of cumulative revenue
recognized will not occur when the uncertainty associated with the variable consideration is subsequently resolved. As of June 29, 2019, the total refund liability was $21.5 million, primarily associated with the annual right to exchange on-premise subscription software.
Contract Assets and Contract Liabilities |
| | | | | | | |
| | June 29, 2019 | | October 1, 2018, as adjusted |
| | (in thousands) |
| Contract asset | $ | 22,808 |
| | $ | 26,265 |
|
| Deferred revenue | $ | 382,579 |
| | $ | 357,490 |
|
As of June 29, 2019, our contract assets are expected to contributebe transferred to future cash flows.
Furthermore, we have madereceivables within the next 12 months and will continue to make investments in systems and processes to enable timely and accurate reporting under the new standard. We currently expect that necessary operational and internal control structural changes will be implemented prior to the adoption date.
2. Deferred Revenue and Related Customer Receivables
Deferred Revenue
Deferred revenue primarily relates to software agreements billed to customers for which the subscription and support services have not yet been provided. The liability associated with performing these subscription and support services istherefore are included in deferred revenue and, if not yet paid, the related customer receivable is included in prepaid expenses and other current assets. Billed but uncollected supportApproximately $14.6 million of the October 1, 2018 contract asset balance was transferred to receivables during the nine months ended June 29, 2019 as a result of the right to payment becoming unconditional. The majority of both the contract asset balance and subscription-relatedthe amounts transferred to receivables relates to two large professional services contracts with invoicing terms based on performance milestones. Additions to contract assets of approximately $11.1 million related to revenue recognized in the period, net of billings. There were no impairments of contract assets during the nine months ended June 29, 2019.
During the three and nine months ended June 29, 2019, $54.7 million and $300.8 million of revenue that was included in the deferred revenue opening balance was recognized, respectively. There were additional deferrals of $325.9 million, which were primarily related to new billings.
Costs to Obtain or Fulfill a Contract
The new revenue recognition standard requires the capitalization of certain incremental costs of obtaining a contract, which impacts the period in which we record our commission expense. Prior to our adoption of the new revenue standard, we recognized commissions expense as incurred. Under the new revenue recognition standard, we are required to recognize these expenses over the period of benefit associated with these costs. This results in a deferral of certain commission expenses each period. Upon adoption, we reduced our accumulated deficit by $70.0 million and recognized an offsetting asset for deferred commission related to contracts that were not completed prior to October 1, 2018.
We recognize an asset for the incremental costs of obtaining a contract with a customer if the benefit of those costs is expected to be longer than one year. These deferred costs are amortized proportionately related to revenue over five years, which is generally longer than the term of the initial contract because of anticipated renewals as commissions for renewals are not commensurate with commissions related to our initial contracts. As of June 29, 2019, deferred costs of $23.0 million were included in other current assets and $60.1 million were included in other assets (non-current).
As the revenue recognition pattern has changed under ASC 606, the costs to fulfill contracts has also changed to match this pattern of recognition. As of October 1, 2018, this resulted in a $2.8 million increase in our accumulated deficit with recognition of an offsetting current liability.
Remaining Performance Obligations
Our contracts with customers include amounts allocated to performance obligations that will be satisfied at a later date. The amounts include additional performance obligations that are not yet recorded in the consolidated balance sheets.As of June 30, 201829, 2019, amounts allocated to these additional contractual obligations are $862.7 million, of which we expect to recognize approximately 90% over the next 24 months, with the remaining amount thereafter.
Disaggregation of Revenue |
| | | | | | | | | | | | | | | | | | | | | | | | |
| | | Three months ended | | Nine months ended |
| | | As Reported ASC 606 | | ASC 605 | | As Reported ASC 605 | | As Reported ASC 606 | | ASC 605 | | As Reported ASC 605 |
| | | June 29, 2019 | | June 29, 2019 | | June 30, 2018 | | June 29, 2019 | | June 29, 2019 | | June 30, 2018 |
| Revenue | | | | | | |
| | | (in thousands) |
| Subscription license | | $ | 53,705 |
| | | | | | $ | 168,762 |
| | | | |
| Subscription support & cloud services | | 90,159 |
| | | | | | 250,811 |
| | | | |
| Total Subscription | | 143,864 |
| | $ | 171,631 |
| | $ | 126,712 |
| | 419,573 |
| | $ | 482,114 |
| | $ | 339,651 |
|
| Perpetual support | | 100,328 |
| | 99,664 |
| | 121,127 |
| | 315,242 |
| | 312,453 |
| | 379,007 |
|
| Total recurring revenue | | 244,192 |
| | 271,295 |
| | 247,839 |
| | 734,815 |
| | 794,567 |
| | 718,658 |
|
| Perpetual license | | 9,213 |
| | 10,644 |
| | 25,780 |
| | 61,354 |
| | 63,661 |
| | 82,604 |
|
| Total software revenue | | 253,405 |
| | 281,939 |
| | 273,619 |
| | 796,169 |
| | 858,228 |
| | 801,262 |
|
| Professional services | | 42,081 |
| | 40,471 |
| | 41,158 |
| | 124,457 |
| | 118,438 |
| | 128,041 |
|
| Total revenue | | $ | 295,486 |
| | $ | 322,410 |
| | $ | 314,777 |
| | $ | 920,626 |
| | $ | 976,666 |
| | $ | 929,303 |
|
For further disaggregation of revenue by geographic region and September 30, 2017 were $108.7 millionproduct group see Note 11. Segment and $160.9Geographic Information.
Practical Expedients
We elected certain practical expedients with the adoption of the new revenue standard. We do not account for significant financing components if the period between revenue recognition and when the customer pays for the products or services is one year or less. Additionally, we recognize revenue equal to the amount we have a right to invoice, when the amount corresponds directly with the value to the customer of our performance date.
Transition Disclosures
In accordance with the modified retrospective method transition requirements, we will present the financial statement line items impacted and adjusted to compare to presentation under ASC 605 for each of the interim and annual periods during the first year of adoption of ASC 606.
The following tables present our Balance Sheets and Statements of Operations as reported under ASC 606 for the current period with comparative periods reported under ASC 605: |
| | | | | | | | | | | |
| | As Reported ASC 606 | | ASC 605 | | As Reported ASC 605 |
| | June 29,
2019 | | June 29,
2019 | | September 30,
2018 |
| ASSETS | | | | | |
| Current assets: | | | | | |
| Cash and cash equivalents | $ | 267,862 |
| | $ | 267,862 |
| | $ | 259,946 |
|
| Short-term marketable securities | 33,073 |
| | 33,073 |
| | 25,836 |
|
Accounts receivable (1) | 321,426 |
| | 111,165 |
| | 129,297 |
|
| Prepaid expenses | 69,819 |
| | 75,504 |
| | 48,997 |
|
Other current assets (2) | 60,483 |
| | 139,997 |
| | 169,708 |
|
| Total current assets | 752,663 |
| | 627,601 |
| | 633,784 |
|
| Property and equipment, net | 107,752 |
| | 107,752 |
| | 80,613 |
|
| Goodwill | 1,245,084 |
| | 1,245,084 |
| | 1,182,457 |
|
| Acquired intangible assets, net | 183,180 |
| | 183,180 |
| | 200,202 |
|
| Long-term marketable securities | 21,553 |
| | 21,553 |
| | 30,115 |
|
Deferred tax assets (3) | 189,371 |
| | 222,477 |
| | 165,566 |
|
Other assets (4) | 148,998 |
| | 41,121 |
| | 36,285 |
|
| Total assets | $ | 2,648,601 |
| | $ | 2,448,768 |
| | $ | 2,329,022 |
|
| LIABILITIES AND STOCKHOLDERS’ EQUITY |
| | | |
|
| Current liabilities: |
| | | |
|
| Accounts payable | $ | 44,065 |
| | $ | 44,065 |
| | $ | 53,473 |
|
Accrued expenses and other current liabilities (5) | 95,790 |
| | 71,506 |
| | 74,388 |
|
| Accrued compensation and benefits | 78,854 |
| | 78,854 |
| | 101,784 |
|
Accrued income taxes (3) | 8,222 |
| | 4,135 |
| | 18,044 |
|
Deferred revenue (6) | 374,291 |
| | 542,888 |
| | 487,590 |
|
| Total current liabilities | 601,222 |
| | 741,448 |
| | 735,279 |
|
| Long-term debt | 698,916 |
| | 698,916 |
| | 643,268 |
|
Deferred tax liabilities (3) | 37,354 |
| | 6,635 |
| | 5,589 |
|
Deferred revenue (6) | 8,288 |
| | 8,045 |
| | 11,852 |
|
| Other liabilities | 87,226 |
| | 87,226 |
| | 58,445 |
|
| Total liabilities | 1,433,006 |
| | 1,542,270 |
| | 1,454,433 |
|
| | | | | | |
| Stockholders’ equity: |
| | | |
|
| Preferred stock | — |
| | — |
| | — |
|
| Common stock | 1,151 |
| | 1,151 |
| | 1,180 |
|
| Additional paid-in capital | 1,504,512 |
| | 1,504,512 |
| | 1,558,403 |
|
| Accumulated deficit | (197,056 | ) | | (508,225 | ) | | (599,409 | ) |
| Accumulated other comprehensive loss | (93,012 | ) | | (90,940 | ) | | (85,585 | ) |
| Total stockholders’ equity | 1,215,595 |
| | 906,498 |
| | 874,589 |
|
| Total liabilities and stockholders’ equity | $ | 2,648,601 |
| | $ | 2,448,768 |
| | $ | 2,329,022 |
|
The changes in balance sheet accounts due to the adoption of ASC 606 are due primarily to the following:
| |
| (1) | Up front license recognition under our subscription contracts and billed but uncollected support and subscription receivables that had corresponding deferred revenue, which were included in other current assets prior to our adoption of ASC 606. |
(2) Support and subscription receivables previously included in other current assets described in note (1) above, offset by contract assets and capitalized commission costs.
| |
| (3) | The tax effect of the accumulated deficit impact related to the acceleration of revenue and deferral of costs (primarily commissions). |
(4) The long-term portion of unbilled receivables due to the acceleration of license revenue on multi-year subscription contracts and the long-term portion of capitalized commission costs.
(5) Refund liability, primarily associated with the annual right to exchange on-premise subscription software described above in Judgments and Estimates.
(6) The decrease in deferred revenue recorded to accumulated deficit upon adoption of ASC 606 primarily related to on-premise subscription software licenses.
|
| | | | | | | | | | | | | | | | | | | | | | | |
| | Three months ended | | Nine months ended |
| | As Reported ASC 606 | | ASC 605 | | As Reported ASC 605 | | As Reported ASC 606 | | ASC 605 | | As Reported ASC 605 |
| | June 29,
2019 | | June 29,
2019 | | June 30,
2018 | | June 29,
2019 | | June 29,
2019 | | June 30,
2018 |
| Revenue: | | | | | | | | | | | |
License (1) | $ | 62,918 |
| | $ | 163,220 |
| | $ | 136,568 |
| | $ | 230,116 |
| | $ | 493,256 |
| | $ | 376,591 |
|
Support and cloud services (1) | 190,487 |
| | 118,719 |
| | 137,051 |
| | 566,053 |
| | 364,972 |
| | 424,671 |
|
| Total software revenue | 253,405 |
| | 281,939 |
| | 273,619 |
| | 796,169 |
| | 858,228 |
| | 801,262 |
|
Professional services | 42,081 |
| | 40,471 |
| | 41,158 |
| | 124,457 |
| | 118,438 |
| | 128,041 |
|
| Total revenue | 295,486 |
| | 322,410 |
| | 314,777 |
| | 920,626 |
| | 976,666 |
| | 929,303 |
|
| Cost of revenue: |
| | | | | | | | | | |
| Cost of license revenue | 13,307 |
| | 12,998 |
| | 11,982 |
| | 38,745 |
| | 37,590 |
| | 35,950 |
|
Cost of support and cloud services revenue | 33,785 |
| | 33,606 |
| | 34,291 |
| | 97,856 |
| | 97,213 |
| | 103,128 |
|
| Total cost of software revenue | 47,092 |
| | 46,604 |
| | 46,273 |
| | 136,601 |
| | 134,803 |
| | 139,078 |
|
| Cost of professional services revenue | 35,613 |
| | 34,629 |
| | 35,360 |
| | 103,360 |
| | 99,593 |
| | 109,298 |
|
Total cost of revenue (2) | 82,705 |
| | 81,233 |
| | 81,633 |
| | 239,961 |
| | 234,396 |
| | 248,376 |
|
| Gross margin | 212,781 |
| | 241,177 |
| | 233,144 |
| | 680,665 |
| | 742,270 |
| | 680,927 |
|
| Operating expenses: |
|
| | | | | | | | | | |
Sales and marketing (3) | 108,202 |
| | 113,533 |
| | 107,801 |
| | 316,142 |
| | 330,258 |
| | 305,566 |
|
| Research and development | 60,590 |
| | 60,590 |
| | 61,221 |
| | 182,774 |
| | 182,774 |
| | 187,390 |
|
| General and administrative | 28,773 |
| | 28,773 |
| | 33,098 |
| | 102,008 |
| | 102,008 |
| | 101,487 |
|
| Amortization of acquired intangible assets | 5,920 |
| | 5,920 |
| | 7,850 |
| | 17,786 |
| | 17,786 |
| | 23,566 |
|
| Restructuring and other charges, net | (9 | ) | | (9 | ) | | 1,627 |
| | 45,464 |
| | 45,464 |
| | 1,846 |
|
| Total operating expenses | 203,476 |
| | 208,807 |
| | 211,597 |
| | 664,174 |
| | 678,290 |
| | 619,855 |
|
| Operating income | 9,305 |
| | 32,370 |
| | 21,547 |
| | 16,491 |
| | 63,980 |
| | 61,072 |
|
| Interest expense | (10,816 | ) | | (10,816 | ) | | (10,646 | ) | | (32,475 | ) | | (32,475 | ) | | (31,072 | ) |
| Other income (expense), net | 1,026 |
| | 736 |
| | (930 | ) | | 2,501 |
| | 2,349 |
| | (2,013 | ) |
| Income (loss) before income taxes | (485 | ) | | 22,290 |
| | 9,971 |
| | (13,483 | ) | | 33,854 |
| | 27,987 |
|
Provision (benefit) for income taxes (4) | 14,273 |
| | 10,585 |
| | (7,026 | ) | | 23,803 |
| | 14,931 |
| | (10,809 | ) |
| Net income (loss) | $ | (14,758 | ) | | $ | 11,705 |
| | $ | 16,997 |
| | $ | (37,286 | ) | | $ | 18,923 |
| | $ | 38,796 |
|
| |
| (1) | The reduction in license revenue and increase in support revenue is a result of the support component of subscription licenses which is included in license revenue under ASC 605. Additionally, for the three months ended June 29, 2019, license revenue decreased by approximately $49.8 million as a result of the revenue recorded to accumulated deficit, which would have been recognized during the third quarter of 2019 and approximately $28.7 million as a result of revenue recognized during the first two quarters of 2019 which would have been recognized during the third quarter of 2019. For the nine months ended June 29, 2019, license revenue decreased by approximately $173.1 million as a result of the revenue recorded to accumulated deficit which would have been recognized during the period. This was partially offset by approximately $51.7 million and $115.1 million of upfront license revenue recognition on new and renewal bookings for the three and nine months ending June 29, 2019, respectively. |
(2) Cost of revenue under ASC 606 is higher than under ASC 605 due to the treatment of deferred professional services costs under the new accounting guidance, partially offset by the timing of revenue recognition under ASC 606 resulting in lower associated royalty costs.
(3) Sales and marketing costs are lower under ASC 606 due to the amortization of commissions costs capitalized upon adoption of ASC 606, offset by the deferral of ongoing commission expenses under the new accounting guidance.
(4) The benefit for income taxes under ASC 606 includes indirect effects of the adoption.
3. Restructuring and Other Charges
Restructuring and other charges, net includes restructuring charges (credits) and headquarters relocation charges.
For the nine months ended June 29, 2019 restructuring charges and other charges, net totaled $45.5 million, of which $43.0 million is attributable to workforce realignment and facility closures and $2.5 million is attributable to headquarters relocation charges. For the nine months ended June 30, 2018 restructuring charges totaled $1.8 million and include $1.0 million of credits attributable to a workforce realignment and facility closures, and $2.9 million is attributable to headquarters relocation charges.
Restructuring Charges (Credits)
In fiscal 2016,October 2018, we initiated a restructuring plan to restructure our workforce and consolidate select facilities to reduce our cost structure and to realign our investments with what we believeworkforce to be our highershift investment to support Industrial Internet of Things and Augmented Reality strategic high growth opportunities. As this was a realignment of resources rather than a cost-savings initiative, it did not result in significant cost savings. The actions haverestructuring plan was completed in the first quarter of 2019 and resulted in total restructuring charges of $84.5$16 million primarily associated withfor termination benefits associated with approximately 800 employees. This240 employees, substantially all of which has been paid.
In January 2019, we relocated our worldwide headquarters to the Boston Seaport District. Our prior headquarters lease will not expire until November 2022, and we are seeking to sublease that space, but have not yet done so. As a result, we will bear overlapping rent obligations for those premises and, in the third quarter and first nine months of 2019, we recorded a restructuring plan was substantially completed in 2017.charge of approximately $0.4 million and $27.1 million, respectively, based on the net present value of remaining lease commitments net of estimated sublease income. Restructuring charges and estimated cash outflows could increase if we are unable to sublease our prior headquarters as we expect. Other costs associated with the move were recorded as incurred. In the first nine months of 2019, we also recorded $0.1 million of credits related to prior facility restructuring actions.
The following table summarizes restructuring accrual activity for the nine months ended June 30, 2018:29, 2019:
|
| | | | | | | | | | | |
| | Employee severance and related benefits | | Facility closures and related costs | | Total |
| | (in thousands) |
| October 1, 2018 | $ | — |
| | $ | 2,415 |
| | $ | 2,415 |
|
| Charges to operations, net | 15,719 |
| | 27,243 |
| | 42,962 |
|
| Cash disbursements | (15,397 | ) | | (6,009 | ) | | (21,406 | ) |
| Non-cash reclass | — |
| | 4,812 |
| | 4,812 |
|
| Foreign exchange impact | 6 |
| | (18 | ) | | (12 | ) |
| Accrual, June 29, 2019 | $ | 328 |
| | $ | 28,443 |
| | $ | 28,771 |
|
|
| | | | | | | | | | | |
| | Employee severance and related benefits | | Facility closures and related costs | | Total |
| | (in thousands) |
| October 1, 2017 | $ | 1,736 |
| | $ | 4,508 |
| | $ | 6,244 |
|
| Credit to operations, net | (509 | ) | | (505 | ) | | (1,014 | ) |
| Cash disbursements | (1,247 | ) | | (1,207 | ) | | (2,454 | ) |
| Foreign exchange impact | 20 |
| | (80 | ) | | (60 | ) |
| Accrual, June 30, 2018 | $ | — |
| | $ | 2,716 |
| | $ | 2,716 |
|
The following table summarizes restructuring accrual activity for the nine months ended July 1, 2017:June 30, 2018:
|
| | | | | | | | | | | |
| | Employee severance and related benefits | | Facility closures and related costs | | Total |
| | (in thousands) |
| October 1, 2017 | $ | 1,736 |
| | $ | 4,508 |
| | $ | 6,244 |
|
| Credits to operations, net | (509 | ) | | (505 | ) | | (1,014 | ) |
| Cash disbursements | (1,247 | ) | | (1,207 | ) | | (2,454 | ) |
| Foreign exchange impact | 20 |
| | (80 | ) | | (60 | ) |
| Accrual, June 30, 2018 | $ | — |
| | $ | 2,716 |
| | $ | 2,716 |
|
|
| | | | | | | | | | | |
| | Employee severance and related benefits | | Facility closures and related costs | | Total |
| | (in thousands) |
| October 1, 2016 | $ | 35,177 |
| | $ | 1,431 |
| | $ | 36,608 |
|
| Charges to operations, net | 2,582 |
| | 5,718 |
| | 8,300 |
|
| Cash disbursements | (33,979 | ) | | (1,351 | ) | | (35,330 | ) |
| Other non-cash charges | — |
| | (704 | ) | | (704 | ) |
| Foreign exchange impact | (800 | ) | | 98 |
| | (702 | ) |
| Accrual, July 1, 2017 | $ | 2,980 |
| | $ | 5,192 |
| | $ | 8,172 |
|
$13.7 million. The accrual for employee severance and related benefits is included in accrued compensation and benefits in the Consolidated Balance Sheets.
Of the accrual for facility closures and related costs, as of June 30, 2018, $1.6 million is included in accrued expenses and other current liabilities and $1.1 million is included in other liabilities in the Consolidated Balance Sheets.
In determining the amount of the facilities accrual, we are required to estimate such factors as future vacancy rates, the time required to sublet properties and sublease rates. These estimates are reviewed quarterly based on known real estate market conditions and the credit-worthiness of subtenants and may result in revisions to established facility reserves. The accrual for facility closures is based on the net present value of remaining lease commitments net of assumedestimated sublease income. We had $28.4 million accrued as of June 29, 2019 related to excess facilities (compared to $2.4 million at September 30, 2018), representing discounted lease commitments with agreements expiring at various dates through 2023 of approximately $42.1 million, net of committed sublease income of $3.1approximately $1.4 million and uncommitted sublease income of approximately $12.3 million. The accrual for employee severance and related benefits is included in accrued compensation and benefits in the Consolidated Balance Sheets.
Other - Headquarters relocation chargesRelocation Charges
Headquarters relocation charges represent accelerated depreciation expense recorded in anticipation ofother expenses associated with exiting our currentNeedham headquarters facility. In 2019, we will be moving into afacility and relocating to our new worldwide headquarters in the Boston Seaport District, and we will be vacating our current headquarters space. Because our current headquarters lease will not expire until November 2022, we are seeking to sublease that space. Further, if we are unable to sublease our current headquarters space for an amount at least equal to our rent obligations under the current headquarters lease, we will bear overlapping rent obligations for those premises and will be required to record additional headquarters relocation charges related to any rent shortfall. A charge for such shortfall will be recorded in the earlier of the period that we cease using the space (which will likely occur in the second quarter of our fiscal 2019) or the period we exit the lease contract. Additionally, we will incur other costs associated with the move which will be recorded as incurred.District. In the third quarter and first nine months of 2019 and 2018 we recorded $1.9 million and $2.9 million, respectively, of accelerated depreciation expense related to shortening the estimated useful lives of leasehold improvements in our current facility.related to the Needham location. Headquarters relocation charges for the first nine months of 2019 also include $0.6 million of rental expense for the Needham facility that overlapped with rental expense for the new Seaport headquarters.
4. Stock-based Compensation
We measure the cost of employee services received in exchange for restricted stock unit (RSU) awards based on the fair value of RSU awards on the date of grant. That cost is recognized over the period during which an employee is required to provide service in exchange for the award.
Our equity incentive plan provides for grants of nonqualified and incentive stock options, common stock, restricted stock, RSUsrestricted stock units (RSUs) and stock appreciation rights to employees, directors, officers and consultants. We award RSUs as the principal equity incentive awards, including performance-based awards that are earned based on achievement of performance criteria established by the Compensation Committee of our Board of Directors. Each RSU represents the contingent right to receive one share of our common stock.
Beginning inFor performance-based awards, we recognize stock-based compensation based on expected achievement of performance criteria. In the firstthird quarter of 2018,2019, we recorded adjustments to previously recognized stock-based compensation for certain performance-based awards as a result of our estimated probability of vesting. This resulted in a reduction of stock-based compensation.
We measure the cost of employee services received in exchange for RSU awards based on the fair value of the RSU awards on the date of grant. That cost is recognized over the period during which an employee is required to provide service in exchange for the award. We account for forfeitures as they occur, rather than estimate expected forfeitures.
Our employee stock purchase plan (ESPP), initiated in the fourth quarter of 2016, allows eligible employees to contribute up to 10% of their base salary, up to a maximum of $25,000 per year and subject to other plan limitations, toward the purchase of our common stock at a discounted price. The purchase price of the shares on each purchase date is equal to 85% of the lower of the fair market value of our common stock on the first and last trading days of each offering period. The ESPP is qualified under Section 423 of the Internal Revenue Code. We estimate the fair value of each purchase right under the ESPP on the date of grant using the Black-Scholes option valuation model and use the straight-line attribution approach to record the expense over the six-month offering period.
|
| | | | | | |
| Restricted stock unit activity for the nine months ended June 30, 2018 | Shares | | Weighted Average Grant Date Fair Value (Per Share) |
| | (in thousands) | | |
| Balance of outstanding restricted stock units October 1, 2017 | 3,487 |
| | $ | 45.57 |
|
| Granted (1) | 2,167 |
| | $ | 75.99 |
|
| Vested | (1,804 | ) | | $ | 43.94 |
|
| Forfeited or not earned | (531 | ) | | $ | 50.95 |
|
| Balance of outstanding restricted stock units June 30, 2018 | 3,319 |
| | $ | 65.48 |
|
|
| | | | | | |
| Restricted stock unit activity for the nine months ended June 29, 2019 | Shares | | Weighted Average Grant Date Fair Value (Per Share) |
| | (in thousands) | | |
| Balance of outstanding restricted stock units October 1, 2018 | 3,284 |
| | $ | 65.93 |
|
| Granted (1) | 1,793 |
| | $ | 82.98 |
|
| Vested | (1,478 | ) | | $ | 54.95 |
|
| Forfeited or not earned | (346 | ) | | $ | 64.65 |
|
| Balance of outstanding restricted stock units June 29, 2019 | 3,253 |
| | $ | 80.51 |
|
_________________
(1) Restricted stock granted includes 184,000141,000 shares from prior period TSR awards that were earned upon achievement of the performance criteria and vested in November 2018.
| | | | Restricted Stock Units | Restricted Stock Units |
| Grant Period | Performance-based RSUs (1) | | Service-based RSUs (2) | Performance-based RSUs (1) | | Service-based RSUs (2) |
| | (Number of Units in thousands) | (Number of Units in thousands) |
| First nine months of 2018 | 961 | | 1,022 | |
| First nine months of 2019 | | 376 | | 1,276 |
_________________
| |
| (1) | Substantially all the performance-based RSUs were granted to our executive officers. Approximately 189,000160,000 shares are eligible to vest based upon annual increasing performance measures measured over a three-year period. RSUs not earned for a period may be earned in the third period. An additional 250,000 shares are eligible to vest based upon a 2018 performance measure. To the extent earned, those performance-based RSUs will vest inthree substantially equal installments on November 15, 2018,2019, November 15, 20192020 and November 15, 2020,2021, or the date the Compensation Committee determines the extent to which the applicable performance criteria have been achieved for each performance period. An additional 500,000 shares213,000 performance-based RSUs are eligible to vestbe earned based upon annuala 2019 performance measures, measured over a three-year period in fiscal years 2021, 2022 and 2023.measure, which RSUs will be forfeited to the extent the performance measure is not earned for a period may beachieved. These RSUs will vest, to the extent earned, in the third period.three substantially equal installments on November 15, 2019, 2020 and 2021. |
| |
| (2) | The service-based RSUs were granted to employees, including our executive officers, and members of our board of directors. Substantially all service-based RSUs will vest in three substantially equal annual installments on or about the anniversary of the date of grant. |
Compensation expense recorded for our stock-based awards was classified in our Consolidated Statements of Operations as follows:
|
| | | | | | | | | | | | | | | |
| | Three months ended | | Nine months ended |
| | June 29,
2019 | | June 30,
2018 | | June 29,
2019 | | June 30,
2018 |
| | (in thousands) |
| Cost of license revenue | $ | 78 |
| | $ | (46 | ) | | $ | 448 |
| | $ | (30 | ) |
| Cost of support and cloud services revenue | 1,141 |
| | 994 |
| | 3,274 |
| | 3,297 |
|
| Cost of professional services revenue | 1,345 |
| | 1,471 |
| | 5,065 |
| | 4,846 |
|
| Sales and marketing | 5,870 |
| | 4,910 |
| | 25,114 |
| | 14,827 |
|
| Research and development | 4,761 |
| | 3,283 |
| | 14,851 |
| | 9,626 |
|
| General and administrative | 2,039 |
| | 6,046 |
| | 22,856 |
| | 19,449 |
|
| Total stock-based compensation expense | $ | 15,234 |
| | $ | 16,658 |
| | $ | 71,608 |
| | $ | 52,015 |
|
|
| | | | | | | | | | | | | | | |
| | Three months ended | | Nine months ended |
| | June 30,
2018 | | July 1,
2017 | | June 30,
2018 | | July 1,
2017 |
| | (in thousands) |
| Cost of license and subscription revenue | $ | 421 |
| | $ | 347 |
| | $ | 1,242 |
| | $ | 954 |
|
| Cost of support revenue | 527 |
| | 1,139 |
| | 2,025 |
| | 3,638 |
|
| Cost of professional services revenue | 1,471 |
| | 1,505 |
| | 4,846 |
| | 4,500 |
|
| Sales and marketing | 4,910 |
| | 3,296 |
| | 14,827 |
| | 11,047 |
|
| Research and development | 3,283 |
| | 2,805 |
| | 9,626 |
| | 9,753 |
|
| General and administrative | 6,046 |
| | 7,482 |
| | 19,449 |
| | 26,247 |
|
| Total stock-based compensation expense | $ | 16,658 |
| | $ | 16,574 |
| | $ | 52,015 |
| | $ | 56,139 |
|
Stock-based compensation expense includes $1.5 million and $4.1 million in the third quarter and first nine months of 2019, respectively, and $1.1 million and $3.2 million in the third quarter and first nine months of 2018, respectively, and $0.9 million and $2.2 million in the third quarter and first nine months of 2017, respectively, related to the ESPP.
5. Earnings per Share (EPS) and Common Stock
EPS
Basic EPS is calculated by dividing net income by the weighted average number of shares outstanding during the period. Diluted EPS is calculated by dividing net income by the weighted average number of shares outstanding plus the dilutive effect, if any, of outstanding RSUs using the treasury stock method. The calculation of the dilutive effect of outstanding equity awards under the treasury stock method includes consideration of unrecognized compensation expense as additional proceeds.
|
| | | | | | | | | | | | | | | |
| | Three months ended | | Nine months ended |
| Calculation of Basic and Diluted EPS | June 29,
2019 | | June 30,
2018 | | June 29,
2019 | | June 30,
2018 |
| | (in thousands, except per share data) |
| Net income (loss) | $ | (14,758 | ) | | $ | 16,997 |
| | $ | (37,286 | ) | | $ | 38,796 |
|
| Weighted average shares outstanding—Basic | 116,133 |
| | 115,774 |
| | 117,636 |
| | 115,915 |
|
| Dilutive effect of restricted stock units | — |
| | 1,726 |
| | — |
| | 1,772 |
|
| Weighted average shares outstanding—Diluted | 116,133 |
| | 117,500 |
| | 117,636 |
| | 117,687 |
|
| Earnings (loss) per share—Basic | $ | (0.13 | ) | | $ | 0.15 |
| | $ | (0.32 | ) | | $ | 0.33 |
|
| Earnings (loss) per share—Diluted | $ | (0.13 | ) | | $ | 0.14 |
| | $ | (0.32 | ) | | $ | 0.33 |
|
|
| | | | | | | | | | | | | | | |
| | Three months ended | | Nine months ended |
| Calculation of Basic and Diluted EPS | June 30,
2018 | | July 1,
2017 | | June 30,
2018 | | July 1,
2017 |
| | (in thousands, except per share data) |
| Net income (loss) | $ | 16,997 |
| | $ | (951 | ) | | $ | 38,796 |
| | $ | (11,196 | ) |
| Weighted average shares outstanding—Basic | 115,774 |
| | 115,615 |
| | 115,915 |
| | 115,511 |
|
| Dilutive effect of restricted stock units | 1,726 |
| | — |
| | 1,772 |
| | — |
|
| Weighted average shares outstanding—Diluted | 117,500 |
| | 115,615 |
| | 117,687 |
| | 115,511 |
|
| Earnings (loss) per share—Basic | $ | 0.15 |
| | $ | (0.01 | ) | | $ | 0.33 |
| | $ | (0.10 | ) |
| Earnings (loss) per share—Diluted | $ | 0.14 |
| | $ | (0.01 | ) | | $ | 0.33 |
| | $ | (0.10 | ) |
There were 0.1 million antidilutive3,000 anti-dilutive shares for the nine months ended June 29, 2019 and 0.1 million anti-dilutive shares for the nine months ended June 30, 2018. Total antidilutive shares were 2.0 million forFor the three and nine months ended July 1, 2017. For the nine months ended July 1, 2017June 29, 2019 the diluted net loss per share is the same as the basic net loss per share as the effects of all our potential common stock equivalents are antidilutive because we reported a loss for the period.periods.
Common Stock Repurchases
Our Articles of Organization authorize us to issue up to 500 million shares of our common stock.
Our Board of Directors periodically authorizes thehas authorized us to repurchase of sharesup to $1,500 million of our common stock in the period October 1, 2017 through September 30, 2020. We repurchased $25 million and $90 million of our common stock in the third quarter and first nine months of 2019, respectively. In the first nine months of 2018, we repurchased $100 million of our common stock.
On July 20, 2018, we entered into an accelerated share repurchase (“ASR”) agreement with a major financial institution (“Bank”). The ASR allowed us to buy a large number of shares immediately at a purchase price determined by an average market price over a period of time. Under the ASR, we agreed to purchase $1,000 million of our common stock, in total, with an initial delivery to us in July 2018 of 8.2 million shares (“Initial Shares”), which represented the number of shares at the current market price equal to 80% of the total fixed purchase price of $1,000 million. The remainder of the total purchase price of $200 million reflected the value of the stock held by the Bank pending final settlement and, accordingly, was recorded as a reduction to additional paid-in capital in 2018. We settled the ASR in May 2019 and the Bank delivered to us 3.0 million shares.
All shares of our common stock repurchased are automatically restored to the status of authorized and unissued.
On September 14, 2017, our Board of Directors authorized us to repurchase up to $500 million of our common stock6. Acquisitions
Acquisition-related costs in the period October 1, 2017 through September 30, 2020. Inthird quarter and first nine months of 2019 totaled $0.4 million and $1.2 million, respectively, compared to $1.6 million and 1.7 million in the third quarter and first nine months of 2018, respectively. Acquisition-related costs include direct costs of potential and 2017,completed acquisitions (e.g., investment banker fees and professional fees, including legal and valuation services) and expenses related to acquisition integration activities (e.g., professional fees and severance). In addition, subsequent adjustments to our initial estimated amount of contingent consideration associated with specific acquisitions are included within acquisition-related charges. These costs are classified in general and administrative expenses in the accompanying Consolidated Statements of Operations.
Frustum
On November 19, 2018, we repurchased $100acquired Frustum Inc. for $69.5 million (net of cash acquired of $0.7 million). We financed the acquisition with borrowings under our credit facility. Frustum is engaged in next-generation computer-aided design, including generative design, an approach that leverages artificial intelligence to generate design options. At the time of the acquisition, Frustum had approximately 12 employees and $35 million, respectively,historical annualized revenues were not material. We do not expect the acquisition to add material revenue in fiscal 2019.
The acquisition of our common stock.Frustum has been accounted for as a business combination. Assets acquired and liabilities assumed have been recorded at their estimated fair values as of the acquisition date. The 2018 repurchase was accomplished through an accelerated share repurchase ("ASR") agreement withfair values of intangible assets were based on valuations using a major financial institution that we entered into in April 2018. Under this ASR, we repurchased our common stock at adiscounted cash flow model which requires the use of significant estimates and assumptions, including estimating future revenues and costs. The excess of the purchase price determinedover the tangible assets, identifiable intangible assets and assumed liabilities was recorded as goodwill.
The purchase price allocation resulted in $53.7 million of goodwill, $17.9 million of purchased software and $2.1 million of other net liabilities. The acquired technology is being amortized over a useful life of 15 years based on the expected benefit pattern of the assets. The acquired goodwill was allocated to our software products segment and will not be deductible for income tax purposes. The resulting amount of goodwill reflects the expected value that will be created by integrating Frustum generative design technology into our CAD solutions.
Other Acquisitions
In the average marketthird quarter of 2019, we completed two acquisitions for $17.3 million (net of cash acquired of $0.3 million). At the time of acquisitions, the combined companies had approximately 95 employees and historical annualized revenues were not material. We do not expect the acquisitions to add material revenue in fiscal 2019.
The acquisitions were accounted for as business combinations. Assets acquired and liabilities assumed have been recorded at their estimated fair values as of the acquisition dates. The fair values of intangible assets were based on valuations using a discounted cash flow model which requires the use of significant estimates and assumptions, including estimating future revenues and costs. The excess of the purchase price over a period of time, with final settlementthe tangible assets, identifiable intangible assets and assumed liabilities was recorded as goodwill.
The purchase price allocation resulted in June 2018.
In July 2018, our Board of Directors has authorized us to repurchase up to an additional $1,000$12.6 million of goodwill, $3.4 million of customer relationships and $1.3 million of other net assets. The acquired goodwill was allocated to our common stock through September 30, 2020. We entered into a new $1,000 million ASR as described in Note 14. Subsequent Events. Final settlement of this ASR is expected to occur in 7.5 to 10 months.services segment and will not be deductible for income tax purposes.
6.7. Goodwill and Intangible Assets
In 2017, we had threeWe have two operating and reportable segments: (1) Solutions Group, (2) IoT Group and (3) Professional Services. Effective with the beginning of the first quarter of 2018, we changed our operating and reportable segments from three to two: (1) Software Products and (2) Professional Services. We assess goodwill for impairment at the reporting unit level. Our reporting units are determined based on the components of our operating segments that constitute a business for which discrete financial information is available and for which operating results are regularly reviewed by segment management. Our reporting units are the same as our operating segments.
As of June 29, 2019, goodwill and acquired intangible assets in the aggregate attributable to our Software Products segment was $1,382.2 million and attributable to our Professional Services segment was $46.1 million. As of September 30, 2018, goodwill and acquired intangible assets in the aggregate attributable to our Software Products segment was $1,366.8$1,352.4 million and attributable to our Professional Services segment was $30.3 million. As of September 30, 2017, goodwill and acquired intangible assets in the aggregate attributable to our Software Products segment was $1,410.0 million and our Professional Services segment was $30.6$30.2 million. Acquired intangible assets are reviewed for impairment whenever events or changes in circumstances indicate that the carrying value of the asset may not be recoverable.
We completed our annual goodwill impairment review as of June 30, 201829, 2019 based on a qualitative assessment. Our qualitative assessment included company specific (financial performance and long-range plans), industry, and macroeconomic factors, and consideration of the fair value of each reporting unit relative to its carrying value at the last valuation date. Based on our qualitative assessment, we believe it is more likely than not that the fair values of our reporting units exceed their carrying values and no further impairment testing is required.
Goodwill and acquired intangible assets consisted of the following:
| | | | June 30, 2018 | | September 30, 2017 | June 29, 2019 | | September 30, 2018 |
| | Gross Carrying Amount | | Accumulated Amortization | | Net Book Value | | Gross Carrying Amount | | Accumulated Amortization | | Net Book Value | Gross Carrying Amount | | Accumulated Amortization | | Net Book Value | | Gross Carrying Amount | | Accumulated Amortization | | Net Book Value |
| | (in thousands) | (in thousands) |
| Goodwill (not amortized) | | | | | $ | 1,182,462 |
| | | | | | $ | 1,182,772 |
| | | | | $ | 1,245,084 |
| | | | | | $ | 1,182,457 |
|
| Intangible assets with finite lives (amortized) (1): | | | | | | | | | | | | | | | | | | | | | | |
| Purchased software | $ | 362,992 |
| | $ | 247,694 |
| | $ | 115,298 |
| | $ | 362,955 |
| | $ | 228,377 |
| | $ | 134,578 |
| $ | 379,459 |
| | $ | 273,371 |
| | $ | 106,088 |
| | $ | 362,679 |
| | $ | 254,059 |
| | $ | 108,620 |
|
| Capitalized software | 22,877 |
| | 22,877 |
| | — |
| | 22,877 |
| | 22,877 |
| | — |
| 22,877 |
| | 22,877 |
| | — |
| | 22,877 |
| | 22,877 |
| | — |
|
| Customer lists and relationships | 357,904 |
| | 262,982 |
| | 94,922 |
| | 359,932 |
| | 241,554 |
| | 118,378 |
| 359,361 |
| | 286,059 |
| | 73,302 |
| | 357,586 |
| | 270,272 |
| | 87,314 |
|
| Trademarks and trade names | 19,080 |
| | 14,643 |
| | 4,437 |
| | 19,138 |
| | 14,186 |
| | 4,952 |
| 19,012 |
| | 15,222 |
| | 3,790 |
| | 19,054 |
| | 14,786 |
| | 4,268 |
|
| Other | 4,013 |
| | 4,013 |
| | — |
| | 4,030 |
| | 4,030 |
| | — |
| 3,972 |
| | 3,972 |
| | — |
| | 4,003 |
| | 4,003 |
| | — |
|
| | $ | 766,866 |
| | $ | 552,209 |
| | $ | 214,657 |
| | $ | 768,932 |
| | $ | 511,024 |
| | $ | 257,908 |
| $ | 784,681 |
| | $ | 601,501 |
| | $ | 183,180 |
| | $ | 766,199 |
| | $ | 565,997 |
| | $ | 200,202 |
|
| Total goodwill and acquired intangible assets | | | | | $ | 1,397,119 |
| | | | | | $ | 1,440,680 |
| | | | | $ | 1,428,264 |
| | | | | | $ | 1,382,659 |
|
(1) The weighted-average useful lives of purchased software, customer lists and relationships, and trademarks and trade names with a remaining net book value are 9 years, 10 years, and 1011 years, respectively.
Goodwill
Changes in goodwill presented by reportable segments were as follows:
|
| | | | | | | | | | | |
| | Software Products | | Professional Services | | Total |
| | (in thousands) |
| Balance, October 1, 2018 | $ | 1,152,720 |
| | $ | 29,737 |
| | $ | 1,182,457 |
|
| Frustum acquisition | 53,673 |
| | — |
| | 53,673 |
|
| Other acquisitions | — |
| | 12,645 |
| | 12,645 |
|
| Foreign currency translation adjustment | (3,598 | ) | | (93 | ) | | (3,691 | ) |
| Balance, June 29, 2019 | $ | 1,202,795 |
| | $ | 42,289 |
| | $ | 1,245,084 |
|
|
| | | | | | | | | | | |
| | Software Products | | Professional Services | | Total |
| | (in thousands) |
| Balance, October 1, 2017 | $ | 1,152,917 |
| | $ | 29,855 |
| | $ | 1,182,772 |
|
| Acquisition | 4,350 |
| | — |
| | 4,350 |
|
| Foreign currency translation adjustment | (4,542 | ) | | (118 | ) | | (4,660 | ) |
| Balance, June 30, 2018 | $ | 1,152,725 |
| | $ | 29,737 |
| | $ | 1,182,462 |
|
Amortization of Intangible Assets
The aggregate amortization expense for intangible assets with finite lives was classified in our Consolidated Statements of Operations as follows:
|
| | | | | | | | | | | | | | | |
| | Three months ended | | Nine months ended |
| | June 29,
2019 | | June 30,
2018 | | June 29,
2019 | | June 30,
2018 |
| | (in thousands) |
| Amortization of acquired intangible assets | $ | 5,920 |
| | $ | 7,850 |
| | $ | 17,786 |
| | $ | 23,566 |
|
| Cost of license revenue | 6,873 |
| | 6,798 |
| | 20,432 |
| | 20,029 |
|
| Total amortization expense | $ | 12,793 |
| | $ | 14,648 |
| | $ | 38,218 |
| | $ | 43,595 |
|
|
| | | | | | | | | | | | | | | |
| | Three months ended | | Nine months ended |
| | June 30,
2018 | | July 1,
2017 | | June 30,
2018 | | July 1,
2017 |
| | (in thousands) |
| Amortization of acquired intangible assets | $ | 7,850 |
| | $ | 7,973 |
| | $ | 23,566 |
| | $ | 23,986 |
|
| Cost of license and subscription revenue | 6,798 |
| | 6,517 |
| | 20,029 |
| | 19,294 |
|
| Total amortization expense | $ | 14,648 |
| | $ | 14,490 |
| | $ | 43,595 |
| | $ | 43,280 |
|
7.
8. Fair Value Measurements
Fair value is defined as the price that would be received from selling an asset or paid to transfer a liability in an orderly transaction between market participants at the measurement date. When determining the fair value measurements for assets and liabilities required to be recorded at fair value, we consider the principal or most advantageous market in which we would transact and consider assumptions that market participants would use when pricing the asset or liability, such as inherent risk, transfer restrictions, and risk of nonperformance. Generally accepted accounting principles prescribeGAAP prescribes a fair value hierarchy that requires an entity to maximize the use of observable inputs and minimize the use of unobservable inputs when measuring fair value. A financial instrument’s categorization within the fair value hierarchy is based upon the lowest level of input that is significant to the fair value measurement. Three levels of inputs that may be used to measure fair value:
Level 1: quoted prices (unadjusted) in active markets for identical assets or liabilities;
Level 2: inputs other than Level 1 that are observable, either directly or indirectly, such as quoted prices in active markets for similar assets or liabilities, quoted prices for identical or similar assets or liabilities in markets that are not active, or other inputs that are observable or can be corroborated by observable market data for substantially the full term of the assets or liabilities; or
Level 3: unobservable inputs that are supported by little or no market activity and that are significant to the fair value of the assets or liabilities.
A financial instrument’s level within the fair value hierarchy is based on the lowest level of any input that is significant to the fair value measurement.
Money market funds, time deposits and corporate notes/bonds are classified within Level 1 of the fair value hierarchy because they are valued based on quoted market prices in active markets.
Certificates of deposit, commercial paper and certain U.S. government agency securities are classified within Level 2 of the fair value hierarchy. These instruments are valued based on quoted prices in markets that are not active or based on other observable inputs consisting of market yields, reported trades and broker/dealer quotes.
The principal market in which we execute our foreign currency contracts is the institutional market in an over-the-counter environment with a relatively high level of price transparency. The market participants usually are large financial institutions. Our foreign currency contracts’ valuation inputs are based on quoted prices and quoted pricing intervals from public data sources and do not involve management judgment. These contracts are typically classified within Level 2 of the fair value hierarchy.
The fair value of our contingent consideration arrangements is determined based on our evaluation of the probability and amount of any earn-out that will be achieved based on expected future performances by the acquired entities. These arrangements are classified within Level 3 of the fair value hierarchy.
Our significant financial assets and liabilities measured at fair value on a recurring basis as of June 30, 201829, 2019 and September 30, 20172018 were as follows: | | | | June 30, 2018 | June 29, 2019 |
| | Level 1 | | Level 2 | | Level 3 | | Total | Level 1 | | Level 2 | | Level 3 | | Total |
| | (in thousands) | (in thousands) |
| Financial assets: | | | | | | | | | | | | | | |
| Cash equivalents | $ | 85,382 |
| | $ | — |
| | $ | — |
| | $ | 85,382 |
| $ | 106,155 |
| | $ | — |
| | $ | — |
| | $ | 106,155 |
|
| Marketable securities |
| |
|
| |
| |
|
| |
|
| |
| |
|
| Certificates of deposit | — |
| | 219 |
| | — |
| | 219 |
| |
| Commercial paper | | — |
| | 4,475 |
| | — |
| | 4,475 |
|
| Corporate notes/bonds | 52,962 |
| | — |
| | — |
| | 52,962 |
| 50,151 |
| | — |
| | — |
| | 50,151 |
|
| U.S. government agency securities | — |
| | 991 |
| | — |
| | 991 |
| |
| Forward contracts | — |
| | 4,956 |
| | — |
| | 4,956 |
| — |
| | 4,202 |
| | — |
| | 4,202 |
|
| | $ | 138,344 |
| | $ | 6,166 |
| | $ | — |
| | $ | 144,510 |
| $ | 156,306 |
| | $ | 8,677 |
| | $ | — |
| | $ | 164,983 |
|
| Financial liabilities: |
|
| |
|
| |
| |
|
|
| |
|
| |
| |
|
| Contingent consideration related to acquisitions | $ | — |
| | $ | — |
| | $ | 2,100 |
| | $ | 2,100 |
| |
| Forward contracts | — |
| | 1,190 |
| | — |
| | 1,190 |
| — |
| | 5,397 |
| | — |
| | 5,397 |
|
| | $ | — |
| | $ | 1,190 |
| | $ | 2,100 |
| | $ | 3,290 |
| $ | — |
| | $ | 5,397 |
| | $ | — |
| | $ | 5,397 |
|
| | | | September 30, 2017 | September 30, 2018 |
| | Level 1 | | Level 2 | | Level 3 | | Total | Level 1 | | Level 2 | | Level 3 | | Total |
| | (in thousands) | (in thousands) |
| Financial assets: | | | | | | | | | | | | | | |
| Cash equivalents | $ | 49,845 |
| | $ | — |
| | $ | — |
| | $ | 49,845 |
| $ | 93,058 |
| | $ | — |
| | $ | — |
| | $ | 93,058 |
|
| Marketable securities |
| |
|
| |
| |
|
| |
|
| |
| |
|
| Certificates of deposit | — |
| | 240 |
| | — |
| | 240 |
| — |
| | 219 |
| | — |
| | 219 |
|
| Corporate notes/bonds | 47,673 |
| | — |
| | — |
| | 47,673 |
| 54,737 |
| | — |
| | — |
| | 54,737 |
|
| U.S. government agency securities | — |
| | 2,402 |
| | — |
| | 2,402 |
| — |
| | 995 |
| | — |
| | 995 |
|
| Forward contracts | — |
| | 1,163 |
| | — |
| | 1,163 |
| — |
| | 2,889 |
| | — |
| | 2,889 |
|
| | $ | 97,518 |
| | $ | 3,805 |
| | $ | — |
| | $ | 101,323 |
| $ | 147,795 |
| | $ | 4,103 |
| | $ | — |
| | $ | 151,898 |
|
| Financial liabilities: |
|
| |
|
| |
| |
|
|
| |
|
| |
| |
|
| Contingent consideration related to acquisitions | $ | — |
| | $ | — |
| | $ | 8,400 |
| | $ | 8,400 |
| $ | — |
| | $ | — |
| | $ | 1,575 |
| | $ | 1,575 |
|
| Forward contracts | — |
| | 4,347 |
| | — |
| | 4,347 |
| — |
| | 3,419 |
| | — |
| | 3,419 |
|
| | $ | — |
| | $ | 4,347 |
| | $ | 8,400 |
| | $ | 12,747 |
| $ | — |
| | $ | 3,419 |
| | $ | 1,575 |
| | $ | 4,994 |
|
Changes in the fair value of Level 3 contingent consideration liability associated with our acquisitions were as follows:
|
| | | |
| | Contingent Consideration |
| | (in thousands) |
| | Other |
| Balance, October 1, 2018 | $ | 1,575 |
|
| Payment of contingent consideration | (1,575 | ) |
| Balance, June 29, 2019 | $ | — |
|
|
| | | | | | | | | | | |
| | Contingent Consideration |
| | (in thousands) |
| | Kepware | | Other | | Total |
| Balance, October 1, 2017 | $ | 8,400 |
| | $ | — |
| | $ | 8,400 |
|
| Addition to contingent consideration | — |
| | 2,100 |
| | 2,100 |
|
| Payment of contingent consideration | (8,400 | ) | | — |
| | (8,400 | ) |
| Balance, June 30, 2018 | $ | — |
| | $ | 2,100 |
| | $ | 2,100 |
|
|
| | | | | | | | | | | |
| | Contingent Consideration |
| | (in thousands) |
| | ColdLight | | Kepware | | Total |
| Balance, October 1, 2016 | $ | 2,500 |
| | $ | 17,070 |
| | $ | 19,570 |
|
| Change in present value of contingent consideration | — |
| | 392 |
| | 392 |
|
| Payment of contingent consideration | (2,500 | ) | | (9,600 | ) | | (12,100 | ) |
| Balance, July 1, 2017 | $ | — |
| | $ | 7,862 |
| | $ | 7,862 |
|
InOf the Consolidated Balance Sheet as$1.6 million in payments in the first nine months of June 30, 2018, $1.12019, $1.6 million represents the fair value of the contingent consideration liabilityliabilities recorded at the acquisition date and is included in accrued expenses and other current liabilities withfinancing activities in the remaining $1.0 million in other liabilities.
Consolidated Statements of Cash Flows. Of the $8.4 million in payments in the first nine months of 2018, $7.8 million represents the fair value of the liabilities recorded at the acquisition date and is included in financing activities in the Consolidated Statements of Cash Flows. Of
Non-Marketable Equity Investments
We account for non-marketable equity investments at cost, less any impairment, plus or minus adjustments resulting from observable price changes in orderly transactions for identical or similar investments of the $12.1 million paymentssame issuer. We monitor non-marketable equity investments for events that could indicate that the investments are impaired, such as deterioration in the first nine months of 2017, $11.1 million represents theinvestee's financial condition and business forecasts, and lower valuations in recent or proposed financings. Changes in fair value of the liabilitiesnon-marketable equity investments are recorded at the acquisition date and is included in financing activities inOther income (expense), net on the Consolidated Statements of Cash Flows.
In connection withOperations. The carrying value of our acquisition of Kepware, the former shareholders were eligible to receive additional consideration of up to $18.0 million, which was contingentnon-marketable equity investments is recorded in other assets on the achievement of certain Financial Performance, Product IntegrationConsolidated Balance Sheets and Business Integration targets (as defined in the Stock Purchase Agreement) within 24 months from April 1, 2016. The estimated undiscounted range of outcomes for the contingent consideration was $16.9totaled $9.4 million to $18.0and $1.7 million at the acquisition date. Asas of June 29, 2019 and September 30, 2018, we had made $18.0 million in payments and had no liability remaining.respectively.
8.9. Marketable Securities
The amortized cost and fair value of marketable securities as of June 30, 201829, 2019 and September 30, 20172018 were as follows:
|
| | | | | | | | | | | | | | | |
| June 30, 2018 |
| Amortized cost | | Gross unrealized gains | | Gross unrealized losses | | Fair value |
| | (in thousands) |
| Certificates of deposit | $ | 221 |
| | $ | — |
| | $ | (2 | ) | | $ | 219 |
|
| Corporate notes/bonds | 53,474 |
| | — |
| | (512 | ) | | 52,962 |
|
| U.S. government agency securities | 1,000 |
| | — |
| | (9 | ) | | 991 |
|
| $ | 54,695 |
| | $ | — |
| | $ | (523 | ) | | $ | 54,172 |
|
|
| | | | | | | | | | | | | | | |
| June 29, 2019 |
| Amortized cost | | Gross unrealized gains | | Gross unrealized losses | | Fair value |
| | (in thousands) |
| Commercial paper | $ | 4,474 |
| | $ | 1 |
| | $ | — |
| | $ | 4,475 |
|
| Corporate notes/bonds | 50,087 |
| | 123 |
| | (59 | ) | | 50,151 |
|
| $ | 54,561 |
| | $ | 124 |
| | $ | (59 | ) | | $ | 54,626 |
|
| |
| September 30, 2017 | September 30, 2018 |
| Amortized cost | | Gross unrealized gains | | Gross unrealized losses | | Fair value | Amortized cost | | Gross unrealized gains | | Gross unrealized losses | | Fair value |
| | (in thousands) | (in thousands) |
| Certificates of deposit | $ | 240 |
| | $ | — |
| | $ | — |
| | $ | 240 |
| $ | 220 |
| | $ | — |
| | $ | (1 | ) | | $ | 219 |
|
| Corporate notes/bonds | 47,811 |
| | 2 |
| | (140 | ) | | 47,673 |
| 55,140 |
| | — |
| | (403 | ) | | 54,737 |
|
| U.S. government agency securities | 2,407 |
| | — |
| | (5 | ) | | 2,402 |
| 1,004 |
| | — |
| | (9 | ) | | 995 |
|
| $ | 50,458 |
| | $ | 2 |
| | $ | (145 | ) | | $ | 50,315 |
| $ | 56,364 |
| | $ | — |
| | $ | (413 | ) | | $ | 55,951 |
|
Our investment portfolio consists of certificates of deposit, commercial paper, corporate notes/bonds and government securities that have a maximum maturity of threetwo years. The longer the duration of these securities, the more susceptible they are to changes in market interest rates and bond yields. All unrealized losses are due to changes in market interest rates, bond yields and/or credit ratings.
We review our investments to identify and evaluate investments that have an indication of possible impairment. We concluded that, at June 30, 2018,29, 2019, the unrealized losses were temporary.
The following tables summarize the fair value and gross unrealized losses aggregated by category and the length of
time that individual securities have been in a continuous unrealized loss position as of June 30, 201829, 2019 and September 30, 2017.
|
| | | | | | | | | | | | | | | | | | | | | | | |
| | June 30, 2018 |
| | Less than twelve months | | Greater than twelve months | | Total |
| | Fair Value | | Gross unrealized loss | | Fair Value | | Gross unrealized loss | | Fair Value | | Gross unrealized loss |
| | (in thousands) |
| Certificates of deposit | $ | 219 |
| | $ | (2 | ) | | $ | — |
| | $ | — |
| | $ | 219 |
| | $ | (2 | ) |
| Corporate notes/bonds | 31,516 |
| | (358 | ) | | 21,446 |
| | (154 | ) | | 52,962 |
| | (512 | ) |
| U.S. government agency securities | — |
| | — |
| | 991 |
| | (9 | ) | | 991 |
| | (9 | ) |
| | $ | 31,735 |
| | $ | (360 | ) | | $ | 22,437 |
| | $ | (163 | ) | | $ | 54,172 |
| | $ | (523 | ) |
|
| | | | | | | | | | | | | | | | | | | | | | | |
| | June 29, 2019 |
| | Less than twelve months | | Greater than twelve months | | Total |
| | Fair Value | | Gross unrealized loss | | Fair Value | | Gross unrealized loss | | Fair Value | | Gross unrealized loss |
| | (in thousands) |
| Corporate notes/bonds | $ | 3,519 |
| | $ | (6 | ) | | $ | 24,398 |
| | $ | (53 | ) | | $ | 27,917 |
| | $ | (59 | ) |
| | $ | 3,519 |
| | $ | (6 | ) | | $ | 24,398 |
| | $ | (53 | ) | | $ | 27,917 |
| | $ | (59 | ) |
|
| | | | | | | | | | | | | | | | | | | | | | | |
| | September 30, 2018 |
| | Less than twelve months | | Greater than twelve months | | Total |
| | Fair Value | | Gross unrealized loss | | Fair Value | | Gross unrealized loss | | Fair Value | | Gross unrealized loss |
| | (in thousands) |
| Certificates of deposit | $ | 219 |
| | $ | (1 | ) | | $ | — |
| | $ | — |
| | $ | 219 |
| | $ | (1 | ) |
| Corporate notes/bonds | 24,067 |
| | (70 | ) | | 30,670 |
| | (333 | ) | | 54,737 |
| | (403 | ) |
| U.S. government agency securities | — |
| | — |
| | 995 |
| | (9 | ) | | 995 |
| | (9 | ) |
| | $ | 24,286 |
| | $ | (71 | ) | | $ | 31,665 |
| | $ | (342 | ) | | $ | 55,951 |
| | $ | (413 | ) |
|
| | | | | | | | | | | | | | | | | | | | | | | |
| | September 30, 2017 |
| | Less than twelve months | | Greater than twelve months | | Total |
| | Fair Value | | Gross unrealized loss | | Fair Value | | Gross unrealized loss | | Fair Value | | Gross unrealized loss |
| | (in thousands) |
| Certificates of deposit | $ | 240 |
| | $ | — |
| | $ | — |
| | $ | — |
| | $ | 240 |
| | $ | — |
|
| Corporate notes/bonds | 15,254 |
| | (43 | ) | | 28,885 |
| | (97 | ) | | 44,139 |
| | (140 | ) |
| U.S. government agency securities | — |
| | — |
| | 2,402 |
| | (5 | ) | | 2,402 |
| | (5 | ) |
| | $ | 15,494 |
| | $ | (43 | ) | | $ | 31,287 |
| | $ | (102 | ) | | $ | 46,781 |
| | $ | (145 | ) |
The following table presents our available-for-sale marketable securities by contractual maturity date as of June 30, 201829, 2019 and September 30, 2017.2018.
|
| | | | | | | | | | | | | | | |
| June 29, 2019 | | September 30, 2018 |
| Amortized cost | | Fair value | | Amortized cost | | Fair value |
| | (in thousands) |
| Due in one year or less | $ | 32,977 |
| | $ | 32,947 |
| | $ | 25,792 |
| | $ | 25,670 |
|
| Due after one year through three years | 21,584 |
| | 21,679 |
| | 30,572 |
| | 30,281 |
|
| $ | 54,561 |
| | $ | 54,626 |
| | $ | 56,364 |
| | $ | 55,951 |
|
|
| | | | | | | | | | | | | | | |
| June 30, 2018 | | September 30, 2017 |
| Amortized cost | | Fair value | | Amortized cost | | Fair value |
| | (in thousands) | | (in thousands) |
| Due in one year or less | $ | 22,300 |
| | $ | 22,170 |
| | $ | 18,274 |
| | $ | 18,244 |
|
| Due after one year through three years | 32,395 |
| | 32,002 |
| | 32,184 |
| | 32,071 |
|
| $ | 54,695 |
| | $ | 54,172 |
| | $ | 50,458 |
| | $ | 50,315 |
|
9.10. Derivative Financial Instruments
Our earnings and cash flows are subject to fluctuations due to changes in foreign currency exchange rates. Our most significant foreign currency exposures relate to Western European countries, Japan, China, Israel, India and Canada. Our foreign currency risk management strategy is principally designed to mitigate the future potential financial impact of changes in the U.S. Dollar value of anticipated transactions and balances denominated in foreign currency resulting from changes in foreign currency exchange rates. We enter into derivative transactions, specifically foreign currency forward contracts, to manage the exposures to foreign currency exchange risk to reduce earnings volatility. We do not enter into derivatives transactions for trading or speculative purposes.
Non-Designated Hedges
We hedge our net foreign currency monetary assets and liabilities primarily resulting from foreign currency denominated receivables and payables with foreign exchange forward contracts to reduce the risk that our earnings and cash flows will be adversely affected by changes in foreign currency exchange rates. These contracts have maturities of up to approximately three months. Generally, we do not designate these foreign currency forward contracts as hedges for accounting purposes and changes in the fair value of these instruments are recognized immediately in earnings. Because we enter into forward contracts only as an economic hedge, any gain or loss on the underlying foreign-denominated
balance would be offset by the loss or gain on the forward contract. Gains and losses on forward
contracts and foreign denominated receivables and payables are included in interestOther income and other expense,(expense), net.
As of June 30, 201829, 2019 and September 30, 2017,2018, we had outstanding forward contracts with notional amounts equivalent to the following:
|
| | | | | | | |
| Currency Hedged | June 29,
2019 | | September 30,
2018 |
| | (in thousands) |
| Canadian / U.S. Dollar | 10,095 |
| | 7,334 |
|
| Euro / U.S. Dollar | 328,802 |
| | 297,730 |
|
| British Pound / U.S. Dollar | 4,530 |
| | 7,074 |
|
| Israeli Sheqel / U.S. Dollar | 8,641 |
| | 9,778 |
|
| Japanese Yen / U.S. Dollar | 35,350 |
| | 37,456 |
|
| Swiss Franc / U.S. Dollar | 9,364 |
| | 11,944 |
|
| Danish Kroner/ U.S. Dollar | 3,600 |
| | 1,902 |
|
| Swedish Kronor / U.S. Dollar | 17,893 |
| | 18,207 |
|
| Chinese Yuan offshore / U.S. Dollar | 3,921 |
| | 116 |
|
| Singapore Dollar / U.S. Dollar | 33,380 |
| | 1,314 |
|
| Chinese Renminbi / U.S. Dollar | 9,217 |
| | 9,010 |
|
| All other | 6,746 |
| | 4,091 |
|
| Total | $ | 471,539 |
| | $ | 405,956 |
|
|
| | | | | | | |
| Currency Hedged | June 30,
2018 | | September 30,
2017 |
| | (in thousands) |
| Australian / U.S. Dollar | $ | 3,226 |
| | $ | 1,585 |
|
| Canadian / U.S. Dollar | 7,421 |
| | 12,809 |
|
| Swiss Franc / Euro | — |
| | 7,157 |
|
| Chinese Yuan offshore / Euro | — |
| | 10,423 |
|
| Euro / U.S. Dollar | 309,733 |
| | 244,000 |
|
| Japanese Yen / Euro | — |
| | 17,694 |
|
| Israeli Shekel / U.S. Dollar | 7,677 |
| | 8,820 |
|
| Japanese Yen / U.S. Dollar | 18,152 |
| | 3,198 |
|
| Swedish Krona / U.S. Dollar | 8,568 |
| | 4,627 |
|
| Danish Krona / U.S. Dollar | 2,645 |
| | 1,743 |
|
| Hong Kong / U.S. Dollar | 2,628 |
| | 915 |
|
| All other | 8,151 |
| | 5,548 |
|
| Total | $ | 368,201 |
| | $ | 318,519 |
|
The following table shows the effect of our non-designated hedges in the Consolidated Statements of Operations for the three and nine months ended June 29, 2019 and June 30, 2018 and July 1, 2017:2018:
|
| | | | | | | | | | | | | | | | | | |
| Derivatives Not Designated as Hedging Instruments | | Location of Gain or (Loss) Recognized in Income | | Net realized and unrealized gain or (loss) (excluding the underlying foreign currency exposure being hedged) |
| | | | | Three months ended | | Nine months ended |
| | | | | June 29,
2019 | | June 30,
2018 | | June 29,
2019 | | June 30,
2018 |
| | | | | (in thousands) |
| Forward Contracts | | Other income (expense), net | | $ | 1,735 |
| | $ | (9,392 | ) | | $ | (1,004 | ) | | $ | (6,370 | ) |
|
| | | | | | | | | | | | | | | | | | |
| Derivatives Not Designated as Hedging Instruments | | Location of Gain or (Loss) Recognized in Income | | Net realized and unrealized gain or (loss) (excluding the underlying foreign currency exposure being hedged) |
| | | | | Three months ended | | Nine months ended |
| | | | | June 30,
2018 | | July 1,
2017 | | June 30,
2018 | | July 1,
2017 |
| | | | | (in thousands) |
| Forward Contracts | | Interest income and other expense, net | | $ | (9,392 | ) | | $ | 6,669 |
| | $ | (6,370 | ) | | $ | (1,422 | ) |
In the three months ended June 29, 2019 foreign currency gains, net were $0.1 million, and in the first nine months ended June 29, 2019 foreign currency losses, net were $0.2 million. In the three and nine months ended June 30, 2018 foreign currency losses, net were $2.2 million and $5.4 million, respectively. In the three and nine months ended July 1, 2017, foreign currency losses, net were $0.7 million and $3.2 million, respectively.
Cash Flow Hedges
Our foreign exchange risk management program objective is to identify foreign exchange exposures and implement appropriate hedging strategies to minimize earnings fluctuations resulting from foreign exchange rate movements. We designateIn 2018 and the first quarter of 2019, we designated certain foreign exchange forward contracts as cash flow hedges of Euro, Yen and SEK denominated intercompany forecasted revenue transactions (supported by third partythird-party sales). All foreign exchange forward contracts arewere carried at fair value on the Consolidated Balance Sheets and thehad maximum duration of up to 15 months. There were no foreign exchange forward contracts is 15 months.designated as cash flow hedges as of June 29, 2019.
Cash flow hedge relationships arewere designated at inception, and effectiveness iswas assessed prospectively and retrospectively using monthly regression analysis monthly.analysis. As the forward contracts arewere highly effective in offsetting changes to future cash flows on the hedged transactions, we recordrecorded the effective portion of changes in these cash flow hedges in accumulated other comprehensive income and subsequently reclassifyreclassified it into earnings in the period during which the hedged transactions arewere recognized in earnings. Changes in the fair value of foreign exchange forward contracts due to changes in time value arewas included in the assessment of effectiveness. Our derivatives arewere not subject to any credit
credit contingent features. We managemanaged credit risk with counterparties by trading among several counterparties and we reviewreviewed our counterparties’ credit at least quarterly.
As of June 30, 201829, 2019 and September 30, 2017,2018, we had outstanding forward contracts designated as cash flow hedges with notional amounts equivalent to the following: |
| | | | | | | |
| Currency Hedged | June 29,
2019 | | September 30,
2018 |
| | (in thousands) |
| Euro / U.S. Dollar | $ | — |
| | $ | 8,495 |
|
| Japanese Yen / U.S. Dollar | — |
| | 2,193 |
|
| Swedish Kronor / U.S. Dollar | — |
| | 1,708 |
|
| Total | $ | — |
| | $ | 12,396 |
|
|
| | | | | | | |
| Currency Hedged | June 30,
2018 | | September 30,
2017 |
| | (in thousands) |
| Euro / U.S. Dollar | $ | 44,699 |
| | $ | 64,831 |
|
| Japanese Yen / U.S. Dollar | 11,830 |
| | 22,675 |
|
| SEK / U.S. Dollar | 10,521 |
| | 14,091 |
|
| Total | $ | 67,050 |
| | $ | 101,597 |
|
The following table shows the effect of our derivative instruments designated as cash flow hedges in the Consolidated Statements of Operations for the three and nine months ended June 29, 2019 and June 30, 2018 and July 1, 2017 (in thousands):
|
| | | | | | | | | | | | | | | | | | | | | | | | | | | | |
| Derivatives Designated as Hedging Instruments | | Gain or (Loss) Recognized in OCI-Effective Portion | | Location of Gain or (Loss) Reclassified from OCI into Income-Effective Portion | | Gain or (Loss) Reclassified from OCI into Income-Effective Portion | | Location of Gain or (Loss) Recognized-Ineffective Portion | | Gain or (Loss) Recognized-Ineffective Portion |
|
| Three months ended |
|
|
| Three months ended |
|
|
| Three months ended |
|
| June 29,
2019 |
| June 30,
2018 |
|
|
| June 29,
2019 |
| June 30,
2018 |
|
|
| June 29,
2019 |
| June 30,
2018 |
| Forward Contracts | | $ | — |
| | $ | 4,468 |
| | Total software revenue | | $ | — |
| | $ | (277 | ) | | Other income (expense), net | | $ | — |
| | $ | 52 |
|
| | | | | | | | | | | | | | | | | |
|
| Nine months ended |
|
|
| Nine months ended |
|
|
| Nine months ended |
|
| June 29,
2019 |
| June 30,
2018 |
|
|
| June 29,
2019 |
| June 30,
2018 |
|
|
| June 29,
2019 |
| June 30,
2018 |
| Forward Contracts | | $ | 187 |
| | $ | 1,086 |
| | Total software revenue | | $ | 627 |
| | $ | (2,659 | ) | | Other income (expense), net | | $ | — |
| | $ | 17 |
|
|
| | | | | | | | | | | | | | | | | | | | | | | | | | | | |
| Derivatives Designated as Hedging Instruments | | Gain or (Loss) Recognized in OCI-Effective Portion | | Location of Gain or (Loss) Reclassified from OCI into Income-Effective Portion | | Gain or (Loss) Reclassified from OCI into Income-Effective Portion | | Location of Gain or (Loss) Recognized-Ineffective Portion | | Gain or (Loss) Recognized-Ineffective Portion |
| | | Three months ended | | | | Three months ended | | | | Three months ended |
| | | June 30,
2018 | | July 1,
2017 | | | | June 30,
2018 | | July 1,
2017 | | | | June 30,
2018 | | July 1,
2017 |
| Forward Contracts | | $ | 4,468 |
| | $ | (2,627 | ) | | Subscription, support and license revenue | | $ | (277 | ) | | $ | (86 | ) | | Interest income and other expense, net | | $ | 52 |
| | $ | (29 | ) |
| | | | | | | | | | | | | | | | | |
| | | Nine months ended | | | | Nine months ended | | | | Nine months ended |
| | | June 30,
2018 | | July 1,
2017 | | | | June 30,
2018 | | July 1,
2017 | | | | June 30,
2018 | | July 1,
2017 |
| Forward Contracts | | $ | 1,086 |
| | $ | 256 |
| | Subscription, support and license revenue | | $ | (2,659 | ) | | $ | 888 |
| | Interest income and other expense, net | | $ | 17 |
| | $ | (23 | ) |
As of June 30, 2018,29, 2019, we estimated that all amounts reportedhave no cash flow hedges outstanding and no balance in accumulated other comprehensive income will be reclassified to income within the next twelve months.loss.
If an underlying forecast transaction does not occur, or it becomes probable that it will not occur, the related hedge gains and losses on the cash flow hedge would be immediately reclassified to interestOther income and other expense,(expense), net on the Consolidated Statements of Operations. For the three and nine months ended June 29, 2019 and June 30, 2018, and July 1, 2017, there were no such gains or losses.
Net Investment Hedges
We translate balance sheet accounts of subsidiaries with foreign functional currencies into the U.S. Dollar using the exchange rate at each balance sheet date. Resulting translation adjustments are reported as a component of accumulated other comprehensive loss on the Consolidated Balance Sheet. We designate certain foreign exchange forward contracts as net investment hedges against exposure on translation of balance sheet accounts of Euro functional subsidiaries. Net investment hedges partially offset the impact of foreign currency translation adjustment recorded in accumulated other comprehensive loss on the Consolidated Balance Sheet. All foreign exchange forward contracts are carried at fair value on the Consolidated Balance Sheet and the maximum duration of foreign exchange forward contracts is approximately three months.
Net investment hedge relationships are designated at inception, and effectiveness is assessed retrospectively on a quarterly basis using the net equity position of Euro functional subsidiaries. As the forward contracts are highly effective in offsetting exchange rate exposure, we record changes in these net investment hedges in accumulated other comprehensive loss and subsequently reclassify them to foreign currency translation adjustment in accumulated other comprehensive loss at the time of forward contract maturity. Changes in the fair value of foreign exchange forward contracts due to changes in time value are excluded from the assessment of effectiveness. Our derivatives are not subject to any credit contingent features. We manage credit risk with counterparties by trading among several counterparties and we review our counterparties’ credit at least quarterly.
As of June 29, 2019 and September 30, 2018, we had outstanding forward contracts designated as net investment hedges with notional amounts equivalent to the following: |
| | | | | | | |
| Currency Hedged | June 29,
2019 | | September 30,
2018 |
| | (in thousands) |
| Euro / U.S. Dollar | $ | 217,202 |
| | $ | — |
|
| Total | $ | 217,202 |
| | $ | — |
|
The following table shows the effect of our derivative instruments designated as net investment hedges in the Consolidated Statements of Operations for the three and nine months ended June 29, 2019 and June 30, 2018 (in thousands): |
| | | | | | | | | | | | | | | | | | | | | | | | | | |
| Derivatives Designated as Hedging Instruments | | Gain or (Loss) Recognized in OCI-Effective Portion | | Location of Gain or (Loss) Reclassified from OCI -Effective Portion | Gain or (Loss) Reclassified from OCI-Effective Portion | | Location of Gain or (Loss) Excluded from Effectiveness Testing | Gain or (Loss) Recognized-Excluded Portion |
| | Three months ended | |
| Three months ended | |
| Three months ended |
| | June 29,
2019 |
| June 30,
2018 | |
| June 29,
2019 |
| June 30,
2018 | |
| June 29,
2019 |
| June 30,
2018 |
| Forward Contracts | | $ | (7,258 | ) | | $ | — |
| | Accumulated other comprehensive loss | $ | (4,132 | ) | | $ | — |
| | Other income (expense), net | $ | 1,562 |
| | $ | — |
|
| | | | | | | | | | | | | | | |
| | Nine months ended | |
| Nine months ended | |
| Nine months ended |
| | June 29,
2019 |
| June 30,
2018 | |
| June 29,
2019 |
| June 30,
2018 | |
| June 29,
2019 | | June 30,
2018 |
| Forward Contracts | | $ | (6,490 | ) | | $ | — |
| | Accumulated other comprehensive loss | $ | (5,172 | ) | | $ | — |
| | Other income (expense), net | $ | 3,155 |
| | $ | — |
|
As of June 29, 2019, we estimate that all amounts reported in accumulated other comprehensive loss will be applied against exposed balance sheet accounts upon translation within the next three months.
The following table shows our derivative instruments measured at gross fair value as reflected in the Consolidated Balance Sheets:
|
| | | | | | | | | | | | | | | |
| | Fair Value of Derivatives Designated As Hedging Instruments | | Fair Value of Derivatives Not Designated As Hedging Instruments |
| | June 29,
2019 | | September 30,
2018 | | June 29,
2019 | | September 30,
2018 |
| | (in thousands) |
| Derivative assets (1): | | | | | | | |
| Forward Contracts | $ | — |
| | $ | 440 |
| | $ | 4,202 |
| | $ | 2,449 |
|
| Derivative liabilities (2): | | | | | | | |
| Forward Contracts | $ | 3,336 |
| | $ | — |
| | $ | 2,061 |
| | $ | 3,419 |
|
|
| | | | | | | | | | | | | | | |
| | Fair Value of Derivatives Designated As Hedging Instruments | | Fair Value of Derivatives Not Designated As Hedging Instruments |
| | June 30,
2018 | | September 30,
2017 | | June 30,
2018 | | September 30,
2017 |
| | (in thousands) | | (in thousands) |
| Derivative assets (1): | | | | | | | |
| Forward Contracts | $ | 1,994 |
| | $ | 540 |
| | $ | 2,962 |
| | $ | 623 |
|
| Derivative liabilities (2): | | | | | | | |
| Forward Contracts | $ | 16 |
| | $ | 2,352 |
| | $ | 1,174 |
| | $ | 1,995 |
|
| (1) As of June 30, 2018, $4,956 thousand current derivative assets are recorded in other current assets, in the Consolidated Balance Sheets. As of September 30, 2017, $1,128 thousand current derivative assets are recorded in other current assets, and $35 thousand long-term derivative assets are recorded in other assets in the Consolidated Balance Sheets. |
| (2) As of June 30, 2018, $1,190 thousand current derivative liabilities are recorded in accrued expenses and other current liabilities in the Consolidated Balance Sheets. As of September 30, 2017, $4,329 thousand current derivative liabilities are recorded in accrued expenses and other current liabilities, and $18 thousand long term derivative liabilities are recorded in other liabilities in the Consolidated Balance Sheets. |
| |
| (1) | As of June 29, 2019 and September 30, 2018, current derivative assets of $4.2 million and $2.9 million, respectively, are recorded in other current assets in the Consolidated Balance Sheets. |
| |
| (2) | As of June 29, 2019 and September 30, 2018, current derivative liabilities of $5.4 million and $3.4 million, respectively are recorded in accrued expenses and other current liabilities in the Consolidated Balance Sheets. |
Offsetting Derivative Assets and Liabilities
We have entered into master netting arrangements that allow net settlements under certain conditions. Although netting is permitted, it is currently our policy and practice to record all derivative assets and liabilities on a gross basis in the Consolidated Balance Sheets.
The following table sets forth the offsetting of derivative assets as of June 30, 2018:29, 2019:
| | | | Gross Amounts Offset in the Consolidated Balance Sheets | | | | Gross Amounts Not Offset in the Consolidated Balance Sheets | | | Gross Amounts Offset in the Consolidated Balance Sheets | | | | Gross Amounts Not Offset in the Consolidated Balance Sheets | | |
| As of June 30, 2018 | Gross Amount of Recognized Assets | | Gross Amounts Offset in the Consolidated Balance Sheets | | Net Amounts of Assets Presented in the Consolidated Balance Sheets | | Financial Instruments | | Cash Collateral Received | | Net Amount | |
| As of June 29, 2019 | | Gross Amount of Recognized Assets | | Gross Amounts Offset in the Consolidated Balance Sheets | | Net Amounts of Assets Presented in the Consolidated Balance Sheets | | Financial Instruments | | Cash Collateral Received | | Net Amount |
| | (in thousands) | (in thousands) |
| Forward Contracts | $ | 4,956 |
| | $ | — |
| | $ | 4,956 |
| | $ | (1,190 | ) | | $ | — |
| | $ | 3,766 |
| $ | 4,202 |
| | $ | — |
| | $ | 4,202 |
| | $ | (4,202 | ) | | $ | — |
| | $ | — |
|
The following table sets forth the offsetting of derivative liabilities as of June 30, 2018:29, 2019:
|
| | | | | | | | | | | | | | | | | | | | | | | |
| | Gross Amounts Offset in the Consolidated Balance Sheets | | | | Gross Amounts Not Offset in the Consolidated Balance Sheets | | |
| As of June 29, 2019 | Gross Amount of Recognized Liabilities | | Gross Amounts Offset in the Consolidated Balance Sheets | | Net Amounts of Liabilities Presented in the Consolidated Balance Sheets | | Financial Instruments | | Cash Collateral Pledged | | Net Amount |
| | (in thousands) |
| Forward Contracts | $ | 5,397 |
| | $ | — |
| | $ | 5,397 |
| | $ | (4,202 | ) | | $ | — |
| | $ | 1,195 |
|
|
| | | | | | | | | | | | | | | | | | | | | | | |
| | Gross Amounts Offset in the Consolidated Balance Sheets | | | | Gross Amounts Not Offset in the Consolidated Balance Sheets | | |
| As of June 30, 2018 | Gross Amount of Recognized Liabilities | | Gross Amounts Offset in the Consolidated Balance Sheets | | Net Amounts of Liabilities Presented in the Consolidated Balance Sheets | | Financial Instruments | | Cash Collateral Pledged | | Net Amount |
| | (in thousands) |
| Forward Contracts | $ | 1,190 |
| | $ | — |
| | $ | 1,190 |
| | $ | (1,190 | ) | | $ | — |
| | $ | — |
|
10.
11. Segment and Geographic Information
Effective with the beginning of fiscal 2018, we changed our segments, see Note 1. Basis of Presentation for additional information. We operate within a single industry segment -- computer software and related services. Operating segments as defined under GAAP are components of an enterprise about which separate financial information is available that is evaluated regularly by the chief operating decision maker, or decision-making group, in deciding how to allocate resources and in assessing performance. Our chief operating decision maker is our President and Chief Executive Officer. We have two operating and reportable segments: (1) Software Products, which includes license, subscription and related support revenue (including updates and technical support) for all our products; and (2) Professional Services, which includes consulting, implementation and training services. We do not allocate sales &and marketing or general and administrative expense to our operating segments as these activities are managed on a consolidated basis. Additionally, segment profit does not include stock-based compensation, amortization of intangible assets, restructuring charges and certain other identified costs that we do not allocate to the segments for purposes of evaluating their operational performance.
The revenue and profit attributable to our operating segments are summarized below. We do not produce asset information by reportable segment; therefore, it is not reported.
|
| | | | | | | | | | | | | | | | | | | | | | | |
| | Three months ended | | Nine months ended |
| | As Reported ASC 606 | | ASC 605 | | As Reported ASC 605 | | As Reported ASC 606 | | ASC 605 | | As Reported ASC 605 |
| | June 29,
2019 | | June 29,
2019 | | June 30,
2018 | | June 29,
2019 | | June 29,
2019 | | June 30,
2018 |
| | (in thousands) |
| Software Products | | | | | | | | | | | |
| Revenue | $ | 253,405 |
| | $ | 281,939 |
| | $ | 273,619 |
| | $ | 796,169 |
| | $ | 858,228 |
| | $ | 801,262 |
|
| Operating Costs (1) | 94,829 |
| | 94,341 |
| | 96,465 |
| | 280,370 |
| | 278,572 |
| | 293,546 |
|
| Profit | 158,576 |
| | 187,598 |
| | 177,154 |
| | 515,799 |
| | 579,656 |
| | 507,716 |
|
| | | | | | | | | | | | |
| Professional Services | | | | | | | | | | | |
| Revenue | 42,081 |
| | 40,471 |
| | 41,158 |
| | 124,457 |
| | 118,438 |
| | 128,041 |
|
| Operating Costs (2) | 34,326 |
| | 33,342 |
| | 33,982 |
| | 98,515 |
| | 94,748 |
| | 104,745 |
|
| Profit | 7,755 |
| | 7,129 |
| | 7,176 |
| | 25,942 |
| | 23,690 |
| | 23,296 |
|
| | | | | | | | | | | | |
| Total segment revenue | 295,486 |
| | 322,410 |
| | 314,777 |
| | 920,626 |
| | 976,666 |
| | 929,303 |
|
| Total segment costs | 129,155 |
| | 127,683 |
| | 130,447 |
| | 378,885 |
| | 373,320 |
| | 398,291 |
|
| Total segment profit | 166,331 |
| | 194,727 |
| | 184,330 |
| | 541,741 |
| | 603,346 |
| | 531,012 |
|
| | | | | | | | | | | | |
| Unallocated operating expenses: | | | | | | | | | | | |
| Sales and marketing expenses | 102,332 |
| | 107,663 |
| | 102,891 |
| | 291,028 |
| | 305,144 |
| | 290,739 |
|
| General and administrative expenses | 26,310 |
| | 26,310 |
| | 25,474 |
| | 77,937 |
| | 77,937 |
| | 80,320 |
|
| Restructuring and other charges, net | (9 | ) | | (9 | ) | | 1,627 |
| | 45,464 |
| | 45,464 |
| | 1,846 |
|
| Intangibles amortization | 12,793 |
| | 12,793 |
| | 14,648 |
| | 38,218 |
| | 38,218 |
| | 43,595 |
|
| Stock-based compensation | 15,234 |
| | 15,234 |
| | 16,658 |
| | 71,608 |
| | 71,608 |
| | 52,015 |
|
| Other unallocated operating expenses (income) (3) | 366 |
| | 366 |
| | 1,485 |
| | 995 |
| | 995 |
| | 1,425 |
|
| Total operating income | 9,305 |
| | 32,370 |
| | 21,547 |
| | 16,491 |
| | 63,980 |
| | 61,072 |
|
| | | | | | | | | | | | |
| Interest expense | (10,816 | ) | | (10,816 | ) | | (10,646 | ) | | (32,475 | ) | | (32,475 | ) | | (31,072 | ) |
| Other income (expense), net | 1,026 |
| | 736 |
| | (930 | ) | | 2,501 |
| | 2,349 |
| | (2,013 | ) |
| Income before income taxes | $ | (485 | ) | | $ | 22,290 |
| | $ | 9,971 |
| | $ | (13,483 | ) | | $ | 33,854 |
| | $ | 27,987 |
|
(1) Operating costs for the Software Products segment include all costs of software revenue and research and development costs, excluding stock-based compensation and intangible amortization. |
| | | | | | | | | | | | | | | |
| | Three months ended | | Nine months ended |
| | June 30,
2018 | | July 1,
2017 | | June 30,
2018 | | July 1,
2017 |
| | (in thousands) |
| Software Products | | | | | | | |
| Revenue | $ | 273,619 |
| | $ | 247,635 |
| | $ | 801,262 |
| | $ | 722,724 |
|
| Operating Costs (1) | 96,422 |
| | 94,325 |
| | 293,417 |
| | 273,196 |
|
| Profit | 177,197 |
| | 153,310 |
| | 507,845 |
| | 449,528 |
|
| | | | | | | | |
| Professional Services | | | | | | | |
| Revenue | 41,158 |
| | 43,658 |
| | 128,041 |
| | 134,936 |
|
| Operating Costs (2) | 33,945 |
| | 35,588 |
| | 104,634 |
| | 110,681 |
|
| Profit | 7,213 |
| | 8,070 |
| | 23,407 |
| | 24,255 |
|
| | | | | | | | |
| Total segment revenue | 314,777 |
| | 291,293 |
| | 929,303 |
| | 857,660 |
|
| Total segment costs | 130,367 |
| | 129,913 |
| | 398,051 |
| | 383,877 |
|
| Total segment profit | 184,410 |
| | 161,380 |
| | 531,252 |
| | 473,783 |
|
| | | | | | | | |
| Unallocated operating expenses: | | | | | | | |
| Sales and marketing expenses | 102,831 |
| | 89,805 |
| | 290,559 |
| | 260,521 |
|
| General and administrative expenses | 25,458 |
| | 27,263 |
| | 80,272 |
| | 81,270 |
|
| Restructuring and headquarters relocation charges, net | 1,627 |
| | 1,551 |
| | 1,846 |
| | 8,300 |
|
| Intangibles amortization | 14,648 |
| | 14,490 |
| | 43,595 |
| | 43,280 |
|
| Stock-based compensation | 16,658 |
| | 16,574 |
| | 52,015 |
| | 56,139 |
|
| Other unallocated operating expenses (3) | 1,485 |
| | 441 |
| | 1,425 |
| | 943 |
|
| Total operating income | 21,703 |
| | 11,256 |
| | 61,540 |
| | 23,330 |
|
| | | | | | | | |
| Interest expense | (10,646 | ) | | (10,200 | ) | | (31,072 | ) | | (32,239 | ) |
| Interest income and other expense, net | (1,086 | ) | | (357 | ) | | (2,481 | ) | | 2,049 |
|
| Income (loss) before income taxes | $ | 9,971 |
| | $ | 699 |
| | $ | 27,987 |
| | $ | (6,860 | ) |
| (1) Operating costs for the Software Products segment includes all cost of software revenue and research and development costs, excluding stock-based compensation and intangible amortization. |
| (2) Operating costs for the Professional Services segment includes all cost of professional services revenue, excluding stock-based compensation, intangible amortization, and fair value adjustments for deferred services costs. |
| (3) Other unallocated operating expenses include acquisition-related and other transactional costs, pension plan termination-related costs and fair value adjustments for deferred services costs. |
(3) Other unallocated operating expenses include acquisition-related and other transactional costs, pension plan termination-related costs and fair value adjustments for deferred services costs.
We report revenue by the following two product groups:
|
| | | | | | | | | | | | | | | | | | | | | | | |
| | Three months ended | | Nine months ended |
| | As Reported ASC 606 | | ASC 605 | | As Reported ASC 605 | | As Reported ASC 606 | | ASC 605 | | As Reported ASC 605 |
| | June 29,
2019 | | June 29,
2019 | | June 30,
2018 | | June 29,
2019 | | June 29,
2019 | | June 30,
2018 |
| | (in thousands) |
| Solutions | $ | 254,735 |
| | $ | 278,581 |
| | $ | 279,091 |
| | $ | 805,146 |
| | $ | 849,679 |
| | $ | 831,754 |
|
| IoT | 40,751 |
| | 43,829 |
| | 35,686 |
| | 115,480 |
| | 126,987 |
| | 97,549 |
|
| Total revenue | $ | 295,486 |
| | $ | 322,410 |
| | $ | 314,777 |
| | $ | 920,626 |
| | $ | 976,666 |
| | $ | 929,303 |
|
Our international revenue is presented based on the location of our customer. Revenue for the geographic regions in which we operate is presented below.
|
| | | | | | | | | | | | | | | | | | | | | | | |
| | Three months ended | | Nine months ended |
| | As Reported ASC 606 | | ASC 605 | | As Reported ASC 605 | | As Reported ASC 606 | | ASC 605 | | As Reported ASC 605 |
| | June 29,
2019 | | June 29,
2019 | | June 30,
2018 | | June 29,
2019 | | June 29,
2019 | | June 30,
2018 |
| | (in thousands) |
| Revenue: | | | | | | | | | | | |
| Americas | $ | 122,867 |
| | $ | 144,389 |
| | $ | 133,439 |
| | $ | 384,437 |
| | $ | 417,061 |
| | $ | 388,923 |
|
| Europe | 112,083 |
| | 122,988 |
| | 119,876 |
| | 342,477 |
| | 366,392 |
| | 362,982 |
|
| Asia-Pacific | 60,536 |
| | 55,033 |
| | 61,462 |
| | 193,712 |
| | 193,213 |
| | 177,398 |
|
| Total revenue | $ | 295,486 |
| | $ | 322,410 |
| | $ | 314,777 |
| | $ | 920,626 |
| | $ | 976,666 |
| | $ | 929,303 |
|
11.12. Income Taxes
In the third quarter and first nine months of 2018,2019, our effective tax rate was (2,940)% on a pre-tax loss of $(0.5) million, and (177)% on a pre-tax loss of $(13.5) million, respectively, compared to (70)% on pre-tax income of $10.0 million and (39)% on pre-tax income of $28.0 million respectively, compared to 236% on pre-tax income of $0.7 million, and (63)% on a pre-tax loss of $6.9 million in the third quarter and first nine months of 2017,2018, respectively. In the first nine months of 20182019 and 2017,2018, our effective tax rate was lower thandiffered from the statutory federal income tax rates (21% and 35%, respectively)rate of 21% due to U.S. tax reform as(as described below, andbelow), our corporate structure in which our foreign taxes are at a net effective tax rate lower than the U.S. rate.rate, the excess tax benefit related to stock-based compensation and, in the first nine months of 2019, the reduction of a valuation allowance of $1.8 million as the result of the Frustum acquisition. Additionally, in the third quarter and first nine months of 2019 our effective rate includes the indirect effects of the adoption of ASC 606. A significant amount of our foreign earnings is generated by our subsidiaries organized in Ireland. In 20182019 and 2017,2018, the foreign rate differential predominantly relates to these Irish earnings. Our foreign rate differential in 2018 and 2017 includes the continuing rate benefit from a business realignment completed on September 30, 2014 in which intellectual property was transferred between two wholly-owned foreign subsidiaries. For the first nine months of 2018 and 2017, this realignment resulted in tax benefits of approximately $9 million and $21 million, respectively.
On December 22, 2017, the United States enacted tax reform legislation through the Tax Cuts and Jobs Act, (the "Tax Act"), which significantly changed existing U.S. tax laws by a reduction of the corporate tax rate, the implementation of a new system of taxation for non-U.S. earnings, the imposition of a one-time tax on the deemed repatriation of undistributed earnings of non-U.S. subsidiaries, and by the expansion of the limitations on the deductibility of executive compensation and interest expense. As we have a September 30 fiscal year-end, there is a blended U.S. statutory federal rate of approximately 24.5% for our fiscal year ending September 30, 2018 and 21% for subsequent fiscal years. The Tax Act also provides that net operating losses generated in years ending after December 31, 2017 willmay be carried forward indefinitely and can no longer be carried back, and that net operating losses generated in years
beginning after December 31, 2017 can only reduce taxable income by up to 80% when utilized in a future period. The Tax Act includes a provision to tax global intangible low-tax income (GILTI) of foreign subsidiaries and a base erosion anti-abuse tax (BEAT) measure that taxes certain payments between a U.S. corporation and its foreign subsidiaries. The GILTI and BEAT provisions were effective for us beginning October 1, 2018. Our accounting policy is to treat tax on GILTI as a current period cost included in tax expense in the year incurred.
We estimateIn the first nine months of 2018, we provided no federal income taxes payable as a result of the deemed repatriation of undistributed earnings as we estimate that the tax will bewas offset by a combination of current year losses and existing attributes which had a full valuation allowance recorded against the related deferred tax assets. In the third quarter2018, we reduced our estimate forrecorded state income taxes payable by $5.4of $1.7 million to reflect additional guidance on the state implications of the Tax Act. In the first nine months of 2018, we recorded a reasonable estimate of state income taxes payable on the deemed repatriation of $1.7 million.repatriation. We also recorded a deferred tax benefit of $14.1 million as a reasonable estimate offor the impact of the Tax Act on our net U.S. deferred income tax balances. This was primarily attributable to the reduction of the federal tax rate on the net deferred tax liability in the U.S., and the ability to realize net operating losses from the reversal of existing deferred tax assets which can now be carried forward indefinitely and can therefore be netted against deferred tax liabilities for indefinite lived intangible assets.
We are continuing to assess the effects of the Tax Act on our indefinite reinvestment assertionThe U.S. Securities and the realizability of our U.S. deferred tax assets. We are not able to make reasonable estimates at this time of the effects of certain provisions of the Tax Act that will apply to us beginning in our fiscal year ending September 30, 2019, including the Global Intangible Low Tax Income tax (the "GILTI" tax).
The changes included in the Tax Act are broad and complex. The final transition impacts of the Tax Act may differ from the above estimates, possibly materially, due to, among other things, changes in interpretations of the Tax Act, any legislative action to address questions that arise because of the Tax Act, actions taken by U.S. state governments and taxing authorities in response to the Tax Act, any changes in accounting standards for income taxes or related interpretations in response to the Tax Act, or any updates or changes to estimates we have utilized to calculate the transition impacts, including impacts from changes to current year earnings estimates and foreign currency exchange rates of foreign subsidiaries. The Securities Exchange Commission has issued rules that allow for a measurement period of up to one year after the enactment date of the Tax Act to finalize the recording of the related tax impacts. We currently anticipate finalizingfinalized recording the impacts of the Tax Act in the quarter ended December 29, 2018 and recordingdid not record any resulting adjustments bysignificant adjustments.
In October 2016, the endFinancial Accounting Standards Board (FASB) issued Accounting Standards Update (ASU) 2016-16, Income Taxes (Topic 740): Intra-Entity Transfers of Assets Other Than Inventory. The purpose of ASU 2016-16 is to simplify the income tax accounting of an intra-entity transfer of an asset other than inventory and to record its effect when the transfer occurs. We adopted this amendment beginning in the first quarter of 2019 using the modified retrospective method with a cumulative effect adjustment to accumulated deficit of $72.3 million, with a corresponding increase of $75.3 million to deferred tax assets, $6.0 million decrease to income tax assets and a $3.0 million decrease to income tax liabilities. The adjustment primarily relates to deductible amortization of intangible assets in Ireland. Post adoption, our current fiscal year ending September 30, 2018.effective tax rate no longer includes the benefit of this amortization.
We have concluded, based on the weight of available evidence, that a full valuation allowance continues to be required against our U.S. net deferred tax assets as they are not more likely than not to be realized in the future. We will continue to reassess our valuation allowance requirements each financial reporting period. However, we believe that there is a reasonable possibility that within the next 12 months, sufficient positive evidence may become available to allow us to reach a conclusion that a significant portion of the valuation allowance will no longer be needed. Release of the valuation allowance would result in the recognition of certain deferred tax assets and a decrease to income tax expense for the period the release is recorded. However, the exact timing and amount of any valuation allowance release are subject to change on the basis of the level of profitability that we are able to actually achieve.
In the normal course of business, PTC and its subsidiaries are examined by various taxing authorities, including the Internal Revenue Service in the U.S. We regularly assess the likelihood of additional assessments by tax authorities and provide for these matters as appropriate. We are currently under audit by tax authorities in several jurisdictions. Audits by tax authorities typically involve examination of the deductibility of certain permanent items, limitations on net operating losses and tax credits. Although we believe our tax estimates are appropriate, the final determination of tax audits and any related litigation could result in material changes in our estimates.
As of June 30, 201829, 2019 and September 30, 2017,2018, we had unrecognized tax benefits of $9.7 million and $14.8$9.8 million, respectively. If all our unrecognized tax benefits as of June 30, 201829, 2019 were to become recognizable in the future, we would record a benefit to the income tax provision of $9.7 million, which would be partially offset by an increase in the U.S. valuation allowance of $3.8 million.
Although we believe our tax estimates are appropriate, the final determination of tax audits and any related litigation could result in favorable or unfavorable changes in our estimates. We believe it is reasonably possible that within the next 12 months the amount of unrecognized tax benefits related to
the resolution of multi-jurisdictional tax positions could be reduced by up to $2$0.5 million as audits close and statutes of limitations expire.
In the fourth quarter of 2016, we received an assessment of approximately $12 million from the tax authorities in South Korea. The assessment relates to various tax issues, primarily foreign withholding taxes. We have appealed and intend to vigorously defend our positions. We believe that upon completion of a multi-level appeal process it is more likely than not that our positions will be sustained. Accordingly, we have not recorded a tax reserve for this matter. We paid this assessment in the first quarter of 2017 and have recorded the amount in other assets, pending resolution of the appeal process.
In July 2015, the first quarterU.S. Tax Court issued an opinion in Altera Corp. v. Commissioner related to the treatment of 2018,stock-based compensation expense in an intercompany cost-sharing arrangement. The opinion invalidated part of a treasury regulation requiring stock-based compensation to be included in any qualified intercompany cost-sharing arrangement. The Company previously recorded a tax benefit based on the opinion in the case, which was offset by a corresponding increase in the valuation allowance against U.S. deferred tax assets. On June 7, 2019, the U.S. Court of Appeals for the Ninth Circuit reversed the U.S. Tax Court’s decision. On July 22, 2019, Altera Corp. filed a petition for an en banc rehearing before the U.S. Court of Appeals for the Ninth Circuit. This petition is still pending at this time. Due to the fact that the Altera decision is not yet final, as well as uncertainty surrounding the status of the current regulations and questions related to jurisdiction given the Company does not reside in the Ninth Circuit, we have determined no adjustment is required to the consolidated financial statements as a result of the adoption of ASU 2016-09, we recognized previously unrecognized tax benefits of $37.0 million as increases in deferred tax assets for tax loss carryoversthis ruling. The Company will continue to monitor ongoing developments and tax credits, primarily in the U.S. A corresponding increasepotential impacts to the valuation allowance of $36.9 million was recorded to the extent that it was not more likely than not that these benefits would be realized.its consolidated financial statements.
12.13. Debt
At June 30, 201829, 2019 and September 30, 2017,2018, we had the following long-term debt obligations:
|
| | | | | | | |
| | June 29,
2019 | | September 30,
2018 |
| | (in thousands) |
| 6.000% Senior notes due 2024 | $ | 500,000 |
| | $ | 500,000 |
|
| Credit facility revolver | 203,125 |
| | 148,125 |
|
| Total debt | 703,125 |
| | 648,125 |
|
| Unamortized debt issuance costs for the Senior notes (1) | (4,209 | ) | | (4,857 | ) |
| Total debt, net of issuance costs (2) | $ | 698,916 |
| | $ | 643,268 |
|
|
| | | | | | | |
| | June 30,
2018 | | September 30,
2017 |
| | (in thousands) |
| 6.000% Senior notes due 2024 | $ | 500,000 |
| | $ | 500,000 |
|
| Credit facility revolver | 198,125 |
| | 218,125 |
|
| Total debt | 698,125 |
| | 718,125 |
|
| Unamortized debt issuance costs for the Senior notes (1) | (5,072 | ) | | (5,719 | ) |
| Total debt, net of issuance costs (2) | $ | 693,053 |
| | $ | 712,406 |
|
| (1) Unamortized debt issuance costs related to the credit facility were $1.3 million and $2.0 million as of June 30, 2018 and September 30, 2017, respectively, and were included in other assets. |
| (2) As of June 30, 2018 and September 30, 2017, all debt was included in long-term debt. |
| |
| (1) | Unamortized debt issuance costs related to the credit facility were $3.3 million and $3.8 million as of June 29, 2019 and September 30, 2018, respectively, and were included in other assets in the Consolidated Balance Sheets. |
| |
| (2) | As of June 29, 2019 and September 30, 2018, all debt was included in long-term debt in the Consolidated Balance Sheets. |
Senior Notes
In May 2016, we issued $500 million in aggregate principal amount of 6.0% senior, unsecured long-term debt at par value, due in 2024. We used the net proceeds from the sale of the notes to repay a portion of our outstanding revolving loan under our current credit facility. Interest is payable semi-annually on November 15 and May 15. The debt indenture includes covenants that limit our ability to, among other things, incur additional debt, grant liens on our properties or capital stock, enter into sale and leaseback transactions or asset sales, and make capital distributions. We were in compliance with all the covenants as of June 30, 2018.29, 2019.
On orand after May 15, 2019, we may redeem the senior notes at any time in whole or from time to time in part at specified redemption prices. In certain circumstances constituting a change of control, we wouldwill be required to make an offer to repurchase the senior notes at a purchase price equal to 101% of the aggregate principal amount of the notes, plus accrued and unpaid interest. Our ability to repurchase the senior notes in such event may be limited by law, by the indenture associated with the senior notes, by our then-available financial resources or by the terms of other agreements to which we may be party at such time. If we fail to repurchase the senior notes as required by the indenture, it would constitute an event of default under the indenture governing the senior notes which, in turn, may also constitute an event of default under other obligations.
As of June 30, 2018,29, 2019, the total estimated fair value of the Notessenior notes was approximately $520$524.6 million, based on quoted prices for the notes on that date.
Credit Agreement
In November 2015, we entered into
We maintain a multi-currency credit facility with a syndicate of sixteen banks for which JPMorgan Chase Bank, N.A. acts as Administrative Agent. We use the credit facility for general corporate purposes, including acquisitions of businesses, share repurchases and working capital requirements. As of June 30, 2018,29, 2019, the fair value of our credit facility approximates its book value.
TheIn September 2018, we amended and restated the credit facility consists of ato increase the revolving loan commitment from $600 million revolving loan commitment. The loan commitment may be increased byto $700 million and amend other provisions, including replacing the fixed charge coverage ratio with an additional $500 million (in the form of revolving loans or term loans, or a combination
thereof) if the existing or additional lenders are willing to make such increased commitments.interest coverage ratio. The revolving loan commitment does not require amortization of principal and may be repaid in whole or in part prior to the scheduled maturity date at our option without penalty or premium. The credit facility matures on September 15, 2019,13, 2023, when all remaining amounts outstanding will be due and payable in full.
PTC and certain eligible foreign subsidiaries mayare eligible to borrow under the credit facility. Any borrowings by PTC Inc. under the credit facility would be guaranteed by PTC Inc.’s material domestic subsidiaries that become parties to the subsidiary guaranty, if any. As of the filing of this Form 10-Q, there are no subsidiary guarantors of the obligations under the credit facility. Any borrowings by eligible foreign subsidiary borrowers would be guaranteed by PTC Inc. and any subsidiary guarantors. As of the filing of this Form 10-Q there were no borrowings by eligible foreign subsidiaries. In addition, PTC'sowned property (including equity interests) of PTC and certain of its material domestic subsidiaries' owned property (including equity interests) is subject to first priority perfected liens in favor of the lenders ofunder this credit facility. 100% of the voting equity interests of certain of PTC’s domestic subsidiaries and 65% of its material first-tier foreign subsidiaries are pledged as collateral for the obligations under the credit facility.
As of June 30, 2018, we had $198.1 million in loans outstanding under the credit facility. Loans under the credit facility bear interest at variable rates which reset every 30 to 180 days depending on the rate and period selected by PTC as described below. As of June 30, 2018,29, 2019, the annual interest rate for borrowings outstanding was 3.88%4.3%. Interest rates on borrowings outstanding under the credit facility range from 1.25% to 1.75% above an adjusted LIBO rate for Euro currency borrowings or would range from 0.25% to 0.75% above the defined base rate (the greater of the Prime Rate, the FRBNYNYFRB rate plus 0.5%, or an adjusted LIBO rate plus 1%) for base rate borrowings, in each case based upon PTC’s total leverage ratio. Additionally, PTC may borrow certain foreign currencies at rates set in the same range above the respective London interbank offered interest rates for those currencies, based on PTC’s total leverage ratio. A quarterly commitment fee on the undrawn portion of the credit facility is required, ranging from 0.175% to 0.30% per annum based upon PTC’s total leverage ratio.
The credit facility limits PTC’s and its subsidiaries’ ability to, among other things: incur liens or guarantee obligations; pay dividends (other than to PTC) and make other distributions; make investments and enter into joint ventures; dispose of assets; and engage in transactions with affiliates, except on an arms-length basis. Under the credit facility, PTC and its material domestic subsidiaries may not invest cash or property in, or loan to, PTC’s foreign subsidiaries in aggregate amounts exceeding $75.0$100.0 million for any purpose and an additional $200.0 million for acquisitions of businesses. In addition, under the credit facility, PTC and its subsidiaries must maintain the following financial ratios:
a total leverage ratio, defined as consolidated total indebtedness to the consolidated trailing four quarters EBITDA, not to exceed 4.50 to 1.00 as of the last day of any fiscal quarter;
a senior secured leverage ratio, defined as senior consolidated total indebtedness (which excludes unsecured indebtedness) to the consolidated trailing four quarters EBITDA, not to exceed 3.00 to 1.00 as of the last day of any fiscal quarter; and
a fixed charge coverage ratio, defined as the ratio of consolidated trailing four quarters EBITDA less consolidated capital expenditures to consolidated fixed charges, of not less than 3.50 to 1.00 as of the last day of any fiscal quarter.
| |
| • | a total leverage ratio, defined as consolidated funded indebtedness to consolidated trailing four quarters EBITDA, not to exceed 4.50 to 1.00 as of the last day of any fiscal quarter; |
| |
| • | a senior secured leverage ratio, defined as senior consolidated total indebtedness (which excludes unsecured indebtedness) to the consolidated trailing four quarters EBITDA, not to exceed 3.00 to 1.00 as of the last day of any fiscal quarter; and |
| |
| • | an interest coverage ratio, defined as the ratio of consolidated trailing four quarters EBITDA to consolidated trailing four quarters of cash basis interest expense, of not less than 3.00 to 1.00 as of the last day of any fiscal quarter. |
As of June 30, 2018,29, 2019, our total leverage ratio was 2.451.92 to 1.00, our senior secured leverage ratio was 0.730.58 to 1.00 and our fixed chargeinterest coverage ratio was 6.828.95 to 1.00 and we were in compliance with all financial and operating covenants of the credit facility.
Any failure to comply with the financial or operating covenants of the credit facility would prevent PTC from being able to borrow additional funds, and would constitute a default, permitting the lenders to, among other things, accelerate the amounts outstanding, including all accrued interest and unpaid fees, under the credit facility and to terminate the credit facility. A change in control of PTC, as defined in the agreement, also constitutes an event of default, permitting the lenders to accelerate the indebtedness and terminate the credit facility.
We incurred $2.9 million in financing costs in connection with the September 2018 credit facility amendment and restatement. These origination costs are recorded as deferred debt issuance costs and are included in other assets. Financing costs are expensed over the remaining term of the obligations.
In the third quarter and first nine months of 2019 we paid $18.0 million and $38.4 million, respectively, of interest on our debt. In the third quarter and first nine months of 2018 we paid $17.3 million and $36.5 million, respectively, of interest on our debt. The average interest rate on borrowings outstanding during the third quarter and first nine months of 2019 was approximately 5.4% and 5.4%, respectively. The average interest rate on borrowings outstanding during the third quarter and first nine months of 2018 was approximately 5.3% and 5.1%, respectively.
13.14. Commitments and Contingencies
Legal and Regulatory Matters
Korean Tax Audit
In July 2016, we received an assessment of approximately $12 million from the tax authorities in Korea related to an ongoing tax audit. See Note 11. 12. Income Taxes for additional information.
Legal Proceedings
We are subject to various other legal proceedings and claims that arise in the ordinary course of business. We do not believe that resolving the legal proceedings and claims that we are currently subject to will have a material adverse impact on our financial condition, results of operations or cash flows. However, the results of legal proceedings cannot be predicted with certainty. Should any of these legal proceedings and claims be resolved against us, the operating results for a reporting period could be adversely affected.
Accruals
With respect to legal proceedings and claims, we record an accrual for a contingency when it is probable that a liability has been incurred and the amount of the loss can be reasonably estimated. For legal proceedings and claims for which the likelihood that a liability has been incurred is more than remote but less than probable, we estimate the range of possible outcomes. As of June 30, 2018,29, 2019, we estimate approximately $1.1$0.1 million to $3.1$2.1 million in legal proceedings and claims, of which we had accrued $1.0 million.
Accounts Receivable
Accounts receivable as of June 30, 2018 includes an amount invoiced under a multi-year contract for which the period of performance, and related revenue recognized, has spanned a number of years (with no revenue recognized since the first quarter of 2017). The invoiced amount is being disputed by the customer. If we are unable to reach a mutual business resolution, we intend to vigorously pursue collection of the full invoiced amount. If we are unsuccessful in collecting the full invoiced amount, there could be a write-down of accounts receivable and professional services revenue, which could range from $0 to $17.3$0.2 million.
Guarantees and Indemnification Obligations
We enter into standard indemnification agreements in the ordinary course of our business. Under such agreements with our business partners or customers, we indemnify, hold harmless, and agree to reimburse the indemnified party for losses suffered or incurred by the indemnified party, generally in connection with patent, copyright or other intellectual property infringement claims by any third party with respect to our products, as well as claims relating to property damage or personal injury resulting from the performance of services by us or our subcontractors.subcontractors and data breaches. The maximum potential amount of future payments we could be required to make under these indemnification agreements for intellectual property and damage and injury claims is unlimited.unlimited; the maximum potential amount for indemnification for data breaches is capped in those contracts. Historically, our costs to defend lawsuits or settle claims relating to such indemnity agreements have been minimal and, accordingly, we believe the estimated fair value of liabilities under these agreements is immaterial.
We warrant that our software products will perform in all material respects in accordance with our standard published specifications in effect at the time of delivery of the licensed products for a specified period of time. Additionally, we generally warrant that our consulting services will be performed consistent with generally accepted industry standards. In most cases, liability for these warranties is capped. If necessary, we would provide for the estimated cost of product and service warranties based on specific warranty claims and claim history; however, we have not incurred significant cost under our product or services warranties. As a result, we believe the estimated fair value of these liabilities is immaterial.
14.15. Subsequent Events
Investment in PTCCommon Stock Repurchases
As part
In the fourth quarter of a strategic partnership, on2019, we continued our share repurchase program. On July 19, 2018, Rockwell Automation made a $1,000 million equity investment in PTC, by acquiring 10,582,010 shares at a price of $94.50 per share, which represented a premium over our closing share price on June 11, 2018, the date upon which26, 2019, we entered into a securities purchase agreement. The Chairman and CEO of Rockwell Automation has joined PTC's board of directors.
Share Repurchases
We entered into a $1,000 million accelerated share repurchase ("ASR")an agreement with a major financial institution ("Bank") on July 20, 2018. We used cash proceeds from the Rockwell Automation investment to fund the repurchase.
On July 20, 2018, 8,244,873 shares repurchased at the market price of $97.03 per share were delivered to us (totaling $800 million). The remaining $200repurchase approximately $25 million represents the amount held back by the Bank pending final settlement of the ASR. Upon settlement of the ASR, the total shares repurchased by us will equal up to $1,000 million divided by a share price equal to the average daily volume weighted-average price of our common stock duringin the term of the ASR program less a fixed per share discount. Final settlement of the ASR will occur between 7.5-months and 10-months after execution, at the Bank's discretion. All shares repurchased are automatically restored to the status of authorized and unissued.fourth quarter, but we may repurchase more.
ITEM 2. MANAGEMENT’S DISCUSSION AND ANALYSIS OF FINANCIAL CONDITION AND RESULTS OF OPERATIONS
Business Overview
PTC is a global software and services company that delivers solutions to enable our industrial customers' digital transformations, helping them to better design, manufacture, operate, and service their products. Our Internet of Things (IoT) and Augmented Reality (AR) solutions are focused on Smart Connected Processes, Smart Connected Products and Smart Connected People that enable companies to connect factories and plants, smart products, and enterprise systems, bridging the physical, digital and human worlds, to transform their businesses. Our Solutions portfolio of innovative Computer-Aided Design (CAD) and Product Lifecycle Management (PLM) solutions enable manufacturers to create, innovate, operate, and service products. Our Solutions portfolio also includes certain businesses that are managed to focus on providing great solutions for a set of targeted customers, verticals and use cases, but for which our strategy is not for broader market penetration (our productivity zone businesses).
Forward-Looking Statements
Statements in this Quarterly Report on Form 10-Q that are not historic facts, including statements about our fourth quarter and full fiscal 2018 targets, and other future financial and growth expectations and targets, and anticipated tax rates, are forward-looking statements that involve risks and uncertainties that could cause actual results to differ materially from those projected. These risks include: the macroeconomic and/or global manufacturing climates may deteriorate;deteriorate due to, among other factors, the geopolitical environment, including the U.S. Administration's focus on technology transactions with non-U.S. entities and potential expanded prohibitions, and ongoing trade tensions and tariffs; customers may not purchase our solutions or convert existing support contracts to subscription when or at the rates we expect; our businesses, including our Internet of Things (IoT) business, and Augmented Reality business, may not expand and/or generate the revenue we expect; foreign currency exchange rates may vary from our expectations and thereby affect our reported revenue and expense; the mix of revenue between license &and subscription solutions, support and professional services could be different than we expect, which could impact our EPS results; our transition to subscription-only licensing could adversely affect sales and revenue; sales of our solutions as subscriptions may not have the longer-term effect on revenue and earnings that we expect; bookings associated with minimum ACV commitments under our strategic alliance agreementStrategic Alliance Agreement with Rockwell Automation may not result in subscription contracts sold through to end-user customers; our strategic initiatives and investments may not generate the revenue we expect; we may be unable to expand our partner ecosystem as we expect and our partners may not generate the revenue we expect; we may be unable to improve performance in Japan when or as we expect; we may be unable to generate sufficient operating cash flow to return 40% of free cash flow to shareholders and other uses of cash or our credit facility limits or other matters could preclude share repurchases. In addition, our assumptions concerning our future GAAP and non-GAAP effective income tax rates are based on estimates and other factors that could change, including the geographic mix of our revenue, expenses and profits, as well as other risks and uncertainties described below throughout or referenced in Part II, Item 1 A. Risk Factors of this report.
Business OverviewOur 2019 Strategic Goals
PTC is a global computer softwareOur 2019 strategic goals are to deliver sustainable growth, expand subscription licensing and services company. We offer industrial Internet of Things (IoT) solutions that enable companies to connect smart things and environments, manage and analyze data generated by those things and environments, and create industrial IoT applications and Augmented Reality (AR) experiences that transform the way users create, operate, and service products. We also offer a solutions portfolio of innovative Computer-Aided Design (CAD), Product Lifecycle Management (PLM) and Service Lifecycle Management (SLM) solutions that enable manufacturers to create, innovate, operate, and service products.expand our margins. |
| | |
| Sustainable Growth | We are focused on continuing to drive bookings growth both in the high-growth Industrial IoT and AR markets and in our core CAD and PLM markets. We expect that IoT and AR adoption rates will continue to expand and will be the most significant drivers of growth.
|
2018 Strategic Goals
|
| | |
| Sustainable Growth | Our goals are predicated on continuing to drive bookings growth both in the high-growth IoT market and in our core CAD and PLM markets.
|
|
Expand Subscription Licensing | Our goal is to continue to increase the percentage of licenses sold as subscriptions to increase our recurring revenue. Effective January 1, 2018,2019, new software licenses for our core solutions and ThingWorx solutions are available only by subscription in the Americas and Western Europe. Perpetual and subscription licenses will be available to customers outside the Americas and Western Europe through December 31, 2018. Effective January 1, 2019, only subscription software licenses for our core solutions and ThingWorx industrial innovation platform will be available.worldwide. Kepware will continue to be available under perpetual licensing.license. |
|
Cost Controls and Margin Expansion | Our goal is to drive continued margin expansion over the long term. We continue to proactively manage our cost structure and invest in what we believe are high return opportunities in our business. With the growth opportunities in Industrial IoT and AR, and other strategic initiatives we’ve undertaken, as well as our continued commitment to operating margin improvement, we realigned our workforce in the beginning of 2019 to shift investment to support these strategic, high-growth opportunities. We expect to deliver continued operating margin expansion in 2018, and we expect further margin expansion in 2019 and beyond, as we realize the compounding benefit of our maturing subscription business.
|
Operating and Non-GAAP Financial Measures
Our discussion of results includes discussion of our operating measures (including “license and subscription bookings” and other subscription-related measures) and non-GAAP financial measures. Our operating measures and non-GAAP financial measures, including the reasons we use those measures, are described below in Results of Operations - Operating Measures and Results of Operations - Non-GAAP Financial Measures, respectively. You should read those sections to understand those operating and non-GAAP financial measures.
Revenue Sources and Recognition
We sell software subscription and perpetual licenses, support for perpetual licenses, cloud services and professional services.
Subscription revenue is comprised of time-based licenses whereby customers use our software and receive related support for a specified term. Results for reporting periods beginning on or after October 1, 2018 are presented under the Accounting Standards Update No. 2014-09, Revenue from Contracts with Customers: Topic 606 (ASC 606), while prior period amounts are not adjusted and continue to be reported in accordance with the guidance provided by ASC 985-605, Software-Revenue Recognition and revenues for non-software deliverables in accordance with ASC 605-25, Revenue Recognition, Multiple-Element Arrangements (ASC 605). Through 2018, revenue for our subscription contracts was recognized ratably over the term of the contract under ASC 605; this differs from how revenue for such contracts is recognized under ASC 606. Our contracts with customers may include multiple goods and services. Under ASC 606, revenue is recognized for each performance obligation that can be separately identified under the contract. Accordingly, our on-premise subscription contracts are unbundled into multiple performance obligations (i.e., license, cloud and support). Determining whether the software licenses and the cloud services are distinct from each other, and therefore performance obligations to be accounted for separately, or not distinct from each other, and therefore part of a single performance obligation, may require significant judgment. To date, for the majority of our products, we have concluded that the on-premise software licenses and cloud services provided in our subscription offerings are distinct from each other such that revenue from each performance obligation within the offering should be recognized separately. We will continue to review this conclusion as the cloud services that we deliver in combination with our on-premise subscriptions continue to evolve, which could result in changes to how we recognize revenue for such products. The license portion of our on-premise subscription contracts (approximately 50% to 55%) is recognized upfront and the cloud and support portions (approximately 45% to 50%) are recognized ratably over the term. Software as a Service (SaaS)
and cloud services for which revenue is generally recognized ratably over the term of the contract is included in subscription revenue and has been immaterial to date.
Perpetual licenses are a perpetual right to use the software, for which revenue is generally recognized upfront upon shipment to the customer. Support revenue is comprised of contracts to maintain new and/or previously purchased licenses, for which revenue is recognized ratably over the term of the contract. Professional services engagements typically result from sales of new licenses, and for which revenue is recognized as the services are performed.
The effects of our adoption of ASC 606, including adjustments to accumulated deficit related to billed and unbilled deferred revenue, are described in “Recent Accounting Pronouncements” in Note 1.Basis of Presentation and in Note 2. Revenue from Contracts with Customers in the Notes to Consolidated Financial Statements in this Quarterly Report.
Our adoption of ASC 606 will increase the volatility of our revenue results as a significant portion of subscription revenue is recognized at the time of delivery, rather than being recognized ratably over the contract period.
Executive Overview
Our revenue results in the quarter reflect the adoption of subscription licensing by our customers and the compounding effect of the subscription business model as subscription revenue recurs and new subscription revenue is added in the year. Subscription revenue, software revenue and total revenue were all up over the third quarter of 2017, despiteDespite a 1,4001300 basis point increase in subscription mix in the third quarter, we delivered total revenue growth under ASC 605 of 2% (6% constant currency) year over year and software revenue growth under ASC 605 of 3% (6% constant currency) year over year. RecurringSubscription revenue represented approximately 91% of our software revenueunder ASC 605 grew 35% (39% constant currency) in the third quarter of 2018, up from 87% a2019 compared to the year ago. Ourago period. Perpetual license and support revenue resultsdecreased year over year because we discontinued offering perpetual licenses for most of our solutions effective January 1, 2019. We also drovedelivered year-over-year increases in our operating margin results forand EPS under ASC 605 in the third quarter despite increasesof 2019 resulting from the compounding effect of our subscription licenses and lower operating expenses due to effective cost discipline.
Bookings in the third quarter of 2019 declined year over year. Strong bookings in our IoT and AR growth business were offset by the effect of fewer large support contract conversions, the effect of our shifting sales and marketing resources from our productivity zone businesses to our IoT and researchAR business, and development expenses,declines in channel bookings in geographies such as China and Russia following the end of perpetual license sales there at the end of the first quarter of 2019. These effects are expected to adversely affect our bookings for the fourth quarter of 2019.
Given our bookings outlook, on July 24, 2019, in connection with both GAAP and non-GAAP operating margins, and EPS up over the prior year period.
In fiscal 2018, we have focused on several new strategic partnerships. We continued to see momentum with the Microsoft partnership that we signed early in the second quarter, closing ten new joint deals in the quarter. In theour third quarter 2019 earnings release, we entered intoreduced our bookings and revenue guidance for the fourth quarter and the year. Also, given our bookings performance for the year to date and expected performance for the fourth quarter and full fiscal 2019 year, we issued a significant strategic alliance agreement with Rockwell Automation to alignnew cash flow target for fiscal 2024, which supersedes our respective factory automation software solutions and sell a combined software suite into our respective markets. We also entered into a strategic agreement with Ansys to embed breakthrough simulation capabilities inside our Creo product to create the first fully-integrated CAD and real-time simulation solution.previously issued long-range financial targets.
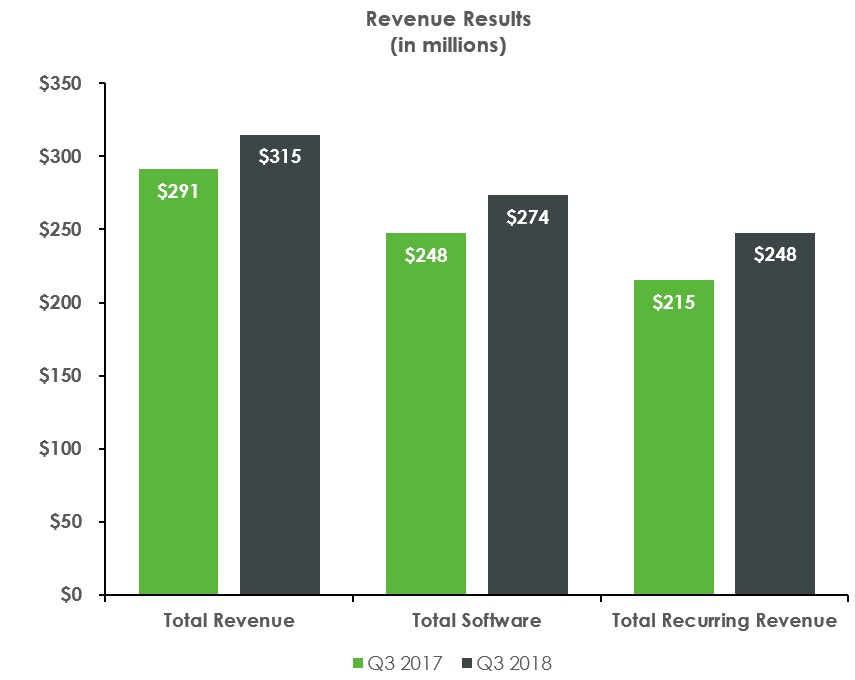
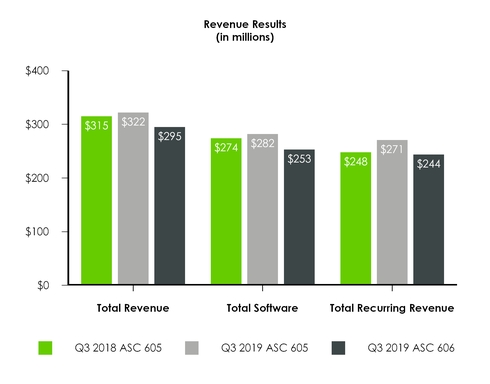
| | | | | Three months ended |
| | | | | | | | | | | | | | | | | | | | | | | | | Percent Change |
| | | Three months ended | | | | Constant Currency Change | | Nine months ended | | | | Constant Currency Change | | As Reported ASC 606 | | ASC 605 | | As Reported ASC 605 | | ASC 605 |
| | | June 30, 2018 | | July 1, 2017 | | | | June 30, 2018 | | July 1, 2017 | | | | | June 29, 2019 | | June 29, 2019 | | June 30, 2018 | | Change | | Constant Currency |
| Revenue | | Change | | Change | | Constant Currency Change | |
| | | (in millions) | | (in millions) | | | | |
| Subscription | | $ | 126.7 |
| | $ | 74.9 |
| | 69 | % | | 65 | % | | $ | 339.7 |
| | $ | 195.0 |
| | 74 | 69 | % | |
| Support | | 121.1 |
| | 140.4 |
| | (14 | )% | | (17 | )% | | 379.0 |
| | 433.6 |
| | (13 | )% | | (16 | )% | |
| Subscription license | | | $ | 53.7 |
| | | | | | | | |
| Subscription support & cloud services | | | 90.2 |
| | | | | | | | |
| Total Subscription | | | 143.9 |
| | $ | 171.6 |
| | $ | 126.7 |
| | 35 | % | | 39 | % |
| Perpetual support | | | 100.3 |
| | 99.7 |
| | 121.1 |
| | (18 | )% | | (15 | )% |
| Total recurring revenue | | 247.8 |
| | 215.3 |
| | 15 | % | | 12 | % | | 718.7 |
| | 628.6 |
| | 14 | % | | 11 | % | | 244.2 |
| | 271.3 |
| | 247.8 |
| | 9 | % | | 13 | % |
| Perpetual license | | 25.8 |
| | 32.3 |
| | (20 | )% | | (23 | )% | | 82.6 |
| | 94.1 |
| | (12 | )% | | (15 | )% | | 9.2 |
| | 10.6 |
| | 25.8 |
| | (59 | )% | | (57 | )% |
| Total subscription, support and license revenue | | 273.6 |
| | 247.6 |
| | 10 | % | | 7 | % | | 801.3 |
| | 722.7 |
| | 11 | % | | 7 | % | |
| Total software revenue (1) | | | 253.4 |
| | 281.9 |
| | 273.6 |
| | 3 | % | | 6 | % |
| Professional services | | 41.2 |
| | 43.7 |
| | (6 | )% | | (8 | )% | | 128.0 |
| | 134.9 |
| | (5 | )% | | (10 | )% | | 42.1 |
| | 40.5 |
| | 41.2 |
| | (2 | )% | | 2 | % |
| Total revenue | | $ | 314.8 |
| | $ | 291.3 |
| | 8 | % | | 5 | % | | $ | 929.3 |
| | $ | 857.7 |
| | 8 | % | | 5 | % | | $ | 295.5 |
| | $ | 322.4 |
| | $ | 314.8 |
| | 2 | % | | 6 | % |
| | | | | | | | | | | | |
| (1) Total software revenue includes: | | | | | | | | | | | |
| License | | | $ | 62.9 |
| | $ | 163.2 |
| | $ | 136.6 |
| | 20 | % | | 23 | % |
| Support and cloud services | | | 190.5 |
| | 118.7 |
| | 137.1 |
| | (13 | )% | | (10 | )% |
| Total software revenue | | | 253.4 |
| | 281.9 |
| | 273.6 |
| | 3 | % | | 6 | % |
|
| | | | | | | | | | | | | | | | | | | | | | |
| | | Three months ended | | | | Nine months ended | | |
| Earnings Measures | | June 30, 2018 | | July 1, 2017 | | Change | | June 30, 2018 | | July 1, 2017 | | Change |
| | | | | | | | | | | |
| Operating Margin | | 6.9 | % | | 3.9 | % | | | | 6.6 | % | | 2.7 | % | | |
| Earnings (Loss) Per Share | | $ | 0.14 |
| | $ | (0.01 | ) | | 1,859 | % | | $ | 0.33 |
| | $ | (0.10 | ) | | 440 | % |
Non-GAAP Operating Margin(1) | | 17.9 | % | | 15.4 | % | | | | 17.3 | % | | 15.6 | % | | |
Non-GAAP Earnings Per Share(1) | | $ | 0.36 |
| | $ | 0.28 |
| | 29 | % | | $ | 1.00 |
| | $ | 0.84 |
| | 20 | % |
(1) Non-GAAP measures are reconciled to GAAP results under Results of Operations - Non-GAAP Financial Measures below. |
|
| | | | | | | | | | | | | | | | | | |
| | | Nine months ended |
| | | | | | | | | Percent Change |
| | | As Reported ASC 606 | | ASC 605 | | As Reported ASC 605 | | ASC 605 |
| | | June 29, 2019 | | June 29, 2019 | | June 30, 2018 | | Change | | Constant Currency |
| Revenue | | | | | |
| | | (in millions) | | | | |
| Subscription license | | $ | 168.8 |
| | | | | | | | |
| Subscription support & cloud services | | 250.8 |
| | | | | | | | |
| Total Subscription | | 419.6 |
| | $ | 482.1 |
| | $ | 339.7 |
| | 42 | % | | 45 | % |
| Perpetual support | | 315.2 |
| | 312.5 |
| | 379.0 |
| | (18 | )% | | (15 | )% |
| Total recurring revenue | | 734.8 |
| | 794.6 |
| | 718.7 |
| | 11 | % | | 13 | % |
| Perpetual license | | 61.4 |
| | 63.7 |
| | 82.6 |
| | (23 | )% | | (20 | )% |
| Total software revenue (1) | | 796.2 |
| | 858.2 |
| | 801.3 |
| | 7 | % | | 10 | % |
| Professional services | | 124.5 |
| | 118.4 |
| | 128.0 |
| | (7 | )% | | (4 | )% |
| Total revenue | | $ | 920.6 |
| | $ | 976.7 |
| | $ | 929.3 |
| | 5 | % | | 8 | % |
| | | | | | | | | | | |
| (1) Total software revenue includes: | | | | | | | | | | |
| License | | $ | 230.1 |
| | $ | 493.3 |
| | $ | 376.6 |
| | 31 | % | | 34 | % |
| Support and cloud services | | 566.1 |
| | 365.0 |
| | 424.7 |
| | (14 | )% | | (12 | )% |
| Total software revenue | | 796.2 |
| | 858.2 |
| | 801.3 |
| | 7 | % | | 8 | % |
|
| | | | | | | | | | | | | | | | | | | | | | | |
| | Three months ended | | Nine months ended |
| | As Reported ASC 606 | | ASC 605 | | As Reported ASC 605 | | As Reported ASC 606 | | ASC 605 | | As Reported ASC 605 |
| Earnings Measures | June 29,
2019 | | June 29,
2019 | | June 30,
2018 | | June 29,
2019 | | June 29,
2019 | | June 30,
2018 |
| | | | | | | | | | | | |
| Operating Margin | 3.1 | % | | 10.0 | % | | 6.8 | % | | 1.8 | % | | 6.6 | % | | 6.6 | % |
| Earnings (Loss) Per Share | $ | (0.13 | ) | | $ | 0.10 |
| | $ | 0.14 |
| | $ | (0.32 | ) | | $ | 0.16 |
| | $ | 0.33 |
|
Non-GAAP Operating Margin(1) | 12.8 | % | | 18.9 | % | | 17.9 | % | | 18.8 | % | | 22.6 | % | | 17.3 | % |
Non-GAAP Earnings Per Share(1) | $ | 0.23 |
| | $ | 0.36 |
| | $ | 0.36 |
| | $ | 1.01 |
| | $ | 1.31 |
| | $ | 1.00 |
|
(1) Non-GAAP measures are reconciled to GAAP results under Results of Operations - Non-GAAP Financial Measures below.
We ended the quarter with cash, cash equivalents and marketable securities of $321 million. We generated $185$230 million of cash from operations in the first nine months of 2018,2019 compared to $102$186 million in the first nine months of 2017. As part2018. Cash from operations for the first nine months of our previously announced share repurchase program, we completed a $1002019 includes $21 million accelerated stock repurchase agreement and retired 1.15 million shares during the quarter. We borrowed $150of restructuring payments compared to $2 million in part to finance the share repurchase, $100 million of which was repaid prior to quarter end.year-ago period. At June 30, 2018,29, 2019, the balance outstanding under our credit facility was $198$203 million and total debt outstanding was $693 million, net of deferred financing fees.
$703 million.
Operating Measures
We provide these operating measures to help investors understand the progress of our subscription transition. These measures are not necessarily indicative of revenue for the period or any future period.
License and Subscription Bookings
License and subscription bookings for the third quarter and first nine months of 20182019 were $113$109 million, up 26% (23%down 3% (1% on a constant currency basis) and $323 million, up 2% (6% on a constant currency basis), respectively, from the year-ago periods primarily due to the impacts described above.
Subscription ACV
Subscription ACV was $49 million for the quarter, up from $44 million in the year-ago period.
Annualized Recurring Revenue (ARR)
ASC 605 ARR was approximately $1,088 million as of the end of the third quarter of 2019, an increase of 9% compared to the third quarter of 2017. On a year-to-date basis, license and subscription bookings were $316 million, up 15% (11%2018 (13% year over year on a constant currency basis) over the first nine months of 2017. For the first nine months of 2018 we saw continued strength in license and subscription bookings across our product portfolio, particularly from PLM, CAD, and IoT (when adjusted for an eight-figure booking in the first quarter of 2017), which all grew at or above our estimated market growth rates. For the second quarter in a row, SLM posted solid license and subscription bookings. IoT license and subscription bookings also benefited from customer expansions, which accounted for over 50% of our ThingWorx bookings. Additionally, our global channel continues to exceed expectations, growing license and subscription bookings in double-digits for the tenth consecutive quarter.
Subscription bookings as a percentage of license and subscription bookings in the third quarter and first nine months of 2018 increased by 1400 basis points and 700 basis points, respectively, compared to the third quarter and first nine months of 2017. Subscription bookings as a percentage of license and subscription bookings continued to grow in the third quarter of 2018 despite foreign exchange headwinds and a geographic mix of sales slightly more weighted to Asia Pacific, where we still sell perpetual licenses. Subscription license bookings increased in part due to customers finding our subscription license offerings more attractive than our perpetual license and support offerings, our incentive plans that are designed to drive subscription sales and the fact that we began offering our software (other than Kepware) only by subscription in the Americas and Western Europe at the beginning of our second quarter of 2018. Subscription license bookings also increased due to support contract conversion and channel program incentives. We have further significant opportunities to convert support contracts to subscriptions.
Americas license and subscription bookings grew 9% and 8% in the third quarter and the first nine months of 2018 compared to the year-ago periods. European license and subscription bookings increased 16% (11% constant currency) and 11% (3% constant currency) in the third quarter and first nine months of 2018 compared to the year-ago periods; the year-over-year comparison is negatively impacted by a $7 million deal we closed in the fourth quarter of 2017 instead of the first quarter of 2018. Asia Pacific license and subscription bookings increased by more than 20% in the third quarter and the first nine months of 2018 compared to the year-ago periods, driven by solid performance in China, Taiwan and Korea and by an easier comparison due to weak performance in Japan in the third quarter of 2017. Japan performed above our expectations in the third quarter, and we believe the challenges there are behind us.
Subscription ACV
Subscription ACV increased 54% over the third quarter of 2017 to $44 million. The increase in subscription ACV is primarily due to strong subscription bookings in the quarter. The subscription mix increased year over year to 78% of total bookings. Both of these measures are tied to the increase in bookings discussed above.
Annualized Recurring Revenue (ARR)
ARR was approximately $994 million for the third quarter of 2018, which increased 15% ($129 million) year over year and grew 3% ($33 million) sequentially..
Deferred Revenue and Backlog (Unbilled Deferred Revenue)
Deferred revenue primarily relates to software agreements invoiced to customers for which the revenue has not yet been recognized. Unbilled deferred revenue (backlog) is the aggregate of contractually committedbooked orders for license, support and subscription and support(including multi-year subscription contracts with start dates from October 1, 2018 through the third quarter of 2019 that were subject to a limited annual cancellation right, of which approximately $189 million was cancellable at June 29, 2019) for which the associated revenue has not been recognized and the customer has not yet been invoiced. We generally do not invoice prior toEarly in the contractual subscription start date andfourth quarter of 2019, we discontinued offering the cancellation right for multi-year contracts we generally invoice annually.substantially all new contracts. We do not record unbilled deferred revenue on our Consolidated Balance Sheet. WhenSheets; such amounts are recorded as deferred revenue when we invoice the customer, we record it ascustomer. We provide this view of deferred revenue (billed).and backlog to enable investors to understand the significant contractual commitments we have to customers and to provide a view of future revenue that we expect will be recognized, even if those commitments are not reflected on our balance sheet.

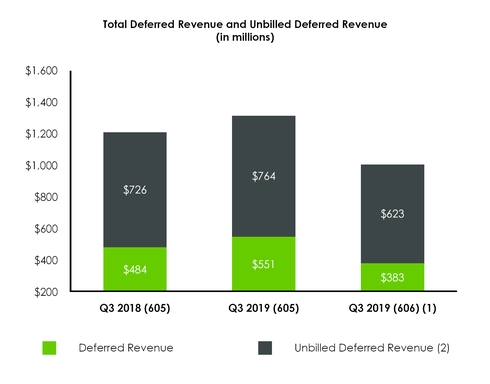
| | | | | | | | | | As Reported ASC 606 (1) | | ASC 605 | | As Reported ASC 605 | | As Reported ASC 605 |
| | June 30, 2018 | | September 30, 2017 | | July 1, 2017 | June 29, 2019 | | June 29, 2019 | | September 30, 2018 | | June 30, 2018 |
| | (Dollar amounts in millions) | (Dollar amounts in millions) |
| Deferred revenue (billed) | $ | 484 |
| | $ | 459 |
| | $ | 465 |
| $ | 383 |
| | $ | 551 |
| | $ | 499 |
| | $ | 484 |
|
| Unbilled deferred revenue | 726 |
| | 633 |
| | 443 |
| |
Unbilled deferred revenue (2) | | 623 |
| | 764 |
| | 911 |
| | 726 |
|
| Total | $ | 1,210 |
| | $ | 1,092 |
| | $ | 909 |
| $ | 1,006 |
| | $ | 1,315 |
| | $ | 1,410 |
| | $ | 1,210 |
|
Total billed(1) Upon adoption of ASC 606, approximately $366 million of total deferred revenue was recorded as a decrease to accumulated deficit with an offsetting $218 million increase to unbilled accounts receivable, a $142 million decrease to deferred revenue and a $6 million increase in other assets net of liabilities, primarily as a result of the acceleration of subscription license revenue under ASC 606.
(2) Of the unbilled deferred revenue increased 33% year-over-year and declined 4% comparedbalance at June 29, 2019, we expect to invoice customers approximately $467 million within the second quarter of 2018 (sequentially). Billed deferred revenue grew 4% year-over-year and declined 3% sequentially, due to the timing of billings in the year. Recurring revenue billings on July 1, which were included in the third quarter of 2017 but not in the third quarter of 2018, were approximately $39 million in 2018. Unbilled deferred revenue grew 64% year-over-year and declined 5% sequentially; the sequential decline was due to the timing of billings in the year and exchange rate headwinds. The average contract duration has remained approximately 2 years for new subscription contracts.next twelve months.
We expect that the amount of deferred revenue and unbilled deferred revenue and billed deferred revenue will changefluctuate from quarter to quarter due to the specific timing, duration and size of large customer subscription and support agreements, varying billing cycles of such agreements, the specific timing of customer renewals (which are typically for one year), foreign currency fluctuations, the timing of when deferred revenue is recognized as revenue and the timing of our fiscal quarter ends, foreign currency fluctuationsends. The average contract duration was approximately 2 years for new subscription contracts in the first nine months of 2019, and for fiscal 2018 and fiscal 2017.
The effects of our adoption of ASC 606, including the timing of whenadjustments to accumulated deficit related to billed and unbilled deferred revenue, is recognized.are described in Note 2. Revenue from Contracts with Customers in the Notes to Consolidated Financial Statements.
Results of Operations
The following table shows the financial measures that we consider the most significant indicators of the performance of our business. Results include combined software revenue from direct sales and our reseller channel. In addition to providing operating income, operating margin, and
diluted earnings per share as calculated under GAAP, the table also includeswe provide non-GAAP operating income, non-GAAP operating margin, and non-GAAP diluted earnings per share for the reported periods. We discussThese non-GAAP financial measures exclude the items described in Non-GAAP Financial Measures below. These non-GAAP financial measures provide investors a view of our operating results that is aligned with management budgets and with performance measures in detail, including items excluded from theour incentive compensation plans. Investors should use these non-GAAP financial measures and provide a reconciliation to the comparableonly in conjunction with our GAAP measures under Non-GAAP Financial Measures below.results. |
| | | | | | | | | | | | | | | | | |
| Three months ended |
| | | | | | | | Percent Change |
| | As Reported ASC 606 | | ASC 605 | | As Reported ASC 605 | | ASC 605 |
| | June 29, 2019 | | June 29, 2019 | | June 30, 2018 | | Actual | | Constant Currency |
| | (Dollar amounts in millions, except per share data) | | | | |
| Subscription | $ | 143.9 |
| | $ | 171.6 |
| | $ | 126.7 |
| | 35 | % | | 39 | % |
| Perpetual support | 100.3 |
| | 99.7 |
| | 121.1 |
| | (18 | )% | | (15 | )% |
| Total recurring revenue | 244.2 |
| | 271.3 |
| | 247.8 |
| | 9 | % | | 13 | % |
| Perpetual license | 9.2 |
| | 10.6 |
| | 25.8 |
| | (59 | )% | | (57 | )% |
| Total software revenue | 253.4 |
| | 281.9 |
| | 273.6 |
| | 3 | % | | 6 | % |
| Professional services | 42.1 |
| | 40.5 |
| | 41.2 |
| | (2 | )% | | 2 | % |
| Total revenue | 295.5 |
| | 322.4 |
| | 314.8 |
| | 2 | % | | 6 | % |
| Total cost of revenue | 82.7 |
| | 81.2 |
| | 81.6 |
| | — | % | | |
| Gross margin | 212.8 |
| | 241.2 |
| | 233.1 |
| | 3 | % | | |
| Operating expenses | 203.5 |
| | 208.8 |
| | 211.6 |
| | (1 | )% | | |
| Total costs and expenses | 286.2 |
| | 290.0 |
| | 293.2 |
| | (1 | )% | | 1 | % |
| Operating income | 9.3 |
| | 32.4 |
| | 21.5 |
| | 50 | % | | 67 | % |
Non-GAAP operating income (1) | $ | 37.8 |
| | $ | 60.9 |
| | $ | 56.3 |
| | 8 | % | | 16 | % |
| Operating margin | 3.1 | % | | 10.0 | % | | 6.8 | % | | | | |
Non-GAAP operating margin (1) | 12.8 | % | | 18.9 | % | | 17.9 | % | | | | |
| Diluted earnings (loss) per share | $ | (0.13 | ) | | $ | 0.10 |
| | $ | 0.14 |
| | | | |
Non-GAAP diluted earnings per share (2) | $ | 0.23 |
| | $ | 0.36 |
| | $ | 0.36 |
| | | | |
| Cash flow from operations | $ | 67.6 |
| | $ | 67.6 |
| | $ | 49.0 |
| | | | |
| | | | Nine months ended |
| | | | | | | | | | | | | | | | | | | | | | | | Percent Change |
| Three months ended | | Percent Change 2017 to 2018 | | Nine months ended | | Percent Change 2017 to 2018 | As Reported ASC 606 | | ASC 605 | | As Reported ASC 605 | | ASC 605 |
| June 30, 2018 | | July 1, 2017 |
| Actual | | Constant Currency | | June 30, 2018 | | July 1, 2017 | | Actual | | Constant Currency | June 29, 2019 | | June 29, 2019 | | June 30, 2018 | | Actual | | Constant Currency |
| (Dollar amounts in millions, except per share data) | | | | | |
| Subscription | $ | 126.7 |
| | $ | 74.9 |
| | 69 | % | | 65 | % | | $ | 339.7 |
| | $ | 195.0 |
| | 74 | % | | 69 | % | $ | 419.6 |
| | $ | 482.1 |
| | $ | 339.7 |
| | 42 | % | | 45 | % |
| Support | 121.1 |
| | 140.4 |
| | (14 | )% | | (17 | )% | | 379.0 |
| | 433.6 |
| | (13 | )% | | (16 | )% | |
| Perpetual support | | 315.2 |
| | 312.5 |
| | 379.0 |
| | (18 | )% | | (15 | )% |
| Total recurring revenue | 247.8 |
| | 215.3 |
| | 15 | % | | 12 | % | | 718.7 |
| | 628.6 |
| | 14 | % | | 11 | % | 734.8 |
| | 794.6 |
| | 718.7 |
| | 11 | % | | 13 | % |
| Perpetual license | 25.8 |
| | 32.3 |
| | (20 | )% | | (23 | )% | | 82.6 |
| | 94.1 |
| | (12 | )% | | (15 | )% | 61.4 |
| | 63.7 |
| | 82.6 |
| | (23 | )% | | (20 | )% |
| Total subscription, support and license revenue | 273.6 |
| | 247.6 |
| | 10 | % | | 7 | % | | 801.3 |
| | 722.7 |
| | 11 | % | | 7 | % | |
| Total software revenue | | 796.2 |
| | 858.2 |
| | 801.3 |
| | 7 | % | | 10 | % |
| Professional services | 41.2 |
| | 43.7 |
| | (6 | )% | | (8 | )% | | 128.0 |
| | 134.9 |
| | (5 | )% | | (10 | )% | 124.5 |
| | 118.4 |
| | 128.0 |
| | (7 | )% | | (4 | )% |
| Total revenue | 314.8 |
| | 291.3 |
| | 8 | % | | 5 | % | | 929.3 |
| | 857.7 |
| | 8 | % | | 5 | % | 920.6 |
| | 976.7 |
| | 929.3 |
| | 5 | % | | 8 | % |
| Total cost of revenue | 81.6 |
| | 82.3 |
| | (1 | )% | | | | 248.1 |
| | 246.2 |
| | 1 | % | | | 240.0 |
| | 234.4 |
| | 248.4 |
| | (6 | )% | | |
| Gross margin | 233.2 |
| | 209.0 |
| | 12 | % | | | | 681.2 |
| | 611.4 |
| | 11 | % | | | 680.7 |
| | 742.3 |
| | 680.9 |
| | 9 | % | | |
| Operating expenses | 211.5 |
| | 197.8 |
| | 7 | % | | | | 619.6 |
| | 588.1 |
| | 5 | % | | | 664.2 |
| | 678.3 |
| | 619.9 |
| | 9 | % | | |
| Total costs and expenses | 293.1 |
| | 280.0 |
| | 5 | % | | 2 | % | | 867.8 |
| | 834.3 |
| | 4 | % | | 1 | % | 904.1 |
| | 912.7 |
| | 868.2 |
| | 5 | % | | 7 | % |
| Operating income | 21.7 |
| | 11.3 |
| | 93 | % | | 45 | % | | $ | 61.5 |
| | $ | 23.3 |
| | 164 | % | | 6 | % | 16.5 |
| | 64.0 |
| | 61.1 |
| | 5 | % | | 15 | % |
Non-GAAP operating income (1) | $ | 56.4 |
| | $ | 44.9 |
| | 26 | % | | 13 | % | | $ | 161.4 |
| | $ | 134.2 |
| | 20 | % | | 3 | % | $ | 173.4 |
| | $ | 220.9 |
| | $ | 160.9 |
| | 37 | % | | 41 | % |
| Operating margin | 6.9 | % | | 3.9 | % | | | | | | 6.6 | % | | 2.7 | % | | | | | 1.8 | % | | 6.6 | % | | 6.6 | % | | | | |
Non-GAAP operating margin (1) | 17.9 | % | | 15.4 | % | | | | | | 17.3 | % | | 15.6 | % | | | | | 18.8 | % | | 22.6 | % | | 17.3 | % | | | | |
| Diluted earnings (loss) per share | $ | 0.14 |
| | $ | (0.01 | ) | | | | | | $ | 0.33 |
| | $ | (0.10 | ) | | | | | $ | (0.32 | ) | | $ | 0.16 |
| | $ | 0.33 |
| | | | |
Non-GAAP diluted earnings per share (2) | $ | 0.36 |
| | $ | 0.28 |
| | | | | | $ | 1.00 |
| | $ | 0.84 |
| | | | | $ | 1.01 |
| | $ | 1.31 |
| | $ | 1.00 |
| | | | |
Cash flow from operations (3) | $ | 49.0 |
| | $ | 73.7 |
| | | | | | $ | 185.3 |
| | $ | 102.5 |
| | | | | $ | 229.9 |
| | $ | 229.9 |
| | $ | 185.3 |
| | | | |
| | | | | | | | | | | | | | | | | |
(1) See Non-GAAP Financial Measures below for a reconciliation of our GAAP results to our non-GAAP measures. | |
| (2) We have a full valuation allowance against our U.S. net deferred tax assets and a valuation allowance against net deferred tax assets in certain foreign jurisdictions. As we are profitable on a non-GAAP basis, the 2018 and 2017 non-GAAP tax provisions are calculated assuming there is no valuation allowance. Income tax adjustments reflect the tax effects of non-GAAP adjustments which are calculated by applying the applicable tax rate by jurisdiction to the non-GAAP adjustments listed above. We have recorded the impact of the Tax Cuts and Jobs Act in our first quarter 2018 GAAP earnings, resulting in a non-cash benefit of approximately $7 million. In the third quarter of 2018, we increased the non-cash benefit by approximately $5 million to reflect additional guidance on the state tax implications of the act. We have excluded this benefit from our non-GAAP results. | |
| (3) Cash flow from operations for the nine months ended June 30, 2018 includes $2.5 million of restructuring payments. Cash flow from operations for the nine months ended July 1, 2017 includes $35.3 million of restructuring payments, a $12 million payment related to a Korea tax audit, and $3.3 million of legal settlement payments. | |
| |
| (1) | See Non-GAAP Financial Measures below for a reconciliation of our GAAP results to our non-GAAP financial measures. |
| |
| (2) | We have recorded a full valuation allowance against our U.S. net deferred tax assets. As we are profitable on a non-GAAP basis, the 2019 and 2018 non-GAAP tax provisions are calculated assuming there is no valuation allowance. Income tax adjustments reflect the tax effects of non-GAAP adjustments, which are calculated by applying the applicable tax rate by jurisdiction to the non-GAAP adjustments listed above. We recorded the impact of the Tax Cuts and Jobs Act in our Q1 2018 earnings, resulting in a non-cash benefit of approximately $7 million. In the third quarter of 2018, we increased the non-cash benefit by approximately $5 million to reflect the additional guidance on the state tax implications of the act. We have excluded this benefit from our non-GAAP results. |
| |
| (3) | Cash flow from operations for the first nine months of 2019 includes $21 million of restructuring payments. Cash flow from operations for the first nine months of 2018 includes $2 million of restructuring payments. |
Impact of Foreign Currency Exchange on Results of Operations
Approximately two-thirds60% of our revenue and half40% of our expenses are transacted in currencies other than the U.S. Dollar. Because we report our results of operations in U.S. Dollars, currency translation, particularly changes in the Euro, Yen, Shekel,Sheqel, and Rupee relative to the U.S. Dollar, affects our reported results. If actual results under ASC 605 for the third quarter and first nine months of 20182019 had been converted into U.S. Dollars based on the foreign currency exchange rates in effect for the third quarter and first nine months of 2017,2018, revenue would have been lowerhigher by $9.6$10.8 million and $35.8$29.7 million, respectively, costs and expenses would have been lowerhigher by $5.9$6.7 million and $22.4$19.9 million, respectively, and operating income would have been lowerhigher by $3.7$4.1 million and $13.4$9.8 million, respectively. Our constant currency disclosures are calculated by multiplying the actual results for the third quarter and first nine months of 20182019 by the exchange rates in effect for the comparable periodperiods of 20172018, excluding the effect of any hedging.
Revenue
We discuss our revenue results by line of business, by product group and by geographic region below.
Revenue by Line of Business
Software
Software revenue consists of subscription, support, and perpetual license revenue. SubscriptionUnder ASC 605, recurring software revenue is comprisedconsists of time-based licenses whereby customers use oursubscription and support revenue and approximates 81% of total revenue and 93% of software and receive related supportrevenue for a specified term, and for which revenue is recognized ratably over the term of the contract. Support revenue is comprised of contracts to maintain new and/or previously purchased perpetual licenses, for which revenue is recognized ratably over the term of the contract. Perpetual licenses are a perpetual right to use the software, for which revenue is generally recognized up front upon shipment to the customer.nine months ended June 29, 2019. Our subscription revenue includes an immaterial amount of Software as a Service (SaaS) and cloud services for which revenue is generally recognized ratably over the term of the contract.services.
As our mix of subscription sales relative to perpetual license sales has increased, perpetual license revenue and support revenue have declined and are expected to continue to decline as customers purchase our solutions as subscriptions and convert existing perpetual licenses with support contracts to subscriptions. Effective January 1, 2019, new software licenses for our core solutions and ThingWorx solutions are available only by subscription worldwide. Kepware will continue to be available under perpetual licensing. As our subscription business matures, recurring software revenue growth is expected to accelerate due to the compounding benefit of a subscription business model.
Our results have been impacted, and we expect will continue to be impacted, by our ability to close large transactions. The amount of bookings and revenue, particularly license and subscriptions, attributable to large transactions, and the number of such transactions, may vary significantly from quarter to quarter based on customer purchasing decisions and macroeconomic conditions. Such transactions may have long lead times as they often follow a lengthy product selection and evaluation process and, for existing customers, are influenced by contract expiration cycles. This may cause volatility in our results.
Professional Services
Consulting and trainingProfessional services engagements typically result from sales of new licenses; revenue is recognized over the term of the engagement. ProfessionalUnder ASC 605, professional services revenue was down 6% (8% constant currency) in the third quarter and down 5% (10% constant currency) for the first nine months of 20182019 was down 2% (up 2% constant currency) and down 7% (4% constant currency), respectively, compared to the year-ago periods. These results are in line with our expectation that professional services revenue will trend flat-to-down over time due to our strategy to expand margins by migrating more services engagements to our partners and delivering products that require less consulting and training services.
|
|
| | | | | | | | | | | |
| | | | | | | | | | | | | | | | | | Three months ended |
| | Three months ended | | Nine months ended | | | | | | | Percent Change |
| | | | | | Percent Change | | | | | | Percent Change | As Reported ASC 606 | | ASC 605 | | As Reported ASC 605 | | ASC 605 |
| | June 30, 2018 | | July 1, 2017 | | Actual | | Constant Currency | | June 30, 2018 | | July 1, 2017 | | Actual | | Constant Currency | June 29, 2019 | | June 29, 2019 | | June 30, 2018 | | Actual | | Constant Currency |
| | (Dollar amounts in millions) | (Dollar amounts in millions) | | | | |
| Solutions Products | | | | | | | | | | | | | | | | | | | | | | | | |
| Software revenue | 241.8 |
|
| 222.4 |
| | 9 | % | | 5 | % | | 714.1 |
| | 654.3 |
| | 9 | % | | 5 | % | 216.5 |
| | 243.5 |
| | 241.8 |
| | 1 | % | | 4 | % |
| Professional services | 37.3 |
| | 41.0 |
| | (9 | )% | | (11 | )% | | 117.6 |
| | 128.1 |
| | (8 | )% | | (13 | )% | 38.3 |
| | 35.1 |
| | 37.3 |
| | (6 | )% | | (2 | )% |
| Total revenue | $ | 279.1 |
| | $ | 263.5 |
| | 6 | % | | 3 | % | | $ | 831.8 |
| | $ | 782.4 |
| | 6 | % | | 2 | % | $ | 254.7 |
| | $ | 278.6 |
| | $ | 279.1 |
| | — | % | | 3 | % |
| IoT Products | | | | | | | | | | | | | | | | | | | | | | | | |
| Software revenue | 31.8 |
| | 25.2 |
| | 26 | % | | 24 | % | | 87.1 |
| | 68.4 |
| | 27 | % | | 25 | % | 36.9 |
| | 38.4 |
| | 31.8 |
| | 21 | % | | 24 | % |
| Professional services | 3.9 |
| | 2.6 |
| | 49 | % | | 46 | % | | 10.4 |
| | 6.9 |
| | 52 | % | | 47 | % | 3.8 |
| | 5.4 |
| | 3.9 |
| | 39 | % | | 42 | % |
| Total revenue | $ | 35.7 |
| | $ | 27.8 |
| | 28 | % | | 26 | % | | $ | 97.5 |
| | $ | 75.3 |
| | 30 | % | | 27 | % | $ | 40.8 |
| | $ | 43.8 |
| | $ | 35.7 |
| | 23 | % | | 26 | % |
| | | | | | | | | | | | | | | | | |
|
| | | | | | | | | | | | | | | | | |
| | Nine months ended |
| | | | | | | | Percent Change |
| | As Reported ASC 606 | | ASC 605 | | As Reported ASC 605 | | ASC 605 |
| | June 29, 2019 | | June 29, 2019 | | June 30, 2018 | | Actual | | Constant Currency |
| | (Dollar amounts in millions) | | | | |
| Solutions Products | | | | | | | | | |
| Software revenue | 691.9 |
| | 748.5 |
| | 714.1 |
| | 5 | % | | 8 | % |
| Professional services | 113.2 |
| | 101.2 |
| | 117.6 |
| | (14 | )% | | (10 | )% |
| Total revenue | $ | 805.1 |
| | $ | 849.7 |
| | $ | 831.8 |
| | 2 | % | | 5 | % |
| IoT Products | | | | | | | | | |
| Software revenue | 104.2 |
| | 109.8 |
| | 87.1 |
| | 26 | % | | 28 | % |
| Professional services | 11.2 |
| | 17.2 |
| | 10.4 |
| | 65 | % | | 70 | % |
| Total revenue | $ | 115.5 |
| | $ | 127.0 |
| | $ | 97.5 |
| | 30 | % | | 33 | % |
Solutions Group
SoftwareUnder ASC 605, Solutions Group software revenue forgrew slightly in the third quarter and first nine months of 2018 increased over the third quarter and first nine months of 2017 as a result of strong CAD, PLM and global channel license and subscription bookings over the past two years, offset by a significant increase in the subscription mix in the current period. Subscription sales have increased in part due to the acceleration of our support conversion programs that we have been offering over thesubscription model and strong bookings in CAD and core PLM in past few years whereby customers may convert existing perpetual licenses and support to a new subscription. Recurringperiods. Solutions recurring software revenue grew 13% bothunder ASC 605 in the third quarter and first nine months of 20182019 grew 7% and 8%, respectively, compared to the year-ago periods (11% for both periods on a constant currency basis), reflecting the bookings growth over the third quarterpast several years and first nine monthsthe compounding benefit of 2017, and has grown double-digits for six consecutive quarters.our maturing subscription model.
ProfessionalSolutions professional services revenue for the third quarter and first nine months of 20182019 declined compared to the third quarter and first nine months of 2017year-ago periods due to our strategy to limit the amount of professional services we provide.
IoT Group
Software revenue for the third quarter and first nine months of 2018 increased compared to the third quarter and first nine months of 2017 due to increases in license and subscription bookings over the past two years, offset by a significant increase in the subscription mix. Software revenue for the third quarter of 2018 increased 10% sequentially over the second quarter of 2018. RecurringUnder ASC 605, IoT recurring software revenue grew 33% both in the third quarter and first nine months of 20182019 by 31% (34% on a constant currency basis), reflecting the strong bookings growth over the third quarterpast several years and first nine monthsthe compounding benefit of 2017. Recurring software revenue increased 7% sequentially over the second quarter of 2018.our maturing subscription model.
ProfessionalIoT professional services revenue increased in the third quarter and first nine months of 20182019 due in part to implementation and adoption services we provide to our IoT customers as part of our efforts to help their IoT initiatives be successful.
succeed.
Revenue by Geographic Region
TotalA significant portion of our total revenue grewis generated outside the U.S. In 2019 and 2018, approximately 40% of total revenue was generated in all regions for the third quarterAmericas, 40% in Europe, and first nine months of 2018 compared to the year-ago periods.

| | | | | | | | | | | | | | | | | | | | Three months ended |
| | Three months ended | | Nine months ended | | | | | | | Percent Change |
| | | | | | Percent Change | | | | | | Percent Change | As Reported ASC 606 | | ASC 605 | | As Reported ASC 605 | | ASC 605 |
| | June 30, 2018 | | July 1, 2017 | | Actual | | Constant Currency | | June 30, 2018 | | July 1, 2017 | | Actual | | Constant Currency | June 29, 2019 | | June 29, 2019 | | June 30, 2018 | | Actual | | Constant Currency |
| | (Dollar amounts in millions) | (Dollar amounts in millions) | | | | |
| Americas | | | | | | | | | | | | | | | | | | | | | | | | |
| Software revenue | 118.0 |
| | 107.8 |
| | 9 | % | | 9 | % | | 344.3 |
| | 321.3 |
| | 7 | % | | 7 | % | 109.6 |
| | 130.9 |
| | 118.0 |
| | 11 | % | | 11 | % |
| Professional services | 15.4 |
| | 16.1 |
| | (5 | )% | | (4 | )% | | 44.6 |
| | 51.7 |
| | (14 | )% | | (14 | )% | 13.3 |
| | 13.5 |
| | 15.4 |
| | (13 | )% | | (12 | )% |
| Total revenue | $ | 133.4 |
| | $ | 124.0 |
| | 8 | % | | 8 | % | | $ | 388.9 |
| | $ | 373.0 |
| | 4 | % | | 4 | % | $ | 122.9 |
| | $ | 144.4 |
| | $ | 133.4 |
| | 8 | % | | 9 | % |
| Europe | | | | | | | | | | | | | | | | | | | | | | | | |
| Software revenue | 100.9 |
| | 91.1 |
| | 11 | % | | 3 | % | | 299.8 |
| | 256.4 |
| | 17 | % | | 9 | % | 90.6 |
| | 103.4 |
| | 100.9 |
| | 2 | % | | 9 | % |
| Professional services | 18.9 |
| | 20.2 |
| | (6 | )% | | (10 | )% | | 63.2 |
| | 59.7 |
| | 6 | % | | (3 | )% | 21.5 |
| | 19.6 |
| | 18.9 |
| | 3 | % | | 9 | % |
| Total revenue | $ | 119.9 |
| | $ | 111.3 |
| | 8 | % | | 1 | % | | $ | 363.0 |
| | $ | 316.1 |
| | 15 | % | | 6 | % | $ | 112.1 |
| | $ | 123.0 |
| | $ | 119.9 |
| | 3 | % | | 9 | % |
| Asia Pacific | | | | | | | | | | | | | | | | | | | | | | | | |
| Software revenue | 54.7 |
| | 48.7 |
| | 12 | % | | 9 | % | | 157.1 |
| | 145.0 |
| | 8 | % | | 5 | % | 53.3 |
| | 47.6 |
| | 54.7 |
| | (13 | )% | | (10 | )% |
| Professional services | 6.8 |
| | 7.3 |
| | (7 | )% | | (10 | )% | | 20.3 |
| | 23.6 |
| | (14 | )% | | (17 | )% | 7.3 |
| | 7.4 |
| | 6.8 |
| | 9 | % | | 14 | % |
| Total revenue | $ | 61.5 |
| | $ | 56.0 |
| | 10 | % | | 7 | % | | $ | 177.4 |
| | $ | 168.6 |
| | 5 | % | | 2 | % | $ | 60.5 |
| | $ | 55.0 |
| | $ | 61.5 |
| | (10 | )% | | (7 | )% |
|
| | | | | | | | | | | | | | | | | |
| | Nine months ended |
| | | | | | | | Percent Change |
| | As Reported ASC 606 | | ASC 605 | | As Reported ASC 605 | | ASC 605 |
| | June 29, 2019 | | June 29, 2019 | | June 30, 2018 | | Actual | | Constant Currency |
| | (Dollar amounts in millions) | | | | |
| Americas | | | | | | | | | |
| Software revenue | 347.0 |
| | 379.4 |
| | 344.3 |
| | 10 | % | | 11 | % |
| Professional services | 37.4 |
| | 37.6 |
| | 44.6 |
| | (16 | )% | | (15 | )% |
| Total revenue | $ | 384.4 |
| | $ | 417.1 |
| | $ | 388.9 |
| | 7 | % | | 8 | % |
| Europe | | | | | | | | | |
| Software revenue | 277.2 |
| | 307.8 |
| | 299.8 |
| | 3 | % | | 8 | % |
| Professional services | 65.2 |
| | 58.6 |
| | 63.2 |
| | (7 | )% | | (1 | )% |
| Total revenue | $ | 342.5 |
| | $ | 366.4 |
| | $ | 363.0 |
| | 1 | % | | 6 | % |
| Asia Pacific | | | | | | | | | |
| Software revenue | 171.9 |
| | 171.0 |
| | 157.1 |
| | 9 | % | | 12 | % |
| Professional services | 21.8 |
| | 22.2 |
| | 20.3 |
| | 10 | % | | 14 | % |
| Total revenue | $ | 193.7 |
| | $ | 193.2 |
| | $ | 177.4 |
| | 9 | % | | 12 | % |
Americas
Strong license and subscription bookings have been drivingSoftware revenue growth in the Americas, with new license and subscriptions bookings up 9% and 8% for the third quarter and first nine months of 2018 compared to the year-ago periods, despite a significant increase in the subscription mix.
Europe
Europe revenue growth is the result of seven double-digit year-over-year license and subscription bookings growth quarters between the fourth quarter of 2016 and the third quarter of 2018, despite an increase in subscription mix in the third quarter of 2018 compared to the third quarter of 2017.
Asia Pacific
Asia Pacific revenue growth is due to improved license and subscription bookings performance of more than 20%grew in the third quarter and first nine months of 2018 compared to2019 over the third quarter and first nine months of 2017, driven by solid performance in China, Taiwan and Korea and by an easier
comparisonyear-ago periods due to weak performancegrowth in Japan in the third quarterrecurring software revenue of 2017, despite a significant increase in the subscription mix.11% and 12%, respectively.
Gross MarginEurope
|
| | | | | | | | | | | | | | | | | | | | | |
| | Three months ended | | Nine months ended |
| | June 30, 2018 | | July 1, 2017 | | Percent
Change | | June 30, 2018 | | July 1, 2017 | | Percent
Change |
| | (Dollar amounts in millions) |
| Gross margin | $ | 233.2 |
| | $ | 209.0 |
| | 12 | % | | $ | 681.2 |
| | $ | 611.4 |
| | 11 | % |
| Non-GAAP gross margin (1) | 242.6 |
| | 219.1 |
| | 11 | % | | 710.0 |
| | 641.7 |
| | 11 | % |
| Gross margin as a % of revenue: | | | | | | | | | | | |
| License and subscription gross margin | 84 | % | | 80 | % | | | | 83 | % | | 78 | % | | |
| Support gross margin | 82 | % | | 83 | % | | | | 82 | % | | 84 | % | | |
| Professional services gross margin | 14 | % | | 15 | % | | | | 15 | % | | 15 | % | | |
| Gross margin as a % of total revenue | 74 | % | | 72 | % | | | | 73 | % | | 71 | % | | |
| Non-GAAP gross margin as a % of total revenue (1) | 77 | % | | 75 | % | | | | 76 | % | | 75 | % | | |
(1) Non-GAAP measures are reconciled to GAAP results under Non-GAAP Financial Measures below. |
The increase in total gross marginSoftware revenue grew in the third quarter and first nine months of 2018 compared2019 over the year-ago periods due to recurring software revenue growth of 5% and 7%, respectively, (12% for both periods on a constant currency basis) driven by the compounding benefit of subscription licensing. This growth was offset in part by the decline of 51% (48% on a constant currency basis) in perpetual license revenue for the first nine months of 2019 due to the end of life of perpetual licenses in Europe as of January 1, 2018.
Asia Pacific
In the third quarter and first nine months of 2017 is2019, Asia Pacific recurring software revenue grew 15% and 17%, respectively, (19% and 21%, respectively on a constant currency basis) compared to the year ago periods driven by the compounding benefit of the subscription transition. Software revenue declined in line withthe third quarter of 2019 compared to the year ago period due to a 92% decline in perpetual license revenue following the end of life of perpetual licenses there as of January 1, 2019. Software revenue increased in the first nine months of 2019 compared to the year-ago period in part due to the last time purchases in the first before the discontinuation of perpetual licenses there as of January 1, 2019.
|
| | | | | | | | | | | | | | | | | | | | | | | | | | | | | |
| | Three months ended | | Nine months ended |
| | As Reported ASC 606 | | ASC 605 | | As Reported ASC 605 | | ASC 605 | | As Reported ASC 606 | | ASC 605 | | As Reported ASC 605 | | ASC 605 |
| | June 29, 2019 | | June 29, 2019 | | June 30, 2018 | | Percent
Change | | June 29, 2019 | | June 29, 2019 | | June 30, 2018 | | Percent
Change |
| | (Dollar amounts in millions) |
| Gross margin | $ | 212.8 |
| | $ | 241.2 |
| | $ | 233.1 |
| | 3 | % | | $ | 680.7 |
| | $ | 742.3 |
| | $ | 680.9 |
| | 9 | % |
Non-GAAP gross margin (1) | 222.3 |
| | 250.7 |
| | 242.6 |
| | 3 | % | | 710.3 |
| | 771.9 |
| | 709.7 |
| | 9 | % |
| Gross margin as a % of revenue: | | | | | | | | | | | | | | | |
| License gross margin | 79 | % | | 92 | % | | 91 | % | | | | 83 | % | | 92 | % | | 90 | % | | |
| Support and cloud services gross margin | 82 | % | | 72 | % | | 75 | % | | | | 83 | % | | 73 | % | | 76 | % | | |
| Professional services gross margin | 15 | % | | 14 | % | | 14 | % | | | | 17 | % | | 16 | % | | 15 | % | | |
| Gross margin as a % of total revenue | 72 | % | | 75 | % | | 74 | % | | | | 74 | % | | 76 | % | | 73 | % | | |
Non-GAAP gross margin as a % of total revenue (1) | 75 | % | | 78 | % | | 77 | % | | | | 77 | % | | 79 | % | | 76 | % | | |
(1) Non-GAAP financial measures are reconciled to GAAP results under Non-GAAP Financial Measures below. |
Under ASC 605, the increase in total revenue growth. Total revenuegross margin in both the third quarter and first nine months of 2019 compared to the third quarter and first nine months of 2018 grew 8% overreflects higher software revenue driven by the third quarter and first nine months of 2017.maturing subscription model. Margins for license and subscription are beginning to expand as the subscription model matures and revenue that has been deferred begins to contribute to each quarterly period. SupportUnder ASC 605, support gross margins are down in the third quarter and first nine months of 20182019 compared to the third quarter and first nine months 2017year-ago periods primarily due to decreasesthe decrease in perpetual support revenue due to conversions of 14% and 13%, respectively. The support revenue decreases are associated with an increase in ourto subscription mix and the conversionend of existing customers fromlife of perpetual licenses with support contracts to subscription.licenses.
The professionalProfessional services gross margin decreased slightly in the third quarter of 2018 compared to the third quarter of 2017 and remained flat inincreased 100 basis points for the first nine months of 20182019 compared to the first nine months of 20172018 due to cost management.
Total Costs and Expenses
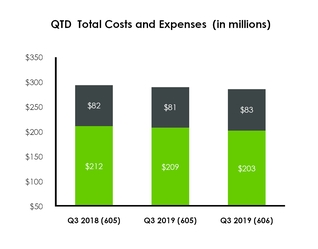
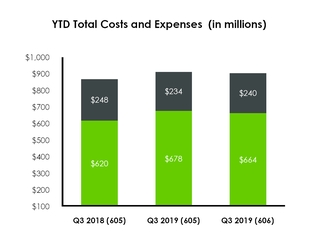

|
| | | | | | | | | | | | | | | | | | | | | | | | | | | | | |
| | Three months ended | | Nine months ended |
| | As Reported ASC 606 | | ASC 605 | | As Reported ASC 605 | | ASC 605 | | As Reported ASC 606 | | ASC 605 | | As Reported ASC 605 | | ASC 605 |
| | June 29, 2019 | | June 29, 2019 | | June 30, 2018 | | Percent
Change | | June 29, 2019 | | June 29, 2019 | | June 30, 2018 | | Percent Change |
| | (Dollar amounts in millions) |
| Costs and expenses: | | | | | | | | | | | | | | | |
| Cost of license revenue | $ | 13.3 |
|
| $ | 13.0 |
| | $ | 12.0 |
|
| 8 | % | | $ | 38.7 |
| | $ | 37.6 |
| | $ | 36.0 |
| | 5 | % |
| Cost of support and cloud services revenue | 33.8 |
| | 33.6 |
| | 34.3 |
| | (2 | )% | | 97.9 |
| | 97.2 |
| | 103.1 |
| | (6 | )% |
| Cost of professional services revenue | 35.6 |
| | 34.6 |
| | 35.4 |
|
| (2 | )% | | 103.4 |
| | 99.6 |
| | 109.3 |
| | (9 | )% |
| Sales and marketing | 108.2 |
|
| 113.5 |
| | 107.8 |
|
| 5 | % | | 316.1 |
| | 330.3 |
| | 305.6 |
| | 8 | % |
| Research and development | 60.6 |
|
| 60.6 |
| | 61.2 |
|
| (1 | )% | | 182.8 |
| | 182.8 |
| | 187.4 |
| | (2 | )% |
| General and administrative | 28.8 |
|
| 28.8 |
| | 33.1 |
|
| (13 | )% | | 102.0 |
| | 102.0 |
| | 101.5 |
| | 1 | % |
| Amortization of acquired intangible assets | 5.9 |
| | 5.9 |
| | 7.9 |
| | (25 | )% | | 17.8 |
| | 17.8 |
| | 23.6 |
| | (25 | )% |
| Restructuring and other charges, net | — |
| | — |
| | 1.6 |
| |
| | 45.5 |
| | 45.5 |
| | 1.8 |
| |
|
| Total costs and expenses | $ | 286.2 |
| | $ | 290.0 |
| | $ | 293.2 |
| | (1 | )% | | $ | 904.1 |
| | $ | 912.7 |
| | $ | 868.2 |
| | 5 | % |
| Total headcount at end of period | 6,048 |
| | 6,048 |
| | 6,065 |
| | — | % | | | | | | | |
|
ASC 605 costs and expenses in the third quarter of 2019 compared to costs and expenses in the third quarter of 2018 decreased primarily due to the declinefollowing:
a $4.3 million decrease in revenue,total compensation, benefit costs and travel expenses, primarily driven by a $6.4 million decrease in performance-based compensation, partially offset by cost management. Professionala $2.2 million increase in salaries,
a $3.5 million decrease in amortization of intangible assets and depreciation of fixed assets expenses,
a $1.2 million decrease in acquisition-related charges,
partially offset by:
a $2.3 million increase in marketing expenses,
a $1.3 million increase in cloud services revenue declined 6%hosting costs, and 5%
a $1.1 million increase in royalty expense.
Costs and expenses for the third quarter and first nine months of 2018, respectively,2019 compared to the year ago periods. The declineyear-ago period include a $6.7 million decrease due to changes in professional services revenue inforeign currency exchange rates.
ASC 605 costs and expenses for the first nine months of 2018 is in line with our strategy2019 compared to migrate more services engagements to our partners and to deliver products that require less consulting and training services.
Total Costs and Expenses
|
| | | | | | | | | | | | | | | | | | | | | |
| | Three months ended | | Nine months ended |
| | June 30, 2018 | | July 1, 2017 | | Percent
Change | | June 30, 2018 | | July 1, 2017 | | Percent Change |
| | (Dollar amounts in millions) |
| Costs and expenses: | | | | | | | | | | | |
| Cost of license and subscription revenue | $ | 24.0 |
|
| $ | 21.6 |
|
| 11 | % | | $ | 71.5 |
| | $ | 62.3 |
| | 15 | % |
| Cost of support revenue | 22.2 |
| | 23.6 |
| | (6 | )% | | 67.5 |
| | 69.0 |
| | (2 | )% |
| Cost of professional services revenue | 35.3 |
| | 37.0 |
|
| (4 | )% | | 109.2 |
| | 114.9 |
| | (5 | )% |
| Sales and marketing | 107.7 |
|
| 93.1 |
|
| 16 | % | | 305.4 |
| | 271.6 |
| | 12 | % |
| Research and development | 61.2 |
|
| 59.9 |
|
| 2 | % | | 187.4 |
| | 175.5 |
| | 7 | % |
| General and administrative | 33.1 |
|
| 35.3 |
|
| (6 | )% | | 101.4 |
| | 108.8 |
| | (7 | )% |
| Amortization of acquired intangible assets | 7.9 |
| | 8.0 |
| | (2 | )% | | 23.6 |
| | 24.0 |
| | (2 | )% |
| Restructuring and other charges, net | 1.6 |
| | 1.6 |
| | 5 | % | | 1.8 |
| | 8.3 |
| | (78 | )% |
| Total costs and expenses | $ | 293.1 |
| | $ | 280.0 |
| | 5 | % | | $ | 867.8 |
| | $ | 834.3 |
| | 4 | % |
| Total headcount at end of period | 6,065 |
| | 5,983 |
| | 1 | % | | | | | |
|
|
Costscosts and expenses infor the third quarterfirst nine months of 2018 compared to the third quarter of 2017 increased primarily as a result of the following:
a $10.7$27.1 million ($6.0restructuring charge associated with exiting our Needham headquarters facility in the second quarter of 2019 and a $15.7 million constant currency)restructuring charge for our workforce realignment in the first quarter of 2019,
a $7.4 million increase in performance-based compensation, expense primarily due to salary and headcount increases and an increase in commission expenses,
a $2.5$6.4 million increase in cloud services hosting costs; of which $1.3costs,
a $2.1 million is includedincrease in cost of license and subscription revenue,royalty expense,
a $1.5 million increase in marketing expense, and
a $1.6$1.5 million increase in transactional charges relatedrent expense primarily due to structuring strategic agreements,one month of overlapping rent in Needham and the new Seaport location in January,
primarily offset by:
a $1.8
an $6.5 million decrease in restructuring charges.salaries, benefit costs and travel expenses, driven by a $3.1 million decrease in salaries and a $3.4 million decrease in benefits and travel expense,
Costsa $6.7 million decrease in amortization of intangible assets and expenses for the third quarterdepreciation of 2018 compared to the year ago period include fixed assets,
a $5.9$2.8 million increase due to changesdecrease in foreign currency exchange rates.outside services primarily professional fees, and
a $1.7 million decrease in meeting costs.
Costs and expenses for the first nine months of 2018 compared to the first nine months of 2017 increased primarily as a result of the following:
a $33.4 million ($16.9 million constant currency) increase in compensation expense primarily due to salary and headcount increases and an increase in commission expenses,
a $6.5 million increase in cloud services hosting costs, of which $3.1 million is included in cost of license and subscription revenue,
a $1.9 million increase in facility costs (including depreciation), and
a $1.1 million increase in acquisition-related and transactional charges related to structuring strategic agreements,
offset by:
a $9.3 million decrease in restructuring charges, and
a $3.8 million decrease in professional fees.
Costs and expenses for the first nine months of 20182019 compared to the year ago period include a $22.4$19.9 million increasedecrease due to changes in foreign currency exchange rates.
Cost of License, Subscription and Support Revenue
|
| | | | | | | | | | | | | | | | | | | | | |
| Cost of License and Subscription Revenue | Three months ended | | Nine months ended |
| | June 30, 2018 | | July 1, 2017 | | Percent Change | | June 30, 2018 | | July 1, 2017 | | Percent Change |
| | (Dollar amounts in millions) |
| Cost of license and subscription revenue | $ | 24.0 |
| | $ | 21.6 |
| | 11 | % | | $ | 71.5 |
| | $ | 62.3 |
| | 15 | % |
| % of total revenue | 8 | % | | 7 | % | | | | 8 | % | | 7 | % | | |
| % of total license and subscription revenue | 16 | % | | 20 | % | | | | 17 | % | | 22 | % | | |
|
| | | | | | | | | | | | | | | | | | | | | | | | | | | | | |
| Cost of License Revenue | Three months ended | | Nine months ended |
| | As Reported ASC 606 | | ASC 605 | | As Reported ASC 605 | | ASC 605 | | As Reported ASC 606 | | ASC 605 | | As Reported ASC 605 | | ASC 605 |
| | June 29, 2019 | | June 29, 2019 | | June 30, 2018 | | Percent Change | | June 29, 2019 | | June 29, 2019 | | June 30, 2018 | | Percent Change |
| | (Dollar amounts in millions) |
| Cost of license revenue | $ | 13.3 |
| | $ | 13.0 |
| | $ | 12.0 |
| | 8 | % | | $ | 38.7 |
| | $ | 37.6 |
| | $ | 36.0 |
| | 5 | % |
| % of total revenue | 5 | % | | 4 | % | | 4 | % | | | | 4 | % | | 4 | % | | 4 | % | | |
| % of total license revenue | 21 | % | | 8 | % | | 9 | % | | | | 17 | % | | 8 | % | | 10 | % | | |
Our cost of license and subscription includes cost of license, whichrevenue consists of fixed and variable costs associated with reproducing and distributing software and documentation, as well as royalties paid to third parties for technology embedded in or licensed with our software products, amortization of intangible assets associated with acquired products, and cost of subscription which includes our cost of cloud services and our cost of software as a service revenue.licensing. Costs associated with providing post-contract support such as providing software updates and technical support for both our subscription offerings and our perpetual licenses are included in cost of support and cloud service revenue. Cost of license and subscription revenue as a percent of license and subscription revenue can vary depending on the subscription mix percentage, the product mix sold, the effect of fixed and variable royalties, headcount and the level of amortization of acquired software intangible assets.
InCost of license revenue under ASC 606 is higher in the third quarter and first nine months of 2019 than under ASC 605 due to the timing of revenue recognition under ASC 606, resulting in earlier recognition of the associated royalty costs. Under ASC 605, the support component of subscription revenue is included in license revenue, which reduces cost of license as a percentage of total license revenue.
Cost of license revenue in the third quarter and first nine months of 2019 compared to the third quarter and first nine months of 2018 increased primarily due to a $1.0 million and $2.0 million increase in royalty costs, respectively, offset by $0.7 million and $2.0 million lower compensation costs, respectively.
Cost of license revenue as a percentage of license revenue under ASC 605 decreased in the third quarter and first nine months of 2019 compared to the third quarter and first nine months of 2017, total compensation increased 2% ($0.2 million) and 13% ($3.4 million), respectively, due to increases in salaries, benefit costs and higher travel expenses. Cloud services hosting costs increased by 42% ($1.3 million) and 38% ($3.1 million), respectively, in the third quarter and first nine months of 2018 compared to the third quarter and first nine months of 2017.
Cost of license and subscription revenue as a percentage of license and subscription revenue has decreased in the third quarter and first nine months of 2018 compared to the year-ago periods due to higher revenue as we realize the benefit of our maturing subscription model.
|
| | | | | | | | | | | | | | | | | | | | | |
| Cost of Support Revenue | Three months ended | | Nine months ended |
| | June 30, 2018 | | July 1, 2017 | | Percent Change | | June 30, 2018 | | July 1, 2017 | | Percent Change |
| | (Dollar amounts in millions) |
| Cost of support revenue | $ | 22.2 |
| | $ | 23.6 |
| | (6 | )% | | $ | 67.5 |
| | $ | 69.0 |
| | (2 | )% |
| % of total revenue | 7 | % | | 8 | % | | | | 7 | % | | 8 | % | | |
| % of total support revenue | 18 | % | | 17 | % | | | | 18 | % | | 16 | % | | |
|
| | | | | | | | | | | | | | | | | | | | | | | | | | | | | |
| Cost of Support and Cloud Services Revenue | Three months ended | | Nine months ended |
| | As Reported ASC 606 | | ASC 605 | | As Reported ASC 605 | | ASC 605 | | As Reported ASC 606 | | ASC 605 | | As Reported ASC 605 | | ASC 605 |
| | June 29, 2019 | | June 29, 2019 | | June 30, 2018 | | Percent Change | | June 29, 2019 | | June 29, 2019 | | June 30, 2018 | | Percent Change |
| | (Dollar amounts in millions) |
| Cost of support and cloud services revenue | $ | 33.8 |
| | $ | 33.6 |
| | $ | 34.3 |
| | (2 | )% | | $ | 97.9 |
| | $ | 97.2 |
| | $ | 103.1 |
| | (6 | )% |
| % of total revenue | 11 | % | | 10 | % | | 11 | % | | | | 11 | % | | 10 | % | | 11 | % | | |
| % of total support and cloud services revenue | 18 | % | | 28 | % | | 25 | % | | | | 17 | % | | 27 | % | | 24 | % | | |
Our cost of support and cloud services revenue includes costs associated with providing post-contract support such as providing software updates and technical support for both our subscription offerings and our perpetual licenses, cost of cloud services, and cost of software as a service revenue. Cost of support and cloud services revenue consists of costs such as salaries, benefits, and computer
equipment and facilities associated with customer support and cloud services and the release of support updates (including related royalty costs) associated with providing.
Under ASC 605, the support for both our perpetual licenses andcomponent of subscription licenses.
Costrevenue is included in license revenue, which increases the cost of support revenue inand cloud services as a percentage of total support and cloud services revenue.
In the third quarter andfirst nine months of 2019 compared to the first nine months of 2018, compared to the third quartertotal support and first nine months of 2017cloud services compensation, benefit costs and travel expenses decreased primarilyby 5% ($2.9 million) due to lower headcount, decreasesas well as lower third-party consulting costs, which decreased by 30% ($1.5 million). Offsetting these lower costs is a 19% ($2.0 million) increase in royalty expense and decreases in professional fees.cloud services hosting costs.
| | | Cost of Professional Services Revenue | Three months ended | | Nine months ended | Three months ended | | Nine months ended |
| | June 30, 2018 | | July 1, 2017 | | Percent Change | | June 30, 2018 | | July 1, 2017 | | Percent Change | As Reported ASC 606 | | ASC 605 | | As Reported ASC 605 | | ASC 605 | | As Reported ASC 606 | | ASC 605 | | As Reported ASC 605 | | ASC 605 |
| | (Dollar amounts in millions) | June 29, 2019 | | June 29, 2019 | | June 30, 2018 | | Percent Change | | June 29, 2019 | | June 29, 2019 | | June 30, 2018 | | Percent Change |
| | | (Dollar amounts in millions) |
| Cost of professional services revenue | $ | 35.3 |
| | $ | 37.0 |
| | (4 | )% | | $ | 109.2 |
| | $ | 114.9 |
| | (5 | )% | $ | 35.6 |
| | $ | 34.6 |
| | $ | 35.4 |
| | (2 | )% | | $ | 103.4 |
| | $ | 99.6 |
| | $ | 109.3 |
| | (9 | )% |
| % of total revenue | 11 | % | | 13 | % | | | | 12 | % | | 13 | % | | | 12 | % | | 11 | % | | 11 | % | | | | 11 | % | | 10 | % | | 12 | % | | |
| % of total professional services revenue | 86 | % | | 85 | % | | | | 85 | % | | 85 | % | | | 85 | % | | 86 | % | | 86 | % | | | | 83 | % | | 84 | % | | 85 | % | | |
Our cost of professional services revenue includes costs such as salaries, benefits, and computer equipment and facilities for our training and consulting personnel, and third-party subcontractor fees. In
Cost of professional services revenue is higher in the third quarter and first nine months of 2018 compared2019 under ASC 606 than under ASC 605 due to the timing of professional services revenue recognition and associated professional services costs.
In the third quarter and first nine months of 2017,2019 compared to the third quarter and first nine months of 2018, total professional services compensation, benefit costs and travel expenses decreased by 11%6% ($3.11.5 million) and 6%14% ($5.210.7 million), respectively, due to lower headcount;headcount, partially offset by higher third-party subcontractor fees, which increased by 17%16% ($1.01.1 million) and 3%15% ($0.73.1 million), respectively.
| | | Sales and Marketing | Three months ended | | Nine months ended | Three months ended | | Nine months ended |
| | June 30, 2018 | | July 1, 2017 | | Percent
Change | | June 30, 2018 | | July 1, 2017 | | Percent
Change | As Reported ASC 606 | | ASC 605 | | As Reported ASC 605 | | ASC 605 | | As Reported ASC 606 | | ASC 605 | | As Reported ASC 605 | | ASC 605 |
| | (Dollar amounts in millions) | June 29, 2019 | | June 29, 2019 | | June 30, 2018 | | Percent
Change | | June 29, 2019 | | June 29, 2019 | | June 30, 2018 | | Percent
Change |
| | | (Dollar amounts in millions) |
| Sales and marketing | $ | 107.7 |
| | $ | 93.1 |
| | 16 | % | | $ | 305.4 |
| | $ | 271.6 |
| | 12 | % | $ | 108.2 |
| | $ | 113.5 |
| | $ | 107.8 |
| | 5 | % | | $ | 316.1 |
| | $ | 330.3 |
| | $ | 305.6 |
| | 8 | % |
| % of total revenue | 34 | % | | 32 | % | | | | 33 | % | | 32 | % | | | 37 | % | | 35 | % | | 34 | % | | | | 34 | % | | 34 | % | | 33 | % | | |
Our sales and marketing expenses primarily include salaries and benefits, sales commissions, advertising and marketing programs, travel and facility costs.
Sales and marketing costs are lower under ASC 606 than under ASC 605 due to the deferral of ongoing commission expenses, offset by the amortization of commissions costs capitalized upon adoption of ASC 606.
In the third quarter and first nine months of 2019 compared to the third quarter and first nine months of 2018, compared to the third quartertotal sales and first nine months of 2017, totalmarketing compensation, benefit costs and travel expenses increased 20%2% ($13.91.9 million) and 14%8% ($29.520.0 million), respectively, due to higher commission costs, an increase in headcount, salary increases and stock-based compensation increases.increases, and an increase in marketing expenses of 23% ($2.2 million) and 6% ($1.5 million), respectively.
| | | Research and Development | Three months ended | | Nine months ended | Three months ended | | Nine months ended |
| | June 30, 2018 | | July 1, 2017 | | Percent
Change | | June 30, 2018 | | July 1, 2017 | | Percent
Change | As Reported ASC 606 | | ASC 605 | | As Reported ASC 605 | | ASC 605 | | As Reported ASC 606 | | ASC 605 | | As Reported ASC 605 | | ASC 605 |
| | (Dollar amounts in millions) | June 29, 2019 | | June 29, 2019 | | June 30, 2018 | | Percent
Change | | June 29, 2019 | | June 29, 2019 | | June 30, 2018 | | Percent
Change |
| | | (Dollar amounts in millions) |
| Research and development | $ | 61.2 |
| | $ | 59.9 |
| | 2 | % | | $ | 187.4 |
| | $ | 175.5 |
| | 7 | % | $ | 60.6 |
| | $ | 60.6 |
| | $ | 61.2 |
| | (1 | )% | | $ | 182.8 |
| | $ | 182.8 |
| | $ | 187.4 |
| | (2 | )% |
| % of total revenue | 19 | % | | 21 | % | | | | 20 | % | | 20 | % | | | 21 | % | | 19 | % | | 19 | % | | | | 20 | % | | 19 | % | | 20 | % | | |
Our research and development expenses consist principally of salaries and benefits, costs of computer equipment and facility expenses. Major research and development activities include developing new products and releases and updates of our software that enhance functionality and add features. In the third quarter and first nine months of 2019 compared to the third quarter and first nine months of 2018, compared to the third quartertotal research and first nine months of 2017 totaldevelopment compensation, benefit costs and travel expenses increasedwere flat (down $0.1 million) and decreased 3% ($1.6 million) and 9% ($12.03.9 million), respectively, primarily due to an increasedecreases in headcount, salary increases and stock-based compensation increases.
in third-party consulting services of 41% ($0.8 million) and 38% ($2.2 million), respectively. | | | General and Administrative | Three months ended | | Nine months ended | Three months ended | | Nine months ended |
| | June 30, 2018 | | July 1, 2017 | | Percent
Change | | June 30, 2018 | | July 1, 2017 | | Percent
Change | As Reported ASC 606 | | ASC 605 | | As Reported ASC 605 | | ASC 605 | | As Reported ASC 606 | | ASC 605 | | As Reported ASC 605 | | ASC 605 |
| | (Dollar amounts in millions) | June 29, 2019 | | June 29, 2019 | | June 30, 2018 | | Percent
Change | | June 29, 2019 | | June 29, 2019 | | June 30, 2018 | | Percent
Change |
| | | (Dollar amounts in millions) |
| General and administrative | $ | 33.1 |
| | $ | 35.3 |
| | (6 | )% | | $ | 101.4 |
| | $ | 108.8 |
| | (7 | )% | $ | 28.8 |
| | $ | 28.8 |
| | $ | 33.1 |
| | (13 | )% | | $ | 102.0 |
| | $ | 102.0 |
| | $ | 101.5 |
| | 1 | % |
| % of total revenue | 11 | % | | 12 | % | | | | 11 | % | | 13 | % | | | 10 | % | | 9 | % | | 11 | % | | | | 11 | % | | 10 | % | | 11 | % | | |
Our general and administrative expenses include the costs of our corporate, finance, information technology, human resources, legal and administrative functions, as well as acquisition-related charges, bad debt expense and outside professional services, including accounting and legal fees.
In the third quarter of 2019 compared to the third quarter of 2018 total general and administrative compensation, benefit costs and travel expenses decreased by 16% ($3.9 million) primarily due to a decrease in performance-based compensation, partially offset by an increase in salaries.
In the first nine months of 2019 compared to the first nine months of 2018 hosted subscription costs increased by 18% ($1.6 million).
In the third quarter and first nine months of 2019 compared to the third quarter and first nine months of 2018 compared to the third quarter and first nine months of 2017 total compensation, benefit costs and travel expensesprofessional fees decreased 4%by 68% ($1.0 million) and 5%68% ($3.82.7 million), respectively, primarily due to lower stock-based compensation, offset by increases in headcount and salary increases. Professional fees also declined by $1.1 million and $2.8 million, respectively in the third quarter and first nine months of 2018 compared to the third quarter and first nine months of 2017.respectively.
| | | Amortization of Acquired Intangible Assets | Three months ended | | Nine months ended | Three months ended | | Nine months ended |
| | June 30, 2018 | | July 1, 2017 | | Percent
Change | | June 30, 2018 | | July 1, 2017 | | Percent
Change | As Reported ASC 606 | | ASC 605 | | As Reported ASC 605 | | ASC 605 | | As Reported ASC 606 | | ASC 605 | | As Reported ASC 605 | | ASC 605 |
| | (Dollar amounts in millions) | June 29, 2019 | | June 29, 2019 | | June 30, 2018 | | Percent
Change | | June 29, 2019 | | June 29, 2019 | | June 30, 2018 | | Percent
Change |
| | | (Dollar amounts in millions) |
| Amortization of acquired intangible assets | $ | 7.9 |
| | $ | 8.0 |
| | (2 | )% | | $ | 23.6 |
| | $ | 24.0 |
| | (2 | )% | $ | 5.9 |
| | $ | 5.9 |
| | $ | 7.9 |
| | (25 | )% | | $ | 17.8 |
| | $ | 17.8 |
| | $ | 23.6 |
| | (25 | )% |
| % of total revenue | 2 | % | | 3 | % | | | | 3 | % | | 3 | % | | | 2 | % | | 2 | % | | 2 | % | | | | 2 | % | | 2 | % | | 3 | % | | |
Amortization of acquired intangible assets reflects the amortization of acquired non-product related intangible assets, primarily customer and trademark-related intangible assets, recorded in connection
with completed acquisitions. The decrease in amortization of acquired intangible assets in the third quarter and first nine months of 20182019 compared to the third quarter and first nine months of 20172018 is due to certainsome assets being fully amortized as well as the impact of foreign currency exchange rates.
| | | Restructuring and Other Charges, Net | Three months ended | | Nine months ended | Three months ended | | Nine months ended |
| | June 30, 2018 | | July 1, 2017 | | June 30, 2018 | | July 1, 2017 | As Reported ASC 606 | | ASC 605 | | As Reported ASC 605 | | As Reported ASC 606 | | ASC 605 | | As Reported ASC 605 |
| | (in millions) | June 29, 2019 | | June 29, 2019 | | June 30, 2018 | | June 29, 2019 | | June 29, 2019 | | June 30, 2018 |
| | | (in millions) |
| Restructuring charges (credits), net | $ | (0.3 | ) | | $ | 1.6 |
| | $ | (1.0 | ) | | $ | 8.3 |
| $ | — |
| | $ | — |
| | $ | (0.3 | ) | | $ | 43.0 |
| | $ | 43.0 |
| | $ | (1.0 | ) |
| Headquarters relocation charges | 1.9 |
| | — |
| | 2.9 |
| | — |
| — |
| | — |
| | 1.9 |
| | 2.5 |
| | 2.5 |
| | 2.9 |
|
| Restructuring and Other Charges, Net | $ | 1.6 |
| | $ | 1.6 |
| | $ | 1.8 |
| | $ | 8.3 |
| $ | — |
| | $ | — |
| | $ | 1.6 |
| | $ | 45.5 |
| | $ | 45.5 |
| | $ | 1.8 |
|
In fiscal 2016, we committed to a plan to restructure our global workforce and consolidate select facilities to reduce our cost structure and to realign our investments with our identified growth opportunities. The actions have resulted in a total restructuring charge of $84.5 million and was substantially completed in 2017. We expect that the expense reductions will be offset by planned cost increases, investments in other areas of our business and the anticipated effects of foreign currency fluctuations, which effects are contemplated in our most recent financial targets for fiscal 2018. In the third quarter and first nine months of 2018, we recorded restructuring credits of $0.3 million and $1.0 million, respectively, primarily related to changes in estimated costs related to the closure of excess facilities. In the third quarter and first nine months of 2018, we made cash payments related to restructuring charges of $0.5 million and $2.5 million, respectively, compared to $6.4 million and $35.3 million in the third quarter and first nine months of 2017, respectively. At June 30, 2018, accrued restructuring totaled $2.7 million, of which we expect to pay $1.6 million within the next twelve months.
Headquarters relocation charges represent accelerated depreciation expense recorded in anticipation of exiting our current headquarters facility. InJanuary 2019 we will be moving into arelocated to our new worldwide headquarters in the Boston Seaport District, and we will be vacating our current headquarters space. Because our currentDistrict. Our prior headquarters lease will not expire until November 2022, and we are seeking to sublease that space. Further, if we are unable to sublease our current headquarters space, for an amount at least equal to our rent obligations under the current headquarters lease,but have not yet done so. As a result, we will bear overlapping rent obligations for those premises and will be requiredin the first nine months of 2019 we recorded a restructuring charge of $27.1 million associated with the restructuring of our prior headquarters. The facility restructuring charge is based on the net present value of remaining lease commitments net of estimated sublease income of $12 million. Restructuring charges and estimated cash outflows could increase if we are unable to record additionalsublease our prior headquarters as we expect.
The headquarters relocation charges include accelerated depreciation expense and double rent for January associated with exiting our prior headquarters facility and relocating to the Seaport.
In the first quarter of 2019, we initiated a restructuring plan to realign our workforce to shift investment to support Industrial Internet of Things and Augmented Reality strategic opportunities. As this was a realignment of resources rather than a cost-savings initiative, it did not result in significant cost savings. The restructuring plan was completed in the first quarter of 2019. In the first nine months of 2019 we recorded restructuring charges of $16 million related to any rent shortfall. A charge for such shortfall will be recorded in the earlier of the period that we cease using the existing space (which will likely occur in the second quarter of our fiscal 2019) or the period we exit the lease contract. Additionally, we will incur other costs associated with the move which will be recorded as incurred.
|
| | | | | | | | | | | | | |
| Interest Expense | Three months ended | | Nine months ended |
| | June 30, 2018 | | July 1, 2017 | | June 30, 2018 | | July 1, 2017 |
| | (in millions) |
| Interest expense | $ | (10.6 | ) | | $ | (10.2 | ) | | (31.1 | ) | | (32.2 | ) |
In March 2017 we modified our credit facility to decrease the loan commitment to $600 million from $900 million, which reduced interest expense in the third quarter and first nine months of 2018 compared2019, we made cash payments related to the third quarter and first nine monthsrestructuring charges of 2017 by $0.1$3.5 million and $1.7$21.4 million, respectively, duerespectively. At June 29, 2019, accrued restructuring totaled $28.8 million, of which we expect to pay $12.4 million within the write-off of deferred financing feesnext twelve months.
|
| | | | | | | | | | | | | | | | | | | | | | | |
| Interest Expense | Three months ended | | Nine months ended |
| | As Reported ASC 606 | | ASC 605 | | As Reported ASC 605 | | As Reported ASC 606 | | ASC 605 | | As Reported ASC 605 |
| | June 29, 2019 | | June 29, 2019 | | June 30, 2018 | | June 29, 2019 | | June 29, 2019 | | June 30, 2018 |
| | (in millions) |
| Interest expense | $ | (10.8 | ) | | $ | (10.8 | ) | | $ | (10.6 | ) | | $ | (32.5 | ) | | $ | (32.5 | ) | | $ | (31.1 | ) |
Interest expense includes interest under our credit facility and reduction of the associated commitment fees.senior notes. We had $698$703 million of total debt at June 30, 2018,29, 2019, compared to $718$648 million at July 1, 2017.June 30, 2018.
| | | Interest Income and Other Expense, net | Three months ended | | Nine months ended | |
| Other Income (Expense), net | | Three months ended | | Nine months ended |
| | | As Reported ASC 606 | | ASC 605 | | As Reported ASC 605 | | As Reported ASC 606 | | ASC 605 | | As Reported ASC 605 |
| | June 30, 2018 | | July 1, 2017 | | June 30, 2018 | | July 1, 2017 | June 29, 2019 | | June 29, 2019 | | June 30, 2018 | | June 29, 2019 | | June 29, 2019 | | June 30, 2018 |
| | (in millions) | (in millions) |
| Interest income | $ | 0.9 |
| | $ | 0.8 |
| | $ | 2.5 |
| | $ | 2.4 |
| $ | 1.0 |
| | $ | 1.0 |
| | $ | 0.9 |
| | $ | 2.9 |
| | $ | 2.9 |
| | $ | 2.5 |
|
| Other expense, net | (2.0 | ) | | (1.2 | ) | | (5.0 | ) | | (0.4 | ) | 0.1 |
| | (0.2 | ) | | (1.8 | ) | | (0.4 | ) | | (0.5 | ) | | (4.5 | ) |
| Total interest income and other expense, net | $ | (1.1 | ) | | $ | (0.4 | ) | | $ | (2.5 | ) | | $ | 2.0 |
| |
| Other income (expense), net | | $ | 1.0 |
| | $ | 0.7 |
| | $ | (0.9 | ) | | $ | 2.5 |
| | $ | 2.3 |
| | $ | (2.0 | ) |
InterestOther income and other expense,(expense), net includes interest income, foreign currency net losses and other non-operating gains and losses. Foreign currency net losses include costs of forward contracts, certain realized and unrealized foreign currency transaction gains or losses, and foreign exchange gains or losses resulting from the required period-end currency re-measurement of the assets and liabilities of our
subsidiaries that use the U.S. Dollar as their functional currency. We use foreign currency forward contracts to reduce our exposure to fluctuations in foreign currency exchange rates.
| | Income Taxes | Three months ended | | Nine months ended | Three months ended | | Nine months ended |
| | June 30, 2018 | | July 1, 2017 | | June 30, 2018 | | July 1, 2017 | As Reported ASC 606 | | ASC 605 | | As Reported ASC 605 | | As Reported ASC 606 | | ASC 605 | | As Reported ASC 605 |
| | (Dollar amounts in millions) | June 29, 2019 | | June 29, 2019 | | June 30, 2018 | | June 29, 2019 | | June 29, 2019 | | June 30, 2018 |
| Pre-tax income (loss) | $ | 10.0 |
| | $ | 0.7 |
| | $ | 28.0 |
| | $ | (6.9 | ) | |
| Tax provision (benefit) | (7.0 | ) | | 1.7 |
| | (10.8 | ) | | 4.3 |
| |
| | | (Dollar amounts in millions) |
| Income (loss) before income taxes | | $ | (0.5 | ) | | $ | 22.3 |
| | $ | 10.0 |
| | $ | (13.5 | ) | | $ | 33.9 |
| | $ | 28.0 |
|
| Provision (benefit) for income taxes | | 14.3 |
| | 10.6 |
| | (7.0 | ) | | 23.8 |
| | 14.9 |
| | (10.8 | ) |
| Effective income tax rate | (70 | )% | | 236 | % | | (39 | )% | | (63 | )% | (2,940 | )% | | 47 | % | | (70 | )% | | (177 | )% | | 44 | % | | (39 | )% |
In the first nine months of 20182019 and 2017,2018, our effective tax rate was lower thandiffered from the statutory federal income tax rates (21% and 35%, respectively)rate of 21% due to U.S. tax reform as(as described below, andbelow), our corporate structure in which our foreign taxes are at a net effective tax rate lower than the U.S. rate.rate, the excess tax benefit related to stock-based compensation and, in the first quarter of 2019, the reduction of a valuation allowance of $1.8 million as the result of the Frustum acquisition. Additionally, ASC 606 includes indirect effects of the adoption at the beginning of the first quarter of fiscal 2019. A significant amount of our foreign earnings is generated by our subsidiaries organized in Ireland. In 20182019 and 2017,2018, the foreign rate differential predominantly relates to these Irish earnings. Our foreign rate differential in 2018 and 2017 includes the continuing rate benefit from a business realignment completed on September 30, 2014 in which intellectual property was transferred between two wholly-owned foreign subsidiaries. For the first nine months of 2018 and 2017, this realignment resulted in tax benefits of approximately $9 million and $21 million, respectively.
On December 22, 2017, the United States enacted tax reform legislation through the Tax Cuts and Jobs Act, (the "Tax Act"), which significantly changed existing U.S. tax laws by a reduction of the corporate tax rate, the implementation of a new system of taxation for non-U.S. earnings, the imposition of a one-time tax on the deemed repatriation of undistributed earnings of non-U.S. subsidiaries, and by the expansion of the limitations on the deductibility of executive compensation and interest expense. As we have a September 30 fiscal year-end, the impact of the Tax Act results inthere is a blended U.S. statutory federal rate of approximately 24.5% for our fiscal year ending September 30, 2018 and 21% for subsequent fiscal years. The Tax Act also provides that net operating losses generated in years ending after December 31, 2017 willmay be carried forward indefinitely and can no longer be carried back, and that net operating losses generated in years beginning after December 31, 2017 can only reduce taxable income by up to 80% when utilized in a future period. The Tax Act includes a provision to tax global intangible low-tax income (GILTI) of foreign subsidiaries and a base erosion anti-abuse tax (BEAT) measure that taxes certain payments between a U.S. corporation and its foreign subsidiaries. The GILTI and BEAT provisions were effective for us beginning October 1, 2018. Our accounting policy is to treat tax on GILTI as a current period cost included in tax expense in the year incurred.
We estimateIn the first nine months of 2018, we provided no federal income taxes payable as a result of the deemed repatriation of undistributed earnings as we estimate that the tax will bewas offset by a combination of current year losses and existing attributes which had a full valuation allowance recorded against the related deferred tax assets. In the third quarter we reduced our estimate forWe recorded state income taxes payable by $5.4of $1.7 million to reflect additional guidance on the state implications of the Tax Act. In the first nine months of 2018, we have recorded a reasonable estimate of state income taxes payable on the deemed repatriation of $1.7 million.repatriation. We also recorded a deferred tax benefit of $14.1 million as a reasonable estimate offor the impact of the Tax Act on our net U.S. deferred income tax balances. This was primarily attributable to the reduction of the federal tax rate on the net deferred tax liability in the U.S., and the ability to realize net operating losses from the reversal of existing deferred tax assets which can now be carried forward indefinitely and can therefore be netted against deferred tax liabilities for indefinite lived intangible assets.
We are continuing to assess the effects of the Tax Act on our indefinite reinvestment assertion and the realizability of our U.S. deferred tax assets. We are not able to make reasonable estimates at this time of the effects of certain provisions of the Tax Act that will apply to us beginning in our fiscal year ending September 30, 2019, including the Global Intangible Low Tax Income tax (the "GILTI" tax).
The changes included in the Tax Act are broad and complex. The final transition impacts of the Tax Act may differ from the above estimates, possibly materially, due to, among other things, changes in interpretations of the Tax Act, any legislative action to address questions that arise because of the Tax Act, actions taken by U.S. state governments and taxing authorities in response to the Tax Act, any changes in accounting standards for income taxes or related interpretations in response to the Tax Act, or
any updates or changes to estimates we have utilized to calculate the transition impacts, including impacts from changes to current year earnings estimates and foreign currency exchange rates of foreign subsidiaries. The U.S. Securities and Exchange Commission has issued rules that allow for a measurement period of up to one year after the enactment date of the Tax Act to finalize the recording of the related tax impacts. We currently anticipate finalizingfinalized recording the impacts of the Tax Act in the quarter ended December 29, 2018 and recordingdid not record any resulting adjustments bysignificant adjustments.
In October 2016, the endFinancial Accounting Standards Board (FASB) issued Accounting Standards Update (ASU) 2016-16, Income Taxes (Topic 740): Intra-Entity Transfers of Assets Other Than Inventory. The purpose of ASU 2016-16 is to simplify the income tax accounting of an intra-entity transfer of an asset other than inventory and to record its effect when the transfer occurs. We adopted this amendment beginning in the first quarter of 2019 using the modified retrospective method with a cumulate effect adjustment to accumulated deficit of $72.3 million, with a corresponding increase of $75.3 million to deferred tax assets, a $6.0 million decrease to income tax assets and a $3.0 million decrease to income tax liabilities. The
adjustment primarily relates to deductible amortization of intangible assets in Ireland. Post adoption, our current fiscal year ending September 30, 2018.effective tax rate no longer includes the benefit of this amortization.
We have concluded, based on the weight of available evidence, that a full valuation allowance continues to be required against our U.S. net deferred tax assets as they are not more likely than not to be realized in the future. We will continue to reassess our valuation allowance requirements each financial reporting period. However, we believe that there is a reasonable possibility that within the next 12 months, sufficient positive evidence may become available to allow us to reach a conclusion that a significant portion of the valuation allowance will no longer be needed. Release of the valuation allowance would result in the recognition of certain deferred tax assets and a decrease to income tax expense for the period the release is recorded. However, the exact timing and amount of any valuation allowance release are subject to change on the basis of the level of profitability that we are able to actually achieve.
In the normal course of business, PTC and its subsidiaries are examined by various taxing authorities, including the Internal Revenue Service in the U.S. We regularly assess the likelihood of additional assessments by tax authorities and provide for these matters as appropriate. We are currently under audit by tax authorities in several jurisdictions. Audits by tax authorities typically involve examination of the deductibility of certain permanent items, limitations on net operating losses and tax credits. Although we believe our tax estimates are appropriate, the final determination of tax audits and any related litigation could result in material changes in our estimates.
In the fourth quarter of 2016, we received an assessment of approximately $12 million from the tax authorities in South Korea. The assessment relates to various tax issues, but primarily to foreign withholding taxes. We have appealed and intend to vigorously defend our positions. We believe that upon completion of a multi-level appeal process it is more likely than not that our positions will be sustained. Accordingly, we have not recorded a tax reserve for this matter. We paid this assessment in the first quarter of 2017 and have recorded the amount in other assets, pending resolution of the appeal process.
In July 2015, the U.S. Tax Court issued an opinion in Altera Corp. v. Commissioner related to the treatment of stock-based compensation expense in an intercompany cost-sharing arrangement. The opinion invalidated part of a treasury regulation requiring stock-based compensation to be included in any qualified intercompany cost-sharing arrangement. The Company previously recorded a tax benefit based on the opinion in the case, which was offset by a corresponding increase in the valuation allowance against U.S. deferred tax assets. On June 7, 2019, the U.S. Court of Appeals for the Ninth Circuit reversed the U.S. Tax Court’s decision. On July 22, 2019, Altera Corp. filed a petition for an en banc rehearing before the U.S. Court of Appeals for the Ninth Circuit. This petition is still pending at this time. Due to the fact that the Altera decision is not yet final, as well as uncertainty surrounding the status of the current regulations and questions related to jurisdiction given the Company does not reside in the Ninth Circuit, we have determined no adjustment is required to the consolidated financial statements as a result of this ruling. The Company will continue to monitor ongoing developments and potential impacts to its consolidated financial statements.
Operating Measures
Subscription Bookings and Subscription ACV
Given the difference in revenue recognition between the sale of a perpetual software license (revenue is recognized at the time of sale) and a subscription, (revenue is recognized ratably over the subscription term), we use bookings for internal planning, forecasting and reporting of new license and subscription sales and cloud services transactions.transaction (as subscription bookings includes cloud services bookings).
In order to normalize between perpetual and subscription licenses, we define subscription bookings as the subscription annualized contract value (subscription ACV) of new subscription bookingscontracts multiplied by a conversion factor of 2. We arrived at the conversion factor of 2 by considering manya number of variables, including pricing, support, length of term, and renewal rates. In 20172018 and for the third quarter and first nine months of 2018,2017, the average subscription contract term for new subscription contracts was approximately two years.
We define subscription ACV as the total value of a new subscription bookingcontract (which may include annual values that increase over time and without regard to contractual termination options) divided by the term of the contract (in days), multiplied by 365. If the term of the subscription contract is less than a year, and is not associated with an existing contract, the ACVbooking is equal to the total contract value. Beginning in the third quarter of 2018, minimum ACV commitments under our Strategic Alliance Agreement with Rockwell Automation are included in subscription ACV if the period-to-date minimum ACV commitment exceeds actual ACV sold under the Agreement.
We define license and subscription bookings as subscription bookings plus perpetual license bookings plus any monthly software rental bookings during the period.bookings.
Because subscription bookings is a metric we use to approximate the value of subscription sales if sold as perpetual licenses, it does not represent the actual revenue that will be recognized with respect to subscription sales or that would be recognized if the sales had beenwere perpetual licenses.licenses, nor does the annualized value of monthly software rental bookings represent the value of any such booking.
Annualized Recurring Revenue (ARR)
Annualized Recurring Revenue (ARR) for a given quarter is calculated by dividing the portion of ASC 605 non-GAAP software revenue attributable to subscription and support software revenue for the quarter by the number of days in the quarter and multiplying by 365. ARR should be viewed independently of revenue and deferred revenue as it is an operating measure and is not intended to be combined with or to replace either of those items. ARR is not a forecast and does not include perpetual license or professional services revenues.
Non-GAAP Financial Measures
The non-GAAP financial measures presented in the discussion of our results of operations and the respective most directly comparable GAAP measures are:
non-GAAP revenue—GAAP revenue
non-GAAP gross margin—GAAP gross margin
non-GAAP operating income—GAAP operating income
non-GAAP operating margin—GAAP operating margin
non-GAAP net income—GAAP net income
non-GAAP diluted earnings or loss per share—GAAP diluted earnings or loss per share
The non-GAAP financial measures exclude fair value adjustments related to acquired deferred revenue and deferred costs, stock-based compensation expense, amortization of acquired intangible assets, expense, acquisition-related charges, restructuring and headquarters relocation charges, pension plan termination-related costs, non-operating credit facility refinancing costs, identified discrete charges included in non-operating other expense, net and the related tax effects of the preceding items, and any other identified tax items.
These items are normally included in the comparable measures calculated and presented in accordance with GAAP. Our management excludes these items when evaluating our ongoing performance and/or predicting our earnings trends, and therefore excludes them from our non-GAAP financial measures. Management uses, and investorsInvestors should consider non-GAAP measures only in conjunction with our GAAP results.
Fair value of acquired deferred revenue is a purchase accounting adjustment recorded to reduce acquired deferred revenue to the fair value of the remaining obligation, so our GAAP revenue for the periods after an acquisition do not reflect the full amount of revenue that would have been reported if the acquired deferred revenue was not written down to fair value. We believe excluding these adjustments to revenue from these contracts (and associated costs in fair value adjustment toof acquired deferred services costcosts) is useful to investors as an additional means to assess revenue trends of our business.
Stock-based compensation is a non-cash expense relating to stock-based awards issued to executive officers, employees and outside directors and to our employee stock purchase program. We exclude this expense as it is a non-cash expense and we assess our internal operations excluding this expense and believe it facilitates comparisons to the performance of other companies in our industry.
Amortization of acquired intangible assets is a non-cash expense that is impacted by the timing and magnitude of our acquisitions. We believe the assessment of our operations excluding these costs is relevant to our assessment of internal operations and comparisons to the performance of other companies in our industry.
Acquisition-related and other transactional charges included in general and administrative costs aredirect costs of potential and completed acquisitions and expenses related to acquisition integration activities, including transaction fees, due diligence costs, severance and professional fees. Subsequent adjustments to our initial estimated amount of contingent consideration associated with specific acquisitions are also included within acquisition-related charges. Other transactional charges include
third-party costs related to structuring unusual transactions. We do not include these costs when reviewing our operating results internally. The occurrence and amount of these costs will vary depending on the timing and size of acquisitions.
Restructuring and other charges, net include excess facility restructuring charges, headquarters relocation charges and severance costs resulting from reductions of personnel driven by modifications to our business strategy. We do not include these costs when reviewing our operating results internally. These costs may vary in size based on our restructuring plan.
Headquarters relocation charges include are non-cash accelerated depreciation expense recorded in anticipation of exiting our current headquarters facility due to changes in the estimated useful lives of fixed assets. We do not include these costs when reviewing our operating results internally. These costs may vary in size based on our restructuring plan.
Income tax adjustments include the tax impact of the items above and assumes that we are profitable on a non-GAAP basis in the U.S. and one foreign jurisdiction. It also eliminates the effect of the valuation
allowance recorded against our net deferred tax assets in those jurisdictions. Additionally, we exclude other material tax items that we do not include when reviewing our operating results internally.
We use these non-GAAP measures, and we believe that they assist our investors, to make period-to-period comparisons of our operational performance because they provide a view of our operating results without items that are not, in our view, indicative of our core operating results. We believe that these non-GAAP measures help illustrate underlying trends in our business, and we use the measures to establish budgets and operational goals (communicated internally and externally) for managing our business and evaluating our performance. We believe that providing non-GAAP measures also affords investors a view of our operating results that may be more easily compared to the results of other companies in our industry that use similar financial measures to supplement their GAAP results.
The items excluded from the non-GAAP measures often have a material impact on our financial results and many of such items recur. Accordingly, the non-GAAP measures included in this Quarterly Report should be considered in addition to, and not as a substitute for or superior to, the comparable measures prepared in accordance with GAAP. The following tables reconcile each of these non-GAAP measures to its most closely comparable GAAP measure on our financial statements.
| | | | | | | | | | | | Three months ended | | Nine months ended |
| | Three months ended | | Nine months ended | As Reported ASC 606 | | ASC 605 | | As Reported ASC 605 | | As Reported ASC 606 | | ASC 605 | | As Reported ASC 605 |
| | June 30, 2018 | | July 1, 2017 | | June 30, 2018 | | July 1, 2017 | June 29, 2019 | | June 29, 2019 | | June 30, 2018 | | June 29, 2019 | | June 29, 2019 | | June 30, 2018 |
| | (in millions, except per share amounts) | (in millions, except per share amounts) |
| GAAP revenue | $ | 314.8 |
| | $ | 291.3 |
| | $ | 929.3 |
| | $ | 857.7 |
| $ | 295.5 |
| | $ | 322.4 |
| | $ | 314.8 |
| | $ | 920.6 |
| | $ | 976.7 |
| | $ | 929.3 |
|
| Fair value of acquired deferred revenue | 0.3 |
| | 0.6 |
| | 1.0 |
| | 2.2 |
| 0.1 |
| | 0.1 |
| | 0.3 |
| | 0.6 |
| | 0.6 |
| | 1.0 |
|
| Non-GAAP revenue | $ | 315.1 |
| | $ | 291.9 |
| | $ | 930.3 |
| | $ | 859.9 |
| $ | 295.6 |
| | $ | 322.5 |
| | $ | 315.1 |
| | $ | 921.2 |
| | $ | 977.3 |
| | $ | 930.3 |
|
| | | | | | | | | | | | | | | | | | | |
| GAAP gross margin | $ | 233.2 |
| | $ | 209.0 |
| | $ | 681.2 |
| | $ | 611.4 |
| $ | 212.8 |
| | $ | 241.2 |
| | $ | 233.1 |
| | $ | 680.7 |
| | $ | 742.3 |
| | $ | 680.9 |
|
| Fair value of acquired deferred revenue | 0.3 |
| | 0.6 |
| | 1.0 |
| | 2.2 |
| |
| Fair value of acquired deferred costs | (0.1 | ) | | (0.1 | ) | | (0.3 | ) | | (0.3 | ) | |
| Fair value of acquired deferred revenue and costs | | 0.1 |
| | 0.1 |
| | 0.2 |
| | 0.4 |
| | 0.4 |
| | 0.7 |
|
| Stock-based compensation | 2.4 |
| | 3.0 |
| | 8.1 |
| | 9.1 |
| 2.6 |
| | 2.6 |
| | 2.4 |
| | 8.8 |
| | 8.8 |
| | 8.1 |
|
| Amortization of acquired intangible assets included in cost of revenue | 6.8 |
| | 6.5 |
| | 20.0 |
| | 19.3 |
| 6.9 |
| | 6.9 |
| | 6.8 |
| | 20.4 |
| | 20.4 |
| | 20.0 |
|
| Non-GAAP gross margin | $ | 242.6 |
| | $ | 219.1 |
| | $ | 710.0 |
| | $ | 641.7 |
| $ | 222.3 |
| | $ | 250.7 |
| | $ | 242.6 |
| | $ | 710.3 |
| | $ | 771.9 |
| | $ | 709.7 |
|
| | | | | | | | | | | | | | | | | | | |
| GAAP operating income | $ | 21.7 |
| | $ | 11.3 |
| | $ | 61.5 |
| | $ | 23.3 |
| $ | 9.3 |
| | $ | 32.4 |
| | $ | 21.5 |
| | $ | 16.5 |
| | $ | 64.0 |
| | $ | 61.1 |
|
| Fair value of acquired deferred revenue | 0.3 |
| | 0.6 |
| | 1.0 |
| | 2.2 |
| |
| Fair value of acquired deferred costs | (0.1 | ) | | (0.1 | ) | | (0.3 | ) | | (0.3 | ) | |
| Fair value of acquired deferred revenue and costs | | 0.1 |
| | 0.1 |
| | 0.2 |
| | 0.4 |
| | 0.4 |
| | 0.7 |
|
| Stock-based compensation | 16.7 |
| | 16.6 |
| | 52.0 |
| | 56.1 |
| 15.2 |
| | 15.2 |
| | 16.7 |
| | 71.6 |
| | 71.6 |
| | 52.0 |
|
| Amortization of acquired intangible assets included in cost of revenue | 6.8 |
| | 6.5 |
| | 20.0 |
| | 19.3 |
| 6.9 |
| | 6.9 |
| | 6.8 |
| | 20.4 |
| | 20.4 |
| | 20.0 |
|
| Amortization of acquired intangible assets | 7.9 |
| | 8.0 |
| | 23.6 |
| | 24.0 |
| 5.9 |
| | 5.9 |
| | 7.9 |
| | 17.8 |
| | 17.8 |
| | 23.6 |
|
| Acquisition-related and other transactional charges included in general and administrative expenses | 1.6 |
| | 0.3 |
| | 1.7 |
| | 1.0 |
| 0.4 |
| | 0.4 |
| | 1.6 |
| | 1.2 |
| | 1.2 |
| | 1.7 |
|
| U.S. pension plan termination-related costs | — |
| | 0.3 |
| | — |
| | 0.3 |
| |
| Headquarters relocation charges | 1.9 |
|
| — |
|
| 2.9 |
|
| — |
| |
| Restructuring charges, net | (0.3 | ) | | 1.6 |
| | (1.0 | ) | | 8.3 |
| |
| Restructuring and other charges, net | | — |
| | — |
| | 1.6 |
| | 45.5 |
| | 45.5 |
| | 1.8 |
|
| Non-GAAP operating income | $ | 56.4 |
| | $ | 44.9 |
| | $ | 161.4 |
| | $ | 134.2 |
| $ | 37.8 |
| | $ | 60.9 |
| | $ | 56.3 |
| | $ | 173.4 |
| | $ | 220.9 |
| | $ | 160.9 |
|
| | | | | | | | | | | | | | | | | | | |
| GAAP net income (loss) | $ | 17.0 |
| | $ | (1.0 | ) | | $ | 38.8 |
| | $ | (11.2 | ) | |
| Fair value of acquired deferred revenue | 0.3 |
| | 0.6 |
| | 1.0 |
| | 2.2 |
| |
| Fair value of acquired deferred costs | (0.1 | ) | | (0.1 | ) | | (0.3 | ) | | (0.3 | ) | |
| GAAP net income | | $ | (14.8 | ) | | $ | 11.7 |
| | $ | 17.0 |
| | $ | (37.3 | ) | | $ | 18.9 |
| | $ | 38.8 |
|
| Fair value of acquired deferred revenue and costs | | 0.1 |
| | 0.1 |
| | 0.2 |
| | 0.4 |
| | 0.4 |
| | 0.7 |
|
| Stock-based compensation | 16.7 |
| | 16.6 |
| | 52.0 |
| | 56.1 |
| 15.2 |
| | 15.2 |
| | 16.7 |
| | 71.6 |
| | 71.6 |
| | 52.0 |
|
| Amortization of acquired intangible assets included in cost of revenue | 6.8 |
| | 6.5 |
| | 20.0 |
| | 19.3 |
| 6.9 |
| | 6.9 |
| | 6.8 |
| | 20.4 |
| | 20.4 |
| | 20.0 |
|
| Amortization of acquired intangible assets | 7.9 |
| | 8.0 |
| | 23.6 |
| | 24.0 |
| 5.9 |
| | 5.9 |
| | 7.9 |
| | 17.8 |
| | 17.8 |
| | 23.6 |
|
| Acquisition-related and other transactional charges included in general and administrative expenses | 1.6 |
| | 0.3 |
| | 1.7 |
| | 1.0 |
| 0.4 |
| | 0.4 |
| | 1.6 |
| | 1.2 |
| | 1.2 |
| | 1.7 |
|
| U.S. pension plan termination-related costs | — |
| | 0.3 |
| | — |
| | 0.3 |
| |
| Headquarters relocation charges | 1.9 |
| | — |
| | 2.9 |
| | — |
| |
| Restructuring charges, net | (0.3 | ) | | 1.6 |
| | (1.0 | ) | | 8.3 |
| |
| Non-operating credit facility refinancing costs | — |
| | — |
| | — |
| | 1.2 |
| |
| Restructuring and other charges, net | | — |
| | — |
| | 1.6 |
| | 45.5 |
| | 45.5 |
| | 1.8 |
|
Income tax adjustments (1) | (9.7 | ) | | (0.2 | ) | | (20.7 | ) | | (2.8 | ) | 13.1 |
| | 1.7 |
| | (9.7 | ) | | 0.4 |
| | (20.9 | ) | | (20.7 | ) |
| Non-GAAP net income | $ | 42.1 |
| | $ | 32.6 |
| | $ | 117.9 |
| | $ | 98.0 |
| $ | 26.9 |
| | $ | 41.9 |
| | $ | 42.1 |
| | $ | 120.0 |
| | $ | 155.0 |
| | $ | 117.9 |
|
| | | | | | | | | | | | | | | | | | | |
| GAAP diluted earnings (loss) per share | $ | 0.14 |
| | $ | (0.01 | ) | | $ | 0.33 |
| | $ | (0.10 | ) | |
| Fair value of acquired deferred revenue | — |
| | 0.01 |
| | 0.01 |
| | 0.02 |
| |
| GAAP diluted earnings per share | | $ | (0.13 | ) | | $ | 0.10 |
| | $ | 0.14 |
| | $ | (0.32 | ) | | $ | 0.16 |
| | $ | 0.33 |
|
| Fair value of acquired deferred revenue and costs | | — |
| | — |
| | — |
| | 0.01 |
| | 0.01 |
| | 0.01 |
|
| Stock-based compensation | 0.14 |
| | 0.14 |
| | 0.44 |
| | 0.48 |
| 0.13 |
| | 0.13 |
| | 0.14 |
| | 0.60 |
| | 0.60 |
| | 0.44 |
|
| Amortization of acquired intangible assets | 0.12 |
| | 0.12 |
| | 0.37 |
| | 0.37 |
| 0.11 |
| | 0.11 |
| | 0.12 |
| | 0.32 |
| | 0.32 |
| | 0.37 |
|
| Acquisition-related and other transactional charges included in general and administrative expenses | 0.01 |
| | — |
| | 0.01 |
| | 0.01 |
| — |
| | — |
| | 0.01 |
| | 0.01 |
| | 0.01 |
| | 0.01 |
|
| Headquarters relocation charges | 0.02 |
| | — |
| | 0.02 |
| | — |
| |
| Restructuring charges, net | — |
| | 0.01 |
| | (0.01 | ) | | 0.07 |
| |
| Non-operating credit facility refinancing costs | — |
| | — |
| | — |
| | 0.01 |
| |
| Restructuring and other charges, net | | — |
| | — |
| | 0.02 |
| | 0.38 |
| | 0.38 |
| | 0.01 |
|
Income tax adjustments (1) | (0.08 | ) | | — |
| | (0.18 | ) | | (0.02 | ) | 0.11 |
| | 0.01 |
| | (0.08 | ) | | — |
| | (0.18 | ) | | (0.18 | ) |
| Non-GAAP diluted earnings per share | $ | 0.36 |
| | $ | 0.28 |
| | $ | 1.00 |
| | $ | 0.84 |
| $ | 0.23 |
| | $ | 0.36 |
| | $ | 0.36 |
| | $ | 1.01 |
| | $ | 1.31 |
| | $ | 1.00 |
|
Operating margin impact of non-GAAP adjustments:
|
| | | | | | | | | | | |
| | Three months ended | | Nine months ended |
| | June 30, 2018 | | July 1, 2017 | | June 30, 2018 | | July 1, 2017 |
| GAAP operating margin | 6.9 | % | | 3.9 | % | | 6.6 | % | | 2.7 | % |
| Fair value of acquired deferred revenue | 0.1 | % | | 0.2 | % | | 0.1 | % | | 0.3 | % |
| Stock-based compensation | 5.3 | % | | 5.7 | % | | 5.6 | % | | 6.5 | % |
| Amortization of acquired intangible assets | 4.7 | % | | 5.0 | % | | 4.7 | % | | 5.0 | % |
| Acquisition-related and other transactional charges included in general and administrative expenses | 0.5 | % | | 0.1 | % | | 0.2 | % | | 0.1 | % |
| U.S. pension plan termination-related costs | — | % | | 0.1 | % | | — | % | | — | % |
| Headquarters relocation charges | 0.6 | % | | — | % | | 0.3 | % | | — | % |
| Restructuring charges, net | (0.1 | )% | | 0.5 | % | | (0.1 | )% | | 1.0 | % |
| Non-GAAP operating margin | 17.9 | % | | 15.4 | % | | 17.3 | % | | 15.6 | % |
| |
| (1) | We have recorded a full valuation allowance against our U.S. net deferred tax assets and a valuation allowance against net deferred tax assets in certain foreign jurisdictions.assets. As we are profitable on a non-GAAP basis, the 20182019 and 20172018 non-GAAP tax provisions are calculated assuming there is no valuation allowance. Income tax adjustments reflect the tax effects of non-GAAP adjustments, which are calculated by applying the applicable tax rate by jurisdiction to the non-GAAP adjustments listed above. We recorded the impact of the Tax Cuts and Jobs Act in our first quarter 2018 GAAP earnings, resulting in a non-cash benefit of approximately $7 million. In the third quarter of 2018, we increased the non-cash benefit by approximately $5 million to reflect additional guidance on the state tax implications of the act. We have excluded these benefits from our non-GAAP results. |
jurisdiction to the non-GAAP adjustments listed above. We recorded the impact of the Tax Cuts and Jobs Act in our Q1 2018 earnings, resulting in a non-cash benefit of approximately $7 million. In the third quarter of 2018, we increased the non-cash benefit by approximately $5 million to reflect the additional guidance on the state tax implications of the act. We have excluded this benefit from our non-GAAP results.
Operating margin impact of non-GAAP adjustments: |
| | | | | | | | | | | | | | | | | |
| | Three months ended | | Nine months ended |
| | As Reported ASC 606 | | ASC 605 | | As Reported ASC 605 | | As Reported ASC 606 | | ASC 605 | | As Reported ASC 605 |
| | June 29, 2019 | | June 29, 2019 | | June 30, 2018 | | June 29, 2019 | | June 29, 2019 | | June 30, 2018 |
| GAAP operating margin | 3.1 | % | | 10.0 | % | | 6.8 | % | | 1.8 | % | | 6.6 | % | | 6.6 | % |
| Fair value of acquired deferred revenue and costs | — | % | | — | % | | 0.1 | % | | 0.1 | % | | 0.1 | % | | 0.1 | % |
| Stock-based compensation | 5.2 | % | | 4.7 | % | | 5.3 | % | | 7.8 | % | | 7.3 | % | | 5.6 | % |
| Amortization of acquired intangible assets | 4.3 | % | | 4.0 | % | | 4.7 | % | | 4.2 | % | | 3.9 | % | | 4.7 | % |
| Acquisition-related and other transactional charges included in general and administrative expenses | 0.1 | % | | 0.1 | % | | 0.5 | % | | 0.1 | % | | 0.1 | % | | 0.2 | % |
| Restructuring and other charges, net | — | % | | — | % | | 0.5 | % | | 5.0 | % | | 4.7 | % | | 0.2 | % |
| Non-GAAP operating margin | 12.8 | % | | 18.9 | % | | 17.9 | % | | 18.8 | % | | 22.6 | % | | 17.3 | % |
Critical Accounting Policies and Estimates
On October 1, 2018, we adopted ASU No. 2014-09, Revenue from Contracts with Customers: Topic 606 (ASC 606). Refer to Note 1. Basis of Presentation and Note 2. Revenue from Contracts with Customers to the Condensed Consolidated Financial Statements of this Quarterly Report on Form 10-Q for estimates related to our adoption of ASC 606. The financial information included in Item 1 reflects no other material changes in our critical accounting policies and estimates as set forth under the heading Critical Accounting Policies and Estimates in Part II, Item 7: Management’s Discussion and Analysis of Financial Condition and Results of Operations of our 20172018 Annual Report on Form 10-K.
Recent Accounting Pronouncements
In accordance with recently issued accounting pronouncements, we will be required to comply with certain changes in accounting rules and regulations, some of which are expected to have a material impact on our consolidated financial statements. Refer to Note 1. Basis of Presentation to the Condensed Consolidated Financial Statements inof this Quarterly Report on Form 10-Q for all recently issued accounting pronouncements, which is incorporated herein by reference.
Liquidity and Capital Resources | | | | June 30, 2018 | | July 1, 2017 | June 29, 2019 | | June 30, 2018 |
| | (in thousands) | (in thousands) |
| Cash and cash equivalents | $ | 266,552 |
| | $ | 260,695 |
| $ | 267,862 |
| | $ | 266,552 |
|
| Restricted cash | | 1,120 |
| | 1,677 |
|
| Short- and long-term marketable securities | 54,172 |
| | 50,189 |
| 54,626 |
| | 54,172 |
|
| Total | $ | 320,724 |
| | $ | 310,884 |
| $ | 323,608 |
| | $ | 322,401 |
|
| | | | | | | |
| | Nine months ended | Nine months ended |
| | June 30, 2018 | | July 1, 2017 | June 29, 2019 | | June 30, 2018 |
| | (in thousands) | (in thousands) |
| Cash provided by operating activities | $ | 185,322 |
| | $ | 102,463 |
| $ | 229,929 |
| | $ | 185,792 |
|
| Cash used by investing activities | (30,089 | ) | | (9,808 | ) | (147,580 | ) | | (30,089 | ) |
| Cash used by financing activities | (165,075 | ) | | (108,498 | ) | (76,603 | ) | | (165,075 | ) |
Cash, and cash equivalents and restricted cash
We invest our cash with highly rated financial institutions and in diversified domestic and international money market mutual funds. Cash and cash equivalents include highly liquid investments with original maturities of three months or less. In addition, we hold investments in marketable securities totaling approximately $54$55 million with an average maturity of 1511 months. At June 30, 2018,29, 2019, cash and cash equivalents totaled $267$268 million, compared to $280$260 million at September 30, 2017, reflective of $1852018, reflecting $230 million in operating cash flows, $55 million in net borrowings under our credit facility and $7.5$4 million from the issuance of common stock, under our Employee Stock Purchase Plan, offset by $100$90 million used for repurchases of common stock, $87 million used for acquisitions, $60 million used to repurchase common stock, $45acquire capital assets, and $44 million used to pay withholding taxes on stock-based awards that vested in the period, $20 million of net repayments made under our credit facility, $19 million used to acquire capital assets, $8 million used to pay contingent consideration, $6 million used to purchase businesses and intangible assets and $5 million used to purchase investments and marketable securities..
A significant portion of our cash is generated and held outside the U.S. At June 30, 2018,29, 2019, we had cash and cash equivalents of $17$25 million in the U.S., $97$79 million in Europe, $123$134 million in Asia Pacific (including India), and $29$30 million in other non-U.S. countries. All the marketable securities are held in Europe. We have substantial cash requirements in the United States, but we believe that the combination of our existing U.S. cash and cash equivalents, marketable securities, our ability to repatriate cash to the U.S. more cost effectively with the recent U.S. tax law changes, future U.S. operating cash flows and cash available under our credit facility, will be sufficient to meet our ongoing U.S. operating expenses and known capital requirements.
Cash provided by operating activities
Cash provided by operating activities was $185$230 million in the first nine months of 2019, compared to $186 million in the first nine months of 2018. Cash from operations for the first nine months of 2019 includes $21 million of restructuring payments compared to $2 million in the year-ago period. The increase in cash from operations in the first nine months of 2019 over the same period in 2018 is primarily due to higher accounts receivable collections and lower accounts payable payments during the period, offset by an increase in restructuring payments of $19 million.
Net loss for the first nine months of 2019 was $37 million compared to $102net income of $39 million for the first nine months of 2018.
Cash used in investing activities |
| | | | | | | |
| | Nine months ended |
| | June 29, 2019 | | June 30, 2018 |
| | (in thousands) |
| Cash used in investing activities included the following: | | | |
| Additions to property and equipment | $ | (59,579 | ) | | $ | (18,666 | ) |
| Acquisitions of businesses, net of cash acquired | (86,737 | ) | | (3,000 | ) |
| Purchase of intangible asset | — |
| | (3,000 | ) |
| Purchases of short- and long-term marketable securities | (18,950 | ) | | (18,063 | ) |
| Proceeds from maturities of short- and long-term marketable securities | 20,677 |
| | 13,640 |
|
| Purchases of investments | (7,500 | ) | | (1,000 | ) |
| Settlement of net investment hedges | 4,509 |
| | — |
|
| | $ | (147,580 | ) | | $ | (30,089 | ) |
The increase in property, plant and equipment payments in the first nine months of 2017. The increase2019 is primarily dueattributable to higher collections of accounts receivable, lower restructuring payments (down $33 million year over year), and the $12 million paymentcapitalized expenditures related to the Korean tax audit madeconstruction of our new worldwide headquarters in the first quarterBoston Seaport District (a portion of 2017.
Net income for the first nine months of 2018 was $39 million compared to a net loss for the first nine months of 2017 of $11 million.
Cash usedwhich is offset by investing activities
|
| | | | | | | |
| | Nine months ended |
| | June 30, 2018 | | July 1, 2017 |
| | (in thousands) |
| Cash provided (used) by investing activities included the following: | | | |
| Additions to property and equipment | $ | (18,666 | ) | | $ | (19,333 | ) |
| Acquisitions of businesses, net of cash acquired | (3,000 | ) | | (4,960 | ) |
| Purchase of intangible asset | (3,000 | ) | | — |
|
| Purchases of short- and long-term marketable securities | (18,063 | ) | | (14,173 | ) |
| Proceeds from maturities of short- and long-term marketable securities | 13,640 |
| | 13,440 |
|
| Purchases of investments | (1,000 | ) | | — |
|
| Proceeds from sales of investments | — |
| | 15,218 |
|
| | $ | (30,089 | ) | | $ | (9,808 | ) |
Our expenditures for property and equipment consisted primarily of computer equipment, software, office equipment and facility improvements. landlord reimbursements included in cash from operations above). In the first nine months of 20182019 we also used net $4 million to purchase additional marketable securities, $3$70 million to acquire developed software, $3 million for a small business acquisition and $1 million for a small investment.Frustum.
Cash used byin financing activities
| | | | Nine months ended | Nine months ended |
| | June 30, 2018 | | July 1, 2017 | June 29, 2019 | | June 30, 2018 |
| | (in thousands) | (in thousands) |
| Cash used by financing activities included the following: | | | | |
| Cash used in financing activities included the following: | | | | |
| Net borrowings (repayments) of debt | $ | (20,000 | ) | | $ | (40,000 | ) | $ | 55,000 |
| | $ | (20,000 | ) |
| Repurchases of common stock | (100,000 | ) | | (34,994 | ) | (89,995 | ) | | (100,000 | ) |
| Payments of withholding taxes in connection with vesting of stock-based awards | (44,797 | ) | | (26,244 | ) | |
| Payments of withholding taxes in connection with stock-based awards | | (44,191 | ) | | (44,797 | ) |
| Proceeds from issuance of common stock | 7,472 |
| | 3,978 |
| 4,158 |
| | 7,472 |
|
| Contingent consideration | (7,750 | ) | | (11,054 | ) | (1,575 | ) | | (7,750 | ) |
| Credit facility origination costs | — |
| | (184 | ) | |
| | $ | (165,075 | ) | | $ | (108,498 | ) | $ | (76,603 | ) | | $ | (165,075 | ) |
The net repaymentsborrowings in the first nine months of 20182019 reflect borrowings of $200$205 million under our credit facility to fund the working capital requirements and stock repurchases,Frustum acquisition, offset by repayments of $220$150 million. In the first nine months of 20182019 we repurchased $100$90 million inof our common stock. We alsostock, paid $45$44 million in withholding taxes in connection with vesting of stock basedstock-based awards, made $8received $4 million in contingent consideration payments, and received $7 millionproceeds from the saleissuance of common stock under our ESPP, plan.and made $2 million in contingent consideration payments.
Outstanding Debt
As of June 29, 2019, we had $703.1 million in total debt outstanding, comprised of $203.1 million outstanding under our revolving credit facility and $500 million of 6.00% Senior Notes due 2024.
Credit Agreement
We maintainOur credit facility is a multi-currency credit facility with a syndicate of sixteen banks with a $600 million revolving loan commitment.for which JPMorgan Chase Bank, N.A. acts as Administrative Agent. The total revolving loan commitment may be increased by an additional $500 million ifunder the existing or additional lenders are willing to make such increased commitments.facility is $700 million. Outstanding revolving loan amounts may be repaid in whole or in part, without penalty or premium, prior to the September 15, 201913, 2023 maturity date, when all remaining amounts outstanding will be due and payable in full.
We use the credit facility for general corporate purposes, including acquisitions of businesses, share repurchases and working capital requirements. As of June 30, 2018,29, 2019, we had $203.1 million in revolving loans outstanding under the credit facility, the fair value of our credit facility approximateswhich approximated its book value. As of June 29, 2019, we have approximately $496.9 million undrawn, of which $481.8 million would be available to borrow, the availability of which is reduced by letters of credit and certain other long-term liabilities.
We andAny borrowings by PTC Inc. or certain of our foreign subsidiaries may borrow under the credit facility. Any amounts borrowed by usfacility would be guaranteed, respectively, by our material domestic subsidiaries that become parties to the subsidiary guaranty, if any. Any amounts borrowedany, and/or by onePTC Inc. Borrowings are also secured by first priority liens on property of PTC and certain of our foreignmaterial domestic subsidiaries, would be guaranteed by us and any subsidiary guarantors. The credit facility is secured by our assets and thoseincluding 100% of somethe voting equity interests of certain of our U.S.domestic subsidiaries (which include equity interests in someand 65% of our other subsidiaries).
As of June 30, 2018, we had $198.1 million in revolving loans outstanding under the credit facility.material first-tier foreign subsidiaries. Loans under the credit facility bear interest at variable rates whichthat reset every 30 to 180 days depending on the rate and period selected by us. Asus and based upon our total leverage ratio. In both the third quarter and first nine months of June 30, 2018,2019, the weighted average annual interest rate for amounts outstanding was 3.88%5.4%. We are currently evaluating the anticipated impact of the phase-out of LIBOR in 2021, which may be material. We also pay a quarterly commitment fee on the undrawn portion of the credit facility ranging from 0.175% to 0.30% per year based on our total leverage ratio.
The credit facility limitsimposes customary covenants that limit our and our subsidiaries’ ability to among other things: incur liens or guarantee obligations;obligations, pay dividends and make other distributions;distributions, make investments and enter into joint ventures; dispose of assets; engage in transactions withcertain other transactions. In addition, we and our material domestic subsidiaries may not invest in, or loan to, our foreign subsidiaries in aggregate amounts exceeding $100 million for any purpose and engage in transactions with affiliates, except on an arms-length basis. In addition, the credit facility requires us toadditional $200 million for acquisitions of businesses. We also must maintain the following financial ratios set forth below.ratios:
|
| | | |
| | Required Ratio | | Ratio as of June 30, 201829, 2019 |
Total Leverage Ratio Ratio of consolidated total indebtedness to the consolidated trailing four quarters EBITDA as of the last day of any fiscal quarter.EBITDA. | Not > 4.50:1.00 | | 2.451.92 to 1.00 |
Fixed ChargeInterest Coverage Ratio
Ratio of consolidated trailing four quarters EBITDA less consolidated capital expenditures to consolidated fixed charges as of the last day of any fiscal quarter.trailing four quarters cash basis interest expense. | > 3.50:3.00:1.00 | | 6.828.95 to 1.00 |
Senior Secured Leverage Ratio Ratio of senior consolidated total indebtedness (which excludes unsecured indebtedness) to consolidated trailing four quarters EBITDA as of the last day of any fiscal quarter. | Not > 3.00:1.00 | | 0.730.58 to 1.00 |
As of the end of the third quarter of 2018, we had approximately $384 million of borrowing capacity under the credit facility.
As of June 30, 2018,29, 2019, we were in compliance with all financial and operating covenants of the credit facility.
Any failure to comply with the financial or operatingsuch covenants of the credit facility would prevent us from being able to borrow additional funds, and would constitute a default, permitting the lenders to, among other things, accelerate the amounts outstanding including all accrued interest and unpaid fees, under the credit facility and to terminate the credit facility. A change in control of PTC Inc., as defined in the agreement, would also constitute an event of default, permitting the lenders to accelerate the indebtedness and terminate the credit facility.
The terms and conditions of the credit facility are described in Note 12 to13. Debt in the Financial Statements.
Outstanding Notes
On May 12, 2016, we issued $500 million of 6.00% senior unsecured notes due 2024. Interest on the notes is payable twice per year in May and November.
We may redeem the notes, in whole or in part, subject to certain conditions, including in some cases a payment of a premium, prior to their maturity date. In addition, if we undergo a change of control, we will be required to make an offer to purchase all the notes at a price equal to 101% of the principal amount of the notes plus accrued and unpaid interest.
The notes were issued under an indenture that contains customary covenants. Subject to certain exceptions, our ability to incur certain additional debt is limited unless, after giving pro forma effect to such incurrence and the application of the proceeds thereof, the ratio of our EBITDA to our Consolidated Fixed Charges is not greater than 2.00 to 1.00. The indenture also restricts our ability to incur liens, pay dividends or make certain other distributions, sell assets or engage in sale/leaseback transactions. Any failure to comply with these and other covenants included in the indenture could constitute an event of default that could result in the acceleration of the payment of the aggregate principal amount of the notes then outstanding and accrued interest. As of June 30, 2018,29, 2019, we were in compliance with all such covenants.
Share Repurchases
Our Articles of Organization authorize us to issue up to 500 million shares of our common stock.
Our Board of Directors periodically authorizes thehas authorized us to repurchase of sharesup to $1,500 million of our common stock in the period October 1, 2017 through September 30, 2020. We repurchased $25 million and $90 million of our common stock in the third quarter and first nine months of 2019, respectively. In the first nine months of 2018, we repurchased $100 million of our common stock.
On July 20, 2018, we entered into an accelerated share repurchase (“ASR”) agreement with a major financial institution (“Bank”). The ASR allowed us to buy a large number of shares immediately at a purchase price determined by an average market price over a period of time. Under the ASR, we agreed to purchase $1,000 million of our common stock, in total, with an initial delivery to us in July 2018 of 8.2 million shares (“Initial Shares”), which represented the number of shares at the current market price equal to 80% of the total fixed purchase price of $1,000 million. The remainder of the total purchase price of $200 million reflected the value of the stock held by the Bank pending final settlement and, accordingly, was recorded as a reduction to additional paid-in capital in 2018. We settled the ASR in May 2019 and the Bank delivered to us 3.0 million shares.
We expect to repurchase additional material amounts over the remainder of 2019. We intend to use cash from operations and borrowings under our credit facility to make such repurchases. All shares of our common stock repurchased are automatically restored to the status of authorized and unissued.
On September 14, 2017, our Board of Directors authorized us to repurchase up to $500 million of our common stock in the period October 1, 2017 through September 30, 2020. In the third quarter of 2018, we repurchased $100 million of our common stock through an ASR agreement with a major financial institution at a purchase price determined by the average market price over a period of time, with final settlement in June 2018. In July 2018, our Board of Directors has authorized us to repurchase up to an additional $1,000 million of our common stock through September 30, 2020. We entered into a new, $1,000 million ASR as described in Note 14. Subsequent Events. Final settlement of this ASR is expected to occur in 7.5 to 10 months.
Future Expectations
Our transition to a subscription licensing model has had, and will continue to have, an adverse impact on revenue, operating margin and EPS relative to periods in which we primarily sold perpetual licenses until the expected transition of our customer base to subscription is completed and the model has matured. This also affects consolidated EBITDA as calculated under our credit facility. Notwithstanding the effect of the subscription transition and those limitations, weWe believe that existing cash and cash equivalents, together with cash generated from operations and amounts available under the credit facility, will be sufficient to meet our working capital and capital expenditure requirements (which capital expenditures we expect to be $40approximately $45 million in 2018)2019, net of expected landlord funding of leasehold improvements) and fund our intended share repurchases through at least the next twelve months and to meet our known long-term capital requirements.
OurCash outflows related to our move to our new worldwide headquarters in the Boston Seaport District and exit of our prior headquarters could be higher than we expect if we are unable to sublease our prior headquarters as estimated. We currently estimate the undiscounted cash outflows related to the remaining term of the lease at our prior headquarters (through November 2022) to be approximately $29 million (reflecting rent obligations and operating expenses net of estimated sublease income of approximately $14 million). That expense could be higher if we do not generate the estimated sublease income. The $29 million and any additional amounts will be paid over the remaining term of the lease; we expect those amounts will not materially adversely affect our ability to fund our working capital and capital expenditure requirements over the period.
Further, our expected uses of cash could change, our cash position could be reduced and we could incur additional debt obligations if we decided to purchase our outstanding shares ordecide to retire debt or to engage in strategic transactions, any of which could be commenced, suspended or completed at any time. Any such purchases or retirement of debt will depend on prevailing market conditions, our liquidity requirements, contractual restrictions and other factors. We also evaluate possible strategic transactions on an ongoing basis and at any given time may be engaged in discussions or negotiations with respect to possible strategic transactions. The amounts involved in any share or debt repurchases or strategic transactions may be material.
| |
| ITEM 3. | QUANTITATIVE AND QUALITATIVE DISCLOSURES ABOUT MARKET RISK |
There have been no significant changes in our market risk exposure as described in Item 7A: Quantitative and Qualitative Disclosures about Market Risk of our 20172018 Annual Report on Form 10-K.
| |
| ITEM 4. | CONTROLS AND PROCEDURES |
Evaluation of Effectiveness of Disclosure Controls and Procedures
Our management maintains disclosure controls and procedures as defined in Rules 13a-15(e) and 15d-15(e) under the Securities Exchange Act of 1934, as amended (the “Exchange Act”) that are designed to provide reasonable assurance that information required to be disclosed in our reports filed or submitted under the Exchange Act is processed, recorded, summarized and reported within the time periods specified in the SEC’s rules and forms, and that such information is accumulated and communicated to our management, including our Chief Executive Officer and Chief Financial Officer (our principal executive officer and principal financial officer, respectively), as appropriate, to allow for timely decisions regarding required disclosure.
We evaluated, under the supervision and with the participation of management, including our principal executive and principal financial officers, the effectiveness of the design and operation of our disclosure controls and procedures as of the end of the period covered by this quarterly report. Based on this evaluation, our principal executive officer and principal financial officer concluded that our disclosure controls and procedures were effective at the reasonable assurance level as of June 30, 2018.29, 2019.
Changes in Internal Control over Financial Reporting
Effective October 1, 2018, we adopted Accounting Standards Update No. 2014-09, Revenue from Contracts with Customers, as amended (ASC 606). In connection with our adoption of ASC 606, we implemented changes to our systems, processes, policies and internal controls. These changes will have a material effect on our internal control over financial reporting in 2019.
There waswere no changeother changes in our internal control over financial reporting (as definedidentified in management's evaluation pursuant to Rules 13a-15(f) and 15d-15(f) under13a or 15(d) of the Exchange Act)Act that occurred during the quarterperiod ended June 30, 201829, 2019 that hashave materially affected, or isare reasonably likely to materially affect, our internal control over financial reporting.
PART II—OTHER INFORMATION
ITEM 1A. RISK FACTORS
In addition to other information set forth in this report, you should carefully consider the risk set forth below and the risk factors described in Part I. Item 1A. Risk Factors in our 20172018 Annual Report on Form 10-K, which could materially affect our business, financial condition or future results. The risk described below and the risks described in our 2017 Annual Report on Form 10-K are not the only risks we face. Additional risks and uncertainties not currently known to us or that we currently deem to be immaterial also may materially and adversely affect our business, financial condition and/or operating results.
On September 7, 2017, we entered into a lease for a new worldwide headquarters in the Boston Seaport District, beginning in January 2019. Because our current headquarters lease will not expire until November 2022, we are seeking to exit our current headquarters lease or sublease that space. If we are unable to do so, or unable to do so for an amount at least equal to our rent obligations under the current headquarters lease, we will bear overlapping rent obligations for those premises and will be required to record a charge related to any rent shortfall, which could adversely affect our financial condition.
Under our current headquarters lease, we pay approximately $7.4 million in annual base rent plus operating expenses (together "rent obligations," an aggregate annual total of approximately $12.0 million). We will begin paying rent under our new headquarters lease on July 1, 2020. Our rent under the new lease when we begin paying rent will be an annual base rent amount of $11.3 million plus our pro rata portions of building operating expenses and real estate taxes (approximately 63% of such amounts, estimated to be approximately $7.1 million in 2020). The base rent will increase by $0.3 million each year over the term of the lease. Accordingly, we will be required to pay rent for both locations from July 1, 2020 until November 30, 2022 unless we can successfully negotiate an exit to our current lease or sublease our current premises. We may be unable to negotiate a financially desirable termination of our current lease or to sublease our current premises for an amount at least equal to our rent obligations under the current lease, which would require us to bear the overlapping rent obligations and to record a charge related to such shortfall, and could adversely affect our cash flow and financial condition.
ITEM 2. UNREGISTERED SALES OF EQUITY SECURITIES AND USE OF PROCEEDS
The table below shows the shares of our common stock we repurchased in the third quarter of 2018.2019.
|
| | | | | | | |
| Period (1) | Total Number of Shares (or Units) Purchased | Average Price Paid per Share (or Unit) | Total Number of Shares (or Units) Purchased as Part of Publicly Announced Plans or Programs | Approximate Dollar Value of Shares (or Units) that May Yet Be Purchased Under the Plans or Programs |
| April 1, 2018 - April 28, 2018 | 951,814 |
| 87.19 |
| 951,814 |
| $420,000,000 (2)(3) |
| April 29, 2018 - May 26, 2018 | — |
| — |
| — |
| $420,000,000 (2)(3) |
| May 27, 2018 - June 30, 2018 | 195,160 |
| 87.19 |
| 195,160 |
| $400,000,000 (2)(3) |
| Total | | | | $400,000,000 (2) |
|
| | | | | | | | |
| Period (1) | Total Number of Shares (or Units) Purchased | Average Price Paid per Share (or Unit) | Total Number of Shares (or Units) Purchased as Part of Publicly Announced Plans or Programs | Approximate Dollar Value of Shares (or Units) that May Yet Be Purchased Under the Plans or Programs |
| March 31, 2019 - April 27, 2019 | — |
| $ | — |
| — |
| $335,005,304 (2)
|
| April 28, 2019 - May 25, 2019 | 287,368 |
| $ | 87.04 |
| 287,368 |
| $310,005,312 (2) |
| May 26, 2019 - June 29, 2019 | — |
| $ | — |
| — |
| $310,005,312 (2)
|
| Total | 287,368 |
| $ | 87.04 |
| 287,368 |
| $310,005,312 (2)
|
(1) Periods are our fiscal months within the fiscal quarter.
(2) On September 14, 2017, ourOur Board of Directors has authorized us to repurchase up to $500$1,500 million worth of our shares incommon stock for the period October 1, 2017 through September 30, 2020, which repurchase program we initially announced on September 19, 2017. Our Board2017 and expanded this authorization to $1,500 million onin July 19, 2018, upon closing of the $1,000 million investment by Rockwell Automation.2018.
(3) In April 2018, we made a $100 million payment to repurchase shares pursuant to an ASR with a major financial institution, of which 951,814 shares were repurchased in April and an additional 195,160 shares were repurchased in June 2018. See Note 5. Earnings per Share (EPS) and Common Stock of "Notes to Consolidate Financial Statements" included in this Quarterly Report.
|
| | |
| | | |
| 3.1 | | |
| | | |
| 3.2 | | |
| | |
| 4.1 | | |
| | | |
| 4.2 | | |
| | | |
| 4.3 | | |
| 10.1* | | |
| | | |
10.1 | | |
| | |
10.2 | | |
| | |
10.3 | | |
| 31.1 | | |
| | |
| 31.2 | | |
| | |
| 32** | | |
| | |
| 101 | | The following materials from PTC Inc.'s Quarterly Report on Form 10-Q for the quarter ended June 30, 201829, 2019 ("Q3 Form 10-Q") formatted in Inline XBRL (eXtensible Business Reporting Language): (i) Condensed Consolidated Balance Sheets as of June 30, 201829, 2019 and September 30, 2017;2018; (ii) Condensed Consolidated Statements of Operations for the three and nine months ended June 29, 2019 and June 30, 2018 and July 1, 2017;2018; (iii) Condensed Consolidated Statements of Comprehensive Income for the three and nine months ended June 29, 2019 and June 30, 2018 and July 1, 2017;2018; (iv) Condensed Consolidated Statements of Cash Flows for the nine months ended June 29, 2019 and June 30, 20182018; (v) Consolidated Statements of Stockholders’ Equity for the three and July 1, 2017;nine months ended June 29, 2019 and (v)June 30, 2018; and (vi) Notes to Condensed Consolidated Financial Statements. |
| 104 | | The cover page of the Q3 Form 10-Q formatted in Inline XBRL (included in Exhibit 101). |
_________________
* Indicates a management contract or arrangement in which an executive officer of PTC participates.
| |
| ** | Indicates that the exhibit is being furnished, not filed, with this report. |
SIGNATURE
Pursuant to the requirements of the Securities Exchange Act of 1934, the registrant has duly caused this report to be signed on its behalf by the undersigned hereunto duly authorized.
|
| | |
| PTC Inc. |
| | |
| By: | | /S/ ANDREW MILLERKRISTIAN TALVITIE |
| | | Andrew MillerKristian Talvitie
Executive Vice President and Chief Financial Officer (Principal Financial Officer) |
Date: July 31, 2018August 8, 2019