| ý | QUARTERLY REPORT PURSUANT TO SECTION 13 OR 15(d) OF THE SECURITIES EXCHANGE ACT OF 1934 |
| ¨ | TRANSITION REPORT PURSUANT TO SECTION 13 OR 15(d) OF THE SECURITIES EXCHANGE ACT OF 1934 |
| Delaware | 13-3317783 | |
| (State or other jurisdiction of incorporation or organization) | (I.R.S. Employer Identification No.) | |
| Indicate by check mark: | Yes | No | |
| • whether the registrant (1) has filed all reports required to be filed by Section 13 or 15(d) of the Securities Exchange Act of 1934 during the preceding 12 months (or for such shorter period that the registrant was required to file such reports), and (2) has been subject to such filing requirements for the past 90 days. | ý | ¨ | |
| • whether the registrant has submitted electronically and posted on its corporate Web site, if any, every Interactive Data File required to be submitted and posted pursuant to Rule 405 of Regulation S-T during the preceding 12 months (or for such shorter period that the registrant was required to submit and post such files). | ý | ¨ | |
| • whether the registrant is a large accelerated filer, an accelerated filer, a non-accelerated filer, | |||
Large accelerated filer x | Accelerated filer ¨ | Non-accelerated filer ¨ | Smaller reporting company ¨ | Emerging growth company ¨ | |||
| • whether the registrant is a shell company (as defined in Rule 12b-2 of the Exchange Act.) | ¨ | ý | |
| Item | Description | Page | Description | Page |
| 1. | FINANCIAL STATEMENTS | |||
| REPORT OF INDEPENDENT REGISTERED PUBLIC ACCOUNTING FIRM | ||||
Condensed Consolidated Statements of Operations — For the Three Months Ended March 31, 2016 and 2015 | CONDENSED CONSOLIDATED STATEMENTS OF OPERATIONS - FOR THE THREE MONTHS ENDED MARCH 31, 2017 AND 2016 | |||
Condensed Consolidated Statements of Comprehensive Income — For the Three Months Ended March 31, 2016 and 2015 | CONDENSED CONSOLIDATED STATEMENTS OF COMPREHENSIVE INCOME (LOSS) - FOR THE THREE MONTHS ENDED MARCH 31, 2017 AND 2016 | |||
Condensed Consolidated Balance Sheets — As of March 31, 2016 and December 31, 2015 | CONDENSED CONSOLIDATED BALANCE SHEETS - AS OF MARCH 31, 2017 AND DECEMBER 31, 2016 | |||
Condensed Consolidated Statements of Changes in Stockholders’ Equity — For the Three Months Ended March 31, 2016 and 2015 | CONDENSED CONSOLIDATED STATEMENTS OF CHANGES IN STOCKHOLDERS' EQUITY - FOR THE THREE MONTHS ENDED MARCH 31, 2017 AND 2016 | |||
Condensed Consolidated Statements of Cash Flows — For the Three Months Ended March 31, 2016 and 2015 | CONDENSED CONSOLIDATED STATEMENTS OF CASH FLOWS - FOR THE THREE MONTHS ENDED MARCH 31, 2017 AND 2016 | |||
| NOTES TO CONDENSED CONSOLIDATED FINANCIAL STATEMENTS | ||||
| 2. | MANAGEMENT'S DISCUSSION AND ANALYSIS OF FINANCIAL CONDITION AND RESULTS OF OPERATIONS | |||
| 3. | QUANTITATIVE AND QUALITATIVE DISCLOSURES ABOUT MARKET RISK | |||
| 4. | CONTROLS AND PROCEDURES | |||
| 1. | LEGAL PROCEEDINGS | |||
| 1A. | RISK FACTORS | |||
| 2. | UNREGISTERED SALES OF EQUITY SECURITIES AND USE OF PROCEEDS | |||
| 6. | EXHIBITS | |||
| SIGNATURE | ||||
| EXHIBITS INDEX | ||||
| ◦ | challenges related to the Company’s current operating environment, including global political, economic and market conditions, and the effect of financial market disruptions, economic downturns or other potentially adverse macroeconomic developments on the |
| ◦ | financial risk related to the continued reinvestment of our investment portfolios and performance of our hedge program for our |
| ◦ | market risks associated with our business, including changes in |
| ◦ | the impact on our investment portfolio if our investment portfolio is concentrated in any particular segment of the economy; |
| ◦ | the possibility of unfavorable loss development, including with respect to long-tailed exposures; |
| ◦ | the possibility of a pandemic, earthquake, or other natural or man-made disaster that may adversely affect our businesses; |
| ◦ | weather and other natural physical events, including the severity and frequency of storms, hail, winter storms, hurricanes and tropical storms, as well as climate change and its potential impact on weather patterns; |
| ◦ | the possible occurrence of terrorist attacks and the Company’s |
| ◦ | the |
| ◦ | actions by |
| ◦ | technology changes, such as usage-based methods of determining premiums, advancement in automotive safety features, the development of autonomous vehicles, and platforms that facilitate ride sharing, which may alter demand for the Company's products, impact the frequency or severity of losses, and/or impact the way the Company markets, distributes and underwrites its products; |
| ◦ | the Company’s ability to market, distribute and provide insurance products and investment advisory services through current and future distribution channels and advisory firms; |
| ◦ | the |
| ◦ | volatility in our statutory and United States ("U.S.") |
| ◦ |
| ◦ | the impact on our statutory capital of |
| ◦ |
| ◦ | the potential for losses due to our reinsurers’ unwillingness or inability to meet their obligations under reinsurance contracts and the availability, pricing and adequacy of reinsurance to protect the Company against losses; |
| ◦ | risk associated with the use of analytical models in |
| ◦ | the |
| ◦ | the potential for further acceleration of deferred policy acquisition cost amortization and an increase in reserve for certain guaranteed benefits in our variable annuities; |
| ◦ | the potential for further impairments of our goodwill or the potential for changes in |
| ◦ | the significant uncertainties that limit our ability to estimate the ultimate reserves necessary for asbestos and |
| ◦ | risks associated with the |
| ◦ | the Company’s ability to maintain the availability of its systems and safeguard the security of its data in the event of a disaster, cyber or other information security incident or other unanticipated event; |
| ◦ | the |
| ◦ | the potential for difficulties arising from outsourcing and similar third-party relationships; |
| ◦ | the Company’s ability to protect its intellectual property and defend against claims of |
| ◦ | the cost and other potential effects of increased regulatory and legislative developments, including those that could adversely impact the demand for the Company’s products, operating costs and required capital levels; |
| ◦ | unfavorable judicial or legislative developments; |
| ◦ | the impact of changes in federal or state tax laws; |
| ◦ | regulatory requirements that could delay, deter or prevent a takeover attempt that shareholders might consider in their best interests; and |
| ◦ | the impact of potential changes in accounting principles and related financial reporting requirements. |
| Three Months Ended March 31, | Three Months Ended March 31, | |||||||||||
| (In millions, except for per share data) | 2016 | 2015 | 2017 | 2016 | ||||||||
| (Unaudited) | (Unaudited) | |||||||||||
| Revenues | ||||||||||||
| Earned premiums | $ | 3,404 | $ | 3,322 | $ | 3,473 | $ | 3,404 | ||||
| Fee income | 426 | 459 | 455 | 445 | ||||||||
| Net investment income | 696 | 809 | 728 | 696 | ||||||||
| Net realized capital gains (losses): | ||||||||||||
| Total other-than-temporary impairment ("OTTI") losses | (27 | ) | (12 | ) | (3 | ) | (27 | ) | ||||
| OTTI losses recognized in other comprehensive income (loss) (“OCI”) | 4 | — | ||||||||||
| OTTI losses recognized in other comprehensive income (“OCI”) | 2 | 4 | ||||||||||
| Net OTTI losses recognized in earnings | (23 | ) | (12 | ) | (1 | ) | (23 | ) | ||||
| Other net realized capital gains (losses) | (132 | ) | 17 | |||||||||
| Total net realized capital gains (losses) | (155 | ) | 5 | |||||||||
| Other net realized capital losses | (19 | ) | (132 | ) | ||||||||
| Total net realized capital losses | (20 | ) | (155 | ) | ||||||||
| Other revenues | 20 | 22 | 19 | 20 | ||||||||
| Total revenues | 4,391 | 4,617 | 4,655 | 4,410 | ||||||||
| Benefits, losses and expenses | ||||||||||||
| Benefits, losses and loss adjustment expenses | 2,641 | 2,563 | 2,757 | 2,641 | ||||||||
| Amortization of deferred policy acquisition costs ("DAC") | 374 | 387 | 363 | 374 | ||||||||
| Insurance operating costs and other expenses | 909 | 948 | 965 | 928 | ||||||||
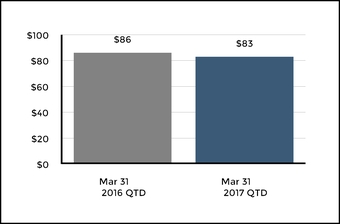
| Interest expense | 86 | 94 | 83 | 86 | ||||||||
| Total benefits, losses and expenses | 4,010 | 3,992 | 4,168 | 4,029 | ||||||||
| Income before income taxes | 381 | 625 | 487 | 381 | ||||||||
| Income tax expense | 58 | 158 | 109 | 58 | ||||||||
| Net income | $ | 323 | $ | 467 | $ | 378 | $ | 323 | ||||
| Net income per common share | ||||||||||||
| Basic | $ | 0.81 | $ | 1.11 | $ | 1.02 | $ | 0.81 | ||||
| Diluted | $ | 0.79 | $ | 1.08 | $ | 1.00 | $ | 0.79 | ||||
| Cash dividends declared per common share | $ | 0.21 | $ | 0.18 | $ | 0.23 | $ | 0.21 | ||||
| Three Months Ended March 31, | Three Months Ended March 31, | |||||||||||
| (In millions) | 2016 | 2015 | 2017 | 2016 | ||||||||
| (Unaudited) | (Unaudited) | |||||||||||
| Net income | $ | 323 | $ | 467 | $ | 378 | $ | 323 | ||||
| Other comprehensive income (loss): | ||||||||||||
| Changes in net unrealized gain on securities | 522 | 208 | 137 | 522 | ||||||||
| Changes in OTTI losses recognized in other comprehensive income | (8 | ) | (3 | ) | (1 | ) | (8 | ) | ||||
| Changes in net gain on cash flow hedging instruments | 54 | 27 | (18 | ) | 54 | |||||||
| Changes in foreign currency translation adjustments | 6 | (20 | ) | 2 | 6 | |||||||
| Changes in pension and other postretirement plan adjustments | 9 | 10 | 10 | 9 | ||||||||
| OCI, net of tax | 583 | 222 | 130 | 583 | ||||||||
| Comprehensive income | $ | 906 | $ | 689 | $ | 508 | $ | 906 | ||||
| (In millions, except for share and per share data) | March 31, 2016 | December 31, 2015 | March 31, 2017 | December 31, 2016 | ||||||||
| (Unaudited) | (Unaudited) | |||||||||||
| Assets | ||||||||||||
| Investments: | ||||||||||||
| Fixed maturities, available-for-sale, at fair value (amortized cost of $57,378 and $56,965) | $ | 60,693 | $ | 59,196 | ||||||||
| Fixed maturities, at fair value using the fair value option (includes variable interest entity assets of $0 and $150) | 486 | 503 | ||||||||||
| Equity securities, available-for-sale, at fair value (cost of $767 and $1,135) (includes equity securities, at fair value using the fair value option, of $0 and $282, and variable interest entity assets of $0 and $1) | 798 | 1,121 | ||||||||||
| Mortgage loans (net of allowances for loan losses of $22 and $23) | 5,637 | 5,624 | ||||||||||
| Fixed maturities, available-for-sale, at fair value (amortized cost of $53,908 and $53,805) | $ | 56,326 | $ | 56,003 | ||||||||
| Fixed maturities, at fair value using the fair value option | 160 | 293 | ||||||||||
| Equity securities, available-for-sale, at fair value (cost of $1,135 and $1,020) (includes equity securities, at fair value using the fair value option, of $123 and $0) | 1,223 | 1,097 | ||||||||||
| Mortgage loans (net of allowances for loan losses of $19 and $19) | 5,685 | 5,697 | ||||||||||
| Policy loans, at outstanding balance | 1,444 | 1,447 | 1,442 | 1,444 | ||||||||
| Limited partnerships and other alternative investments (includes variable interest entity assets of $394 and $2) | 2,654 | 2,874 | ||||||||||
| Limited partnerships and other alternative investments | 2,418 | 2,456 | ||||||||||
| Other investments | 280 | 120 | 340 | 403 | ||||||||
| Short-term investments (includes variable interest entity assets, at fair value, of $60 and $3) | 1,918 | 1,843 | ||||||||||
| Short-term investments | 4,595 | 3,244 | ||||||||||
| Total investments | 73,910 | 72,728 | 72,189 | 70,637 | ||||||||
| Cash (includes variable interest entity assets, at fair value, of $5 and $10) | 479 | 448 | ||||||||||
| Cash (includes variable interest entity assets, at fair value, of $5 and $5) | 337 | 882 | ||||||||||
| Premiums receivable and agents’ balances, net | 3,605 | 3,537 | 3,764 | 3,731 | ||||||||
| Reinsurance recoverables, net | 23,125 | 23,189 | 23,405 | 23,311 | ||||||||
| Deferred policy acquisition costs | 1,694 | 1,816 | 1,693 | 1,711 | ||||||||
| Deferred income taxes, net | 2,868 | 3,206 | 3,105 | 3,281 | ||||||||
| Goodwill | 498 | 498 | 567 | 567 | ||||||||
| Property and equipment, net | 995 | 974 | 984 | 991 | ||||||||
| Other assets (includes variable interest entity assets of $4 and $0) | 1,958 | 1,829 | ||||||||||
| Other assets | 1,839 | 1,786 | ||||||||||
| Assets held for sale | 923 | 870 | ||||||||||
| Separate account assets | 118,361 | 120,123 | 116,582 | 115,665 | ||||||||
| Total assets | $ | 227,493 | $ | 228,348 | $ | 225,388 | $ | 223,432 | ||||
| Liabilities | ||||||||||||
| Reserve for future policy benefits and unpaid losses and loss adjustment expenses | $ | 41,842 | $ | 41,572 | ||||||||
| Unpaid losses and loss adjustment expenses | $ | 27,687 | $ | 27,605 | ||||||||
| Reserve for future policy benefits | 14,051 | 13,929 | ||||||||||
| Other policyholder funds and benefits payable | 31,525 | 31,670 | 30,863 | 31,176 | ||||||||
| Unearned premiums | 5,497 | 5,385 | 5,609 | 5,499 | ||||||||
| Short-term debt | 690 | 275 | 320 | 416 | ||||||||
| Long-term debt | 4,633 | 5,084 | 4,817 | 4,636 | ||||||||
| Other liabilities (includes variable interest entity liabilities of $5 and $12) | 6,833 | 6,597 | ||||||||||
| Other liabilities (includes variable interest entity liabilities of $5 and $5) | 7,789 | 6,992 | ||||||||||
| Liabilities held for sale | 661 | 611 | ||||||||||
| Separate account liabilities | 118,361 | 120,123 | 116,582 | 115,665 | ||||||||
| Total liabilities | $ | 209,381 | $ | 210,706 | $ | 208,379 | $ | 206,529 | ||||
| Commitments and Contingencies (Note 8) | ||||||||||||
| Commitments and Contingencies (Note 12) | ||||||||||||
| Stockholders’ Equity | ||||||||||||
| Common stock, $0.01 par value — 1,500,000,000 shares authorized, 490,923,222 and 490,923,222 shares issued | 5 | 5 | ||||||||||
| Common stock, $0.01 par value — 1,500,000,000 shares authorized, 402,923,222 and 402,923,222 shares issued | 4 | 4 | ||||||||||
| Additional paid-in capital | 8,885 | 8,973 | 5,177 | 5,247 | ||||||||
| Retained earnings | 12,789 | 12,550 | 13,406 | 13,114 | ||||||||
| Treasury stock, at cost — 95,319,786 and 89,102,038 shares | (3,821 | ) | (3,557 | ) | ||||||||
| Treasury stock, at cost — 33,726,771 and 28,974,069 shares | (1,371 | ) | (1,125 | ) | ||||||||
| Accumulated other comprehensive income ("AOCI"), net of tax | 254 | (329 | ) | (207 | ) | (337 | ) | |||||
| Total stockholders’ equity | $ | 18,112 | $ | 17,642 | $ | 17,009 | $ | 16,903 | ||||
| Total liabilities and stockholders’ equity | $ | 227,493 | $ | 228,348 | $ | 225,388 | $ | 223,432 | ||||
| Three Months Ended March 31, | Three Months Ended March 31, | |||||||||||
| (In millions, except for share data) | 2016 | 2015 | 2017 | 2016 | ||||||||
| (Unaudited) | (Unaudited) | |||||||||||
| Common Stock | $ | 5 | $ | 5 | $ | 4 | $ | 5 | ||||
| Additional Paid-in Capital, beginning of period | 8,973 | 9,123 | 5,247 | 8,973 | ||||||||
| Issuance of shares under incentive and stock compensation plans | (124 | ) | (150 | ) | (66 | ) | (124 | ) | ||||
| Stock-based compensation plans expense | 19 | 16 | 36 | 19 | ||||||||
| Tax benefit on employee stock options and share-based awards | 24 | 26 | — | 24 | ||||||||
| Issuance of shares for warrant exercise | (7 | ) | (19 | ) | (40 | ) | (7 | ) | ||||
| Additional Paid-in Capital, end of period | 8,885 | 8,996 | 5,177 | 8,885 | ||||||||
| Retained Earnings, beginning of period | 12,550 | 11,191 | 13,114 | 12,550 | ||||||||
| Net income | 323 | 467 | 378 | 323 | ||||||||
| Dividends declared on common stock | (84 | ) | (75 | ) | (86 | ) | (84 | ) | ||||
| Retained Earnings, end of period | 12,789 | 11,583 | 13,406 | 12,789 | ||||||||
| Treasury Stock, at cost, beginning of period | (3,557 | ) | (2,527 | ) | (1,125 | ) | (3,557 | ) | ||||
| Treasury stock acquired | (350 | ) | (250 | ) | (325 | ) | (350 | ) | ||||
| Issuance of shares under incentive and stock compensation plans | 125 | 154 | 72 | 125 | ||||||||
| Net shares acquired related to employee incentive and stock compensation plans | (46 | ) | (53 | ) | (33 | ) | (46 | ) | ||||
| Issuance of shares for warrant exercise | 7 | 19 | 40 | 7 | ||||||||
| Treasury Stock, at cost, end of period | (3,821 | ) | (2,657 | ) | (1,371 | ) | (3,821 | ) | ||||
| Accumulated Other Comprehensive Income (Loss), net of tax, beginning of period | (329 | ) | 928 | (337 | ) | (329 | ) | |||||
| Total other comprehensive income (loss) | 583 | 222 | 130 | 583 | ||||||||
| Accumulated Other Comprehensive Income (Loss), net of tax, end of period | 254 | 1,150 | (207 | ) | 254 | |||||||
| Total Stockholders’ Equity | $ | 18,112 | $ | 19,077 | $ | 17,009 | $ | 18,112 | ||||
| Common Shares Outstanding, beginning of period (in thousands) | 401,821 | 424,416 | 373,949 | 401,821 | ||||||||
| Treasury stock acquired | (8,394 | ) | (6,128 | ) | (6,709 | ) | (8,394 | ) | ||||
| Issuance of shares under incentive and stock compensation plans | 3,069 | 3,923 | 1,690 | 3,069 | ||||||||
| Return of shares under incentive and stock compensation plans to treasury stock | (1,066 | ) | (1,299 | ) | (674 | ) | (1,066 | ) | ||||
| Issuance of shares for warrant exercise | 173 | 477 | 940 | 173 | ||||||||
| Common Shares Outstanding, at end of period | 395,603 | 421,389 | 369,196 | 395,603 | ||||||||
| Three Months Ended March 31, | Three Months Ended March 31, | |||||||||||
| (In millions) | 2016 | 2015 | 2017 | 2016 | ||||||||
| Operating Activities | (Unaudited) | (Unaudited) | ||||||||||
| Net income | $ | 323 | $ | 467 | $ | 378 | $ | 323 | ||||
| Adjustments to reconcile net income to net cash provided by operating activities: | ||||||||||||
| Net realized capital (gains) losses | 155 | (5 | ) | |||||||||
| Net realized capital losses | 20 | 155 | ||||||||||
| Amortization of deferred policy acquisition costs | 374 | 387 | 363 | 374 | ||||||||
| Additions to deferred policy acquisition costs | (354 | ) | (354 | ) | (352 | ) | (354 | ) | ||||
| Depreciation and amortization | 95 | 101 | 96 | 95 | ||||||||
| Other operating activities, net | 81 | 22 | 111 | 81 | ||||||||
| Change in assets and liabilities: | ||||||||||||
| Decrease in reinsurance recoverables | 53 | 37 | ||||||||||
| (Increase) decrease in reinsurance recoverables | (7 | ) | 53 | |||||||||
| Increase (decrease) in deferred and accrued income taxes | (14 | ) | 168 | 256 | (14 | ) | ||||||
| Increase in reserve for future policy benefits and unpaid losses and loss adjustment expenses and unearned premiums | 158 | 120 | 293 | 158 | ||||||||
| Net change in other assets and other liabilities | (473 | ) | (496 | ) | (933 | ) | (473 | ) | ||||
| Net cash provided by operating activities | 398 | 447 | 225 | 398 | ||||||||
| Investing Activities | ||||||||||||
| Proceeds from the sale/maturity/prepayment of: | ||||||||||||
| Fixed maturities, available-for-sale | 5,460 | 6,584 | 8,020 | 5,460 | ||||||||
| Fixed maturities, fair value option | 19 | 36 | 62 | 19 | ||||||||
| Equity securities, available-for-sale | 414 | 363 | 216 | 414 | ||||||||
| Mortgage loans | 114 | 104 | 213 | 114 | ||||||||
| Partnerships | 235 | 179 | 83 | 235 | ||||||||
| Payments for the purchase of: | ||||||||||||
| Fixed maturities, available-for-sale | (5,752 | ) | (7,375 | ) | (7,809 | ) | (5,752 | ) | ||||
| Fixed maturities, fair value option | (38 | ) | (59 | ) | — | (38 | ) | |||||
| Equity securities, available-for-sale | (130 | ) | (566 | ) | (278 | ) | (130 | ) | ||||
| Mortgage loans | (128 | ) | (154 | ) | (199 | ) | (128 | ) | ||||
| Partnerships | (88 | ) | (106 | ) | (86 | ) | (88 | ) | ||||
| Net proceeds from derivatives | 189 | 45 | ||||||||||
| Net increase (decrease) in policy loans | 2 | (24 | ) | |||||||||
| Net (payments for) proceeds from derivatives | (56 | ) | 189 | |||||||||
| Net increase in policy loans | 2 | 2 | ||||||||||
| Net additions to property and equipment | (84 | ) | (58 | ) | (41 | ) | (84 | ) | ||||
| Net proceeds from (payments for) short-term investments | (29 | ) | 1,325 | |||||||||
| Net payments for short-term investments | (1,317 | ) | (29 | ) | ||||||||
| Other investing activities, net | 10 | 1 | (18 | ) | 10 | |||||||
| Net cash provided by investing activities | 194 | 295 | ||||||||||
| Net cash provided (used) by investing activities | (1,208 | ) | 194 | |||||||||
| Financing Activities | ||||||||||||
| Deposits and other additions to investment and universal life-type contracts | 1,165 | 1,209 | 1,398 | 1,165 | ||||||||
| Withdrawals and other deductions from investment and universal life-type contracts | (4,174 | ) | (4,682 | ) | (3,773 | ) | (4,174 | ) | ||||
| Net transfers from separate accounts related to investment and universal life-type contracts | 2,810 | 3,175 | 2,057 | 2,810 | ||||||||
| Repayments at maturity or settlement of consumer notes | (5 | ) | (2 | ) | (7 | ) | (5 | ) | ||||
| Net increase in securities loaned or sold under agreements to repurchase | 64 | 323 | 1,115 | 64 | ||||||||
| Repayment of debt | — | (289 | ) | (416 | ) | — | ||||||
| Net issuance (return) of shares under incentive and stock compensation plans and excess tax benefit | 10 | (25 | ) | |||||||||
| Proceeds from the issuance of debt | 500 | — | ||||||||||
| Net (return) issuance of shares under incentive and stock compensation plans | (26 | ) | 10 | |||||||||
| Treasury stock acquired | (350 | ) | (250 | ) | (325 | ) | (350 | ) | ||||
| Dividends paid on common stock | (85 | ) | (78 | ) | (87 | ) | (85 | ) | ||||
| Net cash used for financing activities | (565 | ) | (619 | ) | ||||||||
| Net cash provided (used) for financing activities | 436 | (565 | ) | |||||||||
| Foreign exchange rate effect on cash | 4 | (22 | ) | 2 | 4 | |||||||
| Net increase in cash | 31 | 101 | ||||||||||
| Net (decrease) increase in cash | (545 | ) | 31 | |||||||||
| Cash – beginning of period | 448 | 399 | 882 | 448 | ||||||||
| Cash – end of period | $ | 479 | $ | 500 | $ | 337 | $ | 479 | ||||
| Supplemental Disclosure of Cash Flow Information | ||||||||||||
| Income tax refunds received | $ | — | $ | 47 | $ | 132 | $ | — | ||||
| Interest paid | $ | 71 | $ | 77 | $ | 71 | $ | 71 | ||||
| Carrying Value as of | ||
| March 31, 2017 | December 31, 2016 | |
| Assets | ||
| Cash and investments | $657 | $657 |
| Reinsurance recoverables and other [1] | 266 | 213 |
| Total assets held for sale | $923 | $870 |
| Liabilities | ||
| Reserve for future policy benefits and unpaid losses and loss adjustment expenses | $646 | $600 |
| Other liabilities | 15 | 11 |
| Total liabilities held for sale | $661 | $611 |
| [1] | Includes intercompany reinsurance recoverables of $69 and $71 to be settled in cash or securities prior to closing as of March 31, 2017 and December 31, 2016, respectively. |
| Computation of Basic and Diluted Earnings per Common Share | Computation of Basic and Diluted Earnings per Common Share | |||||||||||
| Three Months Ended March 31, | Three Months Ended March 31, | |||||||||||
| (In millions, except for per share data) | 2016 | 2015 | 2017 | 2016 | ||||||||
| Earnings | ||||||||||||
| Net income | $ | 323 | $ | 467 | $ | 378 | $ | 323 | ||||
| Shares | ||||||||||||
| Weighted average common shares outstanding, basic | 398.5 | 422.6 | 371.4 | 398.5 | ||||||||
| Dilutive effect of stock compensation plans | 4.2 | 5.5 | 4.2 | 4.2 | ||||||||
| Dilutive effect of warrants | 3.6 | 5.6 | 3.0 | 3.6 | ||||||||
| Weighted average common shares outstanding and dilutive potential common shares | 406.3 | 433.7 | 378.6 | 406.3 | ||||||||
| Net income per common share | ||||||||||||
| Basic | $ | 0.81 | $ | 1.11 | $ | 1.02 | $ | 0.81 | ||||
| Diluted | $ | 0.79 | $ | 1.08 | $ | 1.00 | $ | 0.79 | ||||
| Three Months Ended March 31, | Three Months Ended March 31, | |||||||||||
| Net Income (Loss) | 2016 | 2015 | 2017 | 2016 | ||||||||
| Commercial Lines | $ | 228 | $ | 240 | ||||||||
| Personal Lines | 20 | 76 | ||||||||||
| Commercial Lines [1] | $ | 231 | $ | 225 | ||||||||
| Personal Lines [1] | 33 | 23 | ||||||||||
| Property & Casualty Other Operations | 17 | 23 | 24 | 17 | ||||||||
| Group Benefits | 50 | 52 | 45 | 50 | ||||||||
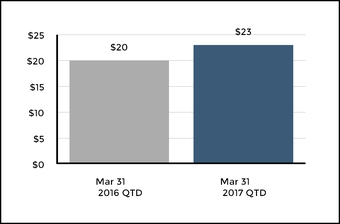
| Mutual Funds | 20 | 22 | 23 | 20 | ||||||||
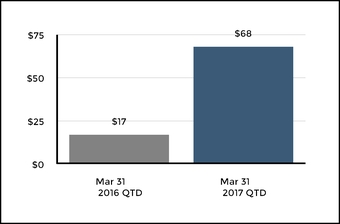
| Talcott Resolution | 17 | 111 | 68 | 17 | ||||||||
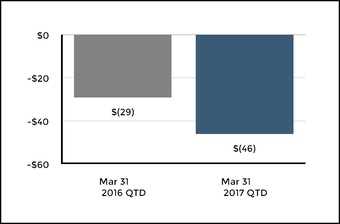
| Corporate | (29 | ) | (57 | ) | (46 | ) | (29 | ) | ||||
| Net income | $ | 323 | $ | 467 | $ | 378 | $ | 323 | ||||
| [1] | For the three months ended March 31, 2017 and 2016 there was a segment change which resulted in a movement from Commercial Lines to Personal Lines of $3 of net servicing revenues associated with our participation in the National Flood Insurance Program. |
| Three Months Ended March 31, | ||||||
| Revenues | 2017 | 2016 | ||||
| Earned premiums and fee income | ||||||
| Commercial Lines | ||||||
| Workers’ compensation | $ | 813 | $ | 759 | ||
| Liability | 148 | 143 | ||||
| Package business | 314 | 308 | ||||
| Automobile | 161 | 158 | ||||
| Professional liability | 60 | 53 | ||||
| Bond | 55 | 53 | ||||
| Property | 147 | 159 | ||||
| Total Commercial Lines [1] | 1,698 | 1,633 | ||||
| Personal Lines | ||||||
| Automobile | 662 | 685 | ||||
| Homeowners | 283 | 299 | ||||
| Total Personal Lines [1] [2] | 945 | 984 | ||||
| Group Benefits | ||||||
| Group disability | 381 | 369 | ||||
| Group life | 399 | 375 | ||||
| Other | 55 | 51 | ||||
| Total Group Benefits | 835 | 795 | ||||
| Mutual Funds | ||||||
| Mutual Fund | 167 | 142 | ||||
| Talcott | 24 | 25 | ||||
| Total Mutual Funds | 191 | 167 | ||||
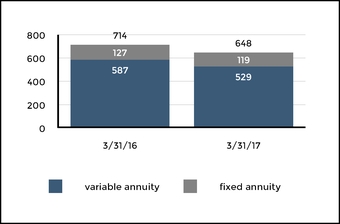
| Talcott Resolution | 258 | 269 | ||||
| Corporate | 1 | 1 | ||||
| Total earned premiums and fee income | 3,928 | 3,849 | ||||
| Net investment income | 728 | 696 | ||||
| Net realized capital losses | (20 | ) | (155 | ) | ||
| Other revenues | 19 | 20 | ||||
| Total revenues | $ | 4,655 | $ | 4,410 | ||
| [1] | Commercial Lines and Personal Lines includes installment fees of $10 and $11, respectively, for the three months ended March 31, 2017. Commercial Lines and Personal Lines includes installment fees of $10 and $9, respectively, for the three months ended March 31, 2016. |
| [2] | For the three months endedMarch 31, 2017 and 2016, AARP members accounted for earned premiums of $800 and $807, respectively. |
| Three Months Ended March 31, | ||||||
| Revenues | 2016 | 2015 | ||||
| Earned premiums and fee income | ||||||
| Commercial Lines | ||||||
| Workers’ compensation | $ | 755 | $ | 744 | ||
| Property | 159 | 156 | ||||
| Automobile | 157 | 148 | ||||
| Package business | 303 | 292 | ||||
| Liability | 143 | 135 | ||||
| Bond | 53 | 53 | ||||
| Professional liability | 53 | 55 | ||||
| Total Commercial Lines | 1,623 | 1,583 | ||||
| Personal Lines | ||||||
| Automobile | 678 | 655 | ||||
| Homeowners | 297 | 297 | ||||
| Total Personal Lines [1] | 975 | 952 | ||||
| Group Benefits | ||||||
| Group disability | 369 | 371 | ||||
| Group life | 375 | 365 | ||||
| Other | 51 | 44 | ||||
| Total Group Benefits | 795 | 780 | ||||
| Mutual Funds | ||||||
| Mutual Fund | 142 | 149 | ||||
| Talcott | 25 | 30 | ||||
| Total Mutual Funds | 167 | 179 | ||||
| Talcott Resolution | 269 | 285 | ||||
| Corporate | 1 | 2 | ||||
| Total earned premiums and fee income | 3,830 | 3,781 | ||||
| Net investment income | 696 | 809 | ||||
| Net realized capital gains (losses) | (155 | ) | 5 | |||
| Other revenues | 20 | 22 | ||||
| Total revenues | $ | 4,391 | $ | 4,617 | ||
| Level 1 |
| Level 2 |
| Level 3 |
| March 31, 2016 | ||||||||||||||||||||||||
| Assets and (Liabilities) Carried at Fair Value by Hierarchy Level as of March 31, 2017 | Assets and (Liabilities) Carried at Fair Value by Hierarchy Level as of March 31, 2017 | |||||||||||||||||||||||
| Total | Quoted Prices in Active Markets for Identical Assets (Level 1) | Significant Observable Inputs (Level 2) | Significant Unobservable Inputs (Level 3) | Total | Quoted Prices in Active Markets for Identical Assets (Level 1) | Significant Observable Inputs (Level 2) | Significant Unobservable Inputs (Level 3) | |||||||||||||||||
| Assets accounted for at fair value on a recurring basis | ||||||||||||||||||||||||
| Fixed maturities, AFS | ||||||||||||||||||||||||
| Asset-backed-securities ("ABS") | $ | 2,665 | $ | — | $ | 2,633 | $ | 32 | $ | 2,265 | $ | — | $ | 2,140 | $ | 125 | ||||||||
| Collateralized debt obligations ("CDOs") | 3,107 | — | 2,565 | 542 | 2,311 | — | 1,992 | 319 | ||||||||||||||||
| Commercial mortgage-backed securities ("CMBS") | 5,224 | — | 5,090 | 134 | 5,099 | — | 4,982 | 117 | ||||||||||||||||
| Corporate | 27,297 | — | 26,463 | 834 | 25,730 | — | 24,652 | 1,078 | ||||||||||||||||
| Foreign government/government agencies | 1,189 | — | 1,113 | 76 | 1,187 | — | 1,121 | 66 | ||||||||||||||||
| Municipal | 12,303 | — | 12,253 | 50 | ||||||||||||||||||||
| Bonds of municipalities and political subdivisions ("municipal bonds") | 11,780 | — | 11,663 | 117 | ||||||||||||||||||||
| Residential mortgage-backed securities ("RMBS") | 4,338 | — | 2,452 | 1,886 | 3,921 | — | 1,873 | 2,048 | ||||||||||||||||
| U.S. Treasuries | 4,570 | 67 | 4,503 | — | 4,033 | 688 | 3,345 | — | ||||||||||||||||
| Total fixed maturities | 60,693 | 67 | 57,072 | 3,554 | 56,326 | 688 | 51,768 | 3,870 | ||||||||||||||||
| Fixed maturities, FVO | 486 | — | 472 | 14 | 160 | — | 160 | — | ||||||||||||||||
| Equity securities, trading [1] | 11 | 11 | — | — | 11 | 11 | — | — | ||||||||||||||||
| Equity securities, AFS | 798 | 548 | 158 | 92 | 1,223 | 936 | 188 | 99 | ||||||||||||||||
| Derivative assets | ||||||||||||||||||||||||
| Credit derivatives | 16 | — | 16 | — | 2 | — | 2 | — | ||||||||||||||||
| Equity derivatives | 2 | — | — | 2 | 4 | — | — | 4 | ||||||||||||||||
| Foreign exchange derivatives | 5 | — | 5 | — | 3 | — | 3 | — | ||||||||||||||||
| Interest rate derivatives | (138 | ) | — | (138 | ) | — | 48 | — | 43 | 5 | ||||||||||||||
| Guaranteed minimum withdrawal benefit ("GMWB") hedging instruments | 146 | — | 61 | 85 | ||||||||||||||||||||
| GMWB hedging instruments | 80 | — | 36 | 44 | ||||||||||||||||||||
| Macro hedge program | 64 | — | — | 64 | 113 | — | 9 | 104 | ||||||||||||||||
| Other derivative contracts | 5 | — | — | 5 | ||||||||||||||||||||
| Total derivative assets [2] | 100 | — | (56 | ) | 156 | 250 | — | 93 | 157 | |||||||||||||||
| Short-term investments | 1,918 | 447 | 1,471 | — | 4,595 | 2,077 | 2,518 | — | ||||||||||||||||
| Limited partnerships and other alternative investments [3] | 394 | — | — | — | ||||||||||||||||||||
| Reinsurance recoverable for GMWB | 99 | — | — | 99 | 60 | — | — | 60 | ||||||||||||||||
| Modified coinsurance reinsurance contracts | 57 | — | 57 | — | 66 | — | 66 | — | ||||||||||||||||
| Separate account assets [4] | 115,959 | 74,486 | 40,156 | 155 | ||||||||||||||||||||
| Separate account assets [3] | 113,585 | 73,539 | 38,882 | 277 | ||||||||||||||||||||
| Total assets accounted for at fair value on a recurring basis | $ | 180,515 | $ | 75,559 | $ | 99,330 | $ | 4,070 | $ | 176,276 | $ | 77,251 | $ | 93,675 | $ | 4,463 | ||||||||
| Liabilities accounted for at fair value on a recurring basis | ||||||||||||||||||||||||
| Other policyholder funds and benefits payable | ||||||||||||||||||||||||
| GMWB | $ | (361 | ) | $ | — | $ | — | $ | (361 | ) | ||||||||||||||
| GMWB embedded derivative | $ | (157 | ) | $ | — | $ | — | $ | (157 | ) | ||||||||||||||
| Equity linked notes | (25 | ) | — | — | (25 | ) | (36 | ) | — | — | (36 | ) | ||||||||||||
| Total other policyholder funds and benefits payable | (386 | ) | — | — | (386 | ) | (193 | ) | — | — | (193 | ) | ||||||||||||
| Derivative liabilities | ||||||||||||||||||||||||
| Credit derivatives | (39 | ) | — | (39 | ) | — | (2 | ) | — | (2 | ) | — | ||||||||||||
| Equity derivatives | 28 | — | 25 | 3 | 37 | — | 37 | — | ||||||||||||||||
| Foreign exchange derivatives | (338 | ) | — | (338 | ) | — | (262 | ) | — | (262 | ) | — | ||||||||||||
| Interest rate derivatives | (665 | ) | — | (637 | ) | (28 | ) | (517 | ) | — | (488 | ) | (29 | ) | ||||||||||
| GMWB hedging instruments | 46 | — | (13 | ) | 59 | 3 | — | 1 | 2 | |||||||||||||||
| Macro hedge program | 81 | — | — | 81 | 58 | — | 3 | 55 | ||||||||||||||||
| Total derivative liabilities [5] | (887 | ) | — | (1,002 | ) | 115 | ||||||||||||||||||
| Total derivative liabilities [4] | (683 | ) | — | (711 | ) | 28 | ||||||||||||||||||
| Contingent consideration [5] | (26 | ) | — | — | (26 | ) | ||||||||||||||||||
| Total liabilities accounted for at fair value on a recurring basis | $ | (1,273 | ) | $ | — | $ | (1,002 | ) | $ | (271 | ) | $ | (902 | ) | $ | — | $ | (711 | ) | $ | (191 | ) | ||
| December 31, 2015 | ||||||||||||
| Total | Quoted Prices in Active Markets for Identical Assets (Level 1) | Significant Observable Inputs (Level 2) | Significant Unobservable Inputs (Level 3) | |||||||||
| Assets accounted for at fair value on a recurring basis | ||||||||||||
| Fixed maturities, AFS | ||||||||||||
| ABS | $ | 2,499 | $ | — | $ | 2,462 | $ | 37 | ||||
| CDOs | 3,038 | — | 2,497 | 541 | ||||||||
| CMBS | 4,717 | — | 4,567 | 150 | ||||||||
| Corporate | 26,802 | — | 25,948 | 854 | ||||||||
| Foreign government/government agencies | 1,308 | — | 1,248 | 60 | ||||||||
| Municipal | 12,121 | — | 12,072 | 49 | ||||||||
| RMBS | 4,046 | — | 2,424 | 1,622 | ||||||||
| U.S. Treasuries | 4,665 | 740 | 3,925 | — | ||||||||
| Total fixed maturities | 59,196 | 740 | 55,143 | 3,313 | ||||||||
| Fixed maturities, FVO | 503 | 2 | 485 | 16 | ||||||||
| Equity securities, trading [1] | 11 | 11 | ||||||||||
| Equity securities, AFS | 1,121 | 874 | 154 | 93 | ||||||||
| Derivative assets | ||||||||||||
| Credit derivatives | 21 | — | 21 | — | ||||||||
| Foreign exchange derivatives | 15 | — | 15 | — | ||||||||
| Interest rate derivatives | (227 | ) | — | (227 | ) | — | ||||||
| GMWB hedging instruments | 111 | — | 27 | 84 | ||||||||
| Macro hedge program | 74 | — | — | 74 | ||||||||
| Other derivative contracts | 7 | — | — | 7 | ||||||||
| Total derivative assets [2] | 1 | — | (164 | ) | 165 | |||||||
| Short-term investments | 1,843 | 333 | 1,510 | — | ||||||||
| Limited partnerships and other alternative investments [3] | 622 | — | — | — | ||||||||
| Reinsurance recoverable for GMWB | 83 | — | — | 83 | ||||||||
| Modified coinsurance reinsurance contracts | 79 | — | 79 | — | ||||||||
| Separate account assets [4] | 118,174 | 78,110 | 38,700 | 140 | ||||||||
| Total assets accounted for at fair value on a recurring basis | $ | 181,633 | $ | 80,070 | $ | 95,907 | $ | 3,810 | ||||
| Liabilities accounted for at fair value on a recurring basis | ||||||||||||
| Other policyholder funds and benefits payable | ||||||||||||
| GMWB | $ | (262 | ) | $ | — | $ | — | $ | (262 | ) | ||
| Equity linked notes | (26 | ) | — | — | (26 | ) | ||||||
| Total other policyholder funds and benefits payable | (288 | ) | — | — | (288 | ) | ||||||
| Derivative liabilities | ||||||||||||
| Credit derivatives | (16 | ) | — | (16 | ) | — | ||||||
| Equity derivatives | 41 | — | 41 | — | ||||||||
| Foreign exchange derivatives | (374 | ) | — | (374 | ) | — | ||||||
| Interest rate derivatives | (569 | ) | — | (547 | ) | (22 | ) | |||||
| GMWB hedging instruments | 47 | — | (4 | ) | 51 | |||||||
| Macro hedge program | 73 | — | — | 73 | ||||||||
| Total derivative liabilities [5] | (798 | ) | — | (900 | ) | 102 | ||||||
| Total liabilities accounted for at fair value on a recurring basis | $ | (1,086 | ) | $ | — | $ | (900 | ) | $ | (186 | ) | |
| Assets and (Liabilities) Carried at Fair Value by Hierarchy Level as of December 31, 2016 | ||||||||||||
| Total | Quoted Prices in Active Markets for Identical Assets (Level 1) | Significant Observable Inputs (Level 2) | Significant Unobservable Inputs (Level 3) | |||||||||
| Assets accounted for at fair value on a recurring basis | ||||||||||||
| Fixed maturities, AFS | ||||||||||||
| ABS | $ | 2,382 | $ | — | $ | 2,300 | $ | 82 | ||||
| CDOs | 1,916 | — | 1,502 | 414 | ||||||||
| CMBS | 4,936 | — | 4,856 | 80 | ||||||||
| Corporate | 25,666 | — | 24,586 | 1,080 | ||||||||
| Foreign government/government agencies | 1,171 | — | 1,107 | 64 | ||||||||
| Municipal bonds | 11,486 | — | 11,368 | 118 | ||||||||
| RMBS | 4,767 | — | 2,795 | 1,972 | ||||||||
| U.S. Treasuries | 3,679 | 620 | 3,059 | — | ||||||||
| Total fixed maturities | 56,003 | 620 | 51,573 | 3,810 | ||||||||
| Fixed maturities, FVO | 293 | 1 | 281 | 11 | ||||||||
| Equity securities, trading [1] | 11 | 11 | — | — | ||||||||
| Equity securities, AFS | 1,097 | 821 | 177 | 99 | ||||||||
| Derivative assets | ||||||||||||
| Credit derivatives | 17 | — | 17 | — | ||||||||
| Foreign exchange derivatives | 27 | — | 27 | — | ||||||||
| Interest rate derivatives | (427 | ) | — | (427 | ) | — | ||||||
| GMWB hedging instruments | 74 | — | 14 | 60 | ||||||||
| Macro hedge program | 128 | — | 8 | 120 | ||||||||
| Other derivative contracts | 1 | — | — | 1 | ||||||||
| Total derivative assets [2] | (180 | ) | — | (361 | ) | 181 | ||||||
| Short-term investments | 3,244 | 878 | 2,366 | — | ||||||||
| Reinsurance recoverable for GMWB | 73 | — | — | 73 | ||||||||
| Modified coinsurance reinsurance contracts | 68 | — | 68 | — | ||||||||
| Separate account assets [3] | 111,634 | 71,606 | 38,856 | 201 | ||||||||
| Total assets accounted for at fair value on a recurring basis | $ | 172,243 | $ | 73,937 | $ | 92,960 | $ | 4,375 | ||||
| Liabilities accounted for at fair value on a recurring basis | ||||||||||||
| Other policyholder funds and benefits payable | ||||||||||||
| GMWB embedded derivative | $ | (241 | ) | $ | — | $ | — | $ | (241 | ) | ||
| Equity linked notes | (33 | ) | — | — | (33 | ) | ||||||
| Total other policyholder funds and benefits payable | (274 | ) | — | — | (274 | ) | ||||||
| Derivative liabilities | ||||||||||||
| Credit derivatives | (13 | ) | — | (13 | ) | — | ||||||
| Equity derivatives | 33 | — | 33 | — | ||||||||
| Foreign exchange derivatives | (237 | ) | — | (237 | ) | — | ||||||
| Interest rate derivatives | (542 | ) | — | (521 | ) | (21 | ) | |||||
| GMWB hedging instruments | 20 | — | (1 | ) | 21 | |||||||
| Macro hedge program | 50 | — | 3 | 47 | ||||||||
| Total derivative liabilities [4] | (689 | ) | — | (736 | ) | 47 | ||||||
| Contingent consideration [5] | (25 | ) | — | — | (25 | ) | ||||||
| Total liabilities accounted for at fair value on a recurring basis | $ | (988 | ) | $ | — | $ | (736 | ) | $ | (252 | ) | |
| [1] | Included in other investments on the Condensed Consolidated Balance Sheets. |
| [2] | Includes |
| [3] | Approximately $3.0 billion and |
| [ | Includes OTC and OTC-cleared derivative instruments in a net negative fair value position (derivative liability) after consideration of the accrued interest and impact of collateral posting requirements, which may be imposed by agreements, clearing house rules and applicable law. |
| [5] | For additional information see the |
| Valuation Inputs Used in Levels 2 and 3 Measurements for Securities and Freestanding Derivatives | |||
Level 2 Primary Observable Inputs | Level 3 Primary Unobservable Inputs | ||
| Fixed Maturity Investments | |||
| Structured securities (includes ABS, CDOs CMBS and RMBS) | |||
• Benchmark yields and spreads • Monthly payment information • Collateral performance, which varies by vintage year and includes delinquency rates, loss severity rates and refinancing assumptions • Credit default swap indices Other inputs for ABS and RMBS: • Estimate of future principal prepayments, derived based on the characteristics of the • Prepayment speeds previously experienced at the interest rate levels projected for the collateral | • Independent broker quotes • Credit spreads beyond observable curve • Interest rates beyond observable curve Other inputs for less liquid securities • Estimated cash flows • Credit spreads, which include illiquidity premium • Constant prepayment rates • Constant default rates • Loss severity | ||
| Corporates | |||
• Benchmark yields and • Reported trades, bids, offers of the same or similar securities • Issuer spreads Other inputs for • Credit spreads for public securities | • Independent broker quotes • Credit spreads beyond observable curve • Interest rates beyond observable curve Other inputs for • Independent broker quotes • Credit spreads for public securities of similar quality, maturity, and sector, adjusted for non-public nature | ||
| U.S Treasuries, Municipals, and Foreign government/government agencies | |||
• Benchmark yields and spreads • Issuer credit default swap curves • Political events in emerging market economies • Municipal Securities Rulemaking Board reported trades and material event notices • Issuer financial statements | • Independent broker quotes • Credit spreads beyond observable curve • Interest rates beyond observable curve | ||
| Equity Securities | |||
| • Quoted prices in markets that are | • For privately traded equity securities, internal discounted cash flow models utilizing earnings multiples or | ||
| Short Term Investments | |||
• Benchmark yields and • Reported trades, bids, offers • Issuer spreads and • Material event notices and new issue money market rates | Not applicable | ||
| Derivatives | |||
| Credit derivatives | |||
• Swap yield curve • Credit default swap | • Independent broker quotes • Yield curves beyond observable | ||
| Equity derivatives | |||
• Equity index levels • Swap yield curve | • Independent broker quotes • Equity volatility | ||
| Foreign exchange derivatives | |||
• Swap yield curve • Currency spot and forward rates • Cross currency basis curves | • Independent broker quotes | ||
| Interest rate derivatives | |||
| • Swap yield curve | • Independent broker quotes • Interest rate volatility | ||
| Securities | Unobservable Inputs | ||||||||
| As of March 31, 2016 | |||||||||
| Assets Accounted for at Fair Value on a Recurring Basis | Fair Value | Predominant Valuation Technique | Significant Unobservable Input | Minimum | Maximum | Weighted Average [1] | Impact of Increase in Input on Fair Value [2] | ||
| CMBS [3] | $ | 115 | Discounted cash flows | Spread (encompasses prepayment, default risk and loss severity) | 31 bps | 1,035 bps | 409 bps | Decrease | |
| Corporate [3] | 320 | Discounted cash flows | Spread | 62 bps | 725 bps | 298 bps | Decrease | ||
| Municipal [3] | 32 | Discounted cash flows | Spread | 219 bps | 219 bps | 219 bps | Decrease | ||
| RMBS | 1,886 | Discounted cash flows | Spread | 34 bps | 1,281 bps | 217 bps | Decrease | ||
| Constant prepayment rate | —% | 20% | 3% | Decrease [4] | |||||
| Constant default rate | 1% | 10% | 6% | Decrease | |||||
| Loss severity | 40% | 100% | 80% | Decrease | |||||
| As of December 31, 2015 | |||||||||
| CMBS [3] | $ | 122 | Discounted cash flows | Spread (encompasses prepayment, default risk and loss severity) | 31 bps | 1,505 bps | 266 bps | Decrease | |
| Corporate [3] | 339 | Discounted cash flows | Spread | 63 bps | 800 bps | 306 bps | Decrease | ||
| Municipal [3] | 31 | Discounted cash flows | Spread | 193 bps | 193 bps | 193 bps | Decrease | ||
| RMBS | 1,622 | Discounted cash flows | Spread | 30 bps | 1,696 bps | 178 bps | Decrease | ||
| Constant prepayment rate | —% | 20% | 2% | Decrease [4] | |||||
| Constant default rate | 1% | 10% | 6% | Decrease | |||||
| Loss severity | —% | 100% | 78% | Decrease | |||||
| Significant Unobservable Inputs for Level 3 - Securities | |||||||||
| Assets accounted for at fair value on a recurring basis | Fair Value | Predominant Valuation Technique | Significant Unobservable Input | Minimum | Maximum | Weighted Average [1] | Impact of Increase in Input on Fair Value [2] | ||
| As of March 31, 2017 | |||||||||
| CMBS [3] | $ | 76 | Discounted cash flows | Spread (encompasses prepayment, default risk and loss severity) | 9 bps | 1,272 bps | 463 bps | Decrease | |
| Corporate [4] | 438 | Discounted cash flows | Spread | 107 bps | 963 bps | 328 bps | Decrease | ||
| Municipal [3] | 101 | Discounted cash flows | Spread | 186 bps | 241 bps | 208 bps | Decrease | ||
| RMBS [3] | 2,038 | Discounted cash flows | Spread | 34 bps | 1,371 bps | 179 bps | Decrease | ||
| Constant prepayment rate | —% | 20% | 4% | Decrease [5] | |||||
| Constant default rate | 1% | 10% | 5% | Decrease | |||||
| Loss severity | —% | 100% | 73% | Decrease | |||||
| As of December 31, 2016 | |||||||||
| CMBS [3] | $ | 52 | Discounted cash flows | Spread (encompasses prepayment, default risk and loss severity) | 10 bps | 1,273 bps | 366 bps | Decrease | |
| Corporate [4] | 510 | Discounted cash flows | Spread | 122 bps | 1,302 bps | 359 bps | Decrease | ||
| Municipal [3] | 101 | Discounted cash flows | Spread | 135 bps | 286 bps | 221 bps | Decrease | ||
| RMBS [3] | 1,963 | Discounted cash flows | Spread | 16 bps | 1,830 bps | 192 bps | Decrease | ||
| Constant prepayment rate | —% | 20% | 4% | Decrease [5] | |||||
| Constant default rate | —% | 11% | 5% | Decrease | |||||
| Loss severity | —% | 100% | 75% | Decrease | |||||
| [1] | The weighted average is determined based on the fair value of the securities. |
| [2] | Conversely, the impact of a decrease in input would have the opposite impact to the fair value as that presented in the table. |
| [3] |
| [4] | Excludes securities for which the Company bases fair value on broker |
| [ | Decrease for above market rate coupons and increase for below market rate coupons. |
| Freestanding Derivatives | Unobservable Inputs | |||||||||||||||||||
| Significant Unobservable Inputs for Level 3 - Freestanding Derivatives | Significant Unobservable Inputs for Level 3 - Freestanding Derivatives | |||||||||||||||||||
| As of March 31, 2016 | Fair Value | Predominant Valuation Technique | Significant Unobservable Input | Minimum | Maximum | Impact of Increase in Input on Fair Value [1] | ||||||||||||||
Fair Value | Predominant Valuation Technique | Significant Unobservable Input | Minimum | Maximum | Impact of Increase in Input on Fair Value [1] | |||||||||||||||
| Interest rate derivative | ||||||||||||||||||||
| As of March 31, 2017 | As of March 31, 2017 | |||||||||||||||||||
| Interest rate derivatives | ||||||||||||||||||||
| Interest rate swaps | $ | (32 | ) | Discounted cash flows | Swap curve beyond 30 years | 2 | % | 2 | % | Decrease | $ | (29 | ) | Discounted cash flows | Swap curve beyond 30 years | 3 | % | 3 | % | Decrease |
| Interest rate swaptions [2] | 4 | Option model | Interest rate volatility | 2 | % | 2 | % | Increase | 5 | Option model | Interest rate volatility | 2 | % | 2 | % | Increase | ||||
| GMWB hedging instruments | ||||||||||||||||||||
| Equity variance swaps | (34 | ) | Option model | Equity volatility | 22 | % | 24 | % | Increase | (39 | ) | Option model | Equity volatility | 16 | % | 20 | % | Increase | ||
| Equity options | 28 | Option model | Equity volatility | 26 | % | 29 | % | Increase | 9 | Option model | Equity volatility | 26 | % | 28 | % | Increase | ||||
| Customized swaps | 150 | Discounted cash flows | Equity volatility | 12 | % | 30 | % | Increase | 76 | Discounted cash flows | Equity volatility | 9 | % | 30 | % | Increase | ||||
| Macro hedge program [3] | ||||||||||||||||||||
| Equity options | 178 | Option model | Equity volatility | 12 | % | 27 | % | Increase | 164 | Option model | Equity volatility | 15 | % | 32 | % | Increase | ||||
| As of December 31, 2015 | ||||||||||||||||||||
| Interest rate derivative | ||||||||||||||||||||
| As of December 31, 2016 | As of December 31, 2016 | |||||||||||||||||||
| Interest rate derivatives | ||||||||||||||||||||
| Interest rate swaps | $ | (30 | ) | Discounted cash flows | Swap curve beyond 30 years | 3 | % | 3 | % | Decrease | $ | (29 | ) | Discounted cash flows | Swap curve beyond 30 years | 3 | % | 3 | % | Decrease |
| Interest rate swaptions [2] | 8 | Option model | Interest rate volatility | 1 | % | 2 | % | Increase | 8 | Option model | Interest rate volatility | 2 | % | 2 | % | Increase | ||||
| GMWB hedging instruments | ||||||||||||||||||||
| Equity variance swaps | (31 | ) | Option model | Equity volatility | 19 | % | 21 | % | Increase | (36 | ) | Option model | Equity volatility | 20 | % | 23 | % | Increase | ||
| Equity options | 35 | Option model | Equity volatility | 27 | % | 29 | % | Increase | 17 | Option model | Equity volatility | 27 | % | 30 | % | Increase | ||||
| Customized swaps | 131 | Discounted cash flows | Equity volatility | 10 | % | 40 | % | Increase | 100 | Discounted cash flows | Equity volatility | 12 | % | 30 | % | Increase | ||||
| Macro hedge program [3] | ||||||||||||||||||||
| Equity options | 179 | Option model | Equity volatility | 14 | % | 28 | % | Increase | 188 | Option model | Equity volatility | 17 | % | 28 | % | Increase | ||||
| [1] | Conversely, the impact of a decrease in input would have the opposite impact to the fair value as that presented in the table. Changes are based on long positions, unless otherwise noted. Changes in fair value will be inversely impacted for short positions. |
| [2] | The swaptions presented are purchased options that have the right to enter into a pay-fixed swap. |
| [3] |
| GMWB Embedded Derivatives | The Company formerly offered certain variable annuity products with GMWB riders that provide the policyholder with a guaranteed remaining balance ("GRB") which is generally equal to premiums less withdrawals. If the policyholder’s account value is reduced to a specified level through a combination of market declines and withdrawals but the GRB still has value, the Company is obligated to continue to make annuity payments to the policyholder until the GRB is exhausted. When payments of the GRB are not life-contingent, the GMWB represents an embedded derivative carried at fair value reported in other policyholder funds and benefits payable in the Condensed Consolidated Balance Sheets with changes in fair value reported in net realized capital gains and losses. |
| Free-standing Customized Derivatives | The Company holds free-standing customized derivative contracts to provide protection from certain capital markets risks for the remaining term of specified blocks of non-reinsured GMWB riders. These customized derivatives are based on policyholder behavior assumptions specified at the inception of the derivative contracts. The Company retains the risk for differences between assumed and actual policyholder behavior and between the performance of the actively managed funds underlying the separate accounts and their respective indices. These derivatives are reported in the Condensed Consolidated Balance Sheets within other investments or other liabilities, as appropriate, after considering the impact of master netting agreements. |
| GMWB Reinsurance Derivative | The Company has reinsurance arrangements in place to transfer a portion of its risk of loss due to GMWB. These arrangements are recognized as derivatives carried at fair value and reported in reinsurance recoverables in the Condensed Consolidated Balance Sheets. Changes in the fair value of the reinsurance agreements are reported in net realized capital gains and losses. |
| Valuation Inputs Used in Levels 2 and 3 Measurements for GMWB Embedded, Customized and Reinsurance Derivatives | |||
| Level 2 Primary Observable Inputs | Level 3 Primary Unobservable Inputs | ||
• Risk-free rates as represented by the Eurodollar futures, LIBOR deposits and swap rates to derive forward curve rates • Correlations of 10 years of observed historical returns across underlying well-known market indices • Correlations of historical index returns compared to separate account fund returns • Equity index levels | • Market implied equity volatility assumptions Assumptions about policyholder behavior, including: • Withdrawal utilization • Withdrawal rates • Lapse rates • Reset elections | ||
| Significant Unobservable Inputs for Level 3 GMWB Embedded Customized and Reinsurance Derivatives | Significant Unobservable Inputs for Level 3 GMWB Embedded Customized and Reinsurance Derivatives | |||||
| As of March 31, 2016 | As of March 31, 2017 | |||||
| Significant Unobservable Input | Unobservable Inputs (Minimum) | Unobservable Inputs (Maximum) | Impact of Increase in Input on Fair Value Measurement [1] | Unobservable Inputs (Minimum) | Unobservable Inputs (Maximum) | Impact of Increase in Input on Fair Value Measurement [1] |
| Withdrawal Utilization [2] | 20% | 100% | Increase | 15% | 100% | Increase |
| Withdrawal Rates [3] | —% | 8% | Increase | —% | 8% | Increase |
| Lapse Rates [4] | —% | 75% | Decrease | —% | 40% | Decrease |
| Reset Elections [5] | 20% | 75% | Increase | 20% | 75% | Increase |
| Equity Volatility [6] | 12% | 30% | Increase | 9% | 30% | Increase |
| As of December 31, 2015 | As of December 31, 2016 | |||||
| Significant Unobservable Input | Unobservable Inputs (Minimum) | Unobservable Inputs (Maximum) | Impact of Increase in Input on Fair Value Measurement [1] | Unobservable Inputs (Minimum) | Unobservable Inputs (Maximum) | Impact of Increase in Input on Fair Value Measurement [1] |
| Withdrawal Utilization [2] | 20% | 100% | Increase | 15% | 100% | Increase |
| Withdrawal Rates [3] | —% | 8% | Increase | —% | 8% | Increase |
| Lapse Rates [4] | —% | 75% | Decrease | —% | 40% | Decrease |
| Reset Elections [5] | 20% | 75% | Increase | 20% | 75% | Increase |
| Equity Volatility [6] | 10% | 40% | Increase | 12% | 30% | Increase |
| [1] | Conversely, the impact of a decrease in input would have the opposite impact to the fair value as that presented in the table. |
| [2] | Range represents assumed cumulative percentages of policyholders taking withdrawals. |
| [3] | Range represents assumed cumulative annual amount withdrawn by policyholders. |
| [4] | Range represents assumed annual percentages of full surrender of the underlying variable annuity contracts across all policy durations for in force business. |
| [5] | Range represents assumed cumulative percentages of policyholders that would elect to reset their guaranteed benefit base. |
| [6] | Range represents implied market volatilities for equity indices based on multiple pricing sources. |
| Fair Value Roll-forwards for Financial Instruments Classified as Level 3 for the Three Months Ended March 31, 2017 | ||||||||||||||||||||||||||||
| Total realized/unrealized gains (losses) | ||||||||||||||||||||||||||||
| Fair value as of January 1, 2017 | Included in net income [1] [2] [6] | Included in OCI [3] | Purchases [8] | Settlements | Sales | Transfers into Level 3 [4] | Transfers out of Level 3 [4] | Fair value as of March 31, 2017 | ||||||||||||||||||||
| Assets | ||||||||||||||||||||||||||||
| Fixed Maturities, AFS | ||||||||||||||||||||||||||||
| ABS | $ | 82 | $ | — | $ | — | $ | 45 | $ | (5 | ) | $ | — | $ | 26 | $ | (23 | ) | $ | 125 | ||||||||
| CDOs | 414 | — | 4 | — | (1 | ) | — | — | (98 | ) | 319 | |||||||||||||||||
| CMBS | 80 | (1 | ) | — | 56 | (3 | ) | — | — | (15 | ) | 117 | ||||||||||||||||
| Corporate | 1,080 | 6 | 16 | 169 | (36 | ) | (160 | ) | 40 | (37 | ) | 1,078 | ||||||||||||||||
| Foreign Govt./Govt. Agencies | 64 | — | 3 | — | (1 | ) | — | — | — | 66 | ||||||||||||||||||
| Municipal | 118 | — | 5 | — | — | (6 | ) | — | — | 117 | ||||||||||||||||||
| RMBS | 1,972 | — | 6 | 173 | (96 | ) | (7 | ) | — | — | 2,048 | |||||||||||||||||
| Total Fixed Maturities, AFS | 3,810 | 5 | 34 | 443 | (142 | ) | (173 | ) | 66 | (173 | ) | 3,870 | ||||||||||||||||
| Fixed Maturities, FVO | 11 | — | — | 4 | (2 | ) | (13 | ) | — | — | — | |||||||||||||||||
| Equity Securities, AFS | 99 | — | (4 | ) | 4 | — | — | — | — | 99 | ||||||||||||||||||
| Freestanding Derivatives, net [5] | ||||||||||||||||||||||||||||
| Equity | — | (1 | ) | — | 5 | — | — | — | — | 4 | ||||||||||||||||||
| Interest rate | (21 | ) | (3 | ) | — | — | — | — | — | — | (24 | ) | ||||||||||||||||
| GMWB hedging instruments | 81 | (35 | ) | — | — | — | — | — | — | 46 | ||||||||||||||||||
| Macro hedge program | 167 | (8 | ) | — | — | — | — | — | — | 159 | ||||||||||||||||||
| Other contracts | 1 | (1 | ) | — | — | — | — | — | — | — | ||||||||||||||||||
| Total Freestanding Derivatives, net [5] | 228 | (48 | ) | — | 5 | — | — | — | — | 185 | ||||||||||||||||||
| Reinsurance Recoverable for GMWB | 73 | (17 | ) | — | — | 4 | — | — | — | 60 | ||||||||||||||||||
| Separate Accounts | 201 | — | 3 | 97 | (4 | ) | (8 | ) | 3 | (15 | ) | 277 | ||||||||||||||||
| Total Assets | $ | 4,422 | $ | (60 | ) | $ | 33 | $ | 553 | $ | (144 | ) | $ | (194 | ) | $ | 69 | $ | (188 | ) | $ | 4,491 | ||||||
| Liabilities | ||||||||||||||||||||||||||||
| Other Policyholder Funds and Benefits Payable | ||||||||||||||||||||||||||||
| Guaranteed Withdrawal Benefits | $ | (241 | ) | $ | 100 | $ | — | $ | — | $ | (16 | ) | $ | — | $ | — | $ | — | $ | (157 | ) | |||||||
| Equity Linked Notes | (33 | ) | (3 | ) | — | — | — | — | — | — | (36 | ) | ||||||||||||||||
| Total Other Policyholder Funds and Benefits Payable | (274 | ) | 97 | — | — | (16 | ) | — | — | — | (193 | ) | ||||||||||||||||
| Contingent Consideration [7] | (25 | ) | (1 | ) | — | — | — | — | — | — | (26 | ) | ||||||||||||||||
| Total Liabilities | $ | (299 | ) | $ | 96 | $ | — | $ | — | $ | (16 | ) | $ | — | $ | — | $ | — | $ | (219 | ) | |||||||
| Fixed Maturities, AFS | |||||||||||||||||||||||||||
| Assets | ABS | CDOs | CMBS | Corporate | Foreign Govt./Govt. Agencies | Municipal | RMBS | Total Fixed Maturities, AFS | Fixed Maturities, FVO | ||||||||||||||||||
| Fair value as of January 1, 2016 | $ | 37 | $ | 541 | $ | 150 | $ | 854 | $ | 60 | $ | 49 | $ | 1,622 | $ | 3,313 | $ | 16 | |||||||||
| Total realized/unrealized gains (losses) | |||||||||||||||||||||||||||
| Included in net income [1] [2] [6] | — | — | (1 | ) | (13 | ) | — | — | — | (14 | ) | (2 | ) | ||||||||||||||
| Included in OCI [3] | — | — | (8 | ) | (7 | ) | 5 | 1 | (14 | ) | (23 | ) | — | ||||||||||||||
| Purchases | — | — | 40 | 30 | 14 | — | 333 | 417 | 5 | ||||||||||||||||||
| Settlements | (3 | ) | 1 | (9 | ) | (5 | ) | (1 | ) | — | (57 | ) | (74 | ) | (1 | ) | |||||||||||
| Sales | — | — | — | (25 | ) | (2 | ) | — | — | (27 | ) | — | |||||||||||||||
| Transfers into Level 3 [4] | 5 | — | — | 58 | — | — | 2 | 65 | — | ||||||||||||||||||
| Transfers out of Level 3 [4] | (7 | ) | — | (38 | ) | (58 | ) | — | — | — | (103 | ) | (4 | ) | |||||||||||||
| Fair value as of March 31, 2016 | $ | 32 | $ | 542 | $ | 134 | $ | 834 | $ | 76 | $ | 50 | $ | 1,886 | $ | 3,554 | $ | 14 | |||||||||
| Changes in unrealized gains (losses) included in net income related to financial instruments still held at March 31, 2016 [2] [7] | $ | — | $ | — | $ | (1 | ) | $ | (13 | ) | $ | — | $ | — | $ | — | $ | (14 | ) | $ | (1 | ) | |||||
| Freestanding Derivatives [5] | |||||||||||||||||||||
| Assets (Liabilities) | Equity Securities, AFS | Equity | Interest Rate | GMWB Hedging | Macro Hedge Program | Other Contracts | Total Free- Standing Derivatives [5] | ||||||||||||||
| Fair value as of January 1, 2016 | $ | 93 | $ | — | $ | (22 | ) | $ | 135 | $ | 147 | $ | 7 | $ | 267 | ||||||
| Total realized/unrealized gains (losses) | |||||||||||||||||||||
| Included in net income [1] [2] [6] | (1 | ) | (11 | ) | (6 | ) | 9 | — | (2 | ) | (10 | ) | |||||||||
| Included in OCI [3] | 2 | — | — | — | — | — | — | ||||||||||||||
| Purchases | — | 16 | — | — | — | — | 16 | ||||||||||||||
| Settlements | — | — | — | — | (2 | ) | — | (2 | ) | ||||||||||||
| Sales | (2 | ) | — | — | — | — | — | — | |||||||||||||
| Transfers into Level 3 [4] | — | — | — | — | — | — | — | ||||||||||||||
| Transfers out of Level 3 [4] | — | — | — | — | — | — | — | ||||||||||||||
| Fair value as of March 31, 2016 | $ | 92 | $ | 5 | $ | (28 | ) | $ | 144 | $ | 145 | $ | 5 | $ | 271 | ||||||
| Changes in unrealized gains (losses) included in net income related to financial instruments still held at March 31, 2016 [2] [7] | $ | (1 | ) | $ | (11 | ) | $ | (6 | ) | $ | 9 | $ | (1 | ) | $ | (2 | ) | $ | (11 | ) | |
| Assets | Reinsurance Recoverable for GMWB | Separate Accounts | ||||
| Fair value as of January 1, 2016 | $ | 83 | $ | 139 | ||
| Total realized/unrealized gains (losses) | ||||||
| Included in net income [1] [2] [6] | 12 | — | ||||
| Included in OCI [3] | — | 4 | ||||
| Purchases | — | 38 | ||||
| Settlements | 4 | (5 | ) | |||
| Sales | — | (10 | ) | |||
| Transfers into Level 3 [4] | — | 3 | ||||
| Transfers out of Level 3 [4] | — | (15 | ) | |||
| Fair value as of March 31, 2016 | $ | 99 | $ | 154 | ||
| Changes in unrealized gains (losses) included in net income related to financial instruments still held at March 31, 2016 [2] [7] | $ | 12 | $ | — | ||
| Other Policyholder Funds and Benefits Payable | |||||||||
| Liabilities | Guaranteed Withdrawal Benefits | Equity Linked Notes | Total Other Policyholder Funds and Benefits Payable | ||||||
| Fair value as of January 1, 2016 | $ | (262 | ) | $ | (26 | ) | $ | (288 | ) |
| Total realized/unrealized gains (losses) | |||||||||
| Included in net income [1] [2] [6] | (82 | ) | 1 | (81 | ) | ||||
| Settlements | (17 | ) | — | (17 | ) | ||||
| Fair value as of March 31, 2016 | $ | (361 | ) | $ | (25 | ) | $ | (386 | ) |
| Changes in unrealized gains (losses) included in net income related to financial instruments still held at March 31, 2016 [2] [7] | $ | (82 | ) | $ | 1 | $ | (81 | ) | |
| Fixed Maturities, AFS | |||||||||||||||||||||||||||
| Assets | ABS | CDOs | CMBS | Corporate | Foreign Govt./Govt. Agencies | Municipal | RMBS | Total Fixed Maturities, AFS | Fixed Maturities, FVO | ||||||||||||||||||
| Fair value as of January 1, 2015 | $ | 122 | $ | 623 | $ | 284 | $ | 1,040 | $ | 59 | $ | 66 | $ | 1,281 | $ | 3,475 | $ | 92 | |||||||||
| Total realized/unrealized gains (losses) | |||||||||||||||||||||||||||
| Included in net income [1] [2] [6] | — | (2 | ) | (1 | ) | (4 | ) | — | — | (1 | ) | (8 | ) | (5 | ) | ||||||||||||
| Included in OCI [3] | — | 19 | (3 | ) | (28 | ) | 1 | (2 | ) | (1 | ) | (14 | ) | — | |||||||||||||
| Purchases | 43 | — | 21 | 5 | 5 | — | 310 | 384 | 12 | ||||||||||||||||||
| Settlements | (1 | ) | (9 | ) | (13 | ) | 1 | (1 | ) | — | (46 | ) | (69 | ) | — | ||||||||||||
| Sales | — | — | — | (7 | ) | (16 | ) | — | (31 | ) | (54 | ) | (4 | ) | |||||||||||||
| Transfers into Level 3 [4] | 1 | — | 5 | 139 | — | — | 4 | 149 | — | ||||||||||||||||||
| Transfers out of Level 3 [4] | (4 | ) | (47 | ) | (25 | ) | (34 | ) | — | — | (53 | ) | (163 | ) | (10 | ) | |||||||||||
| Fair value as of March 31, 2015 | $ | 161 | $ | 584 | $ | 268 | $ | 1,112 | $ | 48 | $ | 64 | $ | 1,463 | $ | 3,700 | $ | 85 | |||||||||
| Changes in unrealized gains (losses) included in net income related to financial instruments still held at March 31, 2015 [2] [7] | $ | — | $ | (1 | ) | $ | (1 | ) | $ | (2 | ) | $ | — | $ | — | $ | (1 | ) | $ | (5 | ) | $ | (1 | ) | |||
| Freestanding Derivatives [5] | ||||||||||||||||||||||||
| Assets (Liabilities) | Equity Securities, AFS | Credit | Equity | Interest Rate | GMWB Hedging | Macro Hedge Program | Other Contracts | Total Free-Standing Derivatives [5] | ||||||||||||||||
| Fair value as of January 1, 2015 | $ | 98 | $ | (9 | ) | $ | 6 | $ | (7 | ) | $ | 170 | $ | 141 | $ | 12 | $ | 313 | ||||||
| Total realized/unrealized gains (losses) | ||||||||||||||||||||||||
| Included in net income [1] [2] [6] | 1 | 5 | 17 | (11 | ) | 9 | (1 | ) | (1 | ) | 18 | |||||||||||||
| Included in OCI [3] | (3 | ) | — | — | — | — | — | — | — | |||||||||||||||
| Purchases | 8 | (7 | ) | — | — | — | 47 | — | 40 | |||||||||||||||
| Settlements | — | — | (15 | ) | — | (20 | ) | — | — | (35 | ) | |||||||||||||
| Sales | (2 | ) | — | — | — | — | — | — | — | |||||||||||||||
| Transfers into Level 3 [4] | — | — | — | — | — | — | — | — | ||||||||||||||||
| Transfers out of Level 3 [4] | — | — | — | — | — | — | — | — | ||||||||||||||||
| Fair value as of March 31, 2015 | $ | 102 | $ | (11 | ) | $ | 8 | $ | (18 | ) | $ | 159 | $ | 187 | $ | 11 | $ | 336 | ||||||
| Changes in unrealized gains (losses) included in net income related to financial instruments still held at March 31, 2015 [2] [7] | $ | 1 | $ | 5 | $ | 3 | $ | (19 | ) | $ | 16 | $ | 3 | $ | (1 | ) | $ | 7 | ||||||
| Assets | Reinsurance Recoverable for GMWB | Separate Accounts | ||||
| Fair value as of January 1, 2015 | $ | 56 | $ | 112 | ||
| Total realized/unrealized gains (losses) | ||||||
| Included in net income [1] [2] [6] | 4 | 1 | ||||
| Purchases | — | 38 | ||||
| Settlements | 5 | (5 | ) | |||
| Sales | — | (6 | ) | |||
| Transfers into Level 3 [4] | — | 1 | ||||
| Transfers out of Level 3 [4] | — | (4 | ) | |||
| Fair value as of March 31, 2015 | $ | 65 | $ | 137 | ||
| Changes in unrealized gains (losses) included in net income related to financial instruments still held at March 31, 2015 [2] [7] | $ | 4 | $ | 1 | ||
| Other Policyholder Funds and Benefits Payable | ||||||||||||
| Liabilities | Guaranteed Withdrawal Benefits | Equity Linked Notes | Total Other Policyholder Funds and Benefits Payable | Consumer Notes | ||||||||
| Fair value as of January 1, 2015 | $ | (139 | ) | $ | (26 | ) | $ | (165 | ) | $ | (3 | ) |
| Total realized/unrealized gains (losses) | ||||||||||||
| Included in net income [1] [2] [6] | (19 | ) | — | (19 | ) | — | ||||||
| Settlements | (18 | ) | — | (18 | ) | — | ||||||
| Fair value as of March 31, 2015 | $ | (176 | ) | $ | (26 | ) | $ | (202 | ) | $ | (3 | ) |
| Changes in unrealized gains (losses) included in net income related to financial instruments still held at March 31, 2015 [2] [7] | $ | (19 | ) | $ | — | $ | (19 | ) | $ | — | ||
| Fair Value Roll-forwards for Financial Instruments Classified as Level 3 for the Three Months Ended March 31, 2016 | ||||||||||||||||||||||||||||
| Total realized/unrealized gains (losses) | ||||||||||||||||||||||||||||
| Fair value as of January 1, 2016 | Included in net income [1] [2] [6] | Included in OCI [3] | Purchases [8] | Settlements | Sales | Transfers into Level 3 [4] | Transfers out of Level 3 [4] | Fair value as of March 31, 2016 | ||||||||||||||||||||
| Assets | ||||||||||||||||||||||||||||
| Fixed Maturities, AFS | ||||||||||||||||||||||||||||
| ABS | $ | 37 | $ | — | $ | — | $ | — | $ | (3 | ) | $ | — | $ | 5 | $ | (7 | ) | $ | 32 | ||||||||
| CDOs | 541 | — | — | — | 1 | — | — | — | 542 | |||||||||||||||||||
| CMBS | 150 | (1 | ) | (8 | ) | 40 | (9 | ) | — | — | (38 | ) | 134 | |||||||||||||||
| Corporate | 854 | (13 | ) | (7 | ) | 30 | (5 | ) | (25 | ) | 58 | (58 | ) | 834 | ||||||||||||||
| Foreign Govt./Govt. Agencies | 60 | — | 5 | 14 | (1 | ) | (2 | ) | — | — | 76 | |||||||||||||||||
| Municipal | 49 | — | 1 | — | — | — | — | — | 50 | |||||||||||||||||||
| RMBS | 1,622 | — | (14 | ) | 333 | (57 | ) | — | 2 | — | 1,886 | |||||||||||||||||
| Total Fixed Maturities, AFS | 3,313 | (14 | ) | (23 | ) | 417 | (74 | ) | (27 | ) | 65 | (103 | ) | 3,554 | ||||||||||||||
| Fixed Maturities, FVO | 16 | (2 | ) | — | 5 | (1 | ) | — | — | (4 | ) | 14 | ||||||||||||||||
| Equity Securities, AFS | 93 | (1 | ) | 2 | — | — | (2 | ) | — | — | 92 | |||||||||||||||||
| Freestanding Derivatives, net [5] | ||||||||||||||||||||||||||||
| Equity | — | (11 | ) | — | 16 | — | — | — | — | 5 | ||||||||||||||||||
| Interest rate | (22 | ) | (6 | ) | — | — | — | — | — | — | (28 | ) | ||||||||||||||||
| GMWB hedging instruments | 135 | 9 | — | — | — | — | — | — | 144 | |||||||||||||||||||
| Macro hedge program | 147 | — | — | — | (2 | ) | — | — | — | 145 | ||||||||||||||||||
| Other contracts | 7 | (2 | ) | — | — | — | — | — | — | 5 | ||||||||||||||||||
| Total Freestanding Derivatives, net [5] | 267 | (10 | ) | — | 16 | (2 | ) | — | — | — | 271 | |||||||||||||||||
| Reinsurance Recoverable for GMWB | 83 | 12 | — | — | 4 | — | — | — | 99 | |||||||||||||||||||
| Separate Accounts | 139 | — | 4 | 38 | (5 | ) | (10 | ) | 3 | (15 | ) | 154 | ||||||||||||||||
| Total Assets | $ | 3,911 | $ | (15 | ) | $ | (17 | ) | $ | 476 | $ | (78 | ) | $ | (39 | ) | $ | 68 | $ | (122 | ) | $ | 4,184 | |||||
| Liabilities | ||||||||||||||||||||||||||||
| Other Policyholder Funds and Benefits Payable | ||||||||||||||||||||||||||||
| Guaranteed Withdrawal Benefits | $ | (262 | ) | $ | (82 | ) | $ | — | $ | — | $ | (17 | ) | $ | — | $ | — | $ | — | $ | (361 | ) | ||||||
| Equity Linked Notes | (26 | ) | 1 | — | — | — | — | — | — | (25 | ) | |||||||||||||||||
| Total Other Policyholder Funds and Benefits Payable | (288 | ) | (81 | ) | — | — | (17 | ) | — | — | — | (386 | ) | |||||||||||||||
| Total Liabilities | $ | (288 | ) | $ | (81 | ) | $ | — | $ | — | $ | (17 | ) | $ | — | $ | — | $ | — | $ | (386 | ) | ||||||
| [1] | The Company classifies realized and unrealized gains (losses) on GMWB reinsurance derivatives and GMWB embedded derivatives as unrealized gains (losses) for purposes of disclosure in this table because it is impracticable to track on a contract-by-contract basis the realized gains (losses) for these derivatives and embedded derivatives. |
| [2] |
| [3] | All amounts are before income taxes and amortization of DAC. |
| [4] | Transfers in and/or (out) of Level 3 are primarily attributable to the availability of market observable information and the re-evaluation of the observability of pricing inputs. |
| [5] | Derivative instruments are reported in this table on a net basis for asset (liability) positions and reported in the Condensed Consolidated Balance Sheets in other investments and other liabilities. |
| [6] | Includes both market and non-market impacts in deriving realized and unrealized gains (losses). |
| [7] | For additional information, see the Contingent Consideration section of Note 5 - Fair Value Measurements of Notes to Condensed Consolidated Financial Statements. |
| [8] | Includes issuance of contingent consideration associated with the Lattice acquisition, see Note 2 - Business Disposition of Notes to Condensed Consolidated Financial Statements for |
| Changes in Unrealized Gains (Losses) Included in Net Income for Financial Instruments Classified as Level 3 Still Held at: | |||||||
| March 31, 2017 [1] [2] | March 31, 2016 [1] [2] | ||||||
| Assets | |||||||
| Fixed Maturities, AFS | |||||||
| ABS | $ | — | $ | — | |||
| CDOs | — | — | |||||
| CMBS | (1 | ) | (1 | ) | |||
| Corporate | — | (13 | ) | ||||
| Foreign Govt./Govt. Agencies | — | — | |||||
| Municipal | — | — | |||||
| RMBS | — | — | |||||
| Total Fixed Maturities, AFS | (1 | ) | (14 | ) | |||
| Fixed Maturities, FVO | — | (1 | ) | ||||
| Equity Securities, AFS | — | (1 | ) | ||||
| Freestanding Derivatives, net | |||||||
| Equity | (1 | ) | (11 | ) | |||
| Interest rate | (3 | ) | (6 | ) | |||
| GMWB hedging instruments | (36 | ) | 9 | ||||
| Macro hedge program | (8 | ) | (1 | ) | |||
| Other Contracts | — | (2 | ) | ||||
| Total Freestanding Derivatives, net | (48 | ) | (11 | ) | |||
| Reinsurance Recoverable for GMWB | (17 | ) | 12 | ||||
| Separate Accounts | — | — | |||||
| Total Assets | $ | (66 | ) | $ | (15 | ) | |
| Liabilities | |||||||
| Other Policyholder Funds and Benefits Payable | |||||||
| Guaranteed Withdrawal Benefits | $ | 100 | $ | (82 | ) | ||
| Equity Linked Notes | (3 | ) | 1 | ||||
| Total Other Policyholder Funds and Benefits Payable | 97 | (81 | ) | ||||
| Contingent Consideration [3] | (1 | ) | — | ||||
| Total Liabilities | $ | 96 | $ | (81 | ) | ||
| [1] | All amounts in these rows are reported in net realized capital gains (losses). The realized/unrealized gains (losses) included in net income for separate account assets are offset by an equal amount for separate account liabilities, which results in a net zero impact on net income for the Company. All amounts are before income taxes and amortization of DAC. |
| [2] | Amounts presented are for Level 3 only and therefore may not agree to other disclosures included herein. |
| [3] | For additional information, see the Contingent Consideration section of Note 5 - Fair Value Measurements of Notes to Condensed Consolidated Financial Statements. |
| Three Months Ended March 31, | ||||||
| 2016 | 2015 | |||||
| Assets | ||||||
| Fixed maturities, FVO | ||||||
| CDOs | $ | — | $ | 1 | ||
| Foreign government | (1 | ) | — | |||
| RMBS | 1 | 1 | ||||
| Total fixed maturities, FVO | $ | — | $ | 2 | ||
| Equity, FVO | (34 | ) | 2 | |||
| Total realized capital gains (losses) | $ | (34 | ) | $ | 4 | |
| March 31, 2016 | December 31, 2015 | |||||
| Assets | ||||||
| Fixed maturities, FVO | ||||||
| ABS | $ | 9 | $ | 13 | ||
| CDOs | 4 | 6 | ||||
| CMBS | 16 | 24 | ||||
| Corporate | 62 | 87 | ||||
| Foreign government | 8 | 2 | ||||
| U.S government | 3 | 3 | ||||
| RMBS | 384 | 368 | ||||
| Total fixed maturities, FVO | $ | 486 | $ | 503 | ||
| Equity, FVO [1] | $ | — | $ | 282 | ||
| Changes in Fair Value of Assets using Fair Value Option | ||||||
| Three Months Ended March 31, | ||||||
| 2017 | 2016 | |||||
| Assets | ||||||
| Fixed maturities, FVO | ||||||
| Corporate | $ | (1 | ) | $ | — | |
| Foreign government | — | (1 | ) | |||
| RMBS | 1 | 1 | ||||
| Total fixed maturities, FVO | $ | — | $ | — | ||
| Equity, FVO | (1 | ) | (34 | ) | ||
| Total realized capital gains (losses) | $ | (1 | ) | $ | (34 | ) |
| March 31, 2016 | December 31, 2015 | ||||||||||||
| Fair Value Hierarchy Level | Carrying Amount | Fair Value | Carrying Amount | Fair Value | |||||||||
| Assets | |||||||||||||
| Policy loans | Level 3 | $ | 1,444 | $ | 1,444 | $ | 1,447 | $ | 1,447 | ||||
| Mortgage loans | Level 3 | 5,637 | 5,900 | 5,624 | 5,736 | ||||||||
| Liabilities | |||||||||||||
| Other policyholder funds and benefits payable [1] | Level 3 | $ | 6,636 | $ | 6,888 | $ | 6,706 | $ | 6,898 | ||||
| Senior notes [2] | Level 2 | 4,240 | 4,836 | 4,259 | 4,811 | ||||||||
| Junior subordinated debentures [2] | Level 2 | 1,083 | 1,283 | 1,100 | 1,304 | ||||||||
| Consumer notes [3] | Level 3 | 33 | 33 | 38 | 38 | ||||||||
| Assumed investment contracts [3] | Level 3 | 668 | 730 | 619 | 682 | ||||||||
| Fair Value of Assets and Liabilities using the Fair Value Option | ||||||
| March 31, 2017 | December 31, 2016 | |||||
| Assets | ||||||
| Fixed maturities, FVO | ||||||
| ABS | $ | — | $ | 7 | ||
| CDOs | — | 3 | ||||
| CMBS | — | 8 | ||||
| Corporate | — | 40 | ||||
| U.S government | — | 7 | ||||
| RMBS | 160 | 228 | ||||
| Total fixed maturities, FVO | $ | 160 | $ | 293 | ||
| Equity, FVO [1] | $ | 123 | $ | — | ||
| [1] | Included in equity securities, AFS on the Condensed Consolidated Balance Sheets. |
| Financial Assets and Liabilities Not Carried at Fair Value | |||||||
| Fair Value Hierarchy Level | Carrying Amount | Fair Value | |||||
| March 31, 2017 | |||||||
| Assets | |||||||
| Policy loans | Level 3 | $ | 1,442 | $ | 1,442 | ||
| Mortgage loans | Level 3 | 5,685 | 5,689 | ||||
| Liabilities | |||||||
| Other policyholder funds and benefits payable [1] | Level 3 | $ | 6,626 | $ | 6,809 | ||
| Senior notes [2] | Level 2 | 3,554 | 4,110 | ||||
| Junior subordinated debentures [2] | Level 2 | 1,583 | 1,708 | ||||
| Consumer notes [3] [4] | Level 3 | 14 | 14 | ||||
| Assumed investment contracts [3] | Level 3 | 514 | 547 | ||||
| December 31, 2016 | |||||||
| Assets | |||||||
| Policy loans | Level 3 | $ | 1,444 | $ | 1,444 | ||
| Mortgage loans | Level 3 | 5,697 | 5,721 | ||||
| Liabilities | |||||||
| Other policyholder funds and benefits payable [1] | Level 3 | $ | 6,714 | $ | 6,906 | ||
| Senior notes [2] | Level 2 | 3,969 | 4,487 | ||||
| Junior subordinated debentures [2] | Level 2 | 1,083 | 1,246 | ||||
| Consumer notes [3] [4] | Level 3 | 20 | 20 | ||||
| Assumed investment contracts [3] | Level 3 | 487 | 526 | ||||
| [1] | Excludes guarantees on variable annuities, group accident and health and universal life insurance contracts, including corporate owned life insurance. |
| [2] | Included in long-term debt in the Condensed Consolidated Balance Sheets, except for current maturities, which are included in short-term debt. |
| [3] | Excludes amounts carried at fair value and included in preceding disclosures. |
| [4] | Included in other liabilities in the Condensed Consolidated Balance Sheets. |
| Net Realized Capital Gains (Losses) | ||||||
| Three Months Ended March 31, | ||||||
| (Before tax) | 2017 | 2016 | ||||
| Gross gains on sales | $ | 112 | $ | 90 | ||
| Gross losses on sales | (75 | ) | (108 | ) | ||
| Net OTTI losses recognized in earnings | (1 | ) | (23 | ) | ||
| Results of variable annuity hedge program | ||||||
| GMWB derivatives, net | 18 | (17 | ) | |||
| Macro hedge program | (86 | ) | (14 | ) | ||
| Total results of variable annuity hedge program | (68 | ) | (31 | ) | ||
| Transactional foreign currency revaluation | (13 | ) | (44 | ) | ||
| Non-qualifying foreign currency derivatives | 11 | 39 | ||||
| Other, net [1] | 14 | (78 | ) | |||
| Net realized capital gains (losses) | $ | (20 | ) | $ | (155 | ) |
| Three Months Ended March 31, | ||||||
| (Before tax) | 2016 | 2015 | ||||
| Gross gains on sales | $ | 90 | $ | 197 | ||
| Gross losses on sales | (108 | ) | (148 | ) | ||
| Net OTTI losses recognized in earnings | (23 | ) | (12 | ) | ||
| Valuation allowances on mortgage loans | — | (3 | ) | |||
| Periodic net coupon settlements on credit derivatives | — | 1 | ||||
| Results of variable annuity hedge program | ||||||
| GMWB derivatives, net | (17 | ) | 1 | |||
| Macro hedge program | (14 | ) | (4 | ) | ||
| Total results of variable annuity hedge program | (31 | ) | (3 | ) | ||
| Other, net [1] | (83 | ) | (27 | ) | ||
| Net realized capital gains (losses) | $ | (155 | ) | $ | 5 | |
| [1] | Includes non-qualifying derivatives, |
| Impairments in Earnings by Type | ||||||
| Three Months Ended March 31, | ||||||
| 2017 | 2016 | |||||
| Credit impairments | $ | 1 | $ | 18 | ||
| Intent-to-sell impairments | — | 2 | ||||
| Impairments on equity securities | — | 3 | ||||
| Total impairments | $ | 1 | $ | 23 | ||
| Three Months Ended March 31, | ||||||
| 2016 | 2015 | |||||
| Credit impairments | $ | 18 | $ | 3 | ||
| Intent-to-sell impairments | 2 | 9 | ||||
| Impairments on equity securities | 3 | — | ||||
| Total impairments | $ | 23 | $ | 12 | ||
| Three Months Ended March 31, | ||||||
| (Before tax) | 2016 | 2015 | ||||
| Balance as of beginning of period | $ | (324 | ) | $ | (424 | ) |
| Additions for credit impairments recognized on [1]: | ||||||
| Securities not previously impaired | (17 | ) | (3 | ) | ||
| Securities previously impaired | (1 | ) | — | |||
| Reductions for credit impairments previously recognized on: | ||||||
| Securities that matured or were sold during the period | 1 | 4 | ||||
| Securities the Company made the decision to sell or more likely than not will be required to sell | — | 2 | ||||
| Securities due to an increase in expected cash flows | 5 | 9 | ||||
| Balance as of end of period | $ | (336 | ) | $ | (412 | ) |
| Cumulative Credit Impairments | ||||||
| Three Months Ended March 31, | ||||||
| (Before tax) | 2017 | 2016 | ||||
| Balance as of beginning of period | $ | (280 | ) | $ | (324 | ) |
| Additions for credit impairments recognized on [1]: | ||||||
| Securities not previously impaired | (1 | ) | (17 | ) | ||
| Securities previously impaired | — | (1 | ) | |||
| Reductions for credit impairments previously recognized on: | ||||||
| Securities that matured or were sold during the period | 12 | 1 | ||||
| Securities due to an increase in expected cash flows | 9 | 5 | ||||
| Balance as of end of period | $ | (260 | ) | $ | (336 | ) |
| [1] | These additions are included in the net OTTI losses recognized in earnings in the Condensed Consolidated Statements of Operations. |
| AFS Securities by Type | AFS Securities by Type | ||||||||||||||||||||||||||||||||||||||||||||||||||||||||||||
| March 31, 2016 | December 31, 2015 | March 31, 2017 | December 31, 2016 | ||||||||||||||||||||||||||||||||||||||||||||||||||||||||||
Cost or Amortized Cost | Gross Unrealized Gains | Gross Unrealized Losses | Fair Value | Non-Credit OTTI [1] | Cost or Amortized Cost | Gross Unrealized Gains | Gross Unrealized Losses | Fair Value | Non-Credit OTTI [1] | Cost or Amortized Cost | Gross Unrealized Gains | Gross Unrealized Losses | Fair Value | Non-Credit OTTI [1] | Cost or Amortized Cost | Gross Unrealized Gains | Gross Unrealized Losses | Fair Value | Non-Credit OTTI [1] | ||||||||||||||||||||||||||||||||||||||||||
| ABS | $ | 2,683 | $ | 29 | $ | (47 | ) | $ | 2,665 | $ | — | $ | 2,520 | $ | 24 | $ | (45 | ) | $ | 2,499 | $ | — | $ | 2,267 | $ | 20 | $ | (22 | ) | $ | 2,265 | $ | — | $ | 2,396 | $ | 17 | $ | (31 | ) | $ | 2,382 | $ | — | |||||||||||||||||
| CDOs [2] | 3,075 | 68 | (37 | ) | 3,107 | — | 2,989 | 75 | (23 | ) | 3,038 | — | 2,243 | 71 | (3 | ) | 2,311 | — | 1,853 | 67 | (4 | ) | 1,916 | — | |||||||||||||||||||||||||||||||||||||
| CMBS | 5,132 | 155 | (63 | ) | 5,224 | (8 | ) | 4,668 | 105 | (56 | ) | 4,717 | (8 | ) | 5,055 | 102 | (58 | ) | 5,099 | (7 | ) | 4,907 | 97 | (68 | ) | 4,936 | (6 | ) | |||||||||||||||||||||||||||||||||
| Corporate | 25,723 | 1,818 | (244 | ) | 27,297 | (17 | ) | 25,876 | 1,342 | (416 | ) | 26,802 | (3 | ) | 24,371 | 1,548 | (189 | ) | 25,730 | — | 24,380 | 1,510 | (224 | ) | 25,666 | — | |||||||||||||||||||||||||||||||||||
| Foreign govt./govt. agencies | 1,146 | 57 | (14 | ) | 1,189 | — | 1,321 | 34 | (47 | ) | 1,308 | — | 1,151 | 48 | (12 | ) | 1,187 | — | 1,164 | 33 | (26 | ) | 1,171 | — | |||||||||||||||||||||||||||||||||||||
| Municipal | 11,186 | 1,124 | (7 | ) | 12,303 | — | 11,124 | 1,008 | (11 | ) | 12,121 | — | 11,076 | 759 | (55 | ) | 11,780 | — | 10,825 | 732 | (71 | ) | 11,486 | — | |||||||||||||||||||||||||||||||||||||
| RMBS | 4,263 | 103 | (28 | ) | 4,338 | — | 3,986 | 82 | (22 | ) | 4,046 | — | 3,866 | 69 | (14 | ) | 3,921 | — | 4,738 | 66 | (37 | ) | 4,767 | — | |||||||||||||||||||||||||||||||||||||
| U.S. Treasuries | 4,170 | 403 | (3 | ) | 4,570 | — | 4,481 | 222 | (38 | ) | 4,665 | — | 3,879 | 189 | (35 | ) | 4,033 | — | 3,542 | 182 | (45 | ) | 3,679 | — | |||||||||||||||||||||||||||||||||||||
| Total fixed maturities, AFS | $ | 57,378 | $ | 3,757 | $ | (443 | ) | $ | 60,693 | $ | (25 | ) | $ | 56,965 | $ | 2,892 | $ | (658 | ) | $ | 59,196 | $ | (11 | ) | $ | 53,908 | $ | 2,806 | $ | (388 | ) | $ | 56,326 | $ | (7 | ) | $ | 53,805 | $ | 2,704 | $ | (506 | ) | $ | 56,003 | $ | (6 | ) | |||||||||||||
| Equity securities, AFS [3] | 767 | 56 | (25 | ) | 798 | — | 842 | 38 | (41 | ) | 839 | — | 1,011 | 107 | (18 | ) | 1,100 | — | 1,020 | 96 | (19 | ) | 1,097 | — | |||||||||||||||||||||||||||||||||||||
| Total AFS securities | $ | 58,145 | $ | 3,813 | $ | (468 | ) | $ | 61,491 | $ | (25 | ) | $ | 57,807 | $ | 2,930 | $ | (699 | ) | $ | 60,035 | $ | (11 | ) | $ | 54,919 | $ | 2,913 | $ | (406 | ) | $ | 57,426 | $ | (7 | ) | $ | 54,825 | $ | 2,800 | $ | (525 | ) | $ | 57,100 | $ | (6 | ) | |||||||||||||
| [1] | Represents the amount of cumulative non-credit OTTI losses recognized in OCI on securities that also had credit impairments. These losses are included in gross unrealized losses as of March 31, |
| [2] | Gross unrealized gains (losses) exclude the fair value of bifurcated embedded derivatives within certain securities. Subsequent changes in value are recorded in net realized capital gains (losses). |
| [3] | Excludes equity securities, FVO, with a cost and fair value of |
| Fixed maturities, AFS, by Contractual Maturity Year | Fixed maturities, AFS, by Contractual Maturity Year | |||||||||||||||||||||||
| March 31, 2016 | December 31, 2015 | March 31, 2017 | December 31, 2016 | |||||||||||||||||||||
| Contractual Maturity | Amortized Cost | Fair Value | Amortized Cost | Fair Value | ||||||||||||||||||||
| Amortized Cost | Fair Value | Amortized Cost | Fair Value | |||||||||||||||||||||
| One year or less | $ | 2,509 | $ | 2,527 | $ | 2,373 | $ | 2,405 | $ | 1,693 | $ | 1,709 | $ | 1,896 | $ | 1,912 | ||||||||
| Over one year through five years | 10,591 | 10,986 | 10,929 | 11,200 | 9,145 | 9,422 | 9,015 | 9,289 | ||||||||||||||||
| Over five years through ten years | 8,816 | 9,242 | 9,322 | 9,497 | 9,079 | 9,325 | 9,038 | 9,245 | ||||||||||||||||
| Over ten years | 20,309 | 22,604 | 20,178 | 21,794 | 20,560 | 22,274 | 19,962 | 21,556 | ||||||||||||||||
| Subtotal | 42,225 | 45,359 | 42,802 | 44,896 | 40,477 | 42,730 | 39,911 | 42,002 | ||||||||||||||||
| Mortgage-backed and asset-backed securities | 15,153 | 15,334 | 14,163 | 14,300 | 13,431 | 13,596 | 13,894 | 14,001 | ||||||||||||||||
| Total fixed maturities, AFS | $ | 57,378 | $ | 60,693 | $ | 56,965 | $ | 59,196 | $ | 53,908 | $ | 56,326 | $ | 53,805 | $ | 56,003 | ||||||||
| Unrealized Loss Aging for AFS Securities by Type and Length of Time as of March 31, 2017 | |||||||||||||||||||||||||||
| Less Than 12 Months | 12 Months or More | Total | |||||||||||||||||||||||||
| Amortized Cost | Fair Value | Unrealized Losses | Amortized Cost | Fair Value | Unrealized Losses | Amortized Cost | Fair Value | Unrealized Losses | |||||||||||||||||||
| ABS | $ | 544 | $ | 542 | $ | (2 | ) | $ | 276 | $ | 256 | $ | (20 | ) | $ | 820 | $ | 798 | $ | (22 | ) | ||||||
| CDOs [1] | 1,253 | 1,251 | (2 | ) | 284 | 283 | (1 | ) | 1,537 | 1,534 | (3 | ) | |||||||||||||||
| CMBS | 1,804 | 1,764 | (40 | ) | 309 | 291 | (18 | ) | 2,113 | 2,055 | (58 | ) | |||||||||||||||
| Corporate | 4,813 | 4,671 | (142 | ) | 865 | 818 | (47 | ) | 5,678 | 5,489 | (189 | ) | |||||||||||||||
| Foreign govt./govt. agencies | 350 | 341 | (9 | ) | 36 | 33 | (3 | ) | 386 | 374 | (12 | ) | |||||||||||||||
| Municipal | 1,372 | 1,318 | (54 | ) | 35 | 34 | (1 | ) | 1,407 | 1,352 | (55 | ) | |||||||||||||||
| RMBS | 865 | 856 | (9 | ) | 453 | 448 | (5 | ) | 1,318 | 1,304 | (14 | ) | |||||||||||||||
| U.S. Treasuries | 1,425 | 1,390 | (35 | ) | — | — | — | 1,425 | 1,390 | (35 | ) | ||||||||||||||||
| Total fixed maturities, AFS | $ | 12,426 | $ | 12,133 | $ | (293 | ) | $ | 2,258 | $ | 2,163 | $ | (95 | ) | $ | 14,684 | $ | 14,296 | $ | (388 | ) | ||||||
| Equity securities, AFS [2] | 238 | 223 | (15 | ) | 30 | 27 | (3 | ) | 268 | 250 | (18 | ) | |||||||||||||||
| Total securities in an unrealized loss position | $ | 12,664 | $ | 12,356 | $ | (308 | ) | $ | 2,288 | $ | 2,190 | $ | (98 | ) | $ | 14,952 | $ | 14,546 | $ | (406 | ) | ||||||
| March 31, 2016 | |||||||||||||||||||||||||||||
| Less Than 12 Months | 12 Months or More | Total | |||||||||||||||||||||||||||
| Amortized Cost | Fair Value | Unrealized Losses | Amortized Cost | Fair Value | Unrealized Losses | Amortized Cost | Fair Value | Unrealized Losses | |||||||||||||||||||||
| ABS | $ | 1,121 | $ | 1,112 | $ | (9 | ) | $ | 368 | $ | 330 | $ | (38 | ) | $ | 1,489 | $ | 1,442 | $ | (47 | ) | ||||||||
| CDOs [1] | 1,543 | 1,523 | (21 | ) | 1,108 | 1,092 | (16 | ) | 2,651 | 2,615 | (37 | ) | |||||||||||||||||
| CMBS | 1,370 | 1,322 | (48 | ) | 250 | 235 | (15 | ) | 1,620 | 1,557 | (63 | ) | |||||||||||||||||
| Corporate | 3,810 | 3,662 | (148 | ) | 890 | 794 | (96 | ) | 4,700 | 4,456 | (244 | ) | |||||||||||||||||
| Foreign govt./govt. agencies | 217 | 210 | (7 | ) | 78 | 71 | (7 | ) | 295 | 281 | (14 | ) | |||||||||||||||||
| Municipal | 272 | 267 | (5 | ) | 33 | 31 | (2 | ) | 305 | 298 | (7 | ) | |||||||||||||||||
| RMBS | 919 | 909 | (10 | ) | 743 | 725 | (18 | ) | 1,662 | 1,634 | (28 | ) | |||||||||||||||||
| U.S. Treasuries | 248 | 246 | (2 | ) | 25 | 24 | (1 | ) | 273 | 270 | (3 | ) | |||||||||||||||||
| Total fixed maturities, AFS | $ | 9,500 | $ | 9,251 | $ | (250 | ) | $ | 3,495 | $ | 3,302 | $ | (193 | ) | $ | 12,995 | $ | 12,553 | $ | (443 | ) | ||||||||
| Equity securities, AFS [2] | 276 | 257 | (19 | ) | 56 | 50 | (6 | ) | 332 | 307 | (25 | ) | |||||||||||||||||
| Total securities in an unrealized loss position | $ | 9,776 | $ | 9,508 | $ | (269 | ) | $ | 3,551 | $ | 3,352 | $ | (199 | ) | $ | 13,327 | $ | 12,860 | $ | (468 | ) | ||||||||
| December 31, 2015 | ||||||||||||||||||||||||||||||||||||||||||||||||||||||||
| Unrealized Loss Aging for AFS Securities by Type and Length of Time as of December 31, 2016 | Unrealized Loss Aging for AFS Securities by Type and Length of Time as of December 31, 2016 | |||||||||||||||||||||||||||||||||||||||||||||||||||||||
| Less Than 12 Months | 12 Months or More | Total | Less Than 12 Months | 12 Months or More | Total | |||||||||||||||||||||||||||||||||||||||||||||||||||
| Amortized Cost | Fair Value | Unrealized Losses | Amortized Cost | Fair Value | Unrealized Losses | Amortized Cost | Fair Value | Unrealized Losses | Amortized Cost | Fair Value | Unrealized Losses | Amortized Cost | Fair Value | Unrealized Losses | Amortized Cost | Fair Value | Unrealized Losses | |||||||||||||||||||||||||||||||||||||||
| ABS | $ | 1,619 | $ | 1,609 | $ | (10 | ) | $ | 357 | $ | 322 | $ | (35 | ) | $ | 1,976 | $ | 1,931 | $ | (45 | ) | $ | 582 | $ | 579 | $ | (3 | ) | $ | 368 | $ | 340 | $ | (28 | ) | $ | 950 | $ | 919 | $ | (31 | ) | ||||||||||||||
| CDOs [1] | 1,164 | 1,154 | (10 | ) | 1,243 | 1,227 | (13 | ) | 2,407 | 2,381 | (23 | ) | 641 | 640 | (1 | ) | 370 | 367 | (3 | ) | 1,011 | 1,007 | (4 | ) | ||||||||||||||||||||||||||||||||
| CMBS | 1,726 | 1,681 | (45 | ) | 189 | 178 | (11 | ) | 1,915 | 1,859 | (56 | ) | 2,076 | 2,027 | (49 | ) | 293 | 274 | (19 | ) | 2,369 | 2,301 | (68 | ) | ||||||||||||||||||||||||||||||||
| Corporate | 9,206 | 8,866 | (340 | ) | 656 | 580 | (76 | ) | 9,862 | 9,446 | (416 | ) | 5,418 | 5,248 | (170 | ) | 835 | 781 | (54 | ) | 6,253 | 6,029 | (224 | ) | ||||||||||||||||||||||||||||||||
| Foreign govt./govt. agencies | 679 | 646 | (33 | ) | 124 | 110 | (14 | ) | 803 | 756 | (47 | ) | 573 | 550 | (23 | ) | 27 | 24 | (3 | ) | 600 | 574 | (26 | ) | ||||||||||||||||||||||||||||||||
| Municipal | 440 | 430 | (10 | ) | 18 | 17 | (1 | ) | 458 | 447 | (11 | ) | 1,567 | 1,498 | (69 | ) | 43 | 41 | (2 | ) | 1,610 | 1,539 | (71 | ) | ||||||||||||||||||||||||||||||||
| RMBS | 1,349 | 1,340 | (9 | ) | 415 | 402 | (13 | ) | 1,764 | 1,742 | (22 | ) | 1,655 | 1,624 | (31 | ) | 591 | 585 | (6 | ) | 2,246 | 2,209 | (37 | ) | ||||||||||||||||||||||||||||||||
| U.S. Treasuries | 2,432 | 2,394 | (38 | ) | 8 | 8 | — | 2,440 | 2,402 | (38 | ) | 1,432 | 1,387 | (45 | ) | — | — | — | 1,432 | 1,387 | (45 | ) | ||||||||||||||||||||||||||||||||||
| Total fixed maturities, AFS | $ | 18,615 | $ | 18,120 | $ | (495 | ) | $ | 3,010 | $ | 2,844 | $ | (163 | ) | $ | 21,625 | $ | 20,964 | $ | (658 | ) | $ | 13,944 | $ | 13,553 | $ | (391 | ) | $ | 2,527 | $ | 2,412 | $ | (115 | ) | $ | 16,471 | $ | 15,965 | $ | (506 | ) | ||||||||||||||
| Equity securities, AFS [2] | 480 | 449 | (31 | ) | 62 | 52 | (10 | ) | 542 | 501 | (41 | ) | 330 | 315 | (15 | ) | 38 | 34 | (4 | ) | 368 | 349 | (19 | ) | ||||||||||||||||||||||||||||||||
| Total securities in an unrealized loss position | $ | 19,095 | $ | 18,569 | $ | (526 | ) | $ | 3,072 | $ | 2,896 | $ | (173 | ) | $ | 22,167 | $ | 21,465 | $ | (699 | ) | $ | 14,274 | $ | 13,868 | $ | (406 | ) | $ | 2,565 | $ | 2,446 | $ | (119 | ) | $ | 16,839 | $ | 16,314 | $ | (525 | ) | ||||||||||||||
| [1] | Unrealized losses exclude the change in fair value of bifurcated embedded derivatives within certain securities, for which changes in fair value are recorded in net realized capital gains (losses). |
| [2] | As of March 31, |
| March 31, 2016 | December 31, 2015 | ||||||||||||||||||
| Amortized Cost [1] | Valuation Allowance | Carrying Value | Amortized Cost [1] | Valuation Allowance | Carrying Value | ||||||||||||||
| Total commercial mortgage loans | $ | 5,659 | $ | (22 | ) | $ | 5,637 | $ | 5,647 | $ | (23 | ) | $ | 5,624 | |||||
| 2016 | 2015 | |||||
| Balance, as of January 1 | $ | (23 | ) | $ | (18 | ) |
| (Additions)/Reversals | — | (3 | ) | |||
| Deductions | 1 | — | ||||
| Balance, as of March 31 | $ | (22 | ) | $ | (21 | ) |
| Valuation Allowance Activity | ||||||
| 2017 | 2016 | |||||
| Balance, as of January 1 | $ | (19 | ) | $ | (23 | ) |
| (Additions)/Reversals | — | — | ||||
| Deductions | — | 1 | ||||
| Balance, as of March 31 | $ | (19 | ) | $ | (22 | ) |
| Commercial Mortgage Loans Credit Quality | ||||||||
| March 31, 2017 | December 31, 2016 | |||||||
| Loan-to-value | Carrying Value | Avg. Debt-Service Coverage Ratio | Carrying Value | Avg. Debt-Service Coverage Ratio | ||||
| Greater than 80% | $ | 21 | 0.59x | $ | 20 | 0.59x | ||
| 65% - 80% | 524 | 2.20x | 568 | 2.17x | ||||
| Less than 65% | 5,140 | 2.74x | 5,109 | 2.78x | ||||
| Total commercial mortgage loans | $ | 5,685 | 2.67x | $ | 5,697 | 2.70x | ||
| Commercial Mortgage Loans Credit Quality | |||||||||
| March 31, 2016 | December 31, 2015 | ||||||||
| Loan-to-value | Carrying Value | Avg. Debt-Service Coverage Ratio | Carrying Value | Avg. Debt-Service Coverage Ratio | |||||
| Greater than 80% | $ | 17 | 0.77x | $ | 24 | 0.81x | |||
| 65% - 80% | 753 | 1.94x | 623 | 1.82x | |||||
| Less than 65% | 4,867 | 2.78x | 4,977 | 2.75x | |||||
| Total commercial mortgage loans | $ | 5,637 | 2.64x | $ | 5,624 | 2.63x | |||
| Mortgage Loans by Region | ||||||||||
| March 31, 2017 | December 31, 2016 | |||||||||
| Carrying Value | Percent of Total | Carrying Value | Percent of Total | |||||||
| East North Central | $ | 293 | 5.2 | % | $ | 293 | 5.1 | % | ||
| East South Central | 14 | 0.2 | % | 14 | 0.2 | % | ||||
| Middle Atlantic | 557 | 9.8 | % | 534 | 9.4 | % | ||||
| Mountain | 61 | 1.1 | % | 61 | 1.1 | % | ||||
| New England | 389 | 6.8 | % | 345 | 6.1 | % | ||||
| Pacific | 1,604 | 28.2 | % | 1,609 | 28.3 | % | ||||
| South Atlantic | 1,217 | 21.4 | % | 1,198 | 21.0 | % | ||||
| West North Central | 40 | 0.7 | % | 40 | 0.7 | % | ||||
| West South Central | 347 | 6.1 | % | 338 | 5.9 | % | ||||
| Other [1] | 1,163 | 20.5 | % | 1,265 | 22.2 | % | ||||
| Total mortgage loans | $ | 5,685 | 100.0 | % | $ | 5,697 | 100.0 | % | ||
| Mortgage Loans by Region | |||||||||||
| March 31, 2016 | December 31, 2015 | ||||||||||
| Carrying Value | Percent of Total | Carrying Value | Percent of Total | ||||||||
| East North Central | $ | 315 | 5.6 | % | $ | 289 | 5.1 | % | |||
| East South Central | 14 | 0.2 | % | 14 | 0.2 | % | |||||
| Middle Atlantic | 383 | 6.8 | % | 384 | 6.8 | % | |||||
| Mountain | 35 | 0.6 | % | 32 | 0.6 | % | |||||
| New England | 445 | 7.9 | % | 446 | 7.9 | % | |||||
| Pacific | 1,636 | 29.1 | % | 1,669 | 29.7 | % | |||||
| South Atlantic | 1,175 | 20.8 | % | 1,174 | 20.9 | % | |||||
| West North Central | 29 | 0.5 | % | 29 | 0.5 | % | |||||
| West South Central | 339 | 6.0 | % | 318 | 5.7 | % | |||||
| Other [1] | 1,266 | 22.5 | % | 1,269 | 22.6 | % | |||||
| Total mortgage loans | $ | 5,637 | 100.0 | % | $ | 5,624 | 100.0 | % | |||
| [1] | Primarily represents loans collateralized by multiple properties in various regions. |
| Mortgage Loans by Property Type | |||||||||||
| March 31, 2016 | December 31, 2015 | ||||||||||
| Carrying Value | Percent of Total | Carrying Value | Percent of Total | ||||||||
| Commercial | |||||||||||
| Agricultural | $ | 19 | 0.3 | % | $ | 26 | 0.5 | % | |||
| Industrial | 1,444 | 25.6 | % | 1,422 | 25.3 | % | |||||
| Lodging | 25 | 0.4 | % | 26 | 0.5 | % | |||||
| Multifamily | 1,397 | 24.8 | % | 1,345 | 23.9 | % | |||||
| Office | 1,509 | 26.8 | % | 1,547 | 27.5 | % | |||||
| Retail | 1,093 | 19.4 | % | 1,109 | 19.7 | % | |||||
| Other | 150 | 2.7 | % | 149 | 2.6 | % | |||||
| Total mortgage loans | $ | 5,637 | 100.0 | % | $ | 5,624 | 100.0 | % | |||
| Mortgage Loans by Property Type | ||||||||||
| March 31, 2017 | December 31, 2016 | |||||||||
| Carrying Value | Percent of Total | Carrying Value | Percent of Total | |||||||
| Commercial | ||||||||||
| Agricultural | $ | 16 | 0.3 | % | $ | 16 | 0.3 | % | ||
| Industrial | 1,397 | 24.6 | % | 1,468 | 25.7 | % | ||||
| Lodging | 25 | 0.4 | % | 25 | 0.4 | % | ||||
| Multifamily | 1,372 | 24.1 | % | 1,365 | 24.0 | % | ||||
| Office | 1,427 | 25.1 | % | 1,361 | 23.9 | % | ||||
| Retail | 1,012 | 17.8 | % | 1,036 | 18.2 | % | ||||
| Other | 436 | 7.7 | % | 426 | 7.5 | % | ||||
| Total mortgage loans | $ | 5,685 | 100.0 | % | $ | 5,697 | 100.0 | % | ||
| March 31, 2016 | December 31, 2015 | ||||||||||||||||||
| Total Assets | Total Liabilities [1] | Maximum Exposure to Loss [2] | Total Assets | Total Liabilities [1] | Maximum Exposure to Loss [2] | ||||||||||||||
| CDO [3] | $ | 5 | $ | 5 | $ | — | $ | 5 | $ | 5 | $ | — | |||||||
| Investment funds [4] | — | — | — | 159 | 7 | 151 | |||||||||||||
| Limited partnerships and other alternative investments [5] | 458 | — | 458 | 2 | — | 2 | |||||||||||||
| Total | $ | 463 | $ | 5 | $ | 458 | $ | 166 | $ | 12 | $ | 153 | |||||||
| GMWB Hedging Instruments | GMWB Hedging Instruments | |||||||||||||||||||||||
| Notional Amount | Fair Value | Notional Amount | Fair Value | |||||||||||||||||||||
| March 31, 2016 | December 31, 2015 | March 31, 2016 | December 31, 2015 | Mar. 31, 2017 | Dec. 31, 2016 | Mar. 31, 2017 | Dec. 31, 2016 | |||||||||||||||||
| Customized swaps | $ | 5,622 | $ | 5,877 | $ | 150 | $ | 131 | $ | 5,213 | $ | 5,191 | $ | 76 | $ | 100 | ||||||||
| Equity swaps, options, and futures | 1,392 | 1,362 | (6 | ) | 2 | 1,374 | 1,362 | (35 | ) | (27 | ) | |||||||||||||
| Interest rate swaps and futures | 3,773 | 3,740 | 48 | 25 | 3,350 | 3,703 | 42 | 21 | ||||||||||||||||
| Total | $ | 10,787 | $ | 10,979 | $ | 192 | $ | 158 | $ | 9,937 | $ | 10,256 | $ | 83 | $ | 94 | ||||||||
| Notional Amount | Fair Value | |||||||||||
| March 31, 2016 | December 31, 2015 | March 31, 2016 | December 31, 2015 | |||||||||
| Equity swaps, options, and futures | $ | 4,605 | $ | 4,548 | $ | 145 | $ | 147 | ||||
| Total | $ | 4,605 | $ | 4,548 | $ | 145 | $ | 147 | ||||
| Net Derivatives | Asset Derivatives | Liability Derivatives | |||||||||||||||||||||||||
| Notional Amount | Fair Value | Fair Value | Fair Value | ||||||||||||||||||||||||
| Hedge Designation/ Derivative Type | Mar. 31, 2016 | Dec. 31, 2015 | Mar. 31, 2016 | Dec. 31, 2015 | Mar. 31, 2016 | Dec. 31, 2015 | Mar. 31, 2016 | Dec. 31, 2015 | |||||||||||||||||||
| Cash flow hedges | |||||||||||||||||||||||||||
| Interest rate swaps | $ | 3,478 | $ | 3,527 | $ | 89 | $ | 17 | $ | 94 | $ | 50 | $ | (5 | ) | $ | (33 | ) | |||||||||
| Foreign currency swaps | 143 | 143 | (18 | ) | (19 | ) | 6 | 7 | (24 | ) | (26 | ) | |||||||||||||||
| Total cash flow hedges | 3,621 | 3,670 | 71 | (2 | ) | 100 | 57 | (29 | ) | (59 | ) | ||||||||||||||||
| Fair value hedges | |||||||||||||||||||||||||||
| Interest rate swaps | 23 | 23 | — | — | — | — | — | — | |||||||||||||||||||
| Total fair value hedges | 23 | 23 | — | — | — | — | — | — | |||||||||||||||||||
| Non-qualifying strategies | |||||||||||||||||||||||||||
| Interest rate contracts | |||||||||||||||||||||||||||
| Interest rate swaps, swaptions, and futures | 14,545 | 14,290 | (892 | ) | (814 | ) | 475 | 297 | (1,367 | ) | (1,111 | ) | |||||||||||||||
| Foreign exchange contracts | |||||||||||||||||||||||||||
| Foreign currency swaps and forwards | 317 | 653 | 6 | 17 | 6 | 17 | — | — | |||||||||||||||||||
| Fixed payout annuity hedge | 1,063 | 1,063 | (321 | ) | (357 | ) | — | — | (321 | ) | (357 | ) | |||||||||||||||
| Credit contracts | |||||||||||||||||||||||||||
| Credit derivatives that purchase credit protection | 494 | 423 | (11 | ) | 18 | 2 | 22 | (13 | ) | (4 | ) | ||||||||||||||||
| Credit derivatives that assume credit risk [1] | 1,397 | 2,458 | (9 | ) | (13 | ) | 8 | 9 | (17 | ) | (22 | ) | |||||||||||||||
| Credit derivatives in offsetting positions | 4,034 | 4,059 | (2 | ) | (2 | ) | 43 | 40 | (45 | ) | (42 | ) | |||||||||||||||
| Equity contracts | |||||||||||||||||||||||||||
| Equity index swaps and options | 1,429 | 419 | 5 | 15 | 34 | 41 | (29 | ) | (26 | ) | |||||||||||||||||
| Variable annuity hedge program | |||||||||||||||||||||||||||
| GMWB product derivatives [2] | 14,597 | 15,099 | (361 | ) | (262 | ) | — | — | (361 | ) | (262 | ) | |||||||||||||||
| GMWB reinsurance contracts | 3,005 | 3,106 | 99 | 83 | 99 | 83 | — | — | |||||||||||||||||||
| GMWB hedging instruments | 10,787 | 10,979 | 192 | 158 | 338 | 264 | (146 | ) | (106 | ) | |||||||||||||||||
| Macro hedge program | 4,605 | 4,548 | 145 | 147 | 178 | 179 | (33 | ) | (32 | ) | |||||||||||||||||
| Other | |||||||||||||||||||||||||||
| Contingent capital facility put option | 500 | 500 | 5 | 7 | 5 | 7 | — | — | |||||||||||||||||||
| Modified coinsurance reinsurance contracts | 905 | 895 | 57 | 79 | 57 | 79 | — | — | |||||||||||||||||||
| Total non-qualifying strategies | 57,678 | 58,492 | (1,087 | ) | (924 | ) | 1,245 | 1,038 | (2,332 | ) | (1,962 | ) | |||||||||||||||
| Total cash flow hedges, fair value hedges, and non-qualifying strategies | $ | 61,322 | $ | 62,185 | $ | (1,016 | ) | $ | (926 | ) | $ | 1,345 | $ | 1,095 | $ | (2,361 | ) | $ | (2,021 | ) | |||||||
| Balance Sheet Location | |||||||||||||||||||||||||||
| Fixed maturities, available-for-sale | $ | 426 | $ | 425 | $ | 1 | $ | (3 | ) | $ | 1 | $ | — | $ | — | $ | (3 | ) | |||||||||
| Other investments | 23,359 | 23,253 | 100 | 1 | 566 | 409 | (466 | ) | (408 | ) | |||||||||||||||||
| Other liabilities | 18,980 | 19,358 | (887 | ) | (798 | ) | 622 | 524 | (1,509 | ) | (1,322 | ) | |||||||||||||||
| Reinsurance recoverables | 3,910 | 4,000 | 156 | 162 | 156 | 162 | — | — | |||||||||||||||||||
| Other policyholder funds and benefits payable | 14,647 | 15,149 | (386 | ) | (288 | ) | — | — | (386 | ) | (288 | ) | |||||||||||||||
| Total derivatives | $ | 61,322 | $ | 62,185 | $ | (1,016 | ) | $ | (926 | ) | $ | 1,345 | $ | 1,095 | $ | (2,361 | ) | $ | (2,021 | ) | |||||||
| Derivative Balance Sheet Presentation | ||||||||||||||||||||||||
| Net Derivatives | Asset Derivatives | Liability Derivatives | ||||||||||||||||||||||
| Notional Amount | Fair Value | Fair Value | Fair Value | |||||||||||||||||||||
| Hedge Designation/ Derivative Type | Mar. 31, 2017 | Dec. 31, 2016 | Mar. 31, 2017 | Dec. 31, 2016 | Mar. 31, 2017 | Dec. 31, 2016 | Mar. 31, 2017 | Dec. 31, 2016 | ||||||||||||||||
| Cash flow hedges | ||||||||||||||||||||||||
| Interest rate swaps | $ | 3,480 | $ | 3,440 | $ | 5 | $ | (79 | ) | $ | 97 | $ | 11 | $ | (92 | ) | $ | (90 | ) | |||||
| Foreign currency swaps | 239 | 239 | (14 | ) | (15 | ) | 11 | 11 | (25 | ) | (26 | ) | ||||||||||||
| Total cash flow hedges | 3,719 | 3,679 | (9 | ) | (94 | ) | 108 | 22 | (117 | ) | (116 | ) | ||||||||||||
| Non-qualifying strategies | ||||||||||||||||||||||||
| Interest rate contracts | ||||||||||||||||||||||||
| Interest rate swaps, swaptions, and futures | 11,080 | 11,743 | (474 | ) | (890 | ) | 648 | 264 | (1,122 | ) | (1,154 | ) | ||||||||||||
| Foreign exchange contracts | ||||||||||||||||||||||||
| Foreign currency swaps and forwards | 307 | 1,064 | (3 | ) | 68 | — | 70 | (3 | ) | (2 | ) | |||||||||||||
| Fixed payout annuity hedge | 804 | 804 | (242 | ) | (263 | ) | — | — | (242 | ) | (263 | ) | ||||||||||||
| Credit contracts | ||||||||||||||||||||||||
| Credit derivatives that purchase credit protection | 159 | 209 | (4 | ) | (4 | ) | 1 | — | (5 | ) | (4 | ) | ||||||||||||
| Credit derivatives that assume credit risk [1] | 1,904 | 1,309 | — | 10 | 26 | 15 | (26 | ) | (5 | ) | ||||||||||||||
| Credit derivatives in offsetting positions | 3,128 | 3,317 | 3 | (1 | ) | 36 | 39 | (33 | ) | (40 | ) | |||||||||||||
| Equity contracts | ||||||||||||||||||||||||
| Equity index swaps and options | 339 | 105 | 5 | — | 41 | 33 | (36 | ) | (33 | ) | ||||||||||||||
| Variable annuity hedge program | ||||||||||||||||||||||||
| GMWB product derivatives [2] | 12,631 | 13,114 | (157 | ) | (241 | ) | — | — | (157 | ) | (241 | ) | ||||||||||||
| GMWB reinsurance contracts | 2,616 | 2,709 | 60 | 73 | 60 | 73 | — | — | ||||||||||||||||
| GMWB hedging instruments | 9,937 | 10,256 | 83 | 94 | 171 | 190 | (88 | ) | (96 | ) | ||||||||||||||
| Macro hedge program | 6,722 | 6,532 | 171 | 178 | 186 | 201 | (15 | ) | (23 | ) | ||||||||||||||
| Other | ||||||||||||||||||||||||
| Contingent capital facility put option | — | 500 | — | 1 | — | 1 | — | — | ||||||||||||||||
| Modified coinsurance reinsurance contracts | 875 | 875 | 66 | 68 | 66 | 68 | — | — | ||||||||||||||||
| Total non-qualifying strategies | 50,502 | 52,537 | (492 | ) | (907 | ) | 1,235 | 954 | (1,727 | ) | (1,861 | ) | ||||||||||||
| Total cash flow hedges, fair value hedges, and non-qualifying strategies | $ | 54,221 | $ | 56,216 | $ | (501 | ) | $ | (1,001 | ) | $ | 1,343 | $ | 976 | $ | (1,844 | ) | $ | (1,977 | ) | ||||
| Balance Sheet Location | ||||||||||||||||||||||||
| Fixed maturities, available-for-sale | $ | 296 | $ | 322 | $ | — | $ | 1 | $ | — | $ | 1 | $ | — | $ | — | ||||||||
| Other investments | 23,717 | 23,620 | 250 | (180 | ) | 821 | 377 | (571 | ) | (557 | ) | |||||||||||||
| Other liabilities | 14,036 | 15,526 | (683 | ) | (689 | ) | 396 | 457 | (1,079 | ) | (1,146 | ) | ||||||||||||
| Reinsurance recoverables | 3,491 | 3,584 | 126 | 141 | 126 | 141 | — | — | ||||||||||||||||
| Other policyholder funds and benefits payable | 12,681 | 13,164 | (194 | ) | (274 | ) | — | — | (194 | ) | (274 | ) | ||||||||||||
| Total derivatives | $ | 54,221 | $ | 56,216 | $ | (501 | ) | $ | (1,001 | ) | $ | 1,343 | $ | 976 | $ | (1,844 | ) | $ | (1,977 | ) | ||||
| [1] | The derivative instruments related to this strategy are held for other investment purposes. |
| [2] | These derivatives are embedded within liabilities and are not held for risk management purposes. |
| (i) | (ii) | (iii) = (i) - (ii) | (iv) | (v) = (iii) - (iv) | |||||||||||||||||||
| Net Amounts Presented in the Statement of Financial Position | Collateral Disallowed for Offset in the Statement of Financial Position | ||||||||||||||||||||||
| Gross Amounts of Recognized Assets | Gross Amounts Offset in the Statement of Financial Position | Derivative Assets [1] | Accrued Interest and Cash Collateral Received [2] | Financial Collateral Received [4] | Net Amount | ||||||||||||||||||
| Description | |||||||||||||||||||||||
| Other investments | $ | 1,188 | $ | 998 | $ | 100 | $ | 90 | $ | 111 | $ | 79 | |||||||||||
| Gross Amounts of Recognized Liabilities | Gross Amounts Offset in the Statement of Financial Position | Derivative Liabilities [3] | Accrued Interest and Cash Collateral Pledged [3] | Financial Collateral Pledged [4] | Net Amount | ||||||||||||||||||
| Description | |||||||||||||||||||||||
| Other liabilities | $ | (1,975 | ) | $ | (961 | ) | $ | (887 | ) | $ | (127 | ) | $ | (950 | ) | $ | (64 | ) | |||||
| (i) | (ii) | (iii) = (i) - (ii) | (iv) | (v) = (iii) - (iv) | |||||||||||||||||||
| Net Amounts Presented in the Statement of Financial Position | Collateral Disallowed for Offset in the Statement of Financial Position | ||||||||||||||||||||||
| Gross Amounts of Recognized Assets | Gross Amounts Offset in the Statement of Financial Position | Derivative Assets [1] | Accrued Interest and Cash Collateral Received [2] | Financial Collateral Received [4] | Net Amount | ||||||||||||||||||
| Description | |||||||||||||||||||||||
| Other investments | $ | 933 | $ | 756 | $ | 1 | $ | 176 | $ | 100 | $ | 77 | |||||||||||
| Offsetting Derivative Assets and Liabilities | Offsetting Derivative Assets and Liabilities | |||||||||||||||||||||||||||||||||||||||||||||
| (i) | (ii) | (iii) = (i) - (ii) | (iv) | (v) = (iii) - (iv) | ||||||||||||||||||||||||||||||||||||||||||
| Net Amounts Presented in the Statement of Financial Position | Collateral Disallowed for Offset in the Statement of Financial Position | |||||||||||||||||||||||||||||||||||||||||||||
| Gross Amounts of Recognized Liabilities | Gross Amounts Offset in the Statement of Financial Position | Derivative Liabilities [3] | Accrued Interest and Cash Collateral Pledged [3] | Financial Collateral Pledged [4] | Net Amount | Gross Amounts of Recognized Assets (Liabilities) | Gross Amounts Offset in the Statement of Financial Position | Derivative Assets [1] (Liabilities) [2] | Accrued Interest and Cash Collateral (Received) [3] Pledged [2] | Financial Collateral (Received) Pledged [4] | Net Amount | |||||||||||||||||||||||||||||||||||
| Description | ||||||||||||||||||||||||||||||||||||||||||||||
| As of March 31, 2017 | ||||||||||||||||||||||||||||||||||||||||||||||
| Other investments | $ | 1,217 | $ | 1,101 | $ | 250 | $ | (134 | ) | $ | 73 | $ | 43 | |||||||||||||||||||||||||||||||||
| Other liabilities | $ | (1,730 | ) | $ | (818 | ) | $ | (798 | ) | $ | (114 | ) | $ | (889 | ) | $ | (23 | ) | $ | (1,650 | ) | $ | (820 | ) | $ | (683 | ) | $ | (147 | ) | $ | (811 | ) | $ | (19 | ) | ||||||||||
| As of December 31, 2016 | ||||||||||||||||||||||||||||||||||||||||||||||
| Other investments | $ | 834 | $ | 670 | $ | (180 | ) | $ | 344 | $ | 103 | $ | 61 | |||||||||||||||||||||||||||||||||
| Other liabilities | $ | (1,703 | ) | $ | (884 | ) | $ | (689 | ) | $ | (130 | ) | $ | (763 | ) | $ | (56 | ) | ||||||||||||||||||||||||||||
| [1] | Included in other |
| [2] | Included in other |
| [3] | Included in other |
| [4] | Excludes collateral associated with exchange-traded derivative instruments. |
| Derivatives in Cash Flow Hedging Relationships | |||||||||
| Gain (Loss) Recognized in OCI on Derivative (Effective Portion) | |||||||||
| Three Months Ended March 31, | |||||||||
| 2017 | 2016 | ||||||||
| Interest rate swaps | $ | (7 | ) | $ | 106 | ||||
| Foreign currency swaps | 1 | 1 | |||||||
| Total | $ | (6 | ) | $ | 107 | ||||
| Gain or (Loss) Reclassified from AOCI into Income (Effective Portion) | |||||||||
| Three Months Ended March 31, | |||||||||
| 2017 | 2016 | ||||||||
| Interest rate swaps | |||||||||
Net realized capital gain/(loss) | $ | 4 | $ | 5 | |||||
| Net investment income | 16 | 15 | |||||||
| Foreign currency swaps | |||||||||
Net realized capital gain/(loss) | 1 | 4 | |||||||
| Total | $ | 21 | $ | 24 | |||||
| Gain (Loss) Recognized in OCI on Derivative (Effective Portion) | Net Realized Capital Gains(Losses) Recognized in Income on Derivative (Ineffective Portion) | ||||||||||||
| Three Months Ended March 31, | Three Months Ended March 31, | ||||||||||||
| 2016 | 2015 | 2016 | 2015 | ||||||||||
| Interest rate swaps | $ | 106 | $ | 56 | $ | — | $ | — | |||||
| Foreign currency swaps | 1 | (7 | ) | — | — | ||||||||
| Total | $ | 107 | $ | 49 | $ | — | $ | — | |||||
| Gain or (Loss) Reclassified from AOCI into Income (Effective Portion) | |||||||
| Three Months Ended March 31, | |||||||
| Location | 2016 | 2015 | |||||
| Interest rate swaps | Net realized capital gains (losses) | $ | 5 | $ | 1 | ||
| Interest rate swaps | Net investment income | 15 | 16 | ||||
| Foreign currency swaps | Net realized capital gains (losses) | 4 | (10 | ) | |||
| Total | $ | 24 | $ | 7 | |||
| Non-Qualifying Strategies Recognized within Net Realized Capital Gains (Losses) | Non-Qualifying Strategies Recognized within Net Realized Capital Gains (Losses) | |||||||||||
| Three Months Ended March 31, | Three Months Ended March 31, | |||||||||||
| 2016 | 2015 | 2017 | 2016 | |||||||||
| Variable annuity hedge program | ||||||||||||
| GMWB product derivatives | $ | 101 | $ | (79 | ) | |||||||
| GMWB reinsurance contracts | (18 | ) | 12 | |||||||||
| GMWB hedging instruments | (65 | ) | 50 | |||||||||
| Macro hedge program | (86 | ) | (14 | ) | ||||||||
| Total variable annuity hedge program | (68 | ) | (31 | ) | ||||||||
| Foreign exchange contracts | ||||||||||||
| Foreign currency swaps and forwards | (10 | ) | 3 | |||||||||
| Fixed payout annuity hedge | 21 | 36 | ||||||||||
| Total foreign exchange contracts | 11 | 39 | ||||||||||
| Other non-qualifying derivatives | ||||||||||||
| Interest rate contracts | ||||||||||||
| Interest rate swaps, swaptions, and futures | $ | (24 | ) | $ | (12 | ) | 7 | (24 | ) | |||
| Foreign exchange contracts | ||||||||||||
| Foreign currency swaps and forwards | 3 | 7 | ||||||||||
| Fixed payout annuity hedge [1] | 36 | (14 | ) | |||||||||
| Credit contracts | ||||||||||||
| Credit derivatives that purchase credit protection | (5 | ) | (2 | ) | (11 | ) | (5 | ) | ||||
| Credit derivatives that assume credit risk | (2 | ) | 9 | 17 | (2 | ) | ||||||
| Equity contracts | ||||||||||||
| Equity index swaps and options | 18 | (3 | ) | — | 18 | |||||||
| Commodity contracts | ||||||||||||
| Commodity options | — | (5 | ) | |||||||||
| Variable annuity hedge program | ||||||||||||
| GMWB product derivatives | (79 | ) | (19 | ) | ||||||||
| GMWB reinsurance contracts | 12 | 7 | ||||||||||
| GMWB hedging instruments | 50 | 13 | ||||||||||
| Macro hedge program | (14 | ) | (4 | ) | ||||||||
| Other | ||||||||||||
| Contingent capital facility put option | (2 | ) | (2 | ) | (1 | ) | (2 | ) | ||||
| Modified coinsurance reinsurance contracts | (22 | ) | (11 | ) | (2 | ) | (22 | ) | ||||
| Total [2] | $ | (29 | ) | $ | (36 | ) | ||||||
| Total other non-qualifying derivatives | 10 | (37 | ) | |||||||||
| Total [1] | $ | (47 | ) | $ | (29 | ) | ||||||
| [1] |
| Excludes investments that contain an embedded credit derivative for which the Company has elected the fair value option. For further discussion, see the Fair Value Option section in Note |
Underlying Referenced Credit Obligation(s) [1] | |||||||||||||||
| Credit Derivative Type by Derivative Risk Exposure | Notional Amount [2] | Fair Value | Weighted Average Years to Maturity | Type | Average Credit Rating | Offsetting Notional Amount [3] | Offsetting Fair Value [3] | ||||||||
| Single name credit default swaps | |||||||||||||||
| Investment grade risk exposure | $ | 102 | $ | — | 2 years | Corporate Credit/ Foreign Gov. | A- | $ | 88 | $ | — | ||||
| Below investment grade risk exposure | 153 | (1 | ) | 1 year | Corporate Credit | BB- | 153 | — | |||||||
| Basket credit default swaps [4] | |||||||||||||||
| Investment grade risk exposure | 2,046 | 18 | 3 years | Corporate Credit | BBB+ | 1,417 | (12 | ) | |||||||
| Investment grade risk exposure | 610 | (18 | ) | 5 years | CMBS Credit | AA+ | 206 | 2 | |||||||
| Below investment grade risk exposure | 153 | (30 | ) | 1 year | CMBS Credit | CCC | 153 | 29 | |||||||
| Embedded credit derivatives | |||||||||||||||
| Investment grade risk exposure | 350 | 351 | 1 year | Corporate Credit | A+ | — | — | ||||||||
| Total [5] | $ | 3,414 | $ | 320 | $ | 2,017 | $ | 19 | |||||||
| Credit Derivatives by Type | Credit Derivatives by Type | |||||||||||||||||||||||||||||
Underlying Referenced Credit Obligation(s) [1] | Underlying Referenced Credit Obligation(s) [1] | |||||||||||||||||||||||||||||
| Credit Derivative Type by Derivative Risk Exposure | Notional Amount [2] | Fair Value | Weighted Average Years to Maturity | Type | Average Credit Rating | Offsetting Notional Amount [3] | Offsetting Fair Value [3] | |||||||||||||||||||||||
Notional Amount [2] | Fair Value | Weighted Average Years to Maturity | Type | Average Credit Rating | Offsetting Notional Amount [3] | Offsetting Fair Value [3] | ||||||||||||||||||||||||
| As of March 31, 2017 | As of March 31, 2017 | |||||||||||||||||||||||||||||
| Single name credit default swaps | ||||||||||||||||||||||||||||||
| Investment grade risk exposure | $ | 190 | $ | (1 | ) | 1 year | Corporate Credit/ Foreign Gov. | BBB+ | $ | 176 | $ | (1 | ) | $ | 229 | $ | 2 | 4 years | Corporate Credit/ Foreign Gov. | A- | $ | 40 | $ | — | ||||||
| Below investment grade risk exposure | 77 | (2 | ) | 2 years | Corporate Credit | B | 77 | 1 | 52 | — | 1 year | Corporate Credit | B- | 52 | (1 | ) | ||||||||||||||
| Basket credit default swaps [4] | ||||||||||||||||||||||||||||||
| Investment grade risk exposure | 3,036 | 22 | 4 years | Corporate Credit | BBB+ | 1,411 | (13 | ) | 2,589 | 8 | 3 years | Corporate Credit | BBB+ | 1,204 | (7 | ) | ||||||||||||||
| Below investment grade risk exposure | 50 | 4 | 4 years | Corporate Credit | B+ | 49 | — | |||||||||||||||||||||||
| Investment grade risk exposure | 681 | (19 | ) | 6 years | CMBS Credit | AA+ | 212 | 1 | 246 | (4 | ) | 4 years | CMBS Credit | AA | 116 | 1 | ||||||||||||||
| Below investment grade risk exposure | 153 | (25 | ) | 1 year | CMBS Credit | CCC | 153 | 25 | 102 | (19 | ) | less than 1 year | CMBS Credit | CCC | 103 | 19 | ||||||||||||||
| Embedded credit derivatives | ||||||||||||||||||||||||||||||
| Investment grade risk exposure | 350 | 346 | 1 year | Corporate Credit | A+ | — | — | 200 | 200 | less than 1 year | Corporate Credit | A+ | — | — | ||||||||||||||||
| Total [5] | $ | 4,487 | $ | 321 | $ | 2,029 | $ | 13 | $ | 3,468 | $ | 191 | $ | 1,564 | $ | 12 | ||||||||||||||
| As of December 31, 2016 | As of December 31, 2016 | |||||||||||||||||||||||||||||
| Single name credit default swaps | ||||||||||||||||||||||||||||||
| Investment grade risk exposure | $ | 169 | $ | — | 4 years | Corporate Credit/ Foreign Gov. | A- | $ | 50 | $ | — | |||||||||||||||||||
| Below investment grade risk exposure | 77 | — | 1 year | Corporate Credit | B+ | 77 | — | |||||||||||||||||||||||
| Basket credit default swaps [4] | ||||||||||||||||||||||||||||||
| Investment grade risk exposure | 2,065 | 22 | 3 years | Corporate Credit | BBB+ | 1,204 | (10 | ) | ||||||||||||||||||||||
| Below investment grade risk exposure | 50 | 3 | 4 years | Corporate Credit | B | 50 | (3 | ) | ||||||||||||||||||||||
| Investment grade risk exposure | 297 | (5 | ) | 4 years | CMBS Credit | AA | 167 | 1 | ||||||||||||||||||||||
| Below investment grade risk exposure | 110 | (26 | ) | 1 year | CMBS Credit | CCC | 111 | 26 | ||||||||||||||||||||||
| Embedded credit derivatives | ||||||||||||||||||||||||||||||
| Investment grade risk exposure | 200 | 201 | Less than 1 year | Corporate Credit | A+ | — | — | |||||||||||||||||||||||
| Total [5] | $ | 2,968 | $ | 195 | $ | 1,659 | $ | 14 | ||||||||||||||||||||||
| [1] | The average credit ratings are based on availability and are generally the midpoint of the |
| [2] | Notional amount is equal to the maximum potential future loss amount. These derivatives are governed by agreements, clearing house rules and applicable law, which include collateral posting requirements. There is no additional specific collateral related to these contracts or recourse provisions included in the contracts to offset losses. |
| [3] | The Company has entered into offsetting credit default swaps to terminate certain existing credit default swaps, thereby offsetting the future changes in value of, or losses paid related to, the original swap. |
| [4] | Includes |
| [5] | Excludes investments that contain an embedded credit derivative for which the Company has elected the fair value option. For further discussion, see the Fair Value Option section in Note |
| For the three months ended March 31, | ||||||
| 2017 | 2016 | |||||
| Beginning liabilities for unpaid losses and loss adjustment expenses, gross | $ | 21,833 | $ | 21,825 | ||
| Reinsurance and other recoverables | 2,776 | 2,882 | ||||
| Beginning liabilities for unpaid losses and loss adjustment expenses, net | 19,057 | 18,943 | ||||
| Provision for unpaid losses and loss adjustment expenses | ||||||
| Current accident year | 1,762 | 1,636 | ||||
| Prior accident year development | 12 | 33 | ||||
| Total provision for unpaid losses and loss adjustment expenses | 1,774 | 1,669 | ||||
| Less: payments | ||||||
| Current accident year | 352 | 358 | ||||
| Prior accident years | 1,300 | 1,266 | ||||
| Total payments | 1,652 | 1,624 | ||||
| Ending liabilities for unpaid losses and loss adjustment expenses, net | 19,179 | 18,988 | ||||
| Reinsurance and other recoverables [1] | 2,772 | 2,835 | ||||
| Ending liabilities for unpaid losses and loss adjustment expenses, gross | $ | 21,951 | $ | 21,823 | ||
| [1] | Includes reinsurance recoverables of $2,365 and $2,451 for the three months ended March 31, 2017 and 2016, respectively. |
| For the three months ended March 31, | ||||||
| 2017 | 2016 | |||||
| Workers’ compensation | $ | (20 | ) | $ | (79 | ) |
| Workers’ compensation discount accretion | 8 | 7 | ||||
| General liability | 10 | 32 | ||||
| Package business | — | 45 | ||||
| Commercial property | 1 | (2 | ) | |||
| Professional liability | — | (33 | ) | |||
| Bond | (10 | ) | (6 | ) | ||
| Automobile liability - Commercial Lines | 20 | 9 | ||||
| Automobile liability - Personal Lines | — | 65 | ||||
| Homeowners | — | (6 | ) | |||
| Net asbestos reserves | — | — | ||||
| Net environmental reserves | — | — | ||||
| Catastrophes | (3 | ) | (7 | ) | ||
| Uncollectible reinsurance | — | — | ||||
| Other reserve re-estimates, net | 6 | 8 | ||||
| Total prior accident year development | $ | 12 | $ | 33 | ||
| For the three months ended March 31, | ||||||
| 2017 | 2016 [1] | |||||
| Beginning liabilities for unpaid losses and loss adjustment expenses, gross | $ | 5,772 | $ | 5,889 | ||
| Reinsurance recoverables | 208 | 218 | ||||
| Beginning liabilities for unpaid losses and loss adjustment expenses, net | 5,564 | 5,671 | ||||
| Provision for unpaid losses and loss adjustment expenses | ||||||
| Current incurral year | 678 | 638 | ||||
| Prior year's discount accretion | 52 | 54 | ||||
| Prior incurral year development [2] | (69 | ) | (53 | ) | ||
| Total provision for unpaid losses and loss adjustment expenses [3] | 661 | 639 | ||||
| Less: payments | ||||||
| Current incurral year | 178 | 174 | ||||
| Prior incurral years | 519 | 509 | ||||
| Total payments | 697 | 683 | ||||
| Ending liabilities for unpaid losses and loss adjustment expenses, net | 5,528 | 5,627 | ||||
| Reinsurance recoverables | 208 | 219 | ||||
| Ending liabilities for unpaid losses and loss adjustment expenses, gross | $ | 5,736 | $ | 5,846 | ||
| [1] | Certain prior year amounts have been reclassified to conform to the current year presentation for unpaid losses and loss adjustment expenses. |
| [2] | Prior incurral year development represents the change in estimated ultimate incurred losses and loss adjustment expenses for prior incurral years on a discounted basis. |
| [3] | Includes unallocated loss adjustment expenses of $24, and $24 for for the three months ended March 31, 2017 and 2016, respectively, that are recorded in insurance operating costs and other expenses in the Condensed Consolidated Statements of Operations. |
| Changes in Reserves for Future Policy Benefits | ||||||||||||
| Universal Life - Type Contracts | ||||||||||||
| GMDB/GMWB [1] | Universal Life Secondary Guarantees | Traditional Annuity and Other Contracts [2] | Total Future Policy Benefits | |||||||||
| Liability balance as of January 1, 2017 | $ | 786 | $ | 2,627 | $ | 10,516 | $ | 13,929 | ||||
| Incurred [3] | 24 | 79 | 225 | 328 | ||||||||
| Paid | (27 | ) | — | (197 | ) | (224 | ) | |||||
| Change in unrealized investment gains and losses | — | — | 18 | 18 | ||||||||
| Liability balance as of March 31, 2017 | $ | 783 | $ | 2,706 | $ | 10,562 | $ | 14,051 | ||||
| Reinsurance recoverable asset, as of January 1, 2017 | $ | 432 | $ | 2,627 | $ | 1,392 | $ | 4,451 | ||||
| Incurred [3] | 17 | 79 | 46 | 142 | ||||||||
| Paid | (23 | ) | — | (11 | ) | (34 | ) | |||||
| Reinsurance recoverable asset, as of March 31, 2017 | $ | 426 | $ | 2,706 | $ | 1,427 | $ | 4,559 | ||||
| GMDB/GMWB [1] | Universal Life Secondary Guarantees | |||||
| Liability balance as of January 1, 2016 | $ | 863 | $ | 2,313 | ||
| Incurred [2] | 28 | 69 | ||||
| Paid | (38 | ) | — | |||
| Liability balance as of March 31, 2016 | $ | 853 | $ | 2,382 | ||
| Reinsurance recoverable asset, as of January 1, 2016 | $ | 523 | $ | 2,313 | ||
| Incurred [2] | 25 | 69 | ||||
| Paid | (29 | ) | — | |||
| Reinsurance recoverable asset, as of March 31, 2016 | $ | 519 | $ | 2,382 | ||
| GMDB/GMWB [1] | Universal Life Secondary Guarantees | |||||
| Liability balance as of January 1, 2015 | $ | 812 | $ | 2,041 | ||
| Incurred [2] | 17 | 63 | ||||
| Paid | (29 | ) | — | |||
| Liability balance as of March 31, 2015 | $ | 800 | $ | 2,104 | ||
| Reinsurance recoverable asset, as of January 1, 2015 | $ | 481 | $ | 2,041 | ||
| Incurred [2] | 18 | 63 | ||||
| Paid | (22 | ) | — | |||
| Reinsurance recoverable asset, as of March 31, 2015 | $ | 477 | $ | 2,104 | ||
| Universal Life - Type Contracts | ||||||||||||
| GMDB/GMWB [1] | Universal Life Secondary Guarantees | Traditional Annuity and Other Contracts [2] | Total Future Policy Benefits | |||||||||
| Liability balance as of January 1, 2016 | $ | 863 | $ | 2,313 | $ | 10,683 | $ | 13,859 | ||||
| Incurred [3] | 28 | 69 | 227 | 324 | ||||||||
| Paid | (38 | ) | — | (196 | ) | (234 | ) | |||||
| Change in unrealized investment gains and losses | — | — | 224 | 224 | ||||||||
| Liability balance as of March 31, 2016 | $ | 853 | $ | 2,382 | $ | 10,938 | $ | 14,173 | ||||
| Reinsurance recoverable asset, as of January 1, 2016 | $ | 523 | $ | 2,313 | $ | 1,478 | $ | 4,314 | ||||
| Incurred [3] | 25 | 69 | 37 | 131 | ||||||||
| Paid | (29 | ) | — | (15 | ) | (44 | ) | |||||
| Reinsurance recoverable asset, as of March 31, 2016 | $ | 519 | $ | 2,382 | $ | 1,500 | $ | 4,401 | ||||
| [1] | These liability balances include all GMDB benefits, plus the life-contingent portion of GMWB benefits in excess of the return of the GRB. GMWB benefits that make up |
| [2] | Represents life-contingent reserves for which the company is subject to insurance and investment risk. |
| [3] | Includes the portion of assessments established as additions to reserves as well as changes in estimates affecting the reserves. |
| Account Value by GMDB/GMWB Type | ||||||||||
| Maximum anniversary value (“MAV”) [1] | Account Value (“AV”) [8] | Net Amount at Risk (“NAR”) [9] | Retained Net Amount at Risk (“RNAR”) [9] | Weighted Average Attained Age of Annuitant | ||||||
| MAV only | $ | 13,980 | $ | 2,783 | $ | 490 | 71 | |||
| With 5% rollup [2] | 1,216 | 232 | 79 | 71 | ||||||
| With Earnings Protection Benefit Rider (“EPB”) [3] | 3,562 | 471 | 75 | 70 | ||||||
| With 5% rollup & EPB | 472 | 104 | 23 | 72 | ||||||
| Total MAV | 19,230 | 3,590 | 667 | |||||||
| Asset Protection Benefit (“APB”) [4] | 11,162 | 546 | 363 | 69 | ||||||
| Lifetime Income Benefit (“LIB”) — Death Benefit [5] | 495 | 9 | 9 | 69 | ||||||
| Reset [6] (5-7 years) | 2,487 | 42 | 41 | 70 | ||||||
| Return of Premium (“ROP”) [7]/Other | 9,126 | 75 | 69 | 68 | ||||||
| Subtotal Variable Annuity with GMDB/GMWB [10] | 42,500 | 4,262 | 1,149 | 69 | ||||||
| Less: General Account Value with GMDB/GMWB | 3,796 | |||||||||
| Subtotal Separate Account Liabilities with GMDB | 38,704 | |||||||||
| Separate Account Liabilities without GMDB | 79,657 | |||||||||
| Total Separate Account Liabilities | $ | 118,361 | ||||||||
| Account Value by GMDB/GMWB Type as of March 31, 2017 | ||||||||||
| Maximum anniversary value (“MAV”) [1] | Account Value (“AV”) [8] | Net Amount at Risk (“NAR”) [9] | Retained Net Amount at Risk (“RNAR”) [9] | Weighted Average Attained Age of Annuitant | ||||||
| MAV only | $ | 13,713 | $ | 2,166 | $ | 326 | 71 | |||
| With 5% rollup [2] | 1,166 | 166 | 53 | 71 | ||||||
| With Earnings Protection Benefit Rider (“EPB”) [3] | 3,484 | 493 | 77 | 71 | ||||||
| With 5% rollup & EPB | 475 | 104 | 23 | 73 | ||||||
| Total MAV | 18,838 | 2,929 | 479 | |||||||
| Asset Protection Benefit (“APB”) [4] | 10,416 | 127 | 83 | 69 | ||||||
| Lifetime Income Benefit (“LIB”) — Death Benefit [5] | 463 | 5 | 5 | 70 | ||||||
| Reset [6] (5-7 years) | 2,436 | 7 | 7 | 70 | ||||||
| Return of Premium (“ROP”) [7]/Other | 8,795 | 63 | 60 | 69 | ||||||
| Subtotal Variable Annuity with GMDB/GMWB [10] | 40,948 | $ | 3,131 | $ | 634 | 70 | ||||
| Less: General Account Value with GMDB/GMWB | 3,727 | |||||||||
| Subtotal Separate Account Liabilities with GMDB | 37,221 | |||||||||
| Separate Account Liabilities without GMDB | 79,361 | |||||||||
| Total Separate Account Liabilities | $ | 116,582 | ||||||||
| [1] | MAV GMDB is the greatest of current AV, net premiums paid and the highest AV on any anniversary before age 80 years (adjusted for withdrawals). |
| [2] | Rollup GMDB is the greatest of the MAV, current AV, net premium paid and premiums (adjusted for withdrawals) accumulated at generally 5% simple interest up to the earlier of age 80 years or 100% of adjusted premiums. |
| [3] | EPB GMDB is the greatest of the MAV, current AV, or contract value plus a percentage of the contract’s growth. The contract’s growth is AV less premiums net of withdrawals, subject to a cap of 200% of premiums net of withdrawals. |
| [4] | APB GMDB is the greater of current AV or MAV, not to exceed current AV plus 25% times the greater of net premiums and MAV (each adjusted for premiums in the past 12 months). |
| [5] | LIB GMDB is the greatest of current AV; net premiums paid; or, for certain contracts, a benefit amount generally based on market performance that ratchets over time. |
| [6] | Reset GMDB is the greatest of current AV, net premiums paid and the most recent five to seven year anniversary AV before age 80 years (adjusted for withdrawals). |
| [7] | ROP GMDB is the greater of current AV or net premiums paid. |
| [8] | AV includes the contract holder’s investment in the separate account and the general account. |
| [9] | NAR is defined as the guaranteed benefit in excess of the current AV. RNAR represents NAR reduced for reinsurance. NAR and RNAR are highly sensitive to equity markets movements and increase when equity markets decline. |
[10] Some variable annuity contracts with GMDB also have a life-contingent GMWB that may provide for benefits in excess of the return of the GRB. Such contracts included in this amount have $6.4 billion of total account value and weighted average attained age of 72 years. There is no NAR or retained NAR related to these contracts. Includes $1.5 billion |
| Account Balance Breakdown of Variable Separate Account Investments for Contracts with Guarantees | ||||||
| Asset type | As of March 31, 2017 | As of December 31, 2016 | ||||
| Equity securities (including mutual funds) | $ | 34,244 | $ | 33,880 | ||
| Cash and cash equivalents | 2,977 | 3,045 | ||||
| Total | $ | 37,221 | $ | 36,925 | ||
| Asset type | As of March 31, 2016 | As of December 31, 2015 | ||||
| Equity securities (including mutual funds) | $ | 35,398 | $ | 36,970 | ||
| Cash and cash equivalents | 3,306 | 3,453 | ||||
| Total | $ | 38,704 | $ | 40,423 | ||
| Income Tax Rate Reconciliation | ||||||
| Three Months Ended March 31, | ||||||
| 2017 | 2016 | |||||
| Tax provision at U.S. federal statutory rate | $ | 170 | $ | 133 | ||
| Tax-exempt interest | (30 | ) | (32 | ) | ||
| Dividends-received deduction ("DRD") | (19 | ) | (22 | ) | ||
| Decrease in valuation allowance | — | (25 | ) | |||
| Stock compensation | (7 | ) | — | |||
| Other | (5 | ) | 4 | |||
| Provision for income taxes | $ | 109 | $ | 58 | ||
| Three Months Ended March 31, | ||||||
| 2016 | 2015 | |||||
| Tax provision at U.S. federal statutory rate | $ | 133 | $ | 219 | ||
| Tax-exempt interest | (32 | ) | (34 | ) | ||
| Dividends-received deduction ("DRD") | (22 | ) | (23 | ) | ||
| Decrease in valuation allowance [1] | (25 | ) | (1 | ) | ||
| Other | 4 | (3 | ) | |||
| Provision for income taxes | $ | 58 | $ | 158 | ||
| Roll-forward of Unrecognized Tax Benefits | Roll-forward of Unrecognized Tax Benefits | |||||||||||
| Three Months Ended March 31, | Three Months Ended March 31, | |||||||||||
| 2016 | 2015 | 2017 | 2016 | |||||||||
| Balance, beginning of period | $ | 12 | $ | 48 | $ | 12 | $ | 12 | ||||
| Gross increases - tax positions in prior period | — | — | — | — | ||||||||
| Gross decreases - tax positions in prior period | — | — | — | — | ||||||||
| Balance, end of period | $ | 12 | $ | 48 | $ | 12 | $ | 12 | ||||
| Future Tax Benefits | Future Tax Benefits | |||||||||||||||||||||||||||||||||||
| As of | As of | |||||||||||||||||||||||||||||||||||
| March 31, 2016 | December 31, 2015 | Expiration | March 31, 2017 | December 31, 2016 | Expiration | |||||||||||||||||||||||||||||||
| Carryover amount | Expected tax benefit, gross | Carryover amount | Expected tax benefit, gross | Dates | Amount | Carryover amount | Expected tax benefit, gross | Carryover amount | Expected tax benefit, gross | Dates | Amount | |||||||||||||||||||||||||
| Net operating loss carryover - U.S. | $ | 5,097 | $ | 1,784 | $ | 5,182 | $ | 1,814 | 2016 | - | 2020 | $ | 4 | $ | 5,165 | $ | 1,808 | $ | 5,412 | $ | 1,894 | 2020 | $ | 1 | ||||||||||||
| 2023 | - | 2033 | $ | 5,093 | 2023 | - | 2036 | $ | 5,164 | |||||||||||||||||||||||||||
| Net operating loss carryover - foreign | $ | 88 | $ | 17 | $ | 89 | $ | 17 | No expiration | $ | 88 | |||||||||||||||||||||||||
| Net operating loss carryover - foreign [1] | $ | 51 | $ | 10 | $ | 48 | $ | 9 | No expiration | $ | 51 | |||||||||||||||||||||||||
| Foreign tax credit carryover | $ | 146 | $ | 146 | $ | 154 | $ | 154 | 2019 | - | 2024 | $ | 146 | $ | 49 | $ | 49 | $ | 56 | $ | 56 | 2021 | - | 2024 | $ | 49 | ||||||||||
| Capital loss carryover | $ | 151 | $ | 53 | $ | 222 | $ | 78 | 2019 | $ | 151 | $ | — | $ | — | $ | — | $ | — | 0 | $ | — | ||||||||||||||
| Alternative minimum tax credit carryover | $ | 639 | $ | 639 | $ | 639 | $ | 639 | No expiration | $ | 639 | $ | 650 | $ | 650 | $ | 640 | $ | 640 | No expiration | $ | 650 | ||||||||||||||
| General business credit carryover | $ | 90 | $ | 90 | $ | 99 | $ | 99 | 2031 | - | 2036 | $ | 90 | |||||||||||||||||||||||
| [1] | Related to subsidiaries included in the sale of the U.K. property and casualty run-off business and part of the assets held for sale. For additional information, see Note 2 - Business Disposition of Notes to Condensed Consolidated Financial Statements. |
| Changes in | ||||||||||||||||||
| Net Unrealized Gain on Securities | OTTI Losses in OCI | Net Gain on Cash Flow Hedging Instruments | Foreign Currency Translation Adjustments | Pension and Other Postretirement Plan Adjustments | AOCI, net of tax | |||||||||||||
| Beginning balance | $ | 1,279 | $ | (7 | ) | $ | 130 | $ | (55 | ) | $ | (1,676 | ) | $ | (329 | ) | ||
| OCI before reclassifications | 549 | (9 | ) | 70 | 6 | 1 | 617 | |||||||||||
| Amounts reclassified from AOCI | (27 | ) | 1 | (16 | ) | — | 8 | (34 | ) | |||||||||
| OCI, net of tax | 522 | (8 | ) | 54 | 6 | 9 | 583 | |||||||||||
| Ending balance | $ | 1,801 | $ | (15 | ) | $ | 184 | $ | (49 | ) | $ | (1,667 | ) | $ | 254 | |||
| Amount Reclassified from AOCI | ||||
| AOCI | Three Months Ended March 31, 2016 | Affected Line Item in the Condensed Consolidated Statement of Operations | ||
| Net Unrealized Gain on Securities | ||||
| Available-for-sale securities | $ | 41 | Net realized capital gains (losses) | |
| 41 | Total before tax | |||
| 14 | Income tax expense | |||
| $ | 27 | Net income | ||
| OTTI Losses in OCI | ||||
| Other than temporary impairments | $ | (1 | ) | Net realized capital gains (losses) |
| (1 | ) | Total before tax | ||
| — | Income tax expense | |||
| $ | (1 | ) | Net income | |
| Net Gains on Cash Flow Hedging Instruments | ||||
| Interest rate swaps | $ | 5 | Net realized capital gains (losses) | |
| Interest rate swaps | 15 | Net investment income | ||
| Foreign currency swaps | 4 | Net realized capital gains (losses) | ||
| 24 | Total before tax | |||
| 8 | Income tax expense | |||
| $ | 16 | Net income | ||
| Pension and Other Postretirement Plan Adjustments | ||||
| Amortization of prior service credit | $ | 2 | Insurance operating costs and other expenses | |
| Amortization of actuarial loss | (15 | ) | Insurance operating costs and other expenses | |
| (13 | ) | Total before tax | ||
| (5 | ) | Income tax expense | ||
| $ | (8 | ) | Net income | |
| Total amounts reclassified from AOCI | $ | 34 | Net income | |
| Changes in AOCI, Net of Tax for the Three Months Ended March 31, 2017 | ||||||||||||||||||
| Changes in | ||||||||||||||||||
| Net Unrealized Gain on Securities | OTTI Losses in OCI | Net Gain on Cash Flow Hedging Instruments | Foreign Currency Translation Adjustments | Pension and Other Postretirement Plan Adjustments | AOCI, net of tax | |||||||||||||
| Beginning balance | $ | 1,276 | $ | (3 | ) | $ | 76 | $ | 6 | $ | (1,692 | ) | $ | (337 | ) | |||
| OCI before reclassifications | 160 | (1 | ) | (4 | ) | 2 | — | 157 | ||||||||||
| Amounts reclassified from AOCI | (23 | ) | — | (14 | ) | — | 10 | (27 | ) | |||||||||
| OCI, net of tax | 137 | (1 | ) | (18 | ) | 2 | 10 | 130 | ||||||||||
| Ending balance | $ | 1,413 | $ | (4 | ) | $ | 58 | $ | 8 | $ | (1,682 | ) | $ | (207 | ) | |||
| Reclassifications from AOCI | ||||
| Three Months Ended March 31, 2017 | Affected Line Item in the Condensed Consolidated Statement of Operations | |||
| Net Unrealized Gain on Securities | ||||
| Available-for-sale securities | $ | 36 | Net realized capital gains (losses) | |
| 36 | Total before tax | |||
| 13 | Income tax expense (benefit) | |||
| $ | 23 | Net income | ||
| Net Gains on Cash Flow Hedging Instruments | ||||
| Interest rate swaps | $ | 4 | Net realized capital gains (losses) | |
| Interest rate swaps | 16 | Net investment income | ||
| Foreign currency swaps | 1 | Net realized capital gains (losses) | ||
| 21 | Total before tax | |||
| 7 | Income tax expense (benefit) | |||
| $ | 14 | Net income | ||
| Pension and Other Postretirement Plan Adjustments | ||||
| Amortization of prior service credit | $ | 1 | Insurance operating costs and other expenses | |
| Amortization of actuarial loss | (16 | ) | Insurance operating costs and other expenses | |
| (15 | ) | Total before tax | ||
| (5 | ) | Income tax expense (benefit) | ||
| $ | (10 | ) | Net income | |
| Total amounts reclassified from AOCI | $ | 27 | Net income | |
| Changes in AOCI, Net of Tax for the Three Months Ended March 31, 2016 | ||||||||||||||||||
| Changes in | ||||||||||||||||||
| Net Unrealized Gain on Securities | OTTI Losses in OCI | Net Gain on Cash Flow Hedging Instruments | Foreign Currency Translation Adjustments | Pension and Other Postretirement Plan Adjustments | AOCI, net of tax | |||||||||||||
| Beginning balance | $ | 1,279 | $ | (7 | ) | $ | 130 | $ | (55 | ) | $ | (1,676 | ) | $ | (329 | ) | ||
| OCI before reclassifications | 549 | (9 | ) | 70 | 6 | 1 | 617 | |||||||||||
| Amounts reclassified from AOCI | (27 | ) | 1 | (16 | ) | — | 8 | (34 | ) | |||||||||
| OCI, net of tax | 522 | (8 | ) | 54 | 6 | 9 | 583 | |||||||||||
| Ending balance | $ | 1,801 | $ | (15 | ) | $ | 184 | $ | (49 | ) | $ | (1,667 | ) | $ | 254 | |||
| Reclassifications of AOCI | ||||
| Three Months Ended March 31, 2016 | Affected Line Item in the Condensed Consolidated Statement of Operations | |||
| Net Unrealized Gain on Securities | ||||
| Available-for-sale securities | $ | 41 | Net realized capital gains (losses) | |
| 41 | Total before tax | |||
| 14 | Income tax expense (benefit) | |||
| $ | 27 | Net income | ||
| OTTI Losses in OCI | ||||
| Other than temporary impairments | $ | (1 | ) | Net realized capital gains (losses) |
| (1 | ) | Total before tax | ||
| — | Income tax expense (benefit) | |||
| $ | (1 | ) | Net income | |
| Net Gains on Cash Flow Hedging Instruments | ||||
| Interest rate swaps | $ | 5 | Net realized capital gains (losses) | |
| Interest rate swaps | 15 | Net investment income | ||
| Foreign currency swaps | 4 | Net realized capital gains (losses) | ||
| 24 | Total before tax | |||
| 8 | Income tax expense (benefit) | |||
| $ | 16 | Net income | ||
| Pension and Other Postretirement Plan Adjustments | ||||
| Amortization of prior service credit | $ | 2 | Insurance operating costs and other expenses | |
| Amortization of actuarial loss | (15 | ) | Insurance operating costs and other expenses | |
| (13 | ) | Total before tax | ||
| (5 | ) | Income tax expense (benefit) | ||
| $ | (8 | ) | Net income | |
| Total amounts reclassified from AOCI | $ | 34 | Net income | |
| Changes in | ||||||||||||||||||
| Net Unrealized Gain on Securities | OTTI Losses in OCI | Net Gain on Cash Flow Hedging Instruments | Foreign Currency Translation Adjustments | Pension and Other Postretirement Plan Adjustments | AOCI, net of tax | |||||||||||||
| Beginning balance | $ | 2,370 | $ | (5 | ) | $ | 150 | $ | (8 | ) | $ | (1,579 | ) | $ | 928 | |||
| OCI before reclassifications | 232 | (4 | ) | 32 | (20 | ) | 19 | 259 | ||||||||||
| Amounts reclassified from AOCI | (24 | ) | 1 | (5 | ) | — | (9 | ) | (37 | ) | ||||||||
| OCI, net of tax | 208 | (3 | ) | 27 | (20 | ) | 10 | 222 | ||||||||||
| Ending balance | $ | 2,578 | $ | (8 | ) | $ | 177 | $ | (28 | ) | $ | (1,569 | ) | $ | 1,150 | |||
| Amount Reclassified from AOCI | ||||
| AOCI | Three Months Ended March 31, 2015 | Affected Line Item in the Condensed Consolidated Statement of Operations | ||
| Net Unrealized Gain on Securities | ||||
| Available-for-sale securities | $ | 37 | Net realized capital gains (losses) | |
| 37 | Total before tax | |||
| 13 | Income tax expense | |||
| $ | 24 | Net income | ||
| OTTI Losses in OCI | ||||
| Other than temporary impairments | $ | (1 | ) | Net realized capital gains (losses) |
| (1 | ) | Total before tax | ||
| — | Income tax expense | |||
| $ | (1 | ) | Net income | |
| Net Gains on Cash Flow Hedging Instruments | ||||
| Interest rate swaps | $ | 1 | Net realized capital gains (losses) | |
| Interest rate swaps | 16 | Net investment income | ||
| Foreign currency swaps | (10 | ) | Net realized capital gains (losses) | |
| 7 | Total before tax | |||
| 2 | Income tax expense | |||
| $ | 5 | Net income | ||
| Pension and Other Postretirement Plan Adjustments | ||||
| Amortization of prior service credit | $ | (2 | ) | Insurance operating costs and other expenses |
| Amortization of actuarial loss | 16 | Insurance operating costs and other expenses | ||
| 14 | Total before tax | |||
| 5 | Income tax expense | |||
| $ | 9 | Net income | ||
| Total amounts reclassified from AOCI | $ | 37 | Net income | |
| Components of Net Periodic Cost (Benefit) | Components of Net Periodic Cost (Benefit) | |||||||||||||||||||||||
| Pension Benefits | Other Postretirement Benefits | |||||||||||||||||||||||
| Three Months Ended March 31, | Three Months Ended March 31, | |||||||||||||||||||||||
| Pension Benefits | Other Postretirement Benefits | 2017 | 2016 | 2017 | 2016 | |||||||||||||||||||
| Three Months Ended March 31, | Three Months Ended March 31, | |||||||||||||||||||||||
| 2016 | 2015 | 2016 | 2015 | |||||||||||||||||||||
| Service cost | $ | 1 | $ | — | $ | — | $ | — | ||||||||||||||||
| Interest cost | $ | 59 | $ | 59 | $ | 3 | $ | 3 | 49 | 59 | 2 | 3 | ||||||||||||
| Expected return on plan assets | (77 | ) | (78 | ) | (2 | ) | (3 | ) | (79 | ) | (77 | ) | (2 | ) | (2 | ) | ||||||||
| Amortization of prior service credit | — | — | (2 | ) | (2 | ) | — | — | (1 | ) | (2 | ) | ||||||||||||
| Amortization of actuarial loss | 14 | 15 | 1 | 1 | 15 | 14 | 1 | 1 | ||||||||||||||||
| Net periodic benefit | $ | (4 | ) | $ | (4 | ) | $ | — | $ | (1 | ) | $ | (14 | ) | $ | (4 | ) | $ | — | $ | — | |||
| Description | Page |
| Key Performance Measures and Ratios | |
Commercial Lines | |
| Personal Lines | |
| Three Months Ended March 31, | ||||||
| 2017 | 2016 | |||||
| Net income | $ | 378 | $ | 323 | ||
| Less: Unlock benefit (charge), before tax | 18 | 13 | ||||
| Less: Net realized capital gains (losses) after DAC, excluded from core earnings, before tax | (20 | ) | (148 | ) | ||
| Less: Income tax benefit (expense) [1] | 2 | 73 | ||||
| Core earnings | $ | 378 | $ | 385 | ||
| Net Income | Net Income per Diluted Share | Book Value per Diluted Share |
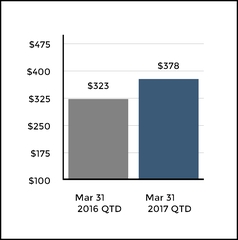
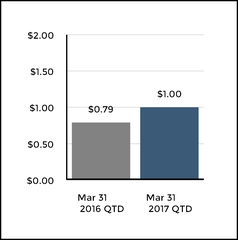
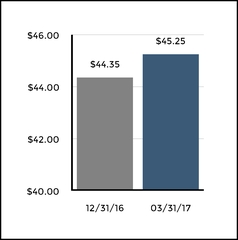
| Net Investment Income | Investment Yield After-tax |
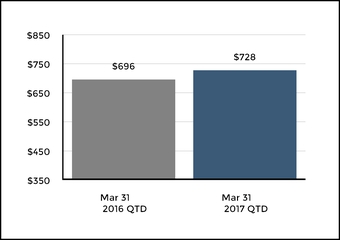
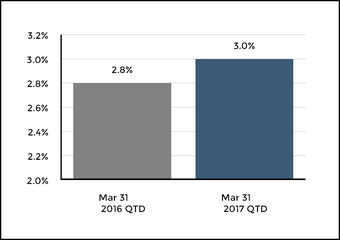
| Written Premiums | Combined Ratio |
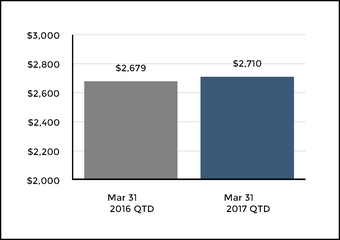
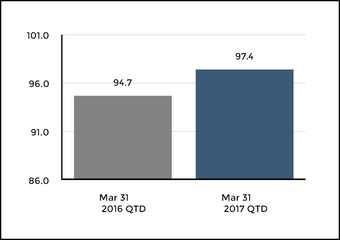
| Group Benefits Core Earnings Margin [1] | Net Income - Talcott Resolution |
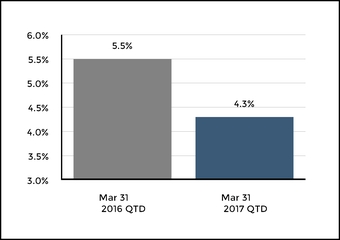
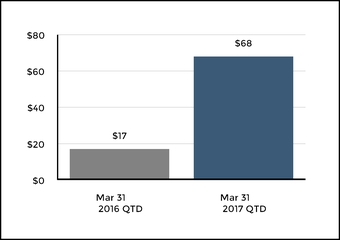
| [1] | A reconciliation of the net income margin to core earnings margin is set forth in the Results of Operations section within MD&A - Group Benefits. |
| Three Months Ended March 31, | ||||||||
| 2017 | 2016 | Change | ||||||
| Earned premiums | $ | 3,473 | $ | 3,404 | 2 | % | ||
| Fee income | 455 | 445 | 2 | % | ||||
| Net investment income | 728 | 696 | 5 | % | ||||
| Net realized capital losses | (20 | ) | (155 | ) | 87 | % | ||
| Other revenues | 19 | 20 | (5 | %) | ||||
| Total revenues | 4,655 | 4,410 | 6 | % | ||||
| Benefits, losses and loss adjustment expenses | 2,757 | 2,641 | 4 | % | ||||
| Amortization of deferred policy acquisition costs | 363 | 374 | (3 | %) | ||||
| Insurance operating costs and other expenses | 965 | 928 | 4 | % | ||||
| Interest expense | 83 | 86 | (3 | %) | ||||
| Total benefits, losses and expenses | 4,168 | 4,029 | 3 | % | ||||
| Income before income taxes | 487 | 381 | 28 | % | ||||
| Income tax expense | 109 | 58 | 88 | % | ||||
| Net income | $ | 378 | $ | 323 | 17 | % | ||
| Operating Summary | Three Months Ended March 31, | |||||||
| 2016 | 2015 | Change | ||||||
| Earned premiums | $ | 3,404 | $ | 3,322 | 2 | % | ||
| Fee income | 426 | 459 | (7 | %) | ||||
| Net investment income | 696 | 809 | (14 | %) | ||||
| Net realized capital gains (losses) | (155 | ) | 5 | NM | ||||
| Other revenues | 20 | 22 | (9 | %) | ||||
| Total revenues | 4,391 | 4,617 | (5 | %) | ||||
| Benefits, losses and loss adjustment expenses | 2,641 | 2,563 | 3 | % | ||||
| Amortization of deferred policy acquisition costs | 374 | 387 | (3 | %) | ||||
| Insurance operating costs and other expenses | 909 | 948 | (4 | %) | ||||
| Interest expense | 86 | 94 | (9 | %) | ||||
| Total benefits, losses and expenses | 4,010 | 3,992 | — | % | ||||
| Income before income taxes | 381 | 625 | (39 | %) | ||||
| Income tax expense | 58 | 158 | (63 | %) | ||||
| Net income | $ | 323 | $ | 467 | (31 | %) | ||
| ▪ | Net unfavorable prior accident year reserve development in first quarter 2017 was primarily due to an increase in reserves for commercial automobile liability and general liability, partially offset by a decrease in reserves for bond and workers' compensation. The increase in estimate for commercial automobile was in Small Commercial and large national accounts for the 2013 to 2016 accident years, driven by higher frequency of more severe accidents, including litigated claims. |
| ▪ | Prior accident year reserve development in 2016 was primarily due to an increase in reserves in personal lines automobile liability and small commercial package business, partially offset by favorable development in workers' compensation. For additional information, see MD&A - Critical Accounting Estimates, Reserve Roll Forwards and Development. |
| March 31, 2016 | December 31, 2015 | March 31, 2017 | December 31, 2016 | |||||||||||||||||||
| Amount | Percent | Amount | Percent | Amount | Percent | Amount | Percent | |||||||||||||||
| Fixed maturities, available-for-sale ("AFS"), at fair value | $ | 60,693 | 82.1 | % | $ | 59,196 | 81.4 | % | $ | 56,326 | 78.0 | % | $ | 56,003 | 79.3 | % | ||||||
| Fixed maturities, at fair value using the fair value option ("FVO") | 486 | 0.7 | % | 503 | 0.7 | % | 160 | 0.2 | % | 293 | 0.4 | % | ||||||||||
| Equity securities, AFS, at fair value [1] | 798 | 1.1 | % | 1,121 | 1.5 | % | 1,223 | 1.7 | % | 1,097 | 1.6 | % | ||||||||||
| Mortgage loans | 5,637 | 7.6 | % | 5,624 | 7.7 | % | 5,685 | 7.9 | % | 5,697 | 8.1 | % | ||||||||||
| Policy loans, at outstanding balance | 1,444 | 1.9 | % | 1,447 | 2.0 | % | 1,442 | 2.0 | % | 1,444 | 1.9 | % | ||||||||||
| Limited partnerships and other alternative investments | 2,654 | 3.6 | % | 2,874 | 4.0 | % | 2,418 | 3.3 | % | 2,456 | 3.5 | % | ||||||||||
| Other investments [2] | 280 | 0.4 | % | 120 | 0.2 | % | 340 | 0.5 | % | 403 | 0.6 | % | ||||||||||
| Short-term investments | 1,918 | 2.6 | % | 1,843 | 2.5 | % | 4,595 | 6.4 | % | 3,244 | 4.6 | % | ||||||||||
| Total investments | $ | 73,910 | 100.0 | % | $ | 72,728 | 100.0 | % | $ | 72,189 | 100.0 | % | $ | 70,637 | 100.0 | % | ||||||
| [1] | Includes equity securities at fair value using the FVO of |
| [2] | Primarily relates to derivative instruments. |
| Net Investment Income (Loss) | Net Investment Income (Loss) | |||||||||||||||||||
| Three Months Ended March 31, | Three Months Ended March 31, | |||||||||||||||||||
| 2016 | 2015 | 2017 | 2016 | |||||||||||||||||
| (Before tax) | Amount | Yield [1] | Amount | Yield [1] | Amount | Yield [1] | Amount | Yield [1] | ||||||||||||
| Fixed maturities [2] | $ | 595 | 4.2 | % | $ | 600 | 4.2 | % | $ | 575 | 4.2 | % | $ | 595 | 4.2 | % | ||||
| Equity securities, AFS | 11 | 4.7 | % | 6 | 2.0 | % | ||||||||||||||
| Equity securities | 5 | 1.9 | % | 11 | 4.7 | % | ||||||||||||||
| Mortgage loans | 60 | 4.3 | % | 69 | 4.9 | % | 62 | 4.3 | % | 60 | 4.3 | % | ||||||||
| Policy loans | 22 | 6.0 | % | 20 | 5.6 | % | 19 | 5.1 | % | 22 | 6.0 | % | ||||||||
| Limited partnerships and other alternative investments | 8 | 1.2 | % | 99 | 13.7 | % | 70 | 11.6 | % | 8 | 1.2 | % | ||||||||
| Other [3] | 27 | 42 | 29 | 27 | ||||||||||||||||
| Investment expense | (27 | ) | (27 | ) | (32 | ) | (27 | ) | ||||||||||||
| Total net investment income | 696 | 4.0 | % | 809 | 4.5 | % | $ | 728 | 4.3 | % | $ | 696 | 4.0 | % | ||||||
| Total net investment income excluding limited partnerships and other alternative investments | $ | 688 | 4.1 | % | $ | 710 | 4.1 | % | $ | 658 | 4.0 | % | $ | 688 | 4.1 | % | ||||
| [1] | Yields calculated using annualized net investment income divided by the monthly average invested assets at cost, amortized cost, or adjusted carrying value, as applicable, excluding repurchase agreement and securities lending collateral , if any, and derivatives book value. |
| [2] | Includes net investment income on short-term investments. |
| [3] | Primarily includes income from derivatives that qualify for hedge accounting and |
| Net Realized Capital Gains (Losses) | Net Realized Capital Gains (Losses) | |||||||||||
| Three Months Ended March 31, | Three Months Ended March 31, | |||||||||||
| (Before tax) | 2016 | 2015 | 2017 | 2016 | ||||||||
| Gross gains on sales | $ | 90 | $ | 197 | $ | 112 | $ | 90 | ||||
| Gross losses on sales | (108 | ) | (148 | ) | (75 | ) | (108 | ) | ||||
| Net other-than-temporary impairment ("OTTI") losses recognized in earnings | (23 | ) | (12 | ) | ||||||||
| Valuation allowances on mortgage loans | — | (3 | ) | |||||||||
| Periodic net coupon settlements on credit derivatives | — | 1 | ||||||||||
| Net other-than-temporary impairment ("OTTI") losses recognized in earnings [1] | (1 | ) | (23 | ) | ||||||||
| Results of variable annuity hedge program | ||||||||||||
| GMWB derivatives, net | (17 | ) | 1 | 18 | (17 | ) | ||||||
| Macro hedge program | (14 | ) | (4 | ) | (86 | ) | (14 | ) | ||||
| Total results of variable annuity hedge program | (31 | ) | (3 | ) | (68 | ) | (31 | ) | ||||
| Other, net [1] | (83 | ) | (27 | ) | ||||||||
| Transactional foreign currency revaluation | (13 | ) | (44 | ) | ||||||||
| Non-qualifying foreign currency derivatives | 11 | 39 | ||||||||||
| Other, net [2] | 14 | (78 | ) | |||||||||
| Net realized capital gains (losses) | $ | (155 | ) | $ | 5 | $ | (20 | ) | $ | (155 | ) | |
| [1] | See Other-Than-Temporary Impairments within the Investment Portfolio Risks and Risk Management section of the MD&A. |
| [2] | Primarily consists of changes in value of non-qualifying derivatives, including credit derivatives, interest rate derivatives used to manage duration, and |
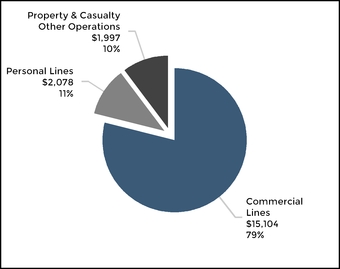
| Three Months Ended March 31, 2016 | ||||||||||||||||||||||||
Commercial Lines | Personal Lines | Property & Casualty Other Operations | Total Property & Casualty Insurance | Commercial Lines | Personal Lines | Property & Casualty Other Operations | Total Property & Casualty Insurance | |||||||||||||||||
| Beginning liabilities for unpaid losses and loss adjustment expenses, gross | $ | 16,559 | $ | 1,845 | $ | 3,421 | $ | 21,825 | $ | 17,238 | $ | 2,094 | $ | 2,501 | $ | 21,833 | ||||||||
| Reinsurance and other recoverables | 2,293 | 19 | 570 | 2,882 | 2,325 | 25 | 426 | 2,776 | ||||||||||||||||
| Beginning liabilities for unpaid losses and loss adjustment expenses, net | 14,266 | 1,826 | 2,851 | 18,943 | 14,913 | 2,069 | 2,075 | 19,057 | ||||||||||||||||
| Provision for unpaid losses and loss adjustment expenses | ||||||||||||||||||||||||
| Current accident year before catastrophes | 913 | 632 | — | 1,545 | 968 | 644 | — | 1,612 | ||||||||||||||||
| Current accident year catastrophes [3] | 44 | 47 | — | 91 | ||||||||||||||||||||
| Prior accident year development | (20 | ) | 52 | 1 | 33 | |||||||||||||||||||
| Current accident year ("CAY") catastrophes ("CATS") | 71 | 79 | — | 150 | ||||||||||||||||||||
| Prior accident year development ("PYD") | 15 | (4 | ) | 1 | 12 | |||||||||||||||||||
| Total provision for unpaid losses and loss adjustment expenses | 937 | 731 | 1 | 1,669 | 1,054 | 719 | 1 | 1,774 | ||||||||||||||||
| Less: payments | 854 | 707 | 63 | 1,624 | 863 | 710 | 79 | 1,652 | ||||||||||||||||
| Ending liabilities for unpaid losses and loss adjustment expenses, net | 14,349 | 1,850 | 2,789 | 18,988 | 15,104 | 2,078 | 1,997 | 19,179 | ||||||||||||||||
| Reinsurance and other recoverables | 2,251 | 19 | 565 | 2,835 | 2,336 | 25 | 411 | 2,772 | ||||||||||||||||
| Ending liabilities for unpaid losses and loss adjustment expenses, gross | $ | 16,600 | $ | 1,869 | $ | 3,354 | $ | 21,823 | $ | 17,440 | $ | 2,103 | $ | 2,408 | $ | 21,951 | ||||||||
| Earned premiums | $ | 1,623 | $ | 975 | $ | 1,698 | $ | 945 | ||||||||||||||||
| Loss and loss expense paid ratio [1] | 52.6 | 72.5 | 50.8 | 75.1 | ||||||||||||||||||||
| Loss and loss expense incurred ratio | 57.7 | 75.0 | 62.4 | 77.0 | ||||||||||||||||||||
| Prior accident year development (pts) [2] | (1.2 | ) | 5.3 | 0.9 | (0.4 | ) | ||||||||||||||||||
| [1] | The “loss and loss expense paid ratio” represents the ratio of paid losses and loss adjustment expenses to earned premiums. |
| [2] | “Prior accident year development (pts)” represents the ratio of prior accident year development to earned premiums. |
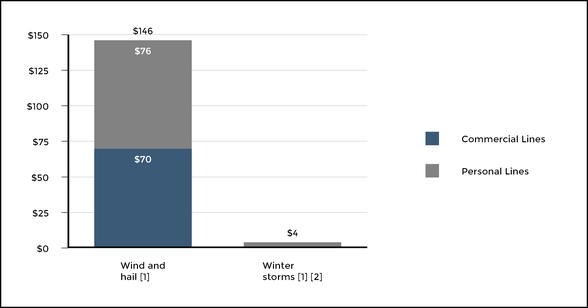
| Three Months Ended March 31, 2016 | |||||||||
| Category | Commercial Lines | Personal Lines | Total Property & Casualty Insurance | ||||||
| Wind and hail [1] | $ | 19 | $ | 41 | $ | 60 | |||
| Winter storms [1] | 25 | 6 | 31 | ||||||
| Total | $ | 44 | $ | 47 | $ | 91 | |||
| Commercial Lines | Personal Lines | Property & Casualty Other Operations | Total Property & Casualty Insurance | |||||||||
| Workers’ compensation | $ | (20 | ) | $ | — | $ | — | $ | (20 | ) | ||
| Workers’ compensation discount accretion | 8 | — | — | 8 | ||||||||
| General liability | 10 | — | — | 10 | ||||||||
| Package business | — | — | — | — | ||||||||
| Commercial property | 1 | — | — | 1 | ||||||||
| Professional liability | — | — | — | — | ||||||||
| Bond | (10 | ) | — | — | (10 | ) | ||||||
| Automobile liability | 20 | — | — | 20 | ||||||||
| Homeowners | — | — | — | — | ||||||||
| Net asbestos reserves | — | — | — | — | ||||||||
| Net environmental reserves | — | — | — | — | ||||||||
| Catastrophes | — | (3 | ) | — | (3 | ) | ||||||
| Uncollectible reinsurance | — | — | — | — | ||||||||
| Other reserve re-estimates, net | 6 | (1 | ) | 1 | 6 | |||||||
| Total prior accident year development | $ | 15 | $ | (4 | ) | $ | 1 | $ | 12 | |||
| Three Months Ended March 31, 2016 | ||||||||||||
| Commercial Lines | Personal Lines | Property & Casualty Other Operations | Total Property & Casualty Insurance | |||||||||
| Auto liability | $ | 9 | $ | 65 | $ | — | $ | 74 | ||||
| Homeowners | — | (6 | ) | — | (6 | ) | ||||||
| Professional liability | (33 | ) | — | — | (33 | ) | ||||||
| Package business | 45 | — | — | 45 | ||||||||
| General liability | 32 | — | — | 32 | ||||||||
| Bond | (6 | ) | — | — | (6 | ) | ||||||
| Commercial property | (2 | ) | — | — | (2 | ) | ||||||
| Workers’ compensation | (79 | ) | — | — | (79 | ) | ||||||
| Workers’ compensation discount accretion | 7 | — | — | 7 | ||||||||
| Catastrophes | (2 | ) | (5 | ) | — | (7 | ) | |||||
| Other reserve re-estimates, net | 9 | (2 | ) | 1 | 8 | |||||||
| Total prior accident year development | $ | (20 | ) | $ | 52 | $ | 1 | $ | 33 | |||
| Three Months Ended March 31, 2015 | ||||||||||||||||||||||||
Commercial Lines [3] | Personal Lines | Property & Casualty Other Operations | Total Property & Casualty Insurance | Commercial Lines [3] | Personal Lines | Property & Casualty Other Operations | Total Property & Casualty Insurance | |||||||||||||||||
| Beginning liabilities for unpaid losses and loss adjustment expenses, gross | $ | 16,465 | $ | 1,874 | $ | 3,467 | $ | 21,806 | $ | 16,559 | $ | 1,845 | $ | 3,421 | $ | 21,825 | ||||||||
| Reinsurance and other recoverables | 2,459 | 18 | 564 | 3,041 | 2,293 | 19 | 570 | 2,882 | ||||||||||||||||
| Beginning liabilities for unpaid losses and loss adjustment expenses, net | 14,006 | 1,856 | 2,903 | 18,765 | 14,266 | 1,826 | 2,851 | 18,943 | ||||||||||||||||
| Provision for unpaid losses and loss adjustment expenses | ||||||||||||||||||||||||
| Current accident year before catastrophes | 928 | 618 | — | 1,546 | 913 | 632 | — | 1,545 | ||||||||||||||||
| Current accident year catastrophes [3] | 58 | 25 | — | 83 | ||||||||||||||||||||
| Current accident year catastrophes | 44 | 47 | — | 91 | ||||||||||||||||||||
| Prior accident year development | (2 | ) | (4 | ) | 4 | (2 | ) | (20 | ) | 52 | 1 | 33 | ||||||||||||
| Total provision for unpaid losses and loss adjustment expenses | 984 | 639 | 4 | 1,627 | 937 | 731 | 1 | 1,669 | ||||||||||||||||
| Less: payments | 897 | 647 | 93 | 1,637 | 854 | 707 | 63 | 1,624 | ||||||||||||||||
| Ending liabilities for unpaid losses and loss adjustment expenses, net | 14,093 | 1,848 | 2,814 | 18,755 | 14,349 | 1,850 | 2,789 | 18,988 | ||||||||||||||||
| Reinsurance and other recoverables | 2,418 | 19 | 558 | 2,995 | 2,251 | 19 | 565 | 2,835 | ||||||||||||||||
| Ending liabilities for unpaid losses and loss adjustment expenses, gross | $ | 16,511 | $ | 1,867 | $ | 3,372 | $ | 21,750 | $ | 16,600 | $ | 1,869 | $ | 3,354 | $ | 21,823 | ||||||||
| Earned premiums | $ | 1,583 | $ | 952 | $ | 1,623 | $ | 975 | ||||||||||||||||
| Loss and loss expense paid ratio [1] | 56.7 | 68.0 | 52.6 | 72.5 | ||||||||||||||||||||
| Loss and loss expense incurred ratio | 62.2 | 67.1 | 57.7 | 75.0 | ||||||||||||||||||||
| Prior accident year development (pts) [2] | (0.1 | ) | (0.4 | ) | (1.2 | ) | 5.3 | |||||||||||||||||
| [1] | The “loss and loss expense paid ratio” represents the ratio of paid losses and loss adjustment expenses to earned premiums. |
| [2] | “Prior accident year development (pts)” represents the ratio of prior accident year development to earned premiums. |
| Three Months Ended March 31, 2015 | |||||||||
| Category | Commercial Lines | Personal Lines | Total Property & Casualty Insurance | ||||||
| Winter storms [1] | 49 | 17 | $ | 66 | |||||
| Tornadoes | 7 | 5 | 12 | ||||||
| Wind and hail [1] | $ | 2 | $ | 3 | $ | 5 | |||
| Total | $ | 58 | $ | 25 | $ | 83 | |||
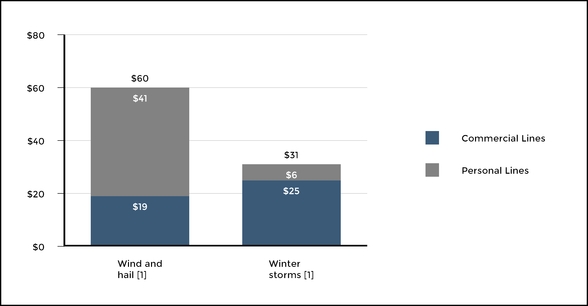
| [1] | These amounts represent an aggregation of multiple catastrophes. |
| Commercial Lines | Personal Lines | Property & Casualty Other Operations | Total Property & Casualty Insurance | |||||||||
| Workers’ compensation | $ | (79 | ) | $ | — | $ | — | $ | (79 | ) | ||
| Workers’ compensation discount accretion | 7 | — | — | 7 | ||||||||
| General liability | 32 | — | — | 32 | ||||||||
| Package business | 45 | — | — | 45 | ||||||||
| Commercial property | (2 | ) | — | — | (2 | ) | ||||||
| Professional liability | (33 | ) | — | — | (33 | ) | ||||||
| Bond | (6 | ) | — | — | (6 | ) | ||||||
| Automobile liability | 9 | 65 | — | 74 | ||||||||
| Homeowners | — | (6 | ) | — | (6 | ) | ||||||
| Catastrophes | (2 | ) | (5 | ) | — | (7 | ) | |||||
| Other reserve re-estimates, net | 9 | (2 | ) | 1 | 8 | |||||||
| Total prior accident year development | $ | (20 | ) | $ | 52 | $ | 1 | $ | 33 | |||
| Three Months Ended March 31, 2015 | ||||||||||||
| Commercial Lines | Personal Lines | Property & Casualty Other Operations | Total Property & Casualty Insurance | |||||||||
| Auto liability | $ | 25 | $ | — | $ | — | $ | 25 | ||||
| Homeowners | — | 1 | — | 1 | ||||||||
| Professional liability | (17 | ) | — | — | (17 | ) | ||||||
| Package business | 1 | — | — | 1 | ||||||||
| General liability | (13 | ) | — | — | (13 | ) | ||||||
| Commercial property | (7 | ) | — | — | (7 | ) | ||||||
| Net environmental reserves | — | — | 3 | 3 | ||||||||
| Workers’ compensation discount accretion | 8 | — | — | 8 | ||||||||
| Catastrophes | (6 | ) | (12 | ) | — | (18 | ) | |||||
| Other reserve re-estimates, net | 7 | 7 | 1 | 15 | ||||||||
| Total prior accident year development | $ | (2 | ) | $ | (4 | ) | $ | 4 | $ | (2 | ) | |
| Three Months Ended March 31, 2016 | Asbestos | Environmental | All Other [1] | Total | |||||||||
| Beginning liability—net [2][3] | $ | 1,712 | $ | 247 | $ | 892 | $ | 2,851 | |||||
| Losses and loss adjustment expenses incurred | — | — | 1 | $ | 1 | ||||||||
| Less: Losses and loss adjustment expenses paid | 34 | 9 | 20 | $ | 63 | ||||||||
| Ending liability – net [2][3] | $ | 1,678 | [4] | $ | 238 | $ | 873 | $ | 2,789 | ||||
| Three Months Ended March 31, 2015 | Asbestos | Environmental | All Other | Total | |||||||||
| Beginning liability—net [1][2] | $ | 1,710 | $ | 241 | $ | 952 | $ | 2,903 | |||||
| Losses and loss adjustment expenses incurred | — | 3 | 1 | 4 | |||||||||
| Less : losses and loss adjustment expenses paid | 43 | 16 | 34 | 93 | |||||||||
| Ending liability – net [1][2] | $ | 1,667 | [3] | $ | 228 | $ | 919 | $ | 2,814 | ||||
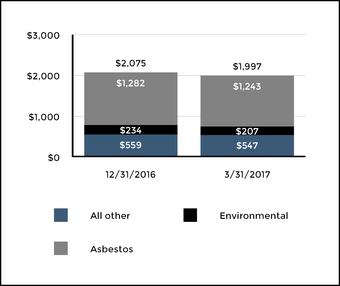
| Asbestos | Environmental | |||||
| March 31, 2017 | ||||||
| Property and Casualty Other Operations | $ | 1,243 | $ | 207 | ||
| Commercial Lines and Personal Lines | 77 | 57 | ||||
| Ending liability — net | $ | 1,320 | $ | 264 | ||
| December 31, 2016 | ||||||
| Property and Casualty Other Operations | $ | 1,282 | $ | 234 | ||
| Commercial Lines and Personal Lines | 81 | 58 | ||||
| Ending liability — net | $ | 1,363 | $ | 292 | ||
| Asbestos | Environmental | Total A&E | ||||||||
| Gross | ||||||||||
| Direct | $ | 1,513 | $ | 280 | $ | 1,793 | ||||
| Assumed Reinsurance | 162 | 7 | 169 | |||||||
| London Market | 293 | 47 | 340 | |||||||
| Total | 1,968 | 334 | 2,302 | |||||||
| Ceded | (443 | ) | (29 | ) | (472 | ) | ||||
| Net reserves transferred to liabilities held for sale | (205 | ) | (41 | ) | (246 | ) | ||||
| Net | $ | 1,320 | $ | 264 | $ | 1,584 | ||||
| Asbestos | Environmental | |||||
| 2017 | ||||||
| Beginning liability—net | $ | 1,363 | $ | 292 | ||
| Reclassification of allowance for uncollectible reinsurance [1] | 1 | — | ||||
| Losses and loss adjustment expenses paid | (44 | ) | (28 | ) | ||
| Ending liability – net | $ | 1,320 | $ | 264 | ||
| 2016 | ||||||
| Beginning liability—net | $ | 1,803 | $ | 318 | ||
| Losses and loss adjustment expenses paid | (37 | ) | (10 | ) | ||
| Ending liability – net | $ | 1,766 | $ | 308 | ||
| Asbestos | Environmental | |
| One year net survival ratio | 2.9 | 3.6 |
| Three year net survival ratio | 4.9 | 4.4 |
| One year net survival ratio - excluding PPG settlement | 7.6 | |
| Three year net survival ratio - excluding PPG settlement | 7.7 | |
| Asbestos [1] | Environmental [1] | Asbestos | Environmental | |||||||||||||||||||||
| Three Months Ended March 31, 2016 | Paid Losses & LAE | Incurred Losses & LAE | Paid Losses & LAE | Incurred Losses & LAE | ||||||||||||||||||||
| Paid Losses & LAE | Incurred Losses & LAE | Paid Losses & LAE | Incurred Losses & LAE | |||||||||||||||||||||
| Gross | ||||||||||||||||||||||||
| Direct | $ | 24 | $ | — | $ | 7 | $ | — | $ | 41 | $ | — | $ | 33 | $ | — | ||||||||
| Assumed Reinsurance | 11 | — | 1 | — | 15 | — | 1 | — | ||||||||||||||||
| London Market | 1 | — | 2 | — | 6 | — | 1 | — | ||||||||||||||||
| Total | 36 | — | 10 | — | 62 | — | 35 | — | ||||||||||||||||
| Ceded | (2 | ) | — | (1 | ) | — | (18 | ) | — | (7 | ) | — | ||||||||||||
| Net | $ | 34 | $ | — | $ | 9 | $ | — | $ | 44 | $ | — | $ | 28 | $ | — | ||||||||
Adverse Development Cover Effective December 31, 2016, the Company entered into an asbestos and environmental adverse development cover (“ADC”) reinsurance agreement with National Indemnity Company (“NICO”), a subsidiary of Berkshire Hathaway Inc., to reduce uncertainty about potential adverse development. Under the ADC, the Company paid a reinsurance premium of $650 for NICO to assume adverse net loss and allocated loss adjustment expense reserve development up to $1.5 billion above the Company’s existing net asbestos and environmental (“A&E”) reserves as of December 31, 2016 of approximately $1.7 billion. The $650 reinsurance premium was placed into a collateral trust account as security for NICO’s claim payment obligations to the Company. The Company has retained the risk of collection on amounts due from other third-party reinsurers and continues to be responsible for claims handling and other administrative services, subject to certain conditions. The ADC covers substantially all the Company’s A&E reserve development up to the reinsurance limit. The ADC excludes risk of adverse development on net asbestos and environmental reserves held by the Company’s U.K. Property and Casualty run-off subsidiaries which have been accounted for as liabilities held for sale in the consolidated balance sheets as of March 31, 2017 and December 31, 2016. The ADC has been accounted for as retroactive reinsurance and the Company reported the $650 cost as a loss on reinsurance transaction in 2016 in the consolidated statement of operations. Under retroactive reinsurance accounting, net adverse asbestos and environmental reserve development after December 31, 2016, if any, will result in an offsetting reinsurance recoverable up to the $1.5 billion limit. Cumulative ceded losses up to the $650 reinsurance premium paid would be recognized as a dollar-for-dollar offset to direct losses incurred. Cumulative ceded losses exceeding the $650 reinsurance premium paid would result in a deferred gain. The deferred gain would be recognized over the claim settlement period in the proportion of the amount of cumulative ceded losses collected from the reinsurer to the estimated ultimate reinsurance recoveries. Consequently, until periods when the deferred gain is recognized as a benefit to earnings, cumulative adverse development of asbestos and 74 |
| Talcott Resolution Significant EGP - based Balances | ||||||
| As of March 31, 2017 | As of December 31, 2016 | |||||
| DAC | $ | 1,042 | $ | 1,066 | ||
| SIA | $ | 53 | $ | 53 | ||
| Death and Other Insurance Benefit Reserves, net of reinsurance [1] | $ | 357 | $ | 354 | ||
| Talcott Resolution | ||||||
| As of March 31, 2016 | As of December 31, 2015 | |||||
| DAC | $ | 1,051 | $ | 1,180 | ||
| SIA | $ | 54 | $ | 56 | ||
| Death and Other Insurance Benefit Reserves, net of reinsurance [1] | $ | 334 | $ | 340 | ||
| [1] | For additional information on death and other insurance benefit reserves, see Note |
| Talcott Resolution | ||||||||||||
| Talcott Resolution Benefit (Charge) to Income, Net of Tax, as a Result of Unlock | Talcott Resolution Benefit (Charge) to Income, Net of Tax, as a Result of Unlock | |||||||||||
| Three Months Ended March 31, | Three Months Ended March 31, | |||||||||||
| 2016 | 2015 | 2017 | 2016 | |||||||||
| DAC | $ | 1 | $ | 10 | $ | 12 | $ | 1 | ||||
| SIA | 1 | 1 | 1 | 1 | ||||||||
| Death and Other Insurance Benefit Reserves | 11 | 18 | 5 | 11 | ||||||||
| Total (before tax) | $ | 13 | $ | 29 | $ | 18 | $ | 13 | ||||
| Income tax effect | 4 | 10 | 6 | 4 | ||||||||
| Total (after-tax) | $ | 9 | $ | 19 | $ | 12 | $ | 9 | ||||
| Three Months Ended March 31, | ||||||
| 2016 | 2015 | |||||
| Net income | $ | 323 | $ | 467 | ||
| Less: Unlock benefit, after-tax | 9 | 19 | ||||
| Less: Net realized capital gains (losses), after-tax and DAC, excluded from core earnings | (96 | ) | 2 | |||
| Less: Restructuring and other costs, after-tax | — | (6 | ) | |||
| Less: Income tax benefit from reduction in valuation allowance | 25 | — | ||||
| Core earnings | $ | 385 | $ | 452 | ||
| COMMERCIAL LINES |
| Three Months Ended March 31, | Three Months Ended March 31, | |||||||||||||||
| Underwriting Summary | 2016 | 2015 | Change | |||||||||||||
| 2017 | 2016 | Change | ||||||||||||||
| Written premiums | $ | 1,726 | $ | 1,722 | — | % | $ | 1,821 | $ | 1,726 | 6 | % | ||||
| Change in unearned premium reserve | 103 | 139 | (26 | %) | 133 | 103 | 29 | % | ||||||||
| Earned premiums | 1,623 | 1,583 | 3 | % | 1,688 | 1,623 | 4 | % | ||||||||
| Fee income | 10 | 10 | — | % | ||||||||||||
| Losses and loss adjustment expenses | ||||||||||||||||
| Current accident year before catastrophes | 913 | 928 | (2 | %) | 968 | 913 | 6 | % | ||||||||
| Current accident year catastrophes | 44 | 58 | (24 | %) | 71 | 44 | 61 | % | ||||||||
| Prior accident year development | (20 | ) | (2 | ) | NM | 15 | (20 | ) | 175 | % | ||||||
| Total losses and loss adjustment expenses | 937 | 984 | (5 | %) | 1,054 | 937 | 12 | % | ||||||||
| Amortization of DAC | 242 | 234 | 3 | % | ||||||||||||
| Amortization of deferred policy acquisition costs | 249 | 242 | 3 | % | ||||||||||||
| Underwriting expenses | 295 | 295 | — | % | 323 | 305 | 6 | % | ||||||||
| Dividends to policyholders | 4 | 5 | (20 | %) | 4 | 4 | — | % | ||||||||
| Underwriting gain | 145 | 65 | 123 | % | 68 | 145 | (53 | %) | ||||||||
| Net servicing income [1] | 4 | 4 | — | % | ||||||||||||
| Net investment income | 209 | 257 | (19 | %) | ||||||||||||
| Net realized capital gains (losses) | (33 | ) | 8 | NM | ||||||||||||
| Other income (expense) | 1 | 1 | — | % | ||||||||||||
| Net investment income [1] | 243 | 209 | 16 | % | ||||||||||||
| Net realized capital gains (losses) [1] | 11 | (33 | ) | 133 | % | |||||||||||
| Other income | 1 | 1 | — | % | ||||||||||||
| Income before income taxes | 326 | 335 | (3 | %) | 323 | 322 | — | % | ||||||||
| Income tax expense | 98 | 95 | 3 | % | ||||||||||||
| Income tax expense [2] | 92 | 97 | (5 | %) | ||||||||||||
| Net income | $ | 228 | $ | 240 | (5 | %) | $ | 231 | $ | 225 | 3 | % | ||||
| [1] |
| [2] | For discussion of income taxes, see Note 11 - Income Taxes of Notes to Condensed Consolidated Financial Statements. |
| Three Months Ended March 31, | Three Months Ended March 31, | |||||||||||
| Premium Measures [1] | 2016 | 2015 | ||||||||||
| 2017 | 2016 | |||||||||||
| New business premium | $ | 275 | $ | 290 | $ | 313 | $ | 275 | ||||
| Standard commercial lines policy count retention | 84 | % | 84 | % | 85 | % | 84 | % | ||||
| Standard commercial lines renewal written pricing increases | 2 | % | 3 | % | ||||||||
| Standard commercial lines renewal earned pricing increases | 2 | % | 5 | % | ||||||||
| Standard commercial lines renewal written price increase | 3.3 | % | 2.2 | % | ||||||||
| Standard commercial lines renewal earned price increase | 2.4 | % | 2.5 | % | ||||||||
| Standard commercial lines policies in-force as of end of period (in thousands) | 1,314 | 1,283 | 1,347 | 1,314 | ||||||||
| [1] | Standard commercial lines consists of small commercial and middle market. Standard commercial premium measures exclude middle market |
| Three Months Ended March 31, | ||||||
| Underwriting Ratios | 2016 | 2015 | Change | |||
| Loss and loss adjustment expense ratio | ||||||
| Current accident year before catastrophes | 56.3 | 58.6 | 2.3 | |||
| Current accident year catastrophes | 2.7 | 3.7 | 1.0 | |||
| Prior accident year development | (1.2 | ) | (0.1 | ) | 1.1 | |
| Total loss and loss adjustment expense ratio | 57.7 | 62.2 | 4.5 | |||
| Expense ratio | 33.1 | 33.4 | 0.3 | |||
| Policyholder dividend ratio | 0.2 | 0.3 | 0.1 | |||
| Combined ratio | 91.1 | 95.9 | 4.8 | |||
| Current accident year catastrophes and prior year development | 1.5 | 3.6 | 2.1 | |||
| Combined ratio before catastrophes and prior year development | 89.6 | 92.4 | 2.8 | |||
| Three Months Ended March 31, | ||||||
| 2017 | 2016 | Change | ||||
| Loss and loss adjustment expense ratio | ||||||
| Current accident year before catastrophes | 57.3 | 56.3 | 1.0 | |||
| Current accident year catastrophes | 4.2 | 2.7 | 1.5 | |||
| Prior accident year development | 0.9 | (1.2 | ) | 2.1 | ||
| Total loss and loss adjustment expense ratio | 62.4 | 57.7 | 4.7 | |||
| Expense ratio | 33.3 | 33.1 | 0.2 | |||
| Policyholder dividend ratio | 0.2 | 0.2 | — | |||
| Combined ratio | 96.0 | 91.1 | 4.9 | |||
| Current accident year catastrophes and prior year development | 5.1 | 1.5 | 3.6 | |||
| Underlying combined ratio | 90.9 | 89.6 | 1.3 | |||
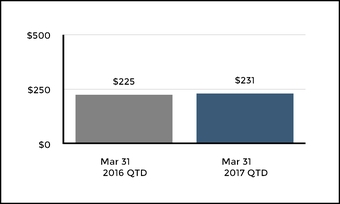
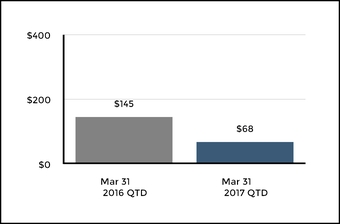
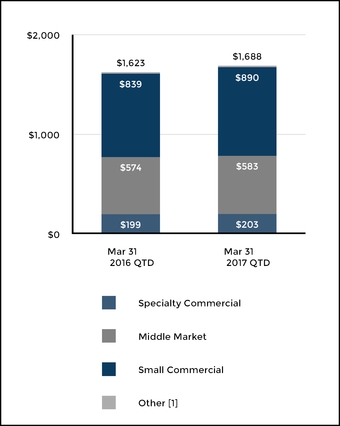
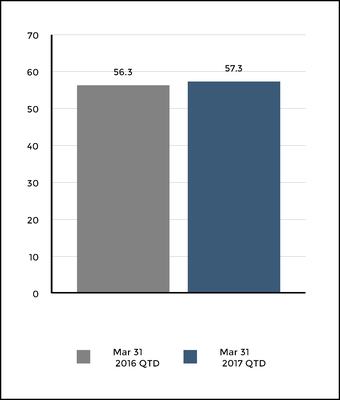
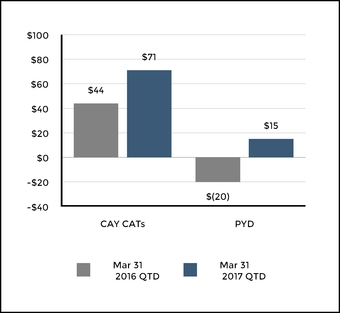
| PERSONAL LINES |
| Three Months Ended March 31, | Three Months Ended March 31, | |||||||||||||||
| Underwriting Summary | 2016 | 2015 | Change | 2017 | 2016 | Change | ||||||||||
| Written premiums | $ | 953 | $ | 939 | 1 | % | $ | 889 | $ | 953 | (7 | %) | ||||
| Change in unearned premium reserve | (22 | ) | (13 | ) | (69 | %) | (45 | ) | (22 | ) | (105 | %) | ||||
| Earned premiums | 975 | 952 | 2 | % | 934 | 975 | (4 | %) | ||||||||
| Fee income | 11 | 9 | 22 | % | ||||||||||||
| Losses and loss adjustment expenses | ||||||||||||||||
| Current accident year before catastrophes | 632 | 618 | 2 | % | 644 | 632 | 2 | % | ||||||||
| Current accident year catastrophes | 47 | 25 | 88 | % | 79 | 47 | 68 | % | ||||||||
| Prior accident year development | 52 | (4 | ) | NM | (4 | ) | 52 | (108 | %) | |||||||
| Total losses and loss adjustment expenses | 731 | 639 | 14 | % | 719 | 731 | (2 | %) | ||||||||
| Amortization of DAC | 89 | 90 | (1 | %) | 81 | 89 | (9 | %) | ||||||||
| Underwriting expenses | 154 | 148 | 4 | % | 138 | 163 | (15 | %) | ||||||||
| Underwriting gain | 1 | 75 | (99 | %) | 7 | 1 | NM | |||||||||
| Net servicing income | — | 1 | (100 | %) | ||||||||||||
| Net investment income | 31 | 35 | (11 | %) | ||||||||||||
| Net realized capital gains (losses) | (5 | ) | 1 | NM | ||||||||||||
| Other expenses | — | (1 | ) | 100 | % | |||||||||||
| Net servicing income [1] | 3 | 4 | (25 | %) | ||||||||||||
| Net investment income [2] | 36 | 31 | 16 | % | ||||||||||||
| Net realized capital gains [2] | 2 | (5 | ) | 140 | % | |||||||||||
| Other expense | (1 | ) | — | NM | ||||||||||||
| Income before income taxes | 27 | 111 | (76 | )% | 47 | 31 | 52 | % | ||||||||
| Income tax expense | 7 | 35 | (80 | %) | ||||||||||||
| Income tax expense [3] | 14 | 8 | 75 | % | ||||||||||||
| Net income | $ | 20 | $ | 76 | (74 | )% | $ | 33 | $ | 23 | 43 | % | ||||
| [1] | Includes servicing revenues of $19 and $20 for the three months endedMarch 31, 2017 and 2016, respectively. |
| [2] | For discussion of consolidated investment results, see MD&A - Investment Results, Net Investment Income (Loss) and Net Realized Capital Gains (Losses). |
| [3] | For discussion of income taxes, see Note 11 - Income Taxes of Notes to Condensed Consolidated Financial Statements. |
| Three Months Ended March 31, | Three Months Ended March 31, | |||||||||||||||
| Written Premiums | 2016 | 2015 | Change | 2017 | 2016 | Change | ||||||||||
| Product Line | ||||||||||||||||
| Automobile | $ | 690 | $ | 671 | 3 | % | $ | 645 | $ | 690 | (7 | %) | ||||
| Homeowners | 263 | 268 | (2 | %) | 244 | 263 | (7 | %) | ||||||||
| Total | $ | 953 | $ | 939 | 1 | % | $ | 889 | $ | 953 | (7 | %) | ||||
| Earned Premiums | ||||||||||||||||
| Product Line | ||||||||||||||||
| Automobile | $ | 678 | $ | 655 | 4 | % | $ | 654 | $ | 678 | (4 | %) | ||||
| Homeowners | 297 | 297 | — | % | 280 | 297 | (6 | %) | ||||||||
| Total | $ | 975 | $ | 952 | 2 | % | $ | 934 | $ | 975 | (4 | %) | ||||
| Three Months Ended March 31, | Three Months Ended March 31, | |||||||||||
| Premium Measures | 2016 | 2015 | 2017 | 2016 | ||||||||
| Policies in-force end of period (in thousands) | ||||||||||||
| Automobile | 2,073 | 2,053 | 1,905 | 2,073 | ||||||||
| Homeowners | 1,262 | 1,305 | 1,144 | 1,262 | ||||||||
| New business written premium | ||||||||||||
| Automobile | $ | 110 | $ | 101 | $ | 42 | $ | 110 | ||||
| Homeowners | $ | 23 | $ | 27 | $ | 12 | $ | 23 | ||||
| Policy count retention | ||||||||||||
| Automobile | 84 | % | 84 | % | 82 | % | 84 | % | ||||
| Homeowners | 84 | % | 85 | % | 82 | % | 84 | % | ||||
| Renewal written pricing increase | ||||||||||||
| Renewal written price increase | ||||||||||||
| Automobile | 7 | % | 6 | % | 10.5 | % | 6.1 | % | ||||
| Homeowners | 9 | % | 8 | % | 8.9 | % | 8.1 | % | ||||
| Renewal earned pricing increase | ||||||||||||
| Renewal earned price increase | ||||||||||||
| Automobile | 6 | % | 6 | % | 8.2 | % | 5.7 | % | ||||
| Homeowners | 8 | % | 8 | % | 8.2 | % | 7.2 | % | ||||
| Three Months Ended March 31, | Three Months Ended March 31, | |||||||||||
| Underwriting Ratios | 2016 | 2015 | Change | 2017 | 2016 | Change | ||||||
| Loss and loss adjustment expense ratio | ||||||||||||
| Current accident year before catastrophes | 64.8 | 64.9 | 0.1 | 69.0 | 64.8 | 4.2 | ||||||
| Current accident year catastrophes | 4.8 | 2.6 | (2.2 | ) | 8.5 | 4.8 | 3.7 | |||||
| Prior year development | 5.3 | (0.4 | ) | (5.7 | ) | (0.4 | ) | 5.3 | (5.7 | ) | ||
| Total loss and loss adjustment expense ratio | 75.0 | 67.1 | (7.9 | ) | 77.0 | 75.0 | 2.0 | |||||
| Expense ratio | 24.9 | 25.0 | 0.1 | 22.3 | 24.9 | (2.6 | ) | |||||
| Combined ratio | 99.9 | 92.1 | (7.8 | ) | 99.3 | 99.9 | (0.6 | ) | ||||
| Current accident year catastrophes and prior year development | 10.1 | 2.2 | (7.9 | ) | 8.1 | 10.1 | (2.0 | ) | ||||
| Combined ratio before catastrophes and prior year development | 89.7 | 89.9 | 0.2 | |||||||||
| Underlying combined ratio | 91.2 | 89.7 | 1.5 | |||||||||
| Three Months Ended March 31, | Three Months Ended March 31, | |||||||||||
| Product Combined Ratios | 2016 | 2015 | Change | |||||||||
| 2017 | 2016 | Change | ||||||||||
| Automobile | ||||||||||||
| Combined ratio | 106.6 | 95.4 | (11.2 | ) | 97.5 | 106.6 | (9.1 | ) | ||||
| Combined ratio before catastrophes and prior year development | 96.2 | 94.6 | (1.6 | ) | ||||||||
| Underlying combined ratio | 96.6 | 96.2 | 0.4 | |||||||||
| Homeowners | ||||||||||||
| Combined ratio | 84.7 | 85.1 | 0.4 | 103.4 | 84.7 | 18.7 | ||||||
| Combined ratio before catastrophes and prior year development | 75.1 | 79.7 | 4.6 | |||||||||
| Underlying combined ratio | 78.9 | 75.1 | 3.8 | |||||||||
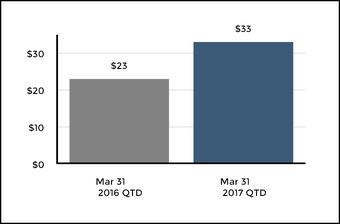
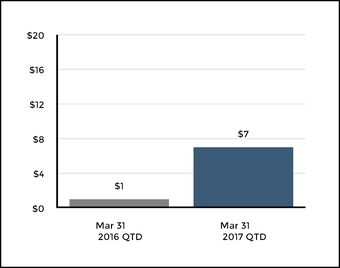
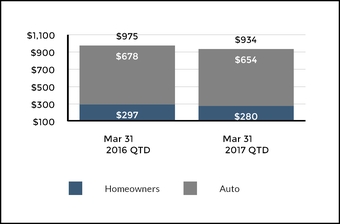
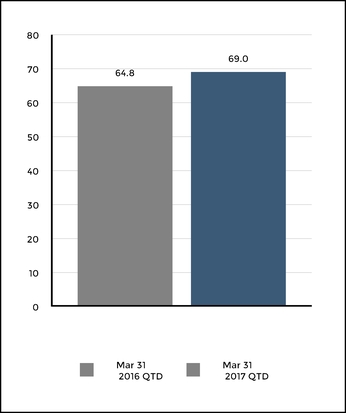
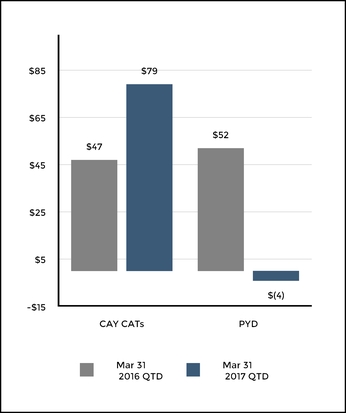
| PROPERTY & CASUALTY OTHER OPERATIONS |
| Three Months Ended March 31, | ||||||||
| Underwriting Summary | 2017 | 2016 | Change | |||||
| Losses and loss adjustment expenses | ||||||||
| Prior accident year development | $ | 1 | $ | 1 | — | % | ||
| Total losses and loss adjustment expenses | 1 | 1 | — | % | ||||
| Underwriting expenses | 5 | 7 | (29 | %) | ||||
| Underwriting loss | (6 | ) | (8 | ) | 25 | % | ||
| Net investment income [1] | 31 | 32 | (3 | %) | ||||
| Net realized capital gains (losses) [1] | 4 | (3 | ) | NM | ||||
| Other income | 2 | 2 | — | % | ||||
| Income before income taxes | 31 | 23 | 35 | % | ||||
| Income tax expense [2] | 7 | 6 | 17 | % | ||||
| Net income | $ | 24 | $ | 17 | 41 | % | ||
| [1] | For discussion of consolidated investment results, see MD&A - Investment Results, Net Investment Income (Loss) and Net Realized Capital Gains (Losses). |
| Three Months Ended March 31, | ||||||||
| Underwriting Summary | 2016 | 2015 | Change | |||||
| Losses and loss adjustment expenses | ||||||||
| Prior accident year development | $ | 1 | $ | 4 | (75 | %) | ||
| Total losses and loss adjustment expenses | 1 | 4 | (75 | %) | ||||
| Underwriting expenses | 7 | 6 | 17 | % | ||||
| Underwriting loss | (8 | ) | (10 | ) | 20 | % | ||
| Net investment income | 32 | 35 | (9 | %) | ||||
| Net realized capital gains (losses) | (3 | ) | 4 | (175 | %) | |||
| Other income | 2 | 1 | 100 | % | ||||
| Income before income taxes | 23 | 30 | (23 | %) | ||||
| Income tax expense | 6 | 7 | (14 | %) | ||||
| Net income | $ | 17 | $ | 23 | (26 | %) | ||
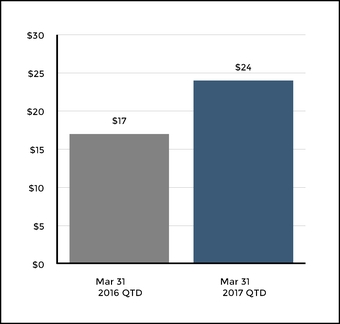
| Three Months Ended March 31, | ||||||||
| Operating Summary | 2016 | 2015 | Change | |||||
| Premiums and other considerations | $ | 795 | $ | 780 | 2 | % | ||
| Net investment income | 88 | 97 | (9 | )% | ||||
| Net realized capital gains (losses) | 2 | (1 | ) | NM | ||||
| Total revenues | 885 | 876 | 1 | % | ||||
| Benefits, losses and loss adjustment expenses | 618 | 598 | 3 | % | ||||
| Amortization of deferred policy acquisition costs | 8 | 8 | — | % | ||||
| Insurance operating costs and other expenses | 194 | 200 | (3 | )% | ||||
| Total benefits, losses and expenses | 820 | 806 | 2 | % | ||||
| Income before income taxes | 65 | 70 | (7 | )% | ||||
| Income tax expense | 15 | 18 | (17 | )% | ||||
| Net income | $ | 50 | $ | 52 | (4 | )% | ||
| GROUP BENEFITS |
| Three Months Ended March 31, | ||||||||
| Premiums and other considerations | 2016 | 2015 | Change | |||||
| Fully insured – ongoing premiums | $ | 772 | $ | 763 | 1 | % | ||
| Buyout premiums | 6 | — | NM | |||||
| Other | 17 | 17 | — | % | ||||
| Total premiums and other considerations | $ | 795 | $ | 780 | 2 | % | ||
| Fully insured ongoing sales, excluding buyouts | $ | 266 | $ | 300 | (11 | )% | ||
| Three Months Ended March 31, | |||||
| Ratios, excluding buyouts | 2016 | 2015 | Change | ||
| Group disability loss ratio | 82.4 | % | 81.8 | % | (0.6) |
| Group life loss ratio | 73.8 | % | 73.2 | % | (0.6) |
| Total loss ratio | 77.6 | % | 76.7 | % | (0.9) |
| Expense ratio | 25.6 | % | 26.7 | % | 1.1 |
| Operating Summary | ||||||||
| Three Months Ended March 31, | ||||||||
| 2017 | 2016 | Change | ||||||
| Premiums and other considerations | $ | 835 | $ | 795 | 5 | % | ||
| Net investment income | 95 | 88 | 8 | % | ||||
| Net realized capital gains (losses) [1] | 8 | 2 | NM | |||||
| Total revenues | 938 | 885 | 6 | % | ||||
| Benefits, losses and loss adjustment expenses | 651 | 618 | 5 | % | ||||
| Amortization of deferred policy acquisition costs | 8 | 8 | — | % | ||||
| Insurance operating costs and other expenses | 220 | 194 | 13 | % | ||||
| Total benefits, losses and expenses | 879 | 820 | 7 | % | ||||
| Income before income taxes | 59 | 65 | (9 | )% | ||||
| Income tax expense [2] | 14 | 15 | (7 | )% | ||||
| Net income | $ | 45 | $ | 50 | (10 | )% | ||
| [1] | For discussion of consolidated investment results, see MD&A - Investment Results, Net Investment Income (Loss) and Net Realized Capital Gains (Losses). |
| [2] | For discussion of income taxes, see Note 11 - Income Taxes of Notes to the Consolidated Financial Statements. |
| Premiums and Other Considerations | ||||||||
| Three Months Ended March 31, | ||||||||
| 2017 | 2016 | Change | ||||||
| Fully insured – ongoing premiums | $ | 805 | $ | 772 | 4 | % | ||
| Buyout premiums | 11 | 6 | 83 | % | ||||
| Fee income | 19 | 17 | 12 | % | ||||
| Total premiums and other considerations | $ | 835 | $ | 795 | 5 | % | ||
| Fully insured ongoing sales, excluding buyouts | $ | 211 | $ | 266 | (21 | )% | ||
| Three Months Ended March 31, | ||||||
| Margin | 2016 | 2015 | Change | |||
| Net income margin | 5.7 | % | 5.9 | % | (0.2 | ) |
| Effect of net capital realized gains (losses), net of tax on after-tax margin | 0.2 | % | — | % | 0.2 | |
| Core earnings margin | 5.5 | % | 5.9 | % | (0.4 | ) |
| Ratios, Excluding Buyouts | |||||
| Three Months Ended March 31, | |||||
| 2017 | 2016 | Change | |||
| Group disability loss ratio | 82.9 | % | 82.4 | % | (0.5) |
| Group life loss ratio | 73.1 | % | 73.8 | % | 0.7 |
| Total loss ratio | 77.7 | % | 77.6 | % | (0.1) |
| Expense ratio | 27.7 | % | 25.6 | % | (2.1) |
| Margin | ||||||
| Three Months Ended March 31, | ||||||
| 2017 | 2016 | Change | ||||
| Net income margin | 4.9 | % | 5.7 | % | (0.8 | ) |
| Effect of net capital realized gains (losses), net of tax on after-tax margin | 0.6 | % | 0.2 | % | 0.4 | |
| Core earnings margin | 4.3 | % | 5.5 | % | (1.2 | ) |
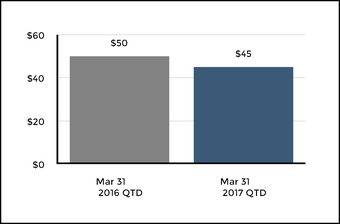
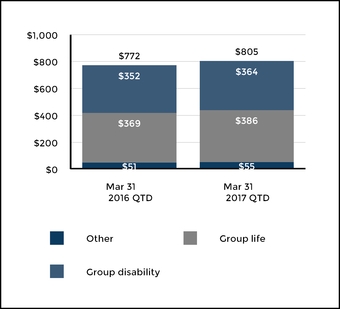
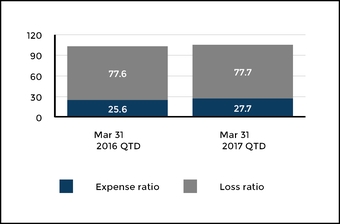
| MUTUAL FUNDS |
| Three Months Ended March 31, | ||||||||
| Operating Summary | 2016 | 2015 | Change | |||||
| Fee income and other | $ | 167 | $ | 179 | (7 | )% | ||
| Total revenues | 167 | 179 | (7 | )% | ||||
| Amortization of DAC | 5 | 5 | — | % | ||||
| Insurance operating costs and other expenses | 131 | 140 | (6 | )% | ||||
| Total benefits, losses and expenses | 136 | 145 | (6 | )% | ||||
| Income before income taxes | 31 | 34 | (9 | )% | ||||
| Income tax expense | 11 | 12 | (8 | )% | ||||
| Net income | $ | 20 | $ | 22 | (9 | )% | ||
| Average Total Mutual Funds segment AUM | $ | 91,188 | $ | 94,778 | (4 | )% | ||
| Return on Assets | ||||||||
| Net income | 8.8 | 9.3 | (5 | )% | ||||
| Core earnings | 8.8 | 9.3 | (5 | )% | ||||
| Mutual Funds segment AUM | ||||||||
| Mutual Fund AUM - beginning of period | $ | 74,413 | $ | 73,035 | 2 | % | ||
| Sales | 4,699 | 4,710 | — | % | ||||
| Redemptions | (4,885 | ) | (4,181 | ) | (17 | )% | ||
| Net Flows | (186 | ) | 529 | (135 | )% | |||
| Change in market value and other | (608 | ) | 2,132 | (129 | )% | |||
| Mutual Fund AUM - end of period | $ | 73,619 | $ | 75,696 | (3 | )% | ||
| Talcott AUM [1] | $ | 16,795 | $ | 20,240 | (17 | )% | ||
| Total Mutual Funds segment AUM | $ | 90,414 | $ | 95,936 | (6 | )% | ||
| Mutual Fund AUM by Asset Class | ||||||||
| Equity | $ | 46,455 | $ | 47,131 | (1 | )% | ||
| Fixed Income | 12,389 | 14,267 | (13 | )% | ||||
| Multi-Strategy Investments [2] | 14,775 | 14,298 | 3 | % | ||||
| Mutual Fund AUM | $ | 73,619 | $ | 75,696 | (3 | )% | ||
| Three Months Ended March 31, | ||||||||
| 2017 | 2016 | Change | ||||||
| Fee income and other revenue | $ | 191 | $ | 167 | 14 | % | ||
| Net investment income | 1 | — | NM | |||||
| Total revenues | 192 | 167 | 15 | % | ||||
| Amortization of DAC | 6 | 5 | 20 | % | ||||
| Operating costs and other expenses | 151 | 131 | 15 | % | ||||
| Total benefits, losses and expenses | 157 | 136 | 15 | % | ||||
| Income before income taxes | 35 | 31 | 13 | % | ||||
| Income tax expense | 12 | 11 | 9 | % | ||||
| Net income | $ | 23 | $ | 20 | 15 | % | ||
| Daily Average Total Mutual Funds segment AUM | $ | 101,114 | $ | 87,192 | 16 | % | ||
| Return on Assets ("ROA") [1] | ||||||||
| Net income | 9.2 | 9.3 | (1 | )% | ||||
| Core Earnings | 9.2 | 9.3 | (1 | )% | ||||