UNITED STATES
SECURITIES AND EXCHANGE COMMISSION
Washington, D.C. 20549
Form 10-Q
|
| |
| x | QUARTERLY REPORT PURSUANT TO SECTION 13 OR 15(d) OF THE SECURITIES EXCHANGE ACT OF 1934 |
For the quarterly period ended June 30, 20162017
OR
|
| |
| o | TRANSITION REPORT PURSUANT TO SECTION 13 OR 15(d) OF THE SECURITIES EXCHANGE ACT OF 1934 |
Commission File Number 0-19311
BIOGEN INC.
(Exact name of registrant as specified in its charter)
|
| | |
| Delaware | | 33-0112644 |
(State or other jurisdiction of incorporation or organization) | | (I.R.S. Employer Identification No.) |
225 Binney Street, Cambridge, MA 02142
(617) 679-2000
(Address, including zip code, and telephone number, including
area code, of registrant’s principal executive offices)
Indicate by check mark whether the registrant (1) has filed all reports required to be filed by Section 13 or 15(d) of the Securities Exchange Act of 1934 during the preceding 12 months (or for such shorter period that the registrant was required to file such reports), and (2) has been subject to such filing requirements for the past 90 days: Yes x No o
Indicate by check mark whether the registrant has submitted electronically and posted on its corporate Web site, if any, every Interactive Data File required to be submitted and posted pursuant to Rule 405 of Regulation S-T during the preceding 12 months (or for such shorter period that the registrant was required to submit and post such files): Yes x No o
Indicate by check mark whether the registrant is a large accelerated filer, an accelerated filer, a non-accelerated filer, or a smaller reporting company, or an emerging growth company. See the definitions of “large accelerated filer,” “accelerated filer” andfiler,” “smaller reporting company” and "emerging growth company" in Rule 12b-2 of the Exchange Act (Check One):
|
| | |
Large accelerated filer x | | Accelerated filer o |
Non-accelerated filer o | | Smaller reporting company o |
| (Do not check if a smaller reporting company) | | Emerging growth companyo |
If an emerging growth company, indicate by check mark if the registrant has elected not to use the extended transition period for complying with any new or revised financial accounting standards provided pursuant to Section 13(a) of the Exchange Act. o
Indicate by check mark whether the registrant is a shell company (as defined in Rule 12b-2 of the Exchange Act): Yes o No x
The number of shares of the issuer’s Common Stock, $0.0005 par value, outstanding as of July 15, 2016,21, 2017 was 219,120,762211,431,746 shares.
BIOGEN INC.
FORM 10-Q — Quarterly Report
For the Quarterly Period Ended June 30, 20162017
TABLE OF CONTENTS
|
| | |
| | | Page |
|
| | | |
| Item 1. | Financial Statements (unaudited) | |
| | | |
| | | |
| | | |
| | | |
| | | |
| | | |
| | | |
| | | |
| | | |
| | | |
| Certain totals may not sum due to rounding. | |
| | | |
| Item 2. | | |
| | | |
| Item 3. | | |
| | | |
| Item 4. | | |
| |
|
| | | |
| Item 1. | | |
| | | |
| Item 1A. | | |
| | | |
| Item 2. | | |
| | | |
| Item 6. | | |
| | |
| |
NOTE REGARDING FORWARD-LOOKING STATEMENTS
This report contains forward-looking statements that are being made pursuant to the provisions of the Private Securities Litigation Reform Act of 1995 (the Act) with the intention of obtaining the benefits of the “Safe Harbor” provisions of the Act. These forward-looking statements may be accompanied by such words as “anticipate,” “believe,” “could,” “estimate,” “expect,” “forecast,” “intend,” “may,” “plan,” “potential,” “project,” “target,“possible,” “will” and other words and terms of similar meaning. Reference is made in particular to forward-looking statements regarding:
the anticipated amount, timing and accounting of revenues, contingent payments, milestone, royalty and other payments under licensing, collaboration or acquisition agreements, tax positions and contingencies, collectability of receivables, pre-approval inventory, cost of sales, research and development costs, compensation and other selling, general and administrative expenses, amortization of intangible assets, foreign currency exchange risk, estimated fair value of assets and liabilities and impairment assessments;
expectations, plans and prospects relating to sales, pricing, growth and launch of our marketed and pipeline products;
the potential impact of increased product competition in the markets in which we compete;
the proposed spin offpatent terms, patent term extensions, patent office actions and expected availability and period of our hemophilia business, including the completion and timing of the spin off and its anticipated benefits, costs and tax treatment;regulatory exclusivity;
the costs and timing of potential clinical trials, filing and approvals, and the potential therapeutic scope of the development and commercialization of our and our collaborators’ pipeline products;
the drivers for growing our business, including our plans and intent to commit resources relating to business development opportunities and research and development programs;
our manufacturing capacity, use of third-party contract manufacturing organizations and plans and timing relating to the expansion of our manufacturing capabilities, including anticipated investments and activities in new manufacturing facilities;
the expected financialpotential impact on our results of ceasing manufacturing activitiesoperations and fully or partially vacating our biologics manufacturing facility in Cambridge, MA and warehouse space in Somerville, MA;liquidity of the United Kingdom's (U.K.'s) intent to voluntarily depart from the European Union (E.U.);
the impact of the continued uncertainty of the credit and economic conditions in certain countries in Europe and our collection of accounts receivable in such countries;
the potential impact on our results of operations and liquidity of the United Kingdom's (U.K.'s) intent to voluntarily depart from the European Union (E.U.);
the potential impact of healthcare reform in the United States (U.S.) and measures being taken worldwide designed to reduce healthcare costs to constrainlimit the overall level of government expenditures, including the impact of pricing actions and reduced reimbursement for our products;
the timing, outcome and impact of administrative, regulatory, legal and other proceedings related to our patents and other proprietary and intellectual property rights, tax audits, assessments and settlements, pricing matters, sales and promotional practices, product liability and other matters;
the anticipated benefits, costs and tax treatment of the spin-off of our hemophilia business;
lease commitments, purchase obligations and the timing and satisfaction of other contractual obligations;
potential costs and expenses incurred to execute business transformation and optimization initiatives;
our ability to finance our operations and business initiatives and obtain funding for such activities; and
the impact of new laws and accounting standards.
These forward-looking statements involve risks and uncertainties, including those that are described in the “Risk Factors” section of this report and elsewhere in this report that could cause actual results to differ materially from those reflected in such statements. You should not place undue reliance on these statements. Forward-looking statements speak only as of the date of this report. Except as required by law, we do not undertake any obligation to publicly update any forward-looking statements, whether as a result of new information, future developments or otherwise.
NOTE REGARDING COMPANY AND PRODUCT REFERENCES
ThroughoutReferences in this report “Biogen,to:
“Biogen,” the “Company,“company,” “we,” “us” and “our” refer to Biogen Inc. and its consolidated subsidiaries. References to “RITUXAN” refersubsidiaries;
“RITUXAN” refers to both RITUXAN (the trade name for rituximab in the U.S., Canada and Japan) and MabThera (the trade name for rituximab outside the U.S., Canada and Japan). References to "ELOCTATE" refer;
"ELOCTATE" refers to both ELOCTATE (the trade name for Antihemophilic Factor (Recombinant), Fc Fusion Protein in the U.S., Canada and Japan) and ELOCTA (the trade name for Antihemophilic Factor (Recombinant), Fc Fusion Protein in the E.U.).
NOTE REGARDING TRADEMARKS
ALPROLIX®AVONEX®, PLEGRIDY®, RITUXAN®, SPINRAZA®, TECFIDERA®, TYSABRI® and ZINBRYTA® AVONEX®, BENEPALI®, ELOCTATE®, FLIXABI®, PLEGRIDY®, RITUXAN®, TECFIDERA® and TYSABRI®are registered trademarks of Biogen. FUMADERMBENEPALITM, CIRARATM, FLIXABITM, FUMADERMTM and ZINBRYTAIMRALDITM are trademarks of Biogen. ENBRELALPROLIX®,®ELOCTATE®, ENBREL®, FAMPYRATM, GAZYVAGAZYVA®, HUMIRA®, OCREVUS®TM, HUMIRA®, REMICADE®REMICADE® and other trademarks referenced in this report are the property of their respective owners.
PART I FINANCIAL INFORMATION
BIOGEN INC. AND SUBSIDIARIES
CONDENSED CONSOLIDATED STATEMENTS OF INCOME
(unaudited, in millions, except per share amounts)
| | | | For the Three Months
Ended June 30, | | For the Six Months
Ended June 30, | For the Three Months
Ended June 30, | | For the Six Months
Ended June 30, |
| | 2016 | | 2015 | | 2016 | | 2015 | 2017 | | 2016 | | 2017 | | 2016 |
| Revenues: | | | | | | | | | | | | | | |
| Product, net | $ | 2,466.0 |
| | $ | 2,198.6 |
| | $ | 4,775.4 |
| | $ | 4,370.9 |
| $ | 2,639.7 |
| | $ | 2,466.0 |
| | $ | 5,019.8 |
| | $ | 4,775.4 |
|
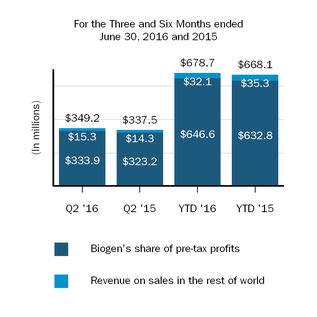
| Revenues from anti-CD20 therapeutic programs | 349.2 |
| | 337.5 |
| | 678.7 |
| | 668.1 |
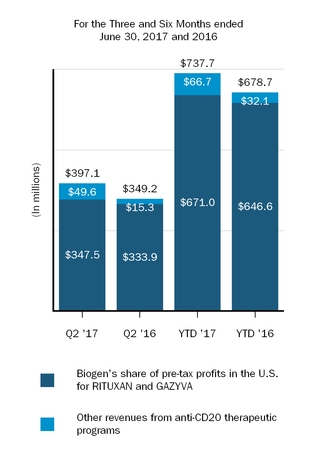
| 397.1 |
| | 349.2 |
| | 737.7 |
| | 678.7 |
|
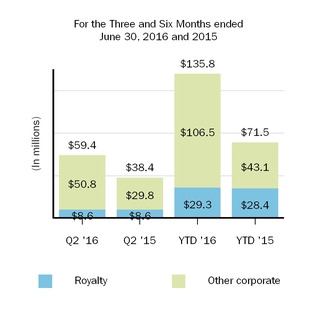
| Other | 79.0 |
| | 55.6 |
| | 166.9 |
| | 107.6 |
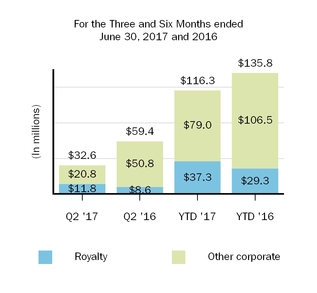
| 41.6 |
| | 79.0 |
| | 131.6 |
| | 166.9 |
|
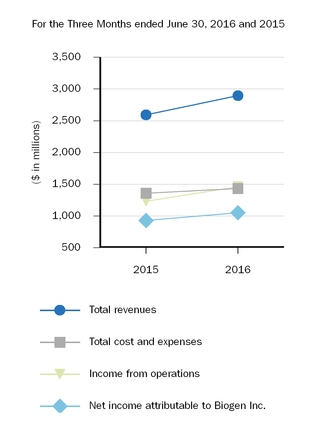
| Total revenues | 2,894.2 |
| | 2,591.6 |
| | 5,621.0 |
| | 5,146.6 |
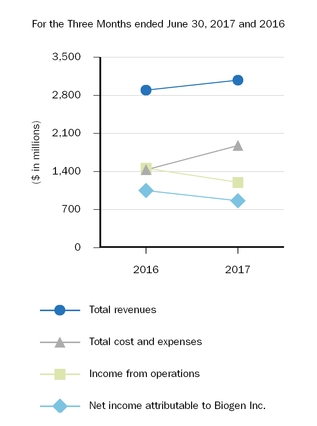
| 3,078.4 |
| | 2,894.2 |
| | 5,889.1 |
| | 5,621.0 |
|
| Cost and expenses: | | | | | | | | | | | | | | |
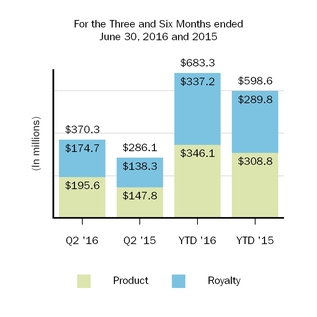
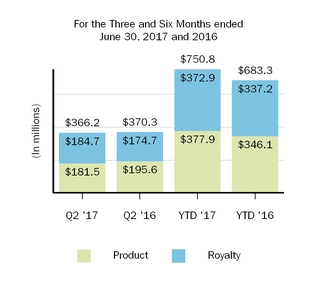
| Cost of sales, excluding amortization of acquired intangible assets | 370.3 |
| | 286.1 |
| | 683.3 |
| | 598.6 |
| 366.2 |
| | 370.3 |
| | 750.8 |
| | 683.3 |
|
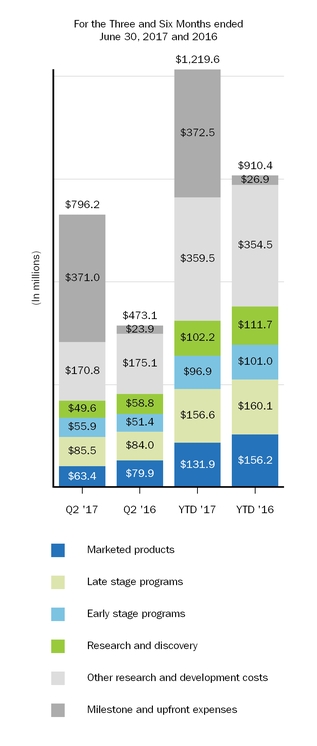
| Research and development | 473.1 |
| | 490.7 |
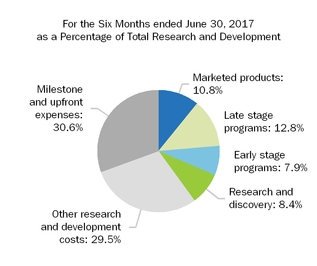
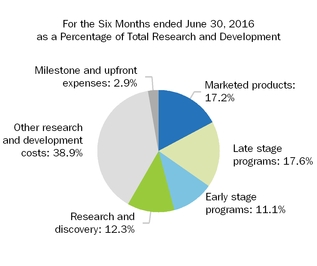
| | 910.4 |
| | 951.3 |
| 796.2 |
| | 473.1 |
| | 1,219.6 |
| | 910.4 |
|
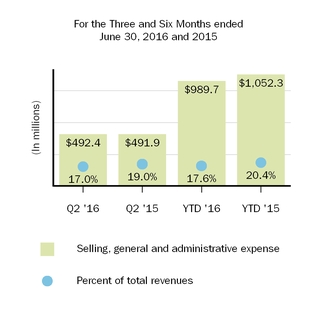
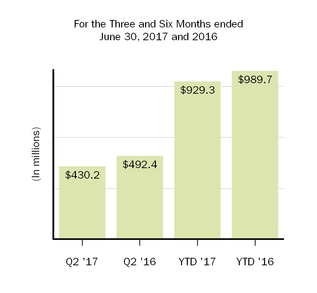
| Selling, general and administrative | 492.4 |
| | 491.9 |
| | 989.7 |
| | 1,052.3 |
| 430.2 |
| | 492.4 |
| | 929.3 |
| | 989.7 |
|
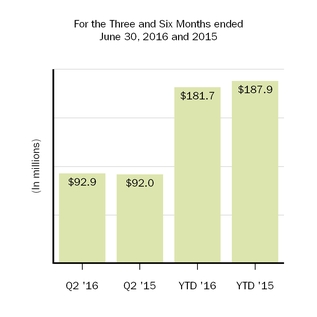
| Amortization of acquired intangible assets | 92.9 |
| | 92.0 |
| | 181.7 |
| | 187.9 |
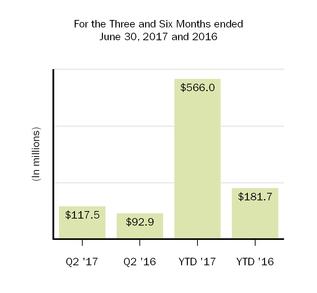
| 117.5 |
| | 92.9 |
| | 566.0 |
| | 181.7 |
|
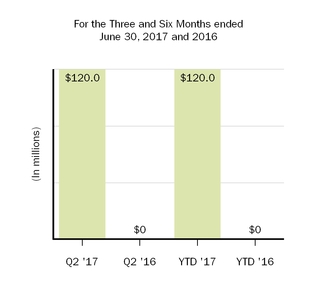
| Acquired in-process research and development | | 120.0 |
| | — |
| | 120.0 |
| | — |
|
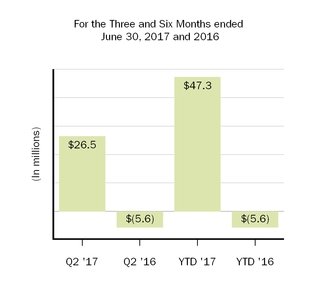
| Collaboration profit (loss) sharing | | 26.5 |
| | (5.6 | ) | | 47.3 |
| | (5.6 | ) |
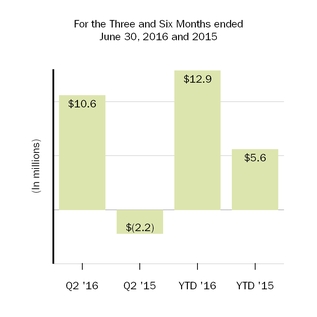
| (Gain) loss on fair value remeasurement of contingent consideration | 10.6 |
| | (2.2 | ) | | 12.9 |
| | 5.6 |
| 21.2 |
| | 10.6 |
| | 31.2 |
| | 12.9 |
|
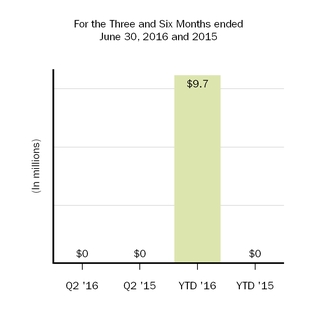
| Restructuring charges | — |
| | — |
| | 9.7 |
| | — |
| — |
| | — |
| | — |
| | 9.7 |
|
| Collaboration profit (loss) sharing | (5.6 | ) | | — |
| | (5.6 | ) | | — |
| |
| Total cost and expenses | 1,433.7 |
| | 1,358.5 |
| | 2,782.1 |
| | 2,795.6 |
| 1,877.8 |
| | 1,433.7 |
| | 3,664.2 |
| | 2,782.1 |
|
| Income from operations | 1,460.5 |
| | 1,233.1 |
| | 2,838.9 |
| | 2,351.0 |
| 1,200.6 |
| | 1,460.5 |
| | 2,224.9 |
| | 2,838.9 |
|
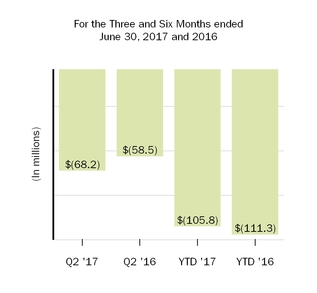
| Other income (expense), net | (58.5 | ) | | (10.9 | ) | | (111.3 | ) | | (25.9 | ) | (68.2 | ) | | (58.5 | ) | | (105.8 | ) | | (111.3 | ) |
| Income before income tax expense and equity in loss of investee, net of tax | 1,402.0 |
| | 1,222.2 |
| | 2,727.6 |
| | 2,325.1 |
| 1,132.4 |
| | 1,402.0 |
| | 2,119.1 |
| | 2,727.6 |
|
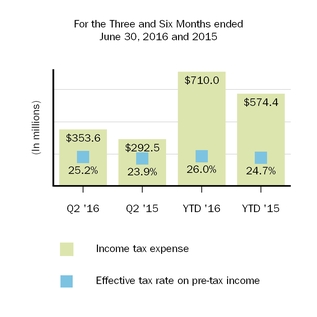
| Income tax expense | 353.6 |
| | 292.5 |
| | 710.0 |
| | 574.4 |
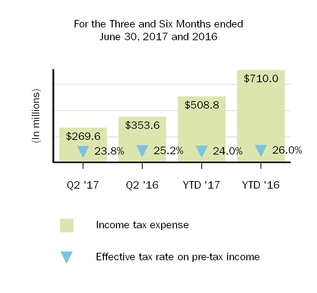
| 269.6 |
| | 353.6 |
| | 508.8 |
| | 710.0 |
|
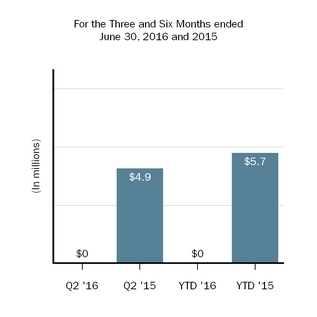
| Equity in loss of investee, net of tax | — |
| | 4.9 |
| | — |
| | 5.7 |
| — |
| | — |
| | — |
| | — |
|
| Net income | 1,048.4 |
| | 924.8 |
| | 2,017.6 |
| | 1,745.0 |
| 862.8 |
| | 1,048.4 |
| | 1,610.3 |
| | 2,017.6 |
|
| Net income (loss) attributable to noncontrolling interests, net of tax | (1.4 | ) | | (2.5 | ) | | (3.1 | ) | | (4.8 | ) | — |
| | (1.4 | ) | | (0.1 | ) | | (3.1 | ) |
| Net income attributable to Biogen Inc. | $ | 1,049.8 |
| | $ | 927.3 |
| | $ | 2,020.7 |
| | $ | 1,749.8 |
| $ | 862.8 |
| | $ | 1,049.8 |
| | $ | 1,610.4 |
| | $ | 2,020.7 |
|
| Net income per share: | | | | | | | | | | | | | | |
| Basic earnings per share attributable to Biogen Inc. | $ | 4.79 |
| | $ | 3.94 |
| | $ | 9.23 |
| | $ | 7.44 |
| $ | 4.07 |
| | $ | 4.79 |
| | $ | 7.53 |
| | $ | 9.23 |
|
| Diluted earnings per share attributable to Biogen Inc. | $ | 4.79 |
| | $ | 3.93 |
| | $ | 9.21 |
| | $ | 7.42 |
| $ | 4.07 |
| | $ | 4.79 |
| | $ | 7.52 |
| | $ | 9.21 |
|
| Weighted-average shares used in calculating: | | | | | | | | | | | | | | |
| Basic earnings per share attributable to Biogen Inc. | 219.1 |
| | 235.3 |
| | 219.0 |
| | 235.1 |
| 211.9 |
| | 219.1 |
| | 213.7 |
| | 219.0 |
|
| Diluted earnings per share attributable to Biogen Inc. | 219.4 |
| | 235.7 |
| | 219.3 |
| | 235.7 |
| 212.2 |
| | 219.4 |
| | 214.0 |
| | 219.3 |
|
See accompanying notes to these unaudited condensed consolidated financial statements.
BIOGEN INC. AND SUBSIDIARIES
CONDENSED CONSOLIDATED STATEMENTS OF COMPREHENSIVE INCOME
(unaudited, in millions)
| | | | For the Three Months
Ended June 30, | | For the Six Months
Ended June 30, | For the Three Months
Ended June 30, | | For the Six Months
Ended June 30, |
| | 2016 | | 2015 | | 2016 | | 2015 | 2017 | | 2016 | | 2017 | | 2016 |
| Net income attributable to Biogen Inc. | $ | 1,049.8 |
| | $ | 927.3 |
| | $ | 2,020.7 |
| | $ | 1,749.8 |
| $ | 862.8 |
| | $ | 1,049.8 |
| | $ | 1,610.4 |
| | $ | 2,020.7 |
|
| Other comprehensive income: | | | | | | | | | | | | | | |
| Unrealized gains (losses) on securities available for sale, net of tax | 4.5 |
| | (0.2 | ) | | 7.0 |
| | 1.1 |
| 7.2 |
| | 4.5 |
| | 5.6 |
| | 7.0 |
|
| Unrealized gains (losses) on cash flow hedges, net of tax | 29.3 |
| | (96.2 | ) | | (18.3 | ) | | (8.9 | ) | (103.0 | ) | | 29.3 |
| | (126.8 | ) | | (18.3 | ) |
| Unrealized gains (losses) on pension benefit obligation | 0.7 |
| | 2.9 |
| | 0.9 |
| | 4.1 |
| |
| Unrealized gains (losses) on pension benefit obligation, net of tax | | (0.6 | ) | | 0.7 |
| | (0.5 | ) | | 0.9 |
|
| Currency translation adjustment | (58.0 | ) | | 63.0 |
| | (48.4 | ) | | (37.8 | ) | 82.8 |
| | (58.0 | ) | | 102.8 |
| | (48.4 | ) |
| Total other comprehensive income (loss), net of tax | (23.5 | ) | | (30.5 | ) | | (58.8 | ) | | (41.5 | ) | (13.6 | ) | | (23.5 | ) | | (18.9 | ) | | (58.8 | ) |
| Comprehensive income attributable to Biogen Inc. | 1,026.3 |
| | 896.8 |
| | 1,961.9 |
| | 1,708.3 |
| 849.2 |
| | 1,026.3 |
| | 1,591.5 |
| | 1,961.9 |
|
| Comprehensive income (loss) attributable to noncontrolling interests, net of tax | (1.4 | ) | | (2.3 | ) | | (3.1 | ) | | (4.5 | ) | — |
| | (1.4 | ) | | (0.1 | ) | | (3.1 | ) |
| Comprehensive income | $ | 1,024.9 |
| | $ | 894.5 |
| | $ | 1,958.8 |
| | $ | 1,703.7 |
| $ | 849.2 |
| | $ | 1,024.9 |
| | $ | 1,591.4 |
| | $ | 1,958.8 |
|
See accompanying notes to these unaudited condensed consolidated financial statements.
BIOGEN INC. AND SUBSIDIARIES
CONDENSED CONSOLIDATED BALANCE SHEETS
(unaudited, in millions, except per share amounts)
| | | | As of June 30,
2016 | | As of December 31,
2015 | As of June 30,
2017 | | As of December 31,
2016 |
ASSETS | | Current assets: | | | | | | |
| Cash and cash equivalents | $ | 1,362.0 |
| | $ | 1,308.0 |
| $ | 1,169.5 |
| | $ | 2,326.5 |
|
| Marketable securities | 2,434.8 |
| | 2,120.5 |
| 1,723.5 |
| | 2,568.6 |
|
| Accounts receivable, net | 1,293.0 |
| | 1,227.0 |
| 1,630.2 |
| | 1,441.6 |
|
| Due from anti-CD20 therapeutic programs | 334.1 |
| | 314.5 |
| 502.9 |
| | 300.6 |
|
| Inventory | 996.4 |
| | 893.4 |
| 936.5 |
| | 1,001.6 |
|
| Other current assets | 1,027.4 |
| | 836.9 |
| 1,146.1 |
| | 1,093.3 |
|
| Total current assets | 7,447.7 |
| | 6,700.3 |
| 7,108.7 |
| | 8,732.2 |
|
| Marketable securities | 3,477.6 |
| | 2,760.4 |
| 2,632.7 |
| | 2,829.4 |
|
| Property, plant and equipment, net | 2,301.8 |
| | 2,187.6 |
| 2,827.6 |
| | 2,501.8 |
|
| Intangible assets, net | 3,967.6 |
| | 4,085.1 |
| 4,051.3 |
| | 3,808.3 |
|
| Goodwill | 3,167.1 |
| | 2,663.8 |
| 3,870.4 |
| | 3,669.3 |
|
| Investments and other assets | 1,153.0 |
| | 1,107.6 |
| 1,268.3 |
| | 1,335.8 |
|
| Total assets | $ | 21,514.8 |
| | $ | 19,504.8 |
| $ | 21,759.0 |
| | $ | 22,876.8 |
|
LIABILITIES AND EQUITY | | Current liabilities: | | | | | | |
| Current portion of notes payable and other financing arrangements | $ | 4.8 |
| | $ | 4.8 |
| $ | 559.9 |
| | $ | 4.7 |
|
| Taxes payable | 212.8 |
| | 208.7 |
| 52.6 |
| | 231.9 |
|
| Accounts payable | 225.9 |
| | 267.4 |
| 330.3 |
| | 279.8 |
|
| Accrued expenses and other | 2,072.7 |
| | 2,096.8 |
| 2,436.9 |
| | 2,903.5 |
|
| Total current liabilities | 2,516.2 |
| | 2,577.7 |
| 3,379.7 |
| | 3,419.9 |
|
| Notes payable and other financing arrangements | 6,538.3 |
| | 6,521.5 |
| 5,954.0 |
| | 6,512.7 |
|
| Long-term deferred tax liability | 105.6 |
| | 124.9 |
| |
| Deferred tax liability | | 100.8 |
| | 93.1 |
|
| Other long-term liabilities | 951.0 |
| | 905.8 |
| 750.9 |
| | 722.5 |
|
| Total liabilities | 10,111.1 |
| | 10,129.9 |
| 10,185.4 |
| | 10,748.2 |
|
| Commitments and contingencies |
|
| |
|
|
|
| |
|
|
| Equity: | | | | | | |
| Biogen Inc. shareholders’ equity | | | | | | |
| Preferred stock, par value $0.001 per share | — |
| | — |
| — |
| | — |
|
| Common stock, par value $0.0005 per share | 0.1 |
| | 0.1 |
| 0.1 |
| | 0.1 |
|
| Additional paid-in capital | 69.1 |
| | — |
| 19.3 |
| | — |
|
| Accumulated other comprehensive loss | (282.8 | ) | | (224.0 | ) | (338.8 | ) | | (319.9 | ) |
| Retained earnings | 14,229.1 |
| | 12,208.4 |
| 14,881.7 |
| | 15,071.6 |
|
| Treasury stock, at cost | (2,611.7 | ) | | (2,611.7 | ) | (2,977.1 | ) | | (2,611.7 | ) |
| Total Biogen Inc. shareholders’ equity | 11,403.8 |
| | 9,372.8 |
| 11,585.2 |
| | 12,140.1 |
|
| Noncontrolling interests | (0.1 | ) | | 2.1 |
| (11.6 | ) | | (11.5 | ) |
| Total equity | 11,403.7 |
| | 9,374.9 |
| 11,573.6 |
| | 12,128.6 |
|
| Total liabilities and equity | $ | 21,514.8 |
| | $ | 19,504.8 |
| $ | 21,759.0 |
| | $ | 22,876.8 |
|
See accompanying notes to these unaudited condensed consolidated financial statements.
BIOGEN INC. AND SUBSIDIARIES
CONDENSED CONSOLIDATED STATEMENTS OF CASH FLOWS
(unaudited, in millions)
|
| | | | | | | |
| | For the Six Months
Ended June 30, |
| | 2016 | | 2015 |
| Cash flows from operating activities: | | | |
| Net income | $ | 2,017.6 |
| | $ | 1,745.0 |
|
| Adjustments to reconcile net income to net cash flows from operating activities: | | | |
| Depreciation and amortization | 325.1 |
| | 292.5 |
|
| Share-based compensation | 84.1 |
| | 93.7 |
|
| Deferred income taxes | (30.2 | ) | | (90.6 | ) |
| Other | 19.8 |
| | (5.8 | ) |
| Changes in operating assets and liabilities, net: | | | |
| Accounts receivable | (65.0 | ) | | (38.9 | ) |
| Inventory | (128.3 | ) | | (81.3 | ) |
| Accrued expenses and other current liabilities | (162.3 | ) | | (169.9 | ) |
| Current taxes payable | (151.7 | ) | | 102.0 |
|
| Other changes in operating assets and liabilities, net | 50.1 |
| | (66.4 | ) |
| Net cash flows provided by operating activities | 1,959.2 |
| | 1,780.3 |
|
| Cash flows from investing activities: | | | |
| Proceeds from sales and maturities of marketable securities | 2,823.6 |
| | 975.5 |
|
| Purchases of marketable securities | (3,833.3 | ) | | (2,045.0 | ) |
| Acquisitions of business, net of cash acquired | — |
| | (198.8 | ) |
| Purchases of property, plant and equipment | (263.7 | ) | | (227.7 | ) |
| Contingent consideration related to Fumapharm AG acquisition | (600.0 | ) | | (250.0 | ) |
| Other | (65.9 | ) | | (10.1 | ) |
| Net cash flows used in investing activities | (1,939.3 | ) | | (1,756.1 | ) |
| Cash flows from financing activities: | | | |
| Purchase of treasury stock | — |
| | (42.2 | ) |
| Proceeds from issuance of stock for share-based compensation arrangements | 23.9 |
| | 34.7 |
|
| Excess tax benefit from share-based awards | 9.0 |
| | 69.7 |
|
| Other | 1.1 |
| | 15.0 |
|
| Net cash flows provided by financing activities | 34.0 |
| | 77.2 |
|
| Net increase in cash and cash equivalents | 53.9 |
| | 101.4 |
|
| Effect of exchange rate changes on cash and cash equivalents | 0.1 |
| | (24.2 | ) |
| Cash and cash equivalents, beginning of the period | 1,308.0 |
| | 1,204.9 |
|
| Cash and cash equivalents, end of the period | $ | 1,362.0 |
| | $ | 1,282.1 |
|
|
| | | | | | | |
| | For the Six Months
Ended June 30, |
| | 2017 | | 2016 |
| Cash flows from operating activities: | | | |
| Net income | $ | 1,610.3 |
| | $ | 2,017.6 |
|
| Adjustments to reconcile net income to net cash flows from operating activities: | | | |
| Depreciation, amortization and acquired in-process research and development | 814.6 |
| | 325.1 |
|
| Share-based compensation | 67.3 |
| | 84.1 |
|
| Deferred income taxes | (20.5 | ) | | (30.2 | ) |
| Other | 73.5 |
| | 28.9 |
|
| Changes in operating assets and liabilities, net: | | | |
| Accounts receivable | (301.2 | ) | | (65.0 | ) |
| Inventory | (85.3 | ) | | (128.3 | ) |
| Accrued expenses and other current liabilities | (452.3 | ) | | (116.4 | ) |
| Income tax assets and liabilities | (114.7 | ) | | (76.7 | ) |
| Other changes in operating assets and liabilities, net | (187.3 | ) | | (25.1 | ) |
| Net cash flows provided by operating activities | 1,404.4 |
| | 2,014.0 |
|
| Cash flows from investing activities: | | | |
| Proceeds from sales and maturities of marketable securities | 3,584.5 |
| | 2,823.6 |
|
| Purchases of marketable securities | (2,536.0 | ) | | (3,833.3 | ) |
| Contingent consideration related to Fumapharm AG acquisition | (600.0 | ) | | (600.0 | ) |
| Acquired in-process research and development | (120.0 | ) | | — |
|
| Purchases of property, plant and equipment | (407.7 | ) | | (263.7 | ) |
| Acquisitions of intangible assets | (860.3 | ) | | — |
|
| Other | (7.3 | ) | | (65.9 | ) |
| Net cash flows used in investing activities | (946.8 | ) | | (1,939.3 | ) |
| Cash flows from financing activities: | | | |
| Purchases of treasury stock | (1,365.4 | ) | | — |
|
| Payments related to issuance of stock for share-based compensation arrangements, net | (17.8 | ) | | (21.9 | ) |
| Net cash contribution to Bioverativ Inc. | (302.7 | ) | | — |
|
| Other | 33.5 |
| | 1.1 |
|
| Net cash flows used in financing activities | (1,652.4 | ) | | (20.8 | ) |
| Net (decrease) increase in cash and cash equivalents | (1,194.8 | ) | | 53.9 |
|
| Effect of exchange rate changes on cash and cash equivalents | 37.8 |
| | 0.1 |
|
| Cash and cash equivalents, beginning of the period | 2,326.5 |
| | 1,308.0 |
|
| Cash and cash equivalents, end of the period | $ | 1,169.5 |
| | $ | 1,362.0 |
|
See accompanying notes to these unaudited condensed consolidated financial statements.
BIOGEN INC. AND SUBSIDIARIES
NOTES TO CONDENSED CONSOLIDATED FINANCIAL STATEMENTS
(unaudited)
1. Summary of Significant Accounting Policies
Business Overview
Biogen is a global biopharmaceutical company focused on discovering, developing, manufacturing and delivering therapies to patients for the treatment ofpeople living with serious neurological diseases, autoimmune disorders and rareneurodegenerative diseases.
Our marketed products include TECFIDERA, AVONEX, PLEGRIDY, TYSABRI, ZINBRYTA and FAMPYRA for multiple sclerosis (MS), ELOCTATESPINRAZA for hemophilia A and ALPROLIX for hemophilia Bthe treatment of spinal muscular atrophy (SMA) and FUMADERM for the treatment of severe plaque psoriasis. We also have a collaboration agreement with Genentech, Inc. (Genentech), a wholly-owned member of the Roche Group, which entitles us to certain business and financial rights with respect to RITUXAN for the treatment of non-Hodgkin's lymphoma, chronic lymphocytic leukemia (CLL) and other conditions, GAZYVA indicated for the treatment of CLL and follicular lymphoma, OCREVUS indicated for the treatment of primary progressive MS and relapsing MS, and other potential anti-CD20 therapies.therapies under a collaboration agreement with Genentech, Inc., a wholly-owned member of the Roche Group.
We support our drug discovery and development efforts through the commitment of significant resources to discovery, research and development programs and business development opportunities, particularly within areas of our scientific, manufacturing and technical capabilities. We intend to invest in the future across our core growth areas of MS and neuroimmunology, Alzheimer's disease and dementia, Parkinson's disease and movement disorders, and neuromuscular diseases including SMA and amyotrophic lateral sclerosis (ALS). Further, we see opportunities to invest in emerging growth areas such as pain, ophthalmology, neuropsychiatry, and acute neurology. In addition, we are employing innovative technologies to ourdiscover potential treatments for rare and genetic disorders, including new ways of treating diseases through gene therapy.
Our innovative drug development efforts, we aimand commercialization activities are complemented by our biosimilar therapies that expand access to leveragemedicines and reduce the cost burden for healthcare systems. We are leveraging our manufacturing capabilities and scientific expertiseknow-how to develop, manufacture and market biosimilars through Samsung Bioepis, our joint venture with Samsung BioLogics Co. Ltd. (Samsung Biologics) that develops, manufactures and markets biosimilars as well as through other strategic contract manufacturing partners.. Under our commercial agreement, with Samsung Bioepis, we market and sell BENEPALI, an etanercept biosimilar referencing ENBREL, and FLIXABI, an infliximab biosimilar referencing REMICADE, in the European Union (E.U.).
In May 2016,Hemophilia Spin-Off
On February 1, 2017, we announced our intention to spin offcompleted the spin-off of our hemophilia business, Bioverativ Inc. (Bioverativ), as an independent, publicly traded company. The new company will focus onOur consolidated results of operations and financial position included in these unaudited condensed consolidated financial statements reflect the discovery and development of therapies for the treatment of hemophilia and other blood disorders, with existing marketed products ELOCTATE and ALPROLIX. The transaction is expected to be completed in early 2017, subject to the satisfaction of certain conditions, including, among others, final approval of our Board of Directors, receipt of a favorable opinion with respect to the tax-free nature of the transaction and the effectiveness of a Form 10 registration statement that will be filed with the Securities and Exchange Commission. Thefinancial results of our hemophilia business will be included infor all periods through January 31, 2017.
For additional information related to the spin-off of our hemophilia business, please read Note 3, Hemophilia Spin-Off, to these condensed consolidated financial statements until the transaction is completed.statements.
Basis of Presentation
In the opinion of management, the accompanying unaudited condensed consolidated financial statements include all adjustments, consisting of normal recurring accruals, necessary for a fair statementpresentation of our financial statements for interim periods in accordance with accounting principles generally accepted in the United States (U.S. GAAP). The information included in this quarterly report on Form 10-Q should be read in conjunction with our consolidated financial statements and the accompanying notes included in our Annual Report on Form 10-K for the year ended December 31, 2015 (20152016 (2016 Form 10-K). Our accounting policies are described in the “Notes to Consolidated Financial Statements” in our 20152016 Form 10-K and updated, as necessary, in this Form 10-Q. The year-end condensed consolidated balance sheet data presented for comparative purposes was derived from our audited financial statements, but does not include all disclosures required by U.S. GAAP. The results of operations for the three and six months ended June 30, 2016,2017, are not necessarily indicative of the operating results for the full year or for any other subsequent interim period.
We operate as one operating segment, which is focused on discovering, developing, manufacturing and delivering therapies to patients for the treatmentpeople living with serious neurological and neurodegenerative diseases.
BIOGEN INC. AND SUBSIDIARIES
NOTES TO CONDENSED CONSOLIDATED FINANCIAL STATEMENTS
(unaudited, continued)
Consolidation
Our condensed consolidated financial statements reflect our financial statements, those of our wholly-owned subsidiaries and those of certain variable interest entities where we are the primary beneficiary. For consolidated entities where we own or are exposed to less than 100% of the economics, we record net income (loss) attributable to noncontrolling interests in our condensed consolidated statements of income equal to the percentage of the economic or ownership interest retained in such entities by the respective noncontrolling parties. Intercompany balances and transactions are eliminated in consolidation.
BIOGEN INC. AND SUBSIDIARIES
NOTES TO CONDENSED CONSOLIDATED FINANCIAL STATEMENTS
(unaudited)
In determining whether we are the primary beneficiary of an entity, we apply a qualitative approach that determines whether we have both (1) the power to direct the economically significant activities of the entity and (2) the obligation to absorb losses of, or the right to receive benefits from, the entity that could potentially be significant to that entity. These considerations impact the way we account for our existing collaborative relationships and other arrangements. We continuously assess whether we are the primary beneficiary of a variable interest entity as changes to existing relationships or future transactions may result in us consolidating or deconsolidating one or more of our collaborators or partners.
Use of Estimates
The preparation of our condensed consolidated financial statements requires us to make estimates, judgments and assumptions that may affect the reported amounts of assets, liabilities, equity, revenues and expenses and related disclosure of contingent assets and liabilities. On an on-goingongoing basis we evaluate our estimates, judgments and methodologies. We base our estimates on historical experience and on various other assumptions that we believe to be reasonable, the results of which form the basis for making judgments about the carrying values of assets, liabilities and equity and the amount of revenues and expenses. Actual results may differ from these estimates under different assumptions or conditions.
New Accounting Pronouncements
From time to time, new accounting pronouncements are issued by the Financial Accounting Standards Board (FASB) or other standard setting bodies that we adopt as of the specified effective date. Unless otherwise discussed, we do not believe that the impact of recently issued standards that are not yet effective will have a material impact on our financial position or results of operations upon adoption.
We adopted the following new standards effective January 1, 2017:
ASU No. 2016-06, Derivatives and Hedging (Topic 815): Contingent Put and Call Options in Debt Instruments.
ASU No. 2016-07, Investments - Equity Method and Joint Ventures (Topic 323): Simplifying the Transition to the Equity Method of Accounting.
ASU No. 2016-09, Compensation - Stock Compensation (Topic 718): Improvements to Employee Share-Based Payment Accounting.
The adoption of these standards did not have a material impact on our financial position, results of operations or statement of cash flows; however, the adoption of ASU No. 2016-09 resulted in the reclassification of certain prior year amounts in our condensed consolidated statements of cash flows to conform to our current year presentation. Specifically, amounts previously disclosed in net cash flows used in financing activities related to our excess tax benefit from share-based compensation have been reclassified to net cash flows provided by operating activities and amounts related to cash paid when withholding shares for tax withholding purposes, previously disclosed in net cash flows provided by operating activities, have been reclassified to net cash flows used in financing activities.
For additional information related to these standards, please read Note 1, Summary of Significant Accounting Policies: New Accounting Pronouncements, to our consolidated financial statements included in our 2016 Form 10-K.
In May 2014 the FASB issued Accounting Standards Update (ASU) No. 2014-09, Revenue from Contracts with Customers (Topic 606), which supersedes all existing revenue recognition requirements, including most industry-specific guidance. The new standard requires a company to recognize revenue when it transfers goods or services to customers in an amount that reflects the consideration that the company expects to receive for those goods or services. In August 2015, theThe FASB has subsequently issued amendments to ASU No. 2015-14, Revenue from Contracts with Customers (Topic 606): Deferral of the Effective Date, which delayed the effective date of the new standard from January 1, 2017 to January 1, 2018. The FASB also agreed to allow entities to choose to adopt the standard as of the original effective date. In March 2016, the FASB issued ASU No. 2016-08, Revenue from Contracts with Customers (Topic 606): Principal versus Agent Considerations, which clarifies the implementation guidance on principal versus agent considerations. In April 2016, the FASB issued ASU No. 2016-10, Revenue from Contracts with Customers (Topic 606): Identifying Performance Obligations and Licensing, which clarifies certain aspects of identifying performance obligations and licensing implementation guidance. In May 2016, the FASB issued ASU No. 2016-12, Revenue from Contracts with Customers (Topic 606): Narrow-Scope Improvements and Practical Expedients related to disclosures of remaining performance obligations, as well as other amendments to guidance on collectibility, non-cash consideration and the presentation of sales and other similar taxes collected from customers. These standards2014-09 that have the same effective date and transition date of January 1, 2018. We are currently evaluating the method of adoption and the potential impact thatexpect to adopt these standards may have on our financial position and results of operations.
During 2015,using the FASB issued the following new standards, which we adopted on January 1, 2016:
ASU No. 2015-05, Intangibles - Goodwill and Other - Internal-Use Software (Subtopic 350-40): Customer's Accounting for Fees Paid in a Cloud Computing Arrangement.
ASU No. 2015-11, Inventory (Topic 330): Simplifying the Measurement of Inventory.
ASU No. 2015-16, Business Combinations (Topic 805): Simplifying the Accounting for Measurement-Period Adjustments.
The adoption of these standards did not have an impact on our financial position or results of operations. For additional information related to these standards, please read Note 1, Summary of Significant Accounting Policies: New Accounting Pronouncements to our consolidated financial statements included in our 2015 Form 10-K.modified retrospective
BIOGEN INC. AND SUBSIDIARIES
NOTES TO CONDENSED CONSOLIDATED FINANCIAL STATEMENTS
(unaudited)(unaudited, continued)
method. We have performed a review of the new standards as compared to our current accounting policies with respect to our product revenues, and a review of our customer contracts is in process. As of June 30, 2017, we have not identified any accounting changes that would materially impact the amount of reported product revenues. During the second half of 2017, we plan to finalize our review of product revenues as well as our other revenue streams to determine the impact that this standard may have on our results of operations, financial position and disclosures.
In January 2016 the FASB issued ASU No. 2016-01, Financial Instruments - Overall (Subtopic 825-10): Recognition and Measurement of Financial Assets and Financial Liabilities. The new standard amends certain aspects of accounting and disclosure requirements of financial instruments, including the requirement that equity investments with readily determinable fair values be measured at fair value with changes in fair value recognized in oura company's results of operations. The new standard does not apply to investments accounted for under the equity method of accounting or those that result in consolidation of the investee. Equity investments that do not have readily determinable fair values may be measured at fair value or at cost minus impairment adjusted for changes in observable prices. A financial liability that is measured at fair value in accordance with the fair value option is required to be presented separately in other comprehensive income for the portion of the total change in the fair value resulting from change in the instrument-specific credit risk. In addition, a valuation allowance should be evaluated on deferred tax assets related to available-for-sale debt securities in combination with other deferred tax assets. The new standard will be effective for us on January 1, 2018. TheBased on our current investment holdings, the adoption of this standard is not expected to have a material impact on our financial position or results of operations.operations; however, it will result in the reclassification of certain investments.
In February 2016 the FASB issued ASU No. 2016-02, Leases (Topic 842). The new standard requires that all lessees recognize the assets and liabilities that arise from leases on thetheir balance sheet and disclose qualitative and quantitative information about itstheir leasing arrangements. The new standard will be effective for us on January 1, 2019. We are currently evaluating the impact that this standard may have on our results of operations, financial position and disclosures. The adoption of this standard is not expected to have a material impact on our net financial position, but willmay materially impact ourthe reported amount of total assets and total liabilities. We are currently evaluating the potential impact that this standard may have on our results of operations.
In March 2016, the FASB issued ASU No. 2016-06, Derivatives and Hedging (Topic 815): Contingent Put and Call Options in Debt Instruments. The new standard simplifies the embedded derivative analysis for debt instruments containing contingent call or put options by removing the requirement to assess whether a contingent event is related to interest rates or credit risks. The new standard will be effective for us on January 1, 2017. The adoption of this standard is not expected to have an impact on our financial position or results of operations.
In March 2016, the FASB issued ASU No. 2016-07, Investments - Equity Method and Joint Ventures (Topic 323): Simplifying the Transition to the Equity Method of Accounting. The new standard eliminates the requirement that when an investment qualifies for use of the equity method as a result of an increase in the level of ownership interest or degree of influence, an adjustment must be made to the investment, results of operations and retained earnings retroactively on a step-by-step basis as if the equity method had been in effect during all previous periods that the investment had been held. The new standard will be effective for us on January 1, 2017. The adoption of this standard is not expected to have a material impact on our financial position or results of operations.
In March 2016, the FASB issued ASU No. 2016-09, Compensation - Stock Compensation (Topic 718): Improvements to Employee Share-Based Payment Accounting. The new standard requires recognition of the income tax effects of vested or settled awards in the income statement and involves several other aspects of the accounting for share-based payment transactions, including the income tax consequences, classification of awards as either equity or liabilities and classification on the statement of cash flows. The new standard will be effective for us on January 1, 2017. This standard is not expected to have a material impact on our financial position, results of operations or statements of cash flows upon adoption.
In June 2016 the FASB issued ASU No. 2016-13, Financial Instruments - Credit Losses (Topic 326): Measurement of Credit Losses on Financial Instruments. The new standard changes the impairment model for most financial assets and certain other instruments. Under the new standard, entities holding financial assets and net investment in leases that are not accounted for at fair value through net income are to be presented at the net amount expected to be collected. An allowance for credit losses will be a valuation account that will be deducted from the amortized cost basis of the financial asset to present the net carrying value at the amount expected to be collected on the financial asset. The new standard will be effective for us on January 1, 2020. The adoption of this standard is not expected to have a material impact on our financial position or results of operations.
In August 2016 the FASB issued ASU No. 2016-15, Statement of Cash Flows (Topic 230): Classification of Certain Cash Receipts and Cash Payments. The new standard clarifies certain aspects of the statement of cash flows, including the classification of debt prepayment or debt extinguishment costs, settlement of zero-coupon debt instruments or other debt instruments with coupon interest rates that are insignificant in relation to the effective interest rate of the borrowing, contingent consideration payments made after a business combination, proceeds from the settlement of insurance claims, proceeds from the settlement of corporate-owned life insurance policies, distributions received from equity method investees and beneficial interests in securitization transactions. The new standard also clarifies that an entity should determine each separately identifiable source or use within the cash receipts and cash payments on the basis of the nature of the underlying cash flows. In situations in which cash receipts and payments have aspects of more than one class of cash flows and cannot be separated by source or use, the appropriate classification should depend on the activity that is likely to be the predominant source or use of cash flows for the item. The new standard will be effective for us on January 1, 2018. The adoption of this standard is not expected to have a material impact on our statements of cash flows upon adoption.
In October 2016 the FASB issued ASU No. 2016-16, Income Taxes (Topic 740): Intra-Entity Transfer of Assets Other Than Inventory. The new standard eliminates the deferral of the tax effects of intra-entity transfers of an asset other than inventory. Under the new standard, entities should recognize the income tax consequences on an intra-entity transfer of an asset other than inventory when the transfer occurs. The new standard will be effective for us on January 1, 2018. We expect to adopt this standard using the modified retrospective method applied through a cumulative-effect adjustment directly to retained earnings as of the beginning of the period of adoption. The adoption
BIOGEN INC. AND SUBSIDIARIES
NOTES TO CONDENSED CONSOLIDATED FINANCIAL STATEMENTS
(unaudited, continued)
2. Restructuringof this standard is expected to have a material impact on our net financial position; however, the final effect of the adoption of this standard will depend on the nature and amount of future transactions.
On October 21, 2015, we announcedIn January 2017 the FASB issued ASU No. 2017-01, Business Combinations (Topic 805): Clarifying the Definition of a corporate restructuring, which includedBusiness. The new standard clarifies the terminationdefinition of certain pipeline programsa business and provides a screen to determine when an 11% reductionintegrated set of assets and activities is not a business. The screen requires that when substantially all of the fair value of the gross assets acquired (or disposed of) is concentrated in workforce. Under this restructuring, cash payments will total approximately $120 million,a single identifiable asset or a group of which $15.9 million were related to previously accrued 2015 incentive compensation, resulting in net expected restructuring charges totaling approximately $105 million. These amountssimilar identifiable assets, the set is not a business. The new standard will be substantially paideffective for us on January 1, 2018; however, we have adopted this standard as of January 1, 2017, with prospective application to any business development transaction.
In January 2017 the FASB issued ASU No. 2017-04, Intangibles - Goodwill and Other (Topic 350): Simplifying the Test of Goodwill Impairment. The new standard eliminates Step 2 from the goodwill impairment test. Under the amendments in ASU No. 2017-04, an entity should recognize an impairment charge for the amount by which the endcarrying amount of 2016.a reporting unit exceeds that reporting unit’s fair value; however, the loss recognized should not exceed the total amount of goodwill allocated to that reporting unit. The new standard will be effective for us on January 1, 2020; however, early adoption is permitted. We intend to early adopt this standard as of October 31, 2017, during our annual review of goodwill. The adoption of this standard is not expected to have a material impact on our financial position or results of operations.
ForIn March 2017 the threeFASB issued ASU No. 2017-07, Compensation - Retirement Benefits (Topic 715): Improving the Presentation of Net Periodic Pension Cost and six months ended June 30, 2016, we recognized restructuring charges totaling $0.0 millionNet Periodic Postretirement Benefit Cost. The new standard will require that an employer disaggregate the service cost component from the other components of net benefit cost. The amendments also provide explicit guidance on how to present the service cost component and $9.7 million, respectively. We previously recognized $93.4 millionthe other components of restructuring chargesnet benefit cost in ourthe income statement and allow only the service cost component of net benefit cost to be eligible for capitalization. The other components of the net periodic benefit cost must be presented separately from the line items that include service cost and outside of any subtotal of operating income on the condensed consolidated statements of income duringincome. The new standard will be effective for us on January 1, 2018. The adoption of this standard is not expected to have a material impact on our financial position or results of operations.
In March 2017 the fourth quarterFASB issued ASU No. 2017-08, Receivables - Nonrefundable Fees and Other Costs (Subtopic 310-20): Premium Amortization on Purchased Callable Debt Securities. The new standard amends the amortization period for certain purchased callable debt securities held at a premium by shortening the amortization period for the premium to the earliest call date. The new standard will be effective for us on January 1, 2019. We are currently evaluating the potential impact that this standard may have on our financial position and results of 2015. Our restructuring reserveoperations.
In May 2017 the FASB issued ASU No. 2017-09, Compensation - Stock Compensation (Topic 718): Scope of Modification Accounting. The new standard provides guidance about which changes to the terms or conditions of a share-based payment award require an entity to apply modification accounting in Topic 718. The new standard will be effective for us on January 1, 2018; however, early adoption is included in accrued expenses and other inpermitted. The adoption of this standard is not expected to have a material impact on our condensed consolidated balance sheets.
The following table summarizes the charges and spending related to our restructuring efforts during the six months ended June 30, 2016:
|
| | | | | | | | | | | |
| (In millions) | Workforce Reduction | | Pipeline Programs | | Total |
| Restructuring reserve as of December 31, 2015 | $ | 33.7 |
| | $ | 3.6 |
| | $ | 37.3 |
|
| Expense | 4.9 |
| | 5.4 |
| | 10.3 |
|
| Payments | (28.7 | ) | | (6.0 | ) | | (34.7 | ) |
| Adjustments to previous estimates, net | (3.5 | ) | | 2.9 |
| | (0.6 | ) |
| Restructuring reserve as of June 30, 2016 | $ | 6.4 |
| | $ | 5.9 |
| | $ | 12.3 |
|
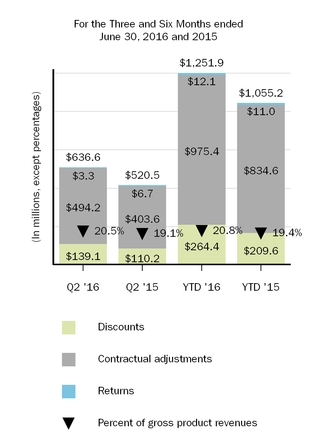
3. Reserves for Discounts and Allowances
An analysisfinancial position or results of the change in reserves for discounts and allowances is summarized as follows:
|
| | | | | | | | | | | | | | | |
| (In millions) | Discounts | | Contractual Adjustments | | Returns | | Total |
| Balance, as of December 31, 2015 | $ | 56.1 |
| | $ | 548.7 |
| | $ | 57.9 |
| | $ | 662.7 |
|
| Current provisions relating to sales in current year | 266.8 |
| | 973.8 |
| | 17.6 |
| | 1,258.2 |
|
| Adjustments relating to prior years | (2.4 | ) | | 1.6 |
| | (5.5 | ) | | (6.3 | ) |
| Payments/credits relating to sales in current year | (210.2 | ) | | (605.1 | ) | | (0.7 | ) | | (816.0 | ) |
| Payments/credits relating to sales in prior years | (51.5 | ) | | (384.9 | ) | | (10.4 | ) | | (446.8 | ) |
| Balance, as of June 30, 2016 | $ | 58.8 |
| | $ | 534.1 |
| | $ | 58.9 |
| | $ | 651.8 |
|
The total reserves above, included in our condensed consolidated balance sheets, are summarized as follows:
|
| | | | | | | |
| (In millions) | As of
June 30,
2016 | | As of
December 31,
2015 |
| Reduction of accounts receivable | $ | 161.3 |
| | $ | 144.6 |
|
| Component of accrued expenses and other | 490.5 |
| | 518.1 |
|
| Total reserves | $ | 651.8 |
| | $ | 662.7 |
|
BIOGEN INC. AND SUBSIDIARIES
NOTES TO CONDENSED CONSOLIDATED FINANCIAL STATEMENTS
(unaudited, continued)
4. Inventory2. Acquisitions
On May 15, 2017, we completed an asset purchase of the Phase 3 candidate, CIRARA (now known as BIIB093), from Remedy Pharmaceuticals Inc. (Remedy). The componentstarget indication for BIIB093 is large hemispheric infarction (LHI), a severe form of inventory are summarized as follows:
|
| | | | | | | |
| (In millions) | As of
June 30,
2016 | | As of
December 31,
2015 |
| Raw materials | $ | 235.0 |
| | $ | 213.0 |
|
| Work in process | 654.6 |
| | 577.6 |
|
| Finished goods | 139.1 |
| | 143.0 |
|
| Total inventory | $ | 1,028.7 |
| | $ | 933.6 |
|
| | | | |
| Balance Sheet Classification: | | | |
| Inventory | $ | 996.4 |
| | $ | 893.4 |
|
| Investments and other assets | 32.3 |
| | 40.2 |
|
| Total inventory | $ | 1,028.7 |
| | $ | 933.6 |
|
Inventory included in investmentsischemic stroke where brain swelling (cerebral edema) often leads to a disproportionately large share of stroke-related morbidity and other assets in our condensed consolidated balance sheets primarily consisted of work in process.
As of December 31, 2015, our inventory included $24.7 million associated with our ZINBRYTA program, $24.2 million associated with the FLIXABI program and $18.4 million associated with the BENEPALI program, which had been capitalized in advance of regulatory approval.mortality. The European Commission (EC) approved the marketing authorization applications for BENEPALI and FLIXABI, two anti-tumor necrosis factor (TNF) biosimilars, for marketing in the E.U. in January 2016 and May 2016, respectively, and the U.S. Food and Drug Administration (FDA) approved ZINBRYTArecently granted BIIB093 Orphan Drug Designation for severe cerebral edema in patients with acute ischemic stroke. The FDA has also granted BIIB093 Fast Track designation. Under the terms of the purchase agreement, we will have responsibility for the treatmentfuture development and commercialization of relapsing forms of MSBIIB093 and have agreed to pay Remedy certain development and sales based milestone payments, which are substantially payable upon or after regulatory approval, as well as royalties on future commercial sales. Remedy will share in the U.S.cost of development for the target indication for BIIB093 in May 2016.LHI stroke.
We are accounting for this transaction as an asset acquisition as we did not acquire any employees from Remedy nor did we acquire any significant processes required in the development of BIIB093. Upon closing of the transaction, we made a $120.0 million upfront payment, which was recorded as acquired in-process research and development in our condensed consolidated statements of income as BIIB093 has not yet reached technological feasibility.
5. Intangible Assets3. Hemophilia Spin-Off
On February 1, 2017, we completed the spin-off of our hemophilia business, Bioverativ, as an independent, publicly traded company trading under the symbol "BIVV" on the Nasdaq Global Select Market. The spin-off was accomplished through the distribution of all the then outstanding shares of common stock of Bioverativ to Biogen shareholders, who received one share of Bioverativ common stock for every two shares of Biogen common stock they owned. The separation and Goodwilldistribution was structured to be tax-free for shareholders for federal income tax purposes. Bioverativ assumed all of our rights and obligations under our collaboration agreement with Swedish Orphan Biovitrum AB and our collaboration and license agreement with Sangamo Biosciences Inc.
Intangible AssetsIn connection with the distribution, Biogen and Bioverativ entered into a separation agreement and various other agreements (including a transition services agreement, a tax matters agreement, a manufacturing and supply agreement, an employee matters agreement, an intellectual property matters agreement and certain other commercial agreements). These agreements govern the separation and distribution and the relationship between the two companies going forward. They also provide for the performance of services by each company for the benefit of the other for a period of time. In addition, under the terms of the separation agreement, Bioverativ is obligated to indemnify us for many liabilities that may exist relating to its business activities, whether incurred prior to or after the distribution, including any pending or future litigation.
Intangible assets, netThe services under these agreements generally commenced on February 1, 2017 (the distribution date), and are expected to terminate within 12 months of accumulated amortization, impairment chargesthe distribution date, with the exception of the manufacturing and adjustments, are summarized as follows:
|
| | | | | | | | | | | | | | | | | | | | | | | | | |
| | | | As of June 30, 2016 | | As of December 31, 2015 |
| (In millions) | Estimated Life | | Cost | | Accumulated Amortization | | Net | | Cost | | Accumulated Amortization | | Net |
| Out-licensed patents | 13-23 years | | $ | 543.3 |
| | $ | (514.9 | ) | | $ | 28.4 |
| | $ | 543.3 |
| | $ | (506.0 | ) | | $ | 37.3 |
|
Developed technology | 15-23 years | | 3,005.3 |
| | (2,604.5 | ) | | 400.8 |
| | 3,005.3 |
| | (2,552.9 | ) | | 452.4 |
|
| In-process research and development | Indefinite until commercialization | | 692.3 |
| | — |
| | 692.3 |
| | 730.5 |
| | — |
| | 730.5 |
|
Trademarks and tradenames | Indefinite | | 64.0 |
| | — |
| | 64.0 |
| | 64.0 |
| | — |
| | 64.0 |
|
Acquired and in-licensed rights and patents | 6-18 years | | 3,405.4 |
| | (623.3 | ) | | 2,782.1 |
| | 3,303.2 |
| | (502.3 | ) | | 2,800.9 |
|
| Total intangible assets | | | $ | 7,710.3 |
| | $ | (3,742.7 | ) | | $ | 3,967.6 |
| | $ | 7,646.3 |
| | $ | (3,561.2 | ) | | $ | 4,085.1 |
|
For the threesupply agreement, which has an initial term of five years, with a five year extension at Bioverativ's sole discretion and six months ended June 30, 2016, amortization of acquired intangible assets totaled $92.9 milliona further five year extension with Bioverativ's and $181.7 million, respectively, as compared to $92.0 million and $187.9 million, respectively, in the prior year comparative periods. In-process research and development amounts include adjustments for foreign exchange rate fluctuations.our consent.
BIOGEN INC. AND SUBSIDIARIES
NOTES TO CONDENSED CONSOLIDATED FINANCIAL STATEMENTS
(unaudited, continued)
In connection with the distribution we made a net cash contribution to Bioverativ, during the first quarter of 2017, totaling $302.7 million. The following table summarizes the assets and liabilities that were charged against equity as a result of the spin-off of our hemophilia business:
|
| | | |
| (In millions) | |
| Assets | |
| Cash | $ | 302.7 |
|
| Accounts receivable | 144.7 |
|
| Inventory | 116.1 |
|
| Property, plant and equipment, net | 20.2 |
|
| Intangible assets, net | 56.8 |
|
| Goodwill | 314.1 |
|
| Other, net | 53.7 |
|
| Assets transferred, net | $ | 1,008.3 |
|
| | |
| Liabilities | |
| Accrued expenses and other current liabilities | $ | 87.8 |
|
| Other long-term liabilities | 67.7 |
|
| Liabilities transferred, net | $ | 155.5 |
|
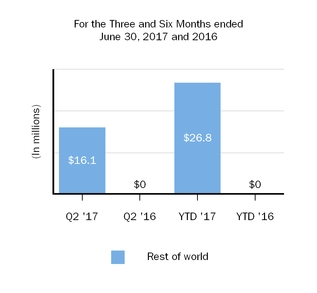
Under the manufacturing and supply agreement, we manufacture and supply certain products and materials to Bioverativ. For the three and six months ended June 30, 2017, we recognized $4.0 million and $7.1 million, respectively, in revenues in relation to these services, which is reflected as a component of other revenues in our condensed consolidated statements of income. We also recorded $3.7 million and $6.6 million as cost of sales in relation to these services during the three and six months ended June 30, 2017, respectively.
Pursuant to the terms of our agreements with Bioverativ, upon completion of the spin-off, we have continued to distribute ALPROLIX and ELOCTATE on behalf of Bioverativ and expect to do so until Bioverativ obtains appropriate regulatory authorizations in certain countries, including the United States (U.S.) and Canada. Under this arrangement, we are distributing these products as an agent of Bioverativ and will also provide related cash management services in connection with sales transactions, including the collection of receivables and the remittance of applicable discounts and allowances. Our consolidated financial position and results of operations do not reflect recognition of activity or balances related to these transactions.
Amounts earned under the non-manufacturing and supply related transaction service agreements are recorded as a reduction of costs and expenses in their respective expense line items, primarily in selling, general and administrative expenses, in our condensed consolidated statements of income. For the three and six months ended June 30, 2017, these amounts were not significant.
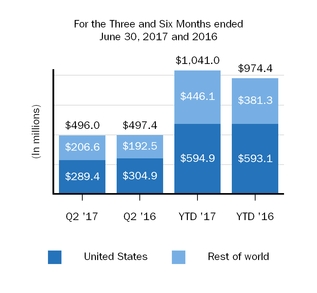
Hemophilia related product revenues reflected in our condensed consolidated statements of income for the six months ended June 30, 2017, totaled $74.4 million, as compared to $205.0 million and $387.7 million for the three and six months ended June 30, 2016, respectively. Results for the six months ended June 30, 2017, only reflect hemophilia-related product revenues through January 31, 2017.
Patents
Prior to the spin-off of our hemophilia business, we were awarded various methods of treatment and composition of matter patents related to ELOCTATE and ALPROLIX. Upon completion of the spin-off, these patents were transferred to the patent portfolio of Bioverativ.
BIOGEN INC. AND SUBSIDIARIES
NOTES TO CONDENSED CONSOLIDATED FINANCIAL STATEMENTS
(unaudited, continued)
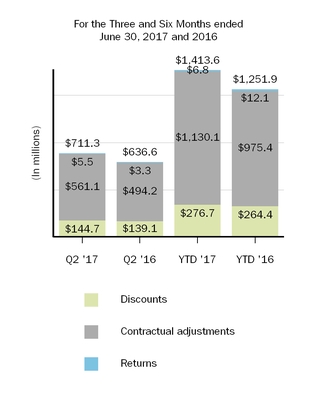
4. Reserves for Discounts and Allowances
An analysis of the change in reserves for discounts and allowances is summarized as follows:
|
| | | | | | | | | | | | | | | |
| (In millions) | Discounts | | Contractual Adjustments | | Returns | | Total |
| Balance, as of December 31, 2016 | $ | 71.6 |
| | $ | 482.7 |
| | $ | 51.2 |
| | $ | 605.5 |
|
| Current provisions relating to sales in current year | 276.9 |
| | 1,120.0 |
| | 15.2 |
| | 1,412.1 |
|
| Adjustments relating to prior years | (0.2 | ) | | 10.1 |
| | (8.4 | ) | | 1.5 |
|
| Payments/credits relating to sales in current year | (186.5 | ) | | (649.9 | ) | | — |
| | (836.4 | ) |
| Payments/credits relating to sales in prior years | (67.6 | ) | | (379.1 | ) | | (11.7 | ) | | (458.4 | ) |
| Balance, as of June 30, 2017 | $ | 94.2 |
| | $ | 583.8 |
| | $ | 46.3 |
| | $ | 724.3 |
|
The total reserves above, which are included in our condensed consolidated balance sheets, are summarized as follows:
|
| | | | | | | |
| (In millions) | As of
June 30,
2017 | | As of
December 31,
2016 |
| Reduction of accounts receivable | $ | 191.0 |
| | $ | 166.9 |
|
| Component of accrued expenses and other | 533.3 |
| | 438.6 |
|
| Total reserves | $ | 724.3 |
| | $ | 605.5 |
|
5. Inventory
The components of inventory are summarized as follows:
|
| | | | | | | |
| (In millions) | As of
June 30,
2017 | | As of
December 31,
2016 |
| Raw materials | $ | 148.3 |
| | $ | 170.4 |
|
| Work in process | 629.3 |
| | 698.7 |
|
| Finished goods | 184.2 |
| | 170.3 |
|
| Total inventory | $ | 961.8 |
| | $ | 1,039.4 |
|
| | | | |
| Balance Sheet Classification: | | | |
| Inventory | $ | 936.5 |
| | $ | 1,001.6 |
|
| Investments and other assets | 25.3 |
| | 37.8 |
|
| Total inventory | $ | 961.8 |
| | $ | 1,039.4 |
|
Long-term inventory, which primarily consists of work in process, is included in investments and other assets in our condensed consolidated balance sheets.
Balances in the table above as of June 30, 2017, also reflect the elimination of certain amounts transferred to Bioverativ in connection with the completion of the spin-off of our hemophilia business. Balances transferred to Bioverativ related to work in process and finished goods inventory totaled $84.5 million and $31.6 million, respectively.
BIOGEN INC. AND SUBSIDIARIES
NOTES TO CONDENSED CONSOLIDATED FINANCIAL STATEMENTS
(unaudited, continued)
6. Intangible Assets and Goodwill
Intangible Assets
Intangible assets, net of accumulated amortization, impairment charges and adjustments, are summarized as follows:
|
| | | | | | | | | | | | | | | | | | | | | | | | | |
| | | | As of June 30, 2017 | | As of December 31, 2016 |
| (In millions) | Estimated Life | | Cost | | Accumulated Amortization | | Net | | Cost | | Accumulated Amortization | | Net |
| Out-licensed patents | 13-23 years | | $ | 543.3 |
| | $ | (529.8 | ) | | $ | 13.5 |
| | $ | 543.3 |
| | $ | (523.6 | ) | | $ | 19.7 |
|
Developed technology | 15-23 years | | 3,005.3 |
| | (2,662.2 | ) | | 343.1 |
| | 3,005.3 |
| | (2,634.3 | ) | | 371.0 |
|
| In-process research and development | Indefinite until commercialization | | 668.6 |
| | — |
| | 668.6 |
| | 648.0 |
| | — |
| | 648.0 |
|
Trademarks and tradenames | Indefinite | | 64.0 |
| | — |
| | 64.0 |
| | 64.0 |
| | — |
| | 64.0 |
|
Acquired and in-licensed rights and patents | 4-18 years | | 3,937.1 |
| | (975.0 | ) | | 2,962.1 |
| | 3,481.7 |
| | (776.1 | ) | | 2,705.6 |
|
| Total intangible assets | | | $ | 8,218.3 |
| | $ | (4,167.0 | ) | | $ | 4,051.3 |
| | $ | 7,742.3 |
| | $ | (3,934.0 | ) | | $ | 3,808.3 |
|
For the three and six months ended June 30, 2017, amortization of acquired intangible assets totaled $117.5 million and $566.0 million, respectively, as compared to $92.9 million and $181.7 million, respectively, in the prior year comparative periods. Amortization of acquired intangible assets for the three and six months ended June 30, 2017, includes $29.4 million and $383.0 million, respectively, of amortization and impairment charges related to our U.S. and rest of world licenses to Forward Pharma A/S' (Forward Pharma) intellectual property related to TECFIDERA, as further discussed below. In-process research and development balances include adjustments related to foreign currency exchange rate fluctuations.
Balances in the table above as of June 30, 2017, also reflect the elimination of certain amounts transferred to Bioverativ in connection with the completion of the spin-off of our hemophilia business. For additional information relating to the spin-off of our hemophilia business, please read Note 3, Hemophilia Spin-Off, to these condensed consolidated financial statements.
Developed Technology
Developed technology primarily relates to our AVONEX product, which was recorded in connection with the merger of Biogen, Inc. and IDEC Pharmaceuticals Corporation in 2003. The net book value of this asset as of June 30, 20162017, was $392.8$335.9 million.
Acquired and In-licensed Rights and Patents
Acquired and in-licensed rights and patents primarily relate to our acquisition of all remaining rights to TYSABRI from Elan Corporation plc (Elan).plc. The net book value of this asset as of June 30, 20162017, was $2,633.4$2,351.8 million.
The increase in acquired and in-licensed rights and patents during the six months ended June 30, 2016, primarily reflects:
$50.02017, reflects the $50.0 million in total milestone payments due to Samsung Bioepis, which became payable uponIonis Pharmaceuticals, Inc. for the approval of BENEPALI and FLIXABISPINRAZA for the treatment of SMA in the E.U. inand net amounts related to our TECFIDERA license rights, as described below.
TECFIDERA License Rights
In January 20162017 we entered into a settlement and May 2016, respectively;
$20.0 million milestone payment due to AbbVie Biotherapeutics, Inc. (AbbVie)license agreement among Biogen Swiss Manufacturing GmbH, Biogen International Holding Ltd., Forward Pharma and certain related parties, which became payable upon the regulatory approvalwas effective as of ZINBRYTA in the U.S. in May 2016; and
$26.5 million upon the approval of ALPROLIX in the E.U. in May 2016, which is comprised of a $20.0 million contingent payment dueFebruary 1, 2017. Pursuant to the former ownersagreement, we obtained U.S. and rest of Syntonix Pharmaceuticals, Inc. (Syntonix) and $6.5 millionworld licenses to Forward Pharma's intellectual property, including Forward Pharma's intellectual property related to TECFIDERA. In exchange, we agreed to pay Forward Pharma $1.25 billion in cash. During the establishmentfourth quarter of 2016, we recognized a corresponding deferred tax liability.pre-tax charge of $454.8 million related to this agreement, representing the fair value of our license to Forward Pharma’s intellectual property for the period April 2014, when we started selling TECFIDERA, through December 31, 2016. For additional
BIOGEN INC. AND SUBSIDIARIES
NOTES TO CONDENSED CONSOLIDATED FINANCIAL STATEMENTS
(unaudited, continued)
For additional information on our relationship with Samsung Bioepis, please read Note 17, Collaborative and Other Relationshipsrelated to these condensed consolidated financial statements. For additional information on our relationship with Syntonix,this agreement, please read Note 21, Commitments and Contingencies, to our consolidated financial statements included in our 20152016 Form 10-K.
We paid the $1.25 billion in February 2017 and recognized an intangible asset of $795.2 million. The asset represented the fair value of the U.S. and rest of world licenses to Forward Pharma’s intellectual property related to TECFIDERA revenues for the period January 2017, the month in which we entered into this agreement, through December 2020, the last month before royalty payments could first commence pursuant to this agreement.
We have two intellectual property disputes with Forward Pharma, one in the U.S. and one in the E.U., concerning intellectual property related to TECFIDERA. In March 2017 the U.S. intellectual property dispute was decided in our favor. Forward Pharma has appealed to the U.S. Court of Appeals for the Federal Circuit and the appeal is pending. For additional information on our relationship with AbbVie,related to these disputes, please read Note 19, Collaborative and Other RelationshipsLitigation, to ourthese condensed consolidated financial statements includedstatements.
As we prevailed in the U.S. proceeding in March 2017, we evaluated the recoverability of the U.S. asset acquired from Forward Pharma and recorded an impairment charge to adjust the carrying value of the acquired U.S. asset to fair value reflecting the impact of the developments in the U.S. legal dispute. We also continue to amortize the remaining net book value of the U.S. and rest of world intangible assets in our 2015 Form 10-K.condensed consolidated statements of income utilizing an economic consumption model.
Estimated Future Amortization of Intangible Assets
Our amortization expense is based on the economic consumption of intangible assets. Our most significant intangible assets are related to our AVONEX and TYSABRI products. Annually, during our long-range planning cycle, we perform an analysis of anticipated lifetime revenues of AVONEX and TYSABRI. This analysis is also updated whenever we determine events or changes in circumstances would significantly affect the anticipated lifetime revenues of either product.
Our most recent long range planning cycle was completed in the third quarter of 2015. 2016.
Based upon this analysis,the above, the estimated future amortization of acquired intangible assets for the next five years is expected to be as follows:
| | | (In millions) | As of
June 30,
2016 | As of
June 30,
2017 |
| 2016 (remaining six months) | $ | 181.6 |
| |
| 2017 | 325.1 |
| |
| 2017 (remaining six months) | | $ | 222.6 |
|
| 2018 | 298.2 |
| 425.8 |
|
| 2019 | 282.7 |
| 412.5 |
|
| 2020 | 277.1 |
| 378.6 |
|
| 2021 | 265.0 |
| 239.3 |
|
| 2022 | | 216.7 |
|
Goodwill
The following table provides a roll forward of the changes in our goodwill balance:
|
| | | |
| (In millions) | As of
June 30,
2017 |
| Goodwill, beginning of period | $ | 3,669.3 |
|
| Elimination of goodwill allocated to our hemophilia business | (314.1 | ) |
| Increase to goodwill | 508.9 |
|
| Other | 6.3 |
|
| Goodwill, end of period | $ | 3,870.4 |
|
The elimination of goodwill represents an allocation based upon the relative enterprise fair value of the hemophilia business as of the distribution date. For additional information relating to the spin-off of our hemophilia business, please read Note 3, Hemophilia Spin-Off, to these condensed consolidated financial statements.
BIOGEN INC. AND SUBSIDIARIES
NOTES TO CONDENSED CONSOLIDATED FINANCIAL STATEMENTS
(unaudited, continued)
Goodwill
The following table provides a roll forward of the changes in our goodwill balance:
|
| | | |
| (In millions) | As of
June 30,
2016 |
| Goodwill, beginning of period | $ | 2,663.8 |
|
| Increase to goodwill | 515.0 |
|
| Other | (11.7 | ) |
| Goodwill, end of period | $ | 3,167.1 |
|
The increase in goodwill during the six months ended June 30, 20162017, was related to $600.0 million in contingent milestones achieved (exclusive of $85.0$91.1 million in tax benefits) and payable to the former shareholders of Fumapharm AG or holders of their rights. Other includes changes in foreign currency exchange rates. For additional information related to future contingent payments to the former shareholders of Fumapharm AG or holders of their rights, please read Note 19,21, Commitments and Contingencies, to these condensedour consolidated financial statements.statements included in our 2016 Form 10-K.
As of June 30, 2016,2017, we had no accumulated impairment losses related to goodwill.
6.7. Fair Value Measurements
The tables below present information about our assets and liabilities that are regularly measured and carried at fair value and indicate the level within the fair value hierarchy of the valuation techniques we utilized to determine such fair value:
| | | As of June 30, 2016 (In millions) | Total | | Quoted Prices in Active Markets (Level 1) | | Significant Other Observable Inputs (Level 2) | | Significant Unobservable Inputs (Level 3) | |
| As of June 30, 2017 (In millions) | | Total | | Quoted Prices in Active Markets (Level 1) | | Significant Other Observable Inputs (Level 2) | | Significant Unobservable Inputs (Level 3) |
| Assets: | | | | | | | | | | | | | | |
| Cash equivalents | $ | 874.6 |
| | $ | — |
| | $ | 874.6 |
| | $ | — |
| $ | 836.0 |
| | $ | — |
| | $ | 836.0 |
| | $ | — |
|
| Marketable debt securities: | | | | | | | | | | | | | | |
| Corporate debt securities | 2,290.3 |
| | — |
| | 2,290.3 |
| | — |
| 2,297.9 |
| | — |
| | 2,297.9 |
| | — |
|
| Government securities | 2,973.4 |
| | — |
| | 2,973.4 |
| | — |
| 1,567.8 |
| | — |
| | 1,567.8 |
| | — |
|
| Mortgage and other asset backed securities | 648.7 |
| | — |
| | 648.7 |
| | — |
| 490.5 |
| | — |
| | 490.5 |
| | — |
|
| Marketable equity securities | 32.4 |
| | 32.4 |
| | — |
| | — |
| 15.2 |
| | 15.2 |
| | — |
| | — |
|
| Derivative contracts | 30.1 |
| | — |
| | 30.1 |
| | — |
| 4.6 |
| | — |
| | 4.6 |
| | — |
|
| Plan assets for deferred compensation | 35.6 |
| | — |
| | 35.6 |
| | — |
| 32.9 |
| | — |
| | 32.9 |
| | — |
|
| Total | $ | 6,885.1 |
| | $ | 32.4 |
| | $ | 6,852.7 |
| | $ | — |
| $ | 5,244.9 |
| | $ | 15.2 |
| | $ | 5,229.7 |
| | $ | — |
|
| Liabilities: | | | | | | | | | | | | | | |
| Derivative contracts | $ | 24.8 |
| | $ | — |
| | $ | 24.8 |
| | $ | — |
| $ | 70.6 |
| | $ | — |
| | $ | 70.6 |
| | $ | — |
|
| Contingent consideration obligations | 515.7 |
| | — |
| | — |
| | 515.7 |
| 492.1 |
| | — |
| | — |
| | 492.1 |
|
| Total | $ | 540.5 |
| | $ | — |
| | $ | 24.8 |
| | $ | 515.7 |
| $ | 562.7 |
| | $ | — |
| | $ | 70.6 |
| | $ | 492.1 |
|
|
| | | | | | | | | | | | | | | |
| As of December 31, 2016 (In millions) | Total | | Quoted Prices in Active Markets (Level 1) | | Significant Other Observable Inputs (Level 2) | | Significant Unobservable Inputs (Level 3) |
| Assets: | | | | | | | |
| Cash equivalents | $ | 2,039.6 |
| | $ | — |
| | $ | 2,039.6 |
| | $ | — |
|
| Marketable debt securities: | | | | | | | |
| Corporate debt securities | 2,663.8 |
| | — |
| | 2,663.8 |
| | — |
|
| Government securities | 2,172.5 |
| | — |
| | 2,172.5 |
| | — |
|
| Mortgage and other asset backed securities | 561.7 |
| | — |
| | 561.7 |
| | — |
|
| Marketable equity securities | 24.9 |
| | 24.9 |
| | — |
| | — |
|
| Derivative contracts | 61.0 |
| | — |
| | 61.0 |
| | — |
|
| Plan assets for deferred compensation | 34.5 |
| | — |
| | 34.5 |
| | — |
|
| Total | $ | 7,558.0 |
| | $ | 24.9 |
| | $ | 7,533.1 |
| | $ | — |
|
| Liabilities: | | | | | | | |
| Derivative contracts | $ | 13.6 |
| | $ | — |
| | $ | 13.6 |
| | $ | — |
|
| Contingent consideration obligations | 467.6 |
| | — |
| | — |
| | 467.6 |
|
| Total | $ | 481.2 |
| | $ | — |
| | $ | 13.6 |
| | $ | 467.6 |
|
BIOGEN INC. AND SUBSIDIARIES
NOTES TO CONDENSED CONSOLIDATED FINANCIAL STATEMENTS
(unaudited, continued)
|
| | | | | | | | | | | | | | | |
| As of December 31, 2015 (In millions) | Total | | Quoted Prices in Active Markets (Level 1) | | Significant Other Observable Inputs (Level 2) | | Significant Unobservable Inputs (Level 3) |
| Assets: | | | | | | | |
| Cash equivalents | $ | 909.5 |
| | $ | — |
| | $ | 909.5 |
| | $ | — |
|
| Marketable debt securities: | | | | | | | |
| Corporate debt securities | 1,510.9 |
| | — |
| | 1,510.9 |
| | — |
|
| Government securities | 2,875.9 |
| | — |
| | 2,875.9 |
| | — |
|
| Mortgage and other asset backed securities | 494.1 |
| | — |
| | 494.1 |
| | — |
|
| Marketable equity securities | 37.5 |
| | 37.5 |
| | — |
| | — |
|
| Derivative contracts | 27.2 |
| | — |
| | 27.2 |
| | — |
|
| Plan assets for deferred compensation | 40.1 |
| | — |
| | 40.1 |
| | — |
|
| Total | $ | 5,895.2 |
| | $ | 37.5 |
| | $ | 5,857.7 |
| | $ | — |
|
| Liabilities: | | | | | | | |
| Derivative contracts | $ | 14.7 |
| | $ | — |
| | $ | 14.7 |
| | $ | — |
|
| Contingent consideration obligations | 506.0 |
| | — |
| | — |
| | 506.0 |
|
| Total | $ | 520.7 |
| | $ | — |
| | $ | 14.7 |
| | $ | 506.0 |
|
There have been no material impairments of our assets measured and carried at fair value during the three and six months ended June 30, 2016.2017. In addition, there were no changes in valuation techniques or inputs utilized or transfers between fair value measurement levels during the three and six months ended June 30, 2016.2017. The fair values of Level 2 instruments classified as cash equivalents and marketable debt securities were determined through third party pricing services. For a description of our validation procedures related to prices provided by third party pricing services, refer toplease read Note 1, Summary of Significant Accounting Policies: Fair Value Measurements,, to our consolidated financial statements included in our 20152016 Form 10-K.
Debt Instruments
The fair and carrying values of our debt instruments, which are Level 2 liabilities, are summarized as follows:
| | | | As of June 30, 2016 | | As of December 31, 2015 | As of June 30, 2017 | | As of December 31, 2016 |
| (In millions) | Fair Value | | Carrying Value | | Fair Value | | Carrying Value | Fair Value | | Carrying Value | | Fair Value | | Carrying Value |
| Notes payable to Fumedica | $ | 6.4 |
| | $ | 6.1 |
| | $ | 9.4 |
| | $ | 9.0 |
| |
| Notes payable to Fumedica AG | | $ | 3.3 |
| | $ | 3.3 |
| | $ | 6.1 |
| | $ | 6.0 |
|
| 6.875% Senior Notes due March 1, 2018 | 598.2 |
| | 561.9 |
| | 602.6 |
| | 565.3 |
| 569.9 |
| | 554.8 |
| | 583.7 |
| | 558.5 |
|
| 2.900% Senior Notes due September 15, 2020 | 1,561.7 |
| | 1,507.9 |
| | 1,497.5 |
| | 1,485.5 |
| 1,531.5 |
| | 1,487.4 |
| | 1,521.5 |
| | 1,485.3 |
|
| 3.625% Senior Notes due September 15, 2022 | 1,061.0 |
| | 992.7 |
| | 1,014.2 |
| | 992.2 |
| 1,051.8 |
| | 993.8 |
| | 1,026.6 |
| | 993.2 |
|
| 4.050% Senior Notes due September 15, 2025 | 1,887.3 |
| | 1,734.1 |
| | 1,764.6 |
| | 1,733.4 |
| 1,853.3 |
| | 1,735.6 |
| | 1,796.0 |
| | 1,734.8 |
|
| 5.200% Senior Notes due September 15, 2045 | 1,996.3 |
| | 1,721.3 |
| | 1,757.6 |
| | 1,721.1 |
| 1,996.2 |
| | 1,721.7 |
| | 1,874.5 |
| | 1,721.5 |
|
| Total | $ | 7,110.9 |
| | $ | 6,524.0 |
| | $ | 6,645.9 |
| | $ | 6,506.5 |
| $ | 7,006.0 |
| | $ | 6,496.6 |
| | $ | 6,808.4 |
| | $ | 6,499.3 |
|
The fair value of our notes payable to Fumedica AG was estimated using market observable inputs, including current interest and foreign currency exchange rates. The fair values of each of our series of Senior Notes were determined through market, observable and corroborated sources. For additional information related to our debt instruments, please read Note 11, Indebtedness, to our consolidated financial statements included in our 20152016 Form 10-K.
BIOGEN INC. AND SUBSIDIARIES
NOTES TO CONDENSED CONSOLIDATED FINANCIAL STATEMENTS
(unaudited, continued)
Contingent Consideration Obligations
The following table provides a roll forward of the fair values of our contingent consideration obligations whichthat includes Level 3 measurements:
| | | | For the Three Months
Ended June 30, | | For the Six Months
Ended June 30, | For the Three Months
Ended June 30, | | For the Six Months
Ended June 30, |
| (In millions) | 2016 | | 2015 | | 2016 | | 2015 | 2017 | | 2016 | | 2017 | | 2016 |
| Fair value, beginning of period | $ | 508.3 |
| | $ | 461.8 |
| | $ | 506.0 |
| | $ | 215.5 |
| $ | 470.9 |
| | $ | 508.3 |
| | $ | 467.6 |
| | $ | 506.0 |
|
| Additions | — |
| | 36.0 |
| | — |
| | 274.5 |
| — |
| | — |
| | — |
| | — |
|
| Changes in fair value | 10.6 |
| | (2.2 | ) | | 12.9 |
| | 5.6 |
| 21.2 |
| | 10.6 |
| | 31.2 |
| | 12.9 |
|
| Payments | (3.2 | ) | | — |
| | (3.2 | ) | | — |
| — |
| | (3.2 | ) | | (6.7 | ) | | (3.2 | ) |
| Fair value, end of period | $ | 515.7 |
| | $ | 495.6 |
| | $ | 515.7 |
| | $ | 495.6 |
| $ | 492.1 |
| | $ | 515.7 |
| | $ | 492.1 |
| | $ | 515.7 |
|
As of June 30, 20162017 and December 31, 2015,2016, approximately $304.0$265.8 million and $301.3$246.8 million, respectively, of our contingent consideration obligations valued using Level 3 measurements were reflected as components of other long-term liabilities in our condensed consolidated balance sheets with the remaining balances reflected as a component of accrued expenses and other.
7.BIOGEN INC. AND SUBSIDIARIES
NOTES TO CONDENSED CONSOLIDATED FINANCIAL STATEMENTS
(unaudited, continued)
8. Financial Instruments
The following table summarizes our financial assets with maturities of less than 90 days from the date of purchase included in cash and cash equivalents on the accompanying condensed consolidated balance sheet:sheets:
| | | (In millions) | As of
June 30,
2016 | | As of
December 31,
2015 | As of
June 30,
2017 | | As of
December 31,
2016 |
| Commercial paper | $ | 56.9 |
| | $ | 21.9 |
| $ | 74.4 |
| | $ | 31.0 |
|
| Overnight reverse repurchase agreements | 66.3 |
| | 134.7 |
| 22.8 |
| | — |
|
| Money market funds | 531.5 |
| | 673.8 |
| 605.5 |
| | 741.7 |
|
| Short-term debt securities | 219.9 |
| | 79.1 |
| 133.3 |
| | 1,266.9 |
|
| Total | $ | 874.6 |
| | $ | 909.5 |
| $ | 836.0 |
| | $ | 2,039.6 |
|
The carrying values of our commercial paper, including accrued interest, overnight reverse repurchase agreements, money market funds and our short-term debt securities approximate fair value due to their short-term maturities. Our overnight reverse repurchase agreements are collateralized with agency-guaranteed mortgage-backed securities and represent approximately 0.3% and 0.7% of total assets as of June 30, 2016 and December 31, 2015, respectively.
The following tables summarize our marketable debt and equity securities, classified as available-for-sale:
| | | As of June 30, 2016 (In millions) | Fair Value | | Gross Unrealized Gains | | Gross Unrealized Losses | | Amortized Cost | |
| As of June 30, 2017 (In millions) | | Fair Value | | Gross Unrealized Gains | | Gross Unrealized Losses | | Amortized Cost |
| Corporate debt securities | | | | | | | | | | | | | | |
| Current | $ | 913.4 |
| | $ | 0.3 |
| | $ | (0.2 | ) | | $ | 913.3 |
| $ | 988.9 |
| | $ | 0.1 |
| | $ | (0.5 | ) | | $ | 989.3 |
|
| Non-current | 1,376.9 |
| | 7.8 |
| | (0.4 | ) | | 1,369.5 |
| 1,309.0 |
| | 1.9 |
| | (2.5 | ) | | 1,309.6 |
|
| Government securities | | | | | | | | | | | | | | |
| Current | 1,521.3 |
| | 0.6 |
| | — |
| | 1,520.7 |
| 732.9 |
| | — |
| | (0.9 | ) | | 733.8 |
|
| Non-current | 1,452.1 |
| | 3.1 |
| | (0.6 | ) | | 1,449.6 |
| 834.9 |
| | 0.4 |
| | (3.3 | ) | | 837.8 |
|
| Mortgage and other asset backed securities | | | | | | | | | | | | | | |
| Current | 0.1 |
| | — |
| | — |
| | 0.1 |
| 1.7 |
| | — |
| | — |
| | 1.7 |
|
| Non-current | 648.6 |
| | 1.4 |
| | (0.9 | ) | | 648.1 |
| 488.8 |
| | 1.1 |
| | (1.2 | ) | | 488.9 |
|
| Total marketable debt securities | $ | 5,912.4 |
| | $ | 13.2 |
| | $ | (2.1 | ) | | $ | 5,901.3 |
| $ | 4,356.2 |
| | $ | 3.5 |
| | $ | (8.4 | ) | | $ | 4,361.1 |
|
| Marketable equity securities, non-current | $ | 32.4 |
| | $ | 0.9 |
| | $ | (2.1 | ) | | $ | 33.6 |
| $ | 15.2 |
| | $ | 0.1 |
| | $ | (3.3 | ) | | $ | 18.4 |
|
|
| | | | | | | | | | | | | | | |
| As of December 31, 2016 (In millions) | Fair Value | | Gross Unrealized Gains | | Gross Unrealized Losses | | Amortized Cost |
| Corporate debt securities | | | | | | | |
| Current | $ | 1,408.6 |
| | $ | 0.2 |
| | $ | (0.6 | ) | | $ | 1,409.0 |
|
| Non-current | 1,255.2 |
| | 1.2 |
| | (4.7 | ) | | 1,258.7 |
|
| Government securities | | | | | | | |
| Current | 1,156.0 |
| | 0.2 |
| | (0.3 | ) | | 1,156.1 |
|
| Non-current | 1,016.5 |
| | 0.5 |
| | (3.4 | ) | | 1,019.4 |
|
| Mortgage and other asset backed securities | | | | | | | |
| Current | 4.0 |
| | — |
| | — |
| | 4.0 |
|
| Non-current | 557.7 |
| | 0.8 |
| | (2.2 | ) | | 559.1 |
|
| Total marketable debt securities | $ | 5,398.0 |
| | $ | 2.9 |
| | $ | (11.2 | ) | | $ | 5,406.3 |
|
| Marketable equity securities, non-current | $ | 24.9 |
| | $ | 0.7 |
| | $ | (9.3 | ) | | $ | 33.5 |
|
BIOGEN INC. AND SUBSIDIARIES
NOTES TO CONDENSED CONSOLIDATED FINANCIAL STATEMENTS
(unaudited, continued)
|
| | | | | | | | | | | | | | | |
| As of December 31, 2015 (In millions) | Fair Value | | Gross Unrealized Gains | | Gross Unrealized Losses | | Amortized Cost |
| Corporate debt securities | | | | | | | |
| Current | $ | 394.3 |
| | $ | — |
| | $ | (0.5 | ) | | $ | 394.8 |
|
| Non-current | 1,116.6 |
| | 0.1 |
| | (4.1 | ) | | 1,120.6 |
|
| Government securities | | | | | | | |
| Current | 1,723.4 |
| | 0.1 |
| | (1.1 | ) | | 1,724.4 |
|
| Non-current | 1,152.5 |
| | — |
| | (3.1 | ) | | 1,155.6 |
|
| Mortgage and other asset backed securities | | | | | | | |
| Current | 2.8 |
| | — |
| | — |
| | 2.8 |
|
| Non-current | 491.3 |
| | 0.1 |
| | (1.8 | ) | | 493.0 |
|
| Total marketable debt securities | $ | 4,880.9 |
| | $ | 0.3 |
| | $ | (10.6 | ) | | $ | 4,891.2 |
|
| Marketable equity securities, non-current | $ | 37.5 |
| | $ | 9.2 |
| | $ | — |
| | $ | 28.3 |
|
Summary of Contractual Maturities: Available-for-Sale Securities
The estimated fair value and amortized cost of our marketable debt securities available-for-sale by contractual maturity are summarized as follows:
| | | | As of June 30, 2016 | | As of December 31, 2015 | As of June 30, 2017 | | As of December 31, 2016 |
| (In millions) | Estimated Fair Value | | Amortized Cost | | Estimated Fair Value | | Amortized Cost | Estimated Fair Value | | Amortized Cost | | Estimated Fair Value | | Amortized Cost |
| Due in one year or less | $ | 2,434.8 |
| | $ | 2,434.1 |
| | $ | 2,120.5 |
| | $ | 2,122.0 |
| $ | 1,723.5 |
| | $ | 1,724.8 |
| | $ | 2,568.6 |
| | $ | 2,569.1 |
|
| Due after one year through five years | 3,255.9 |
| | 3,245.4 |
| | 2,575.9 |
| | 2,583.9 |
| 2,377.6 |
| | 2,381.1 |
| | 2,552.6 |
| | 2,559.7 |
|
| Due after five years | 221.7 |
| | 221.8 |
| | 184.5 |
| | 185.3 |
| 255.1 |
| | 255.2 |
| | 276.8 |
| | 277.5 |
|
| Total available-for-sale securities | $ | 5,912.4 |
| | $ | 5,901.3 |
| | $ | 4,880.9 |
| | $ | 4,891.2 |
| $ | 4,356.2 |
| | $ | 4,361.1 |
| | $ | 5,398.0 |
| | $ | 5,406.3 |
|
The average maturity of our marketable debt securities available-for-sale as of June 30, 20162017 and December 31, 20152016, was approximately 1317 months and 1612 months, respectively.
Proceeds from Marketable Debt Securities
The proceeds from maturities and sales of marketable debt securities and resulting realized gains and losses are summarized as follows:
| | | | For the Three Months
Ended June 30, | | For the Six Months
Ended June 30, | For the Three Months
Ended June 30, | | For the Six Months
Ended June 30, |
| (In millions) | 2016 | | 2015 | | 2016 | | 2015 | 2017 | | 2016 | | 2017 | | 2016 |
| Proceeds from maturities and sales | $ | 1,642.5 |
| | $ | 601.9 |
| | $ | 2,823.6 |
| | $ | 975.5 |
| $ | 1,700.2 |
| | $ | 1,642.5 |
| | $ | 3,584.5 |
| | $ | 2,823.6 |
|
| Realized gains | $ | 0.6 |
| | $ | 0.3 |
| | $ | 1.0 |
| | $ | 0.5 |
| $ | 1.2 |
| | $ | 0.6 |
| | $ | 2.4 |
| | $ | 1.0 |
|
| Realized losses | $ | (1.2 | ) | | $ | (0.5 | ) | | $ | (1.6 | ) | | $ | (0.8 | ) | $ | (1.3 | ) | | $ | (1.2 | ) | | $ | (3.2 | ) | | $ | (1.6 | ) |
Strategic Investments
As of June 30, 20162017 and December 31, 2015,2016, our strategic investment portfolio was comprised of investments totaling $98.3$95.6 million and $96.0$99.9 million, respectively, which are included in investments and other assets in our condensed consolidated balance sheets. Our strategic investment portfolio includes investments in equity securities of certain biotechnology companies and investments in venture capital funds where the underlying investments are in equity securities of biotechnology companies.
BIOGEN INC. AND SUBSIDIARIES
NOTES TO CONDENSED CONSOLIDATED FINANCIAL STATEMENTS
(unaudited, continued)
8.9. Derivative Instruments
Foreign Currency Forward Contracts - Hedging Instruments
Due to the global nature of our operations, portions of our revenues and operating expenses are recorded in currencies other than the U.S. dollar. The value of revenues and operating expenses measured in U.S. dollars is therefore subject to changes in foreign currency exchange rates. In order to mitigate these changes we use foreign currency forward contracts to lock in exchange rates associated with a portion of our forecasted international revenues and operating expenses.
Foreign currency forward contracts in effect as of June 30, 20162017 and December 31, 20152016, had durations of 1 to 24 months and 1 to 18 months.months, respectively. These contracts have been designated as cash flow hedges, and, accordingly, to the extent effective, any unrealized gains or losses on these foreign currency forward contracts are reported in accumulated other comprehensive income (loss) (referred to as AOCI in the tables below). Realized gains and losses for the effective portion of such contracts are recognized in revenue when the sale of product in the currency being hedged is recognized and beginning in the fourth quarter 2015, in operating expenses when the expense in the currency being hedged is recorded. To the extent ineffective, hedge transaction gains and losses are reported in other income (expense), net.
BIOGEN INC. AND SUBSIDIARIES
NOTES TO CONDENSED CONSOLIDATED FINANCIAL STATEMENTS
(unaudited, continued)
The notional value of foreign currency forward contracts that were entered into to hedge forecasted revenues and operating expenses is summarized as follows:
| | | | Notional Amount | Notional Amount |
| Foreign Currency: (In millions) | As of
June 30,
2016 | | As of
December 31,
2015 | As of
June 30,
2017 | | As of
December 31,
2016 |
| Euro | $ | 1,126.5 |
| | $ | 945.5 |
| $ | 1,772.5 |
| | $ | 871.7 |
|
| Swiss francs | 43.5 |
| | 80.8 |
| |
| British pound | | 77.4 |
| | — |
|
| Canadian dollar | 39.9 |
| | 76.7 |
| 39.2 |
| | — |
|
| Swiss franc | | 32.1 |
| | — |
|
| Total foreign currency forward contracts | $ | 1,209.9 |
| | $ | 1,103.0 |
| $ | 1,921.2 |
| | $ | 871.7 |
|
The portion of the fair value of these foreign currency forward contracts that was included in accumulated other comprehensive income (loss) in total equity reflected net losses of $16.4$77.4 million and net gains of $1.8$49.8 million as of June 30, 20162017 and December 31, 2015,2016, respectively. We expect all contracts outstanding as of June 30, 2017, to be settled over the next 1824 months and any amounts in accumulated other comprehensive income (loss) to be reported as an adjustment to revenue or operating expense. We consider the impact of our and our counterparties’ credit risk on the fair value of the contracts as well as the ability of each party to execute its contractual obligations. As of June 30, 20162017 and December 31, 2015,2016, credit risk did not change the fair value of our foreign currency forward contracts.
The following tables summarize the effect of foreign currency forward contracts designated as hedging instruments on our condensed consolidated statements of income:
|
| | | | | | | | | | | | | | | | | | |
| For the Three Months Ended June 30, |
Net Gains/(Losses) Reclassified from AOCI into Operating Income (Effective Portion) | | Net Gains/(Losses) Recognized into Net Income (Ineffective Portion) |
| Location | | 2016 | | 2015 | | Location | | 2016 | | 2015 |
| Revenue | | $ | (4.3 | ) | | $ | 40.4 |
| | Other income (expense) | | $ | 2.1 |
| | $ | 1.2 |
|
| Operating expenses | | $ | (0.1 | ) | | $ | — |
| | Other income (expense) | | $ | — |
| | $ | — |
|
BIOGEN INC. AND SUBSIDIARIES
NOTES TO CONDENSED CONSOLIDATED FINANCIAL STATEMENTS
(unaudited, continued)
|
| | | | | | | | | | | | | | | | | | |
| For the Three Months Ended June 30, |
Net Gains/(Losses) Reclassified from AOCI into Operating Income (Effective Portion) | | Net Gains/(Losses) Recognized into Net Income (Ineffective Portion) |
| Location | | 2017 | | 2016 | | Location | | 2017 | | 2016 |
| Revenue | | $ | (3.0 | ) | | $ | (4.3 | ) | | Other income (expense) | | $ | 2.0 |
| | $ | 2.1 |
|
| Operating expenses | | $ | 0.3 |
| | $ | (0.1 | ) | | Other income (expense) | | $ | (0.1 | ) | | $ | — |
|
| | For the Six Months Ended June 30, | Net Gains/(Losses) Reclassified from AOCI into Operating Income (Effective Portion) | Net Gains/(Losses) Reclassified from AOCI into Operating Income (Effective Portion) | | Net Gains/(Losses) Recognized into Net Income (Ineffective Portion) | Net Gains/(Losses) Reclassified from AOCI into Operating Income (Effective Portion) | | Net Gains/(Losses) Recognized into Net Income (Ineffective Portion) |
| Location | | 2016 | | 2015 | | Location | | 2016 | | 2015 | | 2017 | | 2016 | | Location | | 2017 | | 2016 |
| Revenue | | $ | 4.5 |
| | $ | 75.4 |
| | Other income (expense) | | $ | 4.0 |
| | $ | 3.4 |
| | $ | 3.7 |
| | $ | 4.5 |
| | Other income (expense) | | $ | 6.0 |
| | $ | 4.0 |
|
| Operating expenses | | $ | (0.2 | ) | | $ | — |
| | Other income (expense) | | $ | (0.3 | ) | | $ | — |
| | $ | 0.2 |
| | $ | (0.2 | ) | | Other income (expense) | | $ | (0.3 | ) | | $ | (0.3 | ) |
Interest Rate Contracts - Hedging Instruments
We have entered into interest rate swap contracts on certain borrowing transactions to manage our exposure to interest rate changes.
In connection with the issuance of our 2.90% Senior Notes, we entered into interest rate swaps with an aggregate notional amount of $675.0 million, which expire on September 15, 2020. The interest rate swap contracts are designated as hedges of the fair value changes in the 2.90% Senior Notes attributable to changes in interest rates. Since the specific terms and notional amount of the swaps match the debt being hedged, it is assumed to be a highly effective hedge and all changes in the fair value of the swaps are recorded as a component of theour 2.90% Senior Notes with no net impact recorded in income. Any net interest payments made or received on the interest rate swap contracts are recognized as a component of interest expense in our condensed consolidated statements of income.
BIOGEN INC. AND SUBSIDIARIES
NOTES TO CONDENSED CONSOLIDATED FINANCIAL STATEMENTS
(unaudited, continued)
Foreign Currency Forward Contracts - Other Derivatives
We also enter into other foreign currency forward contracts, usually with durations of one month or less, to mitigate the foreign currency risk related to certain balance sheet positions. We have not elected hedge accounting for these transactions.
The aggregate notional amount of these outstanding foreign currency contracts was $557.2$355.0 million and $721.0$902.1 million as of June 30, 20162017 and December 31, 2015,2016, respectively. Net lossesgains of $18.6$6.1 million and $16.2$4.5 million related to these contracts were recognized as a component of other income (expense), net for the three and six months ended June 30, 2016,2017, respectively, as compared to net gainslosses of $13.6$18.6 million and $3.9$16.2 million, respectively, in the prior year comparative periods.
BIOGEN INC. AND SUBSIDIARIES
NOTES TO CONDENSED CONSOLIDATED FINANCIAL STATEMENTS
(unaudited, continued)
Summary of Derivatives
While certain of our derivatives are subject to netting arrangements with our counterparties, we do not offset derivative assets and liabilities in our condensed consolidated balance sheets.
The following table summarizes the fair value and presentation in our condensed consolidated balance sheets of our outstanding derivatives, including those designated as hedging instruments:
| | | | | Fair Value | | Fair Value |
| (In millions) | Balance Sheet Location | As of June 30, 2016 | Balance Sheet Location | As of June 30, 2017 |
| Hedging Instruments: | | | | |
| Asset derivatives | Other current assets | $ | 2.0 |
| Other current assets | $ | 1.9 |
|
| | Investments and other assets | $ | 23.6 |
| |
| Liability derivatives | Accrued expenses and other | $ | 14.8 |
| Accrued expenses and other | $ | 40.8 |
|
| | Other long-term liabilities | $ | — |
| Other long-term liabilities | $ | 29.5 |
|
| Other Derivatives: | | | | |
| Asset derivatives | Other current assets | $ | 4.5 |
| Other current assets | $ | 2.7 |
|
| Liability derivatives | Accrued expenses and other | $ | 10.0 |
| Accrued expenses and other | $ | 0.3 |
|
| | | | | |
| | | Fair Value | | Fair Value |
| (In millions) | Balance Sheet Location | As of December 31, 2015 | Balance Sheet Location | As of December 31, 2016 |
| Hedging Instruments: | | | | |
| Asset derivatives | Other current assets | $ | 16.6 |
| Other current assets | $ | 50.4 |
|
| | Investments and other assets | $ | 0.3 |
| Investments and other assets | $ | 6.6 |
|
| Liability derivatives | Accrued expenses and other | $ | 10.2 |
| Other long-term liabilities | $ | 4.6 |
|
| | Other long-term liabilities | $ | 2.5 |
| |
| Other Derivatives: | | | | |
| Asset derivatives | Other current assets | $ | 10.3 |
| Other current assets | $ | 4.0 |
|
| Liability derivatives | Accrued expenses and other | $ | 2.0 |
| Accrued expenses and other | $ | 9.0 |
|
9.10. Property, Plant and Equipment
Property, plant and equipment are recorded at historical cost, net of accumulated depreciation. Accumulated depreciation on property, plant and equipment was $1,471.0$1,511.4 million and $1,330.1$1,439.3 million as of June 30, 20162017 and December 31, 2015,2016, respectively.
Solothurn, Switzerland Facility
On December 1, 2015,During the first quarter of 2016 we purchased land in Solothurn, Switzerland for 64.4 million Swiss Francs (approximately $62.5 million). We, where we are building a biologics manufacturing facility on this land in the Commune of Luterbach over the next several years. As of June 30, 20162017 and December 31, 2015,2016, we had approximately $247.8$798.1 million and $99.0$481.5 million, respectively, capitalized as construction in progress related to the construction of this facility.
Cambridge, MA Manufacturing Facility
In June 2016, as a result of an evaluation of our manufacturing capabilities and capacity needs based on current and expected future demand, we determined that we intend to cease manufacturing in Cambridge, MA and vacate our 67,000 square foot small-scale biologics manufacturing facility in Cambridge, MA and 46,000 square foot warehouse space in Somerville, MA by the end of 2016.
We are currently considering alternatives for the facility, which may include a sale of our rights to the facility and related assets. In the event we are unsuccessful with a sale, we will close the facility by December 31, 2016.
As of June 30, 2016,2017, we had contractual commitments of approximately $258.2 million for the carrying valueconstruction of associated assets totaled approximately $43.0 million and our remaining lease obligation related to these facilities totaled $26.3 million.this facility.
BIOGEN INC. AND SUBSIDIARIES
NOTES TO CONDENSED CONSOLIDATED FINANCIAL STATEMENTS
(unaudited, continued)
An impairment assessment as of June 30, 2016 was performed related to the assets, which resulted in no impairments.
The anticipated departure from these facilities has shortened the expected useful lives of certain leasehold improvements and other assets at these facilities. As a result, we recorded additional depreciation expense to reflect the assets' new shorter useful lives. As of June 30, 2016, we recognized approximately $15.8 million of this additional depreciation, which was recorded as cost of sales in our condensed consolidated statements of income.
10.11. Equity
Total equity as of June 30, 2016 increased $2,028.82017, decreased $555.0 million compared to December 31, 2015.2016. This increasedecrease was primarily driven by share repurchases totaling approximately $1.4 billion, as described below, and an adjustment to retained earnings of $852.8 million reflecting the spin-off of our hemophilia business, as described in Note 3, Hemophilia Spin-Off, to these condensed consolidated financial statements. These decreases were partially offset by net income attributable to Biogen Inc. of $2,020.7 million and an increase in additional paid in capital related to our share-based compensation arrangements, partially offset by other comprehensive losses.$1.6 billion.
Share Repurchases
In July 2016 our Board of Directors authorized a program to repurchase up to $5.0 billion of our common stock (2016 Share Repurchase Program). This authorization does not have an expiration date. Repurchased sharesAll share repurchases under this authorization will be retired. The 2016 Share Repurchase Program is in addition to the approximately 1.3Under this program, we repurchased and retired 2.9 million and 3.7 million shares remaining under our February 2011 Share Repurchase Program (2011 Share Repurchase Program), which has been used principally to offsetof common stock issuances under our share-based compensation plans. Duringat a cost of $781.8 million and $1.0 billion during the three and six months ended June 30, 2016 and 2015, we did not2017, respectively. As of June 30, 2017, approximately $3.0 billion remains available to repurchase any shares of common stock under our 2011 Share Repurchase Program.this authorization.
In May 2015,February 2011 our Board of Directors authorized a program to repurchase up to $5.0 billion20.0 million shares of our common stock, which was completed as of DecemberMarch 31, 2015.2017. During the six months ended June 30, 2015,2017, we repurchased and retired 0.11.3 million shares of common stock at a cost of $42.2 million.$365.4 million under this program. During the three and six months ended June 30, 2016, we did not repurchase any shares of common stock under this program.
Noncontrolling Interests
The following table reconciles equity (deficit) attributable to noncontrolling interests (NCI):
| | | | For the Three Months
Ended June 30, | | For the Six Months
Ended June 30, | For the Three Months
Ended June 30, | | For the Six Months
Ended June 30, |
| (In millions) | 2016 | | 2015 | | 2016 | | 2015 | 2017 | | 2016 | | 2017 | | 2016 |
| NCI, beginning of period | $ | 1.3 |
| | $ | 2.7 |
| | $ | 2.1 |
| | $ | 5.0 |
| $ | (11.6 | ) | | $ | 1.3 |
| | $ | (11.5 | ) | | $ | 2.1 |
|
| Net income (loss) attributable to NCI, net of tax | (1.4 | ) | | (2.5 | ) | | (3.1 | ) | | (4.8 | ) | — |
| | (1.4 | ) | | (0.1 | ) | | (3.1 | ) |
| Fair value of net assets and liabilities acquired and assigned to NCI | — |
| | — |
| | 0.9 |
| | — |
| — |
| | — |
| | — |
| | 0.9 |
|
| Translation adjustment and other | — |
| | 0.2 |
| | — |
| | 0.2 |
| |
| NCI, end of period | $ | (0.1 | ) | | $ | 0.4 |
| | $ | (0.1 | ) | | $ | 0.4 |
| $ | (11.6 | ) | | $ | (0.1 | ) | | $ | (11.6 | ) | | $ | (0.1 | ) |
BIOGEN INC. AND SUBSIDIARIES
NOTES TO CONDENSED CONSOLIDATED FINANCIAL STATEMENTS
(unaudited, continued)
11.12. Accumulated Other Comprehensive Income (Loss)
The following table summarizes the changes in accumulated other comprehensive income (loss), net of tax by component:
|
| | | | | | | | | | | | | | | | | | | |
| (In millions) | Unrealized Gains (Losses) on Securities Available for Sale | | Unrealized Gains (Losses) on Cash Flow Hedges | | Unfunded Status of Postretirement Benefit Plans | | Translation Adjustments | | Total |
| Balance, as of December 31, 2015 | $ | (0.8 | ) | | $ | 10.2 |
| | $ | (37.8 | ) | | $ | (195.6 | ) | | $ | (224.0 | ) |
| Other comprehensive income (loss) before reclassifications | 6.6 |
| | (13.9 | ) | | 0.9 |
| | (48.4 | ) | | (54.8 | ) |
| Amounts reclassified from accumulated other comprehensive income (loss) | 0.4 |
| | (4.4 | ) | | — |
| | — |
| | (4.0 | ) |
| Net current period other comprehensive income (loss) | 7.0 |
| | (18.3 | ) | | 0.9 |
| | (48.4 | ) | | (58.8 | ) |
| Balance, as of June 30, 2016 | $ | 6.2 |
| | $ | (8.1 | ) | | $ | (36.9 | ) | | $ | (244.0 | ) | | $ | (282.8 | ) |
|
| | | | | | | | | | | | | | | | | | | |
| (In millions) | Unrealized Gains (Losses) on Securities Available for Sale | | Unrealized Gains (Losses) on Cash Flow Hedges | | Unfunded Status of Postretirement Benefit Plans | | Translation Adjustments | | Total |
| Balance, as of December 31, 2014 | $ | (0.4 | ) | | $ | 71.7 |
| | $ | (31.6 | ) | | $ | (99.2 | ) | | $ | (59.5 | ) |
| Other comprehensive income (loss) before reclassifications | 0.9 |
| | 66.1 |
| | 4.1 |
| | (37.8 | ) | | 33.3 |
|
| Amounts reclassified from accumulated other comprehensive income (loss) | 0.2 |
| | (75.0 | ) | | — |
| | — |
| | (74.8 | ) |
| Net current period other comprehensive income (loss) | 1.1 |
| | (8.9 | ) | | 4.1 |
| | (37.8 | ) | | (41.5 | ) |
| Balance, as of June 30, 2015 | $ | 0.7 |
| | $ | 62.8 |
| | $ | (27.5 | ) | | $ | (137.0 | ) | | $ | (101.0 | ) |
The following table summarizes the amounts reclassified from accumulated other comprehensive income:
|
| | | | | | | | | | | | | | | | |
| (In millions) | Income Statement Location | Amounts Reclassified from Accumulated Other Comprehensive Income |
For the Three Months
Ended June 30, | | For the Six Months
Ended June 30, |
| 2016 | | 2015 | | 2016 | | 2015 |
| Gains (losses) on securities available for sale | Other income (expense) | $ | (0.6 | ) | | $ | (0.2 | ) | | $ | (0.6 | ) | | $ | (0.3 | ) |
| | Income tax benefit (expense) | 0.2 |
| | 0.1 |
| | 0.2 |
| | 0.1 |
|
| | | | | | | | | |
| Gains (losses) on cash flow hedges | Revenues | (4.3 | ) | | 40.4 |
| | 4.5 |
| | 75.4 |
|
| | Operating expenses | (0.1 | ) | | — |
| | (0.2 | ) | | — |
|
| | Other income (expense) | — |
| | — |
| | 0.1 |
| | — |
|
| | Income tax benefit (expense) | 0.1 |
| | (0.2 | ) | | — |
| | (0.4 | ) |
| | | | | | | | | |
| Total reclassifications, net of tax | | $ | (4.7 | ) | | $ | 40.1 |
| | $ | 4.0 |
| | $ | 74.8 |
|
BIOGEN INC. AND SUBSIDIARIES
NOTES TO CONDENSED CONSOLIDATED FINANCIAL STATEMENTS
(unaudited, continued)
12. Earnings per Share
Basic and diluted earnings per share are calculated as follows:
|
| | | | | | | | | | | | | | | |
| | For the Three Months
Ended June 30, | | For the Six Months
Ended June 30, |
| (In millions) | 2016 | | 2015 | | 2016 | | 2015 |
| Numerator: | | | | | | | |
| Net income attributable to Biogen Inc. | $ | 1,049.8 |
| | $ | 927.3 |
| | $ | 2,020.7 |
| | $ | 1,749.8 |
|
| Denominator: | | | | | | | |
| Weighted average number of common shares outstanding | 219.1 |
| | 235.3 |
| | 219.0 |
| | 235.1 |
|
| Effect of dilutive securities: | | | | | | | |
| Stock options and employee stock purchase plan | 0.1 |
| | 0.1 |
| | 0.1 |
| | 0.1 |
|
| Time-vested restricted stock units | 0.1 |
| | 0.2 |
| | 0.1 |
| | 0.3 |
|
| Market stock units | 0.1 |
| | 0.1 |
| | 0.1 |
| | 0.2 |
|
| Dilutive potential common shares | 0.3 |
| | 0.4 |
| | 0.3 |
| | 0.6 |
|
| Shares used in calculating diluted earnings per share | 219.4 |
| | 235.7 |
| | 219.3 |
| | 235.7 |
|
Amounts excluded from the calculation of net income per diluted share because their effects were anti-dilutive were insignificant.
13. Share-based Payments
Share-based Compensation Expense
The following table summarizes share-based compensation expense included in our condensed consolidated statements of income:
|
| | | | | | | | | | | | | | | |
| | For the Three Months
Ended June 30, | | For the Six Months
Ended June 30, |
| (In millions) | 2016 | | 2015 | | 2016 | | 2015 |
| Research and development | $ | 21.5 |
| | $ | 22.1 |
| | $ | 42.9 |
| | $ | 57.5 |
|
| Selling, general and administrative | 28.7 |
| | 26.2 |
| | 63.4 |
| | 81.8 |
|
| Restructuring charges | — |
| | — |
| | (1.8 | ) | | — |
|
| Subtotal | 50.2 |
| | 48.3 |
| | 104.5 |
| | 139.3 |
|
| Capitalized share-based compensation costs | (4.4 | ) | | (2.2 | ) | | (7.5 | ) | | (5.6 | ) |
| Share-based compensation expense included in total cost and expenses | 45.8 |
| | 46.1 |
| | 97.0 |
| | 133.7 |
|
| Income tax effect | (12.7 | ) | | (12.9 | ) | | (27.9 | ) | | (39.6 | ) |
| Share-based compensation expense included in net income attributable to Biogen Inc. | $ | 33.1 |
| | $ | 33.2 |
| | $ | 69.1 |
| | $ | 94.1 |
|
|
| | | | | | | | | | | | | | | | | | | |
| (In millions) | Unrealized Gains (Losses) on Securities Available for Sale, Net of Tax | | Unrealized Gains (Losses) on Cash Flow Hedges, Net of Tax | | Unfunded Status of Postretirement Benefit Plans, Net of Tax | | Translation Adjustments | | Total |
| Balance, as of December 31, 2016 | $ | (10.8 | ) | | $ | 57.8 |
| | $ | (32.7 | ) | | $ | (334.2 | ) | | $ | (319.9 | ) |
| Other comprehensive income (loss) before reclassifications | 5.1 |
| | (122.8 | ) | | (0.5 | ) | | 102.8 |
| | (15.4 | ) |
| Amounts reclassified from accumulated other comprehensive income (loss) | 0.5 |
| | (4.0 | ) | | — |
| | — |
| | (3.5 | ) |
| Net current period other comprehensive income (loss) | 5.6 |
| | (126.8 | ) | | (0.5 | ) | | 102.8 |
| | (18.9 | ) |
| Balance, as of June 30, 2017 | $ | (5.2 | ) | | $ | (69.0 | ) | | $ | (33.2 | ) | | $ | (231.4 | ) | | $ | (338.8 | ) |
BIOGEN INC. AND SUBSIDIARIES
NOTES TO CONDENSED CONSOLIDATED FINANCIAL STATEMENTS
(unaudited, continued)
|
| | | | | | | | | | | | | | | | | | | |
| (In millions) | Unrealized Gains (Losses) on Securities Available for Sale, Net of Tax | | Unrealized Gains (Losses) on Cash Flow Hedges, Net of Tax | | Unfunded Status of Postretirement Benefit Plans, Net of Tax | | Translation Adjustments | | Total |
| Balance, as of December 31, 2015 | $ | (0.8 | ) | | $ | 10.2 |
| | $ | (37.8 | ) | | $ | (195.6 | ) | | $ | (224.0 | ) |
| Other comprehensive income (loss) before reclassifications | 6.6 |
| | (13.9 | ) | | 0.9 |
| | (48.4 | ) | | (54.8 | ) |
| Amounts reclassified from accumulated other comprehensive income (loss) | 0.4 |
| | (4.4 | ) | | — |
| | — |
| | (4.0 | ) |
| Net current period other comprehensive income (loss) | 7.0 |
| | (18.3 | ) | | 0.9 |
| | (48.4 | ) | | (58.8 | ) |
| Balance, as of June 30, 2016 | $ | 6.2 |
| | $ | (8.1 | ) | | $ | (36.9 | ) | | $ | (244.0 | ) | | $ | (282.8 | ) |
The following table summarizes the amounts reclassified from accumulated other comprehensive income:
|
| | | | | | | | | | | | | | | | |
| (In millions) | Income Statement Location | Amounts Reclassified from Accumulated Other Comprehensive Income |
For the Three Months
Ended June 30, | | For the Six Months
Ended June 30, |
| 2017 | | 2016 | | 2017 | | 2016 |
| Gains (losses) on securities available for sale | Other income (expense) | $ | (0.1 | ) | | $ | (0.6 | ) | | $ | (0.8 | ) | | $ | (0.6 | ) |
| | Income tax benefit (expense) | — |
| | 0.2 |
| | 0.3 |
| | 0.2 |
|
| | | | | | | | | |
| Gains (losses) on cash flow hedges | Revenues | (3.0 | ) | | (4.3 | ) | | 3.7 |
| | 4.5 |
|
| | Operating expenses | 0.3 |
| | (0.1 | ) | | 0.2 |
| | (0.2 | ) |
| | Other income (expense) | — |
| | — |
| | 0.1 |
| | 0.1 |
|
| | Income tax benefit (expense) | — |
| | 0.1 |
| | — |
| | — |
|
| | | | | | | | | |
| Total reclassifications, net of tax | | $ | (2.8 | ) | | $ | (4.7 | ) | | $ | 3.5 |
| | $ | 4.0 |
|
13. Earnings per Share
Basic and diluted earnings per share are calculated as follows:
|
| | | | | | | | | | | | | | | |
| | For the Three Months
Ended June 30, | | For the Six Months
Ended June 30, |
| (In millions) | 2017 | | 2016 | | 2017 | | 2016 |
| Numerator: | | | | | | | |
| Net income attributable to Biogen Inc. | $ | 862.8 |
| | $ | 1,049.8 |
| | $ | 1,610.4 |
| | $ | 2,020.7 |
|
| Denominator: | | | | | | | |
| Weighted-average number of common shares outstanding | 211.9 |
| | 219.1 |
| | 213.7 |
| | 219.0 |
|
| Effect of dilutive securities: | | | | | | | |
| Stock options and employee stock purchase plan | 0.1 |
| | 0.1 |
| | — |
| | 0.1 |
|
| Time-vested restricted stock units | 0.1 |
| | 0.1 |
| | 0.2 |
| | 0.1 |
|
| Market stock units | 0.1 |
| | 0.1 |
| | 0.1 |
| | 0.1 |
|
| Dilutive potential common shares | 0.3 |
| | 0.3 |
| | 0.3 |
| | 0.3 |
|
| Shares used in calculating diluted earnings per share | 212.2 |
| | 219.4 |
| | 214.0 |
| | 219.3 |
|
BIOGEN INC. AND SUBSIDIARIES
NOTES TO CONDENSED CONSOLIDATED FINANCIAL STATEMENTS
(unaudited, continued)
Amounts excluded from the calculation of net income per diluted share because their effects were anti-dilutive were insignificant.
The adjustments related to the spin-off of our hemophilia business did not have a material impact on the potentially dilutive securities to be considered in the calculation of diluted earnings per share of common stock.
14. Share-based Payments
Share-based Compensation Expense
The following table summarizes share-based compensation expense included in our condensed consolidated statements of income:
|
| | | | | | | | | | | | | | | |
| | For the Three Months
Ended June 30, | | For the Six Months
Ended June 30, |
| (In millions) | 2017 | | 2016 | | 2017 | | 2016 |
| Research and development | $ | 17.5 |
| | $ | 21.5 |
| | $ | 36.2 |
| | $ | 42.9 |
|
| Selling, general and administrative | 18.9 |
| | 28.7 |
| | 48.3 |
| | 63.4 |
|
| Restructuring charges | — |
| | — |
| | — |
| | (1.8 | ) |
| Subtotal | 36.4 |
| | 50.2 |
| | 84.5 |
| | 104.5 |
|
| Capitalized share-based compensation costs | (2.4 | ) | | (4.4 | ) | | (5.1 | ) | | (7.5 | ) |
| Share-based compensation expense included in total cost and expenses | 34.0 |
| | 45.8 |
| | 79.4 |
| | 97.0 |
|
| Income tax effect | (8.5 | ) | | (12.7 | ) | | (20.9 | ) | | (27.9 | ) |
| Share-based compensation expense included in net income attributable to Biogen Inc. | $ | 25.5 |
| | $ | 33.1 |
| | $ | 58.5 |
| | $ | 69.1 |
|
The following table summarizes share-based compensation expense associated with each of our share-based compensation programs:
| | | | For the Three Months
Ended June 30, | | For the Six Months
Ended June 30, | For the Three Months
Ended June 30, | | For the Six Months
Ended June 30, |
| (In millions) | 2016 | | 2015 | | 2016 | | 2015 | 2017 | | 2016 | | 2017 | | 2016 |
| Market stock units | $ | 7.9 |
| | $ | 9.1 |
| | $ | 21.3 |
| | 26.1 |
| $ | 3.0 |
| | $ | 7.9 |
| | $ | 12.6 |
| | $ | 21.3 |
|
| Time-vested restricted stock units | 33.9 |
| | 31.8 |
| | 64.0 |
| | 63.7 |
| 27.6 |
| | 33.9 |
| | 54.5 |
| | 64.0 |
|
| Cash settled performance units | 4.6 |
| | 3.2 |
| | 4.8 |
| | 27.0 |
| 2.5 |
| | 4.6 |
| | 6.0 |
| | 4.8 |
|
| Performance units | 1.3 |
| | 1.2 |
| | 8.2 |
| | 14.4 |
| 1.2 |
| | 1.3 |
| | 5.7 |
| | 8.2 |
|
| Employee stock purchase plan | 2.5 |
| | 3.0 |
| | 6.2 |
| | 8.1 |
| 2.1 |
| | 2.5 |
| | 5.7 |
| | 6.2 |
|
| Subtotal | 50.2 |
| | 48.3 |
| | 104.5 |
| | 139.3 |
| 36.4 |
| | 50.2 |
| | 84.5 |
| | 104.5 |
|
| Capitalized share-based compensation costs | (4.4 | ) | | (2.2 | ) | | (7.5 | ) | | (5.6 | ) | (2.4 | ) | | (4.4 | ) | | (5.1 | ) | | (7.5 | ) |
| Share-based compensation expense included in total cost and expenses | $ | 45.8 |
| | $ | 46.1 |
| | $ | 97.0 |
| | $ | 133.7 |
| $ | 34.0 |
| | $ | 45.8 |
| | $ | 79.4 |
| | $ | 97.0 |
|
We estimate the fair value of our obligations associated with our performance units and cash settled performance units at the end of each reporting period through expected settlement. Cumulative adjustments to these obligations are recorded each quarter to reflect changes in the stock price and estimated outcome of the performance-related conditions.
Grants Under Share-based Compensation PlansSpin-off Related Equity Adjustments
The following table summarizes our equity grantsPursuant to employees, officers and directors under our current stock plans:
|
| | | | | |
| | For the Six Months
Ended June 30, |
| | 2016 | | 2015 |
| Market stock units | 166,000 |
| | 179,000 |
|
| Cash settled performance shares | 86,000 |
| | 115,000 |
|
| Performance units | 56,000 |
| | 89,000 |
|
| Time-vested restricted stock units | 594,000 |
| | 375,000 |
|
Employee Stock Purchase Plan (ESPP)
In June 2015, our stockholders approvedan employee matters agreement entered into in connection with the Biogen Inc. 2015 ESPP (2015 ESPP). The 2015 ESPP, which became effective on July 1, 2015, replaced the Biogen Idec Inc. 1995 ESPP (1995 ESPP), which expired on June 30, 2015. The maximum aggregate number of sharesspin-off of our commonhemophilia business and the provisions of our existing stock-based compensation arrangements, we made certain adjustments to the number and terms of our outstanding stock that may be purchased underoptions, restricted stock units, cash settled performance units and other share-based awards to preserve the 2015 ESPP is 6,200,000.
intrinsic value of the awards immediately before and after the spin-off. For purposes of the six months ended June 30, 2016, approximately 109,000 shares were issued under our 2015 ESPP, compared to approximately 98,000 shares issued under our 1995 ESPP investing of these equity awards, continued employment or service with Biogen or with Bioverativ was treated as continued employment for purposes of both Biogen’s and Bioverativ’s equity awards with the prior year comparative period.
BIOGEN INC. AND SUBSIDIARIES
NOTES TO CONDENSED CONSOLIDATED FINANCIAL STATEMENTS
(unaudited, continued)
14.outstanding awards continuing to vest over their respective original vesting periods. Outstanding unvested awards for employees transferring to Bioverativ were converted to unvested Bioverativ awards.
Adjustments to the number of our share-based compensation awards were made using an adjustment ratio based upon the weighted-average closing price of our common stock for the 10 calendar days prior to the effective date of the spin-off and the volume weighted-average prices for the 10 calendar days of our common stock following the effective date of the spin-off. For stock options, the exercise prices of the awards were modified to maintain the pre-spin intrinsic value of the awards in relation to the post-spin stock price of Biogen. The difference between the fair value of the awards based upon the adjustment ratio and the opening price on the distribution date was not material.
2017 Omnibus Equity Plan
In June 2017 our shareholders approved the Biogen Inc. 2017 Omnibus Equity Plan (2017 Omnibus Equity Plan) for share-based awards to our employees. Awards granted from the 2017 Omnibus Equity Plan may include stock options, shares of restricted stock, restricted stock units, performance shares, stock appreciation rights and other awards in such amounts and with such terms and conditions as may be determined by a committee of our Board of Directors, subject to the provisions of the plan. Shares of common stock available for grant under the 2017 Omnibus Equity Plan consist of 8.0 million shares reserved for this purpose, plus shares of common stock that remained available for grant under our 2008 Omnibus Equity Plan (including shares available by reason of a predecessor plan) on the date that our shareholders approved the 2017 Omnibus Equity Plan, plus shares that were subject to awards under the 2008 Omnibus Equity Plan (including shares available by reason of a predecessor plan) that remain unissued upon the cancellation, surrender, exchange, termination or forfeiture of such awards. The 2017 Omnibus Equity Plan provides that awards other than stock options and stock appreciation rights will be counted against the total number of shares available under the plan in a 1.5-to-1 ratio.
We have not made any awards pursuant to the 2008 Omnibus Equity Plan since our shareholders approved the 2017 Omnibus Equity Plan, and do not intend to make any awards pursuant to the 2008 Omnibus Equity Plan in the future, except that unused shares under the 2008 Omnibus Equity Plan have been carried over for use under the 2017 Omnibus Equity Plan.
15. Income Taxes
A reconciliation between the U.S. federal statutory tax rate and our effective tax rate is summarized as follows:
| | | | For the Three Months
Ended June 30, | | For the Six Months
Ended June 30, | For the Three Months
Ended June 30, | | For the Six Months
Ended June 30, |
| | 2016 | | 2015 | | 2016 | | 2015 | 2017 | | 2016 | | 2017 | | 2016 |
| Statutory rate | 35.0 | % | | 35.0 | % | | 35.0 | % | | 35.0 | % | 35.0 | % | | 35.0 | % | | 35.0 | % | | 35.0 | % |
| State taxes | 1.0 |
| | 0.4 |
| | 1.0 |
| | — |
| 0.8 |
| | 1.0 |
| | 0.4 |
| | 1.0 |
|
| Taxes on foreign earnings | (10.0 | ) | | (11.1 | ) | | (9.0 | ) | | (9.8 | ) | (11.7 | ) | | (10.0 | ) | | (11.4 | ) | | (9.0 | ) |
| Credits and net operating loss utilization | (1.2 | ) | | (0.7 | ) | | (1.2 | ) | | (0.7 | ) | (0.9 | ) | | (1.2 | ) | | (0.8 | ) | | (1.2 | ) |
| Purchased intangible assets | 1.1 |
| | 1.1 |
| | 1.1 |
| | 1.0 |
| 1.4 |
| | 1.1 |
| | 1.4 |
| | 1.1 |
|
| Manufacturing deduction | (1.6 | ) | | (2.1 | ) | | (1.7 | ) | | (1.8 | ) | (2.1 | ) | | (1.6 | ) | | (2.1 | ) | | (1.7 | ) |
| Other permanent items | 0.6 |
| | 0.9 |
| | 0.6 |
| | 0.7 |
| 0.7 |
| | 0.6 |
| | 0.7 |
| | 0.6 |
|
| Other | 0.3 |
| | 0.4 |
| | 0.2 |
| | 0.3 |
| 0.6 |
| | 0.3 |
| | 0.8 |
| | 0.2 |
|
| Effective tax rate | 25.2 | % | | 23.9 | % | | 26.0 | % | | 24.7 | % | 23.8 | % | | 25.2 | % | | 24.0 | % | | 26.0 | % |
For the three and six months ended June 30, 2016,2017, compared to the same periodperiods in 2015,2016, the decrease in our effective tax rate increasedwas primarily due to a state tax benefit in 2015 resulting from the remeasurement of one of our uncertain positions, described below, and a higherlower relative percentage of our earnings being attributed torecognized in the U.S., a high tax jurisdiction, along with a higher deduction for U.S. manufacturing activities. The geographic split of our earnings was affected by milestone and upfront payments in the current year, the spin-off of our hemophilia business and offsetting growth in sales of SPINRAZA in the U.S. For the six months ended June 30, 2017, we also recognized a benefit from a favorable settlement of a state tax jurisdiction.matter.
BIOGEN INC. AND SUBSIDIARIES
NOTES TO CONDENSED CONSOLIDATED FINANCIAL STATEMENTS
(unaudited, continued)
Accounting for Uncertainty in Income Taxes
We and our subsidiaries are routinely examined by various taxing authorities. We file income tax returns in the U.S. federal jurisdiction, various U.S. states and in U.S. federal and other foreign jurisdictions. With few exceptions, including the proposed disallowance we discuss below, we are no longer subject to U.S. federal tax examination for years before 2013 or state, local or non-U.S. income tax examinations for years before 2004.2005.
In March 2015, we received a final assessment fromWe made payments totaling approximately $57.0 million to the Danish Tax Authority (SKAT) for assessments received for fiscal 2009, 2011 and 2013 regarding withholding taxes and the treatment of certain intercompany transactions involving a Danish affiliate and another of our affiliates. In April 2016, we received final assessments for 2011 and 2013 regarding withholding taxes for similar intercompany transactions. The total amount assessed for 2009, 2011 and 2013 is estimated to be $66.9 million, including interest. For the assessments related to 2011 and 2013, we have made payments to SKAT totaling $13.0 million. We continue to dispute the assessments for all of these periods and believe that the positions we have taken in our historical filings are valid.
During the six months ended June 30, 2015, the net effect of adjustments to our uncertain tax positions was a net benefit of approximately $24.0 million primarily related to the state impact of a federal uncertain tax item.
It is reasonably possible that we will adjust the value of our uncertain tax positions related to our revenues from anti-CD20 therapeutic programs and certain transfer pricing issues as we receive additional information from various taxing authorities, including reaching settlements with the tax authorities. In addition, the Internal Revenue Service (IRS) and other national tax authorities routinely examine our intercompany transfer pricing with respect to intellectual property related transactions and it is possible that they may disagree with one or more positions we have taken with respect to such valuations.
In October 2011, in conjunction with an examination by the IRS, the IRS proposed a disallowance of approximately $130.0 million in deductions for tax years 2007, 2008 and 2009 related to payments for services provided by our wholly owned Danish subsidiary located in Hillerød, Denmark. We initiated a mutual agreement procedure between the IRS and SKAT for the years 2001 through 2009, to reach agreement on the issue. Over the past year, we have reached agreement with the IRS and SKAT regarding the tax treatment of these items for the years up to and including 2009. We have recorded the results of these agreements, which were not significant to our results. In addition, we applied for a bilateral advance pricing agreement for the years 2010 through 2014 to resolve similar issues for those years. In June 2016, we withdrew from the bilateral advance pricing agreement process. We believe that the positions we have taken in our historical filings are valid and supportable and potential changes in these positions are not expected to have a significant impact on our financial position or results of operations.
BIOGEN INC. AND SUBSIDIARIES
NOTES TO CONDENSED CONSOLIDATED FINANCIAL STATEMENTS
(unaudited, continued)
15.16. Other Consolidated Financial Statement Detail
Other Income (Expense), Net
Components of other income (expense), net, are summarized as follows:
| | | | For the Three Months
Ended June 30, | | For the Six Months
Ended June 30, | For the Three Months
Ended June 30, | | For the Six Months
Ended June 30, |
| (In millions) | 2016 | | 2015 | | 2016 | | 2015 | 2017 | | 2016 | | 2017 | | 2016 |
| Interest income | $ | 15.4 |
| | $ | 4.3 |
| | $ | 26.6 |
| | $ | 7.6 |
| $ | 16.9 |
| | $ | 15.4 |
| | $ | 33.6 |
| | $ | 26.6 |
|
| Interest expense | (65.9 | ) | | (5.8 | ) | | (129.2 | ) | | (12.5 | ) | (63.6 | ) | | (65.9 | ) | | (127.0 | ) | | (129.2 | ) |
| Gain (loss) on investments, net | (2.7 | ) | | 0.3 |
| | (1.1 | ) | | (1.4 | ) | (13.4 | ) | | (2.7 | ) | | (11.0 | ) | | (1.1 | ) |
| Foreign exchange gains (losses), net | 0.2 |
| | (1.5 | ) | | 2.3 |
| | (14.5 | ) | (2.3 | ) | | 0.2 |
| | 1.7 |
| | 2.3 |
|
| Other, net | (5.5 | ) | | (8.2 | ) | | (9.9 | ) | | (5.1 | ) | (5.8 | ) | | (5.5 | ) | | (3.1 | ) | | (9.9 | ) |
| Total other income (expense), net | $ | (58.5 | ) | | $ | (10.9 | ) | | $ | (111.3 | ) | | $ | (25.9 | ) | $ | (68.2 | ) | | $ | (58.5 | ) | | $ | (105.8 | ) | | $ | (111.3 | ) |
Other Current Assets
Other current assets includesinclude prepaid taxes totaling approximately $704.1$881.4 million and $550.6$817.0 million as of June 30, 20162017 and December 31, 2015,2016, respectively.
Accrued Expenses and Other
Accrued expenses and other consists of the following:
|
| | | | | | | |
| (In millions) | As of
June 30,
2016 | | As of
December 31,
2015 |
| Current portion of contingent consideration obligations and milestones | $ | 556.7 |
| | $ | 504.7 |
|
| Revenue-related reserves for discounts and allowances | 490.5 |
| | 518.1 |
|
| Employee compensation and benefits | 228.4 |
| | 270.8 |
|
| Royalties and licensing fees | 183.7 |
| | 167.9 |
|
| Other | 613.4 |
| | 635.3 |
|
| Total accrued expenses and other | $ | 2,072.7 |
| | $ | 2,096.8 |
|
Pricing of TYSABRI in Italy - AIFA
In the fourth quarter of 2011, Biogen Italia SRL, our Italian subsidiary, received a notice from the Italian National Medicines Agency (Agenzia Italiana del Farmaco or AIFA) that sales of TYSABRI after mid-February 2009 exceeded a reimbursement limit established pursuant to a Price Determination Resolution (Price Resolution) granted by AIFA in December 2006. In January 2012, we filed an appeal in the Regional Administrative Tribunal of Lazio (Il Tribunale Amministrativo Regionale per il Lazio) in Rome, Italy seeking a ruling that the reimbursement limit in the Price Resolution should apply as written to only "the first 24 months" of TYSABRI sales, which ended in mid-February 2009. That appeal is still pending.
In June 2014, AIFA approved a resolution affirming that there is no reimbursement limit from and after February 2013. As a result, we recognized $53.5 million of TYSABRI revenues related to the periods beginning February 2013 that were previously deferred. AIFA and Biogen Italia SRL are still discussing a possible resolution for the period from February 2009 through January 2013. We have approximately EUR75 million recorded as accrued expenses and deferred revenue both included in our long-term liabilities in our condensed consolidated balance sheet for this matter as of June 30, 2016 and December 31, 2015.
For additional information relating to our agreement with AIFA relating to sales of TYSABRI in Italy, please read Note 17, Other Consolidated Financial Statement Detail to our consolidated financial statements included in our 2015 Form 10-K. |
| | | | | | | |
| (In millions) | As of
June 30,
2017 | | As of
December 31,
2016 |
| Current portion of contingent consideration obligations and milestones | $ | 580.7 |
| | $ | 580.8 |
|
| Revenue-related reserves for discounts and allowances | 533.3 |
| | 438.6 |
|
| Royalties and licensing fees | 195.8 |
| | 195.8 |
|
| Collaboration expenses | 188.0 |
| | 130.9 |
|
| Employee compensation and benefits | 186.6 |
| | 282.9 |
|
| Construction in progress | 161.3 |
| | 134.0 |
|
| Accrued TECFIDERA litigation settlement and license charges | — |
| | 454.8 |
|
| Other | 591.2 |
| | 685.7 |
|
| Total accrued expenses and other | $ | 2,436.9 |
| | $ | 2,903.5 |
|
BIOGEN INC. AND SUBSIDIARIES
NOTES TO CONDENSED CONSOLIDATED FINANCIAL STATEMENTS
(unaudited, continued)
16.Pricing of TYSABRI in Italy - AIFA
In the first quarter of 2017, we reached an agreement with the Price and Reimbursement Committee of the Italian National Medicines Agency (Agenzia Italiana del Farmaco, or AIFA) resolving all of AIFA's claims relating to sales of TYSABRI in excess of the reimbursement limit for prior periods. As a result, in the first quarter of 2017 we recognized EUR41.8 million (approximately $45.0 million) in revenues for sales which were previously deferred. These amounts were previously accrued for and included in the table above in Other.
For additional information regarding our agreement with AIFA relating to sales of TYSABRI in Italy, please read Note 20, Litigation, to our consolidated financial statements included in our 2016 Form 10-K.
17. Investments in Variable Interest Entities
Consolidated Variable Interest Entities
Our condensed consolidated financial statements include the financial results of variable interest entities in which we are the primary beneficiary.
Neurimmune SubOne AG
In 2007 we entered into a collaboration agreement with Neurimmune SubOne AG (Neurimmune), a subsidiary of Neurimmune AG, for the development and commercialization of antibodies for the treatment of Alzheimer’s disease. Neurimmune conducts research to identify potential therapeutic antibodies and we are responsible for the development, manufacturing and commercialization of all products. Our anti-amyloid beta antibody, aducanumab, for
We consolidate the treatmentresults of Alzheimer’s disease resulted from this collaboration. Based upon our current development plans for aducanumab,Neurimmune as we may pay Neurimmune up to $275.0 million in remaining milestone payments. We may also pay royalties in the low-to-mid-teens on sales of any resulting commercial products.
We determined that we are the primary beneficiary of Neurimmune because we have the power through the collaboration to direct the activities that most significantly impact the entity’s economic performance and are required to fund 100% of the research and development costs incurred in support of the collaboration agreement. Accordingly, we consolidate the results of Neurimmune.
We are required to reimburse Neurimmune for amounts that areAmounts incurred by Neurimmune for research and development expenses in support of the collaboration. Amountscollaboration and reimbursed are reflected in research and development expense in our condensed consolidated statements of income. Forby us were immaterial for the three and six months ended June 30, 20162017 and 2015, these amounts were immaterial. Future milestone payments and royalties, if any, will be reflected in our condensed consolidated statements of income as a charge to noncontrolling interest, net of tax, when such milestones are achieved.2016.
The assets and liabilities of Neurimmune are not significant to our financial position or results of operations as it is a research and development organization. We have provided no financing to Neurimmune other than previously contractually required amounts.
Other Variable Interest Entities
We also consolidate the financial results of our other variable interest entities where we are the primary beneficiary. We may pay these variable interest entities up to approximately $8.0 million in remaining milestone payments. We have provided no financing to these entities other than amounts provided for in the contract.
Unconsolidated Variable Interest Entities
We have relationships with other variable interest entities that we do not consolidate as we lack the power to direct the activities that significantly impact the economic success of these entities. These relationships include investments in certain biotechnology companies and research collaboration agreements.
As of June 30, 20162017 and December 31, 2015,2016, the total carrying value of our investments in biotechnology companies totaled $38.0$53.1 million and $29.2$47.4 million, respectively. Our maximum exposure to loss related to these variable interest entities is limited to the carrying value of our investments.
We have also entered into research collaboration agreements with certain variable interest entities where we are required to fund certain development activities. These development activities are included in research and development expense in our condensed consolidated statements of income as they are incurred. We have provided no financing to these variable interest entities other than previously contractually required amounts.
For additional information related to our investments in Neurimmune and other variable interest entities, please read Note 18, Investments in Variable Interest Entities, to our consolidated financial statements included in our 20152016 Form 10-K.
BIOGEN INC. AND SUBSIDIARIES
NOTES TO CONDENSED CONSOLIDATED FINANCIAL STATEMENTS
(unaudited, continued)
17.18. Collaborative and Other Relationships
University of PennsylvaniaBristol-Myers Squibb Company
In May 2016,On April 13, 2017, we entered into an agreement to exclusively license BMS-986168, a collaborationPhase 2-ready experimental medicine with potential in Alzheimer’s disease (AD) and alliance with the University of Pennsylvania (Penn) to advance gene therapy and gene editing technologies. The collaboration will primarily focus on the development of therapeutic approaches that target the eye, skeletal muscle and the central nervous system. The alliance is also expected to focus on the research and validation of next-generation gene transfer technology using adeno-associated virus gene delivery vectors and exploring the expanded use of genome editing technology as a potential therapeutic platform.
During the second quarter of 2016, we paid Penn an upfront amount of $20.0 million, which was recorded as research and development expense in our condensed consolidated statements of income, and prepaid research and development expenditures of $15.0 million, which was recorded in investments and other assets in our condensed consolidated balance sheets. We also expect to fund an additional $47.5 million in the aggregate in research and development costs extending over the next three to five years in seven preclinical research and development programs, as well as the exploration of genome-editing technology.
If all of the collaboration programs are successful and we exercise all of our options under the Penn collaboration and alliance, we may be required to make future payments of over $2.0 billion in research funding, options and milestone payments, in addition to royalties payable on net sales of products.
Swedish Orphan Biovitrum AB
In January 2007, we acquired 100% of the stock of Syntonix. Syntonix had previously entered into a collaboration agreement with Swedish Orphan Biovitrum AB (publ) (Sobi) to jointly develop and commercialize Factor VIII and Factor IX hemophilia products, including ELOCTATE and ALPROLIX. Under an amended and restated collaboration agreement, we have commercial rights for North America (the Biogen North America Territory) and for rest of the world markets outside of the Sobi Territory, as defined below (the Biogen Direct Territory). Following its exercise of an option right, Sobi has assumed commercialization rights for ELOCTA, the trade name for ELOCTATE, and ALPROLIX, in substantially all of Europe, Northern Africa, Russia and certain countries in the Middle East (the Sobi Territory). For additional information on our collaboration agreement with Sobi, please read Note 19, Collaborative and Other Relationships to our consolidated financial statements included in our 2015 Form 10-K.
Sobi had its first commercial sale of ELOCTA in January 2016. In March 2016, the EC approved the transfer of the marketing authorization for ELOCTAprogressive supranuclear palsy (PSP), from Biogen to Sobi, making Sobi the marketing authorization holder of ELOCTA in the E.U. As the marketing authorization holder, Sobi assumes full legal responsibility for ELOCTA, from a regulatory perspective, during its entire life cycle in the E.U. As of June 30, 2016, approximately $157.0 million in expenditures for ELOCTA, net of an escrow payment and other royalty adjustments as described in the table and its footnote (3) below, are reimbursable to us by Sobi under our collaboration agreement due to Sobi's election to assume final development and commercialization of ELOCTA in the Sobi Territory, which is the Opt-In Consideration for ELOCTA. This reimbursement will be recognized by us as royalty revenue in proportion to collaboration revenues, over a ten year period, consistent with the initial patent term of the product.
ALPROLIX was approved in the E.U. by the EC in May 2016 and Sobi had its first commercial sale in June 2016. As of June 30, 2016, approximately $130.0 million in expenditures for ALPROLIX, net of an escrow payment and other royalty adjustments as described in the table and its footnote (3) below, are reimbursable to us by Sobi under our collaboration agreement due to Sobi's election to assume final development and commercialization of ALPROLIX in the Sobi Territory, which is the Opt-In Consideration for ALPROLIX. This reimbursement will be recognized by us as royalty revenue in proportion to collaboration revenues, over a ten year period, consistent with the initial patent term of the product.
BIOGEN INC. AND SUBSIDIARIES
NOTES TO CONDENSED CONSOLIDATED FINANCIAL STATEMENTS
(unaudited, continued)
Bristol-Myers Squibb Company (BMS). BMS-986168 is an antibody targeting tau, the protein that forms the deposits, or tangles, in the brain associated with AD and other neurodegenerative tauopathies such as PSP. PSP is a rare condition that affects movement, speech, vision and cognitive function. The transaction closed on June 1, 2017 and, in connection with the closing, we made an upfront payment to BMS of $300.0 million. Following the closing, we now refer to BMS-986168 as BIIB092.
Under the agreement, we received worldwide rights to BIIB092 and are responsible for the full development and global commercialization of BIIB092 in AD and PSP. We expectmay pay BMS up to recognize the effect of the cash reimbursement as an adjustment$410.0 million in additional milestone payments, and potential royalties. We also assumed all remaining obligations to the Base Rateformer stockholders of iPierian, Inc. (iPierian) related to BMS’s acquisition of iPierian in 2014. In June 2017 we triggered a $60.0 million developmental milestone payable to the table below over a ten year period, consistent with the initial patent termformer stockholders of the products. Under the collaboration agreement, cash payments are as follows:
|
| | | | | |
| | | Rates post Sobi Opt-In(3)
|
Royalty and Net Revenue Share Rates: | Method | | Base Rate following
1st commercial sale in
the Sobi Territory:
| | Rate during the
Reimbursement
Period:
|
Sobi rate to Biogen on net sales in the Sobi Territory | Royalty | | 12% | | Base Rate
plus 5% |
Biogen rate to Sobi on net sales in the Biogen North America Territory | Royalty | | 12% | | Base Rate
less 5% |
Biogen rate to Sobi on net sales in the Biogen Direct Territory | Royalty | | 17% | | Base Rate
less 5% |
Biogen rate to Sobi on net revenue(1)
from the Biogen Distributor Territory(2)
| Net
Revenue
Share | | 50% | | Base Rate
less 15% |
| |
(1) | Net revenue represents Biogen’s pre-tax receipts from third-party distributors, less expenses incurred by Biogen in the conduct of commercialization activities supporting the distributor activities. |
| |
(2) | The Biogen Distributor Territory represents Biogen territories where sales are derived utilizing a third-party distributor. |
| |
(3) | A credit will be issued to Sobi against its reimbursement of the Opt-in Consideration in an amount equal to the difference in the rate paid by Biogen to Sobi on sales in the Biogen territories for certain periods prior to the first commercial sale in the Sobi Territory versus the rate that otherwise would have been payable on such sales. |
If the reimbursement of the Opt-in Consideration has not been achieved within six yearsiPierian upon dosing of the first commercial salepatient in the Phase 2 PSP study for BIIB092 and we may pay the former stockholders of suchiPierian up to $490.0 million in remaining milestone payments, and potential royalties.
Both the $300.0 million upfront payment and the $60.0 million developmental milestone payment were recognized as research and development expense in our condensed consolidated statements of income for the three and six months ended June 30, 2017.
AbbVie Inc.
We have a collaboration agreement with AbbVie Inc. (AbbVie) aimed at advancing the development and commercialization of ZINBRYTA in MS, which was approved for the treatment of relapsing forms of MS in the U.S. in May 2016 and in the E.U. in July 2016. Under the agreement, we and AbbVie conduct ZINBRYTA co-promotion activities in the U.S., E.U. and Canadian territories (Collaboration Territory), where development and commercialization costs and profits are shared equally. Outside of the Collaboration Territory, we are solely responsible for development and commercialization of ZINBRYTA and will pay a tiered royalty to AbbVie as a percentage of net sales in the low to high teens.
Co-promotion Profits and Losses
In the U.S., AbbVie recognizes revenues on sales to third parties and we recognize our 50% share of the co-promotion profits or losses as a component of total revenues in our condensed consolidated statements of income. The collaboration began selling ZINBRYTA in the U.S. in the third quarter of 2016. During the three and six months ended June 30, 2017, we recognized a net reduction in revenue of $3.9 million and $9.8 million, respectively, to reflect our share of an overall net loss within the collaboration.
In the E.U. and Canada, we recognize revenues on sales to third parties in product revenues, net in our condensed consolidated statements of income. We also record the related cost of revenues and sales and marketing expenses to their respective line items in our condensed consolidated statements of income as these costs are incurred. We reimburse AbbVie for their 50% share of the co-promotion profits or losses in the E.U. and Canada. This reimbursement is recognized in collaboration profit (loss) sharing in our condensed consolidated statements of income. We began to recognize product revenues on sales of ZINBRYTA in the E.U. in the third quarter of 2016. For the three and six months ended June 30, 2017, we maintainrecognized net expense of $1.3 million to reflect AbbVie's 50% sharing of the rightnet collaboration profits in the E.U. and Canada.
Ionis Pharmaceuticals, Inc.
SPINRAZA (nusinersen)
In January 2012 we entered into an exclusive worldwide option and collaboration agreement with Ionis Pharmaceuticals, Inc. (Ionis) under which both companies develop and commercialize the antisense investigational drug candidate, SPINRAZA, for the treatment of SMA.
Under the terms of the agreement, during the third quarter of 2016, we exercised our option to require Sobi to pay any remaining balancesdevelop and commercialize SPINRAZA and paid Ionis a $75.0 million license fee in connection with the option exercise. This amount was recognized as research and development expense in our condensed consolidated statements of income. In December 2016 SPINRAZA was approved by the FDA for the treatment of SMA in pediatric and adult patients in the U.S. triggering a $60.0 million milestone payment due to us within 90 daysIonis, which was capitalized in intangible assets, net in our condensed consolidated balance sheets. This amount was paid during the first quarter of 2017.
BIOGEN INC. AND SUBSIDIARIES
NOTES TO CONDENSED CONSOLIDATED FINANCIAL STATEMENTS
(unaudited, continued)
In June 2017 SPINRAZA was approved by the European Commission for the treatment of SMA in pediatric and adult patients in the E.U. triggering a $50.0 million milestone payment due to Ionis, which was capitalized in intangible assets, net in our condensed consolidated balance sheets as of June 30, 2017.
In July 2017 the Japanese Ministry of Health, Labor and Welfare approved SPINRAZA for the treatment of infantile SMA, triggering an additional $40.0 million milestone payment due to Ionis, which we will capitalize in intangible assets, net in our condensed consolidated balance sheets in the third quarter of 2017.
For the three and six months ended June 30, 2017, we recognized revenues totaling $194.8 million and $241.2 million, respectively, on our sales of SPINRAZA in the U.S. and $8.1 million and $9.1 million, respectively, on our sales of SPINRAZA outside of the six year anniversary dateU.S. Pursuant to our agreement with Ionis, we make royalty payments to Ionis on annual worldwide net sales of the first commercial sale.SPINRAZA using a tiered royalty rate between 11% and 15%.
Samsung Bioepis
Joint Venture Agreement
In February 2012 we entered into a joint venture agreement with Samsung BioLogics Co. Ltd. (Samsung Biologics),Biologics, establishing an entity, Samsung Bioepis, to develop, manufacture and market biosimilar pharmaceuticals. Samsung Biologics contributed 280.5 billion South Korean won (approximately $250.0 million) for an 85% stake in Samsung Bioepis and we contributed approximately 49.5 billion South Korean won (approximately $45.0 million) for the remaining 15% ownership interest. Under the joint venture agreement, we have no obligation to provide any additional funding and our ownership interest may be diluted due to financings in which we do not participate. As of June 30, 2016,2017, our ownership interest iswas approximately 9%5%, which reflects the effect of additional equity financings in which we did not participate. We maintain an option to purchase additional stock in Samsung Bioepis that would allow us to increase our ownership percentage up to 49.9%. The exercise of this option is within our control and is based on paying for 49.9% of the total investment made by Samsung Biologics into Samsung Bioepis in excess of what we have already contributed under the agreement plus a rate that will represent their return on capital.control.
Based on our level of influence over Samsung Bioepis, we account for this investment under the equity method of accounting and weWe recognize our share of the results of operations related to our investment in Samsung Bioepis one quarter in arrears when the results of the entity become available, which is reflected as equity in loss of investee, net of tax in our condensed consolidated statements of income. During the three and six months ended June 30, 2015, we recognized a loss on our investment of $4.9 million and $5.7 million, respectively. During 2015, as our share of losses exceeded the carrying value of our investment, we suspended recognizing additional losses and will continue to do so unless we commit to providing additional funding.
BIOGEN INC. AND SUBSIDIARIES
NOTES TO CONDENSED CONSOLIDATED FINANCIAL STATEMENTS
(unaudited, continued)
Commercial Agreement
In December 2013, pursuant to our rights under the joint venture agreement with Samsung Biologics, we entered into an agreement with Samsung Bioepis to commercialize, over a 10-year term, three anti-TNF biosimilar product candidates in Europe and in the case of one anti-TNF biosimilar, Japan. Under the terms of this agreement, we have made total upfront and milestone payments of $46.0 million, which have been recorded as a research and development expense in our condensed consolidated statements of income as the programs they relate to had not achieved regulatory approval. We also agreed to make an additional milestone payment of $25.0 million upon regulatory approval in the E.U. for each of the three anti-TNF biosimilar product candidates. During the six months ended June 30, 2016, we made a $25.0 million milestone payment and accrued another $25.0 million, which have been capitalized in intangible assets, net in our condensed consolidated balance sheet as BENEPALI received regulatory approval in the E.U. in January 2016 and FLIXABI received regulatory approval in the E.U. in May 2016.
We began to recognize revenue on sales of BENEPALI and FLIXABI in the E.U. in the first quarterand third quarters of 2016.2016, respectively. We reflect revenues on sales of BENEPALI and FLIXABI to third parties in product revenues, net in our condensed consolidated statements of income and record the related cost of revenues and sales and marketing expenses in our condensed consolidated statements of income to their respective line items when these costs are incurred. We share 50% of the profit or loss related to ourin accordance with the cost sharing provision of the commercial agreement with Samsung Bioepis. This profit share with Samsung Bioepis is recognized in collaboration profit (loss) sharing in our condensed consolidated statements of income. For the three and six months ended June 30, 2017, we recognized a net expense of $25.2 million and $46.0 million, respectively, to reflect Samsung Bioepis's 50% sharing of the net collaboration profits, as compared to net income of $5.6 million to reflect sharing of the net collaboration losses in both of the prior year comparative periods.
Other Services
Simultaneous with the formation of Samsung Bioepis, we also entered into a license agreement, a technical development services agreement and a manufacturing agreement with Samsung Bioepis. For the three and six months ended June 30, 2016,2017, we recognized $14.2$12.7 million and $16.9$14.9 million, respectively, in relation toconnection with these services as a component of other revenues in our condensed consolidated statements of income, as compared to $17.2$14.2 million and $36.1$16.9 million, respectively, in the prior year comparative periods.
For additional information related to these and our other significant collaboration arrangements, please read Note 19, Collaborative and Other Relationships, to our consolidated financial statements included in our 20152016 Form 10-K.
18.BIOGEN INC. AND SUBSIDIARIES
NOTES TO CONDENSED CONSOLIDATED FINANCIAL STATEMENTS
(unaudited, continued)
19. Litigation
We are currently involved in various claims and legal proceedings, including the matters described below. For information as to our accounting policies relating to claims and legal proceedings, including use of estimates and contingencies, please read Note 1, Summary of Significant Accounting Policies, to our consolidated financial statements included in our 20152016 Form 10-K.
With respect to some loss contingencies, an estimate of the possible loss or range of loss cannot be made until management has further information, including, for example, (i) which claims, if any, will survive dispositive motion practice; (ii) information to be obtained through discovery; (iii) information as to the parties' damages claims and supporting evidence; (iv) the parties’ legal theories; and (v) the parties' settlement positions.
The claims and legal proceedings in which we are involved also include challenges to the scope, validity or enforceability of the patents relating to our products, pipeline or processes, and challenges to the scope, validity or enforceability of the patents held by others. These include claims by third parties that we infringe their patents. An adverse outcome in any of these proceedings could result in one or more of the following and have a material impact on our business or consolidated results of operations and financial position: (i) loss of patent protection; (ii) inability to continue to engage in certain activities; and (iii) payment of significant damages, royalties, penalties and/or license fees to third parties.
BIOGEN INC. AND SUBSIDIARIES
NOTES TO CONDENSED CONSOLIDATED FINANCIAL STATEMENTS
(unaudited, continued)
Loss Contingencies
Forward Pharma German Patent Litigation
On November 18, 2014, Forward Pharma A/S (Forward Pharma) filed suit against us in the Regional Court of Dusseldorf, Germany alleging that TECFIDERA infringes German Utility Model DE 20 2005 022 112 U1 (the utility model), which was issued in April 2014 and expired in October 2015. Forward Pharma subsequently extended its allegations to assert that TECFIDERA infringes Forward Pharma's European Patent No. 2 801 355, which was issued in May 2015 and expires in October 2025 (the '355 patent). Forward Pharma seeks declarations of infringement and damages for our sales of TECFIDERA in Germany. Under German law, disgorgement of profits on infringing sales is a measure of damages. With respect to the '355 patent, the hearing has been stayed pending the outcome of opposition proceedings that we and others have filed in the European Patent Office, and with respect to the utility model the hearing has been stayed pending the outcome of those proceedings and proceedings in the German Patent Office.
ALPROLIX Patent Licensing Matter
We are in discussions with Pfizer regarding its proposal that we take a license to its U.S. Patent No. 8,603,777 (Expression of Factor VII and IX Activities in Mammalian Cells) and pay royalties on sales of ALPROLIX. An estimate of the possible loss or range of loss cannot be made at this time.
Italian National Medicines Agency
In the fourth quarter of 2011, Biogen Italia SRL received notice from the Italian National Medicines Agency (Agenzia Italiana del Farmaco or AIFA) that sales of TYSABRI after mid-February 2009 exceeded a reimbursement limit established pursuant to a Price Determination Resolution (Price Resolution) granted by AIFA in December 2006. On January 12, 2012, we filed an appeal in the Regional Administrative Tribunal of Lazio (Il Tribunale Amministrativo Regionale per il Lazio) in Rome, Italy seeking a ruling that the reimbursement limit in the Price Resolution should apply as written to only “the first 24 months” of TYSABRI sales, which ended in mid-February 2009. The appeal is still pending. In June 2014, AIFA approved a resolution affirming that there is no reimbursement limit from and after February 2013. AIFA and Biogen Italia SRL are discussing a possible resolution for the period from February 2009 through January 2013.
For additional information regarding this matter, please read Note 15, Other Consolidated Financial Statement Detail to these condensed consolidated financial statements.
Qui Tam Litigation
On July 6, 2015, foura qui tam actionsaction filed against us by relators suing on behalf of the United States and certain states werewas unsealed by the U.S. District Court for the District of Massachusetts. All but one of the actions has been voluntarily dismissed. The pending action alleges sales and promotional activities in violation of the federal False Claims Act and state law counterparts, and seeks single and treble damages, civil penalties, interest, attorneys’ fees and costs. The complaint was recently amended, and we intendOur motion to move to dismiss.dismiss is pending. The United States has not made an intervention decision. An estimate of the possible loss or range of loss cannot be made at this time.
Securities Litigation
We and certain current and former officers arewere defendants in In re Biogen Inc. Securities Litigation, filed by a shareholder on August 18, 2015, in the U.S. District Court for the District of Massachusetts. The amended complaint allegesalleged violations of federal securities laws under 15 U.S.C. §78j(b) and §78t(a) and 17 C.F.R. §240.10b-5. The§240.10b-5 and the lead plaintiff sought a declaration of the action as a class action, certification as a representative of the class and its counsel as class counsel, and an award of damages, interest and attorneys' fees. On July 1, 2016 theThe U.S. District Court dismissed the case.case in 2016 and the U.S. Court of Appeals for the First Circuit affirmed the dismissal in May 2017.
We and certain current and former officers are also defendants in an action filed by another shareholder on October 20, 2016, in the U.S. District Court for the District of Massachusetts related to the matter described above. The complaint alleges violations of federal securities laws under 15 U.S.C §78j(b) and §78t(a) and 17 C.F.R. §240.10b-5 and seeks a declaration of the action as a class action and an award of damages, interest and attorneys' fees. An estimate of the possible loss or range of loss cannot be made at this time.
Other Matters
Abbreviated New Drug Application Litigation relating to TECFIDERA
In June and July 2017 we filed patent infringement actions pursuant to the Hatch-Waxman Act against parties who filed Abbreviated New Drug Applications (ANDAs) for generic versions of TECFIDERA. We have sued the following parties in the United States District Court for the District of Delaware: Amneal Pharmaceuticals LLC, Aurobindo Pharma U.S.A., Inc., Hetero USA, Inc., Impax Laboratories, Inc., Prinston Pharmaceuticals, Inc., Slayback Pharma LLC, Teva Pharmaceuticals USA, Inc., Alkem Laboratories Ltd., Cipla Limited, Glenmark Pharmaceuticals Pvt. Ltd., Lupin Atlantis Holdings SA, Macleods Pharmaceuticals, Ltd., MSN Laboratories Pvt. Ltd., Pharmathen S.A., Shipla Medicare Limited, Sun Pharma Global FZE, Torren Pharmaceuticals, Ltd., TWI Pharmaceuticals, Inc., Windlas Healthcare Pvt., Ltd., Accord Healthcare Inc., Par Pharmaceuticals, Sandoz Inc., Sawai (USA), Inc., and Zydus Pharmaceuticals (USA), Inc. We have also filed actions against Stason Pharmaceuticals, Inc. in the United States District Court for the Central District of California, Zydus Pharmaceuticals (USA), Inc. in the United States District Court for the District of
BIOGEN INC. AND SUBSIDIARIES
NOTES TO CONDENSED CONSOLIDATED FINANCIAL STATEMENTS
(unaudited, continued)
Other MattersNew Jersey, and Mylan Pharmaceuticals in the United States District Court for the District of West Virginia. No trial has been scheduled in any of these matters.
Interference Proceeding with Forward Pharma
In April 2015 the U.S. Patent and Trademark Office (USPTO) declared an interference between Forward Pharma’s pending U.S. Patent Application No. 11/576,871 and our U.S. Patent No. 8,399,514 (the '514 patent). The '514 patent includes claims covering the treatment of multiple sclerosisMS with 480 mg of dimethyl fumarate as provided for in our TECFIDERA label. A hearingIn March 2017 the USPTO ruled against Forward Pharma. Forward Pharma has been scheduledappealed to the U.S. Court of Appeals for late 2016.the Federal Circuit and the appeal is pending. For additional information regarding this matter, please read Note 6, Intangibles Assets and Goodwill, to these condensed consolidated financial statements.
Inter Partes Review Petitions and Proceeding
On March 22, 2016, the USPTO instituted inter partes review of the '514 patent on the petition of the Coalition for Affordable Drugs V LLC, an entity associated with a hedge fund. A hearing has been scheduled for late 2016.
On April 18, 2016, Swiss Pharma International AG filed petitions inIn March 2017 the USPTO ruled against the petitioner and in May 2017 denied its request for inter partes review of U.S. Patent Nos. 8,349,321 and, 8,900,577, relating to specific formulations of natalizumab (TYSABRI), and U.S. Patent No. 8,815,236, relating to methods for treating multiple sclerosis and Crohn’s disease using specific formulations of natalizumab (TYSABRI). The USPTO has not yet decided whether to institute review.rehearing.
European Patent Office Oppositions
On March 10,In June 2016 the European Patent Office verbally revoked(EPO) issued a written decision confirming its earlier revocation of our European patent number 2 137 537 (the '537 patent), which we have appealed. The '537 patent includes claims covering the treatment of multiple sclerosisMS with 480 mg of dimethyl fumarate as provided for in our TECFIDERA label. In June 2016 the
The EPO has scheduled a hearing for January 2018 on Biogen’s and others’ oppositions to Forward Pharma’s European Patent OfficeNo. 2 801 355, which was issued a written decision confirming its position from whichin May 2015 and expires in October 2025. The settlement and license agreement that we entered with Forward Pharma in January 2017 did not resolve the issues pending in this proceeding and we and Forward Pharma intend to appeal.permit the EPO and the Technical Board of Appeal and the Enlarged Board of Appeal, as applicable, to make a final determination. For additional information regarding this matter, please read Note 6, Intangibles Assets and Goodwill, to these condensed consolidated financial statements.
Patent Revocation Matter
In December 2015, Swiss Pharma International AG brought an action in the Patents Court of the United Kingdom to revoke the UK counterpart of our European Patent Number 1 485 127 (“Administration of agents to treat inflammation”) (the '127 patent), which was issued in June 2011 and concerns administration of natalizumab (TYSABRI) to treat multiple sclerosis. The patent expires in February 2023. Subsequently, the same entity broughtfiled actions in the District Court of The Hague (on January 11, 2016) and the German Patents Court (on March 3, 2016) to invalidate the Dutch and German counterparts of our European Patent Number 1 485 127 (“Administration of agents to treat inflammation”), which was issued in June 2011 and concerns administration of natalizumab (TYSABRI) to treat MS. The patent expires in February 2023. In July 2017 the '127 patent.District Court of The Hague ruled that the Dutch counterpart of the patent is invalid. We have a right of appeal. A hearing has been scheduled in the UK action for late 2016 and in the DutchGerman action for early 2017. No hearing has yet been scheduled in the German action.2018.
'755 Patent Litigation
On May 28, 2010, Biogen MA Inc. (formerly Biogen Idec MA Inc.) filed a complaint in the U.S. District Court for the District of New Jersey alleging infringement by Bayer Healthcare Pharmaceuticals Inc. (Bayer) (manufacturer, marketer and seller of BETASERON and manufacturer of EXTAVIA), EMD Serono, Inc. (EMD Serono) (manufacturer, marketer and seller of REBIF), Pfizer Inc. (co-marketer of REBIF) and Novartis Pharmaceuticals Corp. (Novartis) (marketer and seller of EXTAVIA) of our U.S. Patent No. 7,588,755 ('755 Patent), which claims the use of interferon beta for immunomodulation or treating a viral condition, viral disease, cancers or tumors. The complaint seeks monetary damages, including lost profits and royalties. Bayer had previously filed a complaint against us in the same court, on May 27, 2010, seeking a declaratory judgment that it does not infringe the '755 Patent and that the patent is invalid, and seeking monetary relief in the form of attorneys' fees, costs and expenses. The court has consolidated the two lawsuits, and we refer to the two actions as the “Consolidated '755 Patent Actions.”
Bayer, Pfizer, Novartis and EMD Serono have all filed counterclaims in the Consolidated '755 Patent Actions seeking declaratory judgments of patent invalidity and non-infringement, and seeking monetary relief in the form of costs and attorneys' fees, and EMD Serono and Bayer have each filed a counterclaim seeking a declaratory judgment that the '755 Patent is unenforceable based on alleged inequitable conduct. Bayer has also amended its complaint to seek such a declaration. Trial has beenWe expect that the trial will be set for September 2017.the first quarter of 2018.
BIOGEN INC. AND SUBSIDIARIES
NOTES TO CONDENSED CONSOLIDATED FINANCIAL STATEMENTS
(unaudited, continued)
Government Matters
We have learned that state and federal governmental authorities are investigating our sales and promotional practices and have received related subpoenas. We are cooperating with the government.
On March 4, 2016, we received a subpoena from the federal government for documents relating to our relationship with non-profit organizations that provide assistance to patients taking drugs sold by Biogen. We are cooperating with the government.
On July 1, 2016, we received civil investigative demands from the federal government for documents and information relating to our treatment of certain service agreements with wholesalers when calculating and reporting Average Manufacturer Prices in connection with the Medicaid Drug Rebate Program. We are cooperating with the government.
On December 5, 2016, we received a subpoena from the federal government for documents relating to government price reporting, rebate payments and Biogen's co-pay assistance programs for AVONEX, TECFIDERA, TYSABRI and PLEGRIDY. We are cooperating with the government.
On December 29, 2016, we received a civil investigative demand from the federal government for documents and information relating to our relationships with entities providing clinical education and reimbursement support services. We are cooperating with the government.
In July 2017 we learned that the Prosecution Office of Milan is investigating our interactions with certain healthcare providers in the process of responding toItaly. We are cooperating with the government.
Product Liability and Other Legal Proceedings
We are also involved in product liability claims and other legal proceedings generally incidental to our normal business activities. While the outcome of any of these proceedings cannot be accurately predicted, we do not believe the ultimate resolution of any of these existing matters would have a material adverse effect on our business or financial condition.
19. Commitments and Contingencies
Fumapharm AG
In 2006, we acquired Fumapharm AG. As part of this acquisition we acquired FUMADERM and TECFIDERA (together, Fumapharm Products). We paid $220.0 million upon closing of the transaction and agreed to pay an additional $15.0 million if a Fumapharm Product was approved for MS in the U.S. or E.U. In the second quarter of 2013, we paid this $15.0 million contingent payment as TECFIDERA was approved in the U.S. for MS by the FDA. We are also required to make additional contingent payments to former shareholders of Fumapharm AG or holders of their rights based on the attainment of certain cumulative sales levels of Fumapharm Products and the level of total net sales of Fumapharm Products in the prior twelve month period.
During the six months ended June 30, 2016, we paid $600.0 million in contingent payments as we reached the $7.0 billion and $8.0 billion cumulative sales levels related to the Fumapharm Products in the fourth quarter of 2015 and first quarter of 2016, respectively, and accrued $300.0 million upon reaching $9.0 billion in total cumulative sales of Fumapharm Products in the second quarter of 2016.
We will owe an additional $300.0 million contingent payment for every additional $1.0 billion in cumulative sales level of Fumapharm Products reached if the prior 12 months sales of the Fumapharm Products exceed $3.0 billion, until such time as the cumulative sales level reaches $20.0 billion, at which time no further contingent payments shall be due. These payments will be accounted for as an increase to goodwill as incurred, in accordance with the accounting standard applicable to business combinations when we acquired Fumapharm. Any portion of the payment which is tax deductible will be recorded as a reduction to goodwill. Payments are due within 60 days following the end of the quarter in which the applicable cumulative sales level has been reached.
Solothurn, Switzerland Facility
On December 1, 2015, we purchased land in Solothurn, Switzerland where we are building a biologics manufacturing facility over the next several years. As of June 30, 2016, we had contractual commitments of approximately $226.0 million for the construction of this facility.
20. Subsequent Events
On July 21, 2016, we announced that George A. Scangos, Ph.D. will step down as our Chief Executive Officer after a successor has been identified. Dr. Scangos will remain on our Board of Directors until he steps down from his executive position. Our Board of Directors will begin a search for Dr. Scangos’ successor immediately.
Item 2. Management’s Discussion and Analysis of Financial Condition and Results of Operations
The following discussion should be read in conjunction with our condensed consolidated financial statements and accompanying notes beginning on page 5 of this quarterly report on Form 10-Q and our audited consolidated financial statements and related notes included in our Annual Report on Form 10-K for the year ended December 31, 2015 (20152016 (2016 Form 10-K). Certain totals may not sum due to rounding.
Executive Summary
Introduction
Biogen is a global biopharmaceutical company focused on discovering, developing, manufacturing and delivering therapies to patients for the treatment ofpeople living with serious neurological diseases, autoimmune disorders and rareneurodegenerative diseases.
Our marketed products include TECFIDERA, AVONEX, PLEGRIDY, TYSABRI, ZINBRYTA and FAMPYRA for multiple sclerosis (MS), ELOCTATESPINRAZA for hemophilia A and ALPROLIX for hemophilia Bthe treatment of spinal muscular atrophy (SMA) and FUMADERM for the treatment of severe plaque psoriasis. We also have a collaboration agreement with Genentech, Inc. (Genentech), a wholly-owned member of the Roche Group, which entitles us to certain business and financial rights with respect to RITUXAN for the treatment of non-Hodgkin's lymphoma, chronic lymphocytic leukemia (CLL) and other conditions, GAZYVA indicated for the treatment of CLL and follicular lymphoma, OCREVUS indicated for the treatment of primary progressive MS (PPMS) and relapsing MS (RMS), and other potential anti-CD20 therapies.
In May 2016, we announced our intention to spin off our hemophilia business as an independent, publicly traded company. The new company will focus on the discovery and development of therapies for the treatment of hemophilia and other blood disorders,under a collaboration agreement with existing marketed products ELOCTATE and ALPROLIX. The transaction is expected to be completed in early 2017, subject to the satisfaction of certain conditions, including, among others, final approval of our Board of Directors, receipt ofGenentech, Inc. (Genentech), a favorable opinion with respect to the tax-free naturewholly-owned member of the transaction and the effectiveness of a Form 10 registration statement that will be filed with the Securities and Exchange Commission. The results of our hemophilia business will be included in our condensed consolidated financial statements until the transaction is completed.Roche Group.
Our current revenues depend upon continued sales of our principal products and, unless we develop, or acquire rights to and commercialize new products and technologies, we may be substantially dependent on sales from our principal products for many years. Further, if the proposed spin off of our hemophilia business is completed, our revenues will be further reliant and concentrated on sales of our MS products in an increasingly competitive market.
In the longer term, our revenue growth will be dependent upon the successful clinical development, regulatory approval and launch of new commercial products as well as additional indications for our existing products, our ability to obtain and maintain patents and other rights related to our marketed products, assets originating from our research and development efforts and successful execution of external business development opportunities. As part of our ongoing research and development efforts, we have devoted significant resources to conducting clinical studies to advance the development of new pharmaceutical products in disease areas for which there are inadequate treatments and to explore the utility of our existing products in treating disorders beyond those currently approved in their labels.
In addition to ourOur innovative drug development efforts, we aimand commercialization activities are complemented by our biosimilar therapies that expand access to leveragemedicines and reduce the cost burden for healthcare systems.
We are leveraging our manufacturing capabilities and scientific expertiseknow-how by developing, manufacturing and marketing biosimilars through Samsung Bioepis, our joint venture with Samsung BioLogics Co. Ltd. (Samsung Biologics) that develops, manufactures and markets biosimilars as well as through other strategic contract manufacturing partners.. Under our commercial agreement, with Samsung Bioepis, we market and sell BENEPALI, an etanercept biosimilar referencing ENBREL, and FLIXABI, an infliximab biosimilar referencing REMICADE, in the European Union (E.U.)E.U.
Corporate Strategy Update
In July 2017 we announced an updated strategic framework to optimize the value of our MS business while investing for the future across our core growth areas of MS and neuroimmunology, Alzheimer's disease and dementia, Parkinson's disease and movement disorders, and neuromuscular diseases including SMA and amyotrophic lateral sclerosis (ALS). Further, we see opportunities to invest in emerging growth areas such as pain, ophthalmology, neuropsychiatry, and acute neurology.
We expect the continued performance of our commercial assets and the expiration of the contingent payments related to TECFIDERA to enable us to invest in and build an industry leading neuroscience pipeline. We view investment in growth as our top priority, but also recognize the value of opportunistically returning excess capital to shareholders through share repurchases.
In order to deliver positive results in the near term while investing in the next stages of our growth, we will focus on the following strategic priorities:
maximizing the resilience of our MS core business;
accelerating efforts in SMA as a significant new growth opportunity;
developing and expanding our neuroscience portfolio;
focusing our capital allocation efforts to drive investment for future growth; and
creating a leaner and simpler operating model to streamline our operations and reallocate resources towards prioritized research and development and commercial value creation opportunities.
Hemophilia Spin-Off
On February 1, 2017, we completed the spin-off of our hemophilia business, Bioverativ Inc. (Bioverativ), as an independent publicly traded company trading under the symbol "BIVV" on the Nasdaq Global Select Market. The spin-off was accomplished through the distribution of all the then outstanding shares of common stock of Bioverativ to Biogen shareholders, who received one share of Bioverativ common stock for every two shares of Biogen common stock they owned. The separation and distribution was structured to be tax-free for shareholders for federal income tax purposes. Bioverativ will assume all of our rights and obligations under our collaboration agreement with Swedish Orphan Biovitrum AB (Sobi) and our collaboration and license agreement with Sangamo Biosciences Inc.
Our consolidated results of operations and financial position included in these unaudited condensed consolidated financial statements reflect the financial results of our hemophilia business for all periods through January 31, 2017. For additional information related to the spin-off of our hemophilia business, please read Note 3, Hemophilia Spin-Off, to our condensed consolidated financial statements included in this report.
Financial Highlights
Diluted earnings per share attributable to Biogen Inc. were $4.79was $4.07 for the three months ended June 30, 2016,2017, representing an increasea decrease of 21.9%15.0% over the same period in 2015.2016.
Our income from operations for the three months ended June 30, 20162017, reflects the following:
Total revenues were $2,894.23,078.4 million for the second quarter of 20162017, representing an increase of 11.7%6.4% over the same period in 20152016.
Product revenues, net totaled $2,466.02,639.7 million for the second quarter of 20162017, representing an increase of 12.2%7.0% over the same period in 20152016. This increase was driven by an 11.7%revenues from SPINRAZA, a 12.6% increase in worldwide TECFIDERA revenues a 7.4% increase in worldwide TYSABRI revenues, a 5.6% increase in worldwide Interferon revenues and revenues from ELOCTATE, ALPROLIX and BENEPALI. Product revenues, net for the second quarter of 20162017, compared to the same period in 20152016, were also negatively impacted by a $44.7 million change in hedge results underthe elimination of worldwide ALPROLIX and ELOCTATE revenues resulting from the spin-off of our hedging program in the comparative period.hemophilia business on February 1, 2017.
Revenues from anti-CD20 therapeutic programs totaled $349.2397.1 million for the second quarter of 20162017, representing an increase of 3.5%13.7% over the same period in 20152016.
Other revenues totaled $79.0 million for the second quarter of 2016, representing an increase of 42.1% from the same period in 2015. This increase was primarily driven by an increase in other corporate revenue.
Total cost and expenses totaled $1,433.741.6 million for the second quarter of 2017, representing a decrease of 47.3% over the same period in 2016.
Total cost and expenses totaled $1,877.8 million for the second quarter of 2017, representing an increase of 5.5%31.0% compared toover the same period in 20152016. This increase was driven by a 29.4%68.3% increase in costresearch and development primarily due to a $300.0 million upfront payment made to Bristol-Myers Squibb Company (BMS) and a $60.0 million developmental milestone payable to iPierian, Inc. (iPierian) recognized in connection with our license agreement for the development of salesBMS-986168 (now known as BIIB092) and a $120.0 million charge to acquired in-process research and development expense related to the recognitionupfront payment made for the asset acquisition of a loss on fair value remeasurement of contingent consideration,CIRARA (now known as BIIB093) from Remedy Pharmaceuticals Inc. (Remedy). These increases were partially offset by a decrease of 3.6%12.6% decrease in researchselling, general and development expense.administrative expenses.
We generated $1,959.2$1,404.4 million of net cash flows from operations for the six months ended June 30, 2016, which were primarily driven by earnings.2017. Cash, cash equivalents and marketable securities totaled approximately $7,274.4$5,525.7 million as of June 30, 2016.2017.
Business Environment
The biopharmaceutical industry and the markets in which we operate are intensely competitive. Many of our competitors are working to develop or have commercialized products similar to those we market or are developing. In addition, the commercialization of certain of our own approved MS products, products of our collaborators and pipeline product candidates may negatively impact future sales of our existing MS products. Our products may also face increased competitive pressures from the introduction of generic versions prodrugs of existing therapeutics or biosimilars of existing products and other technologies, such as gene therapies and bispecific antibodies.technologies.
In addition, salesSales of our products are dependent, in large part, on the availability and extent of coverage, pricing and reimbursement from government health administration authorities, private health insurers and other organizations. Drug prices are under significant scrutiny in many of the markets in which our products are prescribed. Drug pricing and other health care costs continue to be subject to intense political and societal pressures.
In addition, our sales and operations are subject to the risks of doing business internationally. For example, the full scope of implementation of the U.K.’s referendum decision to voluntarily depart from
the E.U., known as Brexit, remains unclear; compliance with any resulting regulatory mandates may prove challenging and the macroeconomic impact on our sales and results of operations from these developments remains unknown.
For additional information related to our competition and pricing risks that could negatively impact our products,product sales, please read the “Risk Factors” section of this report.
Key Pipeline and Product Developments
TYSABRISPINRAZA (nusinersen)
In June 2016,2017 the European Commission (EC) approved a variationthe use of SPINRAZA for the treatment of SMA in pediatric and adult patients in the E.U. SPINRAZA was reviewed under the European Medicines Agency's (EMA) accelerated assessment program, intended to expedite access to patients with unmet medical needs.
In June 2017 SPINRAZA was approved in Canada for the marketing authorizationtreatment of TYSABRI, which extended its indicationSMA.
In July 2017 the Japanese Ministry of Health, Labor and Welfare approved the use of SPINRAZA for the treatment of infantile SMA.
ZINBRYTA (daclizumab)
In July 2017 the EMA announced that it has provisionally restricted the use of ZINBRYTA to include relapsing-remitting MSadult patients with highly active relapsing disease activity despite a full and adequate course of treatment with at least one disease modifying therapy. TYSABRI was previously only indicatedtherapy (DMT) or with rapidly evolving severe RMS who are unsuitable for patients who had failed to respond to beta-interferon or glatiramer acetate intreatment with other DMTs. These changes follow the E.U.initiation of an EMA review of ZINBRYTA, following the report of a case of fatal fulminant liver failure, as well as four cases of serious liver injury.
ZINBRYTAOCREVUS (Ocrelizumab)
In May 2016,March 2017 the Roche Group announced that the U.S. Food and Drug Administration (FDA) approved ZINBRYTAOCREVUS for the treatment of relapsing formsRMS and PPMS.
IMRALDI (adalimumab)
In June 2017 Samsung Bioepis received a positive opinion from the Committee for Medicinal Products for Human Use (CHMP) for the marketing authorization of MS and in July 2016,IMRALDI, an adalimumab biosimilar candidate referencing HUMIRA. The CHMP's recommendation was referred to the EC, approved ZINBRYTAwhich grants approval of marketing authorizations for the treatment of relapsing forms of MS. Under our collaboration agreement with AbbVie, we and AbbVie will conduct co-promotion activitiesmedicines in the E.U., U.S. and Canada Territories, where development and commercialization costs and profits are shared equally. Shipments of ZINBRYTA are expected to commence in the third quarter of 2016.
For additional information related toon our relationshipagreements with AbbVie,Samsung Bioepis, please read Note 19, Collaborative and Other Relationships, to our consolidated financial statements included in our 2015 Form 10-K.
Hemophilia
In March 2016 the EC approved the transfer of the marketing authorization for ELOCTA to Swedish Orphan Biovitrum AB (publ) (Sobi). As the marketing authorization holder, Sobi assumes full legal responsibility for ELOCTA, from a regulatory perspective, during its entire life cycle in the E.U.
In May 2016, the EC approved ALPROLIX in the E.U. for the treatment of hemophilia B. Under our collaboration agreement with Sobi, Sobi has assumed responsibility for final development and commercialization of ALPROLIX in their territory, which includes substantially all of Europe, Northern Africa, Russia, and certain markets in the Middle East (Sobi Territory).
Biosimilars
The EC approved Samsung Bioepis' marketing authorisation applications (MAAs) for BENEPALI and FLIXABI, two anti-tumor necrosis factor (TNF) biosimilars, for marketing in the E.U. in January 2016 and May 2016, respectively. Under our agreement with Samsung Bioepis, we manufacture and commercialize BENEPALI and FLIXABI in specified E.U. countries.
In July 2016, the European Medicine Agency (EMA) accepted Samsung Bioepis' MAA for SB5, an adalimumab biosimilar candidate referencing HUMIRA.
GAZYVA
In February 2016, the Roche Group announced that the FDA approved GAZYVA plus bendamustine chemotherapy followed by GAZYVA alone as a new treatment for people with follicular lymphoma who did not respond to a RITUXAN-containing regimen, or whose follicular lymphoma returned after such treatment. Follicular lymphoma is the most common type of indolent non-Hodgkin’s lymphoma.
In May 2016, the Roche Group announced positive results from the Phase 3 GALLIUM study, which investigated the efficacy and safety of GAZYVA in combination with chemotherapy followed by maintenance with GAZYVA alone, compared to RITUXAN in combination with chemotherapy followed by maintenance with RITUXAN alone in previously untreated patients with follicular lymphoma, the most common type of indolent non-Hodgkin's lymphoma. Results from a pre-planned interim analysis showed that GAZYVA-based treatment significantly reduced the risk of disease worsening or death compared to RITUXAN-based treatment.
In July 2016, the Roche Group announced that the Phase 3 GOYA study evaluating GAZYVA plus CHOP chemotherapy in people with previously untreated diffuse large B-cell lymphoma did not meet its primary endpoint of significantly reducing the risk of disease worsening or death compared to RITUXAN plus CHOP chemotherapy. Adverse events with GAZYVA and RITUXAN were consistent with those seen in previous clinical trials when each was combined with various chemotherapies.
For additional information related to our relationship with Genentech (Roche Group), please read Note 19, Collaborative and Other Relationships to our consolidated financial statements included in our 2015 Form 10-K.
OCREVUS (Ocrelizumab)
In June 2016, the Roche Group announced that the EMA validated its MAA of OCREVUS for the treatment of relapsing multiple sclerosis (RMS) and primary progressive multiple sclerosis (PPMS) in the E.U. Validation signifies the MAA is under review by the Committee for Medicinal Products for Human Use (CHMP). The FDA has also accepted for review its Biologics License Application for OCREVUS for the treatment of RMS and PPMS, and has granted the application Priority Review Designation with a targeted action date of December 28, 2016.
Under our agreement with Genentech, if OCREVUS is approved, we will receive tiered royalty payments on sales of OCREVUS. For additional information related to our relationship with Genentech, please read Note 19, Collaborative and Other Relationships to our consolidated financial statements included in our 2015 Form 10-K.
While we have a financial interest in OCREVUS, future sales of our MS products may be adversely affected by the commercialization of OCREVUS.
Aducanumab
In June 2016, we announced that aducanumab, our investigational treatment for early Alzheimer’s disease, was accepted into the EMA's Priority Medicines (PRIME) program. PRIME aims to bring treatments to patients faster by enhancing the EMA’s support for the development of investigational medicines for diseases without available treatment or in need of better treatment options. Aducanumab was accepted into PRIME based on results from the Phase 1b placebo-controlled study of aducanumab in patients with prodromal or mild Alzheimer’s disease. Through the PRIME program, we will have access to enhanced support from EMA, including advice at key development milestones and the potential for accelerated assessment of a MAA.
Anti-LINGO
In June 2016, we reported top-line results from SYNERGY our Phase 2 trial evaluating anti-LINGO in people with relapsing forms of MS. Anti-LINGO missed the primary endpoint of the SYNERGY trial as well as its secondary efficacy endpoint in the trial. We continue to analyze the results to determine the appropriate next steps.
Results of Operations
Revenues
Revenues are summarized as follows:
| | | | For the Three Months
Ended June 30, | | For the Six Months
Ended June 30, | For the Three Months
Ended June 30, | | For the Six Months
Ended June 30, |
| (In millions, except percentages) | 2016 | | 2015 | | 2016 | | 2015 | 2017 | | 2016 | | 2017 | | 2016 |
| Product revenues: | | | | | | | | | | | | | | | | | | | | | | | | | | | | | | |
| United States | $ | 1,777.5 |
| | 61.4 | % | | $ | 1,565.4 |
| | 60.4 | % | | $ | 3,440.8 |
| | 61.2 | % | | $ | 3,099.1 |
| | 60.2 | % | $ | 1,860.9 |
| | 60.5 | % | | $ | 1,777.5 |
| | 61.4 | % | | $ | 3,491.9 |
| | 59.3 | % | | $ | 3,440.8 |
| | 61.2 | % |
| Rest of world | 688.5 |
| | 23.8 | % | | 633.2 |
| | 24.4 | % | | 1,334.6 |
| | 23.7 | % | | 1,271.8 |
| | 24.7 | % | 778.8 |
| | 25.2 | % | | 688.5 |
| | 23.8 | % | | 1,527.9 |
| | 26.0 | % | | 1,334.6 |
| | 23.7 | % |
| Total product revenues | 2,466.0 |
| | 85.2 | % | | 2,198.6 |
| | 84.8 | % | | 4,775.4 |
| | 85.0 | % | | 4,370.9 |
| | 84.9 | % | 2,639.7 |
| | 85.7 | % | | 2,466.0 |
| | 85.2 | % | | 5,019.8 |
| | 85.3 | % | | 4,775.4 |
| | 84.9 | % |
| Revenues from anti-CD20 therapeutic programs | 349.2 |
| | 12.1 | % | | 337.5 |
| | 13.0 | % | | 678.7 |
| | 12.1 | % | | 668.1 |
| | 13.0 | % | 397.1 |
| | 12.9 | % | | 349.2 |
| | 12.1 | % | | 737.7 |
| | 12.5 | % | | 678.7 |
| | 12.1 | % |
| Other revenues | 79.0 |
| | 2.7 | % | | 55.6 |
| | 2.1 | % | | 166.9 |
| | 3.0 | % | | 107.6 |
| | 2.1 | % | 41.6 |
| | 1.4 | % | | 79.0 |
| | 2.7 | % | | 131.6 |
| | 2.2 | % | | 166.9 |
| | 3.0 | % |
| Total revenues | $ | 2,894.2 |
| | 100.0 | % | | $ | 2,591.6 |
| | 100.0 | % | | $ | 5,621.0 |
| | 100.0 | % | | $ | 5,146.6 |
| | 100.0 | % | $ | 3,078.4 |
| | 100.0 | % | | $ | 2,894.2 |
| | 100.0 | % | | $ | 5,889.1 |
| | 100.0 | % | | $ | 5,621.0 |
| | 100.0 | % |
Product Revenues
Product revenues are summarized as follows:
| | | | For the Three Months
Ended June 30, | | For the Six Months
Ended June 30, | For the Three Months
Ended June 30, | | For the Six Months
Ended June 30, |
| (In millions, except percentages) | 2016 | | 2015 | | 2016 | | 2015 | 2017 | | 2016 | | 2017 | | 2016 |
| Multiple Sclerosis: | | | | | | | | | | | | | | | | | | | | | | | | | | | | | | |
| TECFIDERA | $ | 986.5 |
| | 40.0 | % | | $ | 883.3 |
| | 40.2 | % | | $ | 1,932.4 |
| | 40.5 | % | | $ | 1,708.2 |
| | 39.1 | % | $ | 1,110.6 |
| | 42.1 | % | | $ | 986.5 |
| | 40.0 | % | | $ | 2,068.8 |
| | 41.2 | % | | $ | 1,932.4 |
| | 40.5 | % |
| Interferon* | 728.3 |
| | 29.5 | % | | 689.7 |
| | 31.4 | % | | 1,398.7 |
| | 29.3 | % | | 1,444.2 |
| | 33.0 | % | 690.6 |
| | 26.2 | % | | 728.3 |
| | 29.5 | % | | 1,338.9 |
| | 26.7 | % | | 1,398.7 |
| | 29.3 | % |
| TYSABRI | 497.4 |
| | 20.1 | % | | 463.1 |
| | 21.1 | % | | 974.4 |
| | 20.4 | % | | 925.7 |
| | 21.2 | % | 496.0 |
| | 18.8 | % | | 497.4 |
| | 20.1 | % | | 1,041.0 |
| | 20.7 | % | | 974.4 |
| | 20.4 | % |
| FAMPYRA | 21.6 |
| | 0.9 | % | | 21.1 |
| | 1.0 | % | | 41.8 |
| | 0.9 | % | | 41.1 |
| | 0.9 | % | 22.6 |
| | 0.8 | % | | 21.6 |
| | 0.9 | % | | 43.1 |
| | 0.9 | % | | 41.8 |
| | 0.9 | % |
| ZINBRYTA | | 16.1 |
| | 0.6 | % | | — |
| | — | % | | 26.8 |
| | 0.5 | % | | — |
| | — | % |
| Spinal Muscular Atrophy: | | | | | | | | | | | | | | | | |
| SPINRAZA | | 202.9 |
| | 7.7 | % | | — |
| | — | % | | 250.3 |
| | 5.0 | % | | — |
| | — | % |
| Hemophilia: | | |
| | | |
| | | |
| | | |
| | |
| | | |
| | | |
| | | |
|
| ELOCTATE | 124.7 |
| | 5.1 | % | | 74.3 |
| | 3.4 | % | | 232.4 |
| | 4.9 | % | | 127.9 |
| | 2.9 | % | — |
| | — | % | | 124.7 |
| | 5.1 | % | | 48.4 |
| | 1.0 | % | | 232.4 |
| | 4.9 | % |
| ALPROLIX | 80.3 |
| | 3.3 | % | | 54.4 |
| | 2.5 | % | | 155.3 |
| | 3.2 | % | | 97.5 |
| | 2.2 | % | — |
| | — | % | | 80.3 |
| | 3.3 | % | | 26.0 |
| | 0.5 | % | | 155.3 |
| | 3.2 | % |
| Other product revenues: | | | | | | | | | | | | | | | | |
| Other Product Revenues: | | | | | | | | | | | | | | | | |
| FUMADERM | 11.8 |
| | 0.5 | % | | 12.7 |
| | 0.6 | % | | 23.2 |
| | 0.5 | % | | 26.3 |
| | 0.6 | % | 10.3 |
| | 0.4 | % | | 11.8 |
| | 0.5 | % | | 20.0 |
| | 0.4 | % | | 23.2 |
| | 0.5 | % |
| BENEPALI | 15.4 |
| | 0.6 | % | | — |
| | — | % | | 17.2 |
| | 0.4 | % | | — |
| | — | % | 88.7 |
| | 3.4 | % | | 15.4 |
| | 0.6 | % | | 154.0 |
| | 3.1 | % | | 17.2 |
| | 0.4 | % |
| FLIXABI | | 1.9 |
| | — | % | | — |
| | — | % | | 2.5 |
| | — | % | | — |
| | — | % |
| Total product revenues | $ | 2,466.0 |
| | 100.0 | % | | $ | 2,198.6 |
| | 100.0 | % | | $ | 4,775.4 |
| | 100.0 | % | | $ | 4,370.9 |
| | 100.0 | % | $ | 2,639.7 |
| | 100.0 | % | | $ | 2,466.0 |
| | 100.0 | % | | $ | 5,019.8 |
| | 100.0 | % | | $ | 4,775.4 |
| | 100.0 | % |
*Interferon includes AVONEX and PLEGRIDY.
Multiple Sclerosis (MS)
TECFIDERA
For the three months ended June 30, 2017, compared to the same period in 2016, the increase in U.S. TECFIDERA revenues was primarily due to price increases and an increase in unit sales volume of 2%, partially offset by higher discounts and allowances.
For the six months ended June 30, 2016,2017, compared to the same periodsperiod in 2015,2016, the increase in U.S. TECFIDERA revenues was primarily due to price increases, partially offset by higher discounts and allowances.
allowances and a decrease in unit sales volume of 3%.
For the three and six months ended June 30, 2016,2017, compared to the same periods in 2015,2016, the increase in rest of world TECFIDERA revenues was primarily due to increases in unit sales volume of 39%25% and 45%20%, respectively, including sales in existing markets and new markets where we continue to launch the product and expand our presence around the world. Rest of worldThese increases were partially offset by pricing reductions in certain European countries.
We anticipate relatively stable demand for TECFIDERA revenues for the three and six months ended June 30, 2016, compared to the same periods in 2015, were negatively impacted by2017 on a $12.7 million and $19.9 million changeglobal basis, with patient growth in hedge results under our hedging programinternational markets offsetting modest patient declines in the comparative periods, respectively.U.S., primarily resulting from increasing competition from additional treatments for MS, including OCREVUS.
Interferon
AVONEX and PLEGRIDY
For the three months ended June 30, 2016, compared to the same period in 2015, the increase in U.S. Interferon revenues was primarily due to price increases and an overall increase in Interferon unit sales volume, which was mainly attributable to an increase in PLEGRIDY unit sales volume, partially offset by higher discounts and allowances.
For the six months ended June 30, 2016, compared to the same period in 2015, the increase in U.S. Interferon revenues was primarily due to gross price increases, partially offset by an overall decrease in Interferon unit sales volume attributable to a decrease in AVONEX unit sales volume and higher discounts and allowances.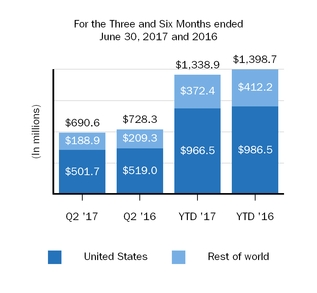
For the three and six months ended June 30, 2016,2017, U.S. AVONEX revenues totaled $442.2$420.4 million and $842.2$820.5 million, respectively, as compared to $404.7$442.2 million and $883.4 million, respectively, in the prior year comparative periods.
For the three and six months ended June 30, 2016, U.S. PLEGRIDY revenues totaled $76.8 million and $144.3 million, respectively, as compared to $50.4 million and $89.9 million, respectively, in the prior year comparative periods.
For the three and six months ended June 30, 2016, compared to the same periods in 2015, the decrease in rest of world Interferon revenues was primarily due to pricing reductions in certain European countries, partially offset by an overall increase in Interferon unit sales volume attributable to an increase in PLEGRIDY unit sales volume, partially offset by a decrease in AVONEX unit sales volume. Rest of world Interferon revenues for the three and six months ended June 30, 2016, compared to the same periods in 2015, were also negatively impacted by a $18.0 million and $29.3 million change in hedge results under our hedging program in the comparative periods, respectively.
For the three and six months ended June 30, 2016, rest of world AVONEX revenues totaled $163.4 million and $327.5 million, respectively, as compared to $210.5 million and $424.5$842.2 million, respectively, in the prior year comparative periods.
For the three and six months ended June 30, 2016, rest of world2017, U.S. PLEGRIDY revenues totaled $45.9$81.3 million and $84.7$146.0 million, respectively, as compared to $24.1$76.8 million and $46.4$144.3 million, respectively, in the prior year comparative periods.
For the three and six months ended June 30, 2017, compared to the same periods in 2016, the decrease in U.S. Interferon revenues was primarily due to an overall decrease in Interferon unit sales volumes of 11% and 12%, respectively, which was primarily attributable to patients transitioning to other oral MS therapies, partially offset by price increases.
For the three and six months ended June 30, 2017, rest of world AVONEX revenues totaled $137.1 million and $273.5 million, respectively, as compared to $163.4 million and $327.5 million, respectively, in the prior year comparative periods.
For the three and six months ended June 30, 2017, rest of world PLEGRIDY revenues totaled $51.8 million and $98.9 million, respectively, as compared to $45.9 million and $84.7 million, respectively, in the prior year comparative periods.
For the three and six months ended June 30, 2017, compared to the same periods in 2016, the decrease in rest of world Interferon revenues was primarily due to an overall decrease in AVONEX unit sales volumes of 14%, primarily due to patients transitioning to other oral MS therapies.
We expect that overall Interferon revenues will continue to decline compared to prior year periods as a result of increasing competition from our other products including TECFIDERA, as well as other MS therapies.treatments for MS.
TYSABRI
For the three months ended June 30, 2017, compared to the same period in 2016, the decrease in U.S. TYSABRI revenues was primarily due to a 4% decrease in unit sales volume and higher discounts and allowances, partially offset by price increases.
For the six months ended June 30, 2016,2017, compared to the same periodsperiod in 2015,2016, the increase in U.S. TYSABRI revenues was primarily due to price increases, in unit sales volume of 6% and 3%, respectively, and increases in gross selling prices partially offset by higher discounts and allowances.
For the three and six months ended June 30, 2016,2017, compared to the same periodsperiod in 2015,2016, the decreaseincrease in rest of world TYSABRI revenues was primarily due to pricing reductions in certain European countries, partially offset by ana 11% increase in unit sales volume of 13% and 10%, respectively, primarily in Europe. Rest of world TYSABRI revenues forvolume.
For the three and six months ended June 30, 2016,2017, compared to the same periodsperiod in 2015, were also negatively impacted by a $12.72016, the increase in rest of world TYSABRI revenues was primarily due to the recognition of approximately $45.0 million and $19.3 million changeof previously deferred revenue in hedge results under our hedging program inItaly relating to the comparative periods, respectively.
In the fourth quarter of 2011, Biogen Italia SRL, our Italian subsidiary, received a notice frompricing agreement with the Italian National Medicines Agency (Agenzia Italiana del Farmaco, or AIFA) that, as discussed below, and a 12% increase in unit sales volume.
In the first quarter of 2017, we reached an agreement with AIFA's Price and Reimbursement Committee resolving all of AIFA's claims relating to sales of TYSABRI after mid-February 2009 exceeded ain excess of the reimbursement limit established pursuant to a Price Determination Resolution (Price Resolution) granted by AIFA in December 2006. AIFA and Biogen Italia SRL are still discussing a possible resolution for the period from February 2009 through January 2013. If our most recent settlement offer is accepted, we could recognize approximately EUR40 million in revenue upon resolution of this matter. prior periods.
For information regarding our agreement with AIFA relating to sales of TYSABRI in Italy, please read Note 17,20, Other Consolidated Financial Statement DetailLitigation, to our consolidated financial statements included in our 20152016 Form 10-K.
We expect thatanticipate relatively stable demand for TYSABRI revenues will continue to facein 2017 on a global basis, with patient growth in our international markets offsetting modest patient declines in the U.S. primarily resulting from increasing competition from additional treatments for MS, includingprimarily OCREVUS.
ZINBRYTA
Under the terms of our collaboration agreement with AbbVie Inc. (AbbVie), we began to recognize revenues on sales of ZINBRYTA to third parties in the E.U. in the third quarter of 2016.
For additional information on our relationship with AbbVie, please read Note 18, Collaborative and other MS product candidates, including OCREVUS.Other Relationships, to our condensed consolidated financial statements included in this report.
Hemophilia
ELOCTATESpinal Muscular Atrophy (SMA)
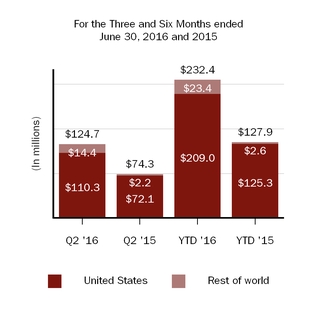
For
We began to recognize revenues on sales of SPINRAZA in the threeU.S. in the fourth quarter of 2016 and six months ended June 30, 2016, compared to the same periods in 2015, the increase in U.S. ELOCTATE revenues was primarily due to an increase in unit sales volume of 53% and 70%, respectively.
For the three and six months ended June 30, 2016, compared to the same periods in 2015, the increase in rest of world ELOCTATE revenues was primarily duein the first quarter of 2017.
For additional information on our relationship with Ionis Pharmaceuticals, Inc. (Ionis), please read Note 18, Collaborative and Other Relationships, to an increaseour condensed consolidated financial statements included in unit sales volume primarily in Japan.
this report.
ALPROLIXBiosimilars
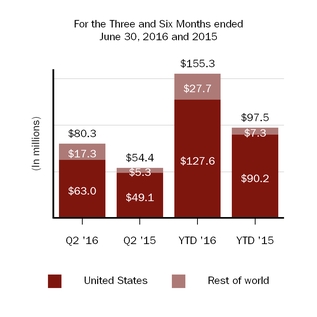
For the three and six months ended June 30, 2016, compared to the same periods in 2015, the increase in U.S. ALPROLIX revenues was primarily due to an increase in unit sales volume of 33% and 43%, respectively.
For the three and six months ended June 30, 2016, compared to the same periods in 2015, the increase in rest of world ALPROLIX revenues was primarily due to an increase in unit sales volume primarily in Japan.
We expect continued growth of ELOCTATE as there remains a significant portion of the patient population that we believe can benefit from long-acting therapies. We also expect continued growth for ELOCTATE and ALPROLIX as we and Sobi expand into additional markets.
BENEPALI
Under the terms of our commercial agreement with Samsung Bioepis, we began to recognize revenues on sales of BENEPALI and FLIXABI to third parties in the E.U. in the first quarterand third quarters of 2016.2016, respectively.
For additional information on our relationship with Samsung Bioepis, please read Note 17,18, Collaborative and Other Relationships, to our condensed consolidated financial statements included in this report.
Revenues from Anti-CD20 Therapeutic Programs
Genentech (Roche Group)
Our share of RITUXAN and GAZYVA collaboration operating profits and royalty revenues on OCREVUS are summarized as follows:
Biogen’s Share of Pre-tax Profits in the U.S. for RITUXAN and GAZYVA
The following tables provide a summary of amounts comprising our share of pre-tax profits on RITUXAN and GAZYVA in the U.S.:
|
| | | | | | | |
| | For the Three Months
Ended June 30, |
| (In millions) | 2017 | | 2016 |
| Product revenues, net | $ | 1,083.8 |
| | $ | 1,032.8 |
|
| Cost and expenses | 193.6 |
| | 178.1 |
|
| Pre-tax profits in the U.S. | 890.2 |
| | 854.7 |
|
| Biogen's share of pre-tax profits | $ | 347.5 |
| | $ | 333.9 |
|
|
| | | | | | | |
| | For the Three Months
Ended June 30, |
| (In millions) | 2016 | | 2015 |
| Product revenues, net | $ | 1,032.8 |
| | $ | 985.8 |
|
| Cost and expenses | 178.1 |
| | 181.4 |
|
| Pre-tax profits in the U.S. | 854.7 |
| | 804.4 |
|
| Biogen's share of pre-tax profits | $ | 333.9 |
| | $ | 323.2 |
|
|
| | | | | | | |
| | For the Six Months
Ended June 30, |
| (In millions) | 2016 | | 2015 |
| Product revenues, net | $ | 2,007.5 |
| | $ | 1,942.0 |
|
| Cost and expenses | 353.2 |
| | 355.3 |
|
| Pre-tax profits in the U.S. | 1,654.3 |
| | 1,586.7 |
|
| Biogen's share of pre-tax profits | $ | 646.7 |
| | $ | 632.8 |
|
|
| | | | | | | |
| | For the Six Months
Ended June 30, |
| (In millions) | 2017 | | 2016 |
| Product revenues, net | $ | 2,124.8 |
| | $ | 2,007.5 |
|
| Cost and expenses | 394.9 |
| | 353.2 |
|
| Pre-tax profits in the U.S. | 1,729.9 |
| | 1,654.3 |
|
| Biogen's share of pre-tax profits | $ | 671.0 |
| | $ | 646.7 |
|
For the three and six months ended June 30, 2016,2017, compared to the same periods in 2015,2016, the increase in U.S. product revenues was primarily due to selling price increases, and increasesan increase in RITUXAN unit sales volume of 3%2% and 2%1%, respectively, and an increase in GAZYVA unit sales volume of 35% and 30%, respectively, partially offset by higher discounts and allowances.
Collaboration costs and expenses for the three and six months ended June 30, 2016,2017, as depicted in the table above, excludes certain expenses charged to the collaboration by Genentech that we believe remain the responsibility of Genentech and we are not obligated to pay under the terms of the collaboration agreement. Accordingly, we did not recognize the effect of those expenses in determination of our share of pre-tax collaboration profits and Genentech has withheld approximately $120 million from amounts due to us in relation to the first quarter of 2017 collaboration activity, representing Genentech’s estimate of our share of these expenses. We remain in discussions with Genentech about a resolution relating to these amounts. Excluding amounts under dispute, collaboration costs and expenses for the three and six months ended June 30, 2017, compared to the same periods in 2015, were relatively consistent.2016, increased primarily due to an increase in RITUXAN product cost of sales.
Our share of RITUXAN annual pre-tax co-promotion profits in the U.S. in excess of $50.0 million decreased to 39% from 40% asin February 2016 when GAZYVA was approved by the FDA inas a new treatment for follicular lymphoma and will further decrease to 37.5% in February 2016.the second half of 2017 as gross sales of GAZYVA in the U.S. for the preceding 12 month period exceeded $150.0 million.
Other Revenues from Anti-CD20 Therapeutic Programs
Other revenues from anti-CD20 therapeutic programs primarily consist of our share of pre-tax co-promotion profits on RITUXAN in Canada, including a one-time adjustment to revenue recognized in Canada, and royalty revenues on sales of OCREVUS. For the three and six months ended June 30, 2017, compared to the same periods in 2016, other revenues from anti-CD20 therapeutic programs increased due to the launch of OCREVUS in the second quarter of 2017 and the commencement of RITUXAN pre-tax co-promotion profit recognition for Canada in the same period as the underlying product sales.
In March 2017 the FDA approved OCREVUS for the treatment of RMS and PPMS. Under the terms of our agreement with Genentech, we will receive a tiered royalty on U.S. net sales from 13.5% and increasing up to 24% if annual net sales exceed $900.0 million.
The commercialization of OCREVUS does not impact the percentage of the co-promotion profits we receive for RITUXAN or GAZYVA. Genentech is solely responsible for development and commercialization of OCREVUS, a humanized anti-CD20 monoclonal antibody, and funding future costs. OCREVUS royalty revenues were based on our estimates from third party and market research data of OCREVUS sales occurring during the corresponding period. Differences between actual and estimated royalty revenues will be adjusted for in the period in which they become known, which is expected to be the following quarter.
For additional information related to our collaboration with Genentech, including information regarding the pre-tax profit sharing formula and its impact on future revenues from anti-CD20 therapeutic programs, please read Note 19, Collaborative and Other Relationships, to our consolidated financial statements included in our 20152016 Form 10-K.
Revenue on Sales in the Rest of World for RITUXAN
Revenue on sales in the rest of world for RITUXAN consists of our share of pre-tax co-promotion profits on RITUXAN in Canada and royalty revenue on sales outside the U.S. and Canada. For the three months ended June 30, 2016, compared to the same period in 2015, revenue on sales in the rest of world for RITUXAN increased as a result of higher pre-tax co-promotion profits on RITUXAN in Canada.
For the six months ended June 30, 2016, compared to the same period in 2015, revenue on sales in the rest of world for RITUXAN decreased as a result of lower pre-tax co-promotion profits on RITUXAN in Canada and patent expirations.
Other Revenues
Other revenues are summarized as follows: | | | | For the Three Months
Ended June 30, | | For the Six Months
Ended June 30, | For the Three Months
Ended June 30, | | For the Six Months
Ended June 30, |
| (In millions, except percentages) | 2016 | | 2015 | | 2016 | | 2015 | 2017 | | 2016 | | 2017 | | 2016 |
| Revenues from collaborative and other relationships | $ | 19.6 |
| | 24.8 | % | | $ | 17.2 |
| | 30.9 | % | | $ | 31.1 |
| | 18.6 | % | | $ | 36.1 |
| | 33.6 | % | $ | 9.0 |
| | 21.6 | % | | $ | 19.6 |
| | 24.8 | % | | $ | 15.3 |
| | 11.6 | % | | $ | 31.1 |
| | 18.6 | % |
| Other royalty and corporate revenues | 59.4 |
| | 75.2 | % | | 38.4 |
| | 69.1 | % | | 135.8 |
| | 81.4 | % | | 71.5 |
| | 66.4 | % | 32.6 |
| | 78.4 | % | | 59.4 |
| | 75.2 | % | | 116.3 |
| | 88.4 | % | | 135.8 |
| | 81.4 | % |
| Total other revenues | $ | 79.0 |
| | 100.0 | % | | $ | 55.6 |
| | 100.0 | % | | $ | 166.9 |
| | 100.0 | % | | $ | 107.6 |
| | 100.0 | % | $ | 41.6 |
| | 100.0 | % | | $ | 79.0 |
| | 100.0 | % | | $ | 131.6 |
| | 100.0 | % | | $ | 166.9 |
| | 100.0 | % |
Revenues from Collaborative and Other Relationships
Revenues from collaborative and other relationships include revenues earned under our 50% share of the co-promotion profits or losses of ZINBRYTA in the U.S. with AbbVie and revenues from our technical development and manufacturing services agreements with Samsung Bioepis. Prior to the spin-off of our hemophilia business, revenues from collaborative and other relationships also included revenues earned under our manufacturing services agreement with Sobi on shipments of ELOCTA and ALPROLIX to Sobi and royalties from Sobi on sales of ELOCTA and ALPROLIX in their territory, which included substantially all of Europe, Russia and certain markets in Northern Africa and the Middle East. Bioverativ assumed all of our rights and obligations under our agreement with Sobi Territory, and revenues from our license, technical development and manufacturing services agreements with Samsung Bioepis.on February 1, 2017.
For the three months ended June 30, 2016, compared to the same period in 2015, the increase in revenues from collaborative and other relationships is primarily due to an increase in ELOCTA shipments made under our manufacturing services agreement with Sobi.
For the six months ended June 30, 2016,2017, compared to the same periodperiods in 2015,2016, the decrease in revenues from collaborative and other relationships iswas primarily due to lower revenues earnednet losses recognized in the U.S. territory under our manufacturing services agreementcollaboration with Samsung Bioepis, partially offset by an increase in ELOCTA shipments made underAbbVie during the three and six months ended June 30, 2017, totaling $3.9 million and $9.8 million, respectively, and the impact of the spin-off of our manufacturing services agreement with Sobi.hemophilia business on February 1, 2017.
For additional information on our collaborativecollaboration agreements with AbbVie and other relationships,Samsung Bioepis, please read Note 17,18, Collaborative and Other Relationships, to our condensed consolidated financial statements included in this report.
Other Royalty and Corporate Revenues
Royalty Revenues
We receive royalties from net sales on products related to patents that we have out-licensed.
For the three and six months ended June 30, 2016, compared to the same periods in 2015, royalty revenues were relatively consistent.
Other Corporate Revenues
Our other corporate revenues include amounts earned under contract manufacturing agreements.
For the three and six months ended June 30, 2016,2017, compared to the same periods in 2015,2016, the increasedecrease in other corporate revenues was primarily due to higherlower contract manufacturing revenues related to servicesthe timing of shipments of drug substance production provided to a strategic partner.
Reserves for Discounts and Allowances
Revenues from product sales are recorded net of reserves established for applicable discounts and allowances, including those associated with the implementation of pricing actions in certain international markets where we operate.
Reserves established for these discountsThese reserves are based on estimates of the amounts earned or to be claimed on the related sales and allowances are classified as reductions of accounts receivable (if the amount is payable to our customer) or a liability (if the amount is payable to a party other than our customer). These reserves are based on estimates of the amounts earned or to be claimed on the related sales. Our estimates take into consideration our historical experience, current contractual and statutory requirements, specific known market events and trends, industry data and forecasted customer buying and payment patterns. Actual amounts may ultimately differ from our estimates. If actual results vary, we adjust these estimates, which will have an effect on earnings in same the period. To date, such adjustments have not been significant.period of adjustment.
Reserves for discounts, contractual adjustments and returns that reduced gross product revenues are summarized as follows:
For the three and six months ended June 30, 2017, reserves for discounts and allowances as a percentage of gross product revenues were 21.2% and 22.0%, respectively, as compared to 20.5% and 20.8%, respectively, in the prior year comparative periods.
Discounts
Discounts include trade term discounts and wholesaler incentives.
For the three and six months ended June 30, 2016,2017, compared to the same periods in 2015,2016, the increase in discounts was primarily driven by increasesan increase in rest of world product revenues, due in part to an increase in biosimilar revenues, as well as an increase in gross selling price and contractual discount rates.prices, partially offset by the impact from the spin-off of our hemophilia business on February 1, 2017.
Contractual Adjustments
Contractual adjustments relate to Medicaid and managed care rebates, co-payment assistance, Veterans Administration, Public Health Service discounts, specialty pharmacy program fees and other government rebates or applicable allowances.
For the three and six months ended June 30, 2016,2017, compared to the same periods in 2015,2016, the increase in contractual adjustments was primarily due to higher Medicaid and other governmental rebates and allowances in the U.S., and managed care rebates, as a result ofdue in part to an increase in gross selling prices and contractual rates.the launch of SPINRAZA in the U.S. in the fourth quarter of 2016, partially offset by the impact from the spin-off of our hemophilia business on February 1, 2017.
Returns
Product return reserves are established for returns made by wholesalers. In accordance with contractual terms, wholesalers are permitted to return product for reasons such as damaged or expired product. The majority of wholesaler returns are due to product expiration. Provisions for product returns are recorded in the period the related revenue is recognized, resulting in a reduction to product sales.
For the threesix months ended June 30, 2016,2017, compared to the same period in 2015,2016, return provisions decreased primarily due to a reduction in return rates based on recent experiences of returned products.
For the six months ended June 30, 2016, compared to the same period in 2015, return provisions increased primarily due to higher unit sales volume, partially offset by a reduction inU.S. return rates based on recent experiences of returned products.
For additional information related to our reserves, please read Note 3,4, Reserves for Discounts and Allowances, to our condensed consolidated financial statements included in this report.
Cost and Expenses
A summary of total cost and expenses is as follows:
| | | | For the Three Months
Ended June 30, | | For the Six Months
Ended June 30, | For the Three Months
Ended June 30, | | For the Six Months
Ended June 30, |
| (In millions, except percentages) | 2016 | | 2015 | | Change % | | 2016 | | 2015 | | Change % | 2017 | | 2016 | | Change % | | 2017 | | 2016 | | Change % |
| Cost of sales, excluding amortization of acquired intangible assets | $ | 370.3 |
| | $ | 286.1 |
| | 29.4 | % | | $ | 683.3 |
| | $ | 598.6 |
| | 14.1 | % | $ | 366.2 |
| | $ | 370.3 |
| | (1.1 | )% | | $ | 750.8 |
| | $ | 683.3 |
| | 9.9 | % |
| Research and development | 473.1 |
| | 490.7 |
| | (3.6 | )% | | 910.4 |
| | 951.3 |
| | (4.3 | )% | 796.2 |
| | 473.1 |
| | 68.3 | % | | 1,219.6 |
| | 910.4 |
| | 34.0 | % |
| Selling, general and administrative | 492.4 |
| | 491.9 |
| | 0.1 | % | | 989.7 |
| | 1,052.3 |
| | (5.9 | )% | 430.2 |
| | 492.4 |
| | (12.6 | )% | | 929.3 |
| | 989.7 |
| | (6.1 | )% |
| Amortization of acquired intangible assets | 92.9 |
| | 92.0 |
| | 1.0 | % | | 181.7 |
| | 187.9 |
| | (3.3 | )% | 117.5 |
| | 92.9 |
| | 26.5 | % | | 566.0 |
| | 181.7 |
| | 211.5 | % |
| Acquired in-process research and development | | 120.0 |
| | — |
| | ** |
| | 120.0 |
| | — |
| | ** |
|
| Collaboration profit (loss) sharing | | 26.5 |
| | (5.6 | ) | | ** |
| | 47.3 |
| | (5.6 | ) | | ** |
|
| (Gain) loss on fair value remeasurement of contingent consideration | 10.6 |
| | (2.2 | ) | | (581.8 | )% | | 12.9 |
| | 5.6 |
| | 130.4 | % | 21.2 |
| | 10.6 |
| | 100.0 | % | | 31.2 |
| | 12.9 |
| | 141.9 | % |
| Restructuring charges | — |
| | — |
| | ** |
| | 9.7 |
| | — |
| | ** |
| — |
| | — |
| | ** |
| | — |
| | 9.7 |
| | (100.0 | )% |
| Collaboration profit (loss) sharing | (5.6 | ) | | — |
| | ** |
| | (5.6 | ) | | — |
| | ** |
| |
| Total cost and expenses | $ | 1,433.7 |
| | $ | 1,358.5 |
| | 5.5 | % | | $ | 2,782.1 |
| | $ | 2,795.6 |
| | (0.5 | )% | $ | 1,877.8 |
| | $ | 1,433.7 |
| | 31.0 | % | | $ | 3,664.2 |
| | $ | 2,782.1 |
| | 31.7 | % |
** Percentage not meaningful.
Cost of Sales, Excluding Amortization of Acquired Intangible Assets
Product Cost of Sales
For the three months ended June 30, 2017, compared to the same period in 2016, the decrease in product cost of sales was primarily driven by the impact from the spin-off of our hemophilia business on February 1, 2017, lower contract manufacturing and the accelerated depreciation recorded in the second quarter of 2016 as a result of our decision to cease manufacturing in Cambridge, MA. These decreases were partially offset by higher unit sales volume related to our biosimilar product shipments and inventory amounts written down as a result of excess, obsolescence, unmarketability or other reasons.
For the six months ended June 30, 20162017, compared to the same periodsperiod in 2015,2016, the increase in product cost of sales was primarily driven by an increase inhigher unit sales volume related to our biosimilar product shipments and inventory amounts written down as a result of excess, obsoleteobsolescence, unmarketability or unsaleable inventory, higher unit sales volume related to PLEGRIDY, ELOCTATE and ALPROLIX and increased contract manufacturing production,other reasons. These increases were partially offset by favorable production costs and mixthe impact from the spin-off of products.
Product costour hemophilia business on February 1, 2017, the accelerated depreciation recorded in the second quarter of sales for the three and six months ended June 30, 2016 also reflects the recognition of $15.8 million of accelerated depreciation as a result of the determination that we intendour decision to cease manufacturing in Cambridge, MA and vacatelower contract manufacturing shipments.
For additional information related to our biologicsCambridge, MA manufacturing facility, please read Note 3, Restructuring, Business Transformation and Other Cost Saving Initiatives, to our consolidated financial statements included in Cambridge, MA and warehouse space in Somerville, MA by the end of 2016.our 2016 Form 10-K.
Royalty Cost of Sales
For the three and six months ended June 30, 2016,2017, compared to the same periods in 2015,2016, the increase in royalty cost of sales was primarily driven by higher royalties on sales of AVONEX and PLEGRIDY in the increase in royalty rates payable to SobiU.S., as noted below, and increasedthe recognition of royalties on sales of SPINRAZA. These increases were partially offset by the impact from the spin-off of our hemophilia business on February 1, 2017 and lower royalties on sales of TYSABRI and our hemophilia products.resulting from the expiration of certain third party royalties.
For additional information on our relationship with Sobi, please read Note 17, Collaborative and Other Relationships to our condensed consolidated financial statements included in this report.
On June 28, 2016, the U.S. Patent and Trademark Office issued to the Japanese Foundation for Cancer Research (JFCR) a patent related to recombinant interferon-beta protein. This patent, USU.S. Patent No. 9,376,478, expires in June 2033. This patent2033, and was issued following an interference proceeding amongbetween JFCR and us. This patent is relevant to AVONEX and PLEGRIDY, and we will pay royalties in the mid singlemid-single digits in relation to this patent during the life of the patent. The royalty payment is expected to be approximately $50 million for the remainder of 2016.its life.
We support our drug discovery and development efforts through the commitment of significant resources to discovery, research and development programs and business development opportunities, particularly within areas of our scientific, manufacturing and technical capabilities.
A significant amount of our research and development costs consist of indirect costs incurred in support of overall research and development activities and non-specific programs, including activities that benefit multiple programs, such as management costs, as well as depreciation, information technology and facility-based expenses. These costs are considered other research and development costs in the table above and are not allocated to a specific program or stage.
Research and development expense incurred in support of our marketed products includes costs associated with product lifecycle management activities including, if applicable, costs associated with the development of new indications for existing products. Late stage programs are programs in Phase 3 development or in registration stage. Early stage
programs are programs in Phase 1 or Phase 2 development. Research and discovery represents costs incurred to support our discovery research and translational science efforts. Other research and development costs consist of indirect costs incurred in support of overall research and development activities and non-specific programs, including activities that benefit multiple programs, such as management costs as well as depreciation and other facility-based expenses. Costs are reflected in the development stage based upon the program status when incurred. Therefore, the same program could be reflected in different development stages in the same year. For several of our programs, the research and development activities are part of our collaborative and other relationships. Our costs reflect our share of the total costs incurred.
For the three and six months ended June 30, 20162017, compared to the same periodperiods in 2015,2016, the decreaseincrease in research and development expense was primarily related to decreases inmilestone and upfront expenses, partially offset by decreased costs incurred in connection with our early stage programs and marketed products partially offset by increased costs incurred in connection with our late stage programs.
For the six months ended June 30, 2016 compared to the same period in 2015, the decrease inand research and development expense was primarily related to a decreasediscovery.
The increase in milestone and upfront expenses and decreases in costs incurred in connection with our early stage programs and marketed products, partially offset by increased costs incurred in connection with our late stage programs.
The decrease in spending associated with our early stage programs for the three and six months ended June 30, 2016,2017, compared to the same periods in 20152016, was primarily due to a $300.0 million upfront payment to BMS upon the advancementclosing of our aducanumab program for Alzheimer's diseasean agreement to exclusively license BMS-986168 (now known as BIIB092) and a late stage program$60.0 million developmental milestone payable to the former stockholders of iPierian upon dosing of the first patient in the third quarter of 2015 and the discontinuance of development of anti-TWEAK in lupus nephritis and Neublastin in neuropathic pain,Phase 2 progressive supranuclear palsy (PSP) study for BIIB092. These increases were partially offset by increased coststhe prior year upfront milestone paid to the University of BIIB074 (formerly known as Raxatrigine)Pennsylvania upon entering into a collaboration and alliance.
For additional information related to our agreement with BMS, please read Note 18, Collaborative and Other Relationships, to our condensed consolidated financial statements included in trigeminal neuralgia (TGN).this report.
The decrease in spending associated with our marketed products for the three and six months ended June 30, 2016,2017, compared to the same periods in 20152016, was primarily due to the discontinuance of development of TYSABRI in secondary-progressive MS in the third quarter of 2015.
The increasea reduction in spending associated with our late stage programs for the three and six months ended June 30, 2016, comparedrelated to the same periods in 2015 was primarily driven by costs incurred to advance our aducanumab program for Alzheimer's diseaseTECFIDERA and the nusinersen program forimpact from the treatmentspin-off of spinal muscular atrophy.
The decrease in spending associated with milestone and upfront expenses for the six months ended June 30, 2016, compared to the same period in 2015 was primarily due to lower milestones recorded in relation to our collaboration agreements with Ionis Pharmaceuticals (Ionis) and prior year milestones paid to AbbVie for the development of ZINBRYTA as a result of filing with the FDA and EMA in 2015,hemophilia business on February 1, 2017, partially offset by increased spending related to ZINBRYTA and SPINRAZA following their approvals in the upfront milestone paid to the Universitysecond and fourth quarters of Pennsylvania upon entering into a collaboration and alliance.2016, respectively.
We intend to continue committing significant resources to targeted research and development opportunities where there is a significant unmet need and where thea drug candidate has the potential to be highly differentiated.
highly differentiated. Specifically, we intend to continue to invest in our MS pipeline, our aducanumab program, the BAN2401 and E2609 programs, the nusinersen program, the amiselimod program and our BIIB074 program.
Selling, General and Administrative
For the three months ended June 30, 2016,2017, compared to the same period in 2015,2016, the decrease in selling, general and administrative expenses remained relatively unchanged. Cost savingswas primarily due to the discontinuance of our TECFIDERA television advertising campaign in connectionthe second quarter of 2016 and a reduction in operational spending associated with our corporate restructuring, which is described below under the heading "Restructuring Charges", werehemophilia business, partially offset by an increase in commercialization costs associated with developing commercial capabilities for the product launches of BENEPALI and FLIXABI and the potential product launch of ZINBRYTA.SPINRAZA.
For the six months ended June 30, 2016,2017, compared to the same period in 2015,2016, the decrease in selling, general and administrative expenses reflects cost savingswas primarily due to the discontinuance of our TECFIDERA television advertising campaign in connectionthe second quarter of 2016 and a reduction in operational spending associated with our corporate restructuring, an $18.0 million benefit to reflect the reimbursement of Samsung Bioepis' share of historical pre-launch costs pursuant to our commercial agreement with Samsung Bioepis,hemophilia business, partially offset by an increase in corporate giving and an increase in commercialization costs associated with developing commercial capabilities for the product launches of BENEPALISPINRAZA and FLIXABI and the anticipated product launch of ZINBRYTA.
For additional information related to our commercial agreement with Samsung Bioepis, please read Note 17, Collaborative and Other Relationships to our condensed consolidated financial statements included in this report.biosimilar candidates.
Amortization of Acquired Intangible Assets
Our amortization expense is based on the economic consumption and impairment of intangible assets. Our most significant intangible assets are related to our AVONEX and TYSABRI products. Annually, during our long-range planning cycle, we perform an analysis of anticipated lifetime revenues of AVONEX and TYSABRI. This analysis is also updated whenever we determine events or changes in circumstances would significantly affect the anticipated lifetime revenues of either product.
Our most recent long range planning cycle was updated in the third quarter of 2015.2016. Based upon this analysis, there was not a significant net change in our expected rate of amortization for acquired intangible assets.
We monitor events and expectations regarding product performance. If new information indicates that the assumptions underlying our most recent analysis are substantially different than those utilized in our current estimates, our analysis would be updated and may result in a significant change in the anticipated lifetime revenues of the relevant process. The occurrence of an adverse event could substantially increase the amount of amortization expense associated with our acquired intangible assets as compared to previous periods or our current expectations, which may result in a significant negative impact on our future results of operations.
Amortization of acquired intangible assets for the three and six months ended June 30, 2017, includes $29.4 million and $383.0 million, respectively, of amortization and impairment charges associated with our U.S. and rest of world licenses to Forward Pharma A/S' (Forward Pharma) intellectual property related to TECFIDERA acquired in the first quarter of 2017, as discussed below.
TECFIDERA License Rights
In January 2017 we entered into a settlement and license agreement. Pursuant to this agreement, we obtained U.S. and rest of world licenses to Forward Pharma's intellectual property, including Forward Pharma's intellectual property related to TECFIDERA. In exchange, we paid Forward Pharma $1.25 billion in cash. During the fourth quarter of 2016, we recognized a pre-tax charge of $454.8 million and in the first quarter of 2017 we recognized an intangible asset of $795.2 million related to this agreement. The pre-tax charge recognized in the fourth quarter of 2016 represented the fair value of our licenses to Forward Pharma’s intellectual property for the period April 2014, when we started selling TECFIDERA, through December 31, 2016. The intangible asset represented the fair value of the U.S. and rest of world licenses to Forward Pharma’s intellectual property related to TECFIDERA revenues for the period January 2017, the month in which we entered into the agreement, through December 2020, the last month before royalty payments could first commence pursuant to the agreement.
We have two intellectual property disputes with Forward Pharma, one in the U.S. and one in the E.U., concerning intellectual property related to TECFIDERA. In March 2017 the U.S. intellectual property dispute was decided in our favor. Forward Pharma appealed to the U.S. Court of Appeals for the Federal Circuit and the appeal is pending. For additional information related to the amortization of acquired intangible assets,these disputes, please read Note 5,19, Intangible Assets and GoodwillLitigation, to our condensed consolidated financial statements included in this report.
As we prevailed in the U.S. proceeding in March 2017, we evaluated the recoverability of the U.S. asset acquired from Forward Pharma and recorded an impairment charge to adjust the carrying value of the acquired U.S. asset to fair value reflecting the impact of the developments in the U.S. legal dispute. We also continue to amortize the remaining net book value of the U.S. and rest of world intangible assets in our condensed consolidated statements of income utilizing an economic consumption model.
In Process Research & Development (IPR&D) related to Business Combinations
Overall, the value of our acquired IPR&D assets is dependent upon a number of variables, including estimates of future revenues and the effects of competition, the level of anticipated development costs and the probability and timing of successfully advancing a particular research program from a clinical trial phase to the next. We are continually reevaluating our estimates concerning these and other variables and evaluating industry and market data regarding the productivity of clinical research and the development process and the estimated economics of our product candidates and those of our expected competitors.process. Changes in our estimates of items may result in a significant change to our valuation of these assets.
The field of developing treatments for idiopathic pulmonary fibrosis (IPF) and forms of neuropathic pain, such as TGN, are highly competitive and can be affected by rapid changes to expected market candidates. There can be no assurance that we will be able to successfully develop STX-100 for the treatment of IPF or BIIB074 for the treatment of TGN or other indications or that a successfully developed therapy will be able to secure sufficient pricing in a competitive market. Changes to clinical development plans or life cycle management strategies are evaluated regularly. We review amounts capitalized as acquired IPR&D for impairment at least annually, as of October 31, and whenever events or changes in circumstances indicate to us that the carrying value of the assets might not be recoverable. Our most recent impairment assessment as of October 31, 20152016 resulted in no impairments.
(Gain) Loss on Fair Value Remeasurement Changes to clinical development plans, life cycle management strategies and changes in program economics, including foreign currency exchange rates, are evaluated regularly. The field of Contingent Consideration
The considerationdeveloping treatments for certainforms of neuropathic pain, such as TGN and idiopathic pulmonary fibrosis (IPF) are highly competitive and can be affected by changes to expected market candidates and changes in timing and the clinical development of our business combinations includes future paymentsproduct candidates. There can be no assurance that are contingent uponwe will be able to successfully develop BIIB074 for the occurrencetreatment of TGN or STX-100 for the treatment of IPF, or other indications or that a particular factor or factors. We recordsuccessfully developed therapy will be able to secure sufficient pricing in a competitive market.
For additional information related to the amortization of acquired intangible assets and our TECFIDERA settlement and license agreement please read Note 6, Intangible Assets and Goodwill, to our condensed consolidated financial statements included in this report.
Acquired In-Process Research and Development
On May 15, 2017, we completed an obligation for such contingent consideration payments at fair value onasset purchase of the acquisition date. We then revalue our contingent consideration obligations each reporting period. Changes inPhase 3 candidate, BIIB093, from Remedy. Upon closing of the fair value of our contingent consideration obligations, other than changes duetransaction, we made a $120.0 million upfront payment to payments, are recognizedRemedy, which was recorded as a (gain) loss on fair value remeasurement of contingent considerationacquired in-process research and development in our condensed consolidated statements of income.income during the second quarter of 2017 as BIIB093 has not yet reached technological feasibility. For additional information related to this transaction, please read Note 2, Acquisitions, to our condensed consolidated financial statements included in this report.
The change
Collaboration Profit (Loss) Sharing
Collaboration profit (loss) reflects the sharing of 50% of the profit or loss related to our biosimilars commercial agreement with Samsung Bioepis and our 50% sharing of the co-promotion profits or losses in fair value remeasurementthe E.U. and Canada related to our collaboration agreement with AbbVie in the commercialization of contingent consideration forZINBRYTA.
We began to recognize revenues on sales of biosimilars in the first quarter of 2016. For the three and six months ended June 30, 2016, compared to the same periods in 2015, was primarily due to changes in the probabilities2017, we shared collaboration profits and therefore recognized net expense of success$25.2 million and $46.0 million, respectively, related to the achievement of certain developmental milestones and the discount rate.
Restructuring Charges
On October 21, 2015, we announced a corporate restructuring, which included the termination of certain pipeline programs and an 11% reduction in workforce. As a result of these initiatives, we reduced our annual run rate of operating expenses by $250 million and reinvested these savings to support the advancement of our high potential pipeline candidates and keybiosimilars commercial activities.
Under this restructuring, cash payments will total approximately $120 million, of which $15.9 million were related to previously accrued 2015 incentive compensation, resulting in net expected restructuring charges totaling approximately $105 million. These amounts will be substantially paid by the end of 2016.
agreement with Samsung Bioepis. For the three and six months ended June 30, 2016, we recognized restructuring charges totaling $0.0 million and $9.7 million, respectively. net income of $5.6 million.
We previously recognized $93.4 millionbegan to recognize revenues on sales of restructuring chargesZINBRYTA in our consolidated statements of income during the fourthE.U. in the third quarter of 2015.
We may continue to execute business transformation2016. For the three and optimization initiatives to streamline operations in the future, including achieving targeted cost reductions, rationalizing manufacturing facilities and other cost savings associated with resource realignments in connection with changes in business strategies and other business conditions.
The following table summarizes the charges and spending related to our restructuring efforts during the six months ended June 30, 2016:
|
| | | | | | | | | | | |
| (In millions) | Workforce Reduction | | Pipeline Programs | | Total |
| Restructuring reserve as of December 31, 2015 | $ | 33.7 |
| | $ | 3.6 |
| | $ | 37.3 |
|
| Expense | 4.9 |
| | 5.4 |
| | 10.3 |
|
| Payments | (28.7 | ) | | (6.0 | ) | | (34.7 | ) |
| Adjustments to previous estimates, net | (3.5 | ) | | 2.9 |
| | (0.6 | ) |
| Restructuring reserve as of June 30, 2016 | $ | 6.4 |
| | $ | 5.9 |
| | $ | 12.3 |
|
Collaboration Profit (Loss) Sharing
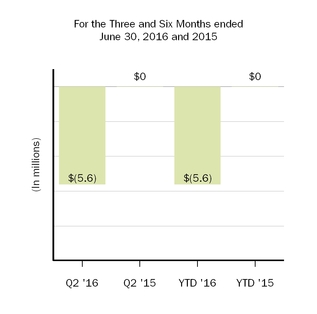
In December 2013, pursuant2017, we recognized net expense of $1.3 million to our rights underreflect AbbVie's 50% sharing of the joint venture agreement with Samsung Biologics, we entered into an agreement with Samsung Bioepis to commercialize, over a 10-year term, three anti-TNF biosimilar product candidates in Europe, andnet collaboration profits in the case of one anti-TNF biosimilar, Japan. We reflect revenues on sales of biosimilars to third parties in product revenues, net in our condensed consolidated statements of incomeE.U. and record the related cost of revenues and sales and marketing expenses in our condensed consolidated statements of income to their respective line items when these costs are incurred. We share 50% of the profit or loss related to our commercial agreement with Samsung Bioepis. The profit share with Samsung Bioepis is recognized in collaboration profit (loss) sharing in our condensed consolidated statements of income.Canada.
For additional information related to this transaction,our agreements with Samsung Bioepis and AbbVie please read Note 17,18, Collaborative and Other Relationships, to our condensed consolidated financial statements included in this report.
Other Income (Expense), Net
For the three months ended June 30, 20162017, compared to the same period in 2015,2016, the change in other income (expense), net was primarily due to an other than temporary impairment recorded on a strategic investment.
For the six months ended June 30, 2017, compared to the same period in 2016, the change in other income (expense), net was primarily due to an increase in interest expense as a result of our issuance of our senior unsecured notes in the third quarter of 2015,income and lower non-income based state taxes and other, partially offset by an increase in interest income due to higher cash, cash equivalents and marketable securities balances.
For the six months ended June 30, 2016 compared to the same period in 2015, the change in other income (expense), net was primarily due to an increase in interest expense asthan temporary impairment recorded on a result of our issuance of our senior unsecured notes in the third quarter of 2015, partially offset by an increase in interest income due to higher cash, cash equivalents and marketable securities balances and the impact of foreign exchange gains recorded during the six months ended June 30, 2016 compared to losses recorded in the prior year comparative period.strategic investment.
Our effective tax rate fluctuates from year to year due to the global nature of our operations. The factors that most significantly impact our effective tax rate include variability in the allocation of our taxable earnings among multiple jurisdictions, changes in tax laws, the amount and characterization of our research and development expenses, the levels of certain deductions and credits, acquisitions and licensing transactions.
For the three and six months ended June 30, 2016,2017, compared to the same periodperiods in 2015,2016, the decrease in our effective tax rate increasedwas primarily due to a state tax benefit in 2015 resulting from the remeasurement of one of our uncertain positions and a higherlower relative percentage of our earnings being attributed torecognized in the U.S., a high tax jurisdiction, along with a higher deduction for U.S. manufacturing activities. The geographic split of our earnings was affected by milestone and upfront payments in the current year, the spin-off of our hemophilia business and offsetting growth in sales of SPINRAZA in the U.S. For the six months ended June 30, 2017, we also recognized a benefit from a favorable settlement of a state tax jurisdiction.matter.
For more information on our uncertain tax positions and income tax rate reconciliation for the three and six months ended June 30, 20162017 and 2015,2016, please read Note 14,15, Income Taxes, to our condensed consolidated financial statements included in this report.
Share in Equity in Loss of Investee, Net of Tax
In February 2012, we entered into an agreement with Samsung Biologics, establishing an entity, Samsung Bioepis, to develop, manufacture and market biosimilar pharmaceuticals. We account for this investment under the equity method of accounting. We recognize our share of the results of operations related to our investment in Samsung Bioepis one quarter in arrears.
During 2015, our share of losses exceeded the carrying value of our investment. We therefore suspended recognizing additional losses and will continue to do so unless we commit to providing additional funding.
For additional information related to this transaction, please read Note 17, Collaborative and Other Relationships to our condensed consolidated financial statements included in this report.
Cambridge, MA Manufacturing Facility
In June 2016, as a result of an evaluation of our manufacturing capabilities and capacity needs based on current and expected future demand, we determined that we intend to cease manufacturing in Cambridge, MA and vacate our 67,000 square foot small-scale biologics manufacturing facility in Cambridge, MA and 46,000 square foot warehouse space in Somerville, MA by the end of 2016.
We are currently considering alternatives for the facility, which may include a sale of our rights to the facility and related assets. In the event we are unsuccessful with a sale, we will close the facility by December 31, 2016.
As of June 30, 2016, the carrying value of associated assets totaled approximately $43.0 million and our remaining lease obligation related to these facilities totaled $26.3 million.
As a result of these actions, we may incur significant costs, including employee separation and retention expenses, facility lease termination fees, rent expense in excess of sublease income and facility closing costs. An impairment assessment as of June 30, 2016 was performed related to the assets, which resulted in no impairments.
The anticipated departure from these facilities has shortened the expected useful lives of certain leasehold improvements and other assets at these facilities. As a result, we recorded additional depreciation expense to reflect the assets' new shorter useful lives. As of June 30, 2016, we recognized approximately $15.8 million of this additional depreciation, which was recorded as cost of sales in our condensed consolidated statements of income.
Financial Condition, Liquidity and Capital Resources
Our financial condition is summarized as follows:
| | | (In millions, except percentages) | As of
June 30,
2016 | | As of
December 31,
2015 | | Change % | As of
June 30,
2017 | | As of
December 31,
2016 | | Change % |
| Financial assets: | | | | | | | | | | |
| Cash and cash equivalents | $ | 1,362.0 |
| | $ | 1,308.0 |
| | 4.1 | % | $ | 1,169.5 |
| | $ | 2,326.5 |
| | (49.7 | )% |
| Marketable securities — current | 2,434.8 |
| | 2,120.5 |
| | 14.8 | % | 1,723.5 |
| | 2,568.6 |
| | (32.9 | )% |
| Marketable securities — non-current | 3,477.6 |
| | 2,760.4 |
| | 26.0 | % | 2,632.7 |
| | 2,829.4 |
| | (7.0 | )% |
| Total cash, cash equivalents and marketable securities | $ | 7,274.4 |
| | $ | 6,188.9 |
| | 17.5 | % | $ | 5,525.7 |
| | $ | 7,724.5 |
| | (28.5 | )% |
| Borrowings: | | | | | | | | | | |
| Current portion of notes payable and other financing arrangements | $ | 4.8 |
| | $ | 4.8 |
| | — | % | $ | 559.9 |
| | $ | 4.7 |
| | ** |
|
| Notes payable and other financing arrangements | 6,538.3 |
| | 6,521.5 |
| | 0.3 | % | 5,954.0 |
| | 6,512.7 |
| | (8.6 | )% |
| Total borrowings | $ | 6,543.1 |
| | $ | 6,526.3 |
| | 0.3 | % | $ | 6,513.9 |
| | $ | 6,517.4 |
| | (0.1 | )% |
| Working capital: | | | | | | | | | | |
| Current assets | $ | 7,447.7 |
| | $ | 6,700.3 |
| | 11.2 | % | $ | 7,108.7 |
| | $ | 8,732.2 |
| | (18.6 | )% |
| Current liabilities | (2,516.2 | ) | | (2,577.7 | ) | | (2.4 | )% | (3,379.7 | ) | | (3,419.9 | ) | | (1.2 | )% |
| Total working capital | $ | 4,931.5 |
| | $ | 4,122.6 |
| | 19.6 | % | $ | 3,729.0 |
| | $ | 5,312.3 |
| | (29.8 | )% |
** Percentage not meaningful.
For the six months ended June 30, 2017, certain significant cash flows were as follows:
$1.4 billion in net cash flows provided by operating activities, net of:
| |
| ◦ | $654.8 million in total payments for income taxes; |
| |
| ◦ | $454.8 million payment made to Forward Pharma for the litigation and settlement charges that were accrued as of December 31, 2016; and |
| |
| ◦ | $300.0 million upfront payment to BMS; |
$1.4 billion used for share repurchases;
$795.2 million payment made to Forward Pharma to license intellectual property related to TECFIDERA;
$600.0 million in contingent payments made to former shareholders of Fumapharm AG and holders of their rights;
$407.7 million used for purchases of property, plant and equipment;
$302.7 million net cash contribution made to Bioverativ; and
$180.0 million in upfront and milestone payments made to Remedy and Ionis.
For the six months ended June 30, 2016, certain significant cash flows were as follows:
$1,959.2 million2.0 billion in net cash flows provided by operating activities;activities, net of:
$840.8 million in total payments for income taxes;
| |
| ◦ | $840.8 million in total payments for income taxes; |
$600.0 million in contingent payments made to former shareholders of Fumapharm AG and holders of their rights; and
$263.7 million used for purchases of property, plant and equipment.
For the six months ended June 30, 2015, certain significant cash flows were as follows:
$1,780.3 million in net cash flows provided by operating activities;
$520.9 million in total payments for income taxes;
$250.0 million in contingent payments made to former shareholders of Fumapharm AG and holders of their rights;
$227.7 million used for purchases of property, plant and equipment;
$198.8 million net cash paid for the acquisition of Convergence Pharmaceuticals (Convergence); and
$42.2 million used for share repurchases.
Overview
We have historically financed our operating and capital expenditures primarily through cash flows earned throughfrom our operations. During 2015, we issued senior unsecured notes for an aggregate principal amount of $6.0 billion. We expect to continue funding our current and planned operating requirements principally through our cash flows from operations, as well as our existing cash resources. We believe that our existing funds, when combined with cash generated from operations and our access to additional financing resources, if needed, are sufficient to satisfy our operating, working capital, strategic alliance, milestone payment, capital expenditure and debt service requirements for the foreseeable future. In addition, we may choose to opportunistically return cash to shareholders and pursue other business initiatives, including acquisition and licensing activities. We may, from time to time, also seek additional funding through a combination of new collaborative agreements, strategic alliances and additional equity and debt financings or from other sources should we identify a significant new opportunity.
The undistributed cumulative foreign earnings of certain of our foreign subsidiaries, exclusive of earnings that would result in little or no net income tax expense under current U.S. tax law or which has already been subject to tax under U.S. tax law, are invested indefinitely outside the U.S.
Of the total cash, cash equivalents and marketable securities at June 30, 2016,2017, approximately $4.2$4.3 billion was generated in foreign jurisdictions and is primarily intended for use in our foreign operations or in connection with business development transactions outside of the U.S. In managing our day-to-day liquidity in the U.S., we do not rely on the unrepatriated earnings as a source of funds and we have not provided for U.S. federal or state income taxes on these undistributed foreign earnings.
For additional information related to certain risks that could negatively impact our financial position or future results of operations, please read the “Risk Factors” and “Quantitative and Qualitative Disclosures About Market Risk” sections of this report.
Share Repurchase Programs
In July 2016 our Board of Directors authorized a program to repurchase up to $5.0 billion of our common stock (2016 Share Repurchase Program). This authorization does not have an expiration date. Repurchased sharesAll share repurchases under this authorization will be retired. The 2016 Share Repurchase Program is in addition to the approximately 1.3Under this program, we repurchased and retired 2.9 million and 3.7 million shares remaining under our February 2011 Share Repurchase Program (2011 Share Repurchase Program), which has been used principally to offsetof common stock issuances under our share-based compensation plans. Duringat a cost of $781.8 million and $1.0 billion during the three and six months ended June 30, 2016 and 2015, we did not2017, respectively. As of June 30, 2017, approximately $3.0 billion remains available to repurchase any shares of common stock under our 2011 Share Repurchase Program.this authorization.
In May 2015,February 2011 our Board of Directors authorized a program to repurchase up to $5.0 billion20.0 million shares of our common stock, which was completed as of DecemberMarch 31, 2015.2017. During the six months ended June 30, 2015,2017, we repurchased and retired 0.11.3 million shares of common stock at a cost of $42.2 million.$365.4 million under this program. During the three and six months ended June 30, 2016, we did not repurchase any shares of common stock under this program.
Cash, Cash Equivalents and Marketable Securities
Until required for another use in our business, we typically invest our cash reserves in bank deposits, certificates of deposit, commercial paper, corporate notes, U.S. and foreign government instruments and other interest bearing marketable debt instruments in accordance with our investment policy. It is our policy to mitigate credit risk in our cash reserves and marketable securities by maintaining a well-diversified portfolio that limits the amount of exposure as to institution, maturity and investment type.
The net increasedecrease in cash, cash equivalents and marketable securities at June 30, 20162017 from December 31, 2015, is2016, was primarily due to net cash flows provided by operating activities, partially offset byused for share repurchases, the payment made to Forward Pharma in connection with our January 2017 settlement and license agreement, contingent payments made to former shareholders of Fumapharm AG and holders of their rights, upfront and milestone payments made to BMS, Remedy and Ionis, net purchases of property, plant and equipment.equipment and the net cash contribution made to Bioverativ. These cash outflows were partially offset by cash flows related to operations.
Borrowings
The following is a summary of our principal indebtedness:
$550.0 million aggregate principal amount of 6.875% Senior Notes due March 1, 2018;
$1.5 billion aggregate principal amount of 2.90% Senior Notes due September 15, 2020;
$1.0 billion aggregate principal amount of 3.625% Senior Notes due September 15, 2022;
$1.75 billion aggregate principal amount of 4.05% Senior Notes due September 15, 2025; and
$1.75 billion aggregate principal amount of 5.20% Senior Notes due September 15, 2045.
These senior unsecured notes were issued at a discount and are amortized as additional interest expense over the period from issuance through maturity.
During the third quarter of 2015, we entered into a $1.0 billion, 5-year senior unsecured revolving credit facility under which we are permitted to draw funds for working capital and general corporate purposes. The terms of the revolving credit facility include a financial covenant that requires us not to exceed a maximum consolidated leverage ratio. As of June 30, 2016,2017, we had no outstanding borrowings and were in compliance with all covenants under this facility.
For a summary of the fair and carrying values of our outstanding borrowings as of June 30, 20162017 and December 31, 2015,2016, please read Note 6,7, Fair Value Measurements, to our condensed consolidated financial statements included in this report.
Working Capital
We define working capital as current assets less current liabilities. The increasechange in working capital at June 30, 20162017 from December 31, 20152016, reflects an increasea decrease in total current assets of $747.4approximately $1.6 billion, partially offset by a $40.2 million as well as a decrease in current liabilities of $61.5 million. liabilities.
The increasedecrease in total current assets was primarily driven by a decrease in net cash, cash equivalents and marketable securities, as described above, and the contribution of certain accounts receivable, inventory, and other current assets to Bioverativ. These decreases were partially offset by an increase in marketable securities, prepaid taxes and inventory. receivables related to our ongoing operations.
The decrease in total current liabilities was driven by a reduction in accrued expenses primarily resulted fromdue to the payment of the $454.8 million charge that was accrued as of December 31, 2016 in relation to our settlement and license agreement with Forward Pharma, a decrease in accountstaxes payable, the payment of incentive compensation and the contribution of certain accrued expenses and other.other current liabilities to Bioverativ. These decreases were partially offset by the reclassification to current liabilities of $550.0 million of our 6.875% Senior Notes due March 1, 2018, as these notes are due within one year.
Cash Flows
The following table summarizes our cash flow activity:
| | | | | For the Six Months
Ended June 30, | For the Six Months
Ended June 30, |
| (In millions, except percentages) | | 2016 | | 2015 | | % Change | 2017 | | 2016 | | % Change |
| Net cash flows provided by operating activities | | $ | 1,959.2 |
| | $ | 1,780.3 |
| | 10.0 | % | $ | 1,404.4 |
| | $ | 2,014.0 |
| | (30.3 | )% |
| Net cash flows used in investing activities | | $ | (1,939.3 | ) | | $ | (1,756.1 | ) | | 10.4 | % | $ | (946.8 | ) | | $ | (1,939.3 | ) | | (51.2 | )% |
| Net cash flows provided by financing activities | | $ | 34.0 |
| | $ | 77.2 |
| | (56.0 | )% | |
| Net cash flows used in financing activities | | $ | (1,652.4 | ) | | $ | (20.8 | ) | | ** |
|
** Percentage not meaningful.
Operating Activities
Cash flows from operating activities represent the cash receipts and disbursements related to all of our activities other than investing and financing activities. We expect cash provided from operating activities will continue to be our primary source of funds to finance operating needs and capital expenditures for the foreseeable future.
Operating cash flow is derived by adjusting our net income for:
Non-cash operating items such as depreciation and amortization, impairment charges, acquired in-process research and development and share-based compensation charges;compensation;
Changes in operating assets and liabilities which reflect timing differences between the receipt and payment of cash associated with transactions and when they are recognized in results of operations; and
Changes associated with the fair value of contingent payments associated with our acquisitions of businesses and payments related to collaborations.
For the six months ended June 30, 2016,2017, compared to the same period in 2015,2016, the increasedecrease in net cash flows provided by operating activities iswas primarily driven by higher net income, partially offset bydue to the $454.8 million payment that was accrued as of December 31, 2016 and paid in the first quarter of 2017, in relation to our settlement and license agreement with Forward Pharma, the $300.0 million upfront payment to BMS made in the second quarter of 2017 and a decreasecomparative increase in income taxes payable.outstanding receivables.
Investing Activities
For the six months ended June 30, 2016,2017, compared to the same period in 2015,2016, the increasedecrease in net cash flows used in investing activities iswas primarily due to an increase in net proceeds from sales and maturities of marketable securities, partially offset by the contingent consideration$795.2 million payment made to license Forward Pharma's intellectual property related to TECFIDERA in the first quarter of 2017, the $120.0 million payment made to Remedy for the purchase of BIIB093 in the second quarter of 2017, the $60.0 million milestone payment to Ionis in the first quarter of 2017 and an increase in purchases of property, plant and equipment primarily related to the Fumapharm AG acquisition, partially offset by cash paid for the acquisitionconstruction of Convergence in February 2015.our Solothurn, Switzerland facility.
Financing Activities
For the six months ended June 30, 2016,2017, compared to the same period in 2015,2016, the decreaseincrease in net cash flows provided byused in financing activities iswas primarily due to a decreaseapproximately $1.4 billion of cash used for share repurchases in tax benefit from share-based awards.the first half of 2017 and the $302.7 million net cash contribution made to Bioverativ in connection with the spin-off of our hemophilia business in February 2017.
Contractual Obligations and Off-Balance Sheet Arrangements
Contractual Obligations
Our contractual obligations primarily consist of our obligations under non-cancellable operating leases, capital leases, long-term debt obligations and defined benefit and other purchase obligations, excluding amounts related to uncertain tax positions, funding commitments, contingent development, regulatory and commercial milestone payments, TYSABRI contingent payments and contingent consideration related to our business combinations, as described below.
On December 1, 2015, we purchased land in Solothurn, Switzerland where we are building a biologics manufacturing facility over the next several years. As of June 30, 2016, we had contractual commitments of approximately $226.0 million for the construction of this facility.
There have been no other material changes in our contractual obligations since December 31, 2015.
Tax Related Obligations
We exclude liabilities pertaining to uncertain tax positions from our summary of contractual obligations as we cannot make a reliable estimate of the period of cash settlement with the respective taxing authorities. As of June 30, 2016, we have approximately $70.0 million of liabilities associated with uncertain tax positions.
Other Funding Commitments
As of June 30, 2016, we have several on-going clinical studies in various clinical trial stages. Our most significant clinical trial expenditures are to contract research organizations (CROs). The contracts with CROs are generally cancellable, with notice, at our option. We have recorded accrued expenses of approximately $36.0 million on our condensed consolidated balance sheet for expenditures incurred by CROs as of June 30, 2016. We have approximately $490.0 million in cancellable future commitments based on existing CRO contracts as of June 30, 2016.
As of June 30, 2016, we have planned clinical trials for our nusinersen program which is managed by Ionis. We have agreed to pay up to approximately $72.5 million to Ionis as the trials for this program proceed. If these trials advance, and we continue with our Ionis program, it is possible that we could make a significant amount of additional development payments in the future.
Contingent Development, Regulatory and Commercial Milestone Payments
Based on our development plans as of June 30, 2016, we could make potential future milestone payments to third parties of up to approximately $3.4 billion as part of our various collaborations, including licensing and development programs. Payments under these agreements generally become due and payable upon achievement of certain development, regulatory or commercial milestones. Because the achievement of these milestones had not occurred as of June 30, 2016, such contingencies have not been recorded in our financial statements. Amounts related to contingent milestone payments are not considered contractual obligations as they are contingent on the successful achievement of certain development, regulatory approval and commercial milestones.
We anticipate that we may pay approximately $40.0 million of milestone payments during the remainder of 2016, provided various development, regulatory or commercial milestones are achieved.
TYSABRI Contingent Payments
In 2013 we acquired from Elan Corporation plc (Elan) full ownership of all remaining rights to TYSABRI that we did not already own or control. Under the terms of the acquisition agreement, we are obligated to make contingent payments to Elan of 18% on annual worldwide net sales up to $2.0 billion and 25% on annual worldwide net sales that exceed $2.0 billion. Royalty payments to Elan and other third parties are recognized as cost of sales in our condensed consolidated statements of income. Elan was acquired by Perrigo Company plc (Perrigo) in December 2013. Following that acquisition, we began making2013, and Perrigo subsequently sold its rights to these royalty payments to Perrigo.another third party effective January 2017.
Contingent Consideration related to Business Combinations
In connection with our acquisitions of Convergence Pharmaceuticals Ltd. (Convergence), Stromedix, Inc. (Stromedix) and Biogen International Neuroscience GmbH (BIN), formerly Panima Pharmaceuticals AG, we agreed to make additional payments based upon the achievement of certain milestone events.
As the acquisitions of Convergence, Stromedix and BIN formerly Panima Pharmaceuticals AG, occurred after January 1, 2009, we record contingent consideration liabilities at their fair value on the acquisition date and revalue these obligations each reporting period.
We may pay up to approximately $1.3$1.2 billion in remaining milestones related to these acquisitions.
Fumapharm AG
In 2006 we acquired Fumapharm AG. As part of this acquisition we acquired FUMADERM and TECFIDERA (together, Fumapharm Products). We are required to make contingent payments to former shareholders of Fumapharm AG or holders of their rights based on the attainment of certain cumulative sales levels of Fumapharm Products and the level of total net sales of Fumapharm Products in the prior twelve12- month period.
During the six months ended June 30, 2016,2017, we paid $600.0 million in contingent payments as we reached the $7.0$11.0 billion and $8.0$12.0 billion cumulative sales levels related to the Fumapharm Products in the fourth quarter of 20152016 and the first quarter of 2016,2017, respectively, and accrued $300.0 million upon reaching $9.0$13.0 billion in total cumulative sales of Fumapharm Products in the second quarter of 2016.2017.
We will owe an additional $300.0 million contingent payment for every additional $1.0 billion in cumulative sales level of Fumapharm Products reached if the prior 12 months sales of the Fumapharm Products exceed $3.0 billion, until such time as the cumulative sales level reaches $20.0 billion, at which time no further contingent payments shallwill be due. If the prior 12 months sales of Fumapharm Products are less than $3.0 billion, contingent payments remain payable on a decreasing tiered basis. These payments willwould be accounted for as an increase to goodwill as incurred, in accordance with the accounting standard applicable to business combinations when we acquired Fumapharm.Fumapharm AG. Any portion of the payment whichthat is tax deductible will be recorded as a reduction to goodwill. Payments are due within 60 days following the end of the quarter in which the applicable cumulative sales level has been reached.
Contingent Development, Regulatory and Commercial Milestone Payments
Based on our development plans as of June 30, 2017, we could make potential future milestone payments to third parties of up to approximately $3.1 billion, including approximately $0.6 billion in development milestones, approximately $0.9 billion in regulatory milestones and approximately $1.6 billion in commercial milestones, as part of our various collaborations, including licensing and development programs. Payments under these agreements generally become due and payable upon achievement of certain development, regulatory or commercial milestones. Because the achievement of these milestones had not occurred as of June 30, 2017, such contingencies have not been recorded in our financial statements. Amounts related to contingent milestone payments are not considered contractual
obligations as they are contingent on the successful achievement of certain development, regulatory approval or commercial milestones.
Provided various development, regulatory or commercial milestones are achieved, we anticipate that we may pay approximately $55.0 million of milestone payments during the remainder of 2017 in addition to the $90.0 million in payments to Ionis for the regulatory approvals of SPINRAZA in the E.U. and Japan and a $60.0 million developmental milestone payment to the former stockholders of iPierian upon dosing of the first patient in the Phase 2 PSP study for BIIB092.
Other Funding Commitments
As of June 30, 2017, we have several ongoing clinical studies in various clinical trial stages. Our most significant clinical trial expenditures are to contract research organizations (CROs). The contracts with CROs are generally cancellable, with notice, at our option. We recorded accrued expenses of approximately $36.0 million in our condensed consolidated balance sheet for expenditures incurred by CROs as of June 30, 2017. We have approximately $442.0 million in cancellable future commitments based on existing CRO contracts as of June 30, 2017.
Tax Related Obligations
We exclude liabilities pertaining to uncertain tax positions from our summary of contractual obligations as we cannot make a reliable estimate of the period of cash settlement with the respective taxing authorities. As of June 30, 2017, we have approximately $36.0 million of liabilities associated with uncertain tax positions.
Other Off-Balance Sheet Arrangements
We do not have any relationships with entities often referred to as structured finance or special purpose entities that were established for the purpose of facilitating off-balance sheet arrangements. As such, we are not exposed to any financing, liquidity, market or credit risk that could arise if we had engaged in such relationships. We consolidate variable interest entities if we are the primary beneficiary.
New Accounting Standards
For a discussion of new accounting standards please read Note 1, Summary of Significant Accounting Policies - New Accounting Pronouncements, to our condensed consolidated financial statements included in this report.
Critical Accounting Estimates
The preparation of our condensed consolidated financial statements, which have been prepared in accordance with accounting principles generally accepted in the U.S. (U.S. GAAP), requires us to make estimates, judgments and assumptions that may affect the reported amounts of assets, liabilities, equity, revenues and expenses and related disclosure of contingent assets and liabilities. On an on-goingongoing basis we evaluate our estimates, judgments and methodologies. We base our estimates on historical experience and on various other assumptions that we believe to be reasonable, the results of which form the basis for making judgments about the carrying values of assets, liabilities and equity and the amount of revenues and expenses. Actual results may differ from these estimates under different assumptions or conditions.
For a discussion of our critical accounting estimates, please read Part II, Item 7 “Management’s Discussion and Analysis of Financial Condition and Results of Operations” of our 20152016 Form 10-K. There have been no material changes to these critical accounting estimates since our 20152016 Form 10-K.
Item 3. Quantitative and Qualitative Disclosures About Market Risk
Market Risk
We are subject to certain risks which may affect our results of operations, cash flows and fair values of assets and liabilities, including volatility in foreign currency exchange rates, interest rate movements, pricing pressures worldwide and weak economic conditions in the foreign markets in which we operate. We manage the impact of foreign currency exchange rates and interest rates through various financial instruments, including derivative instruments such as foreign currency forward contracts, interest rate lock contracts and interest rate swap contracts. We do not enter into financial instruments for trading or speculative purposes. The counter-partiescounterparties to these contracts are major financial institutions, and there is no significant concentration of exposure with any one counter-party.counterparty.
Foreign Currency Exchange Risk
Our results of operations are subject to foreign currency exchange rate fluctuations due to the global nature of our operations. We have operations or maintain distribution relationships in the U.S., Europe, Canada, Asia, and Central and South America. In addition, we recognize our share of pre-tax co-promotion profits on RITUXAN in Canada. As a result, our financial position, results of operations and cash flows can be affected by market fluctuations in foreign currency exchange rates, primarily with respect to the Euro, British pound sterling, Canadian dollar, Swiss franc, Danish krone and Japanese yen.
While the financial results of our global activities are reported in U.S. dollars, the functional currency for most of our foreign subsidiaries is their respective local currency. Fluctuations in the foreign currency exchange rates of the countries in which we do business will affect our operating results, often in ways that are difficult to predict. In particular, as the U.S. dollar strengthens versus other currencies, the value of the non-U.S. revenue will decline when reported in U.S. dollars. The impact to net income as a result of a strengthening U.S. dollar will be partially mitigated by the value of non-U.S. expense which will also decline when reported in U.S. dollars. As the U.S. dollar weakens versus other currencies, the value of the non-U.S. revenue and expenses will increase when reported in U.S. dollars.
We have established revenue and operating expense hedging and balance sheet risk management programs to protect against volatility of future foreign currency cash flows and changes in fair value caused by volatility in foreign currency exchange rates.
In June 2016 the U.K. voted in a referendum to voluntarily depart from the E.U., known as Brexit.Brexit, and in March 2017, the U.K. formally started the process for the U.K. to leave the E.U. The macroeconomic impact on our results of operations from this votethese developments remains unknown. To date, the foreign currency exchange impact has been negligible since we hedged the balance sheet foreign currency exchange risk.
Revenue and Operating Expense Hedging Program
Our foreign currency hedging program is designed to mitigate, over time, a portion of the impact resulting from volatility in exchange rate changes on revenues and operating expenses. We use foreign currency forward contracts to manage foreign currency risk, with the majority of our forward contracts used to hedge certain forecasted revenue and operating expense transactions denominated in foreign currencies in the next 1824 months. We do not engage in currency speculation. For a more detailed disclosure of our revenue and operating expense hedging program, please read Note 8,9, Derivative Instruments, to our condensed consolidated financial statements included in this report.
Our ability to mitigate the impact of exchange rate changes on revenues and net income diminishes as significant exchange rate fluctuations are sustained over extended periods of time. In particular, devaluation or significant deterioration of foreign currency exchange rates are difficult to mitigate and likely to negatively impact earnings. The cash flows from these contracts are reported as operating activities in our condensed consolidated statements of cash flows.
Balance Sheet Risk Management Hedging Program
We also use forward contracts to mitigate the foreign currency exposure related to certain balance sheet items. The primary objective of our balance sheet risk management program is to mitigate the exposure of foreign currency denominated net monetary assets and liabilities of foreign affiliates. In these instances, we principally utilize currency forward contracts. We have not elected hedge accounting for the balance sheet related items. The cash flows from these contracts are reported as operating activities in our condensed consolidated statement of cash flows.
The following quantitative information includes the impact of currency movements on forward contracts used in our revenue, operating expense and balance sheet hedging programs. As of June 30, 20162017 and December 31, 2015,2016, a hypothetical adverse 10% movement in foreign currency rates compared to the U.S. dollar across all maturities would result in a hypothetical decrease in the fair value of forward contracts of approximately $178.0$234.0 million and $185.0$172.0 million, respectively. The estimated fair value change was determined by measuring the impact of the hypothetical exchange rate movement on outstanding forward contracts. Our use of this methodology to quantify the market risk of such instruments is subject to assumptions and actual impact could be significantly different. The quantitative information about market risk is limited because it does not take into account all foreign currency operating transactions.
Interest Rate Risk
Our investment portfolio includes cash equivalents and short-term investments. The fair value of our marketable securities is subject to change as a result of potential changes in market interest rates. The potential change in fair value for interest rate sensitive instruments has been assessed on a hypothetical 100 basis point adverse movement across all maturities. As of June 30, 20162017 and December 31, 2015,2016, we estimate that such hypothetical 100 basis point adverse movement would result in a hypothetical loss in fair value of approximately $50.0$48.0 million and $43.0$50.0 million, respectively, to our interest rate sensitive instruments. The fair values of our investments were determined using third-party pricing services or other market observable data.
To achieve a desired mix of fixed and floating interest rate debt, we entered into interest rate swap contracts during 2015 for certain of our fixed-rate debt. These derivative contracts effectively converted a fixed-rate interest coupon to a floating-rate LIBOR-based coupon over the life of the respective note. As of June 30, 20162017 and December 31, 2015,2016, a 100 basis-point adverse movement (increase in LIBOR) would increase annual interest expense by approximately $6.8 million, respectively.million.
Pricing Pressure
Governments in some international markets in which we operate have implemented measures aimed at reducing healthcare costs to constrainlimit the overall level of government expenditures. These implemented measures vary by country and include, among other things, mandatory rebates and discounts, prospective and possible retroactive price reductions and suspensions on price increases of pharmaceuticals.
In addition, certain countries set prices by reference to the prices in other countries where our products are marketed. Thus, our inability to secure favorable prices in a particular country may impair our ability to obtain acceptable prices in existing and potential new markets, andwhich may limit market growth. The continued implementation of pricing actions throughout Europe may also lead to higher levels of parallel trade.
In the U.S., federal and state legislatures, health agencies and third-party payors continue to focus on containing the cost of health care. Legislative and regulatory proposals, enactments to reform health care insurance programs and increasing pressure from social sources could significantly influence the manner in which our products are prescribed and purchased. It is possible that additional federal health care reform measures will be adopted in the future, which could result in increased pricing pressure and reduced reimbursement for our products and otherwise have an adverse impact on our financial position or results of operations.
Our products are also susceptible to increasing competition from generics and biosimilars in many markets. Generic versions of drugs and biosimilars are likely to be sold at substantially lower prices than branded products. Accordingly, the introduction of generic or biosimilar versions of our marketed products, as well as lower-priced competing products, likely would significantly reduce both the price that we receive for such marketed products and the volume of products that we sell, which may have an adverse impact on our results of operations.
There is also significant economic pressure on state budgets that may result in states increasingly seeking to achieve budget savings through mechanisms that limit coverage or payment for our drugs. Managed care organizations are also continuing to seek price discounts and, in some cases, to impose restrictions on the coverage of particular drugs.
Credit Risk
We are subject to credit risk from our accounts receivable related to our product sales. The majority of our accounts receivable arise from product sales in the U.S. and Europe with concentrations of credit risk limited due to the wide variety of customers and markets using our products, as well as their dispersion across many different geographic areas. Our accounts receivable are primarily due from wholesale distributors, public hospitals and other government entities. We monitor the financial performance and creditworthiness of our customers so that we can properly assess and respond to changes in their credit profile. We operate in certain countries where weakness in economic conditions can result in extended collection periods. We continue to monitor these conditions, including the volatility associated with international economies and the relevant financial markets, and assess their possible impact on our business. To date, we have not experienced any significant losses with respect to the collection of our accounts receivable.
Credit and economic conditions in the E.U. continue to remain uncertain, which has, from time to time, led to long collection periods for our accounts receivable and greater collection risk in certain countries.
We believe that our allowance for doubtful accounts was adequate as of June 30, 20162017 and December 31, 2015.2016. However, if significant changes occur in the availability of government funding or the reimbursement practices of these or other governments, we may not be able to collect on amounts due to us from customers in such countries and our results of operations could be adversely affected.
Item 4. Controls and Procedures
Disclosure Controls and Procedures and Internal Control over Financial Reporting
Controls and Procedures
We have carried out an evaluation, under the supervision and with the participation of our management, including our principal executive officer and principal financial officer, of the effectiveness of the design and operation of our disclosure controls and procedures (as defined in Rules 13a-15(e) and 15d-15(e) under the Securities Exchange Act of 1934, as amended), as of June 30, 2016.2017. Based upon that evaluation, our principal executive officer and principal financial officer concluded that, as of the end of the period covered by this report, our disclosure controls and procedures are effective in ensuring that (a) the information required to be disclosed by us in the reports that we file or submit under the Securities Exchange Act is recorded, processed, summarized and reported within the time periods specified in the Securities Exchange Commission’s rules and forms, and (b) such information is accumulated and communicated to our management, including our principal executive officer and principal financial officer, as appropriate to allow timely decisions regarding required disclosure. In designing and evaluating our disclosure controls and procedures, our management recognized that any controls and procedures, no matter how well designed and operated, can provide only reasonable assurance of achieving the desired control objectives, and our management necessarily was required to apply its judgment in evaluating the cost-benefit relationship of possible controls and procedures.
Changes in Internal Control over Financial Reporting
There were no changes in our internal control over financial reporting during the quarter ended June 30, 2016,2017, that have materially affected, or are reasonably likely to materially affect, our internal control over financial reporting.
Part II — OTHER INFORMATION
Item 1. Legal Proceedings
Please refer to Note 18,19, Litigation, to our condensed consolidated financial statements included in this report, which is incorporated into this item by reference.
Item 1A. Risk Factors
We are substantially dependent on revenues from our principal products.
Our current revenues depend upon continued sales of our principal products, and, unless we develop or acquire rights to new products and technologies, we aremay be substantially dependent on sales from our principal products for many years. Further, iffollowing the proposed spin offcompletion of the spin-off of our hemophilia business, is completed, our revenues will beare further reliant and concentrated on sales of our MS products in an increasingly competitive market.market, and revenue from sales of our product for SMA. Any of the following negative developments relating to any of our principal products may adversely affect our revenues and results of operations or could cause a decline in our stock price:
safety or efficacy issues;
the introduction or greater acceptance of competing products, including lower-priced competing products;
constraints and additional pressures on product pricing or price increases, due to a number of factors, including those resulting from governmental or regulatory requirements, increased competition, or changes in, or, implementation of, reimbursement policies and practices of payors and other third parties; or
adverse legal, administrative, regulatory or legislative developments.
SPINRAZA was recently approved by the FDA, the European Commission and the Japanese Ministry of Health, Labor and Welfare, and is in the early stages of commercial launch. In addition to risks associated with new product launches and the other factors described in these “Risk Factors”, our ability to successfully commercialize SPINRAZA may be adversely affected due to:
our limited marketing experience within the SMA market, which may impact our ability to develop relationships with the associated medical and scientific community;
the lack of readiness of healthcare providers to treat patients with SMA;
the effectiveness of our commercial strategy for marketing SPINRAZA; and
our ability to maintain a positive reputation among patients, healthcare providers and others in the SMA community, which may be impacted by pricing and reimbursement decisions relating to SPINRAZA.
If we fail to compete effectively, our business and market position would suffer.
The biopharmaceutical industry and the markets in which we operate are intensely competitive. We compete in the marketing and sale of our products, the development of new products and processes, the acquisition of rights to new products with commercial potential and the hiring and retention of personnel. We compete with biotechnology and pharmaceutical companies that have a greater number of products on the market and in the product pipeline, greater financial and other resources and other technological or competitive advantages. One or more of our competitors may benefit from significantly greater sales and marketing capabilities, may develop products that are accepted more widely than ours or may receive patent protection that dominates, blocks or adversely affects our product development or business.
Our products are also susceptible to increasing competition from generics and biosimilars in many markets. Generic versions of drugs and biosimilars are likely to be sold at substantially lower prices than branded products. Accordingly, the introduction of generic or biosimilar versions of our marketed products, as well as lower-priced competing products, likely would significantly reduce both the price that we receive for such marketed products and the volume of products that we sell, which may have an adverse impact on our results of operations.
In the MS market, we face intense competition as the number of products and competitors continues to expand. Due to our significant reliance on sales of our MS products, our business may be harmed if we are unable to successfully compete in the MS market. More specifically, our ability to compete, maintain and grow our share in the MS market may be adversely affected due to a number of factors, including:
the introduction of more efficacious, safer, less expensive or more convenient alternatives to our MS products, including our own products and products of our collaborators;
the introduction of lower-cost biosimilars, follow-on products or generic versions of branded MS products sold by our competitors, and the possibility of future competition from generic versions or prodrugs of existing therapeutics or from off-label use by physicians of therapies indicated for other conditions to treat MS patients;
patient dynamics, including the size of the patient population and our ability to attract new patients to our therapies;
damage to physician and patient confidence in any of our MS products or to our sales and reputation as a result of label changes or adverse experiences or events that may occur with patients treated with our MS products;
inability to obtain appropriate pricing and reimbursement for our MS products compared to our competitors in key international markets; or
our ability to obtain and maintain patent, data or market exclusivity for our MS products.
Similarly, the hemophilia treatment market is a highly competitive market, with current treatments marketed by companies that have substantially greater financial resources and marketing expertise. Our ability to successfully compete in the hemophilia market and gain share in this market may be adversely affected due to a number of reasons, including:
difficulty in further penetrating this market if our therapies are not regarded by patients, healthcare providers or payers as offering significant benefits and value over current treatments;
changes in technology, including the introduction by other companies of new technologies, such as gene therapies and bispecific antibody technology that have the potential to transform the standard of care in hemophilia, or longer-lasting or more efficacious, safer, less expensive or more convenient treatments than our therapies; or
our limited marketing experience within the hemophilia treatment market relative to certain of our competitors, which may impact our ability to develop relationships with the associated medical and scientific community.
Sales of our products depend, to a significant extent, on adequate coverage, pricing and reimbursement from third-partythird party payors, which are subject to increasing and intense pressure from political, social, competitive and other sources. Our inability to maintain adequate coverage, or a reduction in pricing or reimbursement, could have an adverse effect on our business, revenues and results of operations, and could cause a decline in our stock price.
Sales of our products are dependent, in large part, on the availability and extent of coverage, pricing and reimbursement from government health administration authorities, private health insurers and other organizations. When a new pharmaceutical product is approved, the availability of government and private reimbursement for that product may be uncertain, as is the pricing and amount for which that product will be reimbursed.
Pricing and reimbursement for our products may be adversely affected by a number of factors, including:
changes in, and implementation of, federal, state or foreign government regulations or private third-party payors' reimbursement policies;
pressure by employers on private health insurance plans to reduce costs; and
consolidation and increasing assertiveness of payors, including managed care organizations, health insurers, pharmacy benefit managers, government health administration authorities, private health insurers and other organizations, seeking price discounts or rebates in connection with the placement of our products on their formularies and, in some cases, the imposition of restrictions on access or coverage of particular drugs or pricing determined based on perceived value.
Our ability to set the price for our products can vary significantly from country to country and as a result so can the price of our products. Certain countries set prices by reference to the prices in other countries where our products are marketed. Thus, our inability to secure adequate prices in a particular country may not only limit the revenue from our products within that country, but may also adversely affect our ability to obtain acceptable prices in other markets. This may create the opportunity for third-party cross-border trade or influence our decision to sell or not to sell a product, thus adversely affecting our geographic expansion plans and revenues.
Our failure to maintain adequate coverage, pricing or reimbursement for our products would have an adverse effect on our business, revenues and results of operation,operations, could curtail or eliminate our ability to adequately fund research and development programs for the discovery and commercialization of new products, and could cause a decline in our stock price.
Drug prices are under significant scrutiny in the markets in which our products are prescribed. DrugWe expect drug pricing and other health care costs to continue to be subject to intense political and societal pressures which we anticipate will continue and escalate on a global basis. In addition, competition from current and future competitors may negatively impact our ability to maintain pricing and our market share. New products or treatments brought to market by our competitors could cause
revenues for our products to decrease due to potential price reductions and lower sales volumes. As a result, our business and reputation may be harmed, our stock price may be adversely impacted and experience periods of volatility and our results of operations may be adversely impacted.
Our results of operations may be adversely affected by current and potential future healthcare reforms.
In the U.S., federal and state legislatures, health agencies and third-party payors continue to focus on containing the cost of health care. Legislative and regulatory proposals and enactments to reform health care insurance programs could significantly influence the manner in which our products are prescribed and purchased. For example, provisions of the Patient Protection and Affordable Care Act (PPACA) have resulted in changes in the way health care is paid for by both governmental and private insurers, including increased rebates owed by manufacturers under the Medicaid Drug Rebate Program, annual fees and taxes on manufacturers of certain branded prescription drugs, the requirement that manufacturers participate in a discount program for certain outpatient drugs under Medicare Part D and the expansion of the number of hospitals eligible for discounts under Section 340B of the Public Health Service Act. These changes have had and are expected to continue to have a significant impact on our business.
We may face uncertainties as a result of federal and administrative efforts to repeal, substantially modify or invalidate some or all of the provisions of the PPACA. There is no assurance that the PPACA, as currently enacted or as amended in the future, will not adversely affect our business and financial results, and we cannot predict how future federal or state legislative or administrative changes relating to healthcare reform will affect our business.
The administration has also indicated an intent to address prescription drug pricing and recent Congressional hearings have brought increased public attention to the costs of prescription drugs. These actions and the uncertainty about the future of the PPACA and healthcare laws may put downward pressure on pharmaceutical pricing and increase our regulatory burdens and operating costs.
There is also significant economic pressure on state budgets that may result in states increasingly seeking to achieve budget savings through mechanisms that limit coverage or payment for our drugs. In recent years, some states have considered legislation and ballot initiatives that would control the prices of drugs, including laws to allow importation of pharmaceutical products from lower cost jurisdictions outside the U.S. and laws intended to impose price controls on state drug purchases. State Medicaid programs are increasingly requesting manufacturers to pay supplemental rebates and requiring prior authorization by the state program for use of any drug for which supplemental rebates are not being paid. Government efforts to reduce Medicaid expenses may lead to increased use of managed care organizations by Medicaid programs. This may result in managed care organizations influencing prescription decisions for a larger segment of the population and a corresponding constraint on prices and reimbursement for our products. In addition, under the PPACA, as states implement their health care marketplaces or operate under the federal exchange, the impact on drug manufacturers, including us, will depend in part on the formulary and benefit design decisions made by insurance sponsors or plans participating in these programs. It is possible that we may need to provide discounts or rebates to such plans in order to maintain favorable formulary access for our products for this patient population, which could have an adverse impact on our sales and results of operations.
In the E.U. and some other international markets, the government provides health care at low cost to consumers and regulates pharmaceutical prices, patient eligibility or reimbursement levels to control costs for the government-sponsored health care system. Many countries have announced or implemented measures to reduce health care costs to constrain their overall level of government expenditures. These measures vary by country and may include, among other things, patient access restrictions, suspensions on price increases, prospective and possibly retroactive price reductions and other recoupments and increased mandatory discounts or rebates, recoveries of past price increases and greater importation of drugs from lower-cost countries to higher-cost countries. These measures have negatively impacted our revenues, and may continue to adversely affect our revenues and results of operations in the future.
Adverse safety events or restrictions on use and safety warnings for our products can negatively affect our business, product sales and stock price.
Adverse safety events involving our marketed products may have a negative impact on our business. Discovery of safety issues with our products could create product liability and could cause additional regulatory scrutiny and requirements for additional labeling or safety monitoring, withdrawal of products from the market and the imposition of fines or criminal penalties. Adverse safety events may also damage physician and patient confidence in our products and our reputation. Any of these could result in liabilities, loss of revenue, material write-offs of inventory, material impairments of intangible assets, goodwill and fixed assets, material restructuring charges and other adverse impacts on our results of operations.
Regulatory authorities are making greater amounts of stand-alone safety information directly available to the public through periodic safety update reports, patient registries and other reporting requirements. The reporting of adverse safety events involving our products or products similar to ours and public rumors about such events may
increase claims against us and may also cause our product sales or stock price to decline or experience periods of volatility.
Restrictions on use or significant safety warnings that may be required to be included in the label of our products, such as the risk of developing progressive multifocal leukoencephalopathy, (PML), a serious brain infection, or liver injury, in the label for certain of our products, may significantly reduce expected revenues for those products and require significant expense and management time.
If we are unable to obtain and maintain adequate protection for our data, intellectual property and other proprietary rights, our business may be harmed.
Our success depends in part on our ability to obtain and defend patent and other intellectual property rights that are important to the commercialization of our products and product candidates. The degree of patent protection that will be afforded to our products and processes in the U.S. and in other important markets remains uncertain and is dependent upon the scope of protection decided upon by the patent offices, courts, administrative bodies and lawmakers in these countries. We can provide no assurance that we will successfully obtain or preserve patent protection for the technologies incorporated into our products and processes, or that the protection obtained will be of sufficient breadth and degree to protect our commercial interests in all countries where we conduct business. If we cannot prevent others from exploiting our inventions, we will not derive the benefit from them that we currently expect. Furthermore, we can provide no assurance that our products will not infringe patents or other intellectual property rights held by third parties.
We also rely on regulatory exclusivity for protection of our products. Implementation and enforcement of regulatory exclusivity, which may consist of regulatory data protection and market protection, varies widely from country to country. Failure to qualify for regulatory exclusivity, or failure to obtain or maintain the extent or duration of such protections that we expect in each of the markets for our products due to challenges, changes or interpretations in the law or otherwise, could affect our revenue for our products or our decision on whether to market our products in a particular country or countries or could otherwise have an adverse impact on our results of operations.
Litigation, interferences, oppositions, inter partes reviews or other proceedings are, have been and may in the future be necessary in some instances to determine the validity and scope of certain of our proprietary rights, and in other instances to determine the validity, scope or non-infringement of certain patent rights claimed by third parties to be pertinent to the manufacture, use or sale of our products. We may also face challenges to our patent and regulatory protections covering our products by third parties, including manufacturers of generics and biosimilars that may choose to launch or attempt to launch their products before the expiration of our patent or regulatory exclusivity. Litigation, interference, oppositions, inter partes reviews, administrative challenges or other similar types of proceedings are unpredictable and may be protracted, expensive and distracting to management. The outcome of such proceedings could adversely affect the validity and scope of our patent or other proprietary rights, hinder our ability to manufacture and market our products, require us to seek a license for the infringed product or technology or result in the assessment of significant monetary damages against us that may exceed amounts, if any, accrued in our financial statements. An adverse determination in a judicial or administrative proceeding or a failure to obtain necessary licenses could prevent us from manufacturing or selling our products. Furthermore, payments under any licenses that we are able to obtain would reduce our profits derived from the covered products and services.
Our long-term success depends upon the successful development of new products and additional indications for existing products.
Our long-term viability and growth will depend upon successful development of additional indications for our existing products as well as successful development of new products and technologies from our research and development activities, our biosimilars joint venture with Samsung Biologics or licenses or acquisitions from third parties.
Product development is very expensive and involves a high degree of risk. Only a small number of research and development programs result in the commercialization of a product. Clinical trials may indicate that our product candidates lack efficacy, have harmful side effects, result in unexpected adverse events or raise other concerns that may significantly reduce the likelihood of regulatory approval. This may result in terminated programs, significant restrictions on use and safety warnings in an approved label, adverse placement within the treatment paradigm or significant reduction in the commercial potential of the product candidate.
Clinical trials and the development of biopharmaceutical products is a lengthy and complex process. If we fail to adequately manage our clinical activities, our clinical trials or potential regulatory approvals may be delayed or denied.
Conducting clinical trials is a complex, time-consuming and expensive process. Our ability to complete clinical trials in a timely fashion depends in large part on a number of key factors. These factors include protocol design, regulatory and institutional review board approval, patient enrollment rates and compliance with extensive current Good Clinical Practices. If we or our third-party clinical trial providers or third-party contract research organizations, or CROs, do not successfully carry out these clinical activities, our clinical trials or the potential regulatory approval of a product candidate may be delayed or be unsuccessful.
We have opened clinical sites and are enrolling patients in a number of countries where our experience is more limited. In most cases, we use the services of third parties to carry out our clinical trial related activities and rely on such parties to accurately report their results. Our reliance on third parties for these activities may impact our ability to control the timing, conduct, expense and quality of our clinical trials. One CRO has responsibility for a substantial portion of our clinical trial related activities and reporting. If this CRO does not adequately perform, many of our trials may be affected. We may need to replace our CROs. Although we believe there are a number of other CROs we could engage to continue these activities, the replacement of an existing CRO may result in the delay of the affected trials or otherwise adversely affect our efforts to obtain regulatory approvals and commercialize our product candidates.
Successful preclinical work or early stage clinical trials does not ensure success in later stage trials, regulatory approval or commercial viability of a product.
Positive results in a trial may not be replicated in subsequent or confirmatory trials. Additionally, success in preclinical work or early stage clinical trials does not ensure that later stage or larger scale clinical trials will be successful or that regulatory approval will be obtained. In addition, even if later stage clinical trials are successful, regulatory authorities may delay or decline approval of our product candidates. Regulatory authorities may disagree with our view of the data, require additional studies or disagree with our trial design or endpoints. Regulatory authorities may also fail to approve the facilities or the processes used to manufacture a product candidate, our dosing or delivery methods or companion devices. Regulatory authorities may grant marketing approval that is more restricted than anticipated. These restrictions may include limiting indications to narrow patient populations and the imposition of safety monitoring, educational requirements and risk evaluation and mitigation strategies. The occurrence of any of these events could result in significant costs and expenses, have an adverse effect on our business, financial condition and results of operations, and cause our stock price to decline or experience periods of volatility.
Even if we are able to successfully develop new products or indications, sales of new products or products with additional indications may not meet investor expectations. We may also make a strategic decision to discontinue development of a product or indication if, for example, we believe commercialization will be difficult relative to the standard of care or other opportunities in our pipeline.
Clinical trials and the development of biopharmaceutical products is a lengthy and complex process. If we fail to adequately manage our clinical activities, our clinical trials or potential regulatory approvals may be delayed or denied.
Conducting clinical trials is a complex, time-consuming and expensive process. Our ability to complete clinical trials in a timely fashion depends in large part on a number of key factors. These factors include protocol design, regulatory and institutional review board approval, patient enrollment rates and compliance with current Good Clinical Practices. If we or our third-party clinical trial providers or third-party CROs do not successfully carry out these clinical activities, our clinical trials or the potential regulatory approval of a product candidate may be delayed or be unsuccessful.
We have opened clinical sites and are enrolling patients in a number of countries where our experience is limited. In most cases, we use the services of third parties to carry out our clinical trial related activities and rely on such parties to accurately report their results. Our reliance on third parties for these activities may impact our ability to control the timing, conduct, expense and quality of our clinical trials. One CRO has responsibility for a substantial portion of our clinical trial related activities and reporting. If this CRO does not adequately perform, many of our trials may be affected. We may need to replace our CROs. Although we believe there are a number of other CROs we could engage to continue these activities, the replacement of an existing CRO may result in the delay of the affected trials or otherwise adversely affect our efforts to obtain regulatory approvals and commercialize our product candidates.
Management and key personnel changes may disrupt our operations, and we may have difficulty retaining key personnel or attracting and retaining qualified replacements on a timely basis for management and other key personnel who may leave the Company.
We have experienced changes in management and other key personnel in critical functions across our organization. In July 2016, we announced thatorganization, including most recently our chief executive officer will be leavingand our company after his successor is identified. It is possible that we may experience other personnel changes in connection with our business operations and the proposed spin off of our hemophilia business.chief financial officer. Changes in management and other key personnel have the potential to disrupt our business, and any such disruption could adversely affect our operations, programs, growth, financial condition and results of operations. Further, new members of management may have different perspectives on programs and opportunities for our business, which may cause us to focus on new business opportunities or reduce or change emphasis on our existing business programs.
Our success is dependent upon our ability to attract and retain qualified management and key personnel in a highly competitive environment. Qualified individuals are in high demand, and we may incur significant costs to attract them, particularly at the executive level. We may face difficulty in attracting and retaining key talent for a number of reasons, such as management changes, the underperformance or discontinuation of one or more late stage programs or recruitment by competitors. We cannot assure you that we will be able to hire or retain the personnel necessary for our operations or that the loss of any such personnel will not have a material impact on our financial condition and results of operations.
Manufacturing issues could substantially increase our costs, limit supply of our products and reduce our revenues.
The process of manufacturing our products is complex, highly regulated and subject to numerous risks, including:
Risk of Product Loss. The manufacturing process for our products is extremely susceptible to product loss due to contamination, oxidation, equipment failure or improper installation or operation of equipment, or vendor or operator error. Even minor deviations from normal manufacturing processes could result in reduced production yields, product defects and other supply disruptions. If microbial, viral or other contaminations are discovered in our products or manufacturing facilities, we may need to close our manufacturing facilities for an extended period of time to investigate and remediate the contaminant.
Risks of Reliance on Third Parties and Single Source Providers. We rely on third-party suppliers and manufacturers for many aspects of our manufacturing process for our products and product candidates. In some cases, due to the unique manner in which our products are manufactured, we rely on single source providers of several raw materials and manufacturing supplies. These third parties are independent entities subject to their own unique operational and financial risks that are outside of our control. These third parties may not perform their obligations in a timely and cost-effective manner or in compliance with applicable regulations, and they may be unable or unwilling to increase production capacity commensurate with demand for our existing or future products. Finding alternative providers could take a significant amount of time and involve significant expense due to the specialized nature of the services and the need to obtain regulatory approval of any significant changes to our suppliers or manufacturing methods. We cannot be certain that we could reach agreement with alternative providers or that the FDA or other regulatory authorities would approve our use of such alternatives.
Global Bulk Supply Risks. We rely on our principal manufacturing facilities in Cambridge, MA, RTP, NC and Hillerød, Denmark for the production of drug substance for our large molecule products and product candidates. Our global bulk supply of these products and product candidates depends on the uninterrupted and efficient operation of these facilities, which could be adversely affected by equipment failures, labor shortages, natural disasters, power failures and numerous other factors.
Risks Relating to Compliance with cGMP.current Good Manufacturing Practices (cGMP). We and our third-party providers are generally required to maintain compliance with cGMP and other stringent requirements and are subject to inspections by the FDA and comparable agencies in other jurisdictions to confirm such compliance. Any delay, interruption or other issues that arise in the manufacture, fill-finish, packaging or storage of our products as a result of a failure of our facilities or the facilities or operations of third parties to pass any regulatory agency inspection could significantly impair our ability to develop and commercialize our products. Significant noncompliance could also result in the imposition of monetary penalties or other civil or criminal sanctions and damage our reputation.
Any adverse developments affecting our manufacturing operations or the operations of our third-party suppliers and manufacturers may result in shipment delays, inventory shortages, lot failures, product withdrawals or recalls or other interruptions in the commercial supply of our products. We may also have to take inventory write-offs and incur other charges and expenses for products that fail to meet specifications, undertake costly remediation efforts or seek more costly manufacturing alternatives. Such developments could increase our manufacturing costs, cause us to lose revenue or market share as patients and physicians turn to competing therapeutics, diminish our profitability or damage our reputation.
We depend on relationships with collaborators and other third parties for revenue, and for the development, regulatory approval, commercialization and marketing of certain of our products and product candidates, which are outside of our full control.
We rely on a number of significant collaborative and other third-party relationships for revenue, and for the development, regulatory approval, commercialization and marketing of certain of our products and product candidates. We also outsource to third parties certain aspects of our regulatory affairs and clinical development relating to our products and product candidates. Reliance on collaborative and other third-party relationships subjects us to a number of risks, including:
we may be unable to control the resources our collaboratorcollaborators or third party devotesparties devote to our programs or products;
disputes may arise under the agreement, including with respect to the achievement and payment of milestones or ownership of rights to technology developed with our collaboratorcollaborators or other third party,parties, and the underlying
contract with our collaboratorcollaborators or other third partyparties may fail to provide significant protection or may fail to be effectively enforced if the collaboratorcollaborators or third party failsparties fail to perform;
the interests of our collaboratorcollaborators or third partyparties may not always be aligned with our interests, and such partyparties may not pursue regulatory approvals or market a product in the same manner or to the same extent that we would, which could adversely affect our revenues;
third-party relationships and collaborations often require the parties to cooperate, and failure to do so effectively could adversely affect product sales, or the clinical development or regulatory approvals of products under joint control or could result in termination of the research, development or commercialization of product candidates or result in litigation or arbitration; and
any failure on the part of our collaboratorcollaborators or other third partyparties to comply with applicable laws and regulatory requirements in the marketing, sale and maintenance of the marketmarketing authorization of our products or to fulfill any responsibilities our collaboratorcollaborators or other third parties may have to protect and enforce any intellectual property rights underlying our products could have an adverse effect on our revenues as well as involve us in possible legal proceedings.
Given these risks, there is considerable uncertainty regarding the success of our current and future collaborative efforts. If these efforts fail, our product development or commercialization of new products could be delayed or revenues from products could decline.
Our business may be adversely affected if we do not successfully execute our growth initiatives.
We are experiencing a period of slower revenue growth compared to recent years. We anticipate growth through internal development projects, commercial initiatives and external opportunities, which may include the acquisition, partnering and in-licensing of products, technologies and companies or the entry into strategic alliances and collaborations. While we believe we have a number of promising programs in our pipeline, failure of internal development projects to advance or difficulties in executing on our commercial initiatives could impact our current and future growth, resulting in additional reliance on external development opportunities for growth. The availability of high quality, cost-effective development opportunities is limited and competitive, and we are not certain that we will be able to identify candidates that we and our shareholders consider suitable or complete transactions on terms that are acceptable to us and our shareholders. We may fail to complete transactions for other reasons, including if we are unable to obtain desired financing on favorable terms, if at all. Even if we are able to successfully identify and complete acquisitions and other strategic alliances and collaborations, we may face unanticipated costs or liabilities in connection with the transaction or we may not be able to integrate them or take full advantage of them or otherwise realize the benefits that we expect.
Supporting our growth initiatives and the further development of our existing products and potential new products in our pipeline requireswill require significant capital expenditures and management resources, including investments in research and development, sales and marketing, manufacturing capabilities and other areas of our business. If we do not successfully execute our growth initiatives, then our business and financial results may be adversely affected and we may incur asset impairment or restructuring charges.
The proposed spin offWe are pursuing opportunities to expand our manufacturing capacity for future clinical and commercial requirements for product candidates, which will result in the incurrence of our hemophilia business is subject to various risks and uncertainties and may not be completed on the terms or timeline currently contemplated, if at all, and will involve significant time and expense, which could harm our business, results of operations and financial condition.
In May 2016, we announced plans to separate our hemophilia business as an independent, publicly-traded company. The transaction is expected to be completed in early 2017, subject to satisfaction of certain conditions. Unanticipated developments could delay, prevent or otherwise adversely affect this proposed spin off, including but not limited to disruptions in general market conditions or potential problems, delays or difficulties in satisfying conditions and obtaining approvals and clearances or litigation or other legal proceedings that may arise as a result of the proposed spin off. In addition, consummation of the spin off will require final approval from our Board of Directors. Therefore, we cannot assure that we will be able to complete the spin off on the terms or on the timeline that we announced, if at all.
We will incur significant expenses in connectioninvestment with the spin off, and such costs and expenses may be greater than we anticipate. In addition, completion of the spin off will require a significant amount of management time and effort which may disrupt our business or otherwise divert management’s attention from other aspects of our business operations. Any such difficulties could adversely affect our business, results of operations and financial condition.
The proposed spin off may not achieve some or all of the anticipated benefits.
If the spin off is completed, there is uncertainty as to whether the anticipated operational, financial and strategic benefits of the spin off will be achieved. There can be no assurance that the combined value of the common stock of the two publicly-traded companiessuch investment will be equalrecouped.
While we believe we currently have sufficient large scale manufacturing capacity to or greater than what the value ofmeet our common stocknear-term manufacturing requirements, it is probable that we would have been had the proposed separation not occurred. The combined value of the common stock of the two companies could be lower than anticipatedneed additional large scale manufacturing capacity to support future clinical and commercial manufacturing requirements for product candidates in our pipeline, if such candidates are successful and approved. We are building a variety of reasons, including, but not limitedlarge scale biologics manufacturing facility in Solothurn, Switzerland. Due to the inabilitylong lead times necessary for the expansion of the new spin off companymanufacturing capacity, we expect to operate and compete effectively as an independent company, and the stock price of the common stock of each of the two companies could experience periods of volatility.make significant investments to build or obtain third-party contract manufacturers with no assurance that such investment will be recouped. If we failare unable to achieve the anticipated benefits of the spin off,adequately and timely manufacture and supply our stock price could decline.
If the spin off does not qualify as a transaction that is generally tax-free for U.S. federal income tax purposes, weproducts and our stockholders could be subject to significant tax liabilities.
We intend to obtain an opinion of outside counsel regarding the qualification of the distribution in the spin off, together with certain related transactions, as a transaction that is generally tax-free for U.S. federal income tax purposes. The opinion will be based on and rely on, among other things, certain facts and assumptions, as well as certain representations, statements and undertakings of Biogen and the new spin off company, including those relating to the past and future conduct of Biogen and the new spin off company. If any of these facts, assumptions, representations, statements or undertakings are, or become, inaccurate or incomplete,product candidates or if we or the new spin off company breach any of their respective covenants in the separation documents, the opinion of counseldo not fully utilize our manufacturing facilities, our business may be invalid and the conclusions reached therein could be jeopardized. It is also possible that the U.S. Internal Revenue Service, or the IRS, could determine that the distribution in the spin off, together with certain related transactions, is taxable for U.S. federal income tax purposes if it determines that any of these facts, assumptions, representations, statements or undertakings are incorrect or have been violated or if it disagrees with the conclusions in the opinion of counsel. An opinion of counsel is not binding on the IRS or any court and there can be no assurance that the IRS will not challenge the conclusions reached in the opinion. If the distribution in the spin off, together with certain related transactions, is ultimately determined to be taxable, we and our stockholders that are subject to U.S. federal income tax could incur significant tax liabilities.harmed.
A breakdown or breach of our technology systems could subject us to liability or interrupt the operation of our business.
We are increasingly dependent upon technology systems and data. Our computer systems continue to increase in multitude and complexity due to the growth in our business, making them potentially vulnerable to breakdown, malicious intrusion and random attack. Likewise, data privacy or security breaches by individuals authorized to
access our technology systems or others may pose a risk that sensitive data, including intellectual property, trade secrets or personal information belonging to us, our patients, customers or other business partners, may be exposed to unauthorized persons or to the public. Cyber-attacks are increasing in their frequency, sophistication and intensity, and are becoming increasingly difficult to detect. They are often carried out by motivated, well-resourced, skilled and persistent actors including nation states, organized crime groups, “hacktivists" and “hacktivists.”employees or contractors acting with malicious intent. Cyber-attacks could include the deployment of harmful malware and key loggers, ransomware, a denial-of-service attack, a malicious website, the use of social engineering and other means to affect the confidentiality, integrity and availability of our technology systems and data. Our key business partners face similar risks and any security breach of their systems could adversely affect our security posture. While we continue to build and improve our systems and infrastructure and believe we have taken appropriate security measures to reduce these risks to our data and information technology systems, there can be no assurance that our efforts will prevent breakdowns or breaches in our systems that could adversely affect our business and operations and/or result in the loss of critical or sensitive information, which could result in financial, legal, business or reputational harm to us. In addition, our liability insurance may not be sufficient in type or amount to cover us against claims related to security breaches, cyber-attacks and other related breaches.
If we fail to comply with the extensive legal and regulatory requirements affecting the health care industry, we could face increased costs, penalties and a loss of business.
Our activities, and the activities of our collaborators, distributors and other third-party providers, are subject to extensive government regulation and oversight both in the U.S. and in foreign jurisdictions. The FDA and comparable agencies in other jurisdictions directly regulate many of our most critical business activities, including the conduct of preclinical and clinical studies, product manufacturing, advertising and promotion, product distribution, adverse event reporting and product risk management. Our interactions in the U.S. or abroad with physicians and other health care providers that prescribe or purchase our products are also subject to government regulation designed to prevent fraud and abuse in the sale and use of the products and place significant restrictions on the marketing practices of health care companies. Health care companies such as ours are facing heightened scrutiny of their relationships
with health care providers from anti-corruption enforcement officials. In addition, health care companies such as ours have been the target of lawsuits and investigations alleging violations of government regulation, including claims asserting submission of incorrect pricing information, impermissible off-label promotion of pharmaceutical products, payments intended to influence the referral of health care business, submission of false claims for government reimbursement, antitrust violations or violations related to environmental matters. There is also enhanced scrutiny of company-sponsored patient assistance programs, including insurance premium and co-pay assistance programs and donations to third partythird-party charities that provide such assistance. If we or our vendors or donation recipients are deemed to fail to comply with relevant laws, regulations or government guidance in the operation of these programs, we could be subject to significant fines or penalties. Risks relating to compliance with laws and regulations may be heightened as we continue to expand our global operations and enter new therapeutic areas with different patient populations, which may have different product distribution methods, marketing programs or patient assistance programs from those we currently utilize or support.
Regulations governing the health care industry are subject to change, with possibly retroactive effect, including:
new laws, regulations or judicial decisions, or new interpretations of existing laws, regulations or decisions, related to health care availability, pricing or marketing practices, compliance with wage and hour laws and other employment practices, method of delivery, payment for health care products and services, compliance with health information and data privacy and security laws and regulations, tracking and reporting payments and other transfers of value made to physicians and teaching hospitals, extensive anti-bribery and anti-corruption prohibitions, product serialization and labeling requirements and used product take-back requirements;
changes in the FDA and foreign regulatory approval processes that may delay or prevent the approval of new products and result in lost market opportunity;
the hiring freeze implemented by the federal government in 2017, including at the FDA, could impact the review and potential approval of new products, which may adversely affect our business and financial condition;
requirements that provide for increased transparency of clinical trial results and quality data, such as the EMA’sEuropean Medicines Agency's clinical transparency policy, which could impact our ability to protect trade secrets and competitively-sensitive information contained in approval applications or could be misinterpreted leading to reputational damage, misperception or legal action, which could harm our business; and
changes in FDA and foreign regulations that may require additional safety monitoring, labeling changes, restrictions on product distribution or use, or other measures after the introduction of our products to market, which could increase our costs of doing business, adversely affect the future permitted uses of approved products or otherwise adversely affect the market for our products.
Violations of governmental regulation may be punishable by criminal and civil sanctions against us, including fines and civil monetary penalties and exclusion from participation in government programs, including Medicare and Medicaid, as well as against executives overseeing our business. In addition to penalties for violation of laws and regulations, we could be required to repay amounts we received from government payors, or pay additional rebates and interest if we are found to have miscalculated the pricing information we have submitted to the government. We cannot ensure that our compliance controls, policies and procedures will in every instance protect us from acts committed by our employees, collaborators, partners or third-party providers that would violate the laws or regulations of the jurisdictions in which we operate. Whether or not we have complied with the law, an investigation into alleged unlawful conduct could increase our expenses, damage our reputation, divert management time and attention and adversely affect our business.
Our indebtedness could adversely affect our business and limit our ability to plan for or respond to changes in our business.
Our indebtedness, together with our significant contingent liabilities, including milestone and royalty payment obligations, could have important consequences to our business; for example, such obligations could:
increase our vulnerability to general adverse economic and industry conditions;
limit our ability to access capital markets and incur additional debt in the future;
require us to dedicate a substantial portion of our cash flow from operations to payments on our indebtedness, thereby reducing the availability of our cash flow for other purposes, including business development efforts, research and development and mergers and acquisitions; and
limit our flexibility in planning for, or reacting to, changes in our business and the industry in which we operate, thereby placing us at a competitive disadvantage compared to our competitors that have less debt.
Our sales and operations are subject to the risks of doing business internationally.
We are increasing our presence in international markets, particularly emerging markets, subjecting us to many risks that could adversely affect our business and revenues, such as:
the inability to obtain necessary foreign regulatory or pricing approvals of products in a timely manner;
collectability of accounts receivable;
fluctuations in foreign currency exchange rates, in particular the recent strength of the U.S. dollar versus foreign currencies which has adversely impacted our revenues and net income;
difficulties in staffing and managing international operations;
the imposition of governmental controls;
less favorable intellectual property or other applicable laws;
increasingly complex standards for complying with foreign laws and regulations that may differ substantially from country to country and may conflict with corresponding U.S. laws and regulations;
the far-reaching anti-bribery and anti-corruption legislation in the U.K., including the U.K. Bribery Act 2010, and elsewhere and escalation of investigations and prosecutions pursuant to such laws;
compliance with complex import and export control laws;
restrictions on direct investments by foreign entities and trade restrictions;
greater political or economic instability; and
changes in tax laws and tariffs.
In addition, our international operations are subject to regulation under U.S. law. For example, the Foreign Corrupt Practices Act prohibits U.S. companies and their representatives from offering, promising, authorizing or making payments to foreign officials for the purpose of obtaining or retaining business abroad. In many countries, the health care professionals we regularly interact with may meet the definition of a foreign government official for purposes of the Foreign Corrupt Practices Act. Failure to comply with domestic or foreign laws could result in various adverse consequences, including: possible delay in approval or refusal to approve a product; recalls, seizures or withdrawal of an approved product from the market; disruption in the supply or availability of our products or suspension of export or import privileges; the imposition of civil or criminal sanctions; the prosecution of executives overseeing our international operations; and damage to our reputation. Any significant impairment of our ability to sell products outside of the U.S. could adversely impact our business and financial results.
Our effective tax rate may fluctuate and we may incur obligations in tax jurisdictions in excess of accrued amounts.
As a global biopharmaceutical company, we are subject to taxation in numerous countries, states and other jurisdictions. As a result, our effective tax rate is derived from a combination of applicable tax rates in the various places that we operate. In preparing our financial statements, we estimate the amount of tax that will become payable in each of such places. Our effective tax rate, however, may be different than experienced in the past due to numerous factors, including changes in the mix of our profitability from country to country, the results of examinations and audits of our tax filings, adjustments to the value of our uncertain tax positions, changes in accounting for income taxes and changes in tax laws. Any of these factors could cause us to experience an effective tax rate significantly different from previous periods or our current expectations.
In addition, our inability to secure or sustain acceptable arrangements with tax authorities and future changes in the tax laws, among other things, may result in tax obligations in excess of amounts accrued in our financial statements.
In the U.S., there are several proposals under consideration to reform tax law, including proposals that may reduce or eliminate the deferral of U.S. income tax on our unrepatriated earnings, penalize certain transfer pricing structures and reduce or eliminate certain foreign or domestic tax credits or deductions. Our future reported financial results may be adversely affected by tax law changes which restrict or eliminate certain foreign tax credits or our ability to deduct expenses attributable to foreign earnings, or otherwise affect the treatment of our unrepatriated earnings.
In addition to U.S. tax reform proposals, the adoption of some or all of the recommendations set forth in the Organization for Economic Co-operation and Development’s project on “Base Erosion and Profit Shifting” (BEPS) by tax authorities in the countries in which we operate could negatively impact our effective tax rate. These recommendations focus on payments from affiliates in high tax jurisdictions to affiliates in lower tax jurisdictions and the activities that give rise to a taxable presence in a particular country.
Our indebtedness could adversely affect our business and limit our ability to plan for or respond to changes in our business.
Our indebtedness, together with our significant contingent liabilities, including milestone and royalty payment obligations, could have important consequences to our business; for example, such obligations could:
increase our vulnerability to general adverse economic and industry conditions;
limit our ability to access capital markets and incur additional debt in the future;
require us to dedicate a substantial portion of our cash flow from operations to payments on our indebtedness, thereby reducing the availability of our cash flow for other purposes, including business development efforts, research and development and mergers and acquisitions; and
limit our flexibility in planning for, or reacting to, changes in our business and the industry in which we operate, thereby placing us at a competitive disadvantage compared to our competitors that have less debt.
Our sales and operations are subject to the risks of doing business internationally.
We are increasing our presence in international markets, particularly emerging markets, subjecting us to many risks that could adversely affect our business and revenues, such as:
the inability to obtain necessary foreign regulatory or pricing approvals of products in a timely manner;
uncertainties regarding the collectability of accounts receivable;
fluctuations in foreign currency exchange rates, in particular the recent strength of the U.S. dollar versus foreign currencies, which has adversely impacted our revenues and net income;
difficulties in staffing and managing international operations;
the imposition of governmental controls;
less favorable intellectual property or other applicable laws;
increasingly complex standards for complying with foreign laws and regulations that may differ substantially from country to country and may conflict with corresponding U.S. laws and regulations;
the far-reaching anti-bribery and anti-corruption legislation in the U.K., including the U.K. Bribery Act 2010, and elsewhere and escalation of investigations and prosecutions pursuant to such laws;
the effects of the implementation of the U.K.'s decision to voluntarily depart from the E.U., known as Brexit;
compliance with complex import and export control laws;
restrictions on direct investments by foreign entities and trade restrictions;
greater political or economic instability; and
changes in tax laws and tariffs.
In addition, our international operations are subject to regulation under U.S. law. For example, the Foreign Corrupt Practices Act prohibits U.S. companies and their representatives from offering, promising, authorizing or making payments to foreign officials for the purpose of obtaining or retaining business abroad. In many countries, the health care professionals we regularly interact with may meet the definition of a foreign government official for purposes of the Foreign Corrupt Practices Act. Failure to comply with domestic or foreign laws could result in various adverse consequences, including: possible delay in approval or refusal to approve a product; recalls, seizures or withdrawal of an approved product from the market; disruption in the supply or availability of our products or suspension of export or import privileges; the imposition of civil or criminal sanctions; the prosecution of executives overseeing our international operations; and damage to our reputation. Any significant impairment of our ability to sell products outside of the U.S. could adversely impact our business and financial results.
Our operating results are subject to significant fluctuations.
Our quarterly revenues, expenses and net income (loss) have fluctuated in the past and are likely to fluctuate significantly in the future due to the risks described in these “Risk Factors” as well as the timing of charges and expenses that we may take. We have recorded, or may be required to record, charges that include:
the cost of restructurings;
impairments with respect to investments, fixed assets and long-lived assets, including in-process R&D and other intangible assets;
inventory write-downs for failed quality specifications, charges for excess or obsolete inventory and charges for inventory write downs relating to product suspensions, expirations or recalls;
changes in the fair value of contingent consideration;
bad debt expenses and increased bad debt reserves;
outcomes of litigation and other legal or administrative proceedings, regulatory matters and tax matters;
milestone payments under license and collaboration agreements; and
payments in connection with acquisitions and other business development activities.
Our revenues are also subject to foreign currency exchange rate fluctuations due to the global nature of our operations. Although we have foreign currency forward contracts to hedge specific forecasted transactions denominated in foreign currencies, our efforts to mitigate the impact of fluctuating currency exchange rates may not be successful. As a result, currency fluctuations among our reporting currency, the U.S. dollar and the currencies in which we do business will affect our operating results, often in unpredictable ways. Our net income may also fluctuate due to the impact of charges we may be required to take with respect to foreign currency hedge transactions. In particular, we may incur higher than expected charges from hedge ineffectiveness or from the termination of a hedge relationship.
Our operating results during any one period do not necessarily suggest the anticipated results of future periods.
We are pursuing opportunities to expand our manufacturing capacity for future clinical and commercial requirements for product candidates, which will result in the incurrence of significant investment with no assurance that such investment will be recouped.
While we believe we currently have sufficient manufacturing capacity to meet our near-term manufacturing requirements, it is probable that we would need additional manufacturing capacity to support future clinical and commercial manufacturing requirements for product candidates in our pipeline, if such candidates are successful and approved. We are building a biologics manufacturing facility in Solothurn, Switzerland and acquired an additional manufacturing facility in RTP, NC. Due to the long lead times necessary for the expansion of manufacturing capacity, we expect to incur significant investment to build or expand our facilities or obtain third-party contract manufacturers with no assurance that such investment will be recouped. If we are unable to adequately and timely manufacture and supply our products and product candidates or if we do not fully utilize our manufacturing facilities, our business may be harmed.
Our investment in Samsung Bioepis, and our success in commercializing biosimilars developed by Samsung Bioepis, areis subject to risks and uncertainties inherent in the development, manufacture and commercialization of biosimilars.
Our investment in Samsung Bioepis, and our success in commercializing biosimilars developed by Samsung Bioepis, areis subject to a number of risks, including:
Reliance on Third Parties. We are dependent on the efforts of Samsung Bioepis and other third parties over whom we have limited or no control in the development and manufacturing of biosimilars products. If Samsung Bioepis or such other third parties fail to perform successfully, we may not realize the anticipated benefits of our investment in Samsung Bioepis;
Regulatory Compliance. Biosimilar products may face regulatory hurdles or delays due to the evolving and uncertain regulatory and commercial pathway of biosimilars products in certain jurisdictions;
Intellectual Property and Regulatory Challenges. Biosimilar products may face extensive patent clearances, patent infringement litigation, injunctions or regulatory challenges, which could prevent the commercial launch of a product or delay it for many years;
Failure to Gain Market and Patient Acceptance. Market success of biosimilar products will be adversely affected if patients, physicians andand/or payers do not accept biosimilar products as safe and efficacious products offering a more competitive price or other benefit over existing therapies;
Ability to Provide Adequate Supply. Manufacturing biosimilars is complex. If we encounter any manufacturing or supply chain difficulties, we may be unable to meet higher than anticipated demand; and
Competitive Challenges. Biosimilar products face significant competition, including from innovator products and from biosimilar products offered by other companies. In some jurisdictions, local tendering processes may restrict biosimilar products from being marketed and sold in those jurisdictions. The number of competitors in a jurisdiction, the timing of approval and the ability to market biosimilar products successfully in a timely and cost-effective matter are additional factors that may impact our success and/or the success of Samsung Bioepis in this business area.
Our investments in properties may not be fully realized.
We own or lease real estate primarily consisting of buildings that contain research laboratories, office space and manufacturing operations. For strategic or other operational reasons, we may decide to further consolidate or co-locate certain aspects of our business operations or dispose of one or more of our properties, some of which may be located in markets that are experiencing high vacancy rates and decreasing property values. If we determine that the fair value of any of our owned properties is lower than their book value we may not realize the full investment in these properties and incur significant impairment charges or additional depreciation when the expected useful lifelives of certain assets have been shortened due to the anticipated closing of facilities. If we decide to fully or partially vacate a leased property, we may incur significant cost, including facility closing costs, employee separation and retention expenses, lease termination fees, rent expense in excess of sublease income and impairment of leasehold improvements and accelerated depreciation of assets. Any of these events may have an adverse impact on our results of operations.
Our portfolio of marketable securities is subject to market, interest and credit risk that may reduce its value.
We maintain a portfolio of marketable securities for investment of our cash. Changes in the value of our portfolio of marketable securities could adversely affect our earnings. In particular, the value of our investments may decline due to increases in interest rates, downgrades of the bonds and other securities included in our portfolio, instability in the global financial markets that reduces the liquidity of securities included in our portfolio, declines in the value of collateral underlying the securities included in our portfolio and other factors. Each of these events may cause us to record charges to reduce the carrying value of our investment portfolio or sell investments for less than our acquisition cost. Although we attempt to mitigate these risks through diversification of our investments and continuous monitoring of our portfolio's overall risk profile, the value of our investments may nevertheless decline.
There can be no assurance that we will continue to repurchase stock or that we will repurchase stock at favorable prices.
OurFrom time to time our Board of Directors has approvedauthorizes stock repurchase programs, and may approve additional repurchase programs in the future.including most recently our 2016 Share Repurchase Program. The amount and timing of stock repurchases are subject to capital availability and our determination that stock repurchases are in the best interest of our stockholdersshareholders and are in compliance with all respective laws and our agreements applicable to the repurchase of stock. Our ability to repurchase stock will depend upon, among other factors, our cash balances and potential future capital requirements for strategic transactions, our results of operations, our financial condition and other factors beyond our control that we may deem relevant. A reduction in, or the completion or expiration of, our stock repurchase programs could have a negative effect on our stock price. We can provide no assurance that we will repurchase stock at favorable prices, if at all.
We may not be able to access the capital and credit markets on terms that are favorable to us.
We may seek access to the capital markets to supplement our existing funds and cash generated from operations for working capital, capital expenditure and debt service requirements and other business initiatives. The capital and credit markets have experienced extreme volatility and disruption, which leads to uncertainty and liquidity issues for both borrowers and investors. In the event of adverse capital and credit market conditions, we may be unable to obtain capital market financing on favorable terms. Changes in credit ratings issued by nationally recognized credit rating agencies could also adversely affect our cost of financing and the market price of our securities.
We may incur operational difficulties or be exposed to claims and liabilities as a result of the separation and distribution of Bioverativ.
On February 1, 2017, we distributed all of the then outstanding shares of Bioverativ common stock to Biogen shareholders in connection with the separation of our hemophilia business. In connection with the distribution, we entered into a separation and distribution agreement and various other agreements (including a transition services agreement, a tax matters agreement, a manufacturing and supply agreement, an employee matters agreement, an intellectual property matters agreement and certain other commercial agreements). These agreements govern the separation and distribution and the relationship between us and Bioverativ going forward, including with respect to potential tax-related losses associated with the separation and distribution. They also provide for the performance of services by each company for the benefit of the other for a period of time (including under the manufacturing and supply agreement pursuant to which we will manufacture and supply certain products and materials to Bioverativ).
The spin-off of our hemophilia business as an independent public company is intended to qualify for tax-free treatment to Biogen and its shareholders under the Internal Revenue Code. Completion of the spin-off was conditioned upon, among other things, our receipt of a favorable opinion from our tax advisors with respect to the tax-free nature of the transaction. The opinion is not binding on the U.S. Internal Revenue Service, or the courts, and there can be no assurance that the IRS or the courts will not challenge the qualification of the spin-off as a tax-free transaction or that any such challenge would not prevail. If the spin-off is determined to be taxable, Biogen and its shareholders could incur significant tax liabilities, which could adversely affect our business, financial condition, or results of operations.
Bioverativ has agreed to indemnify us for certain potential liabilities that may arise, but we cannot guarantee that Bioverativ will be able to satisfy its indemnification obligations.
The separation and distribution agreement provides for indemnification obligations designed to make Bioverativ financially responsible for many liabilities that may exist relating to its business activities, whether incurred prior to or after the distribution, including any pending or future litigation. It is possible that a court would disregard the
allocation agreed to between us and Bioverativ and require us to assume responsibility for obligations allocated to Bioverativ. Third parties could also seek to hold us responsible for any of these liabilities or obligations, and the indemnity rights we have under the separation and distribution agreement may not be sufficient to fully cover all of these liabilities and obligations. Even if we are successful in obtaining indemnification, we may have to bear costs temporarily. In addition, our indemnity obligations to Bioverativ may be significant. These risks could negatively affect our business, financial condition or results of operations.
The separation of Bioverativ continues to involve a number of risks, including, among other things, the indemnification risks described above and the potential that management’s and our employees’ attention will be significantly diverted by the provision of transitional services. Certain of the agreements described above provide for the performance of services by each company for the benefit of the other for a period of time. If Bioverativ is unable to satisfy its obligations under these agreements, including its indemnification obligations, we could incur losses. These arrangements could also lead to disputes over rights to certain shared property and over the allocation of costs and revenues for products and operations. Our inability to effectively manage the separation activities and related events could adversely affect our business, financial condition or results of operations.
We may not achieve some or all of the anticipated benefits of the separation of Bioverativ, which may adversely affect our business.
We may not be able to achieve the full strategic and financial benefits expected to result from the separation of Bioverativ, or such benefits may be delayed or not occur at all. If we fail to achieve some or all of the expected benefits of the separation, or if such benefits are delayed, our business, financial condition, results of operations and the value of our stock could be adversely impacted.
Our business involves environmental risks, which include the cost of compliance and the risk of contamination or injury.
Our business and the business of several of our strategic partners involve the controlled use of hazardous materials, chemicals, biologics and radioactive compounds. Although we believe that our safety procedures for handling and disposing of such materials comply with state, federal and foreign standards, there will always be the risk of accidental contamination or injury. If we were to become liable for an accident, or if we were to suffer an extended facility shutdown, we could incur significant costs, damages and penalties that could harm our business. Manufacturing of our products and product candidates also requires permits from government agencies for water supply and wastewater discharge. If we do not obtain appropriate permits, including permits for sufficient quantities of water and wastewater, we could incur significant costs and limits on our manufacturing volumes that could harm our business.
The illegal distribution and sale by third parties of counterfeit versions of our products or stolen products could have a negative impact on our reputation and business.
Third parties might illegally distribute and sell counterfeit or unfit versions of our products, which do not meet our rigorous manufacturing, distribution and testing standards. A patient who receives a counterfeit or unfit drug may be at risk for a number of dangerous health consequences. Our reputation and business could suffer harm as a result of counterfeit or unfit drugs sold under our brand name. Stolen inventory that is not properly stored or sold through unauthorized channels could adversely impact patient safety, our reputation and our business. In addition, thefts of inventory atthat is stolen from warehouses, plants or while in-transit, which are not properlyand that is subsequently improperly stored and which are sold through unauthorized channels, could adversely impact patient safety, our reputation and our business.
The increasing use of social media platforms presents new risks and challenges.
Social media is increasingly being used to communicate about our products and the diseases our therapies are designed to treat. Social media practices in the biopharmaceutical industry continue to evolve and regulations relating to such use are not always clear. This evolution creates uncertainty and risk of noncompliance with regulations applicable to our business. For example, patients may use social media channels to comment on the effectiveness of a product or to report an alleged adverse event. When such disclosures occur, there is a risk that we fail to monitor and comply with applicable adverse event reporting obligations or we may not be able to defend the company or the public's legitimate interests in the face of the political and market pressures generated by social media due to restrictions on what we may say about our products. There is also a risk of inappropriate disclosure of sensitive information or negative or inaccurate posts or comments about us on any social networking website. If any of these events were to occur or we otherwise fail to comply with applicable regulations, we could incur liability, face overly restrictive regulatory actions or incur other harm to our business.
Some of our collaboration agreements contain change in control provisions that may discourage a third party from attempting to acquire us.
Some of our collaboration agreements include change in control provisions that could reduce the potential acquisition price an acquirer is willing to pay or discourage a takeover attempt that could be viewed as beneficial to shareholders. Upon a change in control, some of these provisions could trigger reduced milestone, profit or royalty payments to us or give our collaboration partner rights to terminate our collaboration agreement, acquire operational control or force the purchase or sale of the programs that are the subject of the collaboration.
Item 2. Unregistered Sales of Equity Securities and Use of Proceeds
Issuer Purchases of Equity Securities
The following table summarizes our common stock repurchase activity under our 2016 Share Repurchase Program during the second quarter of 2017:
|
| | | | | | | | | | | | | |
| Period | Total Number of Shares Purchased (#) | | Average Price Paid per Share ($) | | Total Number of Shares Purchased as Part of Publicly Announced Programs (#) | | Maximum Approximate Dollar Value of Shares That May Yet Be Purchased Under Our Programs ($ in millions) |
| April 2017 | 2,300,000 |
| | $ | 272.03 |
| | 2,300,000 |
| | $ | 3,156.0 |
|
| May 2017 | 571,804 |
| | $ | 273.03 |
| | 571,804 |
| | $ | 3,000.0 |
|
| June 2017 | — |
| | — |
| | — |
| | $ | — |
|
| Total | 2,871,804 |
| | $ | 272.23 |
| | | | |
In July 2016 our Board of Directors authorized a program to repurchase up to $5.0 billion of our common stock (2016 Share Repurchase Program). This authorization does not have an expiration date. Repurchased sharesAll share repurchases under this authorization will be retired. The 2016 Share Repurchase Program is in addition to the approximately 1.3Under this program, we repurchased and retired 2.9 million and 3.7 million shares remaining under our February 2011 Share Repurchase Program (2011 Share Repurchase Program), which has been used principally to offsetof common stock issuances under our share-based compensation plans. Duringat a cost of $781.8 million and $1.0 billion during the three and six months ended June 30, 2016 and 2015, we did not2017, respectively. As of June 30, 2017, approximately $3.0 billion remains available to repurchase any shares of common stock under our 2011 Share Repurchase Program.this authorization.
In May 2015,February 2011 our Board of Directors authorized a program to repurchase up to $5.0 billion20.0 million shares of our common stock, which was completed as of DecemberMarch 31, 2015.2017. During the six months ended June 30, 2015,2017, we repurchased and retired 0.11.3 million shares of common stock at a cost of $42.2 million.$365.4 million under this program. During the three and six months ended June 30, 2016, we did not repurchase any shares of common stock under this program.
Item 6. Exhibits
The exhibits listed on the Exhibit Index immediately preceding such exhibits, which is incorporated herein by reference, are filed or furnished as part of this Quarterly Report on Form 10-Q.
SIGNATURES
Pursuant to the requirements of the Securities Exchange Act of 1934, the registrant has duly caused this report to be signed on its behalf by the undersigned thereunto duly authorized.
|
|
| |
| BIOGEN INC. |
| |
/s/ Paul J. ClancyGregory F. Covino |
Paul J. ClancyGregory F. Covino |
Executive Vice President, Finance |
| Chief Accounting Officer and |
ChiefInterim Principal Financial Officer |
(principal (principal financial officer) |
July 21, 201625, 2017
|
| | |
Exhibit Number | | Description of Exhibit |
| | | |
| 3.1 | | Fourth Amended and Restated Bylaws of Biogen Inc. Filed as Exhibit 3.1 to our Current Report on Form 8-K filed on June 9, 2017. |
| | |
| 10.1* | | Biogen Inc. 2017 Omnibus Equity Plan. Filed as Appendix B to our Definitive Proxy Statement on Schedule 14A filed on April 26, 2017. |
| | |
| 10.2*+ | | Letter regarding employment arrangementForm of John Cox dated May 19, 2016.restricted stock unit award agreement under the Biogen Inc. 2017 Omnibus Equity Plan. |
| | |
| 10.3*+ | | Form of market stock unit award agreement under the Biogen Inc. 2017 Omnibus Equity Plan. |
| | |
| 10.4*+ | | Form of performance unit award agreement under the Biogen Inc. 2017 Omnibus Equity Plan. |
| | |
| 10.5*+ | | Form of performance unit award agreement under the Biogen Inc. 2017 Omnibus Equity Plan. |
| | | |
| 31.1+ | | Certification of the Chief Executive Officer Pursuant to Section 302 of the Sarbanes-Oxley Act of 2002. |
| | | |
| 31.2+ | | Certification of the ChiefPrincipal Financial Officer Pursuant to Section 302 of the Sarbanes-Oxley Act of 2002. |
| | | |
| 32.1++ | | Certification Pursuant to Section 906 of the Sarbanes-Oxley Act of 2002. |
| | | |
| 101++ | | The following materials from Biogen Inc.’s Quarterly Report on Form 10-Q for the quarter ended June 30, 2016,2017, formatted in XBRL (Extensible Business Reporting Language): (i) the Condensed Consolidated Statements of Income, (ii) the Condensed Consolidated Statements of Comprehensive Income, (iii) the Condensed Consolidated Balance Sheets, (iv) the Condensed Consolidated Statements of Cash Flows, and (v) Notes to Condensed Consolidated Financial Statements. |
* Management contract or compensatory plan or arrangement
+ Filed herewith
++ Furnished herewith