UNITED STATES
SECURITIES AND EXCHANGE COMMISSION
WASHINGTON, D.C. 20549
|
| |
x | QUARTERLY REPORT PURSUANT TO SECTION 13 OR 15(d) OF THE SECURITIES EXCHANGE ACT OF 1934 |
FOR THE QUARTERLY PERIOD ENDED SEPTEMBER 30, 2017 |
or |
o | TRANSITION REPORT PURSUANT TO SECTION 13 OR 15(d) OF THE SECURITIES EXCHANGE ACT OF 1934 |
FOR THE TRANSITION PERIOD FROM TO
|
☒ QUARTERLY REPORT PURSUANT TO SECTION 13 OR 15(d) OF THE SECURITIES EXCHANGE ACT OF 1934FOR THE QUARTERLY PERIOD ENDED JUNE 30, 2020
or
☐ TRANSITION REPORT PURSUANT TO SECTION 13 OR 15(d) OF THE SECURITIES EXCHANGE ACT OF 1934
FOR THE TRANSITION PERIOD FROM TO
Commission file number 000-19319
Vertex Pharmaceuticals Incorporated
(Exact name of registrant as specified in its charter)
Massachusetts
(State or other jurisdiction of incorporation or organization)
50 Northern Avenue, Boston, Massachusetts
(Address of principal executive offices)
|
| |
Massachusetts | 04-3039129 |
(State or other jurisdiction of
incorporation or organization) | (I.R.S. Employer
Identification No.) |
50 Northern Avenue, Boston, Massachusetts | 02210 |
(Address of principal executive offices) | (Zip Code) |
04-3039129
(I.R.S. Employer Identification No.)
02210
(Zip Code)
Registrant’s telephone number, including area code (617) 341-6100
| | | | | | | | | | | | | | |
| Securities registered pursuant to Section 12(b) of the Act: | | | | |
| Title of each class | | Trading Symbol | | Name of each exchange on which registered |
| Common Stock, $0.01 Par Value Per Share | | VRTX | | The Nasdaq Global Select Market |
Indicate by check mark whether the registrant: (1) has filed all reports required to be filed by Section 13 or 15(d) of the Securities Exchange Act of 1934 during the preceding 12 months (or for such shorter period that the registrant was required to file such reports), and (2) has been subject to such filing requirements for the past 90 days. Yes x☒ No o☐
Indicate by check mark whether the registrant has submitted electronically and posted on its corporate Web site, if any, every Interactive Data File required to be submitted and posted pursuant to Rule 405 of Regulation S-T (§232.405 of this chapter) during the preceding 12 months (or for such shorter period that the registrant was required to submit and post such files). Yes x☒ No o☐
Indicate by check mark whether the registrant is a large accelerated filer, an accelerated filer, a non-accelerated filer, a smaller reporting company, or an emerging growth company. See the definitions of “large accelerated filer,” “accelerated filer,” “smaller reporting company,” and “emerging growth company” in Rule 12b-2 of the Exchange Act.
Large accelerated filer ☒ Accelerated filer ☐ Non-accelerated filer ☐ Smaller reporting company ☐ Emerging growth company ☐ |
| | | |
Large accelerated filer x
| Accelerated filer o
| Non-accelerated filer o
| Smaller reporting company o
|
| | | |
Emerging growth company o
| (Do not check if a smaller reporting company) |
If an emerging growth company, indicate by check mark if the registrant has elected not to use the extended transition period for complying with any new or revised financial accounting standards provided pursuant to Section 13(a) of the Exchange Act. o☐
Indicate by check mark whether the registrant is a shell company (as defined in Rule 12b-2 of the Exchange Act). Yes o☐ No x☒
Indicate the number of shares outstanding of each of the issuer’s classes of common stock, as of the latest practicable date.
|
| | | | | | | |
| Common Stock, par value $0.01 per share | 252,902,848 |
Class260,467,334 | Outstanding at October 20, 2017July 23, 2020 |
VERTEX PHARMACEUTICALS INCORPORATED
FORM 10-Q
FOR THE QUARTER ENDED SEPTEMBERJune 30, 20172020
TABLE OF CONTENTS
| | | | | | | | |
| | |
| | Page |
| | |
| | |
| | |
| Condensed Consolidated Statements of Operations - Three and NineSix Months Ended SeptemberJune 30, 20172020 and 20162019 | |
| Condensed Consolidated Statements of Comprehensive Income (Loss) - Three and NineSix Months Ended SeptemberJune 30, 20172020 and 20162019 | |
| Condensed Consolidated Balance Sheets - SeptemberJune 30, 20172020 and December 31, 20162019 | |
| Condensed Consolidated Statements of Shareholders' Equity - Three and Noncontrolling Interest - NineSix Months Ended SeptemberJune 30, 20172020 and 20162019 | |
| Condensed Consolidated Statements of Cash Flows - NineThree and Six Months Ended SeptemberJune 30, 20172020 and 20162019 | |
| | |
| | |
| | |
| | |
| | |
| | |
| Item 1A. | | |
| | |
| | |
| | |
| | |
“We,” “us,” “Vertex” and the “Company” as used in this Quarterly Report on Form 10-Q refer to Vertex Pharmaceuticals Incorporated, a Massachusetts corporation, and its subsidiaries.
“Vertex,” “KALYDECO®,” “ORKAMBI®,” “SYMDEKO®,” “SYMKEVI®” and “ORKAMBI“TRIKAFTA®” are registered trademarks of Vertex. The trademark for “KAFTRIOTM” is pending in the United States and registered in the European Union. Other brands, names and trademarks contained in this Quarterly Report on Form 10-Q are the property of their respective owners.
We use the brand name for our products when we refer to the product that has been approved and with respect to the indications on the approved label. Otherwise, including in discussions of our cystic fibrosis development programs, we refer to our compounds by their scientific (or generic) name or VX developmental designation.
Part I. Financial Information
Item 1. Financial Statements
VERTEX PHARMACEUTICALS INCORPORATED
Condensed Consolidated Statements of Operations
(unaudited)
(in thousands, except per share amounts)
|
| | | | | | | | | | | | | | | |
| | Three Months Ended September 30, | | Nine Months Ended September 30, |
| | 2017 | | 2016 | | 2017 | | 2016 |
| Revenues: | | | | | | | |
| Product revenues, net | $ | 549,642 |
| | $ | 409,689 |
| | $ | 1,544,252 |
| | $ | 1,229,750 |
|
| Royalty revenues | 2,231 |
| | 3,835 |
| | 6,643 |
| | 12,713 |
|
| Collaborative revenues | 26,292 |
| | 259 |
| | 286,123 |
| | 1,008 |
|
| Total revenues | 578,165 |
| | 413,783 |
| | 1,837,018 |
| | 1,243,471 |
|
| Costs and expenses: | | | | | | | |
| Cost of product revenues | 72,186 |
| | 53,222 |
| | 188,963 |
| | 147,165 |
|
| Royalty expenses | 688 |
| | 855 |
| | 2,104 |
| | 2,813 |
|
| Research and development expenses | 454,947 |
| | 272,370 |
| | 1,017,961 |
| | 799,238 |
|
| Sales, general and administrative expenses | 120,710 |
| | 106,055 |
| | 361,285 |
| | 322,921 |
|
| Restructuring expenses, net | 337 |
| | 8 |
| | 13,859 |
| | 1,038 |
|
| Intangible asset impairment charge | 255,340 |
| | — |
| | 255,340 |
| | — |
|
| Total costs and expenses | 904,208 |
| | 432,510 |
| | 1,839,512 |
| | 1,273,175 |
|
| Loss from operations | (326,043 | ) | | (18,727 | ) | | (2,494 | ) | | (29,704 | ) |
| Interest expense, net | (13,574 | ) | | (20,140 | ) | | (45,003 | ) | | (60,993 | ) |
| Other (expenses) income, net | (77,553 | ) | | (167 | ) | | (80,634 | ) | | 3,025 |
|
| Loss before (benefit from) provision for income taxes | (417,170 | ) | | (39,034 | ) | | (128,131 | ) | | (87,672 | ) |
| (Benefit from) provision for income taxes | (125,903 | ) | | 503 |
| | (117,581 | ) | | 24,118 |
|
| Net loss | (291,267 | ) | | (39,537 | ) | | (10,550 | ) | | (111,790 | ) |
| Loss (income) attributable to noncontrolling interest | 188,315 |
| | 696 |
| | 173,350 |
| | (33,207 | ) |
| Net (loss) income attributable to Vertex | $ | (102,952 | ) | | $ | (38,841 | ) | | $ | 162,800 |
| | $ | (144,997 | ) |
| | | | | | | | |
| Amounts per share attributable to Vertex common shareholders: | | | | | | | |
| Net (loss) income: | | | | | | | |
| Basic | $ | (0.41 | ) | | $ | (0.16 | ) | | $ | 0.66 |
| | $ | (0.59 | ) |
| Diluted | $ | (0.41 | ) | | $ | (0.16 | ) | | $ | 0.64 |
| | $ | (0.59 | ) |
| Shares used in per share calculations: | | | | | | | |
| Basic | 250,268 |
| | 244,920 |
| | 247,963 |
| | 244,529 |
|
| Diluted | 250,268 |
| | 244,920 |
| | 252,095 |
| | 244,529 |
|
| | | | | | | | | | | | | | | | | | | | | | | |
| Three Months Ended June 30, | | | | Six Months Ended June 30, | | |
| 2020 | | 2019 | | 2020 | | 2019 |
| Revenues: | | | | | | | |
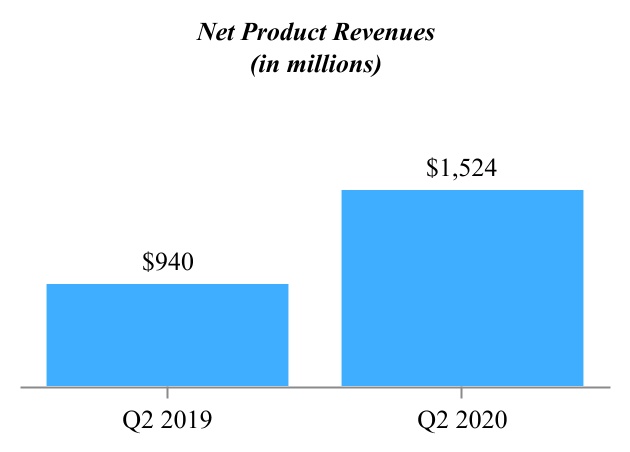
| Product revenues, net | $ | 1,524,485 | | | $ | 940,380 | | | $ | 3,039,592 | | | $ | 1,797,633 | |
| Collaborative and royalty revenues | — | | | 913 | | | — | | | 2,095 | |
| Total revenues | 1,524,485 | | | 941,293 | | | 3,039,592 | | | 1,799,728 | |
| Costs and expenses: | | | | | | | |
| Cost of sales | 184,520 | | | 135,740 | | | 347,017 | | | 230,832 | |
| Research and development expenses | 420,928 | | | 379,091 | | | 869,456 | | | 718,581 | |
| Sales, general and administrative expenses | 191,804 | | | 156,502 | | | 374,062 | | | 303,547 | |
| Change in fair value of contingent consideration | 9,200 | | | — | | | 10,800 | | | — | |
| Total costs and expenses | 806,452 | | | 671,333 | | | 1,601,335 | | | 1,252,960 | |
| Income from operations | 718,033 | | | 269,960 | | | 1,438,257 | | | 546,768 | |
| Interest income | 4,243 | | | 18,076 | | | 16,819 | | | 33,691 | |
| Interest expense | (13,871) | | | (14,837) | | | (28,007) | | | (29,705) | |
| Other income, net | 116,365 | | | 53,939 | | | 55,235 | | | 96,549 | |
| Income before (benefit from) provision for income taxes | 824,770 | | | 327,138 | | | 1,482,304 | | | 647,303 | |
| (Benefit from) provision for income taxes | (12,500) | | | 59,711 | | | 42,281 | | | 111,245 | |
| Net income | $ | 837,270 | | | $ | 267,427 | | | $ | 1,440,023 | | | $ | 536,058 | |
| | | | | | | |
| Net income per common share: | | | | | | | |
| Basic | $ | 3.22 | | | $ | 1.04 | | | $ | 5.54 | | | $ | 2.09 | |
| Diluted | $ | 3.18 | | | $ | 1.03 | | | $ | 5.46 | | | $ | 2.06 | |
| Shares used in per share calculations: | | | | | | | |
| Basic | 259,637 | | | 256,154 | | | 260,013 | | | 255,941 | |
| Diluted | 263,403 | | | 259,822 | | | 263,746 | | | 260,015 | |
The accompanying notes are an integral part of these condensed consolidated financial statements.
VERTEX PHARMACEUTICALS INCORPORATED
Condensed Consolidated Statements of Comprehensive Income (Loss)
(unaudited)
(in thousands)
|
| | | | | | | | | | | | | | | |
| | Three Months Ended September 30, | | Nine Months Ended September 30, |
| | 2017 | | 2016 | | 2017 | | 2016 |
| Net loss | $ | (291,267 | ) | | $ | (39,537 | ) | | $ | (10,550 | ) | | $ | (111,790 | ) |
| Changes in other comprehensive loss: | | | | | | | |
| Unrealized holding gains (losses) on marketable securities, net of tax of zero, respectively | 5,961 |
| | (96 | ) | | (7,786 | ) | | 104 |
|
| Unrealized (losses) gains on foreign currency forward contracts, net of tax of $0.9 million, $0.2 million, $2.9 million and $(0.4) million, respectively | (5,453 | ) | | 2,149 |
| | (27,379 | ) | | 1,936 |
|
| Foreign currency translation adjustment | (3,884 | ) | | (2,508 | ) | | (11,137 | ) | | (7,709 | ) |
| Total changes in other comprehensive loss | (3,376 | ) | | (455 | ) | | (46,302 | ) | | (5,669 | ) |
| Comprehensive loss | (294,643 | ) | | (39,992 | ) | | (56,852 | ) | | (117,459 | ) |
| Comprehensive loss (income) attributable to noncontrolling interest | 188,315 |
| | 696 |
| | 173,350 |
| | (33,207 | ) |
| Comprehensive (loss) income attributable to Vertex | $ | (106,328 | ) | | $ | (39,296 | ) | | $ | 116,498 |
| | $ | (150,666 | ) |
| | | | | | | | | | | | | | | | | | | | | | | |
| Three Months Ended June 30, | | | | Six Months Ended June 30, | | |
| 2020 | | 2019 | | 2020 | | 2019 |
| Net income | $ | 837,270 | | | $ | 267,427 | | | $ | 1,440,023 | | | $ | 536,058 | |
| Other comprehensive loss: | | | | | | | |
| Unrealized holding gains on marketable securities, net | 2,714 | | | 451 | | | 1,950 | | | 1,047 | |
| Unrealized losses on foreign currency forward contracts, net of tax of $4.7 million, $1.8 million, $(0.3) million and $3.3 million, respectively | (19,680) | | | (5,776) | | | (898) | | | (5,998) | |
| Foreign currency translation adjustment | (10,538) | | | (3,876) | | | (13,200) | | | 1,091 | |
| Total other comprehensive loss | (27,504) | | | (9,201) | | | (12,148) | | | (3,860) | |
| Comprehensive income | $ | 809,766 | | | $ | 258,226 | | | $ | 1,427,875 | | | $ | 532,198 | |
The accompanying notes are an integral part of these condensed consolidated financial statements.
VERTEX PHARMACEUTICALS INCORPORATED
Condensed Consolidated Balance Sheets
(unaudited)
(in thousands, except share and per share amounts)
| | | | September 30, | | December 31, | | June 30, | | December 31, |
| | 2017 | | 2016 | | 2020 | | 2019 |
| Assets | | | | Assets | | | |
| Current assets: | | | | Current assets: | |
| Cash and cash equivalents | $ | 1,384,966 |
| | $ | 1,183,945 |
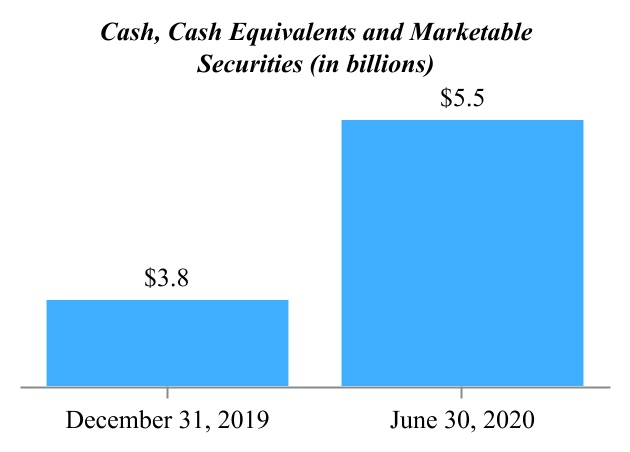
| Cash and cash equivalents | $ | 4,831,332 | | | $ | 3,109,322 | |
| Marketable securities, available for sale | 427,282 |
| | 250,612 |
| |
| Restricted cash and cash equivalents (VIE) | 1,803 |
| | 47,762 |
| |
| Marketable securities | | Marketable securities | 619,437 | | | 698,972 | |
| Accounts receivable, net | 263,493 |
| | 201,083 |
| Accounts receivable, net | 791,768 | | | 633,518 | |
| Inventories | 98,192 |
| | 77,604 |
| Inventories | 219,218 | | | 167,502 | |
| Prepaid expenses and other current assets | 152,238 |
| | 70,534 |
| Prepaid expenses and other current assets | 232,565 | | | 213,515 | |
| Total current assets | 2,327,974 |
| | 1,831,540 |
| Total current assets | 6,694,320 | | | 4,822,829 | |
| Property and equipment, net | 759,978 |
| | 698,362 |
| Property and equipment, net | 728,357 | | | 745,080 | |
| Goodwill | | Goodwill | 1,002,158 | | | 1,002,158 | |
| Intangible assets | 29,000 |
| | 284,340 |
| Intangible assets | 400,000 | | | 400,000 | |
| Goodwill | 50,384 |
| | 50,384 |
| |
| Cost method investments | 20,447 |
| | 20,276 |
| |
| Deferred tax assets | | Deferred tax assets | 1,214,968 | | | 1,190,815 | |
| Other assets | 10,542 |
| | 11,885 |
| Other assets | 176,564 | | | 157,583 | |
| Total assets | $ | 3,198,325 |
| | $ | 2,896,787 |
| Total assets | $ | 10,216,367 | | | $ | 8,318,465 | |
| Liabilities and Shareholders’ Equity | | | | Liabilities and Shareholders’ Equity | | | |
| Current liabilities: | | | | Current liabilities: | |
| Accounts payable | $ | 77,138 |
| | $ | 61,451 |
| Accounts payable | $ | 101,451 | | | $ | 87,610 | |
| Accrued expenses | 378,554 |
| | 315,249 |
| Accrued expenses | 1,545,407 | | | 1,116,912 | |
| Deferred revenues, current portion | 13,003 |
| | 6,005 |
| |
| Accrued restructuring expenses, current portion | 4,205 |
| | 6,047 |
| |
| Capital lease obligations, current portion | 19,881 |
| | 19,426 |
| |
| Customer deposits | 190,272 |
| | 73,416 |
| |
| Credit facility | — |
| | 300,000 |
| |
| Other liabilities, current portion | 27,686 |
| | 10,943 |
| |
| Other current liabilities | | Other current liabilities | 151,782 | | | 130,305 | |
| Total current liabilities | 710,739 |
| | 792,537 |
| Total current liabilities | 1,798,640 | | | 1,334,827 | |
| Deferred revenues, excluding current portion | 2,917 |
| | 6,632 |
| |
| Accrued restructuring expenses, excluding current portion | 146 |
| | 1,907 |
| |
| Capital lease obligations, excluding current portion | 20,259 |
| | 34,976 |
| |
| Deferred tax liability | 10,682 |
| | 134,063 |
| |
| Construction financing lease obligation, excluding current portion | 547,051 |
| | 486,359 |
| |
| Advance from collaborator | 77,258 |
| | 73,423 |
| |
| Other liabilities, excluding current portion | 26,029 |
| | 28,699 |
| |
| Long-term finance lease liabilities | | Long-term finance lease liabilities | 522,067 | | | 538,576 | |
| Long-term contingent consideration | | Long-term contingent consideration | 187,300 | | | 176,500 | |
| Other long-term liabilities | | Other long-term liabilities | 189,118 | | | 183,318 | |
| Total liabilities | 1,395,081 |
| | 1,558,596 |
| Total liabilities | 2,697,125 | | | 2,233,221 | |
| Commitments and contingencies |
|
| |
|
| Commitments and contingencies | — | | | — | |
| Shareholders’ equity: | | | | Shareholders’ equity: | |
| Preferred stock, $0.01 par value; 1,000,000 shares authorized; none issued and outstanding | — |
| | — |
| |
| Common stock, $0.01 par value; 500,000,000 shares authorized; 252,683,346 and 248,300,517 shares issued and outstanding at September 30, 2017 and December 31, 2016, respectively | 2,500 |
| | 2,450 |
| |
| Preferred stock, $0.01 par value; 1,000 shares authorized; NaN issued and outstanding | | Preferred stock, $0.01 par value; 1,000 shares authorized; NaN issued and outstanding | — | | | — | |
| Common stock, $0.01 par value; 500,000 shares authorized, 260,124 and 258,993 shares issued and outstanding, respectively | | Common stock, $0.01 par value; 500,000 shares authorized, 260,124 and 258,993 shares issued and outstanding, respectively | 2,601 | | | 2,589 | |
| Additional paid-in capital | 7,034,113 |
| | 6,506,795 |
| Additional paid-in capital | 7,943,717 | | | 7,937,606 | |
| Accumulated other comprehensive (loss) income | (25,129 | ) | | 21,173 |
| |
| Accumulated other comprehensive loss | | Accumulated other comprehensive loss | (14,121) | | | (1,973) | |
| Accumulated deficit | (5,220,407 | ) | | (5,373,836 | ) | Accumulated deficit | (412,955) | | | (1,852,978) | |
| Total Vertex shareholders’ equity | 1,791,077 |
| | 1,156,582 |
| |
| Noncontrolling interest | 12,167 |
| | 181,609 |
| |
| Total shareholders’ equity | 1,803,244 |
| | 1,338,191 |
| Total shareholders’ equity | 7,519,242 | | | 6,085,244 | |
| Total liabilities and shareholders’ equity | $ | 3,198,325 |
| | $ | 2,896,787 |
| Total liabilities and shareholders’ equity | $ | 10,216,367 | | | $ | 8,318,465 | |
The accompanying notes are an integral part of these condensed consolidated financial statements.
VERTEX PHARMACEUTICALS INCORPORATED
Condensed Consolidated Statements of Shareholders’ Equity and Noncontrolling Interest
(unaudited)
|
| | | | | | | | | | | | | | | | | | | | | | | | | | | | | | |
| | Common Stock | | Additional
Paid-in Capital | | Accumulated
Other
Comprehensive (Loss) Income | | Accumulated Deficit | | Total Vertex
Shareholders’ Equity | | Noncontrolling
Interest | | Total
Shareholders’ Equity |
| | Shares | | Amount | | | | | | |
| Balance at December 31, 2015 | 246,307 |
| | $ | 2,427 |
| | $ | 6,197,500 |
| | $ | 1,824 |
| | $ | (5,261,784 | ) | | $ | 939,967 |
| | $ | 153,661 |
| | $ | 1,093,628 |
|
| Other comprehensive loss, net of tax | — |
| | — |
| | — |
| | (5,669 | ) | | — |
| | (5,669 | ) | | — |
| | (5,669 | ) |
| Net (loss) income | — |
| | — |
| | — |
| | — |
| | (144,997 | ) | | (144,997 | ) | | 33,207 |
| | (111,790 | ) |
| Issuance of common stock under benefit plans | 1,722 |
| | 19 |
| | 50,875 |
| | — |
| | — |
| | 50,894 |
| | — |
| | 50,894 |
|
| Stock-based compensation expense | — |
| | — |
| | 181,351 |
| | — |
| | — |
| | 181,351 |
| | (73 | ) | | 181,278 |
|
| Balance at September 30, 2016 | 248,029 |
| | $ | 2,446 |
| | $ | 6,429,726 |
| | $ | (3,845 | ) | | $ | (5,406,781 | ) | | $ | 1,021,546 |
| | $ | 186,795 |
| | $ | 1,208,341 |
|
| | | | | | | | | | | | | | | | |
| Balance at December 31, 2016 | 248,301 |
| | $ | 2,450 |
| | $ | 6,506,795 |
| | $ | 21,173 |
| | $ | (5,373,836 | ) | | $ | 1,156,582 |
| | $ | 181,609 |
| | $ | 1,338,191 |
|
| Cumulative effect adjustment for adoption of new accounting guidance | — |
| | — |
| | 9,371 |
| | | | (9,371 | ) | | — |
| | — |
| | — |
|
| Other comprehensive loss, net of tax | — |
| | — |
| | — |
| | (46,302 | ) | | — |
| | (46,302 | ) | | — |
| | (46,302 | ) |
| Net income (loss) | — |
| | — |
| | — |
| | — |
| | 162,800 |
| | 162,800 |
| | (173,350 | ) | | (10,550 | ) |
| Issuance of common stock under benefit plans | 4,382 |
| | 50 |
| | 298,956 |
| | — |
| | — |
| | 299,006 |
| | 33 |
| | 299,039 |
|
| Stock-based compensation expense | — |
| | — |
| | 218,991 |
| | — |
| | — |
| | 218,991 |
| | — |
| | 218,991 |
|
| VIE noncontrolling interest upon deconsolidation | — |
| | — |
| | — |
| | — |
| | — |
| | — |
| | 3,910 |
| | 3,910 |
|
| Other | — |
| | — |
| | — |
| | — |
| | — |
| | — |
| | (35 | ) | | (35 | ) |
| Balance at September 30, 2017 | 252,683 |
| | $ | 2,500 |
| | $ | 7,034,113 |
| | $ | (25,129 | ) | | $ | (5,220,407 | ) | | $ | 1,791,077 |
| | $ | 12,167 |
| | $ | 1,803,244 |
|
| | | | | | | | | | | | | | | | | | | | | | | | | | | | | | | | | | | |
| Three Months Ended | | | | | | | | | | |
| Common Stock | | | | Additional Paid-in Capital | | Accumulated Other Comprehensive Income (Loss) | | Accumulated Deficit | | Total Shareholders’ Equity |
| Shares | | Amount | | | | | | | | |
| Balance at March 31, 2019 | 256,351 | | | $ | 2,561 | | | $ | 7,475,909 | | | $ | 6,000 | | | $ | (2,761,157) | | | $ | 4,723,313 | |
| Other comprehensive loss, net of tax | — | | | — | | | — | | | (9,201) | | | — | | | (9,201) | |
| Net income | — | | | — | | | — | | | — | | | 267,427 | | | 267,427 | |
| Repurchase of common stock | (296) | | | (3) | | | (52,007) | | | — | | | — | | | (52,010) | |
| | | | | | | | | | | |
| Issuance of common stock under benefit plans | 616 | | | 7 | | | 50,494 | | | — | | | — | | | 50,501 | |
| Stock-based compensation expense | — | | | — | | | 89,935 | | | — | | | — | | | 89,935 | |
| Balance at June 30, 2019 | 256,671 | | | $ | 2,565 | | | $ | 7,564,331 | | | $ | (3,201) | | | $ | (2,493,730) | | | $ | 5,069,965 | |
| | | | | | | | | | | |
| Balance at March 31, 2020 | 259,079 | | | $ | 2,591 | | | $ | 7,695,905 | | | $ | 13,383 | | | $ | (1,250,225) | | | $ | 6,461,654 | |
| Other comprehensive loss, net of tax | — | | | — | | | — | | | (27,504) | | | — | | | (27,504) | |
| Net income | — | | | — | | | — | | | — | | | 837,270 | | | 837,270 | |
| | | | | | | | | | | |
| Common stock withheld for employee tax obligations | (11) | | | — | | | (3,080) | | | — | | | — | | | (3,080) | |
| Issuance of common stock under benefit plans | 1,056 | | | 10 | | | 132,771 | | | — | | | — | | | 132,781 | |
| Stock-based compensation expense | — | | | — | | | 118,121 | | | — | | | — | | | 118,121 | |
| Balance at June 30, 2020 | 260,124 | | | $ | 2,601 | | | $ | 7,943,717 | | | $ | (14,121) | | | $ | (412,955) | | | $ | 7,519,242 | |
| | | | | | | | | | | |
| Six Months Ended | | | | | | | | | | |
| Common Stock | | | | Additional
Paid-in Capital | | Accumulated Other Comprehensive Income (Loss) | | Accumulated Deficit | | Total
Shareholders’ Equity |
| Shares | | Amount | | | | | | | | |
| Balance at December 31, 2018 | 255,172 | | | $ | 2,546 | | | $ | 7,421,476 | | | $ | 659 | | | $ | (2,989,478) | | | $ | 4,435,203 | |
| Cumulative effect adjustment for adoption of new accounting guidance | — | | | — | | | — | | | — | | | (40,310) | | | (40,310) | |
| Other comprehensive loss, net of tax | — | | | — | | | — | | | (3,860) | | | — | | | (3,860) | |
| Net income | — | | | — | | | — | | | — | | | 536,058 | | | 536,058 | |
| Repurchase of common stock | (833) | | | (9) | | | (150,008) | | | — | | | — | | | (150,017) | |
| Common stock withheld for employee tax obligations | (27) | | | — | | | (5,832) | | | — | | | — | | | (5,832) | |
| Issuance of common stock under benefit plans | 2,359 | | | 28 | | | 114,517 | | | — | | | — | | | 114,545 | |
| Stock-based compensation expense | — | | | — | | | 184,178 | | | — | | | — | | | 184,178 | |
| Balance at June 30, 2019 | 256,671 | | | $ | 2,565 | | | $ | 7,564,331 | | | $ | (3,201) | | | $ | (2,493,730) | | | $ | 5,069,965 | |
| | | | | | | | | | | |
| Balance at December 31, 2019 | 258,993 | | | $ | 2,589 | | | $ | 7,937,606 | | | $ | (1,973) | | | $ | (1,852,978) | | | $ | 6,085,244 | |
| Other comprehensive loss, net of tax | — | | | — | | | — | | | (12,148) | | | — | | | (12,148) | |
| Net income | — | | | — | | | — | | | — | | | 1,440,023 | | | 1,440,023 | |
| Repurchase of common stock | (1,404) | | | (14) | | | (300,012) | | | — | | | — | | | (300,026) | |
| Common stock withheld for employee tax obligations | (586) | | | (6) | | | (139,241) | | | | | | | (139,247) | |
| Issuance of common stock under benefit plans | 3,121 | | | 32 | | | 210,343 | | | — | | | — | | | 210,375 | |
| Stock-based compensation expense | — | | | — | | | 235,021 | | | — | | | — | | | 235,021 | |
| Balance at June 30, 2020 | 260,124 | | | $ | 2,601 | | | $ | 7,943,717 | | | $ | (14,121) | | | $ | (412,955) | | | $ | 7,519,242 | |
The accompanying notes are an integral part of these condensed consolidated financial statements.
VERTEX PHARMACEUTICALS INCORPORATED
Condensed Consolidated Statements of Cash Flows
(unaudited)
(in thousands)
|
| | | | | | | |
| | Nine Months Ended September 30, |
| | 2017 | | 2016 |
| Cash flows from operating activities: | | | |
| Net loss | $ | (10,550 | ) | | $ | (111,790 | ) |
| Adjustments to reconcile net loss to net cash provided by operating activities: | | | |
| Stock-based compensation expense | 215,334 |
| | 178,623 |
|
| Depreciation and amortization expense | 44,965 |
| | 45,947 |
|
| Write-downs of inventories to net realizable value | 11,138 |
| | — |
|
| Deferred income taxes | (113,969 | ) | | 23,544 |
|
| Impairment of property and equipment | 1,946 |
| | — |
|
| Intangible asset impairment charge | 255,340 |
| | — |
|
| Acquired in-process research & development | 160,000 |
| | — |
|
| Deconsolidation of VIE | 76,644 |
| | — |
|
| Other non-cash items, net | (4,787 | ) | | (904 | ) |
| Changes in operating assets and liabilities: | | | |
| Accounts receivable, net | (54,455 | ) | | (9,760 | ) |
| Inventories | (28,570 | ) | | (11,536 | ) |
| Prepaid expenses and other assets | (90,006 | ) | | (8,979 | ) |
| Accounts payable | 6,925 |
| | (21,532 | ) |
| Accrued expenses and other liabilities | 148,102 |
| | 26,121 |
|
| Accrued restructuring expense | (3,863 | ) | | (8,151 | ) |
| Deferred revenues | 3,237 |
| | (10,204 | ) |
| Net cash provided by operating activities | 617,431 |
| | 91,379 |
|
| Cash flows from investing activities: | | | |
| Purchases of marketable securities | (431,653 | ) | | (616,625 | ) |
| Maturities of marketable securities | 247,149 |
| | 535,379 |
|
| Expenditures for property and equipment | (56,817 | ) | | (41,775 | ) |
| Purchase of in-process research & development | (160,000 | ) | | — |
|
| (Decrease) increase in restricted cash and cash equivalents (VIE) | (15,643 | ) | | 20,490 |
|
| Investment in equity securities | — |
| | (23,075 | ) |
| Decrease (increase) in other assets | 380 |
| | (93 | ) |
| Net cash used in investing activities | (416,584 | ) | | (125,699 | ) |
| Cash flows from financing activities: | | | |
| Issuances of common stock under benefit plans | 298,205 |
| | 51,165 |
|
| Payments on revolving credit facility | (300,000 | ) | | — |
|
| Advance from collaborator | 10,000 |
| | — |
|
| Payments on capital lease obligations | (14,188 | ) | | (13,330 | ) |
| Proceeds from capital lease financing | — |
| | 2,030 |
|
| Payments on construction financing lease obligation | (412 | ) | | (356 | ) |
| Proceeds related to construction financing lease obligation | 4,700 |
|
| — |
|
| Repayments of advanced funding | (3,132 | ) | | — |
|
| Net cash (used in) provided by financing activities | (4,827 | ) | | 39,509 |
|
| Effect of changes in exchange rates on cash | 5,001 |
| | (265 | ) |
| Net increase in cash and cash equivalents | 201,021 |
| | 4,924 |
|
| Cash and cash equivalents—beginning of period | 1,183,945 |
| | 714,768 |
|
| Cash and cash equivalents—end of period | $ | 1,384,966 |
| | $ | 719,692 |
|
| | | | |
| Supplemental disclosure of cash flow information: | | | |
| Cash paid for interest | $ | 51,990 |
| | $ | 64,662 |
|
| Cash paid for income taxes | $ | 4,154 |
| | $ | 1,617 |
|
| Capitalization of costs related to construction financing lease obligation | $ | 33,827 |
| | $ | 824 |
|
| Issuances of common stock from employee benefit plans receivable | $ | 868 |
| | $ | 19 |
|
| | | | | | | | | | | |
| Six Months Ended June 30, | | |
| 2020 | | 2019 |
| Cash flows from operating activities: | | | |
| Net income | $ | 1,440,023 | | | $ | 536,058 | |
| Adjustments to reconcile net income to net cash provided by operating activities: | | | |
| Stock-based compensation expense | 232,895 | | | 183,478 | |
| Depreciation expense | 53,518 | | | 54,838 | |
| Increase in fair value of contingent consideration | 10,800 | | | — | |
| Deferred income taxes | 8,963 | | | 87,358 | |
| Gains on equity securities | (65,116) | | | (100,078) | |
| Other non-cash items, net | 16,307 | | | 6,006 | |
| Changes in operating assets and liabilities: | | | |
| Accounts receivable, net | (164,139) | | | (55,870) | |
| Inventories | (64,386) | | | (25,174) | |
| Prepaid expenses and other assets | (28,923) | | | (17,580) | |
| Accounts payable | 14,697 | | | (28,074) | |
| Accrued expenses | 369,851 | | | 113,968 | |
| Other liabilities | 29,735 | | | 33,603 | |
| Net cash provided by operating activities | 1,854,225 | | | 788,533 | |
| Cash flows from investing activities: | | | |
| Purchases of available-for-sale debt securities | (126,577) | | | (263,636) | |
| Maturities of available-for-sale debt securities | 145,395 | | | 228,707 | |
| Sale of equity securities | 127,874 | | | — | |
| Expenditures for property and equipment | (37,314) | | | (34,399) | |
| Investment in equity securities | (5,800) | | | (20,000) | |
| Net cash provided by (used in) investing activities | 103,578 | | | (89,328) | |
| Cash flows from financing activities: | | | |
| Issuances of common stock under benefit plans | 213,058 | | | 114,092 | |
| Repurchases of common stock | (300,026) | | | (150,017) | |
| Payments in connection with common stock withheld for employee tax obligations | (139,247) | | | (5,832) | |
| Payments on finance leases | (20,730) | | | (18,926) | |
| Proceeds related to finance leases | 5,833 | | | 1,002 | |
| Advance from collaborator | 3,500 | | | 7,500 | |
| Repayments of advanced funding | (1,793) | | | (2,823) | |
| Net cash used in financing activities | (239,405) | | | (55,004) | |
| Effect of changes in exchange rates on cash | (3,379) | | | (808) | |
| Net increase in cash and cash equivalents | 1,715,019 | | | 643,393 | |
| Cash, cash equivalents and restricted cash—beginning of period | 3,120,681 | | | 2,658,253 | |
| Cash, cash equivalents and restricted cash—end of period | $ | 4,835,700 | | | $ | 3,301,646 | |
| | | |
| Supplemental disclosure of cash flow information: | | | |
| Cash paid for interest | $ | 27,347 | | | $ | 27,109 | |
| Cash paid for income taxes | $ | 36,813 | | | $ | 10,902 | |
| Issuances of common stock from employee benefit plans receivable | $ | 137 | | | $ | 539 | |
| | | |
The accompanying notes are an integral part of these condensed consolidated financial statements.
VERTEX PHARMACEUTICALS INCORPORATED
Notes to Condensed Consolidated Financial Statements
(unaudited)
A.Basis of Presentation and Accounting Policies
Basis of Presentation
The accompanying condensed consolidated financial statements are unaudited and have been prepared by Vertex Pharmaceuticals Incorporated (“Vertex” or the “Company”) in accordance with accounting principles generally accepted in the United States of America (“GAAP”).
The condensed consolidated financial statements reflect the operations of (i) the Company (ii)and its wholly-owned subsidiaries and (iii) consolidated variable interest entities (VIEs).subsidiaries. All material intercompany balances and transactions have been eliminated. The Company operates in one1 segment, pharmaceuticals. As of September 30, 2017, the Company deconsolidated Parion Sciences, Inc. (“Parion”), a VIE theThe Company has reclassified certain items from the prior year’s condensed consolidated since 2015. The Company's consolidated balance sheet as of September 30, 2017 excludes Parion. Please referfinancial statements to Note C, “Collaborative Arrangements and Acquisitions” for further information regardingconform to the deconsolidation of Parion.current year’s presentation.
Certain information and footnote disclosures normally included in the Company’s annual financial statements2019 Annual Report on Form 10-K have been condensed or omitted. These interim financial statements, in the opinion of management, reflect all normal recurring adjustments necessary for a fair presentation of the financial position and results of operations for the interim periods ended SeptemberJune 30, 20172020 and 2016.2019.
The results of operations for the interim periods are not necessarily indicative of the results of operations to be expected for the full fiscal year. These interim financial statements should be read in conjunction with the audited financial statements for the year ended December 31, 2016,2019, which are contained in the Company’s 2019 Annual Report on Form 10-K for the year ended December 31, 2016 that was filed with the Securities and Exchange Commission (the “SEC”) on February 23, 2017 (the “2016 Annual Report on Form 10-K”).10-K.
Use of Estimates and Summary of Significant Accounting Policies
The preparation of condensed consolidated financial statements in accordance with GAAP requires management to make certain estimates and assumptions that affect the reported amounts of assets and liabilities and disclosure of contingent assets and liabilities at the date of the condensed consolidated financial statements, and the amounts of revenues and expenses during the reported periods. Significant estimates in these condensed consolidated financial statements have been made in connection with (i) determining the calculationtransaction price of revenues inventories, research and development expenses, stock-based compensation expense, restructuring expense, the fair value of(ii) accounting for intangible assets goodwill,and contingent consideration, noncontrolling interest, the consolidation and deconsolidation of VIEs, leases, the fair value of cash flow hedges and the provision for or benefit from income taxes.consideration. The Company bases its estimates on historical experience and various other assumptions, including in certain circumstances future projections that management believes to be reasonable under the circumstances. Actual results could differ from those estimates. Changes in estimates are reflected in reported results in the period in which they become known.
The Company’s significantRecently Adopted Accounting Standards
Leases
On January 1, 2019, the Company adopted Accounting Standards Codification (“ASC”) 842, Leases (“ASC 842”) using the modified-retrospective method, which amended a number of aspects of lease accounting policies are described in Note A, “Natureand required the Company to recognize right-of-use assets and liabilities on the balance sheet. As of Business and Accounting Policies,” inJanuary 1, 2019, the 2016 Annual Report on Form 10-K.Company recorded a cumulative effect adjustment to increase its “Accumulated deficit” by $40.3 million, which related to its leases that were accounted for as build-to-suit leases under the previous accounting guidance.
Recent Accounting PronouncementsInternal-Use Software
In 2014,2018, the Financial Accounting Standards Board (“FASB”) issued new guidance applicable to revenue recognition that will beAccounting Standards Update (“ASU”) 2018-15, Intangibles—Goodwill and Other—Internal-Use Software (Subtopic 350-40): Customer’s Accounting for Implementation Costs Incurred in a Cloud Computing Arrangement That Is a Service Contract (“ASU 2018-15”), which clarifies the accounting for implementation costs in cloud computing arrangements. ASU 2018-15 became effective on January 1, 2018. Early2020. The adoption was permitted for the year-ending December 31, 2017. The new guidance applies a more principles based approach to recognizing revenue. Under the new guidance, revenue is recognized when a customer obtains control of promised goods or services and is recognizedASU 2018-15 resulted in an insignificant amount that reflects the consideration that an entity expects to receive in exchange for those goods or services. In addition, the standard requires disclosure of the nature, amount, timing, and uncertainty of revenue and cash flows arising from contracts with customers. The new guidance must be adopted using either a modified retrospective approach or a full retrospective approach for all periods presented. Under the modified retrospective method, the cumulative effect of applying the standard would be recognized at the date of initial application within retained earnings. Under the full retrospective approach, the standard would be applied to each prior reporting period presented. Upon adoption, the Company will use the modified retrospective method. The Company continues to evaluate the new guidance and the effect the adoption will haveadditional assets recorded on the Company’s condensed consolidated financial
balance sheet.
VERTEX PHARMACEUTICALS INCORPORATED
Notes to Condensed Consolidated Financial Statements
(unaudited)
Fair Value Measurement
statements.In 2018, the FASB issued ASU 2018-13, Fair Value Measurement (Topic 820): Disclosure Framework-Changes to the Disclosure Requirements for Fair Value Measurement (“ASU 2018-13”), which modifies the disclosure requirements for fair value measurements. ASU 2018-13 became effective on January 1, 2020. The Company’s project team is finalizing its reviewadoption of existing customer contracts and current accounting policiesASU 2018-13 resulted in additional disclosures related to identify and assess the potential differences that would result from applying the requirements of the new standard. Based on the Company’s assessment performedLevel 3 inputs. Please refer to date, the new revenue recognition guidance could impact the Company’s accountingNote E, “Fair Value Measurements,” for product shipments to certain countries through early access programs, including the French early access programs, whereby the associated product has received regulatory approval but the price is not fixed or determinable based on the status of ongoing pricing discussions, and could impact the Company’s accounting for certain reimbursement agreements that the Company plans to negotiate in the fourth quarter of 2017. As the Company completes its assessment, it is implementing appropriate changes to its controls to support revenue recognition and additional revenue-related disclosures under the new standard.further information.
Credit Losses
In 2016, the FASB issued amended guidance applicableASU 2016-13, Financial Instruments - Credit Losses (Topic 326): Measurement of Credit Losses on Financial Instruments (“ASU 2016-13”), which requires entities to share-based compensationrecord expected credit losses for certain financial instruments, including trade receivables, as an allowance that reflects the entity's current estimate of credit losses expected to employees thatbe incurred. For available-for-sale debt securities in unrealized loss positions, ASU 2016-13 requires allowances to be recorded instead of reducing the amortized cost of the investment. ASU 2016-13 became effective on January 1, 2020. The adoption of ASU 2016-13 did not have a significant impact on the Company’s condensed consolidated financial statements.
Recently Issued Accounting Standards
Income Taxes
In 2019, the FASB issued ASU 2019-12, Income Taxes (Topic 740) (“ASU 2019-12”), which simplifies the accounting for employee share-based payment transactions, including the accounting for income taxes, forfeitures, and statutory tax withholding requirements, as well as classification in the statement of cash flows. The amended guidance becametaxes. ASU 2019-12 is effective for the Company during the first quarter of 2017. The amended guidance eliminates the requirement that excess tax benefits be realized as a reduction in current taxes payable before the associated tax benefit can be recognized as an increase in additional paid-in capital. This created approximately $410.8 million of deferred tax asset (“DTA”) relating to federal and state net operating losses (“NOLs”) that are fully reserved by an equal increase in valuation allowance. The Company recorded DTAs of approximately $404.7 million relating to Federal NOLs and approximately $6.1 million relating to State NOLs, both of which are offset by a full valuation allowance. Upon adoption, the Company also elected to change its accounting policy to account for forfeitures of options and awards as they occur. The change was applied on a modified retrospective basis with a cumulative effect adjustment to the Company’s accumulated deficit of $9.4 million, which increased the accumulated deficit as of January 1, 2017. This change also resulted in an increase to the DTA of $3.4 million, which is offset by a full valuation allowance. As a result, there was no cumulative-effect adjustment to accumulated deficit. The provisions related to the recognition of excess tax benefits in the income statement and classification in the statement of cash flows were adopted prospectively, and as such, the prior periods were not retrospectively adjusted.
In 2016, the FASB issued amended guidance related to the recording of financial assets and financial liabilities. Under the amended guidance, equity investments (except those accounted for under the equity method of accounting or those that result in consolidation of the investee) are to be measured at fair value with changes in fair value recognized in net income. However, an entity has the option to either measure equity investments without readily determinable fair values at fair value or at cost adjusted for changes in observable prices minus impairment. Changes in measurement under either alternative will be recognized in net income. The amended guidance is effective for the year ending December 31, 2018. Early adoption is permitted. The Company expects the implementation of this standard to have an impact on its consolidated financial statements and related disclosures, as the Company held publicly traded equity investments as of September 30, 2017 as well as equity investments accounted for under the cost method. A cumulative-effect adjustment to the balance sheet will be recorded as of the beginning of the fiscal year of adoption. The implementation of this amended guidance is expected to increase volatility in net income as the volatility currently recorded in other comprehensive income related to changes in the fair market value of available-for-sale equity investments will be reflected in net income after adoption.
In 2016, the FASB issued amended guidance applicable to leases that will be effective for the year ending December 31, 2019. Early adoption is permitted. This guidance requires entities to recognize assets and liabilities for leases with lease terms of more than 12 months on the balance sheet.2021. The Company is inevaluating the processimpact the adoption of evaluating this guidance and determining the expected effectASU 2019-12 may have on its condensed consolidated financial statements.
In 2016, the FASB issued amended guidance related to intra-entity transfers other than inventory. This guidance removes the current exception in GAAP prohibiting entities from recognizing current and deferred income tax expenses or benefits related to transfer of assets, other than inventory, within the consolidated entity. The current exception to defer the recognition of any tax impact on the transfer of inventory within the consolidated entity until it is sold to a third party remains unaffected. The amended guidance is effective for the year ending December 31, 2018. Early adoption is permitted. The Company is in the process of evaluating this guidance and determining the expected effect on its condensed consolidated financial statements.
VERTEX PHARMACEUTICALS INCORPORATED
Notes to Condensed Consolidated Financial Statements
(unaudited)
In 2017, the FASB issued amended guidance related to business combinations. The amended guidance clarifies the definition of a business with the objective of adding guidance to assist entities with evaluating whether transactions should be accounted for as acquisitions (or disposals) of assets or businesses. The new accounting guidance is effective for annual periods beginning after December 15, 2017, including interim periods within those periods. Early adoption is permitted. The Company early adopted this new guidance as of January 1, 2017 and will apply this new guidance to future acquisitions.
In 2017, the FASB issued amended guidance related to measurements of goodwill. The amended guidance eliminates a step from the goodwill impairment test. Under the amended guidance, an entity should perform its annual or interim goodwill impairment test by comparing the fair value of a reporting unit with its carrying amount. An entity would recognize an impairment charge for the amount by which the carrying amount exceeds the reporting unit’s fair value; however, the loss recognized should not exceed the total amount of goodwill allocated to that reporting unit. The amended guidance is effective for the year-ending December 31, 2020. Early adoption is permitted. The Company does not expect a significant effect on its condensed consolidated financial statements upon adoption of this new guidance.
In 2017, the FASB issued amended guidance related to the scope of stock option modification accounting, to reduce diversity in practice and provide clarity regarding existing guidance. The new accounting guidance is effective for annual periods beginning after December 15, 2017, including interim periods within those periods. Early adoption is permitted. The Company does not expect the adoption of this guidance to have a material effect on its condensed consolidated financial statements and related disclosures.
In 2017, the FASB issued amended guidance applicable to hedge accounting. The new accounting guidance is effective for annual periods beginning after December 15, 2018, including interim periods within those periods. Early adoption is permitted. The amended guidance helps simplify certain aspects of hedge accounting and enables entities to more accurately present their risk management activities in their financial statements. The Company is in the process of evaluating this guidance and determining the expected effect on its condensed consolidated financial statements.
For a discussion of other recent accounting pronouncements please refer to Note A, “Nature of Business and Accounting Policies—Recent Accounting Pronouncements,Policies,” in the 2016Company’s 2019 Annual Report on Form 10-K.
Summary of Significant Accounting Policies
The Company sells its products principally to a limited number of specialty pharmacy providers in North America as well as government-owned and supported customers in international markets (collectively, its “Customers”). The Company’s Customers in North America subsequently resell the products to patients and health care providers. The Company recognizes net revenues from product sales upon delivery to the Customer as long as (i) there is persuasive evidence that an arrangement exists between the Company and the Customer, (ii) collectibility is reasonably assured and (iii) the price is fixed or determinable.
In order to conclude that the price is fixed or determinable, the Company must be able to (i) calculate its gross product revenues from sales to Customers and (ii) reasonably estimate its net product revenues upon delivery to its Customers’ locations. The Company calculates gross product revenues based on the price that the Company charges its Customers. The Company estimates its net product revenues by deducting from its gross product revenues (a) trade allowances, such as invoice discounts for prompt payment and Customer fees, (b) estimated government and private payor rebates, chargebacks and discounts, (c) estimated reserves for expected product returns and (d) estimated costs of co-pay assistance programs for patients, as well as other incentives for certain indirect customers.
The Company makes significant estimates and judgments that materially affect the Company’s recognition of net product revenues. In certain instances, the Company may be unable to reasonably conclude that the price is fixed or determinable at the time of delivery, in which case it defers the recognition of revenues. Once the Company is able to determine that the price is fixed or determinable, it recognizes the net product revenues associated with the units in which revenue recognition was deferred.
Revenue recognition related to the Company’s French early access programs could be impacted by the new revenue recognition guidance that is effective January 1, 2018 andaccounting policies are described in Note A, “Basis“Nature of PresentationBusiness and Accounting Policies,” in its 2019 Annual Report on Form 10-K.
B.Revenue Recognition
Disaggregation of Revenue
Revenues by Product
Product revenues, net consisted of the following:
| | | | | | | | | | | | | | | | | | | | | | | |
| Three Months Ended June 30, | | | | Six Months Ended June 30, | | |
| 2020 | | 2019 | | 2020 | | 2019 |
| (in thousands) | | | | | | |
| TRIKAFTA | $ | 917,715 | | | $ | — | | | $ | 1,812,948 | | | $ | — | |
| SYMDEKO/SYMKEVI | 171,729 | | | 361,832 | | | 344,888 | | | 682,107 | |
| ORKAMBI | 231,981 | | | 316,441 | | | 466,119 | | | 609,448 | |
| KALYDECO | 203,060 | | | 262,107 | | | 415,637 | | | 506,078 | |
Total product revenues, net* | $ | 1,524,485 | | | $ | 940,380 | | | $ | 3,039,592 | | | $ | 1,797,633 | |
* The preceding table does not include collaborative and royalty revenues.
VERTEX PHARMACEUTICALS INCORPORATED
Notes to Condensed Consolidated Financial Statements
(unaudited)
Revenues by Geographic Location
Policies”. The Company’s ORKAMBI netNet product revenues are attributed to date do not include any revenues from product sales in France because the price is not fixed or determinable. The Company began distributing ORKAMBI through early access programs in France during the fourth quarter of 2015. As of September 30, 2017, the Company’s condensed consolidated balance sheet includes $190.3 million collected in France related to shipments of ORKAMBI under the early access programs that is classified as Customer deposits. The Company expects that the difference between the amounts collectedcountries based on the invoiced price and the final price for ORKAMBI in France will be returned to the French government.
If the Company concludes as of December 31, 2017 that the pricelocation of the ORKAMBI supplied under the early access programs is fixed or determinable based on, among other factors, the status of negotiations in France, it would record net productcustomer. Collaborative and royalty revenues for all sales since the inception of the early access programs for ORKAMBIare attributed to countries based on the fixed or determinable pricelocation of the Company’s subsidiary associated with the collaborative arrangement related to such revenues. Total revenues from external customers and collaborators by geographic region consisted of the following:
| | | | | | | | | | | | | | | | | | | | | | | |
| Three Months Ended June 30, | | | | Six Months Ended June 30, | | |
| 2020 | | 2019 | | 2020 | | 2019 |
| (in thousands) | | | | | | |
| United States | $ | 1,210,314 | | | $ | 700,618 | | | $ | 2,397,902 | | | $ | 1,341,721 | |
| Outside of the United States | | | | | | | |
| Europe | 257,681 | | | 180,196 | | | 515,072 | | | 347,947 | |
| Other | 56,490 | | | 60,479 | | | 126,618 | | | 110,060 | |
| Total revenues outside of the United States | 314,171 | | | 240,675 | | | 641,690 | | | 458,007 | |
| Total revenues | $ | 1,524,485 | | | $ | 941,293 | | | $ | 3,039,592 | | | $ | 1,799,728 | |
Contract Liabilities
The Company recorded contract liabilities of $70.7 million and $62.3 million as of June 30, 2020 and December 31, 2019, respectively, related to annual contracts with government-owned and supported customers in international markets that limit the fourth quarteramount of 2017.
Ifannual reimbursement the Company concludescan receive. Upon exceeding the annual reimbursement amount, products are provided free of charge, which is a material right. These contracts include upfront payments and fees. The Company defers a portion of the consideration received for shipments made up to the annual reimbursement limit as a portion of “Other current liabilities.” The deferred amount is recognized as revenue when the free products are shipped. The Company’s product revenue contracts include performance obligations that are one year or less.
The Company’s contract liabilities at the priceend of each fiscal year relate to contracts with annual reimbursement limits in international markets in which the annual period associated with the contract is not fixed or determinablethe same as of December 31, 2017,the Company’s fiscal year. In these amounts would be subjectmarkets, the Company recognizes revenues related to performance obligations satisfied in previous years; however, these revenues do not relate to any performance obligations that were satisfied more than 12 months prior to the beginning of the current year.
C.Collaborative Arrangements
The Company has entered into numerous agreements pursuant to which it collaborates with third parties on research, development and commercialization programs, including in-license and out-license agreements.
The Company’s in-license and out-license agreements that had a significant impact on its financial statements for the three and six months ended June 30, 2020 and 2019, or were new guidance applicableduring the three and six months ended June 30, 2020, are described below. Additional in-license and out-license agreements were described in Note B, “Collaborative Arrangements,” of the Company’s 2019 Annual Report on Form 10-K.
In-license Agreements
The Company has entered into a number of license agreements in order to revenue recognition effective January 1, 2018 usingadvance and obtain access to technologies and services related to its research and early-development activities. The Company is generally required to make an upfront payment upon execution of the modified retrospective adoption approach. license agreement; development, regulatory and commercialization milestones payments upon the achievement of certain product research, development and commercialization objectives; and royalty payments on future sales, if any, of commercial products resulting from the collaboration.
Pursuant to the new guidance,terms of its in-license agreements, the Company’s collaborators typically lead the discovery efforts and the Company would record a cumulative effect adjustment toleads all preclinical, development and commercialization activities associated with the Company’s accumulated deficit in the first quarteradvancement of 2018. The amount of the adjustment to accumulated deficit would be determined based upon (i) the status of pricing discussions in France upon adoptionany drug candidates and (ii) the Company’s estimate of the amount of consideration the Company expects to retain related to the French ORKAMBI sales that occurred on or prior to December 31, 2017 that would not be subject to a significant reversal in amounts recognized. For French ORKAMBI sales after December 31, 2017 under the early access programs, the Company would recognize product revenues based on the Company’s estimate of consideration the Company expects to retain for which it is probable that a significant reversal in amounts recognized will not occur. In future periods, if the Company’s estimates regarding the amounts it will receive for ORKAMBI supplied pursuant to these programs change, the effect of the change in estimates would be reflected in net product revenues in the period in which the change in estimate occurred.
The following table summarizes activity in each of the product revenue allowance and reserve categories for the nine months ended September 30, 2017: |
| | | | | | | | | | | | | | | | | | | |
| | Trade
Allowances | | Rebates,
Chargebacks
and Discounts | | Product
Returns | | Other
Incentives | | Total |
| | (in thousands) |
| Balance at December 31, 2016 | $ | 2,568 |
| | $ | 81,927 |
| | $ | 3,492 |
| | $ | 1,214 |
| | $ | 89,201 |
|
| Provision related to current period sales | 18,776 |
| | 118,592 |
| | 3,603 |
| | 12,238 |
| | 153,209 |
|
| Adjustments related to prior period sales | (188 | ) | | (4,327 | ) | | (13 | ) | | (355 | ) | | (4,883 | ) |
| Credits/payments made | (18,409 | ) | | (97,393 | ) | | (1,809 | ) | | (10,021 | ) | | (127,632 | ) |
| Balance at September 30, 2017 | $ | 2,747 |
| | $ | 98,799 |
| | $ | 5,273 |
| | $ | 3,076 |
| | $ | 109,895 |
|
funds all expenses.
VERTEX PHARMACEUTICALS INCORPORATED
Notes to Condensed Consolidated Financial Statements
(unaudited)
| |
C. | Collaborative Arrangements and Acquisitions |
Cystic Fibrosis Foundation Therapeutics Incorporated
The Company typically can terminate its in-license agreements by providing advance notice to its collaborators; the required length of notice is dependent on whether any product developed under the license agreement has received marketing approval. The Company’s license agreements may be terminated by either party for a research, development and commercialization agreement with Cystic Fibrosis Foundation Therapeutics Incorporated (“CFFT”) that was originally entered into in May 2004, and was most recently amended in October 2016 (the “2016 Amendment”). Pursuant to the agreement, as amended, the Company has agreed to pay royalties ranging from low-single digits to mid-single digits on potential sales of certain compounds first synthesized and/or tested between March 1, 2014 and August 31, 2016 and tiered royalties ranging from single digits to sub-teens on any approved drugs first synthesized and/or tested during a research term on or before February 28, 2014, including (i) KALYDECO (ivacaftor) and ORKAMBI (lumacaftor in combination with ivacaftor), which are the Company’s current products and (ii) tezacaftor in combination with ivacaftor. For combination products, such as ORKAMBI, sales will be allocated equally to each of the active pharmaceutical ingredients in the combination product.
In the first quarter of 2016, CFFT earned a commercial milestone payment of $13.9 million from the Company upon achievement of certain sales levels of lumacaftor. There are no additional commercial milestone payments payablematerial breach by the Companyother, subject to CFFT pursuant tonotice and cure provisions. Unless earlier terminated, these license agreements generally remain in effect until the agreement. Pursuant todate on which the 2016 Amendment, the CFFT provided the Company an upfront program award of $75.0 million and agreed to provide development funding to the Company of up to $6.0 million annually. The program award plus any future development funding represent a form of financing pursuant to Accounting Standards Codification (ASC) 730, Research and Development, and thus the amounts are recorded as a liability on the condensed consolidated balance sheet, primarily reflected in Advance from collaborator. The liability is reduced over the estimated royalty term of the agreement. Reductionsand all payment obligations with respect to all products in the liability are reflected as an offset to cost of product revenues and as interest expense.
The Company has royalty obligations to CFFT for ivacaftor, lumacaftor and tezacaftor until the expiration of patents covering those compounds. The Company has patents in the United States and European Union covering the composition-of-matter of ivacaftor that expire in 2027 and 2025, respectively, subject to potential patent extensions. The Company has patents in the United States and European Union covering the composition-of-matter of lumacaftor that expire in 2030 and 2026, respectively, subject to potential extension. The Company has patents in the United States and European Union covering the composition-of-matter of tezacaftor that expire in 2027 and 2028, respectively, subject to potential extension.all countries have expired.
CRISPR Therapeutics AG
In 2015, the Company entered into a strategic collaboration, option and license agreement (the “CRISPR Agreement”) with CRISPR Therapeutics AG and its affiliates (“CRISPR”) to collaborate on the discovery and development of potential new treatments aimed at the underlying genetic causes of human diseases using CRISPR-Cas9 gene editinggene-editing technology. The Company hashad the exclusive right to license upcertain targets. In the fourth quarter of 2019, the Company elected to six CRISPR-Cas9-basedexclusively license 3 targets, including targets for the potential treatment of sickle cell disease. In connection with the CRISPR Agreement, the Company made an upfront payment to CRISPR of $75.0 million and a $30.0 million investment in CRISPR pursuant to a convertible loan agreement that converted into preferred stock in January 2016. The Company expensed $75.0 million to research and development, and the $30.0 million investment was recorded at cost and was classified as a long-term asset on the Company’s condensed consolidated balance sheets. In the second quarter of 2016, the Company made an additional preferred stock investment in CRISPR of approximately $3.1 million. In connection with CRISPR’s initial public offering in October 2016, the Company purchased $10.0 million of common shares at the public offering price and the Company’s preferred stock investments in CRISPR converted into common shares. As of September 30, 2017, the Company recorded the fair value of its investment in CRISPR common shares of $56.9 million in marketable securities and a $13.7 million unrealized gain related to these common shares in accumulated other comprehensive income (loss) on the condensed consolidated balance sheet.
The Company will fund all of the discovery activities conductedcystic fibrosis, pursuant to the CRISPR Agreement. For potential hemoglobinapathy treatments, including treatments for sickle cell disease,each of the Company and CRISPR will share equally all development costs and worldwide revenues. For other3 targets that the Company electselected to license, the Company would lead all development and global commercialization activities. For each of up to six targets that the Company elects to license, other than hemoglobinapathy targets, CRISPR has the potential to receive up to $420.0an additional $410.0 million in development, regulatory and commercial milestones andas well as royalties on net product sales.
In 2017, the Company entered into a co-development and co-commercialization agreement with CRISPR pursuant to the terms of the CRISPR Agreement, under which the Company and CRISPR are co-developing and will co-commercialize CTX001 (the “CTX001 Co-Co Agreement”) for the treatment of hemoglobinopathies, including treatments for sickle cell disease and beta thalassemia. As part of the collaboration, the Company and CRISPR share equally all development costs and potential worldwide revenues related to potential hemoglobinopathy treatments. The Company concluded that the CTX001 Co-Co Agreement is a cost-sharing arrangement, which results in the net impact of the arrangement being recorded in “Research and development expenses” in its condensed consolidated statements of operations. During the three and six months ended June 30, 2020, the net expense related to the CTX001 Co-Co Agreement was $9.8 million and $19.0 million, respectively. During the three and six months ended June 30, 2019, the net expense related to the CTX001 Co-Co Agreement was $7.5 million and $14.6 million, respectively.
In July 2019, the Company entered into a separate strategic collaboration and license agreement (the “CRISPR DMD/DM1 Agreement”) with CRISPR. Pursuant to this agreement, the Company received an exclusive worldwide license to CRISPR’s existing and future intellectual property for Duchenne muscular dystrophy (“DMD”) and myotonic dystrophy type 1 (“DM1”). In the first quarter of 2020, the Company recorded $25.0 million to “Research and development expenses” related to a pre-clinical milestone earned by CRISPR under the CRISPR DMD/DM1 Agreement. CRISPR has the potential to receive up to an additional $800.0 million in research, development, regulatory and commercial milestones for the DMD and DM1 programs as well as royalties on net product sales. CRISPR has the option to co-develop and co-commercialize all DM1 products globally and forego the milestones and royalties associated with the DM1 program. The Company funds all expenses associated with the collaboration except for research costs for specified guide RNA research conducted by CRISPR, which the Company and CRISPR share equally.
Please refer to Note F, “Marketable Securities and Equity Investments,” for further information regarding the Company’s investment in CRISPR’s common stock.
Out-license Agreements
The Company has entered into licensing agreements pursuant to which it has out-licensed rights to certain drug candidates to third-party collaborators. Pursuant to these out-license agreements, the Company’s collaborators become responsible for all costs related to the continued development of such drug candidates and obtain development and commercialization rights to these drug candidates. Depending on the terms of the agreements, the Company’s collaborators may be required to make upfront payments, milestone payments upon the achievement of certain product research and development objectives and may also be required to pay royalties on future sales, if any, of commercial products resulting from the collaboration. The termination provisions associated with these collaborations are generally the same as those described above related to the Company’s in-license agreements. None of the Company’s out-license agreements had a significant impact on the Company’s condensed consolidated statement of operations during the three and six months ended June 30, 2020 and 2019.
VERTEX PHARMACEUTICALS INCORPORATED
Notes to Condensed Consolidated Financial Statements
(unaudited)
Cystic Fibrosis Foundation
The Company may terminate the CRISPR Agreement upon 90 days’ notice to CRISPR prior to any product receiving marketing approval or upon 270 days’ notice afterhas a product has received marketing approval. The CRISPR Agreement also may be terminated by either party for a material breach by the other, subject to noticeresearch, development and cure provisions. Unless earlier terminated, the CRISPR Agreement will continue in effect until the expiration of the Company’s payment obligations under the CRISPR Agreement.
Merck KGaA
On January 10, 2017, the Companycommercialization agreement that was originally entered into a strategic collaboration and licensein 2004 with the Cystic Fibrosis Foundation (“CFF”), as successor in interest to the Cystic Fibrosis Foundation Therapeutics, Inc. This agreement (the “Merck KGaA Agreement”) with Merck KGaA, Darmstadt, Germany (“Merck KGaA”).was most recently amended in 2016. Pursuant to the Merck KGaA Agreement,agreement, as amended, the Company granted Merck KGaA an exclusive worldwide licenseagreed to research, develop and commercialize four oncology research and development programs. Under the Merck KGaA Agreement, the Company granted Merck KGaA exclusive, worldwide rightspay royalties ranging from low-single digits to two clinical-stage programs targeting DNA damage repair: its ataxia telangiectasia and Rad3-related protein inhibitor program, including VX-970 and VX-803, and its DNA-dependent protein kinase inhibitor program, including VX-984. In addition, the Company granted Merck KGaA exclusive, worldwide rights to two pre-clinical programs.
The Merck KGaA Agreement provided for an upfront payment from Merck KGaA to the Company of $230.0 million. During the first quarter of 2017, the Company received $193.6 million of the upfront payment and the remaining $36.4 million was remitted to the German tax authorities. Pursuant to a tax treaty between the United States and Germany, the Company filed a refund application for the tax withholding and expects to receive the refund in the fourth quarter of 2017. The income tax receivable is included in Prepaid expenses and other current assets at September 30, 2017. In addition to the upfront payment, the Company will receive tiered royaltiesmid-single digits on potential sales of licensed products, calculated as a percentage of net sales, that rangecertain compounds first synthesized and/or tested between March 1, 2014 and August 31, 2016, including elexacaftor, and tiered royalties ranging from (i) mid-singlesingle digits to mid-twenties for clinical-stage programssub-teens on covered compounds first synthesized and/or tested during a research term on or before February 28, 2014, including KALYDECO (ivacaftor), ORKAMBI (lumacaftor in combination with ivacaftor) and (ii) mid-single digitsSYMDEKO/SYMKEVI (tezacaftor in combination with ivacaftor). For combination products, such as ORKAMBI, SYMDEKO/SYMKEVI and TRIKAFTA (elexacaftor/tezacaftor/ivacaftor and ivacaftor), sales are allocated equally to high single digits foreach of the pre-clinical research programs. Merck KGaA has assumed full responsibility for development and commercialization costs for all programs.
The Company evaluated the deliverables, primarily consisting of a license to the four programs and the obligation to complete certain fully-reimbursable research and development and transition activities as directed by Merck KGaA, pursuant to the Merck KGaA Agreement, under the multiple element arrangement accounting guidance. The Company concluded that the license has stand-alone value from the research and development and transition activities based on the resources and know-how possessed by Merck KGaA, and thus concluded that there are two units of accountingactive pharmaceutical ingredients in the arrangement. The Company determined the relative selling price of the units of accounting based on the Company’s best estimate of selling price. The Company utilized key assumptions to determine the best estimate of selling price for the license, which included future potential net sales of licensed products, development timelines, reimbursement rates for personnel costs, discount rates, and estimated third-party development costs. The Company utilized a discounted cash flow model to determine its best estimate of selling price for the license and determined the best estimate of selling price for the research and development and transition activities based on what it would sell the services for separately. Based on this analysis, the Company recognized approximately $231.7 million in collaborative revenues related to the upfront payment upon delivery of the license and to the research and development and transition activities provided during the first quarter of 2017. During the three and nine months ended September 30, 2017, the Company recorded the reimbursement for the research and development and transition activities of $5.2 million and $12.8 million, respectively, as revenue in the Company’s consolidated statements of operations primarily due to the fact that the Company is the primary obligor in the arrangement. The Company is providing research and development and transition activities and will recognize the revenues and associated expenses as the services are provided.combination product.
Merck KGaA may terminate the Merck KGaA Agreement or any individual program by providing 90 days’ notice, or, in the case of termination of a program with a product that has received marketing approval, 180 days’ notice. The Merck KGaA Agreement also may be terminated by either party for a material breach by the other party, subject to notice and cure provisions. Unless earlier terminated, the Merck KGaA Agreement will continue in effect until the date on which the royalty term and all payment obligations with respect to all products in all countries have expired.
D.Earnings Per Share
VERTEX PHARMACEUTICALS INCORPORATED
Notes to Condensed Consolidated Financial Statements
(unaudited)
Variable Interest Entities
The Company has entered into several agreements pursuant to which it has licensed rights to certain drug candidates from third-party collaborators, resulting in the consolidation of the third parties’ financial statements into the Company’s condensed consolidated financial statements as VIEs. In order to account for the fair value of the contingent payments, which consist of milestone, royalty and option payments, related to these collaborations under GAAP, the Company uses present-value models based on assumptions regarding the probability of achieving the relevant milestones, estimates regarding the timing of achieving the milestones, estimates of future product sales and the appropriate discount rates. The Company bases its estimate of the probability of achieving the relevant milestones on industry data for similar assets and its own experience. The discount rates used in the valuation model represent a measure of credit risk and market risk associated with settling the liabilities. Significant judgment is used in determining the appropriateness of these assumptions at each reporting period. Changes in these assumptions could have a material effect on the fair value of the contingent payments. The following collaborations are reflected in the Company’s financial statements as consolidated VIEs for portions or all of the periods presented:
Parion Sciences, Inc.
In June 2015, the Company entered into a strategic collaboration and license agreement (the “Parion Agreement”) with Parion. Pursuant to the agreement, the Company is collaborating with Parion to develop investigational epithelial sodium channel (“ENaC”) inhibitors, including VX-371 (formerly P-1037) and VX-551 (formerly P-1055), for the potential treatment of CF and all other pulmonary diseases. The Company is leading development activities for VX-371 and VX-551 and is responsible for all costs, subject to certain exceptions, related to development and commercialization of the compounds.
Pursuant to the Parion Agreement, the Company has worldwide development and commercial rights to Parion’s lead investigational ENaC inhibitors, VX-371 and VX-551, for the potential treatment of CF and all other pulmonary diseases and has the option to select additional compounds discovered in Parion’s research program. Parion received an $80.0 million up-front payment and has the potential to receive up to an additional (i) $490.0 million in development and regulatory milestone payments for development of ENaC inhibitors in CF, including $360.0 million related to global filing and approval milestones, (ii) $370.0 million in development and regulatory milestones for VX-371 and VX-551 in non-CF pulmonary indications and (iii) $230.0 million in development and regulatory milestones should the Company elect to develop an additional ENaC inhibitor from Parion’s research program. The Company has agreed to pay Parion tiered royalties that range from the low double digits to mid-teens as a percentage of potential sales of licensed products.
The Company may terminate the Parion Agreement upon 90 days’ notice to Parion prior to any licensed product receiving marketing approval or upon 180 days’ notice after a licensed product has received marketing approval. If the Company experiences a change of control prior to the initiation of the first Phase 3 clinical trial for a licensed product, Parion may terminate the Parion Agreement upon 30 days’ notice, subject to the Company’s right to receive specified royalties on any subsequent commercialization of licensed products. The Parion Agreement also may be terminated by either party for a material breach by the other, subject to notice and cure provisions. Unless earlier terminated, the Parion Agreement will continue in effect until the expiration of the Company’s royalty obligations, which expire on a country-by-country basis on the later of (i) the date the last-to-expire patent covering a licensed product expires or (ii) ten years after the first commercial sale in the country.
The Company determined that it had a variable interest in Parion via the Parion Agreement, and that the variable interest represented a variable interest in Parion as a whole because the fair value of the ENaC inhibitors represented more than half of the total fair value of Parion’s assets. The Company also concluded that it was the primary beneficiary as it had the power to direct the activities that most significantly affect the economic performance of Parion and it had the obligation to absorb losses and right to receive benefits that potentially could be significant to Parion. Accordingly, the Company consolidated Parion's financial statements from June 4, 2015 through September 30, 2017. The Company deconsolidated Parion effective September 30, 2017. Notwithstanding the applicable accounting treatment, the Company's interests in Parion have been and continue to be limited to those accorded to the Company in the Parion Agreement.
VERTEX PHARMACEUTICALS INCORPORATED
Notes to Condensed Consolidated Financial Statements
(unaudited)
As of June 4, 2015, the Company consolidated Parion’s financial statements, which included $255.3 million of intangible assets on the Company’s condensed consolidated balance sheet for Parion’s in-process research and development assets. These in-process research and development assets relate to Parion’s pulmonary ENaC platform, including the intellectual property related to VX-371 and VX-551, that are licensed by Parion to the Company. The Company also recorded the fair value of the net assets attributable to noncontrolling interest of $164.3 million, deferred tax liability of $91.0 million resulting primarily from a basis difference in the intangible assets and certain other net liabilities held by Parion of $10.5 million. The difference between the fair values of the consideration and noncontrolling interest and the fair value of Parion’s net assets was recorded as goodwill. When determining the valuation of goodwill, the fair value of consideration for the license was zero since there was no consideration transferred outside the condensed consolidated financial statements. While there was a transfer of $80.0 million for the upfront payment to Parion, the cash remained within the Company’s condensed consolidated balance sheet since Parion was part of the consolidated entity. The cash received, net of any cash spent by Parion, was classified as restricted cash and cash equivalents (VIE) within the condensed consolidated balance sheet as it was attributed to the noncontrolling interest holders of Parion.
In the second quarter of 2017, Parion signed a license agreement with an affiliate of Shire plc related to the development of a drug candidate for the potential treatment of dry eye disease. The Company evaluated the license agreement entered into by Parion as a reconsideration event to determine whether it should continue to consolidate Parion as a variable interest entity into its condensed consolidated financial statements. The Company determined that there was no substantive change in the design of Parion subsequent to Parion’s agreement with Shire. Additionally, the Company concluded that it was appropriate to continue to consolidate the financial results of Parion because it continued to have (i) the power to direct the activities that most significantly affect the economic performance of Parion and (ii) the obligation to absorb losses and right to receive benefits that potentially could be significant to Parion. Based on the consolidation of Parion’s financial statements, during the three and nine months ended September 30, 2017, the Company has recognized (i) $20.0 million and $40.0 million, respectively, of collaborative revenues and (ii) a tax provision of $7.4 million and $14.8 million, respectively, both of which were attributable to noncontrolling interest related to payments that Parion received from Shire in the three and nine months ended September 30, 2017. The Company has no interest in Parion’s license agreement with Shire, including the economic benefits and/or obligations derived therefrom.
As of September 30, 2017, the Company determined that the fair value of Parion’s pulmonary ENaC platform had declined significantly based on data received in September 2017 from a Phase 2 clinical trial of VX-371 that did not meet its primary efficacy endpoint. The Company recorded an impairment charge of $255.3 million, which represented the entire value of the intangible asset in the third quarter of 2017. After evaluating the results of the clinical trial, the Company determined that it was no longer the primary beneficiary of Parion as it no longer had the power to direct the significant activities of Parion. The most important factor in this determination was the decrease in the fair value of Parion’s pulmonary ENaC platform relative to Parion’s other activities. Accordingly, the Company deconsolidated Parion as of September 30, 2017. The impairment charge of $255.3 million, decrease in the fair value of the contingent payments payable by the Company to Parion of $69.6 million and benefit from income taxes of $126.2 million resulting from these charges were recorded in the third quarter of 2017 attributable to noncontrolling interest. The benefit from income taxes consisted of benefits of $97.7 million and $28.5 million attributable to the impairment charge and decrease in the fair value of contingent payments, respectively. The net effect of these charges and impact of the deconsolidation was a loss of $7.1 million recorded in other income (expense), net attributable to Vertex in the consolidated statement of operations for the three and nine months ended September 30, 2017. The loss of $7.1 million was approximately the difference between (i) the aggregate of $85.0 million in upfront and milestone payments that the Company has made to Parion to date pursuant to the Parion Agreement and (ii) losses the Company recorded in 2015, 2016, and the first half of 2017 based on increases in the fair value of contingent payments payable by the Company to Parion.
Please refer to Note J, "Intangible Assets and Goodwill," for further information regarding the impairment of Parion’s pulmonary ENaC platform.
In connection with the deconsolidation of Parion, the Company evaluated whether the results of Parion should be presented as discontinued operations for the three and nine month period ending September 30, 2017. The Company concluded that the deconsolidation of Parion based on data from the Phase 2 clinical trial of VX-371 is not a development that significantly impacts the Company’s overall operations and financial results or plans to treat patients with CF. Research
VERTEX PHARMACEUTICALS INCORPORATED
Notes to Condensed Consolidated Financial Statements
(unaudited)
and development expenses incurred related to this program accounted for a minor portion of the Company’s overall annual research and development expenses and the Company remains focused on developing medicines to treat CF. Therefore, the Company has not presented the results related to Parion as discontinued operations in its condensed consolidated statements of operations for the three and nine month ending September 30, 2017.
BioAxone Biosciences, Inc.
In October 2014, the Company entered into a license and collaboration agreement (the “BioAxone Agreement”) with BioAxone Biosciences, Inc. (“BioAxone”), which resulted in the consolidation of BioAxone as a VIE beginning on October 1, 2014. The Company paid BioAxone initial payments of $10.0 million in the fourth quarter of 2014.
BioAxone has the potential to receive up to $90.0 million in milestones and fees, including development, regulatory and milestone payments and a license continuation fee. In addition, BioAxone would receive royalties and commercial milestones on future net product sales of VX-210, if any. The Company recorded an in-process research and development intangible asset of $29.0 million for VX-210 and a corresponding deferred tax liability of $11.3 million attributable to BioAxone. The Company holds an option to purchase BioAxone at a predetermined price. The option expires on the earliest of (a) the day the FDA accepts the Biologics License Application submission for VX-210, (b) the day the Company elects to continue the license instead of exercising the option to purchase BioAxone and (c) March 15, 2018, subject to the Company’s option to extend this date by one year.
Aggregate VIE Financial Information
An aggregate summary of net income attributable to noncontrolling interest related to the Company’s VIEs for the three and nine months ended September 30, 2017 and 2016 is as follows:
|
| | | | | | | | | | | | | | | |
| | Three Months Ended September 30, | | Nine Months Ended September 30, |
| | 2017 | | 2016 | | 2017 | | 2016 |
| | (in thousands) |
| Loss attributable to noncontrolling interest before (benefit from) provision for income taxes and changes in fair value of contingent payments | $ | 238,946 |
| | $ | 2,406 |
| | $ | 222,448 |
| | $ | 6,080 |
|
| (Benefit from) provision for income taxes | (120,181 | ) | | (510 | ) | | (111,658 | ) | | 20,063 |
|
| Decrease (increase) in fair value of contingent payments | 69,550 |
| | (1,200 | ) | | 62,560 |
| | (59,350 | ) |
| Net loss (income) attributable to noncontrolling interest | $ | 188,315 |
| | $ | 696 |
| | $ | 173,350 |
| | $ | (33,207 | ) |
The decreases in the noncontrolling interest holders’ claim to net assets with respect to the fair value of the contingent payments in the three and nine months ended September 30, 2017 were primarily due to the decrease in the fair value of Parion’s pulmonary ENaC platform described above. The increases in the fair value of the contingent payments in the three and nine months ended September 30, 2016 were primarily due to a separate Phase 2 clinical trial of VX-371 achieving its primary safety endpoint in the second quarter of 2016. During the three and nine months ended September 30, 2017 and 2016, the (increases) decreases in the fair value of the contingent payments related to the Company’s VIEs were as follows:
|
| | | | | | | | | | | | | | | |
| | Three Months Ended September 30, | | Nine Months Ended September 30, |
| | 2017 | | 2016 | | 2017 | | 2016 |
| | (in thousands) |
| Parion | $ | 69,550 |
| | $ | (1,100 | ) | | $ | 63,460 |
| | $ | (58,500 | ) |
| BioAxone | — |
| | (100 | ) | | (900 | ) | | (850 | ) |
The fair value of the contingent payments related to the Parion Agreement and the BioAxone Agreement as of the dates set forth in the table:
VERTEX PHARMACEUTICALS INCORPORATED
Notes to Condensed Consolidated Financial Statements
(unaudited)
|
| | | | | | | |
| | September 30, 2017 | | December 31, 2016 |
| | (in thousands) |
| Parion | $ | — |
| | $ | 238,800 |
|
| BioAxone | 18,900 |
| | 18,000 |
|
The table below summarizes items related to the Company’s VIEs included in the Company’s condensed consolidated balance sheets as of the dates set forth in the table. Amounts as of September 30, 2017 related to BioAxone while amounts as of December 31, 2016 related to Parion and BioAxone.
|
| | | | | | | |
| | September 30, 2017 | | December 31, 2016 |
| | (in thousands) |
| Restricted cash and cash equivalents (VIE) | $ | 1,803 |
| | $ | 47,762 |
|
| Prepaid expenses and other current assets | 42 |
| | 6,812 |
|
| Intangible assets | 29,000 |
| | 284,340 |
|
| Other assets | 280 |
| | 399 |
|
| Accounts payable | 455 |
| | 415 |
|
| Accrued expenses | 1,021 |
| | 1,330 |
|
| Other liabilities, current portion | 119 |
| | 2,137 |
|
| Deferred tax liability | 8,338 |
| | 131,446 |
|
| Other liabilities, excluding current portion | — |
| | 300 |
|
| Noncontrolling interest | 12,167 |
| | 181,609 |
|
The Company has recorded the VIEs’ cash and cash equivalents as restricted cash and cash equivalents (VIE) because (i) the Company does not have any interest in or control over the VIEs’ cash and cash equivalents and (ii) the Company’s agreements with each VIE do not provide for the VIEs’ cash and cash equivalents to be used for the development of the assets that the Company licensed from the applicable VIE. Assets recorded as a result of consolidating the Company’s VIEs’ financial condition into the Company’s balance sheets do not represent additional assets that could be used to satisfy claims against the Company’s general assets.
Other Collaborations
The Company has entered into various agreements pursuant to which it collaborates with third parties, including inlicensing and outlicensing arrangements. Although the Company does not consider any of these arrangements to be material, the most notable of these arrangements are described below.
Moderna Therapeutics, Inc.
In July 2016, the Company entered into a strategic collaboration and licensing agreement (the “Moderna Agreement”) with Moderna Therapeutics, Inc. (“Moderna”) pursuant to which the parties are seeking to identify and develop messenger Ribonucleic Acid (“mRNA”) Therapeutics for the treatment of CF. In connection with the Moderna Agreement, in the third quarter of 2016, the Company made an upfront payment to Moderna of $20.0 million and a $20.0 million cost-method investment in Moderna pursuant to a convertible promissory note that converted into preferred stock in August 2016. Moderna has the potential to receive future development and regulatory milestones of up to $275.0 million, including $220.0 million in approval and reimbursement milestones, as well as tiered royalty payments on future sales.
Under the terms of the Moderna Agreement, Moderna will lead discovery efforts and the Company will lead all preclinical, development and commercialization activities associated with the advancement of mRNA Therapeutics that result from this collaboration and will fund all expenses related to the collaboration.
The Company may terminate the Moderna Agreement by providing advance notice to Moderna, with the required length of notice dependent on whether any product developed under the Moderna Agreement has received marketing approval. The Moderna Agreement also may be terminated by either party for a material breach by the other, subject to notice and cure
VERTEX PHARMACEUTICALS INCORPORATED
Notes to Condensed Consolidated Financial Statements
(unaudited)
provisions. Unless earlier terminated, the Moderna Agreement will continue in effect until the expiration of the Company’s payment obligations under the Moderna Agreement.
The Company evaluates the carrying value of its $20.0 million cost-method investment in Moderna, which is not a publicly traded company, for impairment on a quarterly basis and has not recorded any adjustments to the carrying value of its investment to date.
Janssen Pharmaceuticals, Inc.
In June 2014, the Company entered into an agreement (the “Janssen Agreement”) with Janssen Pharmaceuticals, Inc. (“Janssen Inc.”), which was amended in October 2014 to clarify certain roles and responsibilities of the parties.
Pursuant to the Janssen Agreement, Janssen Inc. has an exclusive worldwide license to develop and commercialize certain drug candidates for the treatment of influenza, including JNJ-3872 (formerly VX-787). The Company received non-refundable payments of $35.0 million from Janssen Inc. in 2014, which were recorded as collaborative revenue. The Company has the potential to receive development, regulatory and commercial milestone payments as well as royalties on future product sales, if any. Janssen Inc. may terminate the Janssen Agreement, subject to certain exceptions, upon six months’ notice.
Janssen Inc. is responsible for costs related to the development and commercialization of the compounds. During the three and nine months ended September 30, 2017 the Company recorded reimbursement for these development activities of zero and $1.8 million, respectively. During the three and nine months ended September 30, 2016 the Company recorded reimbursement for these development activities of $2.8 million and $10.6 million, respectively. The reimbursements are recorded as a reduction to development expense in the Company’s condensed consolidated statements of operations primarily due to the fact that Janssen Inc. directs the activities and selects the suppliers associated with these activities.
Asset Acquisition
Concert Pharmaceuticals
In July 2017, the Company completed the acquisition of certain CF assets including VX-561 (formerly CTP-656) from Concert Pharmaceuticals Inc. (“Concert”) pursuant to an asset purchase agreement that was entered into in March 2017 (the “Concert Agreement”). VX-561 is an investigational CFTR potentiator that has the potential to be used as part of future once-daily combination regimens of CFTR modulators that treat the underlying cause of CF. As part of the Concert Agreement, Vertex paid Concert $160.0 million in cash for all worldwide development and commercialization rights to VX-561. If VX-561 is approved as part of a combination regimen to treat CF, Concert could receive up to an additional $90.0 million in milestones based on regulatory approval in the U.S. and reimbursement in the UK, Germany or France. The Company determined that substantially all of the fair value of the Concert Agreement was attributable to a single in-process research and development asset, VX-561, which did not constitute a business. The Company cannot conclude that there is any alternative future use for the acquired in-process research and development asset. Thus, the Company recorded the $160.0 million upfront payment as a research and development expense in the three and nine months ended September 30, 2017. The total purchase price for the transaction was $165.1 million including $5.1 million of transaction costs that were recorded as sales, general and administrative expenses. If the Company achieves one or more of the $90.0 million of regulatory approval and reimbursement milestones, the Company will record the value of the milestone as an intangible asset and will begin amortizing the asset in cost of product revenues in the period that the relevant milestone is achieved.
Basic net income (loss) per share attributable to Vertex common shareholdersshare is based upon the weighted-average number of common shares outstanding during the period, excluding restricted stock and restricted stock units that have been issued but are not yet vested.outstanding. Diluted net income (loss) per common share attributable to Vertex common shareholdersutilizing the treasury method is based upon the weighted-average number of common shares outstanding during the period plus additional weighted-average common equivalent shares outstanding during the period when the effect is dilutive.
VERTEX PHARMACEUTICALS INCORPORATED
Notes to Condensed Consolidated Financial Statements
(unaudited)
The following table sets forth the computation of basic and diluted net income (loss) per common share for the periods ended:
|
| | | | | | | | | | | | | | | |
| | Three Months Ended September 30, | | Nine Months Ended September 30, |
| | 2017 | | 2016 | | 2017 | | 2016 |
| | (in thousands, except per share amounts) |
| Basic net income (loss) attributable to Vertex per common share calculation: | | | | | | | |
| Net income (loss) attributable to Vertex common shareholders | $ | (102,952 | ) | | $ | (38,841 | ) | | $ | 162,800 |
| | $ | (144,997 | ) |
| Less: Undistributed earnings allocated to participating securities | — |
| | — |
| | (203 | ) | | — |
|
| Net income (loss) attributable to Vertex common shareholders—basic | $ | (102,952 | ) | | $ | (38,841 | ) | | $ | 162,597 |
| | $ | (144,997 | ) |
| | | | | | | | |
| Basic weighted-average common shares outstanding | 250,268 |
| | 244,920 |
| | 247,963 |
| | 244,529 |
|
| Basic net income (loss) attributable to Vertex per common share | $ | (0.41 | ) | | $ | (0.16 | ) | | $ | 0.66 |
| | $ | (0.59 | ) |
| | | | | | | | |
| Diluted net income (loss) attributable to Vertex per common share calculation: | | | | | | | |
| Net income (loss) attributable to Vertex common shareholders | $ | (102,952 | ) | | $ | (38,841 | ) | | $ | 162,800 |
| | $ | (144,997 | ) |
| Less: Undistributed earnings allocated to participating securities | — |
| | — |
| | (200 | ) | | — |
|
| Net income (loss) attributable to Vertex common shareholders—diluted | $ | (102,952 | ) | | $ | (38,841 | ) | | $ | 162,600 |
| | $ | (144,997 | ) |
| | | | | | | | |
| Weighted-average shares used to compute basic net income (loss) per common share | 250,268 |
| | 244,920 |
| | 247,963 |
| | 244,529 |
|
| Effect of potentially dilutive securities: | | | | | | | |
| Stock options | — |
| | — |
| | 2,700 |
| | — |
|
| Restricted stock and restricted stock units | — |
| | — |
| | 1,204 |
| | — |
|
| Other | — |
| | — |
| | 228 |
| | — |
|
| Weighted-average shares used to compute diluted net income (loss) per common share | 250,268 |
| | 244,920 |
| | 252,095 |
| | 244,529 |
|
| Diluted net income (loss) attributable to Vertex per common share | $ | (0.41 | ) | | $ | (0.16 | ) | | $ | 0.64 |
| | $ | (0.59 | ) |
| | | | | | | | | | | | | | | | | | | | | | | |
| Three Months Ended June 30, | | | | Six Months Ended June 30, | | |
| 2020 | | 2019 | | 2020 | | 2019 |
| (in thousands, except per share amounts) | | | | | | |
| Net income | $ | 837,270 | | | $ | 267,427 | | | $ | 1,440,023 | | | $ | 536,058 | |
| | | | | | | |
| Basic weighted-average common shares outstanding | 259,637 | | | 256,154 | | | 260,013 | | | 255,941 | |
| Effect of potentially dilutive securities: | | | | | | | |
| Stock options | 2,054 | | | 2,225 | | | 1,961 | | | 2,405 | |
| Restricted stock and restricted stock units (including PSUs) | 1,704 | | | 1,440 | | | 1,752 | | | 1,655 | |
| Employee stock purchase program | 8 | | | 3 | | | 20 | | | 14 | |
| Diluted weighted-average common shares outstanding | 263,403 | | | 259,822 | | | 263,746 | | | 260,015 | |
| | | | | | | |
| Basic net income per common share | $ | 3.22 | | | $ | 1.04 | | | $ | 5.54 | | | $ | 2.09 | |
| Diluted net income per common share | $ | 3.18 | | | $ | 1.03 | | | $ | 5.46 | | | $ | 2.06 | |
The Company did not include the securities in the following table in the computation of the dilutive net income (loss) per share attributable to Vertex common shareholders calculationsshare because the effect would have been anti-dilutive during each period:
| | | | | | | | | | | | | | | | | | | | | | | |
| Three Months Ended June 30, | | | | Six Months Ended June 30, | | |
| 2020 | | 2019 | | 2020 | | 2019 |
| (in thousands) | | | | | | |
| Stock options | 7 | | | 3,207 | | | 443 | | | 3,022 | |
| Unvested restricted stock and restricted stock units (including PSUs) | 5 | | | 3 | | | 218 | | | 4 | |
E.Fair Value Measurements
|
| | | | | | | | | | | |
| | Three Months Ended September 30, | | Nine Months Ended September 30, |
| | 2017 | | 2016 | | 2017 | | 2016 |
| | (in thousands) |
| Stock options | 10,278 |
| | 12,947 |
| | 3,904 |
| | 12,947 |
|
| Unvested restricted stock and restricted stock units | 4,241 |
| | 3,624 |
| | 281 |
| | 3,624 |
|
| |
E. | Fair Value Measurements |
The fair value of the Company’s financial assets and liabilities reflects the Company’s estimate of amounts that it would have received in connection with the sale of the assets or paid in connection with the transfer of the liabilities in an orderly transaction between market participants at the measurement date. In connection with measuring the fair value of its assets and liabilities, the Company seeks to maximize the use of observable inputs (market data obtained from sources independent from the Company) and to minimize the use of unobservable inputs (the Company’s assumptions about how market
VERTEX PHARMACEUTICALS INCORPORATED
Notes to Condensed Consolidated Financial Statements
(unaudited)
participants would price assets and liabilities). The following fair value hierarchy is used to classify assets and liabilities based on the observable inputs and unobservable inputs used in order to determine the fair value of the Company’s financial assets and liabilities:
VERTEX PHARMACEUTICALS INCORPORATED
Notes to Condensed Consolidated Financial Statements
(unaudited)
|
| | | | |
| Level 1: | Quoted prices in active markets for identical assets or liabilities. An active market for an asset or liability is a market in which transactions for the asset or liability occur with sufficient frequency and volume to provide pricing information on an ongoing basis. |
| Level 2: | Observable inputs other than Level 1 inputs. Examples of Level 2 inputs include quoted prices in active markets for similar assets or liabilities and quoted prices for identical assets or liabilities in markets that are not active. |
| Level 3: | Unobservable inputs based on the Company’s assessment of the assumptions that market participants would use in pricing the asset or liability. |
The Company’s investment strategy is focused on capital preservation. The Company invests in instruments that meet the credit quality standards outlined in the Company’s investment policy. This policy also limits the amount of credit exposure to any one issue or type of instrument. As of September 30, 2017,The Company maintains strategic investments separately from the Company’s investments were primarilyinvestment policy that governs its other cash, cash equivalents and marketable securities as described in money market funds, government-sponsored enterprise securities, corporate equity securities, corporate debt securities“Note F, “Marketable Securities and commercial paper.Equity Investments.” Additionally, the Company utilizes foreign currency forward contracts intended to mitigate the effect of changes in foreign exchange rates on its condensed consolidated statement of operations.
As of SeptemberDuring the three and six months ended June 30, 2017, all of2020 and 2019, the Company did not record any other-than-temporary impairment charges related to its financial assets.
The following tables set forth the Company’s financial assets and liabilities that were subject to fair value measurements were valued using observable inputs. The Company’s financial assets valued based on Level 1 inputs consistedby level within the fair value hierarchy (and does not include $2.3 billion and $2.3 billion of money market funds, government-sponsored enterprise securitiescash as of June 30, 2020 and corporate equity securities. The Company’s financial assetsDecember 31, 2019, respectively):
| | | | | | | | | | | | | | | | | | | | | | | | | | | | | | | | | | | | | | | | | | | | | | | |
| As of June 30, 2020 | | | | | | | | As of December 31, 2019 | | | | | | |
| Total | | Level 1 | | Level 2 | | Level 3 | | Total | | Level 1 | | Level 2 | | Level 3 |
| (in thousands) | | | | | | | | | | | | | | |
| Financial instruments carried at fair value (asset positions): | | | | | | | | | | | | | | | |
| Cash equivalents: | | | | | | | | | | | | | | | |
| Money market funds | $ | 2,476,713 | | | $ | 2,476,713 | | | $ | — | | | $ | — | | | $ | 791,039 | | | $ | 791,039 | | | $ | — | | | $ | — | |
| Corporate debt securities | 4,835 | | | — | | | 4,835 | | | — | | | 6,070 | | | — | | | 6,070 | | | — | |
| Commercial paper | 93,107 | | | — | | | 93,107 | | | — | | | 29,472 | | | — | | | 29,472 | | | — | |
| Marketable securities: | | | | | | | | | | | | | | | |
| Corporate equity securities | 219,327 | | | 209,214 | | | 10,113 | | | — | | | 282,084 | | | 261,797 | | | 20,287 | | | — | |
| Government-sponsored enterprise securities | 11,253 | | | 11,253 | | | — | | | — | | | 12,733 | | | 12,733 | | | — | | | — | |
| Corporate debt securities | 293,976 | | | — | | | 293,976 | | | — | | | 301,799 | | | — | | | 301,799 | | | — | |
| Commercial paper | 94,881 | | | — | | | 94,881 | | | — | | | 102,356 | | | — | | | 102,356 | | | — | |
| Prepaid expenses and other current assets: | | | | | | | | | | | | | | | |
| Foreign currency forward contracts | 8,054 | | | — | | | 8,054 | | | — | | | 9,725 | | | — | | | 9,725 | | | — | |
| Other assets: | | | | | | | | | | | | | | | |
| Foreign currency forward contracts | 44 | | | — | | | 44 | | | — | | | — | | | — | | | — | | | — | |
| Total financial assets | $ | 3,202,190 | | | $ | 2,697,180 | | | $ | 505,010 | | | $ | — | | | $ | 1,535,278 | | | $ | 1,065,569 | | | $ | 469,709 | | | $ | — | |
| | | | | | | | | | | | | | | |
| Financial instruments carried at fair value (liability positions): | | | | | | | | | | | | | | | |
| Other current liabilities: | | | | | | | | | | | | | | | |
| Foreign currency forward contracts | $ | (4,871) | | | $ | — | | | $ | (4,871) | | | $ | — | | | $ | (5,533) | | | $ | — | | | $ | (5,533) | | | $ | — | |
| Long-term contingent consideration | (187,300) | | | — | | | — | | | (187,300) | | | (176,500) | | | — | | | — | | | (176,500) | |
| Other long-term liabilities: | | | | | | | | | | | | | | | |
| Foreign currency forward contracts | (1,462) | | | — | | | (1,462) | | | — | | | (1,821) | | | — | | | (1,821) | | | — | |
| Total financial liabilities | $ | (193,633) | | | $ | — | | | $ | (6,333) | | | $ | (187,300) | | | $ | (183,854) | | | $ | — | | | $ | (7,354) | | | $ | (176,500) | |
Please refer to Note F, “Marketable Securities and liabilities valued based on Level 2 inputs consistedEquity Investments,” for the carrying amount and related unrealized gains (losses) by type of corporate debt securities and commercial paper, which consisted of investments in highly-rated investment-grade corporations and foreign currency forward contracts with highly reputable and creditworthy counterparties.
.
investment.
VERTEX PHARMACEUTICALS INCORPORATED
Notes to Condensed Consolidated Financial Statements
(unaudited)
Fair Value of Corporate Equity Securities
The Company maintains strategic investments in corporate equity securities separately from the investment policy that governs its other cash, cash equivalents and marketable securities. The Company classifies its investments in publicly traded companies as “Marketable securities” on its condensed consolidated balance sheets. Generally, the Company’s investments in the common stock of these publicly traded companies are valued based on Level 1 inputs because they have readily determinable fair values. However, certain of the Company’s investments in publicly traded companies have been or continue to be valued based on Level 2 inputs due to transfer restrictions associated with these investments. Please refer to Note F, “Marketable Securities and Equity Investments,” for further information on these investments.
Fair Value of Contingent Consideration
In 2019, the Company acquired Exonics Therapeutics, Inc. (“Exonics”), a privately-held company focused on creating transformative gene-editing therapies to repair mutations that cause DMD and other severe neuromuscular diseases, including DM1. The Company’s Level 3 contingent consideration liabilities are related to $678.3 million of development and regulatory milestones potentially payable to Exonics’ former equity holders. The Company bases its estimates of the probability of achieving the milestones relevant to the fair value of contingent payments on industry data attributable to rare diseases. The discount rates used in the valuation model for contingent payments, which were between 0.7% and 2%, represent a measure of credit risk and market risk associated with settling the liabilities. Significant judgment is used in determining the appropriateness of these assumptions at each reporting period. Due to the uncertainties associated with development and commercialization of a drug candidate in the pharmaceutical industry, the Company's estimates regarding the fair value of contingent consideration will change in the future, resulting in adjustments to the fair value of the Company’s contingent consideration liabilities, and the effect of any such adjustments could be material.
The following table sets forthrepresents a rollforward of the fair value of the Company’s financial assets (excluding VIE cash and cash equivalents, which are recorded as Restricted cash and cash equivalents (VIE)) and liabilities subject tocontingent consideration liabilities:
| | | | | | | | | | | |
| | | | | | | |
| Six Months Ended June 30, 2020 | | | | | | |
| (in thousands) | | | | | | |
| Balance at December 31, 2019 | $ | 176,500 | | | | | | | |
| Increase in fair value of contingent payments | 10,800 | | | | | | | |
| Balance at June 30, 2020 | $ | 187,300 | | | | | | | |
The “Increase in fair value measurements:of contingent payments” in the table above was primarily due to changes in market interest rates.
|
| | | | | | | | | | | | | | | |
| | Fair Value Measurements as of September 30, 2017 |
| | | | Fair Value Hierarchy |
| | Total | | Level 1 | | Level 2 | | Level 3 |
| | (in thousands) |
| Financial instruments carried at fair value (asset position): | | | | | | | |
| Cash equivalents: | | | | | | | |
| Money market funds | $ | 466,702 |
| | $ | 466,702 |
| | $ | — |
| | $ | — |
|
| Government-sponsored enterprise securities | 14,979 |
| | 14,979 |
| | — |
| | — |
|
| Corporate debt securities | 4,488 |
| | — |
| | 4,488 |
| | — |
|
| Commercial paper | 14,608 |
| | — |
| | 14,608 |
| | — |
|
| Marketable securities: | | | | | | | |
| Corporate equity securities | 56,944 |
| | 56,944 |
| | — |
| | — |
|
| Corporate debt securities | 295,171 |
| | — |
| | 295,171 |
| | — |
|
| Commercial paper | 75,167 |
| | — |
| | 75,167 |
| | — |
|
| Prepaid and other current assets: | | | | | | | |
| Foreign currency forward contracts | 42 |
| | — |
| | 42 |
| | — |
|
| Other assets: | | | | | | | |
| Foreign currency forward contracts | 8 |
| | — |
| | 8 |
| | — |
|
| Total financial assets | $ | 928,109 |
|
| $ | 538,625 |
| | $ | 389,484 |
| | $ | — |
|
| Financial instruments carried at fair value (liability position): | | | | | | | |
| Other liabilities, current portion: | | | | | | | |
| Foreign currency forward contracts | $ | (13,897 | ) | | $ | — |
| | $ | (13,897 | ) | | $ | — |
|
| Other liabilities, excluding current portion: | | | | | | | |
| Foreign currency forward contracts | (977 | ) | | — |
| | (977 | ) | | — |
|
| Total financial liabilities | $ | (14,874 | ) | | $ | — |
| | $ | (14,874 | ) | | $ | — |
|
|
| | | | | | | | | | | | | | | |
| | Fair Value Measurements as of December 31, 2016 |
| | | | Fair Value Hierarchy |
| | Total | | Level 1 | | Level 2 | | Level 3 |
| | (in thousands) |
| Financial instruments carried at fair value (asset position): | | | | | | | |
| Cash equivalents: | | | | | | | |
| Money market funds | $ | 280,560 |
| | $ | 280,560 |
| | $ | — |
| | $ | — |
|
| Marketable securities: | | | | | | | |
| Government-sponsored enterprise securities | 15,508 |
| | 15,508 |
| | — |
| | — |
|
| Corporate equity securities | 64,560 |
| | 64,560 |
| | — |
| | — |
|
| Commercial paper | 59,404 |
| | — |
| | 59,404 |
| | — |
|
| Corporate debt securities | 111,140 |
| | — |
| | 111,140 |
| | — |
|
| Prepaid and other current assets: | | | | | | | |
| Foreign currency forward contracts | 14,407 |
| | — |
| | 14,407 |
| | — |
|
| Other assets: | | | | | | | |
| Foreign currency forward contracts | 1,186 |
| | $ | — |
| | 1,186 |
| | $ | — |
|
| Total financial assets | $ | 546,765 |
| | $ | 360,628 |
| | $ | 186,137 |
| | $ | — |
|
| Financial instruments carried at fair value (liability position): | | | | | | | |
| Other liabilities, current portion: | | | | | | | |
| Foreign currency forward contracts | $ | (144 | ) | | $ | — |
| | $ | (144 | ) | | $ | — |
|
| Total financial liabilities | $ | (144 | ) | | $ | — |
| | $ | (144 | ) | | $ | — |
|
VERTEX PHARMACEUTICALS INCORPORATED
Notes to Condensed Consolidated Financial Statements
(unaudited)
The Company’s VIE invested in cash equivalents consisting of money market funds of $1.5 million as of September 30, 2017, which are valued based on Level 1 inputs. These cash equivalents are not included in the table above. The Company’s noncontrolling interest related to the Company’s VIE includes the fair value of the contingent payments, which consist of milestone, royaltyF.Marketable Securities and option payments, which are valued based on Level 3 inputs. Please refer to Note C, “Collaborative Arrangements and Acquisitions,” for further information.Equity Investments
A summary of the Company’s cash cash equivalents and marketable securities, which are recorded at fair value (and do not include $2.3 billion and $2.3 billion of cash as of June 30, 2020 and December 31, 2019, respectively), is shown below:
| | | | | | | | | | | | | | | | | | | | | | | | | | | | | | | | | | | | | | | | | | | | | | | |
| As of June 30, 2020 | | | | | | | | As of December 31, 2019 | | | | | | |
| Amortized Cost | | Gross
Unrealized
Gains | | Gross
Unrealized
Losses | | Fair Value | | Amortized Cost | | Gross
Unrealized
Gains | | Gross
Unrealized
Losses | | Fair Value |
| (in thousands) | | | | | | | | | | | | | | |
| Cash equivalents: | | | | | | | | | | | | | | | |
| Money market funds | $ | 2,476,713 | | | $ | — | | | $ | — | | | $ | 2,476,713 | | | $ | 791,039 | | | $ | — | | | $ | — | | | $ | 791,039 | |
| Corporate debt securities | 4,836 | | | — | | | (1) | | | 4,835 | | | 6,070 | | | — | | | — | | | 6,070 | |
| Commercial paper | 93,084 | | | 23 | | | — | | | 93,107 | | | 29,470 | | | 3 | | | (1) | | | 29,472 | |
| Total cash equivalents | 2,574,633 | | | 23 | | | (1) | | | 2,574,655 | | | 826,579 | | | 3 | | | (1) | | | 826,581 | |
| Marketable securities: | | | | | | | | | | | | | | | |
| Government-sponsored enterprise securities | 11,198 | | | 55 | | | — | | | 11,253 | | | 12,689 | | | 44 | | | — | | | 12,733 | |
| Corporate debt securities | 292,085 | | | 1,897 | | | (6) | | | 293,976 | | | 301,458 | | | 391 | | | (50) | | | 301,799 | |
| Commercial paper | 94,396 | | | 492 | | | (7) | | | 94,881 | | | 102,240 | | | 121 | | | (5) | | | 102,356 | |
| Total marketable debt securities | 397,679 | | | 2,444 | | | (13) | | | 400,110 | | | 416,387 | | | 556 | | | (55) | | | 416,888 | |
| Corporate equity securities | 67,054 | | | 152,273 | | | — | | | 219,327 | | | 113,829 | | | 168,255 | | | — | | | 282,084 | |
| Total marketable securities | $ | 464,733 | | | $ | 154,717 | | | $ | (13) | | | $ | 619,437 | | | $ | 530,216 | | | $ | 168,811 | | | $ | (55) | | | $ | 698,972 | |
|
| | | | | | | | | | | | | | | |
| | Amortized Cost | | Gross
Unrealized
Gains | | Gross
Unrealized
Losses | | Fair Value |
| | (in thousands) |
| As of September 30, 2017 | | | | | | | |
| Cash and cash equivalents: | | | | | | | |
| Cash and money market funds | $ | 1,350,891 |
| | $ | — |
| | $ | — |
| | $ | 1,350,891 |
|
| Government-sponsored enterprise securities | 14,979 |
| | — |
| | — |
| | 14,979 |
|
| Commercial paper | 14,610 |
| | — |
| | (2 | ) | | 14,608 |
|
| Corporate debt securities | 4,488 |
| | — |
| | — |
| | 4,488 |
|
| Total cash and cash equivalents | $ | 1,384,968 |
| | $ | — |
| | $ | (2 | ) | | $ | 1,384,966 |
|
| Marketable securities: | | | | | | | |
| Corporate equity securities | 43,213 |
| | 13,731 |
| | — |
| | 56,944 |
|
| Commercial paper (matures within 1 year) | 75,186 |
| | 1 |
| | (20 | ) | | 75,167 |
|
| Corporate debt securities (matures within 1 year) | 235,679 |
| | 8 |
| | (106 | ) | | 235,581 |
|
| Corporate debt securities (matures after 1 year) | 59,651 |
| | — |
| | (61 | ) | | 59,590 |
|
| Total marketable securities | $ | 413,729 |
| | $ | 13,740 |
| | $ | (187 | ) | | $ | 427,282 |
|
| Total cash, cash equivalents and marketable securities | $ | 1,798,697 |
| | $ | 13,740 |
| | $ | (189 | ) | | $ | 1,812,248 |
|
| | | | | | | | |
| As of December 31, 2016 | | | | | | | |
| Cash and cash equivalents: | | | | | | | |
| Cash and money market funds | $ | 1,183,945 |
| | $ | — |
| | $ | — |
| | $ | 1,183,945 |
|
| Total cash and cash equivalents | $ | 1,183,945 |
| | $ | — |
| | $ | — |
| | $ | 1,183,945 |
|
| Marketable securities: | | | | | | | |
| Government-sponsored enterprise securities (matures within 1 year) | $ | 15,506 |
| | $ | 2 |
| | $ | — |
| | $ | 15,508 |
|
| Corporate equity securities | 43,213 |
| | 21,347 |
| | — |
| | 64,560 |
|
| Commercial paper (matures within 1 year) | 59,331 |
| | 73 |
| | — |
| | 59,404 |
|
| Corporate debt securities (matures within 1 year) | 111,225 |
| | — |
| | (85 | ) | | 111,140 |
|
| Total marketable securities | $ | 229,275 |
| | $ | 21,422 |
| | $ | (85 | ) | | $ | 250,612 |
|
| Total cash, cash equivalents and marketable securities | $ | 1,413,220 |
| | $ | 21,422 |
| | $ | (85 | ) | | $ | 1,434,557 |
|
| | | | | | | | | | | |
| As of June 30, 2020 | | As of December 31, 2019 |
| (in thousands) | | |
| Cash and cash equivalents | $ | 2,574,655 | | | $ | 826,581 | |
| Marketable securities | 400,110 | | | 416,888 | |
| Total | $ | 2,974,765 | | | $ | 1,243,469 | |
Available-for-sale debt securities by contractual maturity were as follows:
| | | | | | | | | | | |
| As of June 30, 2020 | | As of December 31, 2019 |
| (in thousands) | | |
| Matures within one year | $ | 2,939,879 | | | $ | 1,137,942 | |
| Matures after one year through five years | 34,886 | | | 105,527 | |
| Total | $ | 2,974,765 | | | $ | 1,243,469 | |
The Company has a limited number of marketableavailable-for-sale debt securities in insignificant loss positions as of SeptemberJune 30, 2017,2020, which the Companyit does not intend to sell and has concluded it will not be required to sell before recovery of the amortized costs offor the investmentinvestments at maturity. There were noThe Company did 0t record any charges recorded for other-than-temporary declines in the fair value of marketableavailable-for-sale debt securities noror gross realized gains or losses recognized in the three and ninesix months ended SeptemberJune 30, 20172020 and 2016.2019.
As of June 30, 2020 and December 31, 2019, the total fair value of the Company’s strategic investments in the common stock of publicly traded companies, which was primarily related to its investment in CRISPR, was $219.3 million and $282.1 million, respectively, and was classified as “Marketable securities” on its condensed consolidated balance sheets.
The Company records changes in the fair value of its investments in corporate equity securities to “Other income, net” on its condensed consolidated statements of operations. During the three and six months ended June 30, 2020, the Company recorded net unrealized gains of $85.5 million and $35.2 million, respectively, on corporate equity securities held as of June
VERTEX PHARMACEUTICALS INCORPORATED
Notes to Condensed Consolidated Financial Statements
(unaudited)
| |
G. | Accumulated Other Comprehensive Income (Loss) |
A summary30, 2020. During the three and six months ended June 30, 2019, the Company recorded net unrealized gains of $56.5 million and $100.1 million, respectively, on corporate equity securities held as of June 30, 2019. During the six months ended June 30, 2020, the Company received proceeds of $127.9 million related to the sale of the common stock of publicly traded companies, which had a total original weighted-average cost basis of $46.8 million. There were 0 sales of the common stock of publicly traded companies during the six months ended June 30, 2019.
As of June 30, 2020, the carrying value of the Company’s equity investments without readily determinable fair values, which are recorded in “Other assets” on its condensed consolidated balance sheets, was $46.6 million.
G.Accumulated Other Comprehensive Income (Loss)
The following table summarizes the changes in accumulated other comprehensive income (loss) by component is shown below:component:
| | | | | | | | | | | | | | | | | | | | | | | |
| | | Unrealized Holding Gains (Losses), Net of Tax | | | | |
| Foreign Currency Translation Adjustment | | On Available-For-Sale Debt Securities | | On Foreign Currency Forward Contracts | | Total |
| (in thousands) | | | | | | |
| Balance at December 31, 2019 | $ | (895) | | | $ | 503 | | | $ | (1,581) | | | $ | (1,973) | |
| Other comprehensive (loss) income before reclassifications | (13,200) | | | 1,950 | | | 11,079 | | | (171) | |
| Amounts reclassified from accumulated other comprehensive income (loss) | — | | | — | | | (11,977) | | | (11,977) | |
| Net current period other comprehensive (loss) income | (13,200) | | | 1,950 | | | (898) | | | (12,148) | |
| Balance at June 30, 2020 | $ | (14,095) | | | $ | 2,453 | | | $ | (2,479) | | | $ | (14,121) | |
| | | | | | | |
| Balance at December 31, 2018 | $ | (11,227) | | | $ | (536) | | | $ | 12,422 | | | $ | 659 | |
| Other comprehensive income before reclassifications | 1,091 | | | 1,047 | | | 5,793 | | | 7,931 | |
| Amounts reclassified from accumulated other comprehensive income (loss) | — | | | — | | | (11,791) | | | (11,791) | |
| Net current period other comprehensive income (loss) | 1,091 | | | 1,047 | | | (5,998) | | | (3,860) | |
| Balance at June 30, 2019 | $ | (10,136) | | | $ | 511 | | | $ | 6,424 | | | $ | (3,201) | |
H.Hedging
|
| | | | | | | | | | | | | | | |
| | Foreign Currency Translation Adjustment | | Unrealized Holding Gains (Losses) on Marketable Securities, Net of Tax | | Unrealized Gains (Losses) on Foreign Currency Forward Contracts, Net of Tax | | Total |
| | (in thousands) |
| Balance at December 31, 2016 | $ | (7,862 | ) | | $ | 17,521 |
| | $ | 11,514 |
| | $ | 21,173 |
|
| Other comprehensive loss before reclassifications | (11,137 | ) | | (7,786 | ) | | (25,981 | ) | | (44,904 | ) |
| Amounts reclassified from accumulated other comprehensive income (loss) | — |
| | — |
| | (1,398 | ) | | (1,398 | ) |
| Net current period other comprehensive (loss) income | $ | (11,137 | ) | | $ | (7,786 | ) | | $ | (27,379 | ) | | $ | (46,302 | ) |
| Balance at September 30, 2017 | $ | (18,999 | ) | | $ | 9,735 |
| | $ | (15,865 | ) | | $ | (25,129 | ) |
|
| | | | | | | | | | | | | | | |
| | Foreign Currency Translation Adjustment | | Unrealized Holding Gains on Marketable Securities | | Unrealized Gains (Losses) on Foreign Currency Forward Contracts, Net of Tax | | Total |
| | (in thousands) |
| Balance at December 31, 2015 | $ | (2,080 | ) | | $ | 126 |
| | $ | 3,778 |
| | $ | 1,824 |
|
| Other comprehensive (loss) income before reclassifications | (7,709 | ) | | 104 |
| | 6,715 |
| | (890 | ) |
| Amounts reclassified from accumulated other comprehensive income (loss) | — |
| | — |
| | (4,779 | ) | | (4,779 | ) |
| Net current period other comprehensive (loss) income | $ | (7,709 | ) | | $ | 104 |
| | $ | 1,936 |
| | $ | (5,669 | ) |
| Balance at September 30, 2016 | $ | (9,789 | ) | | $ | 230 |
| | $ | 5,714 |
| | $ | (3,845 | ) |
The Company maintains a hedging program intended to mitigate the effect of changes in foreign exchange rates for a portion of the Company’s forecasted product revenues denominated in certain foreign currencies. The program includes foreign currency forward contracts that are designated as cash flow hedges under GAAP having contractual durations from one to eighteen months. The Company recognizes realized gains and losses for the effective portion of such contracts in “Product revenues, net” in its condensed consolidated statements of operations in the same period that it recognizes the product revenues that were impacted by the hedged foreign exchange rate changes.
The Company formally documents the relationship between foreign currency forward contracts (hedging instruments) and forecasted product revenues (hedged items), as well as the Company’s risk management objective and strategy for undertaking various hedging activities, which includes matching all foreign currency forward contracts that are designated as cash flow hedges to forecasted transactions. The Company also formally assesses, both at the hedge’s inception and on an ongoing basis, whether the foreign currency forward contracts are highly effective in offsetting changes in cash flows of hedged items on a prospective and retrospective basis. If the Company determineswere to determine that a (i) foreign currency forward contract is not highly effective as a cash flow hedge, (ii) foreign currency forward contract has ceased to be a highly effective hedge or (iii) forecasted transaction is no longer probable of occurring, the Company would discontinue hedge accounting
VERTEX PHARMACEUTICALS INCORPORATED
Notes to Condensed Consolidated Financial Statements
(unaudited)
treatment prospectively. The Company measures effectiveness based on the change in fair value of the forward contracts and the fair value of the hypothetical foreign currency forward contracts with terms that match the critical terms of the risk being hedged. As of SeptemberJune 30, 2017,2020, all hedges were determined to be highly effectiveeffective.
The Company considers the impact of its counterparties’ credit risk on the fair value of the foreign currency forward contracts. As of June 30, 2020 and December 31, 2019, credit risk did not change the Company had not recorded any ineffectiveness related tofair value of the hedging program.Company’s foreign currency forward contracts.
The following table summarizes the notional amount of the Company’s outstanding foreign currency forward contracts designated as cash flow hedges under GAAP:
| | | | | | | | | | | |
| As of June 30, 2020 | | As of December 31, 2019 |
| Foreign Currency | (in thousands) | | |
| Euro | $ | 633,770 | | | $ | 501,197 | |
| British pound sterling | 150,407 | | | 87,032 | |
| Australian dollar | 89,443 | | | 89,705 | |
| Canadian dollar | 57,578 | | | 50,452 | |
| Total foreign currency forward contracts | $ | 931,198 | | | $ | 728,386 | |
Foreign currency forward contracts - Not designated as hedging instruments
22
TableThe Company also enters into foreign currency forward contracts with contractual maturities of Contentsless than one month, that are designed to mitigate the effect of changes in foreign exchange rates on monetary assets and liabilities, including intercompany balances. These contracts are not designated as hedging instruments under GAAP. The Company recognizes realized gains and losses for such contracts in “Other income, net” in its condensed consolidated statements of operations each period. As of June 30, 2020, the notional amount of the Company’s outstanding foreign currency forward contracts where hedge accounting under GAAP is not applied was $574.6 million.VERTEX PHARMACEUTICALS INCORPORATEDDuring the three and six months ended June 30, 2020 and 2019, the Company recognized the following related to foreign currency forward contacts in its condensed consolidated statements of operations:
Notes to Condensed Consolidated Financial Statements
(unaudited)
|
| | | | | | | |
| | As of September 30, 2017 | | As of December 31, 2016 |
| Foreign Currency | (in thousands) |
| Euro | $ | 234,477 |
| | $ | 164,368 |
|
| British pound sterling | 77,387 |
| | 65,237 |
|
| Australian dollar | 31,283 |
| | 23,776 |
|
| Total foreign currency forward contracts | $ | 343,147 |
| | $ | 253,381 |
|
| | | | | | | | | | | | | | | | | | | | | | | |
| Three Months Ended June 30, | | | | Six Months Ended June 30, | | |
| 2020 | | 2019 | | 2020 | | 2019 |
| (in thousands) | | | | | | |
| Designated as hedging instruments - Reclassified from AOCI | | | | | | | |
| Product revenues, net | $ | 6,366 | | | $ | 8,238 | | | $ | 15,288 | | | $ | 15,077 | |
| Not designated as hedging instruments | | | | | | | |
| Other income, net | $ | (6,056) | | | $ | (1,089) | | | $ | 10,173 | | | $ | 2,062 | |
| | | | | | | |
| Total reported in the Condensed Consolidated Statement of Operations | | | | | | | |
| Product revenues, net | $ | 1,524,485 | | | $ | 940,380 | | | $ | 3,039,592 | | | $ | 1,797,633 | |
| Other income, net | $ | 116,365 | | | $ | 53,939 | | | $ | 55,235 | | | $ | 96,549 | |
The following table summarizes the fair value of the Company’s outstanding foreign currency forward contracts designated as cash flow hedges under GAAP included on the Company’sits condensed consolidated balance sheets:
| | | | | | | | | | | | | | | | | | | | |
| As of June 30, 2020 | | | | | | |
| Assets | | | | Liabilities | | |
| Classification | | Fair Value | | Classification | | Fair Value |
| (in thousands) | | | | | | |
| Prepaid expenses and other current assets | | $ | 8,054 | | | Other current liabilities | | $ | (4,871) | |
| Other assets | | 44 | | | Other long-term liabilities | | (1,462) | |
| Total assets | | $ | 8,098 | | | Total liabilities | | $ | (6,333) | |
VERTEX PHARMACEUTICALS INCORPORATED
Notes to Condensed Consolidated Financial Statements
(unaudited)
|
| | | | | | | | | | |
| As of September 30, 2017 |
| Assets | | Liabilities |
| Classification | | Fair Value | | Classification | | Fair Value |
| (in thousands) |
| Prepaid and other current assets | | $ | 42 |
| | Other liabilities, current portion | | $ | (13,897 | ) |
| Other assets | | 8 |
| | Other liabilities, excluding current portion | | (977 | ) |
| Total assets | | $ | 50 |
| | Total liabilities | | $ | (14,874 | ) |
| | | As of December 31, 2016 | |
| As of December 31, 2019 | | As of December 31, 2019 | |
| Assets | Assets | | Liabilities | Assets | | | Liabilities | |
| Classification | | Fair Value | | Classification | | Fair Value | Classification | | Fair Value | | Classification | | Fair Value |
| (in thousands) | (in thousands) | (in thousands) | |
| Prepaid and other current assets | | $ | 14,407 |
| | Other liabilities, current portion | | $ | (144 | ) | |
| Prepaid expenses and other current assets | | Prepaid expenses and other current assets | | $ | 9,725 | | | Other current liabilities | | $ | (5,533) | |
| Other assets | | 1,186 |
| | Other liabilities, excluding current portion | | — |
| Other assets | | — | | | Other long-term liabilities | | (1,821) | |
| Total assets | | $ | 15,593 |
| | Total liabilities | | $ | (144 | ) | Total assets | | $ | 9,725 | | | Total liabilities | | $ | (7,354) | |
As of SeptemberJune 30, 2017,2020, the Company expects the amounts that are related to foreign exchange forward contracts designated as cash flow hedges under GAAP recorded in prepaid“Prepaid expenses and other currents assetscurrent assets” and other liabilities,“Other current portionliabilities” to be reclassedreclassified to earnings within twelve months.
The following table summarizes the potential effect of offsetting derivatives by type of financial instrument designated as cash flow hedges under GAAP on the Company’s condensed consolidated balance sheets:
| | | | | | | | | | | | | | | | | | | | | | | | | | | | | |
| As of June 30, 2020 | | | | | | | | |
| Gross Amounts Recognized | | Gross Amounts Offset | | Gross Amounts Presented | | Gross Amounts Not Offset | | Legal Offset |
| Foreign currency forward contracts | (in thousands) | | | | | | | | |
| Total assets | $ | 8,098 | | | $ | — | | | $ | 8,098 | | | $ | (6,333) | | | $ | 1,765 | |
| Total liabilities | (6,333) | | | — | | | (6,333) | | | 6,333 | | | — | |
| | | | | | | | | | | | | | | | | | | | | | | | | | | | | |
| As of December 31, 2019 | | | | | | | | |
| Gross Amounts Recognized | | Gross Amounts Offset | | Gross Amounts Presented | | Gross Amounts Not Offset | | Legal Offset |
| Foreign currency forward contracts | (in thousands) | | | | | | | | |
| Total assets | $ | 9,725 | | | $ | — | | | $ | 9,725 | | | $ | (7,354) | | | $ | 2,371 | |
| Total liabilities | (7,354) | | | — | | | (7,354) | | | 7,354 | | | — | |
| | | | | | | | | |
I.Inventories
Inventories consisted of the following:
| | | | | | | | | | | |
| As of June 30, 2020 | | As of December 31, 2019 |
| (in thousands) | | |
| Raw materials | $ | 30,162 | | | $ | 26,247 | |
| Work-in-process | 134,889 | | | 107,021 | |
| Finished goods | 54,167 | | | 34,234 | |
| Total | $ | 219,218 | | | $ | 167,502 | |
|
| | | | | | | | | | | | | | | | | | | |
| | As of September 30, 2017 |
| | Gross Amounts Recognized | | Gross Amounts Offset | | Gross Amounts Presented | | Gross Amounts Not Offset | | Legal Offset |
| Foreign currency forward contracts | (in thousands) |
| Total assets | $ | 50 |
| | $ | — |
| | $ | 50 |
| | $ | (50 | ) | | $ | — |
|
| Total liabilities | $ | (14,874 | ) | | $ | — |
| | $ | (14,874 | ) | | $ | 50 |
| | $ | (14,824 | ) |
|
| | | | | | | | | | | | | | | | | | | |
| | As of December 31, 2016 |
| | Gross Amounts Recognized | | Gross Amounts Offset | | Gross Amounts Presented | | Gross Amounts Not Offset | | Legal Offset |
| Foreign currency forward contracts | (in thousands) |
| Total assets | $ | 15,593 |
| | $ | — |
| | $ | 15,593 |
| | $ | (144 | ) | | $ | 15,449 |
|
| Total liabilities | $ | (144 | ) | | $ | — |
| | $ | (144 | ) | | $ | 144 |
| | $ | — |
|
VERTEX PHARMACEUTICALS INCORPORATED
Notes to Condensed Consolidated Financial Statements
(unaudited)
The Company also enters into foreign exchange forward contracts with contractual maturities of less than one month designed to mitigate the effect of changes in foreign exchange rates on monetary assets and liabilities including intercompany balances. The Company recognized losses of $4.1 million and $13.0 million, recorded in other income (expense), net, for the three and nine months ended September 30, 2017, respectively, related to foreign exchange contracts, which are not designated as hedging instruments under GAAP. The Company recognized a loss of $1.2 million and a gain of $0.5 million, for the three and nine months ended September 30, 2016, respectively, related to foreign exchange contracts not designated as hedging instruments.
As of September 30, 2017, the notional amount of foreign exchange contracts where hedge accounting under GAAP is not applied was $113.8 million. The following table summarizes the fair value of the Company’s outstanding foreign currency forward contracts not designated for hedge accounting included on the Company’s condensed consolidated balance sheets:
|
| | | | | | | |
| | As of September 30, 2017 | | As of December 31, 2016 |
| | (in thousands) |
| Prepaid expenses and other current assets | $ | 1,709 |
| | $ | 660 |
|
I. Inventories
Inventories consisted of the following:
|
| | | | | | | |
| | As of September 30, 2017 | | As of December 31, 2016 |
| | (in thousands) |
| Raw materials | $ | 12,678 |
| | $ | 6,348 |
|
| Work-in-process | 67,826 |
| | 56,672 |
|
| Finished goods | 17,688 |
| | 14,584 |
|
| Total | $ | 98,192 |
| | $ | 77,604 |
|
Based on its evaluation of, among other factors, information regarding tezacaftor's safety and efficacy, the Company has capitalized $9.6 million of inventory costs for tezacaftor manufactured in preparation for its potential product launch as of September 30, 2017. In periods prior, the Company expensed costs associated with tezacaftor’s raw materials and work-in-process as a development expense. The Company submitted a New Drug Application to the United States Food and Drug Administration and a Marketing Authorization Application to the European Medicines Agency for tezacaftor in combination with ivacaftor. The Company plans to continue to monitor the status of the tezacaftor regulatory process and the other factors used to determine whether or not to capitalize the tezacaftor inventory and, if there are significant negative developments regarding tezacaftor, the Company could be required to impair previously capitalized costs.
J. Intangible Assets and Goodwill
Intangible Assets
As of September 30, 2017 and December 31, 2016, in-process research and development intangible assets of $29.0 million and $284.3 million, respectively, were recorded on the Company’s condensed consolidated balance sheet. In 2015, the Company recorded an in-process research development intangible asset of $255.3 million related to Parion’s pulmonary ENaC platform, including the intellectual property related to VX-371 and VX-551, that are licensed by Parion to the Company. In 2014, the Company recorded an in-process research development intangible asset of $29.0 million related to VX-210 that is licensed by BioAxone to the Company.
In connection with its preparation of its financial statements for the three and nine months ended September 30, 2017, the Company determined that there were indicators that the value of the pulmonary ENaC platform intangible asset had become impaired. The Company determined that the fair value of the intangible asset had decreased significantly based on data received in September 2017 from a Phase 2 clinical trial of VX-371 that did not meet its primary efficacy endpoint. Based on this data, the Company evaluated the fair value of Parion’s pulmonary ENaC platform using the discounted cash
VERTEX PHARMACEUTICALS INCORPORATED
Notes to Condensed Consolidated Financial Statements
(unaudited)
flow approach from the perspective of a market participant and determined that the fair value of the intangible asset was zero as of September 30, 2017. The discounted cash flow model pertaining to the impairment of the pulmonary ENaC platform includes (i) assumptions regarding the probability of obtaining marketing approval for the drug candidate, (ii) estimates regarding the timing of and the expected costs to develop and commercialize the drug candidate, (iii) estimates of future cash flows from potential product sales with respect to the drug candidate and (iv) appropriate discount and tax rates. The Company recorded a $255.3 million impairment charge and a benefit from income taxes of $97.7 million in the three and nine months ended September 30, 2017 attributable to noncontrolling interest.
Goodwill
As of September 30, 2017 and December 31, 2016, goodwill of $50.4 million was recorded on the Company’s condensed consolidated balance sheet.
K. Long-term Obligations
Fan Pier Leases
In 2011, the Company entered into two lease agreements, pursuant to which the Company leases approximately 1.1 million square feet of office and laboratory space in two buildings (the “Fan Pier Buildings”) at Fan Pier in Boston, Massachusetts (the “Fan Pier Leases”). The Company commenced lease payments in December 2013, and will make lease payments pursuant to the Fan Pier Leases through December 2028. The Company has an option to extend the term of the Fan Pier Leases for an additional ten years.
Because the Company was involved in the construction project, the Company was deemed for accounting purposes to be the owner of the Fan Pier Buildings during the construction period and recorded project construction costs incurred by the landlord. Upon completion of the Fan Pier Buildings, the Company evaluated the Fan Pier Leases and determined that the Fan Pier Leases did not meet the criteria for “sale-leaseback” treatment. Accordingly, the Company began depreciating the asset and incurring interest expense related to the financing obligation in 2013. The Company bifurcates its lease payments pursuant to the Fan Pier Leases into (i) a portion that is allocated to the Buildings and (ii) a portion that is allocated to the land on which the Fan Pier Buildings were constructed. The portion of the lease obligations allocated to the land is treated as an operating lease that commenced in 2011.
Property and equipment, net, included $479.0 million and $489.0 million as of September 30, 2017 and December 31, 2016, respectively, related to construction costs for the Fan Pier Buildings. The carrying value of the Company’s lease agreement liability for the Fan Pier Buildings was $472.2 million and $472.6 million as of September 30, 2017 and December 31, 2016, respectively.
San Diego Lease
On December 2, 2015, the Company entered into a lease agreement for 3215 Merryfield Row, San Diego, California with ARE-SD Region No. 23, LLC (the “San Diego Building”). Pursuant to this agreement, the Company agreed to lease approximately 170,000 square feet of office and laboratory space in a building to be built in San Diego, California. The lease will commence upon completion of the building, scheduled for the first half of 2018, and will extend for 16 years from the commencement date. Pursuant to the lease agreement, during the initial 16-year term, the Company will pay an average of approximately $10.2 million per year in aggregate rent, exclusive of operating expenses. The Company has the option to extend the lease term for up to two additional five-year terms.
Because the Company is involved in the construction project, the Company is deemed for accounting purposes to be the owner of the San Diego Building during the construction period and recorded project construction costs incurred by the landlord. The Company bifurcates its lease payments pursuant to the San Diego Lease into (i) a portion that is allocated to the San Diego Building and (ii) a portion that is allocated to the land on which the San Diego Building was constructed. Although the Company will not begin making lease payments pursuant to the San Diego Lease until the commencement date, the portion of the lease obligation allocated to the land is treated for accounting purposes as an operating lease that commenced in the fourth quarter of 2016. Upon completion of the San Diego Building, the Company will evaluate the San
VERTEX PHARMACEUTICALS INCORPORATED
Notes to Condensed Consolidated Financial Statements
(unaudited)
Diego Lease and determine if the San Diego Lease meets the criteria for “sale-leaseback” treatment. If the San Diego Lease meets the “sale-leaseback” criteria, the Company will remove the asset and the related liability from its consolidated balance sheet and treat the San Diego Lease as either an operating or a capital lease based on the Company’s assessment of the accounting guidance. The Company expects that upon completion of construction of the San Diego Building the San Diego Lease will not meet the “sale-leaseback” criteria. If the San Diego Lease does not meet “sale-leaseback” criteria, the Company will treat the San Diego Lease as a financing obligation and will depreciate the asset over its estimated useful life.
Property and equipment, net, included $73.9 million and $15.0 million as of September 30, 2017 and December 31, 2016, respectively, related to construction costs for the San Diego Building. The carrying value of the Company’s lease agreement liability for the San Diego Building was $71.8 million and $12.6 million as of September 30, 2017 and December 31, 2016, respectively.
Revolving Credit Facility
In October 2016, the Company entered into a Credit Agreement (the “Credit Agreement”) with Bank of America, N.A., as administrative agent and the lenders referred to therein. The Credit Agreement provides for a $500.0 million revolving facility, $300.0 million of which was drawn at closing (the “Loans”) and was repaid in February 2017. The Credit Agreement also provides that, subject to satisfaction of certain conditions, the Company may request that the borrowing capacity under the Credit Agreement be increased by an additional $300.0 million. The Credit Agreement matures on October 13, 2021.
The proceeds of the borrowing under the Credit Agreement were used primarily to repay the Company’s then outstanding indebtedness under the Macquarie Loan (as defined below). The Loans will bear interest, at the Company’s option, at either a base rate or a Eurodollar rate, in each case plus an applicable margin. Under the Credit Agreement, the applicable margins on base rate loans range from 0.75% to 1.50% and the applicable margins on Eurodollar loans range from 1.75% to 2.50%, in each case based on the Company’s consolidated leverage ratio (the ratio of the Company’s total consolidated debt to the Company’s trailing twelve-month EBITDA).
The Loans are guaranteed by certain of the Company’s domestic subsidiaries and secured by substantially all of the Company’s assets and the assets of the Company’s domestic subsidiaries (excluding intellectual property, owned and leased real property and certain other excluded property) and by the equity interests of the Company’s subsidiaries, subject to certain exceptions. Under the terms of the Credit Agreement, the Company must maintain, subject to certain limited exceptions, a consolidated leverage ratio of 3.00 to 1.00 and consolidated EBITDA of at least $200.0 million, in each case to be measured on a quarterly basis.
The Credit Agreement contains customary representations and warranties and usual and customary affirmative and negative covenants. The Credit Agreement also contains customary events of default. In the case of a continuing event of default, the administrative agent would be entitled to exercise various remedies, including the acceleration of amounts due under outstanding loans.
Term Loan
In July 2014, the Company entered into a credit agreement with the lenders party thereto, and Macquarie US Trading LLC (“Macquarie”), as administrative agent. The credit agreement provided for a $300.0 million senior secured term loan (the “Macquarie Loan”). On October 13, 2016, the Company terminated and repaid all outstanding obligations under the Macquarie Loan.
The Macquarie Loan initially bore interest at a rate of 7.2% per annum, which was reduced to 6.2% per annum based on the FDA’s approval of ORKAMBI. The Term Loan bore interest at a rate of LIBOR plus 5.0% per annum during the third year of the term.
The Company incurred $5.3 million in fees paid to Macquarie that were recorded as a discount on the Macquarie Loan and were recorded as interest expense using the effective interest method over the term of the loan in the Company’s condensed consolidated statements of operations.
L. Stock-based Compensation Expense and Share Repurchase Programs
VERTEX PHARMACEUTICALS INCORPORATED
Notes to Condensed Consolidated Financial Statements
(unaudited)
Stock-based compensation expense
During the three and ninesix months ended SeptemberJune 30, 20172020 and 2016,2019, the Company recognized the following stock-based compensation expense:
| | | | Three Months Ended September 30, | | Nine Months Ended September 30, | | Three Months Ended June 30, | | | Six Months Ended June 30, | |
| | 2017 | | 2016 | | 2017 | | 2016 | | 2020 | | 2019 | | 2020 | | 2019 |
| | (in thousands) | | (in thousands) | |
| Stock-based compensation expense by type of award: | | | | | | | | Stock-based compensation expense by type of award: | |
| Restricted stock and restricted stock units (including PSUs) | | Restricted stock and restricted stock units (including PSUs) | $ | 98,419 | | | $ | 60,966 | | | $ | 195,568 | | | $ | 124,476 | |
| Stock options | $ | 25,969 |
| | $ | 28,773 |
| | $ | 80,865 |
| | $ | 86,859 |
| Stock options | 16,847 | | | 26,160 | | | 34,113 | | | 54,316 | |
| Restricted stock and restricted stock units | 46,737 |
| | 30,966 |
| | 131,388 |
| | 88,107 |
| |
| ESPP share issuances | 2,428 |
| | 2,425 |
| | 6,738 |
| | 6,385 |
| ESPP share issuances | 2,855 | | | 2,809 | | | 5,340 | | | 5,386 | |
| Less stock-based compensation expense capitalized to inventories | (1,364 | ) | | (955 | ) | | (3,657 | ) | | (2,728 | ) | |
| Total stock-based compensation included in costs and expenses | $ | 73,770 |
| | $ | 61,209 |
| | $ | 215,334 |
| | $ | 178,623 |
| |
| Stock-based compensation expense related to inventories | | Stock-based compensation expense related to inventories | (932) | | | (248) | | | (2,126) | | | (700) | |
| Total stock-based compensation expense included in costs and expenses | | Total stock-based compensation expense included in costs and expenses | $ | 117,189 | | | $ | 89,687 | | | $ | 232,895 | | | $ | 183,478 | |
| | | | | | | |
|
| | | | | | | | |
| Stock-based compensation expense by line item: | | | | | | | | Stock-based compensation expense by line item: | |
| Cost of sales | | Cost of sales | $ | 1,387 | | | $ | 1,503 | | | $ | 2,748 | | | $ | 2,841 | |
| Research and development expenses | $ | 46,186 |
| | $ | 39,980 |
| | $ | 134,855 |
| | $ | 115,068 |
| Research and development expenses | 70,275 | | | 55,632 | | | 142,962 | | | 115,347 | |
| Sales, general and administrative expenses | 27,584 |
| | 21,229 |
| | 80,479 |
| | 63,555 |
| Sales, general and administrative expenses | 45,527 | | | 32,552 | | | 87,185 | | | 65,290 | |
| Total stock-based compensation included in costs and expenses | $ | 73,770 |
| | $ | 61,209 |
| | $ | 215,334 |
| | $ | 178,623 |
| |
| Total stock-based compensation expense included in costs and expenses | | Total stock-based compensation expense included in costs and expenses | 117,189 | | | 89,687 | | | 232,895 | | | 183,478 | |
| Income tax effect | | Income tax effect | (31,151) | | | (26,118) | | | (95,397) | | | (65,642) | |
| Total stock-based compensation expense, net of tax | | Total stock-based compensation expense, net of tax | $ | 86,038 | | | $ | 63,569 | | | $ | 137,498 | | | $ | 117,836 | |
The following table sets forth the Company’s unrecognized stock-based compensation expense as of June 30, 2020, by type of award and the weighted-average period over which that expense is expected to be recognized:
|
| | | | | |
| | As of September 30, 2017 |
| | Unrecognized Expense | | Weighted-average
Recognition Period |
| | (in thousands) | | (in years) |
| Type of award: | | | |
| Stock options | $ | 175,298 |
| | 2.60 |
| Restricted stock and restricted stock units | $ | 289,008 |
| | 2.64 |
| ESPP share issuances | $ | 2,636 |
| | 0.46 |
| | | | | | | | | | | |
| As of June 30, 2020 | | |
| Unrecognized Expense | | Weighted-average
Recognition Period |
| (in thousands) | | (in years) |
| Type of award: | | | |
| Restricted stock units (including PSUs) | $ | 473,493 | | | 2.08 |
| Stock options | $ | 91,779 | | | 2.15 |
| ESPP share issuances | $ | 6,489 | | | 0.59 |
VERTEX PHARMACEUTICALS INCORPORATED
Notes to Condensed Consolidated Financial Statements
(unaudited)
The following table summarizes information about stock options outstanding and exercisable at Septemberas of June 30, 2017:2020:
| | | | | | | | | | | | | | | | | | | | | | | | | | | | | | | | |
| | Options Outstanding | | | | | | Options Exercisable | | |
Range of Exercise Prices | | Number
Outstanding | | Weighted-average
Remaining
Contractual Life | | Weighted-average
Exercise Price | | Number
Exercisable | | Weighted-average
Exercise Price |
| | (in thousands) | | (in years) | | (per share) | | (in thousands) | | (per share) |
| $33.82–$40.00 | | 67 | | | 1.27 | | $ | 37.85 | | | 67 | | | $ | 37.85 | |
| $40.01–$60.00 | | 166 | | | 2.20 | | $ | 47.20 | | | 166 | | | $ | 47.20 | |
| $60.01–$80.00 | | 107 | | | 3.77 | | $ | 74.83 | | | 105 | | | $ | 74.83 | |
| $80.01–$100.00 | | 1,095 | | | 5.92 | | $ | 88.92 | | | 889 | | | $ | 89.33 | |
| $100.01–$120.00 | | 132 | | | 4.64 | | $ | 109.27 | | | 130 | | | $ | 109.20 | |
| $120.01–$140.00 | | 288 | | | 5.23 | | $ | 129.41 | | | 286 | | | $ | 129.43 | |
| $140.01–$160.00 | | 784 | | | 7.61 | | $ | 155.49 | | | 340 | | | $ | 155.39 | |
| $160.01–$180.00 | | 619 | | | 8.02 | | $ | 168.32 | | | 252 | | | $ | 165.43 | |
| $180.01–$200.00 | | 1,307 | | | 8.40 | | $ | 185.32 | | | 365 | | | $ | 184.82 | |
| $200.01–$286.27 | | 23 | | | 9.92 | | $ | 286.27 | | | 23 | | | $ | 286.27 | |
| Total | | 4,588 | | | 6.89 | | $ | 139.99 | | | 2,623 | | | $ | 121.00 | |
|
| | | | | | | | | | | | | | | | |
| | | Options Outstanding | | Options Exercisable |
| Range of Exercise Prices | | Number
Outstanding | | Weighted-average
Remaining
Contractual Life | | Weighted-average
Exercise Price | | Number
Exercisable | | Weighted-average
Exercise Price |
| | | (in thousands) | | (in years) | | (per share) | | (in thousands) | | (per share) |
| $18.93–$20.00 | | 128 |
| | 0.35 | | $ | 18.93 |
| | 128 |
| | $ | 18.93 |
|
| $20.01–$40.00 | | 834 |
| | 2.21 | | $ | 34.51 |
| | 834 |
| | $ | 34.51 |
|
| $40.01–$60.00 | | 877 |
| | 4.83 | | $ | 49.17 |
| | 877 |
| | $ | 49.17 |
|
| $60.01–$80.00 | | 821 |
| | 6.46 | | $ | 75.62 |
| | 649 |
| | $ | 75.44 |
|
| $80.01–$100.00 | | 4,587 |
| | 8.33 | | $ | 89.37 |
| | 1,397 |
| | $ | 89.47 |
|
| $100.01–$120.00 | | 1,137 |
| | 7.36 | | $ | 109.34 |
| | 586 |
| | $ | 109.24 |
|
| $120.01–$140.00 | | 1,260 |
| | 7.88 | | $ | 130.24 |
| | 688 |
| | $ | 129.86 |
|
| $140.01–$160.00 | | — |
| | 0.00 | | $ | — |
| | — |
| | $ | — |
|
| $160.01–$163.74 | | 634 |
| | 9.80 | | $ | 162.94 |
| | 3 |
| | $ | 162.94 |
|
| Total | | 10,278 |
| | 7.22 | | $ | 91.28 |
| | 5,162 |
| | $ | 77.92 |
|
M. Other Arrangements
SaleDuring 2018, the Company’s Board of HIV Protease Inhibitor Royalty Stream
In 2008,Directors approved a share repurchase program (the “2018 Share Repurchase Program”), pursuant to which the Company sold to a third partyrepurchased $500.0 million of its rights to receive royalty payments from GlaxoSmithKline plc, net of royalty amounts to be earned bycommon stock in 2018 and due to a third party, for a one-time cash payment of $160.0 million. These royalty payments relate to net sales of HIV protease inhibitors, which had been developed pursuant to a collaboration agreement between2019. During the six months ended June 30, 2019, the Company repurchased 832,186 shares of its common stock under the share repurchase program for an aggregate of $150.0 million including commissions and GlaxoSmithKline plc.fees. As of SeptemberJune 30, 2017,2019, the Company had $8.0repurchased the entire $500.0 million it was authorized to repurchase of its common stock under the 2018 Share Repurchase Program.
During 2019, the Company’s Board of Directors approved a new share repurchase program (the “2019 Share Repurchase Program”), pursuant to which the Company is authorized to repurchase up to $500.0 million of its common stock between August 1, 2019 and December 31, 2020. The Company expects to fund further repurchases of its common stock through a combination of cash on hand and cash generated by operations.
As of June 30, 2020, there was a total of $164.0 million remaining for repurchases under the 2019 Share Repurchase Program. During the six months ended June 30, 2020, the Company repurchased 1,403,868 shares of its common stock under the 2019 Share Repurchase Program for an aggregate of $300.0 million including commissions and fees. Under the 2019 Share Repurchase Program, the Company is authorized to purchase shares from time to time through open market or privately negotiated transactions. Such purchases are made pursuant to Rule 10b5-1 plans or other means as determined by the Company’s management and in deferred revenues related toaccordance with the one-time cash payment, which it is recognizing over the liferequirements of the collaboration agreement with GlaxoSmithKline plc based on the units-of-revenue method. In addition, the Company continues to recognize royalty revenues equal to the amount of the third-party subroyalty and an offsetting royalty expense for the third-party subroyalty payment.SEC.
N.
K.Income Taxes
The Company is subject to United StatesU.S. federal, state, and foreign income taxes. For the three and ninesix months ended SeptemberJune 30, 2017,2020, the Company recorded a benefit from income taxes of $125.9$12.5 million and $117.6 million, respectively, which included a benefit of $120.2 million and $111.7 million, respectively, related to the Company’s VIEs’ income tax provision. The VIEs’ benefit from income taxes during the the three and nine months ended September 30, 2017 related primarily to the impairment of Parion’s pulmonary ENaC platform and decrease in the fair value of the contingent payments payable by the Company to Parion. The Company has no liability for taxes payable by the Company’s VIEs and the income tax provision and related liability have been allocated to noncontrolling interest. For the three and nine months ended September 30, 2016, the Company recorded a provision for income taxes of $0.5$42.3 million, respectively. For the three and six months ended June 30, 2019, the Company recorded provisions for income taxes of $59.7 million and $24.1$111.2 million, respectively, which includedrespectively. The Company’s effective tax rate for the three and six months ended June 30, 2020 was lower than the U.S. statutory rate primarily due to a discrete tax benefit associated with an intra-entity transfer of intellectual property rights to the United Kingdom in the second quarter of 2020, a discrete tax benefit associated with the write-off of a long-term intercompany receivable in the first quarter of 2020 and excess tax benefits related to stock-based compensation. The Company’s effective tax rate for the three and six months ended June 30, 2019 was lower than the U.S. statutory rate primarily due to excess tax benefits related to stock-based compensation.
VERTEX PHARMACEUTICALS INCORPORATED
Notes to Condensed Consolidated Financial Statements
(unaudited)
In the second quarter of 2020, the Company completed an intra-entity transfer of intellectual property rights to the United Kingdom resulting in a deferred tax benefit of $0.5 million$187.0 million. The Company expects to be able to utilize the deferred tax asset resulting from the intra-entity transfer.
The Company released its valuation allowance on the majority of its net operating losses and other deferred tax assets as of December 31, 2018. Starting in 2019, the Company began recording a provision of $20.1 million, respectively, relatedfor income taxes on its pre-tax income using an effective tax rate approximating statutory rates. Due to the Company’s VIEs’Company's ability to offset its pre-tax income against previously benefited net operating losses and credits, it expects a portion of its tax provision.provision to represent a non-cash expense until its net operating losses and credits have been fully utilized.
The Company maintained a valuation allowance of $205.2 million related primarily to U.S. state and foreign tax attributes as of December 31, 2019. On a periodic basis, the Company reassesses any valuation allowances that it maintains on its deferred tax assets, weighing positive and negative evidence to assess the recoverability of the deferred tax assets.
In March 2020, the Coronavirus Aid, Relief and Economic Security Act (the “CARES Act”) was signed into law. The CARES Act includes provisions relating to several aspects of corporate income taxes. The Company does not currently expect the CARES Act to have a significant impact on its provision for income taxes; however, it will continue to monitor the provisions of the CARES Act in relation to its operations.
The Company has reviewed the tax positions taken, or to be taken, in its tax returns for all tax years currently open to examination by a taxing authority. Unrecognized tax benefits represent the aggregate tax effect of differences between tax return positions and the benefits recognized in the financial statements. As of SeptemberJune 30, 20172020 and December 31, 2016,2019, the Company did not havehad $68.4 million and $33.9 million, respectively, of gross unrecognized tax benefits. The Company recognizes interest and penalties related to income taxes as a component of incomebenefits, which would affect the Company’s tax expense. As of September 30, 2017, no interest and penalties have been accrued.rate if recognized. The Company does not expect that its unrecognized tax benefits will materially increase within the next twelve months. The Company accrues interest and penalties related to unrecognized tax benefits as a component of its provision for income taxes. The Company did not recognize any material interest or penalties related to uncertain tax positions as of September 30, 2017 and December 31, 2016.
The Company continues to maintain a valuation allowance on the majority of its net operating losses and other deferred tax assets because it has a history of cumulative losses. Accordingly, the Company has not reported any tax benefit relating
VERTEX PHARMACEUTICALS INCORPORATED
Notes to Condensed Consolidated Financial Statements
(unaudited)
to the remaining net operating loss carryforwards (NOLs) and income tax credit carryforwards that will be utilized in future periods in these jurisdictions. The Company’s U.S. federal net operating loss carryforwards totaled approximately $4.1 billion as of December 31, 2016. On a quarterly basis, the Company reassesses the valuation allowance on its deferred income tax assets weighing positive and negative evidence to assess the recoverability of the deferred tax assets. Based on the Company’s recent financial performance and its future projections, it could record a reversal of all, or a portion of the valuation allowance associated with U.S. deferred tax assets in future periods. However, any such change is subject to actual performance and other considerations that may present positive or negative evidence at the time of the assessment. The Company’s total deferred tax asset balance subject to the valuation allowance was approximately $1.7 billion at December 31, 2016.
As described in Note A, “Basis of Presentation and Accounting Policies”, the Company adopted amended guidance, during the nine month period ended September 30, 2017. The amended guidance eliminates the requirement that excess tax benefits be realized as a reduction in current taxes payable before the associated tax benefit can be recognized as an increase in additional paid-in capital and requires excess tax benefits and tax deficiencies to be recorded in the condensed consolidated statement of operations when the awards vest or are settled. Amendments related to accounting for excess tax benefits have been adopted prospectively, resulting in a tax benefit of $31.4 million and $62.2 million for the three and ninesix months ended SeptemberJune 30, 2017, respectively. In connection with2020 and 2019.
As of June 30, 2020, foreign earnings, which were not significant, have been retained by foreign subsidiaries for indefinite reinvestment. Upon repatriation of those earnings, in the adoptionform of this new standard,dividends or otherwise, the Company recorded a cumulative-effect adjustment of $410.8 million as of January 1, 2017could be subject to accumulated deficit and deferred tax assets, with an equal offsetting adjustmentwithholding taxes payable to the Company’s valuation allowance. In addition, the Company has recorded $9.4 million related to the impact from adoption of the provisions related to forfeiture rates to accumulated deficit. This change also increased the Company’s deferred tax assets by $3.4 million that is offset by an increase to the valuation allowance in the same amount.
various foreign countries.
The Company files United StatesU.S. federal income tax returns and income tax returns in various state, local and foreign jurisdictions. The Company is no longer subject to any tax assessment from an income tax examination in the United States or any other major taxing jurisdiction for years before 2011, except where the Company has net operating losses or tax credit carryforwards that originate before 2011. The Company currently is under examination byhas various income tax audits ongoing at any time throughout the Canada Revenue Agency for the years ending December 31, 2011 through December 31, 2013.world. No significant adjustments have been reported.reported for any jurisdiction under audit.
At
L.Commitments and Contingencies
Revolving Credit Facility
In September 2019, the Company and certain of its subsidiaries entered into a Credit Agreement (the “2019 Credit Agreement”) with Bank of America, N.A., as administrative agent and the lenders referred to therein. The 2019 Credit Agreement provides for a $500.0 million unsecured revolving facility, which was not drawn upon at closing. Amounts drawn pursuant to the 2019 Credit Agreement, if any, may be used to finance the Company’s working capital needs, and for general corporate or other lawful purposes. The Company had 0 borrowings outstanding under the 2019 Credit Agreement as of June 30, 2017, foreign earnings,2020 and December 31, 2019. The 2019 Credit Agreement also provides that, subject to satisfaction of certain conditions, the Company may request that the borrowing capacity under the 2019 Credit Agreement be increased by an additional $500.0 million. The 2019 Credit Agreement, which were not significant, have been retained indefinitely by foreign subsidiary companies for reinvestment; therefore, no provision has been made for income taxes that would be payable uponmatures on September 17, 2024, superseded the distributionCompany’s credit agreement entered into in 2016 with Bank of such earnings, and it would not be practicable to determine the amount of the related unrecognized deferred income tax liability. Upon repatriation of those earnings,America, N.A serving in the formsame capacity. Additionally, the 2019 Credit Agreement provides a sublimit of dividends or otherwise, the Company would be subject to United States federal income taxes (subject to an adjustment$50.0 million for foreign tax credits) and withholding taxes payable to the various foreign countries.
O. Restructuring Liabilities
Research and Development Restructuring
In February 2017, the Company decided to consolidate its research activities into its Boston, Milton Park and San Diego locations and closed its research site in Canada affecting approximately 70 positions. The Company has incurred aggregate restructuring chargesletters of approximately $12.3 million in the nine months ended September 30, 2017. As of September 30, 2017, the restructuring liability primarily relates to laboratory and office space for the research site in Canada that terminates in October 2018. The Company does not anticipate any significant additional charges related to this restructuring event in the future.
credit.
VERTEX PHARMACEUTICALS INCORPORATED
Notes to Condensed Consolidated Financial Statements
(unaudited)
The restructuring charge and other activities recorded during the the three and nine months ended September 30, 2017 and the related liability balance as of September 30, 2017 were as follows:
|
| | | | | | | |
| | Three Months Ended September 30, | | Nine Months Ended September 30, |
| | 2017 | | 2017 |
| | (in thousands) |
| Liability, beginning of the period | $ | 3,507 |
| | $ | — |
|
| Restructuring (credits) expense | (125 | ) | | 12,315 |
|
| Cash payments | (750 | ) | | (7,869 | ) |
| Asset impairments and other non-cash items | — |
| | (1,814 | ) |
| Liability, end of the period | $ | 2,632 |
| | $ | 2,632 |
|
2003 Kendall Restructuring
In 2003, the Company adopted a plan to restructure its operations to coincide with its increasing internal emphasis on advancing drug candidates through clinical development to commercialization. The restructuring liability relates to specialized laboratory and office space that is leased to the Company pursuant to a 15-year lease that terminates in April 2018. The Company has not used more than 50% of this space since it adopted the plan to restructure its operations in 2003. This unused laboratory and office space currently is subleased to third parties.
The activitiesDirect costs related to the restructuring liability for the three and nine months ended September 30, 2017 and 20162019 Credit Agreement, which were as follows:
|
| | | | | | | | | | | | | | | |
| | Three Months Ended September 30, | | Nine Months Ended September 30, |
| | 2017 | | 2016 | | 2017 | | 2016 |
| | (in thousands) |
| Liability, beginning of the period | $ | 1,990 |
| | $ | 6,388 |
| | $ | 4,328 |
| | $ | 7,944 |
|
| Restructuring expense | 227 |
| | 30 |
| | 1,054 |
| | 222 |
|
| Cash payments | (4,003 | ) | | (5,340 | ) | | (12,962 | ) | | (13,104 | ) |
| Cash received from subleases | 2,732 |
| | 2,866 |
| | 8,526 |
| | 8,882 |
|
| Liability, end of the period | $ | 946 |
| | $ | 3,944 |
| | $ | 946 |
| | $ | 3,944 |
|
Fan Pier Move Restructuring
In connection with the relocation of its Massachusetts operations to Fan Pier in Boston, Massachusetts, which commenced in 2013, the Company is incurring restructuring charges related to its remaining lease obligations at its facilities in Cambridge, Massachusetts. The majority of these restructuring charges were recorded in the third quarter of 2014 upon decommissioning three facilities in Cambridge. During 2015, the Company terminated two of these lease agreements resulting in a credit to restructuring expense equal to the difference between the Company’s estimated future cash flows related to its lease obligations for these facilities and the termination payment paidnot material to the Company’s landlordfinancial statements, were deferred and will be recorded over the term of the 2019 Credit Agreement.
Any amounts borrowed under the 2019 Credit Agreement will bear interest, at the Company’s option, at either a base rate or a Eurocurrency rate, in each case plus an applicable margin. Under the 2019 Credit Agreement, the applicable margins on base rate loans range from 0.125% to 0.50% and the applicable margins on Eurocurrency loans range from 1.125% to 1.50%, in each case based on the effective dateCompany’s consolidated leverage ratio (the ratio of the termination. The third major facility included in this restructuring activity is 120,000 square feet of the Kendall Square Facility that the Company continued to use for its operations following its 2003 Kendall Restructuring. The rentable square footage in this portion of the Kendall Square Facility was subleased to a third party in February 2015. The Company will continue to incur charges through April 2018 related to the difference between the Company’s estimated future cash flows related to this portion of the Kendall Square Facility, which include an estimate for sublease income to be received from the Company’s sublessee and its actual cash flows. The Company discounted the estimated cash flows related to this restructuring activity at a discount rate of 9%.
The activities related to the restructuring liability for the three and nine months ended September 30, 2017 and 2016 were as follows:
VERTEX PHARMACEUTICALS INCORPORATED
Notes to Condensed Consolidated Financial Statements
(unaudited)
|
| | | | | | | | | | | | | | | |
| | Three Months Ended September 30, | | Nine Months Ended September 30, |
| | 2017 | | 2016 | | 2017 | | 2016 |
| | (in thousands) |
| Liability, beginning of the period | $ | 1,521 |
| | $ | 4,863 |
| | $ | 3,626 |
| | $ | 5,964 |
|
| Restructuring expense | 235 |
| | 90 |
| | 490 |
| | 472 |
|
| Cash payments | (3,262 | ) | | (4,199 | ) | | (10,578 | ) | | (10,451 | ) |
| Cash received from subleases | 2,279 |
| | 2,539 |
| | 7,235 |
| | 7,308 |
|
| Liability, end of the period | $ | 773 |
| | $ | 3,293 |
| | $ | 773 |
| | $ | 3,293 |
|
Other Restructuring Activities
The Company has engaged in several other restructuring activities that are unrelated to its Research and Development Restructuring, 2003 Kendall Restructuring and Fan Pier Move Restructuring. The most significant activity commenced in October 2013 when the Company adopted a restructuring plan that included (i) a workforce reduction primarily related to the commercial support of INCIVEK following the continued and rapid decline in the number of patients being treated with INCIVEK as new medicines for the treatment of HCV infection neared approval and (ii) the write-off of certain assets. This action resulted from the Company’s decision to focus its investment on future opportunities in CF and other research and development programs.
The remaining restructuring activities were completed in 2016. As such, there was no outstanding liability as of September 30, 2017. The activities relatedtotal consolidated funded indebtedness to the Company’s other restructuring liabilitiesconsolidated EBITDA for the threemost recently completed four fiscal quarter period).
Any amounts borrowed pursuant to the 2019 Credit Agreement are guaranteed by certain of the Company’s existing and nine months ended Septemberfuture domestic subsidiaries, subject to certain exceptions.
The 2019 Credit Agreement contains customary representations and warranties and affirmative and negative covenants, including financial covenants to maintain (i) subject to certain limited exceptions, a consolidated leverage ratio of 3.50 to 1.00, subject to an increase to 4.00 to 1.00 following a material acquisition and (ii) a consolidated interest coverage ratio (the ratio of the Company’s consolidated EBITDA to its consolidated interest expenses for the most recently completed four fiscal quarter period) of 2.50 to 1.00, in each case measured on a quarterly basis. The 2019 Credit Agreement also contains customary events of default. In the case of a continuing event of default, the administrative agent would be entitled to exercise various remedies, including the acceleration of amounts due under outstanding loans. As of June 30, 2016 were as follows:
|
| | | | | | | |
| | Three Months Ended September 30, | | Nine Months Ended September 30, |
| | 2016 | | 2016 |
| | (in thousands) |
| Liability, beginning of the period | $ | 1,233 |
| | $ | 1,450 |
|
| Restructuring expense | (112 | ) | | 344 |
|
| Cash payments | (1,121 | ) | | (1,794 | ) |
| Liability, end of the period | $ | — |
| | $ | — |
|
P. Commitments and Contingencies2020, the Company was in compliance with the covenants described above.
Guaranties and Indemnifications
As permitted under Massachusetts law, the Company’s Articles of Organization and By-laws provide that the Company will indemnify certain of its officers and directors for certain claims asserted against them in connection with their service as an officer or director. The maximum potential amount of future payments that the Company could be required to make under these indemnification provisions is unlimited. However, the Company has purchased directors’ and officers’ liability insurance policies that could reduce its monetary exposure and enable it to recover a portion of any future amounts paid. NoNaN indemnification claims currently are outstanding, and the Company believes the estimated fair value of these indemnification arrangements is minimal.
The Company customarily agrees in the ordinary course of its business to indemnification provisions in agreements with clinical trial investigators and sites in its drug development programs, sponsored research agreements with academic and not-for-profit institutions, various comparable agreements involving parties performing services for the Company and its real estate leases. The Company also customarily agrees to certain indemnification provisions in its drug discovery, development and commercialization collaboration agreements. With respect to the Company’s clinical trials and sponsored research agreements, these indemnification provisions typically apply to any claim asserted against the investigator or the investigator’s institution relating to personal injury or property damage, violations of law or certain breaches of the Company’s contractual obligations arising out of the research or clinical testing of the Company’s compounds or drug candidates. With respect to lease agreements, the indemnification provisions typically apply to claims asserted against the landlord relating to personal injury or property damage caused by the Company, to violations of law by the Company or to certain breaches of the Company’s contractual obligations. The indemnification provisions appearing in the Company’s collaboration agreements are similar to those for the other agreements discussed above, but in addition provide some limited indemnification for its collaborator in the event of third-party claims alleging infringement of intellectual property rights. In each of the cases above, the indemnification obligation generally survives the termination of the agreement for some extended period, although the Company believes the obligation typically has the most relevance during the contract term and for a short period of time thereafter. The maximum potential amount of future payments that the Company could be required to make under these provisions is generally unlimited. The Company has purchased insurance policies covering personal injury, property damage and general liability that reduce its exposure for indemnification and would enable it in many cases to recover all or a portion of any future amounts paid. The Company has never paid any material amounts to defend lawsuits or settle claims related to these indemnification provisions. Accordingly, the Company believes the estimated fair value of these indemnification arrangements is minimal.
VERTEX PHARMACEUTICALS INCORPORATED
Notes to Condensed Consolidated Financial Statements
(unaudited)
Other Contingencies
The Company has certain contingent liabilities that arise in the ordinary course of its business activities. The Company accrues a reserve for contingent liabilities when it is probable that future expenditures will be made, and such expenditures can be reasonably estimated. There were no0 material contingent liabilities accrued as of SeptemberJune 30, 20172020 or December 31, 2016.2019.
M.Additional Cash Flow Information
The cash, cash equivalents and restricted cash at the beginning and ending of each period presented in the Company’s condensed consolidated statements of cash flows consisted of the following:
| | | | | | | | | | | | | | | | | | | | | | | |
| Six Months Ended June 30, | | | | | | |
| 2020 | | | | 2019 | | |
| Beginning of period | | End of period | | Beginning of period | | End of period |
| (in thousands) | | | | | | |
| Cash and cash equivalents | $ | 3,109,322 | | | $ | 4,831,332 | | | $ | 2,650,134 | | | $ | 3,294,684 | |
| Prepaid expenses and other current assets | 8,004 | | | 4,368 | | | 4,910 | | | 6,962 | |
| Other assets | 3,355 | | | — | | | 3,209 | | | — | |
| Cash, cash equivalents and restricted cash per statement of cash flows | $ | 3,120,681 | | | $ | 4,835,700 | | | $ | 2,658,253 | | | $ | 3,301,646 | |
Item 2. Management’s Discussion and Analysis of Financial Condition and Results of Operations
OVERVIEW
We areinvest in the business of discovering, developing, manufacturing and commercializing medicines for serious diseases. We use precision medicine approaches with the goal of creatingscientific innovation to create transformative medicines for patients inpeople with serious diseases with a focus on specialty markets. Our business isWe have four approved medicines to treat cystic fibrosis, or CF, a life-threatening genetic disease, and are focused on developingexpanding the number of CF patients eligible for our medicines. We are broadening our pipeline into additional disease areas through internal research efforts and commercializing therapiesaccessing external innovation through business development transactions.
In October 2019, TRIKAFTA (elexacaftor/tezacaftor/ivacaftor and ivacaftor), our triple-combination regimen, was approved by the U.S. Food and Drug Administration, or FDA, for the treatment of cystic fibrosis, or CF, and advancing our research and development programs in other indications. Our two marketed products are ORKAMBI (lumacaftor in combination with ivacaftor) and KALYDECO (ivacaftor) and we are currently seeking approval for tezacaftor in combination with ivacaftor, which is a two-drug combination regimen for patients with CF. We currently are evaluating multiple triple combination regimens that include next-generation CFTR corrector compounds in patients with CF in Phase 2 clinical trials12 years of age and plan to initiate pivotal development ofolder who have at least one or two triple-combination regimensF508del mutation in the first halfcystic fibrosis transmembrane conductance regulator, or CFTR, gene. Approval of 2018.
Cystic Fibrosis
ORKAMBITRIKAFTA in the U.S. increased the number of CF patients eligible for our medicines by approximately 6,000 and KALYDECOprovided an additional treatment option for many patients who are collectivelyalso eligible for one of our previously approved products. Collectively, our medicines are currently approved to treat approximately 40%60% of the 75,000 CF patients in North America, Europe and Australia. ORKAMBI is approved as a treatmentWe are seeking approval from the European Commission for approximately 25,000 patients who have two copies of the F508del mutation, or F508del homozygous, in their cystic fibrosis transmembrane conductance regulator, or CFTR, gene. KALYDECO is approvedour triple combination regimen for the treatment of approximately 6,000 CF patients who have the G551D mutation or other specified mutations in their CFTR gene. Our goal is to develop treatment regimens that will provide benefits to as many patients with CF as possible and will enhance the benefits that currently are being provided to patients taking our medicines.
If tezacaftor in combination with ivacaftor is approved, we expect that it would provide an additional treatment option primarily to CF patients who are currently eligible for either ORKAMBI or KALYDECO. If we are able to successfully develop a triple combination regimen that includes a next-generation CFTR corrector compound, including VX-440, VX-152, VX-659 or VX-445, we believe such regimen could potentially provide benefit to all CF patients who have at least one F508del mutation in their CFTR gene (approximately 90% of all CF patients). This would include (i) the first treatment option that treats the underlying cause of CF for patients who have one copy of the F508del mutation in their CFTR gene and a second mutation in their CFTR gene that results in minimal CFTR function, or F508del/Min patients, and (ii) an additional treatment option to CF patients who are eligible for either ORKAMBI, KALYDECO or, if approved, tezacaftor in combination with ivacaftor.
ORKAMBI
In October 2017, we obtained results from a 2-part open-label Phase 3 clinical trial of ORKAMBI in 60 patients with CF two to five12 years of age who have two copies of the F508del mutationand older with specific mutations in their CFTR gene. The clinical trial met its primary endpointIf our triple combination is approved by the European Commission, up to 10,000 patients will be newly eligible for our medicines. We are evaluating our triple combination in younger patients with the goal of safety, showing ORKAMBI was generally well toleratedhaving small molecule treatments for up to 90% of patients with CF. We are also pursuing genetic therapies to address the remaining 10% of CF patients.
Beyond CF, our small molecule programs include programs focused on developing treatments for alpha-1 antitrypsin, or AAT, deficiency, APOL1-mediated kidney diseases, and that there were no new safety concerns compared to priorpain. We are evaluating CTX001, a genetic therapy, as a potential treatment for sickle cell disease, or SCD, and transfusion-dependent beta thalassemia, or TDT, in Phase 1/2 clinical trials in collaboration with CRISPR Therapeutics AG, or CRISPR. In 2019, through a series of ORKAMBIstrategic transactions, we acquired preclinical programs to develop cell-based therapies for type 1 diabetes, or T1D, and preclinical genetic therapy programs for Duchenne muscular dystrophy, or DMD, and myotonic dystrophy type 1, or DM1.
Financial Highlights
Revenues
In the second quarter of 2020, our net product revenues continued to increase due to the approval of TRIKAFTA in late 2019 and uptake of our medicines in ex-U.S. markets following completion of reimbursement agreements in 2019.
Expenses
Our combined R&D and SG&A expenses increased to $612.7 million in the second quarter of 2020 from $535.6 million in the second quarter of 2019. In the second quarter of 2020, cost of sales was 12% of our net product revenues.
Business Updates
Cystic Fibrosis
TRIKAFTA/KAFTRIO (elexacaftor in combination with tezacaftor and ivacaftor)
•In the U.S., most of the approximately 18,000 eligible patients six through eleven12 years of age. Secondary endpoints showed decreasesage and older have initiated treatment with TRIKAFTA following its approval in October 2019.
•In June 2020, the sweat chloride and improvementsEuropean Medicines Agency’s Committee for Medicinal Products for Human Use, or CHMP, adopted a positive opinion for our triple combination, which we intend to market as KAFTRIO in nutritional status as measured by change in weight (weight-for-age z score) and body mass index (BMI-for-age z score). BasedEurope if approved. This opinion was based on these results, we expect to submit a New Drug Application, or NDA, to the U.S. Food and Drug Administration, or FDA, and a Marketing Authorization Application, or MAA, line extensionwe submitted to the European Medicines Agency, or EMA, in 2019 and is for the first quartertreatment of 2018.patients with CF 12 years of age and older with one F508del mutation and one minimal function mutation or two F508del mutations. The CHMP’s positive opinion will be reviewed by the European Commission, which has the authority to approve the MAA.
KALYDECO•In June 2020, we expanded our reimbursement agreement with the National Health Service, or NHS, England to include KAFTRIO, subject to approval of the medicine. If approved, KAFTRIO will be available to patients with CF in England 12 years of age and older with one F508del mutation and one minimal function mutation or two F508del mutations.
We are evaluating KALYDECO in a•In July 2020, we announced positive Phase 3 clinical trial results for TRIKAFTA in patients with CF two12 years and older who have one copy of agethe F508del mutation and younger with one of 10 gating and R117H mutations. Theor residual function mutation. In the U.S., this clinical trial will evaluate the safety of KALYDECO in this age group. We have completed enrollment in patients aged 12 to 24 months.
Tezacaftor in combination with ivacaftor
In the first quarter of 2017, we obtained positive results from two Phase 3 clinical trials of tezacaftor,was a corrector compound, in combination with ivacaftor. The clinical trials demonstrated that the tezacaftor/ivacaftor combination provided statistically significant improvements in lung function (percent predicted forced expiratory volume in one second, or ppFEV1)post-marketing commitment and TRIKAFTA is already approved for use in patients with CF 12 years of age and older who have certain mutationsat least one copy of the F508del mutation, which includes the populations evaluated in their CFTR gene.this clinical trial. The 24-week EVOLVEdata from this clinical trial evaluated tezacaftor in combination with ivacaftor in F508del homozygous patients with CF. Thiswill be submitted to the EMA to support a potential indication expansion of the European Union, or EU, label, after initial approval has been granted for our triple combination.
•Data from our Phase 3 clinical trial met its primary endpoint with a mean absolute improvementevaluating the use of our triple combination regimen in ppFEV1 through 24 weekschildren 6 to 11 years of 4.0 percentage points from baseline compared to placebo (p < 0.0001). The second clinical trial, EXPAND, was an 8-week crossover clinical trial that evaluated the combination treatment in patientsage with CF who have two copies of the F508del mutation or who have one F508delmutation that results in residual CFTR function and one F508del mutation. Thisminimal function mutation is expected in the second half of 2020. If the data from this clinical trial met the primary endpoints of absolute change in ppFEV1 from baselineis positive, we plan to the average of the Week
4 and Week 8 measurements, with the tezacaftor/ivacaftor combination treatment demonstratingsubmit a mean absolute improvement of 6.8 percentage points compared to placebo (p < 0.0001) and the ivacaftor monotherapy group demonstrating a mean absolute improvement of 4.7 percentage points compared to placebo (p < 0.0001). Across both clinical trials, the tezacaftor/ivacaftor combination treatment was generally well tolerated.
Based on these results, we submitted a NDAsupplemental New Drug Application, or sNDA, to the FDA and an MAAin the fourth quarter of 2020 for children 6 to the EMA for tezacaftor11 years of age with at least one F508del mutation, followed by regulatory submissions in other countries.
SYMDEKO/SYMKEVI (tezacaftor in combination with ivacaftorivacaftor)
•The EMA review of the application for use of SYMKEVI in children 6 through 11 years of age in Europe is ongoing. If approved, this will be the first CFTR modulator to treat patients 6 through 11 years of age with residual function mutations in the EU.
KALYDECO (ivacaftor)
•In June 2020, the European Commission granted approval of the label extension for KALYDECO for treatment in patients with CF 12 yearssix months of age and older who are F508del homozygous or who have one copythe R117H mutation.
Pipeline
Beta Thalassemia and Sickle Cell Disease
•In June 2020, we and our collaborator, CRISPR, provided new clinical data at the European Hematology Association Congress from the two ongoing Phase 1/2 clinical trials of the F508del mutationinvestigational CRISPR/Cas9 gene-editing therapy CTX001 in their CFTR genepatients with TDT and in patients with severe SCD. Data from two TDT patients demonstrated clinical proof-of-concept for CTX001 in this disease. Longer duration data from one SCD patient showed a second mutationdurable effect on HbF levels and the patient was free of vaso-occlusive crises. Screening, enrollment and mobilization of these trials is ongoing; conditioning and dosing in their CFTR gene that results in residual CFTR function. The FDA has granted us priority reviewboth trials have been resumed following temporary pauses related to the spread of the NDAnovel coronavirus, or COVID-19. We and the target date for the FDACRISPR expect to complete its review of the NDA under the Prescription Drug User Fee Act, or PDUFA, is February 28, 2018. We expect the EMA to complete its reviewreport data from additional patients in the second half of 2018.2020.
In October 2017, we announced top-line results from
Alpha-1 Antitrypsin Deficiency
•We are evaluating multiple compounds with the potential to correct the misfolding of Z-AAT protein in the liver in order to increase the levels of functional AAT in the blood. Misfolded Z-AAT protein is the root cause of AAT deficiency.
•Enrollment and dosing have been re-initiated at some but not all sites following a temporary COVID-19-related pause in a Phase 3, randomized, double-blind, parallel group,2 proof-of-concept clinical trial designed to evaluate the levels of circulating, functional AAT protein after treatment with VX-814. We expect data from this clinical trial at the end of 2020 or in the first quarter of 2021.
•In July 2020, we initiated a Phase 2 proof-of-concept clinical trial for a second Z-AAT corrector, VX-864.
APOL1-Mediated Kidney Diseases
•We are evaluating inhibitors of APOL1 function to reduce proteinuria in people with serious kidney disease, including focal segmental glomerulosclerosis, or FSGS.
•Enrollment is underway at multiple clinical trial sites in a Phase 2 proof-of-concept clinical trial designed to evaluate the combinationreduction of tezacaftor and ivacaftorproteinuria in people with APOL1-mediated FSGS after treatment with VX-147.
Type 1 Diabetes
•We are developing a cell therapy designed to replace insulin-producing islet cells in patients with CF 12 yearsT1D. Two opportunities exist for the transplant of agethese functional islets into patients: transplantation of islet cells alone, using immunosuppression to protect the implanted cells, and older who were already receiving ivacaftor monotherapy with one copyimplantation of the F508delmutation and one copy ofislet cells inside a gating mutation. The clinical trial enrolled 151 patients with CF. The clinical trial did not meet its primary endpoint of absolute change in ppFEV1 from baseline through 8 weeks. For those receiving the combination of tezacaftor and ivacaftor, ppFEV1 improved by 0.5 percentage points comparednovel immunoprotective device.
•We plan to 0.2 percentage points in those receiving placebo in addition to ivacaftor (p=0.5846). Safety data from the clinical trial showed that the combination of tezacaftor and ivacaftor was generally well tolerated and were consistent with prior Phase 3 clinical trials of the tezacaftor/ivacaftor combination. Secondary endpoints were changes in sweat chloride and change in CFQ-R. Sweat chloride decreased by 5.8 mmol/L in those who received tezacaftor in combination with ivacaftor as compared to those who received placebo in addition to ivacaftor (p=0.0216). There was no change in CFQ-R in the combination group comparedsubmit an IND application to the ivacaftor monotherapy group. Based on these results, we do not planFDA for the first program (transplantation of islet cells alone) in late 2020 to seek regulatory approval for tezacaftor in combination with ivacaftor for these patients, the vast majoritysupport evaluation of whom are eligible for KALYDECO monotherapy.
Next-generation CFTR corrector compounds
In July 2017, we obtained positive results from Phase 1 and Phase 2 clinical trials of three different triple combination regimensthis potential therapy in patients with CF who have one copyT1D.
COVID-19
We continue to monitor the impacts of the F508del mutation in their CFTR gene and a second mutation that results in minimal CFTR function. Initial data from the Phase 2 clinical trials showed mean absolute improvements in ppFEV1 of 9.7 and 12.0 percentage points for VX-152 (200mg q12h) and VX-440 (600mg q12h), respectively, in triple combination with tezacaftor and ivacaftor. Initial data from the Phase 1 clinical trial showed mean absolute improvement in ppFEV1 of 9.6 percentage points for VX-659 in triple combination with tezacaftor and ivacaftor. We amended our ongoing Phase 2 clinical trials of VX-445 and VX-659 to include additional cohorts of patients to evaluate these next-generation CFTR corrector compounds as part of a potential once-daily combination with tezacaftor and VX-561 (formerly CTP-656), the latter of which we acquired from Concert Pharmaceuticals, Inc., or Concert, in the third quarter of 2017. We expect to report additional dataCOVID-19 on our next-generation corrector programbusiness. COVID-19 has not affected our supply chain or the demand for our medicines, and we believe that we will be able to continue to supply all of our approved medicines to our patients globally. We have adjusted our business operations in early 2018. Pending data from theseresponse to COVID-19 with a majority of our employees continuing to work remotely. In addition, we have re-initiated enrollment and dosing in all of our ongoing clinical trials and discussions with regulatory agencies, we plan to initiate pivotal development of one or two triple combination regimens in the first half of 2018.
ENaC Inhibition
VX-371 is an investigational epithelial sodium channel, or ENaC, inhibitor, that we exclusively licensed from Parion Sciences, Inc., or Parion, in 2015. In October 2017, we announced the results of a Phase 2 28-day clinical trial evaluating VX-371 + hypertonic saline versus hypertonic saline alone in 142 patients with CF 12 years of age and older who are homozygous for the F508del mutation and were already receiving ORKAMBI and continued to receive ORKAMBI throughout the clinical trial. The clinical trial did not meet its primary efficacy endpoint. In patients being treated with ORKAMBI, the addition of hypertonic saline resulted in a decrease of 0.1 percentage points ppFEV1 at day 28. In patients being treated with ORKAMBI, the addition of VX-371 + hypertonic saline resulted in an increase of 0.1 percentage points ppFEV1 at day 28. Safety data from the clinical trial showed that the addition of VX-371, with or without hypertonic saline, was generally well tolerated in patients already receiving ORKAMBI, and the safety profile was consistent with that observed in priorinitiated new clinical trials of VX-371 monotherapy. Based on the results of this clinical trial, we recognized an impairment charge relateddespite some temporary pauses to Parion’s pulmonary ENaC platform in third quarter of 2017enrollment and deconsolidated Parion as a VIE, effective September 30, 2017.
A Phase 2 clinical trial of VX-371 monotherapy in patients with primary ciliary dyskinesia (PCD) is ongoing.
dosing caused by COVID-19.
Research and Development
We are engaged in a number of other research and mid- and early-stage development programs, including VX-150 for pain and VX-210 for acute spinal cord injury. We have also entered into third-party collaborations, pursuantcontinue to which we are engaged in the discovery and development of nucleic acid-based therapies for a variety of diseases, including CF. We plan to continue investinginvest in our research programs and fosteringfoster scientific innovation in order to identify and develop transformative medicines. Our current research programs include programs targeting cystic fibrosis, adrenoleukodystrophy, alpha-1 antritrypsin deficiency, sickle cellstrategy is to combine transformative advances in the understanding of human disease and polycystic kidney disease.the science of therapeutics in order to identify and develop new medicines. We believe that pursuing research in diverse areas allows us to balance the risks inherent in drug development and may provide drug candidates that will form our pipeline in future years. To supplement our internal research programs, we acquire technologies and programs and collaborate with biopharmaceutical and technology companies, leading academic research institutions, government laboratories, foundations and other organizations, as needed, to advance research in our areas of therapeutic interest and to access technologies needed to execute on our strategy.
Drug Discovery and Development
Discovery and development of a new pharmaceutical product is a difficult and lengthy process that requires significant financial resources along with extensive technical and regulatory expertise and can take 10 to 15 years or more.expertise. Potential drug candidates are subjected to rigorous evaluations, driven in part by stringent regulatory considerations, designed to generate information concerning efficacy, side-effects,side effects, proper dosage levels and a variety of other physical and chemical characteristics that are important in determining whether a drug candidate should be approved for marketing as a pharmaceutical product. Most chemical compounds that are investigated as potential drug candidates never progress into development, and most drug candidates that do advance into development never receive marketing approval. Because our investments in drug candidates are subject to considerable risks, we closely monitor the results of our discovery, research, clinical trials and nonclinical studies and frequently evaluate our drug development programs in light of new data and scientific, business and commercial insights,
with the objective of balancing risk and potential. This process can result in abrupt changes in focus and priorities as new information becomes available and as we gain additional understanding of our ongoing programs and potential new programs, as well as those of our competitors.
If we believe that data from a completed registration program support approval of a drug candidate, we submit an NDA to the FDA requesting approval to market the drug candidate in the United States and seek analogous approvals from comparable regulatory authorities in foreign jurisdictions.jurisdictions outside the United States. To obtain approval, we must, among other things, demonstrate with evidence gathered in nonclinical studies and well-controlled clinical trials that the drug candidate is safe and effective for the disease it is intended to treat and that the manufacturing facilities, processes and controls for the manufacture of the drug candidate are adequate. The FDA and foreignex-U.S. regulatory authorities have substantial discretion in deciding whether or not a drug candidate should be granted approval based on the benefits and risks of the drug candidate in the treatment of a particular disease, and could delay, limit or deny regulatory approval. If regulatory delays are significant or regulatory approval is limited or denied altogether, our financial results and the commercial prospects for the drug candidate involved will be harmed.
Collaboration Arrangements
We have entered into collaborations with biotechnology and pharmaceutical companies in order to acquire rights or to license drug candidates or technologies that enhance our pipeline and/or our research capabilities. Over the last several years, we entered into collaboration agreements with:
CRISPR Therapeutics AG, or CRISPR, pursuant to which we are collaborating on the discovery and development of potential new treatments aimed at the underlying genetic causes of human diseases using CRISPR-Cas9 gene editing technology;
Parion, pursuant to which we are developing ENaC inhibitors for the treatment of pulmonary diseases;
Moderna Therapeutics, Inc., or Moderna, pursuant to which we are seeking to identify and develop mRNA therapeutics for the treatment of CF; and
BioAxone Biosciences, Inc., or BioAxone, pursuant to which we are evaluating VX-210 as a potential treatment for patients who have spinal cord injuries.
Generally, when we in-license a technology or drug candidate, we make upfront payments to the collaborator, assume the costs of the program and agree to make contingent payments, which could consist of milestone, royalty and option payments. Depending on many factors, including the structure of the collaboration, the significance of the drug candidate that we license to the collaborator’s operations and the other activities in which our collaborators are engaged, the accounting for these transactions can vary significantly. For example, the upfront payments and expenses incurred in connection with our CRISPR and Moderna collaborations are being expensed as research expenses because (i) the collaboration represents a small portion of the overall business of these collaborators and (ii) the licenses associated with these collaborations do not represent a business pursuant to the consolidation accounting guidance. CRISPR’s and Moderna’s activities unrelated to our collaborations have no effect on our consolidated financial statements. Parion and BioAxone have historically been accounted for as variable interest entities, or VIEs, that were included in our consolidated financial statements due to (i) the significance
of the respective licensed programs to Parion and BioAxone as a whole, (ii) our power to control the significant activities under each collaboration and (iii) our obligation to absorb losses and right to receive benefits that potentially could be significant. As of September 30, 2017, we determined that the above conditions were no longer satisfied with respect to Parion following a determination that the fair value of the ENaC inhibitors licensed from Parion had declined significantly based on the results of a Phase 2 clinical trial of VX-371 that did not meet its primary efficacy endpoint. As a result, we no longer account for Parion as a VIE and have deconsolidated Parion from our consolidated financial statements as of September 30, 2017. BioAxone continues to be accounted for as a VIE and remains included in our consolidated financial statements as of September 30, 2017.
Collaborators we account for as a VIE may engage in activities unrelated to our collaboration. The revenues and expenses unrelated to the programs we in-license from our VIEs have historically been immaterial to our consolidated financial statements. With respect to each of Parion, prior to its deconsolidation as of September 30, 2017, and BioAxone, the activities unrelated to our collaboration have represented approximately 2% of our total revenues and total expenses on an annual basis. As a result of the deconsolidation of Parion, we expect these amounts to decrease in future periods. For any consolidated VIEs, we evaluate the fair value of the contingent payments payable by us on a quarterly basis. Changes in the fair value of these contingent future payments affect net income attributable to Vertex on a dollar-for-dollar basis, with increases in the fair value of contingent payments payable by us to a VIE resulting in a decrease in net income attributable to Vertex (or an increase in net loss attributable to Vertex) and decreases in the fair value of contingent payments payable by us to a VIE resulting in an increase in net income attributable to Vertex (or decrease in net loss attributable to Vertex).
We also out-licensed internally developed programs to collaborators who are leading the development of these programs. These outlicense arrangements include our collaboration agreements with:
Merck KGaA, which is advancing four oncology research and development programs; and
Janssen Pharmaceuticals, Inc., which is developing JNJ-3872 (formerly VX-787) for the treatment of influenza.
Pursuant to these out-licensing arrangements, our collaborators are responsible for the research, development and commercialization costs associated with these programs and we are entitled to receive contingent milestone and/or royalty payments. As a result, we do not expect to incur significant expenses in connection with these programs and have the potential for future collaborative and/or royalty revenues resulting from these programs.
Regulatory Compliance
Our marketing of pharmaceutical products is subject to extensive and complex laws and regulations. We have a corporate compliance program designed to actively identify, prevent and mitigate risk through the implementation of compliance policies and systems and through the promotion of a culture of compliance. Among other laws, regulations and standards, we are subject to various U.S. federal and state laws, and comparable foreign laws in other jurisdictions, pertaining to health care fraud and abuse, including anti-kickback and false claims statutes,laws, and laws prohibiting the promotion of drugs for unapproved or off-label uses. Anti-kickback laws generally make it illegal for a prescription drug manufacturer to knowingly and willfully solicit, offer, receive or pay any remuneration in return for or to induce the referral of business, including the purchase or prescription of a particular drug.drug that is reimbursed by a state or federal health care program. False claims laws prohibit anyone from knowingly or willfully presenting for payment to third-party payors, including Medicare and Medicaid, claims for reimbursed drugs or services that are false or fraudulent, claims for items or services not provided as claimed, or claims for medically unnecessary items or services. We are subject to laws and regulations that regulate the sales and marketing practices of pharmaceutical manufacturers, as well as laws such as the U.S. Foreign Corrupt Practices Act, which govern our international business practices with respect to payments to government officials. In addition, we are subject to various data protection and privacy laws and regulations in the U.S., E.U., U.K., Canada, Australia and other jurisdictions. We expect to continue to devote substantial resources to maintain, administer and expand these compliance programs globally.
Reimbursement
Sales of our products depend, to a large degree, on the extent to which our products are coveredreimbursed by third-party payors, such as government health programs, commercial insurance and managed health care organizations. We dedicate substantial management and other resources in order to obtain and maintain appropriate levels of reimbursement for our products from third-party payors, including governmental organizations in the United StatesU.S. and ex-U.S. markets.
In the United States,U.S., we have worked successfully with third party payors in order to promptly obtain appropriate levels of reimbursement for our CF medicines. We plan to continue to engage in discussions with numerous commercial insurers and managed health care organizations, along with government health programs that are typically managed by authorities in the individual states. states, to ensure that payors recognize the significant benefits that our medicines provide by treating the underlying cause of CF and continue to provide access to our medicines.
In Europe and other ex-U.S. markets, we are working to obtainseek government reimbursement for ORKAMBIour medicines on a country-by-country basis, becausebasis. This is necessary for each new medicine, as well as label expansions for our current medicines in many foreign countries patients are unable to access prescription pharmaceutical products that are not reimbursed by their governments. To date, we have reached a pricing andmost countries. We successfully obtained reimbursement agreementfor KALYDECO in each significant ex-U.S. market within two years of approval, but experienced significant challenges in obtaining reimbursement for ORKAMBI with several European countries, including Germany, Ireland and Italy, and remain in negotiations with several others. Consistent with our experience with KALYDECO when it was first approved, we expectcertain ex-U.S. markets. With the completion of reimbursement discussions in England and France in 2019, we have reimbursement for ORKAMBI or SYMKEVI in most of our significant ex-U.S. markets. In addition, in several ex-U.S. markets, may takeincluding England, Ireland, Denmark and Australia, our reimbursement agreements include innovative arrangements that provide a pathway to access and rapid reimbursement for certain future CF medicines. For example, our existing reimbursement agreements in England and Ireland have been expanded to include our triple combination regimen pending approval by the European Commission. We expect to continue to focus significant period of time.
resources to obtain appropriate reimbursement for our products in ex-U.S. markets.
Strategic Transactions
Recent TransactionAcquisitions
Concert PharmaceuticalsAs part of our business strategy, we seek to acquire drugs, drug candidates and other technologies and businesses that have the potential to complement our ongoing research and development efforts. In 2019, we invested significantly in business development transactions designed to augment our pipeline, including the acquisition of Semma Therapeutics, Inc., or Semma, a privately-held company focused on the use of stem cell-derived human islets as a potentially curative treatment for T1D, and Exonics Therapeutics, Inc., or Exonics, a privately-held company focused on creating transformative gene-editing therapies to repair mutations that cause DMD and other severe neuromuscular diseases, including DM1. In the Semma acquisition, we paid approximately $950.0 million in cash to Semma equity holders. In the Exonics acquisition, we paid approximately $245.0 million upfront to Exonics equity holders and agreed to additional payments based upon successful achievement of specified development and regulatory milestones. We expect to continue to identify and evaluate potential acquisitions that may be similar to or different from the transactions that we have engaged in previously.
In July 2017,Both of our 2019 acquisitions were accounted for as business combinations. As of the acquisition date for each transaction, the cash payments, as well as the fair value of contingent consideration for Exonics, were allocated primarily to goodwill and the fair value of several in-process research and development assets that we acquired certain CFacquired. The fair value of contingent consideration related to Exonics was recorded as a liability and will be adjusted on a quarterly basis in the future. As a result, these acquisitions are primarily reflected in additional assets and liabilities on our condensed consolidated balance sheet. Please refer to Note C, “Acquisitions,” and our critical accounting policies, “Acquisitions,” in our 2019 Annual Report on Form 10-K for further information regarding the significant judgments and estimates related to our 2019 acquisitions.
Collaboration and Licensing Arrangements
We enter into arrangements with third parties, including VX-561,collaboration and licensing arrangements, for the development, manufacture and commercialization of drugs, drug candidates and other technologies that have the potential to complement our ongoing research and development efforts. We expect to continue to identify and evaluate collaboration and licensing opportunities that may be similar to or different from Concert, pursuantthe collaborations and licenses that we have engaged in previously.
In-License Agreements
We have entered into collaborations with biotechnology and pharmaceutical companies in order to an agreementacquire rights or to license drug candidates or technologies that enhance our pipeline and/or our research capabilities. Over the last several years, we entered into collaboration agreements with a number of companies, including Affinia Therapeutics Inc., Arbor Biotechnologies, Inc., CRISPR, Kymera Therapeutics, Inc. and Molecular Templates, Inc. Generally, when we in-license a technology or drug candidate, we make upfront payments to the collaborator, assume the costs of the program and/or agree to make contingent payments, which could consist of milestone, royalty and option payments. Most of these collaboration payments are expensed as research and development expenses; however, depending on many factors, including the structure of the collaboration, the significance of the in-licensed drug candidate to the collaborator’s operations and the other activities in Marchwhich our collaborators are engaged, the accounting for these transactions can vary significantly. In the first half of 2020 and 2019, our research and development expenses included $63.3 million and $57.6 million, respectively, related to upfront and milestones payments pursuant to our collaboration agreements.
Out-License Agreements
We also have out-licensed internally developed programs to collaborators who are leading the development of these programs. These out-license arrangements include our agreements with Janssen Pharmaceuticals, Inc., or Janssen, which is evaluating pimodivir in Phase 3 clinical trials for the treatment of influenza; and Merck KGaA, Darmstadt, Germany, which licensed oncology research and development programs from us in early 2017. VX-561 is an investigational CFTR potentiator that has the potential to be used as part of future once-daily combination regimens of CFTR modulators that treat the underlying cause of CF. Pursuant to these out-licensing arrangements, our collaborators are responsible for the agreement, in the third quarter of 2017, we paid Concert $160.0 million in cash for all worldwideresearch, development and commercialization rightscosts associated with these programs, and we are entitled to VX-561. If VX-561 is approved as part ofreceive contingent milestone and/or royalty payments. As a combination regimenresult, we do not expect to treat CF, Concert could receive up to an additional $90.0 million in milestones based on regulatory approval in the U.S. and reimbursement in the UK, Germany or France. In the third quarter of 2017, we recorded the $160.0 million payment as a research and development expense.
incur
significant expenses in connection with these programs and have the potential for future collaborative and royalty revenues resulting from these programs.
Please refer to Note C, “Collaborative Arrangements,” for further information regarding our in-license agreements and out-license agreements.
Strategic Investments
In connection with our business development activities, we have periodically made equity investments in our collaborators. As of June 30, 2020, we held strategic equity investments in public companies, including CRISPR, and certain private companies, and we plan to make additional strategic equity investments in the future. While we invest the majority of our cash, cash equivalents and marketable securities in instruments that meet specific credit quality standards and limit our exposure to any one issue or type of instrument, our strategic investments are maintained and managed separately from our other cash, cash equivalents and marketable securities. Any changes in the fair value of equity investments with readily determinable fair values (including publicly traded securities such as CRISPR) are recorded to other income (expense), net in our condensed consolidated statement of operations. For equity investments without readily determinable fair values including equity investments in private companies, each reporting period we are required to re-evaluate the carrying value of the investment, which may result in other income (expense).
In the first half of 2020 and 2019, we recorded within other income (expense), net gains of $65.1 million and $100.1 million, respectively, related to changes in the fair value of our strategic investments, and from sales of certain equity investments. To the extent that we continue to hold strategic investments, particularly strategic investments in publicly traded companies, we will record other income (expense) related to these strategic investments on a quarterly basis. Due to the increased volatility of the global markets, including as a result of COVID-19, and the high volatility of stocks in the biotechnology industry, we expect the value of these strategic investments to fluctuate and that the increases or decreases in the fair value of these strategic investments will continue to have material impacts on our net income (expense) and our profitability on a quarterly and/or annual basis.
RESULTS OF OPERATIONS
| | | | Three Months Ended September 30, | | Increase/(Decrease) | | Nine Months Ended September 30, | | Increase/(Decrease) | | Three Months Ended June 30, | | | Increase/(Decrease) | | | Six Months Ended June 30, | | | Increase/(Decrease) | |
| | 2017 | | 2016 | | $ | | % | | 2017 | | 2016 | | $ | | % | | 2020 | | 2019 | | $ | | % | | 2020 | | 2019 | | $ | | % |
| | (in thousands) | | | | (in thousands) | | | | (in thousands, except percentages) | |
| Revenues | $ | 578,165 |
| | $ | 413,783 |
| | $ | 164,382 |
| | 40 | % | | $ | 1,837,018 |
| | $ | 1,243,471 |
| | $ | 593,547 |
| | 48 | % | Revenues | $ | 1,524,485 | | | $ | 941,293 | | | $ | 583,192 | | | 62 | % | | $ | 3,039,592 | | | $ | 1,799,728 | | | $ | 1,239,864 | | | 69 | % |
| Operating costs and expenses | 904,208 |
| | 432,510 |
| | 471,698 |
| | 109 | % | | 1,839,512 |
| | 1,273,175 |
| | 566,337 |
| | 44 | % | Operating costs and expenses | 806,452 | | | 671,333 | | | 135,119 | | | 20 | % | | 1,601,335 | | | 1,252,960 | | | 348,375 | | | 28 | % |
| Other items, net | 223,091 |
| | (20,114 | ) | | 243,205 |
| | n/a |
| | 165,294 |
| | (115,293 | ) | | 280,587 |
| | n/a |
| |
| Net (loss) income attributable to Vertex | $ | (102,952 | ) | | $ | (38,841 | ) | | $ | (64,111 | ) | | n/a |
| | $ | 162,800 |
| | $ | (144,997 | ) | | $ | 307,797 |
| | n/a |
| |
| Income from operations | | Income from operations | 718,033 | | | 269,960 | | | 448,073 | | | 166 | % | | 1,438,257 | | | 546,768 | | | 891,489 | | | 163 | % |
| Other non-operating income, net | | Other non-operating income, net | 106,737 | | | 57,178 | | | 49,559 | | | 87 | % | | 44,047 | | | 100,535 | | | (56,488) | | | (56) | % |
| (Benefit from) provision for income taxes | | (Benefit from) provision for income taxes | (12,500) | | | 59,711 | | | ** | | ** | | 42,281 | | | 111,245 | | | (68,964) | | | (62) | % |
| Net income | | Net income | $ | 837,270 | | | $ | 267,427 | | | $ | 569,843 | | | 213 | % | | $ | 1,440,023 | | | $ | 536,058 | | | $ | 903,965 | | | 169 | % |
| | Net income per diluted common share | | Net income per diluted common share | $ | 3.18 | | | $ | 1.03 | | | | | | $ | 5.46 | | | $ | 2.06 | | |
| Diluted shares used in per share calculations | | Diluted shares used in per share calculations | 263,403 | | | 259,822 | | | 263,746 | | | 260,015 | | |
| | | | ** Not meaningful | |
Net Income (Loss) Attributable to Vertex
Net loss attributable to Vertex was $(103.0) million in the third quarter of 2017 as compared to aOur net loss attributable to Vertex of $(38.8) million in the third quarter of 2016. Our revenuesincome increased in the thirdsecond quarter and first half of 20172020 as compared to the thirdsecond quarter and first half of 20162019 primarily due to increased ORKAMBI and KALYDECO net product revenues. Oursignificant increases in our revenues, partially offset by increases in our operating costs and expenses in the third quarter of 2017 included a $255.3 million impairment charge related to Parion’s pulmonary ENaC platform and a $160.0 million payment to Concert in connection with the acquisition of VX-561, for which there were no comparable expenses in the third quarter of 2016.expenses. The increase in operating costs and expenses in the third quarter of 2017 as comparedrevenues was primarily due to the third quarterU.S. approval of 2016 also included increases in cost of product revenues, research and development expenses and sales, general and administrative expenses. Other items, net, in the third quarter of 2017 primarily reflects an income tax benefit and certain other benefits associated with the impairment of Parion’s pulmonary ENaC platform, for which there were no comparable benefits in the third quarter of 2016.
Net income attributable to Vertex was $162.8 million in the nine months ended September 30, 2017 as compared to a net loss attributable to Vertex of $(145.0) million in the nine months ended September 30, 2016. Our revenues increased significantly in the nine months ended September 30, 2017 as compared to the nine months ended September 30, 2016 due to increased ORKAMBI and KALYDECO net product revenues and $230.0 million in one-time collaborative revenues related to the strategic collaboration and license agreement we established with Merck KGaA in the first quarter of 2017. Our operating costs and expenses in the nine months ended September 30, 2017 included a $255.3 million impairment charge related to Parion’s pulmonary ENaC platform and a $160.0 million payment to Concert in connection with the acquisition of VX-561, for which there were no comparable expenses in the nine months ended September 30, 2016. The increase in operating costs and expenses in the nine months ended September 30, 2017 as compared to the nine months ended September 30, 2016 also included increases in cost of product revenues, research and development expenses, sales, general and administrative expenses and restructuring expenses. Other items, net, in the nine months ended September 30, 2017 primarily reflects an income tax benefit and certain other benefits associated with the impairment of Parion’s pulmonary ENaC platform, for which there were no comparable benefits in the nine months ended September 30, 2016.
Diluted Net Income (Loss) Per Share Attributable to Vertex Common Shareholders
Diluted net loss per share attributable to Vertex common shareholders was $(0.41) in the third quarter of 2017 as compared to a diluted net loss per share attributable to Vertex common shareholders of $(0.16) in the third quarter of 2016. Diluted net income per share attributable to Vertex common shareholders was $0.64 in the nine months ended September 30, 2017 as compared to a diluted net loss per share attributable to Vertex common shareholders of $(0.59) in the nine months ended September 30, 2016.
Revenues
|
| | | | | | | | | | | | | | | | | | | | | | | | | | | | | |
| | Three Months Ended September 30, | | Increase/(Decrease) | | Nine Months Ended September 30, | | Increase/(Decrease) |
| | 2017 | | 2016 | | $ | | % | | 2017 | | 2016 | | $ | | % |
| | (in thousands) | | | | (in thousands) | | |
| Product revenues, net | $ | 549,642 |
| | $ | 409,689 |
| | $ | 139,953 |
| | 34 | % | | $ | 1,544,252 |
| | $ | 1,229,750 |
| | $ | 314,502 |
| | 26 | % |
| Royalty revenues | 2,231 |
| | 3,835 |
| | (1,604 | ) | | (42 | )% | | 6,643 |
| | 12,713 |
| | (6,070 | ) | | (48 | )% |
| Collaborative revenues | 26,292 |
| | 259 |
| | 26,033 |
| | n/a |
| | 286,123 |
| | 1,008 |
| | 285,115 |
| | n/a |
|
| Total revenues | $ | 578,165 |
| | $ | 413,783 |
| | $ | 164,382 |
| | 40 | % | | $ | 1,837,018 |
| | $ | 1,243,471 |
| | $ | 593,547 |
| | 48 | % |
Product Revenues, Net
|
| | | | | | | | | | | | | | | | | | | | | | | | | | | | | |
| | Three Months Ended September 30, | | Increase/(Decrease) | | Nine Months Ended September 30, | | Increase/(Decrease) |
| | 2017 | | 2016 | | $ | | % | | 2017 | | 2016 | | $ | | % |
| | (in thousands) | | | | (in thousands) | | |
| ORKAMBI | $ | 336,183 |
| | $ | 234,046 |
| | $ | 102,137 |
| | 44 | % | | $ | 955,451 |
| | $ | 702,670 |
| | $ | 252,781 |
| | 36 | % |
| KALYDECO | 213,461 |
| | 175,608 |
| | 37,853 |
| | 22 | % | | $ | 588,809 |
| | $ | 526,352 |
| | $ | 62,457 |
| | 12 | % |
| INCIVEK | (2 | ) | | 35 |
| | (37 | ) | | n/a |
| | (8 | ) | | 728 |
| | (736 | ) | | n/a |
|
| Total product revenues, net | $ | 549,642 |
| | $ | 409,689 |
| | $ | 139,953 |
| | 34 | % | | $ | 1,544,252 |
| | $ | 1,229,750 |
| | $ | 314,502 |
| | 26 | % |
In the third quarter and the nine months ended September 30, 2017, we recognized approximately $43.1 million and $110.9 million, respectively, in ex-U.S. ORKAMBI net product revenues, as compared to $22.8 million and $47.5 million in the third quarter and the nine months ended September 30, 2016, respectively. We believe that the level of our ORKAMBI revenues for the remainder of 2017 will be dependent upon whether, when and on what terms we are able to obtain reimbursement in additional ex-U.S. markets, the number and rate at which additional patients begin treatment with ORKAMBI, the proportion of initiated patients who remain on treatment and the compliance rates for patients who remain on treatment.
Under the current revenue recognition guidance applicable for the year ending December 31, 2017, we do not recognize any net product revenues on sales of products unless the price is fixed or determinable. Pursuant to new revenue recognition guidance that will become effective January 1, 2018 and is described in Note A, “Basis of Presentation and Accounting Policies” to our condensed consolidated financial statements, we will be required to make estimates of the amount of consideration that will be retained by us that will not be subject to a significant reversal in amounts recognized as net product revenues. Our condensed consolidated balance sheet includes $190.3 million collected as of September 30, 2017 in France related to ORKAMBI supplied under early access programs at the invoiced price, which has not resulted in any net product revenues because the final price is not fixed or determinable under the current guidance.
If we conclude as of December 31, 2017, that the price of the ORKAMBI supplied under the French early access programs is fixed or determinable, we would record net product revenues for all sales since the inception of these programs based on the fixed or determinable priceTRIKAFTA in the fourth quarter of 2017. If2019. The increases in operating expenses were the price is not fixedresult of increased cost of sales consistent with increased product revenues, increased investment in research and determinable asdevelopment and increased sales, and general and administrative expenses to support our business.
Revenues
| | | | | | | | | | | | | | | | | | | | | | | | | | | | | | | | | | | | | | | | | | | | | | | |
| Three Months Ended June 30, | | | | Increase/(Decrease) | | | | Six Months Ended June 30, | | | | Increase/(Decrease) | | |
| 2020 | | 2019 | | $ | | % | | 2020 | | 2019 | | $ | | % |
| (in thousands) | | | | | | | | | | | | | | |
| Product revenues, net | $ | 1,524,485 | | | $ | 940,380 | | | $ | 584,105 | | | 62 | % | | $ | 3,039,592 | | | $ | 1,797,633 | | | $ | 1,241,959 | | | 69 | % |
| Collaborative and royalty revenues | — | | | 913 | | | (913) | | | ** | | — | | | 2,095 | | | (2,095) | | | ** |
| Total revenues | $ | 1,524,485 | | | $ | 941,293 | | | $ | 583,192 | | | 62 | % | | $ | 3,039,592 | | | $ | 1,799,728 | | | $ | 1,239,864 | | | 69 | % |
| | | | | | | | | | | | | | | |
| | | | | | | | | | | | | ** Not meaningful | | |
Product Revenues, Net
| | | | | | | | | | | | | | | | | | | | | | | | | | | | | | | | | | | | | | | | | | | | | | | |
| Three Months Ended June 30, | | | | Increase/(Decrease) | | | | Six Months Ended June 30, | | | | Increase/(Decrease) | | |
| 2020 | | 2019 | | $ | | % | | 2020 | | 2019 | | $ | | % |
| (in thousands, except percentages) | | | | | | | | | | | | | | |
| TRIKAFTA | $ | 917,715 | | | $ | — | | | $ | 917,715 | | | ** | | $ | 1,812,948 | | | $ | — | | | $ | 1,812,948 | | | ** |
| SYMDEKO/SYMKEVI | 171,729 | | | 361,832 | | | (190,103) | | | (53) | % | | 344,888 | | | 682,107 | | | (337,219) | | | (49) | % |
| ORKAMBI | 231,981 | | | 316,441 | | | (84,460) | | | (27) | % | | 466,119 | | | 609,448 | | | (143,329) | | | (24) | % |
| KALYDECO | 203,060 | | | 262,107 | | | (59,047) | | | (23) | % | | 415,637 | | | 506,078 | | | (90,441) | | | (18) | % |
| Total product revenues, net | $ | 1,524,485 | | | $ | 940,380 | | | $ | 584,105 | | | 62 | % | | $ | 3,039,592 | | | $ | 1,797,633 | | | $ | 1,241,959 | | | 69 | % |
| | | | | | | | | | | | | | | |
| | | | | | | | | | | | | ** Not meaningful | | |
In the second quarter and first half of December 31, 2017, these amounts will be subject to the new guidance. In this case, amounts for prior periods will be recognized in the first quarter of 2018 as a cumulative effect adjustment to2020, our accumulated deficit based on an estimate of the amount of consideration that we would retain that would not be subject to a significant reversal in amounts recognized.
KALYDECO net product revenues increased in the third quarter of 2017by $584.1 million and $1.24 billion, respectively, as compared to the thirdsecond quarter and first half of 2016 primarily due to additional patients being treated with KALYDECO as a result of label expansions.2019. The increase in KALYDECOtotal net product revenues in the nine months ended September 30, 2017 as compared to the nine months ended September 30, 2016 included approximately $9 million in one-time revenue credits in the first quarter of 2017 related to the finalization of reimbursement agreements in certain European countries. In the thirdsecond quarter and the nine months ended September 30, 2017, we recognized approximately $80.3 million and $242.5 million, respectively, in ex-U.S. KALYDECO net product revenues, as compared to $75.1 million and $227.6 million in the third quarter and the nine months ended September 30, 2016, respectively.
We have withdrawn INCIVEK, which we previously marketed as a treatment for hepatitis C virus infection, from the market in the United States.
Royalty Revenues
Our royalty revenues were $2.2 million and $6.6 million in the third quarter and the nine months ended September 30, 2017, respectively, as compared to $3.8 million and $12.7 million in the third quarter and the nine months ended September 30, 2016, respectively. Our royalty revenues primarily consist of revenues related to a cash payment we received in 2008 when we sold our rights to certain HIV royalties.
Collaborative Revenues
Our collaborative revenues were $26.3 million and $286.1 million in the third quarter and the nine months ended September 30, 2017, respectively, as compared to $0.3 million and $1.0 million in the third quarter and the nine months ended September 30, 2016, respectively. The increase in our collaborative revenues during the third quarter of 2017 as compared to the third quarter of 2016 was primarily related to amounts received from Merck for transition activities we received pursuant to our collaboration with Merck KGaA and a $20.0 million milestone payment received by Parion in the third quarter of 2017 pursuant to a license agreement it entered into with a third party. We are not a party to such license agreement and have no economic interest in either the license or the milestone payment. Parion was deconsolidated as a VIE as of September 30, 2017 and future payments received by Parion pursuant to this license agreement will no longer be recognized by us as collaborative revenue. The increase in our collaborative revenues during the nine months ended September 30, 2017 as compared to the nine months ended September 30, 20162020 was primarily due to revenue recognized relatedthe launch of TRIKAFTA, which was approved in the United States in the fourth quarter of 2019. Decreases in revenues for our other products were the result of patients in the United States switching from these medicines to TRIKAFTA, partially offset by label expansions and expanded access to our medicines in ex-U.S markets. In the one-time upfront payment Merck KGaA paidsecond quarter and first half of 2020, our net product revenues included $314.2 million
and $641.7 million, respectively, from ex-U.S. markets. In the second quarter and first half of 2019, our net product revenues included $240.7 million and $458.1 million, respectively, from ex-U.S. markets. Net product revenues in the first half of 2020 were also positively impacted by factors that may not be repeated in future periods, including increased patient inventory levels and compliance and persistence rates of patients who recently initiated treatment with TRIKAFTA.
Collaborative and Royalty Revenues
We did not record any collaborative and royalty revenues in the second quarter and first half of 20172020. Our collaborative and $40royalty revenues were $0.9 million and $2.1 million in upfrontthe second quarter and milestone payments received by Parion in 2017 pursuant to its license agreement with a third party.first half of 2019, respectively. Our collaborative revenues have historically fluctuated significantly from one period to another and may continue to fluctuate in the future. Our future royalty revenues will be dependent on if, and when, our collaborators, including Janssen and Merck KGaA, Darmstadt, Germany are able to successfully develop drug candidates that we have out-licensed to them.
Operating Costs and Expenses
| | | ` | Three Months Ended September 30, | | Increase/(Decrease) | | Nine Months Ended September 30, | | Increase/(Decrease) | ` | Three Months Ended June 30, | | | Increase/(Decrease) | | | Six Months Ended June 30, | | | Increase/(Decrease) | |
| | 2017 | | 2016 | | $ | | % | | 2017 | | 2016 | | $ | | % | | 2020 | | 2019 | | $ | | % | | 2020 | | 2019 | | $ | | % |
| | (in thousands) | | | | (in thousands) | | | | (in thousands, except percentages) | |
| Cost of product revenues | $ | 72,186 |
| | $ | 53,222 |
| | $ | 18,964 |
| | 36 | % | | $ | 188,963 |
| | $ | 147,165 |
| | $ | 41,798 |
| | 28 | % | |
| Royalty expenses | 688 |
| | 855 |
| | (167 | ) | | (20 | )% | | 2,104 |
| | 2,813 |
| | (709 | ) | | (25 | )% | |
| Cost of sales | | Cost of sales | $ | 184,520 | | | $ | 135,740 | | | $ | 48,780 | | | 36 | % | | $ | 347,017 | | | $ | 230,832 | | | $ | 116,185 | | | 50 | % |
| Research and development expenses | 454,947 |
| | 272,370 |
| | 182,577 |
| | 67 | % | | 1,017,961 |
| | 799,238 |
| | 218,723 |
| | 27 | % | Research and development expenses | 420,928 | | | 379,091 | | | 41,837 | | | 11 | % | | 869,456 | | | 718,581 | | | 150,875 | | | 21 | % |
| Sales, general and administrative expenses | 120,710 |
| | 106,055 |
| | 14,655 |
| | 14 | % | | 361,285 |
| | 322,921 |
| | 38,364 |
| | 12 | % | Sales, general and administrative expenses | 191,804 | | | 156,502 | | | 35,302 | | | 23 | % | | 374,062 | | | 303,547 | | | 70,515 | | | 23 | % |
| Restructuring expenses, net | 337 |
| | 8 |
| | 329 |
| | n/a |
| | 13,859 |
| | 1,038 |
| | 12,821 |
| | n/a |
| |
| Intangible asset impairment charge | 255,340 |
| | — |
| | 255,340 |
| | n/a |
| | 255,340 |
| | — |
| | 255,340 |
| | n/a |
| |
| Change in fair value of contingent consideration | | Change in fair value of contingent consideration | 9,200 | | | — | | | 9,200 | | | ** | | 10,800 | | | — | | | 10,800 | | | ** |
| Total costs and expenses | $ | 904,208 |
| | $ | 432,510 |
| | $ | 471,698 |
| | 109 | % | | $ | 1,839,512 |
| | $ | 1,273,175 |
| | $ | 566,337 |
| | 44 | % | Total costs and expenses | $ | 806,452 | | | $ | 671,333 | | | $ | 135,119 | | | 20 | % | | $ | 1,601,335 | | | $ | 1,252,960 | | | $ | 348,375 | | | 28 | % |
| | | | | | | ** Not Meaningful | |
Cost of Product RevenuesSales
Our cost of product revenues includessales primarily consists of the cost of producing inventories that corresponded to product revenues for the reporting period, plus the third-party royalties payable on our net sales of our products. Pursuant to our agreement with Cystic Fibrosis Foundation Therapeutics Incorporated, or CFFT,the CFF, our tiered third-party royalties on sales of TRIKAFTA, SYMDEKO/SYMKEVI, KALYDECO and ORKAMBI, calculated as a percentage of net sales, range from the single digits to the sub-teens. As a result ofOver the tiered royalty rate,last several years, our cost of sales has been increasing due to increased net product revenuesrevenues. Our cost of sales as a percentage of CFour net product revenues is lower atwas approximately 12% and 14% in the beginning of each calendar year.
In the thirdsecond quarter of 2017, our2020 and 2019, respectively. Our cost of product revenues increased as compared to the third quarter of 2016 primarily due to the increased CF net product revenues. In the fourth quarter of 2017, we expect our cost of product revenuessales as a percentage of total CFour net product revenues to be similar to the costwas approximately 11% and 13% in first half of product revenues as a percentage of total CF product revenues in the third quarter of 2017.
In the nine months ended September 30, 2016, our cost of product revenues included a $13.9 million commercial milestone that was earned by CFFT related to sales of ORKAMBI. There are no further commercial milestones payable to CFFT.
Royalty Expenses
Royalty expenses primarily consist of expenses related to a subroyalty payable to a third party on net sales of an HIV protease inhibitor sold by GlaxoSmithKline. Royalty expenses do not include royalties we pay to CFFT on sales of KALYDECO2020 and ORKAMBI, which instead are included in cost of product revenues.2019, respectively.
Research and Development Expenses
| | | | Three Months Ended September 30, | | Increase/(Decrease) | | Nine Months Ended September 30, | | Increase/(Decrease) | | Three Months Ended June 30, | | | Increase/(Decrease) | | | Six Months Ended June 30, | | | Increase/(Decrease) | |
| | 2017 | | 2016 | | $ | | % | | 2017 | | 2016 | | $ | | % | | 2020 | | 2019 | | $ | | % | | 2020 | | 2019 | | $ | | % |
| | (in thousands) | | | | (in thousands) | | | | (in thousands, except percentages) | |
| Research expenses | $ | 76,131 |
| | $ | 99,162 |
| | $ | (23,031 | ) | | (23 | )% | | $ | 226,409 |
| | $ | 242,058 |
| | $ | (15,649 | ) | | (6 | )% | Research expenses | $ | 134,138 | | | $ | 144,628 | | | $ | (10,490) | | | (7) | % | | $ | 291,408 | | | $ | 235,091 | | | $ | 56,317 | | | 24 | % |
| Development expenses | 378,816 |
| | 173,208 |
| | 205,608 |
| | 119 | % | | 791,552 |
| | 557,180 |
| | 234,372 |
| | 42 | % | Development expenses | 286,790 | | | 234,463 | | | 52,327 | | | 22 | % | | 578,048 | | | 483,490 | | | 94,558 | | | 20 | % |
| Total research and development expenses | $ | 454,947 |
| | $ | 272,370 |
| | $ | 182,577 |
| | 67 | % | | $ | 1,017,961 |
| | $ | 799,238 |
| | $ | 218,723 |
| | 27 | % | Total research and development expenses | $ | 420,928 | | | $ | 379,091 | | | $ | 41,837 | | | 11 | % | | $ | 869,456 | | | $ | 718,581 | | | $ | 150,875 | | | 21 | % |
Our research and development expenses include internal and external costs incurred for research and development of our drugs and drug candidates.candidates and expenses related to certain technology that we acquire or license through business development transactions. We do not assign our internal costs, such as salary and benefits, stock-based compensation expense, laboratory supplies and other direct expenses and infrastructure costs, to individual drugs or drug candidates, because the employees within our research and development groups typically are deployed across multiple research and development programs. These internal costs are significantly greater than our external costs, such as the costs of services provided to us by clinical research organizations and other outsourced research, which we allocate by individual program. All research and development costs for our drugs and drug candidates are expensed as incurred.
Since January 1, 2014,2018, we have incurred $3.9approximately $4.0 billion in research and development expenses associated with drug discovery and development. The successful development of our drug candidates is highly uncertain and subject to a number of risks. In addition, the duration of clinical trials may vary substantially according to the type, complexity and novelty of the drug candidate and the disease indication being targeted. The FDA and comparable agencies in foreign countries impose substantial requirements on the introduction of therapeutic pharmaceutical products, typically requiring lengthy and detailed laboratory and clinical testing procedures, sampling activities and other costly and time-consuming procedures. Data obtained from nonclinical and clinical activities at any step in the testing process may be adverse and lead to discontinuation or redirection of development activities. Data obtained from these activities also are susceptible to varying interpretations, which could delay, limit or prevent regulatory approval. The duration and cost of discovery, nonclinical studies and clinical trials may vary significantly over the life of a project and are difficult to predict. Therefore, accurate and meaningful estimates of the ultimate costs to bring our drug candidates to market are not available.
In 20162019 and the nine months ended September 30, 2017,first half of 2020, costs related to our CF programs represented the largest portion of our development costs. Any estimates regarding development and regulatory timelines for our drug candidates are highly subjective and subject to change. We recently submitted an NDA and an MAA for tezacaftor in combination with ivacaftor. The target date for the FDA to complete its review of the NDA under PDUFA is February 28, 2018 andUntil we expect the EMA to complete its review of our in MAA in the second half of 2018. Wehave data from Phase 3 clinical trials, we cannot make a meaningful estimate regarding when, or if, ever, our othera clinical development programsprogram will generate revenues and cash flows.
Research Expenses
| | | | | | | | | | | | | | | | | | | | | | | | | | | | | | | | | | | | | | | | | | | | | | | |
| Three Months Ended June 30, | | | | Increase/(Decrease) | | | | Six Months Ended June 30, | | | | Increase/(Decrease) | | |
| 2020 | | 2019 | | $ | | % | | 2020 | | 2019 | | $ | | % |
| (in thousands, except percentages) | | | | | | | | | | | | | | |
| Research Expenses: | | | | | | | | | | | | | | | |
| Salary and benefits | $ | 31,099 | | | $ | 22,498 | | | $ | 8,601 | | | 38 | % | | $ | 65,368 | | | $ | 46,877 | | | $ | 18,491 | | | 39 | % |
| Stock-based compensation expense | 26,496 | | | 17,138 | | | 9,358 | | | 55 | % | | 52,905 | | | 34,673 | | | 18,232 | | | 53 | % |
| Outsourced services and other direct expenses | 21,073 | | | 27,622 | | | (6,549) | | | (24) | % | | 51,926 | | | 50,986 | | | 940 | | | 2 | % |
| Collaboration and asset acquisition payments | 27,000 | | | 52,200 | | | (25,200) | | | (48) | % | | 63,250 | | | 52,200 | | | 11,050 | | | 21 | % |
| Infrastructure costs | 28,470 | | | 25,170 | | | 3,300 | | | 13 | % | | 57,959 | | | 50,355 | | | 7,604 | | | 15 | % |
| Total research expenses | $ | 134,138 | | | $ | 144,628 | | | $ | (10,490) | | | (7) | % | | $ | 291,408 | | | $ | 235,091 | | | $ | 56,317 | | | 24 | % |
| | | | | | | | | | | | | | | |
| | | | | | | | | | | | | | | |
|
| | | | | | | | | | | | | | | | | | | | | | | | | | | | | |
| | Three Months Ended September 30, | | Increase/(Decrease) | | Nine Months Ended September 30, | | Increase/(Decrease) |
| | 2017 | | 2016 | | $ | | % | | 2017 | | 2016 | | $ | | % |
| | (in thousands) | | | | (in thousands) | | |
| Research Expenses: | | | | | | | | | | | | | | | |
| Salary and benefits | $ | 20,445 |
| | $ | 21,525 |
| | $ | (1,080 | ) | | (5 | )% | | $ | 61,486 |
| | $ | 61,503 |
| | $ | (17 | ) | | — | % |
| Stock-based compensation expense | 15,641 |
| | 14,023 |
| | 1,618 |
| | 12 | % | | 44,366 |
| | 38,088 |
| | 6,278 |
| | 16 | % |
| Laboratory supplies and other direct expenses | 10,791 |
| | 11,726 |
| | (935 | ) | | (8 | )% | | 33,980 |
| | 33,410 |
| | 570 |
| | 2 | % |
| Outsourced services | 10,230 |
| | 10,054 |
| | 176 |
| | 2 | % | | 29,644 |
| | 20,749 |
| | 8,895 |
| | 43 | % |
| Collaboration and asset acquisition payments | 425 |
| | 22,000 |
| | (21,575 | ) | | (98 | )% | | 425 |
| | 33,000 |
| | (32,575 | ) | | (99 | )% |
| Infrastructure costs | 18,599 |
| | 19,834 |
| | (1,235 | ) | | (6 | )% | | 56,508 |
| | 55,308 |
| | 1,200 |
| | 2 | % |
| Total research expenses | $ | 76,131 |
| | $ | 99,162 |
| | $ | (23,031 | ) | | (23 | )% | | $ | 226,409 |
| | $ | 242,058 |
| | $ | (15,649 | ) | | (6 | )% |
We maintain a substantial investment in research activities. Our research expenses decreased by 23% in the third quarter of 2017 as compared to the third quarter of 2016 and decreased by 6% in the nine months ended September 30, 2017 as compared to the nine months ended September 30, 2016. Collaboration and asset acquisition payments in the third quarter of 2016 included a $20.0 million payment to Moderna for which there was no comparable expense in the third quarter of 2017. Collaboration and asset acquisition payments in the nine months ended September 30, 2016 included both the Moderna payment and $13.0 million in expenses related to the acquisition of early-stage research assets for which there were no comparable expenses in the nine months ended September 30, 2017. We expect to continue to invest in our research programs with a focus on identifying drug candidates with the goal of creating transformative medicines.medicines for serious diseases. Our research expenses decreased by 7% in the second quarter of 2020 compared to the second quarter of 2019 and increased by 24% in the first half of 2020 compared to the first half of 2019. The decrease in the second quarter of 2020 compared to the second quarter of 2019 was primarily due to a decrease in collaboration and asset acquisition payments partially offset by increased expenses to support our cell and genetic therapy programs. The increase in the first half of 2020 compared to the first half of 2019 was primarily due to increased expenses to support our cell and genetic therapy programs and an increase in collaboration and asset acquisition payments.
Development Expenses
| | | | Three Months Ended September 30, | | Increase/(Decrease) | | Nine Months Ended September 30, | | Increase/(Decrease) | | Three Months Ended June 30, | | | Increase/(Decrease) | | | Six Months Ended June 30, | | | Increase/(Decrease) | |
| | 2017 | | 2016 | | $ | | % | | 2017 | | 2016 | | $ | | % | | 2020 | | 2019 | | $ | | % | | 2020 | | 2019 | | $ | | % |
| | (in thousands) | | | | (in thousands) | | | | (in thousands, except percentages) | |
| Development Expenses: | | | | | | | | | | | | | | | | Development Expenses: | |
| Salary and benefits | $ | 54,125 |
| | $ | 44,788 |
| | $ | 9,337 |
| | 21 | % | | $ | 156,759 |
| | $ | 134,201 |
| | $ | 22,558 |
| | 17 | % | Salary and benefits | $ | 68,532 | | | $ | 58,195 | | | $ | 10,337 | | | 18 | % | | $ | 148,130 | | | $ | 118,702 | | | $ | 29,428 | | | 25 | % |
| Stock-based compensation expense | 30,545 |
| | 25,957 |
| | 4,588 |
| | 18 | % | | 90,489 |
| | 76,980 |
| | 13,509 |
| | 18 | % | Stock-based compensation expense | 43,779 | | | 38,494 | | | 5,285 | | | 14 | % | | 90,057 | | | 80,674 | | | 9,383 | | | 12 | % |
| Laboratory supplies and other direct expenses | 10,828 |
| | 10,784 |
| | 44 |
| | — | % | | 34,171 |
| | 32,039 |
| | 2,132 |
| | 7 | % | |
| Outsourced services | 89,637 |
| | 60,838 |
| | 28,799 |
| | 47 | % | | 251,677 |
| | 216,881 |
| | 34,796 |
| | 16 | % | |
| Outsourced services and other direct expenses | | Outsourced services and other direct expenses | 124,898 | | | 93,701 | | | 31,197 | | | 33 | % | | 241,331 | | | 191,469 | | | 49,862 | | | 26 | % |
| Collaboration and asset acquisition payments | 160,000 |
| | — |
| | 160,000 |
| | n/a |
| | 160,250 |
| | — |
| | 160,250 |
| | n/a |
| Collaboration and asset acquisition payments | — | | | 190 | | | (190) | | | ** | | — | | | 5,440 | | | (5,440) | | | ** |
| Drug supply costs | 3,151 |
| | 2,655 |
| | 496 |
| | 19 | % | | 6,143 |
| | 9,512 |
| | (3,369 | ) | | (35 | )% | |
| Infrastructure costs | 30,530 |
| | 28,186 |
| | 2,344 |
| | 8 | % | | 92,063 |
| | 87,567 |
| | 4,496 |
| | 5 | % | Infrastructure costs | 49,581 | | | 43,883 | | | 5,698 | | | 13 | % | | 98,530 | | | 87,205 | | | 11,325 | | | 13 | % |
| Total development expenses | $ | 378,816 |
| | $ | 173,208 |
| | $ | 205,608 |
| | 119 | % | | $ | 791,552 |
| | $ | 557,180 |
| | $ | 234,372 |
| | 42 | % | Total development expenses | $ | 286,790 | | | $ | 234,463 | | | $ | 52,327 | | | 22 | % | | $ | 578,048 | | | $ | 483,490 | | | $ | 94,558 | | | 20 | % |
| | | | | | | ** Not meaningful | |
Our development expenses increased by 119%22% in the thirdsecond quarter of 20172020 as compared to the thirdsecond quarter of 20162019 and increased by 42%20% in the nine months ended September 30, 2017first half of 2020 as compared to the nine months ended September 30, 2016,first half of 2019, primarily due the $160.0 million payment to Concert in connection with the acquisition of VX-561 in the third quarter of 2017 and to increased outsourced services expenses related to ongoingour advancing pipeline including clinical trials, including trials involving our next-generation CFTR corrector compounds that we are evaluating as part of triple combination treatment regimens. In the fourth quarter of 2017, we expect our outsourced services expenses to increase as compared to the third quarter of 2017 due to expenses related to the advancement of our triple-combination regimens.
headcount and infrastructure costs.
Sales, General and Administrative Expenses
| | | | | | | | | | | | | | | | | | | | | | | | | | | | | | | | | | | | | | | | | | | | | | | |
| Three Months Ended June 30, | | | | Increase/(Decrease) | | | | Six Months Ended June 30, | | | | Increase/(Decrease) | | |
| 2020 | | 2019 | | $ | | % | | 2020 | | 2019 | | $ | | % |
| (in thousands, except percentages) | | | | | | | | | | | | | | |
| Sales, general and administrative expenses | $ | 191,804 | | | $ | 156,502 | | | $ | 35,302 | | | 23 | % | | $ | 374,062 | | | $ | 303,547 | | | $ | 70,515 | | | 23 | % |
|
| | | | | | | | | | | | | | | | | | | | | | | | | | | | | |
| | Three Months Ended September 30, | | Increase/(Decrease) | | Nine Months Ended September 30, | | Increase/(Decrease) |
| | 2017 | | 2016 | | $ | | % | | 2017 | | 2016 | | $ | | % |
| | (in thousands) | | | | (in thousands) | | |
| Sales, general and administrative expenses | $ | 120,710 |
| | $ | 106,055 |
| | $ | 14,655 |
| | 14 | % | | $ | 361,285 |
| | $ | 322,921 |
| | $ | 38,364 |
| | 12 | % |
Sales, general and administrative expenses increased by 14%23% in the thirdsecond quarter of 20172020 as compared to the thirdsecond quarter of 20162019 and increased by 12%23% in the nine months ended September 30, 2017first half of 2020 as compared to the nine months ended September 30, 2016,first half of 2019, primarily due to increased global support for KALYDECOour medicines and ORKAMBI.incremental investment to support the launch of our triple combination regimen.
Restructuring Expenses,Contingent Consideration
In the second quarter and first half of 2020, the increase in the fair value of contingent consideration potentially payable to Exonics’ former equity holders was $9.2 million and $10.8 million, respectively. There were no similar amounts for the second quarter and first half of 2019.
Other Non-Operating Income (Expense), Net
We recorded restructuring expenses of $0.3Interest Income
Interest income decreased from $18.1 million and $13.9$33.7 million in the thirdsecond quarter and first half of 2019, respectively, to $4.2 million and $16.8 million in the nine months ended September 30, 2017,second quarter and first half of 2020, respectively, primarily due to a decrease in prevailing market interest rates. Our future interest income will be dependent on the amount of, and prevailing market interest rates on, our outstanding cash equivalents and marketable securities.
Interest Expense
Interest expense was $13.9 million and $28.0 million in the second quarter and first half of 2020, respectively, as compared to restructuring expenses of $8.0 thousand$14.8 million and $1.0$29.7 million in the thirdsecond quarter and the nine months ended September 30, 2016,first half of 2019, respectively. The increasesmajority of our interest expense in our restructuring expenses in the nine months ended September 30, 2017 primarily relate to our decision to consolidate our research activities into our Boston, Milton Park and San Diego locations and to close our research site in Canada.
Intangible Asset Impairment Charge
In the third quarter of 2017, we recorded a $255.3 million impairment chargethese periods was related to Parion’s pulmonary ENaC platform that we licensed from Parion in 2015 and a benefit from income taxes of $97.7 million related to this impairment charge attributable to Parion. There were no corresponding intangible asset impairment charges in the third quarter and the nine months ended September 30, 2016.
Other Items
Interest Expense, Net
Interest expense, net was $13.6 million and $45.0 million in the third quarter and the nine months ended September 30, 2017, respectively, as compared to $20.1 million and $61.0 million in the third quarter and the nine months ended September 30, 2016, respectively. The decrease in interest expense, net in the third quarter and the nine months ended September 30, 2017 as compared to the third quarter and the nine months ended September 30, 2016 was primarily due to the repayment of the $300.0 million outstanding under our revolving credit facility in February 2017. In the fourth quarter of 2017, we expect to incur approximately $15 million ofimputed interest expense associated with the leases for our leased corporate headquarters and ourin Boston. Our future interest expense related to our revolving credit facility will be dependent on whether, and to what extent, we reborrowborrow amounts under the existingour credit facility.
Other (Expenses) Income (Expense), Net
Other income (expense) income,, net was an expenseincome of $77.6$116.4 million and $80.6$55.2 million in the thirdsecond quarter and the nine months ended September 30, 2017first half of 2020, respectively, as compared to expenseincome of $0.2$53.9 million and $96.5 million in the thirdsecond quarter and first half of 2016 and2019, respectively. Our other income of $3.0 million in the nine months ended September 30, 2016. Other (expense) income,, net in the third quarter and the nine months ended September 30, 2017these periods was primarily related to the deconsolidation of Parion. Other (expense) income, netchanges in the third quarter and the nine months ended September 30, 2016 was primarilyfair value of our strategic investments, as well as realized gains from sales of certain investments. We expect that due to foreign exchange gains and losses.the volatility of the stock price of biotechnology companies, our other income (expense), net will fluctuate in future periods based on increases or decreases in the fair value of our strategic investments.
Income Taxes
We recorded a benefit from income taxes in the second quarter of $125.92020 of $12.5 million and $117.6 million in the third quarter and the nine months ended September 30, 2017 as compared to a provision for income taxes of $0.5 million and $24.1 million in the third quarter and the nine months ended September 30, 2016. The benefit from income taxes in the third quarter and the nine months ended September 30, 2017 was primarily related to a benefit of $126.2 million attributable to noncontrolling interest as a result of our impairment of Parion’s pulmonary ENaC platform and decrease in the fair value of the contingent payments payable by us to Parion. The provision for income taxes in the thirdfirst half of 2020 of $42.3 million, respectively, as compared to provisions for income taxes of $59.7 million and $111.2 million in the second quarter and first half of 2019, respectively. Our effective tax rate for the nine months ended September 30, 2016first half of 2020 was lower than the U.S. statutory rate primarily due to incomea discrete tax onbenefit of $187.0 million associated with the transfer of intellectual property rights to the United Kingdom in the second quarter of 2020, a discrete tax benefit associated with the write-off of a long-term intercompany receivable in the first quarter of 2020 and excess tax benefits related to stock-based compensation. Our effective tax rate for the first half of 2019 was lower than the U.S. statutory rate primarily due to excess tax benefits related to stock-based compensation. We released our VIEs.
We continue to maintain a valuation allowance on the majority of our net operating losses and other deferred tax assets becausein the fourth quarter of 2018. Starting in 2019, we havebegan recording a history of cumulative losses. Accordingly, we have not reported anyprovision for income taxes on our pre-tax income using an effective tax benefit relatingrate approximating statutory rates. Due to the remainingour ability to offset our pre-tax income against previously benefited net operating loss carryforwards (NOLs)losses and incomecredits, we expect a portion of our tax credit carryforwards that will be utilized in future periods in these
jurisdictions. Our U.S. federalprovision to represent a non-cash expense until our net operating loss carryforwards totaled approximately $4.1losses and credits have been fully utilized.
LIQUIDITY AND CAPITAL RESOURCES
The following table summarizes the components of our financial condition as of June 30, 2020 and December 31, 2019:
| | | | | | | | | | | | | | | | | | | | | | | |
| June 30, | | December 31, | | Increase/(Decrease) | | |
| 2020 | | 2019 | | $ | | % |
| (in thousands) | | | | | | |
| Cash, cash equivalents and marketable securities | $ | 5,450,769 | | | $ | 3,808,294 | | | $ | 1,642,475 | | | 43 | % |
| Working Capital | | | | | | | |
| Total current assets | 6,694,320 | | | 4,822,829 | | | 1,871,491 | | | 39 | % |
| Total current liabilities | (1,798,640) | | | (1,334,827) | | | 463,813 | | | 35 | % |
| Total working capital | $ | 4,895,680 | | | $ | 3,488,002 | | | $ | 1,407,678 | | | 40 | % |
As of June 30, 2020, total working capital was $4.9 billion, which represented an increase of $1.4 billion from $3.5 billion as of December 31, 2016. On a quarterly basis, we reassess the valuation allowance on our deferred income tax assets weighing positive and negative evidence to assess the recoverability of the deferred tax assets. Based on our recent financial performance and our future projections, we could record a reversal of all, or a portion of the valuation allowance associated with U.S. deferred tax assets2019. The increase in future periods. However, any such change is subject to actual performance and other considerations that may present positive or negative evidence at the time of the assessment. Our total deferred tax asset balance subject to the valuation allowance was approximately $1.7 billion at December 31, 2016.
Noncontrolling Interest (VIEs)
The net (income) loss attributable to noncontrolling interest (VIEs) recorded on our condensed consolidated statements of operations reflects Parion and BioAxone’s net (income) loss for the reporting period, adjusted for any changesworking capital in the noncontrolling interest holders’ claim to net assets, including contingent milestone, royalty and option payments. A summaryfirst half of net income attributable to noncontrolling interest related to our VIEs for the three and nine months ended September 30, 2017 and 2016 is as follows:
|
| | | | | | | | | | | | | | | |
| | Three Months Ended September 30, | | Nine Months Ended September 30, |
| | 2017 | | 2016 | | 2017 | | 2016 |
| | (in thousands) | | | | |
| Loss attributable to noncontrolling interest before (benefit from) provision for income taxes and changes in fair value of contingent payments | $ | 238,946 |
| | $ | 2,406 |
| | $ | 222,448 |
| | $ | 6,080 |
|
| (Benefit from) provision for income taxes | (120,181 | ) | | (510 | ) | | (111,658 | ) | | 20,063 |
|
| Decrease (increase) in fair value of contingent payments | 69,550 |
| | (1,200 | ) | | 62,560 |
| | (59,350 | ) |
| Net loss (income) attributable to noncontrolling interest | $ | 188,315 |
| | $ | 696 |
| | $ | 173,350 |
| | $ | (33,207 | ) |
The net loss attributable to noncontrolling interest in the third quarter and nine months ended September 30, 20172020 was primarily related to $1.9 billion of cash provided by operations partially offset by $300.0 million of cash used to repurchase our common stock pursuant to the $255.3 million impairment charge related to Parion’s pulmonary ENaC platform, a decreaseshare repurchase program that we announced in fair valueJuly 2019.
Sources of the contingent payments payable by us to Parion of $69.6 million and benefit from income taxes of $126.2 million related to these charges.Liquidity
As of SeptemberJune 30, 2017, we have deconsolidated Parion.
LIQUIDITY AND CAPITAL RESOURCES
As of September 30, 2017,2020, we had cash, cash equivalents and marketable securities of $1.81$5.5 billion,, which represented an increase of $378 million$1.6 billion from $1.43$3.8 billion as of December 31, 2016. In the nine months ended of September 30, 2017, our cash, cash equivalents and marketable securities balance increased due to cash receipts from product sales, cash received from issuances of common stock under our employee benefit plans and cash received from our collaboration with Merck KGaA in the first quarter of 2017, partially offset by the $300.0 million repayment of our revolving credit facility in the first quarter of 2017 and the $160.0 million payment to Concert in connection with the acquisition of VX-561 in the third quarter of 2017. We expect that our future cash flows will be substantially dependent on CF product sales.
Sources of Liquidity
2019. We intend to rely on our existing cash, cash equivalents and marketable securities together with cash flows from product sales as our primary source of liquidity.
We are receiving cash flows from sales of ORKAMBI and KALYDECO from the United States and ex-U.S. markets. Future net product revenues for ORKAMBI from ex-U.S. markets will be dependent on, among other things, the timing of and abilitymay borrow up to complete reimbursement discussions in European countries.
In February 2017, we repaid the $300.0 million we had borrowed under our $500.0 million pursuant to our revolving credit facility.facility that we entered into in 2019. We may repay and reborrow amounts under the revolving credit agreement without penalty. Subject to certain conditions, we may request that the borrowing capacity under this credit agreement be increased by an additional $300.0 million.$500.0 million, up to a total of $1.0 billion.
In the nine months ended September 30, 2017, we received significant proceeds from the issuance of common stock under our employee benefit plans, but the amount and timing of future proceeds from employee benefits plans is uncertain. Other possible sources of future liquidity include strategic collaborative agreements that include research and/or development funding, commercial debt, public and private offerings of our equity and debt securities, development milestones and
royalties on sales of products, software and equipment leases, strategic sales of assets or businesses and financial transactions. Negative covenants in our credit agreement may prohibit or limit our ability to access these sources of liquidity.
Future Capital Requirements
We incur substantialhave significant future capital requirements, including:
•significant expected operating expenses to conduct research and development activities and to operate our organization. Under the terms of our credit agreement entered into in October 2016, we are required to repay any outstanding principal amounts in 2021. We also have organization; and
•substantial facility and capital lease obligations, including leases for two buildings in Boston, Massachusetts that continue through 2028 and capital expenditures for our building under construction in San Diego, California. As of September 30, 2017, we have collected approximately $190.3 million from ORKAMBI early access programs in France for which the price is not fixed or determinable. We expect we will be required to repay a portion of the collected amounts to the French government based on the difference between the invoiced price of ORKAMBI and the final price for ORKAMBI in France.
2028.
In addition, weaddition:
•We have entered into certain collaboration agreements with third parties that include the funding of certain research, development and commercialization efforts with the potential for future milestone and royalty payments by us upon the achievement of pre-established developmental and regulatory targettargets and/or commercial targets, and we may enter into additional business development transactions, including acquisitions, collaborations and equity investments, that require additional capital.
•We have reached an agreement with the French government and will repay a portion of the amounts we have collected under the ORKAMBI early access programs in France to the French government in the second half of 2020 based on the difference between the invoiced amount and the final amount for ORKAMBI distributed through these programs as reflected in the structure of the agreement with the French government.
•To the extent we borrow amounts under the credit agreement we entered into in 2019, we would be required to repay any outstanding principal amounts in 2024.
•As of June 30, 2020, $164.0 million remained available to fund repurchases under our share repurchase program.
We expect that cash flows from ORKAMBI and KALYDECO,our products together with our current cash, cash equivalents and marketable securities will be sufficient to fund our operations for at least the next twelve months.months and do not expect COVID-19 to have an adverse effect on our liquidity. The adequacy of our available funds to meet our future operating and capital requirements will depend on many factors, including the amounts of future revenues generated by ORKAMBI and KALYDECOour products, and the potential introduction of one or more of our other drug candidates to the market, the level of our business development activities and the number, breadth, cost and prospects of our research and development programs.
Financing Strategy
We have a $500.0 million revolving credit facility that we entered into in October 2016. We may repay and reborrow amounts under the revolving credit agreement without penalty. In addition, subject to certain conditions, we may request that the borrowing capacity under this credit agreement be increased by an additional $300.0 million. We may raise additional capital by borrowing under credit agreements, through public offerings or private placements of our securities or securing new collaborative agreements or other methods of financing. We will continue to manage our capital structure and will consider all financing opportunities, whenever they may occur, that could strengthen our long-term liquidity profile. There can be no assurance that any such financing opportunities will be available on acceptable terms, if at all.
CONTRACTUAL COMMITMENTS AND OBLIGATIONS
Our commitments and obligations were reported in our Annual Report on Form 10-K for the year ended December 31, 2016,2019, which was filed with the Securities and Exchange Commission, or SEC, on February 23, 2017.13, 2020. There have been no material changes from the contractual commitments and obligations previously disclosed in that Annual Report on Form 10-K, except that:10-K.
In February 2017, we repaid the outstanding $300 million balance of our revolving credit facility.
In July 2017, we acquired certain CF assets including VX-561 from Concert pursuant to an asset purchase agreement. At closing, we paid Concert $160 million in cash for all worldwide development and commercialization rights to VX-561 and may be required to pay up to an additional $90 million in milestones based on regulatory approval in the U.S. and reimbursement in the UK, Germany or France.
CRITICAL ACCOUNTING POLICIES AND ESTIMATES
Our discussion and analysis of our financial condition and results of operations isare based upon our condensed consolidated financial statements prepared in accordance with generally accepted accounting principles in the United States. The preparation of these financial statements requires us to make certain estimates and assumptions that affect the reported amounts of assets and liabilities, the disclosure of contingent assets and liabilities at the date of the condensed consolidated financial statements and the reported amounts of revenues and expenses during the reported periods. These items are
monitored and analyzed by management for changes in facts and circumstances, and material changes in these estimates could occur in the future. Changes in estimates are reflected in reported results for the period in which the change occurs. We base our estimates on historical experience and various other assumptions that we believe to be reasonable under the circumstances. Actual results may differ from our estimates if past experience or other assumptions do not turn out to be substantially accurate. During the ninesix months ended SeptemberJune 30, 2017,2020, there were no material changes to our critical accounting policies as reported in our Annual Report on Form 10-K for the year ended December 31, 2016,2019, which was filed with the SEC on February 23, 2017.13, 2020.
RECENT ACCOUNTING PRONOUNCEMENTS
For a discussion of recent accounting pronouncements, please refer to Note A, “Basis of Presentation and Accounting Policies—Recent Accounting Pronouncements.Policies.”
Item 3. Quantitative and Qualitative Disclosures About Market Risk
As part of our investment portfolio, we own financial instruments that are sensitive to market risks. The investment portfolio is used to preserve our capital until it is required to fund operations, including our research and development activities. None of these market risk-sensitive instruments are held for trading purposes. We do not have derivative financial instruments in our investment portfolio.
Interest Rate Risk
We invest our cash in a variety of financial instruments, principally securities issued by the U.S. government and its agencies, investment-grade corporate bonds and commercial paper, and money market funds. These investments are denominated in U.S. dollars.Dollars. All of our interest-bearing securities are subject to interest rate risk and could decline in value if interest rates fluctuate.fluctuate, including potential fluctuations as a result of COVID-19. Substantially all of our investment portfolio consists of marketable securities with active secondary or resale markets to help ensure portfolio liquidity, and we have implemented guidelines limiting the term-to-maturity of our investment instruments. Due to the conservative nature of these instruments, we do not believe that we have a material exposure to interest rate risk. If interest rates were to increase or decrease by 1%, the fair value of our investment portfolio would increase or decrease by an immaterial amount.
In 2019, we entered into a credit agreement. Loans under the credit agreement bear interest, at our option, at either a base rate or a Eurocurrency rate, in each case plus an applicable margin. The applicable margin on base rate loans ranges from 0.125% to 0.50% and the applicable margin on Eurocurrency loans ranges from 1.125% to 1.50%, in each case, based on our consolidated leverage ratio (the ratio of our total consolidated funded indebtedness to our consolidated EBITDA for the most recently completed four fiscal quarter period). We do not believe that changes in interest rates related to the credit agreement would have a material effect on our financial statements. As of June 30, 2020, we had no principal or interest outstanding. A portion of our “Interest expense” in 2020 will be dependent on whether, and to what extent, we borrow amounts under the existing facility.
Foreign Exchange Market Risk
As a result of our foreign operations, we face exposure to movements in foreign currency exchange rates, primarily the Euro and British Pound Australian Dollar and Canadian Dollar, against the U.S. dollar.Dollar. Fluctuations in the global markets, including as a result of COVID-19, may have a positive or negative effect on our foreign exchange rate exposure. The current exposures arise primarily from cash, accounts receivable, intercompany receivables and payables, payables and accruals and inventories. Both positive and negative affectseffects to our net revenues from international product sales from movements in foreign currency exchange rates are partially mitigated by the natural, opposite affecteffect that foreign currency exchange rates have on our international operating costs and expenses.
We have a foreign currency management program with the objective of reducing the effect of exchange rate fluctuations on our operating results and forecasted revenues and expenses denominated in foreign currencies. We currently have cash flow hedges for the Euro, British Pound, Canadian Dollar and Australian Dollar related to a portion of our forecasted product revenues that qualify for hedge accounting treatment under U.S. GAAP. We do not seek hedge accounting treatment for our foreign currency forward contracts related to monetary assets and liabilities that impact our operating results. As of SeptemberJune 30, 2017,2020, we held foreign exchange forward contracts that were designated as cash flow hedges with notional amounts totaling $456.9 million. As of September 30, 2017, our outstanding foreign exchange forward contracts$931.2 million and had a net fair value of $(13.1) million.
Based$1.8 million recorded on our foreign currency exchange rate exposures at September 30, 2017,condensed consolidated balance sheet.
Although not predictive in nature, we believe a hypothetical 10% adverse fluctuationthreshold reflects a reasonably possible near-term change in exchange rates. Assuming that the June 30, 2020 exchange rates would decreasewere to change by a hypothetical 10%, the fair value ofrecorded on our condensed consolidated balance sheet related to our foreign exchange forward contracts that arewere designated as cash flow hedges as of June 30, 2020 would change by approximately $34.3 million at September 30, 2017. The resulting loss$93.1 million. However, since these contracts hedge a specific portion of our forecasted product revenues denominated in certain foreign currencies, any change in the fair value of these contracts is recorded in “Accumulated other comprehensive loss” on our condensed consolidated balance sheet and is reclassified to earnings in the same periods during which the underlying product revenues affect earnings. Therefore, any change in the fair value of these forward contracts that would result from a hypothetical 10% change in exchange rates would be entirely offset by the gain onchange in value associated with the underlying transactions and therefore would have minimalhedged product revenues resulting in no impact on our future anticipated earnings and cash flows. Similarly, adverse fluctuations in exchange rates that would decreaseflows with respect to the fair valuehedged portion of our foreign exchange forward contracts that are not designated as hedge instruments would be offsetforecasted product revenues.
Equity Price Risk
Information required by a positive impactthis section is incorporated by reference from the discussion in the “Strategic Investments” section of the underlying monetary assetsthis Part I, Item 2, “Management’s Discussion and liabilities.Analysis of Financial Condition and Results of Operations.”
Item 4. Controls and Procedures
Evaluation of Disclosure Controls and Procedures
Our management (under the supervision and with the participation of our chief executive officer and chief financial officer,officer), after evaluating the effectiveness of our disclosure controls and procedures (as defined in Rules 13a-15(e) and 15d-15(e) under the Securities Exchange Act of 1934, as amended) as of the end of the period covered by this Quarterly Report on Form 10-Q, havehas concluded that, based on such evaluation, as of SeptemberJune 30, 20172020 our disclosure controls and procedures were effective and designed to provide reasonable assurance that the information required to be disclosed is recorded, processed, summarized and reported within the time periods specified in the SEC’s rules and forms. In designing and evaluating our disclosure controls and procedures, our management recognized that any controls and procedures, no matter how well designed and operated, can provide only reasonable assurance of achieving the desired control objectives, and our management necessarily was required to apply its judgment in evaluating the cost-benefit relationship of possible controls and procedures.
Changes in Internal Controls Over Financial Reporting
No change in our internal control over financial reporting (as defined in Rules 13a-15(f) and 15d-15(f) under the Securities Exchange Act of 1934, as amended) occurred during the three months ended SeptemberJune 30, 20172020 that has materially affected, or is reasonably likely to materially affect, our internal control over financial reporting.
PART II. Other Information
Item 1. Legal Proceedings
There have been noWe are not currently subject to any material changes from the legal proceedings previously disclosed in our Annual Report on Form 10-K for the year ended December 31, 2016, which was filed with the Securities and Exchange Commission, or SEC, on February 23, 2017.proceedings.
Item 1A. Risk Factors
Information regarding risk factors appears in Part I, Item 1A1A. “Risk Factors” of our Annual Report on Form 10-K for the year ended December 31, 2016,2019, which was filed with the SEC on February 23, 2017.13, 2020. There have been no material changes from the risk factors previously disclosed in the Annual Report on Form 10-K, except as discussed in Part II, Item 1A. “Risk Factors” in our Quarterly Report on Form 10-Q for the quarter ended March 31, 2020, which was filed with the SEC on May 1, 2020 and is being updated below.
We are subject to risks associated with the spread of the novel strain of coronavirus, or COVID-19.
COVID-19 has broadly affected the global economy, resulted in significant travel and work restrictions in many regions and has put a significant strain on healthcare resources. COVID-19 has had, and we expect it will continue to have, an impact on our operations and an impact on the operations of our collaborators, third-party contractors and other entities, including governments, governmental agencies and payors, with which we interact. To date, the most significant effect on our business operations has been the requirement that a majority of our employees work remotely. We have re-initiated enrollment and dosing in all of our ongoing clinical trials and initiated new clinical trials despite some temporary pauses to enrollment and dosing caused by COVID-19. In the first fourfuture, the economic impacts of the COVID-19 outbreak could affect our business directly or indirectly, including potentially affecting the net prices for our products through changes in our payor mix as a result of increased unemployment in the United States or increased pressure on healthcare costs. The effects on our research, development, manufacturing and commercialization activities will be dependent on, among other things, the severity and duration of the COVID-19 outbreak as well as the impact of the outbreak on our third-party manufacturers, suppliers, distributors, subcontractors and customers. While the ultimate impact of COVID-19 on our business is highly uncertain, any negative impacts that materialize could materially adversely affect our operations, financial performance and stock price. Any negative impacts of COVID-19, alone or in combination with others, could exacerbate risk factors set forth below shall replace the first three risk factors set forthdiscussed in thePart I, “Item 1A. Risk Factors” in our Annual Report on Form 10-K and the fifth risk factor set forth below shall be added as a new risk factor.
All of our product revenues and the vast majority of our total revenues are derived from sales of medicines for the treatment of cystic fibrosis. If weyear ended December 31, 2019. The full extent to which the COVID-19 outbreak will negatively affect our operations, financial performance and stock price will depend on future developments that are unable to continue to increase revenues from sales of our cystic fibrosis medicines or if we do not meethighly uncertain and cannot be predicted, including the expectations of investors or public equity market analysts, our business would be materially harmedscope and the market price of our common stock would likely decline.
Substantially all of our product revenues and the vast majority of our total revenues are derived from the sale of CF medicines. As a result, our future success is dependent on our ability to continue to increase revenues from sales of our CF medicines. In the near term, this will require us to maintain KALYDECO net product revenues and increase ORKAMBI net product revenues. In the medium term, this will require us to obtain approval for, and successfully commercialize, tezacaftor in combination with ivacaftor. In the longer term, this will require us to successfully develop, obtain approval for and commercialize at least one triple-combination therapy that will allow us to treat patients who have one copyduration of the F508del mutation in their CFTR geneoutbreak and a second mutation in their CFTR gene that results in minimal CFTR function and to improve the treatment options available to patients with CF who are eligible for our current medicines. If we are unable to increase our CF product revenues or if we experience adverse developments with respect to development or commercialization of our CF medicines, our results of operations will be adversely affected and our business will be materially harmed.
We are investing significant resources in the development of our next-generation CFTR corrector compounds in triple combinations and if we are unable to show the safety and efficacy of these compounds, experience delays in doing so or are unable to successfully commercialize at least one of these medicines, our business would be materially harmed.
We are investing significant resources in the development of our next-generation CFTR corrector compounds, including VX-152, VX-440, VX-659 and VX-445, which we are evaluating as part of triple combination treatment regimens for the treatment of patients with CF. We believe that a significant portion of the long-term value attributed to our companyactions taken by investors is based on the commercial potential of these triple-combination therapies. In July 2017, we obtained initial positive results from Phase 2 clinical trials of VX-152 and VX-440 and a Phase 1 clinical trial of VX-659. In each case, these clinical trials enrolled a limited number of patients with CF and we expect to receive additional information regarding these compounds in early 2018. Based on these results, we expect to initiate pivotal programs to evaluate one or two of these triple combination regimens in the first half of 2018.
In order to ultimately obtain approval for a triple-combination regimen, we will need to demonstrate that the compounds are safe and effective in a significantly larger number of patients than were involved in the clinical trials conducted to date. Initial results from ongoing clinical trials may differ materially from final results from such clinical trials. The results from preclinical and early clinical studies do not always accurately predict results in later, large-scale clinical trials. If the data from our ongoing or planned clinical trials or non-clinical studies of triple combination regimens including our next-generation CFTR compounds are not favorable, the FDA and comparable foreign regulatorygovernmental authorities may not approve these treatment regimens and/or we may be forced to delay or terminate the development of these treatment regimens, which would have an adverse effect on our business. Even successfully completed large-scale clinical trials may not result in marketable medicines. If a triple combination that includes a next-generation CFTR corrector compounds fails to achieve its primary endpoint in clinical trials, if safety issues arise or if the results from our clinical trials are otherwise inadequate to support regulatory approval of our triple combination therapies, commercialization of that combination regimen could be delayed or halted.
Even if we gain marketing approval for one or more combination therapies containing a next-generation CFTR corrector compound in a timely manner, we cannot be sure that such combination therapy will be commercially successful. In addition, since we expect that a significant portion of the patients for whom a triple combination treatment regimen would be indicated would also be eligible for our then existing medicines, a portion of the revenues from our triple combination regimens will likely displace revenues from our then marketed products reducing the overall effect of the commercialization of our triple combination regimens on our total revenues.
If the anticipated or actual timing of marketing approvals for these compounds, or the market acceptance of these compounds, if approved, including treatment reimbursement levels agreed to by third-party payors, do not meet the expectations of investors or public market analysts, the market price of our common stock would likely decline.
Our business currently depends heavily on ORKABMI and KALYDECO net product revenues and we expect to continue to depend on these revenues at least until we obtain approval for tezacaftor in combination with ivacaftor.
Our two marketed medicines are ORKAMBI and KALYDECO, which are approved to treat patients with CF who have specific mutations in their CFTR gene. ORKAMBI and KALYDECO net product revenues represented approximately 52% and 32% of our total revenues in the nine months ended September 30, 2017, respectively, and we expect ORKAMBI and KALYDECO net product revenues to represent substantially all of our total revenues for the remainder of 2017.
A majority of our net product revenues are from sales of ORKAMBI and most of our ORKAMBI net product revenues have come from the United States. We have recognized limited ex-U.S. net product revenues due to the ongoing reimbursement discussions in many ex-U.S. countries and have experienced challenges in the commercialization of ORKAMBI both in the United States and in ex-U.S. markets. Our ORKAMBI U.S. revenues have been affected by uptake, discontinuations and compliance rates. Our ORKAMBI ex-U.S. revenues have been affected by the same factors as our U.S. ORKAMBI revenues and challenges with respect to obtaining reimbursement for ORKAMBI in ex-U.S. markets. Factors that affect our ORKAMBI net product revenues include:
the rate at which patients initiate treatment of ORKAMBI, the proportion of initiated patients who remain on treatment and the compliance rate for patients who remain on treatment;
the safety and efficacy profile of ORKAMBI;
our ability to obtain reimbursement for ORKAMBI and any changes in reimbursement policies of payors and other third parties; and
legal, administrative, regulatory or legislative developments, including pricing limitations.
Since the regulations that govern pricing, coverage and reimbursement for drugs vary widely from country to country, there is no assurance that coverage and reimbursement will be available outside of the United States and, even if it is available, the timing or the level of reimbursement may not be satisfactory. Adverse pricing limitations or a delay in obtaining coverage and reimbursement would decrease our future net product revenues and harm our business.
If we continue to experience challenges with the commercialization of ORKAMBI or are unable to sustain KALYDECO net product revenues or if either medicine were to become subject to problems such as safety or efficacy issues, the introduction or greater acceptance of competing products, changes in reimbursement policies of payors and other third parties or adverse legal, administrative, regulatory or legislative developments, our ability commercialization of our products would be impaired and our stock price would likely decline.
Our business depends onin response to the success of tezacaftor in combination with ivacaftor, which has not been approved by the FDA or the European Commission. If we are unable to obtain marketing approval or experience material delays in obtaining marketing approval for, or reimbursement arrangements relating to, tezacaftor in combination with ivacaftor, our business could be materially harmed.
In the first quarter of 2017, we obtained positive results from two Phase 3 clinical trials of tezacaftor in combination with ivacaftor that showed statistically significant improvements in lung function in patients with CF 12 years of age and older who have certain mutations in their CFTR gene. Based on these results, we submitted an NDA in the United States and an MAA in Europe for this potential combination regimen. The target date for the FDA to complete its review of the NDA under the Prescription Drug User Fee Act is February 28, 2018. We expect the EMA to complete its review in the second half
of 2018. Obtaining approval of an NDA or an MAA is a lengthy, expensive and uncertain process, and we may not be successful. Obtaining approval depends on many factors including:
whether or not the FDA and European regulatory authorities determine that the evidence gathered in well-controlled clinical trials, other clinical trials and nonclinical studies demonstrates that the combination regimen is safe; and
whether or not the FDA and European regulatory authorities are satisfied that the manufacturing facilities, processes and controls for the combination are adequate, that the labeling is satisfactory and that plans for post-marketing studies, safety monitoring and risk evaluation and mitigation are sufficient.
Obtaining marketing approval for the combination of tezacaftor and ivacaftor in one country or region does not ensure that we will be able to obtain marketing approval in any other country or region.
Even if a tezacaftor in combination with ivacaftor is approved, the FDA or the European Commission, as the case may be, may limit the indications for which the product may be marketed, require extensive warnings on the product labeling or require expensive and time-consuming clinical trials or reporting as conditions of approval. If we experience material delays in obtaining marketing approval for the combination of tezacaftor and ivacaftor in either the United States or Europe, our future net product revenues and cash flows will be adversely effected. If we do not obtain approval to market the combination of tezacaftor and ivacaftor in the United States or Europe, our business will be materially harmed. Additionally, even if the combination of tezacaftor and ivacaftor receives marketing approval, coverage and reimbursement may not be available and, even if it is available, the level of reimbursement may not be satisfactory.
We may not realize the anticipated benefits of our acquisition of VX-561 from Concert Pharmaceuticals, Inc.
In July 2017, we acquired certain CF assets from Concert Pharmaceuticals, Inc., or Concert, including VX-561, an investigational CFTR potentiator that has the potential to be used as part of future once-daily combination regimens of CFTR modulators that treat the underlying cause of CF. We amended our ongoing Phase 2 clinical trials of VX-445 and VX-659 to include additional cohorts of patients to evaluate these next-generation CFTR corrector compounds in combination with tezacaftor and VX-561. Acquisitions are inherently risky and we may not realize the anticipated benefits of such transaction, which involves numerous risks including:
that we fail to successfully develop and/or integrate VX-561 into our pipeline in order to achieve our strategic objectives;
that we receive inadequate or unfavorable data from clinical trials evaluating the VX-561 in combination with other CFTR modulators; and
the potential failure of the due diligence processes to identify significant problems, liabilities or other shortcomings or challenges of VX-561 or any of the other assets acquired from Concert, including but not limited to, problems, liabilities or other shortcomings or challenges with respect to intellectual property, product quality, safety, and other known and unknown liabilities.
outbreak.
SPECIAL NOTE REGARDING FORWARD-LOOKING STATEMENTS
This Quarterly Report on Form 10-Q and, in particular, our Management’s Discussion and Analysis of Financial Condition and Results of Operations set forth in Part I-ItemI, Item 2, contain or incorporate a number of forward-looking statements within the meaning of Section 27A of the Securities Act of 1933, as amended, and Section 21E of the Securities Exchange Act of 1934, as amended, including statements regarding:
•our expectations regarding the amount of, timing of, and trends with respect to our financial performance, including revenues, costs and expenses and other gains and losses, including those related to net product revenues from KALYDECOrevenues;
•our expectations regarding the effect of COVID-19 on, among other things, our financial performance, liquidity, business and ORKAMBI;operations, including, manufacturing, supply chain, research and development activities and pipeline programs;
•our expectations regarding clinical trials, development timelines, regulatory authority filings, submissions and potential approvals and label expansions for ivacaftor, lumacaftor, tezacaftor, elexacaftor, and any combination regimen;
•our ability to obtain reimbursement for our medicines in the U.S. and ex-U.S. markets and our ability to launch, commercialize and market our medicines or any of our other drug candidates for which we obtain regulatory approval;
•our expectations regarding the timing and structure of clinical trials of our drugs, drug candidates and other pipeline programs and the expected timing of our receipt of data from our ongoing and planned clinical trials and regulatory authority filings and submissions for our products and drug candidates, including the NDA and MAA submission for tezacaftor in combination with ivacaftor and the ongoing and planned clinical trials to evaluate our next-generation CFTR correctors;trials;
our ability to successfully market KALYDECO and ORKAMBI or any of our other drug candidates for which we obtain regulatory approval;
•the data that will be generated by ongoing and planned clinical trials and the ability to use that data to advance compounds, continue development or support regulatory filings;
•our beliefs regarding the support provided by clinical trials and preclinical and nonclinical studies of our drug candidates and other pipeline programs for further investigation, clinical trials or potential use as a treatment;
•our plan to continue investing in our research and development programs, including anticipated timelines for our programs, and our strategy to develop our drug candidates,pipeline programs, alone or with third party-collaborators;
•the potential future benefits of our acquisitions and collaborations;
•the establishment, development and maintenance of collaborative relationships;relationships, including potential milestone payments or other obligations;
•potential business development activities;activities, including the identification of potential collaborative partners or acquisition targets;
our post-closing integration of the assets acquired from Concert;
•potential fluctuations in foreign currency exchange rates;
•our expectations regarding our provision for or benefit from income taxes and the utilization of our deferred tax assets;
•our ability to use our research programs to identify and develop new drug candidates to address serious diseases and significant unmet medical needs; and
•our liquidity and our expectations regarding the possibility of raising additional capital.
Any or all of our forward-looking statements in this Quarterly Report on Form 10-Q may turn out to be wrong. They can be affected by inaccurate assumptions or by known or unknown risks and uncertainties. Many factors mentioned in this Quarterly Report on Form 10-Q will be important in determining future results. Consequently, no forward-looking statement can be guaranteed. Actual future results may vary materially from expected results. We also provide a cautionary discussion of risks and uncertainties under “Risk Factors” in Item 1A of our Annual Report on Form 10-K for the year ended December 31, 2016,2019, which was filed with the SEC on February 23, 2017.13, 2020 and our Quarterly Report on Form 10-Q for the quarter ended March 31, 2020, which was filed with the SEC on May 1, 2020. These are factors and uncertainties that we think could cause our actual results to differ materially from expected results. Other factors and uncertainties besides those listed there could also adversely affect us.
Without limiting the foregoing, the words “believes,” “anticipates,” “plans,” “intends,” “expects”“expects,” “could,” “may,” “potential,” “will,” “estimate” and similar expressions are intended to identify forward-looking statements. There are a number of factors and uncertainties that could cause actual events or results to differ materially from those indicated by such forward-looking statements, many of which are beyond our control. In addition, the forward-looking statements contained herein represent our estimate only as of the date of this filing and should not be relied upon as representing our estimate as of any subsequent date. While we may elect to update these forward-looking statements at some point in the future, we specifically disclaim any obligation to do so to reflect actual results, changes in assumptions or changes in other factors affecting such forward-looking statements.
Item 2. Unregistered Sales of Equity Securities and Use of Proceeds
Issuer Repurchases of Equity Securities
The table set forth below shows all repurchasesIn July 2019, our Board of securities by us duringDirectors approved a share repurchase program (the “2019 Share Repurchase Program”), pursuant to which we are authorized to repurchase up to $500.0 million of our common stock between August 1, 2019 and December 31, 2020. During the three monthsquarter ended SeptemberJune 30, 2017:
|
| | | | | |
| Period | | Total Number
of Shares Purchased | Average Price
Paid per Share | Total Number of Shares
Purchased as Part of
Publicly Announced
Plans or Programs | Maximum Number of
Shares that May Yet
be Purchased Under
the Plans or Programs |
| July 1, 2017 to July 31, 2017 | 2,040 | $0.01 | — | — |
| August 1, 2017 to August 31, 2017 | 15,811 | $0.01 | — | — |
| September 1, 2017 to September 30, 2017 | 2,589 | $0.01 | — | — |
| Total | 20,440 | $0.01 | — | — |
The repurchases were made2020, we did not repurchase any shares of our common stock. As of June 30, 2020, we had purchased a total of 1,617,416 shares at a cost of $336.0 million under the terms2019 Share Repurchase Program. As of June 30, 2020, $164.0 million remained available to fund repurchases under the 2019 Share Repurchase Program.
Under our Amended and Restated 2006 Stock and Option Plan and our Amended and Restated 2013 Stock and Option Plan. Under these plans, we award shares of restricted stock to our employees that typically are subject to a lapsing right of repurchase by us. We may exercise this right of repurchase if a restricted stock recipient’s service to us is terminated. If we exercise this right,2019 Share Repurchase Program, we are requiredauthorized to repaypurchase shares from time to time through open market or privately negotiated transactions. Such purchases may be made pursuant to Rule 10b5-1 plans or other means as determined by our management and in accordance with the purchase price paid by or on behalfrequirements of the recipient for the repurchased restricted shares, which typically is the par value per shareSecurities and Exchange Commission.
Item 6. Exhibits
|
| | | | | | | |
| Exhibit Number | Exhibit Description | |
10.13.2 | | |
| 10.1 |
| |
10.231.1 | |
31.1 | | |
| 31.2 | | |
| 32.1 | | |
| 101.INS | XBRL Instance - the instance document does not appear in the Interactive Data File because its XBRL tags are embedded within the Inline XBRL document. | |
| 101.SCH | XBRL Taxonomy Extension Schema | |
| 101.CAL | XBRL Taxonomy Extension Calculation | |
| 101.LAB | XBRL Taxonomy Extension Labels | |
| 101.PRE | XBRL Taxonomy Extension Presentation | |
| 101.DEF | XBRL Taxonomy Extension Definition | |
| 104 | Cover Page Interactive Data File––the cover page interactive data file does not appear in the Interactive Data File because its XBRL tags are embedded within the Inline XBRL document. | |
| * Management contract, compensatory plan or agreement. | |
* Management contract, compensatory plan or agreement.
SIGNATURES
Pursuant to the requirements of the Securities Exchange Act of 1934, the registrant has duly caused this report to be signed on its behalf by the undersigned thereunto duly authorized.
| | | | | | | | |
| Vertex Pharmaceuticals Incorporated | |
| | |
| Vertex Pharmaceuticals Incorporated |
| | |
October 30, 2017July 31, 2020 | By: | /s/ Thomas GraneyCharles F. Wagner, Jr. |
| | Thomas GraneyCharles F. Wagner, Jr. |
| | SeniorExecutive Vice President, and Chief Financial Officer
(principal financial officer and
duly authorized officer) |