UNITED STATES
SECURITIES AND EXCHANGE COMMISSION
WASHINGTON, D.C. 20549
|
| |
x | QUARTERLY REPORT PURSUANT TO SECTION 13 OR 15(d) OF THE SECURITIES EXCHANGE ACT OF 1934 |
FOR THE QUARTERLY PERIOD ENDED SEPTEMBER 30, 2017 |
or |
o | TRANSITION REPORT PURSUANT TO SECTION 13 OR 15(d) OF THE SECURITIES EXCHANGE ACT OF 1934 |
FOR THE TRANSITION PERIOD FROM TO
|
☒ QUARTERLY REPORT PURSUANT TO SECTION 13 OR 15(d) OF THE SECURITIES EXCHANGE ACT OF 1934FOR THE QUARTERLY PERIOD ENDED SEPTEMBER 30, 2022
or
☐ TRANSITION REPORT PURSUANT TO SECTION 13 OR 15(d) OF THE SECURITIES EXCHANGE ACT OF 1934
FOR THE TRANSITION PERIOD FROM TO
Commission file number 000-19319
Vertex Pharmaceuticals Incorporated
(Exact name of registrant as specified in its charter)
Massachusetts
(State or other jurisdiction of incorporation or organization)
50 Northern Avenue, Boston, Massachusetts
(Address of principal executive offices)
|
| |
Massachusetts | 04-3039129 |
(State or other jurisdiction of
incorporation or organization) | (I.R.S. Employer
Identification No.) |
50 Northern Avenue, Boston, Massachusetts | 02210 |
(Address of principal executive offices) | (Zip Code) |
04-3039129
(I.R.S. Employer Identification No.)
02210
(Zip Code)
Registrant’s telephone number, including area code (617) 341-6100
| | | | | | | | | | | | | | |
| Securities registered pursuant to Section 12(b) of the Act: |
| Title of each class | | Trading Symbol | | Name of each exchange on which registered |
| Common Stock, $0.01 Par Value Per Share | | VRTX | | The Nasdaq Global Select Market |
Indicate by check mark whether the registrant: (1) has filed all reports required to be filed by Section 13 or 15(d) of the Securities Exchange Act of 1934 during the preceding 12 months (or for such shorter period that the registrant was required to file such reports), and (2) has been subject to such filing requirements for the past 90 days. Yes x☒ No o☐
Indicate by check mark whether the registrant has submitted electronically and posted on its corporate Web site, if any, every Interactive Data File required to be submitted and posted pursuant to Rule 405 of Regulation S-T (§232.405 of this chapter) during the preceding 12 months (or for such shorter period that the registrant was required to submit and post such files). Yes x☒ No o☐
Indicate by check mark whether the registrant is a large accelerated filer, an accelerated filer, a non-accelerated filer, a smaller reporting company, or an emerging growth company. See the definitions of “large accelerated filer,” “accelerated filer,” “smaller reporting company,” and “emerging growth company” in Rule 12b-2 of the Exchange Act.
Large accelerated filer ☒ Accelerated filer ☐ Non-accelerated filer ☐ Smaller reporting company ☐ Emerging growth company ☐ |
| | | |
Large accelerated filer x
| Accelerated filer o
| Non-accelerated filer o
| Smaller reporting company o
|
| | | |
Emerging growth company o
| (Do not check if a smaller reporting company) |
If an emerging growth company, indicate by check mark if the registrant has elected not to use the extended transition period for complying with any new or revised financial accounting standards provided pursuant to Section 13(a) of the Exchange Act. o☐
Indicate by check mark whether the registrant is a shell company (as defined in Rule 12b-2 of the Exchange Act). Yes o☐ No x☒
Indicate the number of shares outstanding of each of the issuer’s classes of common stock, as of the latest practicable date.
|
| | | | | | | |
| Common Stock, par value $0.01 per share | 252,902,848 |
Class256,691,452 | Outstanding at October 20, 201721, 2022 |
VERTEX PHARMACEUTICALS INCORPORATED
FORM 10-Q
FOR THE QUARTER ENDED SEPTEMBER 30, 20172022
TABLE OF CONTENTS
“We,Vertex,” “we,” “us,” “Vertex” and the “Company”“our” as used in this Quarterly Report on Form 10-Q refer to Vertex Pharmaceuticals Incorporated, a Massachusetts corporation, and its subsidiaries.
“Vertex®,” “KALYDECO®,” “ORKAMBI®,” “SYMDEKO®,” “SYMKEVI®,” “TRIKAFTA®” and “ORKAMBI“KAFTRIO®” are registered trademarks of Vertex. Other brands, names and trademarks contained in this Quarterly Report on Form 10-Q are the property of their respective owners.
We use the brand name for our products when we refer to the product that has been approved and with respect to the indications on the approved label. Otherwise, including in discussions of our cystic fibrosis development programs, we refer to our compounds by their scientific (or generic) name or VX developmental designation.
Part I. Financial Information
Item 1. Financial Statements
VERTEX PHARMACEUTICALS INCORPORATED
Condensed Consolidated Statements of Operations
(unaudited)
(in thousands,millions, except per share amounts)
| | | | | | | | | | | | | | | | | | | | | | | |
| Three Months Ended September 30, | | Nine Months Ended September 30, |
| 2022 | | 2021 | | 2022 | | 2021 |
| Revenues: | | | | | | | |
| Product revenues, net | $ | 2,334.3 | | | $ | 1,984.1 | | | $ | 6,628.0 | | | $ | 5,500.8 | |
| Other revenues | — | | | — | | | — | | | 1.0 | |
| Total revenues | 2,334.3 | | | 1,984.1 | | | 6,628.0 | | | 5,501.8 | |
| Costs and expenses: | | | | | | | |
| Cost of sales | 289.4 | | | 236.5 | | | 797.0 | | | 656.8 | |
| Research and development expenses | 645.0 | | | 467.0 | | | 1,846.2 | | | 1,370.0 | |
| Acquired in-process research and development expenses | 29.0 | | | 26.7 | | | 92.9 | | | 986.8 | |
| Selling, general and administrative expenses | 246.8 | | | 198.2 | | | 677.3 | | | 584.9 | |
| Change in fair value of contingent consideration | (2.6) | | | 1.2 | | | (59.3) | | | (1.1) | |
| Total costs and expenses | 1,207.6 | | | 929.6 | | | 3,354.1 | | | 3,597.4 | |
| Income from operations | 1,126.7 | | | 1,054.5 | | | 3,273.9 | | | 1,904.4 | |
| Interest income | 46.2 | | | 1.1 | | | 58.6 | | | 3.7 | |
| Interest expense | (13.7) | | | (15.2) | | | (43.2) | | | (46.4) | |
| Other income (expense), net | 17.2 | | | 42.4 | | | (133.7) | | | (2.2) | |
| Income before provision for income taxes | 1,176.4 | | | 1,082.8 | | | 3,155.6 | | | 1,859.5 | |
| Provision for income taxes | 245.9 | | | 230.9 | | | 652.5 | | | 287.5 | |
| Net income | $ | 930.5 | | | $ | 851.9 | | | $ | 2,503.1 | | | $ | 1,572.0 | |
| | | | | | | |
| Net income per common share: | | | | | | | |
| Basic | $ | 3.63 | | | $ | 3.30 | | | $ | 9.78 | | | $ | 6.08 | |
| Diluted | $ | 3.59 | | | $ | 3.28 | | | $ | 9.68 | | | $ | 6.03 | |
| Shares used in per share calculations: | | | | | | | |
| Basic | 256.5 | | | 257.9 | | | 255.8 | | | 258.7 | |
| Diluted | 259.5 | | | 259.7 | | | 258.7 | | | 260.9 | |
|
| | | | | | | | | | | | | | | |
| | Three Months Ended September 30, | | Nine Months Ended September 30, |
| | 2017 | | 2016 | | 2017 | | 2016 |
| Revenues: | | | | | | | |
| Product revenues, net | $ | 549,642 |
| | $ | 409,689 |
| | $ | 1,544,252 |
| | $ | 1,229,750 |
|
| Royalty revenues | 2,231 |
| | 3,835 |
| | 6,643 |
| | 12,713 |
|
| Collaborative revenues | 26,292 |
| | 259 |
| | 286,123 |
| | 1,008 |
|
| Total revenues | 578,165 |
| | 413,783 |
| | 1,837,018 |
| | 1,243,471 |
|
| Costs and expenses: | | | | | | | |
| Cost of product revenues | 72,186 |
| | 53,222 |
| | 188,963 |
| | 147,165 |
|
| Royalty expenses | 688 |
| | 855 |
| | 2,104 |
| | 2,813 |
|
| Research and development expenses | 454,947 |
| | 272,370 |
| | 1,017,961 |
| | 799,238 |
|
| Sales, general and administrative expenses | 120,710 |
| | 106,055 |
| | 361,285 |
| | 322,921 |
|
| Restructuring expenses, net | 337 |
| | 8 |
| | 13,859 |
| | 1,038 |
|
| Intangible asset impairment charge | 255,340 |
| | — |
| | 255,340 |
| | — |
|
| Total costs and expenses | 904,208 |
| | 432,510 |
| | 1,839,512 |
| | 1,273,175 |
|
| Loss from operations | (326,043 | ) | | (18,727 | ) | | (2,494 | ) | | (29,704 | ) |
| Interest expense, net | (13,574 | ) | | (20,140 | ) | | (45,003 | ) | | (60,993 | ) |
| Other (expenses) income, net | (77,553 | ) | | (167 | ) | | (80,634 | ) | | 3,025 |
|
| Loss before (benefit from) provision for income taxes | (417,170 | ) | | (39,034 | ) | | (128,131 | ) | | (87,672 | ) |
| (Benefit from) provision for income taxes | (125,903 | ) | | 503 |
| | (117,581 | ) | | 24,118 |
|
| Net loss | (291,267 | ) | | (39,537 | ) | | (10,550 | ) | | (111,790 | ) |
| Loss (income) attributable to noncontrolling interest | 188,315 |
| | 696 |
| | 173,350 |
| | (33,207 | ) |
| Net (loss) income attributable to Vertex | $ | (102,952 | ) | | $ | (38,841 | ) | | $ | 162,800 |
| | $ | (144,997 | ) |
| | | | | | | | |
| Amounts per share attributable to Vertex common shareholders: | | | | | | | |
| Net (loss) income: | | | | | | | |
| Basic | $ | (0.41 | ) | | $ | (0.16 | ) | | $ | 0.66 |
| | $ | (0.59 | ) |
| Diluted | $ | (0.41 | ) | | $ | (0.16 | ) | | $ | 0.64 |
| | $ | (0.59 | ) |
| Shares used in per share calculations: | | | | | | | |
| Basic | 250,268 |
| | 244,920 |
| | 247,963 |
| | 244,529 |
|
| Diluted | 250,268 |
| | 244,920 |
| | 252,095 |
| | 244,529 |
|
The accompanying notes are an integral part of these condensed consolidated financial statements.
VERTEX PHARMACEUTICALS INCORPORATED
Condensed Consolidated Statements of Comprehensive Income (Loss)
(unaudited)
(in thousands)millions)
|
| | | | | | | | | | | | | | | |
| | Three Months Ended September 30, | | Nine Months Ended September 30, |
| | 2017 | | 2016 | | 2017 | | 2016 |
| Net loss | $ | (291,267 | ) | | $ | (39,537 | ) | | $ | (10,550 | ) | | $ | (111,790 | ) |
| Changes in other comprehensive loss: | | | | | | | |
| Unrealized holding gains (losses) on marketable securities, net of tax of zero, respectively | 5,961 |
| | (96 | ) | | (7,786 | ) | | 104 |
|
| Unrealized (losses) gains on foreign currency forward contracts, net of tax of $0.9 million, $0.2 million, $2.9 million and $(0.4) million, respectively | (5,453 | ) | | 2,149 |
| | (27,379 | ) | | 1,936 |
|
| Foreign currency translation adjustment | (3,884 | ) | | (2,508 | ) | | (11,137 | ) | | (7,709 | ) |
| Total changes in other comprehensive loss | (3,376 | ) | | (455 | ) | | (46,302 | ) | | (5,669 | ) |
| Comprehensive loss | (294,643 | ) | | (39,992 | ) | | (56,852 | ) | | (117,459 | ) |
| Comprehensive loss (income) attributable to noncontrolling interest | 188,315 |
| | 696 |
| | 173,350 |
| | (33,207 | ) |
| Comprehensive (loss) income attributable to Vertex | $ | (106,328 | ) | | $ | (39,296 | ) | | $ | 116,498 |
| | $ | (150,666 | ) |
| | | | | | | | | | | | | | | | | | | | | | | |
| Three Months Ended September 30, | | Nine Months Ended September 30, |
| 2022 | | 2021 | | 2022 | | 2021 |
| Net income | $ | 930.5 | | | $ | 851.9 | | | $ | 2,503.1 | | | $ | 1,572.0 | |
| Other comprehensive income: | | | | | | | |
| Unrealized holding losses on marketable securities, net | (0.6) | | | (0.0) | | | (3.6) | | | (0.3) | |
| Unrealized gains on foreign currency forward contracts, net of tax of $(16.0), $(9.6), $(34.3) and $(21.2), respectively | 58.8 | | | 34.7 | | | 128.1 | | | 77.0 | |
| Foreign currency translation adjustment | (18.1) | | | 2.0 | | | (42.8) | | | 3.3 | |
| Total other comprehensive income | 40.1 | | | 36.7 | | | 81.7 | | | 80.0 | |
| Comprehensive income | $ | 970.6 | | | $ | 888.6 | | | $ | 2,584.8 | | | $ | 1,652.0 | |
The accompanying notes are an integral part of these condensed consolidated financial statements.
VERTEX PHARMACEUTICALS INCORPORATED
Condensed Consolidated Balance Sheets
(unaudited)
(in thousands,millions, except share and per share amounts)data)
| | | | September 30, | | December 31, | | September 30, | | December 31, |
| | 2017 | | 2016 | | 2022 | | 2021 |
| Assets | | | | Assets | | | |
| Current assets: | | | | Current assets: | |
| Cash and cash equivalents | $ | 1,384,966 |
| | $ | 1,183,945 |
| Cash and cash equivalents | $ | 9,171.5 | | | $ | 6,795.0 | |
| Marketable securities, available for sale | 427,282 |
| | 250,612 |
| |
| Restricted cash and cash equivalents (VIE) | 1,803 |
| | 47,762 |
| |
| Marketable securities | | Marketable securities | 599.2 | | | 729.9 | |
| Accounts receivable, net | 263,493 |
| | 201,083 |
| Accounts receivable, net | 1,385.2 | | | 1,136.8 | |
| Inventories | 98,192 |
| | 77,604 |
| Inventories | 388.2 | | | 353.1 | |
| Prepaid expenses and other current assets | 152,238 |
| | 70,534 |
| Prepaid expenses and other current assets | 726.9 | | | 545.8 | |
| Total current assets | 2,327,974 |
| | 1,831,540 |
| Total current assets | 12,271.0 | | | 9,560.6 | |
| Property and equipment, net | 759,978 |
| | 698,362 |
| Property and equipment, net | 1,118.7 | | | 1,094.1 | |
| Goodwill | | Goodwill | 1,075.2 | | | 1,002.2 | |
| Intangible assets | 29,000 |
| | 284,340 |
| Intangible assets | 603.6 | | | 400.0 | |
| Goodwill | 50,384 |
| | 50,384 |
| |
| Cost method investments | 20,447 |
| | 20,276 |
| |
| Deferred tax assets | | Deferred tax assets | 1,162.7 | | | 934.5 | |
| Operating lease assets | | Operating lease assets | 342.7 | | | 330.3 | |
| Other assets | 10,542 |
| | 11,885 |
| Other assets | 132.5 | | | 110.8 | |
| Total assets | $ | 3,198,325 |
| | $ | 2,896,787 |
| Total assets | $ | 16,706.4 | | | $ | 13,432.5 | |
| Liabilities and Shareholders’ Equity | | | | Liabilities and Shareholders’ Equity | | | |
| Current liabilities: | | | | Current liabilities: | |
| Accounts payable | $ | 77,138 |
| | $ | 61,451 |
| Accounts payable | $ | 126.9 | | | $ | 195.0 | |
| Accrued expenses | 378,554 |
| | 315,249 |
| Accrued expenses | 2,264.4 | | | 1,678.6 | |
| Deferred revenues, current portion | 13,003 |
| | 6,005 |
| |
| Accrued restructuring expenses, current portion | 4,205 |
| | 6,047 |
| |
| Capital lease obligations, current portion | 19,881 |
| | 19,426 |
| |
| Customer deposits | 190,272 |
| | 73,416 |
| |
| Credit facility | — |
| | 300,000 |
| |
| Other liabilities, current portion | 27,686 |
| | 10,943 |
| |
| Other current liabilities | | Other current liabilities | 218.0 | | | 268.4 | |
| Total current liabilities | 710,739 |
| | 792,537 |
| Total current liabilities | 2,609.3 | | | 2,142.0 | |
| Deferred revenues, excluding current portion | 2,917 |
| | 6,632 |
| |
| Accrued restructuring expenses, excluding current portion | 146 |
| | 1,907 |
| |
| Capital lease obligations, excluding current portion | 20,259 |
| | 34,976 |
| |
| Deferred tax liability | 10,682 |
| | 134,063 |
| |
| Construction financing lease obligation, excluding current portion | 547,051 |
| | 486,359 |
| |
| Advance from collaborator | 77,258 |
| | 73,423 |
| |
| Other liabilities, excluding current portion | 26,029 |
| | 28,699 |
| |
| Long-term finance lease liabilities | | Long-term finance lease liabilities | 442.3 | | | 509.8 | |
| Long-term operating lease liabilities | | Long-term operating lease liabilities | 382.3 | | | 377.4 | |
| Long-term contingent consideration | | Long-term contingent consideration | 127.2 | | | 186.5 | |
| Other long-term liabilities | | Other long-term liabilities | 115.7 | | | 116.8 | |
| Total liabilities | 1,395,081 |
| | 1,558,596 |
| Total liabilities | 3,676.8 | | | 3,332.5 | |
| Commitments and contingencies |
|
| |
|
| Commitments and contingencies | — | | | — | |
| Shareholders’ equity: | | | | Shareholders’ equity: | |
| Preferred stock, $0.01 par value; 1,000,000 shares authorized; none issued and outstanding | — |
| | — |
| Preferred stock, $0.01 par value; 1,000,000 shares authorized; none issued and outstanding | — | | | — | |
| Common stock, $0.01 par value; 500,000,000 shares authorized; 252,683,346 and 248,300,517 shares issued and outstanding at September 30, 2017 and December 31, 2016, respectively | 2,500 |
| | 2,450 |
| |
| Common stock, $0.01 par value; 500,000,000 shares authorized, 256,645,737 and 254,479,046 shares issued and outstanding, respectively | | Common stock, $0.01 par value; 500,000,000 shares authorized, 256,645,737 and 254,479,046 shares issued and outstanding, respectively | 2.6 | | | 2.5 | |
| Additional paid-in capital | 7,034,113 |
| | 6,506,795 |
| Additional paid-in capital | 7,225.5 | | | 6,880.8 | |
| Accumulated other comprehensive (loss) income | (25,129 | ) | | 21,173 |
| |
| Accumulated deficit | (5,220,407 | ) | | (5,373,836 | ) | |
| Total Vertex shareholders’ equity | 1,791,077 |
| | 1,156,582 |
| |
| Noncontrolling interest | 12,167 |
| | 181,609 |
| |
| Accumulated other comprehensive income | | Accumulated other comprehensive income | 97.6 | | | 15.9 | |
| Retained earnings | | Retained earnings | 5,703.9 | | | 3,200.8 | |
| Total shareholders’ equity | 1,803,244 |
| | 1,338,191 |
| Total shareholders’ equity | 13,029.6 | | | 10,100.0 | |
| Total liabilities and shareholders’ equity | $ | 3,198,325 |
| | $ | 2,896,787 |
| Total liabilities and shareholders’ equity | $ | 16,706.4 | | | $ | 13,432.5 | |
The accompanying notes are an integral part of these condensed consolidated financial statements.
VERTEX PHARMACEUTICALS INCORPORATED
Condensed Consolidated Statements of Shareholders’ Equity and Noncontrolling Interest
(unaudited)
|
| | | | | | | | | | | | | | | | | | | | | | | | | | | | | | |
| | Common Stock | | Additional
Paid-in Capital | | Accumulated
Other
Comprehensive (Loss) Income | | Accumulated Deficit | | Total Vertex
Shareholders’ Equity | | Noncontrolling
Interest | | Total
Shareholders’ Equity |
| | Shares | | Amount | | | | | | |
| Balance at December 31, 2015 | 246,307 |
| | $ | 2,427 |
| | $ | 6,197,500 |
| | $ | 1,824 |
| | $ | (5,261,784 | ) | | $ | 939,967 |
| | $ | 153,661 |
| | $ | 1,093,628 |
|
| Other comprehensive loss, net of tax | — |
| | — |
| | — |
| | (5,669 | ) | | — |
| | (5,669 | ) | | — |
| | (5,669 | ) |
| Net (loss) income | — |
| | — |
| | — |
| | — |
| | (144,997 | ) | | (144,997 | ) | | 33,207 |
| | (111,790 | ) |
| Issuance of common stock under benefit plans | 1,722 |
| | 19 |
| | 50,875 |
| | — |
| | — |
| | 50,894 |
| | — |
| | 50,894 |
|
| Stock-based compensation expense | — |
| | — |
| | 181,351 |
| | — |
| | — |
| | 181,351 |
| | (73 | ) | | 181,278 |
|
| Balance at September 30, 2016 | 248,029 |
| | $ | 2,446 |
| | $ | 6,429,726 |
| | $ | (3,845 | ) | | $ | (5,406,781 | ) | | $ | 1,021,546 |
| | $ | 186,795 |
| | $ | 1,208,341 |
|
| | | | | | | | | | | | | | | | |
| Balance at December 31, 2016 | 248,301 |
| | $ | 2,450 |
| | $ | 6,506,795 |
| | $ | 21,173 |
| | $ | (5,373,836 | ) | | $ | 1,156,582 |
| | $ | 181,609 |
| | $ | 1,338,191 |
|
| Cumulative effect adjustment for adoption of new accounting guidance | — |
| | — |
| | 9,371 |
| | | | (9,371 | ) | | — |
| | — |
| | — |
|
| Other comprehensive loss, net of tax | — |
| | — |
| | — |
| | (46,302 | ) | | — |
| | (46,302 | ) | | — |
| | (46,302 | ) |
| Net income (loss) | — |
| | — |
| | — |
| | — |
| | 162,800 |
| | 162,800 |
| | (173,350 | ) | | (10,550 | ) |
| Issuance of common stock under benefit plans | 4,382 |
| | 50 |
| | 298,956 |
| | — |
| | — |
| | 299,006 |
| | 33 |
| | 299,039 |
|
| Stock-based compensation expense | — |
| | — |
| | 218,991 |
| | — |
| | — |
| | 218,991 |
| | — |
| | 218,991 |
|
| VIE noncontrolling interest upon deconsolidation | — |
| | — |
| | — |
| | — |
| | — |
| | — |
| | 3,910 |
| | 3,910 |
|
| Other | — |
| | — |
| | — |
| | — |
| | — |
| | — |
| | (35 | ) | | (35 | ) |
| Balance at September 30, 2017 | 252,683 |
| | $ | 2,500 |
| | $ | 7,034,113 |
| | $ | (25,129 | ) | | $ | (5,220,407 | ) | | $ | 1,791,077 |
| | $ | 12,167 |
| | $ | 1,803,244 |
|
| | | | | | | | | | | | | | | | | | | | | | | | | | | | | | | | | | | |
| Three Months Ended |
| Common Stock | | Additional Paid-in Capital | | Accumulated Other Comprehensive (Loss) Income | | Retained Earnings | | Total Shareholders’ Equity |
| Shares | | Amount | | | | |
| Balance at June 30, 2021 | 259.1 | | | $ | 2.6 | | | $ | 7,640.2 | | | $ | (25.2) | | | $ | 1,578.8 | | | $ | 9,196.4 | |
| Other comprehensive income, net of tax | — | | | — | | | — | | | 36.7 | | | — | | | 36.7 | |
| Net income | — | | | — | | | — | | | — | | | 851.9 | | | 851.9 | |
| Repurchase of common stock | (3.3) | | | (0.0) | | | (642.2) | | | — | | | — | | | (642.2) | |
| Common stock withheld for employee tax obligations | (0.1) | | | (0.0) | | | (28.6) | | | — | | | — | | | (28.6) | |
| Issuance of common stock under benefit plans | 0.5 | | | 0.0 | | | 12.9 | | | — | | | — | | | 12.9 | |
| Stock-based compensation expense | — | | | — | | | 103.7 | | | — | | | — | | | 103.7 | |
| Balance at September 30, 2021 | 256.2 | | | $ | 2.6 | | | $ | 7,086.0 | | | $ | 11.5 | | | $ | 2,430.7 | | | $ | 9,530.8 | |
| | | | | | | | | | | |
| Balance at June 30, 2022 | 256.0 | | | $ | 2.6 | | | $ | 7,100.0 | | | $ | 57.5 | | | $ | 4,773.4 | | | $ | 11,933.5 | |
| Other comprehensive income, net of tax | — | | | — | | | — | | | 40.1 | | | — | | | 40.1 | |
| Net income | — | | | — | | | — | | | — | | | 930.5 | | | 930.5 | |
| | | | | | | | | | | |
| Common stock withheld for employee tax obligations | (0.2) | | | (0.0) | | | (48.0) | | | — | | | — | | | (48.0) | |
| Issuance of common stock under benefit plans | 0.8 | | | 0.0 | | | 38.2 | | | — | | | — | | | 38.2 | |
| Stock-based compensation expense | — | | | — | | | 135.3 | | | — | | | — | | | 135.3 | |
| Balance at September 30, 2022 | 256.6 | | | $ | 2.6 | | | $ | 7,225.5 | | | $ | 97.6 | | | $ | 5,703.9 | | | $ | 13,029.6 | |
| | | | | | | | | | | |
| Nine Months Ended |
| Common Stock | | Additional
Paid-in Capital | | Accumulated Other Comprehensive (Loss) Income | | Retained Earnings | | Total
Shareholders’ Equity |
| Shares | | Amount | | | | |
| Balance at December 31, 2020 | 259.9 | | | $ | 2.6 | | | $ | 7,894.0 | | | $ | (68.5) | | | $ | 858.7 | | | $ | 8,686.8 | |
| Other comprehensive income, net of tax | — | | | — | | | — | | | 80.0 | | | — | | | 80.0 | |
| Net income | — | | | — | | | — | | | — | | | 1,572.0 | | | 1,572.0 | |
| Repurchase of common stock | (5.3) | | | (0.0) | | | (1,067.2) | | | — | | | — | | | (1,067.2) | |
| Common stock withheld for employee tax obligations | (0.6) | | | (0.0) | | | (134.2) | | | — | | | — | | | (134.2) | |
| Issuance of common stock under benefit plans | 2.2 | | | 0.0 | | | 66.8 | | | — | | | — | | | 66.8 | |
| Stock-based compensation expense | — | | | — | | | 326.6 | | | — | | | — | | | 326.6 | |
| Balance at September 30, 2021 | 256.2 | | | $ | 2.6 | | | $ | 7,086.0 | | | $ | 11.5 | | | $ | 2,430.7 | | | $ | 9,530.8 | |
| | | | | | | | | | | |
| Balance at December 31, 2021 | 254.5 | | | $ | 2.5 | | | $ | 6,880.8 | | | $ | 15.9 | | | $ | 3,200.8 | | | $ | 10,100.0 | |
| Other comprehensive income, net of tax | — | | | — | | | — | | | 81.7 | | | — | | | 81.7 | |
| Net income | — | | | — | | | — | | | — | | | 2,503.1 | | | 2,503.1 | |
| | | | | | | | | | | |
| Common stock withheld for employee tax obligations | (0.7) | | | (0.0) | | | (169.9) | | | — | | | — | | | (169.9) | |
| Issuance of common stock under benefit plans | 2.8 | | | 0.1 | | | 135.2 | | | — | | | — | | | 135.3 | |
| Stock-based compensation expense | — | | | — | | | 379.4 | | | — | | | — | | | 379.4 | |
| Balance at September 30, 2022 | 256.6 | | | $ | 2.6 | | | $ | 7,225.5 | | | $ | 97.6 | | | $ | 5,703.9 | | | $ | 13,029.6 | |
The accompanying notes are an integral part of these condensed consolidated financial statements.
VERTEX PHARMACEUTICALS INCORPORATED
Condensed Consolidated Statements of Cash Flows
(unaudited)
(in thousands)millions)
|
| | | | | | | |
| | Nine Months Ended September 30, |
| | 2017 | | 2016 |
| Cash flows from operating activities: | | | |
| Net loss | $ | (10,550 | ) | | $ | (111,790 | ) |
| Adjustments to reconcile net loss to net cash provided by operating activities: | | | |
| Stock-based compensation expense | 215,334 |
| | 178,623 |
|
| Depreciation and amortization expense | 44,965 |
| | 45,947 |
|
| Write-downs of inventories to net realizable value | 11,138 |
| | — |
|
| Deferred income taxes | (113,969 | ) | | 23,544 |
|
| Impairment of property and equipment | 1,946 |
| | — |
|
| Intangible asset impairment charge | 255,340 |
| | — |
|
| Acquired in-process research & development | 160,000 |
| | — |
|
| Deconsolidation of VIE | 76,644 |
| | — |
|
| Other non-cash items, net | (4,787 | ) | | (904 | ) |
| Changes in operating assets and liabilities: | | | |
| Accounts receivable, net | (54,455 | ) | | (9,760 | ) |
| Inventories | (28,570 | ) | | (11,536 | ) |
| Prepaid expenses and other assets | (90,006 | ) | | (8,979 | ) |
| Accounts payable | 6,925 |
| | (21,532 | ) |
| Accrued expenses and other liabilities | 148,102 |
| | 26,121 |
|
| Accrued restructuring expense | (3,863 | ) | | (8,151 | ) |
| Deferred revenues | 3,237 |
| | (10,204 | ) |
| Net cash provided by operating activities | 617,431 |
| | 91,379 |
|
| Cash flows from investing activities: | | | |
| Purchases of marketable securities | (431,653 | ) | | (616,625 | ) |
| Maturities of marketable securities | 247,149 |
| | 535,379 |
|
| Expenditures for property and equipment | (56,817 | ) | | (41,775 | ) |
| Purchase of in-process research & development | (160,000 | ) | | — |
|
| (Decrease) increase in restricted cash and cash equivalents (VIE) | (15,643 | ) | | 20,490 |
|
| Investment in equity securities | — |
| | (23,075 | ) |
| Decrease (increase) in other assets | 380 |
| | (93 | ) |
| Net cash used in investing activities | (416,584 | ) | | (125,699 | ) |
| Cash flows from financing activities: | | | |
| Issuances of common stock under benefit plans | 298,205 |
| | 51,165 |
|
| Payments on revolving credit facility | (300,000 | ) | | — |
|
| Advance from collaborator | 10,000 |
| | — |
|
| Payments on capital lease obligations | (14,188 | ) | | (13,330 | ) |
| Proceeds from capital lease financing | — |
| | 2,030 |
|
| Payments on construction financing lease obligation | (412 | ) | | (356 | ) |
| Proceeds related to construction financing lease obligation | 4,700 |
|
| — |
|
| Repayments of advanced funding | (3,132 | ) | | — |
|
| Net cash (used in) provided by financing activities | (4,827 | ) | | 39,509 |
|
| Effect of changes in exchange rates on cash | 5,001 |
| | (265 | ) |
| Net increase in cash and cash equivalents | 201,021 |
| | 4,924 |
|
| Cash and cash equivalents—beginning of period | 1,183,945 |
| | 714,768 |
|
| Cash and cash equivalents—end of period | $ | 1,384,966 |
| | $ | 719,692 |
|
| | | | |
| Supplemental disclosure of cash flow information: | | | |
| Cash paid for interest | $ | 51,990 |
| | $ | 64,662 |
|
| Cash paid for income taxes | $ | 4,154 |
| | $ | 1,617 |
|
| Capitalization of costs related to construction financing lease obligation | $ | 33,827 |
| | $ | 824 |
|
| Issuances of common stock from employee benefit plans receivable | $ | 868 |
| | $ | 19 |
|
| | | | | | | | | | | |
| Nine Months Ended September 30, |
| 2022 | | 2021 |
| Cash flows from operating activities: | | | |
| Net income | $ | 2,503.1 | | | $ | 1,572.0 | |
| Adjustments to reconcile net income to net cash provided by operating activities: | | | |
| Stock-based compensation expense | 379.8 | | | 322.8 | |
| Depreciation expense | 109.9 | | | 91.8 | |
| Decrease in fair value of contingent consideration | (59.3) | | | (1.1) | |
| Deferred income taxes | (424.0) | | | (112.7) | |
| Gains (losses) on equity securities | 143.1 | | | (5.0) | |
| Other non-cash items, net | (32.8) | | | 20.5 | |
| Changes in operating assets and liabilities: | | | |
| Accounts receivable, net | (368.8) | | | (231.2) | |
| Inventories | (58.1) | | | (65.8) | |
| Prepaid expenses and other assets | (41.9) | | | (107.7) | |
| Accounts payable | (39.1) | | | (22.0) | |
| Accrued expenses | 980.3 | | | 254.2 | |
| Other liabilities | (40.7) | | | (67.3) | |
| Net cash provided by operating activities | 3,051.5 | | | 1,648.5 | |
| Cash flows from investing activities: | | | |
| Purchases of available-for-sale debt securities | (417.8) | | | (447.8) | |
| Maturities of available-for-sale debt securities | 435.9 | | | 452.1 | |
| Payment to acquire ViaCyte, Inc., net of cash acquired | (295.9) | | | — | |
| Purchases of property and equipment | (171.1) | | | (173.2) | |
| Investment in equity securities and notes receivable | (47.8) | | | (38.0) | |
| | | |
| Net cash used in investing activities | (496.7) | | | (206.9) | |
| Cash flows from financing activities: | | | |
| Issuances of common stock under benefit plans | 134.7 | | | 67.3 | |
| Repurchases of common stock | — | | | (1,057.2) | |
| Payments in connection with common stock withheld for employee tax obligations | (169.9) | | | (134.2) | |
| Payments on finance leases | (75.1) | | | (34.6) | |
| Proceeds from finance leases | — | | | 12.6 | |
| Other financing activities | 2.4 | | | 4.3 | |
| Net cash used in financing activities | (107.9) | | | (1,141.8) | |
| Effect of changes in exchange rates on cash | (70.0) | | | (8.5) | |
| Net increase in cash, cash equivalents and restricted cash | 2,376.9 | | | 291.3 | |
| Cash, cash equivalents and restricted cash—beginning of period | 6,800.1 | | | 5,988.9 | |
| Cash, cash equivalents and restricted cash—end of period | $ | 9,177.0 | | | $ | 6,280.2 | |
| | | |
| Supplemental disclosure of cash flow information: | | | |
| Cash paid for interest | $ | 41.1 | | | $ | 42.7 | |
| Cash paid for income taxes | $ | 840.1 | | | $ | 381.5 | |
The accompanying notes are an integral part of these condensed consolidated financial statements.
VERTEX PHARMACEUTICALS INCORPORATED
Notes to Condensed Consolidated Financial Statements
(unaudited)
A.Basis of Presentation and Accounting Policies
Basis of Presentation
The accompanying condensed consolidated financial statements are unaudited and have been prepared by Vertex Pharmaceuticals Incorporated (“Vertex”Vertex,” “we,” “us” or the “Company”“our”) in accordance with accounting principles generally accepted in the United States of America (“U.S. GAAP”).
The condensed consolidated financial statements reflect the operations of (i) the Company, (ii) itsVertex and our wholly-owned subsidiaries and (iii) consolidated variable interest entities (VIEs).subsidiaries. All material intercompany balances and transactions have been eliminated. The Company operatesWe operate in one segment, pharmaceuticals. As
Beginning with the second quarter of 2022, we are separately classifying upfront, contingent milestone, and other payments pursuant to our business development transactions, including collaborations, licenses of third-party technologies, and asset acquisitions as “Acquired in-process research and development expenses” in our condensed consolidated statements of operations. To conform prior periods to current presentation, we reclassified $26.7 million and $986.8 million from “Research and development expenses” to “Acquired in-process research and development expenses” for the three and nine months ended September 30, 2017, the Company deconsolidated Parion Sciences, Inc. (“Parion”), a VIE the Company has consolidated since 2015. The Company's consolidated balance sheet as of September 30, 2017 excludes Parion.2021, respectively. Please refer to Note C, “Collaborative“Acquired In-Process Research and Development and Other Arrangements, and Acquisitions”” for further information regarding the deconsolidation of Parion.on these transactions.
Certain information and footnote disclosures normally included in our Annual Report on Form 10-K for the Company’s annual financial statementsfiscal year ended December 31, 2021 (the “2021 Annual Report on Form 10-K”) have been condensed or omitted. These interim financial statements, in the opinion of management, reflect all normal recurring adjustments necessary for a fair presentation of the financial position and results of operations for the interim periods ended September 30, 20172022 and 2016.2021.
The results of operations for the interim periods are not necessarily indicative of the results of operations to be expected for the full fiscal year. These interim financial statements should be read in conjunction with the audited financial statements for the year ended December 31, 2016,2021, which are contained in the Company’sour 2021 Annual Report on Form 10-K for the year ended December 31, 2016 that was filed with the Securities and Exchange Commission (the “SEC”) on February 23, 2017 (the “2016 Annual Report on Form 10-K”).10-K.
Use of Estimates and Summary of Significant Accounting Policies
The preparation of condensed consolidated financial statements in accordance with U.S. GAAP requires managementus to make certain estimates and assumptions that affect the reported amounts of assets and liabilities and disclosure of contingent assets and liabilities at the date of theour condensed consolidated financial statements, and the amounts of revenues and expenses during the reported periods. Significant estimates in these condensed consolidated financial statements have been made in connection with the calculation of revenues, inventories, research and development expenses, stock-based compensation expense, restructuring expense, the fair value of intangible assets, goodwill, contingent consideration, noncontrolling interest, the consolidation and deconsolidation of VIEs, leases, the fair value of cash flow hedges and the provision for or benefit from income taxes. The Company bases itsWe base our estimates on historical experience and various other assumptions, including in certain circumstances future projections that management believeswe believe to be reasonable under the circumstances. Actual results could differ from those estimates. Changes in estimates are reflected in reported results in the period in which they become known.
The Company’sRecently Adopted and Issued Accounting Standards
For a discussion of recently adopted accounting pronouncements please refer to Note A, “Nature of Business and Accounting Policies,” in our 2021 Annual Report on Form 10-K. We do not expect any recently issued accounting standards to have a significant impact on our condensed consolidated financial statements.
Summary of Significant Accounting Policies
Our significant accounting policies are described in Note A, “Nature of Business and Accounting Policies,” in the 2016our 2021 Annual Report on Form 10-K.
Recent Accounting Pronouncements
In 2014, the Financial Accounting Standards Board (“FASB”) issued new guidance applicable to revenue recognition that will be effective January 1, 2018. Early adoption was permitted for the year-ending December 31, 2017. The new guidance applies a more principles based approach to recognizing revenue. Under the new guidance, revenue is recognized when a customer obtains control of promised goods or services and is recognized in an amount that reflects the consideration that an entity expects to receive in exchange for those goods or services. In addition, the standard requires disclosure of the nature, amount, timing, and uncertainty of revenue and cash flows arising from contracts with customers. The new guidance must be adopted using either a modified retrospective approach or a full retrospective approach for all periods presented. Under the modified retrospective method, the cumulative effect of applying the standard would be recognized at the date of initial application within retained earnings. Under the full retrospective approach, the standard would be applied to each prior reporting period presented. Upon adoption, the Company will use the modified retrospective method. The Company continues to evaluate the new guidance and the effect the adoption will have on the condensed consolidated financial
VERTEX PHARMACEUTICALS INCORPORATED
Notes to Condensed Consolidated Financial Statements
(unaudited)
B.Revenue Recognition
statements. The Company’s project team is finalizing its reviewDisaggregation of existing customer contracts and current accounting policies to identify and assess the potential differences that would result from applying the requirementsRevenue
Revenues by Product
Product revenues, net consisted of the new standard. Based on the Company’s assessment performed to date, the new revenue recognition guidance could impact the Company’s accounting forfollowing:
| | | | | | | | | | | | | | | | | | | | | | | |
| Three Months Ended September 30, | | Nine Months Ended September 30, |
| 2022 | | 2021 | | 2022 | | 2021 |
| (in millions) |
| TRIKAFTA/KAFTRIO | $ | 2,010.5 | | | $ | 1,555.8 | | | $ | 5,665.3 | | | $ | 4,004.6 | |
| SYMDEKO/SYMKEVI | 38.2 | | | 81.4 | | | 145.7 | | | 340.0 | |
| ORKAMBI | 146.2 | | | 184.5 | | | 399.9 | | | 624.2 | |
| KALYDECO | 139.4 | | | 162.4 | | | 417.1 | | | 532.0 | |
| Total product revenues, net | $ | 2,334.3 | | | $ | 1,984.1 | | | $ | 6,628.0 | | | $ | 5,500.8 | |
Product Revenues by Geographic Location
Total net product shipments to certain countries through early access programs, including the French early access programs, whereby the associated product has received regulatory approval but the price is not fixed or determinablerevenues by geographic region, based on the status of ongoing pricing discussions, and could impact the Company’s accounting for certain reimbursement agreements that the Company plans to negotiate in the fourth quarter of 2017. As the Company completes its assessment, it is implementing appropriate changes to its controls to support revenue recognition and additional revenue-related disclosures under the new standard.
In 2016, the FASB issued amended guidance applicable to share-based compensation to employees that simplifies the accounting for employee share-based payment transactions, including the accounting for income taxes, forfeitures, and statutory tax withholding requirements, as well as classification in the statement of cash flows. The amended guidance became effective for the Company during the first quarter of 2017. The amended guidance eliminates the requirement that excess tax benefits be realized as a reduction in current taxes payable before the associated tax benefit can be recognized as an increase in additional paid-in capital. This created approximately $410.8 million of deferred tax asset (“DTA”) relating to federal and state net operating losses (“NOLs”) that are fully reserved by an equal increase in valuation allowance. The Company recorded DTAs of approximately $404.7 million relating to Federal NOLs and approximately $6.1 million relating to State NOLs, both of which are offset by a full valuation allowance. Upon adoption, the Company also elected to change its accounting policy to account for forfeitures of options and awards as they occur. The change was applied on a modified retrospective basis with a cumulative effect adjustment to the Company’s accumulated deficit of $9.4 million, which increased the accumulated deficit as of January 1, 2017. This change also resulted in an increase to the DTA of $3.4 million, which is offset by a full valuation allowance. As a result, there was no cumulative-effect adjustment to accumulated deficit. The provisions related to the recognition of excess tax benefits in the income statement and classification in the statement of cash flows were adopted prospectively, and as such, the prior periods were not retrospectively adjusted.
In 2016, the FASB issued amended guidance related to the recording of financial assets and financial liabilities. Under the amended guidance, equity investments (except those accounted for under the equity method of accounting or those that result in consolidationlocation of the investee) are to be measured at fair value with changes in fair value recognized in net income. However, an entity hascustomer, consisted of the option to either measure equity investments without readily determinable fair values at fair value or at cost adjusted for changes in observable prices minus impairment. Changes in measurement under either alternative will be recognized in net income. The amended guidance is effective for the year ending December 31, 2018. Early adoption is permitted. The Company expects the implementationfollowing:
| | | | | | | | | | | | | | | | | | | | | | | |
| Three Months Ended September 30, | | Nine Months Ended September 30, |
| 2022 | | 2021 | | 2022 | | 2021 |
| (in millions) |
| United States | $ | 1,455.6 | | | $ | 1,382.9 | | | $ | 4,238.9 | | | $ | 3,893.2 | |
| Outside of the United States | | | | | | | |
| Europe | 730.5 | | | 518.8 | | | 2,018.3 | | | 1,382.7 | |
| Other | 148.2 | | | 82.4 | | | 370.8 | | | 224.9 | |
| Total product revenues outside of the United States | 878.7 | | | 601.2 | | | 2,389.1 | | | 1,607.6 | |
| Total product revenues, net | $ | 2,334.3 | | | $ | 1,984.1 | | | $ | 6,628.0 | | | $ | 5,500.8 | |
Contract Liabilities
We had contract liabilities of this standard to have an impact on its consolidated financial statements$119.5 million and related disclosures, as the Company held publicly traded equity investments$171.7 million as of September 30, 2017 as well as equity investments accounted2022 and December 31, 2021, respectively, related to annual contracts with government-owned and supported customers in international markets that limit the amount of annual reimbursement we can receive. Upon exceeding the annual reimbursement amount, products are provided free of charge, which is a material right. These contracts include upfront payments and fees. We defer a portion of the consideration received for under the cost method. A cumulative-effect adjustmentshipments made up to the balance sheet will be recordedannual reimbursement limit as a portion of “Other current liabilities.” The deferred amount is recognized as revenue when the free products are shipped. Our product revenue contracts include performance obligations that are one year or less.
Our contract liabilities at the end of each fiscal year relate to contracts with annual reimbursement limits in international markets in which the annual period associated with the contract is not the same as our fiscal year. In these markets, we recognize revenues related to performance obligations satisfied in previous years; however, these revenues do not relate to any performance obligations that were satisfied more than 12 months prior to the beginning of the fiscal year of adoption. The implementation of this amended guidance is expected to increase volatility in net income as the volatility currently recorded in other comprehensive income related to changes in the fair market value of available-for-sale equity investments will be reflected in net income after adoption.current year.
In 2016, the FASB issued amended guidance applicable to leases that will be effective for the year ending December 31, 2019. Early adoption is permitted. This guidance requires entities to recognize assets and liabilities for leases with lease terms of more than 12 months on the balance sheet. The Company is in the process of evaluating this guidance and determining the expected effect on its condensed consolidated financial statements.
In 2016, the FASB issued amended guidance related to intra-entity transfers other than inventory. This guidance removes the current exception in GAAP prohibiting entities from recognizing current and deferred income tax expenses or benefits related to transfer of assets, other than inventory, within the consolidated entity. The current exception to defer the recognition of any tax impact on the transfer of inventory within the consolidated entity until it is sold to a third party remains unaffected. The amended guidance is effective for the year ending December 31, 2018. Early adoption is permitted. The Company is in the process of evaluating this guidance and determining the expected effect on its condensed consolidated financial statements.
VERTEX PHARMACEUTICALS INCORPORATED
Notes to Condensed Consolidated Financial Statements
(unaudited)
C.Acquired In-Process Research and Development and Other Arrangements
In 2017,We have entered into numerous agreements with third parties to collaborate on research, development and commercialization programs, license technologies, or acquire assets. Our “Acquired in-process research and development expenses” included $29.0 million and $92.9 million for the FASB issued amended guidancethree and nine months ended September 30, 2022, respectively, and $26.7 million and $986.8 million, for the three and nine months ended September 30, 2021, respectively, related to upfront, contingent milestone, or other payments pursuant to our business combinations. The amended guidance clarifies the definitiondevelopment transactions, including collaborations, licenses of a business with the objective of adding guidance to assist entities with evaluating whether transactions should be accounted for as acquisitions (or disposals) of assets or businesses. The new accounting guidance is effective for annual periods beginning after December 15, 2017, including interim periods within those periods. Early adoption is permitted. The Company early adopted this new guidance as of January 1, 2017third-party technologies, and will apply this new guidance to futureasset acquisitions.
In 2017, the FASB issued amended guidance related to measurements of goodwill. The amended guidance eliminatesOur collaboration, licensing and asset acquisition agreements that had a step from the goodwill impairment test. Under the amended guidance, an entity should perform its annual or interim goodwill impairment test by comparing the fair value of a reporting unit with its carrying amount. An entity would recognize an impairment chargesignificant impact on our financial statements for the amount by whichthree and nine months ended September 30, 2022 and 2021, or were new or materially revised during the carrying amount exceeds the reporting unit’s fair value; however, the loss recognized should not exceed the total amountthree and nine months ended September 30, 2022, are described below. Additional agreements were described in Note B, “Collaborative and Other Arrangements,” of goodwill allocated to that reporting unit. The amended guidance is effective for the year-ending December 31, 2020. Early adoption is permitted. The Company does not expect a significant effect on its condensed consolidated financial statements upon adoption of this new guidance.
In 2017, the FASB issued amended guidance related to the scope of stock option modification accounting, to reduce diversity in practice and provide clarity regarding existing guidance. The new accounting guidance is effective for annual periods beginning after December 15, 2017, including interim periods within those periods. Early adoption is permitted. The Company does not expect the adoption of this guidance to have a material effect on its condensed consolidated financial statements and related disclosures.
In 2017, the FASB issued amended guidance applicable to hedge accounting. The new accounting guidance is effective for annual periods beginning after December 15, 2018, including interim periods within those periods. Early adoption is permitted. The amended guidance helps simplify certain aspects of hedge accounting and enables entities to more accurately present their risk management activities in their financial statements. The Company is in the process of evaluating this guidance and determining the expected effect on its condensed consolidated financial statements.
For a discussion of other recent accounting pronouncements please refer to Note A, “Nature of Business and Accounting Policies—Recent Accounting Pronouncements,” in the 2016our 2021 Annual Report on Form 10-K.
In-license Agreements
The Company sells its products principally toWe have entered into a limited number of specialty pharmacy providersin-license agreements in North America as well as government-owned and supported customers in international markets (collectively, its “Customers”). The Company’s Customers in North America subsequently resell the products to patients and health care providers. The Company recognizes net revenues from product sales upon delivery to the Customer as long as (i) there is persuasive evidence that an arrangement exists between the Company and the Customer, (ii) collectibility is reasonably assured and (iii) the price is fixed or determinable.
In order to conclude that the price is fixed or determinable, the Company must be ableadvance and obtain access to (i) calculate its gross product revenues from sales to Customerstechnologies and (ii) reasonably estimate its net product revenues upon delivery to its Customers’ locations. The Company calculates gross product revenues based on the price that the Company charges its Customers. The Company estimates its net product revenues by deducting from its gross product revenues (a) trade allowances, such as invoice discounts for prompt payment and Customer fees, (b) estimated government and private payor rebates, chargebacks and discounts, (c) estimated reserves for expected product returns and (d) estimated costs of co-pay assistance programs for patients, as well as other incentives for certain indirect customers.
The Company makes significant estimates and judgments that materially affect the Company’s recognition of net product revenues. In certain instances, the Company may be unable to reasonably conclude that the price is fixed or determinable at the time of delivery, in which case it defers the recognition of revenues. Once the Company is able to determine that the price is fixed or determinable, it recognizes the net product revenues associated with the units in which revenue recognition was deferred.
Revenue recognitionservices related to our research and early-development activities. We are generally required to make an upfront payment upon execution of our license agreements; development, regulatory and commercialization milestones payments upon the Company’s French early access programs could be impacted by the new revenue recognition guidance that is effective January 1, 2018 and described in Note A, “Basisachievement of Presentation and Accounting
VERTEX PHARMACEUTICALS INCORPORATED
Notes to Condensed Consolidated Financial Statements
(unaudited)
Policies”. The Company’s ORKAMBI netcertain product revenues to date do not include any revenues from product sales in France because the price is not fixed or determinable. The Company began distributing ORKAMBI through early access programs in France during the fourth quarter of 2015. As of September 30, 2017, the Company’s condensed consolidated balance sheet includes $190.3 million collected in France related to shipments of ORKAMBI under the early access programs that is classified as Customer deposits. The Company expects that the difference between the amounts collected based on the invoiced price and the final price for ORKAMBI in France will be returned to the French government.
If the Company concludes as of December 31, 2017 that the price of the ORKAMBI supplied under the early access programs is fixed or determinable based on, among other factors, the status of negotiations in France, it would record net product revenues for all sales since the inception of the early access programs for ORKAMBI based on the fixed or determinable price in the fourth quarter of 2017.
If the Company concludes that the price is not fixed or determinable as of December 31, 2017, these amounts would be subject to the new guidance applicable to revenue recognition effective January 1, 2018 using the modified retrospective adoption approach. Pursuant to the new guidance, the Company would record a cumulative effect adjustment to the Company’s accumulated deficit in the first quarter of 2018. The amount of the adjustment to accumulated deficit would be determined based upon (i) the status of pricing discussions in France upon adoption and (ii) the Company’s estimate of the amount of consideration the Company expects to retain related to the French ORKAMBI sales that occurred on or prior to December 31, 2017 that would not be subject to a significant reversal in amounts recognized. For French ORKAMBI sales after December 31, 2017 under the early access programs, the Company would recognize product revenues based on the Company’s estimate of consideration the Company expects to retain for which it is probable that a significant reversal in amounts recognized will not occur. In future periods, if the Company’s estimates regarding the amounts it will receive for ORKAMBI supplied pursuant to these programs change, the effect of the change in estimates would be reflected in net product revenues in the period in which the change in estimate occurred.
The following table summarizes activity in each of the product revenue allowance and reserve categories for the nine months ended September 30, 2017: |
| | | | | | | | | | | | | | | | | | | |
| | Trade
Allowances | | Rebates,
Chargebacks
and Discounts | | Product
Returns | | Other
Incentives | | Total |
| | (in thousands) |
| Balance at December 31, 2016 | $ | 2,568 |
| | $ | 81,927 |
| | $ | 3,492 |
| | $ | 1,214 |
| | $ | 89,201 |
|
| Provision related to current period sales | 18,776 |
| | 118,592 |
| | 3,603 |
| | 12,238 |
| | 153,209 |
|
| Adjustments related to prior period sales | (188 | ) | | (4,327 | ) | | (13 | ) | | (355 | ) | | (4,883 | ) |
| Credits/payments made | (18,409 | ) | | (97,393 | ) | | (1,809 | ) | | (10,021 | ) | | (127,632 | ) |
| Balance at September 30, 2017 | $ | 2,747 |
| | $ | 98,799 |
| | $ | 5,273 |
| | $ | 3,076 |
| | $ | 109,895 |
|
VERTEX PHARMACEUTICALS INCORPORATED
Notes to Condensed Consolidated Financial Statements
(unaudited)
| |
C. | Collaborative Arrangements and Acquisitions |
Cystic Fibrosis Foundation Therapeutics Incorporated
The Company has a research, development and commercialization agreement with Cystic Fibrosis Foundation Therapeutics Incorporated (“CFFT”) that was originally entered into in May 2004,objectives; and was most recently amended in October 2016 (the “2016 Amendment”). royalty payments on future sales, if any, of commercial products resulting from our collaborations.
Pursuant to the terms of our in-license agreements, our collaborators typically lead the discovery efforts and we lead all preclinical, development and commercialization activities associated with the advancement of any product candidates and fund all expenses.
We typically can terminate our in-license agreements by providing advance notice to our collaborators; the required length of notice is dependent on whether any product developed under the license agreement as amended, the Company has agreed to pay royalties ranging from low-single digits to mid-single digits on potential sales of certain compounds first synthesized and/or tested between March 1, 2014 and August 31, 2016 and tiered royalties ranging from single digits to sub-teens on any approved drugs first synthesized and/or tested duringreceived marketing approval. Our license agreements may be terminated by either party for a research term on or before February 28, 2014, including (i) KALYDECO (ivacaftor) and ORKAMBI (lumacaftor in combination with ivacaftor), which are the Company’s current products and (ii) tezacaftor in combination with ivacaftor. For combination products, such as ORKAMBI, sales will be allocated equally to each of the active pharmaceutical ingredients in the combination product.
In the first quarter of 2016, CFFT earned a commercial milestone payment of $13.9 million from the Company upon achievement of certain sales levels of lumacaftor. There are no additional commercial milestone payments payablematerial breach by the Companyother, subject to CFFT pursuant tonotice and cure provisions. Unless earlier terminated, these license agreements generally remain in effect until the agreement. Pursuant todate on which the 2016 Amendment, the CFFT provided the Company an upfront program award of $75.0 million and agreed to provide development funding to the Company of up to $6.0 million annually. The program award plus any future development funding represent a form of financing pursuant to Accounting Standards Codification (ASC) 730, Research and Development, and thus the amounts are recorded as a liability on the condensed consolidated balance sheet, primarily reflected in Advance from collaborator. The liability is reduced over the estimated royalty term of the agreement. Reductionsand all payment obligations with respect to all products in the liability are reflected as an offset to cost of product revenues and as interest expense.
The Company has royalty obligations to CFFT for ivacaftor, lumacaftor and tezacaftor until the expiration of patents covering those compounds. The Company has patents in the United States and European Union covering the composition-of-matter of ivacaftor that expire in 2027 and 2025, respectively, subject to potential patent extensions. The Company has patents in the United States and European Union covering the composition-of-matter of lumacaftor that expire in 2030 and 2026, respectively, subject to potential extension. The Company has patents in the United States and European Union covering the composition-of-matter of tezacaftor that expire in 2027 and 2028, respectively, subject to potential extension.all countries have expired.
CRISPR Therapeutics AG - CRISPR-Cas9 Gene-editing Therapies
In 2015, the Companywe entered into a strategic collaboration, option and license agreement (the “CRISPR Agreement”) with CRISPR Therapeutics AG and its affiliates (“CRISPR”) to collaborate on the discovery and development of potential new treatments aimed at the underlying genetic causes of human diseases using CRISPR-Cas9 gene editinggene-editing technology. The Company hasWe had the exclusive right to license upcertain targets. In 2019, we elected to six CRISPR-Cas9-basedexclusively license three targets, including targets for the potential treatment of sickle cell disease. In connection with the CRISPR Agreement, the Company made an upfront payment to CRISPR of $75.0 million and a $30.0 million investment in CRISPR pursuant to a convertible loan agreement that converted into preferred stock in January 2016. The Company expensed $75.0 million to research and development, and the $30.0 million investment was recorded at cost and was classified as a long-term asset on the Company’s condensed consolidated balance sheets. In the second quarter of 2016, the Company made an additional preferred stock investment in CRISPR of approximately $3.1 million. In connection with CRISPR’s initial public offering in October 2016, the Company purchased $10.0 million of common shares at the public offering price and the Company’s preferred stock investments in CRISPR converted into common shares. As of September 30, 2017, the Company recorded the fair value of its investment in CRISPR common shares of $56.9 million in marketable securities and a $13.7 million unrealized gain related to these common shares in accumulated other comprehensive income (loss) on the condensed consolidated balance sheet.
The Company will fund all of the discovery activities conductedcystic fibrosis, pursuant to the CRISPR Agreement. For potential hemoglobinapathy treatments, including treatments for sickle cell disease,each of the Company and CRISPR will share equally all development costs and worldwide revenues. For otherthree targets that the Company electswe elected to license, the Company would lead all development and global commercialization activities. For each of up to six targets that the Company elects to license, other than hemoglobinapathy targets, CRISPR has the potential to receive up to $420.0an additional $410.0 million in development, regulatory and commercial milestones andas well as royalties on net product sales.
In 2017, we entered into a joint development and commercialization agreement with CRISPR pursuant to the terms of the CRISPR Agreement (the “Original CTX001 JDCA”), under which we and CRISPR were co-developing and preparing to co-commercialize exagamglogene autotemcel (“exa-cel”), formerly known as CTX001, for the treatment of hemoglobinopathies, including treatments for sickle cell disease and transfusion-dependent beta thalassemia.
In the second quarter of 2021, we and CRISPR amended and restated the Original CTX001 JDCA (the “A&R JDCA”), pursuant to which the parties agreed to, among other things, (a) adjust the governance structure for the collaboration and adjust the responsibilities of each party thereunder; (b) adjust the allocation of net profits and net losses between the parties; and (c) exclusively license (subject to CRISPR’s reserved rights to conduct certain activities) certain intellectual property rights to us relating to the products that may be researched, developed, manufactured and commercialized under such agreement.
Pursuant to the A&R JDCA, we lead global development, manufacturing and commercialization of exa-cel, with support from CRISPR. Subject to the terms and conditions of the A&R JDCA, we conduct all research, development, manufacturing and commercialization activities relating to the product candidates and products under the A&R JDCA (including exa-cel) throughout the world subject to CRISPR’s reserved right to conduct certain activities.
VERTEX PHARMACEUTICALS INCORPORATED
Notes to Condensed Consolidated Financial Statements
(unaudited)
The Company may terminate the CRISPR Agreement upon 90 days’ notice to CRISPR prior to any product receiving marketing approval or upon 270 days’ notice after a product has received marketing approval. The CRISPR Agreement also may be terminated by either party for a material breach by the other, subject to notice and cure provisions. Unless earlier terminated, the CRISPR Agreement will continue in effect until the expiration of the Company’s payment obligations under the CRISPR Agreement.
Merck KGaA
On January 10, 2017, the Company entered into a strategic collaboration and license agreement (the “Merck KGaA Agreement”) with Merck KGaA, Darmstadt, Germany (“Merck KGaA”). Pursuant to the Merck KGaA Agreement, the Company granted Merck KGaA an exclusive worldwide license to research, develop and commercialize four oncology research and development programs. Under the Merck KGaA Agreement, the Company granted Merck KGaA exclusive, worldwide rights to two clinical-stage programs targeting DNA damage repair: its ataxia telangiectasia and Rad3-related protein inhibitor program, including VX-970 and VX-803, and its DNA-dependent protein kinase inhibitor program, including VX-984. In addition, the Company granted Merck KGaA exclusive, worldwide rights to two pre-clinical programs.
The Merck KGaA Agreement provided for an upfront payment from Merck KGaA to the Company of $230.0 million. During the first quarter of 2017, the Company received $193.6 million of the upfront payment and the remaining $36.4 million was remitted to the German tax authorities. Pursuant to a tax treaty between the United States and Germany, the Company filed a refund application for the tax withholding and expects to receive the refund in the fourth quarter of 2017. The income tax receivable is included in Prepaid expenses and other current assets at September 30, 2017. In addition to the upfront payment, the Company will receive tiered royalties on potential sales of licensed products, calculated as a percentage of net sales, that range from (i) mid-single digits to mid-twenties for clinical-stage programs and (ii) mid-single digits to high single digits for the pre-clinical research programs. Merck KGaA has assumed full responsibility for development and commercialization costs for all programs.
The Company evaluated the deliverables, primarily consisting of a license to the four programs and the obligation to complete certain fully-reimbursable research and development and transition activities as directed by Merck KGaA, pursuant to the Merck KGaA Agreement, under the multiple element arrangement accounting guidance. The Company concluded that the license has stand-alone value from the research and development and transition activities based on the resources and know-how possessed by Merck KGaA, and thus concluded that there are two units of accounting in the arrangement. The Company determined the relative selling price of the units of accounting based on the Company’s best estimate of selling price. The Company utilized key assumptions to determine the best estimate of selling price for the license, which included future potential net sales of licensed products, development timelines, reimbursement rates for personnel costs, discount rates, and estimated third-party development costs. The Company utilized a discounted cash flow model to determine its best estimate of selling price for the license and determined the best estimate of selling price for the research and development and transition activities based on what it would sell the services for separately. Based on this analysis, the Company recognized approximately $231.7 million in collaborative revenues related to the upfront payment upon delivery of the license and to the research and development and transition activities provided during the first quarter of 2017. During the three and nine months ended September 30, 2017, the Company recorded the reimbursement for the research and development and transition activities of $5.2 million and $12.8 million, respectively, as revenue in the Company’s consolidated statements of operations primarily due to the fact that the Company is the primary obligor in the arrangement. The Company is providing research and development and transition activities and will recognize the revenues and associated expenses as the services are provided.
Merck KGaA may terminate the Merck KGaA Agreement or any individual program by providing 90 days’ notice, or, in the case of termination of a program with a product that has received marketing approval, 180 days’ notice. The Merck KGaA Agreement also may be terminated by either party for a material breach by the other party, subject to notice and cure provisions. Unless earlier terminated, the Merck KGaA Agreement will continue in effect until the date on which the royalty term and all payment obligations with respect to all products in all countries have expired.
VERTEX PHARMACEUTICALS INCORPORATED
Notes to Condensed Consolidated Financial Statements
(unaudited)
Variable Interest Entities
The Company has entered into several agreements pursuant to which it has licensed rights to certain drug candidates from third-party collaborators, resulting in the consolidation of the third parties’ financial statements into the Company’s condensed consolidated financial statements as VIEs. In order to account for the fair value of the contingent payments, which consist of milestone, royalty and option payments, related to these collaborations under GAAP, the Company uses present-value models based on assumptions regarding the probability of achieving the relevant milestones, estimates regarding the timing of achieving the milestones, estimates of future product sales and the appropriate discount rates. The Company bases its estimate of the probability of achieving the relevant milestones on industry data for similar assets and its own experience. The discount rates used in the valuation model represent a measure of credit risk and market risk associated with settling the liabilities. Significant judgment is used in determining the appropriateness of these assumptions at each reporting period. Changes in these assumptions could have a material effect on the fair value of the contingent payments. The following collaborations are reflected in the Company’s financial statements as consolidated VIEs for portions or all of the periods presented:
Parion Sciences, Inc.
In June 2015, the Company entered into a strategic collaboration and license agreement (the “Parion Agreement”) with Parion. Pursuant to the agreement, the Company is collaborating with Parion to develop investigational epithelial sodium channel (“ENaC”) inhibitors, including VX-371 (formerly P-1037) and VX-551 (formerly P-1055), for the potential treatment of CF and all other pulmonary diseases. The Company is leading development activities for VX-371 and VX-551 and is responsible for all costs, subject to certain exceptions, related to development and commercialization of the compounds.
Pursuant to the Parion Agreement, the Company has worldwide development and commercial rights to Parion’s lead investigational ENaC inhibitors, VX-371 and VX-551, for the potential treatment of CF and all other pulmonary diseases and has the option to select additional compounds discovered in Parion’s research program. Parion received an $80.0 million up-front payment and has the potential to receive up to an additional (i) $490.0 million in development and regulatory milestone payments for development of ENaC inhibitors in CF, including $360.0 million related to global filing and approval milestones, (ii) $370.0 million in development and regulatory milestones for VX-371 and VX-551 in non-CF pulmonary indications and (iii) $230.0 million in development and regulatory milestones should the Company elect to develop an additional ENaC inhibitor from Parion’s research program. The Company has agreed to pay Parion tiered royalties that range from the low double digits to mid-teens as a percentage of potential sales of licensed products.
The Company may terminate the Parion Agreement upon 90 days’ notice to Parion prior to any licensed product receiving marketing approval or upon 180 days’ notice after a licensed product has received marketing approval. If the Company experiences a change of control prior to the initiation of the first Phase 3 clinical trial for a licensed product, Parion may terminate the Parion Agreement upon 30 days’ notice, subject to the Company’s right to receive specified royalties on any subsequent commercialization of licensed products. The Parion Agreement also may be terminated by either party for a material breach by the other, subject to notice and cure provisions. Unless earlier terminated, the Parion Agreement will continue in effect until the expiration of the Company’s royalty obligations, which expire on a country-by-country basis on the later of (i) the date the last-to-expire patent covering a licensed product expires or (ii) ten years after the first commercial sale in the country.
The Company determined that it had a variable interest in Parion via the Parion Agreement, and that the variable interest represented a variable interest in Parion as a whole because the fair value of the ENaC inhibitors represented more than half of the total fair value of Parion’s assets. The Company also concluded that it was the primary beneficiary as it had the power to direct the activities that most significantly affect the economic performance of Parion and it had the obligation to absorb losses and right to receive benefits that potentially could be significant to Parion. Accordingly, the Company consolidated Parion's financial statements from June 4, 2015 through September 30, 2017. The Company deconsolidated Parion effective September 30, 2017. Notwithstanding the applicable accounting treatment, the Company's interests in Parion have been and continue to be limited to those accorded to the Company in the Parion Agreement.
VERTEX PHARMACEUTICALS INCORPORATED
Notes to Condensed Consolidated Financial Statements
(unaudited)
As of June 4, 2015, the Company consolidated Parion’s financial statements, which included $255.3 million of intangible assets on the Company’s condensed consolidated balance sheet for Parion’s in-process research and development assets. These in-process research and development assets relate to Parion’s pulmonary ENaC platform, including the intellectual property related to VX-371 and VX-551, that are licensed by Parion to the Company. The Company also recorded the fair value of the net assets attributable to noncontrolling interest of $164.3 million, deferred tax liability of $91.0 million resulting primarily from a basis difference in the intangible assets and certain other net liabilities held by Parion of $10.5 million. The difference between the fair values of the consideration and noncontrolling interest and the fair value of Parion’s net assets was recorded as goodwill. When determining the valuation of goodwill, the fair value of consideration for the license was zero since there was no consideration transferred outside the condensed consolidated financial statements. While there was a transfer of $80.0 million for the upfront payment to Parion, the cash remained within the Company’s condensed consolidated balance sheet since Parion was part of the consolidated entity. The cash received, net of any cash spent by Parion, was classified as restricted cash and cash equivalents (VIE) within the condensed consolidated balance sheet as it was attributed to the noncontrolling interest holders of Parion.
In the second quarter of 2017, Parion signed a license agreement with an affiliate of Shire plc related to the development of a drug candidate for the potential treatment of dry eye disease. The Company evaluated the license agreement entered into by Parion as a reconsideration event to determine whether it should continue to consolidate Parion as a variable interest entity into its condensed consolidated financial statements. The Company determined that there was no substantive change in the design of Parion subsequent to Parion’s agreement with Shire. Additionally, the Company concluded that it was appropriate to continue to consolidate the financial results of Parion because it continued to have (i) the power to direct the activities that most significantly affect the economic performance of Parion and (ii) the obligation to absorb losses and right to receive benefits that potentially could be significant to Parion. Based on the consolidation of Parion’s financial statements, during the three and nine months ended September 30, 2017, the Company has recognized (i) $20.0 million and $40.0 million, respectively, of collaborative revenues and (ii) a tax provision of $7.4 million and $14.8 million, respectively, both of which were attributable to noncontrolling interest related to payments that Parion received from Shire in the three and nine months ended September 30, 2017. The Company has no interest in Parion’s license agreement with Shire, including the economic benefits and/or obligations derived therefrom.
As of September 30, 2017, the Company determined that the fair value of Parion’s pulmonary ENaC platform had declined significantly based on data received in September 2017 from a Phase 2 clinical trial of VX-371 that did not meet its primary efficacy endpoint. The Company recorded an impairment charge of $255.3 million, which represented the entire value of the intangible asset in the third quarter of 2017. After evaluating the results of the clinical trial, the Company determined that it was no longer the primary beneficiary of Parion as it no longer had the power to direct the significant activities of Parion. The most important factor in this determination was the decrease in the fair value of Parion’s pulmonary ENaC platform relative to Parion’s other activities. Accordingly, the Company deconsolidated Parion as of September 30, 2017. The impairment charge of $255.3 million, decrease in the fair value of the contingent payments payable by the Company to Parion of $69.6 million and benefit from income taxes of $126.2 million resulting from these charges were recorded in the third quarter of 2017 attributable to noncontrolling interest. The benefit from income taxes consisted of benefits of $97.7 million and $28.5 million attributable to the impairment charge and decrease in the fair value of contingent payments, respectively. The net effect of these charges and impact of the deconsolidation was a loss of $7.1 million recorded in other income (expense), net attributable to Vertex in the consolidated statement of operations for the three and nine months ended September 30, 2017. The loss of $7.1 million was approximately the difference between (i) the aggregate of $85.0 million in upfront and milestone payments that the Company has made to Parion to date pursuant to the Parion Agreement and (ii) losses the Company recorded in 2015, 2016, and the first half of 2017 based on increases in the fair value of contingent payments payable by the Company to Parion.
Please refer to Note J, "Intangible Assets and Goodwill," for further information regarding the impairment of Parion’s pulmonary ENaC platform.
In connection with the deconsolidation of Parion, the Company evaluated whether the results of Parion should be presented as discontinued operations for the three and nine month period ending September 30, 2017. The Company concluded that the deconsolidation of Parion based on data from the Phase 2 clinical trial of VX-371 is notA&R JDCA, we made a development that significantly impacts the Company’s overall operations and financial results or plans$900.0 million upfront payment to treat patients with CF. Research
VERTEX PHARMACEUTICALS INCORPORATED
Notes to Condensed Consolidated Financial Statements
(unaudited)
and development expenses incurred related to this program accounted for a minor portion of the Company’s overall annual research and development expenses and the Company remains focused on developing medicines to treat CF. Therefore, the Company has not presented the results related to Parion as discontinued operations in its condensed consolidated statements of operations for the three and nine month ending September 30, 2017.
BioAxone Biosciences, Inc.
In October 2014, the Company entered into a license and collaboration agreement (the “BioAxone Agreement”) with BioAxone Biosciences, Inc. (“BioAxone”), which resulted in the consolidation of BioAxone as a VIE beginning on October 1, 2014. The Company paid BioAxone initial payments of $10.0 million in the fourth quarter of 2014.
BioAxone has the potential to receive up to $90.0 million in milestones and fees, including development, regulatory and milestone payments and a license continuation fee. In addition, BioAxone would receive royalties and commercial milestones on future net product sales of VX-210, if any. The Company recorded an in-process research and development intangible asset of $29.0 million for VX-210 and a corresponding deferred tax liability of $11.3 million attributable to BioAxone. The Company holds an option to purchase BioAxone at a predetermined price. The option expires on the earliest of (a) the day the FDA accepts the Biologics License Application submission for VX-210, (b) the day the Company elects to continue the license instead of exercising the option to purchase BioAxone and (c) March 15, 2018, subject to the Company’s option to extend this date by one year.
Aggregate VIE Financial Information
An aggregate summary of net income attributable to noncontrolling interest related to the Company’s VIEs for the three and nine months ended September 30, 2017 and 2016 is as follows:
|
| | | | | | | | | | | | | | | |
| | Three Months Ended September 30, | | Nine Months Ended September 30, |
| | 2017 | | 2016 | | 2017 | | 2016 |
| | (in thousands) |
| Loss attributable to noncontrolling interest before (benefit from) provision for income taxes and changes in fair value of contingent payments | $ | 238,946 |
| | $ | 2,406 |
| | $ | 222,448 |
| | $ | 6,080 |
|
| (Benefit from) provision for income taxes | (120,181 | ) | | (510 | ) | | (111,658 | ) | | 20,063 |
|
| Decrease (increase) in fair value of contingent payments | 69,550 |
| | (1,200 | ) | | 62,560 |
| | (59,350 | ) |
| Net loss (income) attributable to noncontrolling interest | $ | 188,315 |
| | $ | 696 |
| | $ | 173,350 |
| | $ | (33,207 | ) |
The decreases in the noncontrolling interest holders’ claim to net assets with respect to the fair value of the contingent payments in the three and nine months ended September 30, 2017 were primarily due to the decrease in the fair value of Parion’s pulmonary ENaC platform described above. The increases in the fair value of the contingent payments in the three and nine months ended September 30, 2016 were primarily due to a separate Phase 2 clinical trial of VX-371 achieving its primary safety endpointCRISPR in the second quarter of 2016. During the three and nine months ended September 30, 2017 and 2016, the (increases) decreases in the fair value of the contingent payments related to the Company’s VIEs were as follows:
|
| | | | | | | | | | | | | | | |
| | Three Months Ended September 30, | | Nine Months Ended September 30, |
| | 2017 | | 2016 | | 2017 | | 2016 |
| | (in thousands) |
| Parion | $ | 69,550 |
| | $ | (1,100 | ) | | $ | 63,460 |
| | $ | (58,500 | ) |
| BioAxone | — |
| | (100 | ) | | (900 | ) | | (850 | ) |
The fair value of the contingent payments related to the Parion Agreement and the BioAxone Agreement as of the dates set forth in the table:
VERTEX PHARMACEUTICALS INCORPORATED
Notes to Condensed Consolidated Financial Statements
(unaudited)
|
| | | | | | | |
| | September 30, 2017 | | December 31, 2016 |
| | (in thousands) |
| Parion | $ | — |
| | $ | 238,800 |
|
| BioAxone | 18,900 |
| | 18,000 |
|
The table below summarizes items related to the Company’s VIEs included in the Company’s condensed consolidated balance sheets as of the dates set forth in the table. Amounts as of September 30, 2017 related to BioAxone while amounts as of December 31, 2016 related to Parion and BioAxone.
|
| | | | | | | |
| | September 30, 2017 | | December 31, 2016 |
| | (in thousands) |
| Restricted cash and cash equivalents (VIE) | $ | 1,803 |
| | $ | 47,762 |
|
| Prepaid expenses and other current assets | 42 |
| | 6,812 |
|
| Intangible assets | 29,000 |
| | 284,340 |
|
| Other assets | 280 |
| | 399 |
|
| Accounts payable | 455 |
| | 415 |
|
| Accrued expenses | 1,021 |
| | 1,330 |
|
| Other liabilities, current portion | 119 |
| | 2,137 |
|
| Deferred tax liability | 8,338 |
| | 131,446 |
|
| Other liabilities, excluding current portion | — |
| | 300 |
|
| Noncontrolling interest | 12,167 |
| | 181,609 |
|
The Company has recorded the VIEs’ cash and cash equivalents as restricted cash and cash equivalents (VIE) because (i) the Company does2021. We concluded that we did not have any interest in or control over the VIEs’ cash and cash equivalents and (ii) the Company’s agreements with each VIE do not provide for the VIEs’ cash and cash equivalents to be used for the development of the assets that the Company licensed from the applicable VIE. Assets recorded as a result of consolidating the Company’s VIEs’ financial condition into the Company’s balance sheets do not represent additional assets that could be used to satisfy claims against the Company’s general assets.
Other Collaborations
The Company has entered into various agreements pursuant to which it collaborates with third parties, including inlicensing and outlicensing arrangements. Although the Company does not consider any of these arrangements to be material, the most notable of these arrangements are described below.
Moderna Therapeutics, Inc.
In July 2016, the Company entered into a strategic collaboration and licensing agreement (the “Moderna Agreement”) with Moderna Therapeutics, Inc. (“Moderna”) pursuant to which the parties are seeking to identify and develop messenger Ribonucleic Acid (“mRNA”) Therapeutics for the treatment of CF. In connection with the Moderna Agreement, in the third quarter of 2016, the Company made an upfront payment to Moderna of $20.0 million and a $20.0 million cost-method investment in Moderna pursuant to a convertible promissory note that converted into preferred stock in August 2016. Moderna has the potential to receive future development and regulatory milestones of up to $275.0 million, including $220.0 million in approval and reimbursement milestones, as well as tiered royalty payments on future sales.
Under the terms of the Moderna Agreement, Moderna will lead discovery efforts and the Company will lead all preclinical, development and commercialization activities associated with the advancement of mRNA Therapeutics that result from this collaboration and will fund all expenses related to the collaboration.
The Company may terminate the Moderna Agreement by providing advance notice to Moderna, with the required length of notice dependent on whether any product developed under the Moderna Agreement has received marketing approval. The Moderna Agreement also may be terminated by either party for a material breach by the other, subject to notice and cure
VERTEX PHARMACEUTICALS INCORPORATED
Notes to Condensed Consolidated Financial Statements
(unaudited)
provisions. Unless earlier terminated, the Moderna Agreement will continue in effect until the expiration of the Company’s payment obligations under the Moderna Agreement.
The Company evaluates the carrying value of its $20.0 million cost-method investment in Moderna, which is not a publicly traded company, for impairment on a quarterly basis and has not recorded any adjustments to the carrying value of its investment to date.
Janssen Pharmaceuticals, Inc.
In June 2014, the Company entered into an agreement (the “Janssen Agreement”) with Janssen Pharmaceuticals, Inc. (“Janssen Inc.”), which was amended in October 2014 to clarify certain roles and responsibilities of the parties.
Pursuant to the Janssen Agreement, Janssen Inc. has an exclusive worldwide license to develop and commercialize certain drug candidates for the treatment of influenza, including JNJ-3872 (formerly VX-787). The Company received non-refundable payments of $35.0 million from Janssen Inc. in 2014, which were recorded as collaborative revenue. The Company has the potential to receive development, regulatory and commercial milestone payments as well as royalties on future product sales, if any. Janssen Inc. may terminate the Janssen Agreement, subject to certain exceptions, upon six months’ notice.
Janssen Inc. is responsible for costs related to the development and commercialization of the compounds. During the three and nine months ended September 30, 2017 the Company recorded reimbursement for these development activities of zero and $1.8 million, respectively. During the three and nine months ended September 30, 2016 the Company recorded reimbursement for these development activities of $2.8 million and $10.6 million, respectively. The reimbursements are recorded as a reduction to development expense in the Company’s condensed consolidated statements of operations primarily due to the fact that Janssen Inc. directs the activities and selects the suppliers associated with these activities.
Asset Acquisition
Concert Pharmaceuticals
In July 2017, the Company completed the acquisition of certain CF assets including VX-561 (formerly CTP-656) from Concert Pharmaceuticals Inc. (“Concert”) pursuant to an asset purchase agreement that was entered into in March 2017 (the “Concert Agreement”). VX-561 is an investigational CFTR potentiator that has the potential to be used as part of future once-daily combination regimens of CFTR modulators that treat the underlying cause of CF. As part of the Concert Agreement, Vertex paid Concert $160.0 million in cash for all worldwide development and commercialization rights to VX-561. If VX-561 is approved as part of a combination regimen to treat CF, Concert could receive up to an additional $90.0 million in milestones based on regulatory approval in the U.S. and reimbursement in the UK, Germany or France. The Company determined that substantially all of the fair value of the Concert Agreement was attributable to a single in-process research and development asset, VX-561, which did not constitute a business. The Company cannot conclude that there is any alternative future use for the acquired in-process research and development asset. Thus, the Companyand recorded the $160.0 millionthis upfront payment as ato “Acquired in-process research and development expenseexpenses.” CRISPR has the potential to receive an additional one-time $200.0 million milestone payment upon receipt of the first marketing approval of exa-cel from the U.S. Food and Drug Administration or the European Commission.
We and CRISPR shared equally all expenses incurred under the Original CTX001 JDCA. On July 1, 2021, the net profits and net losses incurred with respect to exa-cel pursuant to the A&R JDCA began to be allocated 60% to us and 40% to CRISPR, subject to certain adjustments, while all other product candidates and products continue to have net profits and net losses shared equally between the parties. We concluded that the Original CTX001 JDCA and the A&R JDCA are cost-sharing arrangements, which result in the net impact of the arrangements being recorded in “Total costs and expenses” within our condensed consolidated statements of operations. During the three and nine months ended September 30, 2017. The2022 and 2021, we recognized the following amounts in total, purchase pricenot including amounts recorded to “Acquired in-process research and development expenses,” related to these agreements:
| | | | | | | | | | | | | | | | | | | | | | | |
| Three Months Ended September 30, | | Nine Months Ended September 30, |
| 2022 | | 2021 | | 2022 | | 2021 |
| (in millions) |
| Total expenses incurred under the Original CTX001 JDCA and A&R JDCA | $ | 98.2 | | | $ | 58.7 | | | $ | 259.8 | | | $ | 147.4 | |
| Vertex’s share recognized in “Total costs and expenses” in our condensed consolidated statements of operations | $ | 59.0 | | | $ | 35.2 | | | $ | 155.9 | | | $ | 79.6 | |
Verve Therapeutics, Inc.
In July 2022, we entered into a research collaboration with Verve Therapeutics, Inc. (“Verve”) focused on discovering and developing an in vivo gene-editing program for a liver disease. Under the terms of the agreement, we made a $25.0 million upfront payment to Verve and purchased $35.0 million of Verve’s common stock. We concluded that there is no alternative future use for the transactionacquired in-process research and development and recorded the upfront payment to “Acquired in-process research and development expenses.” The investment in Verve’s common stock is recorded at fair value on our condensed consolidated balance sheet within “Marketable securities.”
Asset Acquisition
Catalyst Biosciences, Inc. - Complement 3 Degrader Program
In May 2022, pursuant to an asset purchase agreement, we acquired Catalyst Biosciences, Inc.’s portfolio of protease medicines that target the complement system (the “complement portfolio”) and related intellectual property, including CB 2782-PEG, which is a pre-clinical complement component 3 degrader program for geographic atrophy in dry age-related macular degeneration. We determined that substantially all the fair value acquired was $165.1concentrated in the CB-2782 PEG in-process research and development assets, which did not constitute a business, and for which we determined there was no alternative future use. As a result, we recorded our $60.0 million upfront payment to “Acquired in-process research and development expenses” in the nine months ended September 30, 2022.
Cystic Fibrosis Foundation
We have a research, development and commercialization agreement that was originally entered into in 2004 with the Cystic Fibrosis Foundation, as successor in interest to the Cystic Fibrosis Foundation Therapeutics, Inc. This agreement was most recently amended in 2016. Pursuant to the agreement, as amended, we agreed to pay royalties ranging from low-single digits to mid-single digits on potential sales of certain compounds first synthesized and/or tested between March 1, 2014 and August 31, 2016, including $5.1 million of transaction costs that were recordedelexacaftor, and tiered royalties ranging from single digits to sub-teens on covered compounds first synthesized and/or tested during a research term on or before February 28, 2014, including KALYDECO (ivacaftor), ORKAMBI (lumacaftor in combination with ivacaftor) and SYMDEKO/SYMKEVI (tezacaftor in combination with ivacaftor). For combination products, such as ORKAMBI, SYMDEKO/SYMKEVI and TRIKAFTA/KAFTRIO (elexacaftor/tezacaftor/ivacaftor and ivacaftor), sales general and administrative expenses. If the Company achieves one or moreare allocated equally to each of the $90.0 million of regulatory approval and reimbursement milestones, the Company will record the value of the milestone as an intangible asset and will begin amortizing the asset in cost of product revenuesactive pharmaceutical ingredients in the period thatcombination product. We record our royalties payable to the relevant milestone is achieved.
Basic net income (loss) per share attributableCystic Fibrosis Foundation to Vertex common shareholders is based upon the weighted-average number“Cost of common shares outstanding during the period, excluding restricted stock and restricted stock units that have been issued but are not yet vested. Diluted net income (loss) per share attributable to Vertex common shareholders is based upon the weighted-average number of common shares outstanding during the period plus additional weighted-average common equivalent shares outstanding during the period when the effect is dilutive.
sales.”
VERTEX PHARMACEUTICALS INCORPORATED
Notes to Condensed Consolidated Financial Statements
(unaudited)
D.Business Combination
On September 27, 2022, we acquired all outstanding shares of ViaCyte, Inc. (“ViaCyte”), a privately held biotechnology company primarily focused on delivering novel stem cell-derived cell replacement therapies as a functional cure for type 1 diabetes, in exchange for $315.0 million. ViaCyte’s intellectual property and assembled workforce complement our ongoing programs and have the potential to produce therapies for patients with type 1 diabetes. We accounted for the transaction as a business combination, and allocated the purchase price to the following assets acquired and liabilities assumed:
| | | | | |
| As of September 27, 2022 |
| (in millions) |
| Cash and cash equivalents | $ | 19.1 | |
| Goodwill | 73.0 | |
| Intangible asset | 216.6 | |
| |
| Net other assets | 6.3 | |
| Total purchase price | $ | 315.0 | |
The “Goodwill” represents the difference between the fair value of the consideration transferred and the fair value of the assets acquired and liabilities assumed. The goodwill is attributable to (i) the technological expertise in cell therapy of ViaCyte’s assembled workforce, (ii) the potential synergies from combining ViaCyte’s technology with our clinical development capabilities and (iii) the potential future benefits for other therapeutic programs that the acquired technology could be used for, but did not meet the definition of an in-process research and development asset. None of the goodwill is expected to be deductible for income tax purposes.
The “Intangible asset” is an in-process research and development asset of $216.6 million related to ViaCyte’s technology and intellectual property associated with stem cell differentiation and manufacturing. The fair value of the intangible asset was determined through a discounted cash flow analysis using the relief from royalty method, which estimated the cost savings associated with owning an asset instead of paying a royalty to the previous owner. The relief from royalty method utilized Level 3 fair value inputs including (i) estimated future product sales, which were calculated using, among other assumptions, an estimated probability of obtaining marketing approval for the asset, (ii) estimated after-tax royalty savings expected from ownership of the asset, and (iii) an appropriate discount and tax rate.
As of September 30, 2022, our analysis of the fair value of certain assets acquired, including certain tax analyses, related to the ViaCyte business combination is preliminary and will be finalized during the measurement period of up to one year from the acquisition date. The financial results of ViaCyte did not have a material effect on our condensed consolidated statement of operations in the three and nine months ended September 30, 2022.
VERTEX PHARMACEUTICALS INCORPORATED
Notes to Condensed Consolidated Financial Statements (unaudited)
E.Earnings Per Share
The following table sets forth the computation of basic and diluted net income (loss) per common share for the periods ended:
| | | | | | | | | | | | | | | | | | | | | | | |
| Three Months Ended September 30, | | Nine Months Ended September 30, |
| 2022 | | 2021 | | 2022 | | 2021 |
| (in millions, except per share amounts) |
| Net income | $ | 930.5 | | | $ | 851.9 | | | $ | 2,503.1 | | | $ | 1,572.0 | |
| | | | | | | |
| Basic weighted-average common shares outstanding | 256.5 | | | 257.9 | | | 255.8 | | | 258.7 | |
| Effect of potentially dilutive securities: | | | | | | | |
| Stock options | 1.4 | | | 1.0 | | | 1.4 | | | 1.1 | |
| Restricted stock units (including PSUs) | 1.6 | | | 0.8 | | | 1.4 | | | 1.1 | |
| Employee stock purchase program | 0.0 | | | 0.0 | | | 0.1 | | | 0.0 | |
| Diluted weighted-average common shares outstanding | 259.5 | | | 259.7 | | | 258.7 | | | 260.9 | |
| | | | | | | |
| Basic net income per common share | $ | 3.63 | | | $ | 3.30 | | | $ | 9.78 | | | $ | 6.08 | |
| Diluted net income per common share | $ | 3.59 | | | $ | 3.28 | | | $ | 9.68 | | | $ | 6.03 | |
|
| | | | | | | | | | | | | | | |
| | Three Months Ended September 30, | | Nine Months Ended September 30, |
| | 2017 | | 2016 | | 2017 | | 2016 |
| | (in thousands, except per share amounts) |
| Basic net income (loss) attributable to Vertex per common share calculation: | | | | | | | |
| Net income (loss) attributable to Vertex common shareholders | $ | (102,952 | ) | | $ | (38,841 | ) | | $ | 162,800 |
| | $ | (144,997 | ) |
| Less: Undistributed earnings allocated to participating securities | — |
| | — |
| | (203 | ) | | — |
|
| Net income (loss) attributable to Vertex common shareholders—basic | $ | (102,952 | ) | | $ | (38,841 | ) | | $ | 162,597 |
| | $ | (144,997 | ) |
| | | | | | | | |
| Basic weighted-average common shares outstanding | 250,268 |
| | 244,920 |
| | 247,963 |
| | 244,529 |
|
| Basic net income (loss) attributable to Vertex per common share | $ | (0.41 | ) | | $ | (0.16 | ) | | $ | 0.66 |
| | $ | (0.59 | ) |
| | | | | | | | |
| Diluted net income (loss) attributable to Vertex per common share calculation: | | | | | | | |
| Net income (loss) attributable to Vertex common shareholders | $ | (102,952 | ) | | $ | (38,841 | ) | | $ | 162,800 |
| | $ | (144,997 | ) |
| Less: Undistributed earnings allocated to participating securities | — |
| | — |
| | (200 | ) | | — |
|
| Net income (loss) attributable to Vertex common shareholders—diluted | $ | (102,952 | ) | | $ | (38,841 | ) | | $ | 162,600 |
| | $ | (144,997 | ) |
| | | | | | | | |
| Weighted-average shares used to compute basic net income (loss) per common share | 250,268 |
| | 244,920 |
| | 247,963 |
| | 244,529 |
|
| Effect of potentially dilutive securities: | | | | | | | |
| Stock options | — |
| | — |
| | 2,700 |
| | — |
|
| Restricted stock and restricted stock units | — |
| | — |
| | 1,204 |
| | — |
|
| Other | — |
| | — |
| | 228 |
| | — |
|
| Weighted-average shares used to compute diluted net income (loss) per common share | 250,268 |
| | 244,920 |
| | 252,095 |
| | 244,529 |
|
| Diluted net income (loss) attributable to Vertex per common share | $ | (0.41 | ) | | $ | (0.16 | ) | | $ | 0.64 |
| | $ | (0.59 | ) |
The CompanyWe did not include the securities in the following table in the computation of the dilutivediluted net income (loss) per share attributable to Vertex common shareholders calculationsshare because the effect would have been anti-dilutive during each period:
| | | | | | | | | | | | | | | | | | | | | | | |
| Three Months Ended September 30, | | Nine Months Ended September 30, |
| 2022 | | 2021 | | 2022 | | 2021 |
| (in millions) |
| Stock options | — | | | 1.1 | | | 0.0 | | | 0.7 | |
| Unvested restricted stock units (including PSUs) | 0.0 | | | 0.2 | | | 0.2 | | | 0.4 | |
F.Fair Value Measurements
|
| | | | | | | | | | | |
| | Three Months Ended September 30, | | Nine Months Ended September 30, |
| | 2017 | | 2016 | | 2017 | | 2016 |
| | (in thousands) |
| Stock options | 10,278 |
| | 12,947 |
| | 3,904 |
| | 12,947 |
|
| Unvested restricted stock and restricted stock units | 4,241 |
| | 3,624 |
| | 281 |
| | 3,624 |
|
| |
E. | Fair Value Measurements |
The fair value of the Company’s financial assets and liabilities reflects the Company’s estimate of amounts that it would have received in connection with the sale of the assets or paid in connection with the transfer of the liabilities in an orderly transaction between market participants at the measurement date. In connection with measuring the fair value of its assets and liabilities, the Company seeks to maximize the use of observable inputs (market data obtained from sources independent from the Company) and to minimize the use of unobservable inputs (the Company’s assumptions about how market
VERTEX PHARMACEUTICALS INCORPORATED
Notes to Condensed Consolidated Financial Statements
(unaudited)
participants would price assets and liabilities). The following fair value hierarchy is used to classify assets and liabilities based on the observable inputs and unobservable inputs used in order to determine the fair value theof our financial assets and liabilities:
|
| | | | |
| Level 1: | Quoted prices in active markets for identical assets or liabilities. An active market for an asset or liability is a market in which transactions for the asset or liability occur with sufficient frequency and volume to provide pricing information on an ongoing basis. |
| Level 2: | Observable inputs other than Level 1 inputs. Examples of Level 2 inputs include quoted prices in active markets for similar assets or liabilities and quoted prices for identical assets or liabilities in markets that are not active. |
| Level 3: | Unobservable inputs based on the Company’sour assessment of the assumptions that market participants would use in pricing the asset or liability. |
The Company’sOur investment strategy is focused on capital preservation. The Company investsWe invest in instruments that meet the credit quality standards outlined in the Company’sour investment policy. This policy, which also limits the amount of credit exposure to any one issue or type of instrument. As of September 30, 2017,We maintain strategic investments separately from the Company’s investments were primarilyinvestment policy that governs our other cash, cash equivalents and marketable securities as described in money market funds, government-sponsored enterprise securities, corporate equity securities, corporate debt securitiesNote G, “Marketable Securities and commercial paper.Equity Investments.” Additionally, the Company utilizeswe utilize foreign currency forward contracts intended to mitigate the effect of changes in foreign exchange rates on itsour condensed consolidated statement of operations.
As of September 30, 2017, all of the Company’s financial assets and liabilities that were subject to fair value measurements were valued using observable inputs. The Company’s financial assets valued based on Level 1 inputs consisted of money market funds, government-sponsored enterprise securities and corporate equity securities. The Company’s financial assets and liabilities valued based on Level 2 inputs consisted of corporate debt securities and commercial paper, which consisted of investments in highly-rated investment-grade corporations and foreign currency forward contracts with highly reputable and creditworthy counterparties.
.
VERTEX PHARMACEUTICALS INCORPORATED
Notes to Condensed Consolidated Financial Statements
(unaudited)
The following table setstables set forth the Company’sour financial assets (excluding VIE cash and cash equivalents, which are recorded as Restricted cash and cash equivalents (VIE)) and liabilities subject to fair value measurements:measurements by level within the fair value hierarchy (and does not include $3.5 billion and $3.3 billion of cash as of September 30, 2022 and December 31, 2021, respectively):
| | | | | | | | | | | | | | | | | | | | | | | | | | | | | | | | | | | | | | | | | | | | | | | |
| As of September 30, 2022 | | As of December 31, 2021 |
| Total | | Level 1 | | Level 2 | | Level 3 | | Total | | Level 1 | | Level 2 | | Level 3 |
| (in millions) |
| Financial instruments carried at fair value (asset positions): |
| Cash equivalents: | | | | | | | | | | | | | | | |
| Money market funds | $ | 3,610.9 | | | $ | 3,610.9 | | | $ | — | | | $ | — | | | $ | 3,478.1 | | | $ | 3,478.1 | | | $ | — | | | $ | — | |
| Time deposits | 2,000.0 | | | — | | | 2,000.0 | | | — | | | — | | | — | | | — | | | — | |
| Commercial paper | 18.2 | | | — | | | 18.2 | | | — | | | — | | | — | | | — | | | — | |
| Marketable securities: | | | | | | | | | | | | | | | |
| Corporate equity securities | 122.8 | | | 78.2 | | | 44.6 | | | — | | | 230.9 | | | 230.9 | | | — | | | — | |
| U.S. Treasury securities | 130.0 | | | 130.0 | | | — | | | — | | | 86.4 | | | 86.4 | | | — | | | — | |
| Government-sponsored enterprise securities | 10.5 | | | 10.5 | | | — | | | — | | | 69.0 | | | 69.0 | | | — | | | — | |
| Corporate debt securities | 66.8 | | | — | | | 66.8 | | | — | | | 90.9 | | | — | | | 90.9 | | | — | |
| Commercial paper | 269.1 | | | — | | | 269.1 | | | — | | | 252.7 | | | — | | | 252.7 | | | — | |
| Prepaid expenses and other current assets: | | | | | | | | | | | | | | | |
| Foreign currency forward contracts | 191.6 | | | — | | | 191.6 | | | — | | | 44.5 | | | — | | | 44.5 | | | — | |
| Other assets: | | | | | | | | | | | | | | | |
| Foreign currency forward contracts | 9.1 | | | — | | | 9.1 | | | — | | | 2.0 | | | — | | | 2.0 | | | — | |
| Total financial assets | $ | 6,429.0 | | | $ | 3,829.6 | | | $ | 2,599.4 | | | $ | — | | | $ | 4,254.5 | | | $ | 3,864.4 | | | $ | 390.1 | | | $ | — | |
| | | | | | | | | | | | | | | |
| Financial instruments carried at fair value (liability positions): |
| Other current liabilities: | | | | | | | | | | | | | | | |
| Foreign currency forward contracts | $ | (0.0) | | | $ | — | | | $ | (0.0) | | | $ | — | | | $ | (5.6) | | | $ | — | | | $ | (5.6) | | | $ | — | |
| Long-term contingent consideration | (127.2) | | | — | | | — | | | (127.2) | | | (186.5) | | | — | | | — | | | (186.5) | |
| Other long-term liabilities: | | | | | | | | | | | | | | | |
| Foreign currency forward contracts | (0.0) | | | — | | | (0.0) | | | — | | | (2.7) | | | — | | | (2.7) | | | — | |
| Total financial liabilities | $ | (127.2) | | | $ | — | | | $ | (0.0) | | | $ | (127.2) | | | $ | (194.8) | | | $ | — | | | $ | (8.3) | | | $ | (186.5) | |
Please refer to Note G, “Marketable Securities and Equity Investments,” for the carrying amount and related unrealized gains (losses) by type of investment.
Fair Value of Corporate Equity Securities
We classify our investments in publicly traded corporate equity securities as “Marketable securities” on our condensed consolidated balance sheets. Generally, our investments in the common stock of publicly traded companies are valued based on Level 1 inputs because they have readily determinable fair values. However, certain of our investments in publicly traded companies have been or continue to be valued based on Level 2 inputs due to transfer restrictions associated with these investments. Please refer to Note G, “Marketable Securities and Equity Investments,” for further information on these investments.
Fair Value of Contingent Consideration
In 2019, we acquired Exonics Therapeutics, Inc. (“Exonics”), a privately-held company focused on creating transformative gene-editing therapies to repair mutations that cause Duchenne muscular dystrophy and other severe neuromuscular diseases, including myotonic dystrophy type 1. Our Level 3 contingent consideration liabilities are related to $678.3 million of development and regulatory milestones potentially payable to former Exonics equity holders. We base our estimates of the probability of achieving the milestones relevant to the fair value of contingent payments on industry data attributable to rare diseases and our knowledge of the progress and viability of the programs. The discount rates used in the valuation model for contingent payments, which were between 5.2% and 5.7% as of September 30, 2022, represent a measure of credit risk and market risk associated with settling the liabilities. Significant judgment is used in determining the appropriateness of these assumptions at each reporting period. Due to the uncertainties associated with development and
|
| | | | | | | | | | | | | | | |
| | Fair Value Measurements as of September 30, 2017 |
| | | | Fair Value Hierarchy |
| | Total | | Level 1 | | Level 2 | | Level 3 |
| | (in thousands) |
| Financial instruments carried at fair value (asset position): | | | | | | | |
| Cash equivalents: | | | | | | | |
| Money market funds | $ | 466,702 |
| | $ | 466,702 |
| | $ | — |
| | $ | — |
|
| Government-sponsored enterprise securities | 14,979 |
| | 14,979 |
| | — |
| | — |
|
| Corporate debt securities | 4,488 |
| | — |
| | 4,488 |
| | — |
|
| Commercial paper | 14,608 |
| | — |
| | 14,608 |
| | — |
|
| Marketable securities: | | | | | | | |
| Corporate equity securities | 56,944 |
| | 56,944 |
| | — |
| | — |
|
| Corporate debt securities | 295,171 |
| | — |
| | 295,171 |
| | — |
|
| Commercial paper | 75,167 |
| | — |
| | 75,167 |
| | — |
|
| Prepaid and other current assets: | | | | | | | |
| Foreign currency forward contracts | 42 |
| | — |
| | 42 |
| | — |
|
| Other assets: | | | | | | | |
| Foreign currency forward contracts | 8 |
| | — |
| | 8 |
| | — |
|
| Total financial assets | $ | 928,109 |
|
| $ | 538,625 |
| | $ | 389,484 |
| | $ | — |
|
| Financial instruments carried at fair value (liability position): | | | | | | | |
| Other liabilities, current portion: | | | | | | | |
| Foreign currency forward contracts | $ | (13,897 | ) | | $ | — |
| | $ | (13,897 | ) | | $ | — |
|
| Other liabilities, excluding current portion: | | | | | | | |
| Foreign currency forward contracts | (977 | ) | | — |
| | (977 | ) | | — |
|
| Total financial liabilities | $ | (14,874 | ) | | $ | — |
| | $ | (14,874 | ) | | $ | — |
|
|
| | | | | | | | | | | | | | | |
| | Fair Value Measurements as of December 31, 2016 |
| | | | Fair Value Hierarchy |
| | Total | | Level 1 | | Level 2 | | Level 3 |
| | (in thousands) |
| Financial instruments carried at fair value (asset position): | | | | | | | |
| Cash equivalents: | | | | | | | |
| Money market funds | $ | 280,560 |
| | $ | 280,560 |
| | $ | — |
| | $ | — |
|
| Marketable securities: | | | | | | | |
| Government-sponsored enterprise securities | 15,508 |
| | 15,508 |
| | — |
| | — |
|
| Corporate equity securities | 64,560 |
| | 64,560 |
| | — |
| | — |
|
| Commercial paper | 59,404 |
| | — |
| | 59,404 |
| | — |
|
| Corporate debt securities | 111,140 |
| | — |
| | 111,140 |
| | — |
|
| Prepaid and other current assets: | | | | | | | |
| Foreign currency forward contracts | 14,407 |
| | — |
| | 14,407 |
| | — |
|
| Other assets: | | | | | | | |
| Foreign currency forward contracts | 1,186 |
| | $ | — |
| | 1,186 |
| | $ | — |
|
| Total financial assets | $ | 546,765 |
| | $ | 360,628 |
| | $ | 186,137 |
| | $ | — |
|
| Financial instruments carried at fair value (liability position): | | | | | | | |
| Other liabilities, current portion: | | | | | | | |
| Foreign currency forward contracts | $ | (144 | ) | | $ | — |
| | $ | (144 | ) | | $ | — |
|
| Total financial liabilities | $ | (144 | ) | | $ | — |
| | $ | (144 | ) | | $ | — |
|
VERTEX PHARMACEUTICALS INCORPORATED
Notes to Condensed Consolidated Financial Statements
(unaudited)
The Company’s VIE invested in cash equivalents consistingcommercialization of money market funds of $1.5 million as of September 30, 2017, which are valued based on Level 1 inputs. These cash equivalents are not includedproduct candidates in the table above. The Company’s noncontrolling interest related topharmaceutical industry and the Company’s VIE includeseffects of changes in other assumptions including discount rates, we expect our estimates regarding the fair value of contingent consideration to change in the future, resulting in adjustments to the fair value of our contingent payments, which consistconsideration liabilities, and the effect of milestone, royalty and option payments, which are valued based on Level 3 inputs. Please refer to Note C, “Collaborative Arrangements and Acquisitions,” for further information.any such adjustments could be material.
The following table represents a rollforward of the fair value of our contingent consideration liabilities: | | | | | | | | | | | |
F. | Marketable SecuritiesNine Months Ended September 30, 2022 | | | | | | |
| (in millions) | | | | | | |
| Balance at December 31, 2021 | $ | 186.5 | | | | | | | |
| Decrease in fair value of contingent payments | (59.3) | | | | | | | |
| Balance at September 30, 2022 | $ | 127.2 | | | | | | | |
The decrease in fair value of contingent consideration during the nine months ended September 30, 2022 was primarily due to a revision to the scope of certain acquired gene-editing programs in the second quarter of 2022.
Fair Value of Intangible Assets
As of September 30, 2022 and December 31, 2021, we had $603.6 million and $400.0 million, respectively, of in-process research and development intangible assets classified as “Intangible assets” on our condensed consolidated balance sheets. In the third quarter of 2022, we recorded a $216.6 million in-process research and development intangible asset resulting from our acquisition of ViaCyte, which is described in Note D, “Business Combination.” In the nine months ended September 30, 2022, we recorded a $13.0 million impairment of an in-process research and development intangible asset to “Research and development expenses,” due to a decision to revise the scope of certain acquired gene-editing programs.
G.Marketable Securities and Equity Investments
A summary of the Company’s cash,our cash equivalents and marketable securities, which are recorded at fair value (and do not include $3.5 billion and $3.3 billion of cash as of September 30, 2022 and December 31, 2021, respectively), is shown below:
| | | | | | | | | | | | | | | | | | | | | | | | | | | | | | | | | | | | | | | | | | | | | | | |
| As of September 30, 2022 | | As of December 31, 2021 |
| Amortized Cost | | Gross
Unrealized
Gains | | Gross
Unrealized
Losses | | Fair Value | | Amortized Cost | | Gross
Unrealized
Gains | | Gross
Unrealized
Losses | | Fair Value |
| (in millions) |
| Cash equivalents: | | | | | | | | | | | | | | | |
| Money market funds | $ | 3,610.9 | | | $ | — | | | $ | — | | | $ | 3,610.9 | | | $ | 3,478.1 | | | $ | — | | | $ | — | | | $ | 3,478.1 | |
| Time deposits | 2,000.0 | | | — | | | — | | | 2,000.0 | | | — | | | — | | | — | | | — | |
| Commercial paper | 18.2 | | | — | | | — | | | 18.2 | | | — | | | — | | | — | | | — | |
| Total cash equivalents | $ | 5,629.1 | | | $ | — | | | $ | — | | | $ | 5,629.1 | | | $ | 3,478.1 | | | $ | — | | | $ | — | | | $ | 3,478.1 | |
| Marketable securities: | | | | | | | | | | | | | | | |
| U.S. Treasury securities | $ | 131.7 | | | $ | — | | | $ | (1.7) | | | $ | 130.0 | | | $ | 86.6 | | | $ | — | | | $ | (0.2) | | | $ | 86.4 | |
| Government-sponsored enterprise securities | 10.6 | | | — | | | (0.1) | | | 10.5 | | | 69.0 | | | — | | | — | | | 69.0 | |
| Corporate debt securities | 67.8 | | | — | | | (1.0) | | | 66.8 | | | 91.1 | | | — | | | (0.2) | | | 90.9 | |
| Commercial paper | 270.4 | | | — | | | (1.3) | | | 269.1 | | | 252.8 | | | — | | | (0.1) | | | 252.7 | |
| Total marketable debt securities | 480.5 | | | — | | | (4.1) | | | 476.4 | | | 499.5 | | | — | | | (0.5) | | | 499.0 | |
| Corporate equity securities | 104.4 | | | 29.2 | | | (10.8) | | | 122.8 | | | 69.4 | | | 167.1 | | | (5.6) | | | 230.9 | |
| Total marketable securities | $ | 584.9 | | | $ | 29.2 | | | $ | (14.9) | | | $ | 599.2 | | | $ | 568.9 | | | $ | 167.1 | | | $ | (6.1) | | | $ | 729.9 | |
VERTEX PHARMACEUTICALS INCORPORATED
Notes to Condensed Consolidated Financial Statements (unaudited)
|
| | | | | | | | | | | | | | | |
| | Amortized Cost | | Gross
Unrealized
Gains | | Gross
Unrealized
Losses | | Fair Value |
| | (in thousands) |
| As of September 30, 2017 | | | | | | | |
| Cash and cash equivalents: | | | | | | | |
| Cash and money market funds | $ | 1,350,891 |
| | $ | — |
| | $ | — |
| | $ | 1,350,891 |
|
| Government-sponsored enterprise securities | 14,979 |
| | — |
| | — |
| | 14,979 |
|
| Commercial paper | 14,610 |
| | — |
| | (2 | ) | | 14,608 |
|
| Corporate debt securities | 4,488 |
| | — |
| | — |
| | 4,488 |
|
| Total cash and cash equivalents | $ | 1,384,968 |
| | $ | — |
| | $ | (2 | ) | | $ | 1,384,966 |
|
| Marketable securities: | | | | | | | |
| Corporate equity securities | 43,213 |
| | 13,731 |
| | — |
| | 56,944 |
|
| Commercial paper (matures within 1 year) | 75,186 |
| | 1 |
| | (20 | ) | | 75,167 |
|
| Corporate debt securities (matures within 1 year) | 235,679 |
| | 8 |
| | (106 | ) | | 235,581 |
|
| Corporate debt securities (matures after 1 year) | 59,651 |
| | — |
| | (61 | ) | | 59,590 |
|
| Total marketable securities | $ | 413,729 |
| | $ | 13,740 |
| | $ | (187 | ) | | $ | 427,282 |
|
| Total cash, cash equivalents and marketable securities | $ | 1,798,697 |
| | $ | 13,740 |
| | $ | (189 | ) | | $ | 1,812,248 |
|
| | | | | | | | |
| As of December 31, 2016 | | | | | | | |
| Cash and cash equivalents: | | | | | | | |
| Cash and money market funds | $ | 1,183,945 |
| | $ | — |
| | $ | — |
| | $ | 1,183,945 |
|
| Total cash and cash equivalents | $ | 1,183,945 |
| | $ | — |
| | $ | — |
| | $ | 1,183,945 |
|
| Marketable securities: | | | | | | | |
| Government-sponsored enterprise securities (matures within 1 year) | $ | 15,506 |
| | $ | 2 |
| | $ | — |
| | $ | 15,508 |
|
| Corporate equity securities | 43,213 |
| | 21,347 |
| | — |
| | 64,560 |
|
| Commercial paper (matures within 1 year) | 59,331 |
| | 73 |
| | — |
| | 59,404 |
|
| Corporate debt securities (matures within 1 year) | 111,225 |
| | — |
| | (85 | ) | | 111,140 |
|
| Total marketable securities | $ | 229,275 |
| | $ | 21,422 |
| | $ | (85 | ) | | $ | 250,612 |
|
| Total cash, cash equivalents and marketable securities | $ | 1,413,220 |
| | $ | 21,422 |
| | $ | (85 | ) | | $ | 1,434,557 |
|
The Company has | | | | | | | | | | | |
| As of September 30, 2022 | | As of December 31, 2021 |
| (in millions) |
| Cash and cash equivalents | $ | 3,629.1 | | | $ | 3,478.1 | |
| Marketable securities | 476.4 | | | 499.0 | |
| Total | $ | 4,105.5 | | | $ | 3,977.1 | |
Available-for-sale debt securities by contractual maturity were as follows:
| | | | | | | | | | | |
| As of September 30, 2022 | | As of December 31, 2021 |
| (in millions) |
| Matures within one year | $ | 4,091.4 | | | $ | 3,912.3 | |
| Matures after one year through five years | 14.1 | | | 64.8 | |
| Total | $ | 4,105.5 | | | $ | 3,977.1 | |
We have a limited number of marketableavailable-for-sale debt securities in insignificant loss positions as of September 30, 2017,2022, which the Company doeswe do not intend to sell and hashave concluded itwe will not be required to sell before recovery of the amortized costs offor the investmentinvestments at maturity. There were no charges recordedWe did not record any allowances for other-than-temporary declines incredit losses to adjust the fair value of marketableavailable-for-sale debt securities noror gross realized gains or losses recognized in the three and nine months ended September 30, 20172022 and 2016.2021.
We record changes in the fair value of our investments in corporate equity securities to “Other income (expense), net” in our condensed consolidated statements of operations. During the three and nine months ended September 30, 2022 and 2021, our net unrealized gains (losses) on corporate equity securities held at the conclusion of each period were as follows:
| | | | | | | | | | | | | | | | | | | | | | | |
| Three Months Ended September 30, | | Nine Months Ended September 30, |
| 2022 | | 2021 | | 2022 | | 2021 |
| (in millions) |
| Net unrealized gains (losses) | $ | 16.7 | | | $ | 46.7 | | | $ | (143.1) | | | $ | 5.0 | |
As of September 30, 2022, the carrying value of our equity investments without readily determinable fair values, which are recorded in “Other assets” on our condensed consolidated balance sheets, was $98.6 million.
VERTEX PHARMACEUTICALS INCORPORATED
Notes to Condensed Consolidated Financial Statements
(unaudited)
H.Accumulated Other Comprehensive Income (Loss)
| |
G. | Accumulated Other Comprehensive Income (Loss) |
A summary ofThe following table summarizes the Company’s changes in accumulated other comprehensive income (loss) by component is shown below:component:
| | | | | | | | | | | | | | | | | | | | | | | |
| | | Unrealized Holding Gains (Losses), Net of Tax | | |
| Foreign Currency Translation Adjustment | | On Available-For-Sale Debt Securities | | On Foreign Currency Forward Contracts | | Total |
| (in millions) |
| Balance at December 31, 2021 | $ | (13.6) | | | $ | (0.5) | | | $ | 30.0 | | | $ | 15.9 | |
| Other comprehensive (loss) income before reclassifications | (42.8) | | | (3.6) | | | 230.2 | | | 183.8 | |
| Amounts reclassified from accumulated other comprehensive income (loss) | — | | | — | | | (102.1) | | | (102.1) | |
| Net current period other comprehensive (loss) income | (42.8) | | | (3.6) | | | 128.1 | | | 81.7 | |
| Balance at September 30, 2022 | $ | (56.4) | | | $ | (4.1) | | | $ | 158.1 | | | $ | 97.6 | |
| | | | | | | |
| Balance at December 31, 2020 | $ | (15.6) | | | $ | 0.3 | | | $ | (53.2) | | | $ | (68.5) | |
| Other comprehensive income (loss) before reclassifications | 3.3 | | | (0.3) | | | 46.2 | | | 49.2 | |
| Amounts reclassified from accumulated other comprehensive income (loss) | — | | | — | | | 30.8 | | | 30.8 | |
| Net current period other comprehensive income (loss) | 3.3 | | | (0.3) | | | 77.0 | | | 80.0 | |
| Balance at September 30, 2021 | $ | (12.3) | | | $ | 0.0 | | | $ | 23.8 | | | $ | 11.5 | |
I.Hedging
|
| | | | | | | | | | | | | | | |
| | Foreign Currency Translation Adjustment | | Unrealized Holding Gains (Losses) on Marketable Securities, Net of Tax | | Unrealized Gains (Losses) on Foreign Currency Forward Contracts, Net of Tax | | Total |
| | (in thousands) |
| Balance at December 31, 2016 | $ | (7,862 | ) | | $ | 17,521 |
| | $ | 11,514 |
| | $ | 21,173 |
|
| Other comprehensive loss before reclassifications | (11,137 | ) | | (7,786 | ) | | (25,981 | ) | | (44,904 | ) |
| Amounts reclassified from accumulated other comprehensive income (loss) | — |
| | — |
| | (1,398 | ) | | (1,398 | ) |
| Net current period other comprehensive (loss) income | $ | (11,137 | ) | | $ | (7,786 | ) | | $ | (27,379 | ) | | $ | (46,302 | ) |
| Balance at September 30, 2017 | $ | (18,999 | ) | | $ | 9,735 |
| | $ | (15,865 | ) | | $ | (25,129 | ) |
|
| | | | | | | | | | | | | | | |
| | Foreign Currency Translation Adjustment | | Unrealized Holding Gains on Marketable Securities | | Unrealized Gains (Losses) on Foreign Currency Forward Contracts, Net of Tax | | Total |
| | (in thousands) |
| Balance at December 31, 2015 | $ | (2,080 | ) | | $ | 126 |
| | $ | 3,778 |
| | $ | 1,824 |
|
| Other comprehensive (loss) income before reclassifications | (7,709 | ) | | 104 |
| | 6,715 |
| | (890 | ) |
| Amounts reclassified from accumulated other comprehensive income (loss) | — |
| | — |
| | (4,779 | ) | | (4,779 | ) |
| Net current period other comprehensive (loss) income | $ | (7,709 | ) | | $ | 104 |
| | $ | 1,936 |
| | $ | (5,669 | ) |
| Balance at September 30, 2016 | $ | (9,789 | ) | | $ | 230 |
| | $ | 5,714 |
| | $ | (3,845 | ) |
The Company maintainsWe maintain a hedging program intended to mitigate the effect of changes in foreign exchange rates for a portion of the Company’sour forecasted product revenues denominated in certain foreign currencies. The program includes foreign currency forward contracts that are designated as cash flow hedges under U.S. GAAP having contractual durations from one to eighteen months. We recognize realized gains and losses for the effective portion of such contracts in “Product revenues, net” in our condensed consolidated statements of operations in the same period that we recognize the product revenues that were impacted by the hedged foreign exchange rate changes.
The CompanyWe formally documentsdocument the relationship between foreign currency forward contracts (hedging instruments) and forecasted product revenues (hedged items), as well as the Company’sour risk management objective and strategy for undertaking various hedging activities, which includes matching all foreign currency forward contracts that are designated as cash flow hedges to forecasted transactions. The CompanyWe also formally assesses,assess, both at the hedge’s inception and on an ongoing basis, whether the foreign currency forward contracts are highly effective in offsetting changes in cash flows of hedged items on a prospective and retrospective basis. If the Company determineswe were to determine that a (i) foreign currency forward contract is not highly effective as a cash flow hedge, (ii) foreign currency forward contract has ceased to be a highly effective hedge or (iii) forecasted transaction is no longer probable of occurring, the Companywe would discontinue hedge accounting treatment prospectively. The Company measuresWe measure effectiveness based on the change in fair value of the forward contracts and the fair value of the hypothetical foreign currency forward contracts with terms that match the critical terms of the risk being hedged. As of September 30, 2017,2022, all hedges were determined to be highly effectiveeffective.
We consider the impact of our counterparties’ credit risk on the fair value of the foreign currency forward contracts. As of September 30, 2022 and December 31, 2021, credit risk did not change the Company had not recorded any ineffectiveness relatedfair value of our foreign currency forward contracts.
VERTEX PHARMACEUTICALS INCORPORATED
Notes to the hedging program.Condensed Consolidated Financial Statements (unaudited)
The following table summarizes the notional amount in U.S. dollars of the Company’sour outstanding foreign currency forward contracts designated as cash flow hedges under U.S. GAAP:
| | | | | | | | | | | |
| As of September 30, 2022 | | As of December 31, 2021 |
| Foreign Currency | (in millions) |
| Euro | $ | 1,081.9 | | | $ | 1,364.5 | |
| Canadian dollar | 192.3 | | | 89.9 | |
| British pound sterling | 183.5 | | | 287.7 | |
| Australian dollar | 150.8 | | | 96.3 | |
| Swiss Franc | 59.2 | | | 54.1 | |
| Total foreign currency forward contracts | $ | 1,667.7 | | | $ | 1,892.5 | |
Foreign currency forward contracts - Not designated as hedging instruments
22
TableWe also enter into foreign currency forward contracts with contractual maturities of Contentsless than one month, which are designed to mitigate the effect of changes in foreign exchange rates on monetary assets and liabilities, including intercompany balances. These contracts are not designated as hedging instruments under U.S. GAAP. We recognize realized gains and losses for such contracts in “Other income (expense), net” in our condensed consolidated statements of operations each period. As of September 30, 2022, the notional amount of our outstanding foreign currency forward contracts where hedge accounting under U.S. GAAP is not applied was $641.6 million.VERTEX PHARMACEUTICALS INCORPORATEDDuring the three and nine months ended September 30, 2022 and 2021, we recognized the following related to foreign currency forward contracts in our condensed consolidated statements of operations:
Notes to Condensed Consolidated Financial Statements
(unaudited)
|
| | | | | | | |
| | As of September 30, 2017 | | As of December 31, 2016 |
| Foreign Currency | (in thousands) |
| Euro | $ | 234,477 |
| | $ | 164,368 |
|
| British pound sterling | 77,387 |
| | 65,237 |
|
| Australian dollar | 31,283 |
| | 23,776 |
|
| Total foreign currency forward contracts | $ | 343,147 |
| | $ | 253,381 |
|
| | | | | | | | | | | | | | | | | | | | | | | |
| Three Months Ended September 30, | | Nine Months Ended September 30, |
| 2022 | | 2021 | | 2022 | | 2021 |
| (in millions) |
| Designated as hedging instruments - Reclassified from AOCI | | | | | | |
| Product revenues, net | $ | 65.2 | | | $ | (5.2) | | | $ | 130.3 | | | $ | (39.3) | |
| Not designated as hedging instruments | | | | | | | |
| Other income (expense), net | $ | (22.1) | | | $ | (0.4) | | | $ | (38.9) | | | $ | (9.4) | |
| | | | | | | |
| Total reported in the Condensed Consolidated Statement of Operations | | | | | | |
| Product revenues, net | $ | 2,334.3 | | | $ | 1,984.1 | | | $ | 6,628.0 | | | $ | 5,500.8 | |
| Other income (expense), net | $ | 17.2 | | | $ | 42.4 | | | $ | (133.7) | | | $ | (2.2) | |
The following table summarizes the fair value of the Company’sour outstanding foreign currency forward contracts designated as cash flow hedges under U.S. GAAP included on the Company’sour condensed consolidated balance sheets:
| | | | | | | | | | | | | | | | | | | | |
| As of September 30, 2022 |
| Assets | | Liabilities |
| Classification | | Fair Value | | Classification | | Fair Value |
| (in millions) |
| Prepaid expenses and other current assets | | $ | 191.6 | | | Other current liabilities | | $ | (0.0) | |
| Other assets | | 9.1 | | | Other long-term liabilities | | (0.0) | |
| Total assets | | $ | 200.7 | | | Total liabilities | | $ | (0.0) | |
VERTEX PHARMACEUTICALS INCORPORATED
Notes to Condensed Consolidated Financial Statements (unaudited)
|
| | | | | | | | | | |
| As of September 30, 2017 |
| Assets | | Liabilities |
| Classification | | Fair Value | | Classification | | Fair Value |
| (in thousands) |
| Prepaid and other current assets | | $ | 42 |
| | Other liabilities, current portion | | $ | (13,897 | ) |
| Other assets | | 8 |
| | Other liabilities, excluding current portion | | (977 | ) |
| Total assets | | $ | 50 |
| | Total liabilities | | $ | (14,874 | ) |
| | | As of December 31, 2016 | |
| As of December 31, 2021 | | As of December 31, 2021 |
| Assets | Assets | | Liabilities | Assets | | Liabilities |
| Classification | | Fair Value | | Classification | | Fair Value | Classification | | Fair Value | | Classification | | Fair Value |
| (in thousands) | |
| Prepaid and other current assets | | $ | 14,407 |
| | Other liabilities, current portion | | $ | (144 | ) | |
| (in millions) | | (in millions) |
| Prepaid expenses and other current assets | | Prepaid expenses and other current assets | | $ | 44.5 | | | Other current liabilities | | $ | (5.6) | |
| Other assets | | 1,186 |
| | Other liabilities, excluding current portion | | — |
| Other assets | | 2.0 | | | Other long-term liabilities | | (2.7) | |
| Total assets | | $ | 15,593 |
| | Total liabilities | | $ | (144 | ) | Total assets | | $ | 46.5 | | | Total liabilities | | $ | (8.3) | |
As of September 30, 2017,2022, we expect the Company expects amounts that are related to foreign exchange forward contracts designated as cash flow hedges under U.S. GAAP recorded in prepaid“Prepaid expenses and other currents assetscurrent assets” and other liabilities,“Other current portionliabilities” to be reclassedreclassified to earnings within twelve months.
We present the fair value of our foreign currency forward contracts on a gross basis within our condensed consolidated balance sheets. The following table summarizes the potential effect of offsetting derivatives by type of financial instrument designated as cash flow hedges under U.S. GAAP on the Company’sour condensed consolidated balance sheets:
| | | | | | | | | | | | | | | | | | | | | | | | | | | | | |
| As of September 30, 2022 |
| Gross Amounts Recognized | | Gross Amounts Offset | | Gross Amounts Presented | | Gross Amounts Not Offset | | Legal Offset |
| Foreign currency forward contracts | (in millions) |
| Total assets | $ | 200.7 | | | $ | — | | | $ | 200.7 | | | $ | (0.0) | | | $ | 200.7 | |
| Total liabilities | (0.0) | | | — | | | (0.0) | | | 0.0 | | | — | |
| | | | | | | | | | | | | | | | | | | | | | | | | | | | | |
| As of December 31, 2021 |
| Gross Amounts Recognized | | Gross Amounts Offset | | Gross Amounts Presented | | Gross Amounts Not Offset | | Legal Offset |
| Foreign currency forward contracts | (in millions) |
| Total assets | $ | 46.5 | | | $ | — | | | $ | 46.5 | | | $ | (8.3) | | | $ | 38.2 | |
| Total liabilities | (8.3) | | | — | | | (8.3) | | | 8.3 | | | — | |
| | | | | | | | | |
J.Inventories
Inventories consisted of the following:
| | | | | | | | | | | |
| As of September 30, 2022 | | As of December 31, 2021 |
| (in millions) |
| Raw materials | $ | 32.2 | | | $ | 42.4 | |
| Work-in-process | 229.3 | | | 224.0 | |
| Finished goods | 126.7 | | | 86.7 | |
| Total | $ | 388.2 | | | $ | 353.1 | |
|
| | | | | | | | | | | | | | | | | | | |
| | As of September 30, 2017 |
| | Gross Amounts Recognized | | Gross Amounts Offset | | Gross Amounts Presented | | Gross Amounts Not Offset | | Legal Offset |
| Foreign currency forward contracts | (in thousands) |
| Total assets | $ | 50 |
| | $ | — |
| | $ | 50 |
| | $ | (50 | ) | | $ | — |
|
| Total liabilities | $ | (14,874 | ) | | $ | — |
| | $ | (14,874 | ) | | $ | 50 |
| | $ | (14,824 | ) |
|
| | | | | | | | | | | | | | | | | | | |
| | As of December 31, 2016 |
| | Gross Amounts Recognized | | Gross Amounts Offset | | Gross Amounts Presented | | Gross Amounts Not Offset | | Legal Offset |
| Foreign currency forward contracts | (in thousands) |
| Total assets | $ | 15,593 |
| | $ | — |
| | $ | 15,593 |
| | $ | (144 | ) | | $ | 15,449 |
|
| Total liabilities | $ | (144 | ) | | $ | — |
| | $ | (144 | ) | | $ | 144 |
| | $ | — |
|
VERTEX PHARMACEUTICALS INCORPORATED
Notes to Condensed Consolidated Financial Statements
(unaudited)
K.Stock-based Compensation Expense and Share Repurchase Programs
The Company also enters into foreign exchange forward contracts with contractual maturities of less than one month designed to mitigate the effect of changes in foreign exchange rates on monetary assets and liabilities including intercompany balances. The Company recognized losses of $4.1 million and $13.0 million, recorded in other income (expense), net, forStock-based compensation expense
During the three and nine months ended September 30, 2017, respectively, related2022 and 2021, we recognized the following stock-based compensation expense:
| | | | | | | | | | | | | | | | | | | | | | | |
| Three Months Ended September 30, | | Nine Months Ended September 30, |
| 2022 | | 2021 | | 2022 | | 2021 |
| (in millions) |
| Stock-based compensation expense by type of award: | | | | | | | |
| Restricted stock units (including PSUs) | $ | 130.3 | | | $ | 89.5 | | | $ | 351.5 | | | $ | 279.1 | |
| Stock options | 3.1 | | | 7.9 | | | 14.9 | | | 29.6 | |
| ESPP share issuances | 1.9 | | | 6.3 | | | 13.0 | | | 17.9 | |
| Stock-based compensation expense related to inventories | 0.3 | | | (0.7) | | | 0.4 | | | (3.8) | |
| Total stock-based compensation expense included in “Total costs and expenses” | $ | 135.6 | | | $ | 103.0 | | | $ | 379.8 | | | $ | 322.8 | |
| | | | | | | |
| Stock-based compensation expense by line item: | | | | | | | |
| Cost of sales | $ | 2.4 | | | $ | 1.6 | | | $ | 7.0 | | | $ | 4.6 | |
| Research and development expenses | 80.0 | | | 61.0 | | | 229.9 | | | 196.4 | |
| Selling, general and administrative expenses | 53.2 | | | 40.4 | | | 142.9 | | | 121.8 | |
| Total stock-based compensation expense included in costs and expenses | 135.6 | | | 103.0 | | | 379.8 | | | 322.8 | |
| Income tax effect | (38.8) | | | (21.6) | | | (101.3) | | | (73.7) | |
| Total stock-based compensation expense, net of tax | $ | 96.8 | | | $ | 81.4 | | | $ | 278.5 | | | $ | 249.1 | |
Share repurchase programs
In November 2020, our Board of Directors approved a share repurchase program (the “2020 Share Repurchase Program”), pursuant to foreign exchange contracts, which are not designated as hedging instruments under GAAP. The Company recognized a losswe repurchased $500.0 million of $1.2 millionour common stock in 2020 and a gainthe first quarter of $0.5 million, for2021. During the three andmonths ended March 31, 2021, we repurchased 2.0 million shares of our common stock under the 2020 Share Repurchase Program for an aggregate of $424.9 million.
In June 2021, our Board of Directors approved a share repurchase program (the “2021 Share Repurchase Program”), pursuant to which we are authorized to repurchase up to $1.5 billion of our common stock by December 31, 2022. During the nine months ended September 30, 2016, respectively, related to foreign exchange contracts2022, we did not designated as hedging instruments.
repurchase any shares of our common stock under the 2021 Share Repurchase Program. As of September 30, 2017,2022, a total of $499.7 million remained authorized for repurchases of common stock under the notional amount of foreign exchange contracts where hedge accounting under GAAP is not applied was $113.8 million. The following table summarizes the fair value of the Company’s outstanding foreign currency forward contracts not designated for hedge accounting included on the Company’s condensed consolidated balance sheets:2021 Share Repurchase Program.
|
| | | | | | | |
| | As of September 30, 2017 | | As of December 31, 2016 |
| | (in thousands) |
| Prepaid expenses and other current assets | $ | 1,709 |
| | $ | 660 |
|
I. Inventories
Inventories consisted of the following:
|
| | | | | | | |
| | As of September 30, 2017 | | As of December 31, 2016 |
| | (in thousands) |
| Raw materials | $ | 12,678 |
| | $ | 6,348 |
|
| Work-in-process | 67,826 |
| | 56,672 |
|
| Finished goods | 17,688 |
| | 14,584 |
|
| Total | $ | 98,192 |
| | $ | 77,604 |
|
Based on its evaluation of, among other factors, information regarding tezacaftor's safety and efficacy, the Company has capitalized $9.6 million of inventory costs for tezacaftor manufactured in preparation for its potential product launch as of September 30, 2017. In periods prior, the Company expensed costs associated with tezacaftor’s raw materials and work-in-process as a development expense. The Company submitted a New Drug Application to the United States Food and Drug Administration and a Marketing Authorization Application to the European Medicines Agency for tezacaftor in combination with ivacaftor. The Company plans to continue to monitor the status of the tezacaftor regulatory process and the other factors used to determine whether or not to capitalize the tezacaftor inventory and, if there are significant negative developments regarding tezacaftor, the Company could be required to impair previously capitalized costs.
J. Intangible Assets and Goodwill
Intangible Assets
As of September 30, 2017 and December 31, 2016, in-process research and development intangible assets of $29.0 million and $284.3 million, respectively, were recorded on the Company’s condensed consolidated balance sheet. In 2015, the Company recorded an in-process research development intangible asset of $255.3 million related to Parion’s pulmonary ENaC platform, including the intellectual property related to VX-371 and VX-551, that are licensed by Parion to the Company. In 2014, the Company recorded an in-process research development intangible asset of $29.0 million related to VX-210 that is licensed by BioAxone to the Company.
In connection with its preparation of its financial statements for the three and nine months ended September 30, 2017, the Company determined that there were indicators that the value of the pulmonary ENaC platform intangible asset had become impaired. The Company determined that the fair value of the intangible asset had decreased significantly based on data received in September 2017 from a Phase 2 clinical trial of VX-371 that did not meet its primary efficacy endpoint. Based on this data, the Company evaluated the fair value of Parion’s pulmonary ENaC platform using the discounted cash
VERTEX PHARMACEUTICALS INCORPORATED
Notes to Condensed Consolidated Financial Statements
(unaudited)
L.Income Taxes
flow approach from the perspective of a market participantWe are subject to U.S. federal, state, and determined that the fair value of the intangible asset was zero as of September 30, 2017. The discounted cash flow model pertaining to the impairment of the pulmonary ENaC platform includes (i) assumptions regarding the probability of obtaining marketing approval for the drug candidate, (ii) estimates regarding the timing of and the expected costs to develop and commercialize the drug candidate, (iii) estimates of future cash flows from potential product sales with respect to the drug candidate and (iv) appropriate discount and tax rates. The Company recorded a $255.3 million impairment charge and a benefit fromforeign income taxes of $97.7 million intaxes. During the three and nine months ended September 30, 2017 attributable2022 and 2021, we recorded the following provisions for (benefits from) income taxes and effective tax rates as compared to noncontrolling interest.our income before provision for income taxes:
Goodwill | | | | | | | | | | | | | | | | | | | | | | | |
| Three Months Ended September 30, | | Nine Months Ended September 30, |
| 2022 | | 2021 | | 2022 | | 2021 |
| (in millions, except percentages) |
| Income before provision for income taxes | $ | 1,176.4 | | | $ | 1,082.8 | | | $ | 3,155.6 | | | $ | 1,859.5 | |
| Provision for income taxes | 245.9 | | | 230.9 | | | 652.5 | | | 287.5 | |
| | | | | | | | | | | | | | | | | | | | | | | |
| Effective tax rate | 21 | % | | 21 | % | | 21 | % | | 15 | % |
Our effective tax rate for the three and nine months ended September 30, 2022, and the three months ended September 30, 2021, was similar to the U.S. statutory rate.
Our effective tax rate for the nine months ended September 30, 2021 was different than the U.S. statutory rate primarily due to a $99.7 million discrete tax benefit associated with an increase in the U.K.’s corporate tax rate from 19% to 25%, which was enacted in June 2021 and will become effective in April 2023.
We have reviewed the tax positions taken, or to be taken, in our tax returns for all tax years currently open to examination by a taxing authority. As of September 30, 20172022 and December 31, 2016, goodwill2021, we had $144.9 million and $129.5 million, respectively, of $50.4 million was recorded onnet unrecognized tax benefits, which would affect our tax rate if recognized.
Starting in 2022, our cash paid for income taxes is substantially increasing due to the Company’s condensed consolidated balance sheet.
K. Long-term Obligations
Fan Pier Leaseselimination of the option in the U.S. to deduct research and development expenses in the period they are incurred and instead, as required by the Tax Cuts and Jobs Act of 2017, amortize them over a five year period if they are performed in the U.S. and fifteen years if they are performed in foreign jurisdictions.
In 2011,August 2022, the Company enteredInflation Reduction Act of 2022 (“IRA”) was enacted into two lease agreements, pursuantlaw. The IRA includes a 15% corporate alternative minimum tax and a 1% excise tax on share repurchases. We do not expect the IRA to whichhave a significant impact on our consolidated financial statements.
We file U.S. federal income tax returns and income tax returns in various state, local and foreign jurisdictions. We have various income tax audits ongoing at any time throughout the Company leases approximately 1.1 million square feetworld. Except for jurisdictions where we have net operating losses or tax credit carryforwards, we are no longer subject to any tax assessment from tax authorities for years prior to 2018 in jurisdictions that have a material impact on our consolidated financial statements.
M.Commitments and Contingencies
2022 Credit Facility
In July 2022, Vertex and certain of office and laboratory space in two buildings (the “Fan Pier Buildings”) at Fan Pier in Boston, Massachusetts (the “Fan Pier Leases”). The Company commenced lease payments in December 2013, and will make lease payments pursuant to the Fan Pier Leases through December 2028. The Company has an option to extend the term of the Fan Pier Leases for an additional ten years.
Because the Company was involved in the construction project, the Company was deemed for accounting purposes to be the owner of the Fan Pier Buildings during the construction period and recorded project construction costs incurred by the landlord. Upon completion of the Fan Pier Buildings, the Company evaluated the Fan Pier Leases and determined that the Fan Pier Leases did not meet the criteria for “sale-leaseback” treatment. Accordingly, the Company began depreciating the asset and incurring interest expense related to the financing obligation in 2013. The Company bifurcates its lease payments pursuant to the Fan Pier Leases into (i) a portion that is allocated to the Buildings and (ii) a portion that is allocated to the land on which the Fan Pier Buildings were constructed. The portion of the lease obligations allocated to the land is treated as an operating lease that commenced in 2011.
Property and equipment, net, included $479.0 million and $489.0 million as of September 30, 2017 and December 31, 2016, respectively, related to construction costs for the Fan Pier Buildings. The carrying value of the Company’s lease agreement liability for the Fan Pier Buildings was $472.2 million and $472.6 million as of September 30, 2017 and December 31, 2016, respectively.
San Diego Lease
On December 2, 2015, the Companysubsidiaries entered into a lease agreement for 3215 Merryfield Row, San Diego, California with ARE-SD Region No. 23, LLC (the “San Diego Building”). Pursuant to this agreement, the Company agreed to lease approximately 170,000 square feet of office and laboratory space in a building to be built in San Diego, California. The lease will commence upon completion of the building, scheduled for the first half of 2018, and will extend for 16 years from the commencement date. Pursuant to the lease agreement, during the initial 16-year term, the Company will pay an average of approximately $10.2$500.0 million per year in aggregate rent, exclusive of operating expenses. The Company has the option to extend the lease term for up to two additional five-year terms.
Because the Company is involved in the construction project, the Company is deemed for accounting purposes to be the owner of the San Diego Building during the construction period and recorded project construction costs incurred by the landlord. The Company bifurcates its lease payments pursuant to the San Diego Lease into (i) a portion that is allocated to the San Diego Building and (ii) a portion that is allocated to the land on which the San Diego Building was constructed. Although the Company will not begin making lease payments pursuant to the San Diego Lease until the commencement date, the portion of the lease obligation allocated to the land is treated for accounting purposes as an operating lease that commenced in the fourth quarter of 2016. Upon completion of the San Diego Building, the Company will evaluate the San
VERTEX PHARMACEUTICALS INCORPORATED
Notes to Condensed Consolidated Financial Statements
(unaudited)
Diego Lease and determine if the San Diego Lease meets the criteria for “sale-leaseback” treatment. If the San Diego Lease meets the “sale-leaseback” criteria, the Company will remove the asset and the related liability from its consolidated balance sheet and treat the San Diego Lease as either an operating or a capital lease based on the Company’s assessment of the accounting guidance. The Company expects that upon completion of construction of the San Diego Building the San Diego Lease will not meet the “sale-leaseback” criteria. If the San Diego Lease does not meet “sale-leaseback” criteria, the Company will treat the San Diego Lease as a financing obligation and will depreciate the asset over its estimated useful life.
Property and equipment, net, included $73.9 million and $15.0 million as of September 30, 2017 and December 31, 2016, respectively, related to construction costs for the San Diego Building. The carrying value of the Company’s lease agreement liability for the San Diego Building was $71.8 million and $12.6 million as of September 30, 2017 and December 31, 2016, respectively.
Revolving Credit Facility
In October 2016, the Company entered into a Credit Agreementunsecured revolving facility (the “Credit Agreement”) with Bank of America, N.A., as administrative agent and the lenders referred to therein.therein (the “Lenders”), which matures on July 1, 2027. The Credit Agreement provides for a $500.0 million revolving facility, $300.0 million of which was not drawn upon at closing (the “Loans”) and was repaid in February 2017. Thewe have not drawn upon it to date. Amounts drawn pursuant to the Credit Agreement, also provides that, subjectif any, will be used for general corporate purposes. Subject to satisfaction of certain conditions, the Companywe may request that the borrowing capacity underfor the Credit Agreement be increased by an additional $300.0$500.0 million. TheAdditionally, the Credit Agreement matures on October 13, 2021.provides a sublimit of $100.0 million for letters of credit.
The proceeds of the borrowingAny amounts borrowed under the Credit Agreement were used primarily to repay the Company’s then outstanding indebtedness under the Macquarie Loan (as defined below). The Loans will bear interest, at the Company’sour option, at either a base rate or a EurodollarSOFR rate, in each case plus an applicable margin. Under the Credit Agreement, the applicable margins on base rate loans range from 0.75%0.000% to 1.50%0.500% and the applicable margins on EurodollarSOFR loans range from 1.75%1.000% to 2.50%1.500%, in each case based on the Company’sour consolidated leverage ratio (the ratio of the Company’sour total consolidated debtfunded indebtedness to our consolidated EBITDA for the most recently completed four fiscal quarter period).
VERTEX PHARMACEUTICALS INCORPORATED
Notes to Condensed Consolidated Financial Statements (unaudited)
Any amounts borrowed pursuant to the Company’s trailing twelve-month EBITDA).
The LoansCredit Agreement are guaranteed by certain of the Company’sour existing and future domestic subsidiaries and secured by substantially all of the Company’s assets and the assets of the Company’s domestic subsidiaries (excluding intellectual property, owned and leased real property and certain other excluded property) and by the equity interests of the Company’s subsidiaries, subject to certain exceptions. Under the terms of the
The Credit Agreement the Company mustcontains customary representations and warranties and affirmative and negative covenants, including a financial covenant to maintain subject to certain limited exceptions, a consolidated leverage ratio of 3.003.50 to 1.00, and consolidated EBITDAsubject to an increase to 4.00 to 1.00 following a material acquisition. As of at least $200.0 million,September 30, 2022, we were in each case to be measured on a quarterly basis.
The Credit Agreement contains customary representations and warranties and usual and customary affirmative and negative covenants.compliance with the covenants described above. The Credit Agreement also contains customary events of default. In the case of a continuing event of default, the administrative agent would be entitled to exercise various remedies, including the acceleration of amounts due under outstanding loans.
Term LoanDirect costs related to the Credit Agreement are recorded over its term and were not material to our financial statements.
Prior Credit Facilities
In July 2014,2022, in conjunction with entering our new credit agreement, we terminated the Company$500.0 million credit agreement we entered into in 2019. In September 2022, a $2.0 billion credit agreement with the lenders party thereto, and Macquarie US Trading LLC (“Macquarie”), as administrative agent. The credit agreement provided for a $300.0 million senior secured term loan (the “Macquarie Loan”). On October 13, 2016, the Company terminated and repaid all outstanding obligations under the Macquarie Loan.
The Macquarie Loan initially bore interest at a rate of 7.2% per annum, which was reduced to 6.2% per annum based on the FDA’s approval of ORKAMBI. The Term Loan bore interest at a rate of LIBOR plus 5.0% per annum during the third year of the term.
The Company incurred $5.3 millionwe entered into in fees paid to Macquarie that were recorded as a discount on the Macquarie Loan and were recorded as interest expense using the effective interest method over the term of the loan2020 expired in the Company’s condensed consolidated statements of operations.
L. Stock-based Compensation Expense
VERTEX PHARMACEUTICALS INCORPORATED
Notes to Condensed Consolidated Financial Statements
(unaudited)
During the three and nine months ended September 30, 2017 and 2016, the Company recognized the following stock-based compensation expense:
|
| | | | | | | | | | | | | | | |
| | Three Months Ended September 30, | | Nine Months Ended September 30, |
| | 2017 | | 2016 | | 2017 | | 2016 |
| | (in thousands) |
| Stock-based compensation expense by type of award: | | | | | | | |
| Stock options | $ | 25,969 |
| | $ | 28,773 |
| | $ | 80,865 |
| | $ | 86,859 |
|
| Restricted stock and restricted stock units | 46,737 |
| | 30,966 |
| | 131,388 |
| | 88,107 |
|
| ESPP share issuances | 2,428 |
| | 2,425 |
| | 6,738 |
| | 6,385 |
|
| Less stock-based compensation expense capitalized to inventories | (1,364 | ) | | (955 | ) | | (3,657 | ) | | (2,728 | ) |
| Total stock-based compensation included in costs and expenses | $ | 73,770 |
| | $ | 61,209 |
| | $ | 215,334 |
| | $ | 178,623 |
|
| | | | | | | |
|
|
| Stock-based compensation expense by line item: | | | | | | | |
| Research and development expenses | $ | 46,186 |
| | $ | 39,980 |
| | $ | 134,855 |
| | $ | 115,068 |
|
| Sales, general and administrative expenses | 27,584 |
| | 21,229 |
| | 80,479 |
| | 63,555 |
|
| Total stock-based compensation included in costs and expenses | $ | 73,770 |
| | $ | 61,209 |
| | $ | 215,334 |
| | $ | 178,623 |
|
The following table sets forth the Company’s unrecognized stock-based compensation expense by type of award and the weighted-average period over which that expense is expected to be recognized:
|
| | | | | |
| | As of September 30, 2017 |
| | Unrecognized Expense | | Weighted-average
Recognition Period |
| | (in thousands) | | (in years) |
| Type of award: | | | |
| Stock options | $ | 175,298 |
| | 2.60 |
| Restricted stock and restricted stock units | $ | 289,008 |
| | 2.64 |
| ESPP share issuances | $ | 2,636 |
| | 0.46 |
VERTEX PHARMACEUTICALS INCORPORATED
Notes to Condensed Consolidated Financial Statements
(unaudited)
The following table summarizes information about stock options outstanding and exercisable at September 30, 2017:
|
| | | | | | | | | | | | | | | | |
| | | Options Outstanding | | Options Exercisable |
| Range of Exercise Prices | | Number
Outstanding | | Weighted-average
Remaining
Contractual Life | | Weighted-average
Exercise Price | | Number
Exercisable | | Weighted-average
Exercise Price |
| | | (in thousands) | | (in years) | | (per share) | | (in thousands) | | (per share) |
| $18.93–$20.00 | | 128 |
| | 0.35 | | $ | 18.93 |
| | 128 |
| | $ | 18.93 |
|
| $20.01–$40.00 | | 834 |
| | 2.21 | | $ | 34.51 |
| | 834 |
| | $ | 34.51 |
|
| $40.01–$60.00 | | 877 |
| | 4.83 | | $ | 49.17 |
| | 877 |
| | $ | 49.17 |
|
| $60.01–$80.00 | | 821 |
| | 6.46 | | $ | 75.62 |
| | 649 |
| | $ | 75.44 |
|
| $80.01–$100.00 | | 4,587 |
| | 8.33 | | $ | 89.37 |
| | 1,397 |
| | $ | 89.47 |
|
| $100.01–$120.00 | | 1,137 |
| | 7.36 | | $ | 109.34 |
| | 586 |
| | $ | 109.24 |
|
| $120.01–$140.00 | | 1,260 |
| | 7.88 | | $ | 130.24 |
| | 688 |
| | $ | 129.86 |
|
| $140.01–$160.00 | | — |
| | 0.00 | | $ | — |
| | — |
| | $ | — |
|
| $160.01–$163.74 | | 634 |
| | 9.80 | | $ | 162.94 |
| | 3 |
| | $ | 162.94 |
|
| Total | | 10,278 |
| | 7.22 | | $ | 91.28 |
| | 5,162 |
| | $ | 77.92 |
|
M. Other Arrangements
Sale of HIV Protease Inhibitor Royalty Stream
In 2008, the Company sold to a third party its rights to receive royalty payments from GlaxoSmithKline plc, net of royalty amounts to be earned by and due to a third party, for a one-time cash payment of $160.0 million. These royalty payments relate to net sales of HIV protease inhibitors, which had been developed pursuant to a collaboration agreement between the Company and GlaxoSmithKline plc. As of September 30, 2017, the Company had $8.0 million in deferred revenues related to the one-time cash payment, which it is recognizing over the life of the collaboration agreement with GlaxoSmithKline plc based on the units-of-revenue method. In addition, the Company continues to recognize royalty revenues equal to the amount of the third-party subroyalty and an offsetting royalty expense for the third-party subroyalty payment.
N. Income Taxes
The Company is subject to United States federal, state, and foreign income taxes. For the three and nine months ended September 30, 2017, the Company recorded a benefit from income taxes of $125.9 million and $117.6 million, respectively, which included a benefit of $120.2 million and $111.7 million, respectively, related to the Company’s VIEs’ income tax provision. The VIEs’ benefit from income taxes during the the three and nine months ended September 30, 2017 related primarily to the impairment of Parion’s pulmonary ENaC platform and decrease in the fair value of the contingent payments payable by the Company to Parion. The Company has no liability for taxes payable by the Company’s VIEs and the income tax provision and related liability have been allocated to noncontrolling interest. For the three and nine months ended September 30, 2016, the Company recorded a provision for income taxes of $0.5 million and $24.1 million, respectively, which included a benefit of $0.5 million and a provision of $20.1 million, respectively, related to the Company’s VIEs’ income tax provision.
As of September 30, 2017 and December 31, 2016, the Company did not have unrecognized tax benefits. The Company recognizes interest and penalties related to income taxes as a component of income tax expense. As of September 30, 2017, no interest and penalties have been accrued. The Company does not expect that its unrecognized tax benefits will materially increase within the next twelve months. The Company did not recognize any material interest or penalties related to uncertain tax positions as of September 30, 2017 and December 31, 2016.
The Company continues to maintain a valuation allowance on the majority of its net operating losses and other deferred tax assets because it has a history of cumulative losses. Accordingly, the Company has not reported any tax benefit relating
VERTEX PHARMACEUTICALS INCORPORATED
Notes to Condensed Consolidated Financial Statements
(unaudited)
to the remaining net operating loss carryforwards (NOLs) and income tax credit carryforwards that will be utilized in future periods in these jurisdictions. The Company’s U.S. federal net operating loss carryforwards totaled approximately $4.1 billion as of December 31, 2016. On a quarterly basis, the Company reassesses the valuation allowance on its deferred income tax assets weighing positive and negative evidence to assess the recoverability of the deferred tax assets. Based on the Company’s recent financial performance and its future projections, it could record a reversal of all, or a portion of the valuation allowance associated with U.S. deferred tax assets in future periods. However, any such change is subject to actual performance and other considerations that may present positive or negative evidence at the time of the assessment. The Company’s total deferred tax asset balance subject to the valuation allowance was approximately $1.7 billion at December 31, 2016.
As described in Note A, “Basis of Presentation and Accounting Policies”, the Company adopted amended guidance, during the nine month period ended September 30, 2017. The amended guidance eliminates the requirement that excess tax benefits be realized as a reduction in current taxes payable before the associated tax benefit can be recognized as an increase in additional paid-in capital and requires excess tax benefits and tax deficiencies to be recorded in the condensed consolidated statement of operations when the awards vest or are settled. Amendments related to accounting for excess tax benefits have been adopted prospectively, resulting in a tax benefit of $31.4 million and $62.2 million for the three and nine months ended September 30, 2017, respectively. In connection with the adoption of this new standard, the Company recorded a cumulative-effect adjustment of $410.8 million as of January 1, 2017 to accumulated deficit and deferred tax assets, with an equal offsetting adjustment to the Company’s valuation allowance. In addition, the Company has recorded $9.4 million related to the impact from adoption of the provisions related to forfeiture rates to accumulated deficit. This change also increased the Company’s deferred tax assets by $3.4 million that is offset by an increase to the valuation allowance in the same amount.
The Company files United States federal income tax returns and income tax returns in various state, local and foreign jurisdictions. The Company is no longer subject to any tax assessment from an income tax examination in the United States or any other major taxing jurisdiction for years before 2011, except where the Company has net operating losses or tax credit carryforwards that originate before 2011. The Company currently is under examination by the Canada Revenue Agency for the years ending December 31, 2011 through December 31, 2013. No adjustments have been reported.
At September 30, 2017, foreign earnings, which were not significant, have been retained indefinitely by foreign subsidiary companies for reinvestment; therefore, no provision has been made for income taxes that would be payable upon the distribution of such earnings, and it would not be practicable to determine the amount of the related unrecognized deferred income tax liability. Upon repatriation of those earnings, in the form of dividends or otherwise, the Company would be subject to United States federal income taxes (subject to an adjustment for foreign tax credits) and withholding taxes payable to the various foreign countries.
O. Restructuring Liabilities
Research and Development Restructuring
In February 2017, the Company decided to consolidate its research activities into its Boston, Milton Park and San Diego locations and closed its research site in Canada affecting approximately 70 positions. The Company has incurred aggregate restructuring charges of approximately $12.3 million in the nine months ended September 30, 2017. As of September 30, 2017, the restructuring liability primarily relates to laboratory and office space for the research site in Canada that terminates in October 2018. The Company does not anticipate any significant additional charges related to this restructuring event in the future.
VERTEX PHARMACEUTICALS INCORPORATED
Notes to Condensed Consolidated Financial Statements
(unaudited)
The restructuring charge and other activities recorded during the the three and nine months ended September 30, 2017 and the related liability balance as of September 30, 2017 were as follows:
|
| | | | | | | |
| | Three Months Ended September 30, | | Nine Months Ended September 30, |
| | 2017 | | 2017 |
| | (in thousands) |
| Liability, beginning of the period | $ | 3,507 |
| | $ | — |
|
| Restructuring (credits) expense | (125 | ) | | 12,315 |
|
| Cash payments | (750 | ) | | (7,869 | ) |
| Asset impairments and other non-cash items | — |
| | (1,814 | ) |
| Liability, end of the period | $ | 2,632 |
| | $ | 2,632 |
|
2003 Kendall Restructuring
In 2003, the Company adopted a plan to restructure its operations to coincideaccordance with its increasing internal emphasis on advancing drug candidates through clinical development to commercialization. The restructuring liability relates to specialized laboratory and office space that is leased to the Company pursuant to a 15-year lease that terminates in April 2018. The Company has not used more than 50% of this space since it adopted the plan to restructure its operations in 2003. This unused laboratory and office space currently is subleased to third parties.
The activities related to the restructuring liability for the three and nine months ended September 30, 2017 and 2016 were as follows:
|
| | | | | | | | | | | | | | | |
| | Three Months Ended September 30, | | Nine Months Ended September 30, |
| | 2017 | | 2016 | | 2017 | | 2016 |
| | (in thousands) |
| Liability, beginning of the period | $ | 1,990 |
| | $ | 6,388 |
| | $ | 4,328 |
| | $ | 7,944 |
|
| Restructuring expense | 227 |
| | 30 |
| | 1,054 |
| | 222 |
|
| Cash payments | (4,003 | ) | | (5,340 | ) | | (12,962 | ) | | (13,104 | ) |
| Cash received from subleases | 2,732 |
| | 2,866 |
| | 8,526 |
| | 8,882 |
|
| Liability, end of the period | $ | 946 |
| | $ | 3,944 |
| | $ | 946 |
| | $ | 3,944 |
|
Fan Pier Move Restructuring
In connection with the relocation of its Massachusetts operations to Fan Pier in Boston, Massachusetts, which commenced in 2013, the Company is incurring restructuring charges related to its remaining lease obligations at its facilities in Cambridge, Massachusetts. The majority of these restructuring charges were recorded in the third quarter of 2014 upon decommissioning three facilities in Cambridge. During 2015, the Company terminated two of these lease agreements resulting in a credit to restructuring expense equal to the difference between the Company’s estimated future cash flows related to its lease obligations for these facilities and the termination payment paid to the Company’s landlord on the effective date of the termination. The third major facility included in this restructuring activity is 120,000 square feet of the Kendall Square Facility that the Company continued to use for its operations following its 2003 Kendall Restructuring. The rentable square footage in this portion of the Kendall Square Facility was subleased to a third party in February 2015. The Company will continue to incur charges through April 2018 related to the difference between the Company’s estimated future cash flows related to this portion of the Kendall Square Facility, which include an estimate for sublease income to be received from the Company’s sublessee and its actual cash flows. The Company discounted the estimated cash flows related to this restructuring activity at a discount rate of 9%.
The activities related to the restructuring liability for the three and nine months ended September 30, 2017 and 2016 were as follows:
VERTEX PHARMACEUTICALS INCORPORATED
Notes to Condensed Consolidated Financial Statements
(unaudited)
|
| | | | | | | | | | | | | | | |
| | Three Months Ended September 30, | | Nine Months Ended September 30, |
| | 2017 | | 2016 | | 2017 | | 2016 |
| | (in thousands) |
| Liability, beginning of the period | $ | 1,521 |
| | $ | 4,863 |
| | $ | 3,626 |
| | $ | 5,964 |
|
| Restructuring expense | 235 |
| | 90 |
| | 490 |
| | 472 |
|
| Cash payments | (3,262 | ) | | (4,199 | ) | | (10,578 | ) | | (10,451 | ) |
| Cash received from subleases | 2,279 |
| | 2,539 |
| | 7,235 |
| | 7,308 |
|
| Liability, end of the period | $ | 773 |
| | $ | 3,293 |
| | $ | 773 |
| | $ | 3,293 |
|
Other Restructuring Activities
The Company has engaged in several other restructuring activities that are unrelated to its Research and Development Restructuring, 2003 Kendall Restructuring and Fan Pier Move Restructuring. The most significant activity commenced in October 2013 when the Company adopted a restructuring plan that included (i) a workforce reduction primarily related to the commercial support of INCIVEK following the continued and rapid decline in the number of patients being treated with INCIVEK as new medicines for the treatment of HCV infection neared approval and (ii) the write-off of certain assets. This action resulted from the Company’s decision to focus its investment on future opportunities in CF and other research and development programs.
The remaining restructuring activities were completed in 2016. As such, there was no outstanding liability as of September 30, 2017. The activities related to the Company’s other restructuring liabilities for the three and nine months ended September 30, 2016 were as follows:
|
| | | | | | | |
| | Three Months Ended September 30, | | Nine Months Ended September 30, |
| | 2016 | | 2016 |
| | (in thousands) |
| Liability, beginning of the period | $ | 1,233 |
| | $ | 1,450 |
|
| Restructuring expense | (112 | ) | | 344 |
|
| Cash payments | (1,121 | ) | | (1,794 | ) |
| Liability, end of the period | $ | — |
| | $ | — |
|
P. Commitments and Contingenciesterms.
Guaranties and Indemnifications
As permitted under Massachusetts law, the Company’sour Articles of Organization and By-laws provide that the Companywe will indemnify certain of itsour officers and directors for certain claims asserted against them in connection with their service as an officer or director. The maximum potential amount of future payments that the Companywe could be required to make under these indemnification provisions is unlimited. However, the Company haswe have purchased directors’ and officers’ liability insurance policies that could reduce itsour monetary exposure and enable itus to recover a portion of any future amounts paid. No indemnification claims currently are outstanding, and the Company believeswe believe the estimated fair value of these indemnification arrangements is minimal.
The CompanyWe customarily agreesagree in the ordinary course of itsour business to indemnification provisions in agreements with clinical trial investigators and sites in its drugour product development programs, sponsored research agreements with academic and not-for-profit institutions, various comparable agreements involving parties performing services for the Companyus, and itsour real estate leases. The CompanyWe also customarily agreesagree to certain indemnification provisions in itsour drug discovery, development and commercialization collaboration agreements. With respect to the Company’sour clinical trials and sponsored research agreements, these indemnification provisions typically apply to any claim asserted against the investigator or the investigator’s institution relating to personal injury or property damage, violations of law or certain breaches of the Company’sour contractual obligations arising out of the research or clinical testing of the Company’sour compounds or drugproduct candidates. With respect to lease agreements, the indemnification provisions typically apply to claims asserted against the landlord relating to personal injury or property damage caused by the Company,us, to violations of law by the Companyus or to certain breaches of the Company’sour contractual obligations. The indemnification provisions appearing in the Company’sour collaboration agreements are similar to those for the other agreements discussed above, but in addition provide some limited indemnification for itsour collaborator in the event of third-party claims alleging infringement of intellectual property rights. In each of the cases above, the indemnification obligation generally survives the termination of the agreement for some extended period, although the Company believeswe believe the obligation typically has the most relevance during the contract term and for a short period of time thereafter. The maximum potential amount of future payments that the Companywe could be required to make under these provisions is generally unlimited. The Company hasWe have purchased insurance policies covering personal injury, property damage and general liability that reduce itsour exposure for indemnification and would enable itus in many cases to recover all or a portion of any future amounts paid. The Company hasWe have never paid any material amounts to defend lawsuits or settle claims related to these indemnification provisions. Accordingly, the Company believeswe believe the estimated fair value of these indemnification arrangements is minimal.
Other Contingencies
The Company hasWe have certain contingent liabilities that arise in the ordinary course of itsour business activities. The Company accruesWe accrue a reserve for contingent liabilities when it is probable that future expenditures will be made, and such expenditures can be reasonably estimated. ThereOther than our contingent consideration liabilities discussed in Note F, “Fair Value Measurements,” there were no material contingent liabilities accrued as of September 30, 20172022 or December 31, 2016.2021.
VERTEX PHARMACEUTICALS INCORPORATED
Notes to Condensed Consolidated Financial Statements (unaudited)
N.Additional Cash Flow Information
The cash, cash equivalents and restricted cash at the beginning and ending of each period presented in our condensed consolidated statements of cash flows consisted of the following:
| | | | | | | | | | | | | | | | | | | | | | | |
| Nine Months Ended September 30, |
| 2022 | | 2021 |
| Beginning of period | | End of period | | Beginning of period | | End of period |
| (in millions) |
| Cash and cash equivalents | $ | 6,795.0 | | | $ | 9,171.5 | | | $ | 5,988.2 | | | $ | 6,275.7 | |
| Prepaid expenses and other current assets | 5.1 | | | 5.5 | | | 0.7 | | | 4.5 | |
| | | | | | | |
| Cash, cash equivalents and restricted cash per condensed consolidated statement of cash flows | $ | 6,800.1 | | | $ | 9,177.0 | | | $ | 5,988.9 | | | $ | 6,280.2 | |
Item 2. Management’s Discussion and Analysis of Financial Condition and Results of Operations
OVERVIEW
We areinvest in the business of discovering, developing, manufacturing and commercializing medicines for serious diseases. We use precision medicine approaches with the goal of creatingscientific innovation to create transformative medicines for patients inpeople with serious diseases with a focus on specialty markets. Our business is focused on developing and commercializing therapies for the treatment ofWe have four approved medicines to treat cystic fibrosis, or CF, a life-threatening genetic disease, and advancingare focused on increasing the number of people with CF eligible and able to receive our medicines through label expansions, approval of new medicines, and expanded reimbursement. We are broadening our pipeline into additional disease areas through internal research efforts and accessing external innovation through business development programs in other indications. transactions.
Our two marketed products are ORKAMBI (lumacaftor in combination with ivacaftor) and KALYDECO (ivacaftor) and we are currently seeking approval for tezacaftor in combination with ivacaftor, which is a two-drugtriple combination regimen, for patients with CF. We currently are evaluating multiple triple combination regimens that include next-generation CFTR corrector compoundsTRIKAFTA/KAFTRIO (elexacaftor/tezacaftor/ivacaftor and ivacaftor), was approved in patients with CF in Phase 2 clinical trials and plan to initiate pivotal development of one or two triple-combination regimens2019 in the first half of 2018.
Cystic Fibrosis
ORKAMBIUnited States, or U.S., and KALYDECOin 2020 in the European Union, or E.U. Collectively, our four medicines are collectively approved to treat approximately 40%being used by the majority of the 75,000approximately 83,000 people with CF patients in North America, Europe, and Australia. ORKAMBI is approved as a treatmentWe are evaluating our medicines in additional patient populations, including younger children, with the goal of having small molecule treatments for approximately 25,000 patients90% of people with CF. We also are pursuing genetic therapies for the remaining people with CF who may not be helped by our current CF medicines.
Beyond CF, we continue to research and develop product candidates for the treatment of serious diseases, including sickle cell disease, beta thalassemia, pain, APOL1-mediated kidney disease, type 1 diabetes, alpha-1 antitrypsin deficiency, Duchenne muscular dystrophy, and myotonic dystrophy type 1.
Financial Highlights
| | | | | |
| Revenues | In the third quarter of 2022, our net product revenues continued to increase as compared to the third quarter of 2021 primarily due to the strong uptake of TRIKAFTA/KAFTRIO in multiple countries internationally and continued steady performance of TRIKAFTA in the U.S. |
| Expenses | Our total research and development, or R&D, acquired in-process research and development, or AIPR&D, and selling, general and administrative, or SG&A, expenses increased to $920.8 million in the third quarter of 2022 as compared to $691.9 million in the third quarter of 2021. The increase was primarily due to the progression of several product candidates into mid- to late-stage clinical development. Cost of sales was 12% of our net product revenues in each of the third quarter of 2022 and 2021, respectively. |
| Cash | Our cash, cash equivalent and marketable securities increased to $9.8 billion as of September 30, 2022 as compared to $7.5 billion as of December 31, 2021 primarily due to our net product revenues and operating cash flows partially offset by income tax payments and our acquisition of ViaCyte, Inc., or ViaCyte. |
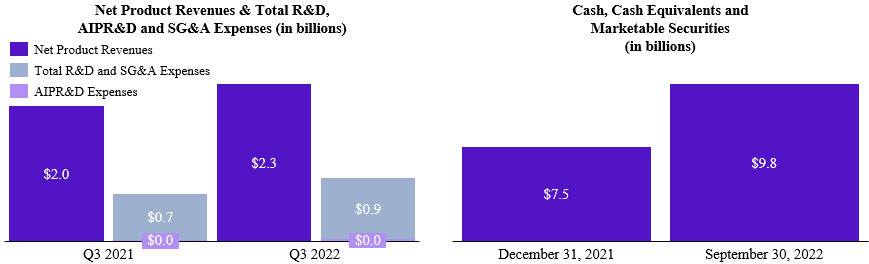
Business Updates
Marketed Products
We expect to continue to grow our CF business by increasing the number of people with CF eligible and able to receive our medicines and providing improved treatment options for people who are already eligible for one of our medicines. Recent and anticipated progress in activities supporting these efforts is included below.
•We have two copiesreceived approval from the U.S. Food and Drug Administration, or the FDA, for ORKAMBI in children with CF 12 to less than 24 months of age who are homozygous for the F508del mutation or F508del homozygous, in theirthe cystic fibrosis transmembrane conductance regulator, or CFTR,, gene.
•We have received reimbursement of KAFTRIO in Italy for children with CF 6 to 11 years of age with at least one F508del mutation in the CFTR gene.
•We expect to present results from the Phase 3 clinical trial for TRIKAFTA/KAFTRIO in children with CF 2 to 5 years of age at the North American Cystic Fibrosis Conference in November 2022. We anticipate global regulatory submissions for TRIKAFTA/KAFTRIO in children with CF 2 to 5 years of age before the end of 2022.
•We anticipate global regulatory submissions for KALYDECO in children with CF from 1 month to less than 4 months of age before the end of 2022.
•TRIKAFTA/KAFTRIO is now approved and reimbursed or accessible in more than 30 countries.
Pipeline
We continue to advance a pipeline of potentially transformative small molecule and cell and genetic therapies aimed at treating serious diseases. Recent and anticipated progress in activities supporting these efforts is included below.
Cystic Fibrosis
•We are conducting two Phase 3 global, randomized, double-blind, active-controlled clinical trials evaluating our new once-daily investigational triple combination of vanzacaftor/tezacaftor/deutivacaftor, formerly known as VX-121/tezacaftor/VX-561, in people with CF 12 years of age and older. Enrollment in both clinical trials is expected to be completed by the end of 2022. We also have initiated a clinical trial of vanzacaftor/tezacaftor/deutivacaftor in children with CF 6 to 11 years of age.
•In collaboration with Moderna, we are developing a CFTR mRNA therapeutic for the treatment of approximately 6,000people with CF who do not produce any CFTR protein. We have completed IND-enabling studies and expect to submit an Investigational New Drug Application, or IND, for this program in the fourth quarter of 2022.
Beta Thalassemia and Sickle Cell Disease
•We are evaluating the use of a non-viral ex vivo CRISPR gene-editing therapy, exagamglogene autotemcel, or exa-cel, formerly known as CTX001, for the treatment of sickle cell disease, or SCD, and transfusion-dependent beta thalassemia, or TDT. We have concluded our discussions with the FDA, and the FDA granted exa-cel a rolling review. We plan to submit a biologics licensing application, or BLA, beginning in November 2022. We expect to complete the submission by the end of the first quarter of 2023. In the U.S., exa-cel has been granted Fast Track, Regenerative Medicine Advanced Therapy, Rare Pediatric Disease, and Orphan Drug designations.
•We anticipate submissions to the European Medicines Agency, or EMA, and the United Kingdom’s Medicines and Healthcare products Regulatory Agency, or MHRA, for regulatory approval of exa-cel for TDT and SCD in Europe and the U.K. in the fourth quarter of 2022. Exa-cel has been granted EMA Priority Medicines, or PRIME, designation in Europe and Orphan Drug designation in Europe and the U.K.
•Two additional Phase 3 clinical trials evaluating exa-cel in pediatric patients whowith TDT and SCD are ongoing.
Pain
•We have discovered multiple selective small molecule inhibitors of NaV1.8 with the objective of creating a new class of pain medicines that have the G551D mutationpotential to provide effective pain relief. In March, we announced positive Phase 2 data for VX-548, a NaV1.8 inhibitor, for the non-opioid treatment of acute pain. We have reached agreement with the FDA on the Phase 3 pivotal program design for VX-548 for moderate to severe acute pain. We have initiated this Phase 3 program and we expect to enroll two randomized, controlled trials with 2,000 patients with moderate to severe acute pain following bunionectomy and abdominoplasty surgery. We plan to evaluate the safety and effectiveness of VX-548 in multiple other types of moderate to severe acute pain in an additional clinical trial.
•The FDA granted VX-548 Fast Track and Breakthrough Therapy designations for the treatment of moderate to severe acute pain.
•We expect to initiate a Phase 2 clinical trial evaluating VX-548 in neuropathic pain by the end of 2022.
APOL1-Mediated Kidney Disease
•Inaxaplin, formerly known as VX-147, is our small molecule for the treatment of APOL1-mediated kidney disease, or other specifiedAMKD, including APOL1-mediated focal segmental glomerulosclerosis, or FSGS. Based on positive Phase 2 data in FSGS, we initiated pivotal development of inaxaplin in a single Phase 2/3 clinical trial in patients with AMKD with two APOL1 mutations and proteinuric kidney disease. We continue to enroll patients in this Phase 2/3 clinical trial.
•The FDA grantedinaxaplin Breakthrough Therapy designation for APOL1-mediated FSGS and the EMA granted inaxaplin Orphan Drug and PRIME designations for AMKD.
Type 1 Diabetes
•VX-880 is a stem cell-derived, fully differentiated, insulin-producing islet cell replacement therapy used in combination with immunosuppression to protect the implanted cells. VX-880 is being evaluated in a Phase 1/2 clinical trial as a potential treatment for type 1 diabetes, or T1D, and proof-of-concept has been achieved in the VX-880 program. Enrollment is ongoing in this Phase 1/2 clinical trial.
•We continue to advance additional programs in T1D, in which these same stem cell-derived, fully differentiated, insulin-producing islet cells are encapsulated and implanted in an immunoprotective device or modified to produce hypoimmune stem cells islets with the goal of eliminating the need for immunosuppression. We are conducting IND-enabling studies for the cells and device program, and we expect to submit an IND for this program in the fourth quarter of 2022.
Alpha-1 Antitrypsin Deficiency
•We are working to address the underlying genetic cause of alpha-1 antitrypsin, or AAT, deficiency by developing novel small molecule correctors of Z-AAT protein folding, with the goal of enabling the secretion of functional AAT into the blood and addressing both the lung and the liver aspects of AAT deficiency. We have initiated a clinical trial for VX-634, which is the first in a series of next-wave investigational molecules with significantly improved potency and drug-like properties as compared to our previous AAT correctors.
•We plan to initiate a Phase 2 clinical trial of VX-864, a first-generation AAT corrector, to assess the impact of longer-term treatment on the liver, as well as the levels of functional AAT in the plasma.
Duchenne Muscular Dystrophy
•We are investigating a novel approach to treating Duchenne muscular dystrophy, or DMD, which delivers CRISPR/Cas9 gene-editing technology to muscle cells, with the goal of restoring near-full length dystrophin protein expression by targeting specific mutations in their CFTR gene. the dystrophin gene that cause the disease. We are conducting IND-enabling studies for our first in vivo gene-editing therapy for DMD and we expect to submit an IND for this program in 2023.
Investment in External Innovation
•In the third quarter of 2022, we acquired ViaCyte, a regenerative medicine company focused on delivering novel stem cell-derived cell replacement therapies as a potential functional cure for T1D.
Our goal isBusiness Environment
Our net product revenues come from the sale of our medicines for the treatment of CF. Our CF strategy involves continuing to develop and obtain approval and reimbursement for treatment regimens that will provide benefits to as many patientsall people with CF as possible and will enhanceincreasing the benefits that currently are being provided to patients taking our medicines.
If tezacaftor in combinationnumber of people with ivacaftor is approved, we expect that it would provide an additional treatment option primarily to CF patients who are currently eligible for either ORKAMBI or KALYDECO. If we areand able to successfully developreceive our medicines, including through label expansions, expanded reimbursement, and the development of new medicines. We are actively pursuing a triple combination regimen that includes a next-generation CFTR corrector compound, including VX-440, VX-152, VX-659 or VX-445, we believe such regimen could potentially provide benefitpipeline of product candidates for the treatment of serious diseases outside of CF. Our strategy is to all CF patients who have at least one F508del mutation in their CFTR gene (approximately 90% of all CF patients). This would include (i) the first treatment option that treats the underlying cause of CF for patients who have one copy of the F508del mutation in their CFTR gene and a second mutation in their CFTR gene that results in minimal CFTR function, or F508del/Min patients, and (ii) an additional treatment option to CF patients who are eligible for either ORKAMBI, KALYDECO or, if approved, tezacaftor in combination with ivacaftor.
ORKAMBI
In October 2017, we obtained results from a 2-part open-label Phase 3 clinical trial of ORKAMBI in 60 patients with CF two to five years of age who have two copies of the F508del mutation in their CFTR gene. The clinical trial met its primary endpoint of safety, showing ORKAMBI was generally well tolerated and that there were no new safety concerns compared to prior clinical trials of ORKAMBI in patients six through eleven years of age. Secondary endpoints showed decreasescombine transformative advances in the sweat chloride and improvements in nutritional status as measured by change in weight (weight-for-age z score) and body mass index (BMI-for-age z score). Based on these results, we expect to submit a New Drug Application, or NDA, to the U.S. Food and Drug Administration, or FDA, and a Marketing Authorization Application, or MAA, line extension to the European Medicines Agency, or EMA, in the first quarterunderstanding of 2018.
KALYDECO
We are evaluating KALYDECO in a Phase 3 clinical trial in patients with CF two years of age and younger with one of 10 gating and R117H mutations. The clinical trial will evaluate the safety of KALYDECO in this age group. We have completed enrollment in patients aged 12 to 24 months.
Tezacaftor in combination with ivacaftor
In the first quarter of 2017, we obtained positive results from two Phase 3 clinical trials of tezacaftor, a corrector compound, in combination with ivacaftor. The clinical trials demonstrated that the tezacaftor/ivacaftor combination provided statistically significant improvements in lung function (percent predicted forced expiratory volume in one second, or ppFEV1) in patients with CF 12 years of age and older who have certain mutations in their CFTR gene. The 24-week EVOLVE clinical trial evaluated tezacaftor in combination with ivacaftor in F508del homozygous patients with CF. This clinical trial met its primary endpoint with a mean absolute improvement in ppFEV1 through 24 weeks of 4.0 percentage points from baseline compared to placebo (p < 0.0001). The second clinical trial, EXPAND, was an 8-week crossover clinical trial that evaluated the combination treatment in patients with CF who have one mutation that results in residual CFTR function and one F508del mutation. This clinical trial met the primary endpoints of absolute change in ppFEV1 from baseline to the average of the Week
4 and Week 8 measurements, with the tezacaftor/ivacaftor combination treatment demonstrating a mean absolute improvement of 6.8 percentage points compared to placebo (p < 0.0001)human disease biology and the ivacaftor monotherapy group demonstrating a mean absolute improvementscience of 4.7 percentage points comparedtherapeutics in order to placebo (p < 0.0001). Across both clinical trials, the tezacaftor/ivacaftor combination treatment was generally well tolerated.
Based on these results, we submitted a NDA to the FDAdiscover and an MAA to the EMA for tezacaftor in combination with ivacaftor in patients with CF 12 years of age and older who are F508del homozygous or who have one copy of the F508del mutation in their CFTR gene and a second mutation in their CFTR gene that results in residual CFTR function. The FDA has granted us priority review of the NDA and the target date for the FDA to complete its review of the NDA under the Prescription Drug User Fee Act, or PDUFA, is February 28, 2018. We expect the EMA to complete its review in the second half of 2018.
In October 2017, we announced top-line resultsdevelop new medicines. This approach includes advancing multiple compounds from a Phase 3, randomized, double-blind, parallel group, clinical trial evaluating the combination of tezacaftor and ivacaftor in patients with CF 12 years of age and older who were already receiving ivacaftor monotherapy with one copy of the F508delmutation and one copy of a gating mutation. The clinical trial enrolled 151 patients with CF. The clinical trial did not meet its primary endpoint of absolute change in ppFEV1 from baseline through 8 weeks. For those receiving the combination of tezacaftor and ivacaftor, ppFEV1 improved by 0.5 percentage points compared to 0.2 percentage points in those receiving placebo in addition to ivacaftor (p=0.5846). Safety data from the clinical trial showed that the combination of tezacaftor and ivacaftor was generally well tolerated and were consistent with prior Phase 3 clinical trials of the tezacaftor/ivacaftor combination. Secondary endpoints were changes in sweat chloride and change in CFQ-R. Sweat chloride decreased by 5.8 mmol/L in those who received tezacaftor in combination with ivacaftor as compared to those who received placebo in addition to ivacaftor (p=0.0216). There was no change in CFQ-R in the combination group compared to the ivacaftor monotherapy group. Based on these results, we do not plan to seek regulatory approval for tezacaftor in combination with ivacaftor for these patients, the vast majority of whom are eligible for KALYDECO monotherapy.
Next-generation CFTR corrector compounds
In July 2017, we obtained positive results from Phase 1 and Phase 2 clinical trials of three different triple combination regimens in patients with CF who have one copy of the F508del mutation in their CFTR gene and a second mutation that results in minimal CFTR function. Initial data from the Phase 2 clinical trials showed mean absolute improvements in ppFEV1 of 9.7 and 12.0 percentage points for VX-152 (200mg q12h) and VX-440 (600mg q12h), respectively, in triple combination with tezacaftor and ivacaftor. Initial data from the Phase 1 clinical trial showed mean absolute improvement in ppFEV1 of 9.6 percentage points for VX-659 in triple combination with tezacaftor and ivacaftor. We amended our ongoing Phase 2 clinical trials of VX-445 and VX-659 to include additional cohorts of patients to evaluate these next-generation CFTR corrector compounds as part of a potential once-daily combination with tezacaftor and VX-561 (formerly CTP-656), the latter of which we acquired from Concert Pharmaceuticals, Inc., or Concert, in the third quarter of 2017. We expect to report additional data on our next-generation correctoreach program, inspanning multiple modalities, into early 2018. Pending data from these clinical trials and discussions with regulatory agencies, we planevaluating patient data to initiate pivotal development of one or two triple combination regimens in the first half of 2018.
ENaC Inhibition
VX-371 is an investigational epithelial sodium channel, or ENaC, inhibitor, that we exclusively licensed from Parion Sciences, Inc., or Parion, in 2015. In October 2017, we announced the results of a Phase 2 28-day clinical trial evaluating VX-371 + hypertonic saline versus hypertonic saline alone in 142 patients with CF 12 years of age and older who are homozygous for the F508del mutation and were already receiving ORKAMBI and continued to receive ORKAMBI throughout the clinical trial. The clinical trial did not meet its primary efficacy endpoint. In patients being treated with ORKAMBI, the addition of hypertonic saline resulted in a decrease of 0.1 percentage points ppFEV1 at day 28. In patients being treated with ORKAMBI, the addition of VX-371 + hypertonic saline resulted in an increase of 0.1 percentage points ppFEV1 at day 28. Safety data from the clinical trial showed that the addition of VX-371, with or without hypertonic saline, was generally well tolerated in patients already receiving ORKAMBI, and the safety profile was consistent with that observed in prior clinical trials of VX-371 monotherapy. Based on the results of this clinical trial, we recognized an impairment charge related to Parion’s pulmonary ENaC platform in third quarter of 2017 and deconsolidated Parion as a VIE, effective September 30, 2017.
A Phase 2 clinical trial of VX-371 monotherapy in patients with primary ciliary dyskinesia (PCD) is ongoing.
Research and Development
We are engaged in a number of other research and mid- and early-stage development programs, including VX-150 for pain and VX-210 for acute spinal cord injury. We have also entered into third-party collaborations, pursuant to which we are engaged in theinform discovery and development of nucleic acid-basedadditional compounds, with the goal of bringing first-in-class and best-in-class therapies for a varietyto patients, and to provide durable clinical and commercial success.
In pursuit of diseases, including CF. We plan to continue investingnew product candidates and therapies in ourspecialty markets, we invest in research programs and fostering scientific innovation in order to identify and develop transformative medicines. Our current research programs include programs targeting cystic fibrosis, adrenoleukodystrophy, alpha-1 antritrypsin deficiency, sickle cell disease and polycystic kidney disease.development. We believe that pursuing research in diverse areas allows us to balance the risks inherent in drugproduct development and may provide drugproduct candidates that will form our pipeline in future years. To supplement our internal research programs, we acquire technologies and programs and collaborate with biopharmaceutical and technology companies, leading academic research institutions, government laboratories, foundations and other organizations, as needed, to advance research in our areas of therapeutic interest and to access technologies needed to execute on our strategy.
Discovery and development of a new pharmaceutical or biological product is a difficult and lengthy process that requires significant financial resources along with extensive technical and regulatory expertise and can take 10 to 15 years or more. Potential drug candidates are subjected to rigorous evaluations, driven in part by stringent regulatory considerations, designed to generate information concerning efficacy, side-effects, proper dosage levels and a variety of other physical and chemical characteristics that are important in determining whether a drug candidate should be approved for marketing as a pharmaceutical product.expertise. Most chemical compounds that are investigated as potential drug candidatesor biological products never progress into development, and most drug candidatesproducts that do advance into development never receive marketing approval. Because ourOur investments in drugproduct candidates are subject to considerable risks, werisks. We closely monitor the results of our discovery, research, clinical trials and nonclinical studies and frequently evaluate our drugproduct development programs in light of new data and scientific, business and commercial insights, with the objective of balancing risk and potential. This process can result in abruptrapid changes in focus and priorities as new information becomes available and as we gain additional understanding of our ongoing programs and potential new programs, as well as those of our competitors.
IfOur business also requires ensuring appropriate manufacturing and reimbursement of our products. As we advance our product candidates through clinical development toward commercialization and market and sell our approved products, we build and maintain our supply chain and quality assurance resources. We rely on a global network of third parties and our internal capabilities to manufacture and distribute our products for commercial sale and post-approval clinical trials and to manufacture and distribute our product candidates for clinical trials. In addition to establishing supply chains for each new approved product, we adapt our supply chain for existing products to include additional formulations or to increase scale of production for existing products as needed. The processes for cell and genetic therapies can be more complex than those required for small molecule drugs and require different systems, equipment, facilities and expertise. We are focused on ensuring the stability of the supply chains for our current products, as well as for our pipeline programs.
Sales of our products depend, to a large degree, on the extent to which our products are reimbursed by third-party payors, such as government health programs, commercial insurance and managed health care organizations. Reimbursement for our products, including our potential pipeline therapies, cannot be assured and may take significant periods of time to obtain. We dedicate substantial management and other resources in order to obtain and maintain appropriate levels of reimbursement for our products from third-party payors, including governmental organizations in the U.S. and ex-U.S. markets.
In the U.S., we have worked successfully with third-party payors in order to promptly obtain appropriate levels of reimbursement for our CF medicines. We plan to continue to engage in discussions with numerous commercial insurers and managed health care organizations, along with government health programs that are typically managed by authorities in the individual states, to ensure that payors recognize the significant benefits that our medicines provide and provide patients with appropriate levels of access to our medicines now and in the future. In ex-U.S. markets, we seek government reimbursement for our medicines on a country-by-country or region-by-region basis, as required. This is necessary for each new medicine, as well as for label expansions for our current medicines. We expect to continue to focus significant resources to obtain expanded reimbursement for our CF medicines and, ultimately, pipeline therapies in U.S. and ex-U.S. markets.
COVID-19
We continue to monitor the impacts of the COVID-19 global pandemic on our business, including in our clinical trials, manufacturing facilities and capabilities, and ability to access necessary resources. COVID-19 has not materially affected our supply chain or the demand for our medicines, and we believe that data fromwe will be able to continue to supply all of our approved medicines to patients globally. We adjusted our business operations in response to COVID-19 and have continued to monitor local COVID-19 trends and government guidance for each of our site locations. We are utilizing a completed registration program support approvalsite-specific approach to assess and permit employee access to our sites. Currently, our sites are open to certain employees where appropriate and permitted by local laws and guidelines.
Strategic Transactions
Acquisitions
As part of our business strategy, we seek to acquire products, product candidates and other technologies and businesses that are aligned with our corporate and research and development strategies and complement and advance our ongoing research and development efforts.
In the second quarter of 2022, we acquired Catalyst Biosciences, Inc.’s, or Catalyst’s, portfolio of protease medicines that target the complement system and related intellectual property for $60.0 million. In the third quarter of 2022, we acquired ViaCyte, a drug candidate, we submit an NDAprivately held biotechnology company with intellectual property, tools, technologies and assets with potential to the FDA requesting approvalaccelerate development of our T1D programs, for $315.0 million.
We expect to market the drug candidate in the United Statescontinue to identify and seek analogous approvals from comparable regulatory authorities in foreign jurisdictions. To obtain approval, we must, among other things, demonstrateevaluate potential acquisitions and may include larger transactions or later-stage assets.
Collaboration and In-Licensing Arrangements
We enter into arrangements with evidence gathered in nonclinical studiesthird parties, including collaboration and well-controlled clinical trials that the drug candidate is safe and effectivelicensing arrangements, for the disease it is intended to treatdevelopment, manufacture and that the manufacturing facilities, processescommercialization of products, product candidates and controls for the manufacture of the drug candidate are adequate. The FDA and foreign regulatory authorities have substantial discretion in deciding whether or not a drug candidate should be granted approval based on the benefits and risks of the drug candidate in the treatment of a particular disease, and could delay, limit or deny regulatory approval. If regulatory delays are significant or regulatory approval is limited or denied altogether, our financial results and the commercial prospects for the drug candidate involved will be harmed.
Collaboration Arrangements
We have entered into collaborations with biotechnology and pharmaceutical companies in order to acquire rights or to license drug candidates orother technologies that enhancehave the potential to complement our pipeline and/or ourongoing research capabilities.and development efforts. Over the last several years, we entered into collaboration agreements with:
with a number of companies, including Arbor Biotechnologies, Inc., CRISPR Therapeutics AG, or CRISPR, pursuant to which we are collaborating on the discoveryKymera Therapeutics, Inc., Mammoth Biosciences, Inc., Moderna, Inc., Obsidian Therapeutics, Inc., and development of potential new treatments aimed at the underlying genetic causes of human diseases using CRISPR-Cas9 gene editing technology;
Parion, pursuant to which we are developing ENaC inhibitors for the treatment of pulmonary diseases;
ModernaVerve Therapeutics, Inc., or Moderna, pursuant to which we are seeking to identify and develop mRNA therapeutics for the treatment of CF; and
BioAxone Biosciences, Inc., or BioAxone, pursuant to which we are evaluating VX-210 as a potential treatment for patients who have spinal cord injuries.
Verve. Generally, when we in-license a technology or drugproduct candidate, we make upfront payments to the collaborator, assume the costs of the program andand/or agree to make contingent payments, which could consist of milestone, royalty and option payments. DependingMost of these collaboration payments are expensed as acquired in-process research and development expenses; however, depending on many factors, including the structure of the collaboration, the significance of the drugin-licensed product candidate that we license to the collaborator’s operations and the other activities in which our collaborators are engaged, the accounting for these transactions can vary significantly. For example,We expect to continue to identify and evaluate collaboration and licensing opportunities that may be similar to or different from the collaborations and licenses that we have engaged in previously.
Acquired In-Process Research and Development
In the nine months ended September 30, 2022 and 2021, our AIPR&D included $92.9 million and $986.8 million, respectively, related to upfront, contingent milestone, or other payments and expenses incurred in connection with our CRISPR and Moderna collaborations are being expensed as research expenses because (i) the collaboration represents a small portion of the overall business of these collaborators and (ii) the licenses associated with these collaborations do not represent a business pursuant to our business development transactions, including the consolidation accounting guidance. CRISPR’scollaborations, licenses of third-party technologies, and Moderna’s activities unrelated to our collaborations have no effect on our consolidated financial statements. Parion and BioAxone have historically been accounted for as variable interest entities, or VIEs, that were included in our consolidated financial statements due to (i) the significanceasset acquisitions described above.
of the respective licensed programs to Parion and BioAxone as a whole, (ii) our power to control the significant activities under each collaboration and (iii) our obligation to absorb losses and right to receive benefits that potentially could be significant. As of September 30, 2017, we determined that the above conditions were no longer satisfied with respect to Parion following a determination that the fair value of the ENaC inhibitors licensed from Parion had declined significantly based on the results of a Phase 2 clinical trial of VX-371 that did not meet its primary efficacy endpoint. As a result, we no longer account for Parion as a VIE and have deconsolidated Parion from our consolidated financial statements as of September 30, 2017. BioAxone continues to be accounted for as a VIE and remains included in our consolidated financial statements as of September 30, 2017.
Collaborators we account for as a VIE may engage in activities unrelated to our collaboration. The revenues and expenses unrelated to the programs we in-license from our VIEs have historically been immaterial to our consolidated financial statements. With respect to each of Parion, prior to its deconsolidation as of September 30, 2017, and BioAxone, the activities unrelated to our collaboration have represented approximately 2% of our total revenues and total expenses on an annual basis. As a result of the deconsolidation of Parion, we expect these amounts to decrease in future periods. For any consolidated VIEs, we evaluate the fair value of the contingent payments payable by us on a quarterly basis. Changes in the fair value of these contingent future payments affect net income attributable to Vertex on a dollar-for-dollar basis, with increases in the fair value of contingent payments payable by us to a VIE resulting in a decrease in net income attributable to Vertex (or an increase in net loss attributable to Vertex) and decreases in the fair value of contingent payments payable by us to a VIE resulting in an increase in net income attributable to Vertex (or decrease in net loss attributable to Vertex).Out-License Agreements
We also have out-licensed internally developed programs to collaborators who are leading the development of these programs. These outlicense arrangements include our collaboration agreements with:
Merck KGaA, which is advancing four oncology research and development programs; and
Janssen Pharmaceuticals, Inc., which is developing JNJ-3872 (formerly VX-787) for the treatment of influenza.
Pursuant to these out-licensing arrangements, our collaborators are responsible for the research, development, and commercialization costs associated with these programs, and we are entitled to receive contingent milestone and/or royalty payments. As a result, we do not expect to incur significant expenses in connection with these programs and have the potential for future collaborative and/orand royalty revenues resulting from these programs.
Regulatory Compliance
Our marketing of pharmaceutical products is subject to extensive and complex laws and regulations. We have a corporate compliance program designed to actively identify, prevent and mitigate risk through the implementation of compliance policies and systems, and through the promotion of a culture of compliance. Among other laws, regulations and standards, we are subject to various U.S. federal and state laws, and comparable foreign laws pertaining to health care fraud and abuse, including anti-kickback and false claims statutes, and laws prohibiting the promotion of drugs for unapproved or off-label uses. Anti-kickback laws make it illegal for a prescription drug manufacturer to solicit, offer, receive or pay any remuneration to induce the referral of business, including the purchase or prescription of a particular drug. False claims laws prohibit anyone from presenting for payment to third-party payors, including Medicare and Medicaid, claims for reimbursed drugs or services that are false or fraudulent, claims for items or services not provided as claimed, or claims for medically unnecessary items or services. We expect to continue to devote substantial resources to maintain, administer and expand these compliance programs globally.
Reimbursement
Sales None of our products depend, to a large degree, on the extent to which our products are covered by third-party payors, such as government health programs, commercial insurance and managed health care organizations. We dedicate substantial management and other resources in order to obtain and maintain appropriate levels of reimbursement for our products from third-party payors, including governmental organizations in the United States and ex-U.S. markets. In the United States, we continue to engage in discussions with numerous commercial insurers and managed health care organizations, along with government health programs that are typically managed by authorities in the individual states. In Europe and other ex-U.S. markets, we are working to obtain government reimbursement for ORKAMBI on a country-by-country basis, because in many foreign countries patients are unable to access prescription pharmaceutical products that are not reimbursed by their governments. To date, we have reached a pricing and reimbursement agreement for ORKAMBI with several European countries, including Germany, Ireland and Italy, and remain in negotiations with several others. Consistent with our experience with KALYDECO when it was first approved, we expect reimbursement discussions in ex-U.S. markets may take a significant period of time.
out-license agreements had
a significant impact on our condensed consolidated statement of operations during the nine months ended September 30, 2022 and 2021.
Recent TransactionStrategic Investments
Concert Pharmaceuticals
In July 2017,connection with our business development activities, we acquiredhave periodically made equity investments in our collaborators. As of September 30, 2022, we held strategic equity investments in certain CF assets, including VX-561, from Concert, pursuantpublic and private companies, and we expect to an agreement that we entered into in March 2017. VX-561 is an investigational CFTR potentiator that has the potential to be used as part of future once-daily combination regimens of CFTR modulators that treat the underlying cause of CF. Pursuant to the agreement,make additional strategic equity investments in the third quarterfuture. While we invest the majority of 2017, we paid Concert $160.0 millionour cash, cash equivalents and marketable securities in instruments that meet specific credit quality standards and limit our exposure to any one issue or type of instrument, our strategic investments are maintained and managed separately from our other cash, for all worldwide developmentcash equivalents and commercialization rights to VX-561. If VX-561 is approved as partmarketable securities. As discussed below in “Other Income (Expense), Net” in our Results of a combination regimen to treat CF, Concert could receive up to an additional $90.0 million in milestones based on regulatory approvalOperations, any changes in the U.S. and reimbursementfair value of equity investments with readily determinable fair values (including publicly traded securities) are recorded to other income (expense), net in the UK, Germany or France. our condensed consolidated statement of operations.
RESULTS OF OPERATIONS
| | | | | | | | | | | | | | | | | | | | | | | | | | | | | | | | | | | |
| Three Months Ended September 30, | | | | Nine Months Ended September 30, | | |
| 2022 | | 2021 | | Change | | 2022 | | 2021 | | Change |
| (in millions, except percentages and per share amounts) |
| Revenues | $ | 2,334.3 | | | $ | 1,984.1 | | | 18% | | $ | 6,628.0 | | | $ | 5,501.8 | | | 20% |
| Operating costs and expenses | 1,207.6 | | | 929.6 | | | 30% | | 3,354.1 | | | 3,597.4 | | | (7)% |
| Income from operations | 1,126.7 | | | 1,054.5 | | | 7% | | 3,273.9 | | | 1,904.4 | | | 72% |
| Other non-operating expense, net | 49.7 | | | 28.3 | | | 76% | | (118.3) | | | (44.9) | | | 163% |
| Provision for income taxes | 245.9 | | | 230.9 | | | 6% | | 652.5 | | | 287.5 | | | 127% |
| Net income | $ | 930.5 | | | $ | 851.9 | | | 9% | | $ | 2,503.1 | | | $ | 1,572.0 | | | 59% |
| | | | | | | | | | | |
| Net income per diluted common share | $ | 3.59 | | | $ | 3.28 | | | | | $ | 9.68 | | | $ | 6.03 | | | |
| Diluted shares used in per share calculations | 259.5 | | | 259.7 | | | | | 258.7 | | | 260.9 | | | |
| | | | | | | |
Revenues
| | | | | | | | | | | | | | | | | | | | | | | | | | | | | | | | | | | |
| Three Months Ended September 30, | | | | Nine Months Ended September 30, | | |
| 2022 | | 2021 | | Change | | 2022 | | 2021 | | Change |
| (in millions, except percentages) |
| TRIKAFTA/KAFTRIO | $ | 2,010.5 | | | $ | 1,555.8 | | | 29% | | $ | 5,665.3 | | | $ | 4,004.6 | | | 41% |
| SYMDEKO/SYMKEVI | 38.2 | | | 81.4 | | | (53)% | | 145.7 | | | 340.0 | | | (57)% |
| ORKAMBI | 146.2 | | | 184.5 | | | (21)% | | 399.9 | | | 624.2 | | | (36)% |
| KALYDECO | 139.4 | | | 162.4 | | | (14)% | | 417.1 | | | 532.0 | | | (22)% |
| Product revenues, net | 2,334.3 | | | 1,984.1 | | | 18% | | 6,628.0 | | | 5,500.8 | | | 20% |
| Other revenues | — | | | — | | | ** | | — | | | 1.0 | | | ** |
| Total revenues | $ | 2,334.3 | | | $ | 1,984.1 | | | 18% | | $ | 6,628.0 | | | $ | 5,501.8 | | | 20% |
| | | | | | | ** Not meaningful |
Product Revenues, Net
In the third quarter of 2017, we recorded the $160.0 million payment as a research and development expense.
RESULTS OF OPERATIONS
|
| | | | | | | | | | | | | | | | | | | | | | | | | | | | | |
| | Three Months Ended September 30, | | Increase/(Decrease) | | Nine Months Ended September 30, | | Increase/(Decrease) |
| | 2017 | | 2016 | | $ | | % | | 2017 | | 2016 | | $ | | % |
| | (in thousands) | | | | (in thousands) | | |
| Revenues | $ | 578,165 |
| | $ | 413,783 |
| | $ | 164,382 |
| | 40 | % | | $ | 1,837,018 |
| | $ | 1,243,471 |
| | $ | 593,547 |
| | 48 | % |
| Operating costs and expenses | 904,208 |
| | 432,510 |
| | 471,698 |
| | 109 | % | | 1,839,512 |
| | 1,273,175 |
| | 566,337 |
| | 44 | % |
| Other items, net | 223,091 |
| | (20,114 | ) | | 243,205 |
| | n/a |
| | 165,294 |
| | (115,293 | ) | | 280,587 |
| | n/a |
|
| Net (loss) income attributable to Vertex | $ | (102,952 | ) | | $ | (38,841 | ) | | $ | (64,111 | ) | | n/a |
| | $ | 162,800 |
| | $ | (144,997 | ) | | $ | 307,797 |
| | n/a |
|
Net Income (Loss) Attributable to Vertex
Net loss attributable to Vertex was $(103.0) million in the third quarter of 2017 as compared to a2022, our net loss attributable to Vertex of $(38.8) million in the third quarter of 2016. Ourproduct revenues increased in the third quarter of 2017by $350.2 million, or 18% as compared to the third quarter of 20162021, primarily due to increased ORKAMBIthe strong uptake of TRIKAFTA/KAFTRIO in multiple countries internationally and KALYDECO net product revenues. Our operating costs and expensescontinued steady performance of TRIKAFTA in the third quarter of 2017 included a $255.3 million impairment charge related to Parion’s pulmonary ENaC platform and a $160.0 million payment to Concert in connection with the acquisition of VX-561, for which there were no comparable expenses in the third quarter of 2016. The increase in operating costs and expenses in the third quarter of 2017 as compared to the third quarter of 2016 also included increases in cost of product revenues, research and development expenses and sales, general and administrative expenses. Other items, net, in the third quarter of 2017 primarily reflects an income tax benefit and certain other benefits associated with the impairment of Parion’s pulmonary ENaC platform, for which there were no comparable benefits in the third quarter of 2016.
Net income attributable to Vertex was $162.8 million inU.S. In the nine months ended September 30, 2017 as compared to a2022, our net loss attributable to Vertex of $(145.0) million in the nine months ended September 30, 2016. Ourproduct revenues increased significantly in the nine months ended September 30, 2017by $1.1 billion, or 20% as compared to the nine months ended September 30, 20162021, respectively, primarily due to increased ORKAMBIthe strong uptake of TRIKAFTA/KAFTRIO in multiple countries internationally and KALYDECOin the U.S., including the June 2021 launch of TRIKAFTA for children with CF 6 through 11 years or age. Decreases in revenues for our products other than TRIKAFTA/KAFTRIO were primarily the result of patients switching from these medicines to TRIKAFTA/KAFTRIO.
Our net product revenues from the U.S. and $230.0from ex-U.S. markets were as follows:
| | | | | | | | | | | | | | | | | | | | | | | | | | | | | | | | | | | |
| Three Months Ended September 30, | | | | Nine Months Ended September 30, | | |
| 2022 | | 2021 | | Change | | 2022 | | 2021 | | Change |
| (in millions, except percentages) |
| United States | $ | 1,455.6 | | | $ | 1,382.9 | | | 5% | | $ | 4,238.9 | | | $ | 3,893.2 | | | 9% |
| ex-U.S. | 878.7 | | | 601.2 | | | 46% | | 2,389.1 | | | 1,607.6 | | | 49% |
| Product revenues, net | $ | 2,334.3 | | | $ | 1,984.1 | | | 18% | | $ | 6,628.0 | | | $ | 5,500.8 | | | 20% |
Other Revenues
We earned a collaborative milestone of $1.0 million in one-time collaborative revenues related to the strategic collaboration and license agreement we established with Merck KGaA in the first quarter of 2017. Our operating costs and expenses in the nine months ended September 30, 2017 included a $255.3 million impairment charge related to Parion’s pulmonary ENaC platform2021 and a $160.0 million payment to Concert in connection with the acquisition of VX-561, for which there were no comparable expensesdid not have any “Other revenues” in the nine months ended September 30, 2016. The increase in operating costs and expenses in the nine months ended September 30, 2017 as compared to the nine months ended September 30, 2016 also included increases in cost of product revenues, research and development expenses, sales, general and administrative expenses and restructuring expenses. Other items, net, in the nine months ended September 30, 2017 primarily reflects an income tax benefit and certain other benefits associated with the impairment of Parion’s pulmonary ENaC platform, for which there were no comparable benefits in the nine months ended September 30, 2016.
Diluted Net Income (Loss) Per Share Attributable to Vertex Common Shareholders
Diluted net loss per share attributable to Vertex common shareholders was $(0.41) in the third quarter of 2017 as compared to a diluted net loss per share attributable to Vertex common shareholders of $(0.16) in the third quarter of 2016. Diluted net income per share attributable to Vertex common shareholders was $0.64 in the nine months ended September 30, 2017 as compared to a diluted net loss per share attributable to Vertex common shareholders of $(0.59) in the nine months ended September 30, 2016.
Revenues
|
| | | | | | | | | | | | | | | | | | | | | | | | | | | | | |
| | Three Months Ended September 30, | | Increase/(Decrease) | | Nine Months Ended September 30, | | Increase/(Decrease) |
| | 2017 | | 2016 | | $ | | % | | 2017 | | 2016 | | $ | | % |
| | (in thousands) | | | | (in thousands) | | |
| Product revenues, net | $ | 549,642 |
| | $ | 409,689 |
| | $ | 139,953 |
| | 34 | % | | $ | 1,544,252 |
| | $ | 1,229,750 |
| | $ | 314,502 |
| | 26 | % |
| Royalty revenues | 2,231 |
| | 3,835 |
| | (1,604 | ) | | (42 | )% | | 6,643 |
| | 12,713 |
| | (6,070 | ) | | (48 | )% |
| Collaborative revenues | 26,292 |
| | 259 |
| | 26,033 |
| | n/a |
| | 286,123 |
| | 1,008 |
| | 285,115 |
| | n/a |
|
| Total revenues | $ | 578,165 |
| | $ | 413,783 |
| | $ | 164,382 |
| | 40 | % | | $ | 1,837,018 |
| | $ | 1,243,471 |
| | $ | 593,547 |
| | 48 | % |
Product Revenues, Net
|
| | | | | | | | | | | | | | | | | | | | | | | | | | | | | |
| | Three Months Ended September 30, | | Increase/(Decrease) | | Nine Months Ended September 30, | | Increase/(Decrease) |
| | 2017 | | 2016 | | $ | | % | | 2017 | | 2016 | | $ | | % |
| | (in thousands) | | | | (in thousands) | | |
| ORKAMBI | $ | 336,183 |
| | $ | 234,046 |
| | $ | 102,137 |
| | 44 | % | | $ | 955,451 |
| | $ | 702,670 |
| | $ | 252,781 |
| | 36 | % |
| KALYDECO | 213,461 |
| | 175,608 |
| | 37,853 |
| | 22 | % | | $ | 588,809 |
| | $ | 526,352 |
| | $ | 62,457 |
| | 12 | % |
| INCIVEK | (2 | ) | | 35 |
| | (37 | ) | | n/a |
| | (8 | ) | | 728 |
| | (736 | ) | | n/a |
|
| Total product revenues, net | $ | 549,642 |
| | $ | 409,689 |
| | $ | 139,953 |
| | 34 | % | | $ | 1,544,252 |
| | $ | 1,229,750 |
| | $ | 314,502 |
| | 26 | % |
In the third quarter and the nine months ended September 30, 2017, we recognized approximately $43.1 million and $110.9 million, respectively, in ex-U.S. ORKAMBI net product revenues, as compared to $22.8 million and $47.5 million in the third quarter and the nine months ended September 30, 2016, respectively. We believe that the level of our ORKAMBI revenues for the remainder of 2017 will be dependent upon whether, when and on what terms we are able to obtain reimbursement in additional ex-U.S. markets, the number and rate at which additional patients begin treatment with ORKAMBI, the proportion of initiated patients who remain on treatment and the compliance rates for patients who remain on treatment.
Under the current revenue recognition guidance applicable for the year ending December 31, 2017, we do not recognize any net product revenues on sales of products unless the price is fixed or determinable. Pursuant to new revenue recognition guidance that will become effective January 1, 2018 and is described in Note A, “Basis of Presentation and Accounting Policies” to our condensed consolidated financial statements, we will be required to make estimates of the amount of consideration that will be retained by us that will not be subject to a significant reversal in amounts recognized as net product revenues.2022. Our condensed consolidated balance sheet includes $190.3 million collected as of September 30, 2017 in France related to ORKAMBI supplied under early access programs at the invoiced price, which has not resulted in any net product revenues because the final price is not fixed or determinable under the current guidance.
If we conclude as of December 31, 2017, that the price of the ORKAMBI supplied under the French early access programs is fixed or determinable, we would record net product revenues for all sales since the inception of these programs based on the fixed or determinable price in the fourth quarter of 2017. If the price is not fixed and determinable as of December 31, 2017, these amounts will be subject to the new guidance. In this case, amounts for prior periods will be recognized in the first quarter of 2018 as a cumulative effect adjustment to our accumulated deficit based on an estimate of the amount of consideration that we would retain that would not be subject to a significant reversal in amounts recognized.
KALYDECO net product revenues increased in the third quarter of 2017 as compared to the third quarter of 2016 primarily due to additional patients being treated with KALYDECO as a result of label expansions. The increase in KALYDECO net product revenues in the nine months ended September 30, 2017 as compared to the nine months ended September 30, 2016 included approximately $9 million in one-time revenue credits in the first quarter of 2017 related to the finalization of reimbursement agreements in certain European countries. In the third quarter and the nine months ended September 30, 2017, we recognized approximately $80.3 million and $242.5 million, respectively, in ex-U.S. KALYDECO net product revenues, as compared to $75.1 million and $227.6 million in the third quarter and the nine months ended September 30, 2016, respectively.
We have withdrawn INCIVEK, which we previously marketed as a treatment for hepatitis C virus infection, from the market in the United States.
Royalty Revenues
Our royalty revenues were $2.2 million and $6.6 million in the third quarter and the nine months ended September 30, 2017, respectively, as compared to $3.8 million and $12.7 million in the third quarter and the nine months ended September 30, 2016, respectively. Our royalty revenues primarily consist of revenues related to a cash payment we received in 2008 when we sold our rights to certain HIV royalties.
Collaborative Revenues
Our collaborative revenues were $26.3 million and $286.1 million in the third quarter and the nine months ended September 30, 2017, respectively, as compared to $0.3 million and $1.0 million in the third quarter and the nine months ended September 30, 2016, respectively. The increase in our collaborative revenues during the third quarter of 2017 as compared to the third quarter of 2016 was primarily related to amounts received from Merck for transition activities we received pursuant to our collaboration with Merck KGaA and a $20.0 million milestone payment received by Parion in the third quarter of 2017 pursuant to a license agreement it entered into with a third party. We are not a party to such license agreement and have no economic interest in either the license or the milestone payment. Parion was deconsolidated as a VIE as of September 30, 2017 and future payments received by Parion pursuant to this license agreement will no longer be recognized by us as collaborative revenue. The increase in our collaborative revenues during the nine months ended September 30, 2017 as compared to the nine months ended September 30, 2016 was primarily due to revenue recognized related to the one-time upfront payment Merck KGaA paid in the first quarter of 2017 and $40 million in upfront and milestone payments received by Parion in 2017 pursuant to its license agreement with a third party. Our collaborative revenues“Other revenues” have historically fluctuated significantly from one period to another based on our collaborative out-license activities and may continue to fluctuate in the future.
Operating Costs and Expenses
| | | | | | | | | | | | | | | | | | | | | | | | | | | | | | | | | | | |
| Three Months Ended September 30, | | | | Nine Months Ended September 30, | | |
| 2022 | | 2021 | | Change | | 2022 | | 2021 | | Change |
| (in millions, except percentages) |
| Cost of sales | $ | 289.4 | | | $ | 236.5 | | | 22% | | $ | 797.0 | | | $ | 656.8 | | | 21% |
| Research and development expenses | 645.0 | | | 467.0 | | | 38% | | 1,846.2 | | | 1,370.0 | | | 35% |
| Acquired in-process research and development expenses | 29.0 | | | 26.7 | | | 9% | | 92.9 | | | 986.8 | | | (91)% |
| Selling, general and administrative expenses | 246.8 | | | 198.2 | | | 25% | | 677.3 | | | 584.9 | | | 16% |
| Change in fair value of contingent consideration | (2.6) | | | 1.2 | | | ** | | (59.3) | | | (1.1) | | | ** |
| Total costs and expenses | $ | 1,207.6 | | | $ | 929.6 | | | 30% | | $ | 3,354.1 | | | $ | 3,597.4 | | | (7)% |
| | | | | | | ** Not meaningful |
|
| | | | | | | | | | | | | | | | | | | | | | | | | | | | | |
| ` | Three Months Ended September 30, | | Increase/(Decrease) | | Nine Months Ended September 30, | | Increase/(Decrease) |
| | 2017 | | 2016 | | $ | | % | | 2017 | | 2016 | | $ | | % |
| | (in thousands) | | | | (in thousands) | | |
| Cost of product revenues | $ | 72,186 |
| | $ | 53,222 |
| | $ | 18,964 |
| | 36 | % | | $ | 188,963 |
| | $ | 147,165 |
| | $ | 41,798 |
| | 28 | % |
| Royalty expenses | 688 |
| | 855 |
| | (167 | ) | | (20 | )% | | 2,104 |
| | 2,813 |
| | (709 | ) | | (25 | )% |
| Research and development expenses | 454,947 |
| | 272,370 |
| | 182,577 |
| | 67 | % | | 1,017,961 |
| | 799,238 |
| | 218,723 |
| | 27 | % |
| Sales, general and administrative expenses | 120,710 |
| | 106,055 |
| | 14,655 |
| | 14 | % | | 361,285 |
| | 322,921 |
| | 38,364 |
| | 12 | % |
| Restructuring expenses, net | 337 |
| | 8 |
| | 329 |
| | n/a |
| | 13,859 |
| | 1,038 |
| | 12,821 |
| | n/a |
|
| Intangible asset impairment charge | 255,340 |
| | — |
| | 255,340 |
| | n/a |
| | 255,340 |
| | — |
| | 255,340 |
| | n/a |
|
| Total costs and expenses | $ | 904,208 |
| | $ | 432,510 |
| | $ | 471,698 |
| | 109 | % | | $ | 1,839,512 |
| | $ | 1,273,175 |
| | $ | 566,337 |
| | 44 | % |
Cost of Product RevenuesSales
Our cost of product revenues includessales primarily consists of third-party royalties payable on net sales of our products as well as the cost of producing inventories that corresponded to product revenues for the reporting period, plus the third-party royalties payable on our net sales of our products.inventories. Pursuant to our agreement with the Cystic Fibrosis Foundation Therapeutics Incorporated, or CFFT, our tiered third-party royalties on sales of TRIKAFTA/KAFTRIO, SYMDEKO/SYMKEVI, KALYDECO, and ORKAMBI, calculated as a percentage of net sales, range from the single digits to the sub-teens. As a resultsub-teens, with royalties on sales of TRIKAFTA/KAFTRIO slightly lower than for our other products. Over the tiered royalty rate,last several years, our cost of sales has been increasing due to increased net product revenuesrevenues. Our cost of sales as a percentage of CFour net product revenues is lower at the beginningwas 12% in each of each calendar year.
In the third quarter of 2017, our cost of product revenues increased as compared to the third quarter of 2016 primarily due to the increased CF net product revenues. In the fourth quarter of 2017, we expect our cost of product revenues as a percentage of total CF product revenues to be similar to the cost of product revenues as a percentage of total CF product revenues in the third quarter of 2017.
In theand nine months ended September 30, 2016, our cost of product revenues included a $13.9 million commercial milestone that was earned by CFFT related to sales of ORKAMBI. There are no further commercial milestones payable to CFFT.
Royalty Expenses
Royalty expenses primarily consist of expenses related to a subroyalty payable to a third party on net sales of an HIV protease inhibitor sold by GlaxoSmithKline. Royalty expenses do not include royalties we pay to CFFT on sales of KALYDECO2022 and ORKAMBI, which instead are included in cost of product revenues.2021.
Research and Development Expenses
| | | | Three Months Ended September 30, | | Increase/(Decrease) | | Nine Months Ended September 30, | | Increase/(Decrease) | | Three Months Ended September 30, | | Nine Months Ended September 30, | |
| | 2017 | | 2016 | | $ | | % | | 2017 | | 2016 | | $ | | % | | 2022 | | 2021 | | Change | | 2022 | | 2021 | | Change |
| | (in thousands) | | | | (in thousands) | | | | (in millions, except percentages) |
| Research expenses | $ | 76,131 |
| | $ | 99,162 |
| | $ | (23,031 | ) | | (23 | )% | | $ | 226,409 |
| | $ | 242,058 |
| | $ | (15,649 | ) | | (6 | )% | Research expenses | $ | 160.2 | | | $ | 121.9 | | | 31% | | $ | 464.9 | | | $ | 372.2 | | | 25% |
| Development expenses | 378,816 |
| | 173,208 |
| | 205,608 |
| | 119 | % | | 791,552 |
| | 557,180 |
| | 234,372 |
| | 42 | % | Development expenses | 484.8 | | | 345.1 | | | 40% | | 1,381.3 | | | 997.8 | | | 38% |
| Total research and development expenses | $ | 454,947 |
| | $ | 272,370 |
| | $ | 182,577 |
| | 67 | % | | $ | 1,017,961 |
| | $ | 799,238 |
| | $ | 218,723 |
| | 27 | % | Total research and development expenses | $ | 645.0 | | | $ | 467.0 | | | 38% | | $ | 1,846.2 | | | $ | 1,370.0 | | | 35% |
Our research and development expenses include internal and external costs incurred for research and development of our drugsproducts and drugproduct candidates. We do not assign our internal costs, such as salary and benefits, stock-based compensation expense, laboratory supplies and other direct expenses and infrastructure costs, to individual drugsproducts or drugproduct candidates, because the employees within our research and development groups typically are deployed across multiple research and development programs. These internal costs are significantly greater than ourWe assign external costs, such as the costs of services provided to us by clinical research organizations and other
outsourced research which we allocate by individual program. Our internal costs are significantly greater than our external costs. All research and development costs for our drugsproducts and drugproduct candidates are expensed as incurred.
Since January 1, 2014,2020, we have incurred $3.9approximately $6.8 billion in total research and development and AIPR&D expenses associated with drugproduct discovery and development. The successful development of our drugproduct candidates is highly uncertain and subject to a number of risks. In addition, the duration of clinical trials may vary substantially according to the type, complexity and novelty of the drugproduct candidate and the disease indication being targeted. The FDA and comparable agencies in foreign countries impose substantial requirements on the introduction of therapeutic pharmaceutical products, typically requiring lengthy and detailed laboratory and clinical testing procedures, sampling activities and other costly and time-consuming procedures. Data obtained from nonclinical and clinical activities at any step in the testing process may be adverse and lead to discontinuation or redirection of development activities. Data obtained from these activities also are susceptible to varying interpretations, which could delay, limit or prevent regulatory approval. The duration and cost of discovery, nonclinical studies and clinical trials may vary significantly over the life of a project and are difficult to predict. Therefore, accurate and meaningful estimates of the ultimate costs to bring our drugproduct candidates to market are not available.
Any estimates regarding development and regulatory timelines for our product candidates are highly subjective and subject to change. Until we have data from Phase 3 clinical trials, we cannot make a meaningful estimate regarding when, or if, a clinical development program will generate revenues and cash flows.
Research Expenses
| | | | | | | | | | | | | | | | | | | | | | | | | | | | | | | | | | | |
| Three Months Ended September 30, | | | | Nine Months Ended September 30, | | |
| 2022 | | 2021 | | Change | | 2022 | | 2021 | | Change |
| (in millions, except percentages) |
| Research Expenses: | | | | | | | | | | | |
| Salary and benefits | $ | 40.7 | | | $ | 34.6 | | | 18% | | $ | 119.0 | | | $ | 102.5 | | | 16% |
| Stock-based compensation expense | 23.3 | | | 17.4 | | | 34% | | 65.7 | | | 56.4 | | | 16% |
| Outsourced services and other direct expenses | 49.2 | | | 35.8 | | | 37% | | 132.7 | | | 114.9 | | | 15% |
| Intangible asset impairment charge | — | | | — | | | ** | | 13.0 | | | — | | | ** |
| Infrastructure costs | 47.0 | | | 34.1 | | | 38% | | 134.5 | | | 98.4 | | | 37% |
| Total research expenses | $ | 160.2 | | | $ | 121.9 | | | 31% | | $ | 464.9 | | | $ | 372.2 | | | 25% |
| | | | | | | ** Not meaningful |
Our research expenses have been increasing over the last several years as we have invested in our pipeline and expanded our cell and genetic therapy capabilities, resulting in increased headcount and infrastructure. We expect to continue to invest in our research programs with a focus on creating transformative medicines for serious diseases.
Development Expenses
| | | | | | | | | | | | | | | | | | | | | | | | | | | | | | | | | | | |
| Three Months Ended September 30, | | | | Nine Months Ended September 30, | | |
| 2022 | | 2021 | | Change | | 2022 | | 2021 | | Change |
| (in millions, except percentages) |
| Development Expenses: | | | | | | | | | | | |
| Salary and benefits | $ | 133.5 | | | $ | 88.6 | | | 51% | | $ | 344.4 | | | $ | 252.2 | | | 37% |
| Stock-based compensation expense | 56.7 | | | 43.6 | | | 30% | | 164.2 | | | 140.0 | | | 17% |
| Outsourced services and other direct expenses | 215.9 | | | 149.6 | | | 44% | | 639.2 | | | 426.4 | | | 50% |
| Infrastructure costs | 78.7 | | | 63.3 | | | 24% | | 233.5 | | | 179.2 | | | 30% |
| Total development expenses | $ | 484.8 | | | $ | 345.1 | | | 40% | | $ | 1,381.3 | | | $ | 997.8 | | | 38% |
| | | | | | | |
Our development expenses increased by $139.7 million and $383.5 million, or 40% and 38%, in the third quarter and nine months ended September 30, 2022 as compared to the third quarter and nine months ended September 30, 2021, respectively, primarily due to increased costs to support clinical trials associated with our advancing pipeline programs, including our CF triple combination of vanzacaftor/tezacaftor/deutivacaftor, exa-cel, pain and T1D. We are investing in our internal headcount, leveraging outsourced services, and investing in infrastructure to support these programs. In 2016 and the nine months ended September 30, 2017,2022 and 2021, costs related to our CF programs represented the largest portion of our development costs. Any estimates regarding development
Acquired In-process Research and regulatory timelines for our drug candidates are highly subjective and subject to change. We recently submitted an NDA and an MAA for tezacaftor in combination with ivacaftor. The target date for the FDA to complete its review of the NDA under PDUFA is February 28, 2018 and we expect the EMA to complete its review of our in MAA in the second half of 2018. We cannot make a meaningful estimate when, if ever, our other clinical development programs will generate revenues and cash flows.
ResearchDevelopment Expenses
| | | | | | | | | | | | | | | | | | | | | | | | | | | | | | | | | | | |
| Three Months Ended September 30, | | | | Nine Months Ended September 30, | | |
| 2022 | | 2021 | | Change | | 2022 | | 2021 | | Change |
| (in millions, except percentages) |
| Acquired in-process research and development expenses | $ | 29.0 | | | $ | 26.7 | | | 9% | | $ | 92.9 | | | $ | 986.8 | | | (91)% |
|
| | | | | | | | | | | | | | | | | | | | | | | | | | | | | |
| | Three Months Ended September 30, | | Increase/(Decrease) | | Nine Months Ended September 30, | | Increase/(Decrease) |
| | 2017 | | 2016 | | $ | | % | | 2017 | | 2016 | | $ | | % |
| | (in thousands) | | | | (in thousands) | | |
| Research Expenses: | | | | | | | | | | | | | | | |
| Salary and benefits | $ | 20,445 |
| | $ | 21,525 |
| | $ | (1,080 | ) | | (5 | )% | | $ | 61,486 |
| | $ | 61,503 |
| | $ | (17 | ) | | — | % |
| Stock-based compensation expense | 15,641 |
| | 14,023 |
| | 1,618 |
| | 12 | % | | 44,366 |
| | 38,088 |
| | 6,278 |
| | 16 | % |
| Laboratory supplies and other direct expenses | 10,791 |
| | 11,726 |
| | (935 | ) | | (8 | )% | | 33,980 |
| | 33,410 |
| | 570 |
| | 2 | % |
| Outsourced services | 10,230 |
| | 10,054 |
| | 176 |
| | 2 | % | | 29,644 |
| | 20,749 |
| | 8,895 |
| | 43 | % |
| Collaboration and asset acquisition payments | 425 |
| | 22,000 |
| | (21,575 | ) | | (98 | )% | | 425 |
| | 33,000 |
| | (32,575 | ) | | (99 | )% |
| Infrastructure costs | 18,599 |
| | 19,834 |
| | (1,235 | ) | | (6 | )% | | 56,508 |
| | 55,308 |
| | 1,200 |
| | 2 | % |
| Total research expenses | $ | 76,131 |
| | $ | 99,162 |
| | $ | (23,031 | ) | | (23 | )% | | $ | 226,409 |
| | $ | 242,058 |
| | $ | (15,649 | ) | | (6 | )% |
We maintain a substantial investment in research activities. Our research expenses decreased by 23%AIPR&D in the third quarter of 2017 as compared2022 was primarily related to the third quarter of 2016 and decreased by 6%a $25.0 million upfront payment pursuant to our license agreement with Verve. AIPR&D in the nine months ended September 30, 2017 as compared2022 was primarily related to the nine months ended September 30, 2016. Collaborationour payment to Verve and asset acquisition payments in the third quarter of 2016 included a $20.0$60.0 million payment to Moderna for which there was no comparable expense in the third quarter of 2017. CollaborationCatalyst to acquire their complement portfolio and asset acquisition paymentsrelated intellectual property. AIPR&D in the nine months ended September 30, 20162021 included both the Moderna$900.0 million upfront payment to CRISPR. Our AIPR&D has historically fluctuated, and $13.0 million in expenses related to the acquisition of early-stage research assets for which there were no comparable expenses in the nine months ended September 30, 2017. We expectis expected to continue to invest in our research programs with a focus on identifying drug candidates with the goal of creating transformative medicines.
Development Expenses
|
| | | | | | | | | | | | | | | | | | | | | | | | | | | | | |
| | Three Months Ended September 30, | | Increase/(Decrease) | | Nine Months Ended September 30, | | Increase/(Decrease) |
| | 2017 | | 2016 | | $ | | % | | 2017 | | 2016 | | $ | | % |
| | (in thousands) | | | | (in thousands) | | |
| Development Expenses: | | | | | | | | | | | | | | | |
| Salary and benefits | $ | 54,125 |
| | $ | 44,788 |
| | $ | 9,337 |
| | 21 | % | | $ | 156,759 |
| | $ | 134,201 |
| | $ | 22,558 |
| | 17 | % |
| Stock-based compensation expense | 30,545 |
| | 25,957 |
| | 4,588 |
| | 18 | % | | 90,489 |
| | 76,980 |
| | 13,509 |
| | 18 | % |
| Laboratory supplies and other direct expenses | 10,828 |
| | 10,784 |
| | 44 |
| | — | % | | 34,171 |
| | 32,039 |
| | 2,132 |
| | 7 | % |
| Outsourced services | 89,637 |
| | 60,838 |
| | 28,799 |
| | 47 | % | | 251,677 |
| | 216,881 |
| | 34,796 |
| | 16 | % |
| Collaboration and asset acquisition payments | 160,000 |
| | — |
| | 160,000 |
| | n/a |
| | 160,250 |
| | — |
| | 160,250 |
| | n/a |
|
| Drug supply costs | 3,151 |
| | 2,655 |
| | 496 |
| | 19 | % | | 6,143 |
| | 9,512 |
| | (3,369 | ) | | (35 | )% |
| Infrastructure costs | 30,530 |
| | 28,186 |
| | 2,344 |
| | 8 | % | | 92,063 |
| | 87,567 |
| | 4,496 |
| | 5 | % |
| Total development expenses | $ | 378,816 |
| | $ | 173,208 |
| | $ | 205,608 |
| | 119 | % | | $ | 791,552 |
| | $ | 557,180 |
| | $ | 234,372 |
| | 42 | % |
Our development expenses increased by 119% in the third quarter of 2017 as comparedfluctuate, from one period to the third quarter of 2016 and increased by 42% in the nine months ended September 30, 2017 as compared to the nine months ended September 30, 2016, primarily due the $160.0 million payment to Concert in connection with the acquisition of VX-561 in the third quarter of 2017 and to increased outsourced services expenses related to ongoing clinical trials, including trials involving our next-generation CFTR corrector compounds that we are evaluating as part of triple combination treatment regimens. In the fourth quarter of 2017, we expect our outsourced services expenses to increase as compared to the third quarter of 2017another due to expenses relatedupfront, contingent milestone, and other payments pursuant to the advancementour business development transactions, including collaborations, licenses of our triple-combination regimens.third-party technologies, and asset acquisitions.
Sales,Selling, General and Administrative Expenses
| | | | | | | | | | | | | | | | | | | | | | | | | | | | | | | | | | | |
| Three Months Ended September 30, | | | | Nine Months Ended September 30, | | |
| 2022 | | 2021 | | Change | | 2022 | | 2021 | | Change |
| (in millions, except percentages) |
| Selling, general and administrative expenses | $ | 246.8 | | | $ | 198.2 | | | 25% | | $ | 677.3 | | | $ | 584.9 | | | 16% |
|
| | | | | | | | | | | | | | | | | | | | | | | | | | | | | |
| | Three Months Ended September 30, | | Increase/(Decrease) | | Nine Months Ended September 30, | | Increase/(Decrease) |
| | 2017 | | 2016 | | $ | | % | | 2017 | | 2016 | | $ | | % |
| | (in thousands) | | | | (in thousands) | | |
| Sales, general and administrative expenses | $ | 120,710 |
| | $ | 106,055 |
| | $ | 14,655 |
| | 14 | % | | $ | 361,285 |
| | $ | 322,921 |
| | $ | 38,364 |
| | 12 | % |
Sales,Selling, general and administrative expenses increased by 14% in the third quarter of 2017 as compared to the third quarter of 2016 and increased by 12% in the nine months ended September 30, 2017 as compared to the nine months ended September 30, 2016, primarily due to increased global support for KALYDECO25% and ORKAMBI.
Restructuring Expenses, Net
We recorded restructuring expenses of $0.3 million and $13.9 million in the third quarter and the nine months ended September 30, 2017, respectively, as compared to restructuring expenses of $8.0 thousand and $1.0 million in the third quarter and the nine months ended September 30, 2016, respectively. The increases in our restructuring expenses in the nine months ended September 30, 2017 primarily relate to our decision to consolidate our research activities into our Boston, Milton Park and San Diego locations and to close our research site in Canada.
Intangible Asset Impairment Charge
In the third quarter of 2017, we recorded a $255.3 million impairment charge related to Parion’s pulmonary ENaC platform that we licensed from Parion in 2015 and a benefit from income taxes of $97.7 million related to this impairment charge attributable to Parion. There were no corresponding intangible asset impairment charges in the third quarter and the nine months ended September 30, 2016.
Other Items
Interest Expense, Net
Interest expense, net was $13.6 million and $45.0 million in the third quarter and the nine months ended September 30, 2017, respectively, as compared to $20.1 million and $61.0 million in the third quarter and the nine months ended September 30, 2016, respectively. The decrease in interest expense, net in the third quarter and the nine months ended September 30, 2017 as compared to the third quarter and the nine months ended September 30, 2016 was primarily due to the repayment of the $300.0 million outstanding under our revolving credit facility in February 2017. In the fourth quarter of 2017, we expect to incur approximately $15 million of interest expense associated with the leases for our corporate headquarters and our interest expense related to our revolving credit facility will be dependent on whether, and to what extent, we reborrow amounts under the existing facility.
Other (Expenses) Income, Net
Other (expense) income, net was an expense of $77.6 million and $80.6 million in the third quarter and the nine months ended September 30, 2017 as compared to expense of $0.2 million in the third quarter of 2016 and income of $3.0 million in the nine months ended September 30, 2016. Other (expense) income, net in the third quarter and the nine months ended September 30, 2017 was primarily related to the deconsolidation of Parion. Other (expense) income, net in the third quarter and the nine months ended September 30, 2016 was primarily due to foreign exchange gains and losses.
Income Taxes
We recorded a benefit from income taxes of $125.9 million and $117.6 million in the third quarter and the nine months ended September 30, 2017 as compared to a provision for income taxes of $0.5 million and $24.1 million in the third quarter and the nine months ended September 30, 2016. The benefit from income taxes in the third quarter and the nine months ended September 30, 2017 was primarily related to a benefit of $126.2 million attributable to noncontrolling interest as a result of our impairment of Parion’s pulmonary ENaC platform and decrease in the fair value of the contingent payments payable by us to Parion. The provision for income taxes in the third quarter and the nine months ended September 30, 2016 was primarily due to income tax on our VIEs.
We continue to maintain a valuation allowance on the majority of our net operating losses and other deferred tax assets because we have a history of cumulative losses. Accordingly, we have not reported any tax benefit relating to the remaining net operating loss carryforwards (NOLs) and income tax credit carryforwards that will be utilized in future periods in these
jurisdictions. Our U.S. federal net operating loss carryforwards totaled approximately $4.1 billion as of December 31, 2016. On a quarterly basis, we reassess the valuation allowance on our deferred income tax assets weighing positive and negative evidence to assess the recoverability of the deferred tax assets. Based on our recent financial performance and our future projections, we could record a reversal of all, or a portion of the valuation allowance associated with U.S. deferred tax assets in future periods. However, any such change is subject to actual performance and other considerations that may present positive or negative evidence at the time of the assessment. Our total deferred tax asset balance subject to the valuation allowance was approximately $1.7 billion at December 31, 2016.
Noncontrolling Interest (VIEs)
The net (income) loss attributable to noncontrolling interest (VIEs) recorded on our condensed consolidated statements of operations reflects Parion and BioAxone’s net (income) loss for the reporting period, adjusted for any changes in the noncontrolling interest holders’ claim to net assets, including contingent milestone, royalty and option payments. A summary of net income attributable to noncontrolling interest related to our VIEs for the three and nine months ended September 30, 2017 and 2016 is as follows:
|
| | | | | | | | | | | | | | | |
| | Three Months Ended September 30, | | Nine Months Ended September 30, |
| | 2017 | | 2016 | | 2017 | | 2016 |
| | (in thousands) | | | | |
| Loss attributable to noncontrolling interest before (benefit from) provision for income taxes and changes in fair value of contingent payments | $ | 238,946 |
| | $ | 2,406 |
| | $ | 222,448 |
| | $ | 6,080 |
|
| (Benefit from) provision for income taxes | (120,181 | ) | | (510 | ) | | (111,658 | ) | | 20,063 |
|
| Decrease (increase) in fair value of contingent payments | 69,550 |
| | (1,200 | ) | | 62,560 |
| | (59,350 | ) |
| Net loss (income) attributable to noncontrolling interest | $ | 188,315 |
| | $ | 696 |
| | $ | 173,350 |
| | $ | (33,207 | ) |
The net loss attributable to noncontrolling interest16% in the third quarter and nine months ended September 30, 2017 was primarily related2022 as compared to the $255.3 million impairment charge relatedthird quarter and nine months ended September 30, 2021, respectively, primarily due to Parion’s pulmonary ENaC platform, a decrease inthe continued investment to support the commercialization of our medicines and increased support for our pipeline product candidates.
Contingent Consideration
The fair value of the contingent paymentsconsideration potentially payable to former Exonics equity holders decreased by us to Parion of $69.6$2.6 million and benefit from$59.3 million in the third quarter and nine months ended September 30, 2022, respectively. The fair value of contingent consideration decreased in the nine months ended September 30, 2022 primarily as a result of a revision to the scope of certain gene-editing programs in the second quarter of 2022. The fair value of contingent consideration increased by $1.2 million and decreased by $1.1 million in the third quarter and nine months ended September 30, 2021, respectively.
Other Non-Operating Income (Expense), Net
Interest Income
Interest income taxesincreased to $46.2 million and $58.6 million in the third quarter and nine months ended September 30, 2022, respectively, as compared to $1.1 million and $3.7 million in the third quarter and nine months ended September 30, 2021, respectively. The increase in interest income was primarily due to increased market interest rates and increased cash equivalents and available-for-sale debt securities. Our future interest income is dependent on the amount of, $126.2and prevailing market interest rates on, our outstanding cash equivalents and available-for-sale debt securities.
Interest Expense
Interest expense was $13.7 million and $15.2 million in the third quarter of 2022 and 2021, respectively, and $43.2 million and $46.4 million in the nine months ended September 30, 2022 and 2021, respectively. The majority of our interest expense in these periods was related to imputed interest expense associated with our leased corporate headquarters in Boston.
Other Income (Expense), Net
Other income (expense), net was income of $17.2 million and $42.4 million in the third quarter of 2022 and 2021, respectively, and expense of $133.7 million and $2.2 million in the nine months ended September 30, 2022 and 2021, respectively. The vast majority of these charges.
amounts relate to net unrealized gains or losses resulting from changes in the fair value of our strategic investments. As of September 30, 2017,2022, the fair value of our investments in publicly traded companies was $122.8 million. To the extent that we have deconsolidated Parion.continue to hold strategic investments in publicly traded companies, we will record other income (expense) related to these strategic investments on a quarterly basis. We expect that due to the volatility of the stock price of biotechnology companies, our other income (expense), net will fluctuate in future periods based on increases or decreases in the fair value of our strategic investments.
Income Taxes
We recorded provisions for income taxes of $245.9 million and $652.5 million in the third quarter and nine months ended September 30, 2022, respectively, and $230.9 million and $287.5 million in the third quarter and nine months ended September 30, 2021. Our effective tax rate of 21% for the nine months ended September 30, 2022 was similar to the U.S. statutory rate. Our effective tax rate of 15% for the nine months ended September 30, 2021 was lower than the U.S. statutory rate primarily due to a $99.7 million discrete tax benefit associated with an increase in the U.K.’s corporate tax rate from 19% to 25%, which was enacted in June 2021 and will become effective in April 2023.
Net Income
Our net income increased to $930.5 million in the third quarter of 2022 as compared to $851.9 million in the third quarter of 2021, primarily due to increased product revenues and interest income partially offset by increased operating costs and expenses.
Our net income increased to $2.5 billion in the nine months ended September 30, 2022 as compared to $1.6 billion in the nine months ended September 30, 2021, primarily due to the $900.0 million upfront payment we made to CRISPR in the second quarter of 2021 and increased product revenues partially offset by increased operating costs and expenses. We also incurred significant unrealized losses on our strategic investments in third quarter and nine months ended September 30, 2022.
In each of the third quarter of 2022 as compared to the third quarter of 2021 and the nine months ended September 30, 2022 as compared to the nine months ended September 30, 2021, our increased operating costs and expenses consisted of increased cost of sales, development expenses to progress several product candidates into mid- to late-stage clinical development, selling, general and administrative expenses to support the commercialization of our medicines and increased support for our pipeline product candidates and income taxes.
LIQUIDITY AND CAPITAL RESOURCES
The following table summarizes the components of our financial condition as of September 30, 2022 and December 31, 2021:
| | | | | | | | | | | | | | | | | |
| As of September 30, 2022 | | As of December 31, 2021 | | Change |
| (in millions, except percentages) |
| Cash, cash equivalents and marketable securities | $ | 9,770.7 | | | $ | 7,524.9 | | | 30% |
| Working Capital: | | | | | |
| Total current assets | 12,271.0 | | | 9,560.6 | | | 28% |
| Total current liabilities | (2,609.3) | | | (2,142.0) | | | 22% |
| Total working capital | $ | 9,661.7 | | | $ | 7,418.6 | | | 30% |
Working Capital
As of September 30, 2017,2022, total working capital was $9.7 billion, which represented an increase of $2.2 billion from $7.4 billion as of December 31, 2021. The increase in total working capital in the nine months ended September 30, 2022 was primarily related to $3.1 billion of cash provided by operations.
Cash Flows
| | | | | | | | | | | |
| Nine Months Ended September 30, |
| 2022 | | 2021 |
| (in millions) |
| Net cash provided by (used in): | | | |
| Operating activities | $ | 3,051.5 | | | $ | 1,648.5 | |
| Investing activities | $ | (496.7) | | | $ | (206.9) | |
| Financing activities | $ | (107.9) | | | $ | (1,141.8) | |
Operating Activities
Cash provided by operating activities were $3.1 billion in the nine months ended September 30, 2022 as compared to $1.6 billion in the nine months ended September 30, 2021, primarily due to the $900.0 million upfront payment to CRISPR in the nine months ended September 30, 2021 and an increase to accrued expenses from increased product revenues, offset by higher income tax payments.
Investing Activities
Cash used in investing activities were $496.7 million and $206.9 million in the nine months ended September 30, 2022 and 2021, respectively. In the third quarter of 2022, our investing activities included a net payment of $295.9 million to acquire ViaCyte. Otherwise, our investing activities were primarily related to purchases of property and equipment in each of the nine months ended September 30, 2022 and 2021.
Financing Activities
Cash used in financing activities were $107.9 million and $1.1 billion in the nine months ended September 30, 2022 and 2021, respectively. In the nine months ended September 30, 2022, the largest portion of our financing activities were related to our employee stock benefit plans. In the nine months ended September 30, 2021, the largest portion of our financing activities were share repurchases pursuant to our share repurchase programs totaling $1.1 billion.
Sources and Uses of Liquidity
As of September 30, 2022, we had cash, cash equivalents and marketable securities of $1.81$9.8 billion,, which represented an increase of $378 million$2.2 billion from $1.43$7.5 billion as of December 31, 2016. In the nine months ended of September 30, 2017, our cash, cash equivalents and marketable securities balance increased due to cash receipts from product sales, cash received from issuances of common stock under our employee benefit plans and cash received from our collaboration with Merck KGaA in the first quarter of 2017, partially offset by the $300.0 million repayment of our revolving credit facility in the first quarter of 2017 and the $160.0 million payment to Concert in connection with the acquisition of VX-561 in the third quarter of 2017. We expect that our future cash flows will be substantially dependent on CF product sales.
Sources of Liquidity
2021. We intend to rely on our existing cash, cash equivalents and marketable securities together with cash flows from product sales as our primary source of liquidity. We are receiving cash flows from sales of ORKAMBI and KALYDECO from the United States and ex-U.S. markets. Future net product revenues for ORKAMBI from ex-U.S. markets will be dependent on, among other things, the timing of and ability to complete reimbursement discussions in European countries.
In February 2017, we repaid the $300.0 million we had borrowed under our $500.0 million revolving credit facility. We may repay and reborrow amounts under the revolving credit agreement without penalty. Subject to certain conditions, we may request that the borrowing capacity under this credit agreement be increased by an additional $300.0 million.
In the nine months ended September 30, 2017, we received significant proceeds from the issuance of common stock under our employee benefit plans, but the amount and timing of future proceeds from employee benefits plans is uncertain. Other possible sources of liquidity include strategic collaborative agreements that include research and/or development funding, commercial debt, public and private offerings of our equity and debt securities, development milestones and
royalties on sales of products, software and equipment leases, strategic sales of assets or businesses and financial transactions. Negative covenants in our credit agreement may prohibit or limit our ability to access these sources of liquidity.
Future Capital Requirements
We incur substantial operating expenses to conduct research and development activities and to operate our organization. Under the terms of our credit agreement entered into in October 2016, we are required to repay any outstanding principal amounts in 2021. We also have substantial facility and capital lease obligations, including leases for two buildings in Boston, Massachusetts that continue through 2028 and capital expenditures for our building under construction in San Diego, California. As of September 30, 2017, we have collected approximately $190.3 million from ORKAMBI early access programs in France for which the price is not fixed or determinable. We expect we will be required to repay a portion of the collected amounts to the French government based on the difference between the invoiced price of ORKAMBI and the final price for ORKAMBI in France.
In addition, we have entered into certain collaboration agreements with third parties that include the funding of certain research, development and commercialization efforts with the potential for future milestone and royalty payments by us upon the achievement of pre-established developmental and regulatory target and we may enter into additional business development transactions that require additional capital.
We expect that cash flows from ORKAMBI and KALYDECO,our products together with our current cash, cash equivalents and marketable securities will be sufficient to fund our operations for at least the next twelve months. The adequacy of our available funds to meet our future operating and capital requirements will depend on many factors, including the amounts of future revenues generated by ORKAMBI and KALYDECOour products, and the potential introduction of one or more of our other drugproduct candidates to the market, the level of our business development activities and the number, breadth, cost and prospects of our research and development programs.
Credit Facilities & Financing Strategy
We have amay borrow up to $500.0 million pursuant to a revolving credit facility that we entered into in October 2016. We mayJuly 2022 and could repay and reborrow amounts under thethis revolving credit agreement without penalty. In addition, subjectSubject to certain conditions, we maycould request that the borrowing capacity under this credit agreement be increased by an additional $300.0 million. $500.0 million, for a total of $1.0 billion. Negative covenants in our credit agreement could prohibit or limit our ability to access this source of liquidity. As of September 30, 2022, the facility was undrawn, and we were in compliance with these covenants.
In July 2022, in conjunction with entering our new credit agreement, we terminated the $500.0 million credit agreement we entered into in 2019. In September 2022, a $2.0 billion credit agreement we entered into in 2020 expired in accordance with its terms.
We may also raise additional capital by borrowing under credit agreements, through public offerings or private placements of our securities or securing new collaborative agreements or other methods of financing. We will continue to manage our capital structure and will consider all financing opportunities, whenever they may occur, that could strengthen our long-term liquidity profile. There can be no assurance that any such financing opportunities will be available on acceptable terms, if at all.
Future Capital Requirements CONTRACTUAL COMMITMENTS AND OBLIGATIONSWe have significant future capital requirements, including:
•Expected operating expenses to conduct research and development activities and to operate our organization.
•Facility and finance lease obligations.
•Royalties we pay to the Cystic Fibrosis Foundation on sales of our CF products.
•Cash paid for income taxes.
In addition, we have significant potential future capital requirements including:
•We have entered into certain business development-related agreements with third parties that include the funding of certain research, development, and commercialization efforts. Certain of our transactions, including collaborations, licensing arrangements, and asset acquisitions, include the potential for future milestone and royalty payments by us upon the achievement of pre-established developmental and regulatory targets and/or commercial targets. Our commitmentsobligation to fund these research and obligations were reporteddevelopment and commercialization efforts and to pay these potential milestone and royalties is contingent upon continued involvement in the programs and/or the lack of any adverse events that could cause the discontinuance of the programs associated with our collaborations, licensing arrangements and acquisitions. We may enter into additional business development transactions, including acquisitions, collaborations, licensing arrangements and equity investments, that require additional capital.
•To the extent we borrow amounts under our existing credit agreement, we would be required to repay any outstanding principal amounts in 2027.
•As of September 30, 2022, we had $0.5 billion available under our 2021 Share Repurchase Program.
There have not been any material changes to our future capital requirements disclosed in our Annual Report on Form 10-K for the year ended December 31, 2016,2021, which was filed with the Securities and Exchange Commission, or SEC, on February 23, 2017. There have been no material changes from the contractual commitments and obligations previously disclosed in that Annual Report on Form 10-K, except that:9, 2022.
In February 2017, we repaid the outstanding $300 million balance
In July 2017, we acquired certain CF assets including VX-561 from Concert pursuant to an asset purchase agreement. At closing, we paid Concert $160 million in cash for all worldwide development and commercialization rights to VX-561 and may be required to pay up to an additional $90 million in milestones based on regulatory approval in the U.S. and reimbursement in the UK, Germany or France.
CRITICAL ACCOUNTING POLICIES AND ESTIMATES
Our discussion and analysis of our financial condition and results of operations isare based upon our condensed consolidated financial statements prepared in accordance with generally accepted accounting principles in the United States.U.S. The preparation of these financial statements requires us to make certain estimates and assumptions that affect the reported amounts of assets and liabilities, the disclosure of contingent assets and liabilities at the date of the condensed consolidated financial statements and the reported amounts of revenues and expenses during the reported periods. These items are monitored and analyzed by management for changes in facts and circumstances, and material changes in these estimates could occur in the future. Changes in estimates are reflected in reported results for the period in which the change occurs. We base our estimates on historical experience and various other assumptions that we believe to be reasonable under the circumstances. Actual results may differ from our estimates if past experience or other assumptions do not turn out to be substantially accurate. During the nine months ended September 30, 2017,2022, there were no material changes to our critical accounting policies as reported in our Annual Report on Form 10-K for the year ended December 31, 2016,2021, which was filed with the SEC on February 23, 2017.9, 2022.
RECENT ACCOUNTING PRONOUNCEMENTS
For a discussion of recent accounting pronouncements, please refer to Note A, “Basis of Presentation and Accounting Policies—Recent Accounting Pronouncements.Policies.”
Item 3. Quantitative and Qualitative Disclosures About Market Risk
As partInformation required by this item is incorporated by reference from the discussion in Part II, Item 7A, “Quantitative and Qualitative Disclosures About Market Risk,” of our investment portfolio, we own financial instruments that are sensitive to market risks. The investment portfolio is used to preserve our capital until it is required to fund operations, including our research and development activities. None of these market risk-sensitive instruments are heldAnnual Report on Form 10-K for trading purposes.
Interest Rate Risk
We invest our cash in a variety of financial instruments, principally securities issued by the U.S. government and its agencies, investment-grade corporate bonds and commercial paper, and money market funds. These investments are denominated in U.S. dollars. All of our interest-bearing securities are subject to interest rate risk and could decline in value if interest rates fluctuate. Substantially all of our investment portfolio consists of marketable securities with active secondary or resale markets to help ensure portfolio liquidity, and we have implemented guidelines limiting the term-to-maturity of our investment instruments. Due to the conservative nature of these instruments, we do not believe that we have a material exposure to interest rate risk. If interest rates were to increase or decrease by 1%, the fair value of our investment portfolio would increase or decrease by an immaterial amount.
Foreign Exchange Market Risk
As a result of our foreign operations, we face exposure to movements in foreign currency exchange rates, primarily the Euro, British Pound, Australian Dollar and Canadian Dollar, against the U.S. dollar. The current exposures arise primarily from cash, accounts receivable, intercompany receivables, payables and inventories. Both positive and negative affects to our net revenues from international product sales from movements in foreign currency exchange rates are partially mitigated by the natural, opposite affect that foreign currency exchange rates have on our international operating costs and expenses.
We have a foreign currency management programyear ended December 31, 2021, which was filed with the objective of reducing the effect of exchange rate fluctuationsSEC on our operating results and forecasted revenues and expenses denominated in foreign currencies. We currently have cash flow hedges for the Euro, British Pound and Australian Dollar related to forecasted product revenues that qualify for hedge accounting treatment under U.S. GAAP. We do not seek hedge accounting treatment for our forward contracts related to monetary assets and liabilities that impact our operating results. As of September 30, 2017, we held foreign exchange forward contracts with notional amounts totaling $456.9 million. As of September 30, 2017, our outstanding foreign exchange forward contracts had a net fair value of $(13.1) million.February 9, 2022.
Based on our foreign currency exchange rate exposures at September 30, 2017, a hypothetical 10% adverse fluctuation in exchange rates would decrease the fair value of our foreign exchange forward contracts that are designated as cash flow hedges by approximately $34.3 million at September 30, 2017. The resulting loss on these forward contracts would be offset by the gain on the underlying transactions and therefore would have minimal impact on future anticipated earnings and cash flows. Similarly, adverse fluctuations in exchange rates that would decrease the fair value of our foreign exchange forward contracts that are not designated as hedge instruments would be offset by a positive impact of the underlying monetary assets and liabilities.
Item 4. Controls and Procedures
Evaluation of Disclosure Controls and Procedures
Our management (under the supervision and with the participation of our chief executive officer and chief financial officer,officer), after evaluating the effectiveness of our disclosure controls and procedures (as defined in Rules 13a-15(e) and 15d-15(e) under the Securities Exchange Act of 1934, as amended) as of the end of the period covered by this Quarterly Report on Form 10-Q, havehas concluded that, based on such evaluation, as of September 30, 20172022 our disclosure controls and procedures were effective and designed to provide reasonable assurance that the information required to be disclosed is recorded, processed, summarized and reported within the time periods specified in the SEC’s rules and forms. In designing and evaluating our disclosure controls and procedures, our management recognized that any controls and procedures, no matter how well designed and operated, can provide only reasonable assurance of achieving the desired control objectives, and our management necessarily was required to apply its judgment in evaluating the cost-benefit relationship of possible controls and procedures.
Changes in Internal Controls Over Financial Reporting
No change in our internal control over financial reporting (as defined in Rules 13a-15(f) and 15d-15(f) under the Securities Exchange Act of 1934, as amended) occurred during the three months ended September 30, 20172022 that has materially affected, or is reasonably likely to materially affect, our internal control over financial reporting.
PART II. Other Information
Item 1. Legal Proceedings
There have been noWe are not currently subject to any material changes from the legal proceedings previously disclosed in our Annual Report on Form 10-K for the year ended December 31, 2016, which was filed with the Securities and Exchange Commission, or SEC, on February 23, 2017.proceedings.
Item 1A. Risk Factors
Information regarding risk factors appears in Part I, Item 1A1A. “Risk Factors” of our Annual Report on Form 10-K for the year ended December 31, 2016,2021, which was filed with the SEC on February 23, 2017.9, 2022. There have been no material changes from the risk factors previously disclosed in the Annual Report on Form 10-K, except that the first four risk factors set forth below shall replace the first three risk factors set forth in the Annual Report on Form 10-K and the fifth risk factor set forth below shall be added as a new risk factor.
All of our product revenues and the vast majority of our total revenues are derived from sales of medicines for the treatment of cystic fibrosis. If we are unable to continue to increase revenues from sales of our cystic fibrosis medicines or if we do not meet the expectations of investors or public equity market analysts, our business would be materially harmed and the market price of our common stock would likely decline.
Substantially all of our product revenues and the vast majority of our total revenues are derived from the sale of CF medicines. As a result, our future success is dependent on our ability to continue to increase revenues from sales of our CF medicines. In the near term, this will require us to maintain KALYDECO net product revenues and increase ORKAMBI net product revenues. In the medium term, this will require us to obtain approval for, and successfully commercialize, tezacaftor in combination with ivacaftor. In the longer term, this will require us to successfully develop, obtain approval for and commercialize at least one triple-combination therapy that will allow us to treat patients who have one copy of the F508del mutation in their CFTR gene and a second mutation in their CFTR gene that results in minimal CFTR function and to improve the treatment options available to patients with CF who are eligible for our current medicines. If we are unable to increase our CF product revenues or if we experience adverse developments with respect to development or commercialization of our CF medicines, our results of operations will be adversely affected and our business will be materially harmed.
We are investing significant resources in the development of our next-generation CFTR corrector compounds in triple combinations and if we are unable to show the safety and efficacy of these compounds, experience delays in doing so or are unable to successfully commercialize at least one of these medicines, our business would be materially harmed.
We are investing significant resources in the development of our next-generation CFTR corrector compounds, including VX-152, VX-440, VX-659 and VX-445, which we are evaluating as part of triple combination treatment regimens for the treatment of patients with CF. We believe that a significant portion of the long-term value attributed to our company by investors is based on the commercial potential of these triple-combination therapies. In July 2017, we obtained initial positive results from Phase 2 clinical trials of VX-152 and VX-440 and a Phase 1 clinical trial of VX-659. In each case, these clinical trials enrolled a limited number of patients with CF and we expect to receive additional information regarding these compounds in early 2018. Based on these results, we expect to initiate pivotal programs to evaluate one or two of these triple combination regimens in the first half of 2018.
In order to ultimately obtain approval for a triple-combination regimen, we will need to demonstrate that the compounds are safe and effective in a significantly larger number of patients than were involved in the clinical trials conducted to date. Initial results from ongoing clinical trials may differ materially from final results from such clinical trials. The results from preclinical and early clinical studies do not always accurately predict results in later, large-scale clinical trials. If the data from our ongoing or planned clinical trials or non-clinical studies of triple combination regimens including our next-generation CFTR compounds are not favorable, the FDA and comparable foreign regulatory authorities may not approve these treatment regimens and/or we may be forced to delay or terminate the development of these treatment regimens, which would have an adverse effect on our business. Even successfully completed large-scale clinical trials may not result in marketable medicines. If a triple combination that includes a next-generation CFTR corrector compounds fails to achieve its primary endpoint in clinical trials, if safety issues arise or if the results from our clinical trials are otherwise inadequate to support regulatory approval of our triple combination therapies, commercialization of that combination regimen could be delayed or halted.
Even if we gain marketing approval for one or more combination therapies containing a next-generation CFTR corrector compound in a timely manner, we cannot be sure that such combination therapy will be commercially successful. In addition, since we expect that a significant portion of the patients for whom a triple combination treatment regimen would be indicated would also be eligible for our then existing medicines, a portion of the revenues from our triple combination regimens will likely displace revenues from our then marketed products reducing the overall effect of the commercialization of our triple combination regimens on our total revenues.
If the anticipated or actual timing of marketing approvals for these compounds, or the market acceptance of these compounds, if approved, including treatment reimbursement levels agreed to by third-party payors, do not meet the expectations of investors or public market analysts, the market price of our common stock would likely decline.
Our business currently depends heavily on ORKABMI and KALYDECO net product revenues and we expect to continue to depend on these revenues at least until we obtain approval for tezacaftor in combination with ivacaftor.
Our two marketed medicines are ORKAMBI and KALYDECO, which are approved to treat patients with CF who have specific mutations in their CFTR gene. ORKAMBI and KALYDECO net product revenues represented approximately 52% and 32% of our total revenues in the nine months ended September 30, 2017, respectively, and we expect ORKAMBI and KALYDECO net product revenues to represent substantially all of our total revenues for the remainder of 2017.
A majority of our net product revenues are from sales of ORKAMBI and most of our ORKAMBI net product revenues have come from the United States. We have recognized limited ex-U.S. net product revenues due to the ongoing reimbursement discussions in many ex-U.S. countries and have experienced challenges in the commercialization of ORKAMBI both in the United States and in ex-U.S. markets. Our ORKAMBI U.S. revenues have been affected by uptake, discontinuations and compliance rates. Our ORKAMBI ex-U.S. revenues have been affected by the same factors as our U.S. ORKAMBI revenues and challenges with respect to obtaining reimbursement for ORKAMBI in ex-U.S. markets. Factors that affect our ORKAMBI net product revenues include:
the rate at which patients initiate treatment of ORKAMBI, the proportion of initiated patients who remain on treatment and the compliance rate for patients who remain on treatment;
the safety and efficacy profile of ORKAMBI;
our ability to obtain reimbursement for ORKAMBI and any changes in reimbursement policies of payors and other third parties; and
legal, administrative, regulatory or legislative developments, including pricing limitations.
Since the regulations that govern pricing, coverage and reimbursement for drugs vary widely from country to country, there is no assurance that coverage and reimbursement will be available outside of the United States and, even if it is available, the timing or the level of reimbursement may not be satisfactory. Adverse pricing limitations or a delay in obtaining coverage and reimbursement would decrease our future net product revenues and harm our business.
If we continue to experience challenges with the commercialization of ORKAMBI or are unable to sustain KALYDECO net product revenues or if either medicine were to become subject to problems such as safety or efficacy issues, the introduction or greater acceptance of competing products, changes in reimbursement policies of payors and other third parties, or adverse legal, administrative, regulatory or legislative developments, our ability commercialization of our products would be impaired and our stock price would likely decline.
Our business depends on the success of tezacaftor in combination with ivacaftor, which has not been approved by the FDA or the European Commission. If we are unable to obtain marketing approval or experience material delays in obtaining marketing approval for, or reimbursement arrangements relating to, tezacaftor in combination with ivacaftor, our business could be materially harmed.
In the first quarter of 2017, we obtained positive results from two Phase 3 clinical trials of tezacaftor in combination with ivacaftor that showed statistically significant improvements in lung function in patients with CF 12 years of age and older who have certain mutations in their CFTR gene. Based on these results, we submitted an NDA in the United States and an MAA in Europe for this potential combination regimen. The target date for the FDA to complete its review of the NDA under the Prescription Drug User Fee Act is February 28, 2018. We expect the EMA to complete its review in the second half
of 2018. Obtaining approval of an NDA or an MAA is a lengthy, expensive and uncertain process, and we may not be successful. Obtaining approval depends on many factors including:
whether or not the FDA and European regulatory authorities determine that the evidence gathered in well-controlled clinical trials, other clinical trials and nonclinical studies demonstrates that the combination regimen is safe; and
whether or not the FDA and European regulatory authorities are satisfied that the manufacturing facilities, processes and controls for the combination are adequate, that the labeling is satisfactory and that plans for post-marketing studies, safety monitoring and risk evaluation and mitigation are sufficient.
Obtaining marketing approval for the combination of tezacaftor and ivacaftor in one country or region does not ensure that we will be able to obtain marketing approval in any other country or region.
Even if a tezacaftor in combination with ivacaftor is approved, the FDA or the European Commission, as the case may be, may limit the indications for which the product may be marketed, require extensive warnings on the product labeling or require expensive and time-consuming clinical trials or reporting as conditions of approval. If we experience material delays in obtaining marketing approval for the combination of tezacaftor and ivacaftor in either the United States or Europe, our future net product revenues and cash flows will be adversely effected. If we do not obtain approval to market the combination of tezacaftor and ivacaftor in the United States or Europe, our business will be materially harmed. Additionally, even if the combination of tezacaftor and ivacaftor receives marketing approval, coverage and reimbursement may not be available and, even if it is available, the level of reimbursement may not be satisfactory.
We may not realize the anticipated benefits of our acquisition of VX-561 from Concert Pharmaceuticals, Inc.
In July 2017, we acquired certain CF assets from Concert Pharmaceuticals, Inc., or Concert, including VX-561, an investigational CFTR potentiator that has the potential to be used as part of future once-daily combination regimens of CFTR modulators that treat the underlying cause of CF. We amended our ongoing Phase 2 clinical trials of VX-445 and VX-659 to include additional cohorts of patients to evaluate these next-generation CFTR corrector compounds in combination with tezacaftor and VX-561. Acquisitions are inherently risky and we may not realize the anticipated benefits of such transaction, which involves numerous risks including:
that we fail to successfully develop and/or integrate VX-561 into our pipeline in order to achieve our strategic objectives;
that we receive inadequate or unfavorable data from clinical trials evaluating the VX-561 in combination with other CFTR modulators; and
the potential failure of the due diligence processes to identify significant problems, liabilities or other shortcomings or challenges of VX-561 or any of the other assets acquired from Concert, including but not limited to, problems, liabilities or other shortcomings or challenges with respect to intellectual property, product quality, safety, and other known and unknown liabilities.
10-K.
SPECIAL NOTE REGARDING FORWARD-LOOKING STATEMENTS
This Quarterly Report on Form 10-Q and, in particular, our Management’s Discussion and Analysis of Financial Condition and Results of Operations set forth in Part I-ItemI, Item 2, contain or incorporate a number of forward-looking statements. Forward-looking statements within the meaningare not purely historical and may be accompanied by words such as “anticipates,” “may,” “forecasts,” “expects,” “intends,” “plans,” “potentially,” “believes,” “seeks,” “estimates,” and other words and terms of Section 27A of the Securities Act of 1933, as amended, and Section 21E of the Securities Exchange Act of 1934, as amended, includingsimilar meaning. Such statements regarding:may relate to:
•our expectations regarding the amount of, timing of, and trends with respect to our financial performance, including revenues, costs and expenses and other gains and losses, including those related to net product revenues from KALYDECO and ORKAMBI;revenues;
•our expectations regarding clinical trials, development timelines, regulatory authority filings, submissions, and potential approvals and label expansions for our product and product candidates, and other pipeline programs, including timing and structure of clinical trials, anticipated enrollment and dosing of patients, timing of our receiptavailability of data from our ongoing and planned clinical trials, and timing of anticipated regulatory authority filings and submissions for our products and drug candidates, including the NDA and MAA submission for tezacaftor in combination with ivacaftor and the ongoing and planned clinical trials to evaluate our next-generation CFTR correctors;filings;
•our ability to successfullyobtain reimbursement for our medicines in the U.S. and ex-U.S. markets and our ability to launch, commercialize and market KALYDECO and ORKAMBIour products or any of our other drugproduct candidates for which we obtain regulatory approval;
•the data that will be generated by ongoing and planned clinical trials and the ability to use that data to advance compounds, continue development or support regulatory filings;
•our beliefs regarding the support provided by clinical trials and preclinical and nonclinical studies of our drugproduct candidates and other pipeline programs for further investigation, clinical trials or potential use as a treatment;
•our beliefs regarding the number of people with CF and those potentially eligible for our medicines, and our ability to grow our CF business by increasing the number of people with CF eligible and able to receive our medicines;
•our expectations regarding the potential benefits and commercial potential of our product candidates, including the potential approach to treating or curing specific diseases;
•our plan to continue investing in our research and development programs, including anticipated timelines for our programs, and our strategy to develop our drug candidates,pipeline programs, alone or with third party-collaborators;
•the potential future benefits of our acquisitions and collaborations, including our exa-cel collaboration with CRISPR;
•the establishment, development and maintenance of collaborative relationships;relationships, including potential milestone payments or other obligations;
•potential business development activities;activities, including the identification of potential collaborative partners or acquisition targets;
•our post-closing integrationexpectations that our acquisition of ViaCyte may accelerate the assets acquired from Concert;development of our T1D program;
•our expectations regarding the effect of COVID-19 on, among other things, our financial performance, liquidity, business and operations, including manufacturing, supply chain, research and development activities and pipeline programs;
•potential fluctuations in foreign currency exchange rates;
•our expectations regarding our provision for or benefit from income taxes and the utilization of our deferred tax assets;
•our ability to use our research programs to identify and develop new drugproduct candidates to address serious diseases and significant unmet medical needs; and
•our liquidity and our expectations regarding the possibility of raising additional capital.
AnyForward-looking statements are subject to certain risks, uncertainties, or all of our forward-looking statements in this Quarterly Report on Form 10-Q may turn outother factors that are difficult to be wrong. They can be affected by inaccurate assumptionspredict and could cause actual events or by known or unknown risks and uncertainties. Many factors mentioned in this Quarterly Report on Form 10-Q will be important in determining future results. Consequently, no forward-looking statement can be guaranteed. Actual future results may varyto differ materially from expected results. We also provide a cautionary discussion ofthose indicated in any such statements.These risks, uncertainties, and uncertainties underother factors include, but are not limited to, those described in our “Risk Factors” in Item 1A of our Annual Report on Form 10-K for the year ended December 31, 2016,2021, which was filed with the SEC on February 23, 2017. These are factors9, 2022, and uncertainties that we think could causethose described from time to time in our actual results to differ materially from expected results. Other factorsfuture reports filed with the Securities and uncertainties besides those listed there could also adversely affect us.Exchange Commission.
Without limiting the foregoing, the words “believes,” “anticipates,” “plans,” “intends,” “expects” and similar expressions are intended to identify forward-looking statements. There are a number of factors and uncertainties that could cause actual events or results to differ materially from those indicated byAny such forward-looking statements manyare made on the basis of which are beyond our control. In addition, the forward-looking statements contained herein represent our estimate onlyviews and assumptions as of the date of thisthe filing and shouldare not be relied uponestimates of future performance. Except as representing our estimate as of any subsequent date. Whilerequired by law, we may elect to update these forward-looking statements at some point in the future, we specifically disclaim anyundertake no obligation to do sopublicly update any forward-looking statements. The reader is cautioned not to reflect actual results, changes in assumptions or changes in other factors affectingplace undue reliance on any such forward-looking statements.
Item 2. Unregistered Sales of Equity Securities and Use of Proceeds
Issuer Repurchases of Equity Securities
The table set forth below shows all repurchasesIn June 2021, our Board of securitiesDirectors approved a share repurchase program (the “2021 Share Repurchase Program”), pursuant to which we are authorized to repurchase up to $1.5 billion of our common stock by us duringDecember 31, 2022. We did not repurchase any shares of our common stock under the 2021 Share Repurchase Program in the three months ended September 30, 2017:2022. As of September 30, 2022, $499.7 million remained available to fund repurchases under this share repurchase program.
|
| | | | | |
| Period | | Total Number
of Shares Purchased | Average Price
Paid per Share | Total Number of Shares
Purchased as Part of
Publicly Announced
Plans or Programs | Maximum Number of
Shares that May Yet
be Purchased Under
the Plans or Programs |
| July 1, 2017 to July 31, 2017 | 2,040 | $0.01 | — | — |
| August 1, 2017 to August 31, 2017 | 15,811 | $0.01 | — | — |
| September 1, 2017 to September 30, 2017 | 2,589 | $0.01 | — | — |
| Total | 20,440 | $0.01 | — | — |
The repurchases were made under the terms ofUnder our Amended and Restated 2006 Stock and Option Plan and our Amended and Restated 2013 Stock and Option Plan. Under these plans, we award shares of restricted stock to our employees that typically are subject to a lapsing right of repurchase by us. We may exercise this right of repurchase if a restricted stock recipient’s service to us is terminated. If we exercise this right,2021 Share Repurchase Program, we are requiredauthorized to repaypurchase shares from time to time through open market or privately negotiated transactions. Such purchases may be pursuant to Rule 10b5-1 plans or other means as determined by our management and in accordance with the purchase price paid by or on behalfrequirements of the recipient for the repurchased restricted shares, which typically is the par value per share of $0.01. Repurchased shares are returnedSecurities and are available for future awards under the terms of our Amended and Restated 2013 Stock and Option Plan.Exchange Commission.
Item 6. Exhibits
|
| | | | |
| Exhibit Number | Exhibit Description |
10.131.1 |
|
10.2 | |
31.1 | |
| 31.2 | |
| 32.1 | |
| 101.INS | XBRL Instance - the instance document does not appear in the Interactive Data File because its XBRL tags are embedded within the Inline XBRL document. |
| 101.SCH | XBRL Taxonomy Extension Schema |
| 101.CAL | XBRL Taxonomy Extension Calculation |
| 101.LAB | XBRL Taxonomy Extension Labels |
| 101.PRE | XBRL Taxonomy Extension Presentation |
| 101.DEF | XBRL Taxonomy Extension Definition |
| 104 | Cover Page Interactive Data File––the cover page interactive data file does not appear in the Interactive Data File because its XBRL tags are embedded within the Inline XBRL document. |
* Management contract, compensatory plan or agreement.
SIGNATURES
Pursuant to the requirements of the Securities Exchange Act of 1934, the registrant has duly caused this report to be signed on its behalf by the undersigned thereunto duly authorized.
| | | | | | | | |
| Vertex Pharmaceuticals Incorporated |
| | |
| Vertex Pharmaceuticals Incorporated |
| | |
October 30, 201728, 2022 | By: | /s/ Thomas GraneyCharles F. Wagner, Jr. |
| | Thomas GraneyCharles F. Wagner, Jr. |
| | SeniorExecutive Vice President, and Chief Financial Officer
(principal financial officer and
duly authorized officer) |