UNITED STATES
SECURITIES AND EXCHANGE COMMISSION
WASHINGTON, DC 20549
FORM 10-Q
|
| | | | |
| ☒ | QUARTERLY REPORT PURSUANT TO SECTION 13 OR 15(d) OF THE SECURITIES EXCHANGE ACT OF 1934 |
For the quarterly period ended December 31, 20192020 or |
| | | | |
| ☐ | TRANSITION REPORT PURSUANT TO SECTION 13 OR 15(d) OF THE SECURITIES EXCHANGE ACT OF 1934 |
For the transition period from to
Commission File No. 0-19424
EZCORP, INC.
(Exact name of registrant as specified in its charter) | | | | | | | | | | | | | | | | | |
| Delaware | 74-2540145 |
| (State or other jurisdiction of incorporation or organization) | (I.R.S. Employer Identification No.) |
| | | | | |
Delaware | 74-2540145 |
(State or other jurisdiction of incorporation or organization) | (I.R.S. Employer Identification No.) |
| | | | | |
| 2500 Bee Cave Road | Bldg One | Suite 200 | Rollingwood | TX | 78746 |
| (Address of principal executive offices) | (Zip Code) |
Registrant’s telephone number, including area code: (512) (512) 314-3400
Securities registered pursuant to Section 12(b) of the Act |
| | | | | | | | | | | | | |
| Title of each class | | Trading Symbol(s) | | Name of each exchange on which registered |
| | | | | |
| Class A Non-voting Common Stock, par value $.01 per share | | EZPW | | NASDAQ Stock Market |
| | | | (NASDAQ Global Select Market) |
Indicate by check mark whether the registrant (1) has filed all reports required to be filed by Section 13 or 15(d) of the Securities Exchange Act of 1934 during the preceding 12 months (or for such shorter period that the registrant was required to file such reports), and (2) has been subject to such filing requirements for the past 90 days. Yes☒ No ☐
Indicate by check mark whether the registrant has submitted electronically and posted on its corporate Web site, if any, every Interactive Data File required to be submitted and posted pursuant to Rule 405 of Regulation S-T (§232.405 of this chapter) during the preceding 12 months (or for such shorter period that the registrant was required to submit and post such files). Yes☒ No ☐
Indicate by check mark whether the registrant is a large accelerated filer, an accelerated filer, a non-accelerated filer, smaller reporting company, or an emerging growth company. See definition of “large accelerated filer,” “accelerated filer,” “smaller reporting company,” and "emerging growth company" in Rule 12b-2 of the Exchange Act.
|
| | | | | | | | | | |
| Large Accelerated Filer | ☐ | Accelerated Filer | ☒ |
| Non-accelerated Filer | ☐ | Smaller Reporting Company | ☐☒ |
| | Emerging Growth Company | ☐ |
If an emerging growth company, indicate by check mark if the registrant has elected not to use the extended transition period for complying with any new or revised financial accounting standards provided pursuant to Section 13(a) of the Exchange Act. ☐
Indicate by check mark whether the registrant is a shell company (as defined in Rule 12b-2 of the Exchange Act). Yes ☐ No ☒
APPLICABLE ONLY TO CORPORATE ISSUERS:
The only class of voting securities of the registrant issued and outstanding is the Class B Voting Common Stock, par value $.01 per share, all of which is owned by an affiliate of the registrant. There is no trading market for the Class B Voting Common Stock.
As of January 29, 2020, 52,651,18831, 2021, 52,628,588 shares of the registrant’s Class A Non-voting Common Stock ("Class A Common Stock"), par value $.01 per share, and 2,970,171 shares of the registrant’s Class B Voting Common Stock, par value $.01 per share, were outstanding.
EZCORP, Inc.
INDEX TO FORM 10-Q
PART I — FINANCIAL INFORMATION
ITEM 1. FINANCIAL STATEMENTS
EZCORP, Inc.
CONDENSED CONSOLIDATED BALANCE SHEETS
| | | | | | | | | | | | | | | | | |
| (in thousands, except share and per share amounts) | December 31, 2020 | | December 31, 2019 | | September 30, 2020 |
| (Unaudited) | | |
| Assets: | | | | | |
| Current assets: | | | | | |
| Cash and cash equivalents | $ | 290,450 | | | $ | 143,141 | | | $ | 304,542 | |
| Restricted cash | 8,011 | | | 0 | | | 8,011 | |
| Pawn loans | 147,852 | | | 195,586 | | | 131,323 | |
| Pawn service charges receivable, net | 24,825 | | | 32,250 | | | 20,580 | |
| Inventory, net | 94,980 | | | 187,369 | | | 95,891 | |
| Notes receivable, net | 0 | | | 7,450 | | | 0 | |
| Prepaid expenses and other current assets | 32,824 | | | 36,142 | | | 32,903 | |
| Total current assets | 598,942 | | | 601,938 | | | 593,250 | |
| Investments in unconsolidated affiliates | 31,773 | | | 29,272 | | | 32,458 | |
| Property and equipment, net | 55,204 | | | 65,246 | | | 56,986 | |
| Lease right-of-use asset | 177,308 | | | 225,950 | | | 183,809 | |
| Goodwill | 258,453 | | | 301,282 | | | 257,582 | |
| Intangible assets, net | 58,794 | | | 68,995 | | | 58,638 | |
| Notes receivable, net | 1,156 | | | 1,124 | | | 1,148 | |
| Deferred tax asset, net | 10,000 | | | 2,123 | | | 8,931 | |
| Other assets | 5,534 | | | 5,012 | | | 4,221 | |
| Total assets | $ | 1,197,164 | | | $ | 1,300,942 | | | $ | 1,197,023 | |
| | | | | |
| Liabilities and equity: | | | | | |
| Current liabilities: | | | | | |
| Current maturities of long-term debt, net | $ | 213 | | | $ | 215 | | | $ | 213 | |
| Accounts payable, accrued expenses and other current liabilities | 67,777 | | | 51,621 | | | 71,504 | |
| Customer layaway deposits | 9,904 | | | 12,548 | | | 11,008 | |
| Lease liability | 45,351 | | | 48,052 | | | 49,742 | |
| Total current liabilities | 123,245 | | | 112,436 | | | 132,467 | |
| Long-term debt, net | 254,322 | | | 241,209 | | | 251,016 | |
| Deferred tax liability, net | 172 | | | 2,119 | | | 524 | |
| Lease liability | 143,620 | | | 186,352 | | | 153,040 | |
| Other long-term liabilities | 11,303 | | | 7,226 | | | 10,849 | |
| Total liabilities | 532,662 | | | 549,342 | | | 547,896 | |
| Commitments and Contingencies (Note 11) | 0 | | 0 | | 0 |
| Stockholders’ equity: | | | | | |
| Class A Non-voting Common Stock, par value $0.01 per share; shares authorized: 100 million; issued and outstanding: 52,628,588 as of December 31, 2020; 52,886,122 as of December 31, 2019; and 52,332,848 as of September 30, 2020 | 526 | | | 529 | | | 521 | |
| Class B Voting Common Stock, convertible, par value $0.01 per share; shares authorized: 3 million; issued and outstanding: 2,970,171 | 30 | | | 30 | | | 30 | |
| Additional paid-in capital | 398,269 | | | 407,440 | | | 398,475 | |
| Retained earnings | 322,468 | | | 389,928 | | | 318,169 | |
| Accumulated other comprehensive loss | (56,791) | | | (46,327) | | | (68,068) | |
| Total equity | 664,502 | | | 751,600 | | | 649,127 | |
| Total liabilities and equity | $ | 1,197,164 | | | $ | 1,300,942 | | | $ | 1,197,023 | |
See accompanying notes to unaudited interim condensed consolidated financial statements
EZCORP, Inc. CONDENSED CONSOLIDATED BALANCE SHEETS (in thousands, except share and per share amounts) |
| | | | | | | | | | | |
| | December 31,
2019 | | December 31,
2018 | | September 30,
2019 |
| | | | | | |
| | (Unaudited) | | |
| Assets: | | | | | |
| Current assets: | | | | | |
| Cash and cash equivalents | $ | 143,141 |
| | $ | 297,031 |
| | $ | 157,567 |
|
| Pawn loans | 195,586 |
| | 193,984 |
| | 199,058 |
|
| Pawn service charges receivable, net | 32,250 |
| | 31,558 |
| | 31,802 |
|
| Inventory, net | 187,369 |
| | 175,422 |
| | 179,355 |
|
| Notes receivable, net | 7,450 |
| | 26,711 |
| | 7,182 |
|
| Prepaid expenses and other current assets | 36,142 |
| | 31,483 |
| | 30,796 |
|
| Total current assets | 601,938 |
| | 756,189 |
| | 605,760 |
|
| Investments in unconsolidated affiliates | 29,272 |
| | 35,511 |
| | 34,516 |
|
| Property and equipment, net | 65,246 |
| | 69,770 |
| | 67,357 |
|
| Lease right-of-use asset | 225,950 |
| | — |
| | — |
|
| Goodwill | 301,282 |
| | 296,638 |
| | 300,527 |
|
| Intangible assets, net | 68,995 |
| | 55,956 |
| | 68,044 |
|
| Notes receivable, net | 1,124 |
| | 4,599 |
| | 1,117 |
|
| Deferred tax asset, net | 2,123 |
| | 10,104 |
| | 1,998 |
|
| Other assets | 5,012 |
| | 4,442 |
| | 4,383 |
|
| Total assets | $ | 1,300,942 |
| | $ | 1,233,209 |
| | $ | 1,083,702 |
|
| | | | | | |
| Liabilities and equity: | | | | | |
| Current liabilities: | | | | | |
| Current maturities of long-term debt, net | $ | 215 |
| | $ | 190,238 |
| | $ | 214 |
|
| Accounts payable, accrued expenses and other current liabilities | 51,621 |
| | 57,380 |
| | 77,957 |
|
| Customer layaway deposits | 12,548 |
| | 11,747 |
| | 12,915 |
|
| Lease liability | 48,052 |
| | — |
| | — |
|
| Total current liabilities | 112,436 |
| | 259,365 |
| | 91,086 |
|
| Long-term debt, net | 241,209 |
| | 229,928 |
| | 238,380 |
|
| Deferred tax liability, net | 2,119 |
| | 9,617 |
| | 1,985 |
|
| Lease liability | 186,352 |
| | — |
| | — |
|
| Other long-term liabilities | 7,226 |
| | 6,150 |
| | 7,302 |
|
| Total liabilities | 549,342 |
| | 505,060 |
| | 338,753 |
|
| Commitments and contingencies (Note 9) |
|
| |
|
| |
|
|
| Stockholders’ equity: | | | | | |
| Class A Non-voting Common Stock, par value $.01 per share; shares authorized: 100 million; issued and outstanding: 52,886,122 as of December 31, 2019; 52,475,070 as of December 31, 2018; and 52,565,064 as of September 30, 2019 | 529 |
| | 524 |
| | 526 |
|
| Class B Voting Common Stock, convertible, par value $.01 per share; shares authorized: 3 million; issued and outstanding: 2,970,171 | 30 |
| | 30 |
| | 30 |
|
| Additional paid-in capital | 407,440 |
| | 400,081 |
| | 407,628 |
|
| Retained earnings | 389,928 |
| | 383,256 |
| | 389,163 |
|
| Accumulated other comprehensive loss | (46,327 | ) | | (48,739 | ) | | (52,398 | ) |
| EZCORP, Inc. stockholders’ equity | 751,600 |
| | 735,152 |
| | 744,949 |
|
| Noncontrolling interest | — |
| | (7,003 | ) | | — |
|
| Total equity | 751,600 |
| | 728,149 |
| | 744,949 |
|
| Total liabilities and equity | $ | 1,300,942 |
| | $ | 1,233,209 |
| | $ | 1,083,702 |
|
EZCORP, Inc.
CONDENSED CONSOLIDATED STATEMENTS OF OPERATIONS
(Unaudited)
| | | | | | | | | | | | | | | |
| Three Months Ended December 31, | | |
| (in thousands, except per share amount) | 2020 | | 2019 | | | | |
| |
| Revenues: | | | | | | | |
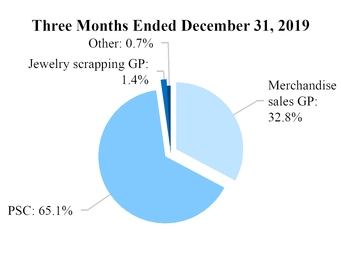
| Merchandise sales | $ | 107,783 | | | $ | 126,728 | | | | | |
| Jewelry scrapping sales | 6,759 | | | 9,528 | | | | | |
| Pawn service charges | 63,489 | | | 84,725 | | | | | |
| Other revenues | 104 | | | 1,454 | | | | | |
| Total revenues | 178,135 | | | 222,435 | | | | | |
| Merchandise cost of goods sold | 64,543 | | | 84,076 | | | | | |
| Jewelry scrapping cost of goods sold | 5,202 | | | 7,754 | | | | | |
| Other cost of revenues | 0 | | | 536 | | | | | |
| Net revenues | 108,390 | | | 130,069 | | | | | |
| Operating expenses: | | | | | | | |
| Store expenses | 79,309 | | | 89,275 | | | | | |
| General and administrative | 12,510 | | | 18,839 | | | | | |
| Depreciation and amortization | 7,572 | | | 7,733 | | | | | |
| (Gain) loss on sale or disposal of assets and other | (22) | | | 744 | | | | | |
| Total operating expenses | 99,369 | | | 116,591 | | | | | |
| Operating income | 9,021 | | | 13,478 | | | | | |
| Interest expense | 5,455 | | | 5,329 | | | | | |
| Interest income | (821) | | | (843) | | | | | |
| Equity in net (income) loss of unconsolidated affiliates | (516) | | | 5,897 | | | | | |
| Other (income) expense | (599) | | | 98 | | | | | |
| Income before income taxes | 5,502 | | | 2,997 | | | | | |
| Income tax expense | 1,203 | | | 1,759 | | | | | |
| Net income | $ | 4,299 | | | $ | 1,238 | | | | | |
| | | | | | | |
| Basic earnings per share | $ | 0.08 | | | $ | 0.02 | | | | | |
| Diluted earnings per share | $ | 0.08 | | | $ | 0.02 | | | | | |
| | | | | | | |
| Weighted-average basic shares outstanding | 55,361 | | | 55,666 | | | | | |
| Weighted-average diluted shares outstanding | 55,428 | | | 55,687 | | | | | |
See accompanying notes to unaudited interim condensed consolidated financial statements
EZCORP, Inc.
CONDENSED CONSOLIDATED STATEMENTS OF COMPREHENSIVE INCOME
(Unaudited)
| | | | | | | | | | | | | | | |
| Three Months Ended December 31, | | |
| (in thousands) | 2020 | | 2019 | | | | |
| | | | | | | |
| Net income | $ | 4,299 | | | $ | 1,238 | | | | | |
| Other comprehensive income: | | | | | | | |
| Foreign currency translation adjustment | 11,277 | | | 6,071 | | | | | |
| | | | | | | |
| | | | | | | |
| | | | | | | |
| | | | | | | |
| Comprehensive income | $ | 15,576 | | | $ | 7,309 | | | | | |
See accompanying notes to unaudited interim condensed consolidated financial statements.
EZCORP, Inc.
CONDENSED CONSOLIDATED STATEMENTS OF STOCKHOLDERS' EQUITY
(Unaudited except for balances as of September 30, 2020 and September 30, 2019)
| | | | | | | | | | | | | | | | | | | | | | | | | | | | | | | | | | | | | |
| | Common Stock | | Additional
Paid-in
Capital | | Retained
Earnings | | Accumulated
Other
Comprehensive Loss | | | | Total Equity |
| (in thousands) | Shares | | Par Value | |
| | | | | | | | | | | | | |
| Balances as of September 30, 2020 | 55,303 | | | $ | 551 | | | $ | 398,475 | | | $ | 318,169 | | | $ | (68,068) | | | | | $ | 649,127 | |
| Stock compensation | — | | — | | 524 | | — | | — | | | | 524 | |
| | | | | | | | | | | | | |
| | | | | | | | | | | | | |
| Release of restricted stock | 296 | | 5 | | — | | — | | — | | | | 5 | |
| Taxes paid related to net share settlement of equity awards | — | | — | | (730) | | — | | — | | | | (730) | |
| | | | | | | | | | | | | |
| | | | | | | | | | | | | |
| | | | | | | | | | | | | |
| | | | | | | | | | | | | |
| | | | | | | | | | | | | |
| Foreign currency translation gain | — | | — | | — | | — | | 11,277 | | | | 11,277 | |
| | | | | | | | | | | | | |
| | | | | | | | | | | | | |
| | | | | | | | | | | | | |
| Net income | — | | — | | — | | 4,299 | | — | | | | 4,299 | |
| Balances as of December 31, 2020 | 55,599 | | $ | 556 | | | $ | 398,269 | | | $ | 322,468 | | | $ | (56,791) | | | | | $ | 664,502 | |
| | | | | | | | | | | | | |
| | | | | | | | | | | | | |
| | | | | | | | | | | | | |
| | | | | | | | | | | | | |
| | | | | | | | | | | | | |
| | | | | | | | | | | | | |
| | | | | | | | | | | | | |
| | | | | | | | | | | | | |
| | | | | | | | | | | | | |
| | | | | | | | | | | | | |
| | | | | | | | | | | | | |
| | | | | | | | | | | | | |
| | | | | | | | | | | | | |
| | | | | | | | | | | | | |
| | | | | | | | | | | | | |
| | | | | | | | | | | | | |
| | | | | | | | | | | | | |
| | | | | | | | | | | | | |
| | | | | | | | | | | | | |
| | | | | | | | | | | | | |
| | | | | | | | | | | | | |
| | | | | | | | | | | | | |
| | | | | | | | | | | | | |
| | | | | | | | | | | | | |
| | | | | | | | | | | | | |
| | | | | | | | | | | | | |
| | | | | | | | | | | | | |
| | | | | | | | | | | | | |
| | | | | | | | | | | | | |
| | | | | | | | | | | | | |
| | | | | | | | | | | | | |
| | | | | | | | | | | | | |
| | | | | | | | | | | | | | | | | | | | | | | | | | | | | | | | | | | | | |
| | Common Stock | | Additional
Paid-in
Capital | | Retained
Earnings | | Accumulated
Other
Comprehensive Loss | | | | Total Equity |
| (in thousands) | Shares | | Par Value | |
| | | | | | | | | | | | | |
| Balances as of September 30, 2019 | 55,535 | | | $ | 556 | | | $ | 407,628 | | | $ | 389,163 | | | $ | (52,398) | | | | | $ | 744,949 | |
| Stock compensation | — | | — | | 1,695 | | — | | — | | | | 1,695 | |
| | | | | | | | | | | | | |
| | | | | | | | | | | | | |
| Release of restricted stock | 463 | | 5 | | — | | — | | — | | | | 5 | |
| Taxes paid related to net share settlement of equity awards | — | | — | | (1,395) | | — | | — | | | | (1,395) | |
| | | | | | | | | | | | | |
| | | | | | | | | | | | | |
| | | | | | | | | | | | | |
| | | | | | | | | | | | | |
| | | | | | | | | | | | | |
| Foreign currency translation gain | — | | — | | — | | — | | 6,071 | | | | 6,071 | |
| | | | | | | | | | | | | |
| Purchase and retirement of treasury stock | (142) | | (2) | | (488) | | (473) | | — | | | | (963) | |
| | | | | | | | | | | | | |
| Net income | — | | — | | | — | | | 1,238 | | | — | | | | | 1,238 | |
| Balances as of December 31, 2019 | 55,856 | | $ | 559 | | | $ | 407,440 | | | $ | 389,928 | | | $ | (46,327) | | | | | $ | 751,600 | |
| | | | | | | | | | | | | |
| | | | | | | | | | | | | |
| | | | | | | | | | | | | |
| | | | | | | | | | | | | |
| | | | | | | | | | | | | |
| | | | | | | | | | | | | |
| | | | | | | | | | | | | |
| | | | | | | | | | | | | |
| | | | | | | | | | | | | |
| | | | | | | | | | | | | |
| | | | | | | | | | | | | |
| | | | | | | | | | | | | |
| | | | | | | | | | | | | |
| | | | | | | | | | | | | |
| | | | | | | | | | | | | |
| | | | | | | | | | | | | |
| | | | | | | | | | | | | |
| | | | | | | | | | | | | |
| | | | | | | | | | | | | |
| | | | | | | | | | | | | |
| | | | | | | | | | | | | |
| | | | | | | | | | | | | |
| | | | | | | | | | | | | |
| | | | | | | | | | | | | |
| | | | | | | | | | | | | |
| | | | | | | | | | | | | |
| | | | | | | | | | | | | |
| | | | | | | | | | | | | |
| | | | | | | | | | | | | |
| | | | | | | | | | | | | |
| | | | | | | | | | | | | |
| | | | | | | | | | | | | |
See accompanying notes to unaudited interim condensed consolidated financial statements
EZCORP, Inc. CONDENSED CONSOLIDATED STATEMENTS OF OPERATIONS |
| | | | | | | |
| | Three Months Ended December 31, |
| | 2019 | | 2018 |
| | | | |
| | (Unaudited) |
| | (in thousands, except per share amounts) |
| Revenues: | | | |
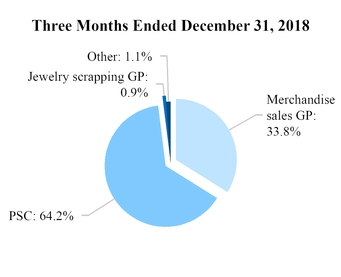
| Merchandise sales | $ | 126,728 |
| | $ | 121,024 |
|
| Jewelry scrapping sales | 9,528 |
| | 9,281 |
|
| Pawn service charges | 84,725 |
| | 83,519 |
|
| Other revenues | 1,454 |
| | 1,871 |
|
| Total revenues | 222,435 |
| | 215,695 |
|
| Merchandise cost of goods sold | 84,076 |
| | 77,112 |
|
| Jewelry scrapping cost of goods sold | 7,754 |
| | 8,050 |
|
| Other cost of revenues | 536 |
| | 484 |
|
| Net revenues | 130,069 |
| | 130,049 |
|
| Operating expenses: | | | |
| Operations | 90,625 |
| | 90,853 |
|
| Administrative | 17,489 |
| | 13,165 |
|
| Depreciation and amortization | 7,733 |
| | 6,848 |
|
| Loss on sale or disposal of assets and other | 744 |
| | 4,442 |
|
| Total operating expenses | 116,591 |
| | 115,308 |
|
| Operating income | 13,478 |
| | 14,741 |
|
| Interest expense | 5,329 |
| | 8,791 |
|
| Interest income | (843 | ) | | (3,339 | ) |
| Equity in net loss of unconsolidated affiliates | 5,897 |
| | 1,119 |
|
| Impairment of investment in unconsolidated affiliates | — |
| | 13,274 |
|
| Other expense (income) | 71 |
| | (386 | ) |
| Income (loss) from continuing operations before income taxes | 3,024 |
| | (4,718 | ) |
| Income tax expense (benefit) | 1,759 |
| | (1,058 | ) |
| Income (loss) from continuing operations, net of tax | 1,265 |
| | (3,660 | ) |
| Loss from discontinued operations, net of tax | (27 | ) | | (183 | ) |
| Net income (loss) | 1,238 |
| | (3,843 | ) |
| Net loss attributable to noncontrolling interest | — |
| | (477 | ) |
| Net income (loss) attributable to EZCORP, Inc. | $ | 1,238 |
| | $ | (3,366 | ) |
| | | | |
| Basic earnings (loss) per share attributable to EZCORP, Inc. — continuing operations | $ | 0.02 |
| | $ | (0.06 | ) |
| Diluted earnings (loss) per share attributable to EZCORP, Inc. — continuing operations | $ | 0.02 |
| | $ | (0.06 | ) |
| | | | |
| Weighted-average basic shares outstanding | 55,666 |
| | 55,032 |
|
| Weighted-average diluted shares outstanding | 55,687 |
| | 55,032 |
|
EZCORP, Inc.
CONDENSED CONSOLIDATED STATEMENTS OF CASH FLOWS
(Unaudited)
| | | | | | | | | | | |
| | Three Months Ended December 31, |
| (in thousands) | 2020 | | 2019 |
| |
| Operating activities: | | | |
| Net income | $ | 4,299 | | | $ | 1,238 | |
| Adjustments to reconcile net income to net cash flows from operating activities: | | | |
| Depreciation and amortization | 7,572 | | | 7,733 | |
| Amortization of debt discount and deferred financing costs | 3,329 | | | 3,229 | |
| Amortization of lease right-of-use asset | 11,504 | | | 11,474 | |
| Accretion of notes receivable discount and deferred compensation fee | 0 | | | (275) | |
| Deferred income taxes | (1,421) | | | 10 | |
| Impairment of goodwill and intangible assets | 0 | | | 0 | |
| Other adjustments | (167) | | | 1,298 | |
| Provision for inventory reserve | (1,510) | | | 329 | |
| Stock compensation expense | 524 | | | 1,695 | |
| Equity in net (income) loss of unconsolidated affiliates | (516) | | | 5,897 | |
| Changes in operating assets and liabilities: | | | |
| Service charges and fees receivable | (4,034) | | | (355) | |
| Inventory | 1,323 | | | (1,921) | |
| Prepaid expenses, other current assets and other assets | (713) | | | (9,649) | |
| Accounts payable, accrued expenses and other liabilities | (23,460) | | | (29,966) | |
| Customer layaway deposits | (1,311) | | | (467) | |
| Income taxes | 68 | | | (1,188) | |
| Net cash used in operating activities | (4,513) | | | (10,918) | |
| Investing activities: | | | |
| Loans made | (142,936) | | | (187,362) | |
| Loans repaid | 77,116 | | | 109,623 | |
| Recovery of pawn loan principal through sale of forfeited collateral | 53,981 | | | 76,515 | |
| Capital expenditures, net | (3,223) | | | (5,574) | |
| | | |
| | | |
| Net cash used in investing activities | (15,062) | | | (6,798) | |
| Financing activities: | | | |
| Taxes paid related to net share settlement of equity awards | (730) | | | (1,395) | |
| Payout of deferred consideration | 0 | | | (175) | |
| Proceeds from borrowings, net of issuance costs | 0 | | | (109) | |
| Payments on borrowings | (53) | | | (292) | |
| Repurchase of common stock | 0 | | | (963) | |
| Net cash used in financing activities | (783) | | | (2,934) | |
| Effect of exchange rate changes on cash and cash equivalents and restricted cash | 6,266 | | | 1,349 | |
| Net decrease in cash, cash equivalents and restricted cash | (14,092) | | | (19,301) | |
| Cash, cash equivalents and restricted cash at beginning of period | 312,553 | | | 162,442 | |
| Cash, cash equivalents and restricted cash at end of period | $ | 298,461 | | | $ | 143,141 | |
| | | |
| Supplemental disclosure of cash flow information | | | |
| Cash and cash equivalents | $ | 290,450 | | | $ | 143,141 | |
| Restricted cash | 8,011 | | | 0 | |
| Total cash and cash equivalents and restricted cash | $ | 298,461 | | | $ | 143,141 | |
| | | |
| Non-cash investing and financing activities: | | | |
| Pawn loans forfeited and transferred to inventory | $ | 50,921 | | | $ | 82,878 | |
See accompanying notes to unaudited interim condensed consolidated financial statements.
EZCORP, Inc. CONDENSED CONSOLIDATED STATEMENTS OF COMPREHENSIVE INCOME (LOSS) |
| | | | | | | |
| | Three Months Ended December 31, |
| | 2019 | | 2018 |
| | | | |
| | (Unaudited) |
| | (in thousands) |
| Net income (loss) | $ | 1,238 |
| | $ | (3,843 | ) |
| Other comprehensive gain (loss): | | | |
| Foreign currency translation gain (loss), net of income tax expense for our investment in unconsolidated affiliate of $122 and $87 for the three months ended December 31, 2019 and 2018. | 6,071 |
| | (6,383 | ) |
| Comprehensive income (loss) | 7,309 |
| | (10,226 | ) |
| Comprehensive loss attributable to noncontrolling interest | — |
|
| (477 | ) |
| Comprehensive income (loss) attributable to EZCORP, Inc. | $ | 7,309 |
| | $ | (9,749 | ) |
See accompanying notes to unaudited interim condensed consolidated financial statements.EZCORP, Inc. CONDENSED CONSOLIDATED STATEMENTS OF STOCKHOLDERS' EQUITY |
| | | | | | | | | | | | | | | | | | | | | | | | | | |
| | Common Stock | | Additional Paid-in Capital | | Retained Earnings | | Accumulated Other Comprehensive Loss | | Noncontrolling Interest | | Total Equity |
| | Shares | | Par Value | |
| | | | | | | | | | | | | | |
| | (Unaudited, except balances as of September 30, 2018) |
| | (in thousands) |
| Balances as of September 30, 2018 | 54,585 |
| | $ | 546 |
| | $ | 397,927 |
| | $ | 386,622 |
| | $ | (42,356 | ) | | $ | (3,331 | ) | | $ | 739,408 |
|
| Stock compensation | — |
| | — |
| | 2,247 |
| | — |
| | — |
| | — |
| | 2,247 |
|
| Release of restricted stock | 860 |
| | 8 |
| | — |
| | — |
| | — |
| | — |
| | 8 |
|
| Taxes paid related to net share settlement of equity awards | — |
| | — |
| | (3,288 | ) | | — |
| | — |
| | — |
| | (3,288 | ) |
| Transfer of subsidiary shares to noncontrolling interest | — |
| | — |
| | 3,195 |
| | — |
| | — |
| | (3,195 | ) | | — |
|
| Foreign currency translation loss | — |
| | — |
| | — |
| | — |
| | (6,383 | ) | | — |
| | (6,383 | ) |
| Net loss | — |
| | — |
| | — |
| | (3,366 | ) | | — |
| | (477 | ) | | (3,843 | ) |
| Balances as of December 31, 2018 | 55,445 |
| | $ | 554 |
| | $ | 400,081 |
| | $ | 383,256 |
| | $ | (48,739 | ) | | $ | (7,003 | ) | | $ | 728,149 |
|
|
| | | | | | | | | | | | | | | | | | | | | | |
| | Common Stock | | Additional Paid-in Capital | | Retained Earnings | | Accumulated Other Comprehensive Loss | | Total Equity |
| | Shares | | Par Value | |
| | | | | | | | | | | | |
| | (Unaudited, except balances as of September 30, 2019) |
| | (in thousands) |
| Balances as of September 30, 2019 | 55,535 |
| | $ | 556 |
| | $ | 407,628 |
| | $ | 389,163 |
| | $ | (52,398 | ) | | $ | 744,949 |
|
| Stock compensation | — |
| | — |
| | 1,695 |
| | — |
| | — |
| | 1,695 |
|
| Release of restricted stock | 463 |
| | 5 |
| | — |
| | — |
| | — |
| | 5 |
|
| Taxes paid related to net share settlement of equity awards | — |
| | — |
| | (1,395 | ) | | — |
| | — |
| | (1,395 | ) |
| Foreign currency translation gain | — |
| | — |
| | — |
| | — |
| | 6,071 |
| | 6,071 |
|
| Purchase and retirement of treasury stock | (142 | ) | | (2 | ) | | (488 | ) | | (473 | ) | | — |
| | (963 | ) |
| Net income | — |
| | — |
| | — |
| | 1,238 |
| | — |
| | 1,238 |
|
| Balances as of December 31, 2019 | 55,856 |
| | $ | 559 |
| | $ | 407,440 |
| | $ | 389,928 |
| | $ | (46,327 | ) | | $ | 751,600 |
|
See accompanying notes to unaudited interim condensed consolidated financial statements.
EZCORP, Inc. CONDENSED CONSOLIDATED STATEMENTS OF CASH FLOWS |
| | | | | | | |
| | Three Months Ended December 31, |
| | 2019 | | 2018 |
| | | | |
| | (Unaudited) |
| | (in thousands) |
| Operating activities: | | | |
| Net income (loss) | $ | 1,238 |
| | $ | (3,843 | ) |
| Adjustments to reconcile net income (loss) to net cash flows from operating activities: | | | |
| Depreciation and amortization | 7,733 |
| | 6,848 |
|
| Amortization of debt discount and deferred financing costs | 3,229 |
| | 5,585 |
|
| Amortization of lease right-of-use asset | 11,474 |
| | — |
|
| Accretion of notes receivable discount and deferred compensation fee | (275 | ) | | (1,376 | ) |
| Deferred income taxes | 10 |
| | 352 |
|
| Impairment of investment in unconsolidated affiliate | — |
| | 13,274 |
|
| Other adjustments | 1,298 |
| | 5,052 |
|
| Stock compensation expense | 1,695 |
| | 2,238 |
|
| Loss from investments in unconsolidated affiliates | 5,897 |
| | 1,119 |
|
| Changes in operating assets and liabilities, net of business acquisitions: | | | |
| Service charges and fees receivable | (355 | ) | | (726 | ) |
| Inventory | (1,592 | ) | | 685 |
|
| Prepaid expenses, other current assets and other assets | (9,649 | ) | | (1,564 | ) |
| Accounts payable, accrued expenses and other liabilities | (29,966 | ) | | (836 | ) |
| Customer layaway deposits | (467 | ) | | 18 |
|
| Income taxes | (1,188 | ) | | (3,445 | ) |
| Net cash (used in) provided by operating activities | (10,918 | ) | | 23,381 |
|
| Investing activities: | | | |
| Loans made | (187,362 | ) | | (186,588 | ) |
| Loans repaid | 109,623 |
| | 106,643 |
|
| Recovery of pawn loan principal through sale of forfeited collateral | 76,515 |
| | 70,594 |
|
| Additions to property and equipment, net | (5,574 | ) | | (5,880 | ) |
| Acquisitions, net of cash acquired | — |
| | (332 | ) |
| Principal collections on notes receivable | — |
| | 7,284 |
|
| Net cash used in investing activities | (6,798 | ) | | (8,279 | ) |
| Financing activities: | | | |
| Taxes paid related to net share settlement of equity awards | (1,395 | ) | | (3,288 | ) |
| Payout of deferred consideration | (175 | ) | | — |
|
| Proceeds from borrowings, net of issuance costs | (109 | ) | | 743 |
|
| Payments on borrowings | (292 | ) | | (67 | ) |
| Repurchase of common stock | (963 | ) | | — |
|
| Net cash used in financing activities | (2,934 | ) | | (2,612 | ) |
| Effect of exchange rate changes on cash and cash equivalents and restricted cash | 1,349 |
| | (782 | ) |
| Net (decrease) increase in cash, cash equivalents and restricted cash | (19,301 | ) | | 11,708 |
|
| Cash, cash equivalents and restricted cash at beginning of period | 162,442 |
| | 285,578 |
|
| Cash, cash equivalents and restricted cash at end of period | $ | 143,141 |
| | $ | 297,286 |
|
| | | | |
| Non-cash investing and financing activities: | | | |
| Pawn loans forfeited and transferred to inventory | $ | 82,878 |
| | $ | 80,301 |
|
See accompanying notes to unaudited interim condensed consolidated financial statements.
EZCORP, Inc.
Notes to Interim Condensed Consolidated Financial Statements (Unaudited)
December 31, 2019
NOTE 1: ORGANIZATION AND SUMMARY OF SIGNIFICANT ACCOUNTING POLICIES
Description of Business
When used in this report, the terms “we,” “us,” “our,” “EZCORP” and the “Company” mean EZCORP, Inc. and(collectively with its consolidated subsidiaries, collectively.
We arethe “Company”, “we”, “us” or “our”) is a leading provider of pawn loans in the United States and Latin America. Pawn loans are non-recourse loans collateralized by tangible property. We also sell merchandise, primarily collateral forfeited from pawn lending operations and usedpre-owned merchandise purchased from customers, and operate a small number of financial services stores in Canada.customers.
Basis of Presentation
The accompanying interim unaudited interim condensed consolidated financial statements (“Condensed Consolidated Financial Statements”) have been prepared in accordance with U.S. generally accepted accounting principles generally accepted in the United States (“U.S. GAAP”) for interim financial information and with the instructions to Form 10-Q and Article 1010-01 of Regulation S-X. Accordingly, they do not include all of the information and footnotes required by generally accepted accounting principles for complete financial statements. Our management has included all adjustments it considers necessary for a fair presentation which are of a normal, recurring nature. All intercompany accounts and transactions have been eliminated in consolidation.
The accompanying financial statementsThese Condensed Consolidated Financial Statements should be read in conjunction with the audited consolidated financial statements and related notes includedcontained in our the Company’s Annual Report on Form 10-K for the year ended September 30, 20192020, filed with the SEC on December 14, 2020 (“2020 Annual Report”).. The balance sheet asIn the opinion of management, the accompanying Condensed Consolidated Financial Statements include all adjustments, consisting of normal recurring adjustments, considered necessary for a fair presentation. Financial results for the three-month period ended December 31, 2020 are not necessarily indicative of results that may be expected for the fiscal year ending September 30, 2019 has been derived from the audited financial statements at that date but does not include all of the information and footnotes required by GAAP for complete financial statements.2021.
Our business is subject to seasonal variations, and operating results for the three months ended December 31, 20192020 and 20182019 (the "current quarter" and "prior-year quarter," respectively) are not necessarily indicative of the results of operations for the full fiscal year.
Principles of Consolidation
The accompanying condensed consolidated financial statements include the accounts of EZCORP, Inc., and its wholly owned subsidiaries. We use the equity method of accounting for entities in which we have a 50% or less investment and exercise significant influence. We account for equity investments for which we do not have significant influence and without readily determinable fair values at cost with adjustments for observable changes in price in orderly transactions for identical or similar investments of the same issuer or impairments. All inter-company accounts and transactions have been eliminated in consolidation.
Reclassifications
The Company has reclassified certain amounts in prior-period financial statements to conform to the current periods presentation.
Use of Estimates and Assumptions
The preparation of these financial statements in conformity with U.S. GAAP requires usmanagement to make estimates and assumptions that affect the reported amounts of assets and liabilities revenues and expenses and related disclosure of contingent assets and liabilities. On an ongoing basis, we evaluate ourliabilities at the date of the financial statements and the reported amounts of revenues and expenses during the reporting period. Such estimates and judgments, including those related toassumptions include the determination of revenue recognition, inventories, loan loss allowances,inventory reserves, expected credit losses, useful lives of long-lived and intangible assets, valuation of share-based compensation, income taxes, contingencies and litigation. We base our estimates on historical experience, observable trends and various other assumptions that we believe are reasonable under the circumstances. We use this information to make judgments about the carrying valuesvaluation of equity investments, valuation of deferred tax assets and liabilities, that are not readily apparent from other sources.loss contingencies related to litigation and discount rates used for operating leases. Actual results may result in actual amounts differing from reported amounts.
Impact of COVID-19
The COVID-19 pandemic continues to affect the U.S. and global economies, and as previously disclosed in our 2020 Annual Report, the pandemic also affected our businesses in a variety of ways beginning in the second quarter of fiscal 2020 and continuing into fiscal 2021. We cannot estimate the length or severity of the COVID-19 pandemic or the related financial consequences on our business and operations, including whether and when historic economic and operating conditions will resume or the extent to which the disruption may impact our
business, financial position, results of operations or cash flows. Our estimates, judgments and assumptions related to COVID-19 could ultimately differ materially from these estimates under different assumptions or conditions.
over time.
Recently Adopted Accounting Policies
In FebruaryJune 2016, the FASBFinancial Accounting Standards Board (“FASB”) issued ASU 2016-02, Leases (Topic 842). This Accounting Standards Update ("ASU"(“ASU”) requires companies2016-13, Financial Instruments — Credit Losses (Topic 326) (“ASU 2016-13”). ASU 2016-13 modifies the measurement of expected credit losses of certain financial instruments, requiring entities to generally recognizeestimate an expected lifetime credit loss on the balance sheet operating and financing lease liabilities and corresponding right-of-usefinancial assets. The provisions of this ASU areamends the impairment model to utilize an expected loss methodology and replaces the incurred loss methodology for financial instruments including trade receivables. The amendment requires entities to consider other factors, such as historical loss experience, current conditions and reasonable and supportable forecasts. ASU 2016-13 was effective as of the beginning of our fiscal 2020 on October 1, 2019. 2020.
We adopted this ASU 2016-13 effective October 1, 2020 using the optional prospective transition method provided under ASU 2018-11, Leases, (Topic 842): Targeted Improvementmodified retrospective approach. There was no net cumulative effect adjustment to retained earnings as of October 1, 2019. We additionally elected the package2020 as a result of practical expedients under Accounting Standards Codification (“ASC”) 842-10-65-1(f) as well as the practical expedientthis adoption. This amendment did not to separate lease and non-lease components for all real estate leases under ASC 842-10-15-37. Further, we have elected an accounting policy not to record right-of-use assets and lease liabilities for all leases which have a duration of less than 12-months. See Note 4 for additional discussion.material impact on our balance sheets or cash flows from operations and did not have a significant impact on our operating results.
Recently Issued Accounting Pronouncements
In June 2016,August 2020, the FASB issued ASU 2016-13, Financial2020-06, “Debt—Debt with Conversion and Other Options (Subtopic 470-20) and Derivatives and Hedging—Contracts in Entity’s Own Equity (Subtopic 815-40): Accounting for Convertible Instruments — Credit Losses (Topic 326): Measurement of Credit Losses on Financial Instruments. This and Contracts in an Entity’s Own Equity” (“ASU along with subsequently issued related ASUs, requires financial assets (or groups of financial assets) measured at amortized cost basis2020-06”), which simplifies accounting for convertible instruments by removing major separation models required under current U.S. GAAP. ASU 2020-06 removes certain settlement conditions that are required for equity contracts to be presented atqualify for the net amount expected to be
collected, among other provisions. Early adoptionderivative scope exception and it also simplifies the diluted earnings per share calculation in certain areas. ASU 2020-06 is permittedeffective for the Company for fiscal years beginning after December 15, 2018,2023, including interim periods within those fiscal years. A reporting entity should generally apply the amendment on a modified retrospective basis through a cumulative-effect adjustment to retained earningsEarly adoption is permitted, but no earlier than fiscal years beginning after December 15, 2020 and adoption must be as of the beginning of the first reporting period in which the amendment is effective.our annual fiscal year. We have not identified any impacts to our financial statements that we believe will be material as a result of the adoption of the ASU, although we continue to evaluateare currently evaluating the impact of adoption. this standard on our consolidated financial statements and related disclosures.
NOTE 2: EXPECTED CREDIT LOSSES
We believeadopted ASU 2016-13 effective October 1, 2020. The Company has financing receivables within the scope of ASU 2016-13, specifically pawn loans receivables and related pawn service charges receivables.
Our pawn loans are short-term in nature, typically 30-120 days for U.S. Pawn loans and 30 days for Latin America Pawn loans. Under our existing accounting policy, if a pawn loan is deemed to be uncollectible, we do not recognize an allowance for doubtful accounts due to the expected recovery of the loan principal amount through the sale of the collateral. We record the forfeited collateral as inventory at the pawn loan principal amount.
Pawn service charges are following an appropriate timelinerecorded under the interest method over the term of the related pawn loan. Under our existing accounting policy, we accrue for any earned but unpaid pawn service charges at the end each month. We then apply a reserve to allowpawn service charges receivable at the end of each month using a pawn loan forfeiture rate derived from a trailing twelve-month average, adjusted for proper recognition,seasonality factors.
We have evaluated, on a collective basis, our pawn loans receivables and pawn service charges receivables and determined the new credit loss standard will not have a material impact on our consolidated financial statements, as our current polices appropriately capture lifetime expected credit losses.
The presentation of pawn loans and disclosure upon adoptionpawn service charges receivable as separate line items on our consolidated balance sheet will remain unchanged under the new credit loss standard.
As of this ASU which is effectiveDecember 31, 2020, pawn loans and related pawn service charges receivable, net were $147.9 million and $24.8 million, respectively.
NOTE 3: OTHER CHARGES
During the fourth quarter of fiscal 2020, we began to implement strategic initiatives to refocus on our core pawn business and optimize our cost structure in order to improve our bottom line performance and position the Company for sustainable growth. The initiatives focused on workforce reductions, closure of our CASHMAX operations, store closures, write-offs and other miscellaneous charges. We recorded $20.4 million of such charges for the first quarter of our fiscal 2021.
| | | | | | | | | | | | | | | | | | | | | | | | | | |
| (in millions) | Accrued Charges at September 30, 2020 | | Charges | | Payments and Adjustments | | Accrued Charges at December 31, 2020 |
| Cash charges: | | | | | | | |
| Labor reduction costs | $ | 5.9 | | | $ | 0 | | | $ | (2.3) | | | $ | 3.6 | |
| CASHMAX shutdown costs | 0.8 | | | 0 | | | (0.4) | | | 0.4 | |
| Store closure costs | 1.8 | | | 0 | | | (1.8) | | | 0 | |
| Other | 2.2 | | | 0 | | | (0.1) | | | 2.1 | |
| | $ | 10.7 | | | $ | 0 | | | $ | (4.6) | | | $ | 6.1 | |
| | | | | | | |
| | | | | | | | |
| | | | | | | | |
| | | | | | | | |
| | | | | | | | |
| | | | | | | | |
NOTE 2: ACQUISITIONS
In June 2019, we acquired assets related to 7 pawn stores operating under the name "Metro Pawn" in Nevada, entering the Reno market and expanding our presence in the Las Vegas metropolitan area, for an aggregate purchase price of $7.0 million in cash, of which $3.9 million was recorded as goodwill. In December 2018, we acquired assets related to 5 pawn stores in Mexico for an aggregate purchase price of $0.3 million in cash, of which $0.1 million was recorded as goodwill. We expect substantially all goodwill attributable to the fiscal 2019 acquisitions to be deductible for tax purposes. We have concluded that these acquisitions were immaterial to our overall consolidated financial results and, therefore, have omitted information that would otherwise be required.
NOTE 3:4: EARNINGS PER SHARE
ComponentsThe following table reconciles the number of common shares used to compute basic and diluted earnings per share attributable to EZCORP Inc., shareholders:
| | | | | | | | | | | | | | | |
| Three Months Ended December 31, | | |
| (in thousands, except per share amounts) | 2020 | | 2019 | | | | |
| | | | | | | |
| | | | | | | |
| | | | | | | |
| Net income | $ | 4,299 | | | $ | 1,238 | | | | | |
| | | | | | | |
| Earnings per common share | | | | | | | |
| Average common share outstanding (denominator) | 55,361 | | | 55,666 | | | | |
| | | | | | | |
| | | | | | | |
| Earnings per common share | $ | 0.08 | | | $ | 0.02 | | | | | |
| | | | | | | |
| Diluted earnings per common share | | | | | | | |
| Average common share outstanding | 55,361 | | | 55,666 | | | | | |
| Dilutive effect of restricted stock and convertible notes* | 67 | | | 21 | | | | | |
| Diluted average common shares outstanding (denominator) | 55,428 | | | 55,687 | | | | | |
| | | | | | | |
| | | | | | | |
| | | | | | | |
| | | | | | | |
| Diluted earnings per common share | $ | 0.08 | | | $ | 0.02 | | | | | |
| | | | | | | |
| Potential common shares excluded from the calculation of diluted earnings per share above*: | | | | | | | |
| Restricted stock** | 657 | | 2,216 | | | | |
* Includes time-based share-based awards and excludedConvertible Notes. See Note 8 for discussion of the terms and conditions of the potential impact of the 2024 Convertible Notes and 2025 Convertible Notes.
** Includes antidilutive potential common sharesshare-based awards as well as performance-based share-based awards that are contingently issuable, but for which the condition for issuance has not been met as follows:of the end of the reporting period.
|
| | | | | | | |
| | Three Months Ended December 31, |
| | 2019 | | 2018 |
| | | | |
| | (in thousands, except per share amounts) |
| Net income (loss) from continuing operations attributable to EZCORP (A) | $ | 1,265 |
| | $ | (3,183 | ) |
| Loss from discontinued operations, net of tax (B) | (27 | ) | | (183 | ) |
| Net income (loss) attributable to EZCORP (C) | $ | 1,238 |
| | $ | (3,366 | ) |
| | | | |
| Weighted-average outstanding shares of common stock (D) | 55,666 |
| | 55,032 |
|
| Dilutive effect of restricted stock* | 21 |
| | — |
|
| Weighted-average common stock and common stock equivalents (E) | 55,687 |
|
| 55,032 |
|
| | | | |
| Basic earnings (loss) per share attributable to EZCORP: | | | |
| Continuing operations (A / D) | $ | 0.02 |
| | $ | (0.06 | ) |
| Discontinued operations (B / D) | — |
| | — |
|
| Basic earnings (loss) per share (C / D) | $ | 0.02 |
| | $ | (0.06 | ) |
| | | | |
| Diluted earnings (loss) per share attributable to EZCORP: | | | |
| Continuing operations (A / E) | $ | 0.02 |
| | $ | (0.06 | ) |
| Discontinued operations (B / E) | — |
| | — |
|
| Diluted earnings (loss) per share (C / E) | $ | 0.02 |
| | $ | (0.06 | ) |
| | | | |
| Potential common shares excluded from the calculation of diluted earnings per share above*: | | | |
| Restricted stock** | 2,216 |
| | 2,626 |
|
| |
* | See Note 7 for discussion of the terms and conditions of the potential impact of the 2019 Convertible Notes Warrants, 2024 Convertible Notes and 2025 Convertible Notes. As required by ASC 260-10-45-19, amount excludes all potential common shares for periods when there is a loss from continuing operations. |
| |
** | Includes antidilutive share-based awards as well as performance-based and market conditioned share-based awards that are contingently issuable, but for which the condition for issuance has not been met as of the end of the reporting period. |
NOTE 4:5: LEASES
As described in Note 1, we adopted ASU 2016-02, Leases (Topic 842) as of October 1, 2019. We lease our pawn locations and corporate offices under operating leases and determine if an arrangement is ora contract contains a lease at inception. After an initialOur lease termportfolio consists primarily of generally operating leases for pawn store locations and corporate offices with lease terms ranging from three to ten years, our real property lease agreements typically allow renewals in three to five-year increments. We generally account for the initial lease termyears.
The information below provides a summary of our pawn locations as up to ten years, including renewal options. Our corporate office is leased through March 2029 with annually escalating rent and includes 2 five-year extension options at the endleasing activities. See Note 12 in our 2020 Annual Report for additional information about our leasing activities.
The weighted-average remaining lease term for operating leases as of December 31, 2019 was 6.02 years. As our leases generally do not include an implicit rate, we compute our incremental borrowing rate based on information available at the lease commencement date applying the portfolio approach to groups of leases with similar characteristics. We used incremental borrowing rates that match the duration of the remaining lease termstable below presents balances of our operating leases on a fully collateralized basis upon adoption asleases:
| | | | | | | | | | | | | | | | | | | |
| (in thousands) | December 31, 2020 | | December 31, 2019 | | September 30, 2020 | | |
| | | | | | | |
| Right-of-use asset | $ | 177,308 | | | $ | 225,950 | | | $ | 183,809 | | | |
| | | | | | | |
| | | | | | | |
| | | | | | | |
| Lease liability, current | $ | 45,351 | | | $ | 48,052 | | | $ | 49,742 | | | |
| Lease liability, non-current | 143,620 | | | 186,352 | | | 153,040 | | | |
| Total lease liability | $ | 188,971 | | | $ | 234,404 | | | $ | 202,782 | | | |
The table below provides the composition of October 1, 2019 to initially measure our lease liability. The weighted average incremental borrowing rate used to measure our lease liability as of December 31, 2019 was 8.44%.costs:
The details of our right-of-use asset and lease liability recognized upon adoption of ASC 842 computed based on the consumer price index and foreign currency exchange rate as applicable then in effect and excluding executory costs on October 1, 2019 are as follows (in thousands): |
| | | |
| Right-of-use asset | $ | 246,028 |
|
| Straight-line rent accrual | (8,479 | ) |
| | $ | 237,549 |
|
| | |
| Lease liability, current | $ | 45,272 |
|
| Lease liability, non-current | 200,756 |
|
| | $ | 246,028 |
|
| | | | | | | | | | | | | | | |
| Three Months Ended December 31, | | |
| (in thousands) | 2020 | | 2019 | | | | |
| | | | | | | |
| Operating lease expense | $ | 15,199 | | | $ | 16,526 | | | | | |
| Variable lease expense | 3,045 | | | 2,807 | | | | | |
| | | | | | | |
| Total lease expense | $ | 18,244 | | | $ | 19,333 | | | | | |
| | | | | | | |
Lease expense is recognized on a straight-line basis over the lease term with variable lease expense recognized in the period in which the costs are incurred. The components of lease expense are included in "Operations""Store" and "Administrative""General and Administrative" expense, based on the underlying lease use, inuse.
Other supplemental information includes the following for our condensed consolidated statements of operations for the three months ended December 31, 2019 are as follows (in thousands):operating leases:
|
| | | |
| Operating lease expense | $ | 16,526 |
|
| Variable lease expense | 2,807 |
|
| | $ | 19,333 |
|
| | | | | | | | | | | |
| Three Months Ended December 31, |
| 2020 | | 2019 |
| | | |
Weighted-average remaining contractual lease term (years) | 5.06 | | 6.02 |
| Weighted-average incremental borrowing rate | 7.85 | % | | 8.44 | % |
| | | |
MaturityMaturities of our lease liabilities as of December 31, 2019 is as follows (in thousands): |
| | | |
| Nine months ending September 30, 2020 | $ | 47,822 |
|
| Fiscal 2021 | 58,922 |
|
| Fiscal 2022 | 49,943 |
|
| Fiscal 2023 | 40,548 |
|
| Fiscal 2024 | 31,309 |
|
| Thereafter | 73,695 |
|
| | $ | 302,239 |
|
| Less: Portion representing interest | (67,835 | ) |
| | $ | 234,404 |
|
Prior to our adoption of ASC 842, future minimum undiscounted rentals due under non-cancelable leases as of September 30, 2019 for each subsequent fiscal year2020 were as follows (in thousands):
|
| | | |
| 2020 | $ | 69,291 |
|
| 2021 | 60,588 |
|
| 2022 | 46,720 |
|
| 2023 | 32,062 |
|
| 2024 | 19,969 |
|
| Thereafter | 39,256 |
|
| | $ | 267,886 |
|
| | | | | |
| Remaining 2021 | $ | 45,013 | |
| Fiscal 2022 | 52,541 | |
| Fiscal 2023 | 40,417 | |
| Fiscal 2024 | 29,425 | |
| Fiscal 2025 | 20,329 | |
| Thereafter | 42,260 | |
| Total lease payments | $ | 229,985 | |
| Less: Portion representing interest | 41,014 | |
| Present value of operating lease liabilities | $ | 188,971 | |
| Less: Current portion | 45,351 | |
| Non-current portion | $ | 143,620 | |
We present the changesrecorded $1.6 million and $0.8 million in non-cash additions to our lease right-of-use assetright of use assets and lease liabilities gross in our condensed consolidated statements of cash flows. The supplemental cash flow information relating to our operating leases for the three monthsquarters ended December 31, 2020 and December 31, 2019, is as follows (in thousands):respectively.
|
| | | |
| Lease right-of-use assets obtained in exchange for operating lease liabilities subsequent to adoption of ASC 842 | $ | 748 |
|
NOTE 5:6: STRATEGIC INVESTMENTS
As of December 31, 2019,2020, we owned 214,183,714 shares, or approximately 34.75%, of Cash Converters International Limited ("Cash Converters International"). The following tables present summary financial information for Cash Converters International’s most recently reported results at June 30, 2020 after translation to U.S. dollars: |
| | | | | | | |
| | June 30, |
| | 2019 | | 2018 |
| | | | |
| | (in thousands) |
| Current assets | $ | 173,826 |
| | $ | 229,105 |
|
| Non-current assets | 152,483 |
| | 148,195 |
|
| Total assets | $ | 326,309 |
| | $ | 377,300 |
|
| | | | |
| Current liabilities | $ | 77,434 |
| | $ | 122,924 |
|
| Non-current liabilities | 26,163 |
| | 15,449 |
|
| Shareholders’ equity | 222,712 |
| | 238,927 |
|
| Total liabilities and shareholders’ equity | $ | 326,309 |
| | $ | 377,300 |
|
|
| | | | | | | |
| | Fiscal Year Ended June 30, |
| | 2019 | | 2018 |
| | | | |
| | (in thousands) |
| Gross revenues | $ | 201,365 |
| | $ | 201,800 |
|
| Gross profit | 111,932 |
| | 128,366 |
|
| Net (loss) profit | (1,210 | ) | | 17,443 |
|
On October 21, 2019, | | | | | | | | | | | |
| | June 30, |
| (in thousands) | 2020 | | 2019 |
| | | |
| Current assets | $ | 157,183 | | | $ | 173,826 | |
| Non-current assets | 172,833 | | | 152,483 | |
| Total assets | $ | 330,016 | | | $ | 326,309 | |
| | | |
| Current liabilities | $ | 68,028 | | | $ | 77,434 | |
| Non-current liabilities | 51,275 | | | 26,163 | |
| Shareholders’ equity | 210,713 | | | 222,712 | |
| Total liabilities and shareholders’ equity | $ | 330,016 | | | $ | 326,309 | |
| | | | | | | | | | | |
| | Fiscal Year Ended June 30, |
| (in thousands) | 2020 | | 2019 |
| | | |
| Gross revenues | $ | 187,025 | | | $ | 201,365 | |
| Gross profit | 112,511 | | | 111,932 | |
| Net loss | (7,032) | | | (1,210) | |
See Note 7 for the fair value and carrying value of our investment in Cash Converters International agreed to settle a class action lawsuit previously filed on behalf of borrowers residing in Queensland, Australia who took out personal loans from Cash Converters International between July 30, 2009 and June 30, 2013. Cash Converters International agreed to pay AUD $42.5 million, subject to court approval. We recorded a charge, net of tax, of $7.1 million for our proportionate share of the settlement in the current quarter related to this event, in addition to our regularly included share of earnings from Cash Converters International. Cash Converters International has indicated that it expects to pay the settlement amount with cash on hand and cash flow from operations.
NOTE 6:7: FAIR VALUE MEASUREMENTS
Our assetsThe fair value of a financial instrument is the amount that could be received upon the sale of an asset or paid to transfer a liability in an orderly transaction between market participants at the measurement date. The fair value hierarchy prioritizes the quality and liabilities discussed below are classified in onereliability of the information used to determine fair values. Categorization within the fair value hierarchy is based on the lowest level of input that is significant to the fair value measurement. The fair value hierarchy is defined into the following three categories based on the inputs used to develop their fair values: categories:
•Level 1 — Quoted market prices in active markets for identical assets or liabilities; liabilities.
•Level 2 — Other observable market-based inputs or unobservable inputs that are corroborated by market data; and data.
•Level 3 — Unobservable
inputs that are not corroborated by market data.
We have elected not to measure at fair value any eligible items for which fair value measurement is optional.
There were no transfers in or out of Level 1, Level 2 or Level 3 for financial assets or liabilities measured at fair value on a recurring basis during the periods presented.
Fair Value Measurement on a Recurring Basis
As of December 31, 2020 and September 30, 2020, we did not have any financial assets or liabilities measured at fair value on a recurring basis.
Financial Assets and Liabilities Not Measured at Fair Value
The tables below present our
estimates of fair value of financial assets and liabilities that were not measured at fair
value on a recurring basis: |
| | | | | | | | | | | | | | | | | | | | |
| | | Carrying Value | | Estimated Fair Value |
| | | December 31, 2019 | | December 31, 2019 | | Fair Value Measurement Using |
| | | Level 1 | | Level 2 | | Level 3 |
| | | | | | | | | | | |
| | | (in thousands) |
| Financial assets: | | | | | | | | | | |
| Notes receivable from Grupo Finmart, net | | $ | 7,450 |
| | $ | 7,729 |
| | $ | — |
| | $ | — |
| | $ | 7,729 |
|
| 2.89% promissory note receivable due April 2024 | | 1,124 |
| | 1,124 |
| | — |
| | — |
| | 1,124 |
|
| Investments in unconsolidated affiliates | | 29,272 |
| | 42,460 |
| | 34,555 |
| | — |
| | 7,905 |
|
| | | | | | | | | | | |
| Financial liabilities: | | | | | | | | | | |
| 2024 Convertible Notes | | $ | 112,740 |
| | $ | 136,634 |
| | $ | — |
| | $ | 136,634 |
| | $ | — |
|
| 2025 Convertible Notes | | 127,902 |
| | 136,965 |
| | — |
| | 136,965 |
| | — |
|
| 8.5% unsecured debt due 2024 | | 1,042 |
| | 1,042 |
| | — |
| | — |
| | 1,042 |
|
| CASHMAX secured borrowing facility | | (260 | ) | | 404 |
| | — |
| | — |
| | 404 |
|
| | | | | | | | | | | | | | Carrying Value | | Estimated Fair Value |
| | | Carrying Value | | Estimated Fair Value | | | December 31, 2020 | | December 31, 2020 | | Fair Value Measurement Using |
| | | December 31, 2018 | | December 31, 2018 | | Fair Value Measurement Using | |
| | | Level 1 | | Level 2 | | Level 3 | |
| | | | | | | | | | | | |
| (in thousands) | | (in thousands) | | December 31, 2020 | | December 31, 2020 | | Level 1 | | Level 2 | | Level 3 |
| | | (in thousands) | | | | | | |
| Financial assets: | | | | | | | | | | | Financial assets: | |
| Notes receivable from Grupo Finmart, net | | $ | 31,310 |
| | $ | 33,710 |
| | $ | — |
| | $ | — |
| | $ | 33,710 |
| |
| 2.89% promissory note receivable due April 2024 | | 2.89% promissory note receivable due April 2024 | | $ | 1,156 | | | $ | 1,156 | | | $ | 0 | | | $ | 0 | | | $ | 1,156 | |
| Investments in unconsolidated affiliates | | 35,511 |
| | 35,511 |
| | 35,511 |
| | — |
| | — |
| Investments in unconsolidated affiliates | | 31,773 | | | 44,716 | | | 37,039 | | | 0 | | | 7,677 | |
| | | | | | | | | | | | |
| Financial liabilities: | | | | | | | | | | | Financial liabilities: | |
| 2019 Convertible Notes | | $ | 190,076 |
| | $ | 190,613 |
| | $ | — |
| | $ | 190,613 |
| | $ | — |
| |
| 2024 Convertible Notes | | 107,182 |
| | 145,202 |
| | — |
| | 145,202 |
| | — |
| 2024 Convertible Notes | | $ | 118,736 | | | $ | 134,838 | | | $ | 0 | | | $ | 134,838 | | | $ | 0 | |
| 2025 Convertible Notes | | 121,316 |
| | 134,447 |
| | — |
| | 134,447 |
| | — |
| 2025 Convertible Notes | | 134,983 | | | 138,000 | | | 0 | | | 138,000 | | | 0 | |
| 8.5% unsecured debt due 2024 | | 1,237 |
| | 1,237 |
| | — |
| | — |
| | 1,237 |
| 8.5% unsecured debt due 2024 | | 816 | | | 816 | | | 0 | | | 0 | | | 816 | |
| CASHMAX secured borrowing facility | | 334 |
| | 1,160 |
| | — |
| | — |
| | 1,160 |
| |
|
| | | | | | | | | | | | | | | | | | | | |
| | | Carrying Value | | Estimated Fair Value |
| | | September 30, 2019 | | September 30, 2019 | | Fair Value Measurement Using |
| | | Level 1 | | Level 2 | | Level 3 |
| | | | | | | | | | | |
| | | (in thousands) |
| Financial assets: | | | | | | | | | | |
| Notes receivable from Grupo Finmart, net | | $ | 7,182 |
| | $ | 7,582 |
| | $ | — |
| | $ | — |
| | $ | 7,582 |
|
| 2.89% promissory note receivable due April 2024 | | 1,117 |
| | 1,117 |
| | — |
| | — |
| | 1,117 |
|
| Investments in unconsolidated affiliates | | 34,516 |
| | 28,308 |
| | 20,252 |
| | — |
| | 8,056 |
|
| | | | | | | | | | | |
| Financial liabilities: | | | | | | | | | | |
| 2024 Convertible Notes | | $ | 111,311 |
| | $ | 139,969 |
| | $ | — |
| | $ | 139,969 |
| | $ | — |
|
| 2025 Convertible Notes | | 126,210 |
| | 138,345 |
| | — |
| | 138,345 |
| | — |
|
| 8.5% unsecured debt due 2024 | | 1,092 |
| | 1,092 |
| | — |
| | — |
| | 1,092 |
|
| CASHMAX secured borrowing facility | | (19 | ) | | 634 |
| | — |
| | — |
| | 634 |
|
| | | | | | | | | | | | | | | | | | | | | | | | | | | | | | | | |
| | Carrying Value | | Estimated Fair Value |
| | | December 31, 2019 | | December 31, 2019 | | Fair Value Measurement Using |
| (in thousands) | | Level 1 | | Level 2 | | Level 3 |
| | | | | | | | | | |
| Financial assets: | | | | | | | | | | |
| Notes receivable from Grupo Finmart, net | | $ | 7,450 | | | $ | 7,729 | | | $ | 0 | | | $ | 0 | | | $ | 7,729 | |
| 2.89% promissory note receivable due April 2024 | | 1,124 | | | 1,124 | | | 0 | | | 0 | | | 1,124 | |
| Investments in unconsolidated affiliates | | 29,272 | | | 42,460 | | | 34,555 | | | 0 | | | 7,905 | |
| | | | | | | | | | |
| Financial liabilities: | | | | | | | | | | |
| 2024 Convertible Notes | | $ | 112,740 | | | $ | 136,634 | | | $ | 0 | | | $ | 136,634 | | | $ | 0 | |
| 2025 Convertible Notes | | 127,902 | | | 136,965 | | | 0 | | | 136,965 | | | 0 | |
| 8.5% unsecured debt due 2024 | | 1,042 | | | 1,042 | | | 0 | | | 0 | | | 1,042 | |
| CASHMAX secured borrowing facility | | (260) | | | 404 | | | 0 | | | 0 | | | 404 | |
| | | | | | | | | | | | | | | | | | | | | | | | | | | | | | | | |
| | Carrying Value | | Estimated Fair Value |
| | | September 30, 2020 | | September 30, 2020 | | Fair Value Measurement Using |
| (in thousands) | | Level 1 | | Level 2 | | Level 3 |
| | | | | | | | | | |
| Financial assets: | | | | | | | | | | |
| 2.89% promissory note receivable due April 2024 | | $ | 1,148 | | | $ | 1,148 | | | $ | 0 | | | $ | 0 | | | $ | 1,148 | |
| Investments in unconsolidated affiliates | | 32,458 | | | 32,597 | | | 24,833 | | | 0 | | | 7,764 | |
| | | | | | | | | | |
| Financial liabilities: | | | | | | | | | | |
| 2024 Convertible Notes | | $ | 117,193 | | | $ | 129,979 | | | $ | 0 | | | $ | 129,979 | | | $ | 0 | |
| 2025 Convertible Notes | | 133,164 | | | 137,569 | | | 0 | | | 137,569 | | | 0 | |
| 8.5% unsecured debt due 2024 | | 872 | | | 872 | | | 0 | | | 0 | | | 872 | |
We estimate thatDue to the carrying valueshort-term nature of our cash and cash equivalents, pawn loans, pawn service charges receivable current consumer loans, fees and interest receivable and other debt, approximatewe estimate that the carrying value approximates fair value. We consider our cash and cash equivalents to be measured using Level 1 inputs and our pawn loans, pawn service charges receivable, consumer loans, fees and interest receivable and other debt to be measured using Level 3 inputs. Significant increases or decreases in the underlying assumptions used to value pawn loans, pawn service charges receivable, consumer loans, fees and interest receivable and other debt could significantly increase or decrease these fair value estimates.
In March 2019, we received $1.1 million in previously escrowed seller funds as a result of settling certain indemnification claims with the seller of GPMX. In April 2019, we loaned the $1.1 million back to the seller of GPMX in exchange for a promissory note. The note bears interest at the rate of 2.89% per annum and is secured by certain marketable securities owned by the seller and held in a U.S. brokerage account. All principal and accrued interest is due and payable in April 2024. The note approximated its carrying value as of December 31, 2020.
We measureduse the equity method of accounting to account for our 34.75% ownership in Cash Converters International.The inputs used to generate the fair value of the remaining deferred compensation fee due in fiscal 2020 frominvestment were considered Level 1 inputs. These inputs are comprised of (a) the salequoted stock price on the Australian
Stock Exchange multiplied by (b) the number of shares we owned multiplied by (c) the applicable foreign currency exchange rate as of December 31, 2019 underthe end of our reporting period. We included no control premium for owning a discounted cash flow approach consideringlarge percentage of outstanding shares.
We use the estimated credit ratings for Grupo Finmart and AlphaCredit, with discount rates of primarily 7%. Certain of the significant inputs used for the valuation were not observable in the market. Significant increases or decreases in the underlying assumptions used to value the notes receivable could significantly increase or decrease these fair value estimates. We remain obligated to indemnify AlphaCredit for any tax obligations arising from the Grupo Finmart business that are attributable to periods prior to the completion of the sale in September 2016, referred to as “pre-closing taxes.” Those obligations continue until the expiration of the statute of limitations applicable to the pre-closing periods. In August 2019, AlphaCredit notified us of a potential indemnity claim for certain pre-closing taxes, but the nature, extent and validity of such claim has yet to be determined. We review the financial statements of Grupo Finmart and AlphaCredit including the calculation of synthetic credit spreads as described above in making our determination that the Parent Loan Notes are collectible on an ongoing basis.
The equity method of accounting is followedto account for our 13% 13.14% ownership in Rich Data Corporation, a previously consolidated variable interest entity ("RDC") overfor which we no longer have the power to direct the activities that most significantly affect its economic performance. We believe that its fair value approximates carrying value although such fair value is highly variable and includes significant unobservable inputs.
We measured the fair value of the 2024 and 2025 Convertible Notes using quoted price inputs. The notes are not actively traded, and thus the price inputs represent a Level 2 measurement. As the quoted price inputs are highly variable from day to day, the fair value estimates disclosed above could significantly increase or decrease.
NOTE 7: DEBT
The following tables present our debt instruments outstanding, contractual maturitiesIn September 2020, we received the final payment from AlphaCredit on the notes receivable related to the sale of Grupo Finmart and interest expense: |
| | | | | | | | | | | | | | | | | | | | | | | | | | | | | | | | | | | |
| | December 31, 2019 | | December 31, 2018 | | September 30, 2019 |
| | Gross Amount | | Debt Discount and Issuance Costs | | Carrying Amount | | Gross Amount | | Debt Discount and Issuance Costs | | Carrying Amount | | Gross Amount | | Debt Discount and Issuance Costs | | Carrying Amount |
| | | | | | | | | | | | | | | | | | |
| | (in thousands) |
| 2019 Convertible Notes | $ | — |
| | $ | — |
| | $ | — |
| | $ | 195,000 |
| | $ | (4,924 | ) | | $ | 190,076 |
| | $ | — |
| | $ | — |
| | $ | — |
|
| 2019 Convertible Notes Embedded Derivative | — |
| | — |
| | — |
| | 21 |
| | — |
| | 21 |
| | — |
| | — |
| | — |
|
| 2024 Convertible Notes | 143,750 |
| | (31,010 | ) | | 112,740 |
| | 143,750 |
| | (36,568 | ) | | 107,182 |
| | 143,750 |
| | (32,439 | ) | | 111,311 |
|
| 2025 Convertible Notes | 172,500 |
| | (44,598 | ) | | 127,902 |
| | 172,500 |
| | (51,184 | ) | | 121,316 |
| | 172,500 |
| | (46,290 | ) | | 126,210 |
|
| 8.5% unsecured debt due 2024* | 1,042 |
| | — |
| | 1,042 |
| | 1,237 |
| | — |
| | 1,237 |
| | 1,092 |
| | — |
| | 1,092 |
|
| CASHMAX secured borrowing facility* | 404 |
| | (664 | ) | | (260 | ) | | 1,160 |
| | (826 | ) | | 334 |
| | 634 |
| | (653 | ) | | (19 | ) |
| Total | $ | 317,696 |
| | $ | (76,272 | ) | | $ | 241,424 |
| | $ | 513,668 |
| | $ | (93,502 | ) | | $ | 420,166 |
| | $ | 317,976 |
| | $ | (79,382 | ) | | $ | 238,594 |
|
| Less current portion | 215 |
| | — |
| | 215 |
| | 195,162 |
| | (4,924 | ) | | 190,238 |
| | 214 |
| | — |
| | 214 |
|
| Total long-term debt | $ | 317,481 |
| | $ | (76,272 | ) | | $ | 241,209 |
| | $ | 318,506 |
| | $ | (88,578 | ) | | $ | 229,928 |
| | $ | 317,762 |
| | $ | (79,382 | ) | | $ | 238,380 |
|
|
| |
* | Amount translated from Guatemalan quetzals and Canadian dollars as of applicable period end. Certain disclosures omitted due to materiality considerations. |
|
| | | | | | | | | | | | | | | | | | | |
| | Schedule of Contractual Maturities |
| | Total | | Less Than 1 Year | | 1 - 3 Years | | 3 - 5 Years | | More Than 5 Years |
| | | | | | | | | | |
| | (in thousands) |
| 2024 Convertible Notes* | 143,750 |
| | — |
| | — |
| | 143,750 |
| | — |
|
| 2025 Convertible Notes* | 172,500 |
| | — |
| | — |
| | 172,500 |
| | — |
|
| 8.5% unsecured debt due 2024 | 1,042 |
| | 215 |
| | 431 |
| | 396 |
| | — |
|
| CASHMAX secured borrowing facility | 404 |
| | — |
| | 404 |
| | — |
| | — |
|
| | $ | 317,696 |
| | $ | 215 |
| | $ | 835 |
| | $ | 316,646 |
| | $ | — |
|
|
| |
* | Excludesrecorded the potential impact of embedded derivatives. |
|
| | | | | | | |
| | Three Months Ended December 31, |
| | 2019 | | 2018 |
| | | | |
| | (in thousands) |
| 2019 Convertible Notes: | | | |
| Contractual interest expense | $ | — |
| | $ | 1,076 |
|
| Amortization of debt discount and deferred financing costs | — |
| | 2,643 |
|
| Total interest expense | $ | — |
| | $ | 3,719 |
|
| | | | |
| 2024 Convertible Notes: | | | |
| Contractual interest expense | $ | 1,033 |
| | $ | 1,033 |
|
| Amortization of debt discount and deferred financing costs | 1,429 |
| | 1,325 |
|
| Total interest expense | $ | 2,462 |
| | $ | 2,358 |
|
| | | | |
| 2025 Convertible Notes: | | | |
| Contractual interest expense | $ | 1,024 |
| | $ | 1,024 |
|
| Amortization of debt discount and deferred financing costs | 1,691 |
| | 1,573 |
|
| Total interest expense | $ | 2,715 |
| | $ | 2,597 |
|
2.375% Convertible Senior Notes Due 2025
In May 2018, we issued $172.5 million aggregate principal amount of 2.375% Convertible Senior Notes Due 2025 (the “2025 Convertible Notes”). The 2025 Convertible Notes were issued pursuant to an indenture dated May 14, 2018 (the "2018 Indenture") by and between us and Wells Fargo Bank, National Association, as the original trustee. The 2025 Convertible Notes were issued in a private offering under Rule 144A under the Securities Act of 1933. The 2025 Convertible Notes pay interest semi-annually in arrears at a rate of 2.375% per annum on May 1 and November 1 of each year, commencing November 1, 2018, and mature on May 1, 2025 (the "2025 Maturity Date"), unless converted, redeemed or repurchased in accordance with their terms prior to such date. The carrying amount of the 2025 Convertible Notes as a separate equity-classified instrument (the “2025 Convertible Notes Embedded Derivative”) included in “Additional paid-in capital”“Restricted cash” in our condensed consolidated balance sheetssheet as of December 31, 2020. In August 2019, was $39.0 million. AlphaCredit notified us of an indemnity claim for certain pre-closing taxes, but the nature, extent and validity of such claim has yet to be determined.
NOTE 8: DEBT
The effectivefollowing table presents the Company's debt instruments outstanding:
| | | | | | | | | | | | | | | | | | | | | | | | | | | | | | | | | | | | | | | | | | | | | | | | | | | | | |
| | December 31, 2020 | | December 31, 2019 | | September 30, 2020 |
| (in thousands) | Gross Amount | | Debt Discount and Issuance Costs | | Carrying Amount | | Gross Amount | | Debt Discount and Issuance Costs | | Carrying Amount | | Gross Amount | | Debt Discount and Issuance Costs | | Carrying Amount |
| | | | | | | | | | | | | | | | | |
| 2024 Convertible Notes | $ | 143,750 | | | $ | (25,014) | | | $ | 118,736 | | | $ | 143,750 | | | $ | (31,010) | | | $ | 112,740 | | | $ | 143,750 | | | $ | (26,557) | | | $ | 117,193 | |
| 2025 Convertible Notes | 172,500 | | | (37,517) | | | 134,983 | | | 172,500 | | | (44,598) | | | 127,902 | | | 172,500 | | | (39,336) | | | 133,164 | |
| 8.5% unsecured debt due 2024* | 816 | | | 0 | | | 816 | | | 1,042 | | | 0 | | | 1,042 | | | 872 | | | 0 | | | 872 | |
| CASHMAX secured borrowing facility* | 0 | | | 0 | | | 0 | | | 404 | | | (664) | | | (260) | | | 0 | | | 0 | | | 0 | |
| Total | $ | 317,066 | | | $ | (62,531) | | | $ | 254,535 | | | $ | 317,696 | | | $ | (76,272) | | | $ | 241,424 | | | $ | 317,122 | | | $ | (65,893) | | | $ | 251,229 | |
| Less current portion | 213 | | | 0 | | | 213 | | | 215 | | | 0 | | | 215 | | | 213 | | | 0 | | | 213 | |
| Total long-term debt | $ | 316,853 | | | $ | (62,531) | | | $ | 254,322 | | | $ | 317,481 | | | $ | (76,272) | | | $ | 241,209 | | | $ | 316,909 | | | $ | (65,893) | | | $ | 251,016 | |
* Amount translated from Guatemalan quetzals and Canadian dollars as of applicable period end. Certain disclosures omitted due to materiality considerations.
The following table presents the Company's contractual maturities related to the debt instruments as of December 31, 2020:
| | | | | | | | | | | | | | | | | | | | | | | | | | | | | |
| | Schedule of Contractual Maturities |
| (in thousands) | Total | | Less Than 1 Year | | 1 - 3 Years | | 3 - 5 Years | | More Than 5 Years |
| | | | | | | | | |
| 2024 Convertible Notes* | $ | 143,750 | | | $ | — | | | $ | 0 | | | $ | 143,750 | | | $ | 0 | |
| 2025 Convertible Notes* | 172,500 | | | 0 | | | 0 | | | 172,500 | | | 0 | |
| 8.5% unsecured debt due 2024 | 816 | | | 213 | | | 425 | | | 178 | | | 0 | |
| $ | 317,066 | | | $ | 213 | | | $ | 425 | | | $ | 316,428 | | | $ | 0 | |
* Excludes the potential impact of embedded derivatives as discussed below.
The following table presents the Company's interest rateexpense related to the Convertible Notes for the three months ended December 31, 2019 was approximately 9%. As of December 31, 2019, the remaining unamortized debt discount2020 and issuance costs will be amortized through the 2025 Maturity Date assuming no early conversion.2019:
The 2025 Convertible Notes are convertible into cash or shares of Class A Non-voting Common Stock ("Class A Common Stock"), or any combination thereof, at our option subject to satisfaction of certain conditions and during the periods described in the 2018 Indenture, based on an initial conversion rate of 62.8931 shares of Class A Common Stock per $1,000 principal amount of 2025 Convertible Notes (equivalent to an initial conversion price of $15.90 per share of our Class A Common Stock). We account for the Class A Common Stock issuable upon conversion under the treasury stock method. To the extent our average share price is over $15.90 per share for any fiscal quarter or year-to-date period, we are required to recognize incremental dilution of our earnings per share.
If, among other triggers described in the 2018 Indenture, the market price of our Class A Common Stock meets the threshold based on at least 20 of the final 30 trading days of the quarter for the 2025 Convertible Notes to become convertible at the option of the holders during the subsequent quarter, we may be required to classify the 2025 Convertible Notes as current on our condensed consolidated balance sheets for each quarter in which such triggers are met. The stock trading price condition
and other triggers are measured on a quarter-by-quarter basis and were not met as of December 31, 2019. As of December 31, 2019, the if-converted value of the 2025 Convertible Notes did not exceed the principal amount. | | | | | | | | | | | | | | | |
| Three Months Ended December 31, | | |
| (in thousands) | 2020 | | 2019 | | | | |
| | | | | | | |
| 2024 Convertible Notes: | | | | | | | |
| Contractual interest expense | $ | 1,033 | | | $ | 1,033 | | | | | |
| Amortization of debt discount and deferred financing costs | 1,542 | | | 1,429 | | | | | |
| Total interest expense | $ | 2,575 | | | $ | 2,462 | | | | | |
| | | | | | | |
| 2025 Convertible Notes: | | | | | | | |
| Contractual interest expense | $ | 1,024 | | | $ | 1,024 | | | | | |
| Amortization of debt discount and deferred financing costs | 1,819 | | | 1,691 | | | | | |
| Total interest expense | $ | 2,843 | | | $ | 2,715 | | | | | |
2.875% Convertible Senior Notes Due 2024
In July 2017, we issued $143.75 million aggregate principal amount of 2.875% Convertible Senior Notes Due 2024 (the “2024 Convertible Notes”). The 2024 Convertible Notes were issued pursuant to an indenture dated July 5, 2017 (the "2017 Indenture") by and between usthe Company and Wells Fargo Bank, National Association, as the original trustee. Effective October 1, 2019, Truist (formerly BB&T) assumed the duties and responsibilities as trustee under the 2017 Indenture. The 2024 Convertible Notes were issued in a private offering under Rule 144A under the Securities Act of 1933. The 2024 Convertible Notes pay interest semi-annually in arrears at a rate of 2.875% per annum on January 1 and July 1 of each year, commencing January 1, 2018, and mature on July 1, 2024 (the "2024 Maturity Date"), unless converted, redeemed or repurchased in accordance with theirthe terms prior to such date. At maturity, the holders of the 2024 Convertible Notes will be entitled to receive cash equal to the principal of the 2024 Convertible Notes plus accrued interest.
The carrying amount of the 2024 Convertible Notes as a separate equity-classified instrument (the “2024 Convertible Notes Embedded Derivative”) included in “Additional paid-in capital” in our condensed consolidated balance sheets as of December 31, 20192020 was $25.3 million.$39.8 million, ($25.3 million, net of tax). The effective interest rate for the three months ended December 31, 20192020 was approximately 9%. As of December 31, 2019,2020, the remaining unamortized debt discount and issuance costs will be amortized through the 2024 Maturity Date assuming no early conversion.
The 2024 Convertible Notes are convertible into cash or shares of Class A Common Stock, or any combination thereof, at our option subject to satisfaction of certain conditions and during the periods described in the 2017 Indenture, based on an initial conversion rate of 100 shares of Class A Common Stock per $1,000 principal amount of 2024 Convertible Notes (equivalent to an initial conversion price of $10.00 per share of our Class A Common Stock). We account for the Class A Common Stock issuable upon conversion under the treasury stock method. To the extent ourthe average share price is over $10.00 per share for any fiscal quarter, we are required to recognize incremental dilution of our earnings per share.
If, among other triggers described in the 2017 Indenture, the market price of ourthe Class A Common Stock meets the threshold based on at least 20 of the final 30 trading days of the quarter for the 2024 Convertible Notes to become convertible at the option of the holders during the subsequent quarter, we may be required to classify the 2024 Convertible Notes as current on our condensed consolidated balance sheets for each quarter in which such triggers are met. The stock trading price condition and other triggers are measured on a quarter-by-quarter basis and were not met as of December 31, 2019.2020. As of December 31, 2019,2020, the if-converted value of the 2024 Convertible Notes did not exceed the principal amount.
2.125% Cash2.375% 2025 Convertible Senior Notes Due 20192025
In June 2014,May 2018, we issued $200$172.5 million aggregate principal amount of 2.125% Cash2.375% Convertible Senior Notes Due 20192025 (the "2019“2025 Convertible Notes"Notes”), with an additional $30 million principal amount of 2019. The 2025 Convertible Notes were issued pursuant to an indenture dated May 14, 2018 (the "2018 Indenture") by and between the Company and Wells Fargo Bank, National Association, as the original trustee. Effective October 1, 2019, Truist (formerly BB&T) assumed the duties and responsibilities as trustee under the 2018 Indenture. The 2025 Convertible Notes were issued in July 2014. In July 2017, we used $34.4 milliona private offering under Rule 144A under the Securities Act of net proceeds from the 20241933. The 2025 Convertible Notes offering to repurchase and retire $35.0 million aggregate principal amount of 2019 Convertible Notes. The 2019 Convertible Notes paidpay interest semi-annually in arrears at a rate of 2.125%2.375% per annum on June 15May 1 and December 15November 1 of each year.year, commencing November 1, 2018, and mature on May 1, 2025 (the "2025 Maturity Date"), unless converted, redeemed or repurchased in accordance with the terms prior to such date. The 2019carrying amount of the 2025 Convertible Notes matured on June 15, 2019as a separate equity-classified instrument (the "2019 Maturity Date"“2025 Convertible Notes Embedded Derivative”), and included in “Additional paid-in capital” in our condensed consolidated balance sheets as of December 31, 2020 was $49.6 million, ($39.1 million, net of tax). The effective interest rate for the three months ended December 31, 2020 was approximately 9%. As of December 31, 2020, the remaining $195.0 million aggregate principal amount outstanding plus accrued interest was repaid using cash on hand.unamortized debt discount and issuance costs will be amortized through the 2025 Maturity Date assuming no early conversion.
2019The 2025 Convertible Notes Warrants
In connection with the issuance of the 2019 Convertible Notes, we also sold net-share-settled warrants (the “2019 Convertible Notes Warrants”). The 2019 Convertible Notes Warrants allow for the purchase of up to approximately 14.3 millionare convertible into cash or shares of our Class A Common Stock, or any combination thereof, at a strikeour option subject to satisfaction of certain conditions and during the periods described in the 2018 Indenture, based on an initial conversion rate of 62.8931 shares of Class A Common Stock per $1,000 principal amount of 2025 Convertible Notes (equivalent to an initial conversion price of $20.83$15.90 per share.share of Class A Common Stock). We account for the Class A Common Stock issuable upon exerciseconversion under the treasury stock method. As a result ofTo the 2019 Convertible Notes Warrants, we will experience dilution to our diluted earningsextent the average share price is over $15.90 per share if our average closing stock price exceeds $20.83 for any fiscal quarter before expiration of the warrants. The unexpired 2019 Convertible Notes Warrants expire on various dates from January 2020 through April 2020 and, if exercised, must be settled in net sharesor year-to-date period, we are required to recognize incremental dilution of our Class A Common Stock. Therefore, upon expiration ofearnings per share.
If, among other triggers described in the 2019 Convertible Notes Warrants, we would issue shares of Class A Common Stock to2018 Indenture, the purchasers of the 2019 Convertible Notes Warrants that represent the value by which themarket price of the Class A Common Stock exceedsmeets the strikethreshold based on at least 20 of the final 30 trading days of the quarter for the 2025 Convertible Notes to become convertible at the option of the holders during the subsequent quarter, we may be required to classify the 2025 Convertible Notes as current on our condensed consolidated balance sheets for each quarter in which such triggers are met. The stock trading price stipulated within the particular warrant agreement, if any.condition and other triggers are measured on a quarter-by-quarter basis and were not met as of December 31, 2020. As of December 31, 2019, there were a maximum2020, the if-converted value of 5.0 million shares of Class A Common Stock issuable under the 20192025 Convertible Notes Warrants outstanding.did not exceed the principal amount.
CASHMAX CASHMAX Secured Borrowing Facility
In November 2018, we entered into a receivablesreceivable's securitization facility with a third-party lender (the "lender") to provide funding for installment loan originations in our Canadian CASHMAX business. UnderWe terminated this facility in September 2020 as part of the closure of the operations of our CASHMAX business. See our 2020 Annual Report for additional information regarding the closure of our Canadian operations.
Prior to the termination of the facility, a variable interest entity (the "trust") hashad the right, subject to various conditions, to borrow up to CAD $25 million from the lender (the "third-party loan") and use the proceeds to purchase interests in installment loan receivables generated by CASHMAX. The trust usesused collections on the transferred receivables to pay various amounts in accordance with an agreed priority arrangement, including expenses, its obligations under the third-party loan and, to the extent available, amounts owned to CASHMAX with respect to the purchase price of the transferred receivables and CASHMAX's retained interest in the receivables. CASHMAX hashad no obligation with respect to the third-party loan or the transferred receivables except to (a) service the underlying installment loans on behalf of the trust and (b) pay amounts owingowed under or repurchase the underlying installment loans in the event of a breach by CASHMAX or in certain other limited circumstances. The facility iswas nonrecourse to EZCORP (subject to certain limited guaranty obligations), allowed borrowing through November 2019, and was to fully maturesmature in November 2021. Our obligation under the facility as of December 31, 2019 was $0.4 million.
NOTE 8: COMMON STOCK AND STOCK9: SHARE-BASED COMPENSATION
Common Stock Repurchase Program
In December 2019, ourthe Company's Board of Directors (the "Board") authorized the repurchase of up to $60.0 million of our Class A Common Stock over three years. Repurchases under the program were suspended in March 2020 in order to preserve liquidity as a result of uncertainties related to the COVID-19 pandemic. NaN share repurchases under the program were made during the first quarter of fiscal 2021. During the current quarter,fiscal 2020, we repurchased and retired 142,409943,149 shares of our Class A Common Stock for $963,000,$5.2 million, which amount was allocated between "Additional paid-in capital" and "Retained earnings" in our condensed consolidated balance sheets.
Stock Compensation
AsWe maintain a Board-approved incentive plan to retain the services of September 30, 2019,our valued officers, directors and employees and to incentivize such persons to make contributions to our company and motivate excellent performance (the "Incentive Plan"). Under the EZCORP, Inc. 2010 Long-Term Incentive Plan, which has been approved by our Boardwe grant awards of Directors, permitted grants of options, restricted stock or restricted stock units to employees and non-employee directors. Awards granted to employees are typically subject to performance and service conditions. Awards granted to non-employee directors are time-based awards and stock appreciation rights covering upsubject only to 5,485,649 sharesservice conditions. Awards granted under the Incentive Plan are measured at the grant date fair value with compensation costs associated with the awards recognized over the requisite service period, usually the vesting period, on a straight-line basis.
During the first quarter of our Class A Common Stock.
In the current quarter,fiscal 2021, we granted a total of 222,912143,145 restricted stock awards to our 9 non-employee directors. These awards vest on September 30, 2020March 31, 2021 and are subject only to service conditions.
The number of long-term incentive award shares and units granted are generally determined based on our share price as of the beginning of the fiscal year, which was $6.46$5.03 for fiscal 20202021 awards.
During the first quarter of fiscal 2020, we granted a total of 222,912 shares of restricted stock awards to non-employee directors based on a share price of $6.46. These awards vested on September 30, 2020.
NOTE 9:10: INCOME TAXES
On March 27, 2020, the Coronavirus Aid, Relief, and Economic Security (CARES) Act was signed into law and includes certain income tax provisions relevant to businesses. We recognized the effect on the consolidated financial statements in the period ended March 31, 2020. For the period ended December 31, 2020, the CARES Act has not had a material impact on our consolidated financial statements. At this time,
we do not expect the impact of the CARES Act to have a material impact on our consolidated financial statements for the year ending September 30, 2021.
NOTE 11: COMMITMENTS AND CONTINGENCIES
Currently, and from time to time, we are involved in various claims, suits,disputes, lawsuits, investigations, and legal proceedings, includingand regulatory proceedings. We accrue for contingencies if it is probable that a liability has been incurred and the lawsuit described below. amount of the loss can be reasonably estimated. Because these matters are inherently unpredictable and unfavorable developments or resolutions can occur, assessing contingencies requires judgments and is highly subjective about future events. The amount of resulting loss may differ from these estimates.
While we are unable to determine the ultimate outcome of any current litigation or regulatory actions, (except as noted below), we do not believe theirthe resolution of any particular matter will not have a material adverse effect on our financial condition, results of operations or liquidity.
Federal Securities Litigation — In July 2015 and August 2015, 2 substantially identical lawsuits were filed in the United States District Court for the Western District of Texas. Those lawsuits were subsequently consolidated into a single action under the caption In re EZCORP, Inc. Securities Litigation (Master File No. 1:15-cv-00608-SS). The original complaint related to the Company’s announcement on July 17, 2015 that it will restate its financial statements for fiscal 2014 and the first quarter of fiscal 2015, and alleged generally that the Company issued materially false or misleading statements concerning the Company, its finances, business operations and prospects and that the Company misrepresented the financial performance of the Grupo Finmart business.
In January 2016, the plaintiffs filed an Amended Class Action Complaint (the "Amended Complaint"), which asserted that the Company and Mark E. Kuchenrither, our former Chief Financial Officer, violated Section 10(b) of the Securities Exchange Act and Rule 10b-5, issued materially false or misleading statements concerning the Company and its internal controls, specifically regarding the financial performance of Grupo Finmart. The plaintiffs also allege that Mr. Kuchenrither, as a controlling person of the Company, violated Section 20(a) of the Securities Exchange Act.
In October 2016, the Court granted the defendants’ motion to dismiss and dismissed the Amended Complaint without prejudice. In November 2016, the plaintiffs filed a Second Amended Consolidated Class Action Complaint (“Second Amended Complaint”), raising the same claims previously dismissed by the Court, but reducing the class period (November 7, 2013 to October 20, 2015 instead of November 6, 2012 to October 20, 2015). In May 2017, the Court granted the defendants’ motion to dismiss with regard to claims related to accounting errors relating to Grupo Finmart’s bad debt reserve calculations for
“nonperforming” loans, but denied the motion to dismiss with regard to claims relating to accounting errors related to certain sales of loan portfolios to third parties.
Following discovery on the surviving claims, the plaintiff filed a Motion for Leave to File a Third Amended Complaint, seeking to revive the "nonperforming" loan claims that the Court previously dismissed, and on July 26, 2018, the Court granted the plaintiff's motion for leave to amend, thus accepting the Third Amended Consolidated Class Action Complaint. The Court issued an order certifying the class and approving the class representative and class counsel in February 2019, and we appealed that order to the U.S. Fifth Circuit Court of Appeals, which appeal was granted in March 2019.
On May 30, 2019, the parties agreed to a mediated settlement of all remaining claims, and on June 18, 2019 entered into a Stipulation and Agreement of Settlement reflecting the terms of the agreed settlement, which called for the payment of $4.9 million by the defendants. Following a settlement fairness hearing on December 6, 2019, the Court entered a judgment approving the agreed settlement and dismissing the claims asserted against the defendants. The settlement amount (which was covered by applicable directors' and officers' liability insurance) has been disbursed as provided in the approved settlement.
NOTE 10:12: SEGMENT INFORMATION
Our operations are primarily managed on a geographical basis and are comprised of 3 reportable segments. The factors for determining our reportable segments include the manner in which our chief operating decision maker (CODM) evaluates performance for purposes of allocating resources and assessing performance. During the first quarter of fiscal 2020, we revised2021, the financial information our chief operating decision maker (currently our chief executive officer) reviews for operational decision-making purposes and for allocation of capital to include the separate financial results of our Lana business.business activities were no longer reviewed by the CODM for evaluating performance since Lana no longer has business activities. Rather, Lana offers support activities to U.S. Pawn. As a result, Lana is no longer an operating or reportable segment. Our historical segment results have been recast to conform to current presentation.
We currently report our segments as follows:
•U.S. Pawn — all pawn activities in the United States;
•Latin America Pawn — all pawn activities in Mexico and other parts of Latin America; Lana — our differentiated customer-centric engagement platform; and
•Other International — primarily our equity interest in the net income of Cash Converters International and consumer finance activities in Canada. Rich Data Corporation.
There are no inter-segment revenues presented below, and the amounts below were determined in accordance with the same accounting principles used in our condensed consolidated financial statements. While we expect the operations
The following tables present revenue for each reportable segment, disaggregated revenue within our three reportable segments and Corporate, segment profits and segment contribution.
Table of the Lana segment to have a positive impact on our pawn loan redemption rates and therefore our pawn service charges and yield, the pawn service charges will all be reported in our pawn segments rather than allocated to the Lana segment. Only discrete revenues related to the Lana segment will be reported in the Lana segment results.Contents |
| | | | | | | | | | | | | | | | | | | | | | | | | | | |
| | Three Months Ended December 31, 2019 |
| U.S. Pawn | | Latin America Pawn | | Lana | | Other
International | | Total Segments | | Corporate Items | | Consolidated |
| | | | | | | | | | | | | | |
| | (in thousands) |
| Revenues: | | | | | | | | | | | | | |
| Merchandise sales | $ | 95,354 |
| | $ | 31,374 |
| | $ | — |
| | $ | — |
| | $ | 126,728 |
| | $ | — |
| | $ | 126,728 |
|
| Jewelry scrapping sales | 6,117 |
| | 3,411 |
| | — |
| | — |
| | 9,528 |
| | — |
| | 9,528 |
|
| Pawn service charges | 64,090 |
| | 20,635 |
| | — |
| | — |
| | 84,725 |
| | — |
| | 84,725 |
|
| Other revenues | 36 |
| | 25 |
| | 1 |
| | 1,392 |
| | 1,454 |
| | — |
| | 1,454 |
|
| Total revenues | 165,597 |
| | 55,445 |
| | 1 |
| | 1,392 |
| | 222,435 |
| | — |
| | 222,435 |
|
| Merchandise cost of goods sold | 61,364 |
| | 22,712 |
| | — |
| | — |
| | 84,076 |
| | — |
| | 84,076 |
|
| Jewelry scrapping cost of goods sold | 4,755 |
| | 2,999 |
| | — |
| | — |
| | 7,754 |
| | — |
| | 7,754 |
|
| Other cost of revenues | — |
| | — |
| | — |
| | 536 |
| | 536 |
| | — |
| | 536 |
|
| Net revenues | 99,478 |
| | 29,734 |
| | 1 |
| | 856 |
| | 130,069 |
| | — |
| | 130,069 |
|
| Segment and corporate expenses (income): | | | | | | | | | | | | | |
| Operations | 68,059 |
| | 19,983 |
| | 1,350 |
| | 1,233 |
| | 90,625 |
| | — |
| | 90,625 |
|
| Administrative | — |
| | — |
| | — |
| | — |
| | — |
| | 17,489 |
| | 17,489 |
|
| Depreciation and amortization | 2,865 |
| | 1,889 |
| | 12 |
| | 34 |
| | 4,800 |
| | 2,933 |
| | 7,733 |
|
| Loss on sale or disposal of assets and other | — |
| | 28 |
| | — |
| | — |
| | 28 |
| | 716 |
| | 744 |
|
| Interest expense | — |
| | 28 |
| | (36 | ) | | 170 |
| | 162 |
| | 5,167 |
| | 5,329 |
|
| Interest income | — |
| | (388 | ) | | — |
| | — |
| | (388 | ) | | (455 | ) | | (843 | ) |
| Equity in net loss of unconsolidated affiliates | — |
| | — |
| | — |
| | 5,897 |
| | 5,897 |
| | — |
| | 5,897 |
|
| Other expense (income) | — |
| | 67 |
| | — |
| | (1 | ) | | 66 |
| | 5 |
| | 71 |
|
| Segment contribution (loss) | $ | 28,554 |
| | $ | 8,127 |
| | $ | (1,325 | ) | | $ | (6,477 | ) | | $ | 28,879 |
| | | | |
| Income from continuing operations before income taxes | | | | | | | | | $ | 28,879 |
| | $ | (25,855 | ) | | $ | 3,024 |
|
| | | | | | | | | | | | | | | | | | | | | | | | | | | | | | | | | | | |
| | Three Months Ended December 31, 2020 |
| (in thousands) | U.S. Pawn | | Latin America Pawn | | Other International | | Total Segments | | Corporate Items | | Consolidated |
| | | | | | | | | | | |
| Revenues: | | | | | | | | | | | |
| Merchandise sales | $ | 82,253 | | | $ | 25,530 | | | $ | 0 | | | $ | 107,783 | | | $ | 0 | | | $ | 107,783 | |
| Jewelry scrapping sales | 4,004 | | | 2,755 | | | 0 | | | 6,759 | | | 0 | | | 6,759 | |
| Pawn service charges | 50,220 | | | 13,269 | | | 0 | | | 63,489 | | | 0 | | | 63,489 | |
| Other revenues | 22 | | | 7 | | | 75 | | | 104 | | | 0 | | | 104 | |
| Total revenues | 136,499 | | | 41,561 | | | 75 | | | 178,135 | | | 0 | | | 178,135 | |
| Merchandise cost of goods sold | 48,059 | | | 16,484 | | | 0 | | | 64,543 | | | 0 | | | 64,543 | |
| Jewelry scrapping cost of goods sold | 2,844 | | | 2,358 | | | 0 | | | 5,202 | | | 0 | | | 5,202 | |
| | | | | | | | | | | |
| Net revenues | 85,596 | | | 22,719 | | | 75 | | | 108,390 | | | 0 | | | 108,390 | |
| Segment and corporate expenses (income): | | | | | | | | | | | |
| Store expenses | 62,092 | | | 17,217 | | | 0 | | | 79,309 | | | 0 | | | 79,309 | |
| General and administrative | 0 | | | 0 | | | 0 | | | 0 | | | 12,510 | | | 12,510 | |
| | | | | | | | | | | |
| Depreciation and amortization | 2,736 | | | 1,860 | | | 0 | | | 4,596 | | | 2,976 | | | 7,572 | |
| Loss (gain) on sale or disposal of assets and other | 27 | | | (101) | | | 0 | | | (74) | | | 52 | | | (22) | |
| | | | | | | | | | | |
| Interest expense | 0 | | | 0 | | | 0 | | | 0 | | | 5,455 | | | 5,455 | |
| Interest income | 0 | | | (764) | | | 0 | | | (764) | | | (57) | | | (821) | |
| Equity in net income of unconsolidated affiliates | 0 | | | 0 | | | (516) | | | (516) | | | 0 | | | (516) | |
| | | | | | | | | | | |
| Other (income) expense | 0 | | | (455) | | | (210) | | | (665) | | | 66 | | | (599) | |
| Segment contribution | $ | 20,741 | | | $ | 4,962 | | | $ | 801 | | | $ | 26,504 | | | | | |
| Income (loss) before income taxes | | | | | | | $ | 26,504 | | | $ | (21,002) | | | $ | 5,502 | |
|
| | | | | | | | | | | | | | | | | | | | | | | | | | | |
| | Three Months Ended December 31, 2018 |
| U.S. Pawn | | Latin America Pawn | | Lana | | Other
International | | Total Segments | | Corporate Items | | Consolidated |
| | | | | | | | | | | | | | |
| | (in thousands) |
| Revenues: | | | | | | | | | | | | | |
| Merchandise sales | $ | 95,103 |
| | $ | 25,921 |
| | $ | — |
| | $ | — |
| | $ | 121,024 |
| | $ | — |
| | $ | 121,024 |
|
| Jewelry scrapping sales | 6,552 |
| | 2,729 |
| | — |
| | — |
| | 9,281 |
| | — |
| | 9,281 |
|
| Pawn service charges | 64,225 |
| | 19,294 |
| | — |
| | — |
| | 83,519 |
| | — |
| | 83,519 |
|
| Other revenues | 48 |
| | 42 |
| | — |
| | 1,781 |
| | 1,871 |
| | — |
| | 1,871 |
|
| Total revenues | 165,928 |
| | 47,986 |
| | — |
| | 1,781 |
| | 215,695 |
| | — |
| | 215,695 |
|
| Merchandise cost of goods sold | 59,148 |
| | 17,964 |
| | — |
| | — |
| | 77,112 |
| | — |
| | 77,112 |
|
| Jewelry scrapping cost of goods sold | 5,510 |
| | 2,540 |
| | — |
| | — |
| | 8,050 |
| | — |
| | 8,050 |
|
| Other cost of revenues | — |
| | — |
| | — |
| | 484 |
| | 484 |
| | — |
| | 484 |
|
| Net revenues | 101,270 |
| | 27,482 |
| | — |
| | 1,297 |
| | 130,049 |
| | — |
| | 130,049 |
|
| Segment and corporate expenses (income): | | | | | | | | | | | | | |
| Operations | 67,937 |
| | 18,196 |
| | 2,090 |
| | 2,630 |
| | 90,853 |
| | — |
| | 90,853 |
|
| Administrative | — |
| | — |
| | — |
| | — |
| | — |
| | 13,165 |
| | 13,165 |
|
| Depreciation and amortization | 3,035 |
| | 1,422 |
| | — |
| | 41 |
| | 4,498 |
| | 2,350 |
| | 6,848 |
|
| Loss on sale or disposal of assets and other | 2,853 |
| | 1,589 |
| | — |
| | — |
| | 4,442 |
| | — |
| | 4,442 |
|
| Interest expense | — |
| | 29 |
| | — |
| | 72 |
| | 101 |
| | 8,690 |
| | 8,791 |
|
| Interest income | — |
| | (419 | ) | | — |
| | — |
| | (419 | ) | | (2,920 | ) | | (3,339 | ) |
| Equity in net loss of unconsolidated affiliates | — |
| | — |
| | — |
| | 1,119 |
| | 1,119 |
| | — |
| | 1,119 |
|
| Impairment of investments in unconsolidated affiliates | — |
| | — |
| | — |
| | 13,274 |
| | 13,274 |
| | — |
| | 13,274 |
|
| Other (income) expense | — |
| | (126 | ) | | — |
| | 22 |
| | (104 | ) | | (282 | ) | | (386 | ) |
| Segment contribution (loss) | $ | 27,445 |
| | $ | 6,791 |
| | $ | (2,090 | ) | | $ | (15,861 | ) | | $ | 16,285 |
| | | | |
| Loss from continuing operations before income taxes | | | | | | | | | $ | 16,285 |
| | $ | (21,003 | ) | | $ | (4,718 | ) |
| | | | | | | | | | | | | | | | | | | | | | | | | | | | | | | | | | | |
| | Three Months Ended December 31, 2019 |
| (in thousands) | U.S. Pawn | | Latin America Pawn | | Other International | | Total Segments | | Corporate Items | | Consolidated |
| | | | | | | | | | | |
| Revenues: | | | | | | | | | | | |
| Merchandise sales | $ | 95,354 | | | $ | 31,374 | | | $ | 0 | | | $ | 126,728 | | | $ | 0 | | | $ | 126,728 | |
| Jewelry scrapping sales | 6,117 | | | 3,411 | | | 0 | | | 9,528 | | | 0 | | | 9,528 | |
| Pawn service charges | 64,090 | | | 20,635 | | | 0 | | | 84,725 | | | 0 | | | 84,725 | |
| Other revenues | 36 | | | 25 | | | 1,393 | | | 1,454 | | | 0 | | | 1,454 | |
| Total revenues | 165,597 | | | 55,445 | | | 1,393 | | | 222,435 | | | 0 | | | 222,435 | |
| Merchandise cost of goods sold | 61,364 | | | 22,712 | | | 0 | | | 84,076 | | | 0 | | | 84,076 | |
| Jewelry scrapping cost of goods sold | 4,755 | | | 2,999 | | | 0 | | | 7,754 | | | 0 | | | 7,754 | |
| Other cost of revenues | 0 | | | 0 | | | 536 | | | 536 | | | 0 | | | 536 | |
| Net revenues | 99,478 | | | 29,734 | | | 857 | | | 130,069 | | | 0 | | | 130,069 | |
| Segment and corporate expenses (income): | | | | | | | | | | | |
| Store expenses | 68,059 | | | 19,983 | | | 1,233 | | | 89,275 | | | 0 | | | 89,275 | |
| General and administrative | 0 | | | 0 | | | 0 | | | 0 | | | 18,839 | | | 18,839 | |
| | | | | | | | | | | |
| Depreciation and amortization | 2,865 | | | 1,889 | | | 34 | | | 4,788 | | | 2,945 | | | 7,733 | |
| Loss on sale or disposal of assets and other | 0 | | | 28 | | | 0 | | | 28 | | | 716 | | | 744 | |
| | | | | | | | | | | |
| Interest expense | 0 | | | 28 | | | 170 | | | 198 | | | 5,131 | | | 5,329 | |
| Interest income | 0 | | | (388) | | | 0 | | | (388) | | | (455) | | | (843) | |
| Equity in net loss of unconsolidated affiliates | 0 | | | 0 | | | 5,897 | | | 5,897 | | | 0 | | | 5,897 | |
| | | | | | | | | | | |
| Other expense (income) | 0 | | | 67 | | | (1) | | | 66 | | | 32 | | | 98 | |
| Segment contribution (loss) | $ | 28,554 | | | $ | 8,127 | | | $ | (6,476) | | | $ | 30,205 | | | | | |
| Income (loss) before income taxes | | | | | | | $ | 30,205 | | | $ | (27,208) | | | $ | 2,997 | |
NOTE 11:13: SUPPLEMENTAL CONSOLIDATED FINANCIAL INFORMATION
Supplemental Consolidated Financial Information
The following table provides supplemental information on net amounts included in our condensed consolidated balance sheets:sheets and condensed consolidated statements of cash flows:
| | | | December 31, 2019 | | December 31, 2018 | | September 30, 2019 | |
| | | | | | | |
| | (in thousands) | |
| Cash and cash equivalents | $ | 143,141 |
| | $ | 297,031 |
| | $ | 157,567 |
| |
| Restricted cash | — |
| | 255 |
| | 4,875 |
| |
| Cash and cash equivalents and restricted cash | $ | 143,141 |
| | $ | 297,286 |
| | $ | 162,442 |
| |
| (in thousands) | | (in thousands) | December 31, 2020 | | December 31, 2019 | | September 30, 2020 |
| | | | | | | | | | | | |
| Gross pawn service charges receivable | $ | 40,887 |
| | $ | 40,016 |
| | $ | 41,838 |
| Gross pawn service charges receivable | $ | 31,721 | | | $ | 40,887 | | | $ | 27,259 | |
| Allowance for uncollectible pawn service charges receivable | (8,637 | ) | | (8,458 | ) | | (10,036 | ) | Allowance for uncollectible pawn service charges receivable | (6,896) | | | (8,637) | | | (6,679) | |
| Pawn service charges receivable, net | $ | 32,250 |
| | $ | 31,558 |
| | $ | 31,802 |
| Pawn service charges receivable, net | $ | 24,825 | | | $ | 32,250 | | | $ | 20,580 | |
| | | | | | | |
| Gross inventory | $ | 197,519 |
| | $ | 185,706 |
| | $ | 189,092 |
| Gross inventory | $ | 106,053 | | | $ | 197,519 | | | $ | 108,205 | |
| Inventory reserves | (10,150 | ) | | (10,284 | ) | | (9,737 | ) | Inventory reserves | (11,073) | | | (10,150) | | | (12,314) | |
| Inventory, net | $ | 187,369 |
| | $ | 175,422 |
| | $ | 179,355 |
| Inventory, net | $ | 94,980 | | | $ | 187,369 | | | $ | 95,891 | |
| | | | | | | |
| Prepaid expenses and other | $ | 12,463 |
| | $ | 11,720 |
| | $ | 4,784 |
| Prepaid expenses and other | $ | 8,079 | | | $ | 12,463 | | | $ | 10,614 | |
| Accounts receivable and other | 12,257 |
| | 14,126 |
| | 10,889 |
| Accounts receivable and other | 9,546 | | | 12,257 | | | 6,991 | |
| Income taxes receivable | 11,422 |
| | 5,361 |
| | 10,248 |
| Income taxes receivable | 15,199 | | | 11,422 | | | 15,298 | |
| Restricted cash | — |
| | 255 |
| | 4,875 |
| |
| 2019 Convertible Notes Hedges | — |
| | 21 |
| | — |
| |
| Prepaid expenses and other current assets | $ | 36,142 |
| | $ | 31,483 |
| | $ | 30,796 |
| Prepaid expenses and other current assets | $ | 32,824 | | | $ | 36,142 | | | $ | 32,903 | |
| | | | | | | |
| Property and equipment, gross | $ | 270,335 |
| | $ | 253,336 |
| | $ | 265,922 |
| Property and equipment, gross | $ | 274,071 | | | $ | 270,335 | | | $ | 267,509 | |
| Accumulated depreciation | (205,089 | ) | | (183,566 | ) | | (198,565 | ) | Accumulated depreciation | $ | (218,867) | | | (205,089) | | | (210,523) | |
| Property and equipment, net | $ | 65,246 |
| | $ | 69,770 |
| | $ | 67,357 |
| Property and equipment, net | $ | 55,204 | | | $ | 65,246 | | | $ | 56,986 | |
| | | | | | | |
| Accounts payable | $ | 12,534 |
| | $ | 15,141 |
| | $ | 25,946 |
| Accounts payable | $ | 17,169 | | | $ | 12,534 | | | $ | 19,114 | |
| Accrued expenses and other | 39,087 |
| | 42,239 |
| | 52,011 |
| Accrued expenses and other | $ | 50,608 | | | 39,087 | | | 52,390 | |
| Accounts payable, accrued expenses and other current liabilities | $ | 51,621 |
| | $ | 57,380 |
| | $ | 77,957 |
| Accounts payable, accrued expenses and other current liabilities | $ | 67,777 | | | $ | 51,621 | | | $ | 71,504 | |
ITEM 2. MANAGEMENT'S DISCUSSION AND ANALYSIS OF FINANCIAL CONDITION AND RESULTS OF OPERATIONS
Management’s Discussion and Analysis of Financial Condition and Results of Operations is intended to inform the reader about matters affecting the financial condition and results of operations of EZCORP, Inc. and its subsidiaries (collectively, “we,” “us”, “our”, "EZCORP" or the “Company”). The following discussion inshould be read together with our condensed consolidated financial statements and related notes included elsewhere within this sectionreport. This discussion contains forward-looking statements that are based on our current expectations. Actualstatements. Our actual results could differ materially from those expressed or implied by theanticipated in these forward-looking statements due to a number of risks, uncertainties and other factors, including those identified in statements. See "Part I, Item 1A — Risk Factors" of our Annual Report on Form 10-K for the year ended September 30, 20192020, as supplemented by the information set forth in “Part I, Item 3 — Quantitative and Qualitative Disclosures about Market Risk.”Risk” and "Part II, Item 1A — Risk Factors" of this Report for a discussion of certain risks, uncertainties and assumptions associated with these statements. Business Overview and Financial Highlights
EZCORP is a Delaware corporation headquartered in Austin, Texas. We are a leading provider of pawn loans in the United States and Latin America.
Our vision is to be the market leader in North America in responsibly and respectfully meeting our customers' desire for access to cash when they want it. That vision is supported by four key imperatives:
Market Leading Customer Satisfaction;
Exceptional Staff Engagement;
Most Efficient Provider of Cash; and
Attractive Shareholder Returns.
At our pawn stores, we offer pawn Pawn loans which are nonrecoursenon-recourse loans collateralized by tangible personal property, andproperty. We also sell merchandise, to customers looking for good value. The merchandise we sell consists of second-handprimarily collateral forfeited from our pawn lending activitiesunpaid loans or goods purchased directly from customers.
We remainexist to serve our customers’ short-term cash needs, helping them to live and enjoy their lives. We are focused on optimizing our balance of pawn loans outstanding (“PLO”) and the resulting higher pawn service charges (“PSC”). The following charts present sources of net revenues, including PSC, merchandise sales gross profit ("Merchandise sales GP") and jewelry scrapping gross profit ("Jewelry scrapping GP"):three strategic pillars:
The following charts present sources of net revenues by geographic disbursement:
The following charts present store counts by geographic disbursement:
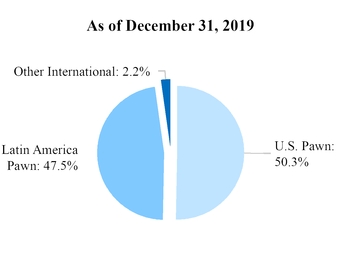
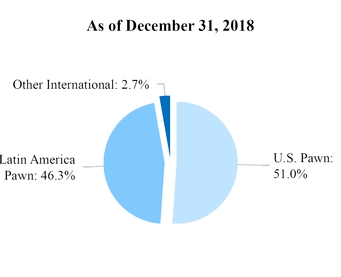
| | | | | | | | |
| | |
| Strengthen the Core | Renewed focus on the unique and essential elements of our pawn business |
| Cost Reduction and Simplification | Significant and sustained adjustment of cost base through ongoing simplification |
| Innovate and Grow | Broaden customer engagement to service more customers more frequently in more locations |
Pawn Activities
At our pawn stores, we offer pawn loans, which are typically small, nonrecourse loans collateralized by tangible personal property. We earn pawn service charges on our pawn loans, which varies by state and loan size. Collateral for our pawn loans consists of tangible personal property, generally jewelry, consumer electronics, tools, sporting goods and musical instruments. Security for our pawn loans is provided via the estimated resale value of the collateralcollateralized personal property and the perceived probability of the loan’sloans' redemption.
Our ability to offer quality second-handpre-owned goods at prices significantly lower than original retail prices attracts value-conscious customers. The gross profit on sales of inventory depends primarily on our assessment of the loan or purchase value at the time the property is either accepted as loan collateral or purchased and our ability to sell that merchandise in a timely manner. As a significant portion of our inventory and sales involve gold and jewelry, our results can be heavily influenced by the market price of gold.gold and diamonds.
Growth and Expansion
We planOur strategy is to expand the number of locations we operate through opening new (“de novo”) locations and through acquisitions in both Latin America and the United States and potential new markets. Our ability to add new stores is dependent on several variables, such as projected achievement of internal investment hurdles, the availability of acceptable sites or acquisition candidates, the alignment of acquirer/seller price expectations, the regulatory environment, local zoning ordinances, access to capital and the availability of qualified personnel. We see opportunity for further expansion through acquisitions and de novo openings in Latin America and acquisitions in the United States.
Seasonality and Quarterly Results
Historically,In the United States, pawn service charges are historically highest in our fourth fiscal quarter (July through September) due to a higher average loan balance during the summer lending season in the United States and lowest in our third fiscal quarter (April through June) following the tax refund season in the United States. Merchandiseand merchandise sales are highest in our first and second fiscal quarters (October through March) due to the holiday season, jewelry sales in the United States surrounding Valentine’s Day and the availability of tax refunds in the United States. Mostrefunds. In Latin America, most of our customers in Latin America receive additional compensation from their employers in December, and many receive additional compensation in June or July, applying downward pressure on loan balances and fueling some merchandise sales in those periods. As a net effect of these and other factors and excluding discrete charges, our consolidated profit before tax is generally highest in our first fiscal quarter (October through December) and lowest in our third
fiscal quarter (April through June). These historical trends have been impacted by COVID-19. However, we expect these historical trends to return in the future.
Segments
DuringFinancial Highlights
We remain focused on optimizing our balance of pawn loans outstanding (“PLO”) and the firstresulting higher pawn service charges (“PSC”). The following chart presents sources of net revenues, including PSC, merchandise sales gross profit ("Merchandise sales GP") and jewelry scrapping gross profit ("Jewelry Scrapping GP") for the three months ended December 31, 2020 and 2019:
The following chart presents sources of net revenues by geographic disbursement for the three months ended December 31, 2020 and 2019:
Business Developments
COVID-19
The COVID-19 pandemic continues to affect the U.S. and global economies, and as disclosed in our 2020 Annual Report on Form 10-K, the pandemic also affected our business in a variety of ways beginning in the second quarter of fiscal 2020 we revisedand continuing into fiscal 2021.
Our business was negatively impacted by COVID-19 during the financial informationcurrent quarter largely due to volume declines as compared to the prior year in pawn loan originations and associated loan balances in both the U.S. and Latin America, as a result of a change in customer borrowing behaviors. Additionally, the impact of sustained lower pawn portfolios has led to reduced inventory available for sale. As a result, our chief operating decision maker (currentlynet revenues for the three months ended December 31, 2020 were down $21.7 million as compared to the prior year.
The full extent and duration of the COVID-19 impact on the global economy generally, and on our chief executive officer) reviews for operational decision-making purposesbusiness specifically, is currently unknown. We expect the impact of the pandemic, and for allocation of capitalthe recovery therefrom, will continue to include the separate financialadversely affect net revenues and earnings in fiscal 2021. A prolonged pandemic and recovery may have an adverse effect on our results of our Lana business. Our historical segment results have been recast to conform to current presentation. We currently report our segments as follows: U.S. Pawn - all pawn activitiesoperations, financial position and liquidity in the United States; Latin America Pawn - all pawnfuture periods.
activities in Mexico and other parts of Latin America; Lana - our customer-centric digital engagement platform; and Other International - primarily our equity interest in the net income of Cash Converters International and consumer finance activities in Canada. While we expect the operations of the Lana segment to have a positive impact on our pawn loan redemption rates and therefore our pawn service charges and yield, the pawn service charges will all be reported in our pawn segments rather than allocated to the Lana segment. Only discrete revenues related to the Lana segment will be reported in the Lana segment results. As a digital offering, Lana has no separate physical store locations.
Leases
As of October 1, 2019, we adopted Accounting Standards Update ("ASU"), Leases (Topic 842). This ASU required companies to generally recognize on the balance sheet operating and financing lease liabilities and corresponding right-of-use assets. We recorded a net right-of-use asset of $237.5 million and a net lease liability of $246.0 million.
Store Data by Segment |
| | | | | | | | | | | |
| | Three Months Ended December 31, 2019 |
| | U.S. Pawn | | Latin America Pawn | | Other International | | Consolidated |
| | | | | | | | |
| As of September 30, 2019 | 512 |
| | 480 |
| | 22 |
| | 1,014 |
|
| New locations opened | — |
| | 4 |
| | — |
| | 4 |
|
| As of December 31, 2019 | 512 |
| | 484 |
| | 22 |
| | 1,018 |
|
|
| | | | | | | | | | | |
| | Three Months Ended December 31, 2018 |
| | U.S. Pawn | | Latin America Pawn | | Other International | | Consolidated |
| | | | | | | | |
| As of September 30, 2018 | 508 |
| | 453 |
| | 27 |
| | 988 |
|
| New locations opened | — |
| | 4 |
| | — |
| | 4 |
|
| Locations acquired | — |
| | 5 |
| | — |
| | 5 |
|
| As of December 31, 2018 | 508 |
| | 462 |
| | 27 |
| | 997 |
|
Results of Operations
Three Months Ended December 31, 2019 vs. Three Months Ended December 31, 2018Non-GAAP Constant Currency Financial Information
These tables, as well as the discussion that follows, should be read with the accompanyingTo supplement our condensed consolidated financial statements, which are prepared and related notes. All comparisons, unless otherwise noted, are to the prior-year quarter.
U.S. Pawn
The following table presents selected summary financial data for the U.S. Pawn segment: |
| | | | | | | | | |
| | Three Months Ended December 31, | | Change |
| | 2019 | | 2018 | |
| | | | | | |
| | (in thousands) | | |
| Net revenues: | | | | | |
| Pawn service charges | $ | 64,090 |
| | $ | 64,225 |
| | —% |
| | | | | | |
| Merchandise sales | 95,354 |
| | 95,103 |
| | —% |
| Merchandise sales gross profit | 33,990 |
| | 35,955 |
| | (5)% |
| Gross margin on merchandise sales | 36 | % | | 38 | % | | (200)bps |
| | | | | | |
| Jewelry scrapping sales | 6,117 |
| | 6,552 |
| | (7)% |
| Jewelry scrapping sales gross profit | 1,362 |
| | 1,042 |
| | 31% |
| Gross margin on jewelry scrapping sales | 22 | % | | 16 | % | | 600bps |
| | | | | | |
| Other revenues | 36 |
| | 48 |
| | (25)% |
| Net revenues | 99,478 |
| | 101,270 |
| | (2)% |
| | | | | | |
| Segment operating expenses: | | | | |
|
| Operations | 68,059 |
| | 67,937 |
| | —% |
| Depreciation and amortization | 2,865 |
| | 3,035 |
| | (6)% |
| Segment operating contribution | 28,554 |
| | 30,298 |
| | (6)% |
| | | | | | |
| Other segment expense | — |
| | 2,853 |
| | (100)% |
| Segment contribution | $ | 28,554 |
| | $ | 27,445 |
| | 4% |
| | | | | | |
| Other data: | | | | | |
| Net earning assets (a) | $ | 305,336 |
| | $ | 299,160 |
| | 2% |
| Inventory turnover | 1.8 |
| | 1.8 |
| | —% |
| Average monthly ending pawn loan balance per store (b) | $ | 301 |
| | $ | 304 |
| | (1)% |
| Monthly average yield on pawn loans outstanding | 14 | % | | 14 | % | | — |
| Pawn loan redemption rate | 84 | % | | 83 | % | | 100bps |
|
| |
(a) | Balance includes pawn loans and inventory. |
(b) | Balance is calculated based upon the average of the monthly ending balances during the applicable period. |
Segment contribution increased $1.1 million, or 4%, to $28.6 million. While net revenues decreased $1.8 million, or 2%, to $99.5 million, total expenses decreased $2.9 million to $70.9 million due primarily to a $2.9 million prior-period recognition of an uncollectible receivable balance from a bankrupt refining partnerpresented in accordance with no comparable charge in the current period. Operations expense was flat to the prior-year quarter, with a slight improvement in depreciation and amortization.
The change in net revenue attributable to same stores and new stores added since the prior-year quarter is summarized as follows: |
| | | | | | | | | | | |
| | Change in Net Revenue |
| | Pawn Service Charges | | Merchandise Sales Gross Profit | | Total |
| | | | | | |
| | (in millions) |
| Same stores | $ | (0.5 | ) | | $ | (2.3 | ) | | $ | (2.8 | ) |
| New stores and other | 0.4 |
| | 0.3 |
| | 0.7 |
|
| Total | $ | (0.1 | ) | | $ | (2.0 | ) | | $ | (2.1 | ) |
| Change in jewelry scrapping sales gross profit and other revenues | | | | | 0.3 |
|
| Total change in net revenue | | | | | $ | (1.8 | ) |
Pawn service charges were flat as acquired stores offset a 1% decrease in average ending monthly pawn loan balances outstanding during the current quarter.
Merchandise sales were flat with gross margin on merchandise sales down 200 basis points to 36%, the low end of our target range. The decline in gross margin was due to holiday sales promotions and our continued efforts to reduce general merchandise inventory aged greater than 360 days, which ended the quarter at 6.8% of total general merchandise inventory, improved from 8.9% at the end of the prior-year quarter. As a result, merchandise sales gross profit decreased 5% to $34.0 million.
Jewelry scrapping sales gross profit increased 31% to $1.4 million due primarily to higher scrapping margins as a result of increased gold market prices. Scrap sales margins increased 600 basis points to 22%. Scrap volume decreased year-over-year as we continue to focus on retail sales for jewelry disposition.
Non-GAAP Financial Information
In addition to the financial information prepared in conformity with accounting principles generally accepted in the United States ("GAAP"),GAAP, we provide certain other non-GAAP financial information on a constant currency basis ("constant currency"). We use constant currency results to evaluate our Latin America Pawn operations, which are denominated primarily in Mexican pesos, Guatemalan quetzals and other Latin American currencies. We believe that presentation of constant currency results is meaningful and useful in understanding the activities and business metrics of our Latin America Pawn operations and reflect an additional way of viewing aspects of our business that, when viewed with GAAP results, provide a more completebetter understanding and evaluation of factors and trends affecting our business. We provide non-GAAP financial information for informational purposes and to enhance understanding of our GAAP consolidated financial statements. We use this non-GAAP financial information to evaluate and compare operating results across accounting periods. Readers should consider the information in addition to, but not instead ofrather than or superior to, our financial statements prepared in accordance with GAAP. This non-GAAP financial information may be determined or calculated differently by other companies, limiting the usefulness of those measures for comparative purposes.
Constant currency results reported herein are calculated by translating consolidated balance sheet and consolidated statement of operations items denominated in local currency to U.S. dollars using the exchange rate from the prior-year comparable period, as opposed to the current period, in order to exclude the effects of foreign currency rate fluctuations. We used the end-of-period rate for balance sheet items and the average closing daily exchange rate on a monthly basis during the appropriate period for statement of operations items. Our statement of operations constant currency results reflect the monthly exchange rate fluctuations and so are not directly calculable from the above rates.rates below. Constant currency results, where presented, also exclude the foreign currency gain or loss. The end-of-period and approximate average exchange rates for each applicable currency as compared to U.S. dollars as of and for the three months ended December 31, 2020 and 2019 and September 30, 2020 and 2019 were as follows:
| | | | | | | | | | | | | | | | | | | | | | | | | | | | | | | | | | | | | | | | | | | | | | | |
| December 31, | | Three Months Ended December 31, | | September 30, | | Three Months Ended
September 30, |
| 2020 | | 2019 | | 2020 | | 2019 | | 2020 | | 2019 | | 2020 | | 2019 |
| | | | | | | | | | | | | | | |
| Mexican peso | 19.9 | | | 18.9 | | | 20.5 | | | 19.2 | | | 21.6 | | | 19.7 | | | 22.1 | | | 19.4 | |
| Guatemalan quetzal | 7.6 | | | 7.5 | | | 7.6 | | | 7.5 | | | 7.6 | | | 7.6 | | | 7.5 | | | 7.5 | |
| Honduran lempira | 23.8 | | | 24.4 | | | 24.1 | | | 24.3 | | | 24.3 | | | 24.2 | | | 24.3 | | | 24.1 | |
| Peruvian sol | 3.6 | | | 3.3 | | | 3.6 | | | 3.3 | | | 3.5 | | | 3.4 | | | 3.5 | | | 3.3 | |
|
| | | | | | | | | | | | |
| | | December 31, | | Three Months Ended December 31, |
| | | 2019 | | 2018 | | 2019 | | 2018 |
| | | | | | | | | |
| Mexican peso | | 18.9 |
| | 19.6 |
| | 19.2 |
| | 19.8 |
|
| Guatemalan quetzal | | 7.5 |
| | 7.7 |
| | 7.5 |
| | 7.6 |
|
| Honduran lempira | | 24.4 |
| | 24.2 |
| | 24.3 |
| | 24.0 |
|
| Peruvian sol | | 3.3 |
| | 3.4 |
| | 3.3 |
| | 3.3 |
|
Operating Results
Segments
We manage our business and report our financial results in three reportable operating segments;
•U.S. Pawn — Represents all pawn activities in the United States;
•Latin America Pawn — Represents all pawn activities in Mexico and other parts of Latin America; and
•Other International — Represents our equity interest in the net income of Cash Converters International and Rich Data Corporation and our financial services stores in Canada, operating under the CASHMAX brand. In the fourth quarter of fiscal 2020, we closed our stores in Canada, and operating activities related to CASHMAX are not material.
See Note 12 – Segment Information, for information regarding changes in reportable segments. Our historical segment results have been recast to conform to current presentation.
Three Months Ended December 31, 2020 vs. Three Months Ended December 31, 2019
Store Data by Segment
| | | | | | | | | | | | | | | | | | | |
| | Three Months Ended December 31, 2020 |
| | U.S. Pawn | | Latin America Pawn | | | | Consolidated |
| | | | | | | |
| As of September 30, 2020 | 505 | | | 500 | | | | | 1,005 | |
| New locations opened | — | | | 2 | | | | | 2 | |
| | | | | | | |
| Locations sold, combined or closed | — | | | — | | | | | — | |
| As of December 31, 2020 | 505 | | | 502 | | | | | 1,007 | |
| | | | | | | | | | | | | | | | | | | | | | | |
| | Three Months Ended December 31, 2019 |
| | U.S. Pawn | | Latin America Pawn | | Other International | | Consolidated |
| | | | | | | |
| As of September 30, 2019 | 512 | | | 480 | | | 22 | | | 1,014 | |
| New locations opened | — | | | 4 | | | — | | | 4 | |
| | | | | | | |
| Locations sold, combined or closed | — | | | — | | | — | | | — | |
| As of December 31, 2019 | 512 | | | 484 | | | 22 | | | 1,018 | |
These tables, as well as the discussion that follows, should be read in conjunction with the accompanying condensed consolidated financial statements and related notes.
U.S. Pawn
The following table presents selected summary financial data for our U.S. Pawn segment:
| | | | | | | | | | | | | | | | | |
| | Three Months Ended December 31, | | Change |
| (in thousands) | 2020 | | 2019 | |
| | | | | |
| Net revenues: | | | | | |
| Pawn service charges | $ | 50,220 | | | $ | 64,090 | | | (22)% |
| | | | | |
| Merchandise sales | 82,253 | | | 95,354 | | | (14)% |
| Merchandise sales gross profit | 34,194 | | | 33,990 | | | 1% |
| Gross margin on merchandise sales | 42 | % | | 36 | % | | 600bps |
| | | | | |
| Jewelry scrapping sales | 4,004 | | | 6,117 | | | (35)% |
| Jewelry scrapping sales gross profit | 1,160 | | | 1,362 | | | (15)% |
| Gross margin on jewelry scrapping sales | 29 | % | | 22 | % | | 700bps |
| | | | | |
| Other revenues | 22 | | | 36 | | | (39)% |
| Net revenues | 85,596 | | | 99,478 | | | (14)% |
| | | | | |
| Segment operating expenses: | | | | | |
| Store expenses | 62,092 | | | 68,059 | | | (9)% |
| Depreciation and amortization | 2,736 | | | 2,865 | | | (5)% |
| Segment operating contribution | 20,768 | | | 28,554 | | | (27)% |
| | | | | |
| Other segment income | 27 | | | — | | | * |
| Segment contribution | $ | 20,741 | | | $ | 28,554 | | | (27)% |
| | | | | |
| Other data: | | | | | |
| Net earning assets (a) | $ | 199,569 | | | $ | 305,336 | | | (35)% |
| Inventory turnover | 2.6 | | | 1.8 | | 44% |
| Average monthly ending pawn loan balance per store (b) | $ | 233 | | | $ | 301 | | | (23)% |
| Monthly average yield on pawn loans outstanding | 14 | % | | 14 | % | | —bps |
| Pawn loan redemption rate | 84 | % | | 84 | % | | —bps |
| | | | | |
| * | Represents a percentage computation that is not mathematically meaningful. |
| (a) | Balance includes pawn loans and inventory. |
| (b) | Balance is calculated based upon the average of the monthly ending balances during the applicable period. |
Pawn service charges decreased by 22% due to a decrease in pawn loans outstanding resulting from the effects of the COVID-19 pandemic. Same stores pawn service charges also decreased by 22%.
Merchandise sales decreased 14%, but merchandise sales gross profit increased 1% to $34.2 million driven by lower inventory levels and a 600 bps improvement in merchandise sales gross profit margin, primarily driven by reduced aged inventory levels and improved inventory turnover. Same stores merchandise sales also decreased by 14%.
Store expenses decreased by 9% driven by a reduction in labor expense.
Segment contribution decreased $7.8 million primarily due to the changes in revenue and store expenses described above.
Latin America Pawn
The following table presents selected summary financial data for the Latin America Pawn segment, including constant currency results, after translation to U.S. dollars from its functional currencies noted above under “Results of Operations — Non-GAAP Financial Information."
|
| | | | | | | | | | | | | | | |
| | Three Months Ended December 31, |
| | 2019 (GAAP) | | 2018 (GAAP) | | Change (GAAP) | | 2019 (Constant Currency) | | Change (Constant Currency) |
| | | | | | | | | | |
| | (in USD thousands) | | | | (in USD thousands)
| | |
| Net revenues: | | | | | | | | | |
| Pawn service charges | $ | 20,635 |
| | $ | 19,294 |
| | 7% | | $ | 20,197 |
| | 5% |
| | | | | |
| | | |
|
| Merchandise sales | 31,374 |
| | 25,921 |
| | 21% | | 30,526 |
| | 18% |
| Merchandise sales gross profit | 8,662 |
| | 7,957 |
| | 9% | | 8,434 |
| | 6% |
| Gross margin on merchandise sales | 28 | % | | 31 | % | | (300)bps | | 28 | % | | (300)bps |
| | | | | |
| | | |
|
| Jewelry scrapping sales | 3,411 |
| | 2,729 |
| | 25% | | 3,366 |
| | 23% |
| Jewelry scrapping sales gross profit | 412 |
| | 189 |
| | 118% | | 407 |
| | 115% |
| Gross margin on jewelry scrapping sales | 12 | % | | 7 | % | | 500bps | | 12 | % | | 500bps |
| | | | | |
| | | |
|
| Other revenues | 25 |
| | 42 |
| | (40)% | | 24 |
| | (43)% |
| Net revenues | 29,734 |
| | 27,482 |
| | 8% | | 29,062 |
| | 6% |
| | | | | |
| | | |
|
| Segment operating expenses: | | | | |
| | | |
|
| Operations | 19,983 |
| | 18,196 |
| | 10% | | 19,573 |
| | 8% |
| Depreciation and amortization | 1,889 |
| | 1,422 |
| | 33% | | 1,844 |
| | 30% |
| Segment operating contribution | 7,862 |
| | 7,864 |
| | —% | | 7,645 |
| | (3)% |
| | | | | |
| | | |
|
| Other segment (income) expense (a) | (265 | ) | | 1,073 |
| | * | | (202 | ) | | * |
| Segment contribution | $ | 8,127 |
| | $ | 6,791 |
| | 20% | | $ | 7,847 |
| | 16% |
| | | | | | | | | | |
| Other data: | | | | | | | | | |
| Net earning assets (b) | $ | 77,619 |
| | $ | 70,246 |
| | 10% | | $ | 75,327 |
| | 7% |
| Inventory turnover | 2.7 |
| | 2.6 |
| | 4% | | 2.7 |
| | 4% |
| Average monthly ending pawn loan balance per store (c) | $ | 119 |
| | $ | 121 |
| | (2)% | | $ | 116 |
| | (4)% |
| Monthly average yield on pawn loans outstanding | 16 | % | | 15 | % | | 100bps | | 16 | % | | 100bps |
| Pawn loan redemption rate (d) | 79 | % | | 78 | % | | 100bps | | 79 | % | | 100bps |
| | | | | | | | | | | | | | | | | | | | | | | | | | | | | |
| | Three Months Ended December 31, |
| (in thousands) | 2020 (GAAP) | | 2019 (GAAP) | | Change (GAAP) | | 2020 (Constant Currency) | | Change (Constant Currency) |
| | | | | | | | | |
| Net revenues: | | | | | | | | | |
| Pawn service charges | $ | 13,269 | | | $ | 20,635 | | | (36)% | | $ | 13,949 | | | (32)% |
| | | | | | | | | |
| Merchandise sales | 25,530 | | | 31,374 | | | (19)% | | 26,784 | | | (15)% |
| Merchandise sales gross profit | 9,046 | | | 8,662 | | | 4% | | 9,446 | | | 9% |
| Gross margin on merchandise sales | 35 | % | | 28 | % | | 700bps | | 35 | % | | 700bps |
| | | | | | | | | |
| Jewelry scrapping sales | 2,755 | | | 3,411 | | | (19)% | | 2,855 | | | (16)% |
| Jewelry scrapping sales gross profit | 397 | | | 412 | | | (4)% | | 417 | | | 1% |
| Gross margin on jewelry scrapping sales | 14 | % | | 12 | % | | 200bps | | 15 | % | | 300bps |
| | | | | | | | | |
| Other revenues, net | 7 | | | 25 | | | (72)% | | 8 | | | (68)% |
| Net revenues | 22,719 | | | 29,734 | | | (24)% | | 23,820 | | | (20)% |
| | | | | | | | | |
| Segment operating expenses: | | | | | | | | | |
| Store Expenses | 17,217 | | | 19,983 | | | (14)% | | 18,097 | | | (9)% |
| Depreciation and amortization | 1,860 | | | 1,889 | | | (2)% | | 1,956 | | | 4% |
| Segment operating contribution | 3,642 | | | 7,862 | | | (54)% | | 3,767 | | | (52)% |
| | | | | | | | | |
| Other segment income (a) | (1,320) | | | (265) | | | 398% | | (1,281) | | | 383% |
| Segment contribution | $ | 4,962 | | | $ | 8,127 | | | (39)% | | $ | 5,048 | | | (38)% |
| | | | | | | | | |
| Other data: | | | | | | | | | |
| Net earning assets (b) | $ | 43,263 | | | $ | 77,619 | | | (44)% | | $ | 45,009 | | | (42)% |
| Inventory turnover | 3.8 | | | 2.7 | | | 41% | | 3.8 | | | 41% |
| Average monthly ending pawn loan balance per store (c) | $ | 53 | | | $ | 119 | | | (55)% | | $ | 56 | | | (53)% |
| Monthly average yield on pawn loans outstanding | 17 | % | | 16 | % | | 100bps | | 17 | % | | 100bps |
| Pawn loan redemption rate (d) | 83 | % | | 79 | % | | 400bps | | 83 | % | | 400bps |
|
| | | | |
* | Represents a percentage computation that is not mathematically meaningful. |
| (a) | Fiscal 20202021 constant currency amount excludes net GAAP basis foreign currency transaction gainsadjustment of $0.1 million resulting from movement in exchange rates. The net foreign currency transaction gains for fiscal 2019 of $0.1 million2020 were nominal and are included in the above results. |
| (b) | Balance includes pawn loans and inventory. |
| (c) | Balance is calculated based upon the average of the monthly ending balances during the applicable period. |
| (d) | Rate is solely inclusive of results from Mexico Pawn. |
In the current quarter, our Latin America pawn segment opened two de novo stores.
Segment contribution increased $1.3 million, or 20%, to $8.1 million (16%Pawn service charges decreased 36% (32% on a constant currency basis) with net revenue growth of $2.3 million, or 8% ($1.6 million, or 6%, on a constant currency basis), to $29.7 million. Operations expense increased $1.8 million, or 10% ($1.4 million, or 8% on a constant currency basis), to $20.0 million due primarily to 22 new store openings, along with relocations and expansions of existing stores.
The change in net revenue attributable to same. Same stores and new stores added since the prior-year quarter is summarized as follows: |
| | | | | | | | | | | |
| | Change in Net Revenue |
| | Pawn Service Charges | | Merchandise Sales Gross Profit | | Total |
| | | | | | |
| | (in millions) |
| Same stores | $ | 0.9 |
| | $ | 0.5 |
| | $ | 1.4 |
|
| New stores and other | 0.4 |
| | 0.3 |
| | 0.7 |
|
| Total | $ | 1.3 |
| | $ | 0.8 |
| | $ | 2.1 |
|
| Change in jewelry scrapping sales gross profit and other revenues | | | | | 0.2 |
|
| Total change in net revenue | | | | | $ | 2.3 |
|
|
| | | | | | | | | | | |
| | Change in Net Revenue (Constant Currency) |
| | Pawn Service Charges | | Merchandise Sales Gross Profit | | Total |
| | | | | | |
| | (in millions) |
| Same stores | $ | 0.5 |
| | $ | 0.3 |
| | $ | 0.8 |
|
| New stores and other | 0.4 |
| | 0.2 |
| | 0.6 |
|
| Total | $ | 0.9 |
| | $ | 0.5 |
| | $ | 1.4 |
|
| Change in jewelry scrapping sales gross profit and other revenues | | | | | 0.2 |
|
| Total change in net revenue | | | | | $ | 1.6 |
|
Pawnpawn service charges increased 7% (5% on a constant currency basis)also decreased by 36%. The average ending monthly pawn loan balance outstanding during the current quarter was down 2% (4%55% (53% on a constant currency basis), offset by the addition of 22 new stores since the end of the prior-year quarter. Pawn loan yield and redemption rates improved 100 basis points each, to 16% and 79%, respectively, reflecting improved lending guidance from our point-of-sale system.
Merchandise sales increased 21% (18% on. We have experienced a constant currency basis), largely attributable to a revised incentive program for store team members implemented in fiscal 2020, with an offsetting 300 basis pointsubstantial decline in margins. As a result of these factorsnew loans activity and foreign currency impacts, merchandise sales gross profit was up 9% to $8.7 million (6% to $8.4 million on a constant currency basis).
Social welfare programs recently implemented in Mexico have provided additional cash to a portion of our customers, contributing to the lowerassociated loan demand and increased sales volume. These programs are directed towards a variety of citizens such as the elderly, disabled, single mothers, certain farmers, micro-businesses and certain students. Based on government announcements, we anticipate these programs will continue on an ongoing basis, but expect our customers’ needs to return to more traditional patterns in six to twelve months.
Jewelry scrapping sales increased 25% (23% on a constant currency basis) on greater volume, with a 500 basis point increase in margin to 12% as we benefited from an overall increase in commodity gold prices.
Other segment expenses compared favorablybalances as a result of a prior-year quarter reserve of $1.5 million against a receivable balance deemed uncollectible from a refiner.change in customer borrowing behaviors due to COVID-19.
Operations expense increased 10% (8%Merchandise sales decreased 19% (15% on a constant currency basis). Same store operations expense increased 7%, with the remainder of the increase attributable to a 5%stores merchandise sales decreased by 20%. This decrease in merchandise sales was offset by an increase in ending store count over the prior-year quarter and costsmerchandise sales gross profit of 4% to open de novo stores. Depreciation and amortization increased 33% (30%$9.0 million (9% to $9.4 million on a constant currency basis) fromdriven by a 700 basis points improvement in merchandise sales gross profit margin primarily due to reduced aged inventory levels and improved inventory turnover.
Store expenses decreased by 14% (9% on a constant currency basis) driven by a reduction in labor expense.
Segment contribution decreased $3.2 million primarily due to the additionchanges in revenue and store expenses described above.
Lana
The following table presents selected financial data for the Lana segment: |
| | | | | | | | | |
| | Three Months Ended December 31, | | Percentage Change |
| | 2019 | | 2018 | |
| | | | | | |
| | (in thousands) | | |
| Operations expense and other | $ | 1,325 |
| | $ | 2,090 |
| | (37)% |
| Segment loss | $ | (1,325 | ) | | $ | (2,090 | ) | | (37)% |
We launched our customer-centric digital engagement platform (“Lana”) in the current quarter, initially serving customers in select Florida locations. This platform currently offers the ability for customers at select locations to remotely extend their pawn loans through digital payments using their Lana account, and will allow us to leverage our existing store and pawn customer base to expand customer acquisition and retention and enable rapid deployment of new products. Discrete revenues to date are minimal as the product offering launched late in the current quarter, and all fees from pawn loan extensions, including those made through the Lana platform, are reported in the pawn segments.
Other International
The following table presents selected financial data for theour Other International segment after translation to U.S. dollars from its functional currency of primarily Australian and Canadian dollars:
| | | | | | | | | Three Months Ended December 31, | | Change |
| | Three Months Ended December 31, | | Percentage Change | |
| | 2019 | | 2018 | | |
| | | | | | |
| (in thousands) | | (in thousands) | 2020 | | 2019 | | Change |
| | (in thousands) | | | | | | |
| Net revenues: | | | | | Net revenues: | |
| Consumer loan fees, interest and other | $ | 1,392 |
| | $ | 1,781 |
| | (22)% | Consumer loan fees, interest and other | $ | 75 | | | $ | 1,393 | | | (95)% |
| Consumer loan bad debt | (536 | ) | | (484 | ) | | 11% | |
| Consumer loan debt | | Consumer loan debt | — | | | 536 | | | (100)% |
| Net revenues | 856 |
| | 1,297 |
| | (34)% | Net revenues | 75 | | | 857 | | | (91)% |
| | | | | |
| |
| Segment operating expenses: | | | | | Segment operating expenses: | |
| Operating expenses | 1,267 |
| | 2,671 |
| | (53)% | |
| Equity in net loss of unconsolidated affiliates | 5,897 |
| | 1,119 |
| | 427% | |
| Segment operating loss | (6,308 | ) | | (2,493 | ) | | 153% | |
| Operations | | Operations | — | | | 1,233 | | | (100)% |
| Equity in net (income) loss on unconsolidated affiliates | | Equity in net (income) loss on unconsolidated affiliates | (516) | | | 5,897 | | | (109)% |
| Segment operating contribution | | Segment operating contribution | 591 | | | (6,273) | | | (109)% |
| | | | | | |
| Other segment expense | 169 |
| | 13,368 |
| | (99)% | Other segment expense | (210) | | | 203 | | | (203)% |
| Segment loss | $ | (6,477 | ) | | $ | (15,861 | ) | | (59)% | |
| Segment contribution (loss) | | Segment contribution (loss) | $ | 801 | | | $ | (6,476) | | | (112)% |
Segment losscontribution was $6.5$0.8 million, an improvementincrease of $9.4$7.3 million from the prior-year quarter primarily due to:
A $13.3 million impairment of Cash Converters International in the prior-year quarter with no impairment in the current quarter; and
A decrease in operating expenses of $1.4 million subsequent to the deconsolidation of a previously consolidated variable interest entity ("RDC") in mid-fiscal 2019; partially offset by
A $7.1 million charge, ($10.1 million, net of a $3.0 million tax benefit) in the first quarter of fiscal 2020 for our share of the Cash Converters International
settlement of a Queensland, Australia class action lawsuit.
We operated 22 financial services stores in Canada under the CASHMAX brand during fiscal year 2020. During the fourth quarter of fiscal year 2020, we closed our CASHMAX business and are no longer operating stores in Canada.
Other Items
The following table reconciles our consolidated segment contribution discussed above to net income (loss) attributable to EZCORP, Inc., including items that affect our consolidated financial results but are not allocated among segments:
|
| | | | | | | | | |
| | Three Months Ended December 31, | | Percentage Change |
| | 2019 | | 2018 | |
| | | | | | |
| | (in thousands) | | |
| Segment contribution | $ | 28,879 |
| | $ | 16,285 |
| | 77% |
| Corporate expenses (income): | | | | |
|
| Administrative | 17,489 |
| | 13,165 |
| | 33% |
| Depreciation and amortization | 2,933 |
| | 2,350 |
| | 25% |
| Loss on sale or disposal of assets and other | 716 |
| | — |
| | * |
| Interest expense | 5,167 |
| | 8,690 |
| | (41)% |
| Interest income | (455 | ) | | (2,920 | ) | | (84)% |
| Other expense (income) | 5 |
| | (282 | ) | | * |
| Income (loss) from continuing operations before income taxes | 3,024 |
| | (4,718 | ) | | * |
| Income tax expense (benefit) | 1,759 |
| | (1,058 | ) | | * |
| Income (loss) from continuing operations, net of tax | 1,265 |
| | (3,660 | ) | | * |
| Loss from discontinued operations, net of tax | (27 | ) | | (183 | ) | | (85)% |
| Net income (loss) | 1,238 |
| | (3,843 | ) | | * |
| Net loss attributable to noncontrolling interest | — |
| | (477 | ) | | (100)% |
| Net income (loss) attributable to EZCORP, Inc. | $ | 1,238 |
| | $ | (3,366 | ) | | * |
| | | | | | | | | | | | | | | | | |
| | Three Months Ended December 31, | | Percentage Change |
| (in thousands) | 2020 | | 2019 | |
| | | | | |
| Segment contribution | $ | 26,504 | | | $ | 30,205 | | | (12)% |
| Corporate expenses (income): | | | | | |
| | | | | |
| General and administrative | 12,510 | | | 18,839 | | | (34)% |
| Depreciation and amortization | 2,976 | | | 2,945 | | | 1% |
| Gain on sale or disposal of assets and other | 52 | | | 716 | | | (93)% |
| Interest expense | 5,455 | | | 5,131 | | | 6% |
| Interest income | (57) | | | (455) | | | (87)% |
| | | | | |
| Other expense | 66 | | | 32 | | | * |
| Income before income taxes | 5,502 | | | 2,997 | | | 84% |
| Income tax expense | 1,203 | | | 1,759 | | | (32)% |
| | | | | |
| | | | | |
| | | | | |
| | | | | |
| Net income | $ | 4,299 | | | $ | 1,238 | | | 247% |
|
| | | | |
| * | Represents a percentage computation that is not mathematically meaningful. |
Segment contribution increased 77%decreased $3.7 million or 12% over the prior-year quarter including positive developmentsprimarily due to reduced pawn service charges from a decline in our Latin Americanew loans activity and US Pawn segments as well as favorable comparisons against prior-year quarter expenses related to a refiner’s bankruptcy and our investment in Cash Converters International.
Administrative expenses increased $4.3 million primarilyassociated loan balances as a result of higher labor, cloud computing costsa change in customer borrowing behaviors due to COVID-19, partially offset by increased merchandise sales gross profit and professional fees. Professional fees include costs relateddecreased store expenses.
General and administrative expenses decreased $6.3 million or 34% due to the remediation of the material weakness in our information technology general controls, fess related to the current quarter adoption of a new lease accounting standard, severance fees pursuant to cost reduction strategies and other smaller items.
Loss on sale or disposal of assets and other includes a $0.6 million chargestrategic initiatives implemented in the currentfourth quarter dueof fiscal year 2020 to terminationoptimize our cost structure at the corporate level.
Interest expense decreased $3.5 million, or 41%, primarily due to the reduction of interest expense on our 2.125% Cash Convertible Senior Notes Due 2019 ("2019 Convertible Notes") which were repaid June 17, 2019. Prior to repayment, the principal amount of these notes was $195.0 million.Contents
Interest income decreased $2.5 million, or 84%, primarily due to the declining principal balance on the Prestaciones Finmart, S.A.P.I. de C.V., SOFOM, E.N.R. ("Grupo Finmart") notes receivable as they are repaid in accordance with their agreed amortization schedule, in addition to the reduction of interest earned on outstanding cash balances after our 2019 Convertible Notes were repaid in June 2019.
Income tax expense increased $2.8 million due primarily to:
A $7.7 million increase in income from continuing operations before income taxes; and
A $0.7 million reduction in tax benefit from the December 2019 vesting of restricted stock units compared to the prior estimates of the related tax benefit that was recorded over their 3-year vesting period. The lower than expected tax benefit relates to the lower related share price upon vesting compared to the grant date value.
Income tax expense includes other items that do not necessarily correspond to pre-tax earnings and create volatility in our effective tax rate. These items include the net effect of state taxes, non-deductible items and changes in valuation allowances for certain foreign operations.
Liquidity and Capital Resources
We currently believe that, based on available capital resources and projected operating cash flow, we have adequate capital resources to fund working capital needs, currently anticipated capital expenditures, currently anticipated business growth and expansion, tax payments, and current and projected debt service requirements.
Cash and Cash Equivalents
Our cash and equivalents balance was $290.5 million at December 31, 2020 compared to $304.5 million at September 30, 2020. At December 31, 2020, our cash and equivalents were held in cash depository accounts with major banks or invested in high quality, short-term liquid investments.
Cash Flows
The table and discussion below presentpresents a summary of the selected sources and uses of our cash: |
| | | | | | | | | |
| | Three Months Ended December 31, | | Percentage Change |
| | 2019 | | 2018 | |
| | | | | | |
| | (in thousands) | | |
| Cash flows from operating activities | $ | (10,918 | ) | | $ | 23,381 |
| | * |
| Cash flows from investing activities | (6,798 | ) | | (8,279 | ) | | 18% |
| Cash flows from financing activities | (2,934 | ) | | (2,612 | ) | | (12)% |
| Effect of exchange rate changes on cash, cash equivalents and restricted cash | 1,349 |
| | (782 | ) | | * |
| Net (decrease) increase in cash, cash equivalents and restricted cash | $ | (19,301 | ) | | $ | 11,708 |
| | * |
|
| |
* | Represents a percentage computation that is not mathematically meaningful. |
| | | | | | | | | | | | | | | | | |
| | Three Months Ended December 31, | | Percentage
Change |
| (in thousands) | 2020 | | 2019 | |
| | | | | |
| Cash flows used in operating activities | $ | (4,513) | | | $ | (10,918) | | | 59% |
| Cash flows used in investing activities | (15,062) | | | (6,798) | | | (122)% |
| Cash flows used in financing activities | (783) | | | (2,934) | | | 73% |
| Effect of exchange rate changes on cash, cash equivalents and restricted cash | 6,266 | | | 1,349 | | | 364% |
| Net decrease in cash, cash equivalents and restricted cash | $ | (14,092) | | | $ | (19,301) | | | 27% |
Change
Net cash used in Cash and Cash Equivalents and Restricted Cash for the Three Months Ended December 31, 2019 vs. Three Months Ended December 31, 2018
Theoperating activities decreased $6.4 million, or 59%, year-over-year due to a net decrease of $12.1 million in non-cash adjustments to reconcile net income to operating cash flows, from operating activities year-over-year was due to $37.3offset by an increase of $15.4 million of changes in working capital offset byand a $3.1 million increase in net income, exclusive of non-cash items. Changesincome.
Net cash used in working capital included certain required prepayments and payments of accounts payable, including certain discrete items, accrued as of September 30, 2019. We continue to refine efforts to most efficiently manage working capital.
The increase in cash flows from investing activities increased $8.3 million, or 122%, year-over-year was primarily due to a $22.5 million decrease in the sale of forfeited collateral, offset by an $8.1$11.9 million net decrease in investment in customer loan growth, partially offset by a $7.3 million net decreasel.
Net cash used in principal collections on notes receivable.
The decrease in cash flows from financing activities decreased $2.2 million, or 73%, year-over-year was primarily due to $1.0 million in common stock repurchases and a net $1.1 million reduction in debt proceeds, offset by a $1.9$1.0 million decrease in cashthe repurchase of common stock and $0.7 million decrease in taxes paid for employeerelated to the net share settlement of individual tax liabilities on vested share-basedequity awards.
The net effect of these and other smaller itemscash flows was a $19.3$14.1 million decrease in cash on hand during the current year-to-date period, resulting in a $143.1$298.5 million ending cash balance. Of the endingand restricted cash balance at December 31, 2019, $39.9 million was not unavailable to fund domestic operations as we intend to permanently reinvest those funds in our foreign operations.balance.
Sources and Uses of Cash
In December 2019, our Board of Directors authorized a stock repurchase program that will allow us to repurchase up to $60 million of our Class A Non-voting Common Stock over three years. On March 20, 2020, we suspended the repurchase of shares under the program in order to preserve current liquidity given the uncertainty of the impact of the COVID-19 pandemic to our operations. The resumption of our stock repurchase program and the amount and timing of purchases will be dependent on a variety of factors, includingsuch as the return to normal business conditions, stock price, trading volume, general market conditions, legal and regulatory requirements, general business conditions, the level of cash flows,flow levels, and corporatecorporate considerations determined by management and the Board, such as liquidity and capital needs and the availability of attractive alternative investment opportunities. The Board of Directors has reserved the right to modify, suspend or terminate the program at any time. During the current quarter,three months ended December 30, 2020, there were no stock repurchases. As of September 30, 2020, we had repurchased and retired 142,409943,149 shares of our Class A Common Stock for $963,000. Through January 29, 2020, we have repurchased and retired an additional 234,394 shares of our Class A Common Stock for $1,504,000, bringing our total repurchases to date (as of January 29, 2020) to 376,803 shares for $2,467,000.$5.2 million.
We anticipate that cash flowflows from operations and cash on hand will be adequate to fund anticipatedany future stock repurchases, our contractual obligations, planned de novo store growth, capital expenditures and working capital requirements through fiscal 2020.2021. We continue to explore accretive acquisition opportunities, both large and small, and may choose to pursue additional debt, equity or equity-linked financings in the future should the need arise.Given the current uncertainty related to the COVID-19 pandemic, we may adjust our capital or other expenditures. Depending on the level of acquisition activity and other factors, our ability to repay our longer term debt obligations, including the convertible debt maturing in 2024 and 2025, may require us to refinance these obligations through the issuance of new debt securities, equity securities, convertible securities or through new credit facilities.
Contractual Obligations
We are responsible for the maintenance, property taxes and insurance at most of our locations. In the fiscal year ended September 30, 2019,2020, these collectively amounted to $22.5$6.2 million.
Recently Adopted Accounting Policies and Recently Issued Accounting Pronouncements
See Note 1 of Notes to Interim Condensed Consolidated Financial Statements included in "Part I, Item 1 — Financial Statements."
Cautionary Statement Regarding Risks and Uncertainties that May Affect Future Results
This Quarterly Report on Form 10-Q, including Management’s Discussion and Analysis of Financial Condition and Results of Operations, includes "forward-looking statements" within the meaning of Section 27A of the Securities Act of 1933 and Section 21E of the Securities Exchange Act of 1934. We intend that all forward-looking statements be subject to the safe harbors created by these laws. All statements, other than statements of historical facts, regarding our strategy, future operations, financial position, future revenues, projected costs, prospects, plans and objectives are forward-looking statements. These statements are often, but not always, made with words or phrases like "may," "should," "could," "will," "predict," "anticipate," "believe," "estimate," "expect," "intend," "plan," "projection" and similar expressions. Such statements are only predictions of the outcome and timing of future events based on our current expectations and currently available information and, accordingly, are subject to substantial risks, uncertainties and assumptions. Actual results could differ materially from those expressed in the forward-looking statements due to a number of risks and uncertainties, many of which are beyond our control. In addition, we cannot predict all of the risks and uncertainties that could cause our actual results to differ from those expressed in the forward-looking statements. Accordingly, you should not regard any forward-looking statements as a representation that the expected results will be achieved. Important risk factors that could cause results or events to differ from current expectations are identified and described in "Part I, Item 1A — Risk Factors" of our Annual Report on Form 10-K for the year ended September 30, 201920.20 and "Part II, Item 1A — Risk Factors" of this Report. We specifically disclaim any responsibility to publicly update any information contained in a forward-looking statement except as required by law. All forward-looking statements attributable to us are expressly qualified in their entirety by this cautionary statement.
ITEM 3. QUANTITATIVE AND QUALITATIVE DISCLOSURES ABOUT MARKET RISK
ITEM 4. CONTROLS AND PROCEDURES
This report includes the certifications of our Chief Executive Officer and Interim Chief Financial Officer required by Rule 13a-14 of the Securities Exchange Act of 1934 (the "Exchange Act"). See Exhibits 31.1 and 31.2. This Item 4 includes information concerning the controls and control evaluations referred to in those certifications.
Evaluation of Disclosure Controls and Procedures
Disclosure controls and procedures (as defined in Rules 13a-15(e) and 15d-15(e) under the Securities Exchange Act of 1934) are designed to ensure that information required to be disclosed in the reports we file or submit under the Securities Exchange Act is recorded, processed, summarized and reported within the time periods specified in SEC rules and forms and that such information is accumulated and communicated to our management, including our Chief Executive Officer and Interim Chief Financial Officer, to allow timely decisions regarding required disclosures.
Under the supervision and with the participation of our Chief Executive Officer and Interim Chief Financial Officer, our management evaluated the effectiveness of the design and operation of our disclosure controls and procedures as of December 31, 2019. Based on2020. Our principal executive officer and principal financial officer have concluded that evaluation, our Chief Executive Officer and Chief Financial Officer concluded thatas of December 31, 2020, our disclosure controls and procedures were not effective asto
provide reasonable assurance that information required to be disclosed in our reports under the continuing existence of a material weakness in internal control over financial reporting described below (which we view as an integral part of our disclosure controlsExchange Act is recorded, processed, summarized, and procedures). Based onreported within the performance of additional procedures designed to ensure the reliability of our financial reporting, we believe that the condensed consolidated financial statements included in this Quarterly Report on Form 10-Q fairly present, in all material respects, our financial position, results of operations and cash flows as of the dates, and for thetime periods presented, in conformity with accounting principles generally acceptedspecified in the United States (“GAAP”).
SEC rules and forms and that such information is accumulated and communicated to management as appropriate to allow timely decisions regarding required disclosure.
Changes in Internal Control overOver Financial Reporting
We implemented internal controls to ensure we adequately evaluated our leases and properly assessed the impact of Topic 842 on our financial statements upon adoption on October 1, 2019. There were no significant changes to our internal control over financial reporting due to the adoption of the new standard.
During the second quarter of fiscal 2019, we identified deficiencies in our information technology general controls (ITGCs) that are designed to prevent or detect unauthorized access or changes to certain information technology (IT) systems that support our financial reporting processes. Our related IT dependent manual and application controls that are impacted by the affected ITGCs were also deemed ineffective as they rely on reports generated by the IT systems subject to ITGCs, resulting in our inability to place reliance on internal controls over related financial statement accounts and assertions. At that time, we determined that the ITGC deficiencies represent a material weakness in our internal control over financial reporting and reported that material weakness in our Quarterly Report on Form 10-Q forduring the quarter ended March 31, 2019. Because we have not fully remediated that material weakness as of December 31, 2019, we2020 that have concluded thatmaterially affected, or are reasonably likely to materially affect, our internal control over financial reporting was not effective as of that date.
As of December 31, 2019, we have continued to implement, manage and monitor a remediation plan focused on IT control enhancements across our logical access and change management processes, including the evaluation of automation tools, where applicable, and database monitoring activities. Management believes it is taking the appropriate steps to remediate the underlying ITGC deficiencies, including allowing the controls to operate for a time period to produce sufficient testing sample sizes.reporting.
Inherent Limitations on Internal Controls
Notwithstanding the foregoing,Our management, including our Chief Executive Officer and Interim Chief Financial Officer, does not expect that our disclosure controls and procedures or our internal control over financial reportingcontrols will prevent or detect all errors and all fraud. A control system, no matter how well designed and operated, can provide only reasonable, not absolute, assurance that the objectives of the control systemsystem’s objectives will be met. LimitationsBecause of the inherent limitations in all control systems, no evaluation of controls can provide absolute assurance that all control issues and instances of fraud, if any, control system includewithin the following:
Judgments in decision-making can be faulty, and control and process breakdowns can occur because of simple errors or mistakes.
Controls can be circumvented by individuals, acting alone or in collusion with others, or by management override.
Company have been detected. The design of any system of controls is based in part onupon certain assumptions about the likelihood of future events, and there can be no assurance that any design will succeed in achieving its stated goals under all potential future conditions.
Over time, controls may become inadequate because of changes in conditions or deterioration in the degree of compliance with associated policies or procedures.
The design of a control system must reflect the fact that resources are constrained, and the benefits of controls must be considered relative to their costs.
Because of the inherent limitations in alla cost-effective control systems, no evaluation of controls can provide absolute assurance that all control issuessystem, misstatements due to error or fraud may occur and instances of fraud, if any, have beennot be detected.
PART II — OTHER INFORMATION
ITEM 1. LEGAL PROCEEDINGS
See Note 911 of Notes to Interim Condensed Consolidated Financial Statements included in "Part I, Item 1 — Financial Statements."
ITEM 1A. RISK FACTORS
ITEM 2. UNREGISTERED SALES OF EQUITY SECURITIES AND USE OF PROCEEDS27
The table below provides certain information about our repurchase of shares of Class A Non-voting Common Stock during the quarter ended December 31, 2019. All such repurchases were made in open market transactions at prevailing market prices and were executed pursuant to a trading plan adopted by the Company pursuant to Rule 10b5-1 under the Securities Exchange Act of 1934. |
| | | | | | | | | | | | | | | | | |
| Total Number of Shares Purchased | | Total Price Paid for Shares Purchased | | Average Price Paid per Share | | Total Number of Shares Purchased as Part of Publicly Announced Programs | | Maximum Approximate Dollar Value of Shares that May Yet be Purchased Under the Plans or Programs (1) |
| | | | | | | | | | |
| | (in thousands, except average price paid per share data) |
| October 1, 2019 through October 31, 2019 | — |
| | $ | — |
| | $ | — |
| | — |
| | $ | — |
|
| November 1, 2019 through November 30, 2019 | — |
| | — |
| | — |
| | — |
| | — |
|
| December 1, 2019 through December 31, 2019 | 142 |
| | 963 |
| | 6.76 |
| | 142 |
| | 59,037 |
|
| Total | 142 |
| | $ | 963 |
| | $ | 6.76 |
| | 142 |
| | $ | 59,037 |
|
|
| |
(1) | On December 2, 2019, our Board of Directors approved a program to repurchase up to $60.0 million of our Class A Non-voting Common Stock over three years. Under the stock repurchase program, we may purchase Class A Non-voting common stock from time to time at management's discretion in accordance with applicable securities laws, including through open market transactions, block or privately negotiated transactions, or any combination thereof. In addition, we may purchase shares pursuant to a trading plan meeting the requirements of Rule 10b5-1 under the Securities Exchange Act of 1934. The amount and timing of purchases will be dependent on a variety of factors, including stock price, trading volume, general market conditions, legal and regulatory requirements, general business conditions, the level of cash flows, and corporate considerations determined by management and the Board of Directors, such as liquidity and capital needs and the availability of attractive alternative investment opportunities. The Board of Directors has reserved the right to modify, suspend or terminate the program at any time. |
ITEM 6. EXHIBITS
The following exhibits are filed with, or incorporated by reference into, this report. | | | | | | | | | | | | | | | | | | | | | | | | | | |
| | | Incorporated by Reference | | Filed Herewith |
Exhibit No. | | Description of Exhibit | | Form | File No. | Exhibit | Filing Date | |
| | | | | | | | |
| | | | | | | | | x |
| | | | | | | | | x |
| 32.1† | | | | | | | | x |
| | | | | | | | | x |
101.INS†††101.INS | | Inline XBRL Instance Document (the instance document does not appear in the interactive data files because the XBRL tags are embedded within the Inline XBRL document) | | | | | | | |
101.SCH†††101.SCH | | Inline XBRL Taxonomy Extension Schema Document | | | | | | | x |
101.CAL†††101.CAL | | Inline XBRL Taxonomy Extension Calculation Linkbase Document | | | | | | | x |
101.DEF†††101.DEF | | Inline XBRL Taxonomy Extension Definition Linkbase Document | | | | | | | x |
101.LAB†††101.LAB | | Inline XBRL Taxonomy LabelExtension Labels Linkbase Document | | | | | | | x |
101.PRE†††101.PRE | | Inline XBRL Taxonomy Extension Presentation Linkbase Document | | | | | | | x |
| 104 | Cover Page Interactive Data File in Inline XBRL format (contained in Exhibit 101) | | | | | | | |
_____________________________ |
| | | | |
| † | Filed herewith. |
†† | Furnished herewith. |
††† | Filed herewithThe certifications furnished in Exhibit 32.1 and Exhibit 32.2 hereto are deemed to accompany this Quarterly Report on Form 10-Q and will not be deemed “filed” for purposes of Section 18 of the Securities Exchange Act of 1934, as Exhibit 101amended, except to this report are the following formatted in XBRL (Extensible Business Reporting Language): (i) Condensed Consolidated Balance Sheets as of December 31, 2019, December 31, 2018 and September 30, 2019; (ii) Condensed Consolidated Statements of Operations forextent that the three months ended December 31, 2019 and December 31, 2018; (iii) Condensed Consolidated Statements of Comprehensive Income (Loss) for the three months ended December 31, 2019 and December 31, 2018; (iv) Condensed Consolidated Statements of Stockholders' Equity for the three months ended December 31, 2019 and December 31, 2018; (v) Condensed Consolidated Statements of Cash Flows for the three months ended December 31, 2019 and December 31, 2018; and (vi) Notes to Interim Condensed Consolidated Financial Statements.registrant specifically incorporates it by reference.
|
SIGNATURES
Pursuant to the requirements of the Securities Exchange Act of 1934, the registrant has duly caused this report to be signed on its behalf by the undersigned thereunto duly authorized. | | | | | | | | | | | |
| | | EZCORP, INC. |
| | | |
|
|
| EZCORP, INC./s/ Jason A. Kulas |
|
|
|
|
Date: | February 3, 2020 |
| /s/ Daniel M. Chism |
|
|
| Daniel M. Chism,Jason A. Kulas,
Chief FinancialExecutive Officer |