UNITED STATES
SECURITIES AND EXCHANGE COMMISSION
Washington, D.C. 20549
_____________________________
FORM 10-Q
_____________________________
(Mark One)
|
| |
| x | QUARTERLY REPORT PURSUANT TO SECTION 13 OR 15(d) OF THE SECURITIES EXCHANGE ACT OF 1934 |
For the quarterly period ended March 31, 20182019
OR
|
| |
| o | TRANSITION REPORT PURSUANT TO SECTION 13 OR 15(d) OF THE SECURITIES EXCHANGE ACT OF 1934 |
For the transition period from to
Commission File Number 1-11356
Radian Group Inc.
(Exact name of registrant as specified in its charter)
|
| | |
| Delaware | | 23-2691170 |
| (State or other jurisdiction of incorporation or organization) | | (I.R.S. Employer Identification No.) |
| | | |
| 1500 Market Street, Philadelphia, PA | | 19102 |
| (Address of principal executive offices) | | (Zip Code) |
(215) 231-1000
(Registrant’s telephone number, including area code)
Indicate by check mark whether the registrant (1) has filed all reports required to be filed by Section 13 or 15(d) of the Securities Exchange Act of 1934 during the preceding 12 months (or for such shorter period that the registrant was required to file such reports), and (2) has been subject to such filing requirements for the past 90 days. Yes x No o
Indicate by check mark whether the registrant has submitted electronically and posted on its corporate Web site, if any, every Interactive Data File required to be submitted and posted pursuant to Rule 405 of Regulation S-T (§232.405 of this chapter) during the preceding 12 months (or for such shorter period that the registrant was required to submit and post such files). Yes x No o
Indicate by check mark whether the registrant is a large accelerated filer, an accelerated filer, a non-accelerated filer, a smaller reporting company, or an emerging growth company. See the definitions of “large accelerated filer,” “accelerated filer,” “smaller reporting company” and “emerging growth company” in Rule 12b-2 of the Exchange Act.
|
| | | | | | | |
Large accelerated filer x | | Accelerated filer o | | Non-accelerated filer o | | Smaller reporting company o | Emerging growth company o |
| | | | (Do not check if a smaller reporting company) | | | |
If an emerging growth company, indicate by check mark if the registrant has elected not to use the extended transition period for complying with any new or revised financial accounting standards provided pursuant to Section 13(a) of the Exchange Act. o
Indicate by check mark whether the registrant is a shell company (as defined in Rule 12b-2 of the Exchange Act). Yes o No x
Securities registered pursuant to Section 12(b) of the Act:
|
| | |
| Title of each class | Trading Symbol(s) | Name of each exchange on which registered |
| Common Stock, $0.001 par value per share | RDN | New York Stock Exchange |
APPLICABLE ONLY TO CORPORATE ISSUERS:
Indicate the number of shares outstanding of each of the issuer’s classes of common stock, as of the latest practicable date: 214,621,425208,020,528 shares of common stock, $0.001 par value per share, outstanding on May 4, 2018.6, 2019.
|
| | |
| TABLE OF CONTENTS | |
| | | Page Number |
| |
| |
| |
| Item 1. | | |
| | | |
| | |
| | | |
| | |
| | | |
| | | |
| | |
| | | |
| | |
| | | |
| | | |
| | | |
| | |
| | | |
| | |
| | |
| | |
| | | |
| | | |
| | |
| | |
| | |
| | | |
| | |
| | |
| | |
| | | |
| | |
| | |
| | |
| | |
| Item 2. | | |
| Item 3. | | |
| Item 4. | | |
| | | |
| |
| Item 1. | | |
| Item 1A. | | |
| Item 2. | | |
| Item 6. | | |
| | | |
| |
GLOSSARY OF ABBREVIATIONS AND ACRONYMS
The following list defines various abbreviations and acronyms used throughout this report, including the Condensed Consolidated Financial Statements, the Notes to Unaudited Condensed Consolidated Financial Statements and Management’s Discussion and Analysis of Financial Condition and Results of Operations. |
| |
| Term | Definition |
| 2014 Master Policy | Radian Guaranty’s master insurance policy, setting forth the terms and conditions of our mortgage insurance coverage, which became effective October 1, 2014 |
2016 Single Premium QSR TransactionAgreement | Quota share reinsurance agreement entered into with a panel of third-party reinsurance providers in the first quarter of 2016 and subsequently amended in the fourth quarter of 2017 |
2017 Form 10-K | Annual Report on Form 10-K for the year ended December 31, 2017 |
2018 Single Premium QSR TransactionAgreement | Quota share reinsurance agreement entered into with a panel of third-party reinsurance providers in October 2017 to cede a portion of Single Premium NIW beginning January 1, 2018 |
| ABS | Asset-backed securities |
| Alt-A | Alternative-A loans, representing loans for which the underwriting documentation is generally limited as compared to fully documented loans (considered a non-prime loan grade) |
| Available Assets | As defined in the PMIERs, assets primarily including the liquid assets of a mortgage insurer, and reduced by premiums received but not yet earned |
| Back-end | With respect to credit risk transfer programs established by the GSEs, policies written on loans that are already part of an existing GSE portfolio, as contrasted with loans that are to be purchased by the GSEs in the future |
BofA Settlement Agreement | The Confidential Settlement Agreement and Release dated September 16, 2014, by and among Radian Guaranty and Countrywide Home Loans, Inc. and Bank of America, N.A., as a successor to BofA Home Loan Servicing f/k/a Countrywide Home Loan Servicing LP, entered into in order to resolve various actual and potential claims or disputes as to mortgage insurance coverage on the specific population of loans covered by the agreement |
| Borrower | With respect to our securities lending agreements, the third-party institutions to which we loan certain securities in our investment portfolio for short periods of time |
| CCF | Conservatorship Capital Framework |
| Claim Curtailment | Our legal right, under certain conditions, to reduce the amount of a claim, including due to servicer negligence |
| Claim Denial | Our legal right, under certain conditions, to deny a claim |
| Claim Severity | The total claim amount paid divided by the original coverage amount |
| Clayton | Clayton Holdings LLC, a Delaware domiciled indirect non-insurance subsidiary of Radian Group |
| Clayton Intercompany Note | A $300 million note payable from Radian Mortgage Services Inc. (formerly Clayton Group Holdings Inc.) to Radian Group (with terms consistent with the terms of our Senior Notes due 2019 that were used to fund our purchase of Clayton) |
| CMBS | Commercial mortgage-backed securities |
Convertible Senior Notes due 2017 | Our 3.000% convertible unsecured senior notes due November 2017 ($450 million original principal amount) |
Convertible Senior Notes due 2019 | Our 2.250% convertible unsecured senior notes due March 2019 ($400 million original principal amount) |
| Cures | Loans that were in default as of the beginning of a period and are no longer in default because payments were received such that the loan is no longer 60 or more days past due |
| Default to Claim Rate | The percentage of defaulted loans that are assumed to result in a claim |
Deficiency AmountEagle Re 2018-1 | The assessed tax liabilities, penalties and interest associated with a formal Notice of Deficiency from the IRSEagle Re 2018-1 Ltd., an unaffiliated special purpose reinsurer (a VIE) domiciled in Bermuda |
Discrete Item(s)Eagle Re 2019-1 | For tax calculation purposes, certain items that are required to be accounted forEagle Re 2019-1 Ltd., an unaffiliated special purpose reinsurer (a VIE) domiciled in the provision for income taxes as they occur and are not considered a component of the estimated annualized effective tax rate for purposes of reporting interim results. Generally, these are items that are: (i) clearly defined (such as changes in tax rate or tax law); (ii) infrequent or unusual in nature; or (iii) gains or losses that are not a component of continuing operating income, such as income from discontinued operations or losses reflected as a component of other comprehensive income. These items impact the difference between the statutory rate and Radian’s effective tax rate.Bermuda |
| EnTitle Direct | EnTitle Direct Group, Inc., a wholly-owned subsidiary of Radian Group, acquired in March 2018 |
| EnTitle Insurance | EnTitle Insurance Company, a wholly-ownedan Ohio domiciled insurance subsidiary of EnTitle Direct |
|
| Excess-of-Loss Program | |
Term | DefinitionThe credit risk protection obtained by Radian Guaranty in November 2018, including: (i) the excess-of-loss reinsurance agreement with Eagle Re 2018-1, in connection with the issuance by Eagle Re 2018-1 of mortgage insurance-linked notes, and (ii) a separate excess-of-loss reinsurance agreement with a third-party reinsurer. Excess-of-loss reinsurance is a type of reinsurance that indemnifies the ceding company against loss in excess of a specific agreed limit, up to a specified sum. Effective in April 2019, it also includes the new credit risk protection obtained through an excess-of-loss reinsurance agreement with Eagle Re 2019-1. |
| Exchange Act | Securities Exchange Act of 1934, as amended |
Extraordinary DividendDistribution | A dividend or distribution of capital that is required to be approved by an insurance company’s primary regulator that is greater than would be permitted as an ordinary dividend whichdistribution (which does not require regulatory approvalapproval) |
|
| |
| Term | Definition |
| Fannie Mae | Federal National Mortgage Association |
| FASB | Financial Accounting Standards Board |
| FEMA | Federal Emergency Management Agency, an agency of the U.S. Department of Homeland Security |
| FEMA Designated Area | Generally, an area that has been subject to a disaster, designated by FEMA as an individual assistance disaster area for the purpose of determining eligibility for various forms of federal assistance |
| FHA | Federal Housing Administration |
| FHFA | Federal Housing Finance Agency |
| FHLB | Federal Home Loan Bank of Pittsburgh |
| FICO | Fair Isaac Corporation (“FICO”) credit scores, for Radian’s portfolio statistics, represent the borrower’s credit score at origination and, in circumstances where there is more than one borrower,are multiple borrowers, the lowest of the borrowers’ FICO score for the primary borrowerscores is utilized |
Flow BasisFive Bridges | With respect to mortgage insurance, includes mortgage insurance policies that are written on an individual loan basis as each loan is originated or on an aggregated basis (in which each individual loanFive Bridges Advisors, LLC. Radian acquired the assets of Five Bridges in a group of loans is insured in a single transaction, typically shortly after the loans have been originated). Among other items, Flow Basis business excludes Pool Insurance, which we originated prior to 2009.December 2018 |
| Foreclosure Stage Default | The Stage of Default indicating that the foreclosure sale has been scheduled or held |
| Freddie Mac | Federal Home Loan Mortgage Corporation |
| Front-end | With respect to credit risk transfer programs established by the GSEs, policies written on loans that are to be purchased by the GSEs in the future, as contrasted with loans that are already part of an existing GSE portfolio |
| GAAP | AccountingGenerally accepted accounting principles generally accepted in the U.S., as amended from time to time |
| Green River Capital | Green River Capital LLC, a wholly-owned subsidiary of Clayton |
GSEsGSE(s) | Government-Sponsored Enterprises (Fannie Mae and Freddie Mac) |
| HARP | Home Affordable Refinance Program |
| IBNR | Losses incurred but not reported |
| IIF | Insurance in force, equal to the aggregate unpaid principal balances of the underlying loans |
| Independent Settlement Services | Independent Settlement Services, LLC, a subsidiary of Radian Group, acquired in November 2018 |
| IRC | Internal Revenue Code of 1986, as amended |
| IRS | Internal Revenue Service |
| IRS Matter | Our dispute with the IRS that we settled and fully resolved in the second quarter of 2018 that was related to the Deficiency Amountassessed tax liabilities, penalties and interest from the IRS’s examination of our 2000 through 2007 consolidated federal income tax returns. See Note 9 of Notes to Unaudited Condensed Consolidated Financial Statements for more information. |
JCT | Congressional Joint Committee on Taxation |
| LAE | Loss adjustment expenses, which include the cost of investigating and adjusting losses and paying claims |
Legacy Portfolio | Mortgage insurance written during the poor underwriting years of 2005 through 2008, together with business written prior to 2005 |
| Loss Mitigation Activity/Activities | Activities such as Rescissions, Claim Denials, Claim Curtailments and cancellations |
| LTV | Loan-to-value ratio, calculated as the percentage of the original loan amount to the original value of the property |
| Master Policies | The Prior Master Policy and the 2014 Master Policy, collectivelytogether |
| Minimum Required Assets | A risk-based minimum required asset amount, as defined in the PMIERs, calculated based on net RIF (RIF, net of credits permitted for reinsurance) and a variety of measures related to expected credit performance and other factors |
|
| |
Term | Definition |
| Model Act | Mortgage Guaranty InsurersInsurance Model Act, as issued by the NAIC to establish minimum capital and surplus requirements for mortgage insurers |
| Monthly and Other Recurring Premiums (or Recurring Premium Policies) | Insurance premiums or policies, respectively, where premiums are paid on a monthly or other installment basis, in contrast to Single Premium Policies |
|
| |
| Term | Definition |
| Monthly Premium Policies | Insurance policies where premiums are paid on a monthly installment basis |
| Moody’s | Moody’s Investors Service |
| Mortgage Insurance | Radian’s Mortgage Insurancemortgage insurance business segment, which provides credit-related insurance coverage, principally through private mortgage insurance on residential first-lien mortgage loans, as well as other credit risk management solutions to mortgage lending institutions nationwideand mortgage credit investors |
| MPP Requirement | Certain states’ statutory or regulatory risk-based capital requirement that the mortgage insurer must maintain a minimum policyholder position, which is calculated based on both risk and surplus levels |
| NAIC | National Association of Insurance Commissioners |
| NIW | New insurance written |
| NOL | Net operating loss; for tax purposes, accumulated during years a company reported more tax deductions than taxable income. NOLs may be carried back or carried forward a certain number of years, depending on each jurisdiction, thus reducingvarious factors which can reduce a company’s tax liability |
Notices of Deficiency | Formal letters from the IRS informing the taxpayer of an IRS determination of tax deficiency and appeal rights |
OCI | Other comprehensive income (loss)liability. |
| Persistency Rate | The percentage of insurance in forceIIF that remains in force over a period of time |
| PMIERs | Private Mortgage Insurer Eligibility Requirements effective on December 31, 2015, issued by the GSEs under oversight of the FHFA to set forth requirements an approved insurer must meet and maintain to provide mortgage guaranty insurance on loans acquired by the GSEs |
| PMIERs 1.0 | The original PMIERs effective on December 31, 2015 |
| PMIERs 2.0 | The revised PMIERs issued by the GSEs on September 27, 2018, which became effective on March 31, 2019 |
| Pool Insurance | Pool Insurance differs from primary insurance in that our maximum liability is not limited to a specific coverage percentage on an individual mortgage loan. Instead, an aggregate exposure limit, or “stop loss,” is applied to the initial aggregate loan balance on a group or “pool” of mortgages |
Post-legacy | The time period subsequent to 2008 |
Post-legacy Portfolio | Mortgage insurance on loans written subsequent to 2008mortgages. |
| Prior Master Policy | Radian Guaranty’s master insurance policy, setting forth the terms and conditions of our mortgage insurance coverage, which was in effect prior to the effective date of itsthe 2014 Master Policy |
QSR TransactionsProgram | The quota share reinsurance agreements entered into with a third-party reinsurance provider in the second and fourth quarters of 2012, collectively |
| Radian | Radian Group Inc. together with its consolidated subsidiaries |
| Radian Group | Radian Group Inc. |
| Radian Guaranty | Radian Guaranty Inc., a Pennsylvania domiciled insurance subsidiary of Radian Group |
| Radian Reinsurance | Radian Reinsurance Inc., a Pennsylvania domiciled insurance subsidiary of Radian Group |
| Radian Settlement Services | Radian Settlement Services Inc., a subsidiary of Clayton, formerly known as ValuAmerica, Inc. |
| RBC States | Risk-based capital states, which are those states that currently impose a statutory or regulatory risk-based capital requirement |
| Red Bell | Red Bell Real Estate, LLC, a wholly-owned subsidiary of Clayton |
| Reinstatements | Reversals of previous Rescissions, Claim Denials and Claim Curtailments |
| REMIC | Real Estate Mortgage Investment Conduit |
| REO | Real estate owned |
| Rescission | Our legal right, under certain conditions, to unilaterally rescind coverage on our mortgage insurance policies if we determine that a loan did not qualify for insurance |
| RIF | Risk in force; for primary insurance, RIF is equal to the underlying loan unpaid principal balance multiplied by the insurance coverage percentage, whereas for Pool Insurance, it represents the remaining exposure under the agreements |
| Risk-to-capital | Under certain state regulations, a maximum ratio of net RIF calculated relative to the level of statutory capital |
| RMBS | Residential mortgage-backed securities |
|
| |
| Term | Definition |
Risk-to-capital | Under certain state regulations, a minimum ratio of statutory capital calculated relative to the level of net RIF |
RMBS | Residential mortgage-backed securities |
| S&P | Standard & Poor’s Financial Services LLC |
SAB 118 | Staff Accounting Bulletin No. 118, “Income Tax Accounting Implications of the Tax Cuts and Jobs Act,” issued by the SEC staff in December 2017 |
| SAPP | Statutory accounting principles and practices, includeincluding those required or permitted, if applicable, by the insurance departments of the respective states of domicile of our insurance subsidiaries |
| SEC | United States Securities and Exchange Commission |
Senior Notes due 2017 | Our 9.000% unsecured senior notes due June 2017 ($195.5 million original principal amount, of which the remaining outstanding principal was redeemed in August 2016) |
| Senior Notes due 2019 | Our 5.500% unsecured senior notes due June 2019 ($300 million original principal amount) |
| Senior Notes due 2020 | Our 5.250% unsecured senior notes due June 2020 ($350 million original principal amount) |
| Senior Notes due 2021 | Our 7.000% unsecured senior notes due March 2021 ($350 million original principal amount) |
| Senior Notes due 2024 | Our 4.500% unsecured senior notes due October 2024 ($450 million original principal amount) |
| Services | Radian’s Services business segment, which is primarily a fee-for-service business that offers a broad array of both mortgage, and real estate and title services to market participants across the mortgage and real estate value chain |
Single Premium NIW (or IIF)/ RIF / IIF | New insurance writtenNIW, RIF or insurance in force,IIF, respectively, on Single Premium Policies |
Single Premium Policy/Policy / Policies | Insurance policies where premiums are paid in a single payment, andwhich includes policies written on an individual basis (as each loan is originated) and on an aggregated basis (in which each individual loan in a group of loans is insured in a single transaction, typically shortly after the loans have been originated) |
Single Premium QSR TransactionsProgram | The 2016 Single Premium QSR TransactionAgreement and the 2018 Single Premium QSR Transaction, collectivelyAgreement, together |
| Stage of Default | The stage a loan is in relative to the foreclosure process, based on whether a foreclosure sale has been scheduled or held |
| Statutory RBC Requirement | Risk-based capital requirement imposed by the RBC States, requiring a minimum surplus level and, in certain states, a minimum ratio of statutory capital relative to the level of risk |
| Surplus Note | An intercompany 0.000% surplus note issued by Radian Guaranty to Radian Group |
TCJA | H.R. 1, known as the Tax Cuts and Jobs Act, signed into law on December 22, 2017 |
| Time in Default | The time period from the point a loan reaches default status (based on the month the default occurred) to the current reporting date |
| U.S. | The United States of America |
| U.S. Treasury | United States Department of the Treasury |
| VA | U.S. Department of Veterans Affairs |
ValuAmericaVIE | ValuAmerica, Inc., a wholly-owned subsidiary of ClaytonVariable interest entity |
Cautionary Note Regarding Forward-Looking Statements—Safe Harbor Provisions
All statements in this report that address events, developments or results that we expect or anticipate may occur in the future are “forward-looking statements” within the meaning of Section 27A of the Securities Act of 1933, Section 21E of the Exchange Act and the U.S. Private Securities Litigation Reform Act of 1995. In most cases, forward-looking statements may be identified by words such as “anticipate,” “may,” “will,” “could,” “should,” “would,” “expect,” “intend,” “plan,” “goal,” “contemplate,” “believe,” “estimate,” “predict,” “project,” “potential,” “continue,” “seek,” “strategy,” “future,” “likely” or the negative or other variations on these words and other similar expressions. These statements, which may include, without limitation, projections regarding our future performance and financial condition, are made on the basis of management’s current views and assumptions with respect to future events. Any forward-looking statement is not a guarantee of future performance and actual results could differ materially from those contained in the forward-looking statement. These statements speak only as of the date they were made, and we undertake no obligation to update or revise any forward-looking statements, whether as a result of new information, future events or otherwise. We operate in a changing environment where new risks emerge from time to time and it is not possible for us to predict all risks that may affect us. The forward-looking statements, as well as our prospects as a whole, are subject to risks and uncertainties that could cause actual results to differ materially from those set forth in the forward-looking statements. These risks and uncertainties include, without limitation:
changes in economic and political conditions that impact the size of the insurable market, the credit performance of our insured portfolio, and our business prospects;
changes in the way customers, investors, ratings agencies, regulators or legislators perceive our performance, financial strength and future prospects;
Radian Guaranty’s ability to remain eligible under the PMIERs and other applicable requirements imposed by the FHFA and by the GSEs to insure loans purchased by the GSEs;GSEs, including potential future changes to the PMIERs which, among other things, may be impacted by the general economic environment and housing market, as well as the proposed CCF that would establish capital requirements for the GSEs, if the CCF is finalized;
our ability to successfully execute and implement our capital plans, including our risk distribution strategy through the capital markets and reinsurance markets, and to maintain sufficient holding company liquidity to meet our short- and long-term liquidity needs;
our ability to successfully execute and implement our business plans and strategies, including plans and strategies to reposition and grow our Services segment as well as plans and strategies that require GSE and/or regulatory approvals and licenses;
our ability to maintain an adequate level of capital in our insurance subsidiaries to satisfy existing and future state regulatory requirements;
changes in the charters or business practices of, or rules or regulations imposed by or applicable to, the GSEs, including:which may include changes imposed byin the FHFA that impactrequirements to remain an approved insurer to the GSEs’ business prospects;GSEs, the GSEs’ interpretation and application of the PMIERs, as well as changes impacting loans purchased by the GSEs, such as the GSEs’ requirements regarding mortgage credit and the proposed changes to the PMIERs;loan size and the GSEs’ use of alternative forms of credit enhancement;pricing;
changes in the current housing finance system in the U.S., including the role of the FHA, the GSEs and private mortgage insurers in this system;
any disruption in the servicing of mortgages covered by our insurance policies, as well as poor servicer performance;
a significant decrease in the Persistency Rates of our mortgage insurance on monthly premium products;
competition in our mortgage insurance business, including price competition and competition from the FHA and VA as well as from other forms of credit enhancement;enhancement, including GSE sponsored alternatives to traditional mortgage insurance;
the effect of the Dodd-Frank Wall Street Reform and Consumer Protection Act on the financial services industry in general, and on our businesses in particular;particular, including future changes to the Qualified Mortgage (QM) loan requirements;
legislative and regulatory activity (or inactivity), including the adoption of (or failure to adopt) new laws and regulations, or changes in existing laws and regulations, or the way they are interpreted or applied, including interpretations and guidance pertaining to recently enacted tax reform legislation;applied;
legal and regulatory claims, assertions, actions, reviews, audits, inquiries and investigations that could result in adverse judgments, settlements, fines, injunctions, restitutions or other relief that could require significant expenditures, increased reserves or have other effects on our business;
the amount and timing of potential settlements, payments or adjustments associated with federal or other tax examinations, including the IRS matter;
examinations;
the possibility that we may fail to estimate accurately the likelihood, magnitude and timing of losses in establishing loss reserves for our mortgage insurance business or to accurately calculate and/or project our Available Assets and Minimum Required Assets under the PMIERs, which will be impacted by, among other things, the size and mix of our IIF, the level of defaults in assessing our ability to comply withportfolio, the proposed PMIERs when implemented;level of cash flow generated by our insurance operations and our risk distribution strategies;
volatility in our financial results of operations caused by changes in the fair value of our assets and liabilities, including a significant portion of our investment portfolio, and potential volatility in our Available Assets if proposed changes to the PMIERs requiring us to mark certain of our Available Assets to fair value were to become effective;portfolio;
potential future impairment charges related to our goodwill and other acquired intangible assets, and uncertainties regarding our ability to execute our restructuring plans within expected costs;assets;
changes in GAAP or SAPP rules and guidance, or their interpretation;
our ability to attract and retain key employees; and
legal and other limitations on dividends and other amounts we may receive from our subsidiaries.subsidiaries, including dividends or ordinary course distributions under our internal tax- and expense-sharing arrangements.
For more information regarding these risks and uncertainties as well as certain additional risks that we face, you should refer to the Risk Factors detailed in Item 1A of our 2017Annual Report on Form 10-K for the year ended December 31, 2018, and to subsequent reports filed from time to time with the SEC. We caution you not to place undue reliance on these forward-looking statements, which are current only as of the date on which we issued this report. We do not intend to, and we disclaim any duty or obligation to, update or revise any forward-looking statements to reflect new information or future events or for any other reason.
PART I—FINANCIAL INFORMATION
Item 1. Financial Statements (Unaudited)
Radian Group Inc.
CONDENSED CONSOLIDATED BALANCE SHEETS (UNAUDITED) | | | ($ in thousands, except per-share amounts) | March 31,
2018 | | December 31,
2017 | March 31,
2019 | | December 31,
2018 |
| | | | | | | |
| Assets | | | | | | |
| Investments (Note 5) | | | | | | |
| Fixed-maturities available for sale—at fair value (amortized cost $3,594,591 and $3,426,217) | $ | 3,554,734 |
| | $ | 3,458,719 |
| |
| Fixed-maturities available for sale—at fair value (amortized cost $3,875,919 and $4,098,962) | | $ | 3,897,584 |
| | $ | 4,021,575 |
|
| Trading securities—at fair value | 563,377 |
| | 606,401 |
| 383,992 |
| | 469,071 |
|
| Equity securities—at fair value (at December 31, 2017, classified as available for sale with related cost of $163,106) | 111,032 |
| | 162,830 |
| |
| Short-term investments—at fair value (includes $39,077 and $19,357 of reinvested cash collateral held under securities lending agreements) | 435,756 |
| | 415,658 |
| |
| Other invested assets—at fair value (amortized cost at December 31, 2017) | 3,318 |
| | 334 |
| |
| Equity securities—at fair value (cost of $125,153 and $139,377) | | 125,025 |
| | 130,565 |
|
| Short-term investments—at fair value (includes $6,233 and $11,699 of reinvested cash collateral held under securities lending agreements) | | 1,066,110 |
| | 528,403 |
|
| Other invested assets—at fair value | | 3,059 |
| | 3,415 |
|
| Total investments | 4,668,217 |
| | 4,643,942 |
| 5,475,770 |
| | 5,153,029 |
|
| Cash | 122,481 |
| | 80,569 |
| 118,668 |
| | 95,393 |
|
| Restricted cash | 7,623 |
| | 15,675 |
| 9,086 |
| | 11,609 |
|
| Accounts and notes receivable | 80,068 |
| | 72,558 |
| 89,237 |
| | 78,652 |
|
| Deferred income taxes, net (Note 9) | 253,381 |
| | 229,567 |
| 67,697 |
| | 131,643 |
|
| Goodwill and other intangible assets, net (Note 6) | 61,465 |
| | 64,212 |
| |
| Goodwill and other acquired intangible assets, net (Note 6) | | 56,811 |
| | 58,998 |
|
| Prepaid reinsurance premium | 390,241 |
| | 386,509 |
| 408,622 |
| | 417,628 |
|
| Other assets (Note 8) | 426,773 |
| | 407,849 |
| 373,678 |
| | 367,700 |
|
| Total assets | $ | 6,010,249 |
| | $ | 5,900,881 |
| $ | 6,599,569 |
| | $ | 6,314,652 |
|
| | | | | | | |
| Liabilities and Stockholders’ Equity | | | | | | |
| Unearned premiums | $ | 723,100 |
| | $ | 723,938 |
| $ | 720,159 |
| | $ | 739,357 |
|
| Reserve for losses and loss adjustment expense (“LAE”) (Note 10) | 488,656 |
| | 507,588 |
| |
| Reserve for losses and loss adjustment expense (Note 10) | | 388,784 |
| | 401,361 |
|
| Senior notes (Note 11) | 1,027,875 |
| | 1,027,074 |
| 1,031,197 |
| | 1,030,348 |
|
| Reinsurance funds withheld | 305,409 |
| | 288,398 |
| 329,868 |
| | 321,212 |
|
| Other liabilities (Note 12) | 412,793 |
| | 353,845 |
| 419,470 |
| | 333,659 |
|
| Total liabilities | 2,957,833 |
| | 2,900,843 |
| 2,889,478 |
| | 2,825,937 |
|
| Commitments and contingencies (Note 13) |
| |
|
| |
|
| Stockholders’ equity | | | | | | |
| Common stock: par value $0.001 per share; 485,000,000 shares authorized at March 31, 2018 and December 31, 2017; 233,160,146 and 233,416,989 shares issued at March 31, 2018 and December 31, 2017, respectively; 215,542,607 and 215,814,188 shares outstanding at March 31, 2018 and December 31, 2017, respectively | 233 |
| | 233 |
| |
| Treasury stock, at cost: 17,617,539 and 17,602,801 shares at March 31, 2018 and December 31, 2017, respectively | (894,191 | ) | | (893,888 | ) | |
| Common stock: par value $0.001 per share; 485,000 shares authorized at March 31, 2019 and December 31, 2018; 229,817 and 231,132 shares issued at March 31, 2019 and December 31, 2018, respectively; 212,136 and 213,473 shares outstanding at March 31, 2019 and December 31, 2018, respectively | | 230 |
| | 231 |
|
| Treasury stock, at cost: 17,681 and 17,660 shares at March 31, 2019 and December 31, 2018, respectively | | (895,321 | ) | | (894,870 | ) |
| Additional paid-in capital | 2,748,233 |
| | 2,754,275 |
| 2,697,724 |
| | 2,724,733 |
|
| Retained earnings | 1,229,616 |
| | 1,116,333 |
| 1,889,964 |
| | 1,719,541 |
|
| Accumulated other comprehensive income (loss) (Note 15) | (31,475 | ) | | 23,085 |
| 17,494 |
| | (60,920 | ) |
| Total stockholders’ equity | 3,052,416 |
| | 3,000,038 |
| 3,710,091 |
| | 3,488,715 |
|
| Total liabilities and stockholders’ equity | $ | 6,010,249 |
| | $ | 5,900,881 |
| $ | 6,599,569 |
| | $ | 6,314,652 |
|
See Notes to Unaudited Condensed Consolidated Financial Statements.
Radian Group Inc.
CONDENSED CONSOLIDATED STATEMENTS OF OPERATIONS (UNAUDITED)
| | | | Three Months Ended
March 31, | Three Months Ended
March 31, |
| (In thousands, except per-share amounts) | 2018 |
| 2017 | 2019 |
| 2018 |
| Revenues: | | | | | | |
| Net premiums earned—insurance | $ | 242,550 |
|
| $ | 221,800 |
| $ | 263,512 |
|
| $ | 242,550 |
|
| Services revenue | 33,164 |
|
| 38,027 |
| 32,753 |
|
| 33,164 |
|
| Net investment income | 33,956 |
| | 31,032 |
| 43,847 |
| | 33,956 |
|
| Net gains (losses) on investments and other financial instruments | (18,887 | ) | | (2,851 | ) | 21,913 |
| | (18,887 | ) |
| Other income | 807 |
| | 746 |
| 1,604 |
| | 807 |
|
| Total revenues | 291,590 |
| | 288,754 |
| 363,629 |
| | 291,590 |
|
| Expenses: | | | | | | |
| Provision for losses | 37,283 |
| | 46,913 |
| 20,754 |
| | 37,283 |
|
| Policy acquisition costs | 7,117 |
| | 6,729 |
| 5,893 |
| | 7,117 |
|
| Cost of services | 23,126 |
| | 28,375 |
| 24,157 |
| | 23,126 |
|
| Other operating expenses | 63,243 |
| | 68,377 |
| 78,805 |
| | 63,243 |
|
| Restructuring and other exit costs (Note 1) | 551 |
| | — |
| |
| Restructuring and other exit costs | | — |
| | 551 |
|
| Interest expense | 15,080 |
| | 15,938 |
| 15,697 |
| | 15,080 |
|
| Loss on induced conversion and debt extinguishment | — |
| | 4,456 |
| |
| Amortization and impairment of other intangible assets | 2,748 |
|
| 3,296 |
| |
| Amortization and impairment of other acquired intangible assets | | 2,187 |
|
| 2,748 |
|
| Total expenses | 149,148 |
| | 174,084 |
| 147,493 |
| | 149,148 |
|
| Pretax income | 142,442 |
|
| 114,670 |
| 216,136 |
|
| 142,442 |
|
| Income tax provision | 27,956 |
| | 38,198 |
| 45,179 |
| | 27,956 |
|
| Net income | $ | 114,486 |
|
| $ | 76,472 |
| $ | 170,957 |
|
| $ | 114,486 |
|
| | | | | | | |
| Net income per share: | | | | | | |
| Basic | $ | 0.53 |
| | $ | 0.36 |
| $ | 0.80 |
| | $ | 0.53 |
|
| Diluted | $ | 0.52 |
| | $ | 0.34 |
| $ | 0.78 |
| | $ | 0.52 |
|
| | | |
|
| | |
|
|
| Weighted-average number of common shares outstanding—basic | 215,967 |
| | 214,925 |
| 213,537 |
| | 215,967 |
|
| Weighted-average number of common and common equivalent shares outstanding—diluted | 219,883 |
| | 221,497 |
| 218,343 |
| | 219,883 |
|
| | | | | |
| Dividends per share | $ | 0.0025 |
| | $ | 0.0025 |
| |
See Notes to Unaudited Condensed Consolidated Financial Statements.
Radian Group Inc.
CONDENSED CONSOLIDATED STATEMENTS OF COMPREHENSIVE INCOME (LOSS) (UNAUDITED)
| | | | Three Months Ended
March 31, | Three Months Ended
March 31, |
| (In thousands) | 2018 | | 2017 | 2019 | | 2018 |
| | | | | | | |
| Net income | $ | 114,486 |
| | $ | 76,472 |
| $ | 170,957 |
| | $ | 114,486 |
|
| Other comprehensive income, net of tax (Note 15): | | | | |
| Other comprehensive income (loss), net of tax (Note 15): | | | | |
| Unrealized gains (losses) on investments: | | | | | | |
| Unrealized holding gains (losses) arising during the period | (60,643 | ) | | 7,367 |
| 78,023 |
| | (60,643 | ) |
| Less: Reclassification adjustment for net gains (losses) included in net income | (3,132 | ) | | (1,631 | ) | (391 | ) | | (3,132 | ) |
| Net unrealized gains (losses) on investments | (57,511 | ) | | 8,998 |
| 78,414 |
| | (57,511 | ) |
| Unrealized foreign currency translation adjustments | 3 |
| | 34 |
| — |
| | 3 |
|
| Cumulative effect of adopting the accounting standard update for financial instruments | 224 |
| | — |
| |
| Cumulative effect of adopting the accounting standard update for the reclassification of certain tax effects | 2,724 |
| | — |
| |
| Other comprehensive income (loss), net of tax | (54,560 | ) | | 9,032 |
| 78,414 |
| | (57,508 | ) |
| Comprehensive income | $ | 59,926 |
| | $ | 85,504 |
| $ | 249,371 |
| | $ | 56,978 |
|
See Notes to Unaudited Condensed Consolidated Financial Statements.
Radian Group Inc.
CONDENSED CONSOLIDATED STATEMENTS OF CHANGES IN COMMON STOCKHOLDERS’ EQUITY (UNAUDITED)(UNAUDITED)
| | | | Three Months Ended March 31, | Three Months Ended
March 31, |
| (In thousands) | 2018 | | 2017 | 2019 | | 2018 |
| Common Stock | | | | | | |
| Balance, beginning of period | $ | 233 |
| | $ | 232 |
| $ | 231 |
| | $ | 233 |
|
| Issuance of common stock under incentive and benefit plans | — |
| | 1 |
| |
| Shares repurchased under share repurchase program (Note 14) | | (1 | ) | | — |
|
| Balance, end of period | 233 |
| | 233 |
| 230 |
| | 233 |
|
| | | | | | | |
| Treasury Stock | | | | | | |
| Balance, beginning of period | (893,888 | ) | | (893,332 | ) | (894,870 | ) | | (893,888 | ) |
| Repurchases of common stock under incentive plans | (303 | ) | | (40 | ) | (451 | ) | | (303 | ) |
| Balance, end of period | (894,191 | ) | | (893,372 | ) | (895,321 | ) | | (894,191 | ) |
| | | | | | | |
| Additional Paid-in Capital | | | | | | |
| Balance, beginning of period | 2,754,275 |
| | 2,779,891 |
| 2,724,733 |
| | 2,754,275 |
|
| Issuance of common stock under incentive and benefit plans | 1,433 |
| | 3,548 |
| 1,069 |
| | 1,433 |
|
| Share-based compensation | 2,528 |
| | 3,222 |
| 3,695 |
| | 2,528 |
|
| Impact of extinguishment of convertible senior notes | — |
| | (42,940 | ) | |
| Cumulative effect of adopting the accounting standard update for share-based payment transactions | — |
| | 756 |
| |
| Change in equity component of currently redeemable convertible senior notes | — |
| | (883 | ) | |
| Shares repurchased under share repurchase program (Note 14) | (10,003 | ) | | — |
| (31,773 | ) | | (10,003 | ) |
| Balance, end of period | 2,748,233 |
| | 2,743,594 |
| 2,697,724 |
| | 2,748,233 |
|
| | | | | | | |
| Retained Earnings | | | | | | |
| Balance, beginning of period | 1,116,333 |
| | 997,890 |
| 1,719,541 |
| | 1,116,333 |
|
| Net income | 114,486 |
| | 76,472 |
| 170,957 |
| | 114,486 |
|
| Dividends declared | (540 | ) | | (538 | ) | (534 | ) | | (540 | ) |
| Cumulative effect of adopting the accounting standard update for financial instruments | 2,061 |
| | — |
| — |
| | 2,061 |
|
| Cumulative effect of adopting the accounting standard update for the reclassification of certain tax effects from accumulated other comprehensive income | (2,724 | ) | | — |
| — |
| | (2,724 | ) |
| Cumulative effect of adopting the accounting standard update for share-based payment transactions, net of tax | — |
| | (491 | ) | |
| Balance, end of period | 1,229,616 |
| | 1,073,333 |
| 1,889,964 |
| | 1,229,616 |
|
| | | | | | | |
| Accumulated Other Comprehensive Income (Loss) | | | | | | |
| Balance, beginning of period | 23,085 |
| | (12,395 | ) | (60,920 | ) | | 23,085 |
|
| Net foreign currency translation adjustment, net of tax | 3 |
| | 34 |
| |
| Net unrealized gains (losses) on investments, net of tax | (57,511 | ) | | 8,998 |
| |
| Cumulative effect of adopting the accounting standard update for financial instruments | 224 |
| | — |
| — |
| | 224 |
|
| Cumulative effect of adopting the accounting standard update for the reclassification of certain tax effects from accumulated other comprehensive income | 2,724 |
| | — |
| — |
| | 2,724 |
|
| Net unrealized gains (losses) on investments, net of tax | | 78,414 |
| | (57,511 | ) |
| Net foreign currency translation adjustment, net of tax | | — |
| | 3 |
|
| Balance, end of period | (31,475 | ) | | (3,363 | ) | 17,494 |
| | (31,475 | ) |
| | | | | | | |
| Total Stockholders’ Equity | $ | 3,052,416 |
| | $ | 2,920,425 |
| $ | 3,710,091 |
| | $ | 3,052,416 |
|
See Notes to Unaudited Condensed Consolidated Financial Statements.
| | Radian Group Inc. | CONDENSED CONSOLIDATED STATEMENTS OF CASH FLOWS (UNAUDITED) | | | | | | | | |
| (In thousands) | Three Months Ended
March 31, | Three Months Ended
March 31, |
| 2018 | | 2017 | 2019 | | 2018 |
| Cash flows from operating activities: | | | | | | |
| Net cash provided by (used in) operating activities | $ | 118,447 |
| | $ | 83,932 |
| $ | 217,778 |
| | $ | 118,447 |
|
| Cash flows from investing activities: | | | | | | |
| Proceeds from sales of: | | | | | | |
| Fixed-maturity investments available for sale | 224,597 |
| | 253,121 |
| 435,709 |
| | 224,597 |
|
| Trading securities | | 70,083 |
| | 11,964 |
|
| Equity securities | 55,795 |
| | — |
| 33,278 |
| | 55,795 |
|
| Trading securities | 11,964 |
| | 46,688 |
| |
| Proceeds from redemptions of: | | | | | | |
| Fixed-maturity investments available for sale | 94,356 |
| | 123,683 |
| 79,915 |
| | 94,356 |
|
| Trading securities | 17,890 |
| | 19,543 |
| 23,293 |
| | 17,890 |
|
| Purchases of: | | | | | | |
| Fixed-maturity investments available for sale | (482,260 | ) | | (444,873 | ) | (275,531 | ) | | (482,260 | ) |
| Equity securities | (19,994 | ) | | — |
| (19,767 | ) | | (19,994 | ) |
| Sales, redemptions and (purchases) of: | | | | | | |
| Short-term investments, net | (17,217 | ) | | 57,923 |
| (526,013 | ) | | (17,217 | ) |
| Other assets and other invested assets, net | 92 |
| | 222 |
| 349 |
| | 92 |
|
| Purchases of property and equipment, net | (4,702 | ) | | (7,687 | ) | (6,659 | ) | | (4,702 | ) |
| Acquisitions, net of cash acquired | (261 | ) | | (86 | ) | — |
| | (261 | ) |
| Net cash provided by (used in) investing activities | (119,740 | ) | | 48,534 |
| (185,343 | ) | | (119,740 | ) |
| Cash flows from financing activities: | | | | | | |
| Dividends paid | (540 | ) | | (538 | ) | (534 | ) | | (540 | ) |
| Purchases and redemptions of senior notes | — |
| | (110,160 | ) | |
| Issuance of common stock | 663 |
| | 2,865 |
| 363 |
| | 663 |
|
| Purchase of common shares | (10,003 | ) | | — |
| (31,774 | ) | | (10,003 | ) |
| Credit facility commitment fees paid | (185 | ) | | — |
| (234 | ) | | (185 | ) |
| Change in secured borrowings (Note 12) | 38,719 |
| | — |
| |
| Change in secured borrowings, net (with terms less than 3 months) | | 21,534 |
| | 38,719 |
|
| Proceeds from secured borrowings (with terms greater than 3 months) | 6,550 |
| | — |
| 6,000 |
| | 6,550 |
|
| Payments of secured borrowings (with terms greater than 3 months) | | (7,000 | ) | | — |
|
| Repayment of other borrowings | (50 | ) | | (81 | ) | (38 | ) | | (50 | ) |
| Net cash provided by (used in) financing activities | 35,154 |
| | (107,914 | ) | (11,683 | ) | | 35,154 |
|
| Effect of exchange rate changes on cash and restricted cash | (1 | ) | | 24 |
| — |
| | (1 | ) |
| Increase (decrease) in cash and restricted cash | 33,860 |
| | 24,576 |
| 20,752 |
| | 33,860 |
|
| Cash and restricted cash, beginning of period | 96,244 |
| | 61,814 |
| 107,002 |
| | 96,244 |
|
| Cash and restricted cash, end of period | $ | 130,104 |
| | $ | 86,390 |
| $ | 127,754 |
| | $ | 130,104 |
|
See Notes to Unaudited Condensed Consolidated Financial Statements.
Radian Group Inc.
Notes to Unaudited Condensed Consolidated Financial Statements
1. Condensed Consolidated Financial Statements—Business Overview, Recent Developments and Significant Accounting Policies
Business Overview
We are a diversified mortgage and real estate services business, providing both credit-related insurance coverage and other credit risk management solutions, as well as a broad array of mortgage, and real estate and title services. We have two reportable business segments—Mortgage Insurance and Services.
Mortgage Insurance
Our Mortgage Insurance segment provides credit-related insurance coverage, principally through private mortgage insurance on residential first-lien mortgage loans, as well as other credit risk management solutions, to mortgage lending institutions nationwide.and mortgage credit investors. We provide our mortgage insurance products and services mainly through our wholly-owned subsidiary, Radian Guaranty. Private mortgage insurance plays an important role in the U.S. housing finance system because it promotes affordable home ownership and helps protect mortgage lenders, investors and other beneficiaries by mitigating default-related losses on residential mortgage loans. Generally, these loans are made to home buyers who make down payments of less than 20% of the purchase price for their home or, in the case of refinancings, have less than 20% equity in their homes.home. Private mortgage insurance also facilitates the sale of these low down payment loans in the secondary mortgage market, most of which are currently sold to the GSEs.
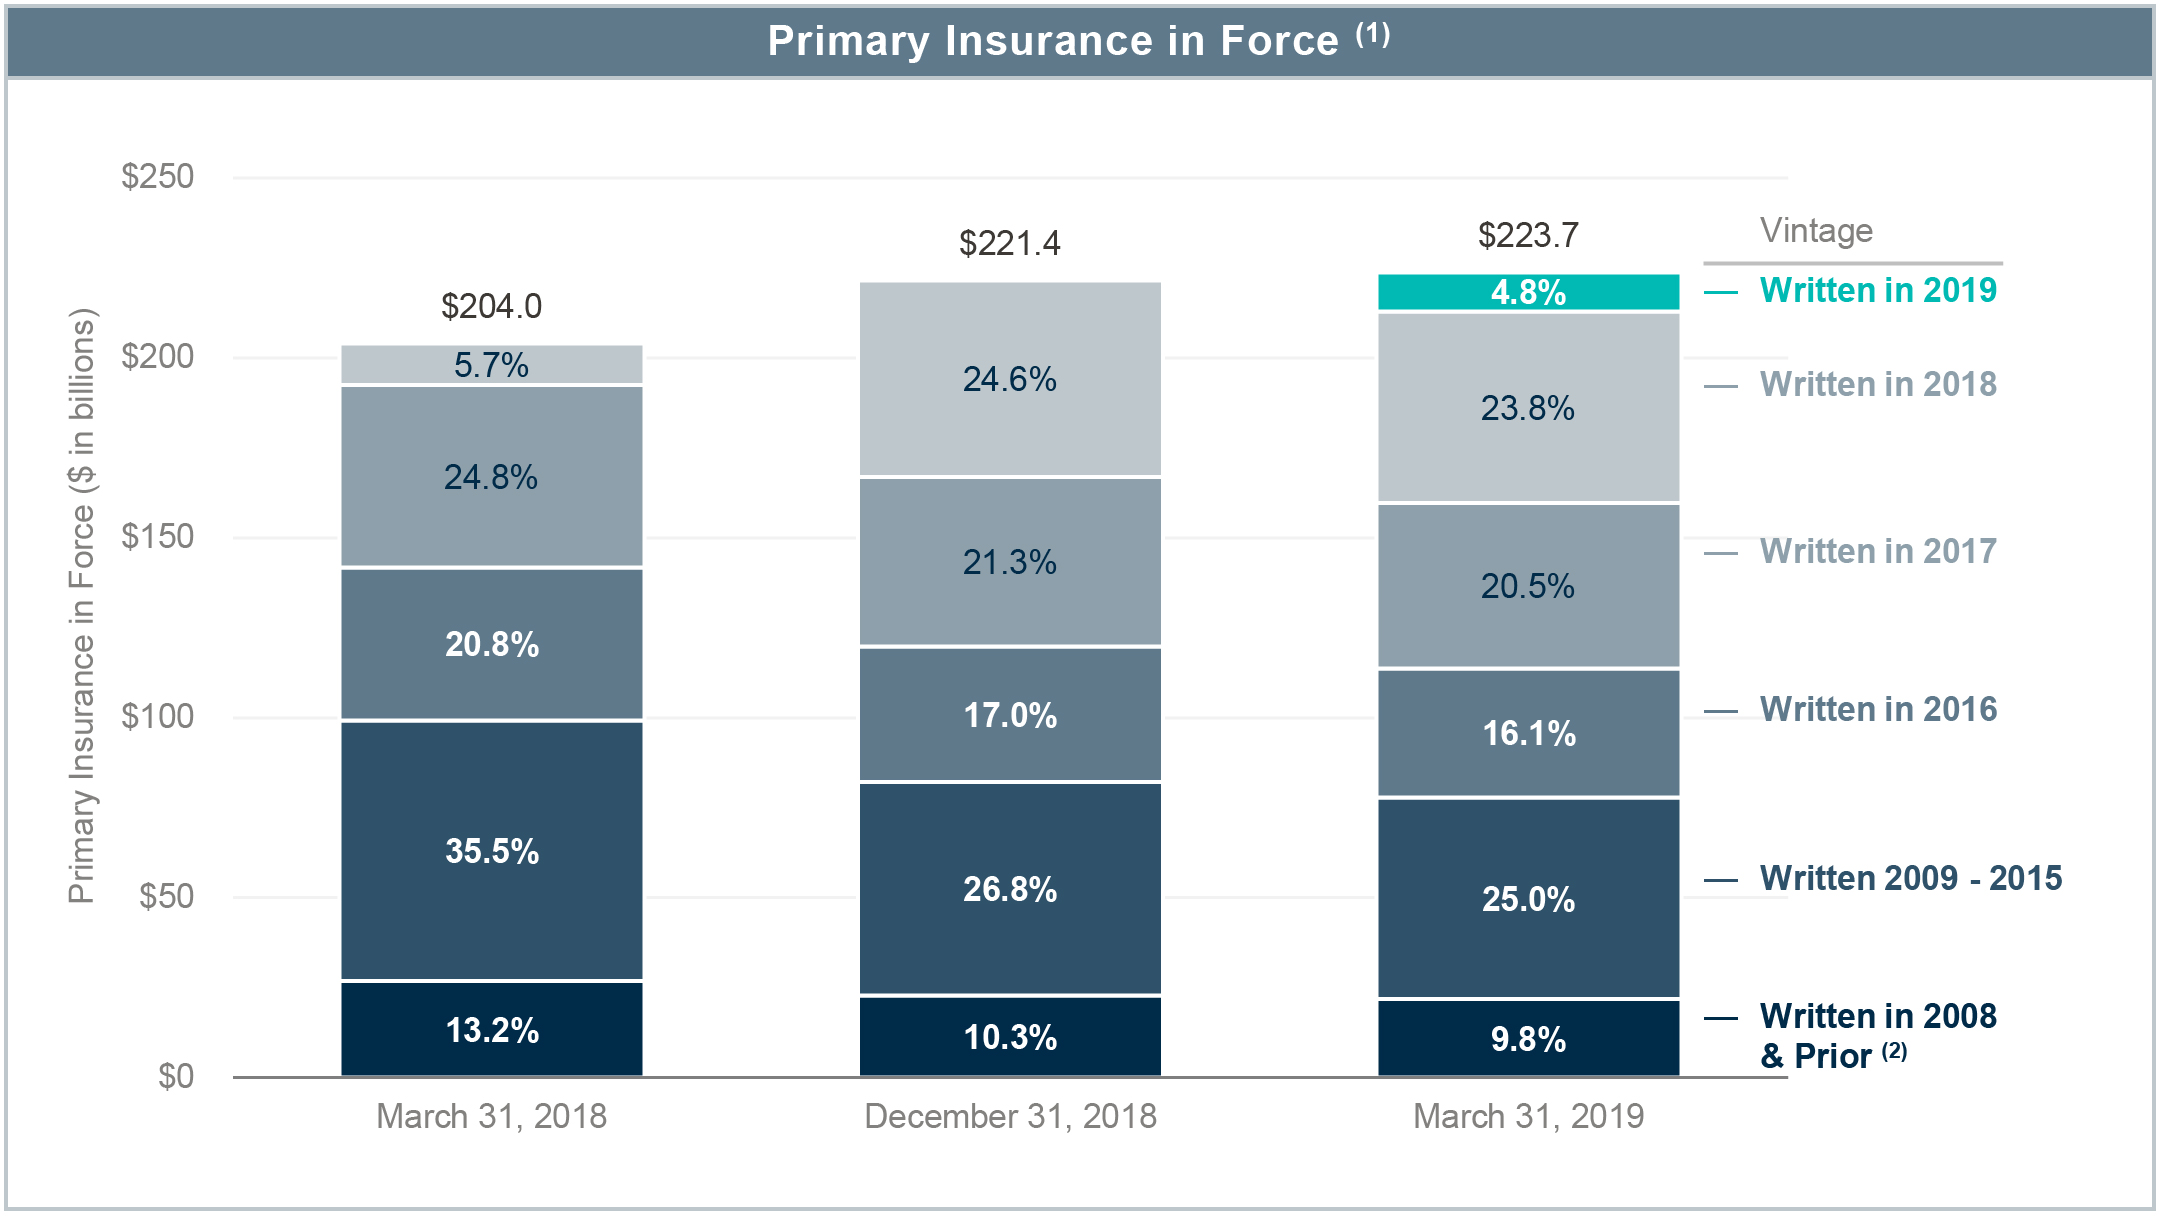
Our Mortgage Insurance segment currently offers primary mortgage insurance coverage on residential first-lien mortgage loans. Our total direct primary mortgage insurance RIF was $52.2$57.4 billion as of March 31, 2018.2019.
The GSEs and state insurance regulators impose various capital and financial requirements on our insurance subsidiaries. These include Risk-to-capital, other risk-based capital measures and surplus requirements, as well as the PMIERs financial requirements discussed below. Failure to comply with these capital and financial requirements may limit the amount of insurance that our mortgage insurance subsidiaries may write or prohibit our mortgage insurance subsidiaries from writing insurance altogether. The GSEs and state insurance regulators also possess significant discretion with respect to our mortgage insurance subsidiaries and all aspects of their business. See Note 16 for additional regulatory information.
PMIERs. In order to be eligible to insure loans purchased by the GSEs, mortgage insurers such as Radian Guaranty must meet the GSEs’ eligibility requirements, or PMIERs. At March 31, 2018,2019, Radian Guaranty is an approved mortgage insurer under the PMIERs and is in compliance with the current PMIERs financial requirements. The PMIERs financial requirements require that a mortgage insurer’s Available Assets meet or exceed its Minimum Required Assets. The GSEs may amend the PMIERs at any time, and they have broad discretion to interpret the requirements, which could impact the calculation of Radian Guaranty’s Available Assets and/or Minimum Required Assets.
The PMIERs are comprehensive, covering virtually all aspects of the business and operations of a private mortgage insurer, including internal risk management and quality controls, the relationship between the GSEs and the approved insurer, as well as the approved insurer’s financial condition. In addition, the GSEs have a broad range of consent rights under the PMIERs and require private mortgage insurers to obtain the prior consent of the GSEs before taking certain actions, which may include paying dividends, entering into various intercompany agreements and commuting or reinsuring risk, among others. If Radian Guaranty is unable to satisfy the requirements set forth in the PMIERs, the GSEs could restrict it from conducting certain types of business with them or take actions that may include not purchasing loans insured by Radian Guaranty.
The PMIERs financial requirements require that a mortgage insurer’s Available Assets meet or exceed its Minimum Required Assets. The GSEs may amend the PMIERs at any time, and they have broad discretion to interpret the requirements, which could impact the calculation of Radian Guaranty’s Available Assets and/or Minimum Required Assets. Further, the PMIERs specifically provide that the factors applied to determine a mortgage insurer’s Minimum Required Assets may be updated every two years following a minimum of 180 days’ notice, or more frequently, as determined by the GSEs. As previously announced, Radian Guaranty received, on a confidential basis, proposed changes to the PMIERs. Based on this information, which has been subject to comment by the private mortgage insurance industry, Radian expects to be able to fully comply with the proposed PMIERs and to maintain an excess of Available Assets over Minimum Required Assets under the PMIERs as of their effective date, which is expected to be no earlier than the end of 2018.
From time to time, we enter into reinsurance transactions as parta component of our long-term risk distribution strategy to manage our capital position and risk profile, which includes managing Radian Guaranty’s capital position under the PMIERs financial requirements. The credit that we receive under the PMIERs financial requirements for these transactions is subject to the periodicinitial and ongoing review ofby the GSEs.
Radian Group Inc.
Notes to Unaudited Condensed Consolidated Financial Statements — (Continued)
Services
Our Services segment is primarily a fee-for-service business that offers a broad array of services to market participants across the mortgage and real estate value chain. These services comprise mortgage services, real estate services and title services, including technology and turn-key solutions, that provide mortgage lenders, financial institutions, mortgage and real estate investors and government entities, among others, with information and other resources and services that are used to originate, evaluate, acquire, securitize, service and monitor residential real estate and loans secured by residential real estate. These services are primarily provided to mortgage lenders, financial institutions, investors and government entities. In addition, we provide title insurance to mortgage lenders as well as directly to borrowers.
Radian Group Inc.
Notes to Unaudited Condensed Consolidated Financial Statements (Continued)
Our mortgage services include transaction managementhelp loan originators and investors evaluate, acquire, surveil and securitize mortgages. These services such asinclude loan review, RMBS securitization and distressed asset reviews, review and valuation services related to single family rental properties, servicer and loan surveillance and underwriting. Our real estate services include:help lenders, investors and real estate agents evaluate, manage, monitor and sell properties. These real estate services include software as a service solutions and platforms, as well as managed services, such as REO asset management; review and valuation services related to single family rental properties;management, real estate valuation services and real estate brokerage services. Our title services include title search,provide a comprehensive suite of title insurance products, title settlement services and both traditional and digital closing services.
20182019 Developments
Capital and Liquidity Actions. On August 9, 2017,March 20, 2019, Radian Group’s board of directors renewedapproved a $150 million increase in authorization for the Company’s existing share repurchase program, authorizingplan, bringing the Companytotal authorization to repurchase shares up to $50$250 million, of its common stock.excluding commissions. During the three months ended March 31, 2018, we2019, the Company purchased 531,0131,546,674 shares at an average price of $18.84$20.54 per share, including commissions. At March 31, 2018,2019, purchase authority of up to $40.0$218.2 million remained available under this program.program, which expires on July 31, 2020. Subsequent to March 31, 2018,2019, we have purchased additional4,131,329 shares of our common stock under this program.program at an average price of $21.94 per share, including commissions. See Note 14 for additional information.details on our share repurchase program.
Restructuring and Other Exit Costs. Pretax restructuring chargesIn April 2019, the Pennsylvania Insurance Department approved a $375 million distribution of $0.6 million were recognizedcapital from Radian Guaranty to Radian Group, which was paid on April 30, 2019 in the first quarterform of cash and marketable securities. See Note 16 for a discussion of this distribution of capital.
Reinsurance. In April 2019, Radian Guaranty entered into a fully collateralized reinsurance agreement with Eagle Re 2019-1. Eagle Re 2019-1 is a VIE and is not a subsidiary or affiliate of Radian Guaranty. This reinsurance agreement provides for up to $562.0 million of aggregate excess-of-loss reinsurance coverage for the mortgage insurance losses on new defaults on an existing portfolio of eligible Recurring Premium Policies issued between January 1, 2018 including $0.5 million in cash expenses. These charges were a result of the Company’s 2017 plan to restructure the Services business. We expect to incur additional pretax charges of approximately $3.1 million under this plan, including approximately $2.5 million in cash payments. These remaining charges are expected to be recognized byand December 31, 2018. The total estimated restructuring charges2018, with an initial RIF of approximately $3.7$10.7 billion. Eagle Re 2019-1 financed its coverage by issuing mortgage insurance-linked notes in an aggregate amount of $562.0 million during 2018 are expected to consist of: (i) asset impairment charges of approximately $0.6 million; (ii) employee severance and benefit costs of approximately $0.9 million; (iii) facility and lease termination costs of approximately $1.6 million; and (iv) contract termination and other restructuring costs of approximately $0.6 million.eligible third-party capital markets investors in an unregistered private offering. See Notes 1 andNote 7 of Notes to Consolidated Financial Statements in our 2017 Form 10-K for additional information, including the events that led to the restructuring decision.
Developments subsequent to March 31, 2018. For informationdetails on events that occurred subsequent to March 31, 2018, including capital actions and the IRS Matter, see Notes 9 and 14, respectively.our reinsurance programs.
Significant Accounting Policies
Basis of Presentation
Our condensed consolidated financial statements are prepared in accordance with GAAP and include the accounts of Radian Group Inc. and its subsidiaries. All intercompany accounts and transactions, and intercompany profits and losses, have been eliminated. We have condensed or omitted certain information and footnote disclosures normally included in consolidated financial statements prepared in accordance with GAAP pursuant to the instructions set forth in Article 10 of Regulation S-X of the SEC.
We refer to Radian Group Inc. together with its consolidated subsidiaries as “Radian,” the “Company,” “we,” “us” or “our,” unless the context requires otherwise. We generally refer to Radian Group Inc. alone, without its consolidated subsidiaries, as “Radian Group.” Unless otherwise defined in this report, certain terms and acronyms used throughout this report are defined in the Glossary of Abbreviations and Acronyms included as part of this report.
The financial information presented for interim periods is unaudited; however, such information reflects all adjustments that are, in the opinion of management, necessary for the fair statement of the financial position, results of operations, comprehensive income and cash flows for the interim periods presented. Such adjustments are of a normal recurring nature. The year-end condensed balance sheet data was derived from our audited financial statements, but does not include all disclosures required by GAAP. These interim financial statements should be read in conjunction with the audited financial statements and notes thereto included in our 20172018 Form 10-K. The results of operations for interim periods are not necessarily indicative of results to be expected for the full year or for any other period. Certain prior period amounts have been reclassified to conform to current period presentation.
Radian Group Inc.
Notes to Unaudited Condensed Consolidated Financial Statements — (Continued)
Use of Estimates
The preparation of financial statements in conformity with GAAP requires us to make estimates and assumptions that affect the reported amounts of assets and liabilities and disclosure of our contingent assets and liabilities at the dates of the financial statements, as well as the reported amounts of revenues and expenses during the reporting periods. While the amounts
Radian Group Inc.
Notes to Unaudited Condensed Consolidated Financial Statements (Continued)
included in our condensed consolidated financial statements include our best estimates and assumptions, actual results may vary materially.
Other Significant Accounting Policies
See Note 2 of Notes to Consolidated Financial Statements in our 20172018 Form 10-K for information regarding other significant accounting policies. There have been no significant changes in our significant accounting policies from those discussed in our 20172018 Form 10-K, other than described below including in “—Revenues“—Leases” and “—“—Recent Accounting Pronouncements—Accounting Standards Adopted during 2018.During 2019.”
Revenue Recognition—ServicesLeases
The FASB issuedWe determine if an updatearrangement includes a lease at inception. A right of use asset and lease liability is recognized for operating leases and is included in other assets and other liabilities, respectively, in our condensed consolidated balance sheet at March 31, 2019. Right-of-use assets represent our right to use an underlying asset for the accounting standard regarding revenue recognition, Revenue from Contracts with Customers, which establishes principles for reporting information about the nature, amount, timinglease term and uncertainty of revenue and cash flowslease liabilities represent our obligation to make lease payments arising from our contracts with customers to provide services. We adopted this update effective January 1, 2018, using the modified retrospective approach. The principle of this update requires an entity to recognize revenue representing the transfer of services to customers in an amount that reflects the consideration that it expects to be entitled to receive in exchange for those services, recognized as the performance obligations are satisfied.
The majority of our revenue-generating transactions are not subject to the new standard as this update did not change revenue recognition principles related to our investmentslease. Operating lease right-of-use assets and insurance products, which together represented the majority of our total revenue for the three months ending March 31, 2018 and are subject to other GAAP guidance discussed elsewhere within our disclosures. This update is primarily applicable to revenues from our Services segment. See “—Business Overview—Services” for information about the services we offer.
The table below represents the disaggregation of Services revenues by revenue type:
|
| | | | | | | |
| | Three Months Ended
March 31, |
| (In thousands) | 2018 | | 2017 |
| Services segment revenue | | | |
Mortgage Services (1) | $ | 13,989 |
| | $ | 18,371 |
|
Real Estate Services (1) | 17,903 |
| | 17,014 |
|
| Title Services | 2,274 |
| | 4,704 |
|
Total (2) | $ | 34,166 |
| | $ | 40,089 |
|
______________________
| |
(1) | 2017 revenues include immaterial amounts of Services revenue related to services that we no longer offer as a result of restructuring our Services business. |
| |
(2) | Includes inter-segment revenues of $1.0 million and $2.1 million for the three months ended March 31, 2018 and 2017, respectively. See Note 3 for segment information. |
Our Services segment revenuesliabilities are recognized over time and measured each periodat the lease commencement date based on the progresspresent value of lease payments over the lease term. Right of use assets are recognized net of any payments made or received from the lessor. In determining the net present value of lease payments, we use our incremental borrowing rate based on the information available at the lease commencement date or as of our date of adoption, January 1, 2019.
Lease expense is recognized on a straight-line basis over the expected lease term. For lease agreements entered into after the adoption of this accounting standard that include lease and non-lease components, such components are generally not accounted for separately. For our building leases, as a result of us having elected to dateadopt the package of practical expedients permitted under the transition guidance, we account for the lease and non-lease components, such as services are performed and made available to customers. Ourcommon area maintenance charges, as a single lease component. We have elected the short-term exemption for contracts with customers, including paymentlease terms are generally short-termof 12 months or less. Prior period amounts continue to be reported in nature; therefore, any impact relatedaccordance with our historic accounting under previous lease guidance.
Our lease agreements primarily relate to timing is immaterial. Revenue recognized related to services made available to customers and billed is reflectedoperating leases for office space we use in accounts receivables. Revenue recognized related to services performed andour operations. Certain of our leases include renewal options and/or termination options that we did not yet billed is recordedconsider in unbilled receivables and reflected in other assets. We have no material bad-debt expense. The following represents balances related to Services contracts asthe determination of the dates indicated:
|
| | | | | | | |
| (In thousands) | March 31, 2018 | | December 31, 2017 |
| Accounts Receivable - Services Contracts | $ | 13,236 |
| | $ | 17,391 |
|
| Unbilled Receivables - Services Contracts | 20,949 |
| | 22,257 |
|
| Deferred Revenues - Services Contracts | 3,481 |
| | 3,235 |
|
Radian Group Inc.
Notes to Unaudited Condensed Consolidated Financial Statements — (Continued)
Revenue expected to be recognized in any future period related to remaining performance obligations,right-of-use asset or the lease liability as we did not consider it reasonably certain that we would exercise such as contracts where revenue is recognized as invoiced and contracts with variable consideration related to undelivered performance obligations, is not material.
Fee-for-Service Contracts
Generally, our contracts with our clientsoptions. Our lease agreements do not include minimum volume commitments and can be terminated atcontain any time by our clients. Although some of our contracts and assignments are recurring in nature, and include repetitive monthly assignments, a significant portion of our engagements are transactional in nature and may be performed in connection with securitizations, loan sales, loan purchasesvariable lease payments, material residual value guarantees or other transactions. Due to the transactional nature of our business, our Services segment revenues may fluctuate from period to period as transactions are commenced or completed.material restrictive covenants. We do not recognize revenue or expense related to amounts advanced by ushave material sublease agreements. As of March 31, 2019, there were no leases which had not yet commenced but that create significant rights and subsequently reimbursed by clientsobligations for maintenance or repairs because we do not take control of the service prior to the client taking control. We record an expense if an advance is made that is not in accordance with a client contract and the client is not obligated to reimburse us.
Due to the nature of the services provided, See Note 12 for more information about our Services arrangements with customers may include any of the following three basic types of contracts:
Fixed-Price Contracts. We use fixed-price contracts in our real estate valuation and component services, our loan review, underwriting and due diligence services as well as our title and closing services. We also use fixed-price contracts in our surveillance business for our servicer oversight services and RMBS surveillance services, and in our asset management business activities. Under fixed-price contracts we agree to perform the specified services and deliverables for a pre-determined per-unit or per-file price or day rate. Each service qualifies as a separate performance obligation and revenue is recognized as the service performed is made available to the client.
Time-and-Expense Contracts. The Services segment also derives a portion of its revenue from professional service activities under time-and-expense contracts. In these types of contracts, we are paid a fixed hourly rate, and we are reimbursed for billable out-of-pocket expenses as work is performed. These contracts are used in our loan review, underwriting and due diligence services. Services revenue consisting of billed time fees and pass-through expenses is recorded over time and based on the progress to date as services are performed and made available to customers. Services revenue may also include expenses billed to clients, which includes travel and other out-of-pocket expenses, and other reimbursable expenses.
Percentage-of-Sale Contracts. Under percentage-of-sale contracts, we are paid a contractual percentage of the sale proceeds upon the sale of each property. These contracts are only used for a portion of our REO management services and our real estate brokerage services. In addition, through the use of our proprietary technology, property leads are sent to select clients. Revenue attributable to services provided under a percentage-of-sale contract is recognized over time and measured based on the progress to date and typically coincides with the client’s successful closing on the property. The revenue recognized for these transactions is based on a percentage of the sale.
In certain instances, fees are received at the time that an asset is assigned to Radian for management. These fees are recorded as deferred revenue and are recognized over time based on progress to date and the availability to customers.lease agreements.
Recent Accounting Pronouncements
Accounting Standards Adopted During 2018. In May 2014, the FASB issued an update to the accounting standard regarding revenue recognition. In July 2015, the FASB delayed the effective date for this updated standard for public companies to interim and annual periods beginning after December 15, 2017, and subsequently issued various clarifying updates. Our adoption of this standard, effective January 1, 2018, had no material impact on our financial statements. The disclosures required by this update are included above in “—Revenue Recognition—Services.”
Radian Group Inc.
Notes to Unaudited Condensed Consolidated Financial Statements — (Continued)
In January 2016, the FASB issued an update that makes certain changes to the standard for the accounting of financial instruments. Among other things, the update requires: (i) equity investments to be measured at fair value with changes in fair value recognized in net income; (ii) the use of the exit price notion when measuring the fair value of financial instruments for disclosure purposes; (iii) separate presentation of financial assets and financial liabilities by measurement category and form of financial asset; and (iv) separate presentation in other comprehensive income of the portion of the total change in the fair value of a liability resulting from a change in the instrument-specific credit risk (also referred to as “own credit”) when the organization has elected to measure the liability at fair value in accordance with the fair value option for financial instruments. The update also eliminates the requirement to disclose the methods and significant assumptions used to estimate the fair value that is required to be disclosed for financial instruments measured at amortized cost on the balance sheet. This update is effective for public companies for fiscal years beginning after December 15, 2017, including interim periods within those fiscal years. In February 2018, the FASB issued technical corrections related to this update, which addresses common questions regarding the application and adoption of the new guidance and the subsequent amendments. As a result of adopting these updates, equity securities are no longer classified as available for sale securities and changes in fair value are recognized through earnings. Consequently, we recorded a cumulative effect adjustment to retained earnings from accumulated other comprehensive income representing unrealized losses related to equity securities in the amount of $0.2 million, net of tax. In addition, we elected to utilize net asset value as a practical expedient to measure certain other investments, which resulted in an increase to other invested assets with an offset to retained earnings in the amount of $2.3 million, net of tax. Our adoption of both these updates effective January 1, 2018 resulted in a net adjustment to retained earnings of $2.1 million. See Notes 4 and 5 for additional information.
In February 2018, the FASB issued an update to the accounting standard regarding income statement reporting of comprehensive income and reclassification of certain tax effects from accumulated other comprehensive income. The amendments in this update allow a reclassification from accumulated other comprehensive income to retained earnings for stranded tax effects resulting from the TCJA. The provisions of this update are effective for fiscal years beginning after December 15, 2018, including interim periods within those fiscal years. Early adoption is permitted, including adoption in an interim period, for reporting periods for which financial statements have not been available for issuance. We elected to early adopt this update effective January 1, 2018. As a result we recorded a reclassification adjustment from other comprehensive income to retained earnings in the amount of $2.7 million. See Note 9 for additional information regarding the TCJA.
Accounting Standards Not Yet Adopted.
2019. In February 2016, the FASB issued an update that replaces the existing accounting and disclosure requirements for leases of property, plant and equipment. The updateequipment, which requires lessees to recognize, as of the lease commencement date, assets and liabilities for all leases with lease terms of more than 12 months, which is a change from the current GAAP requirement to recognize only capital leases on the balance sheet. Pursuant to the new standard, the liability initially recognized for the lease obligation is equal to the present value of the lease payments not yet made, discounted over the lease term at the implicit interest rate of the lease, if available, or otherwise at the lessee’s incremental borrowing rate. The lessee is also required to recognize an asset for its right to use the underlying asset for the lease term, based on the liability subject to certain adjustments, such as for initial direct costs.months. Leases are required to be classified as either operating or finance, with expense on operating leases recorded as a single lease cost on a straight-line basis. For finance leases, interest expense on the lease liability is required to be recognized separately from the straight-line amortization of the right-of-use asset. Quantitative disclosures are required
We elected the optional transition method, which requires the recognition of a cumulative-effect adjustment as of the beginning of the period of adoption, and we also elected the practical expedients for certain items, includingtransitioning existing leases to the costnew standard as of leases, the weighted-average remainingeffective date. As a result of applying the practical expedients: (i) we did not reassess expired or existing contracts to determine if they contain additional leases; (ii) we did not reassess the lease term, the weighted-average discount rateclassification for expired and existing leases; and (iii) we did not reassess initial direct costs for existing leases. Our adoption of this update, effective January 1, 2019, resulted in our recording an increase in other liabilities of $73.5 million, and a maturity analysiscorresponding increase in other assets. The increase to other assets was partially offset by an adjustment for unamortized allowances and incentives of $24.1 million, resulting in a right of use asset of $49.4 million. The increase in other liabilities represents a discounted lease liabilities. Additional qualitativeliability from operating leases, primarily for our various facilities, which represents the present value of these future lease payments discounted at our incremental borrowing rate. Additionally, we expanded our financial statement disclosures are alsoas required by the amendments. Our adoption of this standard did not impact our stockholders’ equity, results of operations or liquidity. See above for a discussion of our accounting policy regarding leases and Note 12.
In March 2017, the natureFASB issued an update to the accounting standard regarding receivables. The new standard requires certain premiums on purchased callable debt securities to be amortized to the earliest call date. The amortization period for callable debt securities purchased at a discount will not be impacted. The provisions of the leases, such as basis, terms and conditions of: (i) variable interest payments; (ii) extension and termination options; and (iii) residual value guarantees. Thisthis update isare effective for public companies for fiscal years
Radian Group Inc.
Notes to Unaudited Condensed Consolidated Financial Statements (Continued)
beginning after December 15, 2018, including interim periods within those fiscal years. Early adoption is permitted.permitted, including adoption in an interim period. The new standard must be adopted by applying the new guidance asadoption of the beginning of the earliest comparative period presented, usingthis update did not have a modified retrospective transition approach with certain optional practical expedients. We are currently evaluating the impact tomaterial effect on our financial statements and future disclosures as a result of this update. See Note 13 of our 2017 Form 10-K for additional information about our leases.disclosures.
Radian Group Inc.
Notes to Unaudited Condensed Consolidated Financial Statements — (Continued)
Accounting Standards Not Yet Adopted. In June 2016, the FASB issued an update to the accounting standard regarding the measurement of credit losses on financial instruments. This update requires that financial assets measured at their amortized cost basis be presented at the net amount expected to be collected. Credit losses relating to available-for-sale debt securities are to be recorded through an allowance for credit losses, rather than a write-down of the asset, with the amount of the allowance limited to the amount by which fair value is less than amortized cost. This update is effective for public companies for fiscal years beginning after December 15, 2019, including interim periods within those fiscal years. Early adoption is permitted for the fiscal years beginning after December 15, 2018, including interim periods within those fiscal years. This update is not applicable to credit losses associated with our mortgage insurance policies. We are currently evaluating the impact toon our financial statements and future disclosures as a result of this update.
In March 2017,August 2018, the FASB issued an update to the accounting standard regarding receivables.long-duration insurance contracts. The new standardstandard: (i) requires certain premiums on purchased callable debt securitiesthat assumptions used to measure the liability for future policy benefits be amortized toreviewed at least annually; (ii) defines and simplifies the earliest call date. Themeasurement of market risk benefits; (iii) simplifies the amortization period for callable debt securities purchased at a discount will not be impacted. The provisions of thisdeferred acquisition costs; and (iv) enhances the required disclosures about long-duration contracts. This update areis effective for fiscal years beginning after December 15, 2020, including interim periods within those fiscal years. Early adoption is permitted. We are currently evaluating the potential impact of the adoption of this update and do not expect it to have a material effect on our financial statements and disclosures.
In August 2018, the FASB issued an update to the accounting standard regarding the capitalization of implementation costs for activities performed in a cloud computing arrangement that is a service contract. The new standard aligns the accounting for implementation costs of hosting arrangements that are service contracts with the accounting for capitalizing internal-use software. This update is effective for fiscal years beginning after December 15, 2019, including interim periods within those fiscal years. Early adoption is permitted, including adoption in an interim period. We are currently evaluating the potential impact of the adoption of this update and do not expect it to have a material effect on our financial statements and future disclosures as a resultdisclosures.
In April 2019, the FASB issued an update to the accounting standards regarding financial instruments and derivatives and hedging, which clarifies the accounting treatment for the measurement of this update.credit losses and provides further clarification on previously issued updates. This update is effective for fiscal years beginning after December 15, 2019, including interim periods within those fiscal years. Early adoption is permitted. We are currently in the process of evaluating the new standard.
Radian Group Inc.
Notes to Unaudited Condensed Consolidated Financial Statements — (Continued)
2. Net Income Per Share
Basic net income per share is computed by dividing net income by the weighted-average number of common shares outstanding, while diluted net income per share is computed by dividing net income attributable to common shareholdersstockholders by the sum of the weighted-average number of common shares outstanding and the weighted-average number of dilutive potential common shares. Dilutive potential common shares relate to our share-based compensation arrangements and our outstanding convertible senior notes.arrangements.
Radian Group Inc.
Notes to Unaudited Condensed Consolidated Financial Statements (Continued)
The calculation of basic and diluted net income per share was as follows:
| | | | Three Months Ended
March 31, | Three Months Ended
March 31, |
| (In thousands, except per-share amounts) | 2018 | | 2017 | 2019 | | 2018 |
| Net income—basic | $ | 114,486 |
| | $ | 76,472 |
| |
Adjustment for dilutive Convertible Senior Notes due 2019, net of tax (1) | — |
| | (215 | ) | |
| Net income—diluted | $ | 114,486 |
| | $ | 76,257 |
| |
| Net income—basic and diluted | | $ | 170,957 |
| | $ | 114,486 |
|
| | | | | | | |
| Average common shares outstanding—basic | 215,967 |
| | 214,925 |
| 213,537 |
| | 215,967 |
|
| Dilutive effect of Convertible Senior Notes due 2017 | — |
| | 701 |
| |
| Dilutive effect of Convertible Senior Notes due 2019 | — |
| | 1,854 |
| |
Dilutive effect of share-based compensation arrangements (2) | 3,916 |
| | 4,017 |
| |
Dilutive effect of share-based compensation arrangements (1) | | 4,806 |
| | 3,916 |
|
| Adjusted average common shares outstanding—diluted | 219,883 |
| | 221,497 |
| 218,343 |
| | 219,883 |
|
| | | | | | | |
| Net income per share: | | | | | | |
| | | | | | | |
| Basic | $ | 0.53 |
| | $ | 0.36 |
| $ | 0.80 |
| | $ | 0.53 |
|
| | | | | | | |
| Diluted | $ | 0.52 |
| | $ | 0.34 |
| $ | 0.78 |
| | $ | 0.52 |
|
______________________
| |
| (1) | As applicable, includes coupon interest, amortization of discount and fees, and other changes in income that would result from the assumed conversion. Included in the three months ended March 31, 2017 is a benefit related to our adjustment of estimated accrued expense to actual amounts, resulting from the January 2017 settlement of our obligations on the remaining Convertible Senior Notes due 2019. |
| |
(2) | The following number of shares of our common stock equivalents issued under our share-based compensation arrangements were not included in the calculation of diluted net income per share because they were anti-dilutive: |
|
| | | | | |
| | Three Months Ended
March 31, |
| (In thousands) | 2019 | | 2018 |
| Shares of common stock equivalents | 169 |
| | 170 |
|
|
| | | | | |
| | Three Months Ended
March 31, |
| (In thousands) | 2018 | | 2017 |
| Shares of common stock equivalents | 170 |
| | 445 |
|
3. Segment Reporting
We have two strategic business units that we manage separately—Mortgage Insurance and Services. Adjusted pretax operating income (loss) for each segment represents segment results on a standalone basis; therefore, inter-segment eliminations and reclassifications required for consolidated GAAP presentation have not been reflected.
We allocate to our Mortgage Insurance segment: (i) corporate expenses based on itsthe segment’s forecasted annual percentage of total revenue, which approximates the estimated percentage of time spent on the Mortgage Insurance segment; (ii) except as described below, all interest expense except for interest expense related to an intercompany note with terms consistent with the original issued amount of $300 million from the Senior Notes due 2019 that were used to fund our purchase of Clayton;expense; and (iii) all corporate cash and investments.
Prior to January 1, 2019, interest expense related to the Clayton Intercompany Note was allocated to our Services segment. Effective January 1, 2019, Radian Group Inc.
Notesrecapitalized the Services segment with a capital contribution that enabled the Services segment to Unaudited Condensed Consolidated Financial Statements — (Continued)
repay the intercompany note and its accumulated allocated interest expense associated with the note, and effective as of the same date, all interest expense is allocated to our Mortgage Insurance segment.
We allocate to our Services segment: (i) corporate expenses based on itsthe segment’s forecasted annual percentage of total revenue, which approximates the estimated percentage of time spent on the Services segment and (ii) as noted above,until January 1, 2019, the allocated interest expense.expense related to the intercompany note as described above. No material corporate cash or investments are allocated to the Services segment. Inter-segment activities are recorded at market rates for segment reporting and eliminated in consolidation.
Contract underwriting activities are reported within our Services segment. We include underwriting-related expenses for mortgage insurance, based on a pro-rata volume of mortgage applications excluding third-party contract underwriting services, in our Mortgage Insurance segment’s other operating expenses before corporate allocations. We include underwriting-related expenses for third-party contract underwriting services, based on a pro-rata volume of mortgage applications, in our Services segment’s cost of services and other operating expenses before corporate allocations, as applicable.
With the exception of goodwill and other acquired intangible assets that relate to our Services segment, which are reviewed as part of our annual goodwill impairment assessment, we do not manage assets by segment.
Adjusted Pretax Operating Income (Loss)
Our senior management, including our Chief Executive Officer (Radian’s chief operating decision maker), uses adjusted pretax operating income (loss) as our primary measure to evaluate the fundamental financial performance of each of Radian’s business segments and to allocate resources to the segments. Adjusted pretax operating income (loss) is defined as pretax income (loss) from continuing operations excluding the effects of net gains (losses) on investments and other financial
Radian Group Inc.
Notes to Unaudited Condensed Consolidated Financial Statements (Continued)
instruments, loss on induced conversion and debt extinguishment, acquisition-related expenses, amortization or impairment of goodwill and other acquired intangible assets, and net impairment losses recognized in earnings and losses from the sale of lines of business.infrequent or unusual non-operating items.
Although adjusted pretax operating income excludes certain items that have occurred in the past and are expected to occur in the future, the excluded items represent those that are: (i) not viewed as part of the operating performance of our primary activities or (ii) not expected to result in an economic impact equal to the amount reflected in pretax income. These adjustments, along with the reasons for their treatment, are described below.
| |
| (1) | Net gains (losses) on investments and other financial instruments. The recognition of realized investment gains or losses can vary significantly across periods as the activity is highly discretionary based on the timing of individual securities sales due to such factors as market opportunities, our tax and capital profile and overall market cycles. Unrealized investment gains and losses arise primarily from changes in the market value of our investments that are classified as trading or equity securities. These valuation adjustments may not necessarily result in realized economic gains or losses. |
Trends in the profitability of our fundamental operating activities can be more clearly identified without the fluctuations of these realized and unrealized gains or losses.losses and changes in fair value of other financial instruments. We do not view them to be indicative of our fundamental operating activities. Therefore, these items are excluded from our calculation of adjusted pretax operating income (loss).
| |
| (2) | Loss on induced conversion and debt extinguishment. Gains or losses on early extinguishment of debt and losses incurred to purchase our convertible debt prior to maturity are discretionary activities that are undertaken in order to take advantage of market opportunities to strengthen our financial and capital positions; therefore, we do not view these activities as part of our operating performance. Such transactions do not reflect expected future operations and do not provide meaningful insight regarding our current or past operating trends. Therefore, these items are excluded from our calculation of adjusted pretax operating income (loss). |
| |
| (3) | Acquisition-related expenses. Acquisition-related expenses represent the costs incurred to effect an acquisition of a business (i.e., a business combination). Because we pursue acquisitions on a strategic and selective basis, and not in the ordinary course of our business, we do not view acquisition-related expenses as a consequence of a primary business activity. Therefore, we do not consider these expenses to be part of our operating performance and they are excluded from our calculation of adjusted pretax operating income (loss). |
| |
| (4) | Amortization or impairment of goodwill and other acquired intangible assets. Amortization of acquired intangible assets represents the periodic expense required to amortize the cost of acquired intangible assets over their estimated useful lives. IntangibleAcquired intangible assets with an indefinite useful life are also periodically reviewed for potential impairment, and impairment adjustments are made whenever appropriate. These charges are not viewed as part of the operating performance of our primary activities and therefore are excluded from our calculation of adjusted pretax operating income (loss). |
Radian Group Inc.
Notes to Unaudited Condensed Consolidated Financial Statements — (Continued)
| |
| (5) | Net impairment losses recognized in earnings and losses from the sale of lines of businessinfrequent or unusual non-operating items. The recognition of net impairment losses on investments and the impairment of other long-lived assets does not result in a cash payment and can vary significantly in both amount and frequency, depending on market credit cycles and other factors. Losses from the sale of lines of business are highly discretionary as a result of strategic restructuring decisions,Infrequent and generallyunusual non-operating items reflect activities that we do not occur in the normal course of our business. We do not view these losses to be indicative of our fundamental operating activities. Therefore, whenever these lossessuch income or loss items occur, we exclude them from our calculation of adjusted pretax operating income (loss). |
Radian Group Inc.
Notes to Unaudited Condensed Consolidated Financial Statements (Continued)
Summarized operating results for our segments for the periods indicated, are as follows:
|
| | | | | | | |
| | Three Months Ended
March 31, |
| (In thousands) | 2019 | | 2018 |
| Mortgage Insurance | | | |
Net premiums written—insurance (1) | $ | 251,586 |
| | $ | 237,980 |
|
| (Increase) decrease in unearned premiums | 10,192 |
| | 4,570 |
|
| Net premiums earned—insurance | 261,778 |
| | 242,550 |
|
| Net investment income | 43,665 |
| | 33,956 |
|
| Other income | 1,196 |
| | 807 |
|
Total (2) | 306,639 |
|
| 277,313 |
|
| | | | |
| Provision for losses | 20,844 |
| | 37,391 |
|
| Policy acquisition costs | 5,893 |
| | 7,117 |
|
| Other operating expenses before corporate allocations | 30,410 |
| | 31,888 |
|
Total (3) | 57,147 |
| | 76,396 |
|
| Adjusted pretax operating income before corporate allocations | 249,492 |
| | 200,917 |
|
| Allocation of corporate operating expenses | 25,625 |
| | 18,577 |
|
| Allocation of interest expense | 15,697 |
| | 10,629 |
|
| Adjusted pretax operating income | $ | 208,170 |
| | $ | 171,711 |
|
|
| | | | | | | |
| | Three Months Ended
March 31, |
| (In thousands) | 2018 | | 2017 |
| Mortgage Insurance | | | |
Net premiums written—insurance (1) | $ | 237,980 |
| | $ | 224,665 |
|
| (Increase) decrease in unearned premiums | 4,570 |
| | (2,865 | ) |
| Net premiums earned—insurance | 242,550 |
| | 221,800 |
|
| Net investment income | 33,956 |
| | 31,032 |
|
| Other income | 807 |
| | 746 |
|
Total (2) | 277,313 |
|
| 253,578 |
|
| | | | |
| Provision for losses | 37,391 |
| | 47,232 |
|
| Policy acquisition costs | 7,117 |
| | 6,729 |
|
| Other operating expenses before corporate allocations | 31,888 |
| | 39,289 |
|
Total (3) | 76,396 |
| | 93,250 |
|
| Adjusted pretax operating income before corporate allocations | 200,917 |
| | 160,328 |
|
| Allocation of corporate operating expenses | 18,577 |
| | 14,186 |
|
| Allocation of interest expense | 10,629 |
| | 11,509 |
|
| Adjusted pretax operating income | $ | 171,711 |
| | $ | 134,633 |
|
______________________
| |
| (1) | Net of ceded premiums written under the QSR Transactions and the Single Premium QSR Transactions.our reinsurance programs. See Note 7 for additional information. |
| |
| (2) | Excludes net gains on investments and other financial instruments of $21.9 million for the three months ended March 31, 2019, and net losses on investments and other financial instruments of $18.9 million for the three months ended March 31, 2018, and net losses on investments and other financial instruments of $2.9 million for the three months ended March 31, 2017, not included in adjusted pretax operating income. |
(3)Includes inter-segment expenses as follows: |
| | | | | | | |
| | Three Months Ended
March 31, |
| (In thousands) | 2019 | | 2018 |
| Inter-segment expenses | $ | 970 |
| | $ | 1,002 |
|
|
| | | | | | | |
| | Three Months Ended
March 31, |
| (In thousands) | 2018 | | 2017 |
| Inter-segment expenses | $ | 1,002 |
| | $ | 2,062 |
|
Radian Group Inc.
Notes to Unaudited Condensed Consolidated Financial Statements — (Continued)
|
| | | | | | | |
| | Three Months Ended
March 31, |
| (In thousands) | 2019 | | 2018 |
| Services | | | |
Net premiums earned—insurance (1) | $ | 1,734 |
| | $ | — |
|
Services revenue (2) | 33,723 |
| | 34,166 |
|
Net investment income (1) | 182 |
| | — |
|
Other income (1) | 408 |
| | — |
|
Total (2) | 36,047 |
| | 34,166 |
|
| | | | |
Provision for losses (1) | (18 | ) | | — |
|
| Cost of services | 24,559 |
| | 23,270 |
|
| Other operating expenses before corporate allocations | 13,435 |
| | 10,744 |
|
| Restructuring and other exit costs | — |
| | 525 |
|
| Total | 37,976 |
| | 34,539 |
|
| Adjusted pretax operating income (loss) before corporate allocations | (1,929 | ) |
| (373 | ) |
| Allocation of corporate operating expenses | 4,171 |
| | 2,784 |
|
| Allocation of interest expense | — |
| (3) | 4,451 |
|
| Adjusted pretax operating income (loss) | $ | (6,100 | ) |
| $ | (7,608 | ) |
|
| | | | | | | |
| | Three Months Ended
March 31, |
| (In thousands) | 2018 | | 2017 |
| Services | | | |
Services revenue (1) | $ | 34,166 |
| | $ | 40,089 |
|
| | | | |
| Cost of services | 23,270 |
| | 28,690 |
|
| Other operating expenses before corporate allocations | 10,744 |
| | 12,604 |
|
Restructuring and other exit costs (2) | 525 |
| | — |
|
| Total | 34,539 |
| | 41,294 |
|
| Adjusted pretax operating income (loss) before corporate allocations | (373 | ) |
| (1,205 | ) |
| Allocation of corporate operating expenses | 2,784 |
| | 3,718 |
|
| Allocation of interest expense | 4,451 |
| | 4,429 |
|
| Adjusted pretax operating income (loss) | $ | (7,608 | ) |
| $ | (9,352 | ) |
______________________
(1)Includes inter-segment revenues as follows: |
| | | | | | | |
| | Three Months Ended
March 31, |
| (In thousands) | 2018 | | 2017 |
| Inter-segment revenues | $ | 1,002 |
| | $ | 2,062 |
|
| |
(2)(1) | Primarily includes employee severanceResults from inclusion of the operations of EnTitle Direct, a national title insurance and related benefit costs. Does not include impairment of long-lived assets, which is not a component of adjusted pretax operating income.settlement services company, acquired in March 2018. |
Selected balance sheet information for our segments,(2)Includes inter-segment revenues as of the periods indicated, is as follows: |
| | | | | | | |
| | Three Months Ended
March 31, |
| (In thousands) | 2019 | | 2018 |
| Inter-segment revenues | $ | 970 |
| | $ | 1,002 |
|
| |
| (3) | Effective January 1, 2019, the Clayton Intercompany Note was repaid using proceeds from an additional capital contribution from Radian Group. As a result of the intercompany note repayment, the Services segment no longer incurs interest expense on the intercompany note. |
|
| | | | | | | | | | | |
| | At March 31, 2018 |
| (In thousands) | Mortgage Insurance | | Services | | Total |
| Total assets | $ | 5,843,685 |
| | $ | 166,564 |
| | $ | 6,010,249 |
|
| | | | | | |
| | At December 31, 2017 |
| (In thousands) | Mortgage Insurance | | Services | | Total |
| Total assets | $ | 5,733,918 |
| | $ | 166,963 |
| | $ | 5,900,881 |
|
Radian Group Inc.
Notes to Unaudited Condensed Consolidated Financial Statements — (Continued)
The reconciliation of adjusted pretax operating income to consolidated pretax income (loss) is as follows:
| | | | Three Months Ended
March 31, | Three Months Ended
March 31, |
| (In thousands) | 2018 |
| 2017 | 2019 | | 2018 |
| Adjusted pretax operating income (loss): | | | | | | |
Mortgage Insurance (1) | $ | 171,711 |
| | $ | 134,633 |
| $ | 208,170 |
| | $ | 171,711 |
|
Services (1) | (7,608 | ) | | (9,352 | ) | (6,100 | ) | | (7,608 | ) |
| Total adjusted pretax operating income | 164,103 |
| | 125,281 |
| 202,070 |
| | 164,103 |
|
| | | | | | | |
| Net losses on investments and other financial instruments | (18,887 | ) | | (2,851 | ) | |
| Loss on induced conversion and debt extinguishment | — |
| | (4,456 | ) | |
| Net gains (losses) on investments and other financial instruments | | 21,913 |
| | (18,887 | ) |
Acquisition-related expenses (2) | — |
| | (8 | ) | (233 | ) | | — |
|
| Amortization and impairment of other intangible assets | (2,748 | ) | | (3,296 | ) | |
Impairment of other long-lived assets and loss from the sale of a business line (3) | (26 | ) | | — |
| |
| Amortization and impairment of other acquired intangible assets | | (2,187 | ) | | (2,748 | ) |
Impairment of other long-lived assets and infrequent or unusual non-operating items (3) | | (5,427 | ) | | (26 | ) |
| Consolidated pretax income | $ | 142,442 |
| | $ | 114,670 |
| $ | 216,136 |
| | $ | 142,442 |
|
______________________
| |
| (1) | Includes inter-segment expenses and revenues as listed in the notes to the preceding tables. |
| |
| (2) | Acquisition-related expenses represent expenses incurred to effect the acquisition of a business, net of adjustments to accruals previously recorded for acquisition expenses. |
| |
| (3) | IncludedThe amount for the three months ended March 31, 2019 is included in other operating expenses on the condensed consolidated statement of operations and primarily relates to impairments of other long-lived assets. The amount for the three months ended March 31, 2018 is included within restructuring and other exit costs. See Note 1.costs on the condensed consolidated statement of operations. |
On a consolidated basis, “adjusted pretax operating income” is a measure not determined in accordance with GAAP. Total adjusted pretax operating income is not a measure of total profitability, and therefore should not be considered in isolation or viewed as a substitute for GAAP pretax income. Our definition of adjusted pretax operating income may not be comparable to similarly-named measures reported by other companies.
Revenue Recognition—Services 4. Fair ValueThe accounting standard on revenue from contracts with customers is primarily applicable to revenues from our Services segment and is not applicable to our investments and insurance products, which represent the majority of our revenue. See Notes 1 and 2 of Notes to Consolidated Financial Instruments
Available for sale securities, trading securities, equity securities and certain other assets are recorded at fair value. All changes in the fair value of trading securities, equity securities and certain other assets are includedStatements in our condensed consolidated statements of operations. All changes in the fair value of available for sale securities are recorded in accumulated other comprehensive income. As a result of our implementation of the update to the standard for the accounting of financial instruments, we elected to measure certain other investments using the net asset value as a practical expedient. See Note 1 “—Significant Accounting Policies—Recent Accounting Pronouncements—Accounting Standards Adopted During 2018” Form 10-K for additional information. There were no other changes toinformation regarding our fair value methodologies during the three months ended March 31, 2018.
In accordance with GAAP, we established a three-level valuation hierarchy for disclosure of fair value measurements based on the transparency of inputs to the valuation of an asset or liability as of the measurement date. The hierarchy gives the highest priority to unadjusted quoted prices in active markets for identical assets or liabilities (Level I measurements)accounting policies and the lowest priority to unobservable inputs (Level III measurements). services we offer.
The level intable below represents the fair value hierarchy within which the fair value measurement falls is determined based on the lowest level input that is significant to the measurement in its entirety. The three levelsdisaggregation of the fair value hierarchy are defined below:Services revenues by revenue type:
|
| | | | | | | |
| | Three Months Ended
March 31, |
| (In thousands) | 2019 | | 2018 |
| Services segment revenue | | | |
| Mortgage Services | $ | 16,063 |
| | $ | 17,498 |
|
| Real Estate Services | 15,836 |
| | 14,394 |
|
| Title Services | 2,232 |
| | 2,274 |
|
Total (1) | $ | 34,131 |
| | $ | 34,166 |
|
______________________
| |
Level I(1) | — Unadjusted quoted pricesIncludes inter-segment revenues of $1.0 million for identical assets or liabilities in active markets thateach of the three months ended March 31, 2019 and 2018, respectively. For the three months ended March 31, 2019, amounts exclude a total of $1.9 million, comprised of Services segment net premiums earned—insurance and net investment income, as both are accessible atexcluded from the measurement date for identical, unrestricted assets or liabilities; |
| |
Level II | — Prices or valuations based on observable inputs other than quoted prices in active markets for identical assets and liabilities; and |
| |
Level III | — Prices or valuations that require inputs that are both significant toscope of the fair value measurement and unobservable. Level III inputs are used to measure fair value only to the extent that observable inputs are not available.revenue recognition standard. |
Our Services segment revenues, other than net premiums earned—insurance and net investment income, are recognized over time and measured each period based on the progress to date as services are performed and made available to customers.
Radian Group Inc.
Notes to Unaudited Condensed Consolidated Financial Statements — (Continued)
Our contracts with customers, including payment terms, are generally short-term in nature; therefore, any impact related to timing is immaterial. Revenue recognized related to services made available to customers and billed is reflected in accounts and notes receivable. Revenue recognized related to services performed and not yet billed is recorded in unbilled receivables and reflected in other assets. Deferred revenue represents advance payments received from customers in advance of revenue recognition. We have no material bad-debt expense. The following represents balances related to Services contracts as of the dates indicated:
|
| | | | | | | |
| (In thousands) | March 31, 2019 | | December 31, 2018 |
| Accounts Receivable - Services Contracts | $ | 13,241 |
| | $ | 15,461 |
|
| Unbilled Receivables - Services Contracts | 22,967 |
| | 19,917 |
|
| Deferred Revenues - Services Contracts | 3,044 |
| | 3,204 |
|
Revenue expected to be recognized in any future period related to remaining performance obligations, such as contracts where revenue is recognized as invoiced and contracts with variable consideration related to undelivered performance obligations, is not material.
4. Fair Value of market activity used to determine the fair value hierarchy is based on the availability of observable inputs market participants would use to price an asset or a liability, including market value price observations. Financial Instruments
We provide a qualitative description of the valuation techniques and inputs used for recurring and non-recurring fair value measurements in our audited financial statements and notes thereto included in our 20172018 Form 10-K. These unaudited condensed consolidated financial statements should be read in conjunction with the audited financial statements and notes thereto included in our 20172018 Form 10-K.
The following is a list of assets that are measured at fair value by hierarchy level as of March 31, 2018:2019:
|
| | | | | | | | | | | | |
| (In thousands) | Level I | | Level II | | Total | |
| Assets at Fair Value | | | | | | |
| Investment Portfolio: | | | | | | |
| U.S. government and agency securities | $ | 178,908 |
| | $ | 33,610 |
| | $ | 212,518 |
| |
| State and municipal obligations | — |
| | 233,827 |
| | 233,827 |
| |
| Money market instruments | 174,541 |
| | — |
| | 174,541 |
| |
| Corporate bonds and notes | — |
| | 2,485,463 |
| | 2,485,463 |
| |
| RMBS | — |
| | 368,495 |
| | 368,495 |
| |
| CMBS | — |
| | 549,986 |
| | 549,986 |
| |
| Other ABS | — |
| | 675,477 |
| | 675,477 |
| |
| Equity securities | 136,107 |
| | 4,998 |
| | 141,105 |
| |
Other investments (1) | — |
| | 653,905 |
| | 653,905 |
| |
Total Investments at Fair Value (2) | 489,556 |
| | 5,005,761 |
| | 5,495,317 |
| (3) |
Total Assets at Fair Value (4) | $ | 489,556 |
| | $ | 5,005,761 |
| | $ | 5,495,317 |
| (3) |
|
| | | | | | | | | | | | |
| (In thousands) | Level I | | Level II | | Total | |
| Assets at Fair Value | | | | | | |
| Investment Portfolio: | | | | | | |
| U.S. government and agency securities | $ | 154,347 |
| | $ | 7,890 |
| | $ | 162,237 |
| |
| State and municipal obligations | — |
| | 372,465 |
| | 372,465 |
| |
| Money market instruments | 144,207 |
| | — |
| | 144,207 |
| |
| Corporate bonds and notes | — |
| | 2,298,885 |
| | 2,298,885 |
| |
| RMBS | — |
| | 254,124 |
| | 254,124 |
| |
| CMBS | — |
| | 520,468 |
| | 520,468 |
| |
| Other ABS | — |
| | 736,518 |
| | 736,518 |
| |
| Foreign government and agency securities | — |
| | 36,576 |
| | 36,576 |
| |
| Equity securities | 136,159 |
| | 1,882 |
| | 138,041 |
| |
Other investments (1) | — |
| | 45,774 |
| | 45,774 |
| |
Total Investments at Fair Value (2) | 434,713 |
| | 4,274,582 |
| | 4,709,295 |
| (3) |
| Total Assets at Fair Value | $ | 434,713 |
| | $ | 4,274,582 |
| | $ | 4,709,295 |
| (3) |
______________________
| |
| (1) | Comprising short-term certificates of deposit and commercial paper. |
| |
| (2) | Does not include certain other invested assets ($3.3 million),of $3.1 million that are primarily invested in limited partnership investments valued using the net asset value as a practical expedient. Includes cash collateral held under securities lending agreements ($39.1 million)of $6.2 million that is reinvested in money market instruments. |
| |
| (3) | Includes $44.4$22.6 million of securities loaned to third-party Borrowers under securities lending agreements, classified as other assets in our condensed consolidated balance sheets. See Note 5 for more information. |
| |
| (4) | Does not include the fair value of an immaterial embedded derivative, which we have accounted for separately as a freestanding derivative and classified in other assets in our condensed consolidated balance sheet. See Note 7 for more information. |
Radian Group Inc.
Notes to Unaudited Condensed Consolidated Financial Statements — (Continued)
The following is a list of assets that are measured at fair value by hierarchy level as of December 31, 2017:2018:
| | | (In thousands) | Level I | | Level II | | Total | | Level I | | Level II | | Total | |
| Assets at Fair Value | | | | | | | | | | | | |
| Investment Portfolio: | | | | | | | | | | | | |
| U.S. government and agency securities | $ | 124,969 |
| | $ | 8,023 |
| | $ | 132,992 |
| | $ | 199,302 |
| | $ | 28,412 |
| | $ | 227,714 |
| |
| State and municipal obligations | — |
| | 386,111 |
| | 386,111 |
| | — |
| | 324,742 |
| | 324,742 |
| |
| Money market instruments | 213,357 |
| | — |
| | 213,357 |
| | 95,132 |
| | — |
| | 95,132 |
| |
| Corporate bonds and notes | — |
| | 2,304,017 |
| | 2,304,017 |
| | — |
| | 2,564,068 |
| | 2,564,068 |
| |
| RMBS | — |
| | 216,749 |
| | 216,749 |
| | — |
| | 353,224 |
| | 353,224 |
| |
| CMBS | — |
| | 503,955 |
| | 503,955 |
| | — |
| | 591,393 |
| | 591,393 |
| |
| Other ABS | — |
| | 676,158 |
| | 676,158 |
| | — |
| | 705,468 |
| | 705,468 |
| |
| Foreign government and agency securities | — |
| | 36,448 |
| | 36,448 |
| | |
| Equity securities | 175,205 |
| | 860 |
| | 176,065 |
| | 136,662 |
| | 3,958 |
| | 140,620 |
| |
Other investments (1) | — |
| | 25,720 |
| | 25,720 |
| | — |
| | 175,113 |
| | 175,113 |
| |
Total Investments at Fair Value (2) | 513,531 |
| | 4,158,041 |
| | 4,671,572 |
| (3) | 431,096 |
| | 4,746,378 |
| | 5,177,474 |
| (3) |
| Total Assets at Fair Value | $ | 513,531 |
| | $ | 4,158,041 |
| | $ | 4,671,572 |
| (3) | |
Total Assets at Fair Value (4) | | $ | 431,096 |
| | $ | 4,746,378 |
| | $ | 5,177,474 |
| (3) |
______________________
| |
| (1) | Comprising short-term certificates of deposit and commercial paper. |
| |
| (2) | Does not include certain other invested assets ($0.3 million),of $3.4 million that are primarily invested in limited partnerships, accounted forpartnership investments valued using the net asset value as cost-method investments and not measured at fair value.a practical expedient. Includes cash collateral held under securities lending agreements ($19.4 million)of $11.7 million that is reinvested in money market instruments. |
| |
| (3) | Includes $28.0$27.9 million of securities loaned to third-party Borrowers under securities lending agreements, classified as other assets in our condensed consolidated balance sheets. See Note 5 for more information. |
| |
| (4) | Does not include the fair value of an immaterial embedded derivative, which we have accounted for separately as a freestanding derivative and classified in other assets in our condensed consolidated balance sheet. See Note 7 for more information. |
ThereAt March 31, 2019 and December 31, 2018, there were no material Level III assets measured at fair value at March 31, 2018 or December 31, 2017, and no Level III liabilities. There were no investment transfers between Level I, Level IIto or from Level III for the three months ended March 31, 20182019 or the year ended December 31, 2018. Activity related to Level III assets and 2017.liabilities (including realized and unrealized gains and losses, purchases, sales, issuances, settlements and transfers) was immaterial for the three months ended March 31, 2019 and the year ended December 31, 2018.
Other Fair Value Disclosure
The carrying value and estimated fair value of other selected assets and liabilities not carried at fair value in our condensed consolidated balance sheets were as follows as of the dates indicated:
|
| | | | | | | | | | | | | | | |
| | March 31, 2019 | | December 31, 2018 |
| (In thousands) | Carrying Amount | | Estimated Fair Value | | Carrying Amount | | Estimated Fair Value |
| Liabilities: | | | | | | | |
| Senior notes | $ | 1,031,197 |
| | $ | 1,051,418 |
| | $ | 1,030,348 |
| | $ | 1,007,687 |
|
| FHLB advances | 108,532 |
| | 109,097 |
| | 82,532 |
| | 82,899 |
|
|
| | | | | | | | | | | | | | | |
| | March 31, 2018 | | December 31, 2017 |
| (In thousands) | Carrying Amount | | Estimated Fair Value | | Carrying Amount | | Estimated Fair Value |
| Assets: | | | | | | | |
Other invested assets (1) | $ | — |
| | $ | — |
| | $ | 334 |
| | $ | 3,226 |
|
| Liabilities: | | | | | | | |
| Senior notes | 1,027,875 |
| | 1,056,437 |
| | 1,027,074 |
| | 1,093,934 |
|
______________________
| |
(1) | As a result of implementing the update to the standard for the accounting of financial instruments effective January 1, 2018, other invested assets are no longer carried at amortized cost. |
Radian Group Inc.
Notes to Unaudited Condensed Consolidated Financial Statements — (Continued)
5. Investments
Available for Sale Securities
Our available for sale securities within our investment portfolio consisted of the following as of the dates indicated:
|
| | | | | | | | | | | | | | | |
| | March 31, 2019 |
| (In thousands) | Amortized Cost | | Fair Value | | Gross Unrealized Gains | | Gross Unrealized Losses |
| Fixed-maturities available for sale: | | | | | | | |
| U.S. government and agency securities | $ | 94,441 |
| | $ | 94,098 |
| (1) | $ | 185 |
| | $ | 528 |
|
| State and municipal obligations | 88,598 |
| | 92,718 |
| | 4,421 |
| | 301 |
|
| Corporate bonds and notes | 2,159,040 |
| | 2,175,975 |
| | 31,450 |
| | 14,515 |
|
| RMBS | 348,746 |
| | 350,238 |
| (2) | 4,242 |
| | 2,750 |
|
| CMBS | 512,190 |
| | 515,604 |
| | 4,873 |
| | 1,459 |
|
| Other ABS | 679,444 |
| | 675,477 |
| | 1,021 |
| | 4,988 |
|
| Total securities available for sale | $ | 3,882,459 |
| | $ | 3,904,110 |
| (3) | $ | 46,192 |
| | $ | 24,541 |
|
|
| | | | | | | | | | | | | | | |
| | March 31, 2018 |
| (In thousands) | Amortized Cost | | Fair Value | | Gross Unrealized Gains | | Gross Unrealized Losses |
| Fixed-maturities available for sale: | | | | | | | |
| U.S. government and agency securities | $ | 65,278 |
| | $ | 63,656 |
| (1) | $ | — |
| | $ | 1,622 |
|
| State and municipal obligations | 157,176 |
| | 159,329 |
| | 3,882 |
| | 1,729 |
|
| Corporate bonds and notes | 1,910,482 |
| | 1,881,117 |
| | 10,525 |
| | 39,890 |
|
| RMBS | 233,144 |
| | 228,040 |
| (2) | 128 |
| | 5,232 |
|
| CMBS | 476,601 |
| | 470,834 |
| | 1,085 |
| | 6,852 |
|
| Other ABS | 736,967 |
| | 736,518 |
| | 1,819 |
| | 2,268 |
|
| Foreign government and agency securities | 32,412 |
| | 32,396 |
| | 257 |
| | 273 |
|
| Total fixed-maturities available for sale | $ | 3,612,060 |
| | $ | 3,571,890 |
| (3) | $ | 17,696 |
| | $ | 57,866 |
|
______________________
| |
| (1) | Includes securities with a fair value of $4.8$10.9 million serving as collateral for FHLB advances. |
| |
| (2) | Includes securities with a fair value of $23.3$103.7 million serving as collateral for FHLB advances. |
| |
| (3) | Includes $17.2$6.5 million of fixed maturityfixed-maturity securities loaned to third-party Borrowers under securities lending agreements, classified as other assets in our condensed consolidated balance sheets, as further described below. |
| | | | December 31, 2017 | December 31, 2018 |
| (In thousands) | Amortized Cost | | Fair Value | | Gross Unrealized Gains | | Gross Unrealized Losses | Amortized Cost | | Fair Value | | Gross Unrealized Gains | | Gross Unrealized Losses |
| Fixed-maturities available for sale: | | | | | | | | | | | | | | |
| U.S. government and agency securities | $ | 69,667 |
| | $ | 69,396 |
| | $ | 96 |
| | $ | 367 |
| $ | 85,532 |
| | $ | 84,070 |
| (1) | $ | 46 |
| | $ | 1,508 |
|
| State and municipal obligations | 156,587 |
| | 161,722 |
| | 5,834 |
| | 699 |
| 138,022 |
| | 138,313 |
| | 2,191 |
| | 1,900 |
|
| Corporate bonds and notes | 1,869,318 |
| | 1,894,886 |
| | 33,620 |
| | 8,052 |
| 2,288,720 |
| | 2,229,885 |
| | 5,053 |
| | 63,888 |
|
| RMBS | 189,455 |
| | 187,229 |
| | 636 |
| | 2,862 |
| 334,843 |
| | 332,142 |
| (2) | 1,785 |
| | 4,486 |
|
| CMBS | 451,595 |
| | 453,394 |
| | 3,409 |
| | 1,610 |
| 546,729 |
| | 539,915 |
| | 544 |
| | 7,358 |
|
| Other ABS | 672,715 |
| | 674,548 |
| | 2,655 |
| | 822 |
| 712,748 |
| | 704,662 |
| | 814 |
| | 8,900 |
|
| Foreign government and agency securities | 31,417 |
| | 32,207 |
| | 823 |
| | 33 |
| |
| Total fixed-maturities available for sale | 3,440,754 |
| | 3,473,382 |
| (1) | 47,073 |
| | 14,445 |
| |
Equity securities available for sale (2) | 176,349 |
| | 176,065 |
| (1) | 1,705 |
| | 1,989 |
| |
| Total debt and equity securities | $ | 3,617,103 |
| | $ | 3,649,447 |
| | $ | 48,778 |
| | $ | 16,434 |
| |
| Total securities available for sale | | $ | 4,106,594 |
| | $ | 4,028,987 |
| (3) | $ | 10,433 |
| | $ | 88,040 |
|
______________________
| |
| (1) | Includes $14.7securities with a fair value of $10.7 million serving as collateral for FHLB advances. |
| |
| (2) | Includes securities with a fair value of $77.7 million serving as collateral for FHLB advances. |
| |
| (3) | Includes $7.4 million of fixed maturity securities and $13.2 million of equityfixed-maturity securities loaned to third-party Borrowers under securities lending agreements, classified as other assets in our condensed consolidated balance sheets, as further described below. |
| |
(2) | Primarily consists of investments in fixed-income and equity exchange-traded funds and publicly-traded business development company equities. |
Radian Group Inc.
Notes to Unaudited Condensed Consolidated Financial Statements — (Continued)
Gross Unrealized Losses and Fair Value of Available for Sale Securities
For securities deemed “available for sale” and that are in an unrealized loss position, the following tables show the gross unrealized losses and fair values, aggregated by investment category and length of time that individual securities have been in a continuous unrealized loss position, as of the dates indicated. Included in the amounts as of March 31, 20182019 and December 31, 2017,2018 are loaned securities under securities lending agreements that are classified as other assets in our condensed consolidated balance sheets, as further described below.
| | | | March 31, 2018 | | March 31, 2019 |
($ in thousands) Description of Securities | Less Than 12 Months | | 12 Months or Greater | | Total | | Less Than 12 Months | | 12 Months or Greater | | Total |
# of securities | | Fair Value | | Unrealized Losses | | # of securities | | Fair Value | | Unrealized Losses | | # of securities | | Fair Value | | Unrealized Losses | | # of securities | | Fair Value | | Unrealized Losses | | # of securities | | Fair Value | | Unrealized Losses | | # of securities | | Fair Value | | Unrealized Losses |
| U.S. government and agency securities | 7 |
| | $ | 41,246 |
| | $ | 1,116 |
| | 3 |
| | $ | 9,520 |
| | $ | 506 |
| | 10 |
| | $ | 50,766 |
| | $ | 1,622 |
| | — |
| | $ | — |
| | $ | — |
| | 9 |
| | $ | 38,177 |
| | $ | 528 |
| | 9 |
| | $ | 38,177 |
| | $ | 528 |
|
| State and municipal obligations | 28 |
| | 79,897 |
| | 1,729 |
| | — |
| | — |
| | — |
| | 28 |
| | 79,897 |
| | 1,729 |
| | 1 |
| | 6,487 |
| | 27 |
| | 3 |
| | 10,983 |
| | 274 |
| | 4 |
| | 17,470 |
| | 301 |
|
| Corporate bonds and notes | 344 |
| | 1,348,488 |
| | 32,623 |
| | 28 |
| | 127,265 |
| | 7,267 |
| | 372 |
| | 1,475,753 |
| | 39,890 |
| | 54 |
| | 220,831 |
| | 2,676 |
| | 148 |
| | 656,876 |
| | 11,839 |
| | 202 |
| | 877,707 |
| | 14,515 |
|
| RMBS | 20 |
| | 112,041 |
| | 1,606 |
| | 27 |
| | 79,087 |
| | 3,626 |
| | 47 |
| | 191,128 |
| | 5,232 |
| | 9 |
| | 60,465 |
| | 124 |
| | 24 |
| | 67,863 |
| | 2,626 |
| | 33 |
| | 128,328 |
| | 2,750 |
|
| CMBS | 67 |
| | 375,353 |
| | 6,592 |
| | 5 |
| | 2,814 |
| | 260 |
| | 72 |
| | 378,167 |
| | 6,852 |
| | 33 |
| | 138,708 |
| | 621 |
| | 19 |
| | 41,516 |
| | 838 |
| | 52 |
| | 180,224 |
| | 1,459 |
|
| Other ABS | 127 |
| | 439,883 |
| | 2,228 |
| | 5 |
| | 4,649 |
| | 40 |
| | 132 |
| | 444,532 |
| | 2,268 |
| | 71 |
| | 321,040 |
| | 2,958 |
| | 41 |
| | 179,398 |
| | 2,030 |
| | 112 |
| | 500,438 |
| | 4,988 |
|
| Foreign government and agency securities | 19 |
| | 20,800 |
| | 273 |
| | — |
| | — |
| | — |
| | 19 |
| | 20,800 |
| | 273 |
| |
| Total | 612 |
| | $ | 2,417,708 |
| | $ | 46,167 |
| | 68 |
| | $ | 223,335 |
| | $ | 11,699 |
| | 680 |
| | $ | 2,641,043 |
| | $ | 57,866 |
| | 168 |
| | $ | 747,531 |
| | $ | 6,406 |
| | 244 |
| | $ | 994,813 |
| | $ | 18,135 |
| | 412 |
| | $ | 1,742,344 |
| | $ | 24,541 |
|
|
| | | | | | | | | | | | | | | | | | | | | | | | | | | | | | | | | |
| | | December 31, 2018 |
($ in thousands) Description of Securities | | Less Than 12 Months | | 12 Months or Greater | | Total |
| | # of securities | | Fair Value | | Unrealized Losses | | # of securities | | Fair Value | | Unrealized Losses | | # of securities | | Fair Value | | Unrealized Losses |
| U.S. government and agency securities | | 2 |
| | $ | 27,415 |
| | $ | 796 |
| | 8 |
| | $ | 23,476 |
| | $ | 712 |
| | 10 |
| | $ | 50,891 |
| | $ | 1,508 |
|
| State and municipal obligations | | 12 |
| | 41,263 |
| | 955 |
| | 16 |
| | 39,982 |
| | 945 |
| | 28 |
| | 81,245 |
| | 1,900 |
|
| Corporate bonds and notes | | 330 |
| | 1,208,430 |
| | 36,284 |
| | 126 |
| | 601,533 |
| | 27,604 |
| | 456 |
| | 1,809,963 |
| | 63,888 |
|
| RMBS | | 15 |
| | 92,315 |
| | 782 |
| | 28 |
| | 77,395 |
| | 3,704 |
| | 43 |
| | 169,710 |
| | 4,486 |
|
| CMBS | | 62 |
| | 328,696 |
| | 3,973 |
| | 33 |
| | 125,728 |
| | 3,385 |
| | 95 |
| | 454,424 |
| | 7,358 |
|
| Other ABS | | 129 |
| | 503,109 |
| | 7,917 |
| | 26 |
| | 89,628 |
| | 983 |
| | 155 |
| | 592,737 |
| | 8,900 |
|
| Total | | 550 |
| | $ | 2,201,228 |
| | $ | 50,707 |
| | 237 |
| | $ | 957,742 |
| | $ | 37,333 |
| | 787 |
| | $ | 3,158,970 |
| | $ | 88,040 |
|
|
| | | | | | | | | | | | | | | | | | | | | | | | | | | | | | | | |
| | December 31, 2017 |
($ in thousands) Description of Securities | Less Than 12 Months | | 12 Months or Greater | | Total |
# of securities | | Fair Value | | Unrealized Losses | | # of securities | | Fair Value | | Unrealized Losses | | # of securities | | Fair Value | | Unrealized Losses |
| U.S. government and agency securities | 6 |
| | $ | 23,309 |
| | $ | 129 |
| | 3 |
| | $ | 9,799 |
| | $ | 238 |
| | 9 |
| | $ | 33,108 |
| | $ | 367 |
|
| State and municipal obligations | 21 |
| | 65,898 |
| | 699 |
| | — |
| | — |
| | — |
| | 21 |
| | 65,898 |
| | 699 |
|
| Corporate bonds and notes | 152 |
| | 672,318 |
| | 4,601 |
| | 32 |
| | 139,105 |
| | 3,451 |
| | 184 |
| | 811,423 |
| | 8,052 |
|
| RMBS | 8 |
| | 19,943 |
| | 204 |
| | 26 |
| | 101,812 |
| | 2,658 |
| | 34 |
| | 121,755 |
| | 2,862 |
|
| CMBS | 35 |
| | 139,353 |
| | 1,395 |
| | 4 |
| | 3,518 |
| | 215 |
| | 39 |
| | 142,871 |
| | 1,610 |
|
| Other ABS | 92 |
| | 260,864 |
| | 777 |
| | 7 |
| | 8,297 |
| | 45 |
| | 99 |
| | 269,161 |
| | 822 |
|
| Foreign government and agency securities | 5 |
| | 7,397 |
| | 33 |
| | — |
| | — |
| | — |
| | 5 |
| | 7,397 |
| | 33 |
|
| Equity securities | 13 |
| | 149,785 |
| | 1,989 |
| | — |
| | — |
| | — |
| | 13 |
| | 149,785 |
| | 1,989 |
|
| Total | 332 |
| | $ | 1,338,867 |
| | $ | 9,827 |
| | 72 |
| | $ | 262,531 |
| | $ | 6,607 |
| | 404 |
| | $ | 1,601,398 |
| | $ | 16,434 |
|
Radian Group Inc.
Notes to Unaudited Condensed Consolidated Financial Statements — (Continued)
Impairments due to credit deterioration that result in a conclusion that the present value of cash flows expected to be collected will not be sufficient to recover the amortized cost basis of the security are considered other-than-temporary. Other declines in fair value (for example, due to interest rate changes, sector credit rating changes or company-specific rating changes) that result in a conclusion that the present value of cash flows expected to be collected will not be sufficient to recover the amortized cost basis of the security also may serve as a basis to conclude that an other-than-temporary impairment has occurred. To the extent we determine that a security is deemed to have had an other-than-temporary impairment, an impairment loss is recognized.
During the three months ended March 31, 2018, we recorded other-than-temporary impairment losses in earnings of $0.9 million due to our intent to sell certain corporate and state and municipal bonds at a loss. For the year ended December 31, 2017, we recorded other-than-temporary impairment losses in earnings of $1.4 million. These losses comprised $0.4 million recorded due to our intent to sell certain corporate bonds at a loss and $1.0 million recorded due to credit deterioration, which included $0.5 million related to a convertible note of a non-public company issuer included in debt securities and $0.5 million related to a privately-placed equity security. There were no credit-related impairment losses recognized in accumulated other comprehensive income (loss) during the three months ended March 31, 2018 or year ended December 31, 2017.
Although we held securities in an unrealized loss position as of March 31, 2018,2019, we did not consider those securities to be other-than-temporarily impaired as of such date. For all investment categories, the unrealized losses of 12 months or greater duration as of March 31, 20182019 were generally caused by interest rate or credit spread movements since the purchase date, and as such, we expect the present value of cash flows to be collected from these securities to be sufficient to recover the amortized cost basis of these securities. As of March 31, 2018,2019, we did not have the intent to sell any debt securities in an unrealized loss position, and we determined that it is more likely than not that we will not be required to sell the securities before recovery of their cost basis, which may be at maturity; therefore, we did not consider these investments to be other-than-temporarily impaired at March 31, 2019.
Other-than-temporary Impairment Activity. To the extent we determine that a security is deemed to have had an other-than-temporary impairment, an impairment loss is recognized. We recognized no other-than-temporary impairment losses in earnings during the three months ended March 31, 2019 and $0.8 million of other-than-temporary impairment losses in earnings
Radian Group Inc.
Notes to Unaudited Condensed Consolidated Financial Statements (Continued)
for the three months ended March 31, 2018. There were no other-than-temporary impairment losses recognized in accumulated other comprehensive income (loss) for those periods.
Trading Securities
The trading securities within our investment portfolio, which are recorded at fair value, consisted of the following as of the dates indicated:
|
| | | | | | | |
| (In thousands) | March 31,
2019 | | December 31,
2018 |
| Trading securities: | | | |
| State and municipal obligations | $ | 128,339 |
| | $ | 168,359 |
|
| Corporate bonds and notes | 203,014 |
| | 228,151 |
|
| RMBS | 18,257 |
| | 21,083 |
|
| CMBS | 34,382 |
| | 51,478 |
|
| Total | $ | 383,992 |
| | $ | 469,071 |
|
|
| | | | | | | |
| (In thousands) | March 31,
2018 | | December 31,
2017 |
| Trading securities: | | | |
| State and municipal obligations | $ | 203,188 |
| | $ | 214,841 |
|
| Corporate bonds and notes | 280,323 |
| | 307,271 |
|
| RMBS | 26,084 |
| | 29,520 |
|
| CMBS | 49,634 |
| | 50,561 |
|
| Foreign government and agency securities | 4,180 |
| | 4,241 |
|
Total (1) | $ | 563,409 |
| | $ | 606,434 |
|
______________________
| |
(1) | Includes a de minimis amount of loaned securities under securities lending agreements that are classified as other assets in our consolidated balance sheets, as further described below. |
For trading securities held at March 31, 2018, we had net unrealized losses associated with those securities of $11.4 million during the three months ended March 31, 2018, compared to net unrealized gains of $3.5 million for the three months ended March 31, 2017. For equity securities held at March 31, 2018, we had net losses of $1.8 million during the three months ended March 31, 2018. Prior to the implementation of the update to the standard for the accounting of financial instruments effective January 1, 2018, the unrealized losses associated with equity securities were classified in accumulated other comprehensive income.
For the three months ended March 31, 2018, we did not transfer any securities from the available for sale or trading categories.
Radian Group Inc.
Notes to Unaudited Condensed Consolidated Financial Statements — (Continued)
Securities Lending Agreements
During the third quarter of 2017, we commenced participationWe participate in a securities lending program whereby we loan certain securities in our investment portfolio to Borrowers for short periods of time. TheseSee Notes 2 and 6 of Notes to Consolidated Financial Statements in our 2018 Form 10-K for additional information about our securities lending agreements are collateralized financing arrangements whereby we transfer securitiesagreements.
Key balances related to third parties through an intermediary in exchange for cash or other securities. In all of our securities lending agreements the securities we transfer to Borrowers (loaned securities) may be transferred or loaned by the Borrowers; however, we maintain effective control over all loaned securities, including: (i) retaining ownership of the securities; (ii) receiving the related investment or other income; and (iii) having the right to request the return of the loaned securities at any time. Although we report such securities at fair value within other assets in our condensed consolidated balance sheets, the detailed information regarding investments provided in this Note includes these securities.
Under our securities lending agreements, the Borrower is required to provide to us collateral, consisting of cash or securities, in amounts generally equal to or exceeding (i) 102% of the value of the loaned securities (105% in the case of foreign securities) or (ii) another agreed-upon percentage not less than 100% of the market value of the loaned securities. Any cash collateral we receive may be invested in liquid assets.
The Borrower generally may return the loaned securities to us at any time, which would require us to return the collateral within the standard settlement period for the loaned securities on the principal exchange or market in which the securities are traded. We manage this liquidity risk associated with cash collateral by maintaining the cash collateral in a short-term money-market fund with daily availability. The credit risk under these programs is reduced by the amounts of collateral received. On a daily basis, the value of the underlying securities that we have loaned to the Borrowers is compared to the value of cash and securities collateral we received from the Borrowers, and additional cash or securities are requested or returned, as applicable. In addition, we are indemnified against counterparty credit risk by the intermediary.
Key components of our securities lending agreements at March 31, 2018 and December 31, 2017 consisted of the following:following as of the dates indicated:
| | | (In thousands) | March 31,
2018 | | December 31,
2017 | March 31,
2019 | | December 31,
2018 |
Loaned securities (1): | | | | | | |
| U.S. government and agency securities | $ | 975 |
| | $ | — |
| $ | — |
| | $ | 9,987 |
|
| Corporate bonds and notes | 15,508 |
| | 13,862 |
| 6,526 |
| | 7,818 |
|
| Foreign government and agency securities | 904 |
| | 867 |
| |
| Equity securities | 27,009 |
| | 13,235 |
| 16,080 |
| | 10,055 |
|
| Total loaned securities, at fair value | $ | 44,396 |
| | $ | 27,964 |
| $ | 22,606 |
| | $ | 27,860 |
|
| | | | | | | |
| Total loaned securities, at amortized cost | $ | 45,266 |
| | $ | 27,846 |
| $ | 22,537 |
| | $ | 28,992 |
|
Securities collateral on deposit from Borrowers (2) | 6,345 |
| | 9,342 |
| 17,372 |
| | 16,815 |
|
Reinvested cash collateral, at estimated fair value (3) | 39,077 |
| | 19,357 |
| 6,233 |
| | 11,699 |
|
______________________
| |
| (1) | Our securities loaned under securities lending agreements are reported at fair value within other assets in our condensed consolidated balance sheets. All of our securities lending agreements are classified as overnight and revolving. None of the amounts are subject to offsetting. |
| |
| (2) | Securities collateral on deposit with us from Borrowers may not be transferred or re-pledged unless the Borrower is in default, and is therefore not reflected in our condensed consolidated financial statements. |
| |
| (3) | All cash collateral received has been reinvested in accordance with the securities lending agreements and is included in short-term investments in our condensed consolidated balance sheets. Amounts payable on the return of cash collateral under securities lending agreements are included within other liabilities in our condensed consolidated balance sheets. |
Radian Group Inc.
Notes to Unaudited Condensed Consolidated Financial Statements — (Continued)
Net Gains (Losses) on Investments and Other Financial Instruments
Net realized and unrealized gains (losses) on investments and other financial instruments consisted of:
|
| | | | | | | |
| | Three Months Ended
March 31, |
| (In thousands) | 2019 | | 2018 |
| Net realized gains (losses): | | | |
Fixed-maturities available for sale (1) | $ | (495 | ) | | $ | (3,120 | ) |
| Equity securities | (680 | ) | | 142 |
|
| Trading securities | (684 | ) | | (538 | ) |
| Other invested assets | 87 |
| | 62 |
|
| Other gains (losses) | 85 |
| | 12 |
|
| Net realized gains (losses) on investments | (1,687 | ) | | (3,442 | ) |
| Other-than-temporary impairment losses | — |
| | (844 | ) |
| Net unrealized gains (losses) on investment securities | 19,469 |
| | (12,804 | ) |
| Total net gains (losses) on investments | 17,782 |
| | (17,090 | ) |
| Net gains (losses) on other financial instruments | 4,131 |
| | (1,797 | ) |
| Net gains (losses) on investments and other financial instruments | $ | 21,913 |
| | $ | (18,887 | ) |
|
| | | | | | | |
| | Three Months Ended March 31, |
| (In thousands) | 2018 | | 2017 |
| Net realized gains (losses): | | | |
| Fixed-maturities available for sale | $ | (3,120 | ) | | $ | (2,509 | ) |
| Equity securities | 142 |
| | — |
|
| Trading securities | (538 | ) | | (5,694 | ) |
| Short-term investments | — |
| | 6 |
|
| Other invested assets | 62 |
| | — |
|
| Other gains (losses) | 12 |
| | 18 |
|
| Net realized gains (losses) on investments | (3,442 | ) | | (8,179 | ) |
| Other-than-temporary impairment losses | (844 | ) | | — |
|
Unrealized gains (losses) on investment securities (1) | (12,804 | ) | | 5,226 |
|
| Total net gains (losses) on investments | (17,090 | ) | | (2,953 | ) |
| Net gains (losses) on other financial instruments | (1,797 | ) | | 102 |
|
| Net gains (losses) on investments and other financial instruments | $ | (18,887 | ) | | $ | (2,851 | ) |
______________________
| |
(1) | These amounts include unrealized gains (losses) on investment securities other than securities available for sale. For the three months ended March 31, 2017, the amount excludes the net change in unrealized gains and losses on equity securities. Prior to the implementation of the update to the standard for the accounting of financial instruments effective January 1, 2018, the unrealized losses associated with equity securities were classified in accumulated other comprehensive income. |
(1)Components of net realized gains (losses) on fixed-maturities available for sale include: |
| | | | | | | |
| | Three Months Ended
March 31, |
| (In thousands) | 2019 | | 2018 |
| Gross investment gains from sales and redemptions | $ | 4,165 |
| | $ | 598 |
|
| Gross investment losses from sales and redemptions | (4,660 | ) | | (3,718 | ) |
Net Unrealized Gains (Losses) on Investment Securities
For each period indicated, the net change in unrealized gains (losses) on investment securities shown below represents a component of net gains (losses) on investments and other financial instruments. The net changes in unrealized gains (losses) on trading securities and equity securities that were still held at each period end were as follows:
|
| | | | | | | |
| | Three Months Ended
March 31, |
| (In thousands) | 2019 | | 2018 |
| Net changes in unrealized gains (losses): | | | |
| Trading securities | $ | 8,587 |
| | $ | (11,420 | ) |
| Equity securities | 7,919 |
| | (1,806 | ) |
| Net changes in unrealized gains (losses) on investment securities | $ | 16,506 |
| | $ | (13,226 | ) |
Radian Group Inc.
Notes to Unaudited Condensed Consolidated Financial Statements (Continued)
Contractual Maturities
The contractual maturities of fixed-maturity investments available for sale were as follows:
| | | | March 31, 2018 | March 31, 2019 |
| | Available for Sale | Available for Sale |
| (In thousands) | Amortized Cost | | Fair Value | Amortized Cost | | Fair Value |
Due in one year or less (1) | $ | 35,241 |
| | $ | 35,146 |
| $ | 93,413 |
| | $ | 93,208 |
|
Due after one year through five years (1) | 745,894 |
| | 735,622 |
| 828,387 |
| | 832,653 |
|
Due after five years through 10 years (1) | 1,016,043 |
| | 989,756 |
| 1,051,235 |
| | 1,060,529 |
|
Due after 10 years (1) | 368,170 |
| | 375,974 |
| 369,044 |
| | 376,401 |
|
RMBS (2) | 233,144 |
| | 228,040 |
| 348,746 |
| | 350,238 |
|
CMBS (2) | 476,601 |
| | 470,834 |
| 512,190 |
| | 515,604 |
|
Other ABS (2) | 736,967 |
| | 736,518 |
| 679,444 |
| | 675,477 |
|
Total (3) | $ | 3,612,060 |
| | $ | 3,571,890 |
| $ | 3,882,459 |
| | $ | 3,904,110 |
|
______________________
| |
| (1) | Actual maturities may differ as a result of calls before scheduled maturity. |
| |
| (2) | RMBS, CMBS and Other ABS are shown separately, as they are not due at a single maturity date. |
| |
| (3) | Includes securities loaned under securities lending agreements.agreements with a fair value of $6.5 million. |
Other
Radian Group Inc.
Notes to Unaudited Condensed Consolidated Financial Statements — (Continued)
OtherFor the three months ended March 31, 2019, we did not transfer any securities from the available for sale or trading categories.
At March 31, 2019 and December 31, 2018, Radianwe had an aggregate amountamounts of $28.1$114.6 million and $88.4 million, respectively, of U.S. government and agency securities and RMBS, classified as fixed-maturities available for sale within our investment securities portfolio, serving as collateral for our FHLB advances. There were no FHLB advances outstanding at December 31, 2017. See Note 12 for additional information.
SecuritiesOur investments include securities on deposit with various state insurance commissioners amounted to $14.9of $16.7 million and $11.8$17.6 million at March 31, 20182019 and December 31, 2017,2018, respectively.
6. Goodwill and Other Acquired Intangible Assets, Net
All of our goodwill and other acquired intangible assets relate to our Services segment. The purchase price allocation for the acquisition of Five Bridges was finalized in the first quarter of 2019. In comparison to the preliminary fair value amounts recorded as of December 31, 2018, the final calculations resulted in: (i) an increase in goodwill of $0.5 million and (ii) decreases in intangible assets of $0.4 million related to technology and $0.1 million related to customer relationships.
The following table shows the changes in the carrying amount of goodwill for the year-to-date periods ended MarchDecember 31, 2018 and DecemberMarch 31, 2017:2019:
|
| | | | | | | | | | | |
| (In thousands) | Goodwill | | Accumulated Impairment Losses | | Net |
| Balance at December 31, 2017 | $ | 197,391 |
| | $ | (186,469 | ) | | $ | 10,922 |
|
| Goodwill acquired | 3,170 |
| | — |
| | 3,170 |
|
| Balance at December 31, 2018 | 200,561 |
| | (186,469 | ) | | 14,092 |
|
| Goodwill acquired | 538 |
| | — |
| | 538 |
|
| Balance at March 31, 2019 | $ | 201,099 |
| | $ | (186,469 | ) | | $ | 14,630 |
|
|
| | | | | | | | | | | |
| (In thousands) | Goodwill | | Accumulated Impairment Losses | | Net |
| Balance at December 31, 2016 | $ | 197,265 |
| | $ | (2,095 | ) | | $ | 195,170 |
|
| Goodwill acquired | 126 |
| | — |
| | 126 |
|
| Impairment losses | — |
| | (184,374 | ) | | (184,374 | ) |
| Balance at December 31, 2017 | 197,391 |
| | (186,469 | ) | | 10,922 |
|
| Goodwill acquired | — |
| | — |
| | — |
|
| Impairment losses | — |
| | — |
| | — |
|
| Balance at March 31, 2018 | $ | 197,391 |
| | $ | (186,469 | ) | | $ | 10,922 |
|
Accounting Policy ConsiderationsGlossaryGoodwill is an asset representing the estimated future economic benefits arising from the assets we have acquired that are not individually identified and separately recognized, and includes the value of the discounted expected future cash flows from these businesses, the workforce, expected synergies with our other affiliates and other unidentifiable intangible assets. Goodwill is deemed to have an indefinite useful life and is subject to review for impairment annually, or more frequently, whenever events and circumstances indicate potential impairment. For purposes of performing our goodwill impairment test, we have concluded that the Services segment constitutes one reporting unit to which all of our recorded goodwill is related.Radian Group Inc.
For additional information on our accounting policies for goodwill and other intangible assets, see Note 2 of Notes to Unaudited Condensed Consolidated Financial Statements in our 2017 Form 10-K.(Continued)
Other Intangible Assets
The following is a summary of the gross and net carrying amounts and accumulated amortization of our other acquired intangible assets as of the periods indicated:
|
| | | | | | | | | | | |
| | March 31, 2019 |
| (In thousands) | Original Amount Acquired | | Accumulated Amortization and Impairment | | Net Carrying Amount |
| Client relationships | $ | 83,860 |
| | $ | (49,751 | ) | (1) | $ | 34,109 |
|
| Technology | 16,964 |
| | (13,575 | ) | (2) | 3,389 |
|
| Trade name and trademarks | 8,340 |
| | (4,080 | ) | | 4,260 |
|
| Non-competition agreements | 185 |
| | (179 | ) | | 6 |
|
| Licenses | 463 |
| | (46 | ) | | 417 |
|
| Total | $ | 109,812 |
| | $ | (67,631 | ) | | $ | 42,181 |
|
|
| | | | | | | | | | | |
| | March 31, 2018 |
| (In thousands) | Original Amount Acquired | | Accumulated Amortization and Impairment | | Net Carrying Amount |
Client relationships (1) | $ | 82,530 |
| | $ | (43,254 | ) | | $ | 39,276 |
|
Technology (2) | 15,250 |
| | (9,457 | ) | | 5,793 |
|
| Trade name and trademarks | 8,340 |
| | (3,218 | ) | | 5,122 |
|
| Client backlog | 6,680 |
| | (6,343 | ) | | 337 |
|
| Non-competition agreements | 185 |
| | (170 | ) | | 15 |
|
| Total | $ | 112,985 |
| | $ | (62,442 | ) | | $ | 50,543 |
|
Radian Group Inc.
Notes to Unaudited Condensed Consolidated Financial Statements — (Continued)
| | | | December 31, 2017 | December 31, 2018 |
| (In thousands) | Original Amount Acquired | | Accumulated Amortization | | Net Carrying Amount | Original Amount Acquired | | Accumulated Amortization | | Net Carrying Amount |
Client relationships (1) | $ | 82,530 |
| | $ | (41,596 | ) | | $ | 40,934 |
| |
Technology (2) | 15,250 |
| | (8,922 | ) | | 6,328 |
| |
| Client relationships | | $ | 84,000 |
| | $ | (48,227 | ) | (1) | $ | 35,773 |
|
| Technology | | 17,362 |
| | (13,141 | ) | (2) | 4,221 |
|
| Trade name and trademarks | 8,340 |
| | (3,003 | ) | | 5,337 |
| 8,340 |
| | (3,864 | ) | | 4,476 |
|
| Client backlog | 6,680 |
| | (6,006 | ) | | 674 |
| |
| Non-competition agreements | 185 |
| | (168 | ) | | 17 |
| 185 |
| | (177 | ) | | 8 |
|
| Licenses | | 463 |
| | (35 | ) | | 428 |
|
| Total | $ | 112,985 |
| | $ | (59,695 | ) | | $ | 53,290 |
| $ | 110,350 |
| | $ | (65,444 | ) | | $ | 44,906 |
|
______________________
| |
| (1) | Includes an impairment charge of $14.9 million in the quarter ended June 30, 2017. |
| |
| (2) | Includes an impairment charge of $0.9 million in the quarter ended June 30, 2017. |
The estimated aggregate amortization expense for the remainder of 20182019 and thereafter is as follows (in thousands):
|
| | | |
| 2019 | $ | 6,416 |
|
| 2020 | 7,236 |
|
| 2021 | 5,822 |
|
| 2022 | 5,290 |
|
| 2023 | 4,839 |
|
| 2024 and thereafter | 12,578 |
|
| Total | $ | 42,181 |
|
|
| | | |
| 2018 | $ | 7,569 |
|
| 2019 | 8,790 |
|
| 2020 | 7,412 |
|
| 2021 | 5,833 |
|
| 2022 | 5,081 |
|
| 2023 | 4,428 |
|
| Thereafter | 11,430 |
|
| Total | $ | 50,543 |
|
Generally,For additional information on our accounting policies for tax purposes, substantially all of our goodwill and other acquired intangible assets, are deductiblesee Notes 2 and will be amortized over a period7 of 15 years from acquisition.Notes to Consolidated Financial Statements in our 2018 Form 10-K.
7. Reinsurance
The effectIn our insurance business, we use reinsurance as part of reinsurance on net premiums writtenour risk distribution strategy, including to manage our capital position and earned is as follows:risk profile. Premiums are primarily ceded under the Single Premium QSR Program, the QSR Program and the Excess-of-Loss Program.
|
| | | | | | | |
| | Three Months Ended
March 31, |
| (In thousands) | 2018 |
| 2017 |
| Net premiums written—insurance: | | | |
| Direct | $ | 257,911 |
| | $ | 239,645 |
|
Ceded (1) | (19,931 | ) | | (14,980 | ) |
| Net premiums written—insurance | $ | 237,980 |
| | $ | 224,665 |
|
| Net premiums earned—insurance: | | | |
| Direct | $ | 258,743 |
| | $ | 236,062 |
|
| Assumed | 6 |
| | 7 |
|
Ceded (1) | (16,199 | ) | | (14,269 | ) |
| Net premiums earned—insurance | $ | 242,550 |
| | $ | 221,800 |
|
______________________
| |
(1) | Net of profit commission. |
Radian Group Inc.
Notes to Unaudited Condensed Consolidated Financial Statements — (Continued)
The effect of all of our reinsurance programs on our net premiums written and earned is as follows:
|
| | | | | | | |
| | Three Months Ended
March 31, |
| (In thousands) | 2019 |
| 2018 |
| Net premiums written—insurance: | | | |
| Direct | $ | 261,031 |
| | $ | 256,599 |
|
Assumed (1) | 2,445 |
| | 1,312 |
|
Ceded (2) | (10,156 | ) | | (19,931 | ) |
| Net premiums written—insurance | $ | 253,320 |
| | $ | 237,980 |
|
| | | | |
| Net premiums earned—insurance: | | | |
| Direct | $ | 280,223 |
| | $ | 257,431 |
|
Assumed (1) | 2,450 |
| | 1,318 |
|
Ceded (2) | (19,161 | ) | | (16,199 | ) |
| Net premiums earned—insurance | $ | 263,512 |
| | $ | 242,550 |
|
______________________
| |
| (1) | Includes premiums earned from our participation in certain Front-end and Back-end credit risk transfer programs. |
| |
| (2) | Net of profit commission. |
Single Premium QSR TransactionsProgram
In the first quarter of 2016, Radian Guaranty entered into the 2016 Single Premium QSR TransactionAgreement with a panel of third-party reinsurers. Effective December 31, 2017, we amended the 2016 Single Premium QSR Transaction to increase the amount of ceded risk on performing loans under the agreement from 35% to 65% for the 2015 through 2017 vintages. As of the effective date, the result of this amendment increases the amount of risk ceded on Single Premium Policies, including for the purposes of calculating any future ceding commissions and profit commissions that Radian Guaranty will earn. It will also increase the future amounts of our ceded premiums and ceded losses. As of January 1, 2018, Radian Guaranty is no longer ceding NIW under this transaction.arrangement. RIF ceded under the 2016 Single Premium QSR TransactionAgreement was $6.8$6.1 billion and $3.9$6.8 billion as of March 31, 20182019 and 2017,2018, respectively.
In October 2017, we entered into the 2018 Single Premium QSR TransactionAgreement with a panel of third-party reinsurers. Under the 2018 Single Premium QSR Transaction,Agreement, we expect to cede 65% of our Single Premium NIW beginning with the business written in January 2018, subject to certain conditions that may affect the amount ceded, including a limitation on ceded premiums written equal to $335 million for policies issued between January 1, 2018 and December 31, 2019. Notwithstanding this limitation, the parties may mutually agree to amend the agreement, including with respect to any limitations on the amounts of insurance that may be ceded. RIF ceded under the 2018 Single Premium QSR TransactionAgreement was $2.1 billion and $0.4 billion as of March 31, 2018.2019 and 2018, respectively.
Ceding commissions earned under the Single Premium QSR Program were $5.8 million and $5.3 million for the three months ended March 31, 2019 and 2018, respectively, and ceded losses were $1.5 million and $0.9 million for the three months ended March 31, 2019 and 2018, respectively.
QSR TransactionsProgram
In 2012, Radian Guaranty entered into the QSR TransactionsProgram with a third-party reinsurance provider. Radian Guaranty has ceded the maximum amount permitted under the QSR TransactionsProgram and is no longer ceding NIW under these transactions.this program. RIF ceded under the QSR TransactionsProgram was $1.1$0.8 billion and $1.5$1.1 billion as of March 31, 2019 and 2018, respectively. Ceding commissions earned under the QSR Program were $2.9 million and $3.5 million for the three months ended March 31, 2019 and 2018, respectively, and ceded losses were $0.2 million for the three months ended March 31, 2019 and 2018.
Excess-of-Loss Program
In November 2018, Radian Guaranty entered into a fully collateralized reinsurance agreement with Eagle Re 2018-1. Eagle Re 2018-1 is a VIE and is not a subsidiary or affiliate of Radian Guaranty. This reinsurance agreement provides for up to $434.0 million of aggregate excess-of-loss reinsurance coverage for the applicable percentage of mortgage insurance losses on new defaults on an existing portfolio of eligible Recurring Premium Policies issued between January 1, 2017 and December 31, 2017, with an initial RIF of $9.1 billion. In addition, Radian Guaranty entered into a separate excess-of-loss reinsurance agreement for up to $21.4 million of coverage, representing a pro rata share of the credit risk alongside the risk assumed by Eagle Re 2018-1 on those Recurring Premium Policies.
Radian Group Inc.
Notes to Unaudited Condensed Consolidated Financial Statements (Continued)
The aggregate excess of loss reinsurance coverage decreases over a ten-year period as the principal balances of the underlying covered mortgages decrease and as claims are paid by Eagle Re 2018-1 or the mortgage insurance is canceled. The outstanding reinsurance coverage amount will begin amortizing after an initial period in which a target level of credit enhancement is obtained and stop amortizing if certain thresholds are reached, such as if the reinsured mortgages were to experience an elevated level of delinquencies or certain credit enhancement tests were not maintained. Radian Guaranty has rights to terminate the reinsurance agreement upon the occurrence of certain events.
Eagle Re 2018-1 financed its coverage by issuing mortgage insurance-linked notes in an aggregate amount of $434.0 million to eligible third-party capital markets investors in an unregistered private offering. Although there is no recourse to Radian Guaranty by the holders of the mortgage insurance-linked notes, reinsurance does not relieve us of our obligations to our policyholders. In the event the VIE is unable to meet its obligations to us, our insurance subsidiaries would be liable to make claims payments to our policyholders. In the event that all of the assets in the reinsurance trust (consisting of U.S. government money market funds, cash or U.S. Treasury securities) have become worthless and the VIE is unable to make its payments to us, our maximum potential loss would be the amount of mortgage insurance claim payments for losses on the insured policies, net of the aggregate reinsurance payments already received, up to the full $434.0 million aggregate excess-of-loss reinsurance coverage amount. In the same scenario, the related embedded derivative of $1.7 million, currently recorded in other assets, would no longer have value.
Eagle Re 2018-1 represents our only VIE as of March 31, 2019. The following table presents the total assets of Eagle Re 2018-1 as well as Radian Guaranty’s maximum exposure to loss associated with Eagle Re 2018-1, as of the dates indicated.
|
| | | | | | | | | | | | | | | |
| | | At March 31, 2019 |
| | | | | Maximum Exposure to Loss |
| (In thousands) | | Total VIE Assets (1) | | On - Balance Sheet | | Off - Balance Sheet (2) | | Total |
| Eagle Re 2018-1 | | $ | 434,034 |
| | $ | 1,683 |
| (3) | $ | 434,034 |
| | 435,717 |
|
| Total | | $ | 434,034 |
| | $ | 1,683 |
| | $ | 434,034 |
| | 435,717 |
|
| | | | | | | | | |
| | | At December 31, 2018 |
| | | | | Maximum Exposure to Loss |
| (In thousands) | | Total VIE Assets (1) | | On - Balance Sheet | | Off - Balance Sheet (2) | | Total |
| Eagle Re 2018-1 | | $ | 434,034 |
| | $ | 1,114 |
| (3) | $ | 434,034 |
| | 435,148 |
|
| Total | | $ | 434,034 |
| | $ | 1,114 |
| | $ | 434,034 |
| | 435,148 |
|
______________________
| |
| (1) | Assets of Eagle Re 2018-1 are required to be invested in U.S. government money market funds, cash or U.S. Treasury securities. Liabilities of Eagle Re 2018-1 consist of its mortgage insurance-linked notes of $434.0 million, as described above. |
| |
| (2) | Represents the maximum amount that would be payable in the future by Radian Guaranty to its policyholders on claims, without the benefit of any corresponding reinsurance recoverables, in the event of the combination of two events: (i) all of the assets in the reinsurance trust (consisting of U.S. government money market funds, cash or U.S. Treasury securities) have become worthless and (ii) $660.4 million of claims have been paid on the reinsured RIF. |
| |
| (3) | Represents the fair value of the related embedded derivative, included in other assets in our condensed consolidated balance sheets. |
There were no ceding commissions earned or ceded losses under the Excess-of-Loss Program for the three months ended March 31, 2019.
Activity Subsequent to March 31, 2019
In April 2019, Radian Guaranty entered into a fully collateralized reinsurance agreement with Eagle Re 2019-1. Eagle Re 2019-1 is a VIE and is not a subsidiary or affiliate of Radian Guaranty. This reinsurance agreement provides for up to $562.0 million of aggregate excess-of-loss reinsurance coverage for the mortgage insurance losses on new defaults on an existing portfolio of eligible Recurring Premium Policies issued between January 1, 2018 and 2017, respectively.December 31, 2018, with an initial RIF of $10.7 billion. Eagle Re 2019-1 financed its coverage by issuing mortgage insurance-linked notes in an aggregate amount of $562.0 million to eligible third-party capital markets investors in an unregistered private offering.
Radian Group Inc.
Notes to Unaudited Condensed Consolidated Financial Statements (Continued)
Collateral
Although we use reinsurance as one of our risk management tools, reinsurance does not relieve us of our obligations to our policyholders. In the event the reinsurers are unable to meet their obligations to us, our insurance subsidiaries would be liable for any defaulted amounts. However, in all of our reinsurance transactions, the reinsurers have established a trust to help secure our potential cash recoveries. In addition, for the Single Premium QSR Program, Radian Guaranty holds amounts received from ceded premiums written to collateralize the reinsurers’ obligations, which is reported in reinsurance funds withheld on our condensed consolidated balance sheets. Any loss recoveries and profit commissions to Radian Guaranty related to the Single Premium QSR Program are expected to be realized from this account.
Other
In our title insurance business, we also use reinsurance as part of our risk distribution strategy. EnTitle Insurance’s reinsurance agreement with a third-party reinsurer provides for coverage of 100% of losses in excess of $1.0 million ultimate net loss on a per claim basis, subject to certain aggregate limits. For the three months ended March 31, 2019 and the year ended December 31, 2018, the effect of this agreement was immaterial to our results of operations. In addition, on March 27, 2018, EnTitle Insurance entered into a loss portfolio transfer reinsurance transaction in which all policies issued by EnTitle Insurance and outstanding at the time, subject to certain limitations, became reinsured by a third party.
See Note 8 of Notes to Consolidated Financial Statements in our 20172018 Form 10-K for more information about our reinsurance transactions.
The following tables show the amounts related to the Single Premium QSR Transactions and the QSR Transactions for the periods indicated:
|
| | | | | | | |
| | Single Premium QSR Transactions |
| | Three Months Ended
March 31, |
| (In thousands) | 2018 | | 2017 |
Ceded premiums written (1) | $ | 15,791 |
| | $ | 8,960 |
|
Ceded premiums earned (1) | 10,377 |
| | 5,859 |
|
| Ceding commissions written | 6,621 |
| | 3,712 |
|
Ceding commissions earned (2) | 5,268 |
| | 2,937 |
|
| Ceded losses | 900 |
| | 573 |
|
|
| | | | | | | |
| | QSR Transactions |
| | Three Months Ended
March 31, |
| (In thousands) | 2018 | | 2017 |
Ceded premiums written (1) | $ | 3,931 |
| | $ | 5,457 |
|
Ceded premiums earned (1) | 5,612 |
| | 7,834 |
|
| Ceding commissions written | 1,128 |
| | 1,559 |
|
Ceding commissions earned (2) | 3,548 |
| | 3,894 |
|
| Ceded losses | 246 |
| | 570 |
|
______________________
| |
(1) | Net of profit commission. |
| |
(2) | Includes amounts reported in policy acquisition costs and other operating expenses. |
Radian Group Inc.
Notes to Unaudited Condensed Consolidated Financial Statements — (Continued)
8. Other Assets
The following table shows the components of other assets as of the dates indicated:
| | | (In thousands) | March 31,
2018 | | December 31,
2017 | March 31,
2019 | | December 31,
2018 |
| Deposit with the IRS (Note 9) | $ | 88,557 |
| | $ | 88,557 |
| |
Property and equipment (1) | 87,332 |
| | 87,042 |
| |
| Corporate-owned life insurance | 84,622 |
| | 85,862 |
| |
| Loaned securities | 44,396 |
| | 27,964 |
| |
| Company-owned life insurance | | $ | 85,729 |
| | $ | 83,377 |
|
Right-of-use assets (1) | | 47,150 |
| | — |
|
Internal-use software (2) | | 46,611 |
| | 51,367 |
|
Property and equipment (3) | | 39,530 |
| | 37,090 |
|
| Accrued investment income | 33,542 |
| | 31,389 |
| 33,275 |
| | 34,878 |
|
| Unbilled receivables | 20,949 |
| | 22,257 |
| 22,967 |
| | 19,917 |
|
| Loaned securities (Note 5) | | 22,606 |
| | 27,860 |
|
| Deferred policy acquisition costs | 16,026 |
| | 16,987 |
| 17,594 |
| | 17,311 |
|
| Reinsurance recoverables | 12,587 |
| | 8,492 |
| 15,401 |
| | 14,402 |
|
Current federal income tax receivable (4) | | — |
| | 44,506 |
|
| Other | 38,762 |
| | 39,299 |
| 42,815 |
| | 36,992 |
|
| Total other assets | $ | 426,773 |
| | $ | 407,849 |
| $ | 373,678 |
| | $ | 367,700 |
|
______________________
| |
| (1) | Represents right-of-use assets recognized as a result of our adoption, as of January 1, 2019, of the new accounting and disclosure requirements for leases of property, plant and equipment. See Note 1 for additional information. Right-of-use assets are shown less accumulated amortization of $2.3 million at March 31, 2019. |
| |
| (2) | Internal-use software, at cost, has been reduced by accumulated amortization of $63.7 million and $60.3 million at March 31, 2019 and December 31, 2018, respectively, as well as $3.8 million of impairment charges in the three months ended March 31, 2019, and $5.1 million of impairment charges in 2018. Amortization expense was $3.1 million and $2.8 million for the three-month periods ended March 31, 2019 and 2018, respectively. |
| |
| (3) | Property and equipment at cost, less accumulated depreciation of $112.1$64.5 million and $106.0$62.9 million at March 31, 20182019 and December 31, 2017,2018, respectively. Depreciation expense was $4.7$2.1 million and $4.1$1.9 million for the three-month periods ended March 31, 20182019 and 2017,2018, respectively. |
| |
| (4) | During the three months ended March 31, 2019, current federal income tax receivable was reduced by our receipt of the remaining $57.2 million refund from amounts on deposit with the IRS related to the settlement of the IRS Matter. |
Radian Group Inc.
Notes to Unaudited Condensed Consolidated Financial Statements (Continued)
9. Income Taxes
For additional information on our income taxes, including our accounting policies and the TCJA, see Notes 1 and 10 of Notes to Consolidated Financial Statements in our 2017 Form 10-K.
Because the TCJA was passed late in the fourth quarter of 2017 and ongoing guidance and accounting interpretation is expected throughout 2018, as of December 31, 2017, we made provisional estimates for the effects of the TCJA in accordance with SAB 118. These provisional estimates primarily related to NOLs, loss reserves, tax depreciation, share-based compensation and state taxes. We expect to complete our analysis of all deferred tax balances by December 2018. As of March 31, 2018, we have not recorded any measurement period adjustments in accordance with SAB 118 to change our provisional amounts that were recorded as of December 31, 2017.
As of March 31, 2018, for federal income tax purposes and before any consideration of the impact of our potential IRS Settlement,2019, we have generated certain tax attributes, including approximately $8.4$2.1 million of federal NOL carryforwards. We currently expect to utilize the majority of our federalThese NOL carryforwards duringrelate to our March 2018 and the remainder before their expiration. Approximately $2.3 million of our federal NOL carryforwards were received as part of the acquisition of EnTitle Direct and as such, their annual utilization amount is limited. However, we still expectare subject to fully utilize these NOLs priorlimitation under IRC Section 382. To the extent not utilized, the NOL carryforwards will expire by tax year 2038.
Certain entities within our consolidated group have generated deferred tax assets of approximately $67.7 million, relating primarily to their expiration in tax years 2027 through 2037. We also have researchstate and development tax creditlocal NOL carryforwards, of $6.8 million that,which, if not utilized,unutilized, will expire during various future tax years 2031 through 2038. Additionally, we had approximately $57.1 million of AMT credit carryforwards, which are expected to be fully utilized or refunded in the near term.
periods. We are required to establish a valuation allowance against our deferred tax assets when it is more likely than not that all or some portion of our deferred tax assets will not be realized. At each balance sheet date, we assess our need for a valuation allowance and ourthis assessment is based on all available evidence, both positive and negative. This requires management to exercise judgment and make assumptions regarding whether our deferred tax assets will be realized in future periods. In making this assessment as of March 31, 2018, weWe have determined that certain of our subsidiariesnon-insurance entities within Radian may continue to generate taxable losses on a separate company basis in the near term and may not be able to fully utilize certain of their state and local NOLs on their state and local tax returns. As of March 31, 2018, our valuation allowance is $64.4 million, which relates primarilyTherefore, with respect to deferred tax assets relating to these separate companystate and local NOLs and other state tax timing adjustments.adjustments, we retained a valuation allowance of $64.4 million at March 31, 2019.
Radian Group Inc.
NotesIn July 2018, we finalized a settlement with the IRS related to Unaudited Condensed Consolidated Financial Statements — (Continued)
We areadjustments we had been contesting adjustments resultingthat resulted from the examination by the IRS of our 2000 through 2007 consolidated federal income tax returns. The IRS opposeswas opposing the recognition of certain tax losses and deductions that were generated through our investment in a portfolio of non-economic REMIC residual interests and has proposed denying the associated tax benefits of these items. We appealed these proposed adjustments to the Internal Revenue Service Office of Appeals and made “qualified deposits” with the U.S. Treasury of $85 million in June 2008 relating to the 2000 through 2004 tax years and $4 million in May 2010 relating to the 2005 through 2007 tax years, in order to avoid the accrual of incremental above-market-rate interest with respect to the proposed adjustments.
We attempted to reach a compromised settlement with the Internal Revenue Service Office of Appeals, but in September 2014 we received Notices of Deficiency covering the 2000 through 2007 tax years that assert unpaid taxes and penalties of $157 million. The Deficiency Amount has not been reduced to reflect our NOL carryback ability. On December 3, 2014, we petitioned the U.S. Tax Court to litigate the Deficiency Amount. On September 1, 2015, we received a notice that the case had been scheduled for trial. However, the parties jointly filed, and the U.S. Tax Court approved, motions for continuance in this matter to postpone the trial date. Also, in February 2016, the U.S. Tax Court approved a joint motion to consolidate for trial, briefing and opinion our case with a similar case involving MGIC Investment Corporation.During 2016, we held several meetings with the IRS in an attempt to reach a settlement on the issues presented in our dispute. In October 2017, the parties informed the U.S. Tax Court that they believed they had reached agreement in principle on all issues in the dispute. In November 2017, as required by law, the agreement was reported to the JCT for review.
In April 2018, we were notified that the JCT had no objection tounder the terms of the settlement, agreement and thatRadian utilized its qualified deposits with the U.S. Treasury to settle its $31.0 million obligation to the IRS, is working toward finalizing the settlement, which we now expect to occur within the next several months. While the expected impact of the final settlement will reduce our available holding company liquidity by approximately $35 million,and during the secondfirst quarter of 20182019, the IRS refunded to Radian the remaining $57.2 million that was previously on deposit. See Note 8 for additional information about this refund.
As a mortgage guaranty insurer, we expectare eligible for a tax deduction, subject to recognize a net positive impactcertain limitations, under IRC Section 832(e) for amounts required by state law or regulation to tax expense of approximately $30 million. This estimated benefitbe set aside in statutory contingency reserves. The deduction is primarily relatedallowed only to the lower than expected interest accrued onextent that we purchase non-interest bearing U.S. Mortgage Guaranty Tax and Loss Bonds (“T&L Bonds”) issued by the U.S. Treasury in an amount equal to the tax deficiency and the impact of the remeasurementbenefit derived from deducting any portion of our deferred taxes due to the enactmentstatutory contingency reserves. As of the TCJAMarch 31, 2019, we held no T&L Bonds. However, we do anticipate purchasing T&L Bonds on a routine basis during the fourth quarter of 2017. This estimated benefit amount does not include any potential related benefit from the impactcoming quarters.
For additional information on our state or local uncertain tax positions. However, over the next twelve months, it is reasonably possible that we could record a material reductionincome taxes, including our accounting policies, see Notes 2 and 10 of Notes to these liabilities for unrecognized tax benefits.
We expect to complete the IRS settlementConsolidated Financial Statements in the coming months. However, if the settlement is not completed, then the ongoing litigation could take several years to resolve and may result in substantial legal expenses. We can provide no assurance regarding the outcome of any such litigation or whether a settlement with the IRS will ultimately be reached. If we are unable to complete the settlement, or the ultimate resolution of this matter produces a result that differs materially from our current expectations, there could be a materially different impact than we currently expect on our effective tax rate, results of operations and cash flows.2018 Form 10-K.
10. Losses and Loss Adjustment Expense
Our reserve for losses and LAE, at the end of each period indicated, consisted of:
| | | (In thousands) | March 31,
2018 | | December 31,
2017 | March 31,
2019 | | December 31,
2018 |
| Mortgage insurance loss reserves | $ | 485,192 |
| | $ | 507,588 |
| $ | 385,361 |
| | $ | 397,891 |
|
Services loss reserves (1) | 3,464 |
| | — |
| 3,423 |
| | 3,470 |
|
| Total reserve for losses and LAE | $ | 488,656 |
| | $ | 507,588 |
| $ | 388,784 |
| | $ | 401,361 |
|
______________________
| |
| (1) | This fullA majority of this amount is included insubject to reinsurance, with the related reinsurance recoverables reported in other assets in our condensed consolidated balance sheet, and relates to the acquisitionEnTitle Insurance. See Note 7 for information about our use of EnTitle Direct, completed on March 27, 2018.reinsurance in our title insurance business. |
Radian Group Inc.
Notes to Unaudited Condensed Consolidated Financial Statements — (Continued)
The following table shows our mortgage insurance reserve for losses and LAE by category at the end of each period indicated:
| | | (In thousands) | March 31,
2018 | | December 31,
2017 | March 31,
2019 | | December 31,
2018 |
| Reserves for losses by category: | | | | |
Reserve for losses by category (1): | | | | |
| Prime | $ | 274,595 |
| | $ | 285,022 |
| $ | 240,489 |
| | $ | 242,135 |
|
| Alt-A and A minus and below | 158,612 |
| | 170,873 |
| 111,955 |
| | 119,553 |
|
| IBNR and other | 17,164 |
| | 16,021 |
| 13,008 |
| | 13,864 |
|
| LAE | 13,440 |
| | 13,349 |
| 8,994 |
| | 10,271 |
|
Reinsurance recoverable (1) | 8,953 |
| | 8,315 |
| |
| Total primary reserves | 472,764 |
| | 493,580 |
| 374,446 |
| | 385,823 |
|
| Pool | 11,387 |
| | 12,794 |
| |
| IBNR and other | 226 |
| | 278 |
| |
| LAE | 319 |
| | 356 |
| |
Reinsurance recoverable (1) | 20 |
| | 35 |
| |
| Total pool reserves | 11,952 |
| | 13,463 |
| 10,621 |
| | 11,640 |
|
| Total First-lien reserves | 484,716 |
| | 507,043 |
| 385,067 |
| | 397,463 |
|
Other (2) | 476 |
| | 545 |
| 294 |
| | 428 |
|
| Total reserve for losses | $ | 485,192 |
| | $ | 507,588 |
| $ | 385,361 |
| | $ | 397,891 |
|
______________________
| |
| (1) | RepresentsIncludes ceded losses on captive reinsurance transactions, which are expected to be recovered and are included in the QSR Transactions and the Single Premium QSR Transactions.reinsurance recoverables reported in other assets in our condensed consolidated balance sheets. See Note 8. |
| |
| (2) | Does not include our Second-liensecond-lien premium deficiency reserve that is included in other liabilities. |
Radian Group Inc.
Notes to Unaudited Condensed Consolidated Financial Statements — (Continued)
The following table presents information relating to our mortgage insurance reserve for losses, including our IBNR reserve and LAE, but excluding our Second-liensecond-lien mortgage loan premium deficiency reserve, for the periods indicated:
| | | | Three Months Ended
March 31, | | Three Months Ended
March 31, |
| (In thousands) | 2018 | | 2017 | | 2019 | | 2018 |
| Balance at beginning of period | $ | 507,588 |
| | $ | 760,269 |
| | $ | 397,891 |
| | $ | 507,588 |
|
Less: Reinsurance recoverables (1) | 8,350 |
| | 6,851 |
| | 11,009 |
| | 8,350 |
|
| Balance at beginning of period, net of reinsurance recoverables | 499,238 |
| | 753,418 |
| | 386,882 |
| | 499,238 |
|
| Add: Losses and LAE incurred in respect of default notices reported and unreported in: | | | | | | | |
Current year (2) | 36,516 |
| | 51,447 |
| | 38,922 |
| | 36,516 |
|
| Prior years | 391 |
| | (4,316 | ) | | (18,173 | ) | | 391 |
|
| Total incurred | 36,907 |
| | 47,131 |
| | 20,749 |
| | 36,907 |
|
| Deduct: Paid claims and LAE related to: | | | | | | | |
Current year (2) | 226 |
| | 42 |
| | 295 |
| | 226 |
|
| Prior years | 59,700 |
| | 82,046 |
| | 34,294 |
| | 59,700 |
|
| Total paid | 59,926 |
| | 82,088 |
| | 34,589 |
| | 59,926 |
|
| Balance at end of period, net of reinsurance recoverables | 476,219 |
| | 718,461 |
| | 373,042 |
| | 476,219 |
|
Add: Reinsurance recoverables (1) | 8,973 |
| | 7,708 |
| | 12,319 |
| | 8,973 |
|
| Balance at end of period | $ | 485,192 |
| | $ | 726,169 |
| | $ | 385,361 |
| | $ | 485,192 |
|
______________________
| |
| (1) | Related to ceded losses recoverable, if any, on captive reinsurance transactions, the QSR Transactions and the Single Premium QSR Transactions.transactions. See Note 7 for additional information. |
| |
| (2) | Related to underlying defaulted loans with a most recent default notice dated in the year indicated. For example, if a loan had defaulted in a prior year, but then subsequently cured and later re-defaulted in the current year, that default would be considered a current year default. |
Radian Group Inc.
Notes to Unaudited Condensed Consolidated Financial Statements (Continued)
Reserve Activity
First Quarter 2019 Activity
Our mortgage insurance loss reserves at March 31, 2019 declined as compared to December 31, 2018, primarily as a result of the amount of paid claims and the favorable reserve development on prior year defaults exceeding losses incurred related to new default notices reported in the current year. Reserves established for new default notices were the primary driver of our total incurred losses for the three months ended March 31, 2019, and they were primarily impacted by the number of new primary default notices received in the period and our related gross Default to Claim Rate assumption applied to those new defaults, which was 8.0% as of March 31, 2019. This assumed rate reflects seasonal patterns as well as a continuation of improvement in cure rates. Historically, new defaults reported in the first quarter have cured at higher rates than subsequent quarters, and we considered this pattern in developing the estimate for the quarter. The provision for losses during the first three months of 2019 was positively impacted by favorable reserve development on prior year defaults, which was primarily driven by a reduction during the period in certain Default to Claim Rate assumptions for these prior year defaults compared to the assumptions used at December 31, 2018. The reductions in Default to Claim Rate assumptions resulted from observed trends, primarily higher Cures than were previously estimated.
Total claims paid decreased for the three months ended March 31, 2019, compared to the same period in 2018. The decrease in claims paid is consistent with the ongoing decline in the outstanding default inventory.
First Quarter 2018 Activity
Our mortgage insurance loss reserves at March 31, 2018 declined as compared to December 31, 2017, primarily as a result of the amount of paid claims continuing to outpace losses incurred related to new default notices reported in the current year. Reserves established for new default notices were the primary driver of our total incurred loss for the three months ended March 31, 2018, and they were primarily impacted by the number of new primary default notices received in the period and our related gross Default to Claim Rate assumption applied to those new defaults, which, except as discussed below for FEMA Designated Areas associated with Hurricanes Harvey and Irma, was approximately 9% for the three months ended9.5% as of March 31, 2018. This assumed rate reflects seasonal patterns as well as a continuation of a general improvement in cure rates. Historically, new defaults reported in the first quarter have cured at higher rates than subsequent quarters, and we considered this pattern in developing the estimate for the quarter. The net effect of changes in reserve estimates for defaults reported in prior years was not material for the three months ended March 31, 2018.
Radian Group Inc.
Notes to Unaudited Condensed Consolidated Financial Statements — (Continued)
During the third quarter of 2017, Hurricanes Harvey and Irma caused extensive property damage to areas of Texas, Florida and Georgia, as well as other general disruptions including power outages and flooding. At March 31, 2018 and December 31, 2017, our total primary mortgage insurance exposure to mortgages in counties affected by these storms and subsequently designated as FEMA Designated Areas was approximately $4.7 billion and $4.6 billion of RIF, respectively, on approximately $17.9 billion and $17.4 billion of IIF, respectively. This exposure represents approximately 9% of our primary RIF as of both March 31, 2018 and December 31, 2017. Although the mortgage insurance we write protects the lenders from a portion of losses resulting from loan defaults, it does not provide protection against property loss or physical damage. Our Master Policies contain an exclusion against physical damage, including damage caused by floods or other natural disasters. Depending on the policy form and circumstances, we may, among other things, deduct the cost to repair or remedy physical damage above a de minimis amount from a claim payment and/or, under certain circumstances, deny a claim where (i) the property underlying a mortgage in default is subject to unrestored physical damage or (ii) the physical damage is deemed to be the principal cause of default.
While we observed an increase in new primary defaults from FEMA Designated Areas associated with Hurricanes Harvey and Irma following those two natural disasters, we expect most of these to cure by the end of 2018, and at higher cure rates than the rates of our general population of defaults. We thereforehad assigned a 3% Default to Claim Rate assumption to the new primary defaults from FEMA Designated Areas associated with Hurricanes Harvey and Irma that were reported subsequent to those two natural disasters and through February 2018. While we observed an increase in new primary defaults from FEMA Designated Areas associated with Hurricanes Harvey and Irma, most of them cured by the end of 2018, as expected, and at higher cure rates than the rates of our general population of defaults. These incremental defaults did not have a material impact on our provision for losses as of March 31, 2018 or December 31, 2017. However, the future reserve impact may be affected by various factors, including the pace of economic recovery in the FEMA Designated Areas.2018.
Total claims paid decreased for the three months ended March 31, 2018, compared to the same period in 2017, consistent with the ongoing decline in the outstanding default inventory.
First Quarter 2017 Activity
Our mortgage insurance loss reserves at March 31, 2017 declined as compared to December 31, 2016, primarily as a result of the amount of paid claims outpacing losses incurred related to new default notices reported in the current year. Reserves established for new default notices were the primary driver of our total incurred loss for the three months ended March 31, 2017, and they were primarily impacted by the number of new primary default notices received in the period and our related gross Default to Claim Rate assumption applied to those new defaults, which was 11.5% as of March 31, 2017. The provision for losses during the first three months of 2017 was positively impacted by favorable reserve development on prior year defaults, which was primarily driven by a reduction during the period in certain Default to Claim Rate assumptions for these prior year defaults compared to those used at December 31, 2016. The reductions in Default to Claim Rate assumptions primarily resulted from observed trends, including higher Cures than were previously estimated. The positive development in prior year defaults was partially offset by a decrease in estimated rates of future Loss Mitigation Activities compared to those used at December 31, 2016.
Total claims paid decreased for the three months ended March 31, 2017, compared to the same period in 2016, consistent with the ongoing decline in the outstanding default inventory.
Radian Group Inc.
Notes to Unaudited Condensed Consolidated Financial Statements — (Continued)
Mortgage Insurance Reserve Assumptions
Default to Claim Rate
Our aggregate weighted-average net Default to Claim Rate assumption (net of Claim Denials and Rescissions) used in estimating our primary reserve for losses was 33% at both March 31, 2018, compared to 31% at2019 and December 31, 2017. The increase in our Default to Claim Rate in the first three months of 2018 primarily resulted from a decrease in the proportion of defaults that have missed three payments or less, which generally have a lower assumed net Default to Claim Rate. This decrease in the proportion of defaults that missed three payments or less was partially offset by: (i) the lower Default to Claim Rate of 3% on new primary defaults in FEMA Designated Areas associated with Hurricanes Harvey and Irma subsequent to those two natural disasters through February 2018 and (ii) a decrease in the assumed gross Default to Claim Rate for new primary defaults that were not located in FEMA Designated Areas associated with Hurricanes Harvey and Irma, from 10.0% at December 31, 2017 to approximately 9% for the three months ended March 31, 2018. As of March 31, 2018, with the exception of new primary defaults in FEMA Designated Areas associated with Hurricanes Harvey and Irma,2019 our gross Default to Claim Rate assumptions on our primary portfolio ranged from approximately 9%8.0% for new defaults, up to 68% for defaults not in foreclosure stage, and 75%72% for Foreclosure Stage Defaults. Our Default to Claim Rate estimates on defaulted loans are mainly developed based on the Stage of Default and Time in Default of the underlying defaulted loans grouped according to the period in which the default occurred, as measured by the progress toward foreclosure sale and the number of months in default. Our estimate of expected Rescissions and Claim Denials (net of expected Reinstatements) embedded in our estimated Default to Claim Rate is generally based on our recent experience. Consideration is also given to any differences in characteristics between those rescinded policies and denied claims and the loans remaining in our defaulted inventory, as well as the estimated impact of the BofA Settlement Agreement.inventory.
Loss Mitigation
Although our estimates of future Loss Mitigation Activities have been declining, they remain elevated compared to levels experienced before 2009. The elevated levels of our rate of Rescissions, Claim Denials and Claim Curtailments have significantly reduced our paid losses and have resulted in a reduction in our loss reserve. Our estimate of net future Loss Mitigation Activities reduced our loss reserves as of March 31, 2018 and December 31, 2017 by approximately $19 million and $21 million, respectively. The amount of estimated Loss Mitigation Activities incorporated into our reserve analysis at any point in time is affected by a number of factors, including not only our estimated rate of Rescissions, Claim Denials and Claim Curtailments on future claims, but also the volume and attributes of our defaulted insured loans, our estimated Default to Claim Rate and our estimated Claim Severity, among other assumptions.
As our Legacy Portfolioinsurance written in years prior to and including 2008 has become a smaller percentage of our overall insured portfolio, we have undertaken a reduced amount of Loss Mitigation Activity has occurred with respect to the claims we receive, and we expect this general trend to continue. As a result, our future Loss Mitigation Activity is not expected to mitigate our paid losses significantly. Our estimate, with respect to the same extentfuture Rescissions, Claim Denials and Claim Curtailments, inclusive of claim withdrawals, reduced our loss reserve as in recent years.of March 31, 2019 and December 31, 2018 by $32 million.
Our reported Rescission, Claim Denial and Claim Curtailment activity in any given period is subject to challenge by our lender and servicer customers. We expect that a portion of previous Rescissions will be reinstated and previous Claim Denials
Radian Group Inc.
Notes to Unaudited Condensed Consolidated Financial Statements (Continued)
will be resubmitted with the required documentation and ultimately paid; therefore, we have incorporated this expectation into our IBNR reserve estimate. Our IBNR reserve estimate of $9.1$10.4 million and $10.4$11.3 million at March 31, 20182019 and December 31, 2017,2018, respectively, includes reserves for this activity.
We also accrue for the premiums that we expect to refund to our lender customers in connection with our estimated Rescissions.
11. Senior Notes
The carrying value of our senior notes at March 31, 20182019 and December 31, 20172018 was as follows:
|
| | | | | | | | |
| (In thousands) | | March 31,
2019 | | December 31,
2018 |
| 5.500% | Senior Notes due 2019 | $ | 158,502 |
| | $ | 158,324 |
|
| 5.250% | Senior Notes due 2020 | 232,961 |
| | 232,729 |
|
| 7.000% | Senior Notes due 2021 | 196,056 |
| | 195,867 |
|
| 4.500% | Senior Notes due 2024 | 443,678 |
| | 443,428 |
|
| | Total Senior Notes | $ | 1,031,197 |
| | $ | 1,030,348 |
|
|
| | | | | | | | |
| (In thousands) | | March 31,
2018 | | December 31,
2017 |
| 5.500% | Senior Notes due 2019 | $ | 157,804 |
| | $ | 157,636 |
|
| 5.250% | Senior Notes due 2020 | 232,053 |
| | 231,834 |
|
| 7.000% | Senior Notes due 2021 | 195,322 |
| | 195,146 |
|
| 4.500% | Senior Notes due 2024 | 442,696 |
| | 442,458 |
|
| | Total Senior Notes | $ | 1,027,875 |
| | $ | 1,027,074 |
|
Radian Group Inc.
Notes to Unaudited Condensed Consolidated Financial Statements — (Continued)
12. Other Liabilities
The following table shows the components of other liabilities as of the dates indicated:
|
| | | | | | | |
| (In thousands) | March 31,
2019 | | December 31,
2018 |
| FHLB advances | $ | 108,532 |
| | $ | 82,532 |
|
| Deferred ceding commission | 88,110 |
| | 91,400 |
|
| Lease liability | 70,927 |
| | — |
|
Payable for securities (1) | 35,981 |
| | 7,949 |
|
| Current federal income taxes | 25,245 |
| | — |
|
| Accrued compensation | 19,112 |
| | 61,452 |
|
Amount payable on the return of cash collateral under securities lending agreements (2) | 6,233 |
| | 11,699 |
|
| Other | 65,330 |
| | 78,627 |
|
| Total other liabilities | $ | 419,470 |
| | $ | 333,659 |
|
|
| | | | | | | |
| (In thousands) | March 31,
2018 | | December 31,
2017 |
| Current federal income taxes | $ | 133,500 |
| | $ | 96,740 |
|
| Deferred ceding commission | 89,710 |
| | 89,907 |
|
| Amount payable on the return of cash collateral under securities lending agreements | 39,077 |
| | 19,357 |
|
| Accrued compensation | 32,069 |
| | 67,687 |
|
| FHLB advances | 25,550 |
| | — |
|
| Other | 92,887 |
| | 80,154 |
|
| Total other liabilities | $ | 412,793 |
| | $ | 353,845 |
|
| |
| (1) | Represents the payable for purchases of securities that have not yet settled as of the balance sheet date. |
| |
| (2) | Amounts payable on the return of cash collateral under securities lending agreements are classified as other liabilities in our condensed consolidated balance sheets. See Note 5 for additional information. |
FHLB Advances
In August 2016,As of March 31, 2019, Radian Guaranty and Radian Reinsurance became members of the FHLB. As members, they may borrow from the FHLB, subject to certain conditions, which include the need to post collateral and the requirement to maintain a minimum investment in FHLB stock, in part depending on the level of their outstanding FHLB advances. These FHLB advances may be used to provide low-cost, supplemental liquidity for various purposes, including to fund incremental investments.
As of March 31, 2018, we had $25.6$108.5 million of fixed-rate advances outstanding with a weighted average interest rate of 2.08%2.77%. Interest on the FHLB advances is payable quarterly, or at maturity if the term of the advance is less than 90 days. As of March 31, 2018, $19.02019, $86.5 million of the FHLB advances mature in 2018 and $6.62019, $3.0 million mature in 2019.2020, $8.0 million mature in 2021, $9.0 million mature in 2023, and $2.0 million mature in 2024 and thereafter. Principal is due at maturity. For obligations with maturities greater than or equal to 90 days, we may prepay the debt at any time, subject to a prepayment fee calculation. See Note 13 of Notes to Consolidated Financial Statements in our 2018 Form 10-K for additional information about our FHLB advances.
The FHLB advances are requiredLease Liability
Our lease liability represents the present value of future lease payments over the lease term. Our leases do not provide a readily determinable implicit rate. Therefore, we must estimate our incremental borrowing rate, on a collateralized basis, to be collateralized by eligible assets whose market value must be maintaineddiscount the lease payments based on information available at a minimum of approximately 103% to 105% oflease commencement. Our leases expire periodically through August 2032, and contain provisions for scheduled periodic rent increases. We estimate the principal balance of the FHLB advances,incremental borrowing rate based on the eligible collateralyields of several Radian Group corporate bonds, as adjusted to reflect a collateralized borrowing rate, which mature periodically through 2024. While the majority of our lease population expires within one year of one of the corporate bonds,
Radian Group Inc.
Notes to Unaudited Condensed Consolidated Financial Statements (Continued)
our more significant leases expire more than one year beyond 2024. For those leases, we have provided atadjust the corporate bond rate for both U.S. Treasury rate yields and a corporate spread adjustment determined from recent market data, resulting in discount rates ranging from 4.22% to 7.08%.
The following tables provide additional information related to our leases, including: (i) the components of our total lease cost; (ii) the cash flows arising from our lease transactions; (iii) supplemental balance sheet information; (iv) the weighted-average remaining lease term; (v) the weighted-average discount rate used for our leases; and (vi) the remaining maturities of our lease liabilities, as of and for the periods indicated:
|
| | | |
| ($ in thousands) | Three Months Ended March 31, 2019 |
| Lease cost | |
| Operating lease cost | $ | 2,319 |
|
| Short-term lease cost | 23 |
|
| Total lease cost | $ | 2,342 |
|
| | |
| Cash paid for amounts included in the measurement of lease liabilities: | |
| Operating cash flows from operating leases | $ | (2,637 | ) |
| | |
|
| | | |
| ($ in thousands) | March 31, 2019 |
| Operating leases: | |
Operating lease right-of-use assets (1) | $ | 47,150 |
|
Operating lease liabilities (2) | 70,927 |
|
| | |
| Weighted-average remaining lease term - operating leases (in years) | 10.4 years |
|
| | |
| Weighted-average discount rate - operating leases | 6.75 | % |
| | |
| Remaining maturities of lease liabilities for the remainder of 2019 and thereafter is as follows: | |
| 2019 | $ | 7,873 |
|
| 2020 | 10,428 |
|
| 2021 | 9,964 |
|
| 2022 | 10,136 |
|
| 2023 | 10,275 |
|
| 2024 and thereafter | 56,542 |
|
| Total lease payments | 105,218 |
|
| Less: Imputed interest | (34,291 | ) |
Present value of lease liabilities (2) | $ | 70,927 |
|
______________________
| |
| (1) | Classified in other assets in our condensed consolidated balance sheets. See Note 8. |
| |
| (2) | Classified in other liabilities in our condensed consolidated balance sheets. |
Radian Group Inc.
Notes to Unaudited Condensed Consolidated Financial Statements (Continued)
Pursuant to the previous lease accounting standard, rent expense for the three months ended March 31, 2018 which consistedwas $1.2 million. Our commitment for non-cancelable leases in future years as of an aggregate amount of $28.1 million in U.S. government and agency securities and RMBSDecember 31, 2018 was as follows (in thousands):
|
| | | |
| 2019 | $ | 11,310 |
|
| 2020 | 10,847 |
|
| 2021 | 10,165 |
|
| 2022 | 10,100 |
|
| 2023 | 10,251 |
|
| 2024 and thereafter | 56,317 |
|
| Total | $ | 108,990 |
|
At December 31, 2018, there were no future minimum receipts expected from fixed-maturities available for sale within our investment securities portfolio.
Amount Payable on the Return of Cash Collateral under Securities Lending Agreements
We participate in a securities lending program whereby we loan certain securities in our investment portfolio to Borrowers for short periods of time. These securities lending agreements, whereby we transfer securities to third parties through an intermediary in exchange for cash or other securities, are considered collateralized financing arrangements. Amounts payable on the return of cash collateral under securities lending agreements are classified as other liabilities in our condensed consolidated balance sheets. See Note 5 for additional information.sublease rental payments.
Revolving Credit Facility
On October 16, 2017, Radian Group entered into a three-year, $225 million unsecured revolving credit facility with a syndicate of bank lenders. Terms of the credit facility include an accordion feature that allows Radian Group, at its option, to increase the amounttotal borrowing capacity during the term of the agreement, subject to our obtaining the necessary increased commitments from the lenders (which may include then existing or other lenders), up to a total of $300 million. BorrowingsEffective October 26, 2018, Radian Group exercised its rights under the accordion feature to add another global bank to the existing syndicate of bank lenders and to increase the amount of total commitments under the credit facility by $42.5 million, bringing the aggregate unsecured revolving credit facility to $267.5 million.
Subject to certain limitations, borrowings under the credit facility may be used for working capital and general corporate purposes, including without limitation, capital contributions to Radian Group’s insurance and reinsurance subsidiaries as well as growth initiatives.
The credit facility contains customary representations, warranties, covenants, terms and conditions. Our ability to borrow under the credit facility is conditioned on the satisfaction of certain financial and other covenants, including covenants related to minimum net worth and statutory surplus, a maximum debt-to-capitalization level, limits on certain types of indebtedness and liens, minimum liquidity levels and Radian Guaranty’s eligibility as a private mortgage insurer with the GSEs. See Note 1213 of Notes to Consolidated Financial Statements in our 20172018 Form 10-K. At March 31, 2018,2019, Radian Group was in compliance with all the covenants althoughand there were no amounts outstanding under this revolving credit facility.
Radian Group Inc.
Notes to Unaudited Condensed Consolidated Financial Statements — (Continued)
13. Commitments and Contingencies
Legal Proceedings
See Note 13 of Notes to Consolidated Financial Statements in our 2017 Form 10-K for information regarding our accounting policies for contingencies.
We are routinely involved in a number of legal actions and proceedings, including litigation and other disputes arising in the ordinary course of our business. The legal and regulatory matters discussed below and in our 20172018 Form 10-K could result in adverse judgments, settlements, fines, injunctions, restitutions or other relief that could require significant expenditures or have other effects on our business. Management believes, based on current knowledge and after consultation with counsel, that the outcome of such actions will not have a material adverse effect on our consolidated financial condition. However, the outcome of litigation and other legal and regulatory matters and proceedings is inherently uncertain, and it is possible that one or more of the matters currently pending or threatened could have an unanticipated adverse effect on our liquidity, financial condition or results of operations for any particular period.
As described in Note 9, on September 4, 2014, we received formal Notices of Deficiency from the IRS related to certain tax losses and deductions resulting from our investment in a portfolio of non-economic REMIC residual interests. If the ultimate resolution of this matter produces a result that differs materially from our current expectations, there could be a materially different impact than we currently expect on our effective tax rate, results of operations and cash flows.
On December 22, 2016, Ocwen Loan Servicing, LLC and Homeward Residential, Inc. (collectively, “Ocwen”) filed a complaint in the U.S. District Court for the Eastern District of Pennsylvania against Radian Guaranty (the “Complaint”) alleging breach of contract and bad faith claims and seeking monetary damages and declaratory relief. Ocwen has also initiated similar legal proceedings against several other mortgage insurers. On December 17, 2016, Ocwen separately filed a parallel arbitration petition against Radian Guaranty before the American Arbitration Association (“AAA”) asserting substantially the same allegations (the “Arbitration”). Ocwen’s filings together listed 9,420 mortgage insurance certificates issued under multiple insurance policies, including pool insurancePool Insurance policies, as subject to the dispute. On June 5, 2017, Ocwen filed an amended complaint and an amended petition (collectively, the “Amended Filings”) with both the court and the AAA, respectively, together listing 8,870 certificates as subject to the dispute. In December 2017 and January 2018, Ocwen and Radian Guaranty filed motions for partial summary judgment on a small number of bellwether certificates selected from the certificates subject to the court proceedings (“Bellwether Certificates”). On February 1, 2018, the trial judge issued an Order and Memorandum decision granting in part and denying in part both parties’ motions for partial summary judgment (subsequently clarified by Orders of March 5 and 29, 2018), and ordering the parties to proceed to trial on certain claims regarding a portion of the Bellwether Certificates. On April 11, 2018, the parties entered into a confidential agreement with respect to all certificates subject to the dispute. The confidential agreement resolved certain categories of claims involved in the dispute and, on April 12, 2018, the parties filed a stipulation of voluntary dismissal of the federal court proceeding and the trial judge issued an Order dismissing all claims and counterclaims subject to the parties’ agreement. Radian Guaranty was not required to make any payment in connection with this confidential agreement. Pursuant to the confidential agreement, the
Radian Group Inc.
Notes to Unaudited Condensed Consolidated Financial Statements (Continued)
parties: (1) dismissed the federal court proceeding; (2) narrowed the scope of the dispute to Ocwen’s breach of contract claims seeking payment of insurance benefits on approximately 2,500 certificates that Ocwen was previously pursuing through the Amended Filings; and (3) agreed to resolve the remaining dispute through the Arbitration. Radian Guaranty believes that Ocwen’s allegations and claims in the legal proceedings described above are without merit and legally deficient, and plans to defend these claims vigorously. We are not able to estimate a reasonably possible loss, if any, or range of loss in this matter because of the current stage of the Arbitration.
On August 31, 2018, Nationstar Mortgage LLC d/b/a Mr. Cooper (“Nationstar”) filed a complaint in the U.S. District Court for the Eastern District of Pennsylvania against Radian Guaranty (the “Complaint”) alleging breach of contract, bad faith, unjust enrichment and conversion claims and seeking monetary damages and declaratory relief. The Complaint lists 3,014 mortgage insurance certificates issued under multiple insurance policies as subject to disputes involving insurance coverage decisions. The Complaint further lists 2,231 mortgage insurance certificates issued under multiple insurance policies as subject to disputes involving premium refund requests. Radian Guaranty believes that Nationstar’s allegations and claims in the legal proceedings described above are without merit and legally deficient, and plans to defend these claims vigorously. In December 2018, Radian Guaranty filed a motion to dismiss the Complaint. In March 2019, the trial judge issued an Order granting in part, and denying in part, our motion to dismiss, and dismissed Nationstar’s unjust enrichment and conversion claims. In May 2019, Radian Guaranty filed an answer, with affirmative defenses and counterclaims, in response to the Complaint. We are not able to estimate a reasonably possible loss, if any, or range of loss in this matter because of the preliminary stage of the Arbitration.litigation.
We also are periodically subject to reviews and audits, as well as inquiries, information-gathering requests and investigations. In connection with these matters, from time to time we receive requests and subpoenas seeking information and documents related to aspects of our business. In March 2017, Green River Capital, a subsidiary of Clayton, received a letter from the staff of the SEC stating that it is conducting an investigation captioned, “In the Matter of Certain Single Family Rental Securitizations,” and that it is requesting information from market participants. The letter requested that Green River Capital provide information regarding broker price opinions that Green River Capital provided on properties included in SFR securitization transactions. Green River Capital is cooperating with the SEC.
Radian Group Inc.
Notes to Unaudited Condensed Consolidated Financial Statements — (Continued)
Our Master Policies establish the timeline within which any suit or action arising from any right of an insured under the policy generally must be commenced. In general, any suit or action arising from any right of an insured under the policy must be commenced within two years after such right first arose for primary insurance and within three years for certain other policies, including certain Pool Insurance policies. Although we believe that our Loss Mitigation Activities are justified under our policies, from time to time we face challenges from certain lender and servicer customers regarding our Loss Mitigation Activities, which have resulted in some reversals of our decisions regarding Rescissions, Claim Denials or Claim Curtailments. We are currently in discussions with these customers regarding our Loss Mitigation Activities and claim payment practices, which if not resolved, could result in arbitration or judicial proceedings and we may need to reassume the risk on, and increase loss reserves for, the associated policies or pay additional claims. See Note 10 for additional information.
Further, there are loansSee Note 14 of Notes to Consolidated Financial Statements in our total defaulted portfolio (in particular,2018 Form 10-K for further information regarding our older defaulted portfolio) for which actions or proceedings (such as foreclosure, which provide the insured with title to the property) may not have been commenced within the outermost deadline in our Prior Master Policy. We are evaluating these loans regarding this potential violationcommitments and contingencies and our corresponding rights under the Prior Master Policy. While we can provide no assurance regarding the ultimate resolution of these issues, it is possible that arbitration or legal proceedings could result.
Other
Securities regulations became effective in 2005 that impose enhanced disclosure requirements on issuers of ABS (including mortgage-backed securities). To allow our customers to comply with these regulations at that time, we typically were required, depending on the amount of credit enhancement we were providing, to provide: (i) audited financial statementsaccounting policies for the insurance subsidiary participating in the transaction or (ii) a full and unconditional holding company-level guarantee for our insurance subsidiaries’ obligations in such transactions. Radian Group has guaranteed two structured transactions for Radian Guaranty involving $94.6 million of remaining credit exposure as of March 31, 2018.contingencies.
14. Capital Stock
Share Repurchase Program
On August 9, 2017,16, 2018, Radian Group’s board of directors renewed the Company’sapproved a share repurchase program authorizingthat authorized the Company to repurchase up to $50$100 million of its common stock. The current authorization allows the Company to repurchase Radian Group common stock in the open market or in privately negotiated transactions, based on market and business conditions, stock price and other factors. On March 20, 2019, Radian Group’s board of directors approved a $150 million increase in authorization for this program, bringing the total authorization to repurchase shares up to $250 million, excluding commissions. Radian operates this program pursuant to a trading plan under Rule 10b5-1 of the Exchange Act.Act, which permits the company to purchase shares, at pre-determined price targets, when it may otherwise be precluded from doing so. During the three months ended March 31, 2018, 531,0132019, the Company purchased 1,546,674 shares were purchased at an average price of $18.84$20.54 per share, including commissions. AtAs of March 31, 2018,2019, purchase authority of up to $40.0$218.2 million remained available under this program, which expires on July 31, 2018.2020.
During April 2018,Subsequent to March 31, 2019, the Company purchased 924,7204,131,329 shares of its common stock under its share repurchase program at an average price of $16.24$21.94 per share, including commissions. At April 30, 2018,As of May 6, 2019, purchase authority of up to a maximum of $25$127.7 million remained available under this program, which, based on current market conditions, we expect to fully utilize before the program expires.program.
Other Purchases
We may purchase shares on the open market to settle stock options exercised by employees and purchases under our Employee Stock Purchase Plan. In addition, upon the vesting of certain restricted stock awards under our equity compensation plans, we may withhold from such vested awards shares of our common stock to satisfy the tax liability of the award recipients.
Radian Group Inc.
Notes to Unaudited Condensed Consolidated Financial Statements — (Continued)
Dividends Paid
In each of the quarters during 2019 and 2018, we declared quarterly cash dividends on our common stock equal to $0.0025 per share.
15. Accumulated Other Comprehensive Income (Loss)
The following table shows the rollforward of accumulated other comprehensive income (loss) as of the periods indicated: |
| | | | | | | | | | | |
| | Three Months Ended March 31, 2019 |
| (In thousands) | Before Tax | | Tax Effect | | Net of Tax |
| Balance at beginning of period | $ | (77,114 | ) | | $ | (16,194 | ) | | $ | (60,920 | ) |
| Other comprehensive income (loss): | | | | | |
| Unrealized gains (losses) on investments: | | | | | |
| Unrealized holding gains (losses) arising during the period | 98,763 |
| | 20,740 |
| | 78,023 |
|
Less: Reclassification adjustment for net gains (losses) included in net income (1) | (495 | ) | | (104 | ) | | (391 | ) |
| Net unrealized gains (losses) on investments | 99,258 |
| | 20,844 |
| | 78,414 |
|
| Other comprehensive income (loss) | 99,258 |
| | 20,844 |
| | 78,414 |
|
| Balance at end of period | $ | 22,144 |
| | $ | 4,650 |
| | $ | 17,494 |
|
| | | | | | |
| | Three Months Ended March 31, 2018 |
| (In thousands) | Before Tax | | Tax Effect | | Net of Tax |
| Balance at beginning of period | $ | 32,669 |
| | $ | 9,584 |
| | $ | 23,085 |
|
| Cumulative effect of adopting the accounting standard update for financial instruments | 284 |
| | 60 |
| | 224 |
|
| Cumulative effect of adopting the accounting standard update for the reclassification of certain tax effects | — |
| | (2,724 | ) | | 2,724 |
|
| Balance adjusted for cumulative effect of adopting accounting standard updates | 32,953 |
| | 6,920 |
| | 26,033 |
|
| Other comprehensive income (loss): | | | | | |
| Unrealized gains (losses) on investments: | | | | | |
| Unrealized holding gains (losses) arising during the period | (76,763 | ) | | (16,120 | ) | | (60,643 | ) |
Less: Reclassification adjustment for net gains (losses) included in net income (1) | (3,964 | ) | | (832 | ) | | (3,132 | ) |
| Net unrealized gains (losses) on investments | (72,799 | ) | | (15,288 | ) | | (57,511 | ) |
| Unrealized foreign currency translation adjustments | 4 |
| | 1 |
| | 3 |
|
| Other comprehensive income (loss) | (72,795 | ) | | (15,287 | ) | | (57,508 | ) |
| Balance at end of period | $ | (39,842 | ) | | $ | (8,367 | ) | | $ | (31,475 | ) |
|
| | | | | | | | | | | |
| | Three Months Ended March 31, 2018 |
| (In thousands) | Before Tax | | Tax Effect | | Net of Tax |
| Balance at beginning of period | $ | 32,669 |
| | $ | 9,584 |
| | $ | 23,085 |
|
| OCI: | | | | | |
| Unrealized gains (losses) on investments: | | | | | |
| Unrealized holding gains (losses) arising during the period | (76,763 | ) | | (16,120 | ) | | (60,643 | ) |
Less: Reclassification adjustment for net gains (losses) included in net income (1) | (3,964 | ) | | (832 | ) | | (3,132 | ) |
| Net unrealized gains (losses) on investments | (72,799 | ) | | (15,288 | ) | | (57,511 | ) |
| Unrealized foreign currency translation adjustments | 4 |
| | 1 |
| | 3 |
|
| Cumulative effect of adopting the accounting standard update for financial instruments | 284 |
| | 60 |
| | 224 |
|
| Cumulative effect of adopting the accounting standard update for the reclassification of certain tax effects | — |
| | (2,724 | ) | | 2,724 |
|
| OCI | (72,511 | ) | | (17,951 | ) | | (54,560 | ) |
| Balance at end of period | $ | (39,842 | ) | | $ | (8,367 | ) | | $ | (31,475 | ) |
| | | | | | |
| | Three Months Ended March 31, 2017 |
| (In thousands) | Before Tax | | Tax Effect | | Net of Tax |
| Balance at beginning of period | $ | (19,063 | ) | | $ | (6,668 | ) | | $ | (12,395 | ) |
| OCI: | | | | | |
| Unrealized gains (losses) on investments: | | | | | |
| Unrealized holding gains (losses) arising during the period | 11,334 |
| | 3,967 |
| | 7,367 |
|
Less: Reclassification adjustment for net gains (losses) included in net income (1) | (2,509 | ) | | (878 | ) | | (1,631 | ) |
| Net unrealized gains (losses) on investments | 13,843 |
| | 4,845 |
| | 8,998 |
|
| Unrealized foreign currency translation adjustments | 52 |
| | 18 |
| | 34 |
|
| OCI | 13,895 |
| | 4,863 |
| | 9,032 |
|
| Balance at end of period | $ | (5,168 | ) | | $ | (1,805 | ) | | $ | (3,363 | ) |
______________________
| |
| (1) | Included in net gains (losses) on investments and other financial instruments on our condensed consolidated statements of operations. |
16. Statutory Information
We prepare our statutory financial statements in accordance with the accounting practices required or permitted, if applicable, by the insurance departments of the respective states of domicile of our insurance subsidiaries. Required SAPP are established by a variety of NAIC publications, as well as state laws, regulations and general administrative rules. In addition, insurance departments have the right to permit other specific practices that may deviate from prescribed practices. As of March 31, 2018,2019, we did not have any prescribed or permitted statutory accounting practices for our mortgage insurance subsidiaries that resulted in reported statutory surplus or risk-based capital being different from what would have been reported had NAIC statutory accounting practices been followed.
Radian Group Inc.
Notes to Unaudited Condensed Consolidated Financial Statements — (Continued)
State insurance regulations include various capital requirements and dividend restrictions based on our insurance subsidiaries’ statutory financial position and results of operations, as described below. FailureOur failure to maintain adequate levels of capital could lead to intervention by the various insurance regulatory authorities, which could materially and adversely affect our business, business prospects and financial condition. As of March 31, 2018,2019, the amount of restricted net assets held by our consolidated insurance subsidiaries (which represents our equity investment in those insurance subsidiaries) totaled $3.6$3.9 billion of our consolidated net assets.
Under state insurance regulations, Radian Guaranty is required to maintain minimum surplus levels and, in certain states, a minimum ratio of statutory capital relative to the level of net RIF, or Risk-to-capital. There are 16 RBC States that currently impose a Statutory RBC Requirement. The most common Statutory RBC Requirement is that a mortgage insurer’s Risk-to-capital may not exceed 25 to 1. In certain of the RBC States, a mortgage insurer must satisfy a MPP Requirement. The statutory capital requirements for the non-RBC States are de minimis (ranging from $1 million to $5 million); however, the insurance laws of these states generally grant broad supervisory powers to state agencies or officials to enforce rules or exercise discretion affecting almost every significant aspect of the insurance business, including the power to revoke or restrict an insurance company’s ability to write new business. Unless an RBC State grants a waiver or other form of relief, if a mortgage insurer, such as Radian Guaranty, is not in compliance with the Statutory RBC Requirement of that state, the mortgage insurer may be prohibited from writing new mortgage insurance business in that state. Radian Guaranty’s domiciliary state, Pennsylvania, is not one of the RBC States.
Radian Guaranty was in compliance with the Statutory RBC Requirements or MPP Requirements, as applicable, in each of the RBC States as of March 31, 2018.2019. The NAIC is in the process of developing a new Model Act for mortgage insurers, which is expected to include, among other items, new capital adequacy requirements for mortgage insurers. In May 2016, a working group of state regulators released an exposure draft of a risk-based capitalthis Model Act. The process for developing this framework to establish capital requirements for mortgage insurers.is ongoing. While the outcome and timing of this process are uncertain, the new Model Act, if and when finalized by the NAIC, has the potential to increase capital requirements in those states that adopt the Model Act. However, we continue to believe the changes to the Model Act will not result in financial requirements that require greater capital than the level currently required under the PMIERs financial requirements. See Note 1 herein and Note 1 of Notes to Consolidated Financial Statements in our 20172018 Form 10-K for information regarding the PMIERs, which set requirements for private mortgage insurers to remain eligibleapproved insurers of loans purchased by the GSEs.
Radian Guaranty’s Risk-to-capital calculation appears in the table below. For purposes of the Risk-to-capital calculation, as well as the Risk-to-capital requirements imposed by certain states, statutory capital is defined as the sum of statutory policyholders’ surplus plus statutory contingency reserves.
| | | | March 31,
2018 | | December 31,
2017 | March 31,
2019 | | December 31,
2018 |
| ($ in millions) | | | | | | |
RIF, net (1) | $ | 37,571.1 |
| | $ | 36,793.5 |
| $ | 41,283.5 |
| | $ | 40,711.3 |
|
| | | | | | | |
| Common stock and paid-in capital | $ | 1,866.0 |
| | $ | 1,866.0 |
| $ | 1,416.0 |
| | $ | 1,416.0 |
|
| Surplus Note | 100.0 |
| | 100.0 |
| 100.0 |
| | 100.0 |
|
| Unassigned earnings (deficit) | (758.8 | ) | | (765.0 | ) | (651.1 | ) | | (701.9 | ) |
| Statutory policyholders’ surplus | 1,207.2 |
| | 1,201.0 |
| 864.9 |
| | 814.1 |
|
| Contingency reserve | 1,773.6 |
| | 1,667.0 |
| 2,224.5 |
| | 2,109.9 |
|
| Statutory capital | $ | 2,980.8 |
| | $ | 2,868.0 |
| $ | 3,089.4 |
| | $ | 2,924.0 |
|
| | | | | | | |
| Risk-to-capital | 12.6:1 | | 12.8:1 | 13.4:1 |
| | 13.9:1 |
______________________
| |
| (1) | Excludes risk ceded through all reinsurance contracts (to third parties andprograms (including with affiliates) and RIF on defaulted loans. |
Radian Guaranty’s statutory capital increased by $165.4 million in the first three months of 2019, primarily due to Radian Guaranty’s statutory net income of $165.1 million during this period. The net decrease in Radian Guaranty’s Risk-to-capital in the first three months of 20182019 was primarily due to the increase in overall statutory capital, partially offset by an increase in RIF. Statutory capital increased by $112.8 million, primarily due
The Risk-to-capital ratio for our combined mortgage insurance operations was 12.4 to Radian Guaranty’s statutory net income1 as of $111.9 million for the first three monthsMarch 31, 2019, compared to 12.8 to 1 as of December 31, 2018.
Radian Group Inc.
Notes to Unaudited Condensed Consolidated Financial Statements — (Continued)
The Risk-to-capital ratioIn April 2019, the Pennsylvania Insurance Department approved a $375 million distribution of capital from Radian Guaranty to Radian Group, which was paid on April 30, 2019 in the form of cash and marketable securities. This transfer was approved by the Pennsylvania Insurance Department as an Extraordinary Distribution and will result in a $375 million decrease in Radian Guaranty’s statutory policyholders’ surplus.
EnTitle Insurance
EnTitle Insurance’s statutory policyholders’ surplus and statutory net loss were $26.1 million and $0.4 million, respectively, as of and for the three months ended March 31, 2019.
Through EnTitle Insurance, we maintain escrow deposits as a service to our combined mortgage insurance operations was 11.9 to 1customers. Amounts held in escrow and excluded from assets and liabilities in our condensed consolidated balance sheets totaled $2.4 million and $4.7 million as of March 31, 2018, compared to 12.1 to 1 as of2019 and December 31, 2017.2018, respectively. These amounts were held at third-party financial institutions and not considered assets of the Company. Should one or more of the financial institutions at which escrow deposits are maintained fail, there is no guarantee that we would recover the funds deposited, whether through Federal Deposit Insurance Corporation coverage or otherwise. In the event of any such failure, we could be held liable for the disposition of these funds owned by third parties.
Part I. Item 2. Management’s Discussion and Analysis of Financial Condition and Results of Operations
Item 2. Management’s Discussion and Analysis of Financial Condition and Results of Operations.
The following analysis of our financial condition and results of operations should be read in conjunction with our unaudited condensed consolidated financial statements and the notes thereto included in this report, and our audited financial statements, notes thereto and Management’s Discussion and Analysis of Financial Condition and Results of Operations included in our 20172018 Form 10-K, for a more complete understanding of our financial position and results of operations. Certain terms and acronyms used throughout this report are defined in the Glossary of Abbreviations and Acronyms included as part of this report. In addition, investors should review the “Cautionary Note Regarding Forward-LookingStatements—Safe Harbor Provisions” above and “Item 1A. Risk Factors” in our 20172018 Form 10-K for a discussion of those risks and uncertainties that have the potential to adversely affect our business, financial condition, results of operations, cash flows or prospects. Our results of operations for interim periods are not necessarily indicative of results to be expected for the full year or for any other period.
|
| |
| Index to Management’s Discussion and Analysis of Financial Condition and Results of Operations |
| | PAGE |
| |
| |
| |
| |
| |
| |
| |
| |
Overview
We are a diversified mortgage and real estate services business with two business segments—Mortgage Insurance and Services. Our Mortgage Insurance segment provides credit-related insurance coverage, principally through private mortgage insurance on residential first-lien mortgage loans, as well as other credit risk management solutions, to mortgage lending institutions nationwide.and mortgage credit investors. We provide our mortgage insurance products and services mainly through our wholly-owned subsidiary, Radian Guaranty. Our Services segment is primarily a fee-for-service business that offers a broad array of both mortgage, and real estate and title services to market participants across the mortgage and real estate value chain.chain, as further detailed in “Results of Operations—Services.” These services, comprising mortgage services, real estate services and title services, are provided primarily through our subsidiaries, including Clayton, Green River Capital, Radian Settlement Services and Red Bell, ValuAmerica andBell. In 2018, we also acquired the businesses of EnTitle Direct (which we acquired in March 2018). Ourand Independent Settlement Services, segment provided approximately 12% and 15%as well as the assets of the total ofFive Bridges, to enhance our net premiums earned and services revenue for the three months ended March 31, 2018 and the year ended December 31, 2017, respectively.
Tax Cuts and Jobs Act
On December 22, 2017, the TCJA was signed into law. The TCJA significantly changes the U.S. tax system, and includes, among other things, a reduction of the federal corporate tax rate from 35% to 21%, effective January 1, 2018. During the three months ended March 31, 2018, the TCJA had a significant favorable impact on the Company’s net income, diluted earnings per share and cash flows, primarily due to the reduction in the federal corporate tax rate from 35% to 21%. The TCJA also significantly increased the economic value of our IIF, due to the increase in expected future net cash flows from our existing IIF.
We are continuing to assess the potential effects of the TCJA on our future results, which we generally expect will be favorable. Notwithstanding our current expectations, future guidance that may be issued or changes in policy or interpretations of the TCJA could impact our financial performance depending, among other things, on how the changes impact the economy, including business and consumer sentiment and other key factors affecting our performance. See “Item 1A. Risk Factors,” “Item 7. Management’s Discussion and Analysis of Financial Condition and Results of Operations” and Note 10 of Notes to Consolidated Financial Statements in our 2017 Form 10-K for additional information on the TCJA.
Part I. Item 2. Management's DiscussionandAnalysis of Financial Condition and Results of Operations (Cont'd)
Services offerings.
Operating Environment
As a seller of mortgage credit protection and mortgage and other credit risk management solutions, as well as a provider of mortgage, and real estate and title services, our results are subject to macroeconomic conditions and other events that impact the housing finance and real estate markets, including eventsseasonal fluctuations that specifically impact the mortgage origination environment, the credit performance of our underlying insured assets and our future business opportunities.
The overall improvements in the U.S. economyRecently, mortgage originations for home purchases have increased and the housing finance market since 2008 led to increased home purchasebecome a larger proportion of total mortgage originations, as refinancing activity and,has declined due to the lowrising interest rate environment,rates. This is a high level of refinance transactions. More recently, rates have been increasing and refinance activity has declined. During 2017 and the first three months of 2018, we have benefited from an increase in home purchase transactionspositive trend for our business because mortgage insurance penetration in the insurable mortgage market is generally three to five times higher for purchase originations than for refinancings. We believe that, becauseAdditionally, mortgage insurance penetration is meaningfully higher forrates on purchase transactions have gradually increased over the past few years. The decline in refinance originations thepartially offset by a slight increase in home purchase transactions resulted in a mortgage insurance market in the first quarterthree months of 2018 was larger as compared2019 comparable to the same period of 2017.2018.
Lending laws and regulations that were enacted in response to the financial crisis of 2007-2008 resulted in a more restrictive credit environment that has limited the growth of the mortgage industry. Although this more restrictive credit environment resulted in overall improvement in credit quality, it also made it more challengingMortgage Market Credit Characteristics. Loans originated for many first-time home buyers to finance a home and has limited the number of loans available for private mortgage insurance. In response to first-time home buyer demand and affordability considerations, lenders and the GSEs recently have expanded their mortgage lending products to include products that accommodate higher LTVs, including LTVs greater than 95%, as well as debt-to-income ratios greater than 45%. As a result, Radian Guaranty and the rest of the private mortgage insurance industry have experienced a shift in the mix of mortgage lending products toward higher LTVs and higher debt-to-income ratios. See “—Market Credit Characteristics” and “Results of Operations—Mortgage Insurance—NIW, IIF, RIF” for additional information regarding our portfolio mix and the mortgage industry.
Notwithstanding this mix shift toward higher LTVs and debt-to-income ratios, loan originationsmarket since 2008 consist primarily of high credit quality loans with significantly better credit performance than the loans originated during 2008 and prior periods. AsSignificant contributors to the improved loan quality include the greater risk discipline of March 31, 2018, our portfolioloan originators and the
Part I. Item 2. Management’s Discussion and Analysis of our total primary RIF. The high volumeFinancial Condition and Results of insurance that we have written on high credit quality loans since 2008 has significantly improved ourOperations (continued)
private mortgage insurance portfolio mixproviders, the Qualified Mortgage (QM) loan requirements under the Dodd Frank Act (including the safe harbor for loans meeting GSE underwriting and together with favorable credit trends, has had a significant positive impact on our resultsproduct guidelines) and the loan-level criteria of operations.the PMIERs financial requirements.
Competition and Pricing. Competitive Environment. In our mortgage insurance business, our primary competitors include other private mortgage insurers and governmental agencies, principally the FHA and the VA. We currently compete with other private mortgage insurers on the basis of price, underwriting guidelines, overall service, customer relationships, perceived financial strength (including based on comparative credit ratings) and reputation, as well as the breadth and quality of the services offered through our Services business that complement our mortgage insurance products. We compete with the FHA and VA primarily on the basis of loan limits, pricing, credit guidelines, terms of our insurance policies and loss mitigation practices.
Pricing is highly competitive in the mortgage insurance industry, with industry participants competing for market share and customer relationships. As a result of this competitive environment, pricing trends have included: (i) the increased use of a spectrum of filed rates to allow for pricing based on more granular loan and borrower attributes, including the use of “black-box” pricing; (ii) the use of customized (often discounted) rates on lender-paid, Single Premium Policies and to a limited extent, on borrower-paid Monthly Premium Policies, including in response to requests for pricing bids by certain lenders; and (iii) most recently, pricing changes that include reductions in standard premium rates for borrower-paid policies.
We continually evaluate our pricing strategies based on many factors. Ourfactors, and our pricing strategies are designed to grow the long-term economic value of our IIFmortgage insurance portfolio and achieveto align with our overall strategic objectives. Consistent with these objectives, during March 2018, we implemented rate reductions on our borrower-paid Single Premium Policies, which represented approximately 5% of our NIW during the first quarter of 2018. This strategy is designed to increase our NIW for borrower-paid Single Premium Policies in comparison to our lender-paid Single Premium Policies in order to improve both our return on required capital and our competitive position. Borrower-paid Single Premium Policies include a cancellation feature, which occurs once the mortgage’s LTV has declined to 78%. As a result of this and other factors, borrower-paid Single Premium Policies provide an increased return on required capital because, over the life of the exposure, the Minimum Required Assets under PMIERs are lower than for lender-paid Single Premium Policies.
Part I. Item 2. Management's DiscussionandAnalysis of Financial Condition and Results of Operations (Cont'd)
More recently, in response to price changes by other private mortgage insurers, in May 2018 we announced additional changes, effective June 2018, that will provide increased risk-based granularity to our pricing across most products and better align with industry trends. These pricing changes result in a decrease in our Monthly Premium Policy rates and an increase in our Single Premium Policy rates forThe mortgage insurance industry is migrating away from a predominantly rate-card-based pricing model to one where a variety of pricing methodologies and include our introductionpricing levels are being deployed with differing degrees of rate adjustors related to multi-borrower loans and loans with a debt-to-income ratio greater than 45%. Based on Radian’s recent mix of NIW, after taking these changes into account, our overall premium rate decrease would have been approximately 6%, which includes the new rate adjustors that would have impacted approximately 50% of new business. Radian expects this new pricing (including the impact of our reinsurance transactions) will, over the life of the policies, produce a blended return on required capital on our new business on an unlevered basis (i.e., after-tax underwriting returns plus projected investment income) in the mid-teens.risk-based granularity. This projected return incorporates our understanding of the proposed changes to the PMIERs, which are expected to be effective no earlier than the end of this year.
During the first quarter of 2018, Freddie Mac announced the launch of a pilot program, Integrated Mortgage Insurance (“IMAGIN”) as an alternative way for lenders to sell to Freddie Mac loans with LTVs greater than 80%. This investor-paid mortgage insurance program, in which insurance is provided directly to Freddie Mac, represents an alternative to traditional mortgage insurance that is provided to individual lenders. Under the IMAGIN program, insurance is being provided by a third party which, in turn, is expected to cede the risk to a panel of reinsurers. The participants in the IMAGIN structure are not subject to compliance with the PMIERs, which may create a competitive disadvantage for private mortgage insurers. In its current form, we do not expect that the IMAGIN program will have a material impact on our financial performance or business prospects. In addition to its current focus on lender-paid Single Premium Policies, we believe there are significant challenges to the long-term sustainability of the program, including that the structure relies on a reinsurance market that, in contrast to traditional mortgage insurance, may not be permanently committed to serving the first-loss mortgage insurance market. However, if this pilot program or other alternatives to traditional private mortgage insurance were to expand and become broadly accepted alternatives to traditional private mortgage insurance, they could reduce the demand for private mortgage insurance in its traditional form and could negatively affect our financial results and business prospects.
Market Credit Characteristics. NIW on mortgage loans with LTVs greater than 95%shift has been increasing throughout the industry, although during the first quarter of 2018 we observed a slowing in the pace of increase. In general, borrowers who purchase a home with mortgage insurance tend to have higher LTVs than borrowers who refinance with mortgage insurance. With purchase volume becoming a larger proportion of total originations and access to credit continuing to steadily expand, the proportion of higher-LTV lending in the market has increased. Additional factors contributingled to an increase in the industry’s NIW on mortgage loans with LTVs greater than 95% include: (i) GSE program enhancements and guideline changes, including Fannie Mae’s HomeReady program and Freddie Mac’s Home Possible and Home Possible Advantage programs, that are designedfrequency of pricing changes. Although the current pricing frameworks continue to make home ownership more affordable for low- to moderate-income borrowers and (ii) recent lender response to market demands, particularly in light of increasing demand from first-time home buyers. As a result of all of these factors, home purchases by first-time home buyers, who traditionally require mortgage loans with higher LTVs and may have higher debt-to-income ratios, are becoming an increasingly significant portion ofleverage the total market. In late 2017 and during the first quarter of 2018, due in part to changes in GSE guidelines that increased acceptable debt-to-income limits, we also observed a material increase in the volume of loans to borrowers with debt-to-income ratios greater than 45% throughout the privatesame general risk attributes as mortgage insurance industry. See “Item 7. Management’s Discussionpricing historically, they incorporate more granular risk-based pricing factors.
We currently employ proprietary risk and Analysis of Financial Condition and Results of Operations—Results of Operations—Mortgage Insurance—NIW, IIF, RIF” in our 2017 Form 10-K for additional information about the GSE programs.
Hurricanes. During the third quarter of 2017, Hurricanes Harvey and Irma caused extensive property damage to areas of Texas, Florida and Georgia,customer analytics, as well as other general disruptions including power outagesa digital pricing delivery platform, to deliver loan level pricing electronically to our customers. In January 2019, we broadly introduced our “black box” pricing framework, RADAR Rates, as our newest pricing option that is powered by Radian’s proprietary RADAR risk model and flooding. Althoughanalyzes credit risk inputs to customize a rate quote to a borrower’s individual risk profile, loan attributes and property characteristics. Our customized pricing is tailored to the specific business needs of our customers and their risk profiles. This framework represents a continuation of our strategy to consistently apply an approach to pricing that provides a full spectrum of pricing options that are customer-centric, flexible and customizable based on a lender’s loan origination process, as well as balanced with our own objectives for managing the risk and return profile of our mortgage insurance we write protects the lenders from a portion of losses resulting from loan defaults, it does not provide protection against property loss or physical damage. Our Master Policies contain an exclusion against physical damage, including damage caused by floods or other natural disasters. Depending on the policy form and circumstances, we may, among other things, deduct the cost to repair or remedy physical damage above a de minimis amount from a claim payment and/or, under certain circumstances, deny a claim where (i) the property underlying a mortgage in default is subject to unrestored physical damage or (ii) the physical damage is deemed to be the principal cause of default.
Part I. Item 2. Management's DiscussionandAnalysis of Financial Condition and Results of Operations (Cont'd)
As expected, Radian Guaranty experienced an increase in reported delinquencies in these hurricane-affected areas in the third and fourth quarters of 2017. Also, as expected, we are experiencing high cure rates for these hurricane-related delinquencies.portfolio. We believe that these hurricane-related delinquencies reached their peak in 2017 and, based on past experience, expect that most of these defaultsRADAR Rates, which leverages our proprietary risk model, will cure by the end of 2018. Therefore, although the number of these defaults that will ultimately result in paid claims is uncertain, we do not expect the incremental defaultsenhance our ability to result incontinue to build a material number of paid claims, given the limitations on our coverage related to property damage. Radian has been working with loan servicers to obtain information about forbearance plans and the status of the properties in the affected areas. The future reserve impact of these defaults may be affected by, among other factors, the pace of economic recovery in the FEMA Designated Areas.
Although, as discussed above, we believe that most of the incremental hurricane-related defaults will cure by the end of 2018 without resulting in a material number of paid claims or a material impact on our loss reserves, because the PMIERs require a higher level of Minimum Required Assets for all defaulted loans, these increases in our defaults require higher Minimum Required Assets which reduces our cushion under the PMIERs. This impact, which we expect to be temporary, has not affected Radian Guaranty’s compliance with the PMIERs financial requirements. See “Liquidity and Capital Resources—Radian Group—Short-Term Liquidity Needs—Capital Support for Subsidiaries” for additional information on PMIERs.
For all geographic areas other than the FEMA Designated Areas associated with Hurricanes Harvey and Irma, the number of total new primaryhigh quality mortgage insurance defaults in our insured portfolio declined by 2.5% in the three months ended March 31, 2018, compared to the same period in 2017. Similarly, for all geographic areas other than the FEMA Designated Areas associated with Hurricanes Harvey and Irma, the primary default rateportfolio. Our customers are increasingly utilizing RADAR Rates; for the portfolio declined from 2.8% atmonth of March 31, 2017 to 2.1% at March 31, 2018. See “Results of Operations—Mortgage Insurance—NIW, IIF, RIF—Provision for Losses”2019, RADAR Rates was utilized for more information on defaults.than half of Radian’s NIW and currently a majority of our NIW is being priced through RADAR Rates.
PMIERs. In order to be eligible to insure loans purchased by the GSEs, mortgage insurers such as Radian Guaranty must meet the GSEs’ eligibility requirements, or PMIERs. The PMIERs are comprehensive, covering virtually all aspects of the business and operations of a private mortgage insurer, including internal risk management and quality controls, the relationship between the GSEs and the approved insurer and the approved insurer’s financial condition. In addition, the GSEs have a broad range of consent rightssignificant discretion under the PMIERs and require private mortgage insurers to obtainmay amend the prior consent ofPMIERs at any time. On September 27, 2018, the GSEs before taking certain actions,issued revisions to the PMIERs, or PMIERs 2.0, which may include paying dividends, entering into various intercompany agreements and commuting or reinsuring risk, among others.became effective on March 31, 2019. Radian Guaranty currently is an approved mortgage insurer under the PMIERs and is in compliance with the current PMIERs financial requirements.
Services. The GSEs have significant discretion undermacroeconomic conditions, seasonality and other events that impact the PMIERshousing, mortgage finance and may amendrelated real estate markets also affect the PMIERs at any time.demand for our mortgage, real estate and title services offered through our Services business segment. As previously disclosed, Radian Guaranty has received, on a confidential basis, proposed changesdescribed in “Item 7. Management’s Discussion and Analysis of Financial Condition and Results of Operations—Key Factors Affecting our Results—Services” in our 2018 Form 10-K, revenues for our Services segment are subject to fluctuations from period to period, in part due to the PMIERs. Based on this information, which has been subject to comment bycombination of the private mortgage insurance industry, Radian expects to be able to fully comply with the proposed PMIERs and to maintain an excess of Available Assets over Minimum Required Assets under the PMIERs as of their effective date, which is expected to be no earlier than the end of 2018, without a need to take further actions to do so. The Company’s expectation is not dependent upon our existing Surplus Note and is based on our projections for positive operating results in 2018, our strong capital position and the benefitstransactional nature of our reinsurance programs. See “Liquiditybusiness and Capital Resources—Radian Group—Short-Term Liquidity Needs” and Note 1 of Notes to Unaudited Condensed Consolidated Financial Statements for additional information.
Services. Our Services business is a fee-for-service business that is also subject tothe overall activity in the mortgage, real estatehousing and mortgage finance markets as well as the overall healthseasonality of the related industries. Due to the transactional nature of its business, its revenue from period to period is subject to seasonal fluctuations reflecting the activities in these markets. In addition, notwithstanding recent increasesSee also in the level of securitization transactions in the marketplace, the continued lack of a meaningful securitization market has significantly limited the growth opportunities for our Services segment. See our 20172018 Form 10-K including Note 1 of Notes to Consolidated Financial Statements, “Item 1. Business-Services—Business—Services—Services Business Overview” and “Overview—“Item 7. Management’s Discussion and Analysis of Financial Condition and Results of Operations—Overview—Other 20172018 Developments,” for additional information regarding the servicesServices segment.
Part I. Item 2. Management’s Discussion and Analysis of Financial Condition and Results of Operations (continued)
Business Strategy
Radian’s objectives include driving strong growth, increasing value creation and providing attractive stockholder returns. Consistent with our long-term strategicthese objectives, highlighted below, our business strategy, as highlighted below, is focused on growing our businesses and diversifying our revenue sources, and increasing our fee-based revenues, while at the same time enhancing our operations and developing a one-company market view by integrating our product and services offerings more effectively.
Write high-quality and profitable NIW to drive future earnings, in a manner that enhances the long-term economic value of our insured mortgage portfolio
50
Part I. Item 2. Management's DiscussionandAnalysis of Financial ConditionLeverage our core competencies and Results of Operations (Cont'd)
|
|
RADIAN’S LONG-TERM STRATEGIC OBJECTIVES |
• Write high-quality and profitable NIW to drive future earnings, in a manner that enhances the long-term economic value of the portfolio |
• Leverage our competitive differentiation through:
» Our diverse products and business model
» Our core credit risk management competency
» Driving a one-company market view through our enterprise sales and marketing platform
» Operational excellence, including customer service, process quality and operational efficiency
» Digitally enabling our products and services by leveraging technology and data to drive our businesses
» Broadening our existing relationships as a valued business partner
|
• Manage our capital and financial flexibility to optimize stockholder value |
• Increase operating leverage through accretive revenue growth and effective expense management (1)
|
______________________increase our competitive differentiation in order to:
| |
(1)– | Operating leverage is aGrow our traditional mortgage insurance business in innovative ways |
| |
| – | Expand our presence in the mortgage and real estate value chain beyond traditional mortgage insurance |
| |
| – | Enhance our value to customers with increased diversification of services delivered by our integrated team |
| |
| – | Maintain strong comprehensive enterprise risk management based on sound data and analytics |
| |
| – | Enhance the quality, efficiency and performance metric we define as the year-over-year percentage change in revenues minus the percentage change in expenses.of our operations and delivery of products and services |
InManage our mortgage insurance business, we monitor various competitivecapital and economic factors while seekingfinancial flexibility to balance both profitabilityoptimize stockholder value
Drive positive operating leverage by maintaining accretive revenue growth and market share considerations in developing our strategies. We take a disciplined, risk-based approach to establishing our premium rates and writing a mix of business that we expect to grow the value of our IIF, produce our targeted level of returns on a blended basis and provide an acceptable level of NIW. See “—Operating Environment—Competition and Pricing,” and “—Results of Operations—Mortgage Insurance—NIW, IIF, RIF.”effective expense management

Our growth strategy includes leveraging our core expertise in mortgage credit risk management and expanding our presence in the mortgage finance industry. As part of their initiative to increase the role of private capitalindustry, including by participating in the mortgage market, Fannie Maecertain Front-end and Freddie Mac have established Front-endBack-end credit risk transfer programs that provide the GSEs with credit risk coverage on a Flow Basis that is incremental to primary mortgage insurance. In these transactions the credit risk coverage becomes effective as a loan is acquireddeveloped by the GSE. Since 2016, we have participated in these Front-end programs as part of a panel of mortgage insurance company affiliates, subject to pre-established credit parameters. During 2017, we also participated in similar credit risk transfer programs covering existing loans in the GSEs’ portfolios (i.e., Back-end).GSEs. Our total RIF under the Front-end and Back-end credit risk transfer programs was $104.8 million and $100.4$243.8 million at March 31, 20182019 and $196.8 million at December 31, 2017, respectively.2018. We expect to continue to participate in these and other similar programs in the future, subject to availability and our evaluation of risk-adjusted returns.
We will only experience claims under these Front-end and Back-end credit risk transfer transactions if the borrower’s equity, any existing primary mortgage insurance and the GSEs’ retained risk are depleted. The GSEs retain the first losseshave been focused on these credit risk transfer transactions, ranging from 35 to 50 basis points. Radian would then be responsible to cover the next layer of losses, which ranges in size from approximately 200 to 300 basis points.
As we repositionrepositioning our Services business pursuant toby implementing our restructuring plan, we are continuing to focus on using the mortgage, real estate and title services offered through our Services segmentwe offer to complement our Mortgage Insurance business. Thisbusiness and investing in new products and services to innovate and provide integrated solutions for our clients. Our strategy is designed to satisfy demand in the market, grow our fee-based revenues, strengthen our existing customer relationships, attract new customers and differentiate us from other mortgage insurance companies. See “PART II—Item 7. Management’s Discussion and Analysis of Financial Condition and Results of Operations—Overview—Business Strategy” in our 2017 Form 10-K for additional information on our Services strategy.
Other 20182019 Developments
Capital and Liquidity Actions. On August 9, 2017,March 20, 2019, Radian Group’s board of directors renewedapproved a $150 million increase in authorization for the Company’s existing share repurchase program, authorizingplan, bringing the Companytotal authorization to repurchase shares up to $50$250 million, of its common stock through July 31, 2018.excluding commissions. During the three months ended March 31, 2018, we2019, the Company purchased 531,0131,546,674 shares at an average price of $18.84$20.54 per share, including commissions. At March 31, 2018,2019, purchase authority of up to $40.0 million remained available under this program.
Part I. Item 2. Management's DiscussionandAnalysis of Financial Condition and Results of Operations (Cont'd)
During April 2018, the Company purchased an additional 924,720 shares of its common stock under its share repurchase program at an average price of $16.24 per share, including commissions. At April 30, 2018, purchase authority of up to a maximum of $25$218.2 million remained available under this program, which basedexpires on current market conditions,July 31, 2020. Subsequent to March 31, 2019, we expect to fully utilize before thepurchased 4,131,329 shares of its common stock under this program expires.at an average price of $21.94 per share, including commissions. See Note 14 of Notes to Unaudited Condensed Consolidated Financial Statements for additional information.details on our share repurchase program.
Restructuring and Other Exit Costs. AsIn April 2019, the Pennsylvania Insurance Department approved a result$375 million distribution of the Company’s continuation of its 2017 plancapital from Radian Guaranty to restructure the Services business, pretax restructuring charges of $0.6 million were recognizedRadian Group, which was paid on April 30, 2019 in the first quarterform of 2018, including $0.5 million in cash expenses. We expect to incur additional pretax charges of approximately $3.1 million under this plan, including approximately $2.5 million in cash payments. These remaining charges are expected to be recognized by December 31, 2018.and marketable securities. See Note 116 of Notes to Unaudited Condensed Consolidated Financial Statements hereinfor a discussion of this distribution of capital.
Reinsurance. Radian’s reinsurance programs represent a component of our long-term risk distribution strategy. From time to time, we enter into reinsurance transactions as part of our strategy to optimize the amounts and Notestypes of capital and risk distribution deployed against insured risk, including by accessing both the capital and the reinsurance markets to distribute risk. We expect our risk distribution strategy to: (i) support our overall capital plans; (ii) lower our cost of capital; and (iii) reduce portfolio risk and financial volatility through economic cycles.
As part of our risk distribution strategy, in April 2019, Radian Guaranty entered into a fully collateralized reinsurance agreement with Eagle Re 2019-1. Eagle Re 2019-1 is a VIE and is not a subsidiary or affiliate of Radian Guaranty. This
Part I. Item 2. Management’s Discussion and Analysis of Financial Condition and Results of Operations (continued)
reinsurance agreement provides for up to $562.0 million of aggregate excess-of-loss reinsurance coverage for mortgage insurance losses in connection with new defaults on an existing portfolio of eligible Recurring Premium Policies issued between January 1, 2018 and 7December 31, 2018, with an initial RIF of Notes$10.7 billion. Eagle Re 2019-1 financed its coverage by issuing mortgage insurance-linked notes in an aggregate amount of $562.0 million to Consolidated Financial Statementseligible third-party capital markets investors in our 2017 Form 10-K foran unregistered private offering. This reinsurance agreement will reduce net RIF by a total of $562.0 million, and is expected to reduce the capital required to be held at Radian Guaranty by reducing the PMIERs Minimum Required Assets by the same amount. For additional information including the events that led to the restructuring decision.
Services Acquisition. During the first quarter of 2018, Radian acquired EnTitle Direct, the owner of EnTitle Insurance Company, a national title insurance and settlement services company. Although the purchase price was not material to Radian, the acquisition is consistent withabout our growth and diversification strategy, as well as our focus on enhancing the core product offerings of our Services business. EnTitle Insurance Company is qualified to write title insurance businessreinsurance arrangements see Note 7 in 40 states and the District of Columbia. By adding the capabilities of EnTitle Insurance Company to the title and settlement services already offered by ValuAmerica, Radian’s existing title agency, we have expanded the geographic reach of our title services and are positioned to provide title insurance and settlement services to our customers across the country.
IRS Matter. In April 2018, Radian was notified that the JCT had no objection to the terms of the Company’s previously disclosed proposed settlement with the IRS. We now expect the settlement to be finalized and completed within the next several months. While the expected impact of the final settlement will reduce Radian’s available holding company liquidity, during the second quarter of 2018 the Company expects to recognize a net positive impact to tax expense and net income of approximately $30 million, resulting in an increase in book value per share of approximately $0.14 (calculated based on the number of common shares outstanding at March 31, 2018). This anticipated benefit does not include any potential related benefit from the impact on state income taxes, which has not yet been determined. See Note 9 of Notes to Unaudited Condensed Consolidated Financial Statements and “Results of Operations—Mortgage Insurance—NIW, IIF, RIF—Net Premiums Written and Earned.” See “Liquidity and Capital Resources—Radian Group—Group—Short-Term Liquidity Needs—IRS Matter” Capital Support for Subsidiaries” for additional information.information on the PMIERs.
Key Factors Affecting Our Results
The key factors affecting our results are discussed in our 2018 Form 10-K. There have been no material changes to thethese key factors affecting our results that are discussed in our 2017 Form 10-K.factors.
Results of Operations—Consolidated
Three Months Ended March 31, 20182019 Compared to Three Months Ended March 31, 20172018
Radian Group serves as the holding company for our operating subsidiaries and does not have any operations of its own. Our consolidated operating results for the three-month periods ended March 31, 20182019 and March 31, 20172018 primarily reflect the financial results and performance of our two business segments—Mortgage Insurance and Services. See Note 3 of Notes to Unaudited Condensed Consolidated Financial Statements for information regarding the basis of our segment reporting, including the related allocations. See “Results of Operations—Mortgage Insurance” and “Results of Operations—Services” for the operating results of these business segments for the three months ended March 31, 2018,2019, compared to the same periodperiods in 2017.2018.
In addition to the results of our operating segments, pretax income (loss) is also affected by those factors described in “Item 7. Management’s Discussion and Analysis of Financial Condition and Results of Operations—Key Factors Affecting Our Results” in our 20172018 Form 10-K.
Part I. Item 2. Management'sManagement’s DiscussionandAnalysis of Financial Condition and Results of Operations (Cont'd)(continued)
The following table highlights selected information related to our consolidated results of operations for the three months ended March 31, 20182019 and 2017:2018:
| | | | | | | | $ Change | | | | | Change |
| | Three Months Ended
March 31, | | Favorable (Unfavorable) | Three Months Ended
March 31, | | Favorable (Unfavorable) |
| (In millions, except per-share amounts) | 2018 |
| 2017 | | 2018 vs. 2017 | 2019 |
| 2018 | | 2019 vs. 2018 |
| Pretax income | $ | 142.4 |
| | $ | 114.7 |
| | $ | 27.7 |
| $ | 216.1 |
| | $ | 142.4 |
| | $ | 73.7 |
|
| Net income | 114.5 |
| | 76.5 |
| | 38.0 |
| 171.0 |
| | 114.5 |
| | 56.5 |
|
| Diluted net income per share | 0.52 |
| | 0.34 |
| | 0.18 |
| 0.78 |
| | 0.52 |
| | 0.26 |
|
| Book value per share at March 31 | 14.16 |
| | 13.58 |
| | 0.58 |
| 17.49 |
| | 14.16 |
| | 3.33 |
|
| | | | | |
|
| | | | | |
| Net premiums earned—insurance | 242.6 |
| | 221.8 |
| | 20.8 |
| |
| Services revenue | 33.2 |
| | 38.0 |
| | (4.8 | ) | |
| Net investment income | 34.0 |
| | 31.0 |
| | 3.0 |
| |
Net premiums earned—insurance (1) | | 263.5 |
| | 242.6 |
| | 20.9 |
|
Services revenue (2) | | 32.8 |
| | 33.2 |
| | (0.4 | ) |
Net investment income (1) | | 43.8 |
| | 34.0 |
| | 9.8 |
|
| Net gains (losses) on investments and other financial instruments | (18.9 | ) | | (2.9 | ) | | (16.0 | ) | 21.9 |
| | (18.9 | ) | | 40.8 |
|
| Provision for losses | 37.3 |
| | 46.9 |
| | 9.6 |
| |
| Cost of services | 23.1 |
| | 28.4 |
| | 5.3 |
| |
Provision for losses (1) | | 20.8 |
| | 37.3 |
| | 16.5 |
|
Cost of services (2) | | 24.2 |
| | 23.1 |
| | (1.1 | ) |
| Other operating expenses | 63.2 |
| | 68.4 |
| | 5.2 |
| 78.8 |
| | 63.2 |
| | (15.6 | ) |
| Restructuring and other exit costs | 0.6 |
| | — |
| | (0.6 | ) | |
| Loss on induced conversion and debt extinguishment | — |
| | 4.5 |
| | 4.5 |
| |
| Income tax provision | 28.0 |
| | 38.2 |
| | 10.2 |
| 45.2 |
| | 28.0 |
| | (17.2 | ) |
Adjusted pretax operating income (3) | | 202.1 |
| | 164.1 |
| | 38.0 |
|
Adjusted diluted net operating income per share (3) | | 0.73 |
| | 0.59 |
| | 0.14 |
|
| | | | | |
|
| | | | | |
Adjusted pretax operating income (1) | $ | 164.1 |
| | $ | 125.2 |
| | $ | 38.9 |
| |
| Return on equity | | 19.0 | % | | 15.1 | % | | 3.9 | % |
Adjusted net operating return on equity (3) | | 17.7 | % | | 17.1 | % | | 0.6 | % |
______________________
| |
| (1) | Relates primarily to the Mortgage Insurance segment. See “Results of Operations—Mortgage Insurance” for more information. |
| |
| (2) | Relates to our Services segment. See “Results of Operations—Services” for more information. |
| |
| (3) | See “—Use of Non-GAAP Financial MeasureMeasures” below. |
Net Income. As discussed in more detail below, ourOur net income increased for the three months ended March 31, 2018,2019, compared to the same period in 2017,2018, primarily reflecting: (i) an increase in net gains on investments and other financial instruments; (ii) an increase in net premiums earned; (ii) a decrease in income tax provision primarily due to the reduction in the federal corporate tax rate from 35% to 21%, effective January 1, 2018; (iii) a decrease in provision for losses; and (iv) a decreasean increase in other operating expenses.net investment income. Partially offsetting these items is an increase in net losses on investments and other financial instruments.operating expenses. See “Results of Operations—Mortgage Insurance” and “Results of Operations—Services” for more information on our segment results.
For the three months ended March 31, 2018, compared to the same period in 2017, revenue increased modestly, primarily driven by a 9% increase in net premiums earned, while other operating expenses decreased by 8%. These results are consistent with Radian’s long-term strategic objective of increasing operating leverage through revenue growth and disciplined expense management.
Diluted Net Income Per Share. The increase in diluted net income per share for the three months ended March 31, 2018,2019, compared to the same period in 2017,2018, is primarily due to the increase in net income, as discussed above.
Book Value Per Share. The increase in book value per share from $13.90$16.34 at December 31, 20172018, to $14.16$17.49 at March 31, 20182019, is primarily due to (i) our first quarter 2019 net income partially offset by a decreaseand (ii) an increase of $0.27$0.37 per share due to net unrealized lossesgains in our available for sale securities, recorded in accumulated other comprehensive income.
Services Revenue and Cost of Services. Services revenue and cost of services represent amounts related to our Services segment and are discussed belowReturn on equity. The increase in “Results of Operations—Services.”
Net Investment Income. For the three months ended March 31, 2018 and 2017, net investment income represents investment income from investments held at Radian Group that are allocatedreturn on equity is primarily due to the Mortgage Insurance segment and investmentincrease in net income from investments heldpartially offset by the Mortgage Insurance segment. See “Results of Operations—Mortgage Insurance” for more information.increase in stockholders’ equity.
Part I. Item 2. Management'sManagement’s DiscussionandAnalysis of Financial Condition and Results of Operations (Cont'd)(continued)
Net Gains (Losses) on Investments and Other Financial Instruments. The increase in net lossesgains on investments and other financial instruments for the three months ended March 31, 2018,2019, as compared to the same period in 2017,2018, is primarily due to the increase in unrealized lossesgains in our trading portfolio related to changes in fair value resulting from increasedlower interest rates, partially offset by a decrease in net realized losses.rates. The components of the net gains (losses) on investments and other financial instruments for the periods indicated are as follows:
| | | | Three Months Ended
March 31, | Three Months Ended
March 31, |
| (In millions) | 2018 | | 2017 | 2019 | | 2018 |
| Net unrealized gains (losses) related to change in fair value of trading securities and other investments | $ | (12.8 | ) | | $ | 5.2 |
| $ | 19.5 |
| | $ | (12.8 | ) |
| Net realized gains (losses) on investments | (3.4 | ) | | (8.2 | ) | (1.7 | ) | | (3.4 | ) |
| Other-than-temporary impairment losses | (0.9 | ) | | — |
| — |
| | (0.9 | ) |
| Net gains (losses) on other financial instruments | (1.8 | ) | | 0.1 |
| 4.1 |
| | (1.8 | ) |
| Net gains (losses) on investments and other financial instruments | $ | (18.9 | ) | | $ | (2.9 | ) | $ | 21.9 |
| | $ | (18.9 | ) |
| | | | | | | |
Other Operating Expenses. Other operating expenses decreased for the three months ended March 31, 2018,2019, increased as compared to the same period in 2017,2018, primarily as a result of: (i) increases due to the impact of: (i) lower expenses associated with retirementbusinesses acquired in 2018 and consulting agreements entered into in February 2017 with our former Chief Executive Officerthe resulting inclusion of their operating expenses; (ii) higher legal and (ii) an increase in ceding commissions, primarily due to the increased cession percentage on the 2016 Single Premium QSR Transaction. These effects were partially offset byother professional services expense; and (iii) higher compensation expense in 2019, including variable and incentive-based compensation.
Restructuring and other exit costs. For In addition to these items, the three months ended March 31, 2019, as compared to the same period in 2018, restructuring and other exit costs include charges associated with our planalso included an increase in non-operating items, primarily related to restructure the Services business. These charges are primarily due to severance and related benefit costs and impairment of other long-lived assets. See “Overview—Services” for more information.
Loss on Induced Conversion and Debt Extinguishment. During the first quarter of 2017, we settled our obligations on the remaining Convertible Senior Notes due 2019, resulting in a loss on debt extinguishment of $4.5 million that represented the difference between the fair value and the carrying value, net of unamortized issuance costs, of the liability component of the Convertible Senior Notes due 2019.
Income Tax Provision. Our effective tax rate was 19.6%20.9% for the three months ended March 31, 2018, compared to 33.3% for2019, which approximates the federal statutory rate. For the same period in 2017. The decrease in2018, the difference between our effective tax rate as compared to the same period in 2017 is primarily due to the TCJA, which was signed into law on December 22, 2017. The TCJA significantly changed the U.S. tax systemof 19.6% and among other things, reduced the federal corporate tax rate from 35% to 21%, effective January 1, 2018. For the three months ended March 31, 2018, the difference between the federal statutory tax rate of 21% and our effective tax rate of 19.6% was primarily due to adjustments to our liability for uncertain tax positions. For the three months ended March 31, 2017, our effective tax rate was lower than the federal statutory rate of 35%, primarily due to the accounting for: (i) excess tax benefits from employee share-based payments; (ii) adjustments to our liability for uncertain tax positions; and (iii) state and local taxes.
Use of Non-GAAP Financial Measure. Measures. In addition to the traditional GAAP financial measures, we have presented “adjusted pretax operating income,” a“adjusted diluted net operating income per share” and “adjusted net operating return on equity,” which are non-GAAP financial measuremeasures for the consolidated company, among our key performance indicators to evaluate our fundamental financial performance. ThisThese non-GAAP financial measure alignsmeasures align with the way our business performance is evaluated by both management and by our board of directors. This measure hasThese measures have been established in order to increase transparency for the purposes of evaluating our core operating trends and enabling more meaningful comparisons with our peers. Although on a consolidated basis “adjusted pretax operating income” is aincome,” “adjusted diluted net operating income per share” and “adjusted net operating return on equity” are non-GAAP financial measure,measures, for the reasons discussed above we believe this measure aidsthese measures aid in understanding the underlying performance of our operations. Our senior management, including our Chief Executive Officer (Radian’s chief operating decision maker), uses adjusted pretax operating income (loss) as our primary measure to evaluate the fundamental financial performance of each of the Company’s business segments and to allocate resources to the segments.
Adjusted pretax operating income is defined as GAAP consolidated pretax income (loss) excluding the effects of: (i) net gains (losses) on investments and other financial instruments; (ii) loss on induced conversion and debt extinguishment; (iii) acquisition-related expenses; (iv) amortization or impairment of goodwill and other acquired intangible assets; and (v) net impairment losses recognized in earnings and lossesinfrequent or unusual non-operating items. Adjusted diluted net operating income per share is calculated by dividing (i) adjusted pretax operating income attributable to common stockholders, net of taxes computed using the company’s statutory tax rate, by (ii) the sum of the weighted average number of common shares outstanding and all dilutive potential common shares outstanding. Interest expense on convertible debt, share dilution from convertible debt and the saleimpact of linesshare-based compensation arrangements have been reflected in the per share calculations consistent with the accounting standard regarding earnings per share, whenever the impact is dilutive. Adjusted net operating return on equity is calculated by dividing annualized adjusted pretax operating income, net of business.taxes computed using the company’s statutory tax rate, by average stockholders’ equity, based on the average of the beginning and ending balances for each period presented.
Part I. Item 2. Management'sManagement’s DiscussionandAnalysis of Financial Condition and Results of Operations (Cont'd)(continued)
Although adjusted pretax operating income (loss) excludes certain items that have occurred in the past and are expected to occur in the future, the excluded items represent those that are: (i) not viewed as part of the operating performance of our primary activities or (ii) not expected to result in an economic impact equal to the amount reflected in pretax income (loss).income. These adjustments, along with the reasons for their treatment, are described below.
| |
| (1) | Net gains (losses) on investments and other financial instruments. The recognition of realized investment gains or losses can vary significantly across periods as the activity is highly discretionary based on the timing of individual securities sales due to such factors as market opportunities, our tax and capital profile and overall market cycles. Unrealized investment gains and losses arise primarily from changes in the market value of our investments that are classified as trading or equity securities. These valuation adjustments may not necessarily result in realized economic gains or losses. |
Trends in the profitability of our fundamental operating activities can be more clearly identified without the fluctuations of these realized and unrealized gains or losses.losses and changes in fair value of other financial instruments. We do not view them to be indicative of our fundamental operating activities. Therefore, these items are excluded from our calculation of adjusted pretax operating income (loss).
| |
| (2) | Loss on induced conversion and debt extinguishment. Gains or losses on early extinguishment of debt and losses incurred to purchase our convertible debt prior to maturity are discretionary activities that are undertaken in order to take advantage of market opportunities to strengthen our financial and capital positions; therefore, we do not view these activities as part of our operating performance. Such transactions do not reflect expected future operations and do not provide meaningful insight regarding our current or past operating trends. Therefore, these items are excluded from our calculation of adjusted pretax operating income (loss). |
| |
| (3) | Acquisition-related expenses. Acquisition-related expenses represent the costs incurred to effect an acquisition of a business (i.e., a business combination). Because we pursue acquisitions on a strategic and selective basis, and not in the ordinary course of our business, we do not view acquisition-related expenses as a consequence of a primary business activity. Therefore, we do not consider these expenses to be part of our operating performance and they are excluded from our calculation of adjusted pretax operating income (loss). |
| |
| (4) | Amortization or impairment of goodwill and other acquired intangible assets. Amortization of acquired intangible assets represents the periodic expense required to amortize the cost of acquired intangible assets over their estimated useful lives. IntangibleAcquired intangible assets with an indefinite useful life are also periodically reviewed for potential impairment, and impairment adjustments are made whenever appropriate. These charges are not viewed as part of the operating performance of our primary activities and therefore are excluded from our calculation of adjusted pretax operating income (loss). |
| |
| (5) | Net impairment losses recognized in earnings and losses from the sale of lines of businessinfrequent or unusual non-operating items. The recognition of net impairment losses on investments and the impairment of other long-lived assets does not result in a cash payment and can vary significantly in both amount and frequency, depending on market credit cycles and other factors. Losses from the sale of lines of business are highly discretionary as a result of strategic restructuring decisions,Infrequent and generallyunusual non-operating items reflect activities that we do not occur in the normal course of our business. We do not view these losses to be indicative of our fundamental operating activities. Therefore, whenever these lossessuch income or loss items occur, we exclude them from our calculation of adjusted pretax operating income (loss). |
Total adjusted pretax operating income, isadjusted diluted net operating income per share and adjusted net operating return on equity are not a measuremeasures of total profitability, and therefore should not be considered in isolation or viewed as a substitutesubstitutes for GAAP pretax income, (loss).diluted net income per share or return on equity. Our definitiondefinitions of adjusted pretax operating income, adjusted diluted net operating income per share and adjusted net operating return on equity may not be comparable to similarly-named measures reported by other companies.
Part I. Item 2. Management'sManagement’s DiscussionandAnalysis of Financial Condition and Results of Operations (Cont'd)(continued)
The following table provides a reconciliationtables provide reconciliations of the most comparable GAAP measure,measures of consolidated pretax income, diluted net income per share and return on equity, to our non-GAAP financial measuremeasures for the consolidated company of adjusted pretax operating income:income, adjusted diluted net operating income per share and adjusted net operating return on equity, respectively:
| | | Reconciliation of Consolidated Non-GAAP Financial Measure | |
| Reconciliation of Consolidated Pretax Income to Adjusted Pretax Operating Income | | Reconciliation of Consolidated Pretax Income to Adjusted Pretax Operating Income |
| | Three Months Ended
March 31, | Three Months Ended
March 31, |
| (In thousands) | 2018 | | 2017 | 2019 | | 2018 |
| Consolidated pretax income (loss) | $ | 142,442 |
| | $ | 114,670 |
| |
| Consolidated pretax income | | $ | 216,136 |
| | $ | 142,442 |
|
| Less income (expense) items: | | | | | | |
| Net gains (losses) on investments and other financial instruments | (18,887 | ) | | (2,851 | ) | 21,913 |
| | (18,887 | ) |
| Loss on induced conversion and debt extinguishment | — |
| | (4,456 | ) | |
Acquisition-related expenses (1) | — |
| | (8 | ) | (233 | ) | | — |
|
| Amortization and impairment of other intangible assets | (2,748 | ) | | (3,296 | ) | |
Impairment of other long-lived assets (2) | (26 | ) | | — |
| |
| Amortization and impairment of other acquired intangible assets | | (2,187 | ) | | (2,748 | ) |
Impairment of other long-lived assets and infrequent or unusual non-operating items (2) | | (5,427 | ) | | (26 | ) |
Total adjusted pretax operating income (3) | $ | 164,103 |
| | $ | 125,281 |
| $ | 202,070 |
|
| $ | 164,103 |
|
| | | | | | | |
______________________
| |
| (1) | Acquisition-related expenses represent expenses incurred to effect the acquisition of a business, net of adjustments to accruals previously recorded for acquisition expenses. |
| |
| (2) | IncludedThe amount for the three months ended March 31, 2019 is included in other operating expenses on the condensed consolidated statement of operations and primarily relates to impairments of other long-lived assets. The amount for the three months ended March 31, 2018 is included within restructuring and other exit costs.costs on the condensed consolidated statement of operations. |
| |
| (3) | Total adjusted pretax operating income on a consolidated basis consists of adjusted pretax operating income (loss) for eachour Mortgage Insurance segment and our Services segment, as follows: |
|
| | | | | | | |
| | Three Months Ended
March 31, |
| (In thousands) | 2018 | | 2017 |
| Adjusted pretax operating income (loss): | | | |
Mortgage insurance (a) | $ | 171,711 |
| | $ | 134,633 |
|
Services (a) | (7,608 | ) | | (9,352 | ) |
| Total adjusted pretax operating income | $ | 164,103 |
| | $ | 125,281 |
|
| | | | |
______________________
| |
(a) | Includes inter-segment expenses and revenues as disclosedfurther detailed in in Note 3 of Notes to Unaudited Condensed Consolidated Financial Statements. |
Part I. Item 2. Management'sManagement’s DiscussionandAnalysis of Financial Condition and Results of Operations (Cont'd)(continued)
|
| | | | | | | |
Reconciliation of Diluted Net Income Per Share to Adjusted Diluted Net Operating Income Per Share |
| | Three Months Ended
March 31, |
| (In thousands) | 2019 | | 2018 |
| Diluted net income per share | $ | 0.78 |
| | $ | 0.52 |
|
| | | | |
| Less per-share impact of reconciling income (expense) items: | | | |
| Net gains (losses) on investments and other financial instruments | 0.10 |
| | (0.09 | ) |
| Amortization and impairment of other acquired intangible assets | (0.01 | ) | | (0.01 | ) |
| Impairment of other long-lived assets and infrequent or unusual non-operating items | (0.02 | ) | | — |
|
Income tax provision (benefit) on other income (expense) items (1) | 0.01 |
| | (0.02 | ) |
| Difference between statutory and effective tax rate | (0.01 | ) | | 0.01 |
|
| Per-share impact of other income (expense) items | 0.05 |
| | (0.07 | ) |
Adjusted diluted net operating income per share (1) | $ | 0.73 |
| | $ | 0.59 |
|
| | | | |
______________________
| |
| (1) | Calculated using the company’s federal statutory tax rate of 21%. Any permanent tax adjustments and state income taxes on these items have been deemed immaterial and are not included. |
|
| | | | | |
Reconciliation of Return on Equity to Adjusted Net Operating Return on Equity (1) |
| | Three Months Ended
March 31, |
| (In thousands) | 2019 | | 2018 |
Return on equity (1) | 19.0 | % | | 15.1 | % |
Less impact of reconciling income (expense) items: (2) | | | |
| Net gains (losses) on investments and other financial instruments | 2.4 |
| | (2.5 | ) |
| Amortization and impairment of other acquired intangible assets | (0.2 | ) | | (0.4 | ) |
| Impairment of other long-lived assets and infrequent or unusual non-operating items | (0.6 | ) | | — |
|
Income tax provision (benefit) on reconciling income (expense) items (3) | 0.3 |
| | (0.6 | ) |
| Difference between statutory and effective tax rate | — |
| | 0.3 |
|
| Impact of reconciling income (expense) items | 1.3 |
|
| (2.0 | ) |
| Adjusted net operating return on equity | 17.7 | % | | 17.1 | % |
| | | | |
______________________
| |
| (1) | Calculated by dividing annualized net income by average stockholders’ equity, based on the average of the beginning and ending balances for each period presented. |
| |
| (2) | Annualized, as a percentage of average stockholders’ equity. |
| |
| (3) | Calculated using the company’s federal statutory tax rate of 21%. Any permanent tax adjustments and state income taxes on these items have been deemed immaterial and are not included. |
Part I. Item 2. Management’s Discussion and Analysis of Financial Condition and Results of Operations (continued)
Results of Operations—Mortgage Insurance
Three Months Ended March 31, 20182019 Compared to Three Months Ended March 31, 20172018
The following table summarizes our Mortgage Insurance segment’s results of operations for the three months ended March 31, 20182019 and 2017:2018:
| | | | | | | | $ Change | | | | | $ Change |
| | Three Months Ended
March 31, | | Favorable (Unfavorable) | Three Months Ended
March 31, | | Favorable (Unfavorable) |
| (In millions) | 2018 | | 2017 | | 2018 vs. 2017 | 2019 | | 2018 | | 2019 vs. 2018 |
Adjusted pretax operating income (1) | $ | 171.7 |
| | $ | 134.6 |
| | $ | 37.1 |
| $ | 208.2 |
| | $ | 171.7 |
| | $ | 36.5 |
|
Net premiums written—insurance (2) | 238.0 |
| | 224.7 |
| | 13.3 |
| 251.6 |
| | 238.0 |
| | 13.6 |
|
| (Increase) decrease in unearned premiums | 4.6 |
| | (2.9 | ) | | 7.5 |
| |
| Net premiums earned—insurance | 242.6 |
| | 221.8 |
| | 20.8 |
| |
(Increase) decrease in unearned premiums (2) | | 10.2 |
| | 4.6 |
| | 5.6 |
|
Net premiums earned—insurance (2) | | 261.8 |
| | 242.6 |
| | 19.2 |
|
| Net investment income | 34.0 |
| | 31.0 |
| | 3.0 |
| 43.7 |
| | 34.0 |
| | 9.7 |
|
| Provision for losses | 37.4 |
| | 47.2 |
| | 9.8 |
| 20.8 |
| | 37.4 |
| | 16.6 |
|
Other operating expenses (3) | 50.5 |
| | 53.5 |
| | 3.0 |
| 56.0 |
| | 50.5 |
| | (5.5 | ) |
| Interest expense | | 15.7 |
| | 10.6 |
| | (5.1 | ) |
______________________
| |
| (1) | Our senior management uses adjusted pretax operating income (loss) as our primary measure to evaluate the fundamental financial performance of each of the Company’s business segments. See Note 3 of Notes to Unaudited Condensed Consolidated Financial Statements. |
| |
| (2) | Net of premiums ceded premiums written under the QSR Transactions and the Single Premium QSR Transactions.our reinsurance programs. See Note 7 of Notes to Unaudited Condensed Consolidated Financial Statements for more information. |
| |
| (3) | Includes allocation of corporate operating expenses of $18.6 million and $14.2$25.6 million for the three months ended March 31, 20182019 and 2017, respectively.$18.6 million for the three months ended March 31, 2018. |
Adjusted Pretax Operating Income. Our Mortgage Insurance segment’s adjusted pretax operating income increased for the three months ended March 31, 2018,2019, compared to the same period in 2017,2018, primarily reflecting: (i) an increase in net premiums earned andearned; (ii) a decrease in the provision for losses.losses; and (iii) an increase in net investment income. Partially offsetting these items are increases in: (i) other operating expenses and (ii) interest expense. See “Results of Operations—Services—Three Months Ended March 31, 2019 Compared to Three Months Ended March 31, 2018—Interest Expense.”
NIW, IIF, RIF
A key component of our current business strategy is to grow our mortgage insurance business by writingwrite profitable insurance on high credit quality mortgages in the U.S. Consistent with this objective, we wrote $11.7$10.9 billion of primary new mortgage insurance in the three months ended March 31, 2018,2019, compared to $10.1$11.7 billion of NIW in the three months ended March 31, 2017.2018. Our Persistency Rate for the twelve months ended March 31, 2019 increased to 83.4%, as compared to 81.0% for the twelve months ended March 31, 2018. The combination of our NIW and our Persistency Rate resulted in an increase in IIF, from $200.7$221.4 billion at December 31, 20172018 to $204.0$223.7 billion at March 31, 2018,2019, as shown in the chart below. Policy years represent the original policy years, and have not been adjusted to reflect subsequent HARP refinancing activity. Our Persistency Rate for the twelve months ended March 31, 2018 increased to 81.0%, as compared to 77.1% for the twelve months ended March 31, 2017.
Part I. Item 2. Management'sManagement’s DiscussionandAnalysis of Financial Condition and Results of Operations (Cont'd)(continued)
______________________
| |
| (1) | Policy years represent the original policy years, and have not been adjusted to reflect subsequent HARP refinancing activity. |
| |
| (2) | Adjusted to reflect subsequent HARP refinancing activity, this percentage would decrease to 5.7%, 6.0% and 7.7% as of March 31, 2019, December 31, 2018 and March 31, 2018, respectively. |
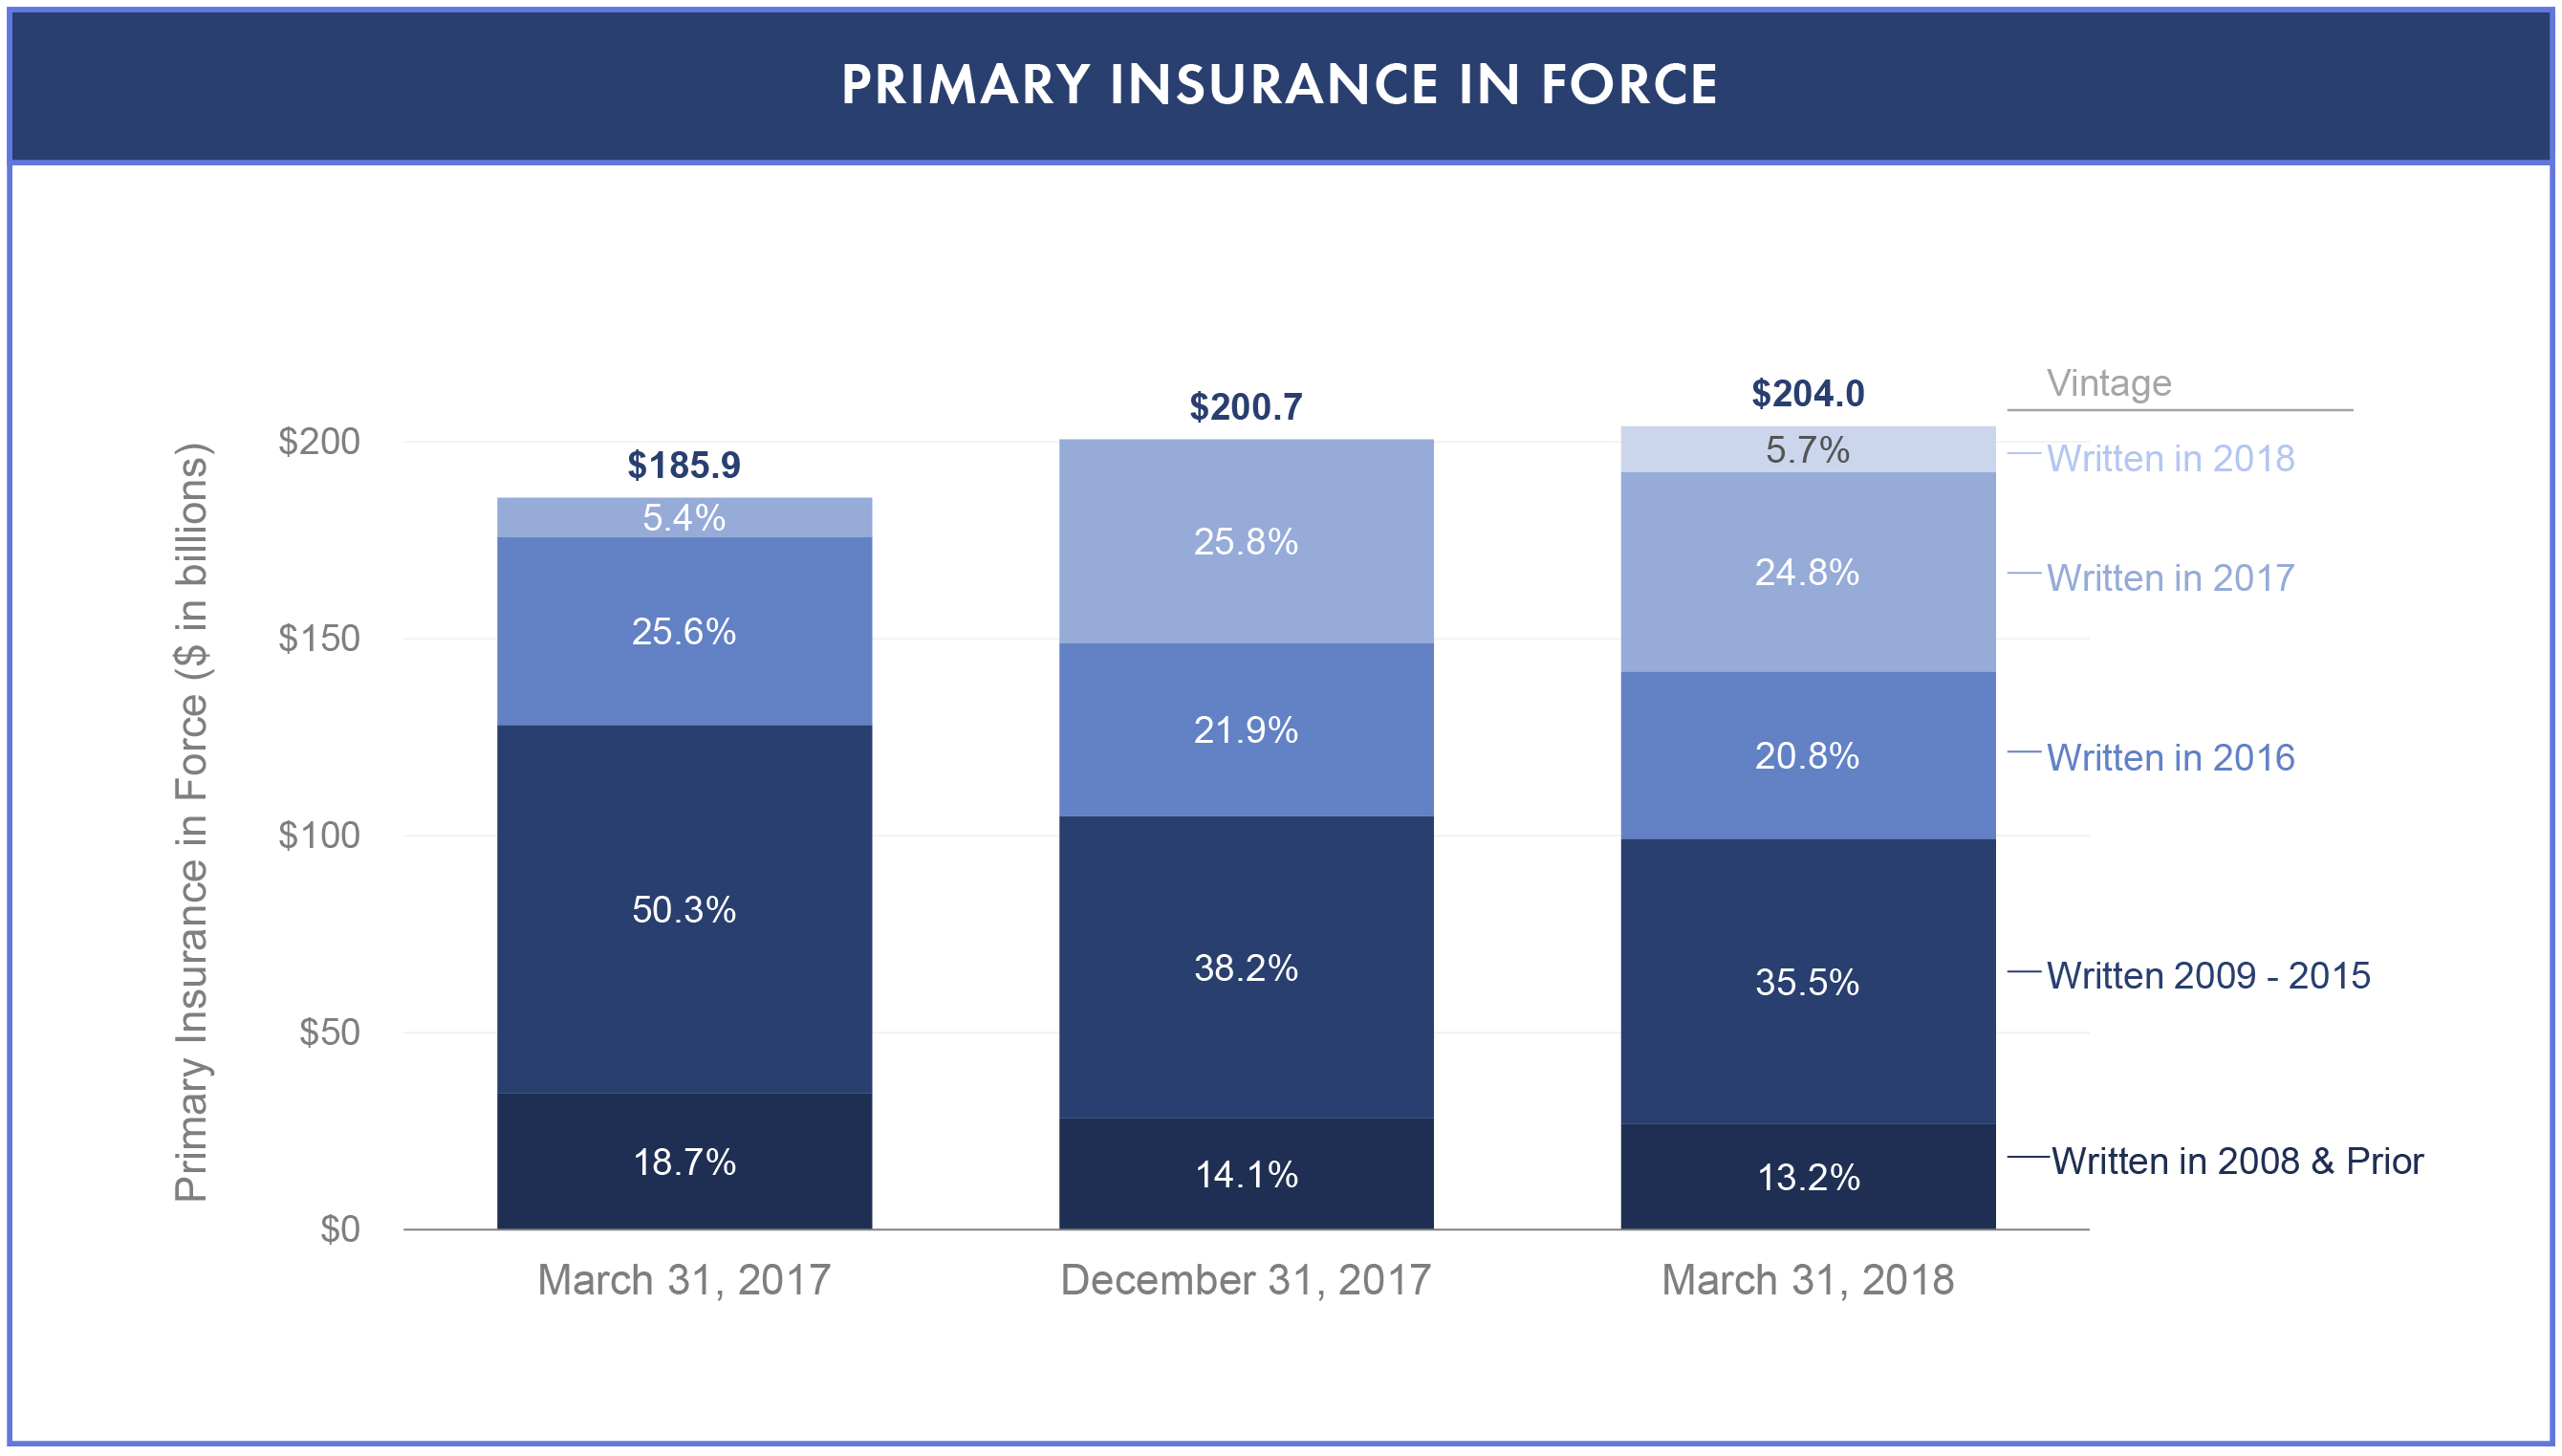
Our IIF is one of the primary drivers of the future premiums that we expect to earn over time. Although not reflected in the current period financial statements, nor in our reported book value, we expect our IIF to generate substantial earnings in future periods, due to the high credit quality of our current mortgage insurance portfolio and its expected persistency over multiple years. Additionally, the economic valueSee “Item 7. Management’s Discussion and Analysis of our existing IIF increased significantly as a resultFinancial Condition and Results of the TCJA, due to the increase in expected future net cash flows associated with the reduction in tax payments. See “KeyOperations—Key Factors Affecting Our Results—Mortgage Insurance—IIF; Persistency Rate; Mix of Business” in our 20172018 Form 10-K for more information.
NIW increaseddecreased by 16.0%6.6% for the three months ended March 31, 2018,2019, compared to the same period in 2017,2018, primarily attributable to an increase indecreased refinance originations.
Although it is difficult to project future volumes, industry sources expect the penetration rate of private mortgage insurance into the overalltotal mortgage origination market andfor the full year 2019 to increase slightly compared to 2018, driven by an expected increase in our share of the private mortgage insurance market,purchase originations, partially offset by decreased refinance originations.
We believe total mortgage origination volume was lower for the three months ended March 31, 2018, as compared to the comparable period in 2017, due to a decreasedecline in refinance mortgage originations resulting fromas a result of higher anticipated interest rates. Mortgage insurance penetration in the slightly higher interest rate environment.purchase origination market has gradually increased over the past few years. Because the penetration rate for mortgage insurance is generally three to five times higher on purchase originations than on refinancing transactions, the mortgage insurance market was larger for the three-month period ended March 31, 2018, compared to the same period in 2017, despite the decline in total mortgage origination volume.
Although it is difficult to project future volumes, industry sources expect the mortgage origination market for the full year 2018 to decline approximately 7% compared to 2017, driven by a decline in refinance originations of approximately 30% as a result of higher anticipated interest rates, partially offset by an expected increase in purchase originations of approximately 6%. Given our expected penetration rates, we currently expect the private mortgage insurance market in 2018for the full year 2019 to be comparable to 2017.2018. Based on industry forecasts and our projections, we expect our NIW in 20182019 to be approximatelyin excess of $50 billion.
We believe total mortgage origination volume was lower for the three months ended March 31, 2019, as compared to the comparable period in 2018, primarily due to a decrease in refinance mortgage originations resulting from the slightly higher interest rate environment, partially offset by a modest increase in purchase originations. Given the higher penetration rate for private mortgage insurance in the purchase origination market, as discussed above, we believe that even though the total mortgage origination volume was lower, the private mortgage insurance market for the three-month period ended March 31, 2019 was comparable to the same period in 2018. Consistent with these trends in the mortgage origination market described above, as a percentage of our total NIW, the level of our purchase origination volume increased and our refinance origination volume decreased, each as a percentage of our total NIW, during the three-month period ended March 31, 2018,2019, compared to the same period in 2017.2018.
Part I. Item 2. Management’s Discussion and Analysis of Financial Condition and Results of Operations (continued)
Beginning in the second half of 2017, the private mortgage insurance industry experienced a shift in the mix of mortgage lending products toward higher LTVs and higher debt-to-income ratios. As a percentage of our total NIW, the volume of our NIW on mortgage loans with LTVs greater than 95% also increased during the three-month period ended March 31, 2018,2019, compared to the same period in 2017. During2018. In contrast, while loans to borrowers with higher debt-to-income ratios, including debt-to-income ratios greater than 45%, remain elevated compared to levels prior to the second half of 2017, they have been trending down. This trend continued during the three-month period ended March 31, 2018,2019, and we also continued to experience an increaseexperienced a decrease in the percentage of our total NIW on mortgage loans to borrowers with higher debt-to incomedebt-to-income ratios, including debt-to-income ratios greater than 45%. However, these trends, compared to the same period in 2018. See “Overview—Operating Environment” for additional information.
As of March 31, 2019, our portfolio of business written after 2008, including HARP refinancings, represented approximately 94.3% of our total primary RIF. Notwithstanding the mix shift toward higher LTVs and debt-to-income ratios, have not materially impacted the overallas discussed above, loan originations after 2008 consist primarily of high credit quality loans with significantly better credit performance than loans originated during 2008 and prior periods. The volume of insurance that we have written on high credit quality loans after 2008 has significantly improved our portfolio. See “Operating Environment—Market Credit Characteristics” for additional information.
Part I. Item 2. Management's DiscussionandAnalysis of Financial Condition and Results of Operations (Cont'd)
The chart below illustrates the composition of our direct primary mortgage insurance RIF at March 31, 2018, based on origination vintages.
______________________
| |
(1) | In 2009, the GSEs began offering HARP loans, which allow a borrower who is not delinquent to refinance a mortgage if the borrower has been unable to take advantage of lower interest rates because the borrower’s home has decreased in value. Refinancings under the HARP programs have had a positive impact on the overall credit quality and composition of our mortgage insurance portfolio because the refinancing generally results in terms under which a borrower has a greater ability to pay and more financial flexibility to cover the loan obligations. We exclude HARP loans from our NIW for the period in which the refinance occurs. During the three months ended March 31, 2018, new HARP loans accounted for $15.4 million of newly refinanced loans that were not included in Radian Guaranty’s NIW for the period, compared to $26.9 million for the same period in 2017. The HARP deadline for refinancing has been extended to December 31, 2018. See “Item 1. Business—Regulation—Federal Regulation—Homeowner Assistance Programs” in our 2017 Form 10-K for more information.
|
Part I. Item 2. Management's DiscussionandAnalysis of Financial Condition and Results of Operations (Cont'd)
portfolio mix.
Our expected future losses on our portfoliosportfolio written after 2008, together with HARP refinancings, are significantly lower than those experienced on our NIW prior to 2009.and including 2008. The following charts illustrate the trends of our cumulative incurred loss ratios by year of origination and development year.
______________________
| |
| (1) | Represents inception-to-date losses incurred as a percentage of net premiums earned. |
| |
| (2) | Incurred losses in 2017 were slightly, but not materially, elevated due to the impact of Hurricanes Harvey and Irma. See “Overview—Operating Environment—Hurricanes” |
| |
| (3) | Radian’s stochastic modeling, used for additional information.pricing, indicates an approximate 20% through-the-cycle loss ratio on newly originated mortgage insurance business. |
Part I. Item 2. Management’s Discussion and Analysis of Financial Condition and Results of Operations (continued)
The following tables provide selected information as of and for the periods indicated related to mortgage insurance NIW, RIF and IIF. Policy years represent the original policy years, and have not been adjusted to reflect subsequent HARP refinancing activity. Throughout this report, unless otherwise noted, RIF is presented on a gross basis and includes the amount ceded under reinsurance. NIW, RIF and IIF for direct Single Premiums include policies written on an individual basis (as each loan is originated) and on an aggregated basis (in which each individual loan in a group of loans is insured in a single transaction, typically after the loans have been originated).
|
| | | | | | | | | | | | | |
| | Three Months Ended March 31, |
| ($ in millions) | 2018 | | 2017 |
| Total primary NIW by FICO score | | | | | | | |
| >=740 | $ | 7,112 |
| | 61.0 | % | | $ | 6,168 |
| | 61.3 | % |
| 680-739 | 3,802 |
| | 32.6 |
| | 3,283 |
| | 32.7 |
|
| 620-679 | 750 |
| | 6.4 |
| | 604 |
| | 6.0 |
|
| Total Primary NIW | $ | 11,664 |
| | 100.0 | % | | $ | 10,055 |
| | 100.0 | % |
| | | | | | | | |
Part I. Item 2. Management's DiscussionandAnalysis of Financial Condition and Results of Operations (Cont'd)
|
| | | | | | | |
| | Three Months Ended
March 31, |
| ($ in millions) | 2018 | | 2017 |
| Percentage of primary NIW | | | |
| Direct Monthly and Other Premiums | 79 | % | | 75 | % |
| Direct Single Premiums | 21 | % | | 25 | % |
| Lender-paid | 16 | % | | 23 | % |
Borrower-paid (1) | 5 | % | | 2 | % |
| | | | |
Net Single Premiums (2) | 7 | % | | 16 | % |
| | | | |
| NIW for Purchases | 89 | % | | 84 | % |
| | | | |
| NIW for Refinances | 11 | % | | 16 | % |
| | | | |
| LTV | | | |
| 95.01% and above | 15.4 | % | | 9.2 | % |
| 90.01% to 95.00% | 44.5 | % | | 47.3 | % |
| 85.01% to 90.00% | 27.5 | % | | 30.3 | % |
| 85.00% and below | 12.6 | % | | 13.2 | % |
| | | | |
| Primary risk written | $ | 2,929 |
| | $ | 2,507 |
|
|
| | | | | | | |
| Primary NIW | | | |
| | Three Months Ended
March 31, |
| ($ in millions) | 2019 | | 2018 |
| Total primary NIW | $ | 10,900 |
| | $ | 11,664 |
|
| Total primary risk written | $ | 2,732 |
| | $ | 2,929 |
|
| Average coverage percentage | 25.1 | % | | 25.1 | % |
| | | | |
| Primary NIW by Loan Purpose: | | | |
| Purchases | 92.2 | % | | 88.8 | % |
| Refinances | 7.8 | % | | 11.2 | % |
| | | | |
| Primary NIW by Premium Type: | | | |
| Direct monthly and other recurring premiums | 83.4 | % | | 79.0 | % |
| |
|
| | |
Borrower-paid (1) | 12.7 |
| | 5.3 |
|
| Lender-paid | 3.9 |
| | 15.7 |
|
| Direct single premiums | 16.6 |
| | 21.0 |
|
| Total | 100.0 | % | | 100.0 | % |
| | | | |
| Total borrower-paid | 95.1 | % | | 83.1 | % |
| | | | |
Primary NIW by FICO Score (2) : | | | |
| >=740 | 57.6 | % | | 56.4 | % |
| 680-739 | 34.7 | % | | 35.9 | % |
| 620-679 | 7.7 | % | | 7.7 | % |
| <=619 | — | % | | — | % |
| | | | |
| Primary NIW by LTV: | | | |
| 95.01% and above | 19.7 | % | | 15.4 | % |
| 90.01% to 95.00% | 40.9 | % | | 44.5 | % |
| 85.01% to 90.00% | 27.3 | % | | 27.5 | % |
| 85.00% and below | 12.1 | % | | 12.6 | % |
| | | | |
______________________
| |
| (1) | Borrower-paid Single Premium Policies provide an increased return on required capital because, over the life of the exposure, thehave lower Minimum Required Assets under the PMIERs are lower than foras compared to lender-paid Single Premium Policies. See “Overview—Operating Environment—Competition and Pricing” for additional information. |
| |
| (2) | RepresentsFor loans with multiple borrowers, the percentage of direct Single Premium Policiesprimary new insurance written after giving effect toby FICO score represents the Single Premium NIW ceded under the Single Premium QSR Transactions (for NIW after the effective dateslowest of the respective agreements). See Note 7borrowers’ FICO scores. All periods prior to March 31, 2019 had previously been presented based on the FICO score of Notesthe primary borrower and have been restated to Unaudited Condensed Consolidated Financial Statements for additional information about these transactions.reflect the lowest of the borrowers’ FICO scores. |
Part I. Item 2. Management’s Discussion and Analysis of Financial Condition and Results of Operations (continued)
|
| | | | | | | | | | | |
| ($ in millions) | March 31,
2018 | | December 31,
2017 | | March 31,
2017 |
| Primary IIF | | | | | |
| Direct Monthly and Other Premiums | 69 | % | | 69 | % | | 68 | % |
| Direct Single Premiums | 31 | % | | 31 | % | | 32 | % |
| | | | | | |
Net Single Premiums (1) | 19 | % | | 20 | % | | 25 | % |
| | | | | | |
| Total Primary IIF | $ | 204,025 |
| | $ | 200,724 |
| | $ | 185,859 |
|
| | | | | | |
Persistency Rate (12 months ended) | 81.0 | % | | 81.1 | % | | 77.1 | % |
Persistency Rate (quarterly, annualized) (2) | 84.3 | % | | 79.4 | % | (3) | 84.4 | % |
|
| | | | | | | | | | | |
| Primary IIF and RIF | | | | | |
| ($ in millions) | March 31, 2019 | | December 31, 2018 | | March 31, 2018 |
| Total primary IIF | $ | 223,734 |
| | $ | 221,443 |
| | $ | 204,025 |
|
| Total primary RIF | $ | 57,361 |
| | $ | 56,728 |
| | $ | 52,153 |
|
| Average coverage percentage | 25.6 | % | | 25.6 | % | | 25.6 | % |
| | | | | | |
| Total primary RIF on defaulted loans | $ | 1,002 |
| | $ | 1,032 |
| | $ | 1,223 |
|
| Percentage of RIF in default | 1.7 | % | | 1.8 | % | | 2.3 | % |
| | | | | | |
| Persistency Rate (12 months ended) | 83.4 | % | | 83.1 | % | | 81.0 | % |
Persistency Rate (quarterly, annualized) (1) | 85.4 | % | | 85.5 | % | | 84.3 | % |
| | | | | | |
| Primary RIF by Premium Type: | | | | | |
| Direct monthly and other recurring premiums | 70.6 | % | | 70.3 | % | | 69.3 | % |
| |
| |
| |
|
Borrower-paid (2) | 7.6 |
| | 7.3 |
| | 5.8 |
|
| Lender-paid | 21.8 |
| | 22.4 |
| | 24.9 |
|
| Direct single premiums | 29.4 |
| | 29.7 |
| | 30.7 |
|
| Total | 100.0 | % | | 100.0 | % | | 100.0 | % |
| | | | | | |
| Total borrower-paid | 75.2 | % | | 74.5 | % | | 71.5 | % |
| | | | | | |
Primary RIF by FICO Score (3) : | | | | | |
| >=740 | 55.2 | % | | 55.1 | % | | 55.0 | % |
| 680-739 | 34.8 | % | | 34.8 | % | | 34.5 | % |
| 620-679 | 9.2 | % | | 9.3 | % | | 9.5 | % |
| <=619 | 0.8 | % | | 0.8 | % | | 1.0 | % |
| | | | | | |
| Primary RIF by LTV: | | | | | |
| 95.01% and above | 12.2 | % | | 11.6 | % | | 9.7 | % |
| 90.01% to 95.00% | 53.0 | % | | 53.1 | % | | 53.2 | % |
| 85.01% to 90.00% | 28.6 | % | | 29.0 | % | | 30.2 | % |
| 85.00% and below | 6.2 | % | | 6.3 | % | | 6.9 | % |
| | | | | | |
| Primary RIF by Policy Year: | | | | | |
| 2008 and prior | 9.6 | % | | 10.1 | % | | 13.0 | % |
| 2009 - 2013 | 10.4 | % | | 11.4 | % | | 15.5 | % |
| 2014 | 5.8 | % | | 6.1 | % | | 7.9 | % |
| 2015 | 9.7 | % | | 10.2 | % | | 13.0 | % |
| 2016 | 16.0 | % | | 16.8 | % | | 20.5 | % |
| 2017 | 20.3 | % | | 21.1 | % | | 24.5 | % |
| 2018 | 23.5 | % | | 24.3 | % | | 5.6 | % |
| 2019 | 4.7 | % | | — | % | | — | % |
| | | | | | |
______________________
| |
| (1) | Represents the percentage of Single Premium IIF, after giving effect to all reinsurance ceded. See Note 7 of Notes to Unaudited Condensed Consolidated Financial Statements for additional information about reinsurance transactions. |
| |
(2) | The Persistency Rate on a quarterly, annualized basis is calculated based on loan-level detail for the quarter ending as of the date shown. It may be impacted by seasonality or other factors, and may not be indicative of full-year trends. |
| |
| (2) | Borrower-paid Single Premium Policies have lower Minimum Required Assets under the PMIERs as compared to lender-paid Single Premium Policies. |
| |
| (3) | The Persistency RateFor loans with multiple borrowers, the percentage of primary risk in force by FICO score represents the fourth quarterlowest of 2017 was reduced by an increase in cancellationsthe borrowers’ FICO scores. All periods prior to March 31, 2019 had previously been presented based on the FICO score of Single Premium Policies duethe primary borrower and have been restated to increased cancellations identified by our ongoing servicer monitoring process for Single Premium Policies.reflect the lowest of the borrowers’ FICO scores. |
Part I. Item 2. Management'sManagement’s DiscussionandAnalysis of Financial Condition and Results of Operations (Cont'd)(continued)
|
| | | | | | | | | | | | | | | | | | | | |
| ($ in millions) | March 31,
2018 | | December 31,
2017 | | March 31,
2017 |
| Primary RIF by Premium Type | | | | | | | | | | | |
| Direct Monthly and Other Premiums | $ | 36,116 |
| | 69.3 | % | | $ | 35,452 |
| | 69.1 | % | | $ | 32,486 |
| | 68.5 | % |
| Direct Single Premiums | 16,037 |
| | 30.7 |
| | 15,836 |
| | 30.9 |
| | 14,908 |
| | 31.5 |
|
| Total primary RIF | $ | 52,153 |
| | 100.0 | % | | $ | 51,288 |
| | 100.0 | % | | $ | 47,394 |
| | 100.0 | % |
| | | | | | | | | | | | |
Net Single Premiums (1) | $ | 8,306 |
| | 18.9 | % | | $ | 8,320 |
| | 19.3 | % | | $ | 10,344 |
| | 24.6 | % |
| | | | | | | | | | | | |
| Primary RIF by Internal Risk Grade | | | | | | | | | | | |
| Prime | $ | 50,623 |
| | 97.1 | % | | $ | 49,674 |
| | 96.9 | % | | $ | 45,442 |
| | 95.9 | % |
| Alt-A and A minus and below | 1,530 |
| | 2.9 |
| | 1,614 |
| | 3.1 |
| | 1,952 |
| | 4.1 |
|
| Total primary RIF | $ | 52,153 |
| �� | 100.0 | % | | $ | 51,288 |
| | 100.0 | % | | $ | 47,394 |
| | 100.0 | % |
| | | | | | | | | | | | |
______________________ | |
(1) | Represents the dollar amount and percentage, respectively, of Single Premium RIF, after giving effect to all reinsurance ceded. |
|
| | | | | | | | | | | | | | | | | | | | |
| ($ in millions) | March 31,
2018 | | December 31,
2017 | | March 31,
2017 |
| Total primary RIF by FICO score | | | | | | | | | | | |
| >=740 | $ | 30,858 |
| | 59.2 | % | | $ | 30,225 |
| | 58.9 | % | | $ | 27,439 |
| | 57.9 | % |
| 680-739 | 16,386 |
| | 31.4 |
| | 16,097 |
| | 31.4 |
| | 14,728 |
| | 31.1 |
|
| 620-679 | 4,395 |
| | 8.4 |
| | 4,425 |
| | 8.6 |
| | 4,567 |
| | 9.6 |
|
| <=619 | 514 |
| | 1.0 |
| | 541 |
| | 1.1 |
| | 660 |
| | 1.4 |
|
| Total primary RIF | $ | 52,153 |
| | 100.0 | % | | $ | 51,288 |
| | 100.0 | % | | $ | 47,394 |
| | 100.0 | % |
| | | | | | | | | | | | |
| Primary RIF on defaulted loans | $ | 1,223 |
| | | | $ | 1,389 |
| | | | $ | 1,224 |
| | |
| | | | | | | | | | | | |
Part I. Item 2. Management's DiscussionandAnalysis of Financial Condition and Results of Operations (Cont'd)
|
| | | | | | | | | | | | | | | | | | | | |
| ($ in millions) | March 31,
2018 | | December 31,
2017 | | March 31,
2017 |
| Total primary RIF by LTV | | | | | | | | | | | |
| 95.01% and above | $ | 5,039 |
| | 9.7 | % | | $ | 4,704 |
| | 9.2 | % | | $ | 3,578 |
| | 7.6 | % |
| 90.01% to 95.00% | 27,774 |
| | 53.2 |
| | 27,276 |
| | 53.2 |
| | 24,938 |
| | 52.6 |
|
| 85.01% to 90.00% | 15,763 |
| | 30.2 |
| | 15,719 |
| | 30.6 |
| | 15,257 |
| | 32.2 |
|
| 85.00% and below | 3,577 |
| | 6.9 |
| | 3,589 |
| | 7.0 |
| | 3,621 |
| | 7.6 |
|
| Total primary RIF | $ | 52,153 |
| | 100.0 | % | | $ | 51,288 |
| | 100.0 | % | | $ | 47,394 |
| | 100.0 | % |
| | | | | | | | | | | | |
| Total primary RIF by policy year | | | | | | | | | | | |
| 2008 and prior | $ | 6,792 |
| | 13.0 | % | | $ | 7,159 |
| | 14.0 | % | | $ | 8,762 |
| | 18.5 | % |
| 2009 | 277 |
| | 0.5 |
| | 298 |
| | 0.6 |
| | 422 |
| | 0.9 |
|
| 2010 | 231 |
| | 0.5 |
| | 264 |
| | 0.5 |
| | 384 |
| | 0.8 |
|
| 2011 | 635 |
| | 1.2 |
| | 682 |
| | 1.3 |
| | 858 |
| | 1.8 |
|
| 2012 | 2,656 |
| | 5.1 |
| | 2,830 |
| | 5.5 |
| | 3,514 |
| | 7.4 |
|
| 2013 | 4,298 |
| | 8.2 |
| | 4,557 |
| | 8.9 |
| | 5,586 |
| | 11.8 |
|
| 2014 | 4,117 |
| | 7.9 |
| | 4,356 |
| | 8.5 |
| | 5,306 |
| | 11.2 |
|
| 2015 | 6,767 |
| | 13.0 |
| | 7,096 |
| | 13.8 |
| | 8,211 |
| | 17.3 |
|
| 2016 | 10,697 |
| | 20.5 |
| | 10,992 |
| | 21.4 |
| | 11,857 |
| | 25.0 |
|
| 2017 | 12,773 |
| | 24.5 |
| | 13,054 |
| | 25.5 |
| | 2,494 |
| | 5.3 |
|
| 2018 | 2,910 |
| | 5.6 |
| | — |
| | — |
| | — |
| | — |
|
Total primary RIF (1) | $ | 52,153 |
| | 100.0 | % | | $ | 51,288 |
|
| 100.0 | % |
| $ | 47,394 |
|
| 100.0 | % |
| | | | | | | | | | | | |
______________________ | |
(1) | At March 31, 2018, December 31, 2017 and March 31, 2017, consists of 97.5%, 97.3% and 97.1%, respectively, of RIF related to fixed-rate mortgages. |
Net Premiums Written and Earned. Net premiums written and earned for the three months ended March 31, 20182019 increased compared to the same period in 20172018, primarily due to an increase in our IIF which was primarily related to an increase in our Monthly Premium Policies. This increase was partially offset by the increased cession percentage on the Single Premium QSR Transactions.
Part I. Item 2. Management's DiscussionandAnalysis of Financial Condition and Results of Operations (Cont'd)
The table below provides additional information about the components of mortgage insurance net premiums earned for the periods indicated.
| | | | Three Months Ended
March 31, | Three Months Ended
March 31, |
| (in thousands) | 2018 | | 2017 | 2019 | | 2018 |
Net premiums earned—insurance: | | | | | | |
| Direct | | | | | | |
| Premiums earned, excluding revenue from cancellations | $ | 246,408 |
| | $ | 225,647 |
| $ | 268,496 |
| | $ | 245,096 |
|
| Single Premium Policy cancellations | 12,335 |
| | 10,415 |
| 9,957 |
| | 12,335 |
|
| Direct premiums earned | 258,743 |
| | 236,062 |
| |
| Direct | | 278,453 |
| | 257,431 |
|
| | | | | |
Assumed (1) | | 2,450 |
| | 1,318 |
|
| | | | | | | |
| Ceded | | | | | | |
| Premiums earned, excluding revenue from cancellations | (20,303 | ) | | (16,366 | ) | (24,486 | ) | | (20,303 | ) |
Single Premium Policy cancellations (1) | (3,301 | ) | | (2,103 | ) | |
Profit commission—other (2) | 7,405 |
| | 4,200 |
| |
Single Premium Policy cancellations (2) | | (2,953 | ) | | (3,301 | ) |
Profit commission—other (3) | | 8,314 |
| | 7,405 |
|
| Ceded premiums, net of profit commission | (16,199 | ) | | (14,269 | ) | (19,125 | ) | | (16,199 | ) |
| | | | | |
| Assumed premiums earned | 6 |
| | 7 |
| |
| | | | | | | |
Total net premiums earned—insurance | $ | 242,550 |
| | $ | 221,800 |
| $ | 261,778 |
| | $ | 242,550 |
|
| | | | | | | |
______________________
| |
| (1) | Includes premiums earned from our participation in certain Front-end and Back-end credit risk transfer programs. |
| |
| (2) | Includes the impact of related profit commissions. |
| |
(2)(3) | The amounts represent the profit commission on the Single Premium QSR Transactions,Program, excluding the impact of Single Premium Policy cancellations. |
The impact of mortgage prepayment speeds on the mix of business we write affects the revenue ultimately produced by our mortgage insurance business. Because prepayment speeds are difficult to project, our strategy has been to writeWe believe that writing a mix of Single Premium Policies and Monthly Premium Policies which we believe balanceshas the potential to moderate the overall impact on our results if actual prepayment speedsprepayments are significantly different from expectations. The Single Premium QSR Transactions are also partHowever, this moderating effect may be impacted by the amount of reinsurance we obtain on portions of our strategy to balance our mix of Single Premium Policies and Monthly Premium Policies. As of March 31, 2018, the impact of all of our third-party quota share reinsurance transactions reduced our Single Premium RIF from 30.7% to 18.9%. See “Key Factors Affecting Our Results—Mortgage Insurance—IIF; Persistency Rate; Mix of Business.” in our 2017 Form 10-K for more information.
We experienced a decrease in our total mix of Single Premium Policies to 21% of our NIW for the first three months of 2018, as compared to 25% for the first three months of 2017.portfolio. We expect our production level for Single Premium Policies to fluctuate over time based on various factors, which include risk-return and risk-mix considerations, as well as market conditions. See the table above, which illustrates the premium impact of direct and ceded Single Premium Policy cancellations for the periods shown, and the table below, which provides the premium impact of each of our reinsurance programs as a percentage of total premiums. See “Item 7. Management’s Discussion and Analysis of Financial Condition and Results of Operations—Key Factors Affecting Our Results—Mortgage Insurance—IIF; Persistency Rate; Mix of Business” in our 2018 Form 10-K for more information.
Net Premiums Written and Earned—Ceded. Historically, we have entered intoWe use third-party reinsurance transactions, including the Single Premium QSR Transactions, as part ofin our mortgage insurance business to manage capital and risk management activities. The Single Premium QSR Transactionsin an effort to optimize the amounts and types of capital and risk distribution deployed against insured risk. When we enter into a reinsurance agreement, the reinsurer receives a premium and, in exchange, agrees to insure an agreed-upon portion of incurred losses. While these arrangements have the impact of reducing our earned premiums, they are expected to increase Radian Guaranty’s return on required capital for its Single Premium Policies.the related policies. The impact of the Single Premium QSR Transactionsthese programs on our financial results will vary depending on the level of ceded RIF, as well as the levels of prepayments and incurred losses on the reinsured portfolio,portfolios, among other factors. See “Item 7. Management’s Discussion and Analysis of Financial Condition and Results of Operations—Key Factors Affecting Our Results—Mortgage Insurance—Third-Party Reinsurance” and Note 8 of Notes to Consolidated Financial Statements in our 2018 Form 10-K for more information about our reinsurance transactions.
Part I. Item 2. Management'sManagement’s DiscussionandAnalysis of Financial Condition and Results of Operations (Cont'd)(continued)
The following table provides information related to the premium impact of our reinsurance transactions.programs. See Note 7 of Notes to Unaudited Condensed Consolidated Financial Statements for more information about our reinsurance transactions,programs, including the ceded amounts related to the QSR Transactions.those programs.
|
| | | | | |
| | Three Months Ended
March 31, |
| | 2018 | | 2017 |
| QSR Transactions | | | |
| % of total direct premiums written | 1.5 | % | | 2.3 | % |
| % of total direct premiums earned | 2.2 | % | | 3.3 | % |
| | | | |
| Single Premium QSR Transactions | | | |
| % of total direct premiums written | 6.1 | % | | 3.7 | % |
| % of total direct premiums earned | 4.0 | % | | 2.5 | % |
| | | | |
| First-Lien Captives | | | |
| % of total direct premiums written | — | % | | 0.2 | % |
| % of total direct premiums earned | 0.1 | % | | 0.2 | % |
|
| | | | | |
| | Three Months Ended
March 31, |
| | 2019 | | 2018 |
| % of total direct and assumed premiums written | | | |
| QSR Program | 1.0 | % | | 1.5 | % |
| Single Premium QSR Program | 1.7 | % | | 6.1 | % |
| Excess-of-Loss Program | 1.1 | % | | — | % |
| | | | |
| % of total direct and assumed premiums earned | | | |
| QSR Program | 1.3 | % | | 2.2 | % |
| Single Premium QSR Program | 4.2 | % | | 4.0 | % |
| Excess-of-Loss Program | 1.2 | % | | — | % |
| | | | |
Net Investment Income. Increasing short-term yields andfrom higher interest rates, combined with higher average investment balances, resulted in increases in net investment income for the three months ended March 31, 2018,2019, compared to the same period in 2017.2018. Our higher investment balances were primarily a result of investing our positive cash flow from operations. All periods include full allocation to the Mortgage Insurance segment of net investment income from investments held at Radian Group.
Provision for Losses. The following table details the financial impact of the significant components of our provision for losses for the periods indicated:
| | | | Three Months Ended
March 31, | Three Months Ended
March 31, |
| (In millions) | 2018 | | 2017 | 2019 | | 2018 |
Current period defaults (1) | $ | 36.5 |
| | $ | 51.4 |
| $ | 38.9 |
| | $ | 36.5 |
|
Prior period defaults (2) | 0.4 |
| | (4.3 | ) | (18.2 | ) | | 0.4 |
|
| Second-lien mortgage loan premium deficiency reserve and other | 0.5 |
| | 0.1 |
| 0.1 |
| | 0.5 |
|
| Provision for losses | $ | 37.4 |
| | $ | 47.2 |
| $ | 20.8 |
| | $ | 37.4 |
|
| | | | | | | |
Loss ratio (3) | 15.4 | % | | 21.3 | % | 8.0 | % | | 15.4 | % |
| | | | | | | |
______________________
| |
| (1) | Related to defaulted loans with a most recent default notice dated in the period indicated. For example, if a loan had defaulted in a prior period, but then subsequently cured and later re-defaulted in the current period, the default would be considered a current period default. |
| |
| (2) | Related to defaulted loans with a default notice dated in a period earlier than the period indicated, which have been continuously in default since that time. |
| |
| (3) | Provision for losses as a percentage of net premiums earned. |
Our mortgage insurance provision for losses for the three months ended March 31, 20182019 decreased by $9.8$16.6 million, as compared to the same period in 2017.2018. Reserves established for new default notices were the primary driver of our total incurred losses for the three months ended March 31, 20182019 and 2017.2018. Current period new primary defaults decreasedincreased by 1.1%12.4% for the three months ended March 31, 2018,2019, compared to the same period in 2017.2018. This increase primarily relates to new defaults on insurance written after 2008 and is consistent with typical default seasoning patterns for our recent NIW vintages. Our gross Default to Claim Rate assumption for new primary defaults excluding the new primary defaults in FEMA Designated Areas associated with Hurricanes Harvey and Irma received subsequent to those two natural disasters, was approximately 9% for the three months ended8.0% at March 31, 2018,2019, compared to 11.5% as of9.5% at March 31, 2017.2018. This reduction in the estimated gross Default to Claim Rate assumptions,assumption, which was based on observed trends, contributed topartially mitigated the reductionincrease in the portion of our provision for losses related to the increased number of new defaults in the three months ended March 31, 2018,2019, compared to the same period in 2017.2018.
Part I. Item 2. Management'sManagement’s DiscussionandAnalysis of Financial Condition and Results of Operations (Cont'd)(continued)
For all areas otherOur provision for losses for the three months ended March 31, 2019 was reduced by positive reserve development on prior period defaults, primarily due to reductions in certain Default to Claim Rate assumptions based on observed trends of higher Cures than FEMA Designated Areas associated with Hurricanes Harvey and Irma, the number of total new primary mortgage insurance defaults in our insured portfolio decreased by 2.5%, as compared to the samewere previously estimated on those prior period in 2017. defaults.
As expected, Radian Guaranty experienced an increase in reported delinquencies in FEMA designated areasDesignated Areas associated with Hurricanes Harvey and Irma during the third and fourth quarters of 2017, followed by cure rates for these delinquencies that are higher than the rates for the rest of our portfolio. We believeThese incremental hurricane-related defaults did not result in a material increase in our incurred losses or paid claims.
Although the number of incremental defaults associated with areas that these hurricane-related delinquencies reached their peak in 2017 and, based onhave been impacted by natural disasters may become somewhat elevated, consistent with our past experience we do not expect that mostthese incremental defaults to result in a material increase in our incurred losses or paid claims, given the limitations on our coverage related to property damage. However, the future reserve impact of these incremental defaults will cure byfrom natural disasters may differ from our previous expectations due to overall economic conditions, the endpace of 2018.economic recovery in the affected areas or other factors. See Note 10 of Notes to Unaudited Condensed Consolidated Financial Statements.
Our primary default rate at March 31, 20182019 was 2.5%2.0% compared to 2.9%2.1% at December 31, 2017.2018. Our primary defaulted inventory comprised 24,59720,122 loans at March 31, 2018,2019, compared to 27,92221,093 loans at December 31, 2017,2018, representing a decrease of 11.9%4.6%. The reduction in our primary defaulted inventory is the result of the total number of defaulted loans: (i) that have cured;cured or (ii) for which claim payments have been made; or (iii) that have resulted in net Rescissions and Claim Denials,made, collectively, exceeding the total number of new defaults on insured loans. TheConsistent with typical default seasoning patterns, the shift in our portfolio composition toward moreour recent vintages is expected to result in increasingslightly increased levels of new defaults from the post-2008in our total portfolio consistent with typical default seasoning patterns. However,for 2019 as compared to 2018, because we do not expect that the reductions in new defaults from our pre-2009 portfolio of insurance written prior to and including 2008 will continue to outpace those increasesthe anticipated increase in 2018. Therefore, we currently expect total new defaults for 2018 to continue to decrease throughout the year as compared to the comparable periods for the prior year.from more recent vintages.
The following table shows the number of primary loans that we have insured, the number of loans in default and the percentage of loans in default as of the dates indicated:
| | | | March 31,
2018 | | December 31,
2017 | | March 31,
2017 | March 31,
2019 | | December 31,
2018 | | March 31,
2018 |
| Default Statistics—Primary Insurance: | | | | | | | | | | |
| Total Primary Insurance | | | | | | | | | | |
| Prime | | | | | | | | | | |
| Number of insured loans | 925,648 |
| | 913,408 |
| | 858,248 |
| 994,865 |
| | 986,704 |
| | 925,648 |
|
| Number of loans in default | 17,887 |
| | 20,269 |
| | 16,981 |
| 14,831 |
| | 15,402 |
| | 17,887 |
|
| Percentage of loans in default | 1.93 | % | | 2.22 | % | | 1.98 | % | 1.49 | % | | 1.56 | % | | 1.93 | % |
| Alt-A and A minus and below | | | | | | | | | | |
| Number of insured loans | 40,661 |
| | 42,318 |
| | 51,468 |
| 34,763 |
| | 35,906 |
| | 40,661 |
|
| Number of loans in default | 6,710 |
| | 7,653 |
| | 8,812 |
| 5,291 |
| | 5,691 |
| | 6,710 |
|
| Percentage of loans in default | 16.50 | % | | 18.08 | % | | 17.12 | % | 15.22 | % | | 15.85 | % | | 16.50 | % |
| Total Primary Insurance | | | | | | | | | | |
| Number of insured loans | 966,309 |
| | 955,726 |
| | 909,716 |
| 1,029,628 |
| | 1,022,610 |
| | 966,309 |
|
Number of loans in default (1) | 24,597 |
| | 27,922 |
| | 25,793 |
| 20,122 |
| | 21,093 |
| | 24,597 |
|
| Percentage of loans in default | 2.55 | % | | 2.92 | % | | 2.84 | % | 1.95 | % | | 2.06 | % | | 2.55 | % |
| Default Statistics—Pool Insurance: | | | | | | | | | | |
| Number of loans in default | 1,907 |
| | 2,117 |
| | 3,746 |
| 1,607 |
| | 1,713 |
| | 1,907 |
|
______________________
| |
| (1) | Included in this amount at March 31, 20182019 and December 31, 20172018 are the defaults in the FEMA Designated Areas associated with Hurricanes Harvey and Irma, which occurred during the third quarter of 2017. At March 31, 2018 and2019, December 31, 20172018 and March 31, 2017,2018, defaults in these areas were 5,780; 7,051;2,420; 2,627; and 2,964,5,780, respectively. |
Part I. Item 2. Management'sManagement’s DiscussionandAnalysis of Financial Condition and Results of Operations (Cont'd)(continued)
The following table shows a rollforward of our primary loans in default, including new defaults from our Legacy Portfolioinsurance written in years: (i) prior to and Post-legacy Portfolio:including 2008 and (ii) after 2008:
|
| | | | | |
| | Three Months Ended
March 31, |
| | 2018 | | 2017 |
| Beginning default inventory | 27,922 |
| | 29,105 |
|
Plus: New defaults (1) | | | |
| Legacy Portfolio new defaults | 5,013 |
| | 6,179 |
|
| Post-legacy new defaults | 4,076 |
| | 3,009 |
|
| Total new defaults | 9,089 |
| | 9,188 |
|
| Less: Cures | 11,367 |
| | 10,989 |
|
Less: Claims paid (2) (3) | 1,052 |
| | 1,504 |
|
| Less: Rescissions and Claim Denials, net of (Reinstatements) | (5 | ) | | 7 |
|
| Ending default inventory | 24,597 |
| | 25,793 |
|
| | | | |
|
| | | | | |
| | Three Months Ended
March 31, |
| | 2019 | | 2018 |
| Beginning default inventory | 21,093 |
| | 27,922 |
|
Plus: New defaults on insurance written in years: (1) | | | |
| Prior to and including 2008 | 4,548 |
| | 5,013 |
|
| After 2008 | 5,668 |
| | 4,076 |
|
| Total new defaults | 10,216 |
| | 9,089 |
|
Less: Cures (1) | 10,479 |
| | 11,367 |
|
Less: Claims paid (2) | 662 |
| | 1,052 |
|
Less: Rescissions and Claim Denials, net of (Reinstatements) (3) | 46 |
| | (5 | ) |
| Ending default inventory | 20,122 |
| | 24,597 |
|
| | | | |
______________________
| |
| (1) | Included in this amount areAmounts include the new defaults and Cures in the FEMA Designated Areas associated with Hurricanes Harvey and Irma, which occurred during the third quarter of 2017. Forthe three months ended March 31, 20182019 and 2017,2018, new defaults and Cures in these areas were as follows:
|
| | | | Three Months Ended
March 31, | Three Months Ended
March 31, |
| | 2018 | | 2017 | 2019 | | 2018 |
| New defaults | 989 |
| | 879 |
| 1,106 |
| | 989 |
|
| Cures | 2,168 |
| | 1,073 |
| 1,239 |
| | 2,168 |
|
| |
| (2) | Includes those charged to a deductible or captive reinsurance transactions, as well as commutations. |
| |
| (3) | Net of any previous Rescissions and Claim Denials that were reinstated during the period (excluding activity related to the BofA Settlement Agreement).period. Such reinstated Rescissions and Claim Denials may ultimately result in a paid claim. |
Our gross Default to Claim Rate estimates on defaulted loans are mainly developed based on the Stage of Default and Time in Default of the underlying defaulted loans, as measured by the progress toward a foreclosure sale and the number of months in default. Our gross Default to Claim Rate assumption for new primary defaults, excluding the new primary defaults in FEMA Designated Areas associated with Hurricanes Harvey and Irma received subsequent to those two natural disasters, was reduced from 10.0%8% at December 31, 2017, to approximately 9% for the three months ended2018 and March 31, 2018.2019. As of March 31, 2018,2019, our gross Default to Claim Rate assumptions on our primary portfolio ranged from approximately 9%8% for new defaults, up to 68% for defaults not in foreclosure stage, and 75%72% for Foreclosure Stage Defaults.
Part I. Item 2. Management'sManagement’s DiscussionandAnalysis of Financial Condition and Results of Operations (Cont'd)(continued)
The following tables show additional information about our primary loans in default as of the dates indicated:
| | | | March 31, 2018 | March 31, 2019 |
| | Total | | Foreclosure Stage Defaulted Loans | | Cure % During the 1st Quarter | | Reserve for Losses | | % of Reserve | Total | | Foreclosure Stage Defaulted Loans | | Cure % During the 1st Quarter | | Reserve for Losses | | % of Reserve |
| ($ in thousands) | # | | % | | # | | % | | $ | | % | # | | % | | # | | % | | $ | | % |
| Missed payments: | | | | | | | | | | | | | | | | | | | | | | |
| Three payments or less | 9,268 |
| | 37.7 | % | | 144 |
| | 37.6 | % | | $ | 80,213 |
| | 18.1 | % | 9,248 |
| | 46.0 | % | | 122 |
| | 39.0 | % | | $ | 82,416 |
| | 23.4 | % |
| Four to eleven payments | 8,523 |
| | 34.7 |
| | 479 |
| | 21.4 |
| | 103,283 |
| | 23.4 |
| 6,051 |
| | 30.1 |
| | 444 |
| | 23.0 |
| | 90,616 |
| | 25.7 |
|
| Twelve payments or more | 6,182 |
| | 25.1 |
| | 1,889 |
| | 6.0 |
| | 227,613 |
| | 51.5 |
| 4,215 |
| | 20.9 |
| | 1,254 |
| | 7.4 |
| | 147,525 |
| | 41.9 |
|
| Pending claims | 624 |
| | 2.5 |
| | N/A |
| | 4.2 |
| | 31,051 |
| | 7.0 |
| 608 |
| | 3.0 |
| | N/A |
| | 4.0 |
| | 31,887 |
| | 9.0 |
|
| Total | 24,597 |
| | 100.0 | % | | 2,512 |
| | | | 442,160 |
| | 100.0 | % | 20,122 |
| | 100.0 | % | | 1,820 |
| | | | 352,444 |
| | 100.0 | % |
| IBNR and other | | | | | | | | | 17,164 |
| | | | | | | | | | | 13,008 |
| | |
| LAE | | | | | | | | | 13,440 |
| | | | | | | | | | | 8,994 |
| | |
| Total primary reserve | | | | | | | | | $ | 472,764 |
| | | | | | | | | | | $ | 374,446 |
| | |
| | | | | | | | | | | | | | | | | | | | | | | |
| | | March 31, 2018 | |
| March 31, 2019 | | March 31, 2019 |
Key Reserve Assumptions | | Gross Default to Claim Rate % | | Net Default to Claim Rate % | | Claim Severity % | | Net Default to Claim Rate % | | Claim Severity % |
| 35% | | 33% | | 97% | | 33% | | 98% |
| | | | December 31, 2017 | December 31, 2018 |
| | Total | | Foreclosure Stage Defaulted Loans | | Cure % During the 4th Quarter | | Reserve for Losses | | % of Reserve | Total | | Foreclosure Stage Defaulted Loans | | Cure % During the 4th Quarter | | Reserve for Losses | | % of Reserve |
| ($ in thousands) | # | | % | | # | | % | | $ | | % | # | | % | | # | | % | | $ | | % |
| Missed payments: | | | | | | | | | | | | | | | | | | | | | | |
| Three payments or less | 13,004 |
| | 46.6 | % | | 172 |
| | 31.7 | % | | $ | 89,412 |
| | 19.3 | % | 10,038 |
| | 47.6 | % | | 148 |
| | 33.2 | % | | $ | 83,540 |
| | 23.1 | % |
| Four to eleven payments | 7,528 |
| | 27.0 |
| | 426 |
| | 20.9 |
| | 99,759 |
| | 21.5 |
| 5,905 |
| | 28.0 |
| | 422 |
| | 24.7 |
| | 87,210 |
| | 24.1 |
|
| Twelve payments or more | 6,651 |
| | 23.8 |
| | 1,933 |
| | 6.3 |
| | 234,895 |
| | 50.6 |
| 4,468 |
| | 21.2 |
| | 1,365 |
| | 6.5 |
| | 156,808 |
| | 43.4 |
|
| Pending claims | 739 |
| | 2.6 |
| | N/A |
| | 3.1 |
| | 40,144 |
| | 8.6 |
| 682 |
| | 3.2 |
| | N/A |
| | 4.3 |
| | 34,130 |
| | 9.4 |
|
| Total | 27,922 |
| | 100.0 | % | | 2,531 |
| | | | 464,210 |
| | 100.0 | % | 21,093 |
| | 100.0 | % | | 1,935 |
| | | | 361,688 |
| | 100.0 | % |
| IBNR and other | | | | | | | | | 16,021 |
| | | | | | | | | | | 13,864 |
| | |
| LAE | | | | | | | | | 13,349 |
| | | | | | | | | | | 10,271 |
| | |
| Total primary reserve | | | | | | | | | $ | 493,580 |
| | | | | | | | | | | $ | 385,823 |
| | |
| | | | | | | | | | | | | | | | | | | | | | | |
| | | December 31, 2017 | |
| December 31, 2018 | | December 31, 2018 |
Key Reserve Assumptions | | Gross Default to Claim Rate % | | Net Default to Claim Rate % | | Claim Severity % | | Net Default to Claim Rate % | | Claim Severity % |
| 33% | | 31% | | 98% | |
| 35% | | | 33% | | 96% |
______________________
N/A – Not applicable
Part I. Item 2. Management's DiscussionandAnalysis of Financial Condition and Results of Operations (Cont'd)
Our aggregate weighted average net Default to Claim Rate assumption for our primary loans used in estimating our reserve for losses, which is net of estimated Claim Denials and Rescissions, was 33% and 31% at both March 31, 20182019 and December 31, 2017, respectively.2018. Our net Default to Claim Rate and loss reserve estimate incorporate our expectations with respect to future Rescissions, Claim Denials and Claim Curtailments.Curtailments, inclusive of claim withdrawals, reduced our loss reserve as of March 31, 2019 and December 31, 2018 by $32 million. These expectations are based primarily on our recent experience with respect to the number of claims that have been denied due to the policyholder’s
Part I. Item 2. Management’s Discussion and Analysis of Financial Condition and Results of Operations (continued)
failure to submit sufficient documentation to perfect a claim within the time period permitted under our Master Policies, and also our recent experience with respect to the number of insurance certificates that have been rescinded due to fraud, underwriter negligence or other factors. Our assumptions also reflect the estimated impact of the BofA Settlement Agreement. See Note 11 of Notes to Consolidated Financial Statements in our 20172018 Form 10-K.
Our mortgage insurance total loss reserve as a percentage of our mortgage insurance total RIF was 0.9%0.7% at both March 31, 2018, compared to 1.0% at2019 and December 31, 2017.2018. See Note 10 of Notes to Unaudited Condensed Consolidated Financial Statements for information regarding our reserves for losses by category and a reconciliation of our Mortgage Insurance segment’s beginning and ending reserves for losses and LAE.
Our primary reserve per default (calculated as primary reserve excluding IBNR and other reserves divided by the number of primary defaults) was $18,523$17,962 and $17,103$17,634 at March 31, 20182019 and December 31, 2017, respectively, with the recent increase caused by an increase in the percentage of defaults within the overall mix of defaults that are aged greater than three months. This mix shift was consistent with the typical seasonal patterns, with cures observed in the first quarter of 2018, being more concentrated in those defaults aged three months or less.respectively.
We considered the sensitivity of our loss reserve estimates at March 31, 20182019 by assessing the potential changes resulting from a parallel shift in Claim Severity and Default to Claim Rate for primary loans. For example, assuming all other factors remain constant, for every one percentage point absolute change in primary Claim Severity (which we estimated to be 97%98% of our risk exposure at March 31, 2018)2019), we estimated that our total loss reserve at March 31, 20182019 would change by approximately $5$4 million. Assuming the portfolio mix and all other factors remain constant, for every one percentage point absolute change in our primary net Default to Claim Rate, we estimated a $13$10 million change in our primary loss reserve at March 31, 2018.2019.
In addition, as part of our claims review process, we assess whether defaulted loans were serviced appropriately in accordance with our insurance policies and servicing guidelines. To the extent a servicer has failed to satisfy its servicing obligations, our policies provide that we may curtail the claim payment for such default, and in some circumstances, cancel coverage or deny the claim. Before consideration of any subsequent challenges by our lender and servicer customers, Claim Curtailments due to servicer noncompliance with our insurance policies and servicing guidelines, which impact the severity of our claim payments, were $1.5$0.6 million for the three months ended March 31, 2018,2019, compared to $2.3$1.5 million for the same periodsperiod in 2017.2018.
Total mortgage insurance claims paid of $34.6 million for the three months ended March 31, 2019 decreased from claims paid of $59.9 million for the three months ended March 31, 2018 decreased from2018. The decrease in claims paid of $82.1 million foris consistent with the three months ended March 31, 2017, primarily due to the continuingongoing decline in the outstanding default inventory. See “Liquidity and Capital Resources—Mortgage Insurance” for more information. Although expected claims are included in our reserve for losses, the timing of claims paid is subject to fluctuation from quarter to quarter, based on the rate that defaults cure and other factors (as described in “Item 1. Business—Mortgage Insurance—Defaults and Claims” in our 20172018 Form 10-K) that make the timing of paid claims difficult to predict.
Part I. Item 2. Management'sManagement’s DiscussionandAnalysis of Financial Condition and Results of Operations (Cont'd)(continued)
The following table shows claims paid by product and average claim paid by product for the periods indicated:
| | | | Three Months Ended
March 31, | Three Months Ended
March 31, |
| (In thousands) | 2018 | | 2017 | 2019 | | 2018 |
Net claims paid: (1) | | | | | | |
| Prime | $ | 37,142 |
| | $ | 52,044 |
| $ | 23,863 |
| | $ | 37,142 |
|
| Alt-A and A minus and below | 21,416 |
| | 25,625 |
| 9,497 |
| | 21,416 |
|
| Total primary claims paid | 58,558 |
| | 77,669 |
| 33,360 |
| | 58,558 |
|
| Pool | 1,152 |
| | 4,180 |
| 1,109 |
| | 1,152 |
|
| Other | 148 |
| | 78 |
| 121 |
| | 148 |
|
| Subtotal | 59,858 |
| | 81,927 |
| 34,590 |
| | 59,858 |
|
| Impact of captive terminations | (36 | ) | | — |
| |
| Impact of commutations | 104 |
| | 161 |
| |
Impact of commutations (2) | | — |
| | 68 |
|
| Total net claims paid | $ | 59,926 |
| | $ | 82,088 |
| $ | 34,590 |
| | $ | 59,926 |
|
| | | | | | | |
Average net claim paid: (1) (2) | | | | |
Average net claim paid: (1) (3) | | | | |
| Prime | $ | 50.0 |
| | $ | 50.5 |
| $ | 47.1 |
| | $ | 50.0 |
|
| Alt-A and A minus and below | 63.0 |
| | 53.4 |
| 53.1 |
| | 63.0 |
|
| Total average net primary claim paid | 54.1 |
| | 51.4 |
| 48.6 |
| | 54.1 |
|
| Pool | 52.4 |
| | 49.2 |
| |
| Total average net claim paid | $ | 53.2 |
| | $ | 50.9 |
| |
| | | | | | | |
Average direct primary claim paid (2) (3) | $ | 54.5 |
| | $ | 51.6 |
| |
Average total direct claim paid (2) (3) | $ | 53.6 |
| | $ | 51.1 |
| |
Average direct primary claim paid (3) (4) | | $ | 49.2 |
| | $ | 54.5 |
|
______________________
| |
| (1) | Net of reinsurance recoveries. |
| |
| (2) | Includes the impact of captive terminations. |
| |
| (3) | Calculated without giving effect to the impact of the termination of captive transactions and commutations. |
| |
(3)(4) | Before reinsurance recoveries. |
Other Operating Expenses. Other operating expenses for the three months ended March 31, 2018,2019, as compared to the same periodperiods in 2017,2018, reflect a decrease primarily due to an increase in ceding commissions, primarily due to the increased cession percentage on the 2016 Single Premium QSR Transaction, partially offset by an increase inresulting from higher allocated corporate operating expenses. The increase in allocated corporate operating expenses is primarily due to (i) higher legal and other professional services expense and (ii) higher compensation expense, including variable and incentive-based compensation and (ii) an increase in the proportion of corporate expenses allocated to the Mortgage Insurance segment, partially offset by a decrease in expenses associated with retirement and consulting agreements entered into in February 2017 with our former Chief Executive Officer.compensation. See “Results of Operations—Consolidated—Three Months Ended March 31, 2019 Compared to Three Months Ended March 31, 2018—Other Operating Expenses.”
Our expense ratio on a net premiums earned basis represents our mortgage insuranceMortgage Insurance segment’s operating expenses (which include policy acquisition costs and other operating expenses, as well as allocated corporate operating expenses), expressed as a percentage of net premiums earned. Our expense ratio was 23.7% forin each of the three months ended March 31, 2019 and 2018 compared to 27.1% for the same period in 2017. The increase in net premiums earned was the primary driver of the change in the expense ratios between these periods, combined with lower other operating expenses.
Part I. Item 2. Management'sManagement’s DiscussionandAnalysis of Financial Condition and Results of Operations (Cont'd)(continued)
Results of Operations—Services
Three Months Ended March 31, 20182019 Compared to Three Months Ended March 31, 20172018
The following table summarizes our Services segment’s results of operations for the three months ended March 31, 20182019 and 2017:2018:
| | | | | | | | $ Change | | | | | $ Change |
| | Three Months Ended
March 31, | | Favorable (Unfavorable) | Three Months Ended
March 31, | | Favorable (Unfavorable) |
| (In millions) | 2018 | | 2017 | | 2018 vs. 2017 | 2019 | | 2018 | | 2019 vs. 2018 |
Adjusted pretax operating income (loss) (1) | $ | (7.6 | ) | | $ | (9.4 | ) | | $ | 1.8 |
| $ | (6.1 | ) | | $ | (7.6 | ) | | $ | 1.5 |
|
| Net premiums earned—insurance | | 1.7 |
| | — |
| | 1.7 |
|
| Services revenue | 34.2 |
| | 40.1 |
| | (5.9 | ) | 33.7 |
| | 34.2 |
| | (0.5 | ) |
| Cost of services | 23.3 |
| | 28.7 |
| | 5.4 |
| 24.6 |
| | 23.3 |
| | (1.3 | ) |
| Gross profit on services | 10.9 |
| | 11.4 |
| | (0.5 | ) | |
Other operating expenses (2) | 13.5 |
| | 16.3 |
| | 2.8 |
| |
Restructuring and other exit costs (3) | 0.5 |
| | — |
| | (0.5 | ) | |
Other operating expenses (2) (3) | | 17.6 |
| | 13.5 |
| | (4.1 | ) |
| Interest expense | | — |
| | 4.5 |
| | 4.5 |
|
| | | | | | | | | | | |
______________________
| |
| (1) | Our senior management uses adjusted pretax operating income (loss) as our primary measure to evaluate the fundamental financial performance of each of the Company’s business segments. See Note 3 of Notes to Unaudited Condensed Consolidated Financial Statements. |
| |
| (2) | Includes allocation of corporate operating expenses of $2.8 million and $3.7$4.2 million for the three-month periodsperiod ended March 31, 20182019, and 2017,$2.8 million for the three-month period ended March 31, 2018, respectively. |
| |
| (3) | Primarily includes employee severance and related benefit costs. Does not include impairment of long-lived assets and infrequent or unusual non-operating items, which isare not considered a componentcomponents of adjusted pretax operating income. |
Our Services segment is primarily a fee-for-service business that offers a broad array of mortgage, real estate and title services to market participants across the
mortgage and real estate value chain, primarily through our subsidiaries, including Clayton, Green River Capital, Radian Settlement Services and Red Bell, ValuAmerica andBell. In 2018, we also acquired the businesses of EnTitle Direct (which was acquired in March 2018). See “Overview—Other 2018 Developments—and Independent Settlement Services, Acquisition.”as well as the assets of Five Bridges, to enhance our Services offerings. In connection with the restructuring of our Services business, we have refined our Services business strategy going forward and are focused on our core mortgage, real estate and title services. These services comprise mortgage services, real estate services and title services that provide mortgage lenders, financial institutions, mortgage and real estate investors and government entities, among others, with information and other resources and services that are used to originate, evaluate, acquire, securitize, service and monitor residential real estate and loans secured by residential real estate. Effective with our acquisition of EnTitle Direct, we provide title insurance to mortgage lenders as well as directly to borrowers.
Adjusted Pretax Operating Income (Loss). Our Services segment’s adjusted pretax operating loss was $7.6 million for the three months ended March 31, 2018,2019 was $6.1 million, compared to an adjusted pretax operating loss of $9.4$7.6 million for the same period in 2017.2018. The changedecrease in our adjusted pretax operating loss for the three months ended March 31, 2018,2019, as compared to the same period in 2017,2018, was primarily driven by decreaseda decrease in interest expense, partially offset by an increase in other operating expenses.expenses resulting from the impact of the businesses acquired in 2018 and the inclusion of other operating expenses for these businesses from their respective dates of acquisition.
Net premiums earned—insurance. Net premiums earned for the three months ended March 31, 2019 increased compared to the same period in 2018, as a result of the acquisition of EnTitle Direct and the inclusion of its operations.
Services Revenue. RevenueServices revenue decreased for the three months ended March 31, 2018,2019, as compared to the same periodperiods in 2017,2018, primarily due to a decline in mortgage services, partially offset by an increase in real estate services and title services transaction volumes.services. This decrease was generally in line with our expectations, as we continueservices revenue is primarily attributable to reposition our Services business to create more sustainable, recurring revenue sources.
Forfluctuations in the three months ended March 31, 2018,overall activity in the top 10 Services customers (which includes our affiliates) generated 44% ofhousing and mortgage finance markets, including a decline in the Services segment’s revenues, as compared to 53% for the same period in 2017. Approximately 3% of the Services segment’s revenuerefinance mortgage origination market for the three months ended March 31, 2018 related2019, compared to sales to our affiliates, and has been eliminated in our consolidated results for all periods presented. The largest single customer generated approximately 11% of the Services segment’s revenue for both the three months ended March 31, 2018, and the same period in 2017.2018, partially offset by the inclusion of revenue from businesses acquired in 2018 since their respective dates of acquisition.
Cost of Services. Our cost of services is primarily affected by our level of services revenue. Our cost of services primarily consists of employee compensation and related payroll benefits, including the cost of billable labor assigned to revenue-generating activities and, to a lesser extent, other costs of providing services such as travel and related expenses incurred in providing client services and costs paid to outside vendors, data acquisition costs and other compensation-related expenses to maintain software application platforms that directly support our businesses. The level of these costs may also fluctuate if market rates of compensation change, or if there is decreased availability or a loss of qualified employees.
Part I. Item 2. Management'sManagement’s DiscussionandAnalysis of Financial Condition and Results of Operations (Cont'd)(continued)
Gross Profit on Services. For the three months ended March 31, 2018, our gross profit on services represented 32% of our total services revenue, compared to 28% for the same period of 2017. The increase in our services gross profit percentage for the three months ended March 31, 2018, as compared to the same period in 2017, was primarily due to the decrease in cost of services as a result of our restructuring actions in 2017.
Other Operating Expenses. Other operating expenses primarily consist of compensation costs not classified as cost of services because they are related to employees, such as sales and corporate employees, who are not directly involved in providing client services. Compensation-related costsOther operating expenses for the three months ended March 31, 2019 were impacted by businesses acquired in 2018 represented 44%and the resulting inclusion of the segment’s other operating expenses compared to 54% for the same period in 2017. The decrease in compensation-related costs for the three months ended March 31, 2018, compared to the same period in 2017, is primarily due to the restructuring actions taken in 2017.these businesses from their respective dates of acquisition. Other operating expenses also include other selling, general and administrative expenses, depreciation, and allocations of corporate general and administrative expenses. Other operating expenses for the three months ended March 31, 2018 include allocations of corporate operating expenses of $2.8 million compared to $3.7 million for the same period in 2017. This decrease is primarily due to: (i) a decrease in the proportion of corporate expenses allocated to the Services segment and (ii) a decrease in expenses associated with retirement and consulting agreements incurred in the three months ended March 31, 2017; partially offset by higher compensation expense, including variable and incentive-based compensation. See “Results of Operations—Consolidated—Three Months Ended March 31, 2019 Compared to Three Months Ended March 31, 2018—Other Operating Expenses.”
Restructuring and other exit costs. ForInterest Expense. Effective January 1, 2019, the three months ended March 31, 2018, restructuring and other exit costs include charges associated with our plan to restructureClayton Intercompany Note was repaid using proceeds from an additional capital contribution from Radian Group. As a result of the intercompany note repayment, the Services business. The portion of these charges that are included in adjusted pretax operating income are primarily due to severance and related benefit costs. See “Overview” for more information.segment no longer incurs interest expense on the intercompany note.
Off-Balance Sheet Arrangements
There have been no material changes in off-balance sheet arrangements from those specified in our 20172018 Form 10-K.
Contractual Obligations and Commitments
There have been no material changes outside of the ordinary course of business in our contractual obligations and commitments from those specified in our 20172018 Form 10-K.
Liquidity and Capital Resources
Radian Group—Short-Term Liquidity Needs
Radian Group serves as the holding company for our insurance and other subsidiaries and does not have any operations of its own. At March 31, 2018,2019, Radian Group had available, either directly or through an unregulated subsidiary, unrestricted cash and liquid investments of $203$723.4 million. This amount: (i)Total liquidity as of March 31, 2019 was $990.9 million, and includes $89our undrawn $267.5 million deposited with the IRS (which may be recalled by usunsecured revolving credit facility as of that time. Available liquidity and total liquidity at any time) in connection with the IRS Matter and (ii) excludesMarch 31, 2019 exclude certain additional cash and liquid investments that have been advanced to Radian Group from our subsidiaries for corporate expenses and interest payments. Total liquidity, which also includes our undrawn $225 million unsecured revolving credit facility enteredIn addition, these amounts do not take into in October 2017, was $428 million as ofconsideration transactions subsequent to March 31, 2018.2019, including: (i) $90.6 million in repurchases of Radian Group common stock, excluding commissions, pursuant to the existing share repurchase authorization and (ii) the $375 million distribution of capital from Radian Guaranty to Radian Group. See “—Sources of Liquidity” below. BorrowingsSubject to certain limitations, borrowings under the credit facility may be used for working capital and general corporate purposes, including, without limitation, capital contributions to Radian Group’s insurance and reinsurance subsidiaries as well as growth initiatives. See Note 12 of Notes to Unaudited Condensed Consolidated Financial Statements for additional details.
During the first quarter of 2018, available holding company liquidity was reduced by the Company’s purchase of Radian Group common stock under its share repurchase program and the acquisition of EnTitle Direct.
On August 9, 2017,March 20, 2019, Radian Group’s board of directors renewedapproved a $150 million increase in authorization for the Company’s existing share repurchase program, authorizingplan, bringing the Companytotal authorization to repurchase shares up to $50$250 million, of its common stock.excluding commissions. During the three months ended March 31, 2018, we2019, the Company purchased 531,0131,546,674 shares at an average price of $18.84$20.54 per share, including commissions. At March 31, 2018,2019, purchase authority of up to $40.0a maximum of $218.2 million remained available under this program, which expires on July 31, 2018.2020. Subsequent to March 31, 2019, Radian Group has purchased an additional $15 million4,131,329 shares of its common stock, in April 2018, which reduced available holding company liquidity from the amount reported above. See Note 14 of Notes to Unaudited Condensed Consolidated Financial Statements for additional details on our share repurchase program. See “Overview—Other 2018 Developments” for additional information on EnTitle Direct.
Part I. Item 2. Management's DiscussionandAnalysis of Financial Condition and Results of Operations (Cont'd)
Radian Group’s principal liquidity demands for the next 12 months are expected to include:are: (i) the payment of corporate expenses, including taxes; (ii) the payment of $158.6 million principal amount of our outstanding Senior Notes due in June 2019; (iii) interest payments on our outstanding debt obligations; (iii) as discussed further below, payments to the U.S. Treasury resulting from the anticipated settlement of our IRS Matter; (iv) the payment of dividends on our common stockstock; and (v) the potential use of up to $40.0$218.2 million to repurchase Radian Group common stock pursuant to the existing share repurchase programauthorization ($1590.6 million of which was used for the purchases made in April 2018 and, based on current market conditions, we expectsubsequent to utilize the remaining amounts prior to the expiration of the program in July 2018)March 31, 2019 through May 6, 2019, excluding commissions). Radian Group’s liquidity demands for the next 12 months or in future periods could also include: (i) capital support for Radian Guaranty and our other insurance subsidiaries;subsidiaries (if needed); (ii) repayments, repurchases or early redemptions of portions of our debt obligations; and (iii) potential investments to support our strategy for growing our businesses.business strategy.
Corporate Expenses and Interest Expense. Radian Group has expense-sharing arrangements in place with its principal operating subsidiaries that require those subsidiaries to pay their allocated share of certain holding-company-levelholding company expenses, including interest payments on most of ourRadian Group’s outstanding debt obligations. Payments of these corporate expenses for
Part I. Item 2. Management’s Discussion and Analysis of Financial Condition and Results of Operations (continued)
the next 12 months, excluding interest payments on ourRadian Group’s debt, are expected to be approximately $75$90 million most of which is expected to be reimbursed by our subsidiaries under our expense-sharing arrangements.$100 million. For the same period, payments of interest on ourRadian Group’s debt obligations are expected to be approximately $55.4 million,$51 million. We expect most of which is expectedthese holding company expenses to be reimbursed by our subsidiaries under our expense-sharing arrangements. See “—Radian Group—Long-Term Liquidity Needs—Needs” and “—Services.” The expense-sharing arrangements between Radian Group and our insurance subsidiaries, as amended, have been approved by the applicable insurance departments, but such approval may be modified or revoked at any time.
Capital Support for Subsidiaries. Private mortgage insurers, including Radian Guaranty, are required to comply with the PMIERs to remain eligibleapproved insurers of loans purchased by the GSEs. Radian Guaranty currently is an approved mortgage insurer under the PMIERs, and is in compliance with the PMIERs financial requirements. At March 31, 2018,2019, Radian Guaranty’s Available Assets under the current PMIERs financial requirements totaled approximately $3.7$3.5 billion, resulting in an excess available resources or a “cushion” of approximately $526$488 million, or 16%, over its Minimum Required Assets of approximately $3.2$3.0 billion. See Note 16 of Notes to Unaudited Condensed Consolidated Financial Statements for additional details regarding the capital requirements of our subsidiaries.
The PMIERs requireWhile the amount of this cushion could fluctuate on a quarterly basis, we expect it to increase over time based, in part, on our expectations regarding the future financial performance of Radian to maintain significantly more Minimum Required Assets for delinquent loans than for performing loans. Therefore, the increaseGuaranty, including our projected NIW, expected decrease in reported delinquencies from hurricane-affected areas resulted in an elevated level of the Company’s Minimum Required Assets as of March 31, 2018, compared to levels prior to the hurricanes, as a result of increased new primary defaults received subsequent to those two disasters. The Company expects these Minimum Required Assets to decrease by the end of 2018, consistent with our expectation that most of the hurricane-related defaults will cure.and risk distribution strategy. See Note 10Notes 1 and 7 of Notes to Unaudited Condensed Consolidated Financial Statements.Statements for additional information about the PMIERs and our reinsurance programs, respectively. Additionally, notwithstanding our cushion, our holding company liquidity of $723.4 million and our $267.5 million unsecured revolving credit facility (both as of March 31, 2019) may be utilized to enhance Radian Guaranty’s PMIERs cushion, as necessary, subject to a $35 million minimum liquidity requirement under our unsecured revolving credit facility. See Note 12 of Notes to Unaudited Condensed Consolidated Financial Statements for additional information on the unsecured revolving credit facility.
Part I. Item 2. Management'sManagement’s DiscussionandAnalysis of Financial Condition and Results of Operations (Cont'd)(continued)
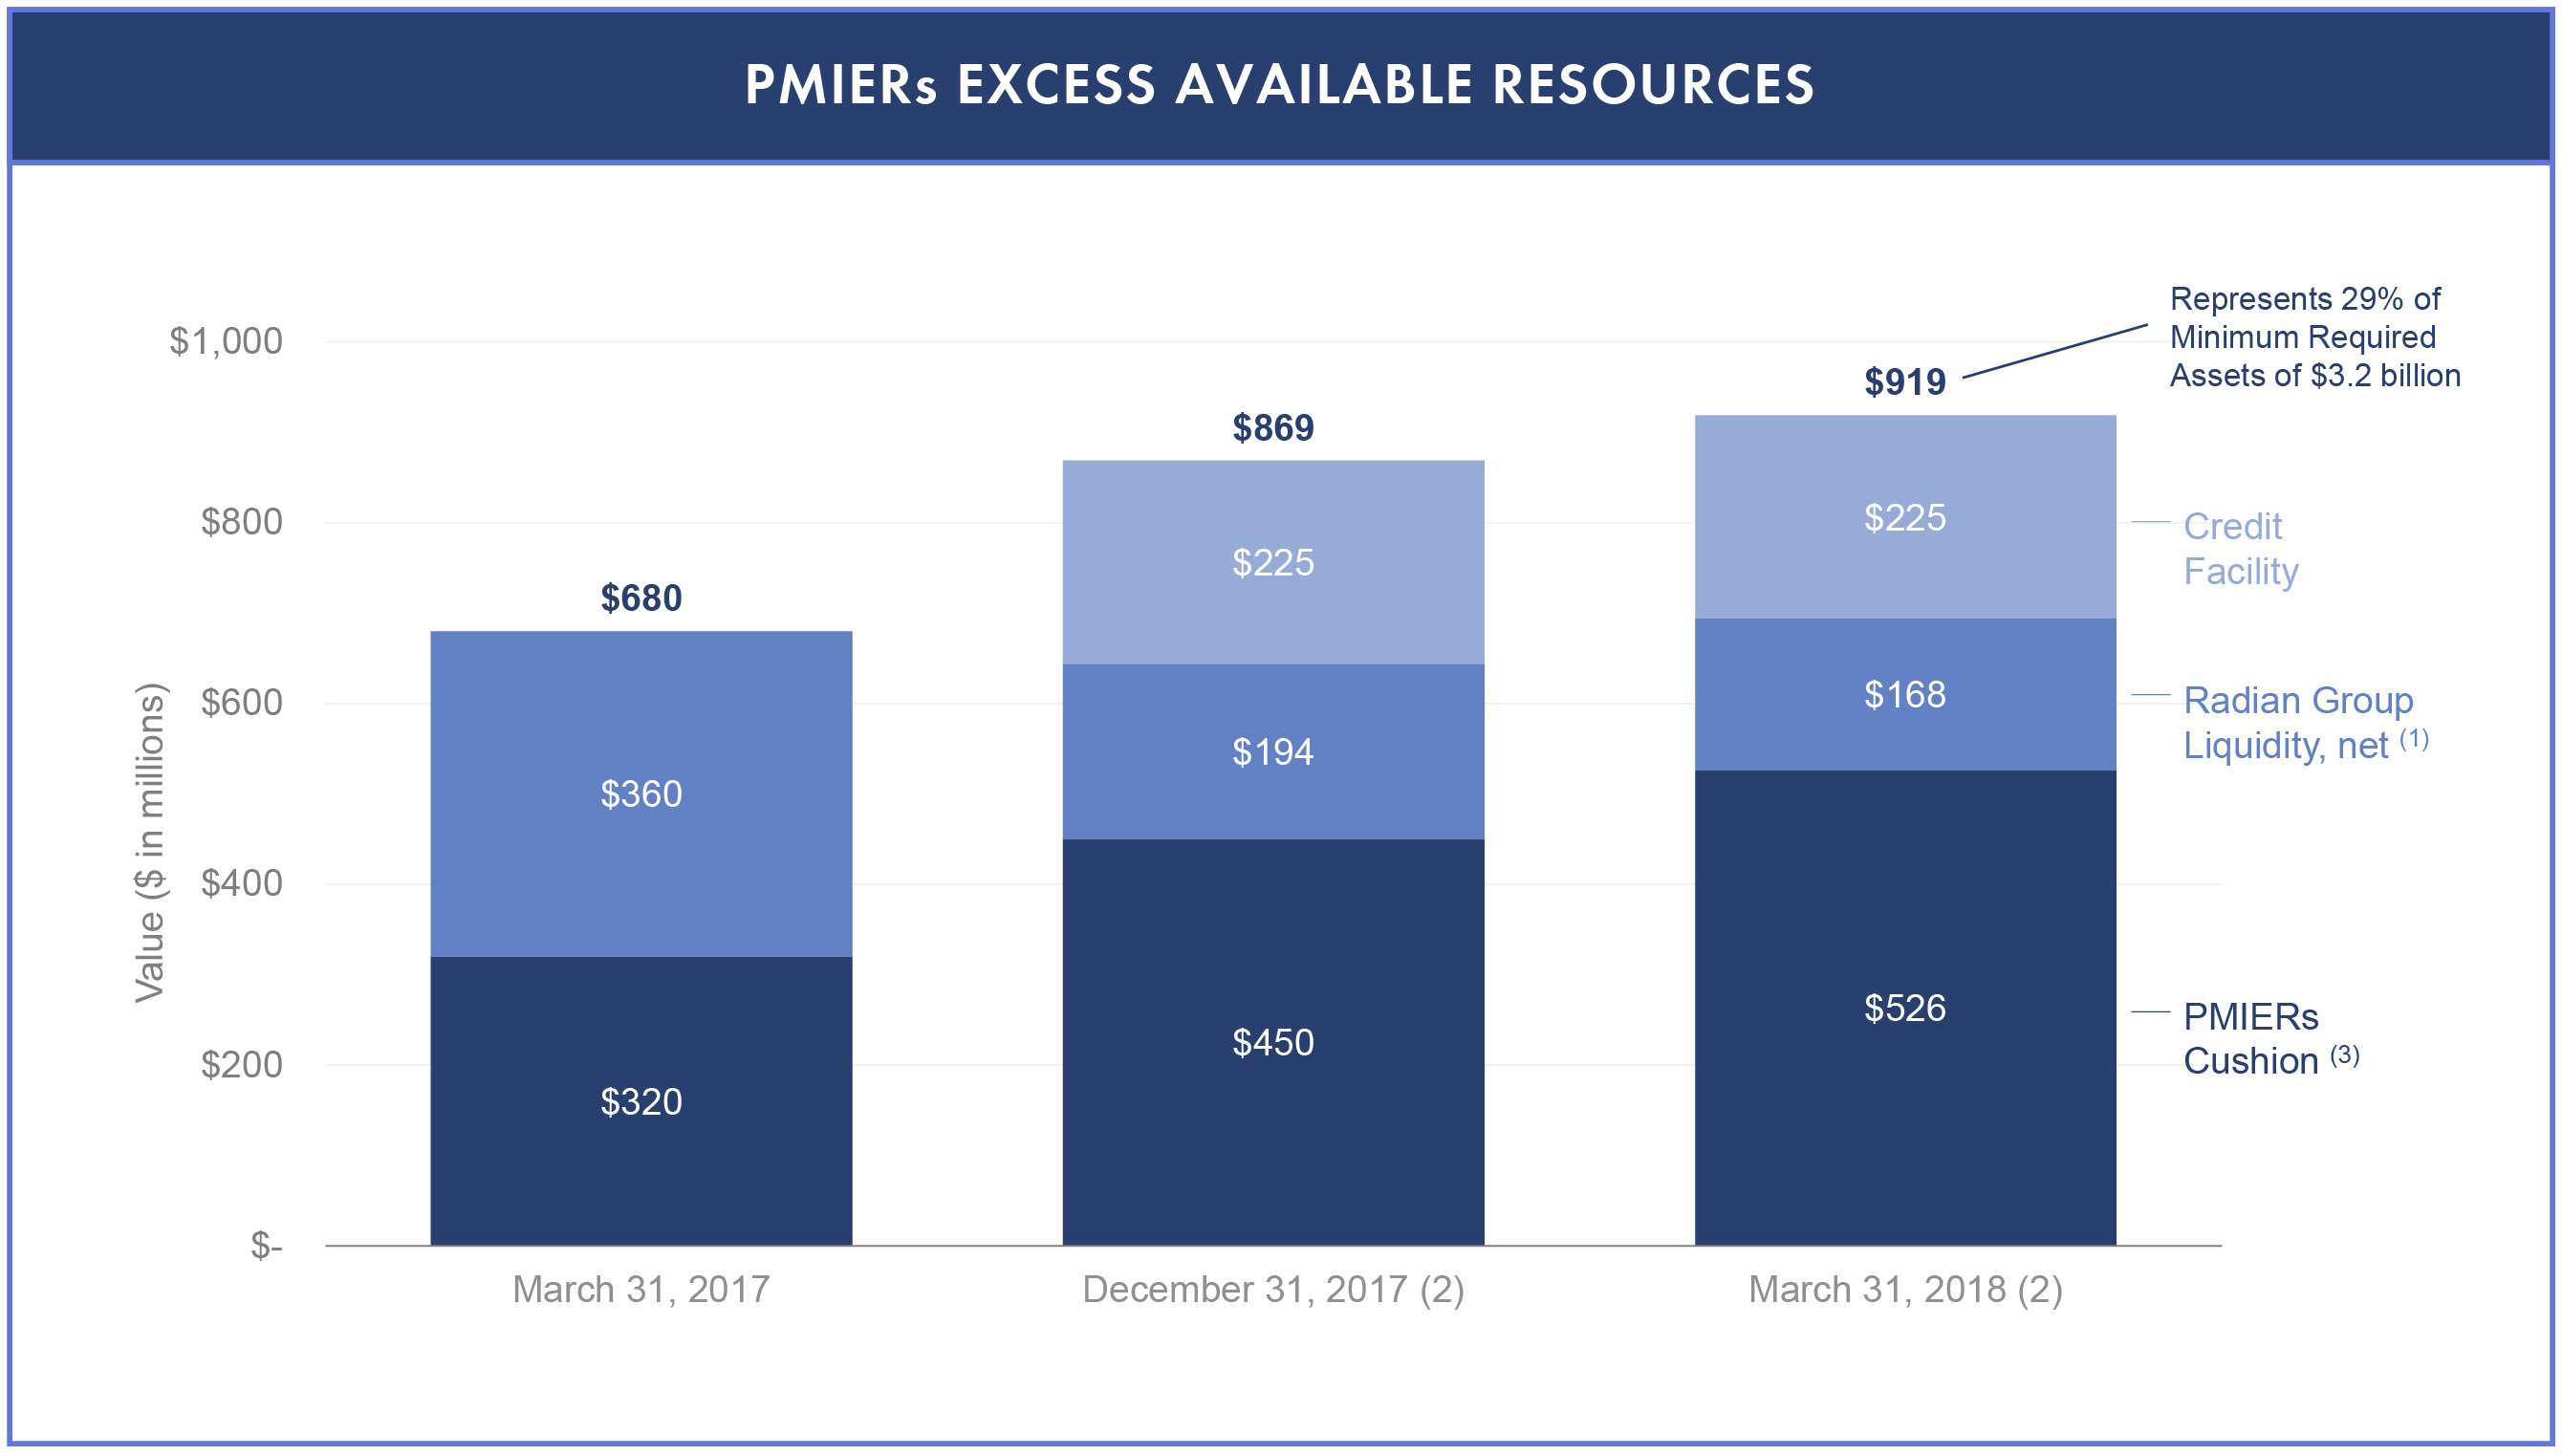
______________________
| |
| (1) | Represents Radian Group’s Liquidity, net of the $35 million minimum liquidity requirement under the unsecured revolving credit facility. Radian Group’s Liquidity as of December 31, 2018 includes $450 million from the December 2018 distribution of capital to our holding company from its mortgage insurance subsidiary, as approved by the Pennsylvania Insurance Department. |
| |
| (2) | The amendment to the 2016 Single Premium QSR Transaction which became effective as of December 31, 2017, and the $100 million of cash and marketable securities that Radian Group transferred to Radian Guaranty in December 2017 in exchange for a Surplus Note both had the effect of increasing the amount of Radian Guaranty’s cushion under the PMIERs financial requirements at December 31, 2017. These increases were partially offset by an elevated level of Minimum Required Assets at December 31, 2017 and March 31, 2018, due to the increase in reported delinquencies from hurricane-affected areas, which is expected to be temporary, as discussed above. |
| |
(3) | Represents Radian Guaranty’s excess of Available Assets over its Minimum Required Assets, calculated in accordance with the PMIERs financial requirements.requirements in effect for each date shown. PMIERs 1.0 was in effect for March 31, 2018 and December 31, 2018; PMIERs 2.0 was in effect for March 31, 2019. |
| |
| (3) | Percentages represent the values shown as a percentage of Minimum Required Assets under the applicable PMIERs financial requirements in effect for the dates shown. |
The PMIERs specifically provide that the factors applied1.0 required Radian to determine a mortgage insurer’smaintain significantly more Minimum Required Assets may be updated every two years, or more frequently, as determinedfor delinquent loans than for performing loans. Therefore, the increase in new primary defaults received during 2017 from areas affected by the GSEs. As previously announced, Radian Guaranty received, on a confidential basis, proposed changes to the PMIERs. Based on this information, which has been subject to comment by the private mortgage insurance industry, Radian expects to be able to fully comply with the proposed PMIERsHurricanes Harvey and Irma required us to maintain an excesselevated level of AvailableMinimum Required Assets overat March 31, 2018, compared to levels prior to these hurricanes. As of December 31, 2018, the impact of these hurricanes on our level of our Minimum Required Assets had substantially decreased, consistent with our expectation that most of the hurricane-related defaults would cure during 2018, and these incremental defaults did not result in a material increase in our incurred losses or paid claims. See Note 11 of Notes to Consolidated Financial Statements in our 2018 Form 10-K. Subject to certain requirements, defaulted loans in FEMA-declared major disaster areas require a reduced level of Minimum Required Assets under PMIERs 2.0, as compared to under PMIERs 1.0, which we expect to help reduce the PMIERs asfuture volatility of their effective date, which is expected to be no earlier than the end of 2018, without a need to take further actions to do so. Radian’s expectation is not dependentour Minimum Required Asset levels upon the existing intercompany Surplus Note,occurrence of a similar event.
The two reinsurance agreements we entered into in November 2018 as part of our Excess-of-Loss Program reduced our level of Minimum Required Assets by $455.4 million. This benefit was approximately offset by the distribution of capital from Radian Guaranty to Radian Group in December 2018, which reduced Radian Guaranty’s Available Assets by $450 million. Net cash provided by operating activities also increased Available Assets during 2018 and is based on its projections for positive operating results in 2018, its strong capital position2019. See Notes 7 and the benefits of its reinsurance programs. See Note 116 of Notes to Unaudited Condensed Consolidated Financial Statements for additional information aboutinformation.
Part I. Item 2. Management’s Discussion and Analysis of Financial Condition and Results of Operations (continued)
The GSEs may amend the PMIERs. If our projections turn outPMIERs at any time, although the GSEs have communicated that for material changes, including material changes affecting Minimum Required Assets, they will generally provide written notice 180 days prior to be inaccurate, our holding company liquiditythe effective date. The GSEs also have broad discretion to interpret the PMIERs, which could impact the calculation of $203 million andRadian Guaranty’s Available Assets and/or Minimum Required Assets. On September 27, 2018, the $225 million unsecured revolving credit facility could be utilizedGSEs issued revisions to enhancethe PMIERs, or PMIERs 2.0, which became effective on March 31, 2019. These changes did not result in a material change in Radian’s Minimum Required Assets, but, as shown in the chart above, reduced Radian’s PMIERs cushion. The reduction in Radian Guaranty’s PMIERs cushion as necessary, subjectis primarily due to a $35reduction in Available Assets of approximately $200 million minimum liquidity requirementas a result of the elimination in PMIERs 2.0 of any credit for future premiums for insurance policies written prior to and including 2008, which was permitted under PMIERs 1.0.
In April 2019, Radian Guaranty entered into a fully collateralized reinsurance agreement with Eagle Re 2019-1 that will reduce net RIF by a total of $562.0 million, and is expected to reduce the capital required to be held at Radian Guaranty by reducing the PMIERs Minimum Required Assets by the same amount. This expected growth in PMIERs excess available resources has not been reflected in the information provided above. See “Overview—Other 2019 Developments—Reinsurance” for additional information on this new agreement.
In April 2019, the Pennsylvania Insurance Department approved a $375 million distribution of capital from Radian Guaranty to Radian Group, which was paid on April 30, 2019 in the form of cash and marketable securities. This distribution will reduce our unsecured revolving credit facility.PMIERs Available Assets by $375 million. See Note 16 of Notes to Unaudited Condensed Consolidated Financial Statements for a discussion of this distribution of capital.
Radian Guaranty’s Risk-to-capital as of March 31, 20182019 was 12.613.4 to 1. See Note 16 of Notes to Unaudited Condensed Consolidated Financial Statements for more information. Our combined Risk-to-capital, which represents the consolidated Risk-to-capital measure for all of our Mortgage Insurance subsidiaries, was 11.912.4 to 1 as of March 31, 2018.2019. Radian Guaranty is not expected to need additional capital to satisfy state insurance regulatory requirements in their current form.
Part I. Item 2. Management's DiscussionandAnalysis of Financial Condition and Results of Operations (Cont'd)
The NAIC is in the process of reviewing the minimum capital and surplus requirements for mortgage insurers and has been considering changes to the Model Act. In May 2016, a working group of state regulators released an exposure draft of a risk-based capital framework to establish capital requirements for mortgage insurers. While the timing and outcome of this process is not known, in the event the NAIC adopts changes to the Model Act, we expect that the capital requirements in states that adopt the new Model Act may increase as a result of the changes. However, we continue to believe the changes to the Model Act will not result in financial requirements that require greater capital than the level currently required under the PMIERs financial requirements.
Title insurance companies, including EnTitle Insurance, are subject to comprehensive state regulations, including minimum net worth requirements. EnTitle Insurance was in compliance with its minimum net worth requirements at March 31, 2019. In the event the cash flow from operations of the Services segmentEnTitle Insurance is not adequate to fund all of its needs, Radian Group may provide additional funds to the Services segmentEnTitle Insurance in the form of aan intercompany note or other capital contribution, or an intercompany note.subject to the approval of the Ohio Department of Insurance, if needed. Radian Group may also provide additional funds to other subsidiaries in our Services segment to help fund their operations, if needed. See also “—Services,Services.” below. Additional capital support may also be required for potential investments in new business initiatives to support our strategy of growing our businesses.
Dividends. Our quarterly common stock dividend currently is $0.0025 per share and, based on our current outstanding shares of common stock, we would require approximately $2.2$2.1 million in the aggregate to pay our quarterly dividends for the next 12 months. Radian Group is not subject to any limitations on its ability to pay dividends except those generally applicable to corporations that are incorporated in Delaware. Delaware corporation law provides that dividends are only payable out of a corporation’s capital surplus or (subject to certain limitations) recent net profits. As of March 31, 2018,2019, our capital surplus was $3.1$3.7 billion, representing our dividend limitation under Delaware law.
IRS Matter. In April 2018, Radian was notified that the JCT had no objection to the terms of the Company’s previously disclosed proposed settlement with the IRS, which we now expect to occur within the next several months. The IRS is expected to retain approximately $35 million of our $89 million deposit currently held by them in connection with the IRS Matter. Therefore, since this deposit is included in our available holding company liquidity, one of the expected impacts of the final settlement is a reduction in Radian’s available holding company liquidity of approximately $35 million. However, the Company expects to recognize in the second quarter of 2018 a net positive impact to tax expense, net income and book value. See “Overview—Other 2018 Developments” for additional information.
Radian Group will not be reimbursed for any portion of this potential settlement under the tax-sharing arrangements with its subsidiaries, as a result of an intercompany assumption and indemnification agreement related to certain of these Deficiency Amounts. See Note 9 of Notes to Unaudited Condensed Consolidated Financial Statements for additional information regarding the IRS Matter.
Sources of Liquidity. In addition to available cash and marketable securities, Radian Group’s principal sources of cash to fund future short-term liquidity needs include payments made to Radian Group under expense- and tax-sharing arrangements with its subsidiaries. See also “—Radian Group—Long-Term Liquidity Needs” and “—Services.” Pursuant to our tax-sharing agreements, our operating subsidiaries pay Radian Group an amount equal to any federal income tax the subsidiary would have paid on a standalone basis if they were not part of our consolidated tax return. As a result, from time to time, under the provisions of our tax-sharing agreements, Radian Group may receive cash from its operating subsidiaries that is in excess of Radian Group’s consolidated federal tax payment obligation. In 2018, Radian expects to pay minimal federalFor 2019, we do not expect these excess tax payments from our subsidiaries to the IRS, other than for the anticipated settlement related to the IRS Matter. See “—IRS Matter,” above. As a result, in 2018, under the provisions of our tax-sharing agreements, Radian Group expects to receive cash payments from certain of its subsidiaries that are in excess ofexceed Radian Group’s consolidated federal tax payment obligations.obligation to the same extent as in 2018.
In addition to the primary sources of liquidity listed above, on October 16, 2017, Radian Group entered intohas in place a three-year, $225$267.5 million unsecured revolving credit facility with a syndicate of bank lenders. Borrowings under the credit facility may be used for working capital and general corporate purposes, including, without limitation, capital contributions to Radian Group’s insurance and reinsurance subsidiaries as well as growth initiatives. At March 31, 2018,2019, the full $225$267.5 million remains undrawn and
Part I. Item 2. Management’s Discussion and Analysis of Financial Condition and Results of Operations (continued)
available under the facility. See Note 12 of Notes to Unaudited Condensed Consolidated Financial Statements for additional information.information on the unsecured revolving credit facility.
If Radian Group’s current sources of liquidity are insufficient for Radian Group to fund its obligations during the next 12 months, or if we otherwise decide to increase our liquidity position, Radian Group may seek additional capital, including by incurring additional debt, issuing additional equity, or selling assets, which we may not be able to do on favorable terms, if at all.
Part I. Item 2. Management's DiscussionandAnalysis of Financial Condition and Results of Operations (Cont'd)
We regularly evaluate opportunities, based on market conditions, to finance our operations by accessing the capital markets or entering into other types of financing arrangements with institutional and other lenders and financing sources, and consider various measures to improve our capital and liquidity positions, as well as to strengthen our balance sheet and improve Radian Group’s debt maturity profile. In the past, we have repurchased and exchanged, prior to maturity, some of our outstanding debt, and in the future, we may, from time to time, seek to redeem, repurchase or exchange for other securities, or otherwise restructure or refinance some or all of our outstanding debt, prior to maturity, in the open market, through other public or private transactions, including pursuant to one or more tender offers, or through any combination of the foregoing, as circumstances may allow. The timing or amount of any potential transactions will depend on a number of factors, including market opportunities and our views regarding our capital and liquidity positions and potential future needs. There can be no assurance that any such transactions will be completed on favorable terms, or at all.
Radian Group—Long-Term Liquidity Needs
In addition to our short-term liquidity needs discussed above, our most significant needs for liquidity beyond the next 12 months are:
| |
| (1) | the repayment of the following principal amounts in connection with our outstanding Senior Notes consisting of:(excluding the $158.6 million principal amount of outstanding debt due in June 2019): |
$158.6 million principal amount of outstanding debt due in June 2019;
$234.1 million principal amount of outstanding debt due in June 2020;
$197.7 million principal amount of outstanding debt due in March 2021;
$450.0 million principal amount of outstanding debt due in October 2024; and
| |
| (2) | potential additional capital contributions to our subsidiaries. |
As of March 31, 2018,2019, certain of our subsidiaries have incurred federal NOLs that could not be carried-back and utilized on a separate company tax return basis. As a result, we are not currently obligated under our tax-sharing agreement to reimburse these subsidiaries for their separate company federal NOL carryforward. However, if in a future period, our consolidated NOL is fully utilized before a subsidiary has utilizedone of these subsidiaries utilizes its share of federal NOL carryforwards on a separate entity basis, then Radian Group may be obligated to fund such subsidiary’s share of our consolidated tax liability to the IRS. Certain subsidiaries, including Clayton, currently have federal NOLs on a separate entity basis that are available for future utilization. However, we do not expect to fund material obligations related to these subsidiary NOLs. See also “—Radian Group—Short-Term Liquidity Needs—Sources of Liquidity.”
We expect to meet the long-term liquidity needs of Radian Group with a combination of: (i) available cash and marketable securities; (ii) private or public issuances of debt or equity securities, which we may not be able to do on favorable terms, if at all; (iii) cash received under tax- and expense-sharing arrangements with our subsidiaries; (iv) to the extent available, dividends or returns of capital from our subsidiaries; and (v) any amounts that Radian Guaranty is able to successfully redeemrepay under the Surplus Note.
Under Pennsylvania’s insurance laws, ordinary dividends and other distributions may only be paid out of an insurer’s positive unassigned surplus, measured as of the end of the prior fiscal year. Despite the fact that Radian Guaranty and Radian Reinsurance maintained significant positive statutory capitalpolicyholders’ surplus balances, Radian Guaranty and Radian Reinsurance had negative unassigned surplus at DecemberMarch 31, 20172019 of $765.0$651.1 million and $112.1$76.6 million, respectively. Therefore, no ordinary dividends or other distributions can be paid by these subsidiaries in 2018.2019. Due in part to the need to set aside contingency reserves, we do not expect that Radian Guaranty or Radian Reinsurance will have positive unassigned surplus, and therefore we expect that they will not have the ability to pay ordinary dividends, for the foreseeable future. Under Pennsylvania’s insurance laws, an insurer may request an Extraordinary Dividend,Distribution, but payment is subject to the approval of the Pennsylvania Insurance Commissioner. See Note 16 of Notes to Unaudited Condensed Consolidated Financial Statements for additional information.
There can also be no assurance that our Services segment will generate sufficient cash flow to pay dividends. See “—Services” below.
Part I. Item 2. Management’s Discussion and Analysis of Financial Condition and Results of Operations (continued)
Mortgage Insurance
As of March 31, 2018,2019, our Mortgage Insurance segment maintained claims paying resources of $4.4$4.5 billion on a statutory basis, which consists of contingency reserves, statutory policyholders’ surplus, premiums received but not yet earned and loss reserves.
The principal demands for liquidity in our mortgage insurance business include: (i) the payment of claims and potential claim settlement transactions, net of reinsurance; (ii) operating expenses (including those allocated from Radian Group) and (iii) taxes. In addition, Radian Guaranty’s Surplus Note to Radian Group has a due date of December 31, 2027. The Surplus Note may be redeemed at any time upon 30 days prior notice, subject to the approval of the Pennsylvania Insurance Department.
Part I. Item 2. Management's DiscussionandAnalysis of Financial Condition and Results of Operations (Cont'd)
In August 2016, Radian Guaranty and Radian Reinsurance became members of the FHLB. As members, they may borrow from the FHLB, subject to certain conditions, which include the need to post collateral.collateral and the requirement to maintain a minimum investment in FHLB stock. Advances from the FHLB may be used to provide low-cost, supplemental liquidity for various purposes, including to fund incremental investments. Radian’s current strategy includes using FHLB advances as financing to purchase additional investment securities that have similar durations, for the purpose of generating additional earnings from our investment securities portfolio with minimal incremental risk. As of March 31, 2018,2019, there were $25.6$108.5 million of FHLB advances outstanding.
The principal sources of liquidity in our mortgage insurance business currently include insurance premiums, net investment income and cash flows fromfrom: (i) investment sales and maturities andmaturities; (ii) FHLB advancesadvances; or (iii) capital contributions from Radian Group. We believe that the operating cash flows generated by each of our mortgage insurance subsidiaries will provide these subsidiaries with a substantial portion of the funds necessary to satisfy their claim payments, operating expenses and taxes for the foreseeable future.
Private mortgage insurers, including Radian Guaranty, are required to comply with the PMIERs to remain eligibleapproved insurers of loans purchased by the GSEs. Radian Guaranty currently is an approved mortgage insurer under the PMIERs and is in compliance with the current PMIERs financial requirements. See “—Radian Group—Short-Term Liquidity Needs—Capital Support for Subsidiaries”and Note 1 of Notes to Unaudited Condensed Consolidated Financial Statements for additional information.
Securities Lending Agreements. Radian Guaranty and Radian Reinsurance from time to time enter into certain short-term securities lending agreements with third-party Borrowers for the purpose of increasing the yield on our investment securities portfolio with minimal incremental risk. Under our securities lending program, Radian Guaranty and Radian Reinsurance loan certain securities in their investment portfolios to these Borrowers for short periods of time in exchange for collateral consisting of cash and other securities. We have the right to request the return of the loaned securities at any time.
Under our securities lending agreements, the Borrower generally may return the loaned securities to us at any time, which would require us to return the cash and other collateral within the standard settlement period for the loaned securities on the principal exchange or market in which the securities are traded. We manage this liquidity risk associated with the cash collateral by maintaining the cash collateral in a short-term money-market fund with daily availability.
The credit risk under these programs is reduced by the amounts of collateral received. On a daily basis, the value of the underlying securities that we have loaned to the Borrowers is compared to the value of cash and securities collateral we received from the Borrowers, and additional cash or securities are requested or returned, as applicable. In addition, we are indemnified against counterparty credit risk by the intermediary. For additional information on our securities lending agreements, see Note 5 of Notes to Unaudited Condensed Consolidated Financial Statements.
Services
As of March 31, 2018,2019, our Services segment maintained cash and cash equivalents totaling $7.7$8.9 million, which included restricted cash of $1.5$1.9 million.
The principal demands for liquidity in our Services segment include: (i) the payment of employee compensation and other direct operating expenses, including those allocated from Radian Group;expenses; (ii) reimbursements to Radian Group for interest payments related to the original issued amountits portion of the Senior Notes due 2019;allocated expense; and (iii) dividends to Radian Group, if any. In addition, during the remainder of 2018, the Services segment expects to pay approximately $2.5 million in cash related to its restructuring plan. See “Overview—Business Strategy”for additional information.
The principal sources of liquidity in our Services segment are cash generated by operations and, to the extent necessary, capital contributions from Radian Group.
Liquidity levels may fluctuate depending on the levels and contractual timing of our invoicing and the payment practices of the Services clients, in combination with the timing of Services’ payments for employee compensation and to external vendors. The amount, if any, and timing of the Services segment’s dividend paying capacity will depend primarily on the amount of excess cash flow generated by the segment.
The Services segment has not generated sufficient cash flows to pay dividends to Radian Group. Additionally, while cash flow has been sufficient to pay the Services segment’s direct operating expenses, it has not been sufficient to reimburse Radian Group for $75 million ofits accumulated allocated expenses, including interest expense associated with the Clayton Intercompany Note. Effective January 1, 2019, Radian Group recapitalized the Services segment with a capital contribution that enabled the Services segment to repay its accumulated allocated operating expense and interest expense. We do notexpense, as well as to repay the Clayton Intercompany Note. While this action had no immediate net impact to Radian Group’s available liquidity, we expect that the
Part I. Item 2. Management’s Discussion and Analysis of Financial Condition and Results of Operations (continued)
Services segment will now be ablemore likely to bringsatisfy its reimbursement obligations current in the foreseeable future. In the event the cash flow from operations of the Services segment is not adequate to fund all of its needs, Radian Group may provide additional funds to the Services segment in the form of a capital contribution or an intercompany note.
Part I. Item 2. Management's DiscussionandAnalysis of Financial Condition and Results of Operations (Cont'd)
Cash Flows
The following table summarizes our consolidated cash flows from operating, investing and financing activities:
| | | (In thousands) | Three Months Ended
March 31, | Three Months Ended
March 31, |
| 2018 | | 2017 | 2019 | | 2018 |
| Net cash provided by (used in): | | | | | | |
| Operating activities | $ | 118,447 |
| | $ | 83,932 |
| $ | 217,778 |
| | $ | 118,447 |
|
| Investing activities | (119,740 | ) | | 48,534 |
| (185,343 | ) | | (119,740 | ) |
| Financing activities | 35,154 |
| | (107,914 | ) | (11,683 | ) | | 35,154 |
|
| Effect of exchange rate changes on cash and restricted cash | (1 | ) | | 24 |
| — |
| | (1 | ) |
| Increase (decrease) in cash and restricted cash | $ | 33,860 |
| | $ | 24,576 |
| $ | 20,752 |
| | $ | 33,860 |
|
| | | | | | | |
Operating Activities. Our most significant source of operating cash flows is generally from premiums received from our insurance policies, while our most significant uses of operating cash flows are generally for claims paid on our insured policies and our operating expenses. Net cash provided by operating activities totaled $118.4$217.8 million for the three months ended March 31, 2018,2019, compared to $83.9$118.4 million for the same period in 2017.2018. This increase in net cash provided by operating activities in the three months ended March 31, 2018,2019, compared to the same period in 2017,2018, was principally the result ofof: (i) an increase in net premiums written, combinedcash received from the IRS, including the remaining $57.2 million refund which was previously on deposit with the IRS; and (ii) a reduction in claims paid.paid in 2019.
Investing Activities. Net cash used in investing activities increased in the three months ended March 31, 2018,2019, compared to the same period in 2017,2018, primarily as a result of an increase in purchases net of proceeds, of fixed-maturityshort-term investments available for sale, partially offset by an increase in proceeds, net of purchases, from equity securities.fixed-maturity investments available for sale.
Financing Activities. Net cash provided byused in financing activities increased for the three months ended March 31, 2018,2019, as compared to net cash usedprovided in financing activities during the same period in 2017.2018. For the three months ended March 31, 20182019, our primary financing activities included an increase in secured borrowings, partially offset by an increase in the purchases of our common shares. During the three months ended March 31, 2017, cash used in financing activities primarily related to the settlement of our obligations on the remaining $68 million aggregate principal amount of our Convertible Senior Notes due 2019. These obligations were settled in cash in the amount of $110.1 million during the three months ended March 31, 2017.
See “Item 1. Financial Statements (Unaudited)—Condensed Consolidated Statements of Cash Flows (Unaudited)” for additional information.
Stockholders’ Equity
Stockholders’ equity increased by $52.4$221.4 million from December 31, 20172018 to March 31, 2018.2019. The net increase in stockholders’ equity resulted primarily fromfrom: (i) our net income of $114.5$171.0 million for the three months ended March 31, 2018, partially offset by: (i)2019 and (ii) net unrealized lossesgains on investments of $57.5$78.4 million, and (ii)partially offset by shares repurchased under our share repurchase program.program of $31.8 million, including commissions. See Note 14 of Notes to Unaudited Condensed Consolidated Financial Statements for additional information.
During the first quarterthree months of 2018,2019, Radian’s holding company debt-to-capital ratio decreased to 21.7% at March 31, 2019 from 22.8% at December 31, 2018 and 25.2% at March 31, 2018 from 25.5% at December 31, 2017 and 25.7% at March 31, 2017.2018.
Part I. Item 2. Management'sManagement’s DiscussionandAnalysis of Financial Condition and Results of Operations (Cont'd)(continued)
Ratings
Radian Group, Radian Guaranty and Radian Reinsurance have been assigned the ratings set forth in the chart below. We believe that ratings often are considered by others in assessing our credit strength and the financial strength of our primary mortgage insurance subsidiaries. The following ratings have been independently assigned by third-party statistical rating organizations, are for informational purposes only and are subject to change.
|
| | | |
| | Moody’s(1) | | S&P(2) |
| Radian Group | Ba3Ba2 | | BB+ |
| Radian Guaranty | Baa3Baa2 | | BBB+ |
| Radian Reinsurance | N/A | | BBB+ |
______________________
| |
| (1) | Based on the August 17, 2017October 1, 2018 update, Moody’s outlook for Radian Group and Radian Guaranty currently is Positive.Stable. |
| |
| (2) | Based on the SeptemberOctober 11, 20172018 update, S&P’s outlook for Radian Group, Radian Guaranty and Radian Reinsurance is currently Stable. |
Critical Accounting Policies
As of the filing date of this report, there were no significant changes in our critical accounting policies from those discussed in our 20172018 Form 10-K.10-K, other than described below. See Note 1 of Notes to Unaudited Condensed Consolidated Financial Statements for accounting pronouncements issued but not yet adopted that may impact the Company’s consolidated financial position, earnings, cash flows or disclosures.
Leases
We determine if an arrangement includes a lease at inception. A right of use asset and lease liability is recognized for operating leases and is included in other assets and other liabilities, respectively, in our condensed consolidated balance sheet at March 31, 2019. Right-of-use assets represent our right to use an underlying asset for the lease term and lease liabilities represent our obligation to make lease payments arising from the lease. Operating lease right-of-use assets and liabilities are recognized at the lease commencement date based on the present value of lease payments over the lease term. Right of use assets are recognized net of any payments made or received from the lessor. In determining the net present value of lease payments, we use our incremental borrowing rate based on the information available at the lease commencement date or as of our date of adoption, January 1, 2019.
Lease expense is recognized on a straight-line basis over the expected lease term. For lease agreements entered into after the adoption of this accounting standard that include lease and non-lease components, such components are generally not accounted for separately. For our building leases, as a result of us having elected to adopt the package of practical expedients permitted under the transition guidance, we account for the lease and non-lease components, such as common area maintenance charges, as a single lease component. We have elected the short-term exemption for contracts with lease terms of 12 months or less. Prior period amounts continue to be reported in accordance with our historic accounting under previous lease guidance.
Our lease agreements primarily relate to operating leases for office space we use in our operations. Certain of our leases include renewal options and/or termination options that we did not consider in the determination of the right-of-use asset or the lease liability as we did not consider it reasonably certain that we would exercise such options. Our lease agreements do not contain any variable lease payments, material residual value guarantees or material restrictive covenants. We do not have material sublease agreements. As of March 31, 2019, there were no leases which had not yet commenced but that create significant rights and obligations for us.
Item 3. Quantitative and Qualitative Disclosures About Market Risk.
Market risk represents the potential for loss due to adverse changes in the value of financial instruments as a result of changes in market conditions. Examples of market risk include changes in interest rates, credit spreads, equity prices, and foreign currency exchange rates, and equity prices. We perform sensitivity analyses to determine the effects of market risk exposures on our investment securities by determining the potential loss in future earnings, fair values or cash flows of market-risk-sensitive instruments resulting from one or more selected hypothetical changes in the above mentioned market risks.
Interest-Rate Risk and Credit-Spread Risk
rates. The primary market risks in our investment portfolio are interest-rate risk and credit-spread risk, namely the fair value sensitivity of our fixed income securities to changes in interest rates and credit spreads, respectively. We regularly analyze our exposure to interest-rate risk and credit-spread risk and have determined that the fair value of our investments is materially exposed to changes in both interest rates and credit spreads.
Our sensitivity analysis for interest rates is based on the change in fair value of our fixed income securities, assuming a hypothetical instantaneous and parallel 100-basis point increase or decrease in the U.S. Treasury yield curve, with all other factors remaining constant. We calculate the duration of our fixed income securities, expressed in years, in order to estimate the interest-rate sensitivity of these securities, as shown in the table below.
Credit spread represents the additional yield on a fixed income security, above the risk-free rate, that is paid by an issuer to compensate investors for assuming the creditmarket risk of the issuer and market liquidity of the fixed income security. We manage credit-spread risk on both an entity and group level, across issuer, maturity, sector and asset class. Our sensitivity analysis for credit-spread risk is based on the change in fair value of our fixed income securities, assuming a hypothetical 100-basis point increase or decrease in all credit spreads, with the exception of U.S. Treasury and agency obligations for which we have assumed no change in credit spreads, and assuming all other factors remain constant. Actual shifts in credit spreads generally vary by issuer and security, based on issuer-specific and security-specific factors such as credit quality, maturity, sector and asset class. Within a given asset class, investment grade securities generally exhibit less credit-spread volatility than securities with lower credit ratings. Our investment securities portfolio primarily consists of investment grade securities.
Our sensitivity analyses for interest-rate risk and credit-spread risk provide an indication of our investment portfolio’s sensitivity to shifts in interest rates and credit spreads. However, the timing and magnitude of actual market changes may differ from the hypothetical assumptions used in our sensitivity calculations.
The following table illustrates the sensitivity of our investment portfolio to both interest-rate risk and credit-spread risk:
|
| | | | | | | | | | | | | | | |
| | Short-term and Available for Sale | | Trading |
| ($ in millions) | March 31,
2018 | | December 31,
2017 | | March 31,
2018 | | December 31,
2017 |
Carrying value of fixed income investment portfolio (1) | $ | 4,063.3 |
| | $ | 4,009.8 |
| | $ | 563.4 |
| | $ | 606.4 |
|
Percentage of fixed income investment portfolio compared to total investment portfolio (2) | 86.2 | % | | 85.8 | % | | 12.0 | % | | 13.0 | % |
| Average duration of fixed income portfolio | 4.3 years |
| | 4.4 years |
| | 5.1 years |
| | 5.1 years |
|
| | | | | | | | |
| Interest-rate risk increase/(decrease) in market value | | | | | | | |
| +100 basis points - $ | $ | (165.7 | ) | | $ | (169.8 | ) | | $ | (27.3 | ) | | $ | (29.7 | ) |
+100 basis points - % (3) | (4.1 | )% | | (4.2 | )% | | (4.9 | )% | | (4.9 | )% |
| - 100 basis points - $ | $ | 179.8 |
| | $ | 184.7 |
| | $ | 30.0 |
| | $ | 32.5 |
|
- 100 basis points - % (3) | 4.4 | % | | 4.6 | % | | 5.3 | % | | 5.4 | % |
| | | | | | | | |
| Credit-spread risk increase (decrease) in market value | | | | | | | |
| +100 basis points - $ | $ | (181.2 | ) | | $ | (183.8 | ) | | $ | (27.9 | ) | | $ | (30.4 | ) |
+100 basis points - % (3) | (4.5 | )% | | (4.6 | )% | | (5.0 | )% | | (5.0 | )% |
| - 100 basis points - $ | $ | 155.7 |
| | $ | 148.6 |
| | $ | 23.2 |
| | $ | 24.6 |
|
- 100 basis points - % (3) | 3.8 | % | | 3.7 | % | | 4.1 | % | | 4.1 | % |
______________________
| |
(1) | Total fixed income securities include fixed-maturity investments available for sale, trading securities and short-term investments and exclude reinvested cash collateral held under securities lending agreements. At March 31, 2018, fixed income securities shown above also include $75.9 million invested in certain fixed income exchange-traded funds that are classified as equity securities in our condensed consolidated balance sheets, as well as $39.3 million in fixed income securities loaned under securities lending agreements that are classified as other assets in our condensed consolidated balance sheets. |
| |
(2) | Total investment portfolio comprises total investments per the consolidated balance sheets including securities loaned under securities lending agreements that are classified as other assets in our consolidated balance sheets. |
| |
(3) | Change in value expressed as a percentage of the market value of the related fixed income portfolio. |
The average duration of our total fixed income portfolio was 4.5 years at December 31, 2017, compared to 4.4 yearsexposures at March 31, 2018. To assist us2019 have not materially changed from those identified in setting duration targets for the investment portfolio, we analyze: (i) the interest-rate sensitivities of our liabilities, including prepayment risk associated with premium cash flows and credit losses; (ii) entity specific cash flows under various economic scenarios; (iii) return, volatility and correlation of specific asset classes and the interconnection with our liabilities; and (iv) our current risk appetite.2018 Form 10-K.
Securities Lending Agreements. Radian Guaranty and Radian Reinsurance from time to time enter into certain short-term securities lending agreements with third-party Borrowers for the purpose of increasing the yield on our investment securities portfolio with minimal incremental risk. Market factors, including changes in interest rates, credit spreads and equity prices, may impact the timing or magnitude of cash outflows for the return of cash collateral. For the purpose of illustrating our interest-rate risk and credit-spread risk, we have included our fixed income securities loaned in the sensitivity table above. As of March 31, 2018 and December 31, 2017, the carrying value of these securities was $44.4 million and $28.0 million, respectively.
Under our securities lending agreements, the Borrower generally may return the loaned securities to us at any time, which would require us to return the cash and other collateral within the standard settlement period for the loaned securities on the principal exchange or market in which the securities are traded. We manage this liquidity risk associated with the cash collateral by maintaining the cash collateral in a short-term money-market fund with daily availability.
The credit risk under these programs is reduced by the amounts of collateral received. On a daily basis, the value of the underlying securities that we have loaned to the Borrowers is compared to the value of cash and securities collateral we received from the Borrowers, and additional cash or securities are requested or returned, as applicable. In addition, we are indemnified against counterparty credit risk by the intermediary. We also have the right to request the return of the loaned securities at any time. For additional information on our securities lending agreements, see Note 5 of Notes to Unaudited Condensed Consolidated Financial Statements.
Foreign Exchange Rate Risk
As of March 31, 2018 and December 31, 2017, we did not hold any foreign currency denominated securities in our investment portfolio. Exchange gains and losses on foreign currency transactions from our foreign operation have not been material due to its limited amount of business. Currency risk is further limited because, in general, both the revenues and expenses of our foreign operation are denominated in the same functional currency, based on the country in which the operation occurs.
Equity Market Price
Equity Investments at March 31, 2018. At March 31, 2018, the market value and cost of the equity securities in our investment portfolio were $111.0 million and $112.3 million, respectively. These amounts include market value and cost of fixed income exchange-traded funds of $75.9 million and $76.7 million, respectively, which are subject to interest-rate risk and credit-spread risk consistent with our other fixed income securities. Therefore, these fixed income exchange-traded funds have been included in the table above for purposes of illustrating our sensitivity to these risks.
The remaining $35.1 million and $35.6 million of market value and cost, respectively, of equity securities at March 31, 2018, consists of publicly-traded business development company equity securities and equity-related exchange-traded funds. Due to our limited basis in these investments at March 31, 2018, our exposure to changes in equity market prices is not significant.
Equity Investments at December 31, 2017. At December 31, 2017, the market value and cost of the equity securities in our investment portfolio were $162.8 million and $163.1 million, respectively. These amounts include market value and cost of fixed income exchange-traded funds of $134.0 million and $135.0 million, respectively, which are subject to interest-rate risk and credit-spread risk consistent with our other fixed income securities. Therefore, these fixed income exchange-traded funds have been included in the table above for purposes of illustrating our sensitivity to these risks.
The remaining $28.8 million and $28.1 million of market value and cost, respectively, of equity securities at December 31, 2017, consists of publicly-traded business development company equity securities and equity-related exchange-traded funds. Due to our limited basis in these investments at December 31, 2017, our exposure to changes in equity market prices was not significant.
Item 4. Controls and Procedures.
Evaluation of Disclosure Controls and Procedures
We maintain disclosure controls and procedures designed to provide reasonable assurance that information required to be disclosed in the reports we file or submit under the Exchange Act is recorded, processed, summarized and reported within the time periods specified in the SEC’s rules and forms and that such information is accumulated and communicated to our management, including our Chief Executive Officer and Chief Financial Officer, as appropriate, to allow timely decisions regarding required disclosure.
Our management, including our Chief Executive Officer and Chief Financial Officer, conducted an evaluation of the effectiveness of our disclosure controls and procedures (as defined in RuleRules 13a-15(e) and 15d-15(e) of the Exchange Act) as of March 31, 2018,2019, pursuant to Rule 15d-15(e)15d-15(b) under the Exchange Act. Based upon that evaluation, our Chief Executive Officer and Chief Financial Officer concluded that, as of March 31, 2018,2019, our disclosure controls and procedures were effective to provide reasonable assurance that the information required to be disclosed by us in the reports we file or submit under the Exchange Act is recorded, processed, summarized and reported within the time periods specified in the SEC’s rules and forms.
Changes in Internal Control Over Financial Reporting
During the three-month period ended March 31, 2018,2019, there has been no change in our internal control over financial reporting (as defined in Rule 13a-15(f) of the Exchange Act) that has materially affected, or is reasonably likely to materially affect, our internal control over financial reporting.
PART II—OTHER INFORMATION
Item 1. Legal Proceedings.
We are routinely involved in a number of legal actions and proceedings, including litigation and other disputes arising in the ordinary course of our business.
We are contesting adjustments resulting from the examination by the IRS of our 2000 through 2007 consolidated federal income tax returns. The IRS opposes the recognition of certain tax losses and deductions that were generated through our investment in a portfolio of non-economic REMIC residual interests and has proposed denying the associated tax benefits of these items. We appealed these proposed adjustments to the Internal Revenue Service Office of Appeals and made “qualified deposits” with the U.S. Treasury of $85 million in June 2008 relating to the 2000 through 2004 tax years and $4 million in May 2010 relating to the 2005 through 2007 tax years, in order to avoid the accrual of incremental above-market-rate interest with respect to the proposed adjustments.
We attempted to reach a compromised settlement with the Internal Revenue Service Office of Appeals, but in September 2014 we received Notices of Deficiency covering the 2000 through 2007 tax years that assert unpaid taxes and penalties of $157 million. The Deficiency Amount has not been reduced to reflect our NOL carryback ability. On December 3, 2014, we petitioned the U.S. Tax Court to litigate the Deficiency Amount. On September 1, 2015, we received a notice that the case had been scheduled for trial. However, the parties jointly filed, and the U.S. Tax Court approved, motions for continuance in this matter to postpone the trial date. Also, in February22, 2016, the U.S. Tax Court approved a joint motion to consolidate for trial, briefing and opinion our case with a similar case involving MGIC Investment Corporation.During 2016, we held several meetings with the IRS in an attempt to reach a settlement on the issues presented in our dispute. In October 2017, the parties informed the U.S. Tax Court that they believed they had reached agreement in principle on all issues in the dispute. In November 2017, as required by law, the agreement was reported to the JCT for review.
In April 2018, we were notified that the JCT had no objection to the terms of the agreement and that the IRS is working toward finalizing the settlement, which we now expect to occur within the next several months. While the expected impact of the final settlement will reduce our available holding company liquidity by approximately $35 million, we expect to recognize in the second quarter of 2018 a net positive impact to tax expense of approximately $30 million. This estimated benefit is primarily related to the lower than expected interest accrued on the tax deficiency and the impact of the remeasurement of our deferred taxes, due to the enactment of the TCJA during the fourth quarter of 2017. This amount does not include any potential related benefit from the impact on our state or local uncertain tax positions. However, over the next twelve months, we expect to record a material reduction to these liabilities for unrecognized tax benefits.
We expect to complete the IRS settlement in the coming months. However, if the settlement is not completed, then the ongoing litigation could take several years to resolve and may result in substantial legal expenses. We can provide no assurance regarding the outcome of any such litigation or whether a settlement with the IRS will ultimately be reached. If we are unable to complete the settlement, or the ultimate resolution of this matter produces a result that differs materially from our current expectations, there could be a materially different impact than we currently expect on our effective tax rate, results of operations and cash flows. See Note 9 of Notes to Unaudited Condensed Consolidated Financial Statements for additional information regarding the IRS Matter.
Ocwen Loan Servicing, LLC and Homeward Residential, Inc. (collectively, “Ocwen”) filed a complaint in the U.S. District Court for the Eastern District of Pennsylvania against Radian Guaranty (the “Complaint”) alleging breach of contract and bad faith claims and seeking monetary damages and declaratory relief. Ocwen has also initiated similar legal proceedings against several other mortgage insurers. On December 17, 2016, Ocwen separately filed a parallel arbitration petition against Radian Guaranty before the American Arbitration Association (“AAA”) asserting substantially the same allegations (the “Arbitration”). Ocwen’s filings together listed 9,420 mortgage insurance certificates issued under multiple insurance policies, including pool insurancePool Insurance policies, as subject to the dispute. On June 5, 2017, Ocwen filed an amended complaint and an amended petition (collectively, the “Amended Filings”) with both the court and the AAA, respectively, together listing 8,870 certificates as subject to the dispute. In December 2017 and January 2018, Ocwen and Radian Guaranty filed motions for partial summary judgment on a small number of bellwether certificates selected from the certificates subject to the court proceedings (“Bellwether Certificates”). On February 1, 2018, the trial judge issued an Order and Memorandum decision granting in part and denying in part both parties’ motions for partial summary judgment (subsequently clarified by Orders of March 5 and 29, 2018), and ordering the parties to proceed to trial on certain claims regarding a portion of the Bellwether Certificates. On April 11, 2018, the parties entered into a confidential agreement with respect to all certificates subject to the dispute. The confidential agreement resolved certain categories of claims involved in the dispute and, on April 12, 2018, the parties filed a stipulation of voluntary dismissal of the federal court proceeding and the trial judge issued an Order dismissing all claims and counterclaims subject to the parties’ agreement. Radian Guaranty was not required to make any payment in connection with this confidential agreement. Pursuant to the confidential agreement, the parties: (1) dismissed the federal court proceeding; (2) narrowed the scope of the dispute to Ocwen’s breach of contract claims seeking payment of insurance benefits on approximately 2,500 certificates that Ocwen was previously pursuing through the Amended Filings; and (3) agreed to resolve the remaining dispute through the Arbitration. Radian Guaranty believes that Ocwen’s allegations and claims in the legal proceedings described above are without merit and legally deficient, and plans to defend these claims vigorously. We are not able to estimate a reasonably possible loss, if any, or range of loss in this matter because of the preliminarycurrent stage of the Arbitration.
On August 31, 2018, Nationstar Mortgage LLC d/b/a Mr. Cooper (“Nationstar”) filed a complaint in the U.S. District Court for the Eastern District of Pennsylvania against Radian Guaranty (the “Complaint”) alleging breach of contract, bad faith, unjust enrichment and conversion claims and seeking monetary damages and declaratory relief. The Complaint lists 3,014 mortgage insurance certificates issued under multiple insurance policies as subject to disputes involving insurance coverage decisions. The Complaint further lists 2,231 mortgage insurance certificates issued under multiple insurance policies as subject to disputes involving premium refund requests. Radian Guaranty believes that Nationstar’s allegations and claims in the legal proceedings described above are without merit and legally deficient, and plans to defend these claims vigorously. In December 2018, Radian Guaranty filed a motion to dismiss the Complaint. In March 2019, the trial judge issued an Order granting in part, and denying in part, our motion to dismiss, and dismissed Nationstar’s unjust enrichment and conversion claims. In May 2019, Radian Guaranty filed an answer, with affirmative defenses and counterclaims, in response to the Complaint. We are not able to estimate a reasonably possible loss, if any, or range of loss in this matter because of the preliminary stage of the litigation.
We also are periodically subject to reviews and audits, as well as inquiries, information-gathering requests and investigations. In connection with these matters, from time to time we receive requests and subpoenas seeking information and documents related to aspects of our business. In March 2017, Green River Capital, a subsidiary of Clayton, received a letter from the staff of the SEC stating that it is conducting an investigation captioned, “In the Matter of Certain Single Family Rental Securitizations,” and that it is requesting information from market participants. The letter requested that Green River Capital provide information regarding broker price opinions that Green River Capital provided on properties included in SFR securitization transactions. Green River Capital is cooperating with the SEC.
The legal and regulatory matters discussed above and in our 20172018 Form 10-K could result in adverse judgments, settlements, fines, injunctions, restitutions or other relief that could require significant expenditures or have other effects on our business. Management believes, based on current knowledge and after consultation with counsel, that the outcome of such actions will not have a material adverse effect on our consolidated financial condition. However, the outcome of litigation and other legal and regulatory matters and proceedings is inherently uncertain, and it is possible that one or more of the matters currently pending or threatened could have an unanticipated adverse effect on our liquidity, financial condition or results of operations for any particular period.
Item 1A. Risk Factors.
There have been no material changes to our risk factors from those previously disclosed in our 20172018 Form 10-K.
Item 2. Unregistered Sales of Equity Securities and Use of Proceeds.
Issuance of Unregistered Securities
During the three months ended March 31, 2018,2019, no equity securities of Radian Group were sold that were not registered under the Securities Act.
Issuer Purchases of Equity Securities
The following table provides information about purchases of Radian Group common stock by us (and our affiliated purchasers) during the three months ended March 31, 2018.2019.
| | Issuer Purchases of Equity Securities | | ($ in thousands, except per-share amounts) | | | | | | | | |
| Period | Total Number of Shares Purchased (1) | | Average Price Paid per Share | | Total Number of Shares Purchased as Part of Publicly Announced Plans or Programs (2) | | Approximate Dollar Value of Shares That May Yet Be Purchased Under the Plans or Programs | Total Number of Shares Purchased (1) | | Average Price Paid per Share | | Total Number of Shares Purchased as Part of Publicly Announced Plans or Programs | | Approximate Dollar Value of Shares That May Yet Be Purchased Under the Plans or Programs (2) |
| Share repurchase program | | | | | | | | | | | | | | |
| 1/1/2018 to 1/31/2018 | — |
| | | | — |
| | $ | — |
| |
| 2/1/2018 to 2/28/2018 | — |
| | | | — |
| | $ | — |
| |
| 3/1/2018 to 3/31/2018 | 543,329 |
| | $ | 18.88 |
| | 531,013 |
| | $ | 40,007,485 |
| |
| 1/1/2019 to 1/31/2019 | | 2,460 |
| | $ | 19.23 |
| | — |
| | $ | 100,000 |
|
| 2/1/2019 to 2/28/2019 | | 11,269 |
| | $ | 21.04 |
| | — |
| | $ | 100,000 |
|
| 3/1/2019 to 3/31/2019 | | 1,554,871 |
| | $ | 20.54 |
| | 1,546,674 |
| | $ | 218,249 |
|
| Total | 543,329 |
| | | | 531,013 |
| | $ | 40,007,485 |
| 1,568,600 |
| | | | 1,546,674 |
| |
|
| | | | | | | | | | | | | | | |
______________________
| |
| (1) | Includes 12,31621,926 shares tendered by employees as payment of taxes withheld on the vesting of certain restricted stock awards granted under the Company’s equity compensation plans. |
| |
| (2) | On August 9, 2017,March 20, 2019, Radian Group’s board of directors renewedapproved a $150 million increase in authorization for the Company’s existing share repurchase program that enables itplan, bringing the total authorization to spendrepurchase shares up to $50$250 million, to repurchase its common stock.excluding commissions. Pursuant to this authorization, during the three months ended March 31, 2018,2019, we purchased a total of 531,0131,546,674 shares at an average price of $18.84, which includes$20.54 per share, including commissions. This share repurchase program expires on July 31, 2018.2020. See Note 14 of Notes to Unaudited Condensed Consolidated Financial Statements.Statements for additional details on our share repurchase program. |
Item 6. Exhibits
|
| | |
| Exhibit No. | | Exhibit Name |
| | | |
*123.1 | | |
| | |
| 3.2 | | |
| | | |
| *31 | | |
| | | |
| **32 | | |
| | | |
| *101 | | Pursuant to Rule 405 of Regulation S-T, the following financial information from Radian Group Inc.’s Quarterly Report on Form 10-Q for the quarter ended March 31, 20182019 is formatted in XBRL (eXtensible Business Reporting Language): (i) Condensed Consolidated Balance Sheets as of March 31, 20182019 and December 31, 2017;2018; (ii) Condensed Consolidated Statements of Operations for the three months ended March 31, 20182019 and 2017;2018; (iii) Condensed Consolidated Statements of Comprehensive Income (Loss) for the three months ended March 31, 20182019 and 2017;2018; (iv) Condensed Consolidated Statements of Changes in Common Stockholders’ Equity for the three months ended March 31, 2018,2019 and 2017;2018; (v) Condensed Consolidated Statements of Cash Flows for the three months ended March 31, 2018,2019 and 2017;2018; and (vi) the Notes to Unaudited Condensed Consolidated Financial Statements. |
______________________
+ Management contract, compensatory plan or arrangement.
* Filed herewith.
** Furnished herewith.
SIGNATURES
Pursuant to the requirements of the Securities Exchange Act of 1934, the registrant has duly caused this report to be signed on its behalf by the undersigned thereunto duly authorized.
|
| |
| | Radian Group Inc. |
| | |
May 9, 20188, 2019 | /s/ J. FRANKLIN HALL |
| | J. Franklin Hall |
| | Senior Executive Vice President, Chief Financial Officer |
| | |
| | /s/ CATHERINE M. JACKSONROBERT J. QUIGLEY |
| | Catherine M. JacksonRobert J. Quigley |
| | Senior Vice President, Controller |