UNITED STATES
SECURITIES AND EXCHANGE COMMISSION
Washington, D.C. 20549
_____________________________
FORM 10-Q
_____________________________
(Mark One)
|
| |
x☒ | QUARTERLY REPORT PURSUANT TO SECTION 13 OR 15(d) OF THE SECURITIES EXCHANGE ACT OF 1934 |
For the quarterly period ended September 30, 20182019
OR
|
| |
o☐ | TRANSITION REPORT PURSUANT TO SECTION 13 OR 15(d) OF THE SECURITIES EXCHANGE ACT OF 1934 |
For the transition period from to
Commission File Number 1-11356
Radian Group Inc.Inc.
(Exact name of registrant as specified in its charter)
|
| | | | | | |
| Delaware | | 23-2691170 |
| (State or other jurisdiction of incorporation or organization) | | (I.R.S. Employer Identification No.) |
| | | | | | | |
| 1500 Market Street | , | Philadelphia | , | PA | | 19102 |
| (Address of principal executive offices) | | (Zip Code) |
(215) (215) 231-1000
(Registrant’s telephone number, including area code)
Securities registered pursuant to Section 12(b) of the Act:
|
| | |
| Title of each class | Trading Symbol(s) | Name of each exchange on which registered |
| Common Stock, $0.001 par value per share | RDN | New York Stock Exchange |
Indicate by check mark whether the registrant (1) has filed all reports required to be filed by Section 13 or 15(d) of the Securities Exchange Act of 1934 during the preceding 12 months (or for such shorter period that the registrant was required to file such reports), and (2) has been subject to such filing requirements for the past 90 days. Yes xYes☒ No o☐
Indicate by check mark whether the registrant has submitted electronically every Interactive Data File required to be submitted pursuant to Rule 405 of Regulation S-T (§232.405 of this chapter) during the preceding 12 months (or for such shorter period that the registrant was required to submit such files). Yes xYes☒ No o☐
Indicate by check mark whether the registrant is a large accelerated filer, an accelerated filer, a non-accelerated filer, a smaller reporting company, or an emerging growth company. See the definitions of “large accelerated filer,” “accelerated filer,” “smaller reporting company” and “emerging growth company” in Rule 12b-2 of the Exchange Act.
|
| | | | | | | | | | | | | |
Large accelerated filer x Accelerated Filer | ☒ | | Accelerated filero | ☐ | | Non-accelerated filero | ☐ | | Smaller reporting companyo | ☐ | | Emerging growth companyo | ☐ |
If an emerging growth company, indicate by check mark if the registrant has elected not to use the extended transition period for complying with any new or revised financial accounting standards provided pursuant to Section 13(a) of the Exchange Act. o☐
Indicate by check mark whether the registrant is a shell company (as defined in Rule 12b-2 of the Exchange Act). Yes o☐ No x☒
APPLICABLE ONLY TO CORPORATE ISSUERS:
Indicate the number of shares outstanding of each of the issuer’s classes of common stock, as of the latest practicable date: 213,333,428201,149,388 shares of common stock, $0.001 par value per share, outstanding on November 5, 2018.8, 2019.
|
| | |
| TABLE OF CONTENTS | |
| | | Page Number |
| |
| |
| |
| Item 1. | | |
| | | |
| | | |
| | | |
| | | |
| | | |
| | | |
| | | |
| | | |
| | | |
| | | |
| | | |
| | | |
| | | |
| | | |
| | | |
| | | |
| | | |
| | | |
| | | |
| | | |
| | |
| | | |
| Item 2. | | |
| Item 3. | | |
| Item 4. | | |
| | | |
| |
| Item 1. | | |
| Item 1A. | | |
| Item 2. | | |
| Item 6. | | |
| | | |
| |
GLOSSARY OF ABBREVIATIONS AND ACRONYMS
The following list defines various abbreviations and acronyms used throughout this report, including the Condensed Consolidated Financial Statements, the Notes to Unaudited Condensed Consolidated Financial Statements and Management’s Discussion and Analysis of Financial Condition and Results of Operations. |
| |
| Term | Definition |
| 2014 Master Policy | Radian Guaranty’s master insurance policy, setting forth the terms and conditions of our mortgage insurance coverage, which became effective October 1, 2014 |
| 2016 Single Premium QSR Agreement | Quota share reinsurance agreement entered into with a panel of third-party reinsurance providers in the first quarter of 2016 and subsequently amended in the fourth quarter of 2017 |
2017 Form 10-K | Annual Report on Form 10-K for the year ended December 31, 2017 |
| 2018 Single Premium QSR Agreement | Quota share reinsurance agreement entered into with a panel of third-party reinsurance providers in October 2017 to cede a portion of Single Premium NIW beginning January 1, 2018 |
| ABS | Asset-backed securities |
Alt-AASU | Alternative-A loans, representing loans for whichAccounting Standards Update, issued by the underwriting documentation is generally limited as comparedFASB to fully documented loans (considered a non-prime loan grade)communicate changes to GAAP |
| Available Assets | As defined in the PMIERs, assets primarily including the liquid assets of a mortgage insurer, and reduced by premiums received but not yet earned |
Back-endCFPB | With respect to credit risk transfer programs established by the GSEs, policies written on loans that are already part of an existing GSE portfolio, as contrasted with loans that are to be purchased by the GSEs in the future |
Borrower | With respect to our securities lending agreements, the third-party institutions to which we loan certain securities in our investment portfolio for short periods of timeConsumer Financial Protection Bureau |
| Claim Curtailment | Our legal right, under certain conditions, to reduce the amount of a claim, including due to servicer negligence |
| Claim Denial | Our legal right, under certain conditions, to deny a claim |
| Claim Severity | The total claim amount paid divided by the original coverage amount |
| Clayton | Clayton Holdings LLC, a Delaware domiciled indirect non-insurance subsidiary of Radian Group |
| Clayton Intercompany Note | A $300 million note payable from Radian Mortgage Services Inc. (formerly Clayton Group Holdings Inc.) to Radian Group (with terms consistent with the terms of our Senior Notes due 2019 that were used to fund our purchase of Clayton) |
| CMBS | Commercial mortgage-backed securities |
Convertible Senior Notes due 2017 | Our 3.000% convertible unsecured senior notes due November 2017 ($450 million original principal amount) |
Convertible Senior Notes due 2019 | Our 2.250% convertible unsecured senior notes due March 2019 ($400 million original principal amount) |
| Cures | Loans that were in default as of the beginning of a period and are no longer in default because payments were received such that the loan is no longer 60 or more days past due |
| Default to Claim Rate | The percentage of defaulted loans that are assumed to result in a claim |
| Discrete Item(s) | For tax calculation purposes, certain items that are required to be accounted for in the provision for income taxes as they occur and are not considered components of the estimated annualized effective tax rate for purposes of reporting interim results. Generally, these are items that are: (i) clearly defined (such as changes in tax rate or tax law); (ii) infrequent or unusual in nature; or (iii) gains or losses that are not components of continuing operating income, such as income from discontinued operations or losses reflected as components of other comprehensive income. These items impact the difference between the statutory rate and Radian’s effective tax rate. |
EnTitle DirectDodd-Frank Act | EnTitle Direct Group, Inc., a wholly-owned subsidiary of Radian GroupDodd-Frank Wall Street Reform and Consumer Protection Act, as amended |
EnTitle InsuranceEagle Re 2018-1 | EnTitle Insurance Company,Eagle Re 2018-1 Ltd., an unaffiliated special purpose reinsurer (a VIE) domiciled in Bermuda |
| Eagle Re 2019-1 | Eagle Re 2019-1 Ltd., an unaffiliated special purpose reinsurer (a VIE) domiciled in Bermuda |
| Eagle Re Issuer(s) | Eagle Re 2018-1 Ltd. and Eagle Re 2019-1 Ltd. |
| Excess-of-Loss Program | The credit risk protection obtained by Radian Guaranty in the form of excess-of-loss reinsurance, which indemnifies the ceding company against loss in excess of a wholly-owned subsidiaryspecific agreed limit, up to a specified sum. The program includes reinsurance agreements with Eagle Re 2018-1 and Eagle Re 2019-1, in connection with the issuance by the Eagle Re Issuers of EnTitle Directmortgage insurance-linked notes in November 2018 and April 2019, respectively. The program also includes a separate agreement with a third-party reinsurer, representing a pro rata share of the credit risk alongside the risk assumed by Eagle Re 2018-1. |
| Exchange Act | Securities Exchange Act of 1934, as amended |
Extraordinary Dividend | A dividend distribution required to be approved by an insurance company’s primary regulator that is greater than would be permitted as an ordinary dividend which does not require regulatory approval |
Fannie Mae | Federal National Mortgage Association |
FASB | Financial Accounting Standards Board |
|
| |
| Term | Definition |
| Extraordinary Distribution | A dividend or distribution of capital that is required to be approved by an insurance company’s primary regulator that is greater than would be permitted as an ordinary distribution (which does not require regulatory approval) |
| Fannie Mae | Federal National Mortgage Association |
| FASB | Financial Accounting Standards Board |
| FEMA | Federal Emergency Management Agency, an agency of the U.S. Department of Homeland Security |
FEMA Designated Area | Generally, an area that has been subject to a disaster, designated by FEMA as an individual assistance disaster area for the purpose of determining eligibility for various forms of federal assistance |
| FHA | Federal Housing Administration |
| FHFA | Federal Housing Finance Agency |
| FHLB | Federal Home Loan Bank of Pittsburgh |
| FICO | Fair Isaac Corporation (“FICO”) credit scores, for Radian’s portfolio statistics, represent the borrower’s credit score at origination and, in circumstances where there is more than one borrower,are multiple borrowers, the lowest of the borrowers’ FICO score for the primary borrowerscores is utilized |
Flow BasisFive Bridges | With respect to mortgage insurance, includes mortgage insurance policies that are written on an individual loan basis as each loan is originated or on an aggregated basis (in which each individual loanFive Bridges Advisors, LLC. Radian acquired the assets of Five Bridges in a group of loans is insured in a single transaction, typically shortly after the loans have been originated). Among other items, Flow Basis business excludes Pool Insurance, which we originated prior to 2009.December 2018 |
| Foreclosure Stage Default | The Stagestage of Default indicating that thedefault of a loan in which a foreclosure sale has been scheduled or held |
| Freddie Mac | Federal Home Loan Mortgage Corporation |
Freddie Mac Agreement | The Master Transaction Agreement between Radian Guaranty and Freddie Mac entered into in August 2013 |
Front-end | With respect to credit risk transfer programs established by the GSEs, policies written on loans that are to be purchased by the GSEs in the future, as contrasted with loans that are already part of an existing GSE portfolio |
| GAAP | AccountingGenerally accepted accounting principles generally accepted in the U.S., as amended from time to time |
Green River Capital | Green River Capital LLC, a wholly-owned subsidiary of Clayton |
GSEsGSE(s) | Government-Sponsored Enterprises (Fannie Mae and Freddie Mac) |
| HARP | Home Affordable Refinance Program. See “Item 1. Business—Regulation—Federal Regulation—Homeowner Assistance Programs” in our 2017 Form 10-K for more information. Program |
| IBNR | Losses incurred but not reported |
| IIF | Insurance in force, equal to the aggregate unpaid principal balances of the underlying loans |
| IRC | Internal Revenue Code of 1986, as amended |
| IRS | Internal Revenue Service |
| IRS Matter | Our dispute with the IRS that we settled and fully resolved in the second quarter of 2018 that was related to the assessed tax liabilities, penalties and interest from the IRS’s examination of our 2000 through 2007 consolidated federal income tax returns. See Note 9 of Notes to Unaudited Condensed Consolidated Financial Statements for more information. |
| LAE | Loss adjustment expenses, which include the cost of investigating and adjusting losses and paying claims |
| Loss Mitigation Activity/Activities | Activities such as Rescissions, Claim Denials, Claim Curtailments and cancellations |
| LTV | Loan-to-value ratio, calculated as the percentage of the original loan amount to the original value of the property |
| Master Policies | The Prior Master Policy and the 2014 Master Policy, collectivelytogether |
| Minimum Required Assets | A risk-based minimum required asset amount, as defined in the PMIERs, calculated based on net RIF (RIF, net of credits permitted for reinsurance) and a variety of measures related to expected credit performance and other factors |
Model Act | Mortgage Guaranty Insurers Model Act, as issued by the NAIC to establish minimum capital and surplus requirements for mortgage insurers |
| Monthly and Other Recurring Premiums (or Recurring Premium Policies) | Insurance premiums or policies, respectively, where premiums are paid on a monthly or other installment basis, in contrast to Single Premium Policies |
Monthly Premium Policies | Insurance policies where premiums are paid on a monthly installment basis |
| Moody’s | Moody’s Investors Service |
|
| |
Term | Definition |
| Mortgage Insurance | Radian’s Mortgage InsuranceRadian's mortgage insurance and risk services business segment, which provides credit-related insurance coverage, principally through private mortgage insurance on residential first-lien mortgage loans, as well as other credit risk management solutions to mortgage lending institutions and mortgage credit investors |
| MPP Requirement | Certain states’ statutory or regulatory risk-based capital requirement that the mortgage insurer must maintain a minimum policyholder position, which is calculated based on both risk and surplus levels |
NAIC | National Association of Insurance Commissioners |
| NIW | New insurance written |
|
| |
| Term | Definition |
| NOL | Net operating loss; for tax purposes, accumulated during years a company reported more tax deductions than taxable income. NOLs may be carried back or carried forward a certain number of years, depending on each jurisdiction, when the NOL occurs and the type of legal entity, thus reducingvarious factors which can reduce a company’s tax liability |
OCI | Other comprehensive income (loss)liability. |
| Persistency Rate | The percentage of insurance in forceIIF that remains in force over a period of time |
| PMIERs | Private Mortgage Insurer Eligibility Requirements effective on December 31, 2015, issued by the GSEs under oversight of the FHFA to set forth requirements an approved insurer must meet and maintain to provide mortgage guaranty insurance on loans acquired by the GSEs |
| PMIERs 1.0 | The original PMIERs effective on December 31, 2015 |
| PMIERs 2.0 | RevisedThe revised PMIERs issued by the GSEs on September 27, 2018, which will becomebecame effective on March 31, 2019 |
| Pool Insurance | Pool Insurance differs from primary insurance in that our maximum liability is not limited to a specific coverage percentage on an individual mortgage loan. Instead, an aggregate exposure limit, or “stop loss,” is applied to the initial aggregate loan balance on a group or “pool” of mortgagesmortgages. |
| Prior Master Policy | Radian Guaranty’s master insurance policy, setting forth the terms and conditions of our mortgage insurance coverage, which was in effect prior to the effective date of itsthe 2014 Master Policy |
| QM | A mortgage that possesses certain low-risk characteristics that enable it to qualify for lender protection under the ability to repay rule instituted by the Dodd-Frank Act |
| QSR Program | The quota share reinsurance agreements entered into with a third-party reinsurance provider in the second and fourth quarters of 2012, collectively |
| Radian | Radian Group Inc. together with its consolidated subsidiaries |
| Radian Group | Radian Group Inc. |
| Radian Guaranty | Radian Guaranty Inc., a Pennsylvania domiciled insurance subsidiary of Radian Group |
| Radian Reinsurance | Radian Reinsurance Inc., a Pennsylvania domiciled insurance subsidiary of Radian Group |
| Radian Title Insurance | Radian Title Insurance Inc., formerly known as EnTitle Insurance, an Ohio domiciled insurance subsidiary of Radian Group |
| RBC States | Risk-based capital states, which are those states that currently impose a statutory or regulatory risk-based capital requirement |
Red Bell | Red Bell Real Estate, LLC, a wholly-owned subsidiary of Clayton |
| Reinstatements | Reversals of previous Rescissions, Claim Denials and Claim Curtailments |
REMIC | Real Estate Mortgage Investment Conduit |
REO | Real estate owned |
| Rescission | Our legal right, under certain conditions, to unilaterally rescind coverage on our mortgage insurance policies if we determine that a loan did not qualify for insurance |
| RIF | Risk in force; for primary insurance, RIF is equal to the underlying loan unpaid principal balance multiplied by the insurance coverage percentage, whereas for Pool Insurance, it represents the remaining exposure under the agreements |
| Risk-to-capital | Under certain state regulations, a minimummaximum ratio of statutory capitalnet RIF calculated relative to the level of net RIFstatutory capital |
| RMBS | Residential mortgage-backed securities |
| S&P | Standard & Poor’s Financial Services LLC |
| SAPP | Statutory accounting principles and practices, includeincluding those required or permitted, if applicable, by the insurance departments of the respective states of domicile of our insurance subsidiaries |
| SEC | United States Securities and Exchange Commission |
|
| |
Term | Definition |
Senior Notes due 2017 | Our 9.000% unsecured senior notes due June 2017 ($195.5 million original principal amount, of which the remaining outstanding principal was redeemed in August 2016) |
| Senior Notes due 2019 | Our 5.500% unsecured senior notes due June 2019 ($300 million original principal amount) |
| Senior Notes due 2020 | Our 5.250% unsecured senior notes due June 2020 ($350 million original principal amount) |
| Senior Notes due 2021 | Our 7.000% unsecured senior notes due March 2021 ($350 million original principal amount) |
| Senior Notes due 2024 | Our 4.500% unsecured senior notes due October 2024 ($450 million original principal amount) |
|
| |
| Term | Definition |
| Senior Notes due 2027 | Our 4.875% unsecured senior notes due March 2027 ($450 million original principal amount) |
| Services | Radian’s ServicesRadian's mortgage, real estate and title services business segment, which is primarily a fee-for-service business that offers a broad array of both mortgage, and real estate and title services to market participants across the mortgage and real estate value chain |
Single Premium NIW (or IIF) | New insurance written or insurance in force, respectively, on Single Premium Policies |
Single Premium Policy/Policy / Policies | Insurance policies where premiums are paid in a single payment, which includes policies written on an individual basis (as each loan is originated) and on an aggregated basis (in which each individual loan in a group of loans is insured in a single transaction, typically shortly after the loans have been originated) |
| Single Premium QSR Program | The 2016 Single Premium QSR Agreement and the 2018 Single Premium QSR Agreement, collectively |
Stage of Default | The stage a loan is in relative to the foreclosure process, based on whether a foreclosure sale has been scheduled or heldtogether |
| Statutory RBC Requirement | Risk-based capital requirement imposed by the RBC States, requiring a minimum surplus level and, in certain states, a minimum ratio of statutory capital relative to the level of risk |
| Surplus Note | An intercompany 0.000% surplus note issued by Radian Guaranty to Radian Group |
TCJA | H.R. 1, known as the Tax Cuts and Jobs Act, signed into law on December 22, 2017 |
Time in Default | The time period from the point a loan reaches default status (based on the month the default occurred) to the current reporting date |
| U.S. | The United States of America |
| U.S. Treasury | United States Department of the Treasury |
| VA | U.S. Department of Veterans Affairs |
ValuAmericaVIE | ValuAmerica, Inc., a wholly-owned subsidiary of ClaytonVariable interest entity |
Cautionary Note Regarding Forward-Looking Statements—Safe Harbor Provisions
All statements in this report that address events, developments or results that we expect or anticipate may occur in the future are “forward-looking statements” within the meaning of Section 27A of the Securities Act of 1933, Section 21E of the Exchange Act and the U.S. Private Securities Litigation Reform Act of 1995. In most cases, forward-looking statements may be identified by words such as “anticipate,” “may,” “will,” “could,” “should,” “would,” “expect,” “intend,” “plan,” “goal,” “contemplate,” “believe,” “estimate,” “predict,” “project,” “potential,” “continue,” “seek,” “strategy,” “future,” “likely” or the negative or other variations on these words and other similar expressions. These statements, which may include, without limitation, projections regarding our future performance and financial condition, are made on the basis of management’s current views and assumptions with respect to future events. Any forward-looking statement is not a guarantee of future performance and actual results could differ materially from those contained in the forward-looking statement. These statements speak only as of the date they were made, and we undertake no obligation to update or revise any forward-looking statements, whether as a result of new information, future events or otherwise. We operate in a changing environment where new risks emerge from time to time and it is not possible for us to predict all risks that may affect us. The forward-looking statements, as well as our prospects as a whole, are subject to risks and uncertainties that could cause actual results to differ materially from those set forth in the forward-looking statements. These risks and uncertainties include, without limitation:
changes in economic and political conditions that impact the size of the insurable market, the credit performance of our insured portfolio, and our business prospects;
changes in the way customers, investors, ratings agencies, regulators or legislators perceive our performance, financial strength and future prospects;
Radian Guaranty’s ability to remain eligible under the PMIERs and other applicable requirements imposed by the FHFA and by the GSEs to insure loans purchased by the GSEs;GSEs, including potential future changes to the PMIERs which, among other things, may be impacted by the general economic environment and housing market, as well as the proposed Conservatorship Capital Framework (“CCF”) that would establish capital requirements for the GSEs, if the CCF is finalized;
our ability to successfully execute and implement our capital plans, including plans for expanding our risk distribution strategy through the capital markets and reinsurance markets, and to maintain sufficient holding company liquidity to meet our short- and long-term liquidity needs;
our ability to successfully execute and implement our business plans and strategies, including plans and strategies to reposition our Services segment as well as plans and strategies that require GSE and/or regulatory approvals and licenses;
our ability to maintain an adequate level of capital in our insurance subsidiaries to satisfy existing and future state regulatory requirements;
changes in the charters or business practices of, or rules or regulations imposed by or applicable to, the GSEs, which may include changes in the requirements to remain an approved insurer to the GSEs, the GSEs’ interpretation and application of the PMIERs, as well as potential future changes to the PMIERs requirements which, among other things, may be impactedimpacting loans purchased by the general economic environmentGSEs, such as whether GSE eligible loans meet the QM loan requirements under applicable law, requirements regarding mortgage credit and housing market, as well asloan size and the proposed Conservator Capital Framework (“CCF”) that would establish capital requirements for the GSEs, if the CCF is finalized;GSEs’ pricing;
changes in the current housing finance system in the U.S., including the role of the FHA, the GSEs and private mortgage insurers in this system;
any disruption in the servicing of mortgages covered by our insurance policies, as well as poor servicer performance;
a significant decrease in the Persistency Rates of our mortgage insurance on monthly premium products;
competition in our mortgage insurance business, including price competition and competition from the FHA and VA as well as from other forms of credit enhancement;enhancement, including GSE sponsored alternatives to traditional mortgage insurance;
the effect of the Dodd-Frank Wall Street Reform and Consumer Protection Act on the financial services industry in general, and on our businesses in particular;particular, including future changes to the QM loan requirements, which currently are subject to an Advanced Notice of Proposed Rulemaking issued by the CFPB;
legislative and regulatory activity (or inactivity), including the adoption of (or failure to adopt) new laws and regulations, or changes in existing laws and regulations, or the way they are interpreted or applied, including interpretations and guidance pertaining to recently enacted tax reform legislation;applied;
legal and regulatory claims, assertions, actions, reviews, audits, inquiries and investigations that could result in adverse judgments, settlements, fines, injunctions, restitutions or other relief that could require significant expenditures, new or increased reserves or have other effects on our business;
the amount and timing of potential settlements, payments or adjustments associated with federal or other tax examinations;
the amount and timing of potential settlements, payments or adjustments associated with federal or other tax examinations;
the possibility that we may fail to estimate accurately the likelihood, magnitude and timing of losses in establishing loss reserves for our mortgage insurance business or to accurately calculate and/or project our Available Assets and Minimum Required Assets under the PMIERs, including PMIERs 2.0, which will be impacted by, among other things, the size and mix of our IIF, the level of defaults in our portfolio, the level of cash flow generated by our insurance operations and our risk distribution strategies;
volatility in our financial results of operations caused by changes in the fair value of our assets and liabilities, including a significant portion of our investment portfolio;
potential future impairment charges related to our goodwill and other acquired intangible assets, and uncertainties regarding our ability to execute our restructuring plans within expected costs;assets;
changes in GAAP or SAPP rules and guidance, or their interpretation;
our ability to attract and retain key employees; and
legal and other limitations on dividends and other amounts we may receive from our subsidiaries.subsidiaries, including dividends or ordinary course distributions under our internal tax- and expense-sharing arrangements.
For more information regarding these risks and uncertainties as well as certain additional risks that we face, you should refer to the Risk Factors detailed in Item 1A of our 2017Annual Report on Form 10-K for the year ended December 31, 2018, and to subsequent reports and registration statements filed from time to time with the SEC. We caution you not to place undue reliance on these forward-looking statements, which are current only as of the date on which we issued this report. We do not intend to, and we disclaim any duty or obligation to, update or revise any forward-looking statements to reflect new information or future events or for any other reason.
PART I—FINANCIAL INFORMATION
Item 1. Financial Statements (Unaudited)
Radian Group Inc.
CONDENSED CONSOLIDATED BALANCE SHEETS (UNAUDITED) | | | ($ in thousands, except per-share amounts) | September 30,
2018 | | December 31,
2017 | September 30,
2019 | | December 31,
2018 |
| | | | | | | |
| Assets | | | | | | |
| Investments (Note 5) | | | | | | |
| Fixed-maturities available for sale—at fair value (amortized cost $3,838,823 and $3,426,217) | $ | 3,763,710 |
| | $ | 3,458,719 |
| |
| Trading securities—at fair value | 493,956 |
| | 606,401 |
| |
| Equity securities—at fair value (at December 31, 2017, classified as available for sale with related cost of $163,106) | 121,865 |
| | 162,830 |
| |
| Short-term investments—at fair value (includes $31,799 and $19,357 of reinvested cash collateral held under securities lending agreements) | 645,119 |
| | 415,658 |
| |
| Other invested assets—at fair value (amortized cost at December 31, 2017) | 3,585 |
| | 334 |
| |
| Fixed-maturities available for sale—at fair value (amortized cost $4,369,273 and $4,098,962) | | $ | 4,527,223 |
| | $ | 4,021,575 |
|
| Trading securities—at fair value (amortized cost of $307,891 and $468,696) | | 329,935 |
| | 469,071 |
|
| Equity securities—at fair value (cost of $119,408 and $139,377) | | 121,759 |
| | 130,565 |
|
| Short-term investments—at fair value (includes $34,767 and $11,699 of reinvested cash collateral held under securities lending agreements) | | 552,095 |
| | 528,403 |
|
| Other invested assets—at fair value | | 2,712 |
| | 3,415 |
|
| Total investments | 5,028,235 |
| | 4,643,942 |
| 5,533,724 |
| | 5,153,029 |
|
| Cash | 104,413 |
| | 80,569 |
| 49,393 |
| | 95,393 |
|
| Restricted cash | 9,925 |
| | 15,675 |
| 2,853 |
| | 11,609 |
|
| Accounts and notes receivable | 108,003 |
| | 72,558 |
| 144,113 |
| | 78,652 |
|
| Deferred income taxes, net (Note 9) | 134,201 |
| | 229,567 |
| — |
| | 131,643 |
|
| Goodwill and other acquired intangible assets, net (Note 6) | 55,707 |
| | 64,212 |
| 52,533 |
| | 58,998 |
|
| Prepaid reinsurance premium | 413,728 |
| | 386,509 |
| 374,339 |
| | 417,628 |
|
| Other assets (Note 8) | 415,272 |
| | 407,849 |
| 513,647 |
| | 367,700 |
|
| Total assets | $ | 6,269,484 |
| | $ | 5,900,881 |
| $ | 6,670,602 |
| | $ | 6,314,652 |
|
| | | | | | | |
| Liabilities and Stockholders’ Equity | | | | | | |
| Unearned premiums | $ | 747,921 |
| | $ | 723,938 |
| $ | 647,856 |
| | $ | 739,357 |
|
| Reserve for losses and loss adjustment expense (“LAE”) (Note 10) | 412,460 |
| | 507,588 |
| |
| Reserve for losses and loss adjustment expense (Note 10) | | 398,141 |
| | 401,361 |
|
| Senior notes (Note 11) | 1,029,511 |
| | 1,027,074 |
| 886,643 |
| | 1,030,348 |
|
| FHLB advances (Note 11) | | 104,492 |
| | 82,532 |
|
| Reinsurance funds withheld | 352,952 |
| | 288,398 |
| 352,532 |
| | 321,212 |
|
| Other liabilities (Note 12) | 379,362 |
| | 353,845 |
| |
| Other liabilities | | 358,431 |
| | 251,127 |
|
| Total liabilities | 2,922,206 |
| | 2,900,843 |
| 2,748,095 |
| | 2,825,937 |
|
| Commitments and contingencies (Note 13) |
| |
| |
| Commitments and contingencies (Note 12) | |
| |
|
| Stockholders’ equity | | | | | | |
| Common stock: par value $0.001 per share; 485,000,000 shares authorized at September 30, 2018 and December 31, 2017; 230,978,401 and 233,416,989 shares issued at September 30, 2018 and December 31, 2017, respectively; 213,333,428 and 215,814,188 shares outstanding at September 30, 2018 and December 31, 2017, respectively | 231 |
| | 233 |
| |
| Treasury stock, at cost: 17,644,973 and 17,602,801 shares at September 30, 2018 and December 31, 2017, respectively | (894,635 | ) | | (893,888 | ) | |
| Common stock: par value $0.001 per share; 485,000 shares authorized at September 30, 2019 and December 31, 2018; 220,174 and 231,132 shares issued at September 30, 2019 and December 31, 2018, respectively; 202,219 and 213,473 shares outstanding at September 30, 2019 and December 31, 2018, respectively | | 220 |
| | 231 |
|
| Treasury stock, at cost: 17,955 and 17,660 shares at September 30, 2019 and December 31, 2018, respectively | | (901,556 | ) | | (894,870 | ) |
| Additional paid-in capital | 2,720,626 |
| | 2,754,275 |
| 2,469,097 |
| | 2,724,733 |
|
| Retained earnings | 1,580,296 |
| | 1,116,333 |
| 2,229,107 |
| | 1,719,541 |
|
| Accumulated other comprehensive income (loss) (Note 15) | (59,240 | ) | | 23,085 |
| |
| Accumulated other comprehensive income (loss) (Note 14) | | 125,639 |
| | (60,920 | ) |
| Total stockholders’ equity | 3,347,278 |
| | 3,000,038 |
| 3,922,507 |
| | 3,488,715 |
|
| Total liabilities and stockholders’ equity | $ | 6,269,484 |
| | $ | 5,900,881 |
| $ | 6,670,602 |
| | $ | 6,314,652 |
|
See Notes to Unaudited Condensed Consolidated Financial Statements.
Radian Group Inc.
CONDENSED CONSOLIDATED STATEMENTS OF OPERATIONS (UNAUDITED)
| | | | Three Months Ended
September 30, |
| Nine Months Ended
September 30, | Three Months Ended
September 30, | | Nine Months Ended
September 30, |
| (In thousands, except per-share amounts) | 2018 |
| 2017 |
| 2018 |
| 2017 | 2019 | | 2018 | | 2019 |
| 2018 |
| Revenues: | | | | | | | | | | | | | | |
| Net premiums earned—insurance | $ | 258,431 |
| | $ | 236,702 |
|
| $ | 752,325 |
|
| $ | 687,598 |
| $ | 281,185 |
| | $ | 258,431 |
| | $ | 843,863 |
|
| $ | 752,325 |
|
| Services revenue | 36,566 |
| | 39,571 |
|
| 106,558 |
|
| 115,400 |
| 42,509 |
| | 36,566 |
| | 114,565 |
|
| 106,558 |
|
| Net investment income | 38,995 |
| | 32,540 |
| | 110,424 |
| | 93,643 |
| 42,756 |
| | 38,995 |
| | 130,364 |
| | 110,424 |
|
| Net gains (losses) on investments and other financial instruments | (4,480 | ) | | 2,480 |
| | (30,771 | ) | | 4,960 |
| 13,009 |
| | (4,480 | ) | | 47,462 |
| | (30,771 | ) |
| Other income | 1,174 |
| | 760 |
| | 2,997 |
| | 2,118 |
| 879 |
| | 1,174 |
| | 2,677 |
| | 2,997 |
|
| Total revenues | 330,686 |
| | 312,053 |
| | 941,533 |
| | 903,719 |
| 380,338 |
| | 330,686 |
| | 1,138,931 |
| | 941,533 |
|
| Expenses: | | | | | | | | | | | | | | |
| Provision for losses | 20,881 |
| | 35,841 |
| | 77,501 |
| | 99,976 |
| 29,231 |
| | 20,881 |
| | 97,412 |
| | 77,501 |
|
| Policy acquisition costs | 5,667 |
| | 5,554 |
| | 18,780 |
| | 18,406 |
| 6,435 |
| | 5,667 |
| | 18,531 |
| | 18,780 |
|
| Cost of services | 25,854 |
| | 27,240 |
| | 73,185 |
| | 81,250 |
| 29,044 |
| | 25,854 |
| | 81,046 |
| | 73,185 |
|
| Other operating expenses | 70,125 |
| | 64,195 |
| | 203,552 |
| | 201,322 |
| 76,384 |
| | 70,125 |
| | 225,235 |
| | 203,552 |
|
| Restructuring and other exit costs (Note 1) | 4,464 |
| | 12,038 |
| | 5,940 |
| | 12,038 |
| |
| Restructuring and other exit costs | | — |
| | 4,464 |
| | — |
| | 5,940 |
|
| Interest expense | 15,535 |
| | 15,715 |
|
| 45,906 |
| | 47,832 |
| 13,492 |
| | 15,535 |
| | 44,150 |
| | 45,906 |
|
| Loss on induced conversion and debt extinguishment | — |
| | 45,766 |
| | — |
| | 51,469 |
| |
| Impairment of goodwill (Note 6) | — |
| | — |
| | — |
| | 184,374 |
| |
| Loss on extinguishment of debt | | 5,940 |
| | — |
| | 22,738 |
| | — |
|
| Amortization and impairment of other acquired intangible assets | 3,472 |
| | 2,890 |
|
| 8,968 |
|
| 25,042 |
| 2,139 |
| | 3,472 |
| | 6,465 |
|
| 8,968 |
|
| Total expenses | 145,998 |
| | 209,239 |
| | 433,832 |
| | 721,709 |
| 162,665 |
| | 145,998 |
| | 495,577 |
| | 433,832 |
|
| Pretax income | 184,688 |
|
| 102,814 |
|
| 507,701 |
|
| 182,010 |
| 217,673 |
| | 184,688 |
| | 643,354 |
|
| 507,701 |
|
| Income tax provision | 41,891 |
| | 37,672 |
|
| 41,469 |
| | 67,738 |
| 44,235 |
| | 41,891 |
| | 132,229 |
| | 41,469 |
|
| Net income | $ | 142,797 |
|
| $ | 65,142 |
|
| $ | 466,232 |
|
| $ | 114,272 |
| $ | 173,438 |
| | $ | 142,797 |
| | $ | 511,125 |
|
| $ | 466,232 |
|
| | | | | | | | | | | | | | | |
| Net income per share: | | | | | | | | | | | | | | |
| Basic | $ | 0.67 |
| | $ | 0.30 |
| | $ | 2.17 |
| | $ | 0.53 |
| $ | 0.85 |
| | $ | 0.67 |
| | $ | 2.45 |
| | $ | 2.17 |
|
| Diluted | $ | 0.66 |
| | $ | 0.30 |
| | $ | 2.13 |
| | $ | 0.52 |
| $ | 0.83 |
| | $ | 0.66 |
| | $ | 2.39 |
| | $ | 2.13 |
|
| | | | | | | |
|
| | | | | | |
|
|
| Weighted-average number of common shares outstanding—basic | 213,309 |
| | 215,279 |
| | 214,499 |
| | 215,194 |
| 203,107 |
| | 213,309 |
| | 208,561 |
| | 214,499 |
|
| Weighted-average number of common and common equivalent shares outstanding—diluted | 217,902 |
| | 219,391 |
| | 218,783 |
| | 220,230 |
| 208,691 |
| | 217,902 |
| | 213,963 |
| | 218,783 |
|
See Notes to Unaudited Condensed Consolidated Financial Statements.
Radian Group Inc.
CONDENSED CONSOLIDATED STATEMENTS OF COMPREHENSIVE INCOME (LOSS) (UNAUDITED)
|
| | | | | | | | | | | | | | | |
| | Three Months Ended
September 30, | | Nine Months Ended
September 30, |
| (In thousands) | 2018 | | 2017 | | 2018 | | 2017 |
| | | | | | | | |
| Net income | $ | 142,797 |
| | $ | 65,142 |
| | $ | 466,232 |
| | $ | 114,272 |
|
| Other comprehensive income, net of tax (Note 15): | | | | | | | |
| Unrealized gains (losses) on investments: | | | | | | | |
| Unrealized holding gains (losses) arising during the period | (5,341 | ) | | 6,239 |
| | (93,788 | ) | | 33,845 |
|
| Less: Reclassification adjustment for net gains (losses) included in net income | (4,044 | ) | | 111 |
| | (8,512 | ) | | (2,687 | ) |
| Net unrealized gains (losses) on investments | (1,297 | ) | | 6,128 |
| | (85,276 | ) | | 36,532 |
|
| Unrealized foreign currency translation adjustments | — |
| | 28 |
| | 3 |
| | 136 |
|
| Other comprehensive income (loss), net of tax | (1,297 | ) | | 6,156 |
| | (85,273 | ) | | 36,668 |
|
| Comprehensive income | $ | 141,500 |
| | $ | 71,298 |
| | $ | 380,959 |
| | $ | 150,940 |
|
|
| | | | | | | | | | | | | | | |
| | Three Months Ended
September 30, | | Nine Months Ended
September 30, |
| (In thousands) | 2019 | | 2018 | | 2019 | | 2018 |
| | | | | | | | |
| Net income | $ | 173,438 |
| | $ | 142,797 |
| | $ | 511,125 |
| | $ | 466,232 |
|
| Other comprehensive income (loss), net of tax (Note 14): | | | | | | | |
| Unrealized gains (losses) on investments: | | | | | | | |
| Unrealized holding gains (losses) arising during the period | 40,654 |
| | (5,341 | ) | | 190,677 |
| | (93,788 | ) |
| Less: Reclassification adjustment for net gains (losses) included in net income | 3,477 |
| | (4,044 | ) | | 4,115 |
| | (8,512 | ) |
| Net unrealized gains (losses) on investments | 37,177 |
| | (1,297 | ) | | 186,562 |
| | (85,276 | ) |
| Net foreign currency translation adjustments | — |
| | — |
| | (3 | ) | | 3 |
|
| Other comprehensive income (loss), net of tax | 37,177 |
| | (1,297 | ) | | 186,559 |
| | (85,273 | ) |
| Comprehensive income | $ | 210,615 |
| | $ | 141,500 |
| | $ | 697,684 |
| | $ | 380,959 |
|
See Notes to Unaudited Condensed Consolidated Financial Statements.
Radian Group Inc.
CONDENSED CONSOLIDATED STATEMENTS OF CHANGES IN COMMON STOCKHOLDERS’ EQUITY (UNAUDITED)
| | | | Nine Months Ended September 30, | Three Months Ended
September 30, | | Nine Months Ended
September 30, |
| (In thousands) | 2018 | | 2017 | 2019 | | 2018 | | 2019 | | 2018 |
| Common Stock | | | | | | | | | | |
| Balance, beginning of period | $ | 233 |
| | $ | 232 |
| $ | 223 |
| | $ | 231 |
| | $ | 231 |
| | $ | 233 |
|
| Issuance of common stock under incentive and benefit plans | 1 |
| | 1 |
| — |
| | — |
| | 1 |
| | 1 |
|
| Shares repurchased under share repurchase program (Note 14) | (3 | ) | | — |
| |
| Shares repurchased under share repurchase program (Note 13) | | (3 | ) | | — |
| | (12 | ) | | (3 | ) |
| Balance, end of period | 231 |
| | 233 |
| 220 |
| | 231 |
| | 220 |
| | 231 |
|
| | | | | | | | | | | |
| Treasury Stock | | | | | | | | | | |
| Balance, beginning of period | (893,888 | ) | | (893,332 | ) | (901,419 | ) | | (894,610 | ) | | (894,870 | ) | | (893,888 | ) |
| Repurchases of common stock under incentive plans | (747 | ) | | (422 | ) | (137 | ) | | (25 | ) | | (6,686 | ) | | (747 | ) |
| Balance, end of period | (894,635 | ) | | (893,754 | ) | (901,556 | ) | | (894,635 | ) | | (901,556 | ) | | (894,635 | ) |
| | | | | | | | | | | |
| Additional Paid-in Capital | | | | | | | | | | |
| Balance, beginning of period | 2,754,275 |
| | 2,779,891 |
| 2,539,803 |
| | 2,715,426 |
| | 2,724,733 |
| | 2,754,275 |
|
| Issuance of common stock under incentive and benefit plans | 2,593 |
| | 4,761 |
| 1,660 |
| | 1,014 |
| | 4,418 |
| | 2,593 |
|
| Share-based compensation | 13,808 |
| | 10,290 |
| 5,169 |
| | 4,186 |
| | 15,119 |
| | 13,808 |
|
| Impact of extinguishment of convertible senior notes | — |
| | (52,408 | ) | |
| Cumulative effect of adopting the accounting standard update for share-based payment transactions | — |
| | 756 |
| |
| Termination of capped calls | — |
| | 4,109 |
| |
| Shares repurchased under share repurchase program (Note 14) | (50,050 | ) | | (6 | ) | |
| Shares repurchased under share repurchase program (Note 13) | | (77,535 | ) | | — |
| | (275,173 | ) | | (50,050 | ) |
| Balance, end of period | 2,720,626 |
| | 2,747,393 |
| 2,469,097 |
| | 2,720,626 |
| | 2,469,097 |
| | 2,720,626 |
|
| | | | | | | | | | | |
| Retained Earnings | | | | | | | | | | |
| Balance, beginning of period | 1,116,333 |
| | 997,890 |
| 2,056,175 |
| | 1,438,032 |
| | 1,719,541 |
| | 1,116,333 |
|
| Cumulative effect of adopting accounting standard updates | | — |
| | — |
| | — |
| | (663 | ) |
| Net income | 466,232 |
| | 114,272 |
| 173,438 |
| | 142,797 |
| | 511,125 |
| | 466,232 |
|
| Dividends declared | (1,606 | ) | | (1,614 | ) | (506 | ) | | (533 | ) | | (1,559 | ) | | (1,606 | ) |
| Cumulative effect of adopting the accounting standard update for financial instruments | 2,061 |
| | — |
| |
| Cumulative effect of adopting the accounting standard update for the reclassification of certain tax effects from accumulated other comprehensive income | (2,724 | ) | | — |
| |
| Cumulative effect of adopting the accounting standard update for share-based payment transactions, net of tax | — |
| | (491 | ) | |
| Balance, end of period | 1,580,296 |
| | 1,110,057 |
| 2,229,107 |
| | 1,580,296 |
| | 2,229,107 |
| | 1,580,296 |
|
| | | | | | | | | | | |
| Accumulated Other Comprehensive Income (Loss) | | | | | | | | | | |
| Balance, beginning of period | 23,085 |
| | (12,395 | ) | 88,462 |
| | (57,943 | ) | | (60,920 | ) | | 23,085 |
|
| Cumulative effect of adopting the accounting standard update for financial instruments | 224 |
| | — |
| |
| Cumulative effect of adopting the accounting standard update for the reclassification of certain tax effects from accumulated other comprehensive income | 2,724 |
| | — |
| |
| Cumulative effect of adopting accounting standard updates | | — |
| | — |
| | — |
| | 2,948 |
|
| Net unrealized gains (losses) on investments, net of tax | (85,276 | ) | | 36,532 |
| 37,177 |
| | (1,297 | ) | | 186,562 |
| | (85,276 | ) |
| Net foreign currency translation adjustment, net of tax | 3 |
| | 136 |
| — |
| | — |
| | (3 | ) | | 3 |
|
| Balance, end of period | (59,240 | ) | | 24,273 |
| 125,639 |
| | (59,240 | ) | | 125,639 |
| | (59,240 | ) |
| | | | | | | | | | | |
| Total Stockholders’ Equity | $ | 3,347,278 |
| | $ | 2,988,202 |
| $ | 3,922,507 |
| | $ | 3,347,278 |
| | $ | 3,922,507 |
| | $ | 3,347,278 |
|
See Notes to Unaudited Condensed Consolidated Financial Statements.
| | Radian Group Inc. | CONDENSED CONSOLIDATED STATEMENTS OF CASH FLOWS (UNAUDITED) | | | | | | | | |
| (In thousands) | Nine Months Ended
September 30, | Nine Months Ended
September 30, |
| 2018 | | 2017 | 2019 | | 2018 |
| Cash flows from operating activities: | | | | | | |
| Net cash provided by (used in) operating activities | $ | 491,929 |
| | $ | 218,425 |
| $ | 506,805 |
| | $ | 491,929 |
|
| Cash flows from investing activities: | | | | | | |
| Proceeds from sales of: | | | | | | |
| Fixed-maturity investments available for sale | 577,034 |
| | 737,054 |
| |
| Fixed-maturities available for sale | | 770,393 |
| | 577,034 |
|
| Trading securities | 35,182 |
| | 176,448 |
| 120,875 |
| | 35,182 |
|
| Equity securities | 92,702 |
| | 23,423 |
| 52,295 |
| | 92,702 |
|
| Proceeds from redemptions of: | | | | | | |
| Fixed-maturity investments available for sale | 337,857 |
| | 377,219 |
| |
| Fixed-maturities available for sale | | 287,557 |
| | 337,857 |
|
| Trading securities | 53,437 |
| | 70,161 |
| 36,827 |
| | 53,437 |
|
| Purchases of: | | | | | | |
| Fixed-maturity investments available for sale | (1,307,335 | ) | | (1,491,083 | ) | |
| Fixed-maturities available for sale | | (1,352,883 | ) | | (1,307,335 | ) |
| Equity securities | (59,625 | ) | | (195,297 | ) | (45,748 | ) | | (59,625 | ) |
| Sales, redemptions and (purchases) of: | | | | | | |
| Short-term investments, net | (216,778 | ) | | 251,509 |
| (12,199 | ) | | (216,778 | ) |
| Other assets and other invested assets, net | 2,111 |
| | 596 |
| 687 |
| | 2,111 |
|
| Purchases of property and equipment, net | (20,323 | ) | | (25,173 | ) | (20,707 | ) | | (20,323 | ) |
| Acquisitions, net of cash acquired | (662 | ) | | (86 | ) | — |
| | (662 | ) |
| Net cash provided by (used in) investing activities | (506,400 | ) | | (75,229 | ) | (162,903 | ) | | (506,400 | ) |
| Cash flows from financing activities: | | | | | | |
| Dividends paid | (1,606 | ) | | (1,614 | ) | (1,559 | ) | | (1,606 | ) |
| Issuance of senior notes, net | — |
| | 443,250 |
| 442,498 |
| | — |
|
| Purchases and redemptions of senior notes | — |
| | (591,918 | ) | |
| Proceeds from termination of capped calls | — |
| | 4,109 |
| |
| Repayments and repurchases of senior notes | | (610,739 | ) | | — |
|
| Issuance of common stock | 1,128 |
| | 3,283 |
| 2,126 |
| | 1,128 |
|
| Purchase of common shares | (50,053 | ) | | (6 | ) | |
| Repurchases of common shares | | (275,185 | ) | | (50,053 | ) |
| Credit facility commitment fees paid | (643 | ) | | — |
| (710 | ) | | (643 | ) |
| Change in secured borrowings (Note 12) | 41,414 |
| | 36,782 |
| |
| Change in secured borrowings, net (with terms less than 3 months) | | 9,568 |
| | 41,414 |
|
| Proceeds from secured borrowings (with terms greater than 3 months) | 45,458 |
| | — |
| 73,011 |
| | 45,458 |
|
| Payments of secured borrowings (with terms greater than 3 months) | (3,000 | ) | | — |
| |
| Repayment of other borrowings | (133 | ) | | (207 | ) | |
| Repayments of secured borrowings (with terms greater than 3 months) | | (37,550 | ) | | (3,000 | ) |
| Repayments of other borrowings | | (114 | ) | | (133 | ) |
| Net cash provided by (used in) financing activities | 32,565 |
| | (106,321 | ) | (398,654 | ) | | 32,565 |
|
| Effect of exchange rate changes on cash and restricted cash | — |
| | 116 |
| (4 | ) | | — |
|
| Increase (decrease) in cash and restricted cash | 18,094 |
| | 36,991 |
| (54,756 | ) | | 18,094 |
|
| Cash and restricted cash, beginning of period | 96,244 |
| | 61,814 |
| 107,002 |
| | 96,244 |
|
| Cash and restricted cash, end of period | $ | 114,338 |
| | $ | 98,805 |
| $ | 52,246 |
| | $ | 114,338 |
|
See Notes to Unaudited Condensed Consolidated Financial Statements.
Radian Group Inc.
Notes to Unaudited Condensed Consolidated Financial Statements
1. Condensed Consolidated Financial Statements—Business Overview Recent Developments and Significant Accounting Policies
Business Overview
We are a diversified mortgage and real estate services business, providing both credit-related insurance coverage and other credit risk management solutions, as well as a broad array of mortgage, and real estate and title services. We have two2 reportable business segments—Mortgage Insurance and Services.
Mortgage Insurance
Our Mortgage Insurance segment provides credit-related insurance coverage, principally through private mortgage insurance on residential first-lien mortgage loans, as well as other credit risk management solutions, to mortgage lending institutions and mortgage credit investors. We provide our mortgage insurance products and services mainly through our wholly-owned subsidiary, Radian Guaranty. Private mortgage insurance plays an important role in the U.S. housing finance system because it promotes affordable home ownership and helps protect mortgage lenders, investors and other beneficiaries by mitigating default-related losses on residential mortgage loans. Generally, these loans are made to home buyershomebuyers who make down payments of less than 20% of the purchase price for their home or, in the case of refinancings, have less than 20% equity in their homes.home. Private mortgage insurance also facilitates the sale of these low down payment loans in the secondary mortgage market, most of which are currently sold to the GSEs. Our total direct primary mortgage insuranceIIF and RIF was $55.6were $237.2 billion and $60.4 billion, respectively, as of September 30, 2018.
The GSEs and state insurance regulators impose various capital and financial requirements on our insurance subsidiaries. These include Risk-to-capital, other risk-based capital measures and surplus requirements, as well as the PMIERs financial requirements discussed below. Failure to comply with these capital and financial requirements may limit the amount of insurance that our insurance subsidiaries may write or prohibit our insurance subsidiaries from writing insurance altogether. The GSEs and state insurance regulators also possess significant discretion with respect to our insurance subsidiaries and all aspects of their businesses. See Note 16 for additional regulatory information.
PMIERs. In order to be eligible to insure loans purchased by the GSEs, mortgage insurers such as Radian Guaranty must meet the GSEs’ eligibility requirements, or PMIERs. At September 30, 2018, Radian Guaranty is an approved mortgage insurer under the PMIERs and is in compliance with the PMIERs financial requirements.
The PMIERs are comprehensive, covering virtually all aspects of the business and operations of a private mortgage insurer, including internal risk management and quality controls, the relationship between the GSEs and the approved insurer as well as the approved insurer’s financial condition. In addition, the GSEs have a broad range of consent rights under the PMIERs, and require private mortgage insurers to obtain the prior consent of the GSEs before taking certain actions, which may include paying dividends, entering into various intercompany agreements, and commuting or reinsuring risk, among others. If Radian Guaranty is unable to satisfy the requirements set forth in the PMIERs, the GSEs could restrict it from conducting certain types of business with them or take actions that may include not purchasing loans insured by Radian Guaranty.
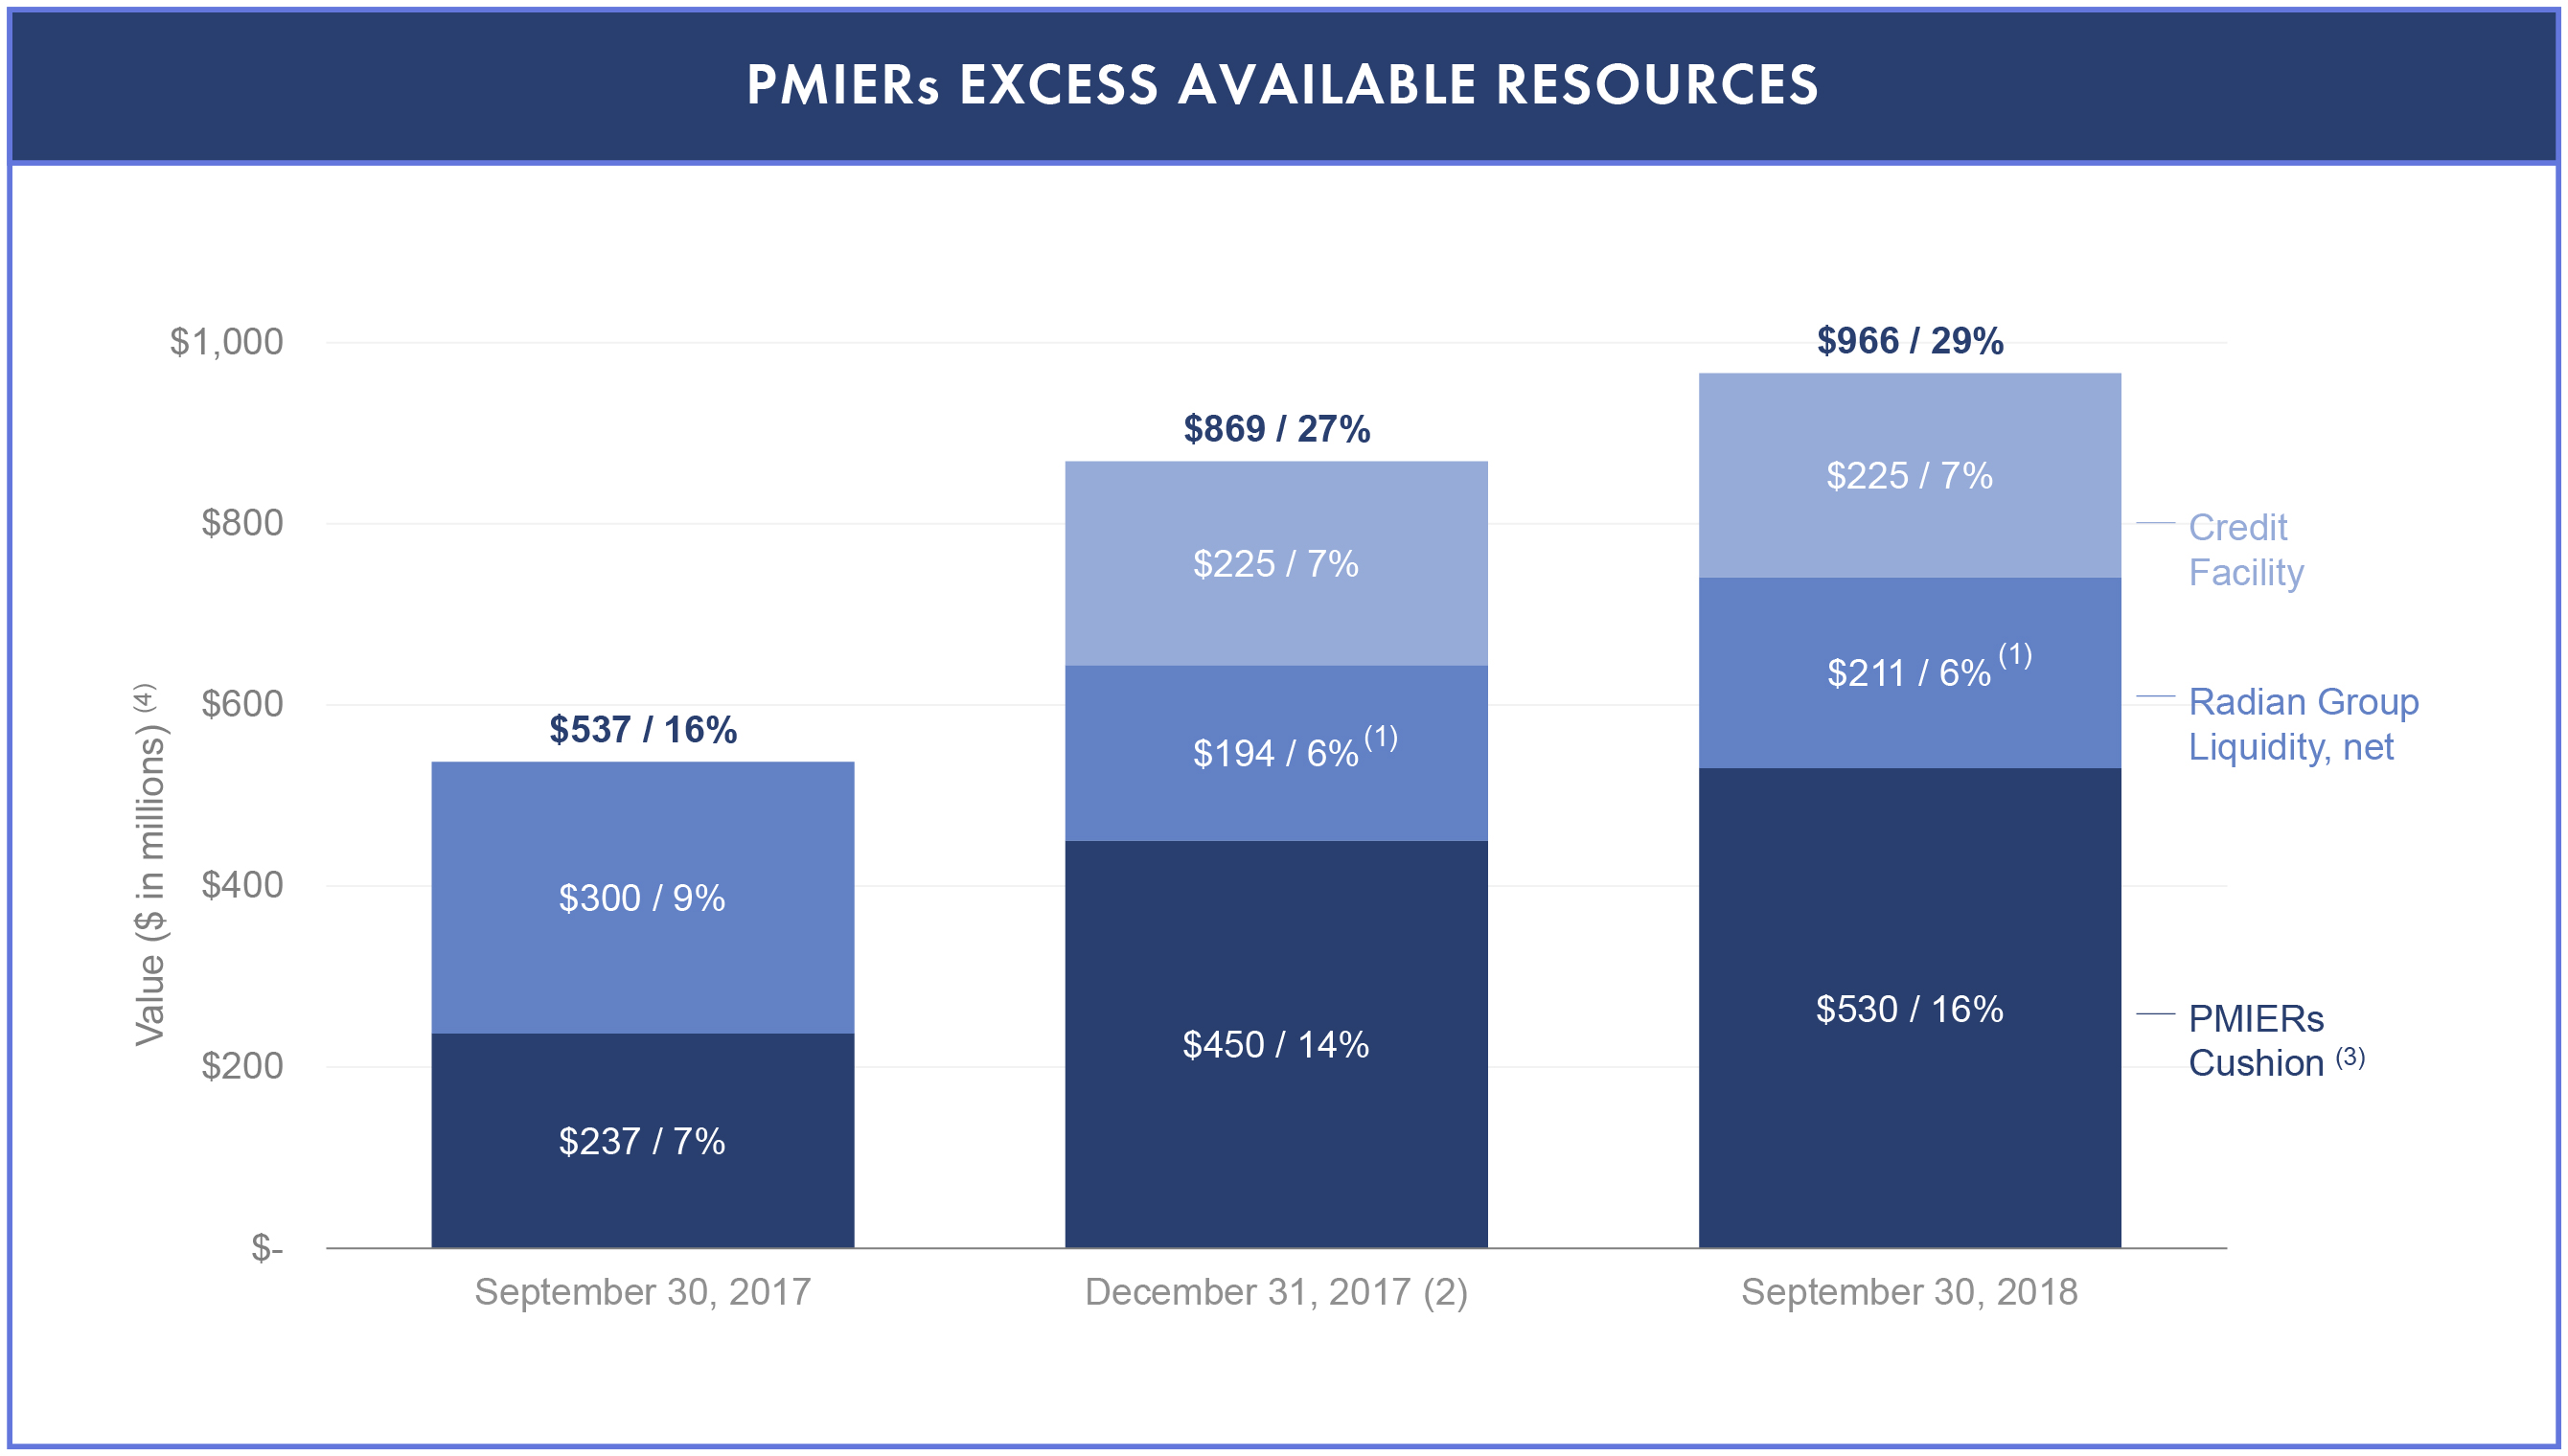
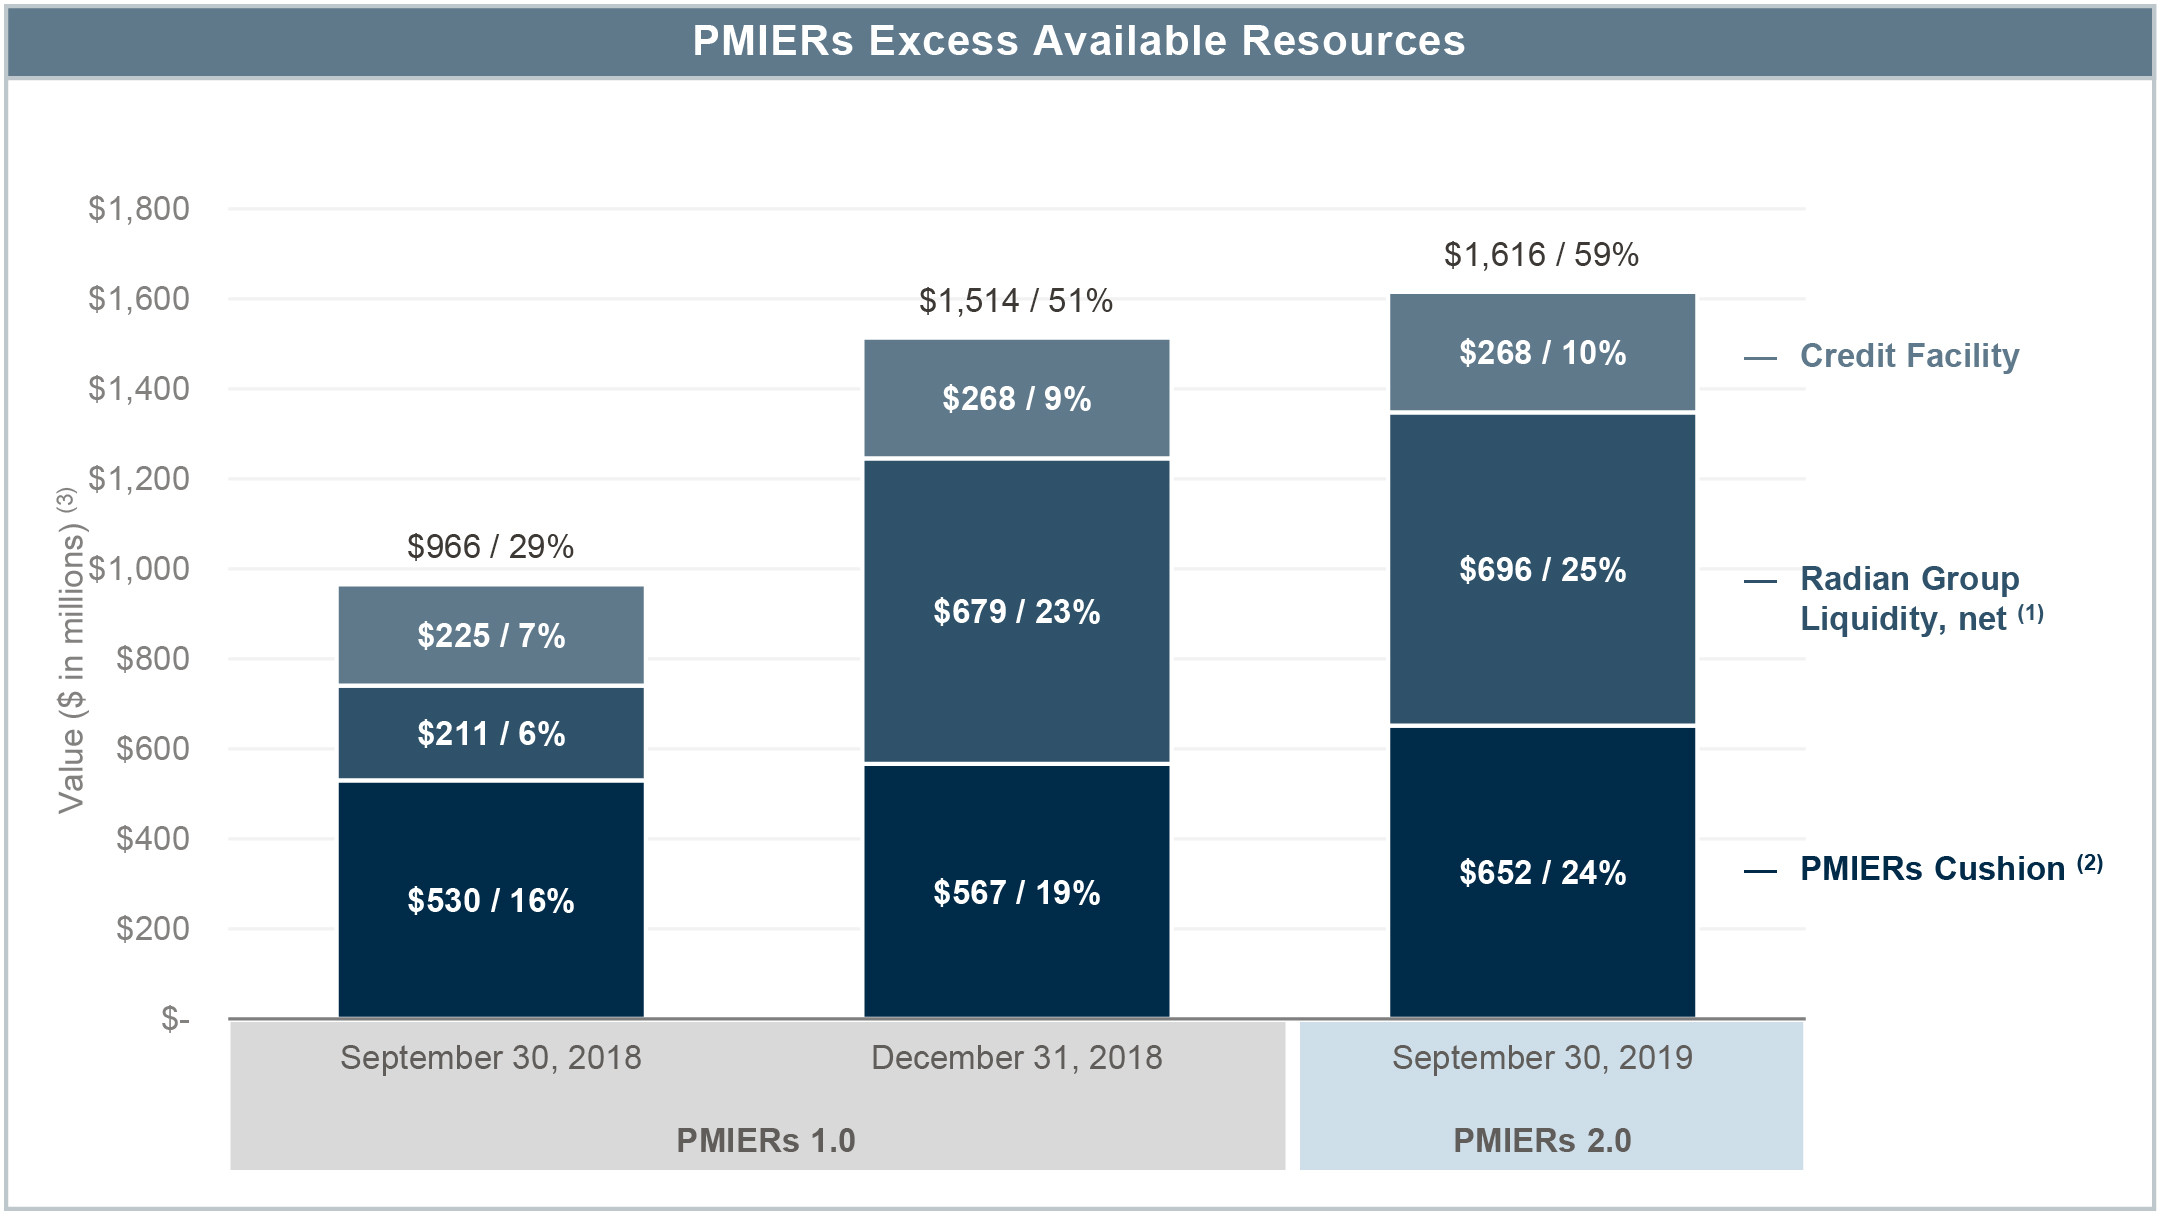
The PMIERs financial requirements require that a mortgage insurer’s Available Assets meet or exceed its Minimum Required Assets. The GSEs may amend the PMIERs at any time, and they have broad discretion to interpret the requirements, which could impact the calculation of Radian Guaranty’s Available Assets and/or Minimum Required Assets. On September 27, 2018, the GSEs issued PMIERs 2.0, which will become effective on March 31, 2019. Radian expects that it will be able to fully comply with PMIERs 2.0 and maintain an excess of Available Assets over Minimum Required Assets as of the effective date.
Services
Our Services segment is primarily a fee-for-service business that offers a broad array of services to market participants across the mortgage and real estate value chain. These services comprise mortgage services, real estate services and title services, including technology-basedtechnology and turn-key solutions, that provide information and other resources and services used to originate, evaluate, acquire, securitize, service and monitor residential real estate and loans secured by residential real estate. We provide theseThese services are primarily provided to among others, mortgage lenders, financial institutions, mortgage and real estate investors and government entities.
Our In addition, we provide title insurance to mortgage services include transaction management services such as loan review, RMBS securitization and distressed asset reviews, servicer and loan surveillance and underwriting. We offer a comprehensive suite of real estate services that includes software solutions and platforms,lenders as well as digitally delivered services, including: REO asset management; review
Radian Group Inc.
Notesdirectly to Unaudited Condensed Consolidated Financial Statements — (Continued)
and valuation services related to single family rental properties; real estate valuation services and real estate brokerage services. Our title services include title search, title insurance, settlement and closing services.
2018 Developments
Capital and Liquidity Actions. On August 9, 2017, Radian Group’s board of directors authorized the Company to repurchase up to $50 million of its common stock. The Company completed this program during the first half of 2018 by purchasing 3,022,856 shares at an average price of $16.56 per share, including commissions.
On August 16, 2018, Radian Group’s board of directors approved a new share repurchase program that authorizes the Company to repurchase up to $100 million of its common stock in the open market or in privately negotiated transactions until expiration of the program on July 31, 2019. As of September 30, 2018, the full purchase authority of up to $100 million remained available under this program. See Note 14 for additional information.
Restructuring and Other Exit Costs. As a result of the Company’s continued implementation of its 2017 plan to restructure the Services business, in the three months ended September 30, 2018, pretax restructuring charges of $0.9 million were recognized, which include: (i) $0.4 million in cash expenses and (ii) $0.5 million of asset impairment charges. For the nine months ended September 30, 2018, pretax restructuring charges of $2.4 million were recognized, including: (i) $1.9 million of cash expenses; (ii) $0.6 million asset impairment charges; and (iii) an adjustment to the previously recognized loss related to the sale of our EuroRisk business. We expect to incur additional pretax charges of approximately $0.2 million under this restructuring plan, all of which represent cash payments. These remaining charges are expected to be recognized by December 31, 2018. Total estimated restructuring charges for 2018 of approximately $2.6 million are expected to consist of: (i) asset impairment charges of approximately $0.5 million; (ii) employee severance and benefit costs of approximately $0.8 million; and (iii) facility and lease termination costs of approximately $1.3 million. See Notes 1 and 7 of Notes to Consolidated Financial Statements in our 2017 Form 10-K for additional information, including the events that led to the restructuring plan.
We review assets for impairment in accordance with the accounting guidance for long-lived assets. As part of this assessment, during the three months ended September 30, 2018, we incurred $3.6 million of other exit costs associated with impairment of internal-use software that was in addition to the asset impairment charges recognized as part of the restructuring charges associated with our services business.
IRS Matter. Radian finalized a settlement with the IRS which resolved the issues and concluded all disputes related to the IRS Matter. In the three-month period ended June 30, 2018, we recorded tax benefits of $73.6 million, which includes both the impact of the settlement with the IRS as well as the reversal of certain previously accrued state and local tax liabilities. Under the terms of the settlement, Radian will submit to the IRS approximately $31 million of its $89 million “qualified deposits” with the U.S. Treasury, and the remaining balance will be returned to Radian. See Note 9 for additional information.borrowers.
Significant Accounting Policies
Basis of Presentation
Our condensed consolidated financial statements are prepared in accordance with GAAP and include the accounts of Radian Group Inc. and its subsidiaries. All intercompany accounts and transactions, and intercompany profits and losses, have been eliminated. We have condensed or omitted certain information and footnote disclosures normally included in consolidated financial statements prepared in accordance with GAAP pursuant to the instructions set forth in Article 10 of Regulation S-X of the SEC.
We refer to Radian Group Inc. together with its consolidated subsidiaries as “Radian,” the “Company,” “we,” “us” or “our,” unless the context requires otherwise. We generally refer to Radian Group Inc. alone, without its consolidated subsidiaries, as “Radian Group.” Unless otherwise defined in this report, certain terms and acronyms used throughout this report are defined in the Glossary of Abbreviations and Acronyms included as part of this report.
The financial information presented for interim periods is unaudited; however, such information reflects all adjustments that are, in the opinion of management, necessary for the fair statement of the financial position, results of operations, comprehensive income and cash flows for the interim periods presented. Such adjustments are of a normal recurring nature. The year-end condensed balance sheet data was derived from our audited financial statements, but does not include all disclosures required by GAAP. These
To fully understand the basis of presentation, these interim financial statements and related notes contained herein should be read in conjunction with the audited financial statements and notes thereto included in our 20172018 Form 10-K. The results of operations for interim periods are not necessarily indicative of results to be expected for the full year or for any other period. Certain prior period amounts have been reclassified to conform to current period presentation.
Radian Group Inc.
Notes to Unaudited Condensed Consolidated Financial Statements — (Continued)
Use of Estimates
The preparation of financial statements in conformity with GAAP requires us to make estimates and assumptions that affect the reported amounts of assets and liabilities and disclosure of our contingent assets and liabilities at the dates of the financial statements, as well as the reported amounts of revenues and expenses during the reporting periods. While the amounts
Radian Group Inc.
Notes to Unaudited Condensed Consolidated Financial Statements (Continued)
included in our condensed consolidated financial statements include our best estimates and assumptions, actual results may vary materially.
Other Significant Accounting Policies
See Note 2 of Notes to Consolidated Financial Statements in our 20172018 Form 10-K for information regarding other significant accounting policies. There have been no significant changes in our significant accounting policies from those discussed in our 20172018 Form 10-K, other than described below including in ““——Revenue Recognition” and “—Recent Accounting Pronouncements—Accounting Standards Adopted During 2018.2019.”
Revenue Recognition
The FASB issued an update to the accounting standard regarding revenue recognition, Revenue from Contracts with Customers, which establishes principles for reporting information about the nature, amount, timing and uncertainty of revenue and cash flows arising from our contracts with customers to provide services. We adopted this update effective January 1, 2018, using the modified retrospective approach. The principle of this update requires an entity to recognize revenue representing the transfer of services to customers in an amount that reflects the consideration that it expects to be entitled to receive in exchange for those services, recognized as the performance obligations are satisfied.
The majority of our revenue-generating transactions are not subject to the new standard as this update did not change revenue recognition principles related to our investments and insurance products, which together represented the majority of our total revenue for the nine months ending September 30, 2018 and are subject to other GAAP guidance discussed elsewhere within our disclosures. This update is primarily applicable to revenues from our Services segment. See “—Business Overview—Services” for information about the services we offer.
The table below represents the disaggregation of Services revenues by revenue type:
|
| | | | | | | | | | | | | | | |
| | Three Months Ended
September 30, | | Nine Months Ended
September 30, |
| (In thousands) | 2018 | | 2017 | | 2018 | | 2017 |
| Services segment revenue | | | | | | | |
| Mortgage Services | $ | 14,663 |
| | $ | 17,005 |
| | $ | 44,998 |
| | $ | 53,158 |
|
| Real Estate Services | 20,920 |
| | 17,386 |
| | 58,124 |
| | 49,863 |
|
| Title Services | 2,198 |
| | 6,671 |
| | 6,933 |
| | 18,105 |
|
Total (1) | $ | 37,781 |
| | $ | 41,062 |
| | $ | 110,055 |
| | $ | 121,126 |
|
______________________
| |
(1) | Includes inter-segment revenues of $0.8 million and $2.7 million for the three and nine months ended September 30, 2018 and $1.5 million and $5.7 million for the three and nine months ended September 30, 2017, respectively. For the three and nine months ended September 30, 2018, amounts exclude $3.1 million and $5.5 million, respectively, of Services segment net premiums earned—insurance and net investment income, as both are excluded from the scope of the revenue recognition standard. See Note 3 for segment information.
|
Radian Group Inc.
Notes to Unaudited Condensed Consolidated Financial Statements — (Continued)
Our Services segment revenues are recognized over time and measured each period based on the progress to date as services are performed and made available to customers. Our contracts with customers, including payment terms, are generally short-term in nature; therefore, any impact related to timing is immaterial. Revenue recognized related to services made available to customers and billed is reflected in accounts receivables. Revenue recognized related to services performed and not yet billed is recorded in unbilled receivables and reflected in other assets. We have no material bad-debt expense. The following represents balances related to Services contracts as of the dates indicated:
|
| | | | | | | |
| (In thousands) | September 30, 2018 | | December 31, 2017 |
| Accounts Receivable - Services Contracts | $ | 12,544 |
| | $ | 17,391 |
|
| Unbilled Receivables - Services Contracts | 19,580 |
| | 22,257 |
|
| Deferred Revenues - Services Contracts | 4,131 |
| | 3,235 |
|
Revenue expected to be recognized in any future period related to remaining performance obligations, such as contracts where revenue is recognized as invoiced and contracts with variable consideration related to undelivered performance obligations, is not material.
Fee-for-Service Contracts
Generally, our contracts with our clients do not include minimum volume commitments and can be terminated at any time by our clients. Although some of our contracts and assignments are recurring in nature, and include repetitive monthly assignments, a significant portion of our engagements are transactional in nature and may be performed in connection with securitizations, loan sales, loan purchases or other transactions. Due to the transactional nature of our business, our Services segment revenues may fluctuate from period to period as transactions are commenced or completed. We do not recognize revenue or expense related to amounts advanced by us and subsequently reimbursed by clients for maintenance or repairs because we do not take control of the service prior to the client taking control. We record an expense if an advance is made that is not in accordance with a client contract and the client is not obligated to reimburse us.
Due to the nature of the services provided, our Services arrangements with customers may include any of the following three basic types of contracts:
Fixed-Price Contracts. We use fixed-price contracts in our real estate valuation and component services, our loan review, underwriting and due diligence services as well as our title and closing services. We also use fixed-price contracts in our surveillance business for our servicer oversight services and RMBS surveillance services, and in our asset management business activities. Under fixed-price contracts we agree to perform the specified services and deliverables for a pre-determined per-unit or per-file price or day rate. Each service qualifies as a separate performance obligation and revenue is recognized as the service performed is made available to the client.
Time-and-Expense Contracts. The Services segment also derives a portion of its revenue from professional service activities under time-and-expense contracts. In these types of contracts, we are paid a fixed hourly rate, and we are reimbursed for billable out-of-pocket expenses as work is performed. These contracts are used in our loan review, underwriting and due diligence services. Services revenue consisting of billed time fees and pass-through expenses is recorded over time and based on the progress to date as services are performed and made available to customers. Services revenue may also include expenses billed to clients, which includes travel and other out-of-pocket expenses, and other reimbursable expenses.
Percentage-of-Sale Contracts. Under percentage-of-sale contracts, we are paid a contractual percentage of the sale proceeds upon the sale of each property. These contracts are only used for a portion of our REO management services and our real estate brokerage services. In addition, through the use of our proprietary technology, property leads are sent to select clients. Revenue attributable to services provided under a percentage-of-sale contract is recognized over time and measured based on the progress to date and typically coincides with the client’s successful closing on the property. The revenue recognized for these transactions is based on a percentage of the sale.
In certain instances, fees are received at the time that an asset is assigned to Radian for management. These fees are recorded as deferred revenue and are recognized over time based on progress to date and the availability to customers.
Recent Accounting Pronouncements
Accounting Standards Adopted During 2018. 2019.In May 2014, the FASB issued an update to the accounting standard regarding revenue recognition. In July 2015, the FASB delayed the effective date for this updated standard for public companies to interim and annual periods beginning after December 15, 2017, and subsequently issued various clarifying updates. Our
Radian Group Inc.
Notes to Unaudited Condensed Consolidated Financial Statements — (Continued)
adoption of this standard, effective We adopted ASU 2016-02, Leases (“ASU 2016-02”), on January 1, 2018, had no impact on our financial statements. The disclosures required by2019. Most significantly, this update are included above in “—Revenue Recognition.”
In January 2016, the FASB issued an update that makes certain changes to the standard for the accounting of financial instruments. Among other things, the update requires: (i) equity investments to be measured at fair value with changes in fair value recognized in net income; (ii) the use of the exit price notion when measuring the fair value of financial instruments for disclosure purposes; (iii) separate presentation of financial assets and financial liabilities by measurement category and form of financial asset; and (iv) separate presentation in other comprehensive income of the portion of the total change in the fair value ofrequires a liability resulting from a change in the instrument-specific credit risk (also referred to as “own credit”) when the organization has elected to measure the liability at fair value in accordance with the fair value option for financial instruments. The update also eliminates the requirement to disclose the methods and significant assumptions used to estimate the fair value that is required to be disclosed for financial instruments measured at amortized cost on the balance sheet. This update is effective for public companies for fiscal years beginning after December 15, 2017, including interim periods within those fiscal years. In February 2018, the FASB issued technical corrections related to this update, which addresses common questions regarding the application and adoption of the new guidance and the subsequent amendments. As a result of adopting these updates, equity securities are no longer classified as available for sale securities and changes in fair value are recognized through earnings. Consequently, we recorded a cumulative effect adjustment to retained earnings from accumulated other comprehensive income representing unrealized losses related to equity securities in the amount of $0.2 million, net of tax. In addition, we elected to utilize net asset value as a practical expedient to measure certain other investments, which resulted in an increase to other invested assets with an offset to retained earnings in the amount of $2.3 million, net of tax. Our adoption of both these updates effective January 1, 2018 resulted in a net increase to retained earnings of $2.1 million. See Notes 4 and 5 for additional information.
In February 2018, the FASB issued an update to the accounting standard regarding income statement reporting of comprehensive income and reclassification of certain tax effects from accumulated other comprehensive income. The amendments in this update allow a reclassification from accumulated other comprehensive income to retained earnings for stranded tax effects resulting from the TCJA. The provisions of this update are effective for fiscal years beginning after December 15, 2018, including interim periods within those fiscal years. Early adoption is permitted, including adoption in an interim period, for reporting periods for which financial statements have not been available for issuance. We elected to early adopt this update effective January 1, 2018. As a result we recorded a reclassification adjustment from other comprehensive income to retained earnings in the amount of $2.7 million. See Note 9 for additional information regarding the TCJA.
Accounting Standards Not Yet Adopted. In February 2016, the FASB issued an update that replaces the existing accounting and disclosure requirements for leases of property, plant and equipment. The update requires lesseeslessee to recognize, as of the lease commencement date, assets and liabilities for all leases with lease terms of more than 12 months, which is a change from the current GAAP requirementliability to recognize only capital leases on the balance sheet. Pursuant to the new standard, the liability initially recognized for the lease obligation is equal to the present value of themake lease payments not yet made, discounted over the lease term at the implicit interest rate of the lease, if available, or otherwise at the lessee’s incremental borrowing rate. The lessee is also required to recognizeand an asset forwith respect to its right to use the underlying asset for the lease term, based on theterm. Upon adoption for contracts in effect as of January 1, 2019, we recorded a lease liability subjectof $73.5 million within other liabilities, and a right-of-use asset of $49.4 million within other assets, corresponding to certain adjustments, such as for initial direct costs. Leases are required to be classified as either operating or finance, with expense on operating leases recorded as a single lease cost on a straight-line basis. For finance leases, interest expense on the lease liability is required to be recognized separately from the straight-line amortizationas adjusted for deferred rent and unamortized allowances and incentives of the right-of-use asset. Quantitative disclosures are required for certain items, including the cost of leases, the weighted-average remaining lease term, the weighted-average discount rate and a maturity analysis of lease liabilities. Additional qualitative disclosures are also required regarding the nature of the leases, such as basis, terms and conditions of: (i) variable interest payments; (ii) extension and termination options; and (iii) residual value guarantees. This update, and the clarifying update issued in July 2018, is effective for public companies for fiscal years beginning after December 15, 2018, including interim periods within those fiscal years. Early adoption is permitted. The new standard must be adopted by applying the new guidance as of the beginning of the earliest comparative period presented, using a modified retrospective transition approach with certain optional practical expedients.$24.1 million. We are currently in the process of identifying our current leases that are subject to the scope of this standard and evaluating the impact on our financial statements and future disclosures as a result of this update. We expect to recognize right-of-use assets and related obligations upon adoption of this update. In July 2018 the FASB issued a further update containing certain targeted improvements to the accounting and disclosure requirements for leases, including an additional (and optional) transition method to recognize the cumulative-effect adjustment as of the beginning of the period of adoption, rather than recognizing the cumulative-effect adjustment as of the beginning of the earliest comparative period presented. We expect to electelected the optional transition method to recognize the cumulative-effect adjustment as of the beginning of the period of adoption. In addition, we expect to electand the practical expedients for transitioning existing leases to the new standard as of the effective
Radian Group Inc.
Notes to Unaudited Condensed Consolidated Financial Statements — (Continued)
date. As a result of applying the practical expedients: (i) we aredid not required to reassess expired or existing contracts to determine if they contain additional leases; (ii) we aredid not required to reassess the lease classification for expired and existing leases; and (iii) we aredid not required to reassess initial direct costs for existing leases. WePrior period amounts continue to be reported in accordance with our historic accounting under previous lease guidance.
With respect to leases entered into subsequent to the adoption of this ASU, we determine if an arrangement includes a lease at inception. If it does, we recognize a right-of-use asset and lease liability in other assets and other liabilities, respectively, in our condensed consolidated balance sheet. Right-of-use assets represent our right to use an underlying asset for the lease term and are currently evaluatingrecognized net of any payments made or received from the impactlessor. Lease liabilities represent our obligation to make lease payments arising from the lease and are based on the present value of lease payments over the lease term. In determining the net present value of lease payments, we use our incremental borrowing rate based on the information available at the lease commencement date or as of our date of adoption, January 1, 2019.
Lease expense is recognized on a straight-line basis over the expected lease term. For lease agreements entered into after the adoption of these updatesthis ASU that include lease and non-lease components, such components are generally not accounted for separately. We have elected the short-term exemption for contracts with lease terms of 12 months or less.
Our lease agreements primarily relate to operating leases for office space we use in our operations. Certain of our leases include renewal options and/or termination options that we did not consider in the determination of the right-of-use asset or the lease liability as we did not believe it was reasonably certain that we would exercise such options. Our lease agreements do not contain any variable lease payments, material residual value guarantees or material restrictive covenants. We do not have material sublease agreements. As of September 30, 2019, there were no leases that had not yet commenced but that created significant rights and obligations for us. See Note 12 for more information about our lease agreements.
We adopted ASU 2017-08, Receivables-Nonrefundable Fees and Other Costs, on January 1, 2019. The new standard requires certain premiums on purchased callable debt securities to be amortized to the earliest call date. The amortization period for callable debt securities purchased at a discount will not be impacted. The adoption of this update did not have a material effect on our financial statements and future disclosures. See Note 13 of Notes to Consolidated Financial Statements in our 2017 Form 10-K for additional information about our leases.
Accounting Standards Not Yet Adopted. In June 2016, the FASB issued an updateASU 2016-13, Financial Instruments-Credit Losses, and issued subsequent amendments to the accounting standard regardinginitial guidance. This ASU and the measurement of credit losses on financial instruments. This update requiresassociated subsequent amendments require that financial assets measured at their amortized cost basis be presented at the net amount expected to be collected. Credit losses relating to available-for-saleour available for sale debt securities are to be recorded through an allowance for credit losses, rather than a write-down of the asset, with the amount of the allowance limited to the amount by which fair value is less than amortized cost. This allowance method will allow reversals of credit losses if the estimate of credit losses declines. This ASU will also affect certain of our accounts and notes receivable, including premiums receivable, and certain of our other assets, including reinsurance recoverables. However, this ASU is not applicable to the accounting for insurance losses and loss adjustment expenses. Due to the nature of our assets affected by this update, we do not expect it to have a material effect on our financial statements and disclosures. This update is effective for public companies for fiscal years beginning after December 15, 2019, including interim periods within those fiscal years. Early adoption is permitted for the fiscal years beginning after December 15, 2018, including interim periods within those fiscal years. This update is not applicable
Radian Group Inc.
Notes to credit losses associated with our mortgage insurance policies. We are currently evaluating the impact on our financial statements and future disclosures as a result of this update.Unaudited Condensed Consolidated Financial Statements (Continued)
In March 2017, the FASB issued an update to the accounting standard regarding receivables. The new standard requires certain premiums on purchased callable debt securities to be amortized to the earliest call date. The amortization period for callable debt securities purchased at a discount will not be impacted. The provisions of this update are effective for fiscal years beginning after December 15, 2018, including interim periods within those fiscal years. Early adoption is permitted, including adoption in an interim period. We do not expect the adoption of this update to have a material effect on our financial statements and disclosures.
In August 2018, the FASB issued an update to the accounting standard regarding the accounting for long-duration insurance contracts.ASU 2018-12, Financial Services-Insurance. The new standard: (i) requires that assumptions used to measure the liability for future policy benefits be reviewed at least annually; (ii) defines and simplifies the measurement of market risk benefits; (iii) simplifies the amortization of deferred acquisition costs; and (iv) enhances the required disclosures about long-duration contracts. This update is effective for fiscal years beginning after December 15, 2020, including interim periods within those fiscal years. Early adoption is permitted. We are currently evaluating the potential impact of the adoption of this update.update but do not expect it to have a material effect on our financial statements and disclosures.
In August 2018, the FASB issued an update to the accounting standard regarding the disclosure requirements for fair value measurement. The amendments in this update remove certain disclosure requirements regarding transfers between assets as well as the valuation process for Level III assets.ASU 2018-15, Intangibles-Goodwill and Other-Internal-Use Software. This update is effective for fiscal years beginning after December 15, 2019, including interim periods within those fiscal years. Early adoption is permitted, including adoption in an interim period. An entity is permitted to early adopt any removed or modified disclosures and delay adoption of the additional disclosures until their required effective date. We are currently evaluating the impact on our financial statements and future disclosures as a result of this update.
In August 2018, the FASB issued an update to the accounting standard regardingASU requires the capitalization of implementation costs for activities performed in a cloud computing arrangement that is a service contract. The new standard aligns the accounting for implementation costs of hosting arrangements that are service contracts with the accounting for capitalizing internal-use software. This update is effective for fiscal years beginning after December 15, 2019, including interim periods within those fiscal years. Early adoption is permitted, including adoption in an interim period. We are currently evaluating the potential impact of the adoption of this update but do not expect it to have a material effect on our financial statements and disclosures.
In April 2019, the FASB issued ASU 2019-04, Codification Improvements related to Financial Instruments-Credit Losses, Derivatives and Hedging, and Financial Instruments. This update to the accounting standards regarding financial instruments and derivatives and hedging clarifies the accounting treatment for the measurement of credit losses and provides further clarification on previously issued updates. This update is effective for fiscal years beginning after December 15, 2019, including interim periods within those fiscal years. Early adoption is permitted for fiscal years beginning after December 15, 2018, including interim periods within those fiscal years. We are currently evaluating the potential impact of the adoption of this update but do not expect it to have a material effect on our financial statements and disclosures.
2. Net Income Per Share
Basic net income per share is computed by dividing net income by the weighted-average number of common shares outstanding, while diluted net income per share is computed by dividing net income attributable to common shareholdersstockholders by the sum of the weighted-average number of common shares outstanding and the weighted-average number of dilutive potential common shares. Dilutive potential common shares relate to our share-based compensation arrangements and our outstanding convertible senior notes, if any.
Radian Group Inc.
Notes to Unaudited Condensed Consolidated Financial Statements — (Continued)
The calculation of basic and diluted net income per share was as follows:
| | | | Three Months Ended
September 30, | | Nine Months Ended
September 30, | Three Months Ended
September 30, | | Nine Months Ended
September 30, |
| (In thousands, except per-share amounts) | 2018 | | 2017 | | 2018 | | 2017 | 2019 | | 2018 | | 2019 | | 2018 |
| Net income—basic | $ | 142,797 |
| | $ | 65,142 |
| | $ | 466,232 |
| | $ | 114,272 |
| |
Adjustment for dilutive Convertible Senior Notes due 2019, net of tax (1) | — |
| | — |
| | — |
| | (215 | ) | |
| Net income—diluted | $ | 142,797 |
| | $ | 65,142 |
| | $ | 466,232 |
| | $ | 114,057 |
| |
| Net income—basic and diluted | | $ | 173,438 |
| | $ | 142,797 |
| | $ | 511,125 |
| | $ | 466,232 |
|
| | | | | | | | | | | | | | | |
| Average common shares outstanding—basic | 213,309 |
| | 215,279 |
| | 214,499 |
| | 215,194 |
| 203,107 |
| | 213,309 |
| | 208,561 |
| | 214,499 |
|
| Dilutive effect of Convertible Senior Notes due 2017 | — |
| | 16 |
| | — |
| | 398 |
| |
| Dilutive effect of Convertible Senior Notes due 2019 | — |
| | — |
| | — |
| | 611 |
| |
Dilutive effect of share-based compensation arrangements (2) | 4,593 |
| | 4,096 |
| | 4,284 |
| | 4,027 |
| |
Dilutive effect of share-based compensation arrangements (1) | | 5,584 |
| | 4,593 |
| | 5,402 |
| | 4,284 |
|
| Adjusted average common shares outstanding—diluted | 217,902 |
|
| 219,391 |
| | 218,783 |
| | 220,230 |
| 208,691 |
|
| 217,902 |
| | 213,963 |
| | 218,783 |
|
| | | | | | | | | | | | | | | |
| Net income per share: | | | | | | | | | | | | | | |
| | | | | | | | | | | | | | | |
| Basic | $ | 0.67 |
| | $ | 0.30 |
| | $ | 2.17 |
| | $ | 0.53 |
| $ | 0.85 |
| | $ | 0.67 |
| | $ | 2.45 |
| | $ | 2.17 |
|
| | | | | | | | | | | | | | | |
| Diluted | $ | 0.66 |
| | $ | 0.30 |
| | $ | 2.13 |
| | $ | 0.52 |
| $ | 0.83 |
| | $ | 0.66 |
| | $ | 2.39 |
| | $ | 2.13 |
|
______________________
| |
| (1) | As applicable, includes coupon interest, amortization of discount and fees, and other changes in income that would result from the assumed conversion. Included in the nine months ended September 30, 2017 is a benefit related to our adjustment of estimated accrued expense to actual amounts, resulting from the January 2017 settlement of our obligations on the remaining Convertible Senior Notes due 2019. |
| |
(2) | The following number of shares of our common stock equivalents issued under our share-based compensation arrangements were not included in the calculation of diluted net income (loss) per share because they were anti-dilutive: |
| | | | Three Months Ended
September 30, | | Nine Months Ended
September 30, | Three Months Ended
September 30, | | Nine Months Ended
September 30, |
| (In thousands) | 2018 | | 2017 | | 2018 | | 2017 | 2019 | | 2018 | | 2019 | | 2018 |
| Shares of common stock equivalents | 338 |
| | 676 |
| | 338 |
| | 440 |
| — |
| | 338 |
| | 160 |
| | 338 |
|
Radian Group Inc.
Notes to Unaudited Condensed Consolidated Financial Statements (Continued)
3. Segment Reporting
We have two2 strategic business units that we manage separately—Mortgage Insurance and Services. Adjusted pretax operating income (loss) for each segment represents segment results on a standalone basis; therefore, inter-segment eliminations and reclassifications required for consolidated GAAP presentation have not been reflected. Inter-segment activities are recorded at market rates for segment reporting and eliminated in consolidation.
We allocate to our Mortgage Insurance segment: (i) corporate expenses based on itsthe segment’s forecasted annual percentage of total revenue, which approximates the estimated percentage of time spent on the Mortgage Insurance segment; (ii) except as described below for periods prior to January 1, 2019, all interest expense (except forexpense; and (iii) all net investment income from corporate cash and investments. Prior to January 1, 2019, interest expense related to an intercompany notethe Clayton Intercompany Note was allocated to our Services segment. Effective January 1, 2019, Radian Group recapitalized the Services segment with terms consistenta capital contribution that enabled the Services segment to repay the Clayton Intercompany Note and its accumulated allocated interest expense associated with the original issued amountnote, and effective as of $300 million from the Senior Notes due 2019 that were used to fund our purchase of Clayton,same date, all of whichinterest expense is allocated to our Services segment); and (iii) all corporate cash and investments.Mortgage Insurance segment.
We allocate to our Services segment: (i) corporate expenses based on itsthe segment’s forecasted annual percentage of total revenue, which approximates the estimated percentage of time spent on the Services segment and (ii) until January 1, 2019, the allocated interest expense related to the intercompany noteClayton Intercompany Note as describeddiscussed above. No material corporate cash or investments are allocated
With the exception of goodwill and other acquired intangible assets that relate to the Services segment. Inter-segment activities are recorded at market rates for segment reporting and eliminated in consolidation.
Contract underwriting activities are reported within our Services segment. We include underwriting-related expenses for mortgage insurance, based on a pro-rata volumesegment, which are reviewed as part of mortgage applications excluding third-party contract underwriting services, in our Mortgage Insurance segment’s other operating expenses before corporate allocations. We include underwriting-related expenses for third-party contract underwriting services, based on a pro-rata volume of mortgage applications, in our Services segment’s cost of services and other operating expenses before corporate allocations, as applicable.
Radian Group Inc.
Notes to Unaudited Condensed Consolidated Financial Statements — (Continued)
Adjusted Pretax Operating Income (Loss)
Our senior management, including our Chief Executive Officer (Radian’s chief operating decision maker), uses adjusted pretax operating income (loss) as our primary measure to evaluate the fundamental financial performance of each of Radian’s business segments and to allocate resources to the segments. Adjusted pretax operating income (loss) is defined as pretax income (loss) from continuing operations excluding the effects ofof: (i) net gains (losses) on investments and other financial instruments,instruments; (ii) loss on induced conversionextinguishment of debt; (iii) amortization and debt extinguishment, acquisition-related expenses, amortization or impairment of goodwill and other acquired intangible assets; and (iv) impairment of other long-lived assets and net impairment losses recognized in earnings andother non-operating items, such as losses from the sale of lines of business.business and acquisition-related expenses. See Note 4 of Notes to Consolidated Financial Statements in our 2018 Form 10-K for detailed information regarding items excluded from adjusted pretax operating income (loss), including the reasons for their treatment.
Although adjusted pretax operating income (loss) excludes certain items that have occurred in the past and are expected to occur in the future, the excluded items represent those that are: (i) not viewed as part of the operating performance of our primary activities or (ii) not expected to result in an economic impact equal to the amount reflected in pretax income. These adjustments, along with the reasonsincome (loss).
The reconciliation of adjusted pretax operating income (loss) for their treatment, are described below.our reportable segments to consolidated pretax income is as follows:
|
| | | | | | | | | | | | | | | |
| | Three Months Ended
September 30, | | Nine Months Ended
September 30, |
| (In thousands) | 2019 | | 2018 | | 2019 | | 2018 |
| Adjusted pretax operating income (loss): | | | | | | | |
| Mortgage Insurance | $ | 214,256 |
| | $ | 204,620 |
| | $ | 641,791 |
| (1) | $ | 573,771 |
|
| Services | (1,513 | ) | | (7,921 | ) | | (11,139 | ) | | (21,960 | ) |
| Total adjusted pretax operating income | 212,743 |
| | 196,699 |
| | 630,652 |
| | 551,811 |
|
| | | | | | | | |
| Net gains (losses) on investments and other financial instruments | 13,009 |
| | (4,480 | ) | | 47,462 |
| | (30,771 | ) |
| Loss on extinguishment of debt | (5,940 | ) | | — |
| | (22,738 | ) | | — |
|
| Amortization and impairment of other acquired intangible assets | (2,139 | ) | | (3,472 | ) | | (6,465 | ) | | (8,968 | ) |
| Impairment of other long-lived assets and other non-operating items | — |
| | (4,059 | ) | | (5,557 | ) | | (4,371 | ) |
| Consolidated pretax income | $ | 217,673 |
| | $ | 184,688 |
| | $ | 643,354 |
| | $ | 507,701 |
|
______________________
| |
| (1) | Net gains (losses) on investments and other financial instruments. The recognition of realized investment gains or losses can vary significantly across periods as the activity is highly discretionary based on the timing of individual securities sales dueIncludes a cumulative adjustment to such factors as market opportunities, our tax and capital profile and overall market cycles. Unrealized investment gains and losses arise primarily from changesunearned premiums recorded in the market valuesecond quarter of our investments that are classified2019 related to an update to the amortization rates used to recognize revenue for Single Premium Policies, as trading or equity securities. These valuation adjustments may not necessarily result in realized economic gains or losses.
|
Trends in the profitability of our fundamental operating activities can be more clearly identified without the fluctuations of these realized and unrealized gains or losses. We do not view them to be indicative of our fundamental operating activities. Therefore, these items are excluded from our calculation of adjusted pretax operating income (loss).
| |
(2) | Loss on induced conversion and debt extinguishment. Gains or losses on early extinguishment of debt and losses incurred to purchase our convertible debt prior to maturity are discretionary activities that are undertaken in order to take advantage of market opportunities to strengthen our financial and capital positions; therefore, we do not view these activities as part of our operating performance. Such transactions do not reflect expected future operations and do not provide meaningful insight regarding our current or past operating trends. Therefore, these items are excluded from our calculation of adjusted pretax operating income (loss).
|
| |
(3) | Acquisition-related expenses. Acquisition-related expenses represent the costs incurred to effect an acquisition of a business (i.e., a business combination). Because we pursue acquisitions on a strategic and selective basis and not in the ordinary course of our business, we do not view acquisition-related expenses as a consequence of a primary business activity. Therefore, we do not consider these expenses to be part of our operating performance and they are excluded from our calculation of adjusted pretax operating income (loss).
|
| |
(4) | Amortization or impairment of goodwill and other acquired intangible assets. Amortization of acquired intangible assets represents the periodic expense required to amortize the cost of acquired intangible assets over their estimated useful lives. Acquired intangible assets with an indefinite useful life are also periodically reviewed for potential impairment, and impairment adjustments are made whenever appropriate. These charges are not viewed as part of the operating performance of our primary activities and therefore are excluded from our calculation of adjusted pretax operating income (loss).
|
| |
(5) | Net impairment losses recognized in earnings and losses from the sale of lines of business. The recognition of net impairment losses on investments and the impairment of other long-lived assets does not result in a cash payment and can vary significantly in both amount and frequency, depending on market credit cycles and other factors. Losses from the sale of lines of business are highly discretionary as a result of strategic restructuring decisions, and generally do not occur in the normal course of our business. We do not view these losses to be indicative of our fundamental operating activities. Therefore, whenever these losses occur, we exclude them from our calculation of adjusted pretax operating income (loss).
further described below. |
Radian Group Inc.
Notes to Unaudited Condensed Consolidated Financial Statements — (Continued)
Summarized operating results for our segments for the periods indicated, are as follows:
|
| | | | | | | | | | | | | | | |
| | Three Months Ended
September 30, | | Nine Months Ended
September 30, |
| (In thousands) | 2018 | | 2017 | | 2018 | | 2017 |
| Mortgage Insurance | | | | | | | |
Net premiums written—insurance (1) | $ | 253,827 |
| | $ | 247,810 |
| | $ | 743,765 |
| | $ | 713,782 |
|
| (Increase) decrease in unearned premiums | 1,655 |
| | (11,108 | ) | | 3,235 |
| | (26,184 | ) |
| Net premiums earned—insurance | 255,482 |
| | 236,702 |
| | 747,000 |
| | 687,598 |
|
| Net investment income | 38,824 |
| | 32,540 |
| | 110,227 |
| | 93,643 |
|
| Other income | 725 |
| | 760 |
| | 2,153 |
| | 2,118 |
|
Total (2) | 295,031 |
| | 270,002 |
|
| 859,380 |
|
| 783,359 |
|
| | | | | | | | |
| Provision for losses | 20,715 |
| | 35,980 |
| | 77,468 |
| | 100,926 |
|
| Policy acquisition costs | 5,667 |
| | 5,554 |
| | 18,780 |
| | 18,406 |
|
| Other operating expenses before corporate allocations | 33,152 |
| | 36,941 |
| | 98,302 |
| | 114,169 |
|
Total (3) | 59,534 |
| | 78,475 |
| | 194,550 |
| | 233,501 |
|
| Adjusted pretax operating income before corporate allocations | 235,497 |
| | 191,527 |
| | 664,830 |
| | 549,858 |
|
| Allocation of corporate operating expenses | 19,794 |
| | 11,737 |
| | 58,507 |
| | 41,817 |
|
| Allocation of interest expense | 11,083 |
| | 11,282 |
| | 32,552 |
| | 34,539 |
|
| Adjusted pretax operating income | $ | 204,620 |
| | $ | 168,508 |
| | $ | 573,771 |
| | $ | 473,502 |
|
______________________
| |
(1) | Net of ceded premiums written under the QSR Program and the Single Premium QSR Program. See Note 7 for additional information. |
| |
(2) | Excludes net losses on investments and other financial instruments of $4.5 million and $30.8 million for the three and nine months ended September 30, 2018, and net gains on investments and other financial instruments of $2.5 million and $5.0 million for the three and nine months ended September 30, 2017, not included in adjusted pretax operating income. |
(3)Includes inter-segment expenses as follows: |
| | | | | | | | | | | | | | | |
| | Three Months Ended
September 30, | | Nine Months Ended
September 30, |
| (In thousands) | 2018 | | 2017 | | 2018 | | 2017 |
| Inter-segment expenses | $ | 766 |
| | $ | 1,491 |
| | $ | 2,653 |
| | $ | 5,726 |
|
Radian Group Inc.
Notes to Unaudited Condensed Consolidated Financial Statements — (Continued)
|
| | | | | | | | | | | | | | | |
| | Three Months Ended
September 30, | | Nine Months Ended
September 30, |
| (In thousands) | 2018 | | 2017 | | 2018 | | 2017 |
| Services | | | | | | | |
Net premiums earned—insurance (1) | $ | 2,949 |
| | $ | — |
| | $ | 5,325 |
| | $ | — |
|
Services revenue (2) | 37,332 |
| | 41,062 |
| | 109,211 |
| | 121,126 |
|
Net investment income (1) | 171 |
| | — |
| | 197 |
| | — |
|
Other income (1) | 449 |
| | — |
| | 844 |
| | — |
|
Total (2) | 40,901 |
| | 41,062 |
| | 115,577 |
| | 121,126 |
|
| | | | | | | | |
Provision for losses (1) | 242 |
| | — |
| | 295 |
| | — |
|
| Cost of services | 26,001 |
| | 27,544 |
| | 73,628 |
| | 82,196 |
|
| Other operating expenses before corporate allocations | 14,772 |
| | 12,781 |
| | 39,531 |
| | 38,188 |
|
Restructuring and other exit costs (3) | 407 |
| | 5,463 |
| | 1,987 |
| | 5,463 |
|
| Total | 41,422 |
| | 45,788 |
| | 115,441 |
| | 125,847 |
|
| Adjusted pretax operating income (loss) before corporate allocations | (521 | ) | | (4,726 | ) |
| 136 |
|
| (4,721 | ) |
| Allocation of corporate operating expenses | 2,948 |
| | 3,730 |
| | 8,742 |
| | 10,852 |
|
| Allocation of interest expense | 4,452 |
| | 4,433 |
| | 13,354 |
| | 13,293 |
|
| Adjusted pretax operating income (loss) | $ | (7,921 | ) | | $ | (12,889 | ) |
| $ | (21,960 | ) |
| $ | (28,866 | ) |
______________________
| |
(1) | Results from inclusion of the operations of EnTitle Direct, a national title insurance and settlement services company, acquired in March 2018. |
(2)Includes inter-segment revenues as follows: |
| | | | | | | | | | | | | | | |
| | Three Months Ended
September 30, | | Nine Months Ended
September 30, |
| (In thousands) | 2018 | | 2017 | | 2018 | | 2017 |
| Inter-segment revenues | $ | 766 |
| | $ | 1,491 |
| | $ | 2,653 |
| | $ | 5,726 |
|
| |
(3) | Does not include impairment of long-lived assets and loss from the sale of a business line, which are not components of adjusted pretax operating income. |
Selected balance sheet information for our segments, as of the periods indicated, is as follows:
|
| | | | | | | | | | | |
| | At September 30, 2018 |
| (In thousands) | Mortgage Insurance | | Services | | Total |
| Total assets | $ | 6,095,101 |
| | $ | 174,383 |
| | $ | 6,269,484 |
|
| | | | | | |
| | At December 31, 2017 |
| (In thousands) | Mortgage Insurance | | Services | | Total |
| Total assets | $ | 5,733,918 |
| | $ | 166,963 |
| | $ | 5,900,881 |
|
Radian Group Inc.
Notes to Unaudited Condensed Consolidated Financial Statements — (Continued)
The reconciliation of adjusted pretax operating income to consolidated pretax income is as follows:
|
| | | | | | | | | | | | | | | |
| | Three Months Ended
September 30, |
| Nine Months Ended
September 30, |
| (In thousands) | 2018 |
| 2017 |
| 2018 |
| 2017 |
| Adjusted pretax operating income (loss): | | | | | | | |
Mortgage Insurance (1) | $ | 204,620 |
| | $ | 168,508 |
| | $ | 573,771 |
| | $ | 473,502 |
|
Services (1) | (7,921 | ) | | (12,889 | ) | | (21,960 | ) | | (28,866 | ) |
| Total adjusted pretax operating income | 196,699 |
|
| 155,619 |
|
| 551,811 |
| | 444,636 |
|
| | | | | | | | |
| Net gains (losses) on investments and other financial instruments | (4,480 | ) | | 2,480 |
| | (30,771 | ) | | 4,960 |
|
| Loss on induced conversion and debt extinguishment | — |
| | (45,766 | ) | | — |
| | (51,469 | ) |
Acquisition-related expenses (2) | (2 | ) | | (54 | ) | | (418 | ) | | (126 | ) |
| Impairment of goodwill | — |
| | — |
| | — |
| | (184,374 | ) |
| Amortization and impairment of other acquired intangible assets | (3,472 | ) | | (2,890 | ) | | (8,968 | ) | | (25,042 | ) |
Impairment of other long-lived assets and loss from the sale of a business line (3) | (4,057 | ) | | (6,575 | ) | | (3,953 | ) | | (6,575 | ) |
| Consolidated pretax income | $ | 184,688 |
|
| $ | 102,814 |
|
| $ | 507,701 |
| | $ | 182,010 |
|
______________________
| |
(1) | Includes inter-segment expenses and revenues as listed in the notes to the preceding tables. |
| |
(2) | Acquisition-related expenses represent expenses incurred to effect the acquisition of a business, net of adjustments to accruals previously recorded for acquisition expenses.
|
| |
(3) | Included within restructuring and other exit costs. See Note 1. |
On a consolidated basis, “adjusted pretax operating income” is a measure not determined in accordance with GAAP. Total adjusted pretax operating income is not a measure of total profitability, and therefore should not be considered in isolation or viewed as a substitute for GAAP pretax income. Our definition of adjusted pretax operating income may not be comparable to similarly-named measures reported by other companies.
4. Fair Value of Financial Instruments
AvailableOur results for sale securities, trading securities, equity securities and certain other assets are recorded at fair value. All changes in the fair value of trading securities, equity securities and certain other assets are included in our condensed consolidated statements of operations. All changes in the fair value of available for sale securities are recorded in accumulated other comprehensive income. As a result of our implementation of the update to the standard for the accounting of financial instruments, we elected to measure certain other investments using the net asset value as a practical expedient. See Note 1 “—Significant Accounting Policies—Recent Accounting Pronouncements—Accounting Standards Adopted During 2018” for additional information. There were no other changes to our fair value methodologies during the nine months ended September 30, 2018.2019 include a $32.9 million increase in net premiums earned and a $0.12 increase in net income per share, due to a reduction in our unearned premiums resulting from a cumulative adjustment in the second quarter of 2019 related to an update to the amortization rates used to recognize revenue for Single Premium Policies. The update to our earned premium recognition factors also resulted in a $6.2 million reduction in other operating expenses and a $0.02 increase in net income per share due to the acceleration of earned ceding commissions related to policies covered under our Single Premium QSR Program. This cumulative adjustment reflects a change in our estimate of the period over which we recognize premiums during the life of our mortgage insurance policies. We periodically review our premium recognition models, with adjustments to the estimate, if any, reflected in current period income. See Note 2 of Notes to Consolidated Financial Statements in our 2018 Form 10-K for additional information regarding our accounting policies for insurance premiums revenue recognition.
In accordance with GAAP, we established a three-level valuation hierarchy for disclosureWe updated the amortization rates due to the continuing increase in the significance of fair value measurements basedborrower-paid Single Premium Policies in our portfolio following our rate reductions on borrower-paid Single Premium Policies in 2018. Under the Homeowners Protection Act of 1998 (“HPA”), borrower-paid policies must be canceled automatically on the transparency of inputsdate the LTV is scheduled to the valuation of an asset or liability asreach 78% of the measurement date. The hierarchy givesoriginal value (or, if the highest priority to unadjusted quoted prices in active markets for identical assets or liabilities (Level I measurements) and the lowest priority to unobservable inputs (Level III measurements). The level in the fair value hierarchy within which the fair value measurement fallsloan is determined basednot current on that date, on the lowest level inputdate that the loan becomes current). As a result, given the shift in our mix of Single Premium Policies toward more borrower-paid Single Premium Policies than lender-paid, the average anticipated term of our Single Premium IIF is significantdeclining compared to the measurementhistorical levels. We updated our analysis to reflect not only this anticipated effect of HPA cancellations on borrower-paid policies, but also changes in its entirety. observed and projected loss patterns for both borrower-paid and lender-paid policies.
Revenue
The three levelsreconciliation of the fair value hierarchy are defined below:our reportable segment revenues to consolidated revenues is as follows:
|
| | | | | | | | | | | | | | | |
| | Three Months Ended
September 30, | | Nine Months Ended
September 30, |
| (In thousands) | 2019 | | 2018 | | 2019 | | 2018 |
| Reportable segment revenues: | | | | | | | |
| Mortgage Insurance | $ | 321,056 |
| | $ | 295,031 |
| | $ | 968,215 |
| (1) | $ | 859,380 |
|
| Services | 47,378 |
| | 40,901 |
| | 126,406 |
| | 115,577 |
|
| Total reportable segment revenues | 368,434 |
| | 335,932 |
| | 1,094,621 |
| | 974,957 |
|
| Add: Net gains (losses) on investments and other financial instruments | 13,009 |
| | (4,480 | ) | | 47,462 |
| | (30,771 | ) |
Less: Inter-segment revenues (2) | 1,105 |
| | 766 |
| | 3,152 |
| | 2,653 |
|
| Total revenues | $ | 380,338 |
| | $ | 330,686 |
| | $ | 1,138,931 |
| | $ | 941,533 |
|
| |
Level I(1) | — Unadjusted quoted pricesIncludes a cumulative adjustment to unearned premiums recorded in the second quarter of 2019 related to an update to the amortization rates used to recognize revenue for identical assets or liabilities in active markets that are accessible at the measurement date for identical, unrestricted assets or liabilities;Single Premium Policies, as further described above. |
| |
Level II(2) | — Prices or valuations based on observable inputs other than quoted pricesInter-segment revenues included in active markets for identical assets and liabilities; andthe Services segment. |
| |
Level III | — Prices or valuations that require inputs that are both significant to the fair value measurement and unobservable. Level III inputs are used to measure fair value only to the extent that observable inputs are not available. |
The accounting standard on revenue from contracts with customers is primarily applicable to our services revenue and is not applicable to our investments and insurance products, which represent the majority of our revenue. See Notes 1 and 2 of Notes to Consolidated Financial Statements in our 2018 Form 10-K for additional information regarding our accounting policies and the services we offer.
Radian Group Inc.
Notes to Unaudited Condensed Consolidated Financial Statements — (Continued)
The leveltable below represents the disaggregation of market activity usedservices revenues from external customers, by type:
|
| | | | | | | | | | | | | | | |
| | Three Months Ended
September 30, | | Nine Months Ended
September 30, |
| (In thousands) | 2019 | | 2018 | | 2019 | | 2018 |
| Services revenue | | | | | | | |
| Mortgage Services | $ | 19,218 |
| | $ | 18,839 |
| | $ | 51,531 |
| | $ | 55,552 |
|
| Real Estate Services | 17,865 |
| | 15,984 |
| | 50,640 |
| | 44,948 |
|
| Title Services | 5,426 |
| | 1,743 |
| | 12,394 |
| | 6,058 |
|
| Total services revenue | $ | 42,509 |
| | $ | 36,566 |
| | $ | 114,565 |
| | $ | 106,558 |
|
Our services revenues are recognized over time and measured each period based on the progress to determinedate as services are performed and made available to customers. Our contracts with customers, including payment terms, are generally short-term in nature; therefore, any impact related to timing is immaterial. Revenue expected to be recognized in any future period related to remaining performance obligations, such as contracts where revenue is recognized as invoiced and contracts with variable consideration related to undelivered performance obligations, is not material.
Revenue recognized related to services made available to customers and billed is reflected in accounts and notes receivable. Revenue recognized related to services performed and not yet billed is recorded in unbilled receivables and reflected in other assets. Deferred revenue represents advance payments received from customers in advance of revenue recognition. We have 0 material bad-debt expense. The following represents balances related to services revenue contracts as of the dates indicated:
|
| | | | | | | |
| (In thousands) | September 30,
2019 | | December 31,
2018 |
| Accounts Receivable | $ | 18,956 |
| | $ | 15,461 |
|
| Unbilled Receivables | 25,110 |
| | 19,917 |
|
| Deferred Revenues | 3,036 |
| | 3,204 |
|
4. Fair Value of Financial Instruments
For discussion of our valuation methodologies for assets and liabilities measured at fair value and the fair value hierarchy, is based on the availabilitysee Note 5 of observable inputs market participants would useNotes to price an asset or a liability, including market value price observations. We provide a qualitative description of the valuation techniques and inputs used for recurring and non-recurring fair value measurementsConsolidated Financial Statements in our audited financial statements and notes thereto included in our 20172018 Form 10-K. These unaudited condensed consolidated financial statements should be read in conjunction with the audited financial statements and notes thereto included in our 2017
Form 10-K.
Radian Group Inc.
Notes to Unaudited Condensed Consolidated Financial Statements (Continued)
The following is a list of assets that are measured at fair value by hierarchy level as of September 30, 2018:2019:
| | | (In thousands) | Level I | | Level II | | Total | | Level I | | Level II | | Total |
| Assets at Fair Value | | | | | | | |
| Investment Portfolio: | | | | | | | |
| Assets at fair value | | | | | | |
| Investments: | | | | | | |
| Fixed-maturities available for sale: | | | | | | |
| U.S. government and agency securities | | $ | 128,443 |
| | $ | 34,012 |
| | $ | 162,455 |
|
| State and municipal obligations | | — |
| | 110,981 |
| | 110,981 |
|
| Corporate bonds and notes | | — |
| | 2,347,346 |
| | 2,347,346 |
|
| RMBS | | — |
| | 619,935 |
| | 619,935 |
|
| CMBS | | — |
| | 563,338 |
| | 563,338 |
|
| Other ABS | | — |
| | 717,986 |
| | 717,986 |
|
| Foreign government and agency securities | | — |
| | 5,182 |
| | 5,182 |
|
| Total fixed-maturities available for sale | | 128,443 |
| | 4,398,780 |
| | 4,527,223 |
|
| | | | | | | |
| Trading securities: | | | | | | |
| State and municipal obligations | | — |
| | 121,190 |
| | 121,190 |
|
| Corporate bonds and notes | | — |
| | 156,648 |
| | 156,648 |
|
| RMBS | | — |
| | 17,116 |
| | 17,116 |
|
| CMBS | | — |
| | 34,981 |
| | 34,981 |
|
| Total trading securities | | — |
| | 329,935 |
| | 329,935 |
|
| | | | | | | |
| Equity securities | | 116,762 |
| | 4,997 |
| | 121,759 |
|
| | | | | | | |
| Short-term investments: | | | | | | |
| U.S. government and agency securities | $ | 234,507 |
| | $ | 21,545 |
| | $ | 256,052 |
| | 120,969 |
| | — |
| | 120,969 |
|
| State and municipal obligations | — |
| | 345,029 |
| | 345,029 |
| | — |
| | 25,547 |
| | 25,547 |
|
| Money market instruments | 156,396 |
| | — |
| | 156,396 |
| | 196,372 |
| | — |
| | 196,372 |
|
| Corporate bonds and notes | — |
| | 2,480,097 |
| | 2,480,097 |
| | — |
| | 37,593 |
| | 37,593 |
|
| RMBS | — |
| | 272,125 |
| | 272,125 |
| | |
| CMBS | — |
| | 576,829 |
| | 576,829 |
| | |
| Other ABS | — |
| | 674,509 |
| | 674,509 |
| | |
Other investments (1) | | — |
| | 171,614 |
| | 171,614 |
|
| Total short-term investments | | 317,341 |
| | 234,754 |
| | 552,095 |
|
| | | | | | | |
Total investments at fair value (2) | | 562,546 |
| | 4,968,466 |
| | 5,531,012 |
|
| | | | | | | |
| Other assets: | | | | | | |
Loaned securities: (3) | | | | | | |
| U.S. government and agency securities | | 19,960 |
| | — |
| | 19,960 |
|
| Corporate bonds and notes | | — |
| | 15,227 |
| | 15,227 |
|
| Equity securities | 145,198 |
| | 3,514 |
| | 148,712 |
| | 30,257 |
| | — |
| | 30,257 |
|
Other investments (1) | — |
| | 149,265 |
| | 149,265 |
| | |
Total Investments at Fair Value (2) | 536,101 |
| | 4,522,913 |
| | 5,059,014 |
| (3) | |
| Total Assets at Fair Value | $ | 536,101 |
| | $ | 4,522,913 |
| | $ | 5,059,014 |
| (3) | |
| | | | | | | | |
Total assets at fair value (2) | | $ | 612,763 |
| | $ | 4,983,693 |
| | $ | 5,596,456 |
|
______________________
| |
| (1) | Comprising short-term certificates of deposit and commercial paper. |
| |
| (2) | Does not include certain other invested assets ($3.6 million),of $2.7 million that are primarily invested in limited partnership investments valued using the net asset value as a practical expedient. Includes cash collateral held under securities lending agreements ($31.8 million) reinvested in money market instruments. |
| |
| (3) | Includes $34.4 million of securitiesSecurities loaned to third-party Borrowersborrowers under securities lending agreements are classified as other assets in our condensed consolidated balance sheets. See Note 5 for more information. |
Radian Group Inc.
Notes to Unaudited Condensed Consolidated Financial Statements — (Continued)
The following is a list of assets that are measured at fair value by hierarchy level as of December 31, 2017:2018:
|
| | | | | | | | | | | |
| (In thousands) | Level I | | Level II | | Total |
| Assets at fair value | | | | | |
| Investments: | | | | | |
| Fixed-maturities available for sale: | | | | | |
| U.S. government and agency securities | $ | 55,658 |
| | $ | 28,412 |
| | $ | 84,070 |
|
| State and municipal obligations | — |
| | 138,313 |
| | 138,313 |
|
| Corporate bonds and notes | — |
| | 2,222,473 |
| | 2,222,473 |
|
| RMBS | — |
| | 332,142 |
| | 332,142 |
|
| CMBS | — |
| | 539,915 |
| | 539,915 |
|
| Other ABS | — |
| | 704,662 |
| | 704,662 |
|
| Total fixed-maturities available for sale | 55,658 |
| | 3,965,917 |
|
| 4,021,575 |
|
| | | | | | |
| Trading securities: | | | | | |
| State and municipal obligations | — |
| | 168,359 |
| | 168,359 |
|
| Corporate bonds and notes | — |
| | 228,152 |
| | 228,152 |
|
| RMBS | — |
| | 21,082 |
| | 21,082 |
|
| CMBS | — |
| | 51,478 |
| | 51,478 |
|
| Total trading securities | — |
| | 469,071 |
|
| 469,071 |
|
| | | | | | |
| Equity securities | 126,607 |
| | 3,958 |
| | 130,565 |
|
| | | | | | |
| Short-term investments: | | | | | |
| U.S. government and agency securities | 133,657 |
| | — |
| | 133,657 |
|
| State and municipal obligations | — |
| | 18,070 |
| | 18,070 |
|
| Money market instruments | 95,132 |
| | — |
| | 95,132 |
|
| Corporate bonds and notes | — |
| | 105,625 |
| | 105,625 |
|
| Other ABS | — |
| | 806 |
| | 806 |
|
Other investments (1) | — |
| | 175,113 |
| | 175,113 |
|
| Total short-term investments | 228,789 |
| | 299,614 |
|
| 528,403 |
|
| | | | | | |
Total investments at fair value (2) | 411,054 |
| | 4,738,560 |
| | 5,149,614 |
|
| | | | | | |
| Other assets: | | | | | |
Loaned securities: (3) | | | | | |
| U.S. government and agency securities | 9,987 |
| | — |
| | 9,987 |
|
| Corporate bonds and notes | — |
| | 7,818 |
| | 7,818 |
|
| Equity securities | 10,055 |
| | — |
| | 10,055 |
|
Total assets at fair value (2) | $ | 431,096 |
| | $ | 4,746,378 |
|
| $ | 5,177,474 |
|
|
| | | | | | | | | | | | |
| (In thousands) | Level I | | Level II | | Total | |
| Assets at Fair Value | | | | | | |
| Investment Portfolio: | | | | | | |
| U.S. government and agency securities | $ | 124,969 |
| | $ | 8,023 |
| | $ | 132,992 |
| |
| State and municipal obligations | — |
| | 386,111 |
| | 386,111 |
| |
| Money market instruments | 213,357 |
| | — |
| | 213,357 |
| |
| Corporate bonds and notes | — |
| | 2,304,017 |
| | 2,304,017 |
| |
| RMBS | — |
| | 216,749 |
| | 216,749 |
| |
| CMBS | — |
| | 503,955 |
| | 503,955 |
| |
| Other ABS | — |
| | 676,158 |
| | 676,158 |
| |
| Foreign government and agency securities | — |
| | 36,448 |
| | 36,448 |
| |
| Equity securities | 175,205 |
| | 860 |
| | 176,065 |
| |
Other investments (1) | — |
| | 25,720 |
| | 25,720 |
| |
Total Investments at Fair Value (2) | 513,531 |
| | 4,158,041 |
| | 4,671,572 |
| (3) |
| Total Assets at Fair Value | $ | 513,531 |
| | $ | 4,158,041 |
| | $ | 4,671,572 |
| (3) |
______________________
| |
| (1) | Comprising short-term certificates of deposit and commercial paper. |
| |
| (2) | Does not include certain other invested assets ($0.3 million),of $3.4 million that are primarily invested in limited partnerships, accounted forpartnership investments valued using the net asset value as cost-method investments and not measured at fair value. Includes cash collateral held under securities lending agreements ($19.4 million) reinvested in money market instruments.a practical expedient. |
| |
| (3) | Includes $28.0 million of securitiesSecurities loaned to third-party Borrowersborrowers under securities lending agreements are classified as other assets in our condensed consolidated balance sheets. See Note 5 for more information. |
There
Radian Group Inc.
Notes to Unaudited Condensed Consolidated Financial Statements (Continued)
At September 30, 2019 and December 31, 2018, there were no0 material Level III assets measured at fair value at September 30, 2018 or December 31, 2017, and no Level III liabilities. There were no investment transfers between Level I, Level IIto or from Level III for the three and nine months ended September 30, 20182019 or the year ended December 31, 2018. Activity related to Level III assets and 2017.liabilities (including realized and unrealized gains and losses, purchases, sales, issuances, settlements and transfers) was immaterial for the three and nine months ended September 30, 2019 and the year ended December 31, 2018.
Other Fair Value Disclosure
The carrying value and estimated fair value of other selected assets and liabilities not carried at fair value in our condensed consolidated balance sheets were as follows as of the dates indicated:
| | | | September 30, 2018 | | December 31, 2017 | September 30, 2019 | | December 31, 2018 |
| (In thousands) | Carrying Amount | | Estimated Fair Value | | Carrying Amount | | Estimated Fair Value | Carrying Amount | | Estimated Fair Value | | Carrying Amount | | Estimated Fair Value |
| Assets: | | | | | | | | |
Other invested assets (1) | $ | — |
| | $ | — |
| | $ | 334 |
| | $ | 3,226 |
| |
| Liabilities: | | | | | | | | | | | | | | |
| Senior notes | 1,029,511 |
| | 1,053,528 |
| | 1,027,074 |
| | 1,093,934 |
| $ | 886,643 |
| | $ | 919,125 |
| | $ | 1,030,348 |
| | $ | 1,007,687 |
|
| FHLB advances | | 104,492 |
| | 105,661 |
| | 82,532 |
| | 82,899 |
|
______________________The fair value of our senior notes is estimated based on the quoted market prices for the same or similar instruments. The fair value of our FHLB advances is estimated based on expected cash flows for similar borrowings. These liabilities are categorized in Level II of the fair value hierarchy. See Note 11 for additional information on our senior notes and FHLB advances.
| |
(1) | As a result of implementing the update to the standard for the accounting of financial instruments effective January 1, 2018, other invested assets are no longer carried at amortized cost. |
Radian Group Inc.
Notes to Unaudited Condensed Consolidated Financial Statements — (Continued)
5. Investments
Available for Sale Securities
Our available for sale securities within our investment portfolio consisted of the following as of the dates indicated:
| | | | September 30, 2018 | September 30, 2019 |
| (In thousands) | Amortized Cost | | Fair Value | | Gross Unrealized Gains | | Gross Unrealized Losses | Amortized Cost | | Fair Value | | Gross Unrealized Gains | | Gross Unrealized Losses |
| Fixed-maturities available for sale: | | | | | | | | | | | | | | |
| U.S. government and agency securities | $ | 75,369 |
| | $ | 72,645 |
| (1) | $ | — |
| | $ | 2,724 |
| $ | 176,682 |
| | $ | 182,415 |
| | $ | 5,839 |
| | $ | 106 |
|
| State and municipal obligations | 140,877 |
| | 139,986 |
| | 1,859 |
| | 2,750 |
| 100,070 |
| | 110,981 |
| | 10,911 |
| | — |
|
| Corporate bonds and notes | 2,158,991 |
| | 2,108,779 |
| | 4,262 |
| | 54,474 |
| 2,254,627 |
| | 2,362,004 |
| | 108,541 |
| | 1,164 |
|
| RMBS | 258,152 |
| | 250,056 |
| (2) | 4 |
| | 8,100 |
| 605,687 |
| | 619,935 |
| | 15,286 |
| | 1,038 |
|
| CMBS | 536,982 |
| | 525,858 |
| | 363 |
| | 11,487 |
| 542,284 |
| | 563,338 |
| | 21,966 |
| | 912 |
|
| Other ABS | 675,686 |
| | 673,418 |
| | 967 |
| | 3,235 |
| 718,854 |
| | 717,986 |
| | 2,394 |
| | 3,262 |
|
| Total securities available for sale | $ | 3,846,057 |
| | $ | 3,770,742 |
| (3) | $ | 7,455 |
| | $ | 82,770 |
| |
| Foreign government and agency securities | | 5,089 |
| | 5,182 |
| | 93 |
| | — |
|
| Total securities available for sale, including loaned securities | | 4,403,293 |
| | 4,561,841 |
| | $ | 165,030 |
| | $ | 6,482 |
|
| Less: loaned securities | | 34,020 |
| | 34,618 |
| | | | |
| Total fixed-maturities available for sale | | $ | 4,369,273 |
| | $ | 4,527,223 |
| |
|
| |
|
|
|
| | | | | | | | | | | | | | | |
| | December 31, 2018 |
| (In thousands) | Amortized Cost | | Fair Value | | Gross Unrealized Gains | | Gross Unrealized Losses |
| Fixed-maturities available for sale: | | | | | | | |
| U.S. government and agency securities | $ | 85,532 |
| | $ | 84,070 |
| | $ | 46 |
| | $ | 1,508 |
|
| State and municipal obligations | 138,022 |
| | 138,313 |
| | 2,191 |
| | 1,900 |
|
| Corporate bonds and notes | 2,288,720 |
| | 2,229,885 |
| | 5,053 |
| | 63,888 |
|
| RMBS | 334,843 |
| | 332,142 |
| | 1,785 |
| | 4,486 |
|
| CMBS | 546,729 |
| | 539,915 |
| | 544 |
| | 7,358 |
|
| Other ABS | 712,748 |
| | 704,662 |
| | 814 |
| | 8,900 |
|
| Total securities available for sale, including loaned securities | 4,106,594 |
| | 4,028,987 |
| | $ | 10,433 |
| | $ | 88,040 |
|
| Less: loaned securities | 7,632 |
| | 7,412 |
| | | | |
| Total fixed-maturities available for sale | $ | 4,098,962 |
| | $ | 4,021,575 |
| |
|
| |
|
|
______________________
| |
(1) | Includes securities with a fair value of $10.5 million serving as collateral for FHLB advances. |
| |
(2) | Includes securities with a fair value of $66.1 million serving as collateral for FHLB advances. |
| |
(3) | Includes $7.0 million of fixed-maturity securities loaned to third-party Borrowers under securities lending agreements, classified as other assets in our condensed consolidated balance sheets, as further described below. |
|
| | | | | | | | | | | | | | | |
| | December 31, 2017 |
| (In thousands) | Amortized Cost | | Fair Value | | Gross Unrealized Gains | | Gross Unrealized Losses |
| Fixed-maturities available for sale: | | | | | | | |
| U.S. government and agency securities | $ | 69,667 |
| | $ | 69,396 |
| | $ | 96 |
| | $ | 367 |
|
| State and municipal obligations | 156,587 |
| | 161,722 |
| | 5,834 |
| | 699 |
|
| Corporate bonds and notes | 1,869,318 |
| | 1,894,886 |
| | 33,620 |
| | 8,052 |
|
| RMBS | 189,455 |
| | 187,229 |
| | 636 |
| | 2,862 |
|
| CMBS | 451,595 |
| | 453,394 |
| | 3,409 |
| | 1,610 |
|
| Other ABS | 672,715 |
| | 674,548 |
| | 2,655 |
| | 822 |
|
| Foreign government and agency securities | 31,417 |
| | 32,207 |
| | 823 |
| | 33 |
|
| Total fixed-maturities available for sale | 3,440,754 |
| | 3,473,382 |
| (1) | 47,073 |
| | 14,445 |
|
Equity securities available for sale (2) | 176,349 |
| | 176,065 |
| (1) | 1,705 |
| | 1,989 |
|
| Total debt and equity securities available for sale | $ | 3,617,103 |
| | $ | 3,649,447 |
| | $ | 48,778 |
| | $ | 16,434 |
|
______________________
| |
(1) | Includes $14.7 million of fixed maturity securities and $13.2 million of equity securities loaned to third-party Borrowers under securities lending agreements, classified as other assets in our condensed consolidated balance sheets, as further described below. |
| |
(2) | Primarily consists of investments in fixed-income and equity exchange-traded funds and publicly-traded business development company equities. |
For the nine months ended September 30, 2018, we did not transfer any securities from the available for sale or trading categories.
Radian Group Inc.
Notes to Unaudited Condensed Consolidated Financial Statements — (Continued)
Gross Unrealized Losses and Fair Value of Available for Sale Securities
For securities deemed “available for sale” and that are in an unrealized loss position, the following tables show the gross unrealized losses and fair values, aggregated by investment category and length of time that individual securities have been in a continuous unrealized loss position, as of the dates indicated. Included in the amounts as of September 30, 20182019 and December 31, 20172018 are loaned securities under securities lending agreements that are classified as other assets in our condensed consolidated balance sheets, as further described below.
Radian Group Inc.
Notes to Unaudited Condensed Consolidated Financial Statements (Continued)
| | | | | September 30, 2018 | | September 30, 2019 |
($ in thousands) Description of Securities | | Less Than 12 Months | | 12 Months or Greater | | Total | | Less Than 12 Months | | 12 Months or Greater | | Total |
| | # of securities | | Fair Value | | Unrealized Losses | | # of securities | | Fair Value | | Unrealized Losses | | # of securities | | Fair Value | | Unrealized Losses | | # of securities | | Fair Value | | Unrealized Losses | | # of securities | | Fair Value | | Unrealized Losses | | # of securities | | Fair Value | | Unrealized Losses |
| U.S. government and agency securities | | 9 |
| | $ | 39,342 |
| | $ | 1,944 |
| | 5 |
| | $ | 11,758 |
| | $ | 780 |
| | 14 |
| | $ | 51,100 |
| | $ | 2,724 |
| | 4 |
| | $ | 68,719 |
| | $ | 89 |
| | 3 |
| | $ | 9,051 |
| | $ | 17 |
| | 7 |
| | $ | 77,770 |
| | $ | 106 |
|
| State and municipal obligations | | 25 |
| | 76,914 |
| | 2,166 |
| | 6 |
| | 13,172 |
| | 584 |
| | 31 |
| | 90,086 |
| | 2,750 |
| |
| Corporate bonds and notes | | 383 |
| | 1,619,774 |
| | 43,840 |
| | 35 |
| | 157,323 |
| | 10,634 |
| | 418 |
| | 1,777,097 |
| | 54,474 |
| | 28 |
| | 126,732 |
| | 1,145 |
| | 4 |
| | 8,543 |
| | 19 |
| | 32 |
| | 135,275 |
| | 1,164 |
|
| RMBS | | 23 |
| | 169,259 |
| | 3,271 |
| | 28 |
| | 80,158 |
| | 4,829 |
| | 51 |
| | 249,417 |
| | 8,100 |
| | 5 |
| | 30,478 |
| | 52 |
| | 23 |
| | 44,649 |
| | 986 |
| | 28 |
| | 75,127 |
| | 1,038 |
|
| CMBS | | 78 |
| | 423,684 |
| | 10,098 |
| | 11 |
| | 26,830 |
| | 1,389 |
| | 89 |
| | 450,514 |
| | 11,487 |
| | 18 |
| | 32,861 |
| | 724 |
| | 10 |
| | 9,120 |
| | 188 |
| | 28 |
| | 41,981 |
| | 912 |
|
| Other ABS | | 118 |
| | 461,978 |
| | 3,002 |
| | 16 |
| | 24,890 |
| | 233 |
| | 134 |
| | 486,868 |
| | 3,235 |
| | 60 |
| | 257,688 |
| | 1,003 |
| | 40 |
| | 155,904 |
| | 2,259 |
| | 100 |
| | 413,592 |
| | 3,262 |
|
| Total | | 636 |
| | $ | 2,790,951 |
| | $ | 64,321 |
| | 101 |
| | $ | 314,131 |
| | $ | 18,449 |
| | 737 |
| | $ | 3,105,082 |
| | $ | 82,770 |
| | 115 |
| | $ | 516,478 |
| | $ | 3,013 |
| | 80 |
| | $ | 227,267 |
| | $ | 3,469 |
| | 195 |
| | $ | 743,745 |
| | $ | 6,482 |
|
| | | | | December 31, 2017 | | December 31, 2018 |
($ in thousands) Description of Securities | | Less Than 12 Months | | 12 Months or Greater | | Total | | Less Than 12 Months | | 12 Months or Greater | | Total |
| | # of securities | | Fair Value | | Unrealized Losses | | # of securities | | Fair Value | | Unrealized Losses | | # of securities | | Fair Value | | Unrealized Losses | | # of securities | | Fair Value | | Unrealized Losses | | # of securities | | Fair Value | | Unrealized Losses | | # of securities | | Fair Value | | Unrealized Losses |
| U.S. government and agency securities | | 6 |
| | $ | 23,309 |
| | $ | 129 |
| | 3 |
| | $ | 9,799 |
| | $ | 238 |
| | 9 |
| | $ | 33,108 |
| | $ | 367 |
| | 2 |
| | $ | 27,415 |
| | $ | 796 |
| | 8 |
| | $ | 23,476 |
| | $ | 712 |
| | 10 |
| | $ | 50,891 |
| | $ | 1,508 |
|
| State and municipal obligations | | 21 |
| | 65,898 |
| | 699 |
| | — |
| | — |
| | — |
| | 21 |
| | 65,898 |
| | 699 |
| | 12 |
| | 41,263 |
| | 955 |
| | 16 |
| | 39,982 |
| | 945 |
| | 28 |
| | 81,245 |
| | 1,900 |
|
| Corporate bonds and notes | | 152 |
| | 672,318 |
| | 4,601 |
| | 32 |
| | 139,105 |
| | 3,451 |
| | 184 |
| | 811,423 |
| | 8,052 |
| | 330 |
| | 1,208,430 |
| | 36,284 |
| | 126 |
| | 601,533 |
| | 27,604 |
| | 456 |
| | 1,809,963 |
| | 63,888 |
|
| RMBS | | 8 |
| | 19,943 |
| | 204 |
| | 26 |
| | 101,812 |
| | 2,658 |
| | 34 |
| | 121,755 |
| | 2,862 |
| | 15 |
| | 92,315 |
| | 782 |
| | 28 |
| | 77,395 |
| | 3,704 |
| | 43 |
| | 169,710 |
| | 4,486 |
|
| CMBS | | 35 |
| | 139,353 |
| | 1,395 |
| | 4 |
| | 3,518 |
| | 215 |
| | 39 |
| | 142,871 |
| | 1,610 |
| | 62 |
| | 328,696 |
| | 3,973 |
| | 33 |
| | 125,728 |
| | 3,385 |
| | 95 |
| | 454,424 |
| | 7,358 |
|
| Other ABS | | 92 |
| | 260,864 |
| | 777 |
| | 7 |
| | 8,297 |
| | 45 |
| | 99 |
| | 269,161 |
| | 822 |
| | 129 |
| | 503,109 |
| | 7,917 |
| | 26 |
| | 89,628 |
| | 983 |
| | 155 |
| | 592,737 |
| | 8,900 |
|
| Foreign government and agency securities | | 5 |
| | 7,397 |
| | 33 |
| | — |
| | — |
| | — |
| | 5 |
| | 7,397 |
| | 33 |
| |
| Equity securities | | 13 |
| | 149,785 |
| | 1,989 |
| | — |
| | — |
| | — |
| | 13 |
| | 149,785 |
| | 1,989 |
| |
| Total | | 332 |
| | $ | 1,338,867 |
| | $ | 9,827 |
| | 72 |
| | $ | 262,531 |
| | $ | 6,607 |
| | 404 |
| | $ | 1,601,398 |
| | $ | 16,434 |
| | 550 |
| | $ | 2,201,228 |
| | $ | 50,707 |
| | 237 |
| | $ | 957,742 |
| | $ | 37,333 |
| | 787 |
| | $ | 3,158,970 |
| | $ | 88,040 |
|
Although we held available for sale securities in an unrealized loss position as of September 30, 2018,2019, we did not consider those securities to be other-than-temporarily impaired as of such date. For all investment categories, the unrealized losses of 12 months or greater duration as of September 30, 20182019 were generally caused by interest rate or credit spread movements since the purchase date, and as such, we expect to recover the amortized cost basis of these securities. As of September 30, 2018,2019, we did not have the intent to sell any debtavailable for sale securities in an unrealized loss position, and we determined that it is more likely than not that we will not be required to sell the securities before recovery of their cost basis, which may be at maturity; therefore, we did not consider these investments to be other-than-temporarily impaired at September 30, 2018.
Radian Group Inc.
Notes to Unaudited Condensed Consolidated Financial Statements — (Continued)
Other-than-temporary Impairment Activity. To the extent we determine that a security is deemed to have had an other-than-temporary impairment, an impairment loss is recognized. During the nine months ended September 30, 2018, we recordedWe recognized 0 other-than-temporary impairment losses in earnings of $1.7 million due to our intent to sell certain: (i) corporate bonds and notes and (ii) state and municipal obligations, each with an amortized cost basis greater than their fair value. While we recognized other-than-temporary impairment losses related to our intent to sell securities, there were no credit-related impairment losses recognized in earnings during the nine months ended September 30, 2018.
During2019 and $1.7 million of other-than-temporary impairment losses in earnings for the nine months ended September 30, 2017, we recorded other-than-temporary impairment losses in earnings of $1.0 million, including $0.5 million related to a convertible note of a non-public company issuer included in debt securities and $0.5 million related to a privately-placed equity security, because we concluded that we would not recover the amortized cost basis of these securities due to credit deterioration.2018. There were no0 other-than-temporary impairment losses recognized in accumulated other comprehensive income (loss) during the nine months ended September 30, 2018 or the year ended December 31, 2017.
Trading Securities
The trading securities within our investment portfolio, which are recorded at fair value, consisted of the following as of the dates indicated:
|
| | | | | | | | |
| (In thousands) | September 30,
2018 | | December 31,
2017 | |
| Trading securities: | | | | |
| State and municipal obligations | $ | 185,494 |
| | $ | 214,841 |
| |
| Corporate bonds and notes | 235,422 |
| | 307,271 |
| |
| RMBS | 22,069 |
| | 29,520 |
| |
| CMBS | 50,971 |
| | 50,561 |
| |
| Foreign government and agency securities | — |
| | 4,241 |
| |
| Total | $ | 493,956 |
| | $ | 606,434 |
| (1) |
______________________for those periods.
| |
(1) | At December 31, 2017, includes a de minimis amount of loaned securities under securities lending agreements that are classified as other assets in our consolidated balance sheets, as further described below. |
Securities Lending Agreements
During the third quarter of 2017, we commenced participationWe participate in a securities lending program whereby we loan certain securities in our investment portfolio to Borrowersthird-party borrowers for short periods of time. These securities lending agreements are collateralized financing arrangements whereby we transfer securities to third parties through an intermediary in exchange for cash or other securities. In all of our securities lending agreements, the securities we transfer to Borrowers (loaned securities) may be transferred or loaned by the Borrowers; however, we maintain effective control over all loaned securities, including: (i) retaining ownership of the securities; (ii) receiving the related investment or other income; and (iii) having the right to request the return of the loaned securities at any time. Although we report such securities at fair value within other assets in our condensed consolidated balance sheets, rather than within investments, the detailed information regarding investments providedwe provide in this Note 5 includes these securities.
Under See Note 4 for additional detail on the loaned securities, and see Notes 2 and 6 of Notes to Consolidated Financial Statements in our 2018 Form 10-K for additional information about our accounting policies with respect to our securities lending agreements the Borrower is required to provide to us collateral, consisting of cash or securities, in amounts generally equal to or exceeding (i) 102% of the value of the loaned securities (105% in the case of foreign securities) or (ii) another agreed-upon percentage not less than 100% of the market value of the loaned securities. Any cash collateral we receive may be invested in liquid assets.
The Borrower generally may return the loaned securities to us at any time, which would require us to returnand the collateral within the standard settlement period for the loaned securities on the principal exchange or market in which the securities are traded. We manage this liquidity risk associated with cash collateral by maintaining the cash collateral in a short-term money-market fund with daily availability. The credit risk under these programs is reduced by the amounts of collateral received. On a daily basis, the value of the underlying securities that we have loaned to the Borrowers is compared to the value of cash and securities collateral we received from the Borrowers, and additional cash or securities are requested or returned, as applicable. In addition, we are indemnified against counterparty credit risk by the intermediary.requirements thereunder, respectively.
Radian Group Inc.
Notes to Unaudited Condensed Consolidated Financial Statements — (Continued)
Key balances related toAll of our securities lending agreements consisted of the followingare classified as overnight and revolving. Securities collateral on deposit with us from third-party borrowers totaling $32.3 million and $16.8 million as of September 30, 2019 and December 31, 2018, respectively, may not be transferred or re-pledged unless the dates indicated:third-party borrower is in default, and is therefore not reflected in our condensed consolidated financial statements.
Net Gains (Losses) on Investments
Net gains (losses) on investments consisted of:
|
| | | | | | | | | | | | | | | |
| | Three Months Ended
September 30, | | Nine Months Ended
September 30, |
| (In thousands) | 2019 | | 2018 | | 2019 | | 2018 |
| Net realized gains (losses): | | | | | | | |
Fixed-maturities available for sale (1) | $ | 4,401 |
| | $ | (4,219 | ) | | $ | 5,209 |
| | $ | (9,030 | ) |
| Trading securities | 19 |
| | (260 | ) | | (391 | ) | | (910 | ) |
| Equity securities | (28 | ) | | (69 | ) | | (708 | ) | | 571 |
|
| Other investments | 205 |
| | 101 |
| | 521 |
| | 392 |
|
| Net realized gains (losses) on investments | 4,597 |
| | (4,447 | ) | | 4,631 |
| | (8,977 | ) |
| Other-than-temporary impairment losses | — |
| | (900 | ) | | — |
| | (1,744 | ) |
| Net unrealized gains (losses) on investments | 4,419 |
| | 1,405 |
| | 33,005 |
| | (17,132 | ) |
| Total net gains (losses) on investments | $ | 9,016 |
| | $ | (3,942 | ) | | $ | 37,636 |
| | $ | (27,853 | ) |
|
| | | | | | | |
| (In thousands) | September 30,
2018 | | December 31,
2017 |
Loaned securities (1): | | | |
| U.S. government and agency securities | $ | 90 |
| | $ | — |
|
| Corporate bonds and notes | 7,427 |
| | 13,862 |
|
| Foreign government and agency securities | — |
| | 867 |
|
| Equity securities | 26,847 |
| | 13,235 |
|
| Total loaned securities, at fair value | $ | 34,364 |
| | $ | 27,964 |
|
| | | | |
| Total loaned securities, at amortized cost | $ | 34,651 |
| | $ | 27,846 |
|
Securities collateral on deposit from Borrowers (2) | 3,367 |
| | 9,342 |
|
Reinvested cash collateral, at estimated fair value (3) | 31,799 |
| | 19,357 |
|
______________________
| |
(1) | Our securities loaned under securities lending agreements are reported at fair value within other assets in our condensed consolidated balance sheets. All of our securities lending agreements are classified as overnight and revolving. None of the amounts are subject to offsetting. |
| |
(2) | Securities collateral on deposit with us from Borrowers may not be transferred or re-pledged unless the Borrower is in default, and is therefore not reflected in our condensed consolidated financial statements. |
| |
(3) | All cash collateral received has been reinvested in accordance with the securities lending agreements and is included in short-term investments in our condensed consolidated balance sheets. Amounts payable on the return of cash collateral under securities lending agreements are included within other liabilities in our condensed consolidated balance sheets. |
(1)Components of net realized gains (losses) on fixed-maturities available for sale include: |
| | | | | | | | | | | | | | | |
| | Three Months Ended
September 30, | | Nine Months Ended
September 30, |
| (In thousands) | 2019 | | 2018 | | 2019 | | 2018 |
| Gross investment gains from sales and redemptions | $ | 4,697 |
| | $ | 814 |
| | $ | 10,926 |
| | $ | 1,831 |
|
| Gross investment losses from sales and redemptions | (296 | ) | | (5,033 | ) | | (5,717 | ) | | (10,861 | ) |
The net changes in unrealized gains (losses) recognized in earnings on investments that were still held at each period-end were as follows: |
| | | | | | | | | | | | | | | |
| | Three Months Ended
September 30, | | Nine Months Ended
September 30, |
| (In thousands) | 2019 | | 2018 | | 2019 | | 2018 |
| Net unrealized gains (losses) on investments still held: | | | | | | | |
| Trading securities | $ | 4,132 |
| | $ | (2,581 | ) | | $ | 18,962 |
| | $ | (18,431 | ) |
| Equity securities | 563 |
| | 2,971 |
| | 9,170 |
| | 2,238 |
|
| Other investments | 47 |
| | 430 |
| | (64 | ) | | 655 |
|
| Net unrealized gains (losses) on investments still held | $ | 4,742 |
| | $ | 820 |
| | $ | 28,068 |
| | $ | (15,538 | ) |
Radian Group Inc.
Notes to Unaudited Condensed Consolidated Financial Statements — (Continued)
Net Gains (Losses) on Investments and Other Financial Instruments
Net gains (losses) on investments and other financial instruments consisted of:
|
| | | | | | | | | | | | | | | |
| | Three Months Ended
September 30, | | Nine Months Ended
September 30, |
| (In thousands) | 2018 | | 2017 | | 2018 | | 2017 |
| Net realized gains (losses): | | | | | | | |
Fixed-maturities available for sale (1) | $ | (4,219 | ) | | $ | 137 |
| | $ | (9,030 | ) | | $ | (3,552 | ) |
| Equity securities | (69 | ) | | 33 |
| | 571 |
| | 418 |
|
| Trading securities | (260 | ) | | (223 | ) | | (910 | ) | | (6,266 | ) |
| Short-term investments | 7 |
| | 14 |
| | — |
| | (18 | ) |
| Other invested assets | 83 |
| | — |
| | 346 |
| | — |
|
| Other gains (losses) | 11 |
| | 7 |
| | 46 |
| | 25 |
|
| Net realized gains (losses) on investments | (4,447 | ) | | (32 | ) | | (8,977 | ) | | (9,393 | ) |
| Other-than-temporary impairment losses | (900 | ) | | — |
| | (1,744 | ) | | (1,000 | ) |
Net unrealized gains (losses) on investment securities (2) | 1,405 |
| | 2,353 |
| | (17,132 | ) | | 14,517 |
|
| Total net gains (losses) on investments | (3,942 | ) | | 2,321 |
| | (27,853 | ) | | 4,124 |
|
| Net gains (losses) on other financial instruments | (538 | ) | | 159 |
| | (2,918 | ) | | 836 |
|
| Net gains (losses) on investments and other financial instruments | $ | (4,480 | ) | | $ | 2,480 |
| | $ | (30,771 | ) | | $ | 4,960 |
|
______________________
(1)Components of net realized gains (losses) on fixed-maturities available for sale include: |
| | | | | | | | | | | | | | | |
| | Three Months Ended
September 30, | | Nine Months Ended
September 30, |
| (In thousands) | 2018 | | 2017 | | 2018 | | 2017 |
| Gross investment gains from sales and redemptions | $ | 814 |
| | $ | 419 |
| | $ | 1,831 |
| | $ | 5,150 |
|
| Gross investment losses from sales and redemptions | (5,033 | ) | | (282 | ) | | (10,861 | ) | | (8,702 | ) |
| |
(2) | These amounts include unrealized gains (losses) on investment securities other than securities available for sale. For the three and nine months ended September 30, 2017, the unrealized gains (losses) on investments exclude the net change in unrealized gains and losses on equity securities. Prior to the implementation of the update to the standard for the accounting of financial instruments effective January 1, 2018, the unrealized gains (losses) associated with equity securities were classified in accumulated other comprehensive income. |
Radian Group Inc.
Notes to Unaudited Condensed Consolidated Financial Statements — (Continued)
Net Unrealized Gains (Losses) on Investment Securities
The net changes in unrealized gains (losses) from trading securities and equity securities still held at period end were as follows for the periods indicated:
|
| | | | | | | | | | | | | | | |
| | Three Months Ended
September 30, | | Nine Months Ended
September 30, |
| (In thousands) | 2018 | | 2017 | | 2018 | | 2017 |
Net changes in unrealized gains (losses) (1): | | | | | | | |
| Equity securities | $ | 2,971 |
| | $ | — |
| | $ | 2,238 |
| | $ | — |
|
Trading securities (2) | (2,622 | ) | | 2,694 |
| | (18,506 | ) | | 10,011 |
|
| Net changes in unrealized gains (losses) on investment securities | $ | 349 |
| | $ | 2,694 |
| | $ | (16,268 | ) | | $ | 10,011 |
|
______________________
| |
(1) | Related only to securities still held at period end. All amounts shown are included in net gains (losses) on investments and other financial instruments. Prior to the implementation of the update to the standard for the accounting of financial instruments effective January 1, 2018, the unrealized losses associated with equity securities were classified in accumulated other comprehensive income. |
| |
(2) | Includes a de minimis amount of net changes in unrealized gains (losses) related to short-term securities. |
Contractual Maturities
The contractual maturities of fixed-maturity investmentsfixed-maturities available for sale were as follows:
| | | | September 30, 2018 | September 30, 2019 |
| | Available for Sale | Available for Sale |
| (In thousands) | Amortized Cost | | Fair Value | Amortized Cost | | Fair Value |
Due in one year or less (1) | $ | 51,228 |
| | $ | 51,101 |
| $ | 132,819 |
| | $ | 132,897 |
|
Due after one year through five years (1) | 823,314 |
| | 809,555 |
| 885,660 |
| | 903,546 |
|
Due after five years through 10 years (1) | 1,099,144 |
| | 1,065,556 |
| 1,108,946 |
| | 1,168,298 |
|
Due after 10 years (1) | 401,551 |
| | 395,198 |
| 409,043 |
| | 455,841 |
|
RMBS (2) | 258,152 |
| | 250,056 |
| 605,687 |
| | 619,935 |
|
CMBS (2) | 536,982 |
| | 525,858 |
| 542,284 |
| | 563,338 |
|
Other ABS (2) | 675,686 |
| | 673,418 |
| 718,854 |
| | 717,986 |
|
Total (3) | $ | 3,846,057 |
| | $ | 3,770,742 |
| |
| Total | | 4,403,293 |
| | 4,561,841 |
|
| Less: loaned securities | | 34,020 |
| | 34,618 |
|
| Total fixed-maturities available for sale | | $ | 4,369,273 |
| | $ | 4,527,223 |
|
______________________
| |
| (1) | Actual maturities may differ as a result of calls before scheduled maturity. |
| |
| (2) | RMBS, CMBS and Other ABS are shown separately, as they are not due at a single maturity date. |
| |
(3) | Includes securities loaned under securities lending agreements. |
Other
AtFor the nine months ended September 30, 2018, Radian had an aggregate amount of $76.6 million of U.S. government and agency2019, we did not transfer any securities and RMBS, classified asfrom the available for sale or trading categories.
Our fixed-maturities available for sale within our investmentinclude securities portfolio,totaling $110.0 million and $88.4 million at September 30, 2019 and December 31, 2018, respectively, serving as collateral for our FHLB advances. There were no FHLB advances outstanding at December 31, 2017. See Note 1211 for additional information.information about our FHLB advances.
Securities on deposit with various state insurance commissioners amounted to $15.4Our fixed-maturities available for sale include securities totaling $16.8 million and $11.8$17.6 million at September 30, 20182019 and December 31, 2017, respectively.2018, respectively, on deposit and serving as collateral with various state regulatory authorities.
Radian Group Inc.
Notes to Unaudited Condensed Consolidated Financial Statements — (Continued)
6. Goodwill and Other Acquired Intangible Assets, Net
All of our goodwill and other acquired intangible assets relate to our Services segment. The purchase price allocation for the acquisition of Five Bridges in December 2018 was finalized in the first quarter of 2019. In comparison to the preliminary fair value amounts recorded as of December 31, 2018, the final calculations resulted in: (i) an increase in goodwill of $0.5 million and (ii) decreases in intangible assets of $0.4 million related to technology and $0.1 million related to client relationships.
The following table shows the changes in the carrying amount of goodwill for the year-to-date periods ended December 31, 2018 and September 30, 2018 and December 31, 2017:2019:
| | | (In thousands) | Goodwill | | Accumulated Impairment Losses | | Net | Goodwill | | Accumulated Impairment Losses | | Net |
| Balance at December 31, 2016 | $ | 197,265 |
| | $ | (2,095 | ) | | $ | 195,170 |
| |
| Goodwill acquired | 126 |
| | — |
| | 126 |
| |
| Impairment losses | — |
| | (184,374 | ) | | (184,374 | ) | |
| Balance at December 31, 2017 | 197,391 |
| | (186,469 | ) | | 10,922 |
| $ | 197,391 |
| | $ | (186,469 | ) | | $ | 10,922 |
|
| Goodwill acquired | — |
| | — |
| | — |
| 3,170 |
| | — |
| | 3,170 |
|
| Impairment losses | — |
| | — |
| | — |
| |
| Balance at September 30, 2018 | $ | 197,391 |
| | $ | (186,469 | ) | | $ | 10,922 |
| |
| Balance at December 31, 2018 | | 200,561 |
| | (186,469 | ) | | 14,092 |
|
| Goodwill acquired | | 538 |
| | — |
| | 538 |
|
| Balance at September 30, 2019 | | $ | 201,099 |
| | $ | (186,469 | ) | | $ | 14,630 |
|
Accounting Policy Considerations
Goodwill is an asset representing the estimated future economic benefits arising from the assets we have acquired that are not individually identified and separately recognized, and includes the value
26
In the third quarter of 2018, we performed a qualitative assessment of goodwill and other acquired intangible assets and considered factors such as: (i) the decline in and timing of revenues during 2018 for the Services segment (as compared to the forecasted amounts for the same period); (ii) the current carrying amount of reporting unit and asset groupings; and (iii) our recent goodwill impairment test and recognition of impairment charges. Based on our qualitative assessment in the third quarter of 2018, we concluded that it is not “more likely than not” that the fair value of the Services reporting unit is less than its carrying amount as of September 30, 2018. In addition, we concluded that the carrying amounts of other acquired intangible assets are supported by projected earnings. We monitor the performance of the Services segment each quarter, including through our annual impairment assessment planned for the fourth quarter of 2018.GlossaryFor additional information on our accounting policies for goodwill and other acquired intangible assets, see Note 2 of Radian Group Inc.
Notes to Unaudited Condensed Consolidated Financial Statements in our 2017 Form 10-K.(Continued)
Other Acquired Intangible Assets
The following is a summary of the gross and net carrying amounts and accumulated amortization of our other acquired intangible assets as of the periods indicated:
| | | | September 30, 2018 | September 30, 2019 |
| (In thousands) | Original Amount Acquired | | Accumulated Amortization and Impairment | | Net Carrying Amount | Original Amount Acquired | | Accumulated Amortization and Impairment | | Net Carrying Amount |
Client relationships (1) | $ | 82,530 |
| | $ | (46,569 | ) | | $ | 35,961 |
| |
Technology (2) | 15,250 |
| | (11,567 | ) | | 3,683 |
| |
| Client relationships | | $ | 83,860 |
| | $ | (52,764 | ) | | $ | 31,096 |
|
| Technology | | 16,964 |
| | (14,382 | ) | | 2,582 |
|
| Trade name and trademarks | 8,340 |
| | (3,649 | ) | | 4,691 |
| 8,340 |
| | (4,511 | ) | | 3,829 |
|
| Client backlog | 6,680 |
| | (6,680 | ) | | — |
| |
| Non-competition agreements | 185 |
| | (175 | ) | | 10 |
| 185 |
| | (183 | ) | | 2 |
|
| Licenses | 463 |
| | (23 | ) | | 440 |
| 463 |
| | (69 | ) | | 394 |
|
| Total | $ | 113,448 |
| | $ | (68,663 | ) | | $ | 44,785 |
| $ | 109,812 |
| | $ | (71,909 | ) | | $ | 37,903 |
|
|
| | | | | | | | | | | |
| | December 31, 2018 |
| (In thousands) | Original Amount Acquired | | Accumulated Amortization and Impairment | | Net Carrying Amount |
| Client relationships | $ | 84,000 |
| | $ | (48,227 | ) | | $ | 35,773 |
|
| Technology | 17,362 |
| | (13,141 | ) | | 4,221 |
|
| Trade name and trademarks | 8,340 |
| | (3,864 | ) | | 4,476 |
|
| Non-competition agreements | 185 |
| | (177 | ) | | 8 |
|
| Licenses | 463 |
| | (35 | ) | | 428 |
|
| Total | $ | 110,350 |
| | $ | (65,444 | ) | | $ | 44,906 |
|
For additional information on our accounting policies for goodwill and other acquired intangible assets, see Notes 2 and 7 of Notes to Consolidated Financial Statements in our 2018 Form 10-K.
7. Reinsurance
In our mortgage insurance and title insurance businesses, we use reinsurance as part of our risk distribution strategy, including to manage our capital position and risk profile. See Note 8 of Notes to Consolidated Financial Statements in our 2018 Form 10-K for more information about our use of reinsurance in our title insurance business.
The reinsurance arrangements for our mortgage insurance business include premiums ceded under the QSR Program, the Single Premium QSR Program and the Excess-of-Loss Program.
Radian Group Inc.
Notes to Unaudited Condensed Consolidated Financial Statements — (Continued)
|
| | | | | | | | | | | |
| | December 31, 2017 |
| (In thousands) | Original Amount Acquired | | Accumulated Amortization | | Net Carrying Amount |
Client relationships (1) | $ | 82,530 |
| | $ | (41,596 | ) | | $ | 40,934 |
|
Technology (2) | 15,250 |
| | (8,922 | ) | | 6,328 |
|
| Trade name and trademarks | 8,340 |
| | (3,003 | ) | | 5,337 |
|
| Client backlog | 6,680 |
| | (6,006 | ) | | 674 |
|
| Non-competition agreements | 185 |
| | (168 | ) | | 17 |
|
| Total | $ | 112,985 |
| | $ | (59,695 | ) | | $ | 53,290 |
|
______________________
| |
(1) | Includes a cumulative impairment charge of $14.9 million. |
| |
(2) | Includes a cumulative impairment charge of $0.9 million. |
The estimated aggregate amortization expense for the remainder of 2018 and thereafter is as follows (in thousands):
|
| | | |
| 2018 | $ | 3,461 |
|
| 2019 | 8,146 |
|
| 2020 | 6,827 |
|
| 2021 | 5,413 |
|
| 2022 | 4,881 |
|
| 2023 | 4,430 |
|
| Thereafter | 11,627 |
|
| Total | $ | 44,785 |
|
Generally, for tax purposes, substantially all of our goodwill and other acquired intangible assets are deductible and will be amortized over a period of 15 years from acquisition.
7. Reinsurance
Radian’s reinsurance programs represent a component of our long-term risk distribution strategy. From time to time, we have entered into reinsurance transactions as part of our strategy to manage our capital position and risk profile, which includes managing Radian Guaranty’s position under the PMIERs financial requirements. The credit that we receive under the PMIERs financial requirements for these transactions is subject to periodic review by the GSEs.
The effect of all of our reinsurance programs on our mortgage insurance net premiums written and earnedincome is as follows:
| | | | Three Months Ended
September 30, |
| Nine Months Ended
September 30, | Three Months Ended
September 30, |
| Nine Months Ended
September 30, |
| (In thousands) | 2018 |
| 2017 |
| 2018 |
| 2017 | 2019 |
| 2018 |
| 2019 |
| 2018 |
| Net premiums written—insurance: | | | | | | | | | | | | | | |
| Direct | $ | 278,118 |
| | $ | 265,927 |
| | $ | 819,812 |
| | $ | 766,219 |
| $ | 287,000 |
| | $ | 279,137 |
| | $ | 828,022 |
| | $ | 820,449 |
|
Ceded (1) | (24,291 | ) | | (18,117 | ) | | (76,047 | ) | | (52,437 | ) | |
Assumed (1) | | 2,608 |
| | 1,987 |
| | 7,528 |
| | 4,803 |
|
Ceded (2) | | (15,455 | ) | | (24,348 | ) | | (39,900 | ) | | (76,162 | ) |
| Net premiums written—insurance | $ | 253,827 |
| | $ | 247,810 |
| | $ | 743,765 |
| | $ | 713,782 |
| $ | 274,153 |
| | $ | 256,776 |
| | $ | 795,650 |
| | $ | 749,090 |
|
| | | | | | | | | |
| Net premiums earned—insurance: | | | | | | | | | | | | | | |
| Direct | $ | 271,487 |
| | $ | 250,541 |
| | $ | 795,811 |
| | $ | 729,832 |
| $ | 305,493 |
| | $ | 272,505 |
| | $ | 919,507 |
| (3) | $ | 796,448 |
|
| Assumed | 6 |
| | 7 |
| | 19 |
| | 21 |
| |
Ceded (1) | (16,011 | ) | | (13,846 | ) | | (48,830 | ) | | (42,255 | ) | |
Assumed (1) | | 2,614 |
| | 1,994 |
| | 7,545 |
| | 4,822 |
|
Ceded (2) | | (26,922 | ) | | (16,068 | ) | | (83,189 | ) | (3) | (48,945 | ) |
| Net premiums earned—insurance | $ | 255,482 |
| | $ | 236,702 |
| | $ | 747,000 |
| | $ | 687,598 |
| $ | 281,185 |
| | $ | 258,431 |
| | $ | 843,863 |
| (3) | $ | 752,325 |
|
| | | | | | | | | |
| Ceding commissions earned | | $ | 12,153 |
| | $ | 8,373 |
| | $ | 37,191 |
| (3) | $ | 25,728 |
|
| Ceded losses | | 771 |
| | 1,191 |
| | 4,326 |
| | 3,356 |
|
______________________
| |
| (1) | Includes premiums earned from our participation in certain credit risk transfer programs. |
| |
| (2) | Net of profit commission. |
Radian Group Inc.
Notes to Unaudited Condensed Consolidated Financial Statements — (Continued)
| |
| (3) |
| Includes a cumulative adjustment to unearned premiums recorded in the second quarter of 2019 related to an update to the amortization rates used to recognize revenue for Single Premium Policies. See Note 3 for further information. |
QSR Program
Single Premium QSR Program
In the first quarter of 2016, Radian Guaranty entered into the 2016 Single Premium QSR Agreement with a panel of third-party reinsurers. Effective December 31, 2017, we amended the 2016 Single Premium QSR Agreement to increase the amount of ceded risk on performing loans under the agreement from 35% to 65% for the 2015 through 2017 vintages. As of the effective date, the result of this amendment increased the amount of risk ceded on Single Premium Policies, including for the purposes of calculating any future ceding commissions and profit commissions that Radian Guaranty will earn. It will also increase the future amounts of our ceded premiums and ceded losses. As of January 1, 2018, Radian Guaranty is no longer ceding additional NIW under this arrangement. RIF ceded under the 2016 Single Premium QSR Agreement was $6.4$5.7 billion and $4.3$6.4 billion as of September 30, 20182019 and 2017,2018, respectively.
In October 2017, weRadian Guaranty entered into the 2018 Single Premium QSR Agreement with a panel of third-party reinsurers. Under the 2018 Single Premium QSR Agreement, we expect to cede up to 65% of our Single Premium NIW beginning with the business written in January 2018, subject to certain conditions that may affect the amount ceded, including a limitation on ceded premiumpremiums written equal to $335 million for policies issued between January 1, 2018 and December 31, 2019. Notwithstanding this limitation, the parties may mutually agree to amend the agreement, including with respect to any limitations on the amounts of insurance that may be ceded. RIF ceded under the 2018 Single Premium QSR Agreement was $2.9 billion and $1.6 billion as of September 30, 2018.2019 and 2018, respectively.
QSRExcess-of-Loss Program
Since the fourth quarter of 2018, Radian Guaranty has entered into 2 fully collateralized reinsurance arrangements with the Eagle Re Issuers. Total ceded premiums earned under our Excess-of-Loss Program were $7.5 million and $18.4 million for the three and nine months ended September 30, 2019, respectively.
The Eagle Re 2018-1 reinsurance agreement, entered into in November 2018, provides for up to $434.0 million of aggregate excess-of-loss reinsurance coverage for a specified percentage of mortgage insurance losses on new defaults on an existing portfolio of eligible Recurring Premium Policies issued between January 1, 2017 and December 31, 2017, with an initial RIF of $9.1 billion. In 2012,addition, Radian Guaranty entered into a separate excess-of-loss reinsurance agreement for up to $21.4 million of coverage, representing a pro rata share of the QSR Program with a third-party reinsurance provider. Radian Guaranty has cededcredit risk alongside the maximum amount permitted under the QSR Program and is no longer ceding NIW under these transactions. RIF ceded under the QSR Program was $1.0 billion and $1.3 billion as of September 30, 2018 and 2017, respectively.risk assumed by Eagle Re 2018-1 on
See Note 8 of Notes to Consolidated Financial Statements in our 2017 Form 10-K for more information about our reinsurance transactions.
The following tables show the amounts related to the Single Premium QSR Program and the QSR Program for the periods indicated:
|
| | | | | | | | | | | | | | | |
| | Single Premium QSR Program |
| | Three Months Ended
September 30, | | Nine Months Ended
September 30, |
| (In thousands) | 2018 | | 2017 | | 2018 | | 2017 |
Ceded premiums written (1) | $ | 20,920 |
| | $ | 13,248 |
| | $ | 64,818 |
| | $ | 36,064 |
|
Ceded premiums earned (1) | 11,181 |
| | 6,771 |
| | 32,718 |
| | 18,941 |
|
| Ceding commissions written | 8,070 |
| | 5,156 |
| | 24,571 |
| | 14,002 |
|
Ceding commissions earned (2) | 5,635 |
| | 3,536 |
| | 16,546 |
| | 9,721 |
|
| Ceded losses | 1,060 |
| | 406 |
| | 2,973 |
| | 1,443 |
|
|
| | | | | | | | | | | | | | | |
| | QSR Program |
| | Three Months Ended
September 30, | | Nine Months Ended
September 30, |
| (In thousands) | 2018 | | 2017 | | 2018 | | 2017 |
Ceded premiums written (1) | $ | 3,174 |
| | $ | 4,621 |
| | $ | 10,621 |
| | $ | 15,137 |
|
Ceded premiums earned (1) | 4,632 |
| | 6,826 |
| | 15,502 |
| | 22,064 |
|
| Ceding commissions written | 918 |
| | 1,323 |
| | 3,058 |
| | 4,328 |
|
Ceding commissions earned (2) | 2,738 |
| | 2,925 |
| | 9,182 |
| | 10,198 |
|
| Ceded losses | 131 |
| | 257 |
| | 383 |
| | 517 |
|
______________________
| |
(1) | Net of profit commission. |
| |
(2) | Includes amounts reported in policy acquisition costs and other operating expenses. |
Radian Group Inc.
Notes to Unaudited Condensed Consolidated Financial Statements — (Continued)
those Recurring Premium Policies. Eagle Re 2018-1 financed its coverage by issuing mortgage insurance-linked notes in an aggregate amount of $434.0 million to eligible third-party capital markets investors in an unregistered private offering. Radian Guaranty and its affiliates have retained the first-loss layer of $204.9 million of aggregate losses, as well as any losses in excess of the outstanding reinsurance coverage amount.
The Eagle Re 2019-1 reinsurance agreement, entered into in April 2019, provides for up to $562.0 million of aggregate excess-of-loss reinsurance coverage for a specified percentage of mortgage insurance losses on new defaults on an existing portfolio of eligible Recurring Premium Policies issued between January 1, 2018 and December 31, 2018, with an initial RIF of $10.7 billion. Eagle Re 2019-1 financed its coverage by issuing mortgage insurance-linked notes in an aggregate amount of $562.0 million to eligible third-party capital markets investors in an unregistered private offering. Radian Guaranty and its affiliates have retained the first-loss layer of $267.6 million of aggregate losses, as well as any losses in excess of the outstanding reinsurance coverage amount.
The aggregate excess-of-loss reinsurance coverage for these transactions decreases over a ten-year period as the principal balances of the underlying covered mortgages decrease and as any claims are paid by the applicable Eagle Re Issuer or the mortgage insurance is canceled. The outstanding reinsurance coverage amount will begin amortizing after an initial period in which a target level of credit enhancement is obtained and will stop amortizing if certain thresholds are reached, such as if the reinsured mortgages were to experience an elevated level of delinquencies or certain credit enhancement tests were not maintained. Radian Guaranty has rights to terminate the reinsurance agreements upon the occurrence of certain events.
The Eagle Re Issuers are not subsidiaries or affiliates of Radian Guaranty. Based on the accounting guidance that addresses VIEs, we have not consolidated any of the Eagle Re Issuers in our consolidated financial statements, because Radian does not have: (i) the power to direct the activities that most significantly affect the Eagle Re Issuers’ economic performances or (ii) the obligation to absorb losses or the right to receive benefits from the Eagle Re Issuers that potentially could be significant to the Eagle Re Issuers. See Note 2 of Notes to Consolidated Financial Statements in our 2018 Form 10-K for more information on our accounting treatment of VIEs.
The Eagle Re Issuers represent our only VIEs as of September 30, 2019. The following table presents the total assets of the Eagle Re Issuers as well as Radian Guaranty’s maximum exposure to loss associated with each Eagle Re Issuer, as of the dates indicated.
|
| | | | | | | | | | | | | | | | |
| | | At September 30, 2019 |
| | | | | Maximum Exposure to Loss |
| (In thousands) | | Total VIE Assets (1) | | On - Balance Sheet | | Off - Balance Sheet (2) | | Total |
| Eagle Re 2018-1 | | $ | 408,586 |
| | $ | 1,493 |
| (3) | $ | 408,586 |
| | $ | 410,079 |
|
| Eagle Re 2019-1 | | 562,036 |
| | 2,202 |
| (3) | 562,036 |
| | 564,238 |
|
| Total | | $ | 970,622 |
| | $ | 3,695 |
| | $ | 970,622 |
| | $ | 974,317 |
|
| | | | | | | | | |
| | | At December 31, 2018 |
| | | | | Maximum Exposure to Loss |
| (In thousands) | | Total VIE Assets (1) | | On - Balance Sheet | | Off - Balance Sheet (2) | | Total |
| Eagle Re 2018-1 | | $ | 434,034 |
| | $ | 1,114 |
| (3) | $ | 434,034 |
| | $ | 435,148 |
|
| Total | | $ | 434,034 |
| | $ | 1,114 |
| | $ | 434,034 |
| | $ | 435,148 |
|
______________________
| |
| (1) | Assets held by the Eagle Re Issuers are required to be invested in U.S. government money market funds, cash or U.S. Treasury securities. Liabilities of the Eagle Re Issuers consist of their mortgage insurance-linked notes, described above. |
| |
| (2) | Represents Radian Guaranty’s maximum exposure to loss in the event the VIE is unable to meet its obligations to us and our insurance subsidiaries would be liable to make claims payments to our policyholders. In the event that all of the assets in the reinsurance trust (consisting of U.S. government money market funds, cash or U.S. Treasury securities) were to lose their value and the VIE is unable to make its payments to us, our maximum potential loss would be the amount of mortgage insurance claim payments for losses on the insured policies, net of the aggregate reinsurance payments already received, up to the full aggregate excess-of-loss reinsurance coverage amount. In the same scenario, the related embedded derivative would no longer have value. |
| |
| (3) | Represents the fair value of the related embedded derivative, included in other assets in our condensed consolidated balance sheets. |
Radian Group Inc.
Notes to Unaudited Condensed Consolidated Financial Statements (Continued)
Collateral
Although we use reinsurance as one of our risk management tools, reinsurance does not relieve us of our obligations to our policyholders. In the event the reinsurers are unable to meet their obligations to us, our insurance subsidiaries would be liable for any defaulted amounts. However, consistent with the PMIERs reinsurer counterparty collateral requirements, Radian Guaranty’s reinsurers have established a trust to help secure our potential cash recoveries. In addition, for the Single Premium QSR Program, Radian Guaranty holds amounts received from ceded premiums written to collateralize the reinsurers’ obligations, which are reported in reinsurance funds withheld on our condensed consolidated balance sheets. Any loss recoveries and profit commissions paid to Radian Guaranty related to the Single Premium QSR Program are expected to be realized from this account.
See Note 8 of Notes to Consolidated Financial Statements in our 2018 Form 10-K for more information about our reinsurance transactions.
8. Other Assets
The following table shows the components of other assets as of the dates indicated:
| | | (In thousands) | September 30,
2018 | | December 31,
2017 | September 30,
2019 | | December 31,
2018 |
| Deposit with the IRS (Note 9) | $ | 88,557 |
| | $ | 88,557 |
| |
| Corporate-owned life insurance | 82,800 |
| | 85,862 |
| |
| Company-owned life insurance | | $ | 103,877 |
| | $ | 83,377 |
|
| Prepaid federal income taxes (Note 9) | | 89,200 |
| | — |
|
| Loaned securities (Note 5) | | 65,444 |
| | 27,860 |
|
Internal-use software (1) | 51,191 |
| | 48,751 |
| 55,190 |
| | 51,367 |
|
Property and equipment (2) | 38,060 |
| | 38,291 |
| |
Right-of-use assets (2) | | 42,613 |
| | — |
|
Property and equipment (3) | | 34,339 |
| | 37,090 |
|
| Accrued investment income | 34,430 |
| | 31,389 |
| 33,187 |
| | 34,878 |
|
| Loaned securities | 34,364 |
| | 27,964 |
| |
| Unbilled receivables | 19,580 |
| | 22,257 |
| 25,110 |
| | 19,917 |
|
| Deferred policy acquisition costs | 16,922 |
| | 16,987 |
| 19,928 |
| | 17,311 |
|
| Reinsurance recoverables | 13,542 |
| | 8,492 |
| 16,906 |
| | 14,402 |
|
Current federal income tax receivable (4) | | — |
| | 44,506 |
|
| Other | 35,826 |
| | 39,299 |
| 27,853 |
| | 36,992 |
|
| Total other assets | $ | 415,272 |
| | $ | 407,849 |
| $ | 513,647 |
| | $ | 367,700 |
|
______________________
| |
| (1) | Internal-use software, at cost, lesshas been reduced by accumulated amortization of $57.2$70.4 million and $48.4$60.3 million at September 30, 20182019 and December 31, 2017, respectively.2018, respectively, as well as $3.8 million of impairment charges in the nine months ended September 30, 2019, and $5.1 million of impairment charges in 2018. Amortization expense was $2.9$3.3 million and $2.7$2.9 million for the three-month periods ended September 30, 20182019 and 2017,2018, respectively, and $8.6$9.8 million and $7.9$8.6 million for the nine-month periods ended September 30, 20182019 and 2017,2018, respectively. |
| |
| (2) | Represents right-of-use assets recognized as a result of our adoption, as of January 1, 2019, of the new accounting and disclosure requirements for leases of property, plant and equipment. See Note 1 for additional information. Right-of-use assets are shown less accumulated amortization of $6.8 million at September 30, 2019. |
| |
| (3) | Property and equipment at cost, less accumulated depreciation of $61.0$68.5 million and $57.6$62.9 million at September 30, 20182019 and December 31, 2017,2018, respectively. Depreciation expense was $2.1$1.9 million and $1.9$2.1 million for the three-month periods ended September 30, 20182019 and 2017,2018, respectively, and $5.9 million and $4.9 million for both the nine-month periods ended September 30, 20182019 and 2017, respectively.2018. |
| |
| (4) | During the nine months ended September 30, 2019, current federal income tax receivable was reduced by our receipt of the remaining $57.2 million refund from amounts on deposit with the IRS related to the settlement of the IRS Matter. |
9. Income Taxes
For additional information onCertain entities within our income taxes, including our accounting policiesconsolidated group have generated deferred tax assets of approximately $68.0 million, relating primarily to state and the TCJA, see Notes 1 and 10local NOL carryforwards, which, if unutilized, will expire during various future tax periods. We are
Radian Group Inc.
Notes to Unaudited Condensed Consolidated Financial Statements in our 2017 Form 10-K.(Continued)
Because the TCJA was passed late in the fourth quarter of 2017 and ongoing guidance and accounting interpretation is expected throughout 2018, as of December 31, 2017, we made provisional estimates for the effects of the TCJA in accordance with Staff Accounting Bulletin No. 118, “Income Tax Accounting Implications of the Tax Cuts and Jobs Act” (“SAB 118,” issued by the SEC staff in December 2017). These provisional estimates primarily related to NOLs, loss reserves, share-based compensation and state taxes. We expect to complete our analysis of all deferred tax balances by December 2018. As of September 30, 2018, we have not recorded any measurement period adjustments in accordance with SAB 118 to change our provisional amounts that were recorded as of December 31, 2017.
As of September 30, 2018, we have utilized substantially all of our federal NOL carryforwards. We have approximately $7.0 million of AMT credit carryforwards, which are expected to be fully utilized or refunded in the near term. If our AMT credits are not fully utilized during the 2018 tax year, then some portion of the refundable credit may be subject to sequestration under the provisions of the Balanced Budget and Emergency Deficit Reduction Act of 1985. However, we do not expect the amount potentially subject to sequestration to be material.
We are required to establish a valuation allowance against our deferred tax assets when it is more likely than not that all or some portion of our deferred tax assets will not be realized. At each balance sheet date, we assess our need for a valuation allowance and ourthis assessment is based on all available evidence, both positive and negative. This requires management to exercise judgment and make assumptions regarding whether our deferred tax assets will be realized in future periods. In making this assessment as of September 30, 2018, weWe have determined that certain of our subsidiariesentities within Radian may continue to generate taxable losses on a separate company basis in the near term and may not be able to fully utilize certain of their state and local NOLs on their state and local tax returns. As of September 30, 2018, our valuation allowance is $53.1 million, which relates primarilyTherefore, with respect to deferred tax assets relating to these separate company state and local NOLs and other state tax timing adjustments.
Radian Group Inc.
Notes to Unaudited Condensed Consolidated Financial Statements — (Continued)
In July 2018, we finalized a settlement with the IRS related to adjustments we had been contesting that resulted from the examination by the IRS of our 2000 through 2007 consolidated federal income tax returns. The IRS was opposing the recognition of certain tax losses and deductions that were generated through our investment in a portfolio of non-economic REMIC residual interests and proposed denying the associated tax benefits of these items.
This settlement with the IRS resolved the issues and concluded all disputes related to the IRS Matter. In the three-month period ended June 30,During 2018, we recorded tax benefits of $73.6 million, which includes both the impact of the settlement with the IRS as well as the reversal of certain previously accrued state and local tax liabilities. Underunder the terms of the settlement, we will submit to the IRS approximately $31 million of our $89 million “qualified deposits”Radian utilized its qualified deposits with the U.S. Treasury to settle its $31.0 million obligation to the IRS, and during the first quarter of 2019, the IRS refunded to Radian the remaining $57.2 million that was previously on deposit resulting in a reduction of our current federal income tax receivable. As of September 30, 2019, our current federal income tax liability is $33.4 million and is included as a component of other liabilities in our condensed consolidated balance willsheets.
As a mortgage guaranty insurer, we are eligible for a tax deduction, subject to certain limitations, under IRC Section 832(e) for amounts required by state law or regulation to be returned to us.
Dueset aside in statutory contingency reserves. The deduction is allowed only to the resolutionextent that we purchase non-interest bearing U.S. Mortgage Guaranty Tax and Loss Bonds issued by the U.S. Treasury in an amount equal to the tax benefit derived from deducting any portion of our long-standing IRS Matter,statutory contingency reserves. As of September 30, 2019, we held $89.2 million of these bonds, which are included as prepaid income taxes within other assets in our condensed consolidated balance sheets. The corresponding deduction of our statutory contingency reserves resulted in the second quarterrecognition of 2018 we recognized a reductionnet deferred tax liability, which is included in other liabilities in our gross unrecognized tax benefits. This reduction, which excludes deferred uncertain tax positions as well as interestcondensed consolidated balance sheets.
For additional information on our income taxes, including our accounting policies, see Notes 2 and penalties, was approximately $88.6 million, and will be reflected10 of Notes to Consolidated Financial Statements in our annual reconciliation of uncertain tax positions. This amount includes the reversal of certain state and local unrecognized tax benefits related to the matters contained within the IRS dispute.2018 Form 10-K.
10. Losses and Loss Adjustment Expense
Our reserve for losses and LAE, at the end of each period indicated, consisted of:
| | | (In thousands) | September 30,
2018 | | December 31,
2017 | September 30,
2019 | | December 31,
2018 |
| Mortgage insurance loss reserves | $ | 408,980 |
| | $ | 507,588 |
| |
| Mortgage Insurance loss reserves | | $ | 394,087 |
| | $ | 397,891 |
|
Services loss reserves (1) | 3,480 |
| | — |
| 4,054 |
| | 3,470 |
|
| Total reserve for losses and LAE | $ | 412,460 |
| | $ | 507,588 |
| $ | 398,141 |
| | $ | 401,361 |
|
______________________
| |
| (1) | AThe Services loss reserves relate to Radian Title Insurance and the majority of this amount is included insubject to reinsurance, with the related reinsurance recoverables reported in other assets in our condensed consolidated balance sheet,sheets. For all periods presented, total incurred losses and relatespaid claims for Radian Title Insurance were not material. See Note 8 of Notes to the acquisition of EnTitle Direct, completed on March 27, 2018. |
The following table shows our mortgage insurance reserve for losses and LAE by category at the end of each period indicated:
|
| | | | | | | |
| (In thousands) | September 30,
2018 | | December 31,
2017 |
| Reserves for losses by category: | | | |
| Prime | $ | 231,916 |
| | $ | 285,022 |
|
| Alt-A and A minus and below | 129,262 |
| | 170,873 |
|
| IBNR and other | 14,505 |
| | 16,021 |
|
| LAE | 11,203 |
| | 13,349 |
|
Reinsurance recoverable (1) | 9,977 |
| | 8,315 |
|
| Total primary reserves | 396,863 |
| | 493,580 |
|
Total pool reserves (2) | 11,705 |
| | 13,463 |
|
| Total First-lien reserves | 408,568 |
| | 507,043 |
|
Other (3) | 412 |
| | 545 |
|
| Total reserve for losses | $ | 408,980 |
| | $ | 507,588 |
|
______________________
| |
(1) | Represents ceded losses on captive reinsurance transactions, the QSR Program and the Single Premium QSR Program. These amounts are included in the reinsurance recoverables reported in other assetsConsolidated Financial Statements in our condensed consolidated balance sheets. |
| |
(2) | Includes2018 Form 10-K for additional information about our use of reinsurance recoverable of $20 thousand and $35 thousand as of September 30, 2018 and December 31, 2017, respectively. |
| |
(3) | Does not includein our Second-lien premium deficiency reserve that is included in other liabilities.title insurance business. |
Radian Group Inc.
Notes to Unaudited Condensed Consolidated Financial Statements — (Continued)
The following table presents information relating to our mortgage insurance reserve for losses, including our IBNR reserve and LAE, but excluding our Second-liensecond-lien mortgage loan premium deficiency reserve, for the periods indicated:
| | | | Nine Months Ended
September 30, | | Nine Months Ended
September 30, |
| (In thousands) | 2018 | | 2017 | | 2019 | | 2018 |
| Balance at beginning of period | $ | 507,588 |
| | $ | 760,269 |
| | $ | 397,891 |
| | $ | 507,588 |
|
Less: Reinsurance recoverables (1) | 8,350 |
| | 6,851 |
| | 11,009 |
| | 8,350 |
|
| Balance at beginning of period, net of reinsurance recoverables | 499,238 |
| | 753,418 |
| | 386,882 |
| | 499,238 |
|
| Add: Losses and LAE incurred in respect of default notices reported and unreported in: | | | | | | | |
Current year (2) | 100,047 |
| | 145,798 |
| | 107,866 |
| | 100,047 |
|
| Prior years | (24,075 | ) | | (45,331 | ) | | (10,579 | ) | | (24,075 | ) |
| Total incurred | 75,972 |
| | 100,467 |
| | 97,287 |
| | 75,972 |
|
| Deduct: Paid claims and LAE related to: | | | | | | | |
Current year (2) | 2,316 |
| | 3,639 |
| | 1,784 |
| | 2,316 |
|
| Prior years | 173,911 |
| | 301,228 |
| | 101,927 |
| | 173,911 |
|
| Total paid | 176,227 |
| | 304,867 |
| (3) | 103,711 |
| | 176,227 |
|
| Balance at end of period, net of reinsurance recoverables | 398,983 |
| | 549,018 |
| | 380,458 |
| | 398,983 |
|
Add: Reinsurance recoverables (1) | 9,997 |
| | 7,470 |
| | 13,629 |
| | 9,997 |
|
| Balance at end of period | $ | 408,980 |
| | $ | 556,488 |
| | $ | 394,087 |
| | $ | 408,980 |
|
______________________
| |
| (1) | Related to ceded losses recoverable, if any, on captive reinsurance transactions, the QSR Program and the Single Premium QSR Program.transactions. See Note 7 for additional information. |
| |
| (2) | Related to underlying defaulted loans with a most recent default notice dated in the year indicated. For example, if a loan had defaulted in a prior year, but then subsequently cured and later re-defaulted in the current year, that default would be considered a current year default. |
| |
(3) | Includes the payment of $54.8 million made in connection with the scheduled final settlement of the Freddie Mac Agreement in the third quarter of 2017. |
Reserve Activity
2019 Activity
Reserves established for new default notices were the primary driver of our total incurred losses for the nine months ended September 30, 2019, and they were primarily impacted by the number of new primary default notices received in the period and our related gross Default to Claim Rate assumption applied to those new defaults, which was 7.5% as of September 30, 2019. Our provision for losses during the first nine months of 2019 was positively impacted by favorable reserve development on prior year defaults. This favorable development was primarily driven by a reduction during the period in certain Default to Claim Rate assumptions for these prior year defaults compared to the assumptions used at December 31, 2018, partially offset by an increase in our IBNR reserve estimate in the nine months ended September 30, 2019 related to previously disclosed legal proceedings. See Note 12 for additional information.
Total claims paid decreased for the nine months ended September 30, 2019, compared to the same period in 2018. The decrease in claims paid is consistent with the ongoing decline in the outstanding default inventory.
2018 Activity
Our mortgage insurance loss reserves at September 30, 2018 declined as compared to December 31, 2017, primarily as a result of the amount of paid claims continuing to outpaceoutpacing losses incurred related to new default notices reported in the current year. Reserves established for new default notices were the primary driver of our incurred lossesloss for the nine months ended September 30, 2018, and they were primarily impacted by the number of new primary default notices received in the period and our related gross Default to Claim Rate assumption applied to those new defaults, which was 8.5% as of September 30, 2018. The provision for losses during the first nine months of 2018 was positively impacted by favorable reserve development on prior year defaults, which was primarily driven by a reduction during the period in certain Default to Claim Rate assumptions for these prior year defaults compared to the assumptions used at December 31, 2017. The reductions in Default to Claim Rate assumptions resulted from observed trends, primarily higher Cures than were previously estimated.
Following Hurricanes Harvey and Irma, which occurred in the third quarter of 2017, we observed an increase in new primary defaults from FEMA Designated Areas associated with these hurricanes. We expect most of these hurricane-related defaults to cure by the end of 2018, and at higher cure rates than the rates for our general population of defaults. We therefore assigned a 3% Default to Claim Rate assumption to the new primary defaults from FEMA Designated Areas associated with Hurricanes Harvey and Irma that were reported subsequent to those two natural disasters and through February 2018. These incremental defaults did not have a material impact on our provision for losses in 2017 or 2018.
Total claims paid decreased for the nine months ended September 30, 2018, compared to the same period in 2017. The decrease in claims paid is consistent with the ongoing decline in the outstanding default inventory. In addition, claims paid for
Radian Group Inc.
Notes to Unaudited Condensed Consolidated Financial Statements — (Continued)
the nine months ended September 30, 2017 were higher because they included payments that were made in connection with the scheduled final settlement of the Freddie Mac Agreement in the third quarter of 2017.
2017 Activity
Our loss reserves at September 30, 2017 declined as compared to December 31, 2016, primarily as a result of the amount of paid claims and Cures continuing to outpace losses incurred related to new default notices reported in the current year. Reserves established for new default notices were the primary driver of our total incurred loss for the nine months ended September 30, 2017, and they were primarily impacted by the number of new primary default notices received in the period and our related gross Default to Claim Rate assumption applied to those new defaults, which was 10.5% as of September 30, 2017. The provision for losses during the first nine months of 2017 was positively impacted by favorable reserve development on prior year defaults, which was primarily driven by a reduction during the period in certain Default to Claim Rate assumptions for these prior year defaults compared to those used at December 31, 2016. The reductions in Default to Claim Rate assumptions resulted from observed trends, primarily higher Cures than were previously estimated. The positive development in prior year defaults was partially offset by incremental IBNR reserves of $14.2 million to reflect the estimated payment for future losses, primarily on certain performing loans in our portfolio with insurance written in years prior to and including 2008 that were expected to be affected by an upcoming pool commutation.
Mortgage Insurance Reserve Assumptions
Default to Claim Rate
Our aggregate weighted-average net Default to Claim Rate assumption (net of Claim Denials and Rescissions) used in estimating our primary reserve for losses was 34% at September 30, 2018, compared to 31% at December 31, 2017. This increase inthe Default to Claim Rate was primarily driven by a reduction in the number of defaults in FEMA Designated Areas associated with Hurricanes Harvey and Irma (which had a lower Default to Claim Rate of 3%). Excluding the impact of defaults associated with these FEMA Designated Areas, our aggregate weighted-average net Default to Claim Rate (net of Claim Denials and Rescissions) was 35% at September 30, 2018, as compared to 38% at December 31, 2017. As of September 30, 20182019 our gross Default to Claim Rate assumptions on our primary portfolio ranged from 8.5%7.5% for new defaults, up to 68%65% for defaults not in foreclosure stage, and 75%72% for Foreclosure Stage Defaults. Our DefaultSee Notes 2 and 11 of Notes to Claim Rate estimates on defaulted loans are mainly developed based on the Stage of Default and Time in Default of the underlying defaulted loans grouped according to the period in which the default occurred, as measured by the progress toward foreclosure sale and the number of months in default. Our estimate of expected Rescissions and Claim Denials (net of expected Reinstatements) embeddedConsolidated Financial Statements in our estimated Default to Claim Rate is generally based on2018 Form 10-K for additional information about our recent experience. Consideration is also given to any differences in characteristics between those rescinded policiesmortgage insurance reserve assumptions and denied claims and the loans remaining in our defaulted inventory.
Loss Mitigation
As our insurance written in years prior to and including 2008 has become a smaller percentage of our overall insured portfolio, a reduced amount of Loss Mitigation Activity has occurred with respect to the claims we receive, and we expect this general trend to continue. As a result, our future Loss Mitigation Activity is not expected to mitigate our paid losses significantly. The amount of estimated Loss Mitigation Activities incorporated into our reserve analysis at any point in time is affected by a number of factors, including not only our estimated rate of Rescissions, Claim Denials and Claim Curtailments on future claims, but also the volume and attributes of our defaulted insured loans, our estimated Default to Claim Rate and our estimated Claim Severity, among other assumptions. Our estimate of net future Loss Mitigation Activities has not materially impacted our loss reserves at September 30, 2018 or December 31, 2017.
Our reported Rescission, Claim Denial and Claim Curtailment activity in any given period is subject to challenge by our lender and servicer customers. We expect that a portion of previous Rescissions will be reinstated and previous Claim Denials will be resubmitted with the required documentation and ultimately paid; therefore, we have incorporated this expectation into our IBNR reserve estimate. Our IBNR reserve estimate of $5.9 million and $10.4 million at September 30, 2018 and December 31, 2017, respectively, includes reserves for this activity.
We also accrue for the premiums that we expect to refund to our lender customers in connection with our estimated Rescissions.Activities.
11. Senior NotesBorrowings and Financing Activities
The carrying value of our senior notesdebt at September 30, 20182019 and December 31, 20172018 was as follows:
|
| | | | | | | | |
| (In thousands) | | September 30,
2018 | | December 31,
2017 |
| 5.500% | Senior Notes due 2019 | $ | 158,148 |
| | $ | 157,636 |
|
| 5.250% | Senior Notes due 2020 | 232,500 |
| | 231,834 |
|
| 7.000% | Senior Notes due 2021 | 195,682 |
| | 195,146 |
|
| 4.500% | Senior Notes due 2024 | 443,181 |
| | 442,458 |
|
| | Total Senior Notes | $ | 1,029,511 |
| | $ | 1,027,074 |
|
|
| | | | | | | |
| (In thousands) | September 30,
2019 | | December 31,
2018 |
| Senior notes: | | | |
| 5.500% Senior Notes due 2019 | $ | — |
| | $ | 158,324 |
|
| 5.250% Senior Notes due 2020 | — |
| | 232,729 |
|
| 7.000% Senior Notes due 2021 | — |
| | 195,867 |
|
| 4.500% Senior Notes due 2024 | 444,186 |
| | 443,428 |
|
| 4.875% Senior Notes due 2027 | 442,457 |
| | — |
|
| Total senior notes | $ | 886,643 |
| | $ | 1,030,348 |
|
| | | | |
| FHLB advances: | | | |
| FHLB advances due 2019 | $ | 58,881 |
| | $ | 60,550 |
|
| FHLB advances due 2020 | 6,621 |
| | 2,991 |
|
| FHLB advances due 2021 | 14,000 |
| | 8,000 |
|
| FHLB advances due 2022 | 9,000 |
| | — |
|
| FHLB advances due 2023 | 8,994 |
| | 8,995 |
|
| FHLB advances due 2024 | 6,996 |
| | 1,996 |
|
| Total FHLB advances | $ | 104,492 |
| | $ | 82,532 |
|
Repayment and Extinguishment of Debt 12. Other LiabilitiesRepayment of Senior Notes due 2019
The following table showsIn accordance with the components of other liabilities asterms of the dates indicated:notes under the related indenture, we retired the remaining aggregate principal amount of $158.6 million of outstanding Senior Notes due 2019 upon their maturity in June 2019.
|
| | | | | | | |
| (In thousands) | September 30,
2018 | | December 31,
2017 |
| Deferred ceding commission | $ | 92,987 |
| | $ | 89,907 |
|
| FHLB advances | 71,430 |
| | — |
|
| Accrued compensation | 48,712 |
| | 67,687 |
|
Payable for securities (1) | 43,076 |
| | 1,000 |
|
| Amount payable on the return of cash collateral under securities lending agreements | 31,799 |
| | 19,357 |
|
| Current federal income taxes | 11,278 |
| | 96,740 |
|
| Other | 80,080 |
| | 79,154 |
|
| Total other liabilities | $ | 379,362 |
| | $ | 353,845 |
|
______________________
| |
(1) | Represents the payable for purchases of securities that have not yet settled as of the balance sheet date. |
FHLB AdvancesDuring the second quarter of 2019, pursuant to cash tender offers to purchase any and all of our outstanding Senior Notes due 2020 and 2021, we purchased aggregate principal amounts of $207.2 million and $127.3 million of our Senior Notes due 2020 and 2021, respectively. We funded the purchases with $351.8 million in cash (which includes accrued and unpaid interest due on the purchased notes). These purchases resulted in a loss on extinguishment of debt of $16.8 million.
In August 2016, Radian Guarantythe third quarter of 2019, we redeemed the remaining $27.0 million and Radian Reinsurance became members$70.4 million aggregate principal amount of Senior Notes due 2020 and 2021, respectively, in accordance with the terms of the FHLB. As members, they may borrow fromrelated indentures. The aggregate redemption amount paid was $103.1 million, which includes accrued interest through the FHLB, subject to certain conditions, which include the need to post collateralapplicable redemption dates. These purchases resulted in a loss on extinguishment of debt of $5.9 million.
Following these purchases and the requirement to maintain a minimum investment in FHLB stock, in part dependingredemptions, there were 0 remaining principal amounts outstanding on the level of their outstanding FHLB advances.
As of September 30, 2018, we had $71.4 million of fixed-rate advances outstanding with a weighted average interest rate of 2.49%. Interest on the FHLB advances is payable quarterly, or at maturity if the term of the advance is less than 90 days. As of September 30, 2018, $46.9 million of the FHLB advances mature in 2018, $11.5 million mature in 2019, $5.0 million mature inSenior Notes due 2020 and 2021 and $8.0 million mature in 2023 and thereafter. Principal is due at maturity. For obligations with maturities greater than or equal to 90 days, we may prepay the debt at any time, subject to a prepayment fee calculation.
The FHLB advances are required to be collateralized by eligible assets with a market value that must be maintained at a minimum of approximately 103% to 105% of the principal balance of the FHLB advances (based on the eligible collateral we have provided at September 30, 2018, which consisted of an2019.
Senior Notes due 2027
In June 2019, we issued $450 million aggregate principal amount of $76.6 million in U.S. governmentSenior Notes due 2027 and agency securities and RMBS from fixed-maturities available for sale within our investment securities portfolio).
Amount Payable on the Return of Cash Collateral under Securities Lending Agreements
We participate in a securities lending program through which we loan certain securities in our investment portfolio to Borrowers for short periods of time. These securities lending agreements, whereby we transfer securities to third parties through an intermediary in exchange for cash or other securities, are considered collateralized financing arrangements. Amounts payable on the return of cash collateral under securities lending agreements are classified as other liabilities in our condensed consolidated balance sheets. See Note 5 for additional information.received net
Radian Group Inc.
Notes to Unaudited Condensed Consolidated Financial Statements — (Continued)
Revolving Credit Facilityproceeds of $442.2 million. These notes mature on March 15, 2027 and bear interest at a rate of 4.875% per annum, payable semi-annually on March 15 and September 15 of each year, with interest payments commencing on March 15, 2020.
On October 16, 2017, Radian Group entered into a three-year, $225 million unsecured revolving credit facility with a syndicate of bank lenders. TermsWe have the option to redeem these notes, in whole or in part, at any time, or from time to time, prior to September 15, 2026 (the date that is six months prior to the maturity date of the credit facility include an accordion feature that allows Radian Group,notes) (the “Par Call Date”), at its option,a redemption price equal to increase the total borrowing capacity during the termgreater of (i) 100% of the agreement, subjectaggregate principal amount of the notes to our obtainingbe redeemed and (ii) the necessary increased commitmentsmake-whole amount, which is the sum of the present values of the remaining scheduled payments of principal and interest in respect of the notes to be redeemed from lenders (which may include then existing or other lenders), up to a total of $300 million. Effective October 26, 2018, Radian Group exercised its rights under the accordion feature to add another global bankredemption date to the existing syndicatePar Call Date discounted to the redemption date at the applicable treasury rate plus 50 basis points, plus, in each case, accrued and unpaid interest thereon to, but excluding, the redemption date. At any time on or after the Par Call Date, we may, at our option, redeem the notes in whole or in part, at a redemption price equal to 100% of bank lenders and to increase the aggregate principal amount of total commitments under the credit facility by $42.5 million, bringingnotes to be redeemed, plus accrued and unpaid interest thereon to, but excluding, the aggregate unsecured revolving credit facility to $267.5 million.redemption date.
Subject to certain limitations, borrowings underThe indenture governing the credit facility may be usedSenior Notes due 2027 contains covenants customary for working capital and general corporate purposes, including capital contributions to Radian Group’s insurance and reinsurance subsidiaries as well as growth initiatives. The credit facility contains customary representations, warranties, covenants, terms and conditions. Our ability to borrow under the credit facility is conditioned on the satisfactionsecurities of certain financial and other covenants,this nature, including covenants related to minimum net worththe payments of the notes, reports to be provided, compliance certificates to be issued and statutory surplus,the ability to modify the covenants. Additionally, the indenture includes covenants restricting us from encumbering the capital stock of a maximum debt-to-capitalization level, limitsdesignated subsidiary (as defined in the indenture for the notes) or disposing of any capital stock of any designated subsidiary unless either all of the stock is disposed of or we retain more than 80% of the stock.
FHLB Advances
Principal on certain types of indebtedness and liens, minimum liquidity levels and Radian Guaranty’s eligibility asFHLB advances is due at maturity. For obligations with original maturities greater than or equal to 90 days, we may prepay the debt at any time, subject to a private mortgage insurer with the GSEs. See Note 12 of Notes to Consolidated Financial Statements in our 2017 Form 10-K. At September 30, 2018, Radian Group was in compliance with all the covenants and there were no amounts outstanding under this revolving credit facility.
13. Commitments and Contingencies
Legal Proceedings
prepayment fee calculation. See Note 13 of Notes to Consolidated Financial Statements in our 20172018 Form 10-K for additional information about our FHLB advances.
Revolving Credit Facility
Radian Group has in place a $267.5 million unsecured revolving credit facility with a syndicate of bank lenders, which is scheduled to expire on October 16, 2020. At September 30, 2019, Radian Group was in compliance with all of the credit facility covenants, and there were 0 amounts outstanding. For more information regarding our accounting policies for contingencies.revolving credit facility, including certain of its terms and covenants, see Note 13 of Notes to Consolidated Financial Statements in our 2018 Form 10-K.
12. Commitments and Contingencies
We are routinely involved in a number of legal actions and proceedings, including litigation and other disputes arising in the ordinary course of our business. The legal and regulatory matters discussed below and in our 20172018 Form 10-K could result in adverse judgments, settlements, fines, injunctions, restitutions or other relief that could require significant expenditures or have other effects on our business. Management believes, based on current knowledge and after consultation with counsel, that the outcome of such actions will not have a material adverse effect on our consolidated financial condition. However, theThe outcome of litigation and other legal and regulatory matters and proceedings is inherently uncertain, and it is possible that one1 or more of the matters currently pending or threatened could have an unanticipated adverse effect on our liquidity, financial condition or results of operations for any particular period.
On December 22, 2016, Ocwen Loan Servicing, LLC and Homeward Residential, Inc. (collectively, “Ocwen”) filed a complaint in the U.S. District Court for the Eastern District of Pennsylvania against Radian Guaranty (the “Complaint”) alleging breach of contract and bad faith claims and seeking monetary damages and declaratory relief. Ocwen has also initiated similar legal proceedings against several other mortgage insurers. On December 17, 2016, Ocwen separately filed a parallel arbitration petition against Radian Guaranty before the American Arbitration Association (“AAA”) asserting substantially the same allegations (the “Arbitration”). Ocwen’s filings together listed 9,420 mortgage insurance certificates issued under multiple insurance policies, including Pool Insurance policies, as subject to the dispute. On June 5, 2017, Ocwen filed an amended complaint and an amended petition (collectively, the “Amended Filings”) with both the court and the AAA, respectively, together listing 8,870 certificates as subject to the dispute. On April 11, 2018, the parties entered into a confidential agreement with respect to all certificates subject to the dispute. The confidential agreement resolved certain categories of claims involved in the dispute and, on April 12, 2018, the parties filed a stipulation of voluntary dismissal of the federal court proceeding and the trial judge issued an Order dismissing all claims and counterclaims subject to the parties’ agreement. Radian Guaranty was not required to make any payment in connection with this confidential agreement. Pursuant to the confidential agreement, the parties: (1) dismissed the federal court proceeding; (2) narrowed the scope of the dispute to Ocwen’s breach of contract claims seeking payment of insurance benefits on approximately 2,500 certificates that Ocwen was previously pursuing through the
Radian Group Inc.
Notes to Unaudited Condensed Consolidated Financial Statements (Continued)
Amended Filings; and (3) agreed to resolve the remaining dispute through the Arbitration. The Arbitration is proceeding, and Radian Guaranty believes that Ocwen’s allegations and claims in the legal proceedings described above are without merit and legally deficient, and planscontinues to defend theseagainst Ocwen’s claims vigorously. We are not able to estimate a reasonably possible loss, if any, or range of loss in this matter because of the preliminary stage of the Arbitration.
On August 31, 2018, Nationstar Mortgage LLC d/b/a Mr. Cooper (“Nationstar”) filed a complaint in the U.S. District Court for the Eastern District of Pennsylvania against Radian Guaranty (the “Complaint”) alleging breach of contract, bad faith, andequitable indemnification, unjust enrichment, and conversion claims and seeking monetary damages and declaratory relief. TheExhibit 1 to the Complaint lists 3,014 mortgage insurance certificates issued under multiple insurance policies as subject to disputes involving insurance coverage decisions.
Radian Group Inc.
Notesdecisions (the “Coverage Disputed Loans”). Exhibit 2 to Unaudited Condensed Consolidated Financial Statements — (Continued)
Thethe Complaint further lists 2,231 mortgage insurance certificates issued under multiple insurance policies as subject to disputes involving premium refund requests. In December 2018, Radian Guaranty filed a motion to dismiss the Complaint. In March 2019, the trial judge issued an order granting in part, and denying in part, our motion to dismiss, and dismissed Nationstar’s unjust enrichment and conversion claims. In May 2019, Radian Guaranty filed an answer, with affirmative defenses and counterclaims, in response to the Complaint. On September 23, 2019, the trial judge entered as an order a joint stipulation submitted by Nationstar and Radian Guaranty that narrowed the scope of the dispute involving Coverage Disputed Loans to claims relating to 1,704 mortgage insurance certificates. Radian Guaranty believes that Nationstar’s allegations and claims in the legal proceedings described above are without merit and legally deficient, and planscontinues to defend against these claims vigorously. We are not able
In the three and nine months ended September 30, 2019, the Company increased its IBNR reserve estimate by $11.8 million and $31.2 million, respectively, related to our best estimate a reasonably possible loss, if any, or range of our probable loss in this matter becauseconnection with the above legal proceedings. While Radian believes it has substantial defenses in these matters and intends to continue to defend against these claims vigorously, it is not feasible to predict the ultimate outcome of these disputes, and the preliminary stageCompany could in the future be required to pay amounts as a result of the litigation.settlements or decisions in these matters, potentially in excess of accruals.
We also are periodically subject to reviews and audits, as well as inquiries, information-gathering requests and investigations. In connection with these matters, from time to time we receive requests and subpoenas seeking information and documents related to aspects of our business. In March 2017, Green River Capital, a subsidiary of Clayton, received a letter from the staff of the SEC stating that it is conducting an investigation captioned, “In the Matter of Certain Single Family Rental Securitizations,” and that it is requesting information from market participants. The letter requested that Green River Capital provide information regarding broker price opinions that Green River Capital provided on properties included in SFR securitization transactions. Green River Capital has been cooperating with the SEC in this matter.
Our Master Policies establish the timeline within which any suit or action arising from any right of an insured under the policy generally must be commenced. In general, any suit or action arising from any right of an insured under the policy must be commenced within two years after such right first arose for primary insurance and within three years for certain other policies, including certain Pool Insurance policies. Although we believe that our Loss Mitigation Activities are justified under our policies, from time to time we face challenges from certain lender and servicer customers regarding our Loss Mitigation Activities, which have resulted in some reversals of our decisions regarding Rescissions, Claim Denials or Claim Curtailments. We are currently in discussions with these customers regarding our Loss Mitigation Activities and claim payment practices, which if not resolved,Activities. These challenges could result in additional arbitration or judicial proceedings and we may need to reassume the risk on, and increase loss reserves for, the associated policies or pay additional claims.
Lease Liability
Our lease liability represents the present value of future lease payments over the lease term. Our leases do not provide a readily determinable implicit rate. Therefore, we must estimate our incremental borrowing rate, on a collateralized basis, to discount the lease payments based on information available at lease commencement. Our leases expire periodically through August 2032, and contain provisions for scheduled periodic rent increases. We estimate the incremental borrowing rate based on the yields of Radian Group corporate bonds, as adjusted to reflect a collateralized borrowing rate, resulting in discount rates ranging from 4.22% to 7.08%. While the majority of our lease population expires within one year of one of the Radian Group corporate bonds, our more significant leases do not. For those leases, we adjust the corporate bond rate for both U.S. Treasury rate yields and a corporate spread adjustment determined from recent market data.
Radian Group Inc.
Notes to Unaudited Condensed Consolidated Financial Statements (Continued)
The following tables provide additional information related to our leases, including: (i) the components of our total lease cost; (ii) the cash flows arising from our lease transactions; (iii) supplemental balance sheet information; (iv) the weighted-average remaining lease term; (v) the weighted-average discount rate used for our leases; and (vi) the remaining maturities of our lease liabilities, as of and for the periods indicated:
|
| | | | | | | |
| ($ in thousands) | Three Months Ended September 30, 2019 | | Nine Months Ended September 30, 2019 |
| Operating lease cost | $ | 2,340 |
| | $ | 7,006 |
|
| Short-term lease cost | 36 |
| | 111 |
|
| Total lease cost | $ | 2,376 |
| | $ | 7,117 |
|
| | | | |
| Cash paid for amounts included in the measurement of lease liabilities: | | | |
| Operating cash flows from operating leases | $ | (2,657 | ) | | $ | (7,933 | ) |
| | | | |
|
| | | |
| ($ in thousands) | September 30, 2019 |
| Operating leases: | |
Operating lease right-of-use assets (1) | $ | 42,613 |
|
Operating lease liabilities (2) | 65,816 |
|
| | |
| Weighted-average remaining lease term - operating leases (in years) | 10.0 years |
|
| | |
| Weighted-average discount rate - operating leases | 6.77 | % |
| | |
| Remaining maturities of lease liabilities for the remainder of 2019 and thereafter is as follows: | |
| 2019 | $ | 2,681 |
|
| 2020 | 10,408 |
|
| 2021 | 9,945 |
|
| 2022 | 10,140 |
|
| 2023 | 10,279 |
|
| 2024 and thereafter | 56,421 |
|
| Total lease payments | 99,874 |
|
| Less: Imputed interest | (34,058 | ) |
Present value of lease liabilities (2) | $ | 65,816 |
|
______________________
| |
| (1) | Classified in other assets in our condensed consolidated balance sheets. See Note 8. |
| |
| (2) | Classified in other liabilities in our condensed consolidated balance sheets. |
Pursuant to the previous lease accounting standard, rent expense for the three and nine months ended September 30, 2018 was $2.5 million and $6.8 million, respectively. Our commitment for non-cancelable leases in future years as of December 31, 2018 was as follows (in thousands):
|
| | | |
| 2019 | $ | 11,310 |
|
| 2020 | 10,847 |
|
| 2021 | 10,165 |
|
| 2022 | 10,100 |
|
| 2023 | 10,251 |
|
| 2024 and thereafter | 56,317 |
|
| Total | $ | 108,990 |
|
At December 31, 2018, there were 0 future minimum receipts expected from sublease rental payments.
Radian Group Inc.
Notes to Unaudited Condensed Consolidated Financial Statements (Continued)
See Note 101 herein for additional information.
Other
Securities regulations became effectiveinformation about our leases and Note 14 of Notes to Consolidated Financial Statements in 2005 that impose enhanced disclosure requirements on issuers of ABS (including mortgage-backed securities). To allow our customers to comply with these regulations at that time, we typically were required, depending on the amount of credit enhancement we were providing, to provide: (i) audited financial statements2018 Form 10-K for the insurance subsidiary participating in the transaction or (ii) a fullfurther information regarding our commitments and unconditional holding company-level guaranteecontingencies and our accounting policies for our insurance subsidiaries’ obligations in such transactions. Radian Group has guaranteed two structured transactions for Radian Guaranty involving $90.3 million of remaining credit exposure as of September 30, 2018.contingencies.
14.13. Capital Stock
Share Repurchase Program
On August 9, 2017, Radian Group’s board of directors authorized the Company to repurchase up to $50 million of its common stock in the open market or in privately negotiated transactions, based on market and business conditions, stock price and other factors. Pursuant to a trading plan under Rule 10b5-1 of the Exchange Act, the Company purchased 3,022,856 shares in the first half of 2018 at an average price of $16.56 per share, including commissions. This share repurchase program was fully utilized and expired on July 31, 2018.
On August 16, 2018, Radian Group’s board of directors approved a new share repurchase program that authorizesauthorized the Company to repurchase up to $100 million of its common stock in the open market or in privately negotiated transactions, based on market and business conditions, stock price and other factors. On March 20, 2019, Radian Group’s board of directors approved a $150 million increase in authorization for this program, bringing the total authorization to repurchase shares up to $250 million, excluding commissions. Radian operated this program pursuant to a trading plan under Rule 10b5-1 of the Exchange Act, which permitted the Company to purchase shares, at pre-determined price targets, when it may have otherwise been precluded from doing so. During the three and nine months ended September 30, 2019, the Company purchased 2,241,568 and 11,258,574 shares at an average price of $23.43 and $22.22 per share, respectively, including commissions. As of September 30, 2018,2019, 0 further purchase authority remains under this program. Over the fullcourse of this program, the Company repurchased a total of 11,258,574 shares, or 5.3% of the shares outstanding at the beginning of the program.
On August 14, 2019, Radian Group’s board of directors approved a new share repurchase program that authorizes the Company to spend up to $200 million, excluding commissions, to repurchase Radian Group common stock in the open market or in privately negotiated transactions, based on market and business conditions, stock price and other factors. Radian operates this program pursuant to a trading plan under Rule 10b5-1 of the Exchange Act, which permits the Company to purchase shares, at pre-determined price targets, when it may otherwise be precluded from doing so. During the three months ended September 30, 2019, the Company purchased 1,104,786 shares at an average price of $22.64 per share, including commissions. As of September 30, 2019, purchase authority of up to $100$175.0 million remained available under this program, which expires on JulyAugust 31, 2019.2020.
Subsequent to September 30, 2019, the Company purchased 1,090,875 shares of its common stock under its share repurchase program at an average price of $22.93 per share, including commissions. As of November 8, 2019, purchase authority of up to $150.0 million remained available under this program.
Other Purchases
We may purchase shares on the open market to settle stock options exercised by employees and purchases under our Employee Stock Purchase Plan. In addition, upon the vesting of certain restricted stock awards or the auto-exercise of certain expiring stock options under our equity compensation plans, we may withhold from such vested or auto-exercised awards shares of our common stock to satisfy the tax liability and the stock option cost of the award recipients, as applicable.recipients.
Dividends Paid
InDuring each of the first three quarters duringof 2019 and each quarter of 2018, and 2017, we declared quarterly cash dividends on our common stock equal to $0.0025 per share.
Radian Group Inc.
Notes to Unaudited Condensed Consolidated Financial Statements — (Continued)
15.14. Accumulated Other Comprehensive Income (Loss)
The following table shows the rollforward of accumulated other comprehensive income (loss) as of the periods indicated: | | | | Three Months Ended September 30, 2018 | | Nine Months Ended September 30, 2018 | Three Months Ended September 30, 2019 | | Nine Months Ended September 30, 2019 |
| (In thousands) | Before Tax | | Tax Effect | | Net of Tax | | Before Tax | | Tax Effect | | Net of Tax | Before Tax | | Tax Effect | | Net of Tax | | Before Tax | | Tax Effect | | Net of Tax |
| Balance at beginning of period | $ | (73,345 | ) | | $ | (15,402 | ) | | $ | (57,943 | ) | | $ | 32,669 |
| | $ | 9,584 |
| | $ | 23,085 |
| $ | 111,977 |
| | $ | 23,515 |
| | $ | 88,462 |
| | $ | (77,114 | ) | | $ | (16,194 | ) | | $ | (60,920 | ) |
| Cumulative effect of adopting the accounting standard update for financial instruments | — |
| | — |
| | — |
| | 284 |
| | 60 |
| | 224 |
| |
| Cumulative effect of adopting the accounting standard update for the reclassification of certain tax effects | — |
| | — |
| | — |
| | — |
| | (2,724 | ) | | 2,724 |
| |
| Balance adjusted for cumulative effect of adopting accounting standard updates | (73,345 | ) | | (15,402 | ) |
| (57,943 | ) |
| 32,953 |
|
| 6,920 |
|
| 26,033 |
| |
| OCI: | | | | | | | | | | | | |
| Other comprehensive income (loss): | | | | | | | | | | | | |
| Unrealized gains (losses) on investments: | | | | |
| | | | | | | | | | |
| | | | | | |
| Unrealized holding gains (losses) arising during the period | (6,762 | ) | | (1,421 | ) | | (5,341 | ) | | (118,719 | ) | | (24,931 | ) | | (93,788 | ) | 51,460 |
| | 10,806 |
| | 40,654 |
| | 241,363 |
| | 50,686 |
| | 190,677 |
|
Less: Reclassification adjustment for net gains (losses) included in net income (1) | (5,120 | ) | | (1,076 | ) | | (4,044 | ) | | (10,775 | ) | | (2,263 | ) | | (8,512 | ) | 4,401 |
| | 924 |
| | 3,477 |
| | 5,209 |
| | 1,094 |
| | 4,115 |
|
| Net unrealized gains (losses) on investments | (1,642 | ) | | (345 | ) | | (1,297 | ) | | (107,944 | ) | | (22,668 | ) | | (85,276 | ) | 47,059 |
| | 9,882 |
| | 37,177 |
| | 236,154 |
| | 49,592 |
| | 186,562 |
|
| Unrealized foreign currency translation adjustments | — |
| | — |
| | — |
| | 4 |
| | 1 |
| | 3 |
| — |
| | — |
| | — |
| | (4 | ) | | (1 | ) | | (3 | ) |
| OCI | (1,642 | ) | | (345 | ) | | (1,297 | ) | | (107,940 | ) | | (22,667 | ) | | (85,273 | ) | |
| Other comprehensive income (loss) | | 47,059 |
| | 9,882 |
| | 37,177 |
| | 236,150 |
| | 49,591 |
| | 186,559 |
|
| Balance at end of period | $ | (74,987 | ) | | $ | (15,747 | ) | | $ | (59,240 | ) | | $ | (74,987 | ) | | $ | (15,747 | ) | | $ | (59,240 | ) | $ | 159,036 |
| | $ | 33,397 |
| | $ | 125,639 |
| | $ | 159,036 |
| | $ | 33,397 |
| | $ | 125,639 |
|
| | | | | | | | | | | | | | | | | | | | | | | |
| | Three Months Ended September 30, 2017 | | Nine Months Ended September 30, 2017 | Three Months Ended September 30, 2018 | | Nine Months Ended September 30, 2018 |
| (In thousands) | Before Tax | | Tax Effect | | Net of Tax | | Before Tax | | Tax Effect | | Net of Tax | Before Tax | | Tax Effect | | Net of Tax | | Before Tax | | Tax Effect | | Net of Tax |
| Balance at beginning of period | $ | 27,878 |
| | $ | 9,761 |
| | $ | 18,117 |
| | $ | (19,063 | ) | | $ | (6,668 | ) | | $ | (12,395 | ) | $ | (73,345 | ) | | $ | (15,402 | ) | | $ | (57,943 | ) | | $ | 32,669 |
| | $ | 9,584 |
| | $ | 23,085 |
|
| OCI: | | | | | | | | | | | | |
| Cumulative effect of adopting accounting standard updates | | — |
| | — |
| | — |
| | 284 |
| | (2,664 | ) | | 2,948 |
|
| Balance adjusted for cumulative effect of adopting accounting standard updates | | (73,345 | ) | | (15,402 | ) | | (57,943 | ) | | 32,953 |
| | 6,920 |
| | 26,033 |
|
| Other comprehensive income (loss): | | | | | | | | | | | | |
| Unrealized gains (losses) on investments: | | | | | | | | | | | | | | | | | | | | | | |
| Unrealized holding gains (losses) arising during the period | 9,598 |
| | 3,359 |
| | 6,239 |
| | 52,069 |
| | 18,224 |
| | 33,845 |
| (6,762 | ) | | (1,421 | ) | | (5,341 | ) | | (118,719 | ) | | (24,931 | ) | | (93,788 | ) |
Less: Reclassification adjustment for net gains (losses) included in net income (1) | 170 |
| | 59 |
| | 111 |
| | (4,134 | ) | | (1,447 | ) | | (2,687 | ) | (5,120 | ) | | (1,076 | ) | | (4,044 | ) | | (10,775 | ) | | (2,263 | ) | | (8,512 | ) |
| Net unrealized gains (losses) on investments | 9,428 |
| | 3,300 |
| | 6,128 |
| | 56,203 |
| | 19,671 |
| | 36,532 |
| (1,642 | ) | | (345 | ) | | (1,297 | ) | | (107,944 | ) | | (22,668 | ) | | (85,276 | ) |
| Unrealized foreign currency translation adjustments | 39 |
| | 11 |
| | 28 |
| | 205 |
| | 69 |
| | 136 |
| — |
| | — |
| | — |
| | 4 |
| | 1 |
| | 3 |
|
| OCI | 9,467 |
| | 3,311 |
| | 6,156 |
| | 56,408 |
| | 19,740 |
| | 36,668 |
| |
| Other comprehensive income (loss) | | (1,642 | ) | | (345 | ) | | (1,297 | ) | | (107,940 | ) | | (22,667 | ) | | (85,273 | ) |
| Balance at end of period | $ | 37,345 |
| | $ | 13,072 |
| | $ | 24,273 |
| | $ | 37,345 |
| | $ | 13,072 |
| | $ | 24,273 |
| $ | (74,987 | ) | | $ | (15,747 | ) | | $ | (59,240 | ) | | $ | (74,987 | ) | | $ | (15,747 | ) | | $ | (59,240 | ) |
______________________
| |
| (1) | Included in net gains (losses) on investments and other financial instruments on our condensed consolidated statements of operations. |
16.15. Statutory Information
We prepare our statutory financial statements in accordance with the accounting practices required or permitted, if applicable, by the insurance departments of the respective states of domicile of our insurance subsidiaries. Required SAPP are established by a variety of NAIC publications, as well as state laws, regulations and general administrative rules. In addition, insurance departments have the right to permit other specific practices that may deviate from prescribed practices. As of September 30, 2018, we did not have any prescribed or permitted statutory accounting practices that resulted in reported statutory surplus or risk-based capital being different from what would have been reported had NAIC statutory accounting practices been followed.
State insurance regulations include various capital requirements and dividend restrictions based on our insurance subsidiaries’ statutory financial position and results of operations, as described below. Failure to maintain adequate levels of capital could lead to intervention by the various insurance regulatory authorities, which could materially and adversely affect our business, business prospects and financial condition. As of September 30, 2018,2019, the amount of restricted net assets held by our consolidated insurance subsidiaries (which represents our equity investment in those insurance subsidiaries) totaled $3.9$4.0 billion of our consolidated net assets.
Under state insurance regulations, Radian Guaranty isour mortgage insurance subsidiaries are required to maintain minimum surplus levels and,levels. In certain RBC States, mortgage insurers licensed in certainthose states must also satisfy a Statutory RBC Requirement that is a minimum ratio of statutory capital relative to the level of net RIF, or Risk-to-capital. There are 16Other RBC States that currently impose a Statutory RBC Requirement. The most common Statutory RBC Requirement is that arequire mortgage insurer’s Risk-to-capital may not exceed 25
Radian Group Inc.
Notes to 1. In certain of the RBC States, a mortgage insurer mustUnaudited Condensed Consolidated Financial Statements (Continued)
insurers licensed in those states to satisfy a MPP Requirement. The statutory capital requirements for the non-RBC States are de minimis (ranging from $1 million to $5 million); however, the insurance laws of these states generally grant broad supervisory powers to state agencies or officials to enforce rules or exercise discretion affecting almost every significant aspect of the insurance business, including the power to revoke or restrict an insurance company’s ability to write new business. Unless an RBC State grants a waiver or other form of relief, if a mortgage insurer, such as Radian Guaranty,Requirement that is not in compliance with the Statutory RBC Requirement of that state, the mortgage insurer may be prohibited from writing newcalculated on both risk and surplus levels. Our mortgage insurance business in that state. Radian Guaranty’s domiciliary state, Pennsylvania, is not one of the RBC States.
Radian Guaranty wassubsidiaries were in compliance with the Statutory RBC Requirements or MPP Requirements, asto the extent applicable, in each of the RBC States as of September 30, 2018. The NAIC is2019.
In addition, in order to be eligible to insure loans purchased by the process of developing a new Model Act forGSEs, mortgage insurers whichsuch as Radian Guaranty must meet the GSEs’ eligibility requirements, or PMIERs. At September 30, 2019, Radian Guaranty is expected to include, among other items, new capital adequacy requirements foran approved mortgage insurers. In May 2016, a working group of state regulators released an exposure draft of this Model Act. While the outcome and timing of this process are uncertain, the new Model Act, if and when finalized by the NAIC, has the potential to increase capital requirements in those states that adopt the Model Act. However, we continue to believe the changes to the Model Act will not result in financial requirements that require greater capital than the level currently requiredinsurer under the PMIERs and is in compliance with the current PMIERs financial requirements. See Note 1 herein and Note 1 of Notes to Consolidated Financial Statements in our 20172018 Form 10-K for additional information regarding the PMIERs, which set requirements for private mortgage insurers to remain approved insurers of loans purchased by the GSEs.PMIERs.
Radian Guaranty’s Risk-to-capital calculation appears in the table below. For purposes of the Risk-to-capital calculation, as well as the Risk-to-capital requirements imposed by certain states, statutory capital is defined as the sum of statutory policyholders’ surplus plus statutory contingency reserves.
| | | | September 30,
2018 | | December 31,
2017 | September 30,
2019 | | December 31,
2018 |
| ($ in millions) | | | | | | |
RIF, net (1) | $ | 40,241.6 |
| | $ | 36,793.5 |
| $ | 43,484.8 |
| | $ | 40,711.3 |
|
| | | | | | | |
| Common stock and paid-in capital | $ | 1,866.0 |
| | $ | 1,866.0 |
| $ | 1,041.0 |
| | $ | 1,416.0 |
|
| Surplus Note | 100.0 |
| | 100.0 |
| 100.0 |
| | 100.0 |
|
| Unassigned earnings (deficit) | (708.9 | ) | | (765.0 | ) | (553.5 | ) | | (701.9 | ) |
| Statutory policyholders’ surplus | 1,257.1 |
| | 1,201.0 |
| 587.5 |
| | 814.1 |
|
| Contingency reserve | 1,995.8 |
| | 1,667.0 |
| 2,475.9 |
| | 2,109.9 |
|
| Statutory capital | $ | 3,252.9 |
| | $ | 2,868.0 |
| $ | 3,063.4 |
| | $ | 2,924.0 |
|
| | | | | | | |
| Risk-to-capital | 12.4:1 |
| | 12.8:1 | 14.2:1 |
| | 13.9:1 |
______________________
| |
| (1) | Excludes risk ceded through all reinsurance contracts (to third parties andprograms (including with affiliates) and RIF on defaulted loans. |
Radian Guaranty’s statutory capital increased by $384.9$139.4 million in the first nine months of 2018,2019, primarily due to Radian Guaranty’s statutory net income of $376.3$525.5 million during this period.period, partially offset by the effect of an Extraordinary Distribution paid to Radian Group, as described below. The net decreaseincrease in Radian Guaranty’s Risk-to-capital in the first nine months of 20182019 was primarily due to the increase in overall statutory capital,RIF, partially offset by anthe increase in RIF.overall statutory capital.
The Risk-to-capital ratio for our combined mortgage insurance operations was 11.712.9 to 1 as of September 30, 2018,2019, compared to 12.112.8 to 1 as of December 31, 2017.2018.
In April 2019, the Pennsylvania Insurance Department approved a $375 million Extraordinary Distribution from Radian Guaranty to Radian Group, which was paid on April 30, 2019 in the form of cash and marketable securities, resulting in a $375 million decrease in Radian Guaranty’s statutory policyholders’ surplus.
For a description of our statutory compliance with regulations for our mortgage insurance and title services businesses, see Note 19 of Notes to Consolidated Financial Statements in our 2018 Form 10-K.
Radian Group Inc.
Notes to Unaudited Condensed Consolidated Financial Statements — (Continued)
Segregated Funds Held for Others
Through EnTitle Insurance, we maintain escrow deposits as a service to our customers. Amounts held in escrow and excluded from assets and liabilities in our consolidated balance sheets totaled $6.1 million as of September 30, 2018. These amounts were held at third-party financial institutions and not considered assets of the Company. Should one or more of the financial institutions at which escrow deposits are maintained fail, there is no guarantee that we would recover the funds deposited, whether through Federal Deposit Insurance Corporation coverage or otherwise. In the event of any such failure, we could be held liable for the disposition of these funds owned by third parties.
Part I. Item 2. Management’s Discussion and Analysis of Financial Condition and Results of Operations
Item 2. Management’s Discussion and Analysis of Financial Condition and Results of Operations.
The following analysis ofdisclosures in this quarterly report are complementary to those made in our financial condition2018 Form 10-K and results of operations should be read in conjunction with our unaudited condensed consolidated financial statements and the notes thereto included in this report, andas well as our audited financial statements, notes thereto and Management’s Discussion and Analysis of Financial Condition and Results of Operations included in our 20172018 Form 10-K, for a more complete understanding10-K.
The following analysis of our financial positioncondition and results of operations.operations for the three and nine months ended September 30, 2019 provides information that evaluates our financial condition as of September 30, 2019 compared with December 31, 2018 and our results of operations for the three and nine months ended September 30, 2019, compared to the same periods last year. Certain terms and acronyms used throughout this report are defined in the Glossary of Abbreviations and Acronyms included as part of this report. In addition, investors should review the “Cautionary Note Regarding Forward-LookingStatements— Statements—Safe Harbor Provisions” above and “Item 1A. Risk Factors” in our 20172018 Form 10-K for a discussion of those risks and uncertainties that have the potential to adversely affect our business, financial condition, results of operations, cash flows or prospects. Our results of operations for interim periods are not necessarily indicative of results to be expected for the full year or for any other period.
|
| |
| Index to Management’s Discussion and Analysis of Financial Condition and Results of Operations |
| | PAGE |
| |
| |
| |
| |
| |
| |
| |
| |
Overview
We are a diversified mortgage and real estate services business with two business segments—Mortgage Insurance and Services. We operate in the highly competitive U.S. mortgage and real estate industries. Our Mortgage Insurance segment provides credit-related insurance coverage, principally through private mortgage insurance on residential first-lien mortgage loans, as well as other credit risk management solutions, to mortgage lending institutions and mortgage credit investors. We provide our mortgage insurance products and services mainly through our wholly-owned subsidiary, Radian Guaranty. Our Services segment is primarily a fee-for-service business that offers a broad array of both mortgage, and real estate and title services to market participants across the mortgage and real estate value chain. These services, comprising mortgage services, real estate servicesIn both our Mortgage Insurance and title services, are provided primarily through Clayton, Green River Capital, Red Bell, ValuAmericaServices businesses, we compete on a number of factors, including price, overall service, customer relationships, perceived financial strength and EnTitle Direct (which we acquired in March 2018). Of the combined total of our net premiums earned and services revenue for the nine months ended September 30, 2018 and the year ended December 31, 2017, our Services segment provided approximately 13% and 15%, respectively.
Tax Cuts and Jobs Act
On December 22, 2017, the TCJA was signed into law. The TCJA significantly changes the U.S. tax system, and includes,reputation, among other things, a reduction of the federal corporate tax rate from 35% to 21%, effective January 1, 2018. During the nine months ended September 30, 2018, the TCJA had a significant favorable impact on the Company’s net income, diluted earnings per share and cash flows, primarily due to the reduction in the federal corporate tax rate. The TCJA also significantly increased the economic value of our mortgage insurance portfolio, due to the increase in expected future net cash flows from our existing IIF.
We are continuing to assess the potential effects of the TCJA on our future results, which we generally expect will be favorable. Notwithstanding our current expectations, future guidance that may be issued or changes in policy or interpretations of the TCJA could impact our financial performance depending, among other things, on how the changes impact the economy, including business and consumer sentiment and other key factors affecting our performance. See “Item 1A. Risk Factors,” “Item 7. Management’s Discussion and Analysis of Financial Condition and Results of Operations” and Note 10 of Notes to Consolidated Financial Statements in our 2017 Form 10-K for additional information on the TCJA.
Part I. Item 2. Management's DiscussionandAnalysis of Financial Condition and Results of Operations (Cont'd)
Operating Environment
As a seller of mortgage credit protection and mortgage and other credit risk management solutions, as well as mortgage and real estate services, our results are subject to macroeconomic conditions and other events that impact the housing finance and real estate markets, including eventsseasonal fluctuations that specifically impact the mortgage origination environment, the credit performance of our underlying insured assets and our future business opportunities.
Recently, The macroeconomic conditions, seasonality and other events that impact the housing, mortgage originationsfinance and related real estate markets also affect the demand for home purchases have increased and become a larger proportion of total mortgage originations, as refinancing activity has declined due to rising interest rates. During 2017 and the first nine months of 2018, we have benefited from this trend because mortgage insurance penetration in the insurable mortgage market is generally three to five times higher for purchase originations than for refinancings. Additionally, mortgage insurance penetration on purchase transactions has gradually increased over the past few years. We believe that, as a result of the increase in home purchase transactions and the higher mortgage insurance penetration for purchase originations, the mortgage insurance market in the first nine months of 2018 was larger as compared to the same period of 2017.
Although the more restrictive credit environment following the financial crisis of 2007-2008 resulted in overall improvement in credit quality, it also has made it more challenging for many first-time home buyers to finance a home and has limited the number of loans available for private mortgage insurance. In response to first-time home buyer demand and affordability considerations, lenders and the GSEs recently have expanded their mortgage lending products to include products that accommodate higher LTVs, including LTVs greater than 95%, as well as debt-to-income ratios greater than 45%. As a result, Radian Guaranty and the rest of the private mortgage insurance industry have experienced a shift in the mix of mortgage lending products toward higher LTVs and higher debt-to-income ratios. However, we believe that these trends toward higher LTVs and debt-to-income ratios have not materially impacted the overall credit quality of our portfolio. See “—Market Credit Characteristics” and “Results of Operations—Mortgage Insurance—NIW, IIF, RIF” for additional information regarding our portfolio mix and the mortgage industry.
Competition and Pricing. In our mortgage, insurance business, our primary competitors include other private mortgage insurersreal estate and governmental agencies, principally the FHA and the VA. We currently compete with other private mortgage insurers on the basis of price, underwriting guidelines, overall service, customer relationships, perceived financial strength (including based on comparative credit ratings) and reputation, as well as the breadth and quality of thetitle services offered through our Services business that complement our mortgage insurance products. We compete with the FHA and VA, primarily on the basis of loan limits, pricing, credit guidelines, terms of our insurance policies and loss mitigation practices.
Pricing is highly competitive in the mortgage insurance industry, with industry participants competing for market share and customer relationships. As a result of this competitive environment, industry pricing trends have included: (i) increases in the use of a spectrum of filed rates to allow for pricing based on more granular loan, borrower and property attributes, including granular pricing through the use of a “Black Box” model; (ii) the use of customized (often discounted) rates on lender-paid, Single Premium Policies and to a limited extent, on borrower-paid Monthly Premium Policies, including in response to requests for pricing bids by certain high-volume lenders; and (iii) other pricing changes that include, among other things, reductions in standard premium rates for borrower-paid Monthly Premium Policies.
We believe that as the mortgage insurance industry migrates away from a predominantly rate-card-based pricing model, various pricing methodologies are being deployed with differing degrees of risk-based granularity and transparency. We currently employ proprietary risk and customer analytics, as well as a digital pricing delivery platform, to deliver loan level pricing electronically to our customers. The granularity of our pricing is based on the business needs of our customers and their risk profiles. Our strategy is to consistently apply an approach to pricing that is customer-centric, flexible and customizable, as well as balanced with our own objectives for managing the risk and return profile of our insured portfolio.
We continually evaluate our pricing based on many factors and we design our pricing strategies to grow the long-term economic value of our mortgage insurance portfolio and to align with our overall strategic objectives. Consistent with these objectives, during March 2018, among other price changes, we implemented rate reductions on our borrower-paid Single Premium Policies. This strategy was designed to increase our NIW for borrower-paid Single Premium Policies in comparison to our lender-paid Single Premium Policies in order to improve both our return on required capital and our competitive position. Under the Homeowners Protection Act, most borrower-paid Single Premium Policies must be cancelled once the mortgage’s scheduled LTV has declined to 78%. As a result of this automatic cancellation feature and other factors, borrower-paid Single Premium Policies provide an increased return on required capital because, over the life of the loans, the Minimum Required Assets under PMIERs are lower than for lender-paid Single Premium Policies. In the six months since implementing this pricing strategy, we successfully increased our NIW for borrower-paid Single Premium Policies from 5% for the three-month
Part I. Item 2. Management's DiscussionandAnalysis of Financial Condition and Results of Operations (Cont'd)
period ended March 31, 2018 to 14% for the three-month period ended September 30, 2018, and our NIW for lender-paid Single Premium Policies decreased from 16% to 8% for the same periods.
Radian had a competitive pricing advantage with respect to borrower-paid Single Premium Policies, from the implementation of our pricing changes in March 2018 until other MI providers changed their pricing in June 2018. Since June 2018, the other private mortgage insurers have recovered some of the market share for borrower-paid Single Premium Policies. Although this resulted in a slight decrease in our share of this portion of the market in the third quarter of 2018 as compared to the second quarter of 2018, we expect the volume allocated to Radian will continue to be elevated through the remainder of 2018 as compared to 2017.
In response to price changes by other private mortgage insurers, in May 2018 we announced additional pricing changes, effective June 2018, that provide increased risk-based granularity of our pricing across most products. Our pricing changes resulted in a decrease in our Monthly Premium Policy rates and an increase in our Single Premium Policy rates for mortgage insurance, and included the introduction of rate adjustors related to multi-borrower loans and loans with a debt-to-income ratio greater than 45%. Based on Radian’s mix of NIW for the three months ended September 30, 2018, after taking the changes announced in May 2018 into account, our estimate of the overall relative premium rate decrease on NIW is approximately 7%. Radian expects this new pricing will, over the life of the policies, produce a blended return on required capital on our new business on an unlevered basis (i.e., after-tax underwriting returns plus projected investment income) in the mid-teens. This projected return incorporates PMIERs 2.0, which will become effective on March 31, 2019. See “—PMIERs,” below.
Our pricing actions in 2018 are expected to gradually affect our results over time, as existing IIF cancels and is replaced with NIW at current pricing. Assuming our current NIW levels, mix and persistency levels remain constant, it would take approximately three years for one-half of our IIF to reflect our current pricing structure. See “Results of Operations—Mortgage Insurance—NIW, IIF, RIF” for additional information.
During the first quarter of 2018, Freddie Mac and Fannie Mae announced the launch of limited pilot programs, Integrated Mortgage Insurance (“IMAGIN”) and Enterprise-Paid Mortgage Insurance (“EPMI”), respectively, as alternative ways for lenders to sell to the GSEs loans with LTVs greater than 80%. These investor-paid mortgage insurance programs, in which insurance is acquired directly by each GSE, have many of the same features and represent potential alternatives to traditional private mortgage insurance products that are provided to individual lenders. Under the IMAGIN and EPMI programs, which are forward insurance arrangements (forward commitments to insure future loan originations), insurance is being provided by a third party which, in turn, is expected to cede the risk to a panel of reinsurers. Under the EPMI program, a forward insurance arrangement will be secured by Fannie Mae from an approved insurance provider that may be: (i) a Fannie Mae-approved reinsurer or (ii) a traditional mortgage insurer that is approved by Fannie Mae pursuant to the PMIERs. The reinsurers that participate in IMAGIN and EPMI are not subject to compliance with the PMIERs, which may create a competitive disadvantage for private mortgage insurers.
In their current forms, we do not expect that these programs will have a material impact on our financial performance or business prospects, in part due to their current focus on lender-paid Single Premium Policies. If the target volumes are achieved, the total volume from these pilot programs is expected to represent less than 5% of the mortgage insurance market. We also believe there are significant challenges to the long-term sustainability of the programs, including for example that the IMAGIN structure relies on a reinsurance market that, in contrast to traditional mortgage insurance, may not be permanently committed to serving the first-loss mortgage insurance market. However, if these pilot programs or other alternatives to traditional private mortgage insurance were to expand and become broadly accepted alternatives to traditional private mortgage insurance, they could reduce the demand for private mortgage insurance in its traditional form and could negatively affect our financial results and business prospects.
Market Credit Characteristics. NIW on mortgage loans with LTVs greater than 95% has been increasing throughout the industry. In general, borrowers who purchase a home with mortgage insurance tend to have higher LTVs than borrowers who refinance with mortgage insurance. With purchase volume becoming a larger proportion of total originations and access to credit continuing to steadily expand, the proportion of higher-LTV lending in the market has increased. Additional factors contributing to the increase in the industry’s NIW on mortgage loans with LTVs greater than 95% include: (i) GSE program enhancements and guideline changes, including Fannie Mae’s HomeReady program and Freddie Mac’s Home Possible and Home Possible Advantage programs, that are designed to make home ownership more affordable for low- to moderate-income borrowers and (ii) recent lender response to market demands, particularly in light of increasing demand from first-time home buyers. As a result of all of these factors, home purchases by first-time home buyers, who traditionally require mortgage loans with higher LTVs and may have higher debt-to-income ratios, are becoming an increasingly significant portion of the total market. Beginning in late 2017, due in part to changes in GSE guidelines that increased acceptable debt-to-income limits, we
Part I. Item 2. Management's DiscussionandAnalysis of Financial Condition and Results of Operations (Cont'd)
also observed a material increase in the volume of loans to borrowers with debt-to-income ratios greater than 45% throughout the private mortgage insurance industry. These higher levels have continued during the first nine months of 2018.segment. See “Item 7. Management’s Discussion and Analysis of Financial Condition and Results of Operations—Key Factors Affecting Our Results—Services” in our 2018 Form 10-K for further discussion of the drivers of revenues and results in our Services business.
Our Mortgage Insurance business continues to benefit from the improvement in market conditions since the financial crisis of 2007-2008, and from the current strength of the U.S. economy and housing finance industry. See “Results of Operations—Consolidated” for an overview of our financial results for the three and nine months ended September 30, 2019. During the third quarter of 2019, average mortgage rates in the U.S. fell to their lowest levels since 2016. This drove an
Part I. Item 2. Management’s Discussion and Analysis of Financial Condition and Results of Operations (continued)
increase in refinance activity and overall mortgage origination volume. Our performance for the three months ended September 30, 2019 reflects this trend, including record levels of quarterly flow NIW driven by higher purchase and refinance origination volumes, but also a decrease in Persistency Rates resulting from the increased refinance activity. See “Results of Operations—Mortgage Insurance—NIW, IIF, RIFRIF—Net Premiums Written and Earned” for further discussion about these recent trends and the net impact on our IIF portfolio.
In the third quarter of 2019, mortgage underwriting quality remained strong and our new business continued to comprise insurance written on high credit quality loans. In addition, the performance of our existing portfolio of IIF, comprised almost entirely of high credit quality loans originated after the financial crisis, continues to benefit from the effects of positive growth in home prices and historically low levels of unemployment. These positive trends resulted in ongoing favorable results, including improvement in our levels of new defaults, incurred losses, paid claims, and cure rates. See “Results of Operations—Mortgage Insurance” for further discussion.
During 2019, the mortgage insurance industry has continued to shift to a pricing environment where a variety of pricing methodologies and pricing levels are being deployed with differing degrees of risk-based granularity. Although the current pricing frameworks are based upon the same general risk attributes as have been considered in mortgage insurance pricing historically, more granular risk-based pricing factors are now being incorporated into pricing tools. The shift away from a predominately rate card based pricing model and the increase in “black box” pricing frameworks provides a more dynamic pricing capability that has led to an increase in the frequency of pricing changes throughout the mortgage insurance industry.
Our risk-based pricing strategies are designed to grow the long-term economic value of our mortgage insurance portfolio and align with our overall strategic objectives. A majority of our NIW is currently being priced through RADAR Rates, our “black box” pricing framework, which utilizes Radian’s proprietary RADAR risk model and analyzes credit risk inputs to customize a rate quote to a borrower’s individual risk profile, loan attributes and property characteristics. Our approach to pricing, which utilizes more traditional pricing forms in addition to RADAR Rates, is tailored to the specific business needs of our customers and their risk profiles and designed to achieve our targeted returns. This approach represents a continuation of our strategy to consistently provide a full spectrum of pricing options that are customer-centric, flexible and customizable based on a lender’s loan origination process, as well as balanced with our own objectives for managing our volume of NIW and the risk and return profile of our mortgage insurance portfolio. We expect that RADAR Rates will continue to enhance our ability to build a high quality mortgage insurance portfolio.
While our estimated share of the private mortgage insurance market during the first nine months of 2019 has remained relatively consistent at approximately 18%-20%, the shift to a more dynamic digital pricing delivery platform could result in increased volatility of market share within the mortgage insurance industry. In addition, more granular price competition through “black box” pricing frameworks could result in increased volatility of average premium rates for new business.
Legislative and Regulatory Developments
Our subsidiaries are subject to comprehensive regulations and other requirements. In addition to the discussion below, see “Item 1. Business—Regulation” in our 20172018 Form 10-K for additional information about the GSE programs.
Hurricanes. We insure mortgages for homes in areas that have been or in the future may be impacted by natural disasters such as hurricanes, floods and wildfires, including Hurricanes Harvey and Irma in 2017 and Hurricanes Florence and Michael in 2018. Although the number of incremental defaults associated with areas that have been impacted by recent natural disasters, including the hurricanes in 2017 and 2018, may become somewhat elevated, we do not expect these incremental defaults to result in a material increase in our incurred losses or paid claims, given the limitations on our coverage related to property damage and our past experience. However, the future reserve impact of these incremental defaults may differ from our expectations due to overall economic conditions, the pace of economic recovery in the affected areas or other factors. See Note 10 of Notes to Unaudited Condensed Consolidated Financial Statements.
As expected, Radian Guaranty experienced an increase in reported delinquencies in the areas affected by Hurricanes Harvey and Irma in the third and fourth quarters of 2017. Also, as we anticipated, in 2018 we have experienced high cure rates for these hurricane-related delinquencies, and they have not resulted in a material number of paid claims or a material impact on our loss reserves. Because the PMIERs require a higher level of Minimum Required Assets for all defaulted loans, these increases in our defaults temporarily reduced our cushion under the PMIERs. As of September 30, 2018, the impact of these hurricanes on our Minimum Required Assets has substantially decreased, consistent with our expectation that mostdiscussion of the hurricane-related defaults would cure during 2018. This volatility has not affected Radian Guaranty’s compliance withregulations that impact our business, as well as legislative and regulatory developments affecting the PMIERs financial requirements. Although we have not yet experienced an impact on reported delinquencies from Hurricanes Michael and Florence, at September 30, 2018, our total primary mortgage insurance exposure to mortgages in FEMA Designated Areas associated with these recent hurricanes is immaterial. See “Liquidity and Capital Resources—Radian Group—Short-Term Liquidity Needs—Capital Support for Subsidiaries” for additional information on PMIERs.housing finance industry.
PMIERs.In order to be eligible to insure loans purchased by the GSEs, mortgage insurers such as Radian Guaranty must meet the GSEs’ eligibility requirements, or PMIERs. The PMIERs are comprehensive, covering virtually all aspects of the business and operations of a private mortgage insurer, including internal risk management and quality controls, the relationship between the GSEs and the approved insurer and the approved insurer’s financial condition. In addition, the GSEs have a broad range of consent rights undermost recent revisions to the PMIERs, and require private mortgage insurers to obtain the prior consent of the GSEs before taking certain actions, which may include paying dividends, entering into various intercompany agreements and commuting or reinsuring risk, among others.PMIERs 2.0, became effective on March 31, 2019. Radian Guaranty currently is an approved mortgage insurer under the PMIERsPMIERs. See “Liquidity and is in compliance with the PMIERs financial requirements.Capital Resources—Mortgage Insurance” for further discussion about PMIERs.
The GSEs have significant discretion underQualified Mortgage Requirements. As discussed in “Item 1. Business—Regulation” in our 2018 Form 10-K, the PMIERs andDodd-Frank Act provides that a lender must make “a reasonable, good faith determination” of each borrower’s ability to repay a loan, but may amend the PMIERs at any time. As anticipated, on September 27, 2018, the GSEs issued PMIERs 2.0, which will become effective on March 31, 2019. Radian expectspresume that ita borrower will be able to fully comply with PMIERs 2.0repay a loan if the loan has certain characteristics that meet the QM definition. The CFPB adopted its QM definition that establishes rigorous underwriting and maintain anproduct feature requirements for a loan to be deemed a QM. Within those regulations, the CFPB created a special exemption for the GSEs that is generally referred to as the “QM patch” and allows any loan that meets the GSE underwriting and product guidelines to be a QM. The QM patch effectively provides QM designation for GSE eligible loans that have a debt-to-income ratio in excess of Available Assets over Minimum Required Assets as43%, which represents a meaningful portion of the effective date. See “Liquidity and Capital Resources—Radian Group—Short-Term Liquidity Needs” and Note 1 of Notes to Unaudited Condensed Consolidated Financial Statements for additional information.
Services. Our Services segment is primarilyloans currently purchased by the GSEs. Without the QM patch or an alternative, loans with debt-to-income ratios above 43% would not be designated as QM unless they were insured by a fee-for-service business that is dependent upon overall activity in the mortgage, real estate and mortgage finance markets, as wellfederal agency such as the overall healthFHA or VA, which have each adopted their own QM definition that does not currently have a debt-to-income ratio limitation. The QM patch expires on the earlier of the related industries. Due, in part, toend of the transactional natureGSEs’ conservatorship or January 10, 2021. On July 25, 2019, the CFPB released an Advanced Notice of its business, revenues for our Services segment are subject to fluctuations from period to period, including seasonal fluctuations that reflect the activities in these markets. In addition, notwithstanding recent increases in the level of securitization transactions in the marketplace, the continued lack of a meaningful private-label securitization market has significantly limited the growth opportunities for our Services segment. See our 2017 Form 10-K, including Note 1 of Notes to Consolidated Financial Statements, “Item 1. Business-Services—Services Business Overview” and “Overview—Other 2017 Developments,” for additional informationProposed Rulemaking (“ANPR”) regarding the Services segment.
Business Strategy
Consistent with our long-term strategic objectives highlighted below, our business strategy is focused on growing our businesses, diversifying our revenue sources and increasing our fee-based revenues, while atexpiration of the same time enhancing our operations and developing a one-company market view by integrating our product and services offerings more effectively.QM patch. The ANPR specifically states
Part I. Item 2.
Management's DiscussionandAnalysis of Financial Condition and Results of Operations (Cont'd)
|
|
RADIAN’S LONG-TERM STRATEGIC OBJECTIVES |
• Write high-quality and profitable NIW to drive future earnings, in a manner that enhances the long-term economic value of the portfolio |
• Leverage our competitive differentiation through:
» Our diverse products and business model
» Our core credit risk management competency
» Driving a one-company market view through our enterprise sales and marketing platform
» Operational excellence, including customer service, process quality and operational efficiency
» Digitally enabling our products and services by leveraging technology and data to drive our businesses
» Broadening our existing relationships as a valued business partner
|
• Manage our capital and financial flexibility to optimize stockholder value |
• Maintain positive operating leverage through accretive revenue growth and effective expense management (1)
|
______________________
| |
(1) | Operating leverage is a performance metric we define as the year-over-year percentage change in revenues minus the percentage change in expenses. |
In our mortgage insurance business, we monitor various competitive and economic factors while seeking to balance both profitability and market share considerations in developing our strategies. We take a strategic, risk-based approach to establishing our premium rates and writing a mix of business that we expect to grow the economic value of our mortgage insurance portfolio and produce our targeted level of returns on a blended basis, while providing an acceptable level of NIW. See “—Operating Environment—Competition and Pricing,” and “—Results of Operations—Mortgage Insurance—NIW, IIF, RIF.”
Our growth strategy includes leveraging our core expertise in mortgage credit risk management and expanding our presence in the mortgage finance industry, including by participating in certain credit risk transfer programs developed by the GSEs. As part of their initiative to increase the role of private capital in the mortgage market, Fannie Mae and Freddie Mac have established Front-end credit risk transfer programs that provide the GSEs with credit risk coverage on a Flow Basis that is incremental to primary mortgage insurance, as well as Back-end programs that provide the GSEs with credit risk coverage on existing pools of loans. Since 2016, we have participated in the Front-end programs as part of a panel of mortgage insurers, and since 2017 we have participated in Back-end programs as a reinsurance company. Our participation in these programs is subject to pre-established credit parameters. Our total RIF under the Front-end and Back-end credit risk transfer programs was $174.6 million at September 30, 2018 and $100.4 million at December 31, 2017. We expect to continue to participate in these and other similar programs in the future, subject to availability and our evaluation of risk-adjusted returns. We will only experience claims under these Front-end and Back-end credit risk transfer transactions if the borrower’s equity, any existing primary mortgage insurance (if applicable) and the GSEs’ retained risk are depleted. The GSEs retain the first losses on these credit risk transfer transactions, ranging from 35 to 60 basis points. Radian would then be responsible to cover the next layer of losses, which ranges in size from approximately 225 to 325 basis points.
We have been focused on repositioning our Services business by implementing our restructuring plan and using the mortgage, real estate and title services offered through our Services segment to complement our Mortgage Insurance business, as well as by investing in new products and services to innovate and provide integrated solutions for our clients. Our strategy is designed to satisfy demand in the market, grow our fee-based revenues, strengthen our existing customer relationships, attract new customers and differentiate us from other mortgage insurance companies. See “PART II—Item 7. Management’s Discussion and Analysis of Financial Condition and Results of Operations—Overview—Operations (continued)
Business Strategy”that the CFPB intends to allow the QM patch to expire in January 2021 or after a short extension, if necessary, and requests comments on possible amendments to the CFPB’s QM definition, including potential replacements for the QM patch. The CFPB has stated that it is “committed to ensuring a smooth and orderly mortgage market” in considering these issues and any resulting transition away from the QM patch. We believe there are many viable alternatives for replacing the QM patch, which, if adopted in a manner that brings greater consistency to how QM is defined across regulatory agencies, would limit the potential impact on the housing market and mortgage insurance market resulting from the expiration of the QM patch. However, the outcome of the rulemaking process is not known and the expiration of the QM patch without a viable replacement, or other potential amendments of the CFPB’s QM definition, could adversely impact our 2017business, financial condition and results of operations. In our 2018 Form 10-K, see “Item 1. Business—Regulation”and “Item 1A. Risk Factors—Legislation and administrative and regulatory changes and interpretations could impact our businesses”for further discussion regarding the definition of QM, the QM patch and the potential impact on our business.
Housing Finance Reform. In September 2019, the U.S. Treasury and the Department of Housing and Urban Development (“HUD”) released plans (“Plans”) to reform the housing finance market, and with respect to the Treasury Plan, to release the GSEs from conservatorship after certain conditions were met. The Plans, which include actions that may be taken administratively (without Congressional action) and legislatively through Congressional action, call for, among other items: (i) recapitalizing the GSEs in preparation for their release from conservatorship; (ii) a greater role for private capital in limiting the GSEs’ risk profile and taxpayer exposure; (iii) a greater coordination of housing policy between the FHFA and HUD, including a reduction in the market overlap between the FHA and the GSEs; (iv) a better defined role for the FHA in adhering to its core mission of serving low and moderate income borrowers; and (v) increased transparency by the GSEs to support a more level playing field with private capital. Leadership at the FHFA and HUD have stated that they plan to use the Plans to guide the direction and activities of the GSEs and FHA, and in late September 2019, Treasury and the FHFA amended the Senior Preferred Stock Purchase Agreement between them to suspend the quarterly “net worth sweep” of the GSEs’ profits into Treasury and to allow the GSEs to retain collectively up to $45 billion in capital.
Further, in October 2019, the FHFA released its annual 2019 Strategic Plan and 2020 Scorecard for the GSEs with objectives that largely align with the recommendations set forth in the Treasury Plan. With the Plans serving as a roadmap, we expect HUD and FHFA will continue to take actions to shape the role of the FHA and GSEs in the housing finance market and to prepare the GSEs to exit conservatorship. While we believe that private capital is viewed favorably as a critical component of the current and any future housing finance market, actions taken in furtherance of the Plans could impact our business, financial condition and results of operations.
Quarterly Highlights and Recent Company Developments
During the third quarter of 2019, we improved our debt-to-capital ratio and our debt maturity profile by redeeming the remaining $27.0 million and $70.4 million aggregate principal amounts of Senior Notes due 2020 and 2021, respectively. See Note 11 of Notes to Unaudited Condensed Consolidated Financial Statements for additional informationdetails on our Services strategy.borrowings and financing activities.
Other 2018 Developments
CapitalIn addition, we continued to execute upon and Liquidity Actions. On August 9, 2017, Radian Group’s board of directors authorized the Company toenhance our share repurchase up to $50 million of its common stock through July 31, 2018. We completed this programprograms during the first halfthird quarter of 2019, including through the following actions:
the completion of our $250 million share repurchase authorization, initially authorized in August 2018, by purchasing 3,022,856additional shares at an average price of $16.56 per share, including commissions.our common stock totaling $52.5 million, excluding commissions;
On August 16, 2018, Radian Group’s boardthe initiation of directors approved a new share repurchase program that authorizes the Companywith authority to spend up to $200 million to repurchase up to $100 million of itsRadian Group common stock. During the three months ended September 30, 2019, we purchased shares under this new authorization totaling $25 million, excluding commissions; and
subsequent to September 30, 2019, the continuation of common stock repurchases under the current program totaling another $25 million, excluding commissions. As of September 30, 2018, the fullNovember 8, 2019, purchase authority of up to
Part I. Item 2. Management's DiscussionandAnalysis of Financial Condition and Results of Operations (Cont'd)
$100 $150.0 million remained available under this program, which expires on July 31, 2019. program.
See Note 1413 of Notes to Unaudited Condensed Consolidated Financial Statements for additional details on our share repurchase program.
Restructuring and Other Exit Costs. As a result of the Company’s continued implementation of its 2017 plan to restructure the Services business, restructuring charges were recognized in 2018. In the third quarter of 2018, as a result of our periodic review of long-lived assets for impairment, we also incurred other exit costs associated with impairment of internal-use software. See Note 1 of Notes to Unaudited Condensed Consolidated Financial Statements for additional details.
Services Acquisition. During the first quarter of 2018, Radian acquired EnTitle Direct, the owner of EnTitle Insurance Company, a national title insurance and settlement services company, for a purchase price that was not material to Radian. The acquisition is consistent with our growth and diversification strategy, as well as our focus on enhancing the core product offerings of our Services business. EnTitle Insurance Company is qualified to write title insurance business in 40 states and the District of Columbia. By adding the capabilities of EnTitle Insurance Company to the title and settlement services that we already were offering through our existing title agency, ValuAmerica, we have expanded the geographic reach of our title services and are positioned to provide title insurance and settlement services to our customers across the country.
IRS Matter. Radian finalized a settlement with the IRS which resolved the issues and concluded all disputes related to the IRS Matter. During the second quarter of 2018, we recorded tax benefits of $73.6 million, which includes both the impact of the settlement with the IRS as well as the reversal of certain previously accrued state and local tax liabilities. Under the terms of the settlement, we will submit to the IRS approximately $31 million of our $89 million “qualified deposits” with the U.S. Treasury, and the remaining balance will be returned to us. We have excluded the expected $31 million payment from available holding company liquidity at June 30, 2018 and September 30, 2018. During the three-month period ended June 30, 2018, the settlement and related tax benefits resulted in an increase to Radian’s net income per share of $0.34 and an increase in book value per share of $0.35. See Note 9 of Notes to Unaudited Condensed Consolidated Financial Statements for additional information.
Reinsurance. Radian’s reinsurance programs represent a component of our long-term risk distribution strategy. From time to time, we have entered into reinsurance transactions as part of our strategy to manage our capital position and risk profile, which includes managing Radian Guaranty’s position under the PMIERs financial requirements. The credit that we receive under the PMIERs financial requirements for these transactions is subject to periodic review by the GSEs. See “Liquidity and Capital Resources—Radian Group—Short-Term Liquidity Needs” for additional information on PMIERs 2.0.
We are expanding our future risk distribution strategy in an effort to optimize the amounts and types of capital and risk distribution deployed against insured risk. We expect the expansion of our risk distribution strategy to: (i) support our overall capital plans; (ii) lower our cost of capital; and (iii) reduce portfolio risk and financial volatility through economic cycles. As part of this long-term risk distribution strategy, in November 2018 Radian Guaranty plans to enter into a fully collateralized reinsurance agreement with Eagle Re 2018-1 Ltd. (“Eagle Re”), an unaffiliated special purpose insurer domiciled in Bermuda. This reinsurance agreement is expected to reduce net risk in force and PMIERs Minimum Required Assets, thus reducing the capital required at Radian Guaranty. Radian Guaranty expects to receive approximately $434.0 million of excess-of-loss reinsurance protection from Eagle Re, covering an existing portfolio of mortgage insurance policies issued by Radian Guaranty between January 2017 and December 2017. Eagle Re plans to finance the coverage by simultaneously issuing a like amount of mortgage insurance-linked notes to eligible third-party capital market investors in an unregistered private offering.
The mortgage-insurance linked notes to be issued by Eagle Re will consist of three classes as follows:
$241.4 Million Class M-1 Notes with an initial interest rate of one-month LIBOR plus 170 basis points;
$168.0 Million Class M-2 Notes with an initial interest rate of one-month LIBOR plus 300 basis points; and
$24.6 Million Class B-1 Notes with an initial interest rate of one-month LIBOR plus 400 basis points.
Eagle Re is not a subsidiary or affiliate of Radian Guaranty. These transactions are expected to close during November 2018, subject to customary conditions.programs.
Key Factors Affecting Our Results
The key factors affecting our results are discussed in our 2018 Form 10-K. There have been no material changes to thethese key factors affecting our results that are discussed in our 2017 Form 10-K.factors.
Part I. Item 2. Management'sManagement’s DiscussionandAnalysis of Financial Condition and Results of Operations (Cont'd)(continued)
Results of Operations—Consolidated
Three and Nine Months Ended September 30, 20182019 Compared to Three and Nine Months Ended September 30, 20172018
Radian Group serves as the holding company for our operating subsidiaries and does not have any operations of its own. Our consolidated operating results for the three-three and nine-month periodsnine months ended September 30, 20182019 and September 30, 20172018 primarily reflect the financial results and performance of our two business segments—Mortgage Insurance and Services. See Note 3 of Notes to Unaudited Condensed Consolidated Financial Statements for information regarding the basis of our segment reporting, including the related allocations. See “Results of Operations—Mortgage Insurance” and “Results of Operations—Services” for the operating results of these business segments for the three and nine months ended September 30, 2018,2019, compared to the same periods in 2017.2018.
In addition to the results of our operating segments, pretax income (loss) is also affected by those factors described in “Item 7. Management’s Discussion and Analysis of Financial Condition and Results of Operations—Key Factors Affecting Our Results” in our 20172018 Form 10-K.
The following table highlights selected information related to our consolidated results of operations for the three and nine months ended September 30, 20182019 and 2017:2018:
| | | | | | | | $ Change | | | | | | $ Change | | | | | Change | | | | | | Change |
| | Three Months Ended
September 30, | | Favorable (Unfavorable) | | Nine Months Ended
September 30, | | Favorable (Unfavorable) | Three Months Ended
September 30, | | Favorable (Unfavorable) | | Nine Months Ended
September 30, | | Favorable (Unfavorable) |
| (In millions, except per-share amounts) | 2018 |
| 2017 | | 2018 vs. 2017 | | 2018 |
| 2017 | | 2018 vs. 2017 | 2019 |
| 2018 | | 2019 vs. 2018 | | 2019 |
| 2018 | | 2019 vs. 2018 |
| Pretax income | $ | 184.7 |
| | $ | 102.8 |
| | $ | 81.9 |
| | $ | 507.7 |
| | $ | 182.0 |
| | $ | 325.7 |
| $ | 217.7 |
| | $ | 184.7 |
| | $ | 33.0 |
| | $ | 643.4 |
| | $ | 507.7 |
| | $ | 135.7 |
|
| Net income | 142.8 |
| | 65.1 |
| | 77.7 |
| | 466.2 |
| | 114.3 |
| | 351.9 |
| 173.4 |
| | 142.8 |
| | 30.6 |
| | 511.1 |
| | 466.2 |
| | 44.9 |
|
| Diluted net income per share | 0.66 |
| | 0.30 |
| | 0.36 |
| | 2.13 |
| | 0.52 |
| | 1.61 |
| 0.83 |
| | 0.66 |
| | 0.17 |
| | 2.39 |
| | 2.13 |
| | 0.26 |
|
| Book value per share at September 30 | 15.69 |
| | 13.88 |
| | 1.81 |
| | 15.69 |
| | 13.88 |
| | 1.81 |
| 19.40 |
| | 15.69 |
| | 3.71 |
| | 19.40 |
| | 15.69 |
| | 3.71 |
|
| | | | | | | | | | | |
|
| | | | | | | | | | | |
| Net premiums earned—insurance | 258.4 |
| | 236.7 |
| | 21.7 |
| | 752.3 |
| | 687.6 |
| | 64.7 |
| |
| Services revenue | 36.6 |
| | 39.6 |
| | (3.0 | ) | | 106.6 |
| | 115.4 |
| | (8.8 | ) | |
| Net investment income | 39.0 |
| | 32.5 |
| | 6.5 |
| | 110.4 |
| | 93.6 |
| | 16.8 |
| |
Net premiums earned—insurance (1) | | 281.2 |
| | 258.4 |
| | 22.8 |
| | 843.9 |
| | 752.3 |
| | 91.6 |
|
Services revenue (2) | | 42.5 |
| | 36.6 |
| | 5.9 |
| | 114.6 |
| | 106.6 |
| | 8.0 |
|
Net investment income (1) | | 42.8 |
| | 39.0 |
| | 3.8 |
| | 130.4 |
| | 110.4 |
| | 20.0 |
|
| Net gains (losses) on investments and other financial instruments | (4.5 | ) | | 2.5 |
| | (7.0 | ) | | (30.8 | ) | | 5.0 |
| | (35.8 | ) | 13.0 |
| | (4.5 | ) | | 17.5 |
| | 47.5 |
| | (30.8 | ) | | 78.3 |
|
| Provision for losses | 20.9 |
| | 35.8 |
| | 14.9 |
| | 77.5 |
| | 100.0 |
| | 22.5 |
| |
| Cost of services | 25.9 |
| | 27.2 |
| | 1.3 |
| | 73.2 |
| | 81.3 |
| | 8.1 |
| |
Provision for losses (1) | | 29.2 |
| | 20.9 |
| | (8.3 | ) | | 97.4 |
| | 77.5 |
| | (19.9 | ) |
Cost of services (2) | | 29.0 |
| | 25.9 |
| | (3.1 | ) | | 81.0 |
| | 73.2 |
| | (7.8 | ) |
| Other operating expenses | 70.1 |
| | 64.2 |
| | (5.9 | ) | | 203.6 |
| | 201.3 |
| | (2.3 | ) | 76.4 |
| | 70.1 |
| | (6.3 | ) | | 225.2 |
| | 203.6 |
| | (21.6 | ) |
| Restructuring and other exit costs | 4.5 |
| | 12.0 |
| | 7.5 |
| | 5.9 |
| | 12.0 |
| | 6.1 |
| — |
| | 4.5 |
| | 4.5 |
| | — |
| | 5.9 |
| | 5.9 |
|
| Loss on induced conversion and debt extinguishment | — |
| | 45.8 |
| | 45.8 |
| | — |
| | 51.5 |
| | 51.5 |
| |
| Impairment of goodwill | — |
| | — |
| | — |
| | — |
| | 184.4 |
| | 184.4 |
| |
| Amortization and impairment of other acquired intangible assets | 3.5 |
| | 2.9 |
| | (0.6 | ) | | 9.0 |
| | 25.0 |
| | 16.0 |
| |
| Loss on extinguishment of debt | | 5.9 |
| | — |
| | (5.9 | ) | | 22.7 |
| | — |
| | (22.7 | ) |
| Income tax provision | 41.9 |
| | 37.7 |
| | (4.2 | ) | | 41.5 |
| | 67.7 |
| | 26.2 |
| 44.2 |
| | 41.9 |
| | (2.3 | ) | | 132.2 |
| | 41.5 |
| | (90.7 | ) |
Adjusted pretax operating income (3) | | $ | 212.7 |
| | $ | 196.7 |
| | $ | 16.0 |
| | $ | 630.7 |
| | $ | 551.8 |
| | $ | 78.9 |
|
Adjusted diluted net operating income per share (3) | | 0.81 |
| | 0.71 |
| | 0.10 |
| | 2.33 |
| | 1.99 |
| | 0.34 |
|
| | | | | | | | | | | |
|
| | | | | | | | | | | |
Adjusted pretax operating income (1) | $ | 196.7 |
| | $ | 155.6 |
| | $ | 41.1 |
| | $ | 551.8 |
| | $ | 444.6 |
| | $ | 107.2 |
| |
| Return on equity | | 18.0 | % | | 17.4 | % | | 0.6 | % | | 18.4 | % | | 19.6 | % | | (1.2 | )% |
Adjusted net operating return on equity (3) | | 17.4 | % | | 19.0 | % | | (1.6 | )% | | 17.9 | % | | 18.3 | % | | (0.4 | )% |
______________________
| |
| (1) | Relates primarily to the Mortgage Insurance segment. See “Results of Operations—Mortgage Insurance” for more information. |
| |
| (2) | Relates to our Services segment. See “Results of Operations—Services” for more information. |
| |
| (3) | See “—Use of Non-GAAP Financial MeasureMeasures” below. |
Net Income. As discussed in more detail below, our net income increased for the three and nine months ended September 30, 2018,2019, compared to the same periods in 2017,2018, primarily reflecting: (i) a decrease in loss on induced conversion and debt extinguishment; (ii) an increase in net premiums earned; (iii) a decrease(ii) an increase in provision for losses; (iv)net gains on investments and other financial instruments; and (iii) an increase in net investment income; (v) a decrease in restructuring and other exit costs, primarily associated with our restructuring of the Services business; and (vi) a lower federal income tax rate in 2018 (see “Income Tax Provision” below).income. Partially offsetting these items is an increase in net losses on investments and other financial instruments. The change in our net income for the nine months ended September 30, 2018, compared to the same period in 2017, also reflects the impairment of goodwill and
Part I. Item 2. Management'sManagement’s DiscussionandAnalysis of Financial Condition and Results of Operations (Cont'd)(continued)
these items are increases in: (i) provision for losses; (ii) other acquired intangible assets related to our Services segment recognizedoperating expenses; and (iii) loss on extinguishment of debt. The increase in the three months ended June 30, 2017. See “Results of Operations—Mortgage Insurance” and “Results of Operations—Services” for more information on our segment results.
For the three and nine months ended September 30, 2018, revenue increased compared to the same periods in 2017, primarily driven by increases of 8% and 9%, respectively, in mortgage insurance net premiums earned. Other operating expenses increased by 9% for the three months ended September 30, 2018 and increased by 1%income for the nine months ended September 30, 2018, both as2019, compared to the same periodsperiod in 2017, primarily due2018, also reflects a cumulative adjustment to unearned premiums recorded in the second quarter of 2019, as discussed in Note 3 of Notes to Unaudited Condensed Consolidated Financial Statements. In addition, the overall increase in net income for the nine months ended September 30, 2019, compared to the acquisition of Entitle Directsame period in 2018, andwas partially offset by an increase in the resulting consolidationincome tax provision, due primarily to a $73.6 million tax benefit in 2018 related to the impact of its operating expenses.the settlement of the IRS Matter (see “—Income Tax Provision” below).
Diluted Net Income Per Share. The increasechange in diluted net income per share for the three and nine months ended September 30, 2018,2019, compared to the same periods in 2017,2018, is primarily due to the increasechange in net income, as discussed above.
Book Value Per Share. The increase in book value per share from $13.90$16.34 at December 31, 20172018, to $15.69$19.40 at September 30, 20182019, is primarily due toto: (i) our net income partially offset by a decreasefor the nine months ended September 30, 2019 and (ii) an increase of $0.40$0.87 per share due to net unrealized lossesgains in our available for sale securities, recorded in accumulated other comprehensive income.
Services Revenue and Cost These increases were partially offset by the $0.26 per share net impact of Services. Services revenue and cost of services represent amounts related to our Services segment and are discussed below in “Results of Operations—Services.”
Net Investment Income. Forshare repurchases for the three and nine months ended September 30, 2018 and 2017, net investment income represents investment income from investments held at Radian Group that are allocated to2019, inclusive of the Mortgage Insurance segment and investment income from investments held by the Mortgage Insurance segment. See “Resultscost of Operations—Mortgage Insurance” for more information.these repurchases.
Net Gains (Losses) on Investments and Other Financial Instruments. The increase in net lossesgains on investments and other financial instruments for the three and nine months ended September 30, 2018,2019, as compared to the same periodperiods in 2017,2018, is primarily due to the increase in realized losses attributable to sales and redemptions of fixed-maturities available for sale. The increase in net losses on investments and other financial instruments for the nine months ended September 30, 2018, as compared to the same period in 2017, is primarily due toto: (i) the increase in unrealized lossesgains in our trading portfolio related to changes in fair value resulting from increasedlower interest rates.rates and (ii) net realized gains on our fixed-maturities available for sale. The components of the net gains (losses) on investments and other financial instruments for the periods indicated are as follows:
| | | | Three Months Ended
September 30, | | Nine Months Ended
September 30, | Three Months Ended
September 30, | | Nine Months Ended
September 30, |
| (In millions) | 2018 | | 2017 | | 2018 | | 2017 | 2019 | | 2018 | | 2019 | | 2018 |
| Net unrealized gains (losses) related to change in fair value of trading securities and other investments | $ | 1.4 |
| | $ | 2.3 |
| | $ | (17.1 | ) | | $ | 14.5 |
| $ | 4.4 |
| | $ | 1.4 |
| | $ | 33.0 |
| | $ | (17.1 | ) |
| Net realized gains (losses) on investments | (4.5 | ) | | — |
| | (9.0 | ) | | (9.4 | ) | 4.6 |
| | (4.5 | ) | | 4.6 |
| | (9.0 | ) |
| Other-than-temporary impairment losses | (0.9 | ) | | — |
| | (1.8 | ) | | (1.0 | ) | — |
| | (0.9 | ) | | — |
| | (1.8 | ) |
| Net gains (losses) on other financial instruments | (0.5 | ) | | 0.2 |
| | (2.9 | ) | | 0.9 |
| 4.0 |
| | (0.5 | ) | | 9.8 |
| | (2.9 | ) |
| Net gains (losses) on investments and other financial instruments | $ | (4.5 | ) | | $ | 2.5 |
| | $ | (30.8 | ) | | $ | 5.0 |
| $ | 13.0 |
| | $ | (4.5 | ) | | $ | 47.4 |
| | $ | (30.8 | ) |
| | | | | | | | | | | | | | | |
Other Operating Expenses. Other operating expenses for the three and nine months ended September 30, 2018,2019 increased as compared to the same periodsperiod in 2017,2018, primarily as a result of:due to: (i) higher compensation expense in 2018,2019, including variable and incentive-based compensation and (ii) an increase due to the acquisition of EnTitle Direct on March 27, 2018, and the resulting inclusion of its operating expenses. These effects were partially offset by an increaseongoing investments in ceding commissions in 2018, primarily due to the 2018 Single Premium QSR Agreement and the increased cession percentage on the 2016 Single Premium QSR Agreement.our technology systems. In addition to these items, other operating expenses for the nine months ended September 30, 2018,2019 increased, as compared to the same period in 2017, also included:2018, due to: (i) lowerthe inclusion of operating expenses associated with retirement and consulting agreements entered intoof businesses acquired in February 2017 with our former Chief Executive Officer2018 and (ii) lower accrued legal expensesan increase in non-operating items, primarily related to defending and resolving certain outstanding legal matters.impairment of other long-lived assets. Partially offsetting these items for the nine months ended September 30, 2019, is an increase in ceding commissions, resulting from a change in estimate affecting policies covered under our Single Premium QSR Program. See Note 3 of Notes to Unaudited Condensed Consolidated Financial Statements for further discussion about the change in estimate for Single Premium Policies.
Restructuring and other exit costs.Other Exit Costs. For the three and nine months ended September 30, 2018, restructuring and other exit costs included charges associated with our plan to restructure the Services business. In addition to restructuring charges
associated with our servicesServices business, in the third quarter of 2018 we also recognized $3.6 million of other exit costs associated
Part I. Item 2. Management's DiscussionandAnalysis of Financial Condition and Results of Operations (Cont'd)
with impairment of internal-use software.
Loss on Extinguishment of Debt. For the three and nine months ended September 30, 2019, the redemption of our remaining Senior Notes due 2020 and 2021 resulted in a loss on extinguishment of debt of $5.9 million and $22.7 million, respectively. See Note 111 of Notes to Unaudited Condensed Consolidated Financial Statements for more information.
Loss on Induced Conversion and Debt Extinguishment. During 2018, we have had no induced conversion or debt extinguishment activities. During the third quarter of 2017, pursuant to cash tender offers, we purchased aggregate principal amounts of $141.4 million, $115.9 million and $152.3 million of our Senior Notes due 2019, 2020 and 2021, respectively. We funded the purchases with $450.0 million in cash (plus accrued and unpaid interest due on the purchased notes). These purchases resulted in a loss on induced conversion and debt extinguishment of $45.8 million.
During the second quarter of 2017, we purchased an aggregate principal amount of $21.6 million of our outstanding Convertible Senior Notes due 2017. These purchases of Convertible Senior Notes due 2017 resulted in a loss on induced conversion and debt extinguishment of $1.2 million. During the first quarter of 2017, we settled our obligations on the remaining Convertible Senior Notes due 2019, resulting in a loss on debt extinguishment of $4.5 million that represented the difference between the fair value and the carrying value, net of unamortized issuance costs, of the liability component of the Convertible Senior Notes due 2019.
Impairment of Goodwill and Other Acquired Intangible Assets. There was no goodwill impairment in 2018. During the second quarter of 2017, we recorded a goodwill impairment charge of $184.4 million, as well as an impairment charge for other acquired intangible assets of $15.8 million, in each case related to our Services segment. These charges were primarily due to changes in expectations regarding the future growth of certain Services product lines, resulting from decisions to change our business strategy, combined with market trends observed during the second quarter of 2017 that we expect to persist. See Note 7 of Notes to Consolidated Financial Statements in our 2017 Form 10-K for additional information.
Income Tax Provision. From 2017 to 2018, ourOur effective tax rates were primarily affected by: (i) the reduction in the federal statutory tax rate as a result of the TCJA, effective January 1, 2018was 20.3% and (ii) the reversal of previously accrued tax liabilities related to the IRS Matter in the second quarter of 2018. The TCJA significantly changed the U.S. tax system and, among other things, reduced the federal corporate tax rate from 35% to 21%, effective January 1, 2018. During the three months ended June 30, 2018, we recorded tax benefits of $73.6 million related to the impact of the settlement with the IRS as well as the reversal of certain previously accrued state and local tax liabilities. See Note 9 of Notes to Unaudited Condensed Consolidated Financial Statements and “Overview—Other 2018 Developments”20.6% for additional information.
For the three and nine months ended September 30, 2019, respectively, which approximates the federal statutory rate. For the same periods in 2018, and 2017, our effective tax rate wasrates were different from the federal statutory tax rate, primarily due to the tax impact of Discrete Items. The impact of Discrete Items on our effective tax rate may fluctuate from period to period. InDuring the nine months ended September 30, 2018, the Discrete
Part I. Item 2. Management’s Discussion and Analysis of Financial Condition and Results of Operations (continued)
Items impacting our effective tax rate primarily includeincluded $73.6 million of tax benefit related to the impactsettlement of the settlement withIRS Matter and related state tax liabilities.
Return on Equity. The change in return on equity is primarily due to the IRS, excess tax benefits and deficiencies from share-based payments to employees, and state and localchange in net income taxes.partially offset by the increase in stockholders’ equity.
Use of Non-GAAP Financial Measure.Measures. In addition to the traditional GAAP financial measures, we have presented “adjusted pretax operating income,” a“adjusted diluted net operating income per share” and “adjusted net operating return on equity,” which are non-GAAP financial measuremeasures for the consolidated company, among our key performance indicators to evaluate our fundamental financial performance. ThisThese non-GAAP financial measure alignsmeasures align with the way our business performance is evaluated by both management and by our board of directors. This measure hasThese measures have been established in order to increase transparency for the purposes of evaluating our operating trends and enabling more meaningful comparisons with our peers. Although on a consolidated basis “adjusted pretax operating income” is aincome,” “adjusted diluted net operating income per share” and “adjusted net operating return on equity” are non-GAAP financial measure,measures, for the reasons discussed above we believe this measure aidsthese measures aid in understanding the underlying performance of our operations. Our senior management, including our Chief Executive Officer (Radian’s chief operating decision maker), uses adjusted pretax operating income (loss) as our primary measure to evaluate the fundamental financial performance of the Company’s business segments and to allocate resources to the segments.
Adjusted pretax operating income is defined as GAAP consolidated pretax income (loss) excluding the effects of: (i) net gains (losses) on investments and other financial instruments; (ii) loss on induced conversionextinguishment of debt; (iii) amortization and debt extinguishment; (iii) acquisition-related expenses; (iv) amortization or impairment of goodwill and other acquired intangible assets; and (v) net(iv) impairment losses recognized in earningsof other long-lived assets and other non-operating items, such as losses from the sale of lines of business.
Althoughbusiness and acquisition-related expenses. Adjusted diluted net operating income per share is calculated by dividing (i) adjusted pretax operating income excludes certain items that have occurred inattributable to common stockholders, net of taxes computed using the past and are expected to occur inCompany’s statutory tax rate, by (ii) the future, the excluded items represent those that are: (i) not viewed as partsum of the weighted average number of common shares outstanding and all dilutive potential common shares outstanding. Adjusted net operating performancereturn on equity is calculated by dividing annualized adjusted pretax operating income, net of our primary activities or (ii) not expectedtaxes computed using the Company’s statutory tax rate, by average stockholders’ equity, based on the average of the beginning and ending balances for each period presented. See Note 4 of Notes to result in an economic impact equal to the amount reflected in pretax income. These adjustments, along with the reasons for their treatment, are described below.
| |
(1) | Net gains (losses) on investmentsConsolidated Financial Statements and “Item 7. Management’s Discussion and other financial instruments.The recognition of realized investment gains or losses can vary significantly across periods as the activity is highly discretionary based on the timing of individual securities sales due to such factors as market opportunities, our
|
Part I. Item 2. Management's DiscussionandAnalysis of Financial Condition and Results of Operations (Cont'd)
tax and capital profile and overall market cycles. Unrealized investment gains and losses arise primarily from changes in the market valueOperations—Results of Operations—Consolidated—Use of Non-GAAP Financial Measures”each inour investments that are classified as trading or equity securities. These valuation adjustments may not necessarily result in realized economic gains or losses.
Trends in the profitability of our fundamental operating activities can be more clearly identified without the fluctuations of these realized and unrealized gains or losses. We do not view them to be indicative of our fundamental operating activities. Therefore, these2018 Form 10-K for detailed information regarding items are excluded from our calculation of adjusted pretax operating income (loss).including the reasons for their treatment.
| |
(2) | Loss on induced conversion and debt extinguishment. Gains or losses on early extinguishment of debt and losses incurred to purchase our convertible debt prior to maturity are discretionary activities that are undertaken in order to take advantage of market opportunities to strengthen our financial and capital positions; therefore, we do not view these activities as part of our operating performance. Such transactions do not reflect expected future operations and do not provide meaningful insight regarding our current or past operating trends. Therefore, these items are excluded from our calculation of adjusted pretax operating income (loss).
|
| |
(3) | Acquisition-related expenses. Acquisition-related expenses represent the costs incurred to effect an acquisition of a business (i.e., a business combination). Because we pursue acquisitions on a strategic and selective basis and not in the ordinary course of our business, we do not view acquisition-related expenses as a consequence of a primary business activity. Therefore, we do not consider these expenses to be part of our operating performance and they are excluded from our calculation of adjusted pretax operating income (loss).
|
| |
(4) | Amortization or impairment of goodwill and other acquired intangible assets. Amortization of acquired intangible assets represents the periodic expense required to amortize the cost of acquired intangible assets over their estimated useful lives. Acquired intangible assets with an indefinite useful life are also periodically reviewed for potential impairment, and impairment adjustments are made whenever appropriate. These charges are not viewed as part of the operating performance of our primary activities and therefore are excluded from our calculation of adjusted pretax operating income (loss).
|
| |
(5) | Net impairment losses recognized in earnings and losses from the sale of lines of business. The recognition of net impairment losses on investments and the impairment of other long-lived assets does not result in a cash payment and can vary significantly in both amount and frequency, depending on market credit cycles and other factors. Losses from the sale of lines of business are highly discretionary as a result of strategic restructuring decisions, and generally do not occur in the normal course of our business. We do not view these losses to be indicative of our fundamental operating activities. Therefore, whenever these losses occur, we exclude them from our calculation of adjusted pretax operating income (loss).
|
Total adjusted pretax operating income, isadjusted diluted net operating income per share and adjusted net operating return on equity are not a measuremeasures of totaloverall profitability, and therefore should not be considered in isolation or viewed as a substitutesubstitutes for GAAP pretax income.income, diluted net income per share or return on equity. Our definitiondefinitions of adjusted pretax operating income, adjusted diluted net operating income per share and adjusted net operating return on equity may not be comparable to similarly-named measures reported by other companies.
Part I. Item 2. Management'sManagement’s DiscussionandAnalysis of Financial Condition and Results of Operations (Cont'd)(continued)
The following table provides a reconciliationtables provide reconciliations of the most comparable GAAP measure,measures of consolidated pretax income, diluted net income per share and return on equity, to our non-GAAP financial measuremeasures for the consolidated company of adjusted pretax operating income:income, adjusted diluted net operating income per share and adjusted net operating return on equity, respectively:
|
| | | | | | | | | | | | | | | |
| Reconciliation of Consolidated Non-GAAP Financial Measure |
| | Three Months Ended
September 30, | | Nine Months Ended
September 30, |
| (In thousands) | 2018 | | 2017 | | 2018 | | 2017 |
| Consolidated pretax income | $ | 184,688 |
| | $ | 102,814 |
| | $ | 507,701 |
| | $ | 182,010 |
|
| Less income (expense) items: | | | | | | | |
| Net gains (losses) on investments and other financial instruments | (4,480 | ) | | 2,480 |
| | (30,771 | ) | | 4,960 |
|
| Loss on induced conversion and debt extinguishment | — |
| | (45,766 | ) | | — |
| | (51,469 | ) |
Acquisition-related expenses (1) | (2 | ) | | (54 | ) | | (418 | ) | | (126 | ) |
| Impairment of goodwill | — |
| | — |
| | — |
| | (184,374 | ) |
| Amortization and impairment of other acquired intangible assets | (3,472 | ) | | (2,890 | ) | | (8,968 | ) | | (25,042 | ) |
Impairment of other long-lived assets (2) | (4,057 | ) | | (6,575 | ) | | (3,953 | ) | | (6,575 | ) |
Total adjusted pretax operating income (3) | $ | 196,699 |
| | $ | 155,619 |
| | $ | 551,811 |
| | $ | 444,636 |
|
| | | | | | | | |
|
| | | | | | | | | | | | | | | |
| Reconciliation of Consolidated Pretax Income to Adjusted Pretax Operating Income |
| | Three Months Ended
September 30, | | Nine Months Ended
September 30, |
| (In thousands) | 2019 | | 2018 | | 2019 | | 2018 |
| Consolidated pretax income | $ | 217,673 |
| | $ | 184,688 |
| | $ | 643,354 |
| | $ | 507,701 |
|
| Less reconciling income (expense) items: | | | | | | | |
| Net gains (losses) on investments and other financial instruments | 13,009 |
| | (4,480 | ) | | 47,462 |
| | (30,771 | ) |
| Loss on extinguishment of debt | (5,940 | ) | | — |
| | (22,738 | ) | | — |
|
| Amortization and impairment of other acquired intangible assets | (2,139 | ) | | (3,472 | ) | | (6,465 | ) | | (8,968 | ) |
Impairment of other long-lived assets and other non-operating items (1) | — |
| | (4,059 | ) | | (5,557 | ) | | (4,371 | ) |
Total adjusted pretax operating income (2) | $ | 212,743 |
| | $ | 196,699 |
|
| $ | 630,652 |
|
| $ | 551,811 |
|
| | | | | | | | |
______________________
| |
| (1) | Acquisition-relatedThe amount for the nine months ended September 30, 2019 primarily relates to impairments of other long-lived assets and is included in other operating expenses represent expenses incurred to effecton the acquisitioncondensed consolidated statement of a business, net of adjustments to accruals previously recordedoperations. The amount for acquisition expenses. |
| |
(2) | Included within restructuringthe three and other exit costs. For the threenine months ended September 30, 2018 primarily relates to the impairment of internal-use software. Includes, forsoftware and is included in restructuring and other exit costs on the nine months ended September 30, 2018, a working capital adjustment related to the saleconsolidated statement of our EuroRisk business.operations. |
| |
(3)(2) | Total adjusted pretax operating income on a consolidated basis consists of adjusted pretax operating income (loss) for our Mortgage Insurance segment and our Services segment, as further detailed in in Note 3 of Notes to Unaudited Condensed Consolidated Financial Statements. |
|
| | | | | | | | | | | | | | | | |
Reconciliation of Diluted Net Income Per Share to Adjusted Diluted Net Operating Income Per Share |
| | Three Months Ended
September 30, | | Nine Months Ended
September 30, | |
| (In thousands) | 2019 | | 2018 | | 2019 | | 2018 | |
| Diluted net income per share | $ | 0.83 |
| | $ | 0.66 |
| | $ | 2.39 |
| | $ | 2.13 |
| |
| | | | | | | | | |
| Less per-share impact of reconciling income (expense) items: | | | | | | | | |
| Net gains (losses) on investments and other financial instruments | 0.06 |
| | (0.02 | ) | | 0.22 |
| | (0.14 | ) | |
| Loss on extinguishment of debt | (0.03 | ) | | — |
| | (0.11 | ) | | — |
| |
| Amortization and impairment of other acquired intangible assets | (0.01 | ) | | (0.02 | ) | | (0.03 | ) | | (0.04 | ) | |
| Impairment of other long-lived assets and other non-operating items | — |
| | (0.02 | ) | | (0.03 | ) | | (0.02 | ) | |
Income tax (provision) benefit on reconciling income (expense) items (1) | — |
| | 0.01 |
| | (0.01 | ) | | 0.04 |
| |
Difference between statutory and effective tax rates | — |
| | — |
| | 0.02 |
| | 0.30 |
| (2) |
| Per-share impact of reconciling income (expense) items | 0.02 |
| | (0.05 | ) | | 0.06 |
| | 0.14 |
| |
Adjusted diluted net operating income per share (1) | $ | 0.81 |
| | $ | 0.71 |
| | $ | 2.33 |
| | $ | 1.99 |
| |
| | | | | | | | | |
______________________
| |
| (1) | Calculated using the Company’s federal statutory tax rate of 21%. Any permanent tax adjustments and state income taxes on these items have been deemed immaterial and are not included. |
| |
| (2) | Includes $0.34 of tax benefit related to the settlement of the IRS Matter, which includes both the impact of the settlement with the IRS as well as the reversal of certain related previously accrued state and local tax liabilities. |
Part I. Item 2. Management’s Discussion and Analysis of Financial Condition and Results of Operations (continued)
|
| | | | | | | | | | | | |
Reconciliation of Return on Equity to Adjusted Net Operating Return on Equity (1) |
| | Three Months Ended
September 30, | | Nine Months Ended
September 30, | |
| (In thousands) | 2019 | | 2018 | | 2019 | | 2018 | |
Return on equity (1) | 18.0 | % | | 17.4 | % | | 18.4 | % | | 19.6 | % | |
Less impact of reconciling income (expense) items: (2) | | | | | | | | |
| Net gains (losses) on investments and other financial instruments | 1.4 |
| | (0.5 | ) | | 1.7 |
| | (1.3 | ) | |
| Loss on extinguishment of debt | (0.6 | ) | | — |
| | (0.8 | ) | | — |
| |
| Amortization and impairment of other acquired intangible assets | (0.2 | ) | | (0.4 | ) | | (0.2 | ) | | (0.4 | ) | |
| Impairment of other long-lived assets and other non-operating items | — |
| | (0.5 | ) | | (0.2 | ) | | (0.2 | ) | |
Income tax (provision) benefit on reconciling income (expense) items (3) | (0.1 | ) | | 0.3 |
| | (0.1 | ) | | 0.4 |
| |
| Difference between statutory and effective tax rates | 0.1 |
| | (0.5 | ) | | 0.1 |
| | 2.8 |
| (4) |
| Impact of reconciling income (expense) items | 0.6 |
| | (1.6 | ) |
| 0.5 |
|
| 1.3 |
| |
| Adjusted net operating return on equity | 17.4 | % | | 19.0 | % | | 17.9 | % | | 18.3 | % | |
| | | | | | | | | |
______________________
| |
| (1) | Calculated by dividing annualized net income by average stockholders’ equity, based on the average of the beginning and ending balances for each period presented. |
| |
| (2) | Annualized, as a percentage of average stockholders’ equity. |
| |
| (3) | Calculated using the Company’s federal statutory tax rate of 21%. Any permanent tax adjustments and state income taxes on these items have been deemed immaterial and are not included. |
| |
| (4) | Includes 3.1% of tax benefit related to the settlement of the IRS Matter, which includes both the impact of the settlement with the IRS as well as the reversal of certain related previously accrued state and local tax liabilities. |
Part I. Item 2. Management'sManagement’s DiscussionandAnalysis of Financial Condition and Results of Operations (Cont'd)(continued)
Results of Operations—Mortgage Insurance
Three and Nine Months Ended September 30, 20182019 Compared to Three and Nine Months Ended September 30, 20172018
The following table summarizes our Mortgage Insurance segment’s results of operations for the three and nine months ended September 30, 20182019 and 2017:2018:
| | | | | | | | $ Change | | | | | | $ Change | | | | | $ Change | | | | | | $ Change |
| | Three Months Ended
September 30, | | Favorable (Unfavorable) | | Nine Months Ended
September 30, | | Favorable (Unfavorable) | Three Months Ended
September 30, | | Favorable (Unfavorable) | | Nine Months Ended
September 30, | | Favorable (Unfavorable) |
| (In millions) | 2018 | | 2017 | | 2018 vs. 2017 | | 2018 | | 2017 | | 2018 vs. 2017 | 2019 | | 2018 | | 2019 vs. 2018 | | 2019 | | 2018 | | 2019 vs. 2018 |
Adjusted pretax operating income (1) | $ | 204.6 |
| | $ | 168.5 |
| | $ | 36.1 |
| | $ | 573.8 |
| | $ | 473.5 |
| | $ | 100.3 |
| |
Net premiums written—insurance (2) | 253.8 |
| | 247.8 |
| | 6.0 |
| | 743.8 |
| | 713.8 |
| | 30.0 |
| |
Adjusted pretax operating income (1) (2) | | $ | 214.3 |
| | $ | 204.6 |
| | $ | 9.7 |
| | $ | 641.8 |
| | $ | 573.8 |
| | $ | 68.0 |
|
| Net premiums written—insurance | | 270.6 |
| | 253.8 |
| | 16.8 |
| | 787.5 |
| | 743.8 |
| | 43.7 |
|
| (Increase) decrease in unearned premiums | 1.7 |
| | (11.1 | ) | | 12.8 |
| | 3.2 |
| | (26.2 | ) | | 29.4 |
| 7.0 |
| | 1.7 |
| | 5.3 |
| | 48.2 |
| | 3.2 |
| | 45.0 |
|
| Net premiums earned—insurance | 255.5 |
| | 236.7 |
| | 18.8 |
| | 747.0 |
| | 687.6 |
| | 59.4 |
| 277.6 |
| | 255.5 |
| | 22.1 |
| | 835.7 |
| | 747.0 |
| | 88.7 |
|
| Net investment income | 38.8 |
| | 32.5 |
| | 6.3 |
| | 110.2 |
| | 93.6 |
| | 16.6 |
| 42.6 |
| | 38.8 |
| | 3.8 |
| | 129.8 |
| | 110.2 |
| | 19.6 |
|
| Provision for losses | 20.7 |
| | 36.0 |
| | 15.3 |
| | 77.5 |
| | 100.9 |
| | 23.4 |
| 29.1 |
| | 20.7 |
| | (8.4 | ) | | 97.1 |
| | 77.5 |
| | (19.6 | ) |
Other operating expenses (3) | 52.9 |
| | 48.7 |
| | (4.2 | ) | | 156.8 |
| | 156.0 |
| | (0.8 | ) | |
| Policy acquisition costs | | 6.4 |
| | 5.7 |
| | (0.7 | ) | | 18.5 |
| | 18.8 |
| | 0.3 |
|
Other operating expenses (2) | | 57.8 |
| | 52.9 |
| | (4.9 | ) | | 166.7 |
| | 156.8 |
| | (9.9 | ) |
| Interest expense | | 13.5 |
| | 11.1 |
| | (2.4 | ) | | 44.2 |
| | 32.6 |
| | (11.6 | ) |
______________________
| |
| (1) | Our senior management uses adjusted pretax operating income (loss) as our primary measure to evaluate the fundamental financial performance of each of the Company’s business segments. See Note 3 of Notes to Unaudited Condensed Consolidated Financial Statements. |
| |
| (2) | Net of ceded premiums written under the QSR Program and the Single Premium QSR Program. See Note 7 of Notes to Unaudited Condensed Consolidated Financial Statements for more information. |
| |
(3) | Includes allocation of corporate operating expenses of $26.7 million and $76.7 million for the three and nine months ended September 30, 2019, respectively, and $19.8 million and $58.5 million for the three and nine months ended September 30, 2018, respectively, and $11.7 million and $41.8 million2018. See Note 3 of Notes to Unaudited Condensed Consolidated Financial Statements for the three and nine months ended September 30, 2017, respectively.more information about our allocation of corporate operating expenses to segments. |
Adjusted Pretax Operating Income. Our Mortgage Insurance segment’s adjusted pretax operating income increased for the three and nine months ended September 30, 2018,2019, compared to the same periods in 2017,2018, primarily reflecting: (i) an increase in net premiums earned;earned and (ii) a decrease in provision for losses; and (iii) an increase in net investment income. See “—NIW, IIF, RIF—Net Premiums Written and Earned” for more information about our net premiums earned. Partially offsetting these items are increases in: (i) provision for losses; (ii) other operating expenses; and (iii) interest expense as a result of the Clayton Intercompany Note repayment. See “—NIW, IIF, RIF—Other Operating Expenses” as well as “Results of Operations—Services—Three and Nine Months Ended September 30, 2019 Compared to Three and Nine Months Ended September 30, 2018—Interest Expense” for additional information.
Part I. Item 2. Management’s Discussion and Analysis of Financial Condition and Results of Operations (continued)
NIW, IIF, RIF
A key component of our current business strategy is to write profitable insurance on high credit quality mortgages in the U.S. Consistent with this objective, we wrote $15.8$22.0 billion and $43.8$51.4 billion of primary new mortgage insuranceNIW in the three and nine months ended September 30, 2018,2019, respectively, compared to $15.1$15.8 billion and $39.5$43.8 billion of NIW in the three and nine months ended September 30, 2017.2018, respectively. Our Persistency Rate for the twelve months ended September 30, 2019 increased slightly to 81.5%, as compared to 81.4% for the twelve months ended September 30, 2018. The combination of our NIW and our Persistency Rate resulted in an increase in IIF, from $200.7$221.4 billion at December 31, 20172018 to $217.1$237.2 billion at September 30, 2018,2019, as shown in the chart below. Policy years represent the original policy years, and have not been adjusted to reflect subsequent HARP refinancing activity. Our Persistency Rate for the twelve months ended September 30, 2018 increased to 81.4%, as compared to 80.0% for the twelve months ended September 30, 2017.
Part I. Item 2. Management's DiscussionandAnalysis of Financial Condition and Results of Operations (Cont'd)
______________________
| |
| (1) | Policy years represent the original policy years, and have not been adjusted to reflect subsequent HARP refinancing activity. |
| |
| (2) | Adjusted to reflect subsequent HARP refinancing activity, this percentage would decrease to 6.4%5.0%, 8.4%6.0% and 9.1%6.4% as of September 30, 2018,2019, December 31, 20172018 and September 30, 2017,2018, respectively. |
Our IIF is one of the primary driversdriver of the future premiums that we expect to earn over time. Although not reflected in the current period financial statements, nor in our reported book value, we expect our IIF to generate substantial earnings in future periods, due to the high credit quality of our current mortgage insurance portfolio and its expected persistency over multiple years. Additionally, as a resultSee “Item 7. Management’s Discussion and Analysis of the TCJA, the economic valueFinancial Condition and Results of our existing IIF increased significantly due to the increase in expected future net cash flows associated with the reduction in tax payments. See “KeyOperations—Key Factors Affecting Our Results—Mortgage Insurance—IIF; Persistency Rate; Mix of Business” in our 20172018 Form 10-K for more information.
We implemented pricing changes during the first half of 2018 that we estimate will result in an overall relative premium rate decrease on NIW. These changes, however, do not affect the value or future returns on our IIF written prior to 2018; therefore, the impact of these pricing actions on near-term revenue is expected to be limited. The changes are expected to gradually affect our results over time, as existing IIF is replaced with NIW at current pricing. Assuming our current NIW levels, mix and persistency levels remain constant, it would take approximately three years for one-half of our IIF to reflect our current pricing structure. However, the ultimate results of the changes will be influenced by many other factors, including the amount of NIW, changes in the product and credit profile mix of both NIW and policy cancellations, the impact of interest rates and product mix on persistency, and the amount of reinsurance we use. See “Overview—Operating Environment—Competition and Pricing” for additional information.
NIW increased by 4.2%39.8% and 10.9%17.3% for the three and nine months ended September 30, 2018,2019, respectively, compared to the same periods in 2017, primarily attributable to an increase in our market share of borrower-paid Single Premium Policies and the penetration rate of private mortgage insurance into the overall mortgage origination market, partially offset by decreased refinance originations.
2018. We believe total mortgage origination volume was lowerhigher for the three and nine months ended September 30, 2018,2019, as compared to the comparable periods in 2017, primarily2018, due to a decrease in refinance mortgage originations resulting from the slightly higher interest rate environment, partially offset by a modestan increase in both purchase and refinance originations. Mortgage insurance penetrationConsistent with these trends in the purchasemortgage origination market, has gradually increased over the past few years, and because the penetration rate for mortgage insurance is generally three to five times higher onvolume of both our purchase originations than on refinancing transactions,and our refinance originations increased during the three and nine months ended September 30, 2019, compared to the same periods in 2018. Our NIW for 2019 also reflects the successful implementation of RADAR Rates, our “black box” pricing strategy, which has been well received by customers with a majority of the NIW we are writing currently being priced through RADAR Rates.
Part I. Item 2. Management'sManagement’s DiscussionandAnalysis of Financial Condition and Results of Operations (Cont'd)(continued)
believe that even though the total mortgage origination volume was lower, the private mortgage insurance market was larger for the three- and nine-month periods ended September 30, 2018, compared to the same periods in 2017.
Although it is difficult to project future volumes, industry sources expect the total mortgage origination market for the full year 20182019 to decline approximately 9%increase 20% compared to 2017,2018, driven by a declinean increase in refinance originations of approximately 28% as a result of higher anticipatedlower interest rates. Purchase originations arerates as well as an expected to increase 2%, compared to 2017. Given our expected penetration rates,in purchase originations. Similarly, we currently expect the private mortgage insurance market for the full year 2019 to be slightly largerincrease in comparison to 2018, than in 2017.driven by both purchase and refinance originations. Based on industry forecasts and our expectations, including penetration rates and our market share,projections, we currently expect our NIW in 20182019 to exceed $55 billion.
Consistent with these trendsbe in the mortgage origination market described above, the levelrange of $65 billion to $70 billion.
As of September 30, 2019, our purchase origination volume increased and our refinance origination volume decreased, each as a percentageportfolio of business written after 2008, including HARP refinancings, represented approximately 95% of our total NIW, during the three- and nine-month periods ended September 30, 2018, compared to the same periods in 2017. As a percentage of our total NIW, the volume of our NIW on mortgage loans with LTVs greater than 95% also increased during the three-and nine-month periods ended September 30, 2018, compared to the same periods in 2017. During the three- and nine-month periods ended September 30, 2018, compared to the same periods in 2017, we also continued to experience an increased percentage of our total NIW on mortgage loans to borrowers with higher debt-to-income ratios, including debt-to-income ratios greater than 45%. Notwithstanding this mix shift toward higher LTVs and debt-to-income ratios, loanprimary RIF. Loan originations after 2008 consist primarily of high credit quality loans with significantly better credit performance than loans originated during 2008 and prior periods. See “Overview—Operating Environment” for additional information.
As of September 30, 2018, our portfolio of business written after 2008, including HARP refinancings, represented approximately 94% of our total primary RIF. The volume of insurance that we have written on high credit quality loans after 2008 has significantly improved our mortgage insurance portfolio mix and, together with favorable credit trends, has had a significant positive impact on our results of operations.mix.
Our actual and expected future losses on our portfoliosportfolio written after 2008, together with HARP refinancings, are significantly lower than those experienced on our NIW prior to and including 2008. The following charts illustrate the trends of our cumulative incurred loss ratios by year of origination and development year.
______________________
| |
| (1) | Represents inception-to-date losses incurred as a percentage of net premiums earned. |
| |
| (2) | Incurred losses in 2017 were slightly, but not materially, elevated due to the impact of Hurricanes Harvey and Irma. See “Overview—Operating Environment—Hurricanes” |
| |
| (3) | Radian’s stochastic modeling, used for additional information.pricing, indicates an approximate 20% through-the-cycle loss ratio on newly originated mortgage insurance business. |
Part I. Item 2. Management'sManagement’s DiscussionandAnalysis of Financial Condition and Results of Operations (Cont'd)(continued)
The following tables provide selected information as of and for the periods indicated related to mortgage insurance NIW, RIF and IIF. Policy years represent the original policy years and have not been adjusted to reflect subsequent HARP refinancing activity. Throughout this report, unless otherwise noted, RIF is presented on a gross basis and includes the amount ceded under reinsurance. NIW, RIF and IIF for direct Single Premiums include policies written on an individual basis (as each loan is originated) and on an aggregated basis (in which each individual loan in a group of loans is insured in a single transaction, typically after the loans have been originated).
|
| | | | | | | | | | | | | | | | | | | | | | | | | | | |
| | Three Months Ended September 30, | | Nine Months Ended September 30, |
| ($ in millions) | 2018 | | 2017 | | 2018 | | 2017 |
| Total primary NIW by FICO score | | | | | | | | | | | | | | | |
| >=740 | $ | 9,572 |
| | 60.7 | % | | $ | 9,236 |
| | 61.1 | % | | $ | 26,672 |
| | 60.8 | % | | $ | 24,240 |
| | 61.3 | % |
| 680-739 | 4,959 |
| | 31.5 |
| | 4,924 |
| | 32.5 |
| | 14,093 |
| | 32.2 |
| | 12,879 |
| | 32.6 |
|
| 620-679 | 1,233 |
| | 7.8 |
| | 965 |
| | 6.4 |
| | 3,080 |
| | 7.0 |
| | 2,403 |
| | 6.1 |
|
| Total Primary NIW | $ | 15,764 |
| | 100.0 | % | | $ | 15,125 |
| | 100.0 | % | | $ | 43,845 |
| | 100.0 | % | | $ | 39,522 |
| | 100.0 | % |
| | | | | | | | | | | | | | | | |
|
| | | | | | | | | | | | | | | |
| | Three Months Ended
September 30, | | Nine Months Ended
September 30, |
| ($ in millions) | 2018 | | 2017 | | 2018 | | 2017 |
| Percentage of primary NIW | | | | | | | |
| Direct Monthly and Other Premiums | 78 | % | | 77 | % | | 78 | % | | 76 | % |
| Direct Single Premiums | 22 | % | | 23 | % | | 22 | % | | 24 | % |
| Lender-paid | 8 | % | | 21 | % | | 10 | % | | 22 | % |
Borrower-paid (1) | 14 | % | | 2 | % | | 12 | % | | 2 | % |
| | | | | | | | |
Net Single Premiums (2) | 8 | % | | 15 | % | | 8 | % | | 15 | % |
| | | | | | | | |
| NIW for Purchases | 96 | % | | 91 | % | | 93 | % | | 89 | % |
| | | | | | | | |
| NIW for Refinances | 4 | % | | 9 | % | | 7 | % | | 11 | % |
| | | | | | | | |
| LTV | | | | | | | |
| 95.01% and above | 16.9 | % | | 14.3 | % | | 16.3 | % | | 12.5 | % |
| 90.01% to 95.00% | 44.3 | % | | 45.7 | % | | 44.7 | % | | 46.7 | % |
| 85.01% to 90.00% | 27.9 | % | | 28.1 | % | | 27.6 | % | | 28.9 | % |
| 85.00% and below | 10.9 | % | | 11.9 | % | | 11.4 | % | | 11.9 | % |
| | | | | | | | |
| Primary risk written | $ | 3,979 |
| | $ | 3,825 |
| | $ | 11,063 |
| | $ | 9,978 |
|
| | | | | | | | |
|
| | | | | | | | | | | | | | | |
| Primary NIW | | | | | | | |
| | Three Months Ended
September 30, | | Nine Months Ended
September 30, |
| ($ in millions) | 2019 | | 2018 | | 2019 | | 2018 |
| Total primary NIW | $ | 22,037 |
| | $ | 15,764 |
| | $ | 51,416 |
| | $ | 43,845 |
|
| Total primary risk written | $ | 5,261 |
| | $ | 3,979 |
| | $ | 12,531 |
| | $ | 11,063 |
|
| Average coverage percentage | 23.9 | % | | 25.2 | % | | 24.4 | % | | 25.2 | % |
| | | | | | | | |
| Primary NIW by Loan Purpose: | | | | | | | |
| Purchases | 80.7 | % | | 95.5 | % | | 86.4 | % | | 93.5 | % |
| Refinances | 19.3 | % | | 4.5 | % | | 13.6 | % | | 6.5 | % |
| | | | | | | | |
| Primary NIW by Premium Type: | | | | | | | |
| Direct Monthly and Other Recurring Premiums | 85.0 | % | | 78.4 | % | | 84.0 | % | | 77.7 | % |
Borrower-paid (1) | 13.1 |
| | 14.2 |
| | 13.5 |
| | 11.7 |
|
| Lender-paid | 1.9 |
| | 7.4 |
| | 2.5 |
| | 10.6 |
|
| Direct single premiums | 15.0 |
| | 21.6 |
| | 16.0 |
| | 22.3 |
|
| Total | 100.0 | % | | 100.0 | % | | 100.0 | % | | 100.0 | % |
| | | | | | | | |
| Total borrower-paid | 97.1 | % | | 91.4 | % | | 96.5 | % | | 88.3 | % |
| | | | | | | | |
Primary NIW by FICO Score (2) : | | | | | | | |
| >=740 | 64.1 | % | | 55.5 | % | | 62.1 | % | | 55.9 | % |
| 680-739 | 31.5 | % | | 34.7 | % | | 32.5 | % | | 35.5 | % |
| 620-679 | 4.4 | % | | 9.8 | % | | 5.4 | % | | 8.6 | % |
| | | | | | | | |
| Primary NIW by LTV: | | | | | | | |
| 95.01% and above | 16.8 | % | | 16.9 | % | | 18.7 | % | | 16.3 | % |
| 90.01% to 95.00% | 37.4 | % | | 44.3 | % | | 38.5 | % | | 44.7 | % |
| 85.01% to 90.00% | 27.4 | % | | 27.9 | % | | 27.2 | % | | 27.6 | % |
| 85.00% and below | 18.4 | % | | 10.9 | % | | 15.6 | % | | 11.4 | % |
______________________
| |
| (1) | Borrower-paid Single Premium Policies provide an increased return on required capital because, over the life of the loans, thehave lower Minimum Required Assets under the PMIERs are lower than foras compared to lender-paid Single Premium Policies. See “Overview—Operating Environment—Competition and Pricing” for additional information. |
| |
| (2) | RepresentsFor loans with multiple borrowers, the percentage of direct Single Premium Policiesprimary new insurance written after giving effect toby FICO score represents the Single Premium NIW ceded under the Single Premium QSR Program (for NIW after the effective dateslowest of the respective agreements). See Note 7borrowers’ FICO scores. All periods prior to March 31, 2019 had previously been presented based on the FICO score of Notesthe primary borrower and have been restated to Unaudited Condensed Consolidated Financial Statements for additional information about these arrangements.reflect the lowest of the borrowers’ FICO scores. |
Part I. Item 2. Management'sManagement’s DiscussionandAnalysis of Financial Condition and Results of Operations (Cont'd)(continued)
|
| | | | | | | | | | | |
| ($ in millions) | September 30,
2018 | | December 31,
2017 | | September 30,
2017 |
| Primary IIF | | | | | |
| Direct Monthly and Other Premiums | 70 | % | | 69 | % | | 68 | % |
| Direct Single Premiums | 30 | % | | 31 | % | | 32 | % |
| | | | | | |
Net Single Premiums (1) | 18 | % | | 20 | % | | 25 | % |
| | | | | | |
| Total Primary IIF | $ | 217,096 |
| | $ | 200,724 |
| | $ | 196,541 |
|
| | | | | | |
Persistency Rate (12 months ended) | 81.4 | % | | 81.1 | % | | 80.0 | % |
Persistency Rate (quarterly, annualized) (2) | 83.4 | % | | 79.4 | % | (3) | 80.4 | % |
|
| | | | | | | | | | | |
| Primary IIF and RIF | | | | | |
| ($ in millions) | September 30, 2019 | | December 31, 2018 | | September 30, 2018 |
| Total primary IIF | $ | 237,158 |
| | $ | 221,443 |
| | $ | 217,096 |
|
| Total primary RIF | $ | 60,420 |
| | $ | 56,728 |
| | $ | 55,577 |
|
| Average coverage percentage | 25.5 | % | | 25.6 | % | | 25.6 | % |
| | | | | | |
| Total primary RIF on defaulted loans | $ | 1,012 |
| | $ | 1,032 |
| | $ | 1,019 |
|
| Percentage of RIF in default | 1.7 | % | | 1.8 | % | | 1.8 | % |
| | | | | | |
| Persistency Rate (12 months ended) | 81.5 | % | | 83.1 | % | | 81.4 | % |
Persistency Rate (quarterly, annualized) (1) | 75.5 | % | | 85.5 | % | | 83.4 | % |
| | | | | | |
| Primary RIF by Premium Type: | | | | | |
| Direct Monthly and Other Recurring Premiums | 72.0 | % | | 70.3 | % | | 69.9 | % |
Borrower-paid (2) | 8.5 |
| | 7.3 |
| | 7.0 |
|
| Lender-paid | 19.5 |
| | 22.4 |
| | 23.1 |
|
| Direct single premiums | 28.0 |
| | 29.7 |
| | 30.1 |
|
| Total | 100.0 | % | | 100.0 | % | | 100.0 | % |
| | | | | | |
| Total borrower-paid | 77.8 | % | | 74.5 | % | | 73.7 | % |
| | | | | | |
Primary RIF by FICO Score (3) : | | | | | |
| >=740 | 56.2 | % | | 55.1 | % | | 55.1 | % |
| 680-739 | 34.5 | % | | 34.8 | % | | 34.7 | % |
| 620-679 | 8.6 | % | | 9.3 | % | | 9.3 | % |
| <=619 | 0.7 | % | | 0.8 | % | | 0.9 | % |
| | | | | | |
| Primary RIF by LTV: | | | | | |
| 95.01% and above | 13.9 | % | | 11.6 | % | | 11.0 | % |
| 90.01% to 95.00% | 51.9 | % | | 53.1 | % | | 53.1 | % |
| 85.01% to 90.00% | 27.9 | % | | 29.0 | % | | 29.4 | % |
| 85.00% and below | 6.3 | % | | 6.3 | % | | 6.5 | % |
| | | | | | |
| Primary RIF by Policy Year: | | | | | |
| 2008 and prior | 8.4 | % | | 10.1 | % | | 10.9 | % |
| 2009 - 2013 | 8.1 | % | | 11.4 | % | | 12.4 | % |
| 2014 | 4.8 | % | | 6.1 | % | | 6.5 | % |
| 2015 | 8.1 | % | | 10.2 | % | | 10.9 | % |
| 2016 | 13.5 | % | | 16.8 | % | | 17.9 | % |
| 2017 | 17.4 | % | | 21.1 | % | | 22.0 | % |
| 2018 | 19.7 | % | | 24.3 | % | | 19.4 | % |
| 2019 | 20.0 | % | | — | % | | — | % |
______________________
| |
| (1) | RepresentsThe Persistency Rate on a quarterly, annualized basis is calculated based on loan-level detail for the percentagequarter ending as of Single Premium IIF, after giving effect to all reinsurance ceded. See Note 7the date shown. It may be impacted by seasonality or other factors, including the level of Notes to Unaudited Condensed Consolidated Financial Statements for additional information about reinsurance transactions.refinance activity during the applicable periods, and may not be indicative of full-year trends. |
| |
| (2) | The Persistency Rate on a quarterly, annualized basis may be impacted by seasonality or other factors, and may not be indicative of full-year trends.Borrower-paid Single Premium Policies have lower Minimum Required Assets under the PMIERs as compared to lender-paid Single Premium Policies.
|
| |
| (3) | The Persistency RateFor loans with multiple borrowers, the percentage of primary risk in force by FICO score represents the fourth quarterlowest of 2017 was reduced by an increase in cancellationsthe borrowers’ FICO scores. All periods prior to March 31, 2019 had previously been presented based on the FICO score of Single Premium Policies duethe primary borrower and have been restated to increased cancellations identified by our ongoing servicer monitoring process for Single Premium Policies.reflect the lowest of the borrowers’ FICO scores. |
|
| | | | | | | | | | | | | | | | | | | | |
| ($ in millions) | September 30,
2018 | | December 31,
2017 | | September 30,
2017 |
| Primary RIF by Premium Type | | | | | | | | | | | |
| Direct Monthly and Other Premiums | $ | 38,865 |
| | 69.9 | % | | $ | 35,452 |
| | 69.1 | % | | $ | 34,500 |
| | 68.7 | % |
| Direct Single Premiums | 16,712 |
| | 30.1 |
| | 15,836 |
| | 30.9 |
| | 15,737 |
| | 31.3 |
|
| Total primary RIF | $ | 55,577 |
| | 100.0 | % | | $ | 51,288 |
| | 100.0 | % | | $ | 50,237 |
| | 100.0 | % |
| | | | | | | | | | | | |
Net Single Premiums (1) | $ | 8,224 |
| | 18.2 | % | | $ | 8,320 |
| | 19.3 | % | | $ | 10,843 |
| | 24.3 | % |
| | | | | | | | | | | | |
| Primary RIF by Internal Risk Grade | | | | | | | | | | | |
| Prime | $ | 54,168 |
| | 97.5 | % | | $ | 49,674 |
| | 96.9 | % | | $ | 48,516 |
| | 96.6 | % |
| Alt-A and A minus and below | 1,409 |
| | 2.5 |
| | 1,614 |
| | 3.1 |
| | 1,721 |
| | 3.4 |
|
| Total primary RIF | $ | 55,577 |
| | 100.0 | % | | $ | 51,288 |
| | 100.0 | % | | $ | 50,237 |
| | 100.0 | % |
| | | | | | | | | | | | |
______________________ | |
(1) | Represents the dollar amount and percentage, respectively, of Single Premium RIF, after giving effect to all reinsurance ceded. |
|
| | | | | | | | | | | | | | | | | | | | |
| ($ in millions) | September 30,
2018 | | December 31,
2017 | | September 30,
2017 |
| Total primary RIF by FICO score | | | | | | | | | | | |
| >=740 | $ | 33,006 |
| | 59.4 | % | | $ | 30,225 |
| | 58.9 | % | | $ | 29,509 |
| | 58.8 | % |
| 680-739 | 17,536 |
| | 31.5 |
| | 16,097 |
| | 31.4 |
| | 15,716 |
| | 31.3 |
|
| 620-679 | 4,559 |
| | 8.2 |
| | 4,425 |
| | 8.6 |
| | 4,440 |
| | 8.8 |
|
| <=619 | 476 |
| | 0.9 |
| | 541 |
| | 1.1 |
| | 572 |
| | 1.1 |
|
| Total primary RIF | $ | 55,577 |
| | 100.0 | % | | $ | 51,288 |
| | 100.0 | % | | $ | 50,237 |
| | 100.0 | % |
| | | | | | | | | | | | |
| Primary RIF on defaulted loans | $ | 1,019 |
| | | | $ | 1,389 |
| | | | $ | 1,137 |
| | |
| | | | | | | | | | | | |
Part I. Item 2. Management'sManagement’s DiscussionandAnalysis of Financial Condition and Results of Operations (Cont'd)(continued)
|
| | | | | | | | | | | | | | | | | | | | |
| ($ in millions) | September 30,
2018 | | December 31,
2017 | | September 30,
2017 |
| Total primary RIF by LTV | | | | | | | | | | | |
| 95.01% and above | $ | 6,101 |
| | 11.0 | % | | $ | 4,704 |
| | 9.2 | % | | $ | 4,307 |
| | 8.6 | % |
| 90.01% to 95.00% | 29,549 |
| | 53.1 |
| | 27,276 |
| | 53.2 |
| | 26,680 |
| | 53.1 |
|
| 85.01% to 90.00% | 16,327 |
| | 29.4 |
| | 15,719 |
| | 30.6 |
| | 15,646 |
| | 31.1 |
|
| 85.00% and below | 3,600 |
| | 6.5 |
| | 3,589 |
| | 7.0 |
| | 3,604 |
| | 7.2 |
|
| Total primary RIF | $ | 55,577 |
| | 100.0 | % | | $ | 51,288 |
| | 100.0 | % | | $ | 50,237 |
| | 100.0 | % |
| | | | | | | | | | | | |
| Total primary RIF by policy year | | | | | | | | | | | |
| 2008 and prior | $ | 6,016 |
| | 10.9 | % | | $ | 7,159 |
| | 14.0 | % | | $ | 7,663 |
| | 15.2 | % |
| 2009 | 220 |
| | 0.4 |
| | 298 |
| | 0.6 |
| | 334 |
| | 0.7 |
|
| 2010 | 181 |
| | 0.3 |
| | 264 |
| | 0.5 |
| | 315 |
| | 0.6 |
|
| 2011 | 516 |
| | 0.9 |
| | 682 |
| | 1.3 |
| | 747 |
| | 1.5 |
|
| 2012 | 2,255 |
| | 4.1 |
| | 2,830 |
| | 5.5 |
| | 3,048 |
| | 6.1 |
|
| 2013 | 3,723 |
| | 6.7 |
| | 4,557 |
| | 8.9 |
| | 4,895 |
| | 9.8 |
|
| 2014 | 3,635 |
| | 6.5 |
| | 4,356 |
| | 8.5 |
| | 4,681 |
| | 9.3 |
|
| 2015 | 6,077 |
| | 10.9 |
| | 7,096 |
| | 13.8 |
| | 7,499 |
| | 14.9 |
|
| 2016 | 9,930 |
| | 17.9 |
| | 10,992 |
| | 21.4 |
| | 11,316 |
| | 22.5 |
|
| 2017 | 12,227 |
| | 22.0 |
| | 13,054 |
| | 25.5 |
| | 9,739 |
| | 19.4 |
|
| 2018 | 10,797 |
| | 19.4 |
| | — |
| | — |
| | — |
| | — |
|
Total primary RIF (1) | $ | 55,577 |
| | 100.0 | % | | $ | 51,288 |
|
| 100.0 | % |
| $ | 50,237 |
|
| 100.0 | % |
| | | | | | | | | | | | |
______________________ | |
(1) | At September 30, 2018, December 31, 2017 and September 30, 2017, consists of 97.7%, 97.3% and 97.3%, respectively, of RIF related to fixed-rate mortgages. |
Net Premiums Written and Earned. Net premiums written and earned for the three and nine months ended September 30, 20182019 increased compared to the same periods in 2017 primarily due to2018, reflecting an increase in our IIF which was primarily related to an increase in our Monthly Premium Policies. This increase was partially offset by the increased cession percentage on the Single Premium QSR Program.
Part I. Item 2. Management's DiscussionandAnalysis of Financial Condition and Results of Operations (Cont'd)
The table below provides additional information about the components of netmonthly premium policies. Net premiums earned for the periods indicated.nine months ended September 30, 2019 includes a $32.9 million cumulative adjustment related to an update to the amortization rates used to recognize revenue for Single Premium Policies. See Note 3 of Notes to Unaudited Condensed Consolidated Financial Statements for further information.
|
| | | | | | | | | | | | | | | |
| | Three Months Ended
September 30, | | Nine Months Ended
September 30, |
| (in thousands) | 2018 | | 2017 | | 2018 | | 2017 |
Net premiums earned—insurance: | | | | | | | |
| Direct | | | | | | | |
| Premiums earned, excluding revenue from cancellations | $ | 259,928 |
| | $ | 235,126 |
| | $ | 757,141 |
| | $ | 690,656 |
|
| Single Premium Policy cancellations | 11,559 |
| | 15,415 |
| | 38,670 |
| | 39,176 |
|
| Direct premiums earned | 271,487 |
| | 250,541 |
| | 795,811 |
| | 729,832 |
|
| | | | | | | | |
| Ceded | | | | | | | |
| Premiums earned, excluding revenue from cancellations | (20,990 | ) | | (15,647 | ) | | (61,784 | ) | | (48,052 | ) |
Single Premium Policy cancellations (1) | (3,288 | ) | | (3,075 | ) | | (10,635 | ) | | (7,800 | ) |
Profit commission—other (2) | 8,267 |
| | 4,876 |
| | 23,589 |
| | 13,597 |
|
| Ceded premiums, net of profit commission | (16,011 | ) | | (13,846 | ) | | (48,830 | ) | | (42,255 | ) |
| | | | | | | | |
| Assumed premiums earned | 6 |
| | 7 |
| | 19 |
| | 21 |
|
| | | | | | | | |
Total net premiums earned—insurance | $ | 255,482 |
| | $ | 236,702 |
| | $ | 747,000 |
| | $ | 687,598 |
|
| | | | | | | | |
______________________
| |
(1) | Includes the impact of related profit commissions. |
| |
(2) | The amounts represent the profit commission on the Single Premium QSR Program, excluding impact of Single Premium Policy cancellations. |
The impact of mortgage prepayment speeds on the mix of business we write affects the revenue ultimately produced by our mortgage insurance business. Because prepayment speeds are difficult to project, our strategy has been to write a mixSee “Item 7. Management’s Discussion and Analysis of Single Premium PoliciesFinancial Condition and Monthly Premium Policies, which we believe balances the overall impact on our results if actual prepayment speeds are significantly different from expectations. The Single Premium QSR Program is also partResults of our strategy to balance our mix of Single Premium Policies and Monthly Premium Policies. As of September 30, 2018, the impact of all of our third-party quota share reinsurance programs reduced our Single Premium RIF from 30.1% to 18.2%. We expect our production level for Single Premium Policies to fluctuate over time based on various factors, which include risk-return and risk-mix considerations, as well as market conditions. See “Overview—Operating EnvironmentOperations—Competition and Pricing,” above, as well as “KeyKey Factors Affecting Our Results—Mortgage InsuranceResults—Mortgage Insurance—IIF; Persistency Rate; Mix of Business” in our 20172018 Form 10-K for more information.
The table below provides additional information about the components of mortgage insurance net premiums earned for the periods indicated, including the effects of our reinsurance programs.
|
| | | | | | | | | | | | | | | |
| | Three Months Ended
September 30, | | Nine Months Ended
September 30, |
| (in thousands) | 2019 | | 2018 | | 2019 | | 2018 |
Net premiums earned—insurance: | | | | | | | |
| Direct | | | | | | | |
| Premiums earned, excluding revenue from cancellations | $ | 274,595 |
| | $ | 257,940 |
| | $ | 858,200 |
| (1) | $ | 752,338 |
|
| Single Premium Policy cancellations | 27,254 |
| | 11,559 |
| | 53,004 |
| | 38,670 |
|
| Direct | 301,849 |
| | 269,499 |
| | 911,204 |
| (1) | 791,008 |
|
| | | | | | | | |
Assumed (2) | 2,614 |
| | 1,993 |
| | 7,545 |
| | 4,821 |
|
| | | | | | | | |
| Ceded | | | | | | | |
| Premiums earned, excluding revenue from cancellations | (28,457 | ) | | (20,989 | ) | | (106,891 | ) | (1) | (61,783 | ) |
Single Premium Policy cancellations (3) | (8,137 | ) | | (3,288 | ) | | (15,923 | ) | | (10,635 | ) |
Profit commission—other (4) | 9,729 |
| | 8,267 |
| | 39,775 |
| (1) | 23,589 |
|
| Ceded premiums, net of profit commission | (26,865 | ) | | (16,010 | ) | | (83,039 | ) | (1) | (48,829 | ) |
| | | | | | | | |
Total net premiums earned—insurance | $ | 277,598 |
| | $ | 255,482 |
| | $ | 835,710 |
| (1) | $ | 747,000 |
|
| | | | | | | | |
______________________
| |
| (1) | Includes a cumulative adjustment to unearned premiums recorded in the second quarter of 2019 related to an update to the amortization rates used to recognize revenue for Single Premium Policies. See Note 3 of Notes to Unaudited Condensed Consolidated Financial Statements for further information. |
| |
| (2) | Includes premiums earned from our participation in certain credit risk transfer programs. |
| |
| (3) | Includes the impact of related profit commissions. |
| |
| (4) | The amounts represent the profit commission on the Single Premium QSR Program, excluding the impact of Single Premium Policy cancellations. |
Net Premiums Written and Earned—Ceded. Historically, we have entered intoWe use third-party reinsurance transactions, including the Single Premium QSR Program,in our mortgage insurance business as part ofof our risk distribution strategy, including to manage our capital position and risk management activities. The Single Premium QSR Program isprofile. When we enter into a reinsurance agreement, the reinsurer receives a premium and, in exchange, agrees to insure an agreed-upon portion of incurred losses. While these arrangements have the impact of reducing our earned premiums, they are expected to increase Radian Guaranty’s return on required capital for its Single Premium Policies.the related policies. The impact of the Single Premium QSR Programthese programs on our financial results will vary depending on the level of ceded RIF, as well as the levels of prepayments and incurred losses on the reinsured portfolio,portfolios, among other factors. The levelSee “Item 7. Management’s Discussion and Analysis of RIF that may be cededFinancial Condition and Results of Operations—Key Factors Affecting Our Results—Mortgage Insurance—Third-Party Reinsurance” and Note 8 of Notes to Consolidated Financial Statements in the future is currently subject to certain contractual conditions that may affect the amount ceded, including a limitation on ceded premium written equal to $335 millionour 2018 Form 10-K for policies issued between January 1, 2018 and December 31, 2019. Notwithstanding this limitation, the parties may mutually agree to amend the agreement, including with respect to any limitations on the amounts of insurance that may be ceded.more information about our reinsurance transactions.
Part I. Item 2. Management'sManagement’s DiscussionandAnalysis of Financial Condition and Results of Operations (Cont'd)(continued)
The following table provides information related to the premium impact of our QSR Program and Single Premium QSR Program.reinsurance programs. See Note 7 of Notes to Unaudited Condensed Consolidated Financial Statements for more information about our reinsurance programs, including the ceded amounts related to the twothose programs.
|
| | | | | | | | | | | |
| | Three Months Ended
September 30, | | Nine Months Ended
September 30, |
| | 2018 | | 2017 | | 2018 | | 2017 |
| QSR Program | | | | | | | |
| % of total direct premiums written | 1.1 | % | | 1.7 | % | | 1.3 | % | | 2.0 | % |
| % of total direct premiums earned | 1.7 | % | | 2.7 | % | | 1.9 | % | | 3.0 | % |
| | | | | | | | |
| Single Premium QSR Program | | | | | | | |
| % of total direct premiums written | 7.4 | % | | 5.0 | % | | 7.8 | % | | 4.7 | % |
| % of total direct premiums earned | 4.0 | % | | 2.7 | % | | 4.1 | % | | 2.6 | % |
| | | | | | | | |
|
| | | | | | | | | | | |
| | Three Months Ended
September 30, | | Nine Months Ended
September 30, |
| | 2019 | | 2018 | | 2019 | | 2018 |
| % of total direct and assumed premiums written | | | | | | | |
| QSR Program | 0.7 | % | | 1.1 | % | | 0.8 | % | | 1.3 | % |
| Single Premium QSR Program | 2.2 |
| | 7.4 |
| | 1.1 |
| | 7.8 |
|
| Excess-of-Loss Program | 2.4 |
| | — |
| | 2.8 |
| | — |
|
| Total | 5.3 | % | | 8.5 | % | | 4.7 | % | | 9.1 | % |
| | | | | | | | |
| % of total direct and assumed premiums earned | | | | | | | |
| QSR Program | 1.0 | % | | 1.7 | % | | 1.2 | % | | 1.9 | % |
| Single Premium QSR Program | 5.3 |
| | 4.0 |
| | 5.7 |
| | 4.1 |
|
| Excess-of-Loss Program | 2.4 |
| | — |
| | 2.0 |
| | — |
|
| Total | 8.7 | % | | 5.7 | % | | 8.9 | % | | 6.0 | % |
| | | | | | | | |
The table below provides information about the amount by which our reinsurance programs reduced our Minimum Required Assets as of the dates indicated.
|
| | | | | | | | | | | |
| (in thousands) | September 30, 2019 | | December 31, 2018 | | September 30, 2018 |
PMIERs impact - reduction in Minimum Required Assets: (1) | | | | | |
| QSR Program | $ | 38,227 |
| | $ | 48,734 |
| | $ | 51,883 |
|
| Single Premium QSR Program | 513,832 |
| | 522,318 |
| | 511,052 |
|
| Excess-of-Loss Program | 834,072 |
| | 455,440 |
| | — |
|
| Total PMIERs impact | $ | 1,386,131 |
| | $ | 1,026,492 |
| | $ | 562,935 |
|
| | | | | | |
| Percentage of gross Minimum Required Assets | 29.6 | % | | 22.8 | % | | 12.7 | % |
| | | | | | |
______________________
| |
| (1) | Excludes the impact of intercompany reinsurance. |
Net Investment Income. IncreasingHigher investment yields, from higher short-term rates andcombined with higher average investment balances, resulted in increases in net investment income for the three and nine months ended September 30, 2018,2019, compared to the same periods in 2017.2018. Our higher investment balances were primarily a result of investing our positive cash flow from operations. All periods include full allocation to the Mortgage Insurance segment of net investment income from investments held at Radian Group.
Part I. Item 2. Management’s Discussion and Analysis of Financial Condition and Results of Operations (continued)
Provision for Losses. The following table details the financial impact of the significant components of our provision for losses for the periods indicated:
| | | | Three Months Ended
September 30, | | Nine Months Ended
September 30, | Three Months Ended
September 30, | | Nine Months Ended
September 30, |
| (In millions) | 2018 | | 2017 | | 2018 | | 2017 | 2019 | | 2018 | | 2019 | | 2018 |
Current period defaults (1) | $ | 40.4 |
| | $ | 50.3 |
| | $ | 100.1 |
| | $ | 145.8 |
| $ | 42.0 |
| | $ | 40.4 |
| | $ | 107.9 |
| | $ | 100.1 |
|
Prior period defaults (2) | (20.4 | ) | | (14.0 | ) | | (24.1 | ) | | (45.4 | ) | (12.6 | ) | | (20.4 | ) | | (10.6 | ) | | (24.1 | ) |
| Second-lien mortgage loan premium deficiency reserve and other | 0.7 |
| | (0.3 | ) | | 1.5 |
| | 0.5 |
| (0.3 | ) | | 0.7 |
| | (0.2 | ) | | 1.5 |
|
| Provision for losses | $ | 20.7 |
| | $ | 36.0 |
| | $ | 77.5 |
| | $ | 100.9 |
| $ | 29.1 |
| | $ | 20.7 |
| | $ | 97.1 |
| | $ | 77.5 |
|
| | | | | | | | | | | | | | | |
Loss ratio (3) | 8.1 | % | | 15.2 | % | | 10.4 | % | | 14.7 | % | 10.5 | % | | 8.1 | % | | 11.6 | % | | 10.4 | % |
| | | | | | | | | | | | | | | |
______________________
| |
| (1) | Related to defaulted loans with a most recent default notice dated in the period indicated. For example, if a loan had defaulted in a prior period, but then subsequently cured and later re-defaulted in the current period, the default would be considered a current period default. |
| |
| (2) | Related to defaulted loans with a default notice dated in a period earlier than the period indicated, which have been continuously in default since that time. |
| |
| (3) | Provision for losses as a percentage of net premiums earned. See below and “—Net Premiums Written and Earned” for further discussion of the components of this ratio. |
Our mortgage insurance provision for losses for the three and nine months ended September 30, 2018 decreased2019 increased by $15.3$8.4 million and $23.4$19.6 million, respectively, as compared to the same periods in 2017.2018. Reserves established for new default notices were the primary driver of our total incurred losses for the three and nine months ended September 30, 20182019 and 2017.2018. Current period new primary defaults decreasedincreased by 4.4%9.6% and 2.8%11.3% for the three and nine months ended September 30, 2018,2019, respectively, compared to the same periods in 2017.2018. This increase primarily relates to new defaults on insurance written after 2008 and is consistent with typical default seasoning patterns for our recent NIW vintages. Our gross Default to Claim Rate assumption for new primary defaults was 7.5% at September 30, 2019, compared to 8.5% at September 30, 2018, compared to 10.5% as of September 30, 2017.2018. This reduction in the estimated gross Default to Claim Rate assumption, which was based on observed trends, contributed topartially mitigated the reductionincrease in the portion of our provision for losses related to the increased number of new defaults in the three and nine months ended September 30, 2018,2019, compared to the same periods in 2017.2018.
Our provision for losses for the three and nine month periods ended September 30, 2018 and 2017 was reduced by positive reserve development on prior period defaults, primarily due to reductions in certain Default to Claim Rate assumptions based on observed trends of higher Cures than were previously estimated on those prior period defaults. The positive development induring the three and nine months ended September 30, 20172019 was positively impacted by favorable reserve development on prior period defaults. This favorable development was primarily driven by a reduction during the period in certain Default to Claim Rate assumptions for prior year defaults compared to the assumptions used at December 31, 2018, partially offset by incrementalan increase in our IBNR reservesreserve estimate related to previously disclosed legal proceedings. See Note 12 of Notes to Unaudited Condensed Consolidated Financial Statements for additional information.
Part I. Item 2. Management'sManagement’s DiscussionandAnalysis of Financial Condition and Results of Operations (Cont'd)(continued)
$14.2 million to reflect the estimated payment for future losses, primarily on certain performing loans in our portfolio with insurance written in years prior to and including 2008 that were expected to be affected by an upcoming pool commutation.
As expected, Radian Guaranty experienced an increase in reported delinquencies in FEMA Designated Areas associated with Hurricanes Harvey and Irma during the third and fourth quarters of 2017, followed by cure rates for these delinquencies that are higher than the rates for the rest of our portfolio. We believe that these hurricane-related delinquencies reached their peak in 2017 and, based on current trends and past experience, expect that most of these defaults will cure by the end of 2018.
Although the number of incremental defaults associated with areas that have been impacted by recent natural disasters, including the hurricanes in 2017 and 2018, may become somewhat elevated, we do not expect these incremental defaults to result in a material increase in our incurred losses or paid claims, given the limitations on our coverage related to property damage and our past experience. However, the future reserve impact of these incremental defaults may differ from our expectations due to overall economic conditions, the pace of economic recovery in the affected areas or other factors. See Note 10 of Notes to Unaudited Condensed Consolidated Financial Statements.
Our primary default rate at September 30, 20182019 was 2.1%1.9% compared to 2.9%2.1% at December 31, 2017. Our primary defaulted inventory comprised 20,770 loans at September 30, 2018, compared to 27,922 loans at December 31, 2017, representing a decrease of 25.6%. The reduction in our primary defaulted inventory is the result of the total number of defaulted loans: (i) that have cured or (ii) for which claim payments have been made, collectively, exceeding the total number of new defaults on insured loans. The shift in our portfolio composition toward more recent vintages is expected to result in increasing levels of defaults from the post-2008 portfolio, consistent with typical default seasoning patterns. However, we expect that the reductions in defaults from our portfolio of insurance written prior to and including 2008 will generally outpace those increases in 2018. Therefore, we currently expect total new defaults for 2018 to continue to decrease throughout the year as compared to the comparable periods for the prior year.
The following table shows the number of primary loans that we have insured, the number of loans in default and the percentage of loans in default as of the dates indicated:
|
| | | | | | | | |
| | September 30,
2018 | | December 31,
2017 | | September 30,
2017 |
| Default Statistics—Primary Insurance: | | | | | |
| Total Primary Insurance | | | | | |
| Prime | | | | | |
| Number of insured loans | 969,994 |
| | 913,408 |
| | 897,253 |
|
| Number of loans in default | 14,916 |
| | 20,269 |
| | 15,953 |
|
| Percentage of loans in default | 1.54 | % | | 2.22 | % | | 1.78 | % |
| Alt-A and A minus and below | | | | | |
| Number of insured loans | 37,268 |
| | 42,318 |
| | 45,555 |
|
| Number of loans in default | 5,854 |
| | 7,653 |
| | 7,873 |
|
| Percentage of loans in default | 15.71 | % | | 18.08 | % | | 17.28 | % |
| Total Primary Insurance | | | | | |
| Number of insured loans | 1,007,262 |
| | 955,726 |
| | 942,808 |
|
Number of loans in default (1) | 20,770 |
| | 27,922 |
| | 23,826 |
|
| Percentage of loans in default | 2.06 | % | | 2.92 | % | | 2.53 | % |
| Default Statistics—Pool Insurance: | | | | | |
| Number of loans in default | 1,729 |
| | 2,117 |
| | 2,900 |
|
______________________
| |
(1) | Included in this amount at September 30, 2018 and December 31, 2017 are the defaults in the FEMA Designated Areas associated with Hurricanes Harvey and Irma, which occurred during the third quarter of 2017. At September 30, 2018, December 31, 2017 and September 30, 2017, defaults in these areas were 2,946; 7,051; and 2,934, respectively. |
Part I. Item 2. Management's DiscussionandAnalysis of Financial Condition and Results of Operations (Cont'd)
The following table shows a rollforward of our primary loans in default, including new defaults from our insurance written in years: (i) prior to and including 2008 and (ii) after 2008:
| | | | Three Months Ended
September 30, | | Nine Months Ended
September 30, | Three Months Ended
September 30, | | Nine Months Ended
September 30, |
| | 2018 | | 2017 | | 2018 | | 2017 | 2019 | | 2018 | | 2019 | | 2018 |
| Beginning default inventory | 22,088 |
| | 23,755 |
| | 27,922 |
| | 29,105 |
| 19,643 |
| | 22,088 |
| | 21,093 |
| | 27,922 |
|
Plus: New defaults on insurance written in years: (1) | | | | | | | | | | | | | | |
| Prior to and including 2008 | 4,922 |
| | 6,331 |
| | 14,630 |
| | 18,224 |
| 4,413 |
| | 4,922 |
| | 13,135 |
| | 14,630 |
|
| After 2008 | 4,713 |
| | 3,752 |
| | 12,433 |
| | 9,617 |
| 6,149 |
| | 4,713 |
| | 16,981 |
| | 12,433 |
|
| Total new defaults | 9,635 |
| | 10,083 |
| | 27,063 |
| | 27,841 |
| 10,562 |
| | 9,635 |
| | 30,116 |
| | 27,063 |
|
Less: Cures (1) | 9,633 |
| | 8,501 |
| | 30,739 |
| | 28,003 |
| |
Less: Claims paid (2) | 1,280 |
| | 1,465 |
| | 3,437 |
| | 5,051 |
| |
Less: Rescissions and Claim Denials, net of (Reinstatements) (3) | 40 |
| | 46 |
| | 39 |
| | 66 |
| |
| Less: Cures | | 9,215 |
| | 9,633 |
| | 28,886 |
| | 30,739 |
|
Less: Claims paid (1) | | 818 |
| | 1,280 |
| | 2,084 |
| | 3,437 |
|
Less: Rescissions and Claim Denials, net of (Reinstatements) (2) | | (12 | ) | | 40 |
| | 55 |
| | 39 |
|
| Ending default inventory | 20,770 |
| | 23,826 |
| | 20,770 |
| | 23,826 |
| 20,184 |
| | 20,770 |
| | 20,184 |
| | 20,770 |
|
| | | | | | | | | | | | | | | |
______________________
| |
| (1) | Amounts include the new defaults and Cures in the FEMA Designated Areas associated with Hurricanes Harvey and Irma, which occurred during the third quarter of 2017. Forthe three and nine months ended September 30, 2018 and 2017, new defaults and Cures in these areas were as follows:
|
|
| | | | | | | | | | | |
| | Three Months Ended
September 30, | | Nine Months Ended
September 30, |
| | 2018 | | 2017 | | 2018 | | 2017 |
| New defaults | 953 |
| | 1,219 |
| | 2,697 |
| | 2,958 |
|
| Cures | 1,982 |
| | 859 |
| | 6,434 |
| | 2,749 |
|
| |
(2) | Includes those charged to a deductible or captive reinsurance transactions, as well as commutations. |
| |
(3)(2) | Net of any previous Rescissions and Claim Denials that were reinstated during the period. Such reinstated Rescissions and Claim Denials may ultimately result in a paid claim. |
Our gross Default to Claim Rate estimates on defaulted loans are mainly developed based on the Stage of Default and Time in Default of the underlying defaulted loans, as measured by the progress toward a foreclosure sale and the number of months in default. Our gross Default to Claim Rate assumption for new primary defaults, was reduced from 10% at December 31, 2017, to 8.5% at September 30, 2018. As of September 30, 2018, our gross Default to Claim Rate assumptions on our primary portfolio ranged from 8.5% for new defaults, up to 68% for defaults not in foreclosure stage, and 75% for Foreclosure Stage Defaults.
Part I. Item 2. Management'sManagement’s DiscussionandAnalysis of Financial Condition and Results of Operations (Cont'd)(continued)
The following tables show additional information about our primary loans in default as of the dates indicated:
| | | | September 30, 2018 | September 30, 2019 |
| | Total | | Foreclosure Stage Defaulted Loans | | Cure % During the 3rd Quarter | | Reserve for Losses | | % of Reserve | Total | | Foreclosure Stage Defaulted Loans | | Cure % During the 3rd Quarter | | Reserve for Losses | | % of Reserve |
| ($ in thousands) | # | | % | | # | | % | | $ | | % | # | | % | | # | | % | | $ | | % |
| Missed payments: | | | | | | | | | | | | | | | | | | | | | | |
| Three payments or less | 9,270 |
| | 44.6 | % | | 130 |
| | 34.7 | % | | $ | 78,795 |
| | 21.2 | % | 10,010 |
| | 49.6 | % | | 127 |
| | 34.9 | % | | $ | 84,512 |
| | 25.5 | % |
| Four to eleven payments | 5,872 |
| | 28.3 |
| | 406 |
| | 31.7 |
| | 86,113 |
| | 23.2 |
| 5,790 |
| | 28.7 |
| | 427 |
| | 22.5 |
| | 88,901 |
| | 26.8 |
|
| Twelve payments or more | 5,020 |
| | 24.2 |
| | 1,515 |
| | 6.5 |
| | 173,977 |
| | 46.9 |
| 3,838 |
| | 19.0 |
| | 1,094 |
| | 6.7 |
| | 129,322 |
| | 38.9 |
|
| Pending claims | 608 |
| | 2.9 |
| | N/A |
| | 3.9 |
| | 32,270 |
| | 8.7 |
| 546 |
| | 2.7 |
| | N/A |
| | 5.2 |
| | 29,370 |
| | 8.8 |
|
| Total | 20,770 |
| | 100.0 | % | | 2,051 |
| | | | 371,155 |
| | 100.0 | % | 20,184 |
| | 100.0 | % | | 1,648 |
| | | | 332,105 |
| | 100.0 | % |
| IBNR and other | | | | | | | | | 14,505 |
| | | | | | | | | | | 42,117 |
| | |
| LAE | | | | | | | | | 11,203 |
| | | | | | | | | | | 9,000 |
| | |
| Total primary reserve | | | | | | | | | $ | 396,863 |
| | | | | | | | | | | $ | 383,222 |
| | |
| | | | | | | | | | | | | | | | | | | | | | | |
| | | September 30, 2018 | |
| September 30, 2019 | | September 30, 2019 |
Key Reserve Assumptions | | Gross Default to Claim Rate % | | Net Default to Claim Rate % | | Claim Severity % | | Net Default to Claim Rate % | | Claim Severity % |
| 36% | | 34% | | 97% | |
| 33% | | | 31% | | 98% |
| | | | December 31, 2017 | December 31, 2018 |
| | Total | | Foreclosure Stage Defaulted Loans | | Cure % During the 4th Quarter | | Reserve for Losses | | % of Reserve | Total | | Foreclosure Stage Defaulted Loans | | Cure % During the 4th Quarter | | Reserve for Losses | | % of Reserve |
| ($ in thousands) | # | | % | | # | | % | | $ | | % | # | | % | | # | | % | | $ | | % |
| Missed payments: | | | | | | | | | | | | | | | | | | | | | | |
| Three payments or less | 13,004 |
| | 46.6 | % | | 172 |
| | 31.7 | % | | $ | 89,412 |
| | 19.3 | % | 10,038 |
| | 47.6 | % | | 148 |
| | 33.2 | % | | $ | 83,540 |
| | 23.1 | % |
| Four to eleven payments | 7,528 |
| | 27.0 |
| | 426 |
| | 20.9 |
| | 99,759 |
| | 21.5 |
| 5,905 |
| | 28.0 |
| | 422 |
| | 24.7 |
| | 87,210 |
| | 24.1 |
|
| Twelve payments or more | 6,651 |
| | 23.8 |
| | 1,933 |
| | 6.3 |
| | 234,895 |
| | 50.6 |
| 4,468 |
| | 21.2 |
| | 1,365 |
| | 6.5 |
| | 156,808 |
| | 43.4 |
|
| Pending claims | 739 |
| | 2.6 |
| | N/A |
| | 3.1 |
| | 40,144 |
| | 8.6 |
| 682 |
| | 3.2 |
| | N/A |
| | 4.3 |
| | 34,130 |
| | 9.4 |
|
| Total | 27,922 |
| | 100.0 | % | | 2,531 |
| | | | 464,210 |
| | 100.0 | % | 21,093 |
| | 100.0 | % | | 1,935 |
| | | | 361,688 |
| | 100.0 | % |
| IBNR and other | | | | | | | | | 16,021 |
| | | | | | | | | | | 13,864 |
| | |
| LAE | | | | | | | | | 13,349 |
| | | | | | | | | | | 10,271 |
| | |
| Total primary reserve | | | | | | | | | $ | 493,580 |
| | | | | | | | | | | $ | 385,823 |
| | |
| | | | | | | | | | | | | | | | | | | | | | | |
| | | December 31, 2017 | |
| December 31, 2018 | | December 31, 2018 |
Key Reserve Assumptions | | Gross Default to Claim Rate % | | Net Default to Claim Rate % | | Claim Severity % | | Net Default to Claim Rate % | | Claim Severity % |
| 33% | | 31% | | 98% | |
| 35% | | | 33% | | 96% |
______________________
N/A – Not applicable
Our aggregate weighted average net Default to Claim Rate assumption for our primary loans used in estimating our reserve for losses, which is net of estimated Claim Denials and Rescissions, was 34%31% and 31%33% at September 30, 20182019 and December 31, 2017,2018, respectively. The increaseThis decrease was primarily due to the decrease in our gross Default to Claim Rate assumptions, as well as a shift in the firstmix of defaults during the nine months ended September 30, 2019, with a slightly lower proportion of 2018 primarily resulted from the decreasepending claims in the number of new primary defaults in FEMA Designated Areas associated with Hurricanes Harvey and Irma, subsequent to those two natural disasters and through February 2018, which had a lower Default to Claim Rate of 3%.our total inventory. Our net Default to Claim Rate and loss reserve estimate incorporate our expectations with respect to future Rescissions, Claim Denials and Claim
Part I. Item 2. Management'sManagement’s DiscussionandAnalysis of Financial Condition and Results of Operations (Cont'd)(continued)
DenialsCurtailments, inclusive of claim withdrawals, reduced our loss reserve as of September 30, 2019 and Claim Curtailments.December 31, 2018 by $29 million and $32 million, respectively. These expectations are based primarily on our recent experience with respect to the number of claims that have been denied due to the policyholder’s failure to submit sufficient documentation to perfect a claim within the time period permitted under our Master Policies, and also our recent experience with respect to the number of insurance certificates that have been rescinded due to fraud, underwriter negligence or other factors. See Note 11 of Notes to Consolidated Financial Statements in our 20172018 Form 10-K.
Our mortgage insurance total loss reserve as a percentage of our mortgage insurance total RIF was 0.7% at both September 30, 2018, compared to 1.0% at2019 and December 31, 2017.2018. See Note 10 of Notes to Unaudited Condensed Consolidated Financial Statements for information regarding our reserves for losses by category and a reconciliation of our Mortgage Insurance segment’s beginning and ending reserves for losses and LAE.
Our primary reserve per default (calculated as primary reserve excluding IBNR and other reserves divided by the number of primary defaults) was $18,409 and $17,103 at September 30, 2018 and December 31, 2017, respectively, with the recent increase caused by the decline in the number of defaults related to FEMA Designated Areas associated with Hurricanes Harvey and Irma, which have a lower reserve per default.
We considered the sensitivity of our loss reserve estimates at September 30, 20182019 by assessing the potential changes resulting from a parallel shift in Claim Severity and Default to Claim Rate for primary loans. For example, assuming all other factors remain constant, for every one percentage point absolute change in primary Claim Severity (which we estimated to be 97%98% of our risk exposure at September 30, 2018)2019), we estimated that our total loss reserve at September 30, 20182019 would change by approximately $4$3 million. Assuming the portfolio mix and all other factors remain constant, for every one percentage point absolute change in our primary net Default to Claim Rate, we estimated a $10an $11 million change in our primary loss reserve at September 30, 2018.2019.
In addition, as partTotal mortgage insurance claims paid of our claims review process, we assess whether defaulted loans were serviced appropriately in accordance with our insurance policies and servicing guidelines. To the extent a servicer has failed to satisfy its servicing obligations, our policies provide that we may curtail the claim payment for such default, and in some circumstances, cancel coverage or deny the claim. Claim Curtailments due to servicer noncompliance with our insurance policies and servicing guidelines, which impact the severity of our claim payments, were $1.0$36.7 million and $3.7$103.7 million for the three and nine months ended September 30, 2018,2019, respectively, compared to $1.4 million and $5.5 million for the same periods in 2017.
Total mortgage insurancedecreased from claims paid of $59.8 million for the three months ended September 30, 2018 decreased from claims paid of $131.5and $176.2 million for the three months ended September 30, 2017.same respective periods in 2018. The decrease in claims paid is consistent with the ongoing decline in the outstanding default inventory. In addition, claims paid for the three months ended September 30, 2017 included the payment of $54.8 million made in connection with the scheduled final settlement of the Freddie Mac Agreement in the third quarter of 2017. Although expected claims are included in our reserve for losses, the timing of claims paid is subject to fluctuation from quarter to quarter, based on the rate that defaults cure and other factors (as described in “Item 1. Business—Mortgage Insurance—Defaults and Claims” in our 20172018 Form 10-K) that make the timing of paid claims difficult to predict.
Part I. Item 2. Management's DiscussionandAnalysis of Financial Condition and Results of Operations (Cont'd)
The following table shows claims paid by product and average claim paid by product for the periods indicated:
|
| | | | | | | | | | | | | | | |
| | Three Months Ended
September 30, | | Nine Months Ended
September 30, |
| (In thousands) | 2018 | | 2017 | | 2018 | | 2017 |
Net claims paid: (1) | | | | | | | |
| Prime | $ | 29,709 |
| | $ | 47,541 |
| | $ | 97,787 |
| | $ | 145,147 |
|
| Alt-A and A minus and below | 16,105 |
| | 26,807 |
| | 54,677 |
| | 76,718 |
|
| Total primary claims paid | 45,814 |
| | 74,348 |
| | 152,464 |
| | 221,865 |
|
| Pool | 1,072 |
| | 2,148 |
| | 3,178 |
| | 8,229 |
|
| Other | 169 |
| | 32 |
| | 474 |
| | (1,827 | ) |
| Subtotal | 47,055 |
| | 76,528 |
| | 156,116 |
| | 228,267 |
|
| Impact of captive terminations | — |
| | — |
| | (36 | ) | | 645 |
|
Impact of commutations (2) | 12,712 |
| | 54,956 |
| | 20,147 |
| | 75,955 |
|
| Total net claims paid | $ | 59,767 |
| | $ | 131,484 |
| | $ | 176,227 |
| | $ | 304,867 |
|
| | | | | | | | |
Average net claim paid: (1) (3) | | | | | | | |
| Prime | $ | 50.9 |
| | $ | 48.4 |
| | $ | 50.3 |
| | $ | 49.0 |
|
| Alt-A and A minus and below | 59.4 |
| | 56.3 |
| | 62.7 |
| | 53.6 |
|
| Total average net primary claim paid | 53.6 |
| | 51.0 |
| | 54.1 |
| | 50.5 |
|
| | | | | | | | |
Average direct primary claim paid (3) (4) | $ | 54.2 |
| | $ | 51.4 |
| | $ | 54.7 |
| | $ | 50.8 |
|
|
| | | | | | | | | | | | | | | |
| | Three Months Ended
September 30, | | Nine Months Ended
September 30, |
| (In thousands) | 2019 | | 2018 | | 2019 | | 2018 |
Net claims paid: (1) | | | | | | | |
| Total primary claims paid | $ | 28,981 |
| | $ | 45,814 |
| | $ | 94,281 |
| | $ | 152,464 |
|
| Total pool and other | 901 |
| | 1,241 |
| | 2,603 |
| | 3,652 |
|
| Subtotal | 29,882 |
| | 47,055 |
| | 96,884 |
| | 156,116 |
|
Impact of commutations (2) | 6,812 |
| | 12,712 |
| | 6,827 |
| | 20,111 |
|
| Total net claims paid | $ | 36,694 |
| | $ | 59,767 |
| | $ | 103,711 |
| | $ | 176,227 |
|
| | | | | | | | |
Total average net primary claim paid (1) (3) | $ | 47.0 |
| | $ | 53.6 |
| | $ | 48.6 |
| | $ | 54.1 |
|
| | | | | | | | |
Average direct primary claim paid (3) (4) | $ | 48.1 |
| | $ | 54.2 |
| | $ | 49.5 |
| | $ | 54.7 |
|
______________________
| |
| (1) | Net of reinsurance recoveries. |
| |
| (2) | ForIncludes payments to commute mortgage insurance coverage on certain performing and non-performing loans and the three months ended September 30, 2017, primarily includes payments made under the Freddie Mac Agreement, as the final settlement date was reached during the quarter.impact of captive terminations. |
| |
| (3) | Calculated without giving effect to the impact of the termination of captive transactions and commutations. |
| |
| (4) | Before reinsurance recoveries. |
Other Operating Expenses. Other operating expenses for the three and nine months ended September 30, 2018,2019 increased as compared to the same periods in 2017, reflect an increase2018, primarily resulting from an increase indue to higher allocated corporate operating expenses. TheThis increase in allocated corporate operating expenses is primarily due to (i) higher compensation expense, including variable and incentive-based compensation and (ii) an increase infor the proportion of corporate expenses allocated to the Mortgage Insurance segment. These increases werenine months ended September 30, 2019, was partially offset by lower expenses accrued in 2018 to defend and resolve certain outstanding legal matters and lower expenses in 2018 as compared to 2017 associated with retirement and consulting agreements entered into in February 2017 with our former Chief Executive Officer. Partially offsetting the increase in allocated corporate operating expenses was an increase in ceding commissions, primarily due to the 2018resulting from a change in estimate affecting policies covered under our Single Premium QSR Agreement andProgram. See Note 3 of Notes to Unaudited Condensed Consolidated Financial Statements for further discussion about the increased cession percentage on the 2016change in estimate for Single Premium QSR Agreement. See “Results of Operations—Consolidated—Other Operating Expenses.”Policies.
Our expense ratio on a net premiums earned basis represents our mortgage insuranceMortgage Insurance segment’s operating expenses (which include policy acquisition costs and other operating expenses, as well as allocated corporate operating expenses),
Part I. Item 2. Management’s Discussion and Analysis of Financial Condition and Results of Operations (continued)
expressed as a percentage of net premiums earned. Our expense ratio was 22.9%23.1% and 23.5%22.2% for the three and nine months ended September 30, 2018,2019, respectively, compared to 22.9% and 25.4%23.5% for the same respective periods in 20172018. The increase in net premiums earned during 2018 was the primary driver of the change in the expense ratios between these periods.
Part I. Item 2. Management's DiscussionandAnalysis of Financial Condition and Results of Operations (Cont'd)
Results of Operations—Services
Three and Nine Months Ended September 30, 20182019 Compared to Three and Nine Months Ended September 30, 20172018
The following table summarizes our Services segment’s results of operations for the three and nine months ended September 30, 20182019 and 2017:2018:
| | | | | | | | $ Change | | | | | | $ Change | | | | | $ Change | | | | | | $ Change |
| | Three Months Ended
September 30, | | Favorable (Unfavorable) | | Nine Months Ended
September 30, | | Favorable (Unfavorable) | Three Months Ended
September 30, | | Favorable (Unfavorable) | | Nine Months Ended
September 30, | | Favorable (Unfavorable) |
| (In millions) | 2018 | | 2017 | | 2018 vs. 2017 | | 2018 | | 2017 | | 2018 vs. 2017 | 2019 | | 2018 | | 2019 vs. 2018 | | 2019 | | 2018 | | 2019 vs. 2018 |
Adjusted pretax operating income (loss) (1) | $ | (7.9 | ) | | $ | (12.9 | ) | | $ | 5.0 |
| | $ | (22.0 | ) | | $ | (28.9 | ) | | $ | 6.9 |
| |
Adjusted pretax operating income (loss) (1) (2) | | $ | (1.5 | ) | | $ | (7.9 | ) | | $ | 6.4 |
| | $ | (11.1 | ) | | $ | (22.0 | ) | | $ | 10.9 |
|
| Net premiums earned—insurance | 2.9 |
| | — |
| | 2.9 |
| | 5.3 |
| | — |
| | 5.3 |
| 3.6 |
| | 2.9 |
| | 0.7 |
| | 8.2 |
| | 5.3 |
| | 2.9 |
|
| Services revenue | 37.3 |
| | 41.0 |
| | (3.7 | ) | | 109.2 |
| | 121.1 |
| | (11.9 | ) | 43.6 |
| | 37.3 |
| | 6.3 |
| | 117.7 |
| | 109.2 |
| | 8.5 |
|
| Cost of services | 26.0 |
| | 27.5 |
| | 1.5 |
| | 73.6 |
| | 82.2 |
| | 8.6 |
| 29.2 |
| | 26.0 |
| | (3.2 | ) | | 81.7 |
| | 73.6 |
| | (8.1 | ) |
| Gross profit on services | 11.3 |
| | 13.5 |
| | (2.2 | ) | | 35.6 |
| | 38.9 |
| | (3.3 | ) | |
Other operating expenses (2) | 17.7 |
| | 16.5 |
| | (1.2 | ) | | 48.3 |
| | 49.0 |
| | 0.7 |
| 19.5 |
| | 17.7 |
| | (1.8 | ) | | 55.3 |
| | 48.3 |
| | (7.0 | ) |
Restructuring and other exit costs (3) | 0.4 |
| | 5.4 |
| | 5.0 |
| | 2.0 |
| | 5.4 |
| | 3.4 |
| |
| | | | | | | | | | | | | |
| Interest expense | | — |
| | 4.5 |
| | 4.5 |
| | — |
| | 13.4 |
| | 13.4 |
|
______________________
| |
| (1) | Our senior management uses adjusted pretax operating income (loss) as our primary measure to evaluate the fundamental financial performance of each of the Company’s business segments. See Note 3 of Notes to Unaudited Condensed Consolidated Financial Statements. |
| |
| (2) | Includes allocation of corporate operating expenses of $4.3 million and $12.5 million for the three and nine months ended September 30, 2019, respectively, and $2.9 million and $8.7 million for the three-three and nine-month periodsnine months ended September 30, 2018, respectively, and $3.7 million and $10.9 million for the three- and nine-month periods ended September 30, 2017, respectively. |
| |
(3) | Primarily includes facility and lease termination costs. Does not include impairment of long-lived assets and loss from the sale of a business line, which are not considered components of adjusted pretax operating income. |
Our Services segment is primarily a fee-for-service business that offers a broad array of services to market participants across the mortgage and real estate value chain, primarily through Clayton, Green River Capital, Red Bell, ValuAmerica and EnTitle Direct (which was acquired in March 2018). See “Overview—Other 2018 Developments—Services Acquisition.” These services comprise mortgage services, real estate services and title services, including technology-based and turn-key solutions, that provide information and other resources and services used to originate, evaluate, acquire, securitize, service and monitor residential real estate and loans secured by residential real estate. We provide these services to, among others, mortgage lenders, financial institutions, mortgage and real estate investors and government entities.
Adjusted Pretax Operating Income (Loss). Our Services segment’s adjusted pretax operating lossesloss for the three and nine months ended September 30, 2018 were $7.92019 was $1.5 million and $22.0$11.1 million, respectively, compared to adjusted pretax operating lossesloss of $12.9$7.9 million and $28.9$22.0 million respectively, for the same respective periods in 2017.2018. The decrease in our adjusted pretax operating loss for the three and nine months ended September 30, 2018,2019, as compared to the same periodperiods in 2017,2018, was driven by: (i) a decrease in compensation-related costs, primarily as a result of our restructuring activities in 2017 and (ii) a decrease in restructuring and other exit costs. These decreases were partially offset by the inclusion of the operating results of EnTitle Direct (acquired in March 2018). The decrease in our adjusted pretax operating loss for the nine months ended September 30, 2018, as compared to the same period in 2017, was primarily driven by a decrease in restructuring and other exit costs and a decreaseinterest expense, as discussed below, partially offset by an increase in other operating expenses.
Net premiums earned—insurance.Premiums Earned—Insurance. Net premiums earned for the three and nine months ended September 30, 20182019 increased compared to the same periods in 2017,2018, as a result of the March 2018 acquisition of EnTitle Directthe title insurance business in March 2018 and the inclusion of its operations.
Services Revenue. Services revenue decreasedincreased for the three and nine months ended September 30, 2018,2019, as compared to the same periods in 2017,2018, primarily due to a declinethe inclusion of revenue from businesses acquired in title services transaction volumes related primarily to lower volume from a large contract completed during 2018 partially offset by an increase in real estate services. This decrease in services revenue is generally in line with our expectations following our announced restructuringsince their respective dates of our Services segment in late 2017, through which we are repositioning the segment for sustained profitability by focusing on the core products and services that we believeacquisition.
Part I. Item 2. Management's DiscussionandAnalysis of Financial Condition and Results of Operations (Cont'd)
have higher growth potential, produce more predictable and recurring fee-based revenues, and better align with our customer needs.
For the three and nine months ended September 30, 2018, the top 10 Services customers (which includes our affiliates) generated 41% and 40%, respectively, of the Services segment’s revenues, as compared to 48% and 49%, respectively, for the same periods in 2017. Approximately 2% of the Services segment’s revenue for both the three and nine months ended September 30, 2018 related to sales to our affiliates, and has been eliminated in our consolidated results for all periods presented. The largest single customer generated approximately 11% of the Services segment’s revenue for both the three and nine months ended September 30, 2018, compared to 13% and 12%, respectively, for the same periods in 2017.
Cost of Services. Our cost of services is primarily affected by our level of services revenue. Our cost of services primarily consists of employee compensation and related payroll benefits, including the cost of billable labor assigned to revenue-generating activities and, to a lesser extent, other costs of providing services such as travel and related expenses incurred in providing client services and costs paid to outside vendors, data acquisition costs and other compensation-related expenses to maintain software application platforms that directly support our businesses. The level of these costs may also fluctuate if market rates of compensation change, or if there is decreased availability or a loss of qualified employees.
Other Operating Expenses. Other operating expenses primarily consist of compensation costs not classified as cost of services because they are related to employees, such as sales and corporate employees, who are not directly involved in providing client services. Compensation-related costs for the three and nine months ended September 30, 2018 represented 53% and 50%, respectively, of the segment’s other operating expenses, compared to 48% and 51%, respectively, for the same periods in 2017. Other operating expenses for the three and nine months ended September 30, 20182019 were impacted by the acquisition of EnTitle Directbusinesses acquired in March 2018 and the resulting inclusion of its other operating expenses for these businesses from the datetheir respective dates of acquisition. The inclusion of EnTitle is the primary driver of the increase in compensation-related costs for the three months ended September 30, 2018, compared to the same period in 2017. The restructuring actions taken in 2017 were the primary drivers of the decrease in compensation-related costs for the nine months ended September 30, 2018, compared to the same period in 2017. Other operating expenses also include other selling, general and administrative expenses, depreciation, and allocations of corporate general and administrative expenses. Other operating expenses for the three and nine months ended September 30, 2018 include allocations of corporate operating expenses of $2.9 million and $8.7 million, respectively, compared to $3.7 million and $10.9 million, respectively, for the same periods in 2017. This decrease is primarily due to: (i) a decrease in the proportion of corporate expenses allocated to the Services segment and (ii) a decrease in corporate expenses related to expenses associated with retirement and consulting agreements incurred in the three months ended March 31, 2017, partially offset by higher compensation expense, including variable and incentive-based compensation. See “Results of Operations—Consolidated—Three and Nine Months Ended September 30, 2019 Compared to Three and Nine Months Ended September 30, 2018—Other Operating Expenses.”
Restructuring and other exit costs.Interest Expense. ForEffective January 1, 2019, the three and nine months ended September 30, 2018, restructuring and other exit costs include charges associated with our plan to restructureClayton Intercompany Note was repaid using proceeds from an additional capital contribution from Radian Group. As a result of the intercompany note repayment, the Services business. See Note 1segment no longer incurs interest expense on the intercompany note.
Part I. Item 2. Management’s Discussion and Analysis of Financial Statements for more information.Condition and Results of Operations (continued)
Off-Balance Sheet Arrangements
There have been no material changes in off-balance sheet arrangements from those specified in our 20172018 Form 10-K, other than as described below.below:
Segregated Funds Held for OthersVariable Interest Entity
Through EnTitle Insurance, we maintain escrow deposits asIn April 2019, Radian Guaranty entered into a service to our customers. Amounts heldfully collateralized reinsurance agreement with Eagle Re 2019-1, an unaffiliated special purpose reinsurer domiciled in escrow and excluded from assets and liabilitiesBermuda. Eagle Re 2019-1 is a special purpose VIE that is not consolidated in our consolidated balance sheets totaled $6.1 million as of September 30, 2018. These amounts were held at third-party financial institutionsstatements because we do not have the unilateral power to direct those activities that are significant to its economic performance. For additional information about Eagle Re 2019-1 and not considered assets of the Company. Should one or more of the financial institutions at which escrow deposits are maintained fail, there is no guarantee that we would recover the funds deposited, whether through Federal Deposit Insurance Corporation coverage or otherwise. In the event of any such failure, we could be held liable for the disposition of these funds owned by third parties.our other reinsurance arrangements, see Note 7 in Notes to Unaudited Condensed Consolidated Financial Statements.
Contractual Obligations and Commitments
There have been no material changes outside of the ordinary course of business in our contractual obligations and commitments from those specified in our 20172018 Form 10-K.
Liquidity and Capital Resources
Consolidated Cash Flows
The following table summarizes our consolidated cash flows from operating, investing and financing activities:
|
| | | | | | | |
| (In thousands) | Nine Months Ended
September 30, |
| 2019 | | 2018 |
| Net cash provided by (used in): | | | |
| Operating activities | $ | 506,805 |
| | $ | 491,929 |
|
| Investing activities | (162,903 | ) | | (506,400 | ) |
| Financing activities | (398,654 | ) | | 32,565 |
|
| Effect of exchange rate changes on cash and restricted cash | (4 | ) | | — |
|
| Increase (decrease) in cash and restricted cash | $ | (54,756 | ) | | $ | 18,094 |
|
| | | | |
Operating Activities. Our most significant source of operating cash flows is generally from premiums received from our mortgage insurance policies, while our most significant uses of operating cash flows are generally for claims paid on our mortgage insurance policies and our operating expenses. Net cash provided by operating activities totaled $506.8 million for the nine months ended September 30, 2019, an increase compared to $491.9 million for the same period in 2018. This increase was principally the result of: (i) a reduction in claims paid in 2019, partially offset by; (ii) ceded premiums paid under the Excess-of-Loss Program in 2019; and (iii) an increase in net cash paid to the IRS, including our purchase of U.S. Mortgage Guaranty Tax and Loss Bonds in 2019.
Investing Activities. Net cash used in investing activities decreased in the nine months ended September 30, 2019, compared to the same period in 2018, primarily as a result of: (i) a decrease in net purchases of short-term investments; (ii) an increase in proceeds from sales, net of purchases, of fixed-maturity investments available for sale; and (iii) an increase in proceeds from sales of trading securities. These changes were partially offset by a decrease in proceeds from sales, net of purchases, of equity securities.
Financing Activities. Net cash used in financing activities increased for the nine months ended September 30, 2019, compared to net cash provided by financing activities during the same period in 2018. For the nine months ended September 30, 2019, our primary financing activities included: (i) an increase in repurchases of our common shares and (ii) repayments and repurchases of senior notes exceeding related issuances. See Notes 11 and13 of Notes to Unaudited Condensed Consolidated Financial Statements for additional information regarding our debt transactions and share repurchases.
See “Item 1. Financial Statements (Unaudited)—Condensed Consolidated Statements of Cash Flows (Unaudited)” for additional information.
Part I. Item 2. Management'sManagement’s DiscussionandAnalysis of Financial Condition and Results of Operations (Cont'd)(continued)
Liquidity and Capital ResourcesAnalysis—Holding Company
Radian Group—Short-Term Liquidity Needs
Radian Group serves as the holding company for our insurance and other subsidiaries and does not have any operations of its own. At September 30, 2018,2019, Radian Group had available, either directly or through an unregulated subsidiary, unrestricted cash and liquid investments of $246$730.7 million. This amount: (i) excludes $31 million expected to be submitted to the IRS in connection with the settlement of the IRS Matter; (ii) includes the remaining $58 million of qualified deposits with the IRS related to the IRS Matter; and (iii)Available liquidity at September 30, 2019 excludes certain additional cash and liquid investments that have been advanced to Radian Group from our subsidiaries forto pay their allocated share of corporate expenses and interest payments. Total liquidity as ofIn addition, this amount does not take into consideration transactions subsequent to September 30, 2018 was $4712019, including: (i) $25.0 million in repurchases of Radian Group common stock, excluding commissions, pursuant to the current share repurchase authorization discussed below; (ii) $20.0 million in distributions paid to Radian Group from subsidiaries; and includes our undrawn $225(iii) a $65.0 million capital contribution paid from Radian Group to its subsidiary Radian Reinsurance to support participation in credit risk transfer transactions.
In addition to available cash and marketable securities, Radian Group’s principal sources of cash to fund future liquidity needs include payments made to Radian Group under expense- and tax-sharing arrangements with its subsidiaries. Radian Group also has in place a $267.5 million unsecured revolving credit facility with a syndicate of bank lenders. At September 30, 2019, the full $267.5 million remains undrawn and available under the facility. See Note 13 of Notes to Consolidated Financial Statements in our 2018 Form 10-K for additional information on the unsecured revolving credit facility.
Radian Group’s principal liquidity demands for the next 12 months are: (i) potential investments to support our business strategy, including contributions to our subsidiaries; (ii) the payment of corporate expenses, including taxes; (iii) interest payments on our outstanding debt obligations; (iv) the payment of dividends on our common stock; and (v) the repurchases of Radian Group common stock pursuant to the share repurchase authorization, as described below.
In addition to our short-term liquidity needs discussed above, our most significant needs for liquidity beyond the next 12 months are potential additional capital contributions to our subsidiaries and the repayment of that time.$900 million aggregate principal amount of debt due in future years. See “—“Sources of Liquidity—Capitalization—Holding Company” below. Radian Group’s liquidity demands for the next 12 months or in future periods could also include: (i) repayments, repurchases or early redemptions of portions of our debt obligations and (ii) potential investments to support our business strategy. Subject to certain limitations, borrowings under the credit facility may be used for working capital and general corporate purposes, including, without limitation, capital contributions to Radian Group’s insurance and reinsurance subsidiaries as well as growth initiatives. See Note 1211 of Notes to Unaudited Condensed Consolidated Financial Statements for additional details.
On August 9, 2017,If Radian Group’s current sources of liquidity are insufficient for Radian Group to fund its obligations, or if we otherwise decide to increase our liquidity position, Radian Group may seek additional capital, including by incurring additional debt, issuing additional equity, or selling assets, which we may not be able to do on favorable terms, if at all.
Share Repurchases. During the nine months ended September 30, 2019, the Company repurchased 12,363,360 shares of Radian Group common stock under programs authorized by Radian Group’s board of directors, authorized the Company to repurchase up to $50at a total cost of $275.2 million, of its common stock. The Company completed this program during the first half of 2018 by purchasing 3,022,856 shares, at an average price of $16.56 per share, including commissions.
On August 16, 2018, Radian Group’s board of directors approved a new share repurchase program that authorizes the Company to repurchase up to $100 million of its common stock in the open market or in privately negotiated transactions, based on market and business conditions, stock price and other factors. Radian plans to utilize a Rule 10b5-1 plan, which would permit the Company to purchase shares, at pre-determined price targets, when it may otherwise be precluded from doing so. As of September 30, 2018, the full purchase authority of up to $100 million remained available under this program, which expires on July 31, 2019. See Note 1413 of Notes to Unaudited Condensed Consolidated Financial Statements for additional details on our share repurchase programs.
DuringDividends. Our quarterly common stock dividend currently is $0.0025 per share and, based on our current outstanding shares of common stock, we would require approximately $2.0 million in the first nine months of 2018, available holding company liquidity increased by payments madeaggregate to Radian Group under tax-sharing arrangements with its subsidiaries. During the same period, available holding company liquidity was reduced by the completion of the Company’s share repurchase program described above, the impact of finalizing the settlement of the IRS Matter, the acquisition of EnTitle Direct and subsequent capital contributions of $23.0 million to EnTitle Direct. See “Overview—Other 2018 Developments” for additional information on EnTitle Direct.
Radian Group’s principal liquidity demandspay our quarterly dividends for the next 12 months are: (i) the payment of corporate expenses, including taxes; (ii) the payment of $159 million principal amount of our outstanding Senior Notes duemonths. Radian Group is not subject to any limitations on its ability to pay dividends except those generally applicable to corporations that are incorporated in June 2019; (iii) interest payments on our outstanding debt obligations; and (iv) the payment of dividends on our common stock. Radian Group’s liquidity demands for the next 12 months or in future periods could also include: (i) capital support for Radian Guaranty and our other insurance subsidiaries; (ii) repayments, repurchases or early redemptions of portions of our debt and (iii) potential investments to support our business strategy.Delaware.
Corporate Expenses and Interest Expense. Radian Group has expense-sharing arrangements in place with its principal operating subsidiaries that require those subsidiaries to pay their allocated share of certain holding company expenses, including interest payments on most of Radian Group’s outstanding debt obligations. Payments of these corporate expenses for the next 12 months, excluding interest payments on Radian Group’s debt, are expected to be approximately $80$90 million to $85$100 million. For the same period, payments of interest on Radian Group’s debt obligations are expected to be approximately $55$47 million. We expect mostnearly all of theseour holding company expenses to be reimbursed by our subsidiaries under our expense-sharing arrangements. See “—Radian Group—Long-Term Liquidity Needs—Services.” The expense-sharing arrangements between Radian Group and our insurance subsidiaries, as amended, have been approved by the applicable insurance departments, but such approval may be modified or revoked at any time.
Capital Support for Subsidiaries. Private mortgage insurers, including Radian Guaranty, are required to comply with the PMIERs to remain approved insurers of loans purchased by the GSEs. Radian Guaranty currently is an approved mortgage insurer under the PMIERs, and is in compliance with the PMIERs financial requirements. At September 30, 2018, Radian Guaranty’s Available Assets under the PMIERs totaled approximately $3.8 billion, resulting in an excess or “cushion” of approximately $530 million, or 16%, over its Minimum Required Assets of approximately $3.3 billion. See Note 16 of Notes to Unaudited Condensed Consolidated Financial Statements for additional details regarding the capital requirements of our subsidiaries.
The PMIERs require Radian to maintain significantly more Minimum Required Assets for delinquent loans than for performing loans. Therefore, the increase in new primary defaults received during the third and fourth quarters of 2017 from
Part I. Item 2. Management'sManagement’s DiscussionandAnalysis of Financial Condition and Results of Operations (Cont'd)(continued)
areas affected by Hurricanes Harvey and Irma required usCapitalization—Holding Company
The following table presents our holding company capital structure:
|
| | | | | | | |
| (In thousands) | September 30,
2019 | | December 31,
2018 |
| Debt: | | | |
| 5.500% Senior Notes due 2019 | $ | — |
| | $ | 158,623 |
|
| 5.250% Senior Notes due 2020 | — |
| | 234,126 |
|
| 7.000% Senior Notes due 2021 | — |
| | 197,661 |
|
| 4.500% Senior Notes due 2024 | 450,000 |
| | 450,000 |
|
| 4.875% Senior Notes due 2027 | 450,000 |
| | — |
|
| Deferred debt costs on senior notes | (13,357 | ) | | (10,062 | ) |
| Revolving credit facility | — |
| | — |
|
| Total | 886,643 |
| | 1,030,348 |
|
| | | | |
| Stockholders’ equity | 3,922,507 |
| | 3,488,715 |
|
| | | | |
| Total capitalization | $ | 4,809,150 |
| | $ | 4,519,063 |
|
| | | | |
| Debt-to-capital ratio | 18.4 | % | | 22.8 | % |
Radian’s holding company debt-to-capital ratio decreased to maintain an elevated level of Minimum Required Assets18.4% at September 30, 2019 from 22.8% at December 31, 2017 and for2018. During the first two quarters of 2018, compared to levels prior to these hurricanes. As ofnine months ended September 30, 2018,2019, we reduced our total debt outstanding and improved our debt maturity profile by completing the impactfollowing transactions:
repayment at maturity of these hurricanes on our level$158.6 million aggregate principal amount of our Minimum Required Assets has substantially decreased, consistent with our expectationSenior Notes due 2019;
the issuance of $450 million aggregate principal amount of Senior Notes due 2027; and
tender offers and the subsequent redemptions that mosttogether resulted in the repayment of the hurricane-related defaults would cure during 2018. Our Minimum Required Asset levels may be subject to volatility in the near term from Hurricanes Florence and Michael, which occurred in September and Octoberremaining aggregate principal amounts of 2018, respectively, or from other natural disasters. However, we do not expect the incremental defaults from Hurricanes Florence and Michael to result in a material number of paid claims. See Note 10 of Notes to Unaudited Condensed Consolidated Financial Statements. After the March 31, 2019 effective date of PMIERs 2.0, subject to certain requirements, defaulted loans in FEMA-declared major disaster areas will require a reduced level of Minimum Required Assets, which we expect to help reduce the future volatility of our Minimum Required Asset levels upon the occurrence of a major disaster.
______________________
| |
(1) | Represents Radian Group’s Liquidity, net of the $35 million minimum liquidity requirement under the unsecured revolving credit facility. |
| |
(2) | The amendment to the 2016 Single Premium QSR Agreement which became effective as of December 31, 2017, and the $100 million of cash and marketable securities that Radian Group transferred to Radian Guaranty in December 2017 in exchange for a Surplus Note both had the effect of increasing the amount of Radian Guaranty’s cushion under the PMIERs financial requirements at December 31, 2017. These increases were partially offset by an elevated level of Minimum Required Assets at December 31, 2017, due to the increase in reported delinquencies from hurricane-affected areas, which is expected to be temporary, as discussed above. |
| |
(3) | Represents Radian Guaranty’s excess of Available Assets over its Minimum Required Assets, calculated in accordance with the PMIERs financial requirements. |
| |
(4) | Percentages represent the values shown as a percentage of Minimum Required Assets under the PMIERs. |
The GSEs may amend the PMIERs at any time, although the GSEs have communicated that for certain changes, including changes affecting Minimum Required Assets, they will generally provide written notice 180 days prior to the effective date. The GSEs also have broad discretion to interpret the PMIERs requirements, which could impact the calculation of Radian Guaranty’s Available Assets and/or Minimum Required Assets. On September 27, 2018, the GSEs issued PMIERs 2.0, which will become effective on March 31, 2019. Radian expects that it will be able to fully comply with PMIERs 2.0 and maintain an excess of Available Assets over Minimum Required Assets as of the effective date. If applied as of September 30, 2018, these changes would not have resulted in a material change in Radian’s Minimum Required Assets, but would have reduced Radian’s
Part I. Item 2. Management's DiscussionandAnalysis of Financial Condition and Results of Operations (Cont'd)
Available Assets by approximately $200 million, primarily due to the elimination in PMIERS 2.0 of any credit for future premiums that is currently allowed for insurance policies written prior to and including 2008. We expect this impact to be substantially offset by an increase in our Available Assets prior to the effective date of March 31, 2019, based on our projections for positive operating results. Our expectation is based on our strong capital position, our current NIW forecast and the benefits of our existing reinsurance programs, and is not dependent on any impact from the reduction of Minimum Required Assets from our expected purchase of reinsurance through a mortgage insurance-linked note transaction that is expected to close during November 2018, or any other future capital or reinsurance actions. See Note 1 of Notes to Unaudited Condensed Consolidated Financial Statements for additional information about the PMIERs and see “Overview—Other 2018 Developments—Reinsurance,” for information about our expected November 2018 transactions. If our projections turn out to be inaccurate, our holding company liquidity of $246$234.1 million and the $225 million unsecured revolving credit facility (both as of September 30, 2018) could be utilized to enhance Radian Guaranty’s PMIERs cushion, as necessary, subject to a $35 million minimum liquidity requirement under our unsecured revolving credit facility. In October 2018, Radian increased the amount of total commitments under its unsecured revolving credit facility by $42.5 million, bringing the aggregate unsecured revolving credit facility from $225 million to $267.5 million. See Note 12 of Notes to Unaudited Condensed Consolidated Financial Statements for additional information on the unsecured revolving credit facility.
Radian Guaranty’s Risk-to-capital as of September 30, 2018 was 12.4 to 1. See Note 16 of Notes to Unaudited Condensed Consolidated Financial Statements for more information. Our combined Risk-to-capital, which represents the consolidated Risk-to-capital measure for all of our Mortgage Insurance subsidiaries, was 11.7 to 1 as of September 30, 2018. Radian Guaranty is not expected to need additional capital to satisfy state insurance regulatory requirements in their current form.
The NAIC is in the process of reviewing the minimum capital and surplus requirements for mortgage insurers and has been considering changes to the Model Act. In May 2016, a working group of state regulators released an exposure draft of a risk-based capital framework to establish capital requirements for mortgage insurers. While the timing and outcome of this process is not known, in the event the NAIC adopts changes to the Model Act, we expect that the capital requirements in states that adopt the new Model Act may increase as a result of the changes. However, we continue to believe the changes to the Model Act will not result in financial requirements that require greater capital than the level currently required under the PMIERs financial requirements.
Title insurance companies, including EnTitle Insurance, are subject to comprehensive state regulations, including minimum net worth requirements. EnTitle Insurance and its subsidiaries were in compliance with their respective minimum net worth requirements at September 30, 2018. In the event the cash flow from operations of the Services segment is not adequate to fund all of its needs, including the regulatory capital needs of EnTitle, Radian Group may provide additional funds to the Services segment in the form of an intercompany note, subject to the approval of the applicable state’s department of insurance, or a capital contribution. See also “—Services,” below. Additional capital support may also be required for potential investments in new business initiatives to support our strategy of growing our businesses.
Dividends. Our quarterly common stock dividend currently is $0.0025 per share and, based on our current outstanding shares of common stock, we would require approximately $2.1 million in the aggregate to pay our quarterly dividends for the next 12 months. Radian Group is not subject to any limitations on its ability to pay dividends except those generally applicable to corporations that are incorporated in Delaware. Delaware corporation law provides that dividends are only payable out of a corporation’s capital surplus or (subject to certain limitations) recent net profits. As of September 30, 2018, our capital surplus was $3.3 billion, representing our dividend limitation under Delaware law.
IRS Matter. In July 2018, Radian finalized a settlement with the IRS which resolved the issues and concluded all disputes related to the IRS Matter. Under the terms of the settlement, we will submit to the IRS approximately $31$197.7 million of our $89Senior Notes due 2020 and 2021, respectively.
Stockholders’ equity increased by $433.8 million “qualified deposits” with the U.S. Treasury, and the remaining balance will be returnedfrom December 31, 2018 to us. We have excluded the expected $31 million payment from Radian Group’s available liquidity of $246 million at September 30, 2018. Radian Group will not be reimbursed for any portion2019. The net increase in stockholders’ equity resulted primarily from: (i) our net income of this potential settlement under the tax-sharing arrangements with its subsidiaries. See Note 9 of Notes to Unaudited Condensed Consolidated Financial Statements and “Overview—Other 2018 Developments” for additional information.
Sources of Liquidity. In addition to available cash and marketable securities, Radian Group’s principal sources of cash to fund future short-term liquidity needs include payments made to Radian Group under expense- and tax-sharing arrangements with its subsidiaries. See also “—Services.” Pursuant to our tax-sharing agreements, our operating subsidiaries pay Radian Group an amount equal to any federal income tax the subsidiary would have paid on a standalone basis if they were not part of our consolidated tax return. As a result, from time to time, under the provisions of our tax-sharing agreements, Radian Group may receive cash from its operating subsidiaries that is in excess of Radian Group’s consolidated federal tax payment
Part I. Item 2. Management's DiscussionandAnalysis of Financial Condition and Results of Operations (Cont'd)
obligation. In 2018, Radian expects to pay minimal federal tax payments to the IRS, other than as described above$511.1 million for the settlement related to the IRS Matter. See “—IRS Matter,” above. As a result, in 2018, under the provisions of our tax-sharing agreements, Radian Group has received cash payments from certain of its subsidiaries that are significantly in excess of Radian Group’s consolidated federal tax payment obligations. We expect to continue to receive additional cash payments from these subsidiaries in the fourth quarter of 2018.
In addition to the primary sources of liquidity listed above, on October 16, 2017, Radian Group entered into a three-year, $225 million unsecured revolving credit facility with a syndicate of bank lenders. Atnine months ended September 30, 2018, the full $2252019 and (ii) net unrealized gains on investments of $186.6 million. These items were partially offset by shares repurchased under our share repurchase programs of $275.2 million, remains undrawn and available under the facility. Effective October 26, 2018, Radian increased the amount of total commitments under the credit facility by $42.5 million, bringing the aggregate unsecured revolving credit facility from $225.0 million to $267.5 million. See Note 12 of Notes to Unaudited Condensed Consolidated Financial Statements for additional information on the unsecured revolving credit facility.
If Radian Group’s current sources of liquidity are insufficient for Radian Group to fund its obligations during the next 12 months, or if we otherwise decide to increase our liquidity position, Radian Group may seek additional capital, including by incurring additional debt, issuing additional equity, or selling assets, which we may not be able to do on favorable terms, if at all.commissions.
We regularly evaluate opportunities, based on market conditions, to finance our operations by accessing the capital markets or entering into other types of financing arrangements with institutional and other lenders and financing sources, and consider various measures to improve our capital and liquidity positions, as well as to strengthen our balance sheet and improve Radian Group’s debt maturity profile. In the past, we have repurchased and exchanged, prior to maturity, some of our outstanding debt, and in the future, we may, from time to time, seek to redeem, repurchase or exchange for other securities, or otherwise restructure or refinance some or all of our outstanding debt, prior to maturity, in the open market, through other public or private transactions, including pursuant to one or more tender offers, or through any combination of the foregoing, as circumstances may allow. The timing or amount of any potential transactions will depend on a number of factors, including market opportunities and our views regarding our capital and liquidity positions and potential future needs. There can be no assurance that any such transactions will be completed on favorable terms, or at all.
Radian Group—Long-Term Liquidity Needs
In addition to our short-term liquidity needs discussed above, our most significant needs for liquidity beyond the next 12 months are:
| |
(1) | the repayment of our outstanding Senior Notes, consisting of: |
$234.1 million principal amount of outstanding debt due in June 2020;
$197.7 million principal amount of outstanding debt due in March 2021;
$450.0 million principal amount of outstanding debt due in October 2024; and
| |
(2) | potential additional capital contributions to our subsidiaries. |
As of September 30, 2018, certain of our subsidiaries have incurred federal NOLs that could not be carried-back and utilized on a separate company tax return basis. As a result, we are not currently obligated under our tax-sharing agreement to reimburse these subsidiaries for their separate company federal NOL carryforward. However, if in a future period, our consolidated NOL and tax credits are fully utilized before a subsidiary has utilized its share of federal NOL carryforwards on a separate entity basis, then Radian Group may be obligated to fund such subsidiary’s share of our consolidated tax liability to the IRS. Certain subsidiaries, including Clayton, currently have federal NOLs on a separate entity basis that are available for future utilization. However, we do not expect to fund material obligations related to these subsidiary NOLs. See also “—Radian Group—Short-Term Liquidity Needs—Sources of Liquidity.”
We expect to meet the long-term liquidity needs of Radian Group with a combination of: (i) available cash and marketable securities; (ii) private or public issuances of debt or equity securities, which we may not be able to do on favorable terms, if at all; (iii) cash received under tax- and expense-sharing arrangements with our subsidiaries; (iv) to the extent available, dividends from our subsidiaries; and (v) any amounts that Radian Guaranty is able to successfully repay under the Surplus Note.
Under Pennsylvania’s insurance laws, ordinary dividends and other distributions may only be paid out of an insurer’s positive unassigned surplus, measured as of the end of the prior fiscal year. Despite the fact that Radian Guaranty and Radian Reinsurance maintained significant positive statutory capital balances, Radian Guaranty and Radian Reinsurance had negative unassigned surplus at December 31, 2017 of $765.0 million and $112.1 million, respectively. Therefore, no ordinary dividends or other distributions can be paid by these subsidiaries in 2018. Due in part to the need to set aside contingency reserves, we do
Part I. Item 2. Management's DiscussionandAnalysis of Financial Condition and Results of Operations (Cont'd)
not expect that Radian Guaranty or Radian Reinsurance will have positive unassigned surplus, and therefore will not have the ability to pay ordinary dividends, for the foreseeable future. Under Pennsylvania’s insurance laws, an insurer may request an Extraordinary Dividend, but payment is subject to the approval of the Pennsylvania Insurance Commissioner.
There can also be no assurance that our Services segment will generate sufficient cash flow to pay dividends. See “—Services” below.
Mortgage Insurance
As of September 30, 2018, our Mortgage Insurance segment maintained claims paying resources of $4.6 billion on a statutory basis, which consists of contingency reserves, statutory policyholders’ surplus, premiums received but not yet earned and loss reserves.
The principal demands for liquidity in our mortgage insurance business include: (i) the payment of claims and potential claim settlement transactions, net of reinsurance; (ii) operating expenses (including those allocated from Radian Group) and; (iii) taxes. In addition, Radian Guaranty’s Surplus Note to Radian Group has a due date of December 31, 2027. The Surplus Note may be redeemed at any time upon 30 days prior notice, subject to the approval of the Pennsylvania Insurance Department.
In August 2016, Radian Guaranty and Radian Reinsurance became members of the FHLB. As members, they may borrow from the FHLB, subject to certain conditions, which include the need to post collateral. Advances from the FHLB may be used to provide low-cost, supplemental liquidity for various purposes, including to fund incremental investments. Radian’s current strategy includes using FHLB advances as financing to purchase additional investment securities that have similar durations, for the purpose of generating additional earnings from our investment securities portfolio with minimal incremental risk. As of September 30, 2018, there were $71.4 millionrepayments of FHLB advances outstanding.
advances; and (iv) taxes. The principal sources of liquidity in our mortgage insurance business currently include insurance premiums, net investment income and cash flows from: (i) investment sales and maturities; (ii) FHLB advances; or (iii) capital contributions from Radian Group. We believe that the operating cash flows generated by each of our mortgage insurance subsidiaries will provide these subsidiaries with a substantial portion of the funds necessary to satisfy their claim payments, operating expenses and taxesneeds for the foreseeable future.
Part I. Item 2. Management’s Discussion and Analysis of Financial Condition and Results of Operations (continued)
As of September 30, 2019, our Mortgage Insurance segment maintained claims paying resources of $4.5 billion on a statutory basis, which consists of contingency reserves, statutory policyholders’ surplus, premiums received but not yet earned and loss reserves.
Radian Guaranty’s Risk-to-capital as of September 30, 2019 was 14.2 to 1. Our combined Risk-to-capital, which represents the consolidated Risk-to-capital measure for all of our Mortgage Insurance subsidiaries, was 12.9 to 1 as of September 30, 2019. Radian Guaranty is not expected to need additional capital to satisfy state insurance regulatory requirements in their current form. See Note 15 of Notes to Unaudited Condensed Consolidated Financial Statements for more information.
Private mortgage insurers, including Radian Guaranty, are required to comply with the PMIERs to remain approved insurers of loans purchased by the GSEs. Radian Guaranty currently is an approved mortgage insurer under the PMIERs and is in compliance with the current PMIERs financial requirements. At September 30, 2019, Radian Guaranty’s Available Assets under the current PMIERs financial requirements totaled approximately $3.4 billion, resulting in excess available resources or a “cushion” of $652 million, or 24%, over its Minimum Required Assets of $2.7 billion.
The chart below summarizes our “cushion” under the PMIERs and Radian’s excess available resources as of September 30, 2018, December 31, 2018 and September 30, 2019, calculated based on the PMIERs financial requirements in effect for each date shown. Our excess available resources include our unsecured revolving credit facility and holding company liquidity, which may be utilized to enhance Radian Guaranty’s PMIERs cushion.
______________________
| |
| (1) | Represents Radian Group’s Liquidity, net of the $35 million minimum liquidity requirement under the unsecured revolving credit facility. Radian Group’s Liquidity as of September 30, 2019 and December 31, 2018 includes $825 million and $450 million, respectively, from the April 2019 and December 2018 distributions of capital of $375 million and $450 million, respectively, from Radian Guaranty to Radian Group, as approved by the Pennsylvania Insurance Department. |
| |
| (2) | Represents Radian Guaranty’s excess of Available Assets over its Minimum Required Assets, calculated in accordance with the PMIERs financial requirements in effect for each date shown. PMIERs 1.0 was in effect for September 30, 2018 and December 31, 2018; PMIERs 2.0 was in effect for September 30, 2019. |
| |
| (3) | Percentages represent the values shown as a percentage of Minimum Required Assets under the applicable PMIERs financial requirements in effect for the dates shown. |
Part I. Item 2. Management’s Discussion and Analysis of Financial Condition and Results of Operations (continued)
In April 2019, Radian Guaranty entered into a fully collateralized reinsurance agreement with Eagle Re 2019-1 that reduced net RIF by a total of $562.0 million, reducing the PMIERs Minimum Required Assets by the same amount at inception. See ““Overview——Radian Group—Short-Term Liquidity Needs—Capital Support for SubsidiariesQuarterly Highlights and Recent Company Developments”and Note 17 of Notes to Unaudited Condensed Consolidated Financial Statements for additional information.information on this new agreement.
Securities Lending Agreements. In April 2019, the Pennsylvania Insurance Department approved a $375 million Extraordinary Distribution from Radian Guaranty to Radian Group, which was paid on April 30, 2019 in the form of cash and marketable securities. This distribution reduced our PMIERs Available Assets by $375 million.
Under Pennsylvania’s insurance laws, ordinary dividends and other distributions may only be paid out of an insurer’s positive unassigned surplus, measured as of the end of the prior fiscal year. Despite the fact that Radian Guaranty and Radian Reinsurance maintained significant positive statutory policyholders’ surplus balances, Radian Guaranty and Radian Reinsurance had negative unassigned surplus at December 31, 2018 of $701.9 million and $84.8 million, respectively. Therefore, no ordinary dividends can be paid by these subsidiaries in 2019. Due in part to the need to set aside contingency reserves, we do not expect that Radian Guaranty or Radian Reinsurance will have positive unassigned surplus, and therefore we expect that they will not have the ability to pay ordinary dividends for the foreseeable future.
Radian Guaranty and Radian Reinsurance are both members of the FHLB. As members, they may borrow from the FHLB, subject to certain conditions, which include the need to post collateral and the requirement to maintain a minimum investment in FHLB stock. Advances from the FHLB may be used to provide low-cost, supplemental liquidity for various purposes, including to fund incremental investments. Radian’s current strategy includes using FHLB advances as financing to purchase additional investment securities that have similar durations, for the purpose of generating additional earnings from our investment securities portfolio with minimal incremental risk. As of September 30, 2019, there were $104.5 million of FHLB advances outstanding.
Radian Guaranty and Radian Reinsurance from time to time enter into certain short-term securities lending agreements with third-party Borrowersborrowers for the purpose of increasing the yield on our investment securities portfolio with minimal incremental risk. Under our securities lending program, Radian Guaranty and Radian Reinsurance loan certain securities in their investment portfolios to these Borrowers for short periods of time in exchange for collateral consisting of cash and other securities. We have the right to request the return of the loaned securities at any time.
Under our securities lending agreements, the Borrower generally may return the loaned securities to us at any time, which would require us to return the cash and other collateral within the standard settlement period for the loaned securities on the principal exchange or market in which the securities are traded. We manage this liquidity risk associated with the cash collateral by maintaining the cash collateral in a short-term money-market fund with daily availability.
The credit risk under these programs is reduced by the amounts of collateral received. On a daily basis, the value of the underlying securities that we have loaned to the Borrowers is compared to the value of cash and securities collateral we received from the Borrowers, and additional cash or securities are requested or returned, as applicable. In addition, we are indemnified against counterparty credit risk by the intermediary. For additional information on our securities lending agreements, see See Note 5 of Notes to Unaudited Condensed Consolidated Financial Statements.Statements for more information.
Services
As of September 30, 2018,2019, our Services segment maintained cash and cash equivalentsliquid investments totaling $7.9$40.3 million, which included restricted cash of $2.5 million.
The principal demands for liquidity in our$0.1 million, primarily held by Radian Title Insurance. Effective January 1, 2019, Radian Group recapitalized the Services segment include: (i)with a capital contribution that enabled the payment of employee compensationServices segment to repay its accumulated allocated operating expense and other operating expenses, including those allocated from Radian Group; (ii) reimbursementsinterest expense, as well as to repay the Clayton Intercompany Note. While this action had no immediate net impact to Radian Group forGroup’s available liquidity, we expect that the Services segment will now be more likely to satisfy its portionreimbursement obligations in the future. In the event the cash flow from operations of allocated expense; and (iii) dividendsthe Services segment is not adequate to fund all of its needs, Radian Group if any.
Part I. Item 2. Management's DiscussionandAnalysis of Financial Condition and Results of Operations (Cont'd)
The principal sources of liquidity in ourmay provide additional funds to the Services segment are cash generated by operations and, toin the extent necessary,form of a capital contributions from Radian Group.contribution or an intercompany loan.
Liquidity levels may fluctuate depending on the levels and contractual timing of our invoicing and the payment practices of the Services clients, in combination with the timing of Services’ payments for employee compensation and to external vendors. The amount, if any, and timing of the Services segment’s dividend paying capacity will depend primarily on the amount of excess cash flow generated by the segment.
The Services segment has not generated sufficient cash flows to pay dividends to Radian Group. Additionally, while cash flow has been sufficient to pay the Services segment’s direct operating expenses, it has not been sufficient to reimburse Radian Group for $90 million of its accumulated allocated operating expense and interest expense. We do not expect that the Services segment will be able to bring its reimbursement obligations current in the foreseeable future. In the event the cash flow from operations of the Services segment is not adequate to fund all of its needs, Radian Group may provide additional funds to the Services segment in the form of a capital contribution or an intercompany note.
Cash Flows
The following table summarizes our consolidated cash flows from operating, investing and financing activities:
|
| | | | | | | |
| (In thousands) | Nine Months Ended
September 30, |
| 2018 | | 2017 |
| Net cash provided by (used in): | | | |
| Operating activities | $ | 491,929 |
| | $ | 218,425 |
|
| Investing activities | (506,400 | ) | | (75,229 | ) |
| Financing activities | 32,565 |
| | (106,321 | ) |
| Effect of exchange rate changes on cash and restricted cash | — |
| | 116 |
|
| Increase (decrease) in cash and restricted cash | $ | 18,094 |
| | $ | 36,991 |
|
| | | | |
Operating Activities. Our most significant source of operating cash flows is from premiums received from our insurance policies, while our most significant uses of operating cash flows are generally for claims paid on our insured policies and our operating expenses. Net cash provided by operating activities totaled $491.9 million for the nine months ended September 30, 2018, compared to $218.4 million for the same period in 2017. This increase in net cash provided by operating activities in the nine months ended September 30, 2018, compared to the same period in 2017, was principally the result of: (i) alternative minimum tax payments of approximately $76 million in the nine months ended September 30, 2017, as compared to minimal tax payments in the nine months ended September 30, 2018; (ii) an increase in net premiums written in 2018; and (iii) a reduction in claims paid in 2018. Claims paid for the nine months ended September 30, 2017 included payments that were made in connection with the scheduled final settlement of the Freddie Mac Agreement in the third quarter of 2017.
Investing Activities. Net cash used in investing activities increased in the nine months ended September 30, 2018, compared to the same period in 2017, primarily as a result of: (i) an increase in purchases of short-term investments and (ii) a decrease in proceeds from trading securities, partially offset by an increase in proceeds, net of purchases, from equity securities.
Financing Activities. Net cash provided by financing activities increased for the nine months ended September 30, 2018, as compared to net cash used in financing activities during the same period in 2017. For the nine months ended September 30, 2018 our primary financing activities included an increase in secured borrowings from the FHLB, partially offset by an increase in the purchases of our common shares. For the nine months ended September 30, 2017 our primary financing activities included the issuance of $450 million aggregate principal amount of Senior Notes due 2024 as well as: (i) the purchases of aggregate principal amounts of $141.4 million, $115.9 million and $152.3 million of our Senior Notes due 2019, 2020 and 2021, respectively; (ii) the settlement of our obligations on the remaining $68.0 million aggregate principal amount of our Convertible Senior Notes due 2019; and (iii) the purchase of $21.6 million aggregate principal amount of our Convertible Senior Notes due 2017, all of which were settled in cash for an aggregate amount of $591.7 million during the nine months ended September 30, 2017.
See “Item 1. Condensed Consolidated Statements of Cash Flows (Unaudited)” for additional information.
Part I. Item 2. Management'sManagement’s DiscussionandAnalysis of Financial Condition and Results of Operations (Cont'd)(continued)
Stockholders’ Equity
Stockholders’ equity increased by $347.2 million from December 31, 2017 to September 30, 2018. The net increase in stockholders’ equity resulted primarily from our net income of $466.2 million for the nine months ended September 30, 2018, partially offset by: (i) net unrealized losses on investments of $85.3 million and (ii) shares repurchased under our share repurchase program of $50.1 million. See Note 14 of Notes to Unaudited Condensed Consolidated Financial Statements for additional information.
During the first nine months of 2018, Radian’s holding company debt-to-capital ratio decreased to 23.5% at September 30, 2018 from 25.5% at December 31, 2017 and 25.6% at September 30, 2017.
Ratings
Radian Group, Radian Guaranty and Radian Reinsurance have been assigned the ratings set forth in the chart below. We believe that ratings often are considered by others in assessing our credit strength and the financial strength of our primary mortgage insurance subsidiaries. The following ratings have been independently assigned by third-party statistical rating organizations, are for informational purposes only and are subject to change.
|
| | | |
| | Moody’s (1) | | S&P (2) |
| Radian Group | Ba2Ba1 | | BB+ |
| Radian Guaranty | Baa2Baa1 | | BBB+ |
| Radian Reinsurance | N/A | | BBB+ |
______________________
| |
| (1) | Based on the September 21, 2018October 17, 2019 update, Moody’s outlook for Radian Group and Radian Guaranty currently is Stable. |
| |
| (2) | Based on the SeptemberOctober 11, 20172018 update, S&P’s outlook for Radian Group, Radian Guaranty and Radian Reinsurance is currently Stable. |
Critical Accounting Policies
As of the filing date of this report, there were no significant changes in our critical accounting policies from those discussed in our 20172018 Form 10-K.10-K, other than described below. See Note 1 of Notes to Unaudited Condensed Consolidated Financial Statements for accounting pronouncements issued but not yet adopted that may impact the Company’s consolidated financial position, earnings, cash flows or disclosures.
76Lease expense is recognized on a straight-line basis over the expected lease term. For lease agreements entered into after the adoption of ASU 2016-02 that include lease and non-lease components, such components are generally not accounted for separately. We have elected the short-term exemption for contracts with lease terms of 12 months or less.
Item 3. Quantitative and Qualitative Disclosures About Market Risk.
Market risk represents the potential for loss due to adverse changes in the value of financial instruments as a result of changes in market conditions. Examples of market risk include changes in interest rates, credit spreads, equity prices, and foreign currency exchange rates, and equity prices. We perform sensitivity analyses to determine the effects of market risk exposures on our investment securities by determining the potential loss in future earnings, fair values or cash flows of market-risk-sensitive instruments resulting from one or more selected hypothetical changes in the above mentioned market risks.
Interest-Rate Risk and Credit-Spread Risk
rates. The primary market risks in our investment portfolio are interest-rate risk and credit-spread risk, namely the fair value sensitivity of our fixed income securities to changes in interest rates and credit spreads, respectively. We regularly analyze our exposure to interest-rate risk and credit-spread risk and have determined that the fair value of our investments is materially exposed to changes in both interest rates and credit spreads.
Our sensitivity analysis for interest rates is based on the change in fair value of our fixed income securities, assuming a hypothetical instantaneous and parallel 100-basis point increase or decrease in the U.S. Treasury yield curve, with all other factors remaining constant. We calculate the duration of our fixed income securities, expressed in years, in order to estimate the interest-rate sensitivity of these securities, as shown in the table below.
Credit spread represents the additional yield on a fixed income security, above the risk-free rate, that is paid by an issuer to compensate investors for assuming the creditmarket risk of the issuer and market liquidity of the fixed income security. We manage credit-spread risk on both an entity and group level, across issuer, maturity, sector and asset class. Our sensitivity analysis for credit-spread risk is based on the change in fair value of our fixed income securities, assuming a hypothetical 100-basis point increase or decrease in all credit spreads, with the exception of U.S. Treasury and agency obligations for which weexposures at September 30, 2019 have assumed no change in credit spreads, and assuming all other factors remain constant. Actual shifts in credit spreads generally vary by issuer and security, based on issuer-specific and security-specific factors such as credit quality, maturity, sector and asset class. Within a given asset class, investment grade securities generally exhibit less credit-spread volatility than securities with lower credit ratings. Our investment securities portfolio primarily consists of investment grade securities.
Our sensitivity analyses for interest-rate risk and credit-spread risk provide an indication of our investment portfolio’s sensitivity to shifts in interest rates and credit spreads. However, the timing and magnitude of actual market changes may differnot materially changed from the hypothetical assumptions usedthose identified in our sensitivity calculations.2018Form 10-K.
The following table illustrates the sensitivity of our investment portfolio to both interest-rate risk and credit-spread risk:
|
| | | | | | | | | | | | | | | |
| | Short-term and Available for Sale | | Trading |
| ($ in millions) | September 30,
2018 | | December 31,
2017 | | September 30,
2018 | | December 31,
2017 |
Carrying value of fixed income investment portfolio (1) (2) | $ | 4,384.5 |
| | $ | 4,009.8 |
| | $ | 594.0 |
| | $ | 606.4 |
|
Percentage of fixed income investment portfolio compared to total investment portfolio (3) | 86.6 | % | | 85.8 | % | | 11.7 | % | | 13.0 | % |
| Average duration of fixed income portfolio | 4.1 years |
| | 4.4 years |
| | 4.4 years |
| | 5.1 years |
|
| | | | | | | | |
| Interest-rate risk increase/(decrease) in market value | | | | | | | |
| +100 basis points - $ | $ | (170.7 | ) | | $ | (169.8 | ) | | $ | (24.9 | ) | | $ | (29.7 | ) |
+100 basis points - % (4) | (3.9 | )% | | (4.2 | )% | | (4.2 | )% | | (4.9 | )% |
| - 100 basis points - $ | $ | 185.9 |
| | $ | 184.7 |
| | $ | 27.0 |
| | $ | 32.5 |
|
- 100 basis points - % (4) | 4.2 | % | | 4.6 | % | | 4.5 | % | | 5.4 | % |
| | | | | | | | |
| Credit-spread risk increase (decrease) in market value | | | | | | | |
| +100 basis points - $ | $ | (181.5 | ) | | $ | (183.8 | ) | | $ | (26.4 | ) | | $ | (30.4 | ) |
+100 basis points - % (4) | (4.1 | )% | | (4.6 | )% | | (4.4 | )% | | (5.0 | )% |
| - 100 basis points - $ | $ | 147.9 |
| | $ | 148.6 |
| | $ | 21.7 |
| | $ | 24.6 |
|
- 100 basis points - % (4) | 3.4 | % | | 3.7 | % | | 3.7 | % | | 4.1 | % |
______________________
| |
(1) | Total fixed income securities include fixed-maturity investments available for sale, trading securities and short-term investments and exclude reinvested cash collateral held under securities lending agreements. At September 30, 2018 and December 31, 2017, fixed income securities shown above also include $79.7 million and $134.1 million, respectively, invested in certain fixed income exchange-traded funds that are classified as equity securities in our condensed consolidated balance sheets, as well as $27.9 million and $20.7 million, respectively, in fixed income securities loaned under securities lending agreements that are classified as other assets in our condensed consolidated balance sheets. |
| |
(2) | At December 31, 2017, equity securities, including our fixed income exchange-traded funds included in this table, were classified as available for sale on our condensed consolidated balance sheet. At September 30, 2018, in accordance with the new accounting guidance adopted for 2018, equity securities are no longer classified as available for sale on our condensed consolidated balance sheet and changes in fair value for equity securities are recognized through earnings. As a result, at September 30, 2018, the fixed income exchange-traded funds that are classified as equity securities on our condensed consolidated balance sheet are included in trading securities in this table. See Note 1 of Notes to Unaudited Condensed Consolidated Financial Statements for additional details on the implementation of this new accounting guidance. |
| |
(3) | Total investment portfolio comprises total investments per the consolidated balance sheets including securities loaned under securities lending agreements that are classified as other assets in our consolidated balance sheets. |
| |
(4) | Change in value expressed as a percentage of the market value of the related fixed income portfolio. |
The average duration of our total fixed income portfolio was 4.1 years at September 30, 2018 compared to 4.5 years at December 31, 2017. To assist us in setting duration targets for the investment portfolio, we analyze: (i) the interest-rate sensitivities of our liabilities, including prepayment risk associated with premium cash flows and credit losses; (ii) entity specific cash flows under various economic scenarios; (iii) return, volatility and correlation of specific asset classes and the interconnection with our liabilities; and (iv) our current risk appetite.
Securities Lending Agreements. Radian Guaranty and Radian Reinsurance from time to time enter into certain short-term securities lending agreements with third-party Borrowers for the purpose of increasing the yield on our investment securities portfolio with minimal incremental risk. Market factors, including changes in interest rates, credit spreads and equity prices, may impact the timing or magnitude of cash outflows for the return of cash collateral. For the purpose of illustrating our interest-rate risk and credit-spread risk, we have included our fixed income securities (which include certain exchange-traded funds) loaned in the sensitivity table above. As of September 30, 2018 and December 31, 2017, the carrying value of these
securities was $27.9 million and $20.7 million, respectively. See Note 5 of Notes to Unaudited Condensed Consolidated Financial Statements for additional details on our securities lending agreements.
Under our securities lending agreements, the Borrower generally may return the loaned securities to us at any time, which would require us to return the cash and other collateral within the standard settlement period for the loaned securities on the principal exchange or market in which the securities are traded. We manage this liquidity risk associated with the cash collateral by maintaining the cash collateral in a short-term money-market fund with daily availability.
The credit risk under these programs is reduced by the amounts of collateral received. On a daily basis, the value of the underlying securities that we have loaned to the Borrowers is compared to the value of cash and securities collateral we received from the Borrowers, and additional cash or securities are requested or returned, as applicable. In addition, we are indemnified against counterparty credit risk by the intermediary. We also have the right to request the return of the loaned securities at any time. For additional information on our securities lending agreements, see Note 5 of Notes to Unaudited Condensed Consolidated Financial Statements.
Foreign Exchange Rate Risk
As of September 30, 2018 and December 31, 2017, we did not hold any foreign currency denominated securities in our investment portfolio. Exchange gains and losses on foreign currency transactions from our foreign operation have not been material due to its limited amount of business. Currency risk is further limited because, in general, both the revenues and expenses of our foreign operation are denominated in the same functional currency, based on the country in which the operation occurs.
Equity Market Price
Equity Investments at September 30, 2018. At September 30, 2018, the market value and cost of the equity securities in our investment portfolio were $121.9 million and $120.3 million, respectively. These amounts include market value and cost of fixed income exchange-traded funds of $79.7 million and $80.2 million, respectively, which are subject to interest-rate risk and credit-spread risk consistent with our other fixed income securities. Therefore, these fixed income exchange-traded funds have been included in the table above for purposes of illustrating our sensitivity to these risks.
The remaining $42.2 million and $40.1 million of market value and cost, respectively, of equity securities at September 30, 2018, primarily consists of publicly-traded business development company equity securities and equity-related exchange-traded funds. Due to our limited basis in these investments at September 30, 2018, our exposure to changes in equity market prices is not significant.
Equity Investments at December 31, 2017. At December 31, 2017, the market value and cost of the equity securities in our investment portfolio were $162.8 million and $163.1 million, respectively. These amounts include market value and cost of fixed income exchange-traded funds of $134.1 million and $135.0 million, respectively, which are subject to interest-rate risk and credit-spread risk consistent with our other fixed income securities. Therefore, these fixed income exchange-traded funds have been included in the table above for purposes of illustrating our sensitivity to these risks.
The remaining $28.8 million and $28.1 million of market value and cost, respectively, of equity securities at December 31, 2017, consists of publicly-traded business development company equity securities and equity-related exchange-traded funds. Due to our limited basis in these investments at December 31, 2017, our exposure to changes in equity market prices was not significant.
Item 4. Controls and Procedures.
Evaluation of Disclosure Controls and Procedures
We maintain disclosure controls and procedures designed to provide reasonable assurance that information required to be disclosed in the reports we file or submit under the Exchange Act is recorded, processed, summarized and reported within the time periods specified in the SEC’s rules and forms and that such information is accumulated and communicated to our management, including our Chief Executive Officer and Chief Financial Officer, as appropriate, to allow timely decisions regarding required disclosure.
Our management, including our Chief Executive Officer and Chief Financial Officer, conducted an evaluation of the effectiveness of our disclosure controls and procedures (as defined in RuleRules 13a-15(e) and 15d-15(e) of the Exchange Act) as of September 30, 2018,2019, pursuant to Rule 15d-15(e)15d-15(b) under the Exchange Act. Based upon that evaluation, our Chief Executive Officer and Chief Financial Officer concluded that, as of September 30, 2018,2019, our disclosure controls and procedures were effective to provide
reasonable assurance that the information required to be disclosed by us in the reports we file or submit under the Exchange Act is recorded, processed, summarized and reported within the time periods specified in the SEC’s rules and forms.
Changes in Internal Control Over Financial Reporting
During the nine-monththree-month period ended September 30, 2018,2019, there has been no change in our internal control over financial reporting (as defined in Rule 13a-15(f) of the Exchange Act) that has materially affected, or is reasonably likely to materially affect, our internal control over financial reporting.
PART II—OTHER INFORMATION
Item 1. Legal Proceedings.
We are routinely involved in a number of legal actions and proceedings, including litigation and other disputes arising in the ordinary course of our business.
On July 18, 2018, we entered into a settlement agreement with the IRS related to adjustments we had been contesting that resulted from the examination by the IRS of our 2000 through 2007 consolidated federal income tax returns. The IRS was opposing the recognition of certain tax losses and deductions that were generated through our investment in a portfolio of non-economic REMIC residual interests and proposed denying the associated tax benefits of these items. We appealed these proposed adjustments to the Internal Revenue Service Office of Appeals and made “qualified deposits” with the U.S. Treasury of $85 million in June 2008 relating to the 2000 through 2004 tax years and $4 million in May 2010 relating to the 2005 through 2007 tax years, in order to avoid the accrual of incremental above-market-rate interest with respect to the proposed adjustments. The settlement with the IRS resolved the issues and concluded all disputes related to the IRS Matter discussed above. Under the terms of the settlement, Radian will submit to the IRS approximately $31 million of its $89 million “qualified deposits” with the U.S. Treasury, and the remaining balance will be returned to Radian. In connection with the final settlement, in the second quarter of 2018, we realized tax benefits of $73.6 million, which includes both the impact of the settlement with the IRS as well as the reversal of certain previously accrued state and local tax liabilities. See Note 9 of Notes to Unaudited Condensed Consolidated Financial Statements for additional information regarding the IRS Matter.
On December 22, 2016, Ocwen Loan Servicing, LLC and Homeward Residential, Inc. (collectively, “Ocwen”) filed a complaint in the U.S. District Court for the Eastern District of Pennsylvania against Radian Guaranty (the “Complaint”) alleging breach of contract and bad faith claims and seeking monetary damages and declaratory relief. Ocwen has also initiated similar legal proceedings against several other mortgage insurers. On December 17, 2016, Ocwen separately filed a parallel arbitration petition against Radian Guaranty before the American Arbitration Association (“AAA”) asserting substantially the same allegations (the “Arbitration”). Ocwen’s filings together listed 9,420 mortgage insurance certificates issued under multiple insurance policies, including Pool Insurance policies, as subject to the dispute. On June 5, 2017, Ocwen filed an amended complaint and an amended petition (collectively, the “Amended Filings”) with both the court and the AAA, respectively, together listing 8,870 certificates as subject to the dispute. On April 11, 2018, the parties entered into a confidential agreement with respect to all certificates subject to the dispute. The confidential agreement resolved certain categories of claims involved in the dispute and, on April 12, 2018, the parties filed a stipulation of voluntary dismissal of the federal court proceeding and the trial judge issued an Orderorder dismissing all claims and counterclaims subject to the parties’ agreement. Radian Guaranty was not required to make any payment in connection with this confidential agreement. Pursuant to the confidential agreement, the parties: (1) dismissed the federal court proceeding; (2) narrowed the scope of the dispute to Ocwen’s breach of contract claims seeking payment of insurance benefits on approximately 2,500 certificates that Ocwen was previously pursuing through the Amended Filings; and (3) agreed to resolve the remaining dispute through the Arbitration. The Arbitration is proceeding and Radian Guaranty believes that Ocwen’s allegations and claims in the legal proceedings described above are without merit and legally deficient, and planscontinues to defend theseagainst Ocwen’s claims vigorously. We are not able to estimate a reasonably possible loss, if any, or range of loss in this matter because of the preliminary stage of the Arbitration.
On August 31, 2018, Nationstar Mortgage LLC d/b/a Mr. Cooper (“Nationstar”) filed a complaint in the U.S. District Court for the Eastern District of Pennsylvania against Radian Guaranty (the “Complaint”) alleging breach of contract, bad faith, andequitable indemnification, unjust enrichment, and conversion claims and seeking monetary damages and declaratory relief. TheExhibit 1 to the Complaint lists 3,014 mortgage insurance certificates issued under multiple insurance policies as subject to disputes involving insurance coverage decisions. Thedecisions (the “Coverage Disputed Loans”). Exhibit 2 to the Complaint further lists 2,231 mortgage insurance certificates issued under multiple insurance policies as subject to disputes involving premium refund requests. In December 2018, Radian Guaranty filed a motion to dismiss the Complaint. In March 2019, the trial judge issued an order granting in part, and denying in part, our motion to dismiss, and dismissed Nationstar’s unjust enrichment and conversion claims. In May 2019, Radian Guaranty filed an answer, with affirmative defenses and counterclaims, in response to the Complaint. On September 23, 2019, the trial judge entered as an order a joint stipulation submitted by Nationstar and Radian Guaranty that narrowed the scope of the dispute involving Coverage Disputed Loans to claims relating to 1,704 mortgage insurance certificates. Radian Guaranty believes that Nationstar’s allegations and claims in the legal proceedings described above are without merit and legally deficient, and planscontinues to defend against these claims vigorously. We are not able
In the three and nine months ended September 30, 2019, the Company increased its IBNR reserve estimate by $11.8 million and $31.2 million, respectively, related to our best estimate a reasonably possible loss, if any, or range of our probable loss in this matter becauseconnection with the above legal proceedings. While Radian believes it has substantial defenses in these matters and intends to continue to defend against these claims vigorously, it is not feasible to predict the ultimate outcome of these disputes, and the preliminary stageCompany could in the future be required to pay amounts as a result of the litigation.settlements or decisions in these matters, potentially in excess of accruals.
We also are periodically subject to reviews and audits, as well as inquiries, information-gathering requests and investigations. In connection with these matters, from time to time we receive requests and subpoenas seeking information and documents related to aspects of our business. In March 2017, Green River Capital, a subsidiary of Clayton, received a letter from the staff of the SEC stating that it is conducting an investigation captioned, “In the Matter of Certain Single Family Rental Securitizations,” and that it is requesting information from market participants. The letter requested that Green River Capital provide information regarding broker price opinions that Green River Capital provided on properties included in SFR securitization transactions. Green River Capital has been cooperating with the SEC in this matter.
The legal and regulatory matters discussed above and in our 20172018 Form 10-K could result in adverse judgments, settlements, fines, injunctions, restitutions or other relief that could require significant expenditures or have other effects on our business. Management believes, based on current knowledge and after consultation with counsel, that the outcome of such actions will not have a material adverse effect on our consolidated financial condition. However, theThe outcome of litigation and other legal and regulatory matters and proceedings is inherently uncertain, and it is possible that one or more of the matters currently pending or threatened could have an unanticipated adverse effect on our liquidity, financial condition or results of operations for any particular period.
Item 1A. Risk Factors.
There have been no material changes to our risk factors from those previously disclosed in our 20172018 Form 10-K.
Item 2. Unregistered Sales of Equity Securities and Use of Proceeds.
Issuance of Unregistered Securities
During the three and nine months ended September 30, 2018,2019, no equity securities of Radian Group were sold that were not registered under the Securities Act.
Issuer Purchases of Equity Securities
The following table provides information about purchases of Radian Group common stock by us (and our affiliated purchasers) during the three months ended September 30, 2018.2019.
|
| | | | | | | | | | | | | |
| Issuer Purchases of Equity Securities |
| Period | Total Number of Shares Purchased (1) | | Average Price Paid per Share | | Total Number of Shares Purchased as Part of Publicly Announced Plans or Programs | | Approximate Dollar Value of Shares That May Yet Be Purchased Under the Plans or Programs (2) |
| Share repurchase program | | | | | | | |
| 7/1/2018 to 7/31/2018 | 947 |
| | $ | 16.55 |
| | — |
| | $ | — |
|
| 8/1/2018 to 8/31/2018 | 512 |
| | $ | 19.56 |
| | — |
| | $ | 100,000 |
|
| 9/1/2018 to 9/30/2018 | — |
| | $ | — |
| | — |
| | $ | 100,000 |
|
| Total | 1,459 |
| | | | — |
| |
|
| | | | | | | | |
|
| | | | | | | | | | | | | |
| Issuer Purchases of Equity Securities |
| ($ in thousands, except per-share amounts) | | | | | | | |
| Period | Total Number of Shares Purchased (1) | | Average Price Paid per Share | | Total Number of Shares Purchased as Part of Publicly Announced Plans or Programs (2) | | Approximate Dollar Value of Shares That May Yet Be Purchased Under the Plans or Programs (2) |
| Share repurchase programs | | | | | | | |
| 7/1/2019 to 7/31/2019 | 2,242,176 |
| | $ | 23.43 |
| | 2,241,568 |
| | $ | — |
|
| 8/1/2019 to 8/31/2019 | 1,107,250 |
| | $ | 22.64 |
| | 1,104,786 |
| | $ | 175,000 |
|
| 9/1/2019 to 9/30/2019 | 772 |
| | $ | 23.12 |
| | — |
| | $ | 175,000 |
|
| Total | 3,350,198 |
| | | | 3,346,354 |
| |
|
| | | | | | | | |
______________________
| |
| (1) | RepresentsIncludes 3,844 shares tendered by employees as payment of taxes withheld on the vesting of certain restricted stock awards granted under the Company’s equity compensation plans. |
| |
| (2) | On March 20, 2019, Radian Group’s board of directors approved a $150 million increase in authorization for the Company’s existing share repurchase plan, bringing the total authorization to repurchase shares up to $250 million, excluding commissions. During the three months ended September 30, 2019, we completed this repurchase authorization by purchasing an additional 2,241,568 shares at an average price of $23.43 per share, including commissions. On August 16, 2018,14, 2019, Radian Group’s board of directors approved a new share repurchase program that authorizes the Company to repurchasespend up to $100$200 million of itsto repurchase Radian Group common stock. As ofPursuant to this authorization, during the three months ended September 30, 2018,2019, the full purchase authorityCompany purchased 1,104,786 shares at an average price of up to $100 million remained available under this$22.64 per share, including commissions. This share repurchase program which expires on JulyAugust 31, 2019.2020. See Note 13 of Notes to Unaudited Condensed Consolidated Financial Statements for additional details on our share repurchase programs. |
Item 6. Exhibits
|
| | |
| Exhibit No. | | Exhibit Name |
| | | |
| *31 | | |
| | | |
| **32 | | |
| | | |
*101101.INS | | Pursuant to Rule 405 of Regulation S-T,Inline XBRL Instance Document - the following financial information from Radian Group Inc.’s Quarterly Report on Form 10-Q forinstance document does not appear in the quarter ended September 30, 2018 is formattedInteractive Data File because its XBRL tags are embedded within the Inline XBRL document. |
| | |
| *101.SCH | | Inline XBRL Taxonomy Extension Schema Document |
| | |
| *101.CAL | | Inline XBRL Taxonomy Extension Calculation Linkbase Document |
| | |
| *101.DEF | | Inline XBRL Taxonomy Extension Definition Linkbase Document |
| | |
| *101.LAB | | Inline XBRL Taxonomy Extension Label Linkbase Document |
| | |
| *101.PRE | | Inline XBRL Taxonomy Extension Presentation Linkbase Document |
| | |
| *104 | | Cover Page Interactive Data File (formatted as Inline XBRL and contained in XBRL (eXtensible Business Reporting Language): (i) Condensed Consolidated Balance Sheets as of September 30, 2018 and December 31, 2017; (ii) Condensed Consolidated Statements of Operations for the three and nine months ended September 30, 2018 and 2017; (iii) Condensed Consolidated Statements of Comprehensive Income (Loss) for the three and nine months ended September 30, 2018 and 2017; (iv) Condensed Consolidated Statements of Changes in Common Stockholders’ Equity for the nine months ended September 30, 2018 and 2017; (v) Condensed Consolidated Statements of Cash Flows for the nine months ended September 30, 2018 and 2017; and (vi) the Notes to Unaudited Condensed Consolidated Financial Statements.Exhibit 101.INS) |
______________________
+ Management contract, compensatory plan or arrangement.
* Filed herewith.
** Furnished herewith.
SIGNATURES
Pursuant to the requirements of the Securities Exchange Act of 1934, the registrant has duly caused this report to be signed on its behalf by the undersigned thereunto duly authorized.
|
| |
| | Radian Group Inc. |
| | |
November 8, 201812, 2019 | /s/ J. FRANKLIN HALL |
| | J. Franklin Hall |
| | Senior Executive Vice President, Chief Financial Officer |
| | |
| | /s/ CRATHERINEOBERT M. JJ. QACKSONUIGLEY |
| | Catherine M. JacksonRobert J. Quigley |
| | Senior Vice President, Controller |