UNITED STATES
SECURITIES AND EXCHANGE COMMISSION
Washington, D.C. 20549
_____________________________
FORM 10-Q
_____________________________
(Mark One)
|
| |
x☒ | QUARTERLY REPORT PURSUANT TO SECTION 13 OR 15(d) OF THE SECURITIES EXCHANGE ACT OF 1934 |
For the quarterly period ended March 31, 20192020
OR
|
| |
o☐ | TRANSITION REPORT PURSUANT TO SECTION 13 OR 15(d) OF THE SECURITIES EXCHANGE ACT OF 1934 |
For the transition period from to
Commission File Number 1-11356
Radian Group Inc.Inc.
(Exact name of registrant as specified in its charter)
|
| | | | | | |
| Delaware | | 23-2691170 |
| (State or other jurisdiction of incorporation or organization) | | (I.R.S. Employer Identification No.) |
| | | | | | | |
| 1500 Market Street | , | Philadelphia | , | PA | | 19102 |
| (Address of principal executive offices) | | (Zip Code) |
(215) (215) 231-1000
(Registrant’s telephone number, including area code)
Securities registered pursuant to Section 12(b) of the Act:
|
| | |
| Title of each class | Trading Symbol(s) | Name of each exchange on which registered |
| Common Stock, $0.001 par value per share | RDN | New York Stock Exchange |
Indicate by check mark whether the registrant (1) has filed all reports required to be filed by Section 13 or 15(d) of the Securities Exchange Act of 1934 during the preceding 12 months (or for such shorter period that the registrant was required to file such reports), and (2) has been subject to such filing requirements for the past 90 days. Yes xYes☒ No o☐
Indicate by check mark whether the registrant has submitted electronically every Interactive Data File required to be submitted pursuant to Rule 405 of Regulation S-T (§232.405 of this chapter) during the preceding 12 months (or for such shorter period that the registrant was required to submit such files). Yes xYes☒ No o☐
Indicate by check mark whether the registrant is a large accelerated filer, an accelerated filer, a non-accelerated filer, a smaller reporting company, or an emerging growth company. See the definitions of “large accelerated filer,” “accelerated filer,” “smaller reporting company” and “emerging growth company” in Rule 12b-2 of the Exchange Act.
|
| | | | | | | | | | | | | |
Large accelerated filer x Accelerated Filer | ☒ | | Accelerated filero | ☐ | | Non-accelerated filero | ☐ | | Smaller reporting companyo | ☐ | | Emerging growth companyo | ☐ |
If an emerging growth company, indicate by check mark if the registrant has elected not to use the extended transition period for complying with any new or revised financial accounting standards provided pursuant to Section 13(a) of the Exchange Act. o☐
Indicate by check mark whether the registrant is a shell company (as defined in Rule 12b-2 of the Exchange Act). Yes o☐ No x☒
Securities registered pursuant to Section 12(b) of the Act:
|
| | |
Title of each class | Trading Symbol(s) | Name of each exchange on which registered |
Common Stock, $0.001 par value per share | RDN | New York Stock Exchange |
APPLICABLE ONLY TO CORPORATE ISSUERS:
Indicate the number of shares outstanding of each of the issuer’s classes of common stock, as of the latest practicable date: 208,020,528190,387,016 shares of common stock, $0.001 par value per share, outstanding on May 6, 2019.4, 2020.
|
| | |
| | TABLE OF CONTENTS | |
| | | Page Number |
| |
| |
| |
| Item 1. | | |
| | | |
| | | |
| | | |
| | | |
| | | |
| | | |
| | | |
| | | |
| | | |
| | | |
| | | |
| | | |
| | | |
| | | |
| | | |
| | | |
| | | |
| | |
| | |
| | | |
| | |
| | |
| | |
| | | |
| Item 2. | | |
| Item 3. | | |
| Item 4. | | |
| | | |
| |
| Item 1. | | |
| Item 1A. | | |
| Item 2. | | |
| Item 5. | | |
| Item 6. | | |
| | | |
| |
GLOSSARY OF ABBREVIATIONS AND ACRONYMS
The following list defines various abbreviations and acronyms used throughout this report, including the Condensed Consolidated Financial Statements, the Notes to Unaudited Condensed Consolidated Financial Statements and Management’s Discussion and Analysis of Financial Condition and Results of Operations. |
| |
| Term | Definition |
| 2014 Master Policy | Radian Guaranty’s master insurance policy, setting forth the terms and conditions of our mortgage insurance coverage, which became effective October 1, 2014 |
| 2016 Single Premium QSR Agreement | Quota share reinsurance agreement entered into with a panel of third-party reinsurance providers in the first quarter of 2016 and subsequently amended in the fourth quarter of 2017 |
| 2018 Single Premium QSR Agreement | Quota share reinsurance agreement entered into with a panel of third-party reinsurance providers in October 2017 to cede a portion of Single Premium NIW beginning January 1, 2018 |
| 2020 Master Policy | Radian Guaranty’s master insurance policy, setting forth the terms and conditions of our mortgage insurance coverage, which became effective March 1, 2020 |
| 2020 Single Premium QSR Agreement | Quota share reinsurance agreement entered into with a panel of third-party reinsurance providers in January 2020 to cede a portion of Single Premium NIW beginning January 1, 2020 |
| ABS | Asset-backed securities |
Alt-AAll Other | Alternative-A loans, representing loansRadian’s non-reportable operating segments and other business activities, including income (losses) from assets held by our holding company, related general corporate operating expenses not attributable or allocated to our reportable segments and, for whichall periods through the underwriting documentation is generally limited as comparedfirst quarter of 2020 prior to fully documented loans (considered a non-prime loan grade)its sale, income and expenses related to Clayton |
| ASU | Accounting Standards Update, issued by the FASB to communicate changes to GAAP |
| Available Assets | As defined in the PMIERs, assets primarily including the liquid assets of a mortgage insurer, and reduced by premiums received but not yet earned |
Back-endCARES Act | With respect to credit risk transfer programs established by the GSEs, policies writtenCoronavirus Aid, Relief, and Economic Security Act signed into law on loans that are already part of an existing GSE portfolio, as contrasted with loans that are to be purchased by the GSEs in the future |
Borrower | With respect to our securities lending agreements, the third-party institutions to which we loan certain securities in our investment portfolio for short periods of timeMarch 27, 2020 |
| CCF | Conservatorship Capital Framework |
| CFPB | Consumer Financial Protection Bureau |
| Claim Curtailment | Our legal right, under certain conditions, to reduce the amount of a claim, including due to servicer negligence |
| Claim Denial | Our legal right, under certain conditions, to deny a claim |
| Claim Severity | The total claim amount paid divided by the original coverage amount |
| Clayton | Clayton HoldingsServices LLC, aan indirect subsidiary of Radian Group, |
Clayton Intercompany Note | A $300 million note payable from Radian Mortgage Services Inc. (formerly Clayton Group Holdings Inc.) to Radian Group (with terms consistent with the terms of our Senior Notes due 2019 that were used to fund our purchase of Clayton) which was sold on January 21, 2020 |
| CMBS | Commercial mortgage-backed securities |
| COVID-19 | The novel coronavirus disease declared a pandemic by the World Health Organization and the Centers for Disease Control and Prevention in March 2020 |
| Cures | Loans that were in default as of the beginning of a period and are no longer in default because payments were received such that the loan is no longer 60 or more days past due |
| Default to Claim Rate | The percentage of defaulted loans that are assumed to result in a claim |
| Disaster Related Capital Charge | Under the PMIERs, multiplier of 0.30 applied to the required asset amount factor for each non-performing loan: (i) backed by a property located in a FEMA Designated Area and (ii) either subject to a certain forbearance plan or with an initial default date occurring within a certain timeframe |
|
| |
| Term | Definition |
| Discrete Item(s) | For tax calculation purposes, certain items that are required to be accounted for in the provision for income taxes as they occur and are not considered components of the estimated annualized effective tax rate for purposes of reporting interim results. Generally, these are items that are: (i) clearly defined (such as changes in tax rate or tax law); (ii) infrequent or unusual in nature; or (iii) gains or losses that are not components of continuing operating income, such as income from discontinued operations or losses reflected as components of other comprehensive income. These items impact the difference between the statutory rate and Radian’s effective tax rate. |
| Dodd-Frank Act | Dodd-Frank Wall Street Reform and Consumer Protection Act, as amended |
| Eagle Re 2018-1 | Eagle Re 2018-1 Ltd., an unaffiliated special purpose reinsurer (a VIE) domiciled in Bermuda |
| Eagle Re 2019-1 | Eagle Re 2019-1 Ltd., an unaffiliated special purpose reinsurer (a VIE) domiciled in Bermuda |
EnTitle DirectEagle Re 2020-1 | EnTitle Direct Group, Inc.Eagle Re 2020-1 Ltd., a subsidiary of Radian Group, acquiredan unaffiliated special purpose reinsurer (a VIE) domiciled in March 2018Bermuda |
EnTitle InsuranceEagle Re Issuer(s) | EnTitle Insurance Company, an Ohio domiciled insurance subsidiary of EnTitle DirectEagle Re 2018-1, Eagle Re 2019-1 and/or Eagle Re 2020-1 |
| Excess-of-Loss Program | The credit risk protection obtained by Radian Guaranty in November 2018, including: (i) the form of excess-of-loss reinsurance, agreement with Eagle Re 2018-1, in connection with the issuance by Eagle Re 2018-1 of mortgage insurance-linked notes, and (ii) a separate excess-of-loss reinsurance agreement with a third-party reinsurer. Excess-of-loss reinsurance is a type of reinsurance thatwhich indemnifies the ceding company against loss in excess of a specific agreed limit, up to a specified sum. Effective in April 2019, it alsoThe program includes the new credit risk protection obtained through an excess-of-loss reinsurance agreementagreements with Eagle Re 2019-1.2018-1, Eagle Re 2019-1 and Eagle Re 2020-1 in connection with the issuance by the Eagle Re Issuers of mortgage insurance-linked notes in November 2018, April 2019 and February 2020, respectively. The program also includes a separate agreement with a third-party reinsurer, representing a pro rata share of the credit risk alongside the risk assumed by Eagle Re 2018-1. |
| Exchange Act | Securities Exchange Act of 1934, as amended |
| Extraordinary Distribution | A dividend or distribution of capital that is required to be approved by an insurance company’s primary regulator that is greater than would be permitted as an ordinary distribution (which does not require regulatory approval) |
|
| |
Term | Definition |
| Fannie Mae | Federal National Mortgage Association |
| FASB | Financial Accounting Standards Board |
| FEMA | Federal Emergency Management Agency, an agency of the U.S. Department of Homeland Security |
| FEMA Designated Area | Generally, an area that has been subject to a disaster, designated by FEMA as an individual assistance disaster area for the purpose of determining eligibility for various forms of federal assistance |
| FHA | Federal Housing Administration |
| FHFA | Federal Housing Finance Agency |
| FHLB | Federal Home Loan Bank of Pittsburgh |
| FICO | Fair Isaac Corporation (“FICO”) credit scores, for Radian’s portfolio statistics, represent the borrower’s credit score at origination and, in circumstances where there are multiple borrowers, the lowest of the borrowers’ FICO scores is utilized |
Five BridgesFlow Basis | Five Bridges Advisors, LLC. Radian acquiredWith respect to mortgage insurance, includes mortgage insurance policies that are written on an individual loan basis as each loan is originated or on an aggregated basis (in which each individual loan in a group of loans is insured in a single transaction, typically shortly after the assets of Five Bridges in December 2018loans have been originated). Among other items, Flow Basis business excludes Pool Insurance, which we originated prior to 2009. |
| Foreclosure Stage Default | The Stagestage of Default indicating that thedefault of a loan in which a foreclosure sale has been scheduled or held |
| Freddie Mac | Federal Home Loan Mortgage Corporation |
Front-end | With respect to credit risk transfer programs established by the GSEs, policies written on loans that are to be purchased by the GSEs in the future, as contrasted with loans that are already part of an existing GSE portfolio |
| GAAP | Generally accepted accounting principles in the U.S., as amended from time to time |
Green River Capital | Green River Capital LLC, a subsidiary of Clayton |
| GSE(s) | Government-Sponsored Enterprises (Fannie Mae and Freddie Mac) |
| HARP | Home Affordable Refinance Program |
| IBNR | Losses incurred but not reported |
| IIF | Insurance in force, equal to the aggregate unpaid principal balances of the underlying loans |
Independent Settlement Services | Independent Settlement Services, LLC, a subsidiary of Radian Group, acquired in November 2018 |
IRC | Internal Revenue Code of 1986, as amended |
| IRS | Internal Revenue Service |
IRS Matter |
| Our dispute with the IRS that we settled and fully resolved in the second quarter of 2018 that was related to the assessed tax liabilities, penalties and interest from the IRS’s examination of our 2000 through 2007 consolidated federal income tax returns. |
| Term | Definition |
| LAE | Loss adjustment expenses, which include the cost of investigating and adjusting losses and paying claims |
| LIBOR | London Inter-bank Offered Rate |
| Loss Mitigation Activity/Activities | Activities such as Rescissions, Claim Denials, Claim Curtailments and cancellations |
| LTV | Loan-to-value ratio, calculated as the percentage of the original loan amount to the original value of the property |
| Master Policies | The Prior Master Policy, the 2014 Master Policy, and the 20142020 Master Policy, together |
| Minimum Required Assets | A risk-based minimum required asset amount, as defined in the PMIERs, calculated based on net RIF (RIF, net of credits permitted for reinsurance) and a variety of measures related to expected credit performance and other factors |
| Model Act | Mortgage Guaranty Insurance Model Act, as issued by the NAIC to establish minimum capital and surplus requirements for mortgage insurers |
| Monthly and Other Recurring Premiums (or Recurring Premium Policies) | Insurance premiums or policies, respectively, where premiums are paid on a monthly or other installment basis, in contrast to Single Premium Policies |
|
| |
Term | Definition |
Monthly Premium Policies | Insurance policies where premiums are paid on a monthly installment basis |
| Moody’s | Moody’s Investors Service |
Mortgage Insurance | Radian’s mortgage insurance and risk services business segment, which provides credit-related insurance coverage, principally through private mortgage insurance on residential first-lien mortgage loans, as well as other credit risk management solutions to mortgage lending institutions and mortgage credit investors |
| MPP Requirement | Certain states’ statutory or regulatory risk-based capital requirement that the mortgage insurer must maintain a minimum policyholder position, which is calculated based on both risk and surplus levels |
NAIC | National Association of Insurance Commissioners |
| NIW | New insurance written |
| NOL | Net operating loss; for tax purposes, accumulated during years a company reported more tax deductions than taxable income. NOLs may be carried back or carried forward a certain number of years, depending on various factors which can reduce a company’s tax liability. |
| Persistency Rate | The percentage of IIF that remains in force over a period of time |
| PMIERs | Private Mortgage Insurer Eligibility Requirements issued by the GSEs under oversight of the FHFA to set forth requirements an approved insurer must meet and maintain to provide mortgage guaranty insurance on loans acquired by the GSEs |
GSEs. The current PMIERs 1.0 | The original PMIERs effective on December 31, 2015 |
| requirements, sometimes referred to as PMIERs 2.0, | The revised incorporate the most recent revisions to the PMIERs issued by the GSEs on September 27, 2018, whichthat became effective on March 31, 20192019. |
| Pool Insurance | Pool Insurance differs from primary insurance in that our maximum liability is not limited to a specific coverage percentage on an individual mortgage loan. Instead, an aggregate exposure limit, or “stop loss,” and/or deductible is applied to the initial aggregate loan balance on a group or “pool” of mortgages. |
| Prior Master Policy | Radian Guaranty’s master insurance policy, setting forth the terms and conditions of our mortgage insurance coverage, which was in effect prior to the effective date of the 2014 Master Policy |
| QM | A mortgage that possesses certain low-risk characteristics that enable it to qualify for lender protection under the ability to repay rule instituted by the Dodd-Frank Act |
| QSR Program | The quota share reinsurance agreements entered into with a third-party reinsurance provider in the second and fourth quarters of 2012, collectively |
| Radian | Radian Group Inc. together with its consolidated subsidiaries |
| Radian Group | Radian Group Inc. |
| Radian Guaranty | Radian Guaranty Inc., a Pennsylvania domiciled insurance subsidiary of Radian Group |
| Radian Reinsurance | Radian Reinsurance Inc., a Pennsylvania domiciled insurance subsidiary of Radian Group |
|
| |
| Term | Definition |
Radian Settlement ServicesTitle Insurance | Radian Settlement ServicesTitle Insurance Inc., a subsidiary of Clayton, formerly known as ValuAmerica, Inc.EnTitle Insurance Company, an Ohio domiciled insurance company and an indirect subsidiary of Radian Group |
| RBC States | Risk-based capital states, which are those states that currently impose a statutory or regulatory risk-based capital requirement |
Red Bell | Red Bell Real Estate LLC, | Radian’s business segment that is primarily a subsidiary fee-for-service business that offers a broad array of Claytontitle, valuation, asset management and other real estate services to market participants across the real estate value chain |
| Reinstatements | Reversals of previous Rescissions, Claim Denials and Claim Curtailments |
REMIC | Real Estate Mortgage Investment Conduit |
REO | Real estate owned |
| Rescission | Our legal right, under certain conditions, to unilaterally rescind coverage on our mortgage insurance policies if we determine that a loan did not qualify for insurance |
| RIF | Risk in force; for primary insurance, RIF is equal to the underlying loan unpaid principal balance multiplied by the insurance coverage percentage, whereas for Pool Insurance, it represents the remaining exposure under the agreements |
| Risk-to-capital | Under certain state regulations, a maximum ratio of net RIF calculated relative to the level of statutory capital |
| RMBS | Residential mortgage-backed securities |
|
| |
Term | Definition |
| S&P | Standard & Poor’s Financial Services LLC |
SAPPSAP | Statutory accounting principles and practices, including those required or permitted, if applicable, by the insurance departments of the respective states of domicile of our insurance subsidiaries |
| SEC | United States Securities and Exchange Commission |
Senior Notes due 2019 | Our 5.500% unsecured senior notes due June 2019 ($300 million original principal amount) |
Senior Notes due 2020 | Our 5.250% unsecured senior notes due June 2020 ($350 million original principal amount) |
Senior Notes due 2021 | Our 7.000% unsecured senior notes due March 2021 ($350 million original principal amount) |
Senior Notes due 2024 | Our 4.500% unsecured senior notes due October 2024 ($450 million original principal amount) |
ServicesSenior Notes due 2027 | Radian’s Services business segment, which is primarily a fee-for-service business that offers a broad array of mortgage, real estate and title services to market participants across the mortgage and real estate value chainOur 4.875% unsecured senior notes due March 2027 ($450 million original principal amount) |
Single Premium NIW / RIF / IIF | NIW RIF or IIF, respectively, on Single Premium Policies |
| Single Premium Policy / Policies | Insurance policies where premiums are paid in a single payment, which includes policies written on an individual basis (as each loan is originated) and on an aggregated basis (in which each individual loan in a group of loans is insured in a single transaction, typically shortly after the loans have been originated) |
| Single Premium QSR Program | The 2016 Single Premium QSR Agreement, the 2018 Single Premium QSR Agreement and the 20182020 Single Premium QSR Agreement, together |
| Stage of Default | The stage a loan is in relative to the foreclosure process, based on whether a foreclosure sale has been scheduled or held |
| Statutory RBC Requirement | Risk-based capital requirement imposed by the RBC States, requiring a minimum surplus level and, in certain states, a minimum ratio of statutory capital relative to the level of risk |
Surplus NoteNotes | AnCollectively: (i) a $100 million 0.000% intercompany 0.000% surplus note issued by Radian Guaranty to Radian Group, |
Time in Default | The time period from the point due December 31, 2027 and (ii) a loan reaches default status (based on the month the default occurred)$200 million 3.0% intercompany surplus note issued by Radian Guaranty to the current reporting date |
U.S. | The United States of America |
U.S. Treasury | United States Department of the TreasuryRadian Group, due January 31, 2030 |
| VA | U.S. Department of Veterans Affairs |
| VIE | Variable interest entity |
Cautionary Note Regarding Forward-Looking Statements—Safe Harbor Provisions
All statements in this report that address events, developments or results that we expect or anticipate may occur in the future are “forward-looking statements” within the meaning of Section 27A of the Securities Act of 1933, Section 21E of the Exchange Act and the U.S. Private Securities Litigation Reform Act of 1995. In most cases, forward-looking statements may be identified by words such as “anticipate,” “may,” “will,” “could,” “should,” “would,” “expect,” “intend,” “plan,” “goal,” “contemplate,” “believe,” “estimate,” “predict,” “project,” “potential,” “continue,” “seek,” “strategy,” “future,” “likely” or the negative or other variations on these words and other similar expressions. These statements, which may include, without limitation, projections regarding our future performance and financial condition, are made on the basis of management’s current views and assumptions with respect to future events.events, including management’s current views regarding the likely impacts of the COVID-19 pandemic. Any forward-looking statement is not a guarantee of future performance and actual results could differ materially from those contained in the forward-looking statement. These statements speak only as of the date they were made, and we undertake no obligation to update or revise any forward-looking statements, whether as a result of new information, future events or otherwise. We operate in a changing environment where new risks emerge from time to time and it is not possible for us to predict all risks that may affect us.us, particularly those associated with the COVID 19 pandemic, which has had wide-ranging and rapidly changing effects. The forward-looking statements, as well as our prospects as a whole, are subject to risks and uncertainties that could cause actual results to differ materially from those set forth in the forward-looking statements. These risks and uncertainties include, without limitation:
| |
| • | The COVID-19 pandemic has significantly impacted the global economy, disrupted global supply chains, lowered equity market valuations, created significant volatility and disruption in financial markets, disrupted the housing finance system and real estate markets and increased unemployment levels. In addition, the pandemic has resulted in temporary closures of many businesses and the institution of social distancing and sheltering in place requirements in most states and communities in the United States. As a result, the demand for certain of our products and services has been impacted, and this impact may continue for an unknown period and could expand in scope. We expect that the COVID-19 pandemic and measures taken to reduce its spread will pervasively impact our business and subject us to certain risks, including those discussed in “Item 1A. Risk Factors—The COVID-19 pandemic has adversely impacted our business, and its ultimate impact on our business and financial results will depend on future developments, which are highly uncertain and cannot be predicted, including the scope and duration of the pandemic and actions taken by governmental authorities in response to the pandemic” and the other risk factors in this report. |
further changes in economic and political conditions, including those resulting from COVID-19, that impact the size of the insurable market, the credit performance of our insured portfolio, and our business prospects;
changes in the way customers, investors, ratings agencies, regulators or legislators perceive our performance, financial strength and future prospects;
Radian Guaranty’s ability to remain eligible under the PMIERs, including potential future changes to the PMIERs, and other applicable requirements imposed by the FHFA and by the GSEs to insure loans purchased by the GSEs, including potential future changes to the PMIERs which, among other things, may be impacted by the general economic environment and housing market, as well as GSEs;
the proposed CCF that would establish capital requirements for the GSEs ifonce finalized, which could form the CCF is finalized;basis for future versions of the PMIERs;
our ability to successfully execute and implement our capital plans, including our risk distribution strategy through the capital markets and reinsurance markets, and to maintain sufficient holding company liquidity to meet our short- and long-term liquidity needs;
our ability to successfully execute and implement our business plans and strategies, including plans and strategies to reposition and grow our Services segment as well as plans and strategies that require GSE and/or regulatory approvals and licenses;various licenses and complex compliance requirements;
our ability to maintain an adequate level of capital in our insurance subsidiaries to satisfy existing and future state regulatory requirements;requirements, including the PMIERs and any changes thereto, as discussed above, and potential changes to the Model Act currently under consideration;
changes in the charters or business practices of, or rules or regulations imposed by or applicable to, the GSEs, which may include changes in the requirements to remain an approved insurer to the GSEs, the GSEs’ interpretation and application of the PMIERs, as well as changes impacting loans purchased by the GSEs, such asincluding changes to the GSEs’ requirements regarding mortgage credit and loan size andbusiness practices in response to the GSEs’ pricing;COVID-19 pandemic;
changes in the current housing finance system in the U.S.,United States, including the role of the FHA, the GSEs and private mortgage insurers in this system;
uncertainty from the expected discontinuance of LIBOR and transition to one or more alternative benchmarks that could cause interest rate volatility and, among other things, impact our investment portfolio, cost of debt and cost of reinsurance through mortgage insurance-linked notes transactions;
any disruption in the servicing of mortgages covered by our insurance policies, as well as poor servicer performance;performance, which could result from the significant financial and operational challenges many servicers are facing due to the impact of the COVID-19 pandemic;
a decrease in the Persistency Rates of our mortgage insurance on monthly premium products;
competition in our mortgage insurance business, including price competition and competition from the FHA and VA as well as from other forms of credit enhancement, including GSE sponsoredGSE-sponsored alternatives to traditional mortgage insurance;
the effect of the Dodd-Frank Act on the financial services industry in general, and on our businesses in particular, including future changes to the Qualified Mortgage (QM)QM loan requirements;requirements which currently are being considered by the CFPB;
legislative and regulatory activity (or inactivity), including the adoption of (or failure to adopt) new laws and regulations, or changes in existing laws and regulations, or the way they are interpreted or applied;applied, including the enactment of the CARES Act and the adoption, interpretation or application of laws and regulations in response to COVID-19;
legal and regulatory claims, assertions, actions, reviews, audits, inquiries and investigations that could result in adverse judgments, settlements, fines, injunctions, restitutions or other relief that could require significant expenditures, new or increased reserves or have other effects on our business;
the amount and timing of potential settlements, payments or adjustments associated with federal or other tax examinations;
the possibility that we may fail to estimate accurately, especially in the event of an extended economic downturn or a period of extreme market volatility and uncertainty such as we are currently experiencing due to the COVID-19 pandemic, the likelihood, magnitude and timing of losses in establishing loss reserves for our mortgage insurance business or to accurately calculate and/or project our Available Assets and Minimum Required Assets under the PMIERs, which will be impacted by, among other things, the size and mix of our IIF, the level of defaults in our portfolio, the level of cash flow generated by our insurance operations and our risk distribution strategies;
volatility in our financial results caused by changes in the fair value of our assets and liabilities, including our investment portfolio;
potential future impairment charges related to our goodwill and other acquired intangible assets;
changes in GAAP or SAPPSAP rules and guidance, or their interpretation;
our ability to attract and retain key employees; and
legal and other limitations on amounts we may receive from our subsidiaries, including dividends or ordinary course distributions under our internal tax- and expense-sharing arrangements.
For more information regarding these risks and uncertainties as well as certain additional risks that we face, you should refer to the“Item 1A. Risk Factors detailedFactors” in Item 1A ofthis report and “Item 1A. Risk Factors” in our Annual Report on Form 10-K for the year ended December 31, 2018,2019, and to subsequent reports and registration statements filed from time to time with the SEC. We caution you not to place undue reliance on these forward-looking statements, which are current only as of the date on which we issued this report. We do not intend to, and we disclaim any duty or obligation to, update or revise any forward-looking statements to reflect new information or future events or for any other reason.
PART I—FINANCIAL INFORMATION
Item 1. Financial Statements (Unaudited)
Radian Group Inc.
CONDENSED CONSOLIDATED BALANCE SHEETS (UNAUDITED) | | | ($ in thousands, except per-share amounts) | March 31,
2019 | | December 31,
2018 | March 31,
2020 | | December 31,
2019 |
| | | | | | | |
| Assets | | | | | | |
| Investments (Note 5) | | | | |
| Fixed-maturities available for sale—at fair value (amortized cost $3,875,919 and $4,098,962) | $ | 3,897,584 |
| | $ | 4,021,575 |
| |
| Trading securities—at fair value | 383,992 |
| | 469,071 |
| |
| Equity securities—at fair value (cost of $125,153 and $139,377) | 125,025 |
| | 130,565 |
| |
| Short-term investments—at fair value (includes $6,233 and $11,699 of reinvested cash collateral held under securities lending agreements) | 1,066,110 |
| | 528,403 |
| |
| Investments (Notes 4 and 5) | | | | |
| Fixed-maturities available for sale—at fair value (amortized cost of $4,564,616 and $4,549,534) | | $ | 4,603,613 |
| | $ | 4,688,911 |
|
| Trading securities—at fair value (amortized cost of $270,551 and $297,505) | | 287,270 |
| | 317,150 |
|
| Equity securities—at fair value (cost of $86,456 and $125,311) | | 74,853 |
| | 130,221 |
|
| Short-term investments—at fair value (includes $14,808 and $25,561 of reinvested cash collateral held under securities lending agreements) | | 638,760 |
| | 518,393 |
|
| Other invested assets—at fair value | 3,059 |
| | 3,415 |
| 4,131 |
| | 4,072 |
|
| Total investments | 5,475,770 |
| | 5,153,029 |
| 5,608,627 |
| | 5,658,747 |
|
| Cash | 118,668 |
| | 95,393 |
| 54,108 |
| | 92,729 |
|
| Restricted cash | 9,086 |
| | 11,609 |
| 7,817 |
| | 3,545 |
|
| Accounts and notes receivable | 89,237 |
| | 78,652 |
| 123,381 |
| | 93,630 |
|
| Deferred income taxes, net (Note 9) | 67,697 |
| | 131,643 |
| |
| Goodwill and other acquired intangible assets, net (Note 6) | 56,811 |
| | 58,998 |
| 27,208 |
| | 28,187 |
|
| Prepaid reinsurance premium | 408,622 |
| | 417,628 |
| 356,104 |
| | 363,856 |
|
| Other assets (Note 8) | 373,678 |
| | 367,700 |
| 513,187 |
| | 567,619 |
|
| Total assets | $ | 6,599,569 |
| | $ | 6,314,652 |
| $ | 6,690,432 |
| | $ | 6,808,313 |
|
| | | | | | | |
| Liabilities and Stockholders’ Equity | | | | | | |
| Unearned premiums | $ | 720,159 |
| | $ | 739,357 |
| $ | 605,045 |
| | $ | 626,822 |
|
| Reserve for losses and loss adjustment expense (Note 10) | 388,784 |
| | 401,361 |
| 418,202 |
| | 404,765 |
|
| Senior notes (Note 11) | 1,031,197 |
| | 1,030,348 |
| 887,584 |
| | 887,110 |
|
| FHLB advances (Note 11) | | 173,760 |
| | 134,875 |
|
| Reinsurance funds withheld | 329,868 |
| | 321,212 |
| 302,551 |
| | 291,829 |
|
| Other liabilities (Note 12) | 419,470 |
| | 333,659 |
| |
| Other liabilities | | 438,782 |
| | 414,189 |
|
| Total liabilities | 2,889,478 |
| | 2,825,937 |
| 2,825,924 |
| | 2,759,590 |
|
| Commitments and contingencies (Note 13) |
| |
| |
| Commitments and contingencies (Note 12) | |
| |
|
| Stockholders’ equity | | | | | | |
| Common stock: par value $0.001 per share; 485,000 shares authorized at March 31, 2019 and December 31, 2018; 229,817 and 231,132 shares issued at March 31, 2019 and December 31, 2018, respectively; 212,136 and 213,473 shares outstanding at March 31, 2019 and December 31, 2018, respectively | 230 |
| | 231 |
| |
| Treasury stock, at cost: 17,681 and 17,660 shares at March 31, 2019 and December 31, 2018, respectively | (895,321 | ) | | (894,870 | ) | |
| Common stock: par value $0.001 per share; 485,000 shares authorized at March 31, 2020 and December 31, 2019; 208,364 and 219,123 shares issued at March 31, 2020 and December 31, 2019, respectively; 190,387 and 201,164 shares outstanding at March 31, 2020 and December 31, 2019, respectively | | 208 |
| | 219 |
|
| Treasury stock, at cost: 17,977 and 17,959 shares at March 31, 2020 and December 31, 2019, respectively | | (902,024 | ) | | (901,657 | ) |
| Additional paid-in capital | 2,697,724 |
| | 2,724,733 |
| 2,231,670 |
| | 2,449,884 |
|
| Retained earnings | 1,889,964 |
| | 1,719,541 |
| 2,504,853 |
| | 2,389,789 |
|
| Accumulated other comprehensive income (loss) (Note 15) | 17,494 |
| | (60,920 | ) | |
| Accumulated other comprehensive income (loss) (Note 14) | | 29,801 |
| | 110,488 |
|
| Total stockholders’ equity | 3,710,091 |
| | 3,488,715 |
| 3,864,508 |
| | 4,048,723 |
|
| Total liabilities and stockholders’ equity | $ | 6,599,569 |
| | $ | 6,314,652 |
| $ | 6,690,432 |
| | $ | 6,808,313 |
|
See Notes to Unaudited Condensed Consolidated Financial Statements.
Radian Group Inc.
CONDENSED CONSOLIDATED STATEMENTS OF OPERATIONS (UNAUDITED)
| | | | Three Months Ended
March 31, | Three Months Ended
March 31, |
| (In thousands, except per-share amounts) | 2019 |
| 2018 | 2020 |
| 2019 |
| Revenues: | | | | | | |
| Net premiums earned—insurance | $ | 263,512 |
|
| $ | 242,550 |
| |
| Services revenue | 32,753 |
|
| 33,164 |
| |
| Net premiums earned—insurance (Note 7) | | $ | 277,415 |
|
| $ | 263,512 |
|
| Services revenue (Note 3) | | 31,927 |
|
| 32,753 |
|
| Net investment income | 43,847 |
| | 33,956 |
| 40,944 |
| | 43,847 |
|
| Net gains (losses) on investments and other financial instruments | 21,913 |
| | (18,887 | ) | (22,027 | ) | | 21,913 |
|
| Other income | 1,604 |
| | 807 |
| 822 |
| | 1,604 |
|
| Total revenues | 363,629 |
| | 291,590 |
| 329,081 |
| | 363,629 |
|
| Expenses: | | | | | | |
| Provision for losses | 20,754 |
| | 37,283 |
| 35,951 |
| | 20,754 |
|
| Policy acquisition costs | 5,893 |
| | 7,117 |
| 7,413 |
| | 5,893 |
|
| Cost of services | 24,157 |
| | 23,126 |
| 22,141 |
| | 24,157 |
|
| Other operating expenses | 78,805 |
| | 63,243 |
| 69,110 |
| | 78,805 |
|
| Restructuring and other exit costs | — |
| | 551 |
| |
| Interest expense | 15,697 |
| | 15,080 |
| 12,194 |
| | 15,697 |
|
| Amortization and impairment of other acquired intangible assets | 2,187 |
|
| 2,748 |
| 979 |
|
| 2,187 |
|
| Total expenses | 147,493 |
| | 149,148 |
| 147,788 |
| | 147,493 |
|
| Pretax income | 216,136 |
|
| 142,442 |
| 181,293 |
|
| 216,136 |
|
| Income tax provision | 45,179 |
| | 27,956 |
| 40,832 |
| | 45,179 |
|
| Net income | $ | 170,957 |
|
| $ | 114,486 |
| $ | 140,461 |
|
| $ | 170,957 |
|
| | | | | | | |
| Net income per share: | | | | |
| Net Income Per Share: | | | | |
| Basic | $ | 0.80 |
| | $ | 0.53 |
| $ | 0.70 |
| | $ | 0.80 |
|
| Diluted | $ | 0.78 |
| | $ | 0.52 |
| $ | 0.70 |
| | $ | 0.78 |
|
| | | |
|
| | |
|
|
| Weighted-average number of common shares outstanding—basic | 213,537 |
| | 215,967 |
| 200,161 |
| | 213,537 |
|
| Weighted-average number of common and common equivalent shares outstanding—diluted | 218,343 |
| | 219,883 |
| 201,819 |
| | 218,343 |
|
See Notes to Unaudited Condensed Consolidated Financial Statements.
Radian Group Inc.
CONDENSED CONSOLIDATED STATEMENTS OF COMPREHENSIVE INCOME (LOSS) (UNAUDITED)
| | | | Three Months Ended
March 31, | Three Months Ended
March 31, |
| (In thousands) | 2019 | | 2018 | 2020 | | 2019 |
| | | | | | | |
| Net income | $ | 170,957 |
| | $ | 114,486 |
| $ | 140,461 |
| | $ | 170,957 |
|
| Other comprehensive income (loss), net of tax (Note 15): | | | | |
| Other comprehensive income (loss), net of tax (Note 14): | | | | |
| Unrealized gains (losses) on investments: | | | | | | |
| Unrealized holding gains (losses) arising during the period | 78,023 |
| | (60,643 | ) | (72,293 | ) | | 78,023 |
|
| Less: Reclassification adjustment for net gains (losses) included in net income | (391 | ) | | (3,132 | ) | 8,394 |
| | (391 | ) |
| Net unrealized gains (losses) on investments | 78,414 |
| | (57,511 | ) | (80,687 | ) | | 78,414 |
|
| Unrealized foreign currency translation adjustments | — |
| | 3 |
| |
| Other comprehensive income (loss), net of tax | 78,414 |
| | (57,508 | ) | (80,687 | ) | | 78,414 |
|
| Comprehensive income | $ | 249,371 |
| | $ | 56,978 |
| $ | 59,774 |
| | $ | 249,371 |
|
See Notes to Unaudited Condensed Consolidated Financial Statements.
Radian Group Inc.
CONDENSED CONSOLIDATED STATEMENTS OF CHANGES IN COMMON STOCKHOLDERS’ EQUITY (UNAUDITED)
| | | | Three Months Ended
March 31, | Three Months Ended
March 31, |
| (In thousands) | 2019 | | 2018 | 2020 | | 2019 |
| Common Stock | | | | | | |
| Balance, beginning of period | $ | 231 |
| | $ | 233 |
| $ | 219 |
| | $ | 231 |
|
| Shares repurchased under share repurchase program (Note 14) | (1 | ) | | — |
| |
| Shares repurchased under share repurchase program (Note 13) | | (11 | ) | | (1 | ) |
| Balance, end of period | 230 |
| | 233 |
| 208 |
| | 230 |
|
| | | | | | | |
| Treasury Stock | | | | | | |
| Balance, beginning of period | (894,870 | ) | | (893,888 | ) | (901,657 | ) | | (894,870 | ) |
| Repurchases of common stock under incentive plans | (451 | ) | | (303 | ) | (367 | ) | | (451 | ) |
| Balance, end of period | (895,321 | ) | | (894,191 | ) | (902,024 | ) | | (895,321 | ) |
| | | | | | | |
| Additional Paid-in Capital | | | | | | |
| Balance, beginning of period | 2,724,733 |
| | 2,754,275 |
| 2,449,884 |
| | 2,724,733 |
|
| Issuance of common stock under incentive and benefit plans | 1,069 |
| | 1,433 |
| 2,235 |
| | 1,069 |
|
| Share-based compensation | 3,695 |
| | 2,528 |
| 5,845 |
| | 3,695 |
|
| Shares repurchased under share repurchase program (Note 14) | (31,773 | ) | | (10,003 | ) | |
| Shares repurchased under share repurchase program (Note 13) | | (226,294 | ) | | (31,773 | ) |
| Balance, end of period | 2,697,724 |
| | 2,748,233 |
| 2,231,670 |
| | 2,697,724 |
|
| | | | | | | |
| Retained Earnings | | | | | | |
| Balance, beginning of period | 1,719,541 |
| | 1,116,333 |
| 2,389,789 |
| | 1,719,541 |
|
| Net income | 170,957 |
| | 114,486 |
| 140,461 |
| | 170,957 |
|
| Dividends declared | (534 | ) | | (540 | ) | |
| Cumulative effect of adopting the accounting standard update for financial instruments | — |
| | 2,061 |
| |
| Cumulative effect of adopting the accounting standard update for the reclassification of certain tax effects from accumulated other comprehensive income | — |
| | (2,724 | ) | |
| Dividends and dividend equivalents declared | | (25,397 | ) | | (534 | ) |
| Balance, end of period | 1,889,964 |
| | 1,229,616 |
| 2,504,853 |
| | 1,889,964 |
|
| | | | | | | |
| Accumulated Other Comprehensive Income (Loss) | | | | | | |
| Balance, beginning of period | (60,920 | ) | | 23,085 |
| 110,488 |
| | (60,920 | ) |
| Cumulative effect of adopting the accounting standard update for financial instruments | — |
| | 224 |
| |
| Cumulative effect of adopting the accounting standard update for the reclassification of certain tax effects from accumulated other comprehensive income | — |
| | 2,724 |
| |
| Net unrealized gains (losses) on investments, net of tax | 78,414 |
| | (57,511 | ) | (80,687 | ) | | 78,414 |
|
| Net foreign currency translation adjustment, net of tax | — |
| | 3 |
| |
| Balance, end of period | 17,494 |
| | (31,475 | ) | 29,801 |
| | 17,494 |
|
| | | | | | | |
| Total Stockholders’ Equity | $ | 3,710,091 |
| | $ | 3,052,416 |
| $ | 3,864,508 |
| | $ | 3,710,091 |
|
See Notes to Unaudited Condensed Consolidated Financial Statements.
| | Radian Group Inc. | CONDENSED CONSOLIDATED STATEMENTS OF CASH FLOWS (UNAUDITED) | | | | | | | | |
| (In thousands) | Three Months Ended
March 31, | Three Months Ended
March 31, |
| 2019 | | 2018 | 2020 | | 2019 |
| Cash flows from operating activities: | | | | |
| Cash Flows from Operating Activities: | | | | |
| Net cash provided by (used in) operating activities | $ | 217,778 |
| | $ | 118,447 |
| $ | 155,800 |
| | $ | 217,778 |
|
| Cash flows from investing activities: | | | | |
| Cash Flows from Investing Activities: | | | | |
| Proceeds from sales of: | | | | | | |
| Fixed-maturity investments available for sale | 435,709 |
| | 224,597 |
| |
| Fixed-maturities available for sale | | 533,019 |
| | 435,709 |
|
| Trading securities | 70,083 |
| | 11,964 |
| 9,936 |
| | 70,083 |
|
| Equity securities | 33,278 |
| | 55,795 |
| 59,339 |
| | 33,278 |
|
| Proceeds from redemptions of: | | | | | | |
| Fixed-maturity investments available for sale | 79,915 |
| | 94,356 |
| |
| Fixed-maturities available for sale | | 151,559 |
| | 79,915 |
|
| Trading securities | 23,293 |
| | 17,890 |
| 16,427 |
| | 23,293 |
|
| Purchases of: | | | | | | |
| Fixed-maturity investments available for sale | (275,531 | ) | | (482,260 | ) | |
| Fixed-maturities available for sale | | (619,024 | ) | | (275,531 | ) |
| Equity securities | (19,767 | ) | | (19,994 | ) | (60,309 | ) | | (19,767 | ) |
| Sales, redemptions and (purchases) of: | | | | | | |
| Short-term investments, net | (526,013 | ) | | (17,217 | ) | (72,220 | ) | | (526,013 | ) |
| Other assets and other invested assets, net | 349 |
| | 92 |
| 2,347 |
| | 349 |
|
| Proceeds from sale of a subsidiary, net of cash sold | | 15,869 |
| | — |
|
| Purchases of property and equipment, net | (6,659 | ) | | (4,702 | ) | (4,950 | ) | | (6,659 | ) |
| Acquisitions, net of cash acquired | — |
| | (261 | ) | |
| Net cash provided by (used in) investing activities | (185,343 | ) | | (119,740 | ) | 31,993 |
| | (185,343 | ) |
| Cash flows from financing activities: | | | | |
| Dividends paid | (534 | ) | | (540 | ) | |
| Cash Flows from Financing Activities: | | | | |
| Dividends and dividend equivalents paid | | (25,138 | ) | | (534 | ) |
| Issuance of common stock | 363 |
| | 663 |
| 1,447 |
| | 363 |
|
| Purchase of common shares | (31,774 | ) | | (10,003 | ) | |
| Repurchases of common shares | | (226,305 | ) | | (31,774 | ) |
| Credit facility commitment fees paid | (234 | ) | | (185 | ) | (237 | ) | | (234 | ) |
| Change in secured borrowings, net (with terms less than 3 months) | 21,534 |
| | 38,719 |
| |
| Change in secured borrowings, net (with terms 3 months or less) | | (2,854 | ) | | 21,534 |
|
| Proceeds from secured borrowings (with terms greater than 3 months) | 6,000 |
| | 6,550 |
| 59,995 |
| | 6,000 |
|
| Payments of secured borrowings (with terms greater than 3 months) | (7,000 | ) | | — |
| |
| Repayment of other borrowings | (38 | ) | | (50 | ) | |
| Repayments of secured borrowings (with terms greater than 3 months) | | (29,011 | ) | | (7,000 | ) |
| Repayments of other borrowings | | (39 | ) | | (38 | ) |
| Net cash provided by (used in) financing activities | (11,683 | ) | | 35,154 |
| (222,142 | ) | | (11,683 | ) |
| Effect of exchange rate changes on cash and restricted cash | — |
| | (1 | ) | |
| Increase (decrease) in cash and restricted cash | 20,752 |
| | 33,860 |
| (34,349 | ) | | 20,752 |
|
| Cash and restricted cash, beginning of period | 107,002 |
| | 96,244 |
| 96,274 |
| | 107,002 |
|
| Cash and restricted cash, end of period | $ | 127,754 |
| | $ | 130,104 |
| $ | 61,925 |
| | $ | 127,754 |
|
See Notes to Unaudited Condensed Consolidated Financial Statements.
Radian Group Inc.
Notes to Unaudited Condensed Consolidated Financial Statements
1. Condensed Consolidated Financial Statements—Business Overview, Recent Developments and Significant Accounting Policies
Business Overview
We are a diversified mortgage and real estate services business, providing both credit-related mortgage insurance coverage and other credit risk management solutions, as well as a broad array of other mortgage, risk, title, valuation, asset management and other real estate and title services. We have two2 reportable business segments—Mortgage Insurance and Services.Real Estate.
Mortgage Insurance
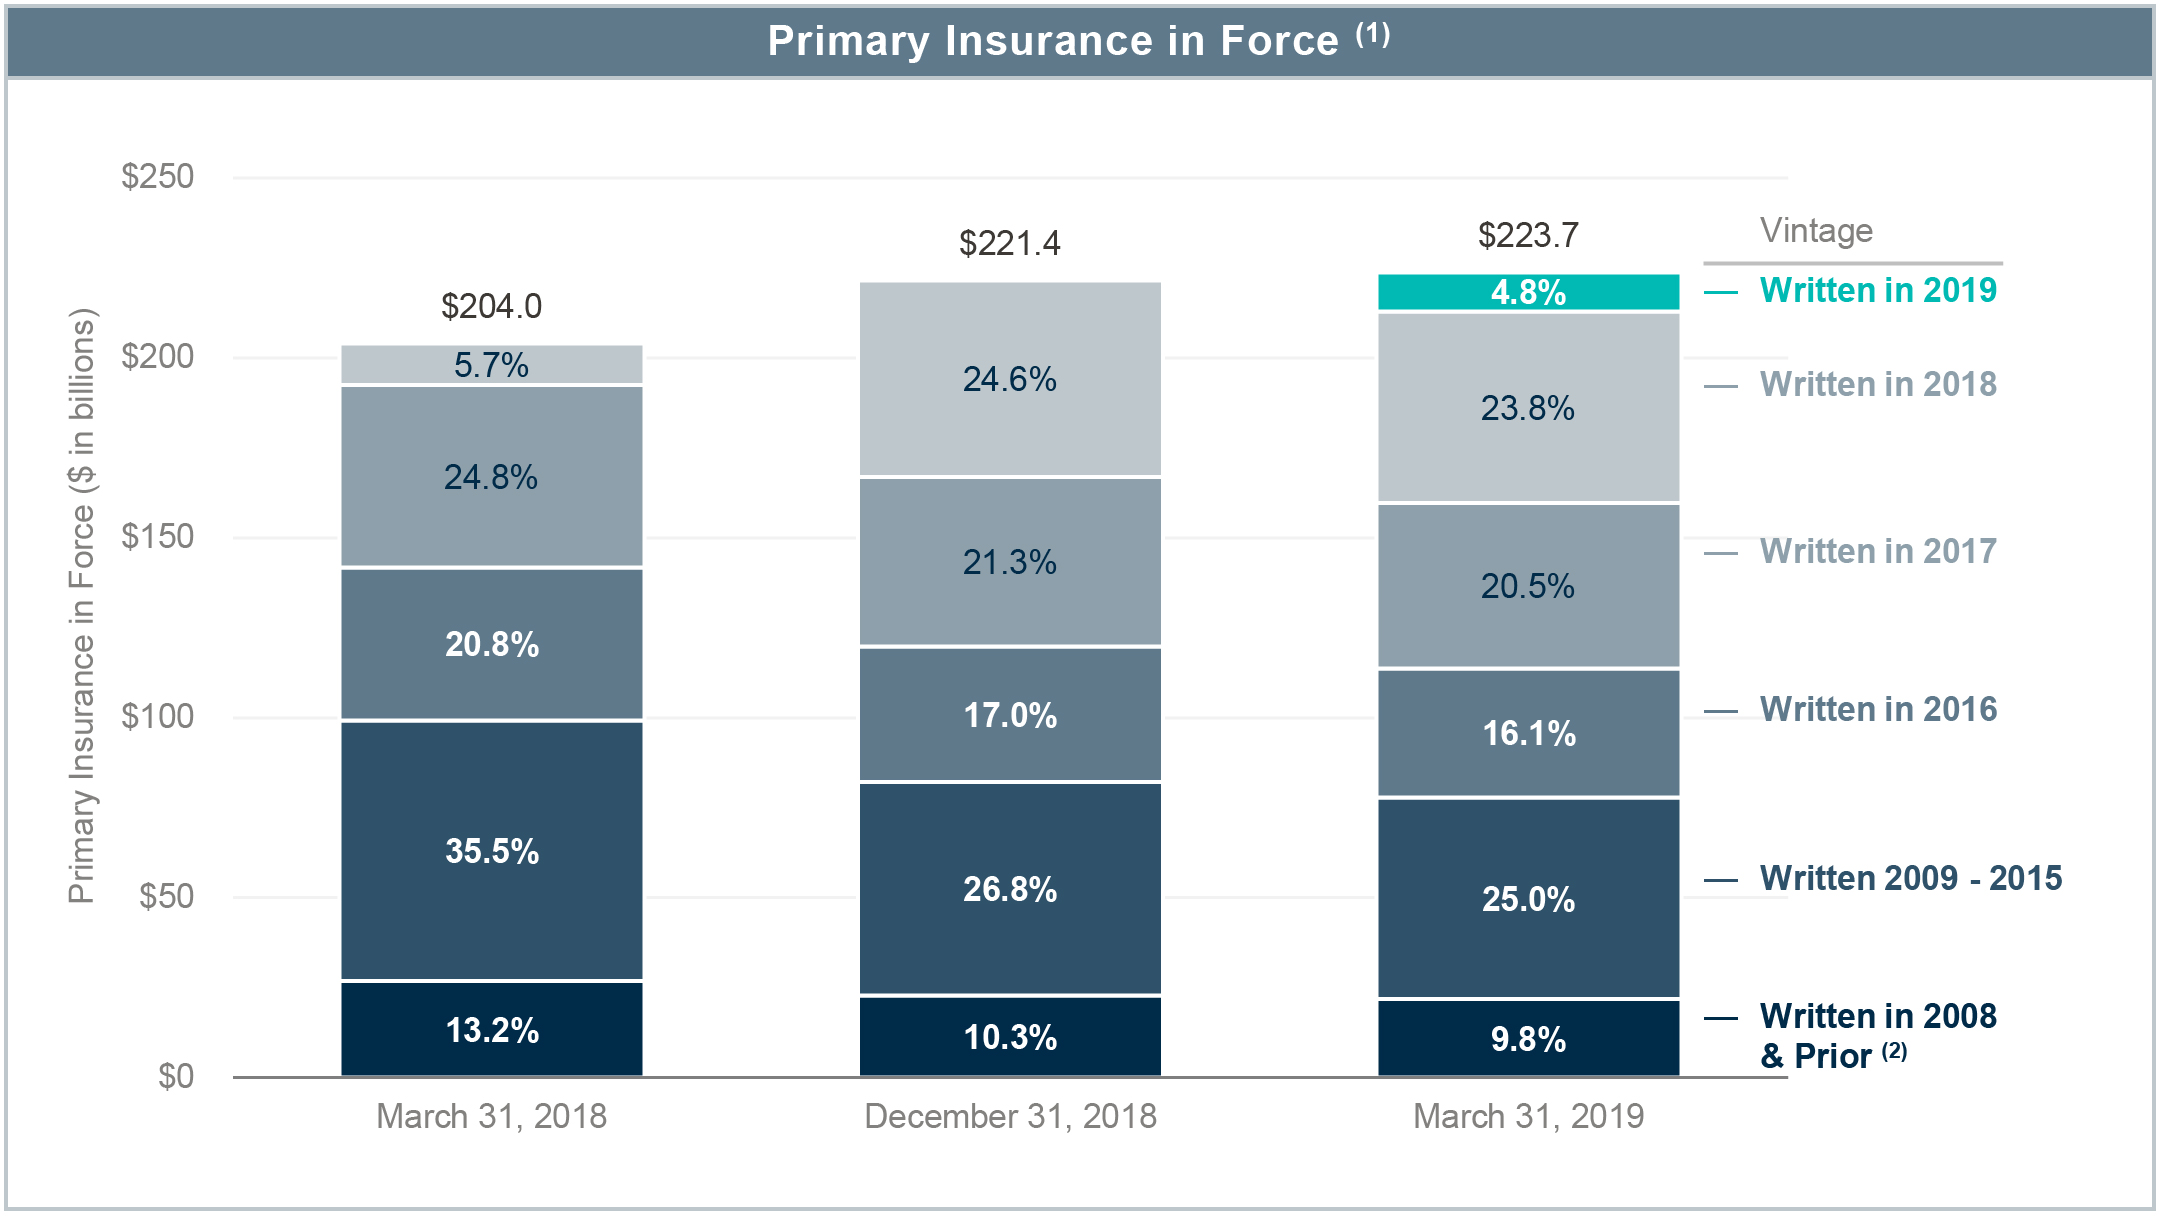
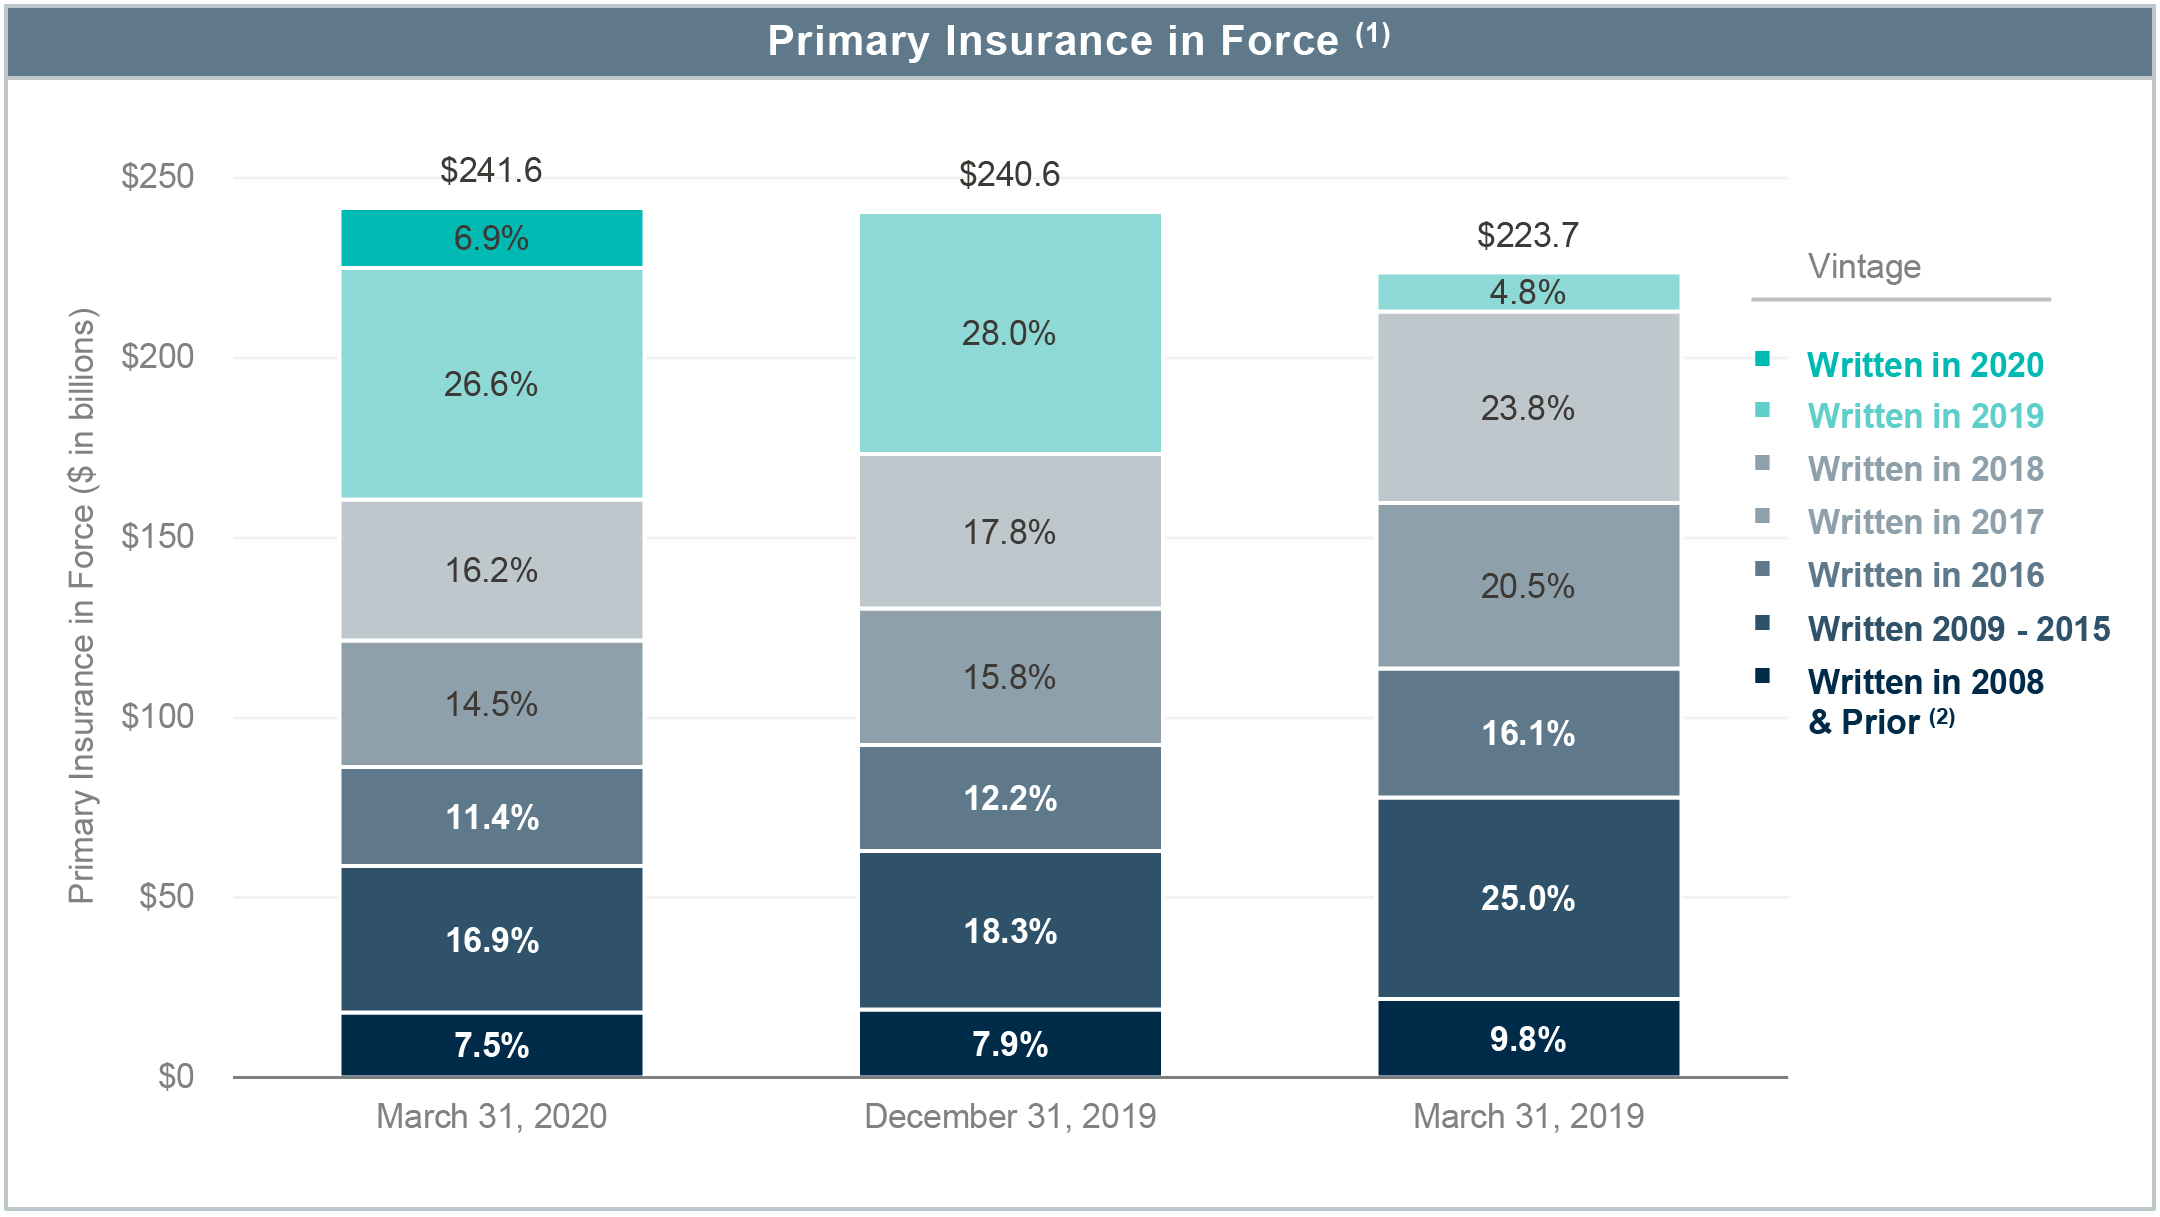
Our Mortgage Insurance segment provides credit-related insurance coverage, principally through private mortgage insurance on residential first-lien mortgage loans, as well as other credit risk management and contract underwriting solutions, to mortgage lending institutions and mortgage credit investors. We provide our mortgage insurance products and services mainly through our wholly-owned subsidiary, Radian Guaranty. Private mortgage insurance plays an important role in the U.S. housing finance system because it promotes affordable home ownership and helps protect mortgage lenders, investors and other beneficiaries by mitigating default-related losses on residential mortgage loans. Generally, these loans are made to home buyershomebuyers who make down payments of less than 20% of the purchase price for their home or, in the case of refinancings, have less than 20% equity in their home. Private mortgage insurance also facilitates the sale of these low down payment loans in the secondary mortgage market, most of which are currently sold to the GSEs. Our total direct primary mortgage insuranceIIF and RIF was $57.4were $241.6 billion and $60.9 billion, respectively, as of March 31, 2020. In addition to providing private mortgage insurance, we participate in credit risk transfer programs developed by the GSEs as part of their initiative to distribute mortgage credit risk and increase the role of private capital in the mortgage market. Our additional RIF under credit risk transfer transactions, resulting from our participation in these programs with the GSEs, totaled $332.8 million as of March 31, 2020 compared to $275.2 million as of December 31, 2019.
The GSEs and state insurance regulators impose various capital and financial requirements on our insurance subsidiaries. These include Risk-to-capital, other risk-based capital measures and surplus requirements, as well as the PMIERs financial requirements discussed below.requirements. Failure to comply with these capital and financial requirements may limit the amount of insurance that our mortgage insurance subsidiaries may write or may prohibit our mortgage insurance subsidiariesthem from writing insurance altogether. The GSEs and state insurance regulators also possess significant discretion with respect to our mortgage insurance subsidiaries and all aspects of their business. See Note 1615 for additional information on PMIERs and other regulatory information.
PMIERs. In order to be eligible to insure loans purchasedinformation, and “—Recent Developments” below for a discussion of the elevated risks posed by the GSEs,COVID-19 pandemic, which we expect will lead to an increase in mortgage insurers such as Radian Guaranty must meet the GSEs’ eligibility requirements, or PMIERs. At March 31, 2019, Radian Guaranty is an approved mortgage insurer under the PMIERsdefaults in our insured portfolio and isa resulting increase in compliance with the current PMIERs financial requirements. The PMIERs financial requirements require that a mortgage insurer’s Available Assets meet or exceed itsour Minimum Required Assets. The GSEs may amend the PMIERs at any time, and they have broad discretion to interpret the requirements, which could impact the calculation of Radian Guaranty’s Available Assets and/or Minimum Required Assets.
The PMIERs are comprehensive, covering virtually all aspects of the business and operations of a private mortgage insurer, including internal risk management and quality controls, the relationship between the GSEs and the approved insurer, as well as the approved insurer’s financial condition. In addition, the GSEs have a broad range of consent rights under the PMIERs and require private mortgage insurers to obtain the prior consent of the GSEs before taking certain actions, which may include entering into various intercompany agreements and commuting or reinsuring risk, among others. If Radian Guaranty is unable to satisfy the requirements set forth in the PMIERs, the GSEs could restrict it from conducting certain types of business with them or take actions that may include not purchasing loans insured by Radian Guaranty.
From time to time, we enter into reinsurance transactions as a component of our long-term risk distribution strategy to manage our capital position and risk profile, which includes managing Radian Guaranty’s capital position under the PMIERs financial requirements. The credit that we receive under the PMIERs financial requirements for these transactions is subject to initial and ongoing review by the GSEs.
ServicesReal Estate
Our ServicesReal Estate segment is primarily a fee-for-service business that offers a broad array of services to market participants across the mortgage and real estate value chain. Our real estate services include title, valuation, asset management and other real estate services offered primarily to financial institutions, investors, GSEs, real estate brokers and agents. Our real estate services help lenders, investors, consumers and real estate agents evaluate, manage, monitor, acquire and sell properties. These services comprise mortgageinclude software as a service solutions and platforms, as well as managed services, such as REO asset management, single family rental services, real estate valuation services and title services, including technology and turn-key solutions, that provide information and other resources used to originate, evaluate, acquire, securitize, service and monitor residential real estate and loans secured by residential real estate. These services are primarily provided to mortgage lenders, financial institutions, investors and government entities.brokerage services. In addition, we provide title insurance and non-insurance title, closing and settlement services to mortgage lenders as well as directly to borrowers.consumers for residential mortgage loans.
See Note 3 for additional information about our reportable segments and All Other business activities, including the sale of Clayton and the impact of organizational changes in the first quarter of 2020.
Recent Developments
As a seller of mortgage credit protection, our results are subject to macroeconomic conditions and specific events that impact the housing finance and real estate markets, including events that impact mortgage originations and the credit performance of our RIF. Many of these conditions are beyond our control, including housing prices, unemployment levels, interest rate changes, the availability of credit and other factors that may be derived from national and regional economic conditions. In general, a deterioration in economic conditions increases the likelihood that borrowers will be unable to satisfy their mortgage obligations. A deteriorating economy can adversely affect housing values, which in turn can influence the willingness of borrowers to continue to make mortgage payments regardless of whether they have the financial resources to do
Radian Group Inc.
Notes to Unaudited Condensed Consolidated Financial Statements (Continued)
Ourso. Mortgage defaults can also occur due to a variety of specific events affecting borrowers, including death or illness, divorce or other family problems, unemployment, or other events. In addition, factors impacting regional economic conditions, acts of terrorism, war or other severe conflicts, event-specific economic depressions or other catastrophic events such as natural disasters and pandemics could result in increased defaults due to the impact of such events on the ability of borrowers to satisfy their mortgage services help loan originatorsobligations and investors evaluate, acquire, surveilon the value of affected homes.
Due to the unprecedented and securitize mortgages. These services include loan review, RMBS securitizationrapidly changing social and distressed asset reviews, revieweconomic impacts associated with the COVID-19 pandemic on the U.S. and valuation services related to single family rental properties, servicerglobal economies generally, and loan surveillance and underwriting. Ourin particular on the U.S. housing, real estate services help lenders, investors and real estate agents evaluate, manage, monitorhousing finance markets, we are unable to predict or estimate the pandemic’s impact on our business or business prospects. Although we are uncertain of the potential magnitude or duration of the business and sell properties. These real estate serviceseconomic impacts of the COVID-19 pandemic, we expect it will have a material negative impact on our business, results of operations and financial condition in the second quarter of 2020 and in future quarters. This negative impact is expected to include software as a service solutionsincreased capital requirements under the PMIERs and platforms,the need to increase our reserve for losses due to an increase in new defaults, which will negatively affect our future earnings. The ultimate significance of COVID-19 on our business will depend on, among other things: the extent and duration of the pandemic, the severity of the disease and the number of people infected with the virus and whether an effective anti-viral treatment or vaccine is developed; the effects on the economy of the pandemic and of the measures taken by governmental authorities and other third parties restricting day-to-day life as well as managed services,the length of time that such as REO asset management, real estate valuation servicesmeasures remain in place; and real estate brokerage services. Our title services providegovernmental and GSE programs implemented to assist new and existing borrowers, including programs and policies instituted by the GSEs to assist borrowers experiencing a comprehensive suiteCOVID-19-related hardship. While at this time the short or long-term impacts of title insurance products, title settlement servicesCOVID-19 on our business are not known, these and both traditional and digital closing services.
other factors, including those discussed in our 2019 Developments
Capital and Liquidity Actions. On March 20, 2019, Radian Group’s board of directors approvedForm 10-K, could have a $150 million increase in authorization formaterial negative effect on the Company’s existing share repurchase plan, bringing the total authorization to repurchase shares up to $250 million, excluding commissions. During the three months ended March 31, 2019, the Company purchased 1,546,674 shares at an average pricebusiness, liquidity, results of $20.54 per share, including commissions. At March 31, 2019, purchase authority of up to $218.2 million remained available under this program, which expires on July 31, 2020. Subsequent to March 31, 2019, we purchased 4,131,329 shares of our common stock under this program at an average price of $21.94 per share, including commissions. See Note 14 for additional details on our share repurchase program.
In April 2019, the Pennsylvania Insurance Department approved a $375 million distribution of capital from Radian Guaranty to Radian Group, which was paid on April 30, 2019 in the form of cashoperations and marketable securities. See Note 16 for a discussion of this distribution of capital.
Reinsurance. In April 2019, Radian Guaranty entered into a fully collateralized reinsurance agreement with Eagle Re 2019-1. Eagle Re 2019-1 is a VIE and is not a subsidiary or affiliate of Radian Guaranty. This reinsurance agreement provides for up to $562.0 million of aggregate excess-of-loss reinsurance coverage for the mortgage insurance losses on new defaults on an existing portfolio of eligible Recurring Premium Policies issued between January 1, 2018 and December 31, 2018, with an initial RIF of $10.7 billion. Eagle Re 2019-1 financed its coverage by issuing mortgage insurance-linked notes in an aggregate amount of $562.0 million to eligible third-party capital markets investors in an unregistered private offering. See Note 7 for additional details on our reinsurance programs.financial condition.
Significant Accounting Policies
Basis of Presentation
Our condensed consolidated financial statements are prepared in accordance with GAAP and include the accounts of Radian Group Inc. and its subsidiaries. All intercompany accounts and transactions, and intercompany profits and losses, have been eliminated. We have condensed or omitted certain information and footnote disclosures normally included in consolidated financial statements prepared in accordance with GAAP pursuant to the instructions set forth in Article 10 of Regulation S-X of the SEC.
We refer to Radian Group Inc. together with its consolidated subsidiaries as “Radian,” the “Company,” “we,” “us” or “our,” unless the context requires otherwise. We generally refer to Radian Group Inc. alone, without its consolidated subsidiaries, as “Radian Group.” Unless otherwise defined in this report, certain terms and acronyms used throughout this report are defined in the Glossary of Abbreviations and Acronyms included as part of this report.
The financial information presented for interim periods is unaudited; however, such information reflects all adjustments that are, in the opinion of management, necessary for the fair statement of the financial position, results of operations, comprehensive income and cash flows for the interim periods presented. Such adjustments are of a normal recurring nature. The year-end condensed balance sheet data was derived from our audited financial statements, but does not include all disclosures required by GAAP. These
To fully understand the basis of presentation, these interim financial statements and related notes contained herein should be read in conjunction with the audited financial statements and notes thereto included in our 20182019 Form 10-K. The results of operations for interim periods are not necessarily indicative of results to be expected for the full year or for any other period. See “—Recent Developments” above for discussion of the elevated risks to our future business, liquidity, results of operations and financial condition due to the COVID-19 pandemic. Certain prior period amounts have been reclassified to conform to current period presentation. See Note 3 for additional information on our segment reporting reclassifications.
Use of Estimates
The preparation of financial statements in conformity with GAAP requires us to make estimates and assumptions that affect the reported amounts of assets and liabilities and disclosure of our contingent assets and liabilities at the dates of the financial statements, as well as the reported amounts of revenues and expenses during the reporting periods. While the amounts included in our condensed consolidated financial statements include our best estimates and assumptions, actual results may vary materially.
Radian Group Inc.
Notes to Unaudited Condensed Consolidated Financial Statements (Continued)
included in our condensed consolidated financial statements include our best estimates and assumptions, actual results may vary materially.
Other Significant Accounting Policies
See Note 2 of Notes to Consolidated Financial Statements in our 20182019 Form 10-K for information regarding other significant accounting policies. There have been no significant changes in our significant accounting policies from those discussed in our 20182019 Form 10-K, other than described below in “—“—LeasesInvestments” and “—“—Recent Accounting Pronouncements—Accounting Standards Adopted During 2019.2020.”
LeasesInvestments
We determine if an arrangement includesInvestments in fixed-maturity securities not classified as held to maturity or trading securities are classified as available for sale and are reported at fair value, with unrealized gains and losses (net of tax) reported as a lease at inception. A rightseparate component of use asset and lease liabilitystockholders’ equity as accumulated other comprehensive income (loss), unless: (i) we intend to sell the impaired security; (ii) it is recognized for operating leases and is included in other assets and other liabilities, respectively, in our condensed consolidated balance sheet at March 31, 2019. Right-of-use assets represent our rightmore likely than not that we will be required to use an underlying asset forsell the lease term and lease liabilities represent our obligationimpaired security prior to make lease payments arising from the lease. Operating lease right-of-use assets and liabilities are recognized at the lease commencement date based onrecovery of its amortized cost basis or (iii) the present value of lease payments overcash flows we expect to collect is less than the lease term. Rightamortized cost basis of use assets area security. In those instances, we record an impairment loss through earnings that varies depending on specific circumstances, as described below.
If a sale is likely, the full amount of the impairment is recognized netas a loss in the statement of operations. As a result of the adoption effective January 2020, of ASU 2016-13, Financial Instruments—Credit Losses (“ASU 2016-13”), described below, in evaluating whether a decline in value for other securities relates to an existing credit loss, we consider several factors, including, but not limited to, the following:
the extent to which the amortized cost basis is greater than fair value;
reasons for the decline in value (e.g., adverse conditions related to industry or geographic area, changes in financial condition to the issuers or underlying loan obligors);
any changes to the rating of the security by a rating agency;
the financial position, access to capital and near-term prospects of the issuer, including the current and future impact of any payments made or received fromspecific events; and
our best estimate of the lessor. In determining the net present value of lease payments,cash flows expected to be collected.
In addition, we useno longer consider the duration of the decline in value in assessing whether our incremental borrowing rate based onfixed income securities available for sale have a credit loss impairment. If a credit loss is determined to exist, the information available at the lease commencement date or as of our date of adoption, January 1, 2019.
Lease expensecredit loss impairment is recognized on a straight-line basis over the expected lease term. For lease agreements entered into after the adoption of this accounting standard that include lease and non-lease components, such components are generally not accounted for separately. For our building leases, as a resultcredit loss expense in the statement of us having electedoperations with an offset to adopt the package of practical expedients permitted under the transition guidance, we accountan allowance for the leasecredit losses. Subsequent changes (favorable and non-lease components, such as common area maintenance charges,unfavorable) in expected credit losses are recognized immediately in net income as a single lease component. We have elected the short-term exemption for contracts with lease termscredit loss expense or a reversal of 12 months or less. Prior period amounts continue to be reported in accordance with our historic accounting under previous lease guidance.
Our lease agreements primarily relate to operating leases for office space we use in our operations. Certain of our leases include renewal options and/or termination options that we did not consider in the determination of the right-of-use asset or the lease liability as we did not consider it reasonably certain that we would exercise such options. Our lease agreements do not contain any variable lease payments, material residual value guarantees or material restrictive covenants. We do not have material sublease agreements. As of March 31, 2019, there were no leases which had not yet commenced but that create significant rights and obligations for us. See Note 12 for more information about our lease agreements.credit loss expense.
Recent Accounting Pronouncements
Accounting Standards Adopted During 2019.2020. In February 2016, the FASB issued an update that replaces the existing accounting and disclosure requirements for leases of property, plant and equipment, which requires lessees to recognize, as of the lease commencement date, assets and liabilities for all leases with lease terms of more than 12 months. Leases are required to be classified as either operating or finance, with expenseWe adopted ASU 2016-13 on operating leases recorded as a single lease cost on a straight-line basis. For finance leases, interest expense on the lease liability is required to be recognized separately from the straight-line amortization of the right-of-use asset.
We elected the optional transition method, which requires the recognition of a cumulative-effect adjustment as of the beginning of the period of adoption, and we also elected the practical expedients for transitioning existing leases to the new standard as of the effective date. As a result of applying the practical expedients: (i) we did not reassess expired or existing contracts to determine if they contain additional leases; (ii) we did not reassess the lease classification for expired and existing leases; and (iii) we did not reassess initial direct costs for existing leases. Our adoption of this update, effective January 1, 2019, resulted in our recording an increase in other liabilities of $73.5 million,2020 using the modified retrospective adoption approach. This ASU and a corresponding increase in other assets. The increase to other assets was partially offset by an adjustment for unamortized allowances and incentives of $24.1 million, resulting in a right of use asset of $49.4 million. The increase in other liabilities represents a discounted lease liability from operating leases, primarily for our various facilities, which represents the present value of these future lease payments discounted at our incremental borrowing rate. Additionally, we expanded our financial statement disclosures as required by the amendments. Our adoption of this standard did not impact our stockholders’ equity, results of operations or liquidity. See above for a discussion of our accounting policy regarding leases and Note 12.
In March 2017, the FASB issued an update to the accounting standard regarding receivables. The new standard requires certain premiums on purchased callable debt securities to be amortized to the earliest call date. The amortization period for callable debt securities purchased at a discount will not be impacted. The provisions of this update are effective for fiscal years
Radian Group Inc.
Notes to Unaudited Condensed Consolidated Financial Statements (Continued)
beginning after December 15, 2018, including interim periods within those fiscal years. Early adoption is permitted, including adoption in an interim period. The adoption of this update did not have a material effect on our financial statements and disclosures.
Accounting Standards Not Yet Adopted. In June 2016, the FASB issued an update to the accounting standard regarding the measurement of credit losses on financial instruments. This update requiresassociated subsequent amendments require that financial assets measured at their amortized cost basis be presented at the net amount expected to be collected. Credit losses relating to our available-for-sale debt securities are to be recorded through an allowance for credit losses, rather than a write-down of the asset, with the amount of the allowance limited to the amount by which fair value is less than amortized cost. This update is effective for public companies for fiscal years beginning after December 15, 2019, including interim periods within those fiscal years. Early adoption is permitted for the fiscal years beginning after December 15, 2018, including interim periods within those fiscal years. This update is not applicable toallowance method will allow reversals of credit losses associated withif the estimate of credit losses declines. This ASU affected certain of our mortgage insurance policies. We are currently evaluatingaccounts and notes receivable, including premiums receivable, and certain of our other assets, including reinsurance recoverables; however, the impactupdate did not have a material effect on our financial statements and future disclosures as a resultdisclosures. See Note 5 for additional information.
We adopted ASU 2019-04, Codification Improvements related to Financial Instruments—Credit Losses, Derivatives and Hedging, and Financial Instruments on January 1, 2020. This update to the accounting standards regarding financial instruments and derivatives and hedging clarifies the accounting treatment for the measurement of credit losses and provides further clarification on previously issued updates. The adoption of this update.update did not have a material effect on our financial statements and disclosures.
Accounting Standards Not Yet Adopted. In August 2018, the FASB issued an update to the accounting standard regarding long-duration insurance contracts.ASU 2018-12, Financial Services—Insurance. The new standard: (i) requires that assumptions used to measure the liability for future policy benefits be reviewed at least annually; (ii) defines and simplifies the measurement of market risk benefits; (iii) simplifies the amortization of deferred acquisition costs; and (iv) enhances the required disclosures about long-duration contracts. This update is effective for fiscal years beginning after December 15, 2020,2021, including interim periods within those fiscal years. Early adoption is permitted. We are currently evaluating the potential impact of the adoption of this update and do not expect it to have a material effect on our financial statements and disclosures.future disclosures as a result of this update.
Radian Group Inc.
Notes to Unaudited Condensed Consolidated Financial Statements (Continued)
In August 2018,March 2020, the FASB issued an update toASU 2020-04, Reference Rate Reform—Facilitation of the accounting standard regarding the capitalizationEffects of implementation costs for activities performed in a cloud computing arrangement that is a service contract. The new standard aligns the accounting for implementation costs of hosting arrangements that are service contracts with the accounting for capitalizing internal-use software.Reference Reform on Financial Reporting. This update is effectiveprovides optional expedients and exceptions for fiscal years beginning after December 15, 2019, including interim periods within those fiscal years. Early adoption is permitted, including adoptionapplying U.S. GAAP to contracts, hedging relationships, and other transactions affected by reference rate reform. The amendments in an interim period.this update are optional and may be elected over time, from the date of issuance, as reference rate reform activities occur. We are currently evaluating the potential impact of the adoption of this updateguidance and do not expect it to have a material effect on our financial statements and disclosures.
In April 2019, the FASB issued an updateoptions related to the accounting standards regarding financial instruments and derivatives and hedging, which clarifies the accounting treatment for the measurement of credit losses and provides further clarification on previously issued updates. This update is effective for fiscal years beginning after December 15, 2019, including interim periods within those fiscal years. Early adoption is permitted. We are currently in the process of evaluating the new standard.practical expedients.
2. Net Income Per Share
Basic net income per share is computed by dividing net income by the weighted-average number of common shares outstanding, while diluted net income per share is computed by dividing net income attributable to common stockholders by the sum of the weighted-average number of common shares outstanding and the weighted-average number of dilutive potential common shares. Dilutive potential common shares relate to our share-based compensation arrangements.
Radian Group Inc.
Notes to Unaudited Condensed Consolidated Financial Statements (Continued)
The calculation of basic and diluted net income per share wasis as follows:
| | | | Three Months Ended
March 31, | Three Months Ended
March 31, |
| (In thousands, except per-share amounts) | 2019 | | 2018 | 2020 | | 2019 |
| Net income—basic and diluted | $ | 170,957 |
| | $ | 114,486 |
| $ | 140,461 |
| | $ | 170,957 |
|
| | | | | | | |
| Average common shares outstanding—basic | 213,537 |
| | 215,967 |
| |
Dilutive effect of share-based compensation arrangements (1) | 4,806 |
| | 3,916 |
| |
Average common shares outstanding—basic (1) | | 200,161 |
| | 213,537 |
|
Dilutive effect of share-based compensation arrangements (2) | | 1,658 |
| | 4,806 |
|
| Adjusted average common shares outstanding—diluted | 218,343 |
| | 219,883 |
| 201,819 |
| | 218,343 |
|
| | | | | | | |
| Net income per share: | | | | | | |
| | | | | | | |
| Basic | $ | 0.80 |
| | $ | 0.53 |
| $ | 0.70 |
| | $ | 0.80 |
|
| | | | | | | |
| Diluted | $ | 0.78 |
| | $ | 0.52 |
| $ | 0.70 |
| | $ | 0.78 |
|
______________________
| |
| (1) | Includes the impact of fully vested shares under our share-based compensation programs. |
| |
| (2) | The following number of shares of our common stock equivalents issued under our share-based compensation arrangements were not included in the calculation of diluted net income per share because they were anti-dilutive: |
| | | | Three Months Ended
March 31, | Three Months Ended
March 31, |
| (In thousands) | 2019 | | 2018 | 2020 | | 2019 |
| Shares of common stock equivalents | 169 |
| | 170 |
| 132 |
| | 169 |
|
3. Segment Reporting
We have two2 strategic business units that we manage separately—Mortgage Insurance and Services. Adjusted pretaxReal Estate. Our Mortgage segment derives its revenue from mortgage insurance and other mortgage and risk services, including contract underwriting services provided to lenders. Our Real Estate segment offers a broad array of title, valuation, asset management and other real estate services to market participants across the real estate value chain. In addition, we report as All Other activities that include income (losses) from assets held by our holding company, related general corporate operating expenses not attributable or allocated to our reportable segments and, for all periods through the first quarter of 2020, income (loss)and expenses related to Clayton prior to its sale in January 2020.
Subsequent to the sale of Clayton, our Chief Executive Officer (Radian’s chief operating decision maker) implemented certain organizational changes that caused the composition of our reportable segments to change. As revised, the Company’s Mortgage and Real Estate segments are managed by our President of Mortgage and Co-Heads of Real Estate, respectively, who are responsible for eachthe overall profitability of their respective segments and who are directly accountable to our chief operating decision maker.
Radian Group Inc.
Notes to Unaudited Condensed Consolidated Financial Statements (Continued)
The differences in the basis of segmentation compared to our 2019 Form 10-K are as follows:
|
| | |
| Business Activity | Current Segmentation | Prior Segmentation |
| Mortgage insurance and risk services | Mortgage | Mortgage Insurance |
| Contract underwriting services | Mortgage | Services |
Title and real estate services (1) | Real Estate | Services |
| Clayton | All Other | Services |
| Income from holding company assets (and related corporate expenses) | All Other | Mortgage Insurance |
| |
| (1) | Includes single family rental services. |
These segment representsreporting changes align with the recent changes in personnel reporting lines, management oversight and branding following the sale of Clayton, and are consistent with the way our chief operating decision maker began assessing the performance of our reportable segments and other business activities effective in the first quarter of 2020. These changes to our reportable segments have been reflected in our segment operating results on a standalone basis; therefore, inter-segment eliminationsfor all periods presented and reclassifications requiredare immaterial to segments presented. See Note 1 for consolidated GAAP presentation have not been reflected.additional details about our Mortgage and Real Estate businesses.
We allocate corporate operating expenses to our Mortgage Insurance segment: (i) corporate expensesboth reportable segments based on theeach segment’s forecasted annual percentage of total revenue, which approximates the estimated percentage of management time spent on the segment; (ii) except as described below, all interest expense; and (iii)each segment. In addition, we allocate all corporate cash and investments. Prior to January 1, 2019, interest expense related to the Clayton Intercompany Note was allocated to our Services segment. Effective January 1, 2019, Radian Group recapitalized the Services segment with a capital contribution that enabled the Services segment to repay the intercompany note and its accumulated allocated interest expense associated with the note, and effective as of the same date, all interest expense is allocated to our Mortgage Insurance segment.
We allocate to our Services segment: (i) corporate expenses based on the segment’s forecasted annual percentage of total revenue, which approximates the estimated percentage of time spent on the segment, and (ii) until January 1, 2019, the allocated interest expense relateddue to the intercompany note as described above. No corporate cash or investments are allocated to the Services segment. Inter-segment activities are recorded at market rates for segment reporting and eliminated in consolidation.
Contract underwriting activities are reported withincapital-intensive nature of our Services segment. We include underwriting-related expenses for mortgage insurance based on a pro-rata volume of mortgage applications excluding third-party contract underwriting services, in our Mortgage Insurance segment’s other operating expenses before corporate allocations. We include underwriting-related expenses for third-party contract underwriting services, based on a pro-rata volume of mortgage applications, in our Services segment’s cost of services and other operating expenses before corporate allocations, as applicable.business.
With the exception of goodwill and other acquired intangible assets that relate to our ServicesReal Estate segment, which are reviewed as part of our annual goodwill impairment assessment, we do not manage assets by segment.
Adjusted Pretax Operating Income (Loss)
Our senior management, including our Chief Executive Officer (Radian’s chief operating decision maker),maker, uses adjusted pretax operating income (loss) as our primary measure to evaluate the fundamental financial performance of each of Radian’s business segments and to allocate resources to the segments. Adjusted pretax operating income (loss) is defined as pretax income (loss) from continuing operations excluding the effects ofof: (i) net gains (losses) on investments and other financial
Radian Group Inc.
Notes to Unaudited Condensed Consolidated Financial Statements (Continued)
instruments, instruments; (ii) loss on induced conversionextinguishment of debt; (iii) amortization and debt extinguishment, acquisition-related expenses, amortization or impairment of goodwill and other acquired intangible assets; and (iv) impairment of other long-lived assets and net impairmentother non-operating items, such as losses recognizedfrom the sale of lines of business and acquisition-related expenses. See Note 4 of Notes to Consolidated Financial Statements in earnings and infrequent or unusual non-operating items.our 2019 Form 10-K for detailed information regarding items excluded from adjusted pretax operating income (loss), including the reasons for their treatment.
Although adjusted pretax operating income (loss) excludes certain items that have occurred in the past and are expected to occur in the future, the excluded items represent those that are: (i) not viewed as part of the operating performance of our primary activities or (ii) not expected to result in an economic impact equal to the amount reflected in pretax income. These adjustments, along with the reasons for their treatment, are described below.income (loss).
| |
(1) | Net gains (losses) on investments and other financial instruments. The recognition of realized investment gains or losses can vary significantly across periods as the activity is highly discretionary based on the timing of individual securities sales due to such factors as market opportunities, our tax and capital profile and overall market cycles. Unrealized gains and losses arise primarily from changes in the market value of our investments that are classified as trading or equity securities. These valuation adjustments may not necessarily result in realized economic gains or losses.
|
Trends in the profitability of our fundamental operating activities can be more clearly identified without the fluctuations of these realized and unrealized gains or losses and changes in fair value of other financial instruments. We do not view them to be indicative of our fundamental operating activities. Therefore, these items are excluded from our calculation of adjustedAdjusted pretax operating income (loss).
| |
(2) | Loss on induced conversion and debt extinguishment. Gains or losses on early extinguishment of debt and losses incurred to purchase our convertible debt prior to maturity are discretionary activities that are undertaken in order to take advantage of market opportunities to strengthen our financial and capital positions; therefore, we do not view these activities as part of our operating performance. Such transactions do not reflect expected future operations and do not provide meaningful insight regarding our current or past operating trends. Therefore, these items are excluded from our calculation of adjusted pretax operating income (loss).
|
| |
(3) | Acquisition-related expenses. Acquisition-related expenses represent the costs incurred to effect an acquisition of a business (i.e., a business combination). Because we pursue acquisitions on a strategic and selective basis, we do not view acquisition-related expenses as a primary business activity. Therefore, we do not consider these expenses to be part of our operating performance and they are excluded from our calculation of adjusted pretax operating income (loss).
|
| |
(4) | Amortization or impairment of goodwill and other acquired intangible assets. Amortization of acquired intangible assets represents the periodic expense required to amortize the cost of acquired intangible assets over their estimated useful lives. Acquired intangible assets with an indefinite useful life are also periodically reviewed for potential impairment, and impairment adjustments are made whenever appropriate. These charges are not viewed as part of the operating performance of our primary activities and therefore are excluded from our calculation of adjusted pretax operating income (loss).
|
| |
(5) | Net impairment losses recognized in earnings and infrequent or unusual non-operating items. The recognition of net impairment losses on investments and the impairment of other long-lived assets can vary significantly in both amount and frequency, depending on market credit cycles and other factors. Infrequent and unusual non-operating items reflect activities that we do not view to be indicative of our fundamental operating activities. Therefore, whenever such income or loss items occur, we exclude them from our calculation of adjusted pretax operating income (loss).
|
Radian Group Inc.
Notes to Unaudited Condensed Consolidated Financial Statements (Continued)
Summarized operating for each segment represents segment results on a standalone basis; therefore, inter-segment eliminations and reclassifications required for our segmentsconsolidated GAAP presentation have not been reflected. Inter-segment activities are recorded at market rates for the periods indicated, are as follows:
|
| | | | | | | |
| | Three Months Ended
March 31, |
| (In thousands) | 2019 | | 2018 |
| Mortgage Insurance | | | |
Net premiums written—insurance (1) | $ | 251,586 |
| | $ | 237,980 |
|
| (Increase) decrease in unearned premiums | 10,192 |
| | 4,570 |
|
| Net premiums earned—insurance | 261,778 |
| | 242,550 |
|
| Net investment income | 43,665 |
| | 33,956 |
|
| Other income | 1,196 |
| | 807 |
|
Total (2) | 306,639 |
|
| 277,313 |
|
| | | | |
| Provision for losses | 20,844 |
| | 37,391 |
|
| Policy acquisition costs | 5,893 |
| | 7,117 |
|
| Other operating expenses before corporate allocations | 30,410 |
| | 31,888 |
|
Total (3) | 57,147 |
| | 76,396 |
|
| Adjusted pretax operating income before corporate allocations | 249,492 |
| | 200,917 |
|
| Allocation of corporate operating expenses | 25,625 |
| | 18,577 |
|
| Allocation of interest expense | 15,697 |
| | 10,629 |
|
| Adjusted pretax operating income | $ | 208,170 |
| | $ | 171,711 |
|
______________________
| |
(1) | Net of ceded premiums written under our reinsurance programs. See Note 7 for additional information. |
| |
(2) | Excludes net gains on investments and other financial instruments of $21.9 million for the three months ended March 31, 2019, and net losses on investments and other financial instruments of $18.9 million for the three months ended March 31, 2018, not included in adjusted pretax operating income. |
(3)Includes inter-segment expenses as follows: |
| | | | | | | |
| | Three Months Ended
March 31, |
| (In thousands) | 2019 | | 2018 |
| Inter-segment expenses | $ | 970 |
| | $ | 1,002 |
|
Radian Group Inc.
Notes to Unaudited Condensed Consolidated Financial Statements (Continued)
|
| | | | | | | |
| | Three Months Ended
March 31, |
| (In thousands) | 2019 | | 2018 |
| Services | | | |
Net premiums earned—insurance (1) | $ | 1,734 |
| | $ | — |
|
Services revenue (2) | 33,723 |
| | 34,166 |
|
Net investment income (1) | 182 |
| | — |
|
Other income (1) | 408 |
| | — |
|
Total (2) | 36,047 |
| | 34,166 |
|
| | | | |
Provision for losses (1) | (18 | ) | | — |
|
| Cost of services | 24,559 |
| | 23,270 |
|
| Other operating expenses before corporate allocations | 13,435 |
| | 10,744 |
|
| Restructuring and other exit costs | — |
| | 525 |
|
| Total | 37,976 |
| | 34,539 |
|
| Adjusted pretax operating income (loss) before corporate allocations | (1,929 | ) |
| (373 | ) |
| Allocation of corporate operating expenses | 4,171 |
| | 2,784 |
|
| Allocation of interest expense | — |
| (3) | 4,451 |
|
| Adjusted pretax operating income (loss) | $ | (6,100 | ) |
| $ | (7,608 | ) |
______________________
| |
(1) | Results from inclusion of the operations of EnTitle Direct, a national title insurance and settlement services company, acquired in March 2018. |
(2)Includes inter-segment revenues as follows: |
| | | | | | | |
| | Three Months Ended
March 31, |
| (In thousands) | 2019 | | 2018 |
| Inter-segment revenues | $ | 970 |
| | $ | 1,002 |
|
| |
(3) | Effective January 1, 2019, the Clayton Intercompany Note was repaid using proceeds from an additional capital contribution from Radian Group. As a result of the intercompany note repayment, the Services segment no longer incurs interest expense on the intercompany note. |
Radian Group Inc.
Notes to Unaudited Condensed Consolidated Financial Statements (Continued)
The reconciliation of adjusted pretax operating income (loss) for our reportable segments and All Other activities to consolidated pretax income is as follows:
|
| | | | | | | |
| | Three Months Ended
March 31, |
| (In thousands) | 2020 | | 2019 |
| Adjusted pretax operating income (loss): | | | |
Mortgage (1) | $ | 205,667 |
| | $ | 203,631 |
|
Real Estate (2) | (4,867 | ) | | (3,925 | ) |
| Total adjusted pretax operating income (loss) for reportable segments | 200,800 |
| | 199,706 |
|
| All Other adjusted pretax operating income (loss) | 3,799 |
| | 2,364 |
|
| Net gains (losses) on investments and other financial instruments | (22,027 | ) | | 21,913 |
|
| Amortization and impairment of other acquired intangible assets | (979 | ) | | (2,187 | ) |
| Impairment of other long-lived assets and other non-operating items | (300 | ) | | (5,660 | ) |
| Consolidated pretax income | $ | 181,293 |
| | $ | 216,136 |
|
|
| | | | | | | |
| | Three Months Ended
March 31, |
| (In thousands) | 2019 | | 2018 |
| Adjusted pretax operating income (loss): | | | |
Mortgage Insurance (1) | $ | 208,170 |
| | $ | 171,711 |
|
Services (1) | (6,100 | ) | | (7,608 | ) |
| Total adjusted pretax operating income | 202,070 |
| | 164,103 |
|
| | | | |
| Net gains (losses) on investments and other financial instruments | 21,913 |
| | (18,887 | ) |
Acquisition-related expenses (2) | (233 | ) | | — |
|
| Amortization and impairment of other acquired intangible assets | (2,187 | ) | | (2,748 | ) |
Impairment of other long-lived assets and infrequent or unusual non-operating items (3) | (5,427 | ) | | (26 | ) |
| Consolidated pretax income | $ | 216,136 |
| | $ | 142,442 |
|
______________________
| |
| (1) | Includes inter-segmentFor the three months ended March 31, 2020, includes allocated corporate operating expenses and revenues as listed indepreciation expense of $29.1 million and $3.7 million, respectively. For the notes to the preceding tables.three months ended March 31, 2019, includes allocated corporate operating expenses and depreciation expense of $25.6 million and $3.9 million, respectively. |
| |
| (2) | Acquisition-relatedFor the three months ended March 31, 2020, includes allocated corporate operating expenses representand depreciation expense of $3.8 million and $0.7 million, respectively. For the three months ended March 31, 2019, includes allocated corporate operating expenses incurred to effect the acquisitionand depreciation expense of a business, net of adjustments to accruals previously recorded for acquisition expenses.$2.8 million and $0.6 million, respectively. |
Revenue
The reconciliation of revenue for our reportable segments and All Other activities to consolidated revenues is as follows:
|
| | | | | | | |
| | Three Months Ended
March 31, |
| (In thousands) | 2020 | | 2019 |
| Revenues: | | | |
Mortgage (1) | $ | 315,084 |
| | $ | 302,370 |
|
Real Estate (1) | 28,583 |
| | 23,023 |
|
| Total revenues for reportable segments | 343,667 |
| | 325,393 |
|
| All Other revenues | 7,633 |
| | 16,839 |
|
| Net gains (losses) on investments and other financial instruments | (22,027 | ) | | 21,913 |
|
| Elimination of inter-segment revenues | (192 | ) | | (516 | ) |
| Total revenues | $ | 329,081 |
| | $ | 363,629 |
|
______________________
| |
(3)(1) | The amountIncludes immaterial inter-segment revenues for the three months ended March 31, 2019 is included in other operating expenses on the condensed consolidated statement of operations2020 and primarily relates to impairments of other long-lived assets. The amount for the three months ended March 31, 2018 is included within restructuring and other exit costs on the condensed consolidated statement of operations.2019. |
On a consolidated basis, “adjusted pretax operating income” is a measure not determined in accordance with GAAP. Total adjusted pretax operating income is not a measure of total profitability, and therefore should not be considered in isolation or viewed as a substitute for GAAP pretax income. Our definition of adjusted pretax operating income may not be comparable to similarly-named measures reported by other companies.
Revenue Recognition—Services
The accounting standard on revenue from contracts with customers is primarily applicable to revenues from our Services segmentservices revenue and is not applicable to our investments and insurance products, which represent the majority of our revenue. See Notes 1 andNote 2 of Notes to Consolidated Financial Statements in our 20182019 Form 10-K for additional information regarding our accounting policies and the services we offer.
The table below represents the disaggregation of Services revenues by revenue type:
|
| | | | | | | |
| | Three Months Ended
March 31, |
| (In thousands) | 2019 | | 2018 |
| Services segment revenue | | | |
| Mortgage Services | $ | 16,063 |
| | $ | 17,498 |
|
| Real Estate Services | 15,836 |
| | 14,394 |
|
| Title Services | 2,232 |
| | 2,274 |
|
Total (1) | $ | 34,131 |
| | $ | 34,166 |
|
______________________
| |
(1) | Includes inter-segment revenues of $1.0 million for each of the three months ended March 31, 2019 and 2018, respectively. For the three months ended March 31, 2019, amounts exclude a total of $1.9 million, comprised of Services segment net premiums earned—insurance and net investment income, as both are excluded from the scope of the revenue recognition standard. |
Our Services segment revenues, other than net premiums earned—insurance and net investment income, are recognized over time and measured each period based on the progress to date as services are performed and made available to customers.
Radian Group Inc.
Notes to Unaudited Condensed Consolidated Financial Statements (Continued)
The table below, which represents total services revenue on our condensed consolidated statements of operations for the periods indicated, represents the disaggregation of services revenues from external customers, by type:
|
| | | | | | | |
| | Three Months Ended
March 31, |
| (In thousands) | 2020 | | 2019 |
| Services revenue | | | |
| Real Estate services: | | | |
| Valuation services | $ | 11,844 |
| | $ | 12,706 |
|
| Title services | 7,305 |
| | 1,600 |
|
| Asset management services | 6,374 |
| | 6,272 |
|
| Other real estate services | 410 |
| | — |
|
| Mortgage services | 3,133 |
| | 644 |
|
| All Other services | 2,861 |
| | 11,531 |
|
| Total services revenue | $ | 31,927 |
| | $ | 32,753 |
|
Our services revenues are recognized over time and measured each period based on the progress to date as services are performed and made available to customers. Our contracts with customers, including payment terms, are generally short-term in nature; therefore, any impact related to timing is immaterial. Revenue recognized related to services made available to customers and billed is reflected in accounts and notes receivable. Revenue recognized related to services performed and not yet billed is recorded in unbilled receivables and reflected in other assets. Deferred revenue represents advance payments received from customers in advance of revenue recognition. We have no material bad-debt expense. The following represents balances related to Services contracts as of the dates indicated:
|
| | | | | | | |
| (In thousands) | March 31, 2019 | | December 31, 2018 |
| Accounts Receivable - Services Contracts | $ | 13,241 |
| | $ | 15,461 |
|
| Unbilled Receivables - Services Contracts | 22,967 |
| | 19,917 |
|
| Deferred Revenues - Services Contracts | 3,044 |
| | 3,204 |
|
Revenue expected to be recognized in any future period related to remaining performance obligations, such as contracts where revenue is recognized as invoiced and contracts with variable consideration related to undelivered performance obligations, is not material.
Revenue recognized related to services made available to customers and billed is reflected in accounts and notes receivable. Accounts and notes receivable included $18.3 million and $10.8 million as of March 31, 2020 and December 31, 2019, respectively, related to services revenue contracts. Revenue recognized related to services performed and not yet billed is recorded in unbilled receivables and reflected in other assets. See Note 8 for additional information. Deferred revenue, which represents advance payments received from customers in advance of revenue recognition, is immaterial for all periods presented. We have 0 material bad-debt expense.
Radian Group Inc.
Notes to Unaudited Condensed Consolidated Financial Statements (Continued)
4. Fair Value of Financial Instruments
We provide a qualitative descriptionFor discussion of theour valuation techniquesmethodologies for assets and inputs used for recurring and non-recurringliabilities measured at fair value measurementsand the fair value hierarchy, see Note 5 of Notes to Consolidated Financial Statements in our audited financial statements and notes thereto included in our 2018 Form 10-K. These unaudited condensed consolidated financial statements should be read in conjunction with the audited financial statements and notes thereto included in our 20182019 Form 10-K.
The following is a list of assets that are measured at fair value by hierarchy level as of March 31, 2019:2020:
| | | (In thousands) | Level I | | Level II | | Total | | Level I | | Level II | | Total |
| Assets at Fair Value | | | | | | | |
| Investment Portfolio: | | | | | | | |
| Assets at fair value | | | | | | |
| Investments: | | | | | | |
| Fixed-maturities available for sale: | | | | | | |
| U.S. government and agency securities | | $ | 155,498 |
| | $ | 3,742 |
| | $ | 159,240 |
|
| State and municipal obligations | | — |
| | 116,975 |
| | 116,975 |
|
| Corporate bonds and notes | | — |
| | 2,265,066 |
| | 2,265,066 |
|
| RMBS | | — |
| | 779,590 |
| | 779,590 |
|
| CMBS | | — |
| | 610,877 |
| | 610,877 |
|
| Other ABS | | — |
| | 666,918 |
| | 666,918 |
|
| Foreign government and agency securities | | — |
| | 4,947 |
| | 4,947 |
|
| Total fixed-maturities available for sale | | 155,498 |
| | 4,448,115 |
| | 4,603,613 |
|
| | | | | | | |
| Trading securities: | | | | | | |
| State and municipal obligations | | — |
| | 114,511 |
| | 114,511 |
|
| Corporate bonds and notes | | — |
| | 123,461 |
| | 123,461 |
|
| RMBS | | — |
| | 15,573 |
| | 15,573 |
|
| CMBS | | — |
| | 33,725 |
| | 33,725 |
|
| Total trading securities | | — |
| | 287,270 |
| | 287,270 |
|
| | | | | | | |
| Equity securities | | 67,086 |
| | 7,767 |
| | 74,853 |
|
| | | | | | | |
| Short-term investments: | | | | | | |
| U.S. government and agency securities | $ | 178,908 |
| | $ | 33,610 |
| | $ | 212,518 |
| | 140,667 |
| | — |
| | 140,667 |
|
| State and municipal obligations | — |
| | 233,827 |
| | 233,827 |
| | — |
| | 10,148 |
| | 10,148 |
|
| Money market instruments | 174,541 |
| | — |
| | 174,541 |
| | 295,757 |
| | — |
| | 295,757 |
|
| Corporate bonds and notes | — |
| | 2,485,463 |
| | 2,485,463 |
| | — |
| | 117,836 |
| | 117,836 |
|
| RMBS | — |
| | 368,495 |
| | 368,495 |
| | |
| CMBS | — |
| | 549,986 |
| | 549,986 |
| | |
| Other ABS | — |
| | 675,477 |
| | 675,477 |
| | |
Other investments (1) | | — |
| | 74,352 |
| | 74,352 |
|
| Total short-term investments | | 436,424 |
| | 202,336 |
| | 638,760 |
|
| | | | | | | |
Total investments at fair value (2) | | 659,008 |
| | 4,945,488 |
| | 5,604,496 |
|
| | | | | | | |
| Other assets: | | | | | | |
Loaned securities: (3) | | | | | | |
| U.S. government and agency securities | | — |
| | 3,784 |
| | 3,784 |
|
| Equity securities | 136,107 |
| | 4,998 |
| | 141,105 |
| | 43,736 |
| | — |
| | 43,736 |
|
Other investments (1) | — |
| | 653,905 |
| | 653,905 |
| | |
Total Investments at Fair Value (2) | 489,556 |
| | 5,005,761 |
| | 5,495,317 |
| (3) | |
Total Assets at Fair Value (4) | $ | 489,556 |
| | $ | 5,005,761 |
| | $ | 5,495,317 |
| (3) | |
Total assets at fair value (2) | | $ | 702,744 |
| | $ | 4,949,272 |
| | $ | 5,652,016 |
|
______________________
| |
| (1) | Comprising short-term certificates of deposit and commercial paper. |
| |
| (2) | Does not include certain other invested assets of $3.1$2.6 million that are primarily invested in limited partnership investments valued using the net asset value as a practical expedient. Includes cash collateral held under securities lending agreements of $6.2expedient and $1.5 million that is reinvestedinvested in money market instruments.a private convertible promissory note. |
| |
| (3) | Includes $22.6 million of securitiesSecurities loaned to third-party Borrowersborrowers under securities lending agreements are classified as other assets in our condensed consolidated balance sheets. See Note 5 for more information. |
| |
(4) | Does not include the fair value of an immaterial embedded derivative, which we have accounted for separately as a freestanding derivative and classified in other assets in our condensed consolidated balance sheet. See Note 7 for more information. |
Radian Group Inc.
Notes to Unaudited Condensed Consolidated Financial Statements (Continued)
The following is a list of assets that are measured at fair value by hierarchy level as of December 31, 2018:2019:
|
| | | | | | | | | | | |
| (In thousands) | Level I | | Level II | | Total |
| Assets at fair value | | | | | |
| Investments: | | | | | |
| Fixed-maturities available for sale: | | | | | |
| U.S. government and agency securities | $ | 143,884 |
| | $ | 35,700 |
| | $ | 179,584 |
|
| State and municipal obligations | — |
| | 119,994 |
| | 119,994 |
|
| Corporate bonds and notes | — |
| | 2,237,611 |
| | 2,237,611 |
|
| RMBS | — |
| | 779,354 |
| | 779,354 |
|
| CMBS | — |
| | 608,015 |
| | 608,015 |
|
| Other ABS | — |
| | 759,129 |
| | 759,129 |
|
| Foreign government and agency securities | — |
| | 5,224 |
| | 5,224 |
|
| Total fixed-maturities available for sale | 143,884 |
| | 4,545,027 |
| | 4,688,911 |
|
| | | | | | |
| Trading securities: | | | | | |
| State and municipal obligations | — |
| | 118,949 |
| | 118,949 |
|
| Corporate bonds and notes | — |
| | 147,232 |
| | 147,232 |
|
| RMBS | — |
| | 16,180 |
| | 16,180 |
|
| CMBS | — |
| | 34,789 |
| | 34,789 |
|
| Total trading securities | — |
| | 317,150 |
| | 317,150 |
|
| | | | | | |
| Equity securities | 124,009 |
| | 6,212 |
| | 130,221 |
|
| | | | | | |
| Short-term investments: | | | | | |
| U.S. government and agency securities | 127,152 |
| | — |
| | 127,152 |
|
| State and municipal obligations | — |
| | 21,475 |
| | 21,475 |
|
| Money market instruments | 202,461 |
| | — |
| | 202,461 |
|
| Corporate bonds and notes | — |
| | 20,298 |
| | 20,298 |
|
Other investments (1) | — |
| | 147,007 |
| | 147,007 |
|
| Total short-term investments | 329,613 |
| | 188,780 |
| | 518,393 |
|
| | | | | | |
Total investments at fair value (2) | 597,506 |
| | 5,057,169 |
| | 5,654,675 |
|
| | | | | | |
| Other assets: | | | | | |
Loaned securities: (3) | | | | | |
| U.S. government and agency securities | 35,309 |
| | — |
| | 35,309 |
|
| Corporate bonds and notes | — |
| | 3,669 |
| | 3,669 |
|
| Equity securities | 27,464 |
| | — |
| | 27,464 |
|
Total assets at fair value (2) | $ | 660,279 |
| | $ | 5,060,838 |
| | $ | 5,721,117 |
|
|
| | | | | | | | | | | | |
| (In thousands) | Level I | | Level II | | Total | |
| Assets at Fair Value | | | | | | |
| Investment Portfolio: | | | | | | |
| U.S. government and agency securities | $ | 199,302 |
| | $ | 28,412 |
| | $ | 227,714 |
| |
| State and municipal obligations | — |
| | 324,742 |
| | 324,742 |
| |
| Money market instruments | 95,132 |
| | — |
| | 95,132 |
| |
| Corporate bonds and notes | — |
| | 2,564,068 |
| | 2,564,068 |
| |
| RMBS | — |
| | 353,224 |
| | 353,224 |
| |
| CMBS | — |
| | 591,393 |
| | 591,393 |
| |
| Other ABS | — |
| | 705,468 |
| | 705,468 |
| |
| Equity securities | 136,662 |
| | 3,958 |
| | 140,620 |
| |
Other investments (1) | — |
| | 175,113 |
| | 175,113 |
| |
Total Investments at Fair Value (2) | 431,096 |
| | 4,746,378 |
| | 5,177,474 |
| (3) |
Total Assets at Fair Value (4) | $ | 431,096 |
| | $ | 4,746,378 |
| | $ | 5,177,474 |
| (3) |
______________________
| |
| (1) | Comprising short-term certificates of deposit and commercial paper. |
| |
| (2) | Does not include certain other invested assets of $3.4$2.6 million that are primarily invested in limited partnership investments valued using the net asset value as a practical expedient. Includes cash collateral held under securities lending agreements of $11.7expedient and $1.5 million that is reinvestedinvested in money market instruments.a private convertible promissory note. |
| |
| (3) | Includes $27.9 million of securitiesSecurities loaned to third-party Borrowersborrowers under securities lending agreements are classified as other assets in our condensed consolidated balance sheets. See Note 5 for more information. |
| |
(4) | Does not include the fair value of an immaterial embedded derivative, which we have accounted for separately as a freestanding derivative and classified in other assets in our condensed consolidated balance sheet. See Note 7 for more information. |
At March 31, 20192020 and December 31, 2018, there were no material2019, we had a Level III assetsliability of $5.6 million measured at fair value, included in other liabilities in our condensed consolidated balance sheets, and noa Level III liabilities. asset of $0.4 million measured at fair value, included in other assets in our condensed consolidated balance sheets, respectively. The Level III assets and liabilities represent
Radian Group Inc.
Notes to Unaudited Condensed Consolidated Financial Statements (Continued)
the embedded derivatives associated with our mortgage insurance-linked note transactions as described in Note 7. The total fair value of the embedded derivatives at March 31, 2020 and December 31, 2019 consists of impacts related to the fair value accounting for derivatives associated with our reinsurance contracts and the related fluctuations from period to period. The estimated fair value related to our embedded derivatives reflects the present value impact of the future variation in premiums we will pay, and includes significant unobservable inputs associated with LIBOR rates and the yield on investments held by trust.
There were no investment transfers to or from Level III for the three months ended March 31, 20192020 or the year ended December 31, 2018. Activity2019. Except for the activity related to the embedded derivatives described above, activity related to Level III assets and liabilities (including realized and unrealized gains and losses, purchases, sales, issuances, settlements and transfers) was immaterial for the three months ended March 31, 20192020 and the year ended December 31, 2018.2019.
Other Fair Value Disclosure
The carrying value and estimated fair value of other selected liabilities not carried at fair value in our condensed consolidated balance sheets were as follows as of the dates indicated:
| | | | March 31, 2019 | | December 31, 2018 | March 31, 2020 | | December 31, 2019 |
| (In thousands) | Carrying Amount | | Estimated Fair Value | | Carrying Amount | | Estimated Fair Value | Carrying Amount | | Estimated Fair Value | | Carrying Amount | | Estimated Fair Value |
| Liabilities: | | | | | | | | | | | | | | |
| Senior notes | $ | 1,031,197 |
| | $ | 1,051,418 |
| | $ | 1,030,348 |
| | $ | 1,007,687 |
| $ | 887,584 |
| | $ | 886,500 |
| | $ | 887,110 |
| | $ | 949,500 |
|
| FHLB advances | 108,532 |
| | 109,097 |
| | 82,532 |
| | 82,899 |
| 173,760 |
| | 176,952 |
| | 134,875 |
| | 135,997 |
|
The fair value of our senior notes is estimated based on thetheir quoted market prices for the same or similar instruments.prices. The fair value of our FHLB advances is estimated based on expected cash flows for similar borrowings. These liabilities are categorized in Level II of the fair value hierarchy. See Note 11 for further information on our senior notes and FHLB advances.
Radian Group Inc.
Notes to Unaudited Condensed Consolidated Financial Statements (Continued)
5. Investments
Available for Sale Securities
Our available for sale securities within our investment portfolio consisted of the following as of the dates indicated:
| | | | March 31, 2019 | March 31, 2020 |
| (In thousands) | Amortized Cost | | Fair Value | | Gross Unrealized Gains | | Gross Unrealized Losses | Amortized Cost | | Fair Value | | Gross Unrealized Gains | | Gross Unrealized Losses |
| Fixed-maturities available for sale: | | | | | | | | | | | | | | |
| U.S. government and agency securities | $ | 94,441 |
| | $ | 94,098 |
| (1) | $ | 185 |
| | $ | 528 |
| $ | 148,382 |
| | $ | 159,240 |
| | $ | 10,858 |
| | $ | — |
|
| State and municipal obligations | 88,598 |
| | 92,718 |
| | 4,421 |
| | 301 |
| 111,831 |
| | 116,975 |
| | 5,462 |
| | 318 |
|
| Corporate bonds and notes | 2,159,040 |
| | 2,175,975 |
| | 31,450 |
| | 14,515 |
| 2,239,543 |
| | 2,268,850 |
| | 77,884 |
| | 48,577 |
|
| RMBS | 348,746 |
| | 350,238 |
| (2) | 4,242 |
| | 2,750 |
| 747,271 |
| | 779,590 |
| | 33,122 |
| | 803 |
|
| CMBS | 512,190 |
| | 515,604 |
| | 4,873 |
| | 1,459 |
| 609,518 |
| | 610,877 |
| | 13,356 |
| | 11,997 |
|
| Other ABS | 679,444 |
| | 675,477 |
| | 1,021 |
| | 4,988 |
| 708,357 |
| | 666,918 |
| | 1,251 |
| | 42,690 |
|
| Total securities available for sale | $ | 3,882,459 |
| | $ | 3,904,110 |
| (3) | $ | 46,192 |
| | $ | 24,541 |
| |
| Foreign government and agency securities | | 5,093 |
| | 4,947 |
| | — |
| | 146 |
|
| Total securities available for sale, including loaned securities | | 4,569,995 |
| | 4,607,397 |
| | $ | 141,933 |
| | $ | 104,531 |
|
| Less: loaned securities | | 5,379 |
| | 3,784 |
| | | | |
| Total fixed-maturities available for sale | | $ | 4,564,616 |
| | $ | 4,603,613 |
| |
|
| |
|
|
|
| | | | | | | | | | | | | | | |
| | December 31, 2019 |
| (In thousands) | Amortized Cost | | Fair Value | | Gross Unrealized Gains | | Gross Unrealized Losses |
| Fixed-maturities available for sale: | | | | | | | |
| U.S. government and agency securities | $ | 198,613 |
| | $ | 199,928 |
| | $ | 2,048 |
| | $ | 733 |
|
| State and municipal obligations | 112,003 |
| | 119,994 |
| | 8,032 |
| | 41 |
|
| Corporate bonds and notes | 2,136,819 |
| | 2,241,280 |
| | 106,189 |
| | 1,728 |
|
| RMBS | 766,429 |
| | 779,354 |
| | 14,452 |
| | 1,527 |
|
| CMBS | 593,647 |
| | 608,015 |
| | 14,993 |
| | 625 |
|
| Other ABS | 760,785 |
| | 759,129 |
| | 2,018 |
| | 3,674 |
|
| Foreign government and agency securities | 5,091 |
| | 5,224 |
| | 133 |
| | — |
|
| Total securities available for sale, including loaned securities | 4,573,387 |
| | 4,712,924 |
| | $ | 147,865 |
| | $ | 8,328 |
|
| Less: loaned securities | 23,853 |
| | 24,013 |
| | | | |
| Total fixed-maturities available for sale | $ | 4,549,534 |
| | $ | 4,688,911 |
| |
|
| |
|
|
______________________
| |
(1) | Includes securities with a fair value of $10.9 million serving as collateral for FHLB advances. |
| |
(2) | Includes securities with a fair value of $103.7 million serving as collateral for FHLB advances. |
| |
(3) | Includes $6.5 million of fixed-maturity securities loaned to third-party Borrowers under securities lending agreements, classified as other assets in our condensed consolidated balance sheets, as further described below. |
|
| | | | | | | | | | | | | | | |
| | December 31, 2018 |
| (In thousands) | Amortized Cost | | Fair Value | | Gross Unrealized Gains | | Gross Unrealized Losses |
| Fixed-maturities available for sale: | | | | | | | |
| U.S. government and agency securities | $ | 85,532 |
| | $ | 84,070 |
| (1) | $ | 46 |
| | $ | 1,508 |
|
| State and municipal obligations | 138,022 |
| | 138,313 |
| | 2,191 |
| | 1,900 |
|
| Corporate bonds and notes | 2,288,720 |
| | 2,229,885 |
| | 5,053 |
| | 63,888 |
|
| RMBS | 334,843 |
| | 332,142 |
| (2) | 1,785 |
| | 4,486 |
|
| CMBS | 546,729 |
| | 539,915 |
| | 544 |
| | 7,358 |
|
| Other ABS | 712,748 |
| | 704,662 |
| | 814 |
| | 8,900 |
|
| Total securities available for sale | $ | 4,106,594 |
| | $ | 4,028,987 |
| (3) | $ | 10,433 |
| | $ | 88,040 |
|
______________________
| |
(1) | Includes securities with a fair value of $10.7 million serving as collateral for FHLB advances. |
| |
(2) | Includes securities with a fair value of $77.7 million serving as collateral for FHLB advances. |
| |
(3) | Includes $7.4 million of fixed-maturity securities loaned to third-party Borrowers under securities lending agreements, classified as other assets in our condensed consolidated balance sheets, as further described below. |
Radian Group Inc.
Notes to Unaudited Condensed Consolidated Financial Statements (Continued)
Gross Unrealized Losses and Fair Value of Available for Sale Securities
For securities deemed “availableour available for sale” and that aresale securities in an unrealized loss position, the following tables show the gross unrealized losses and fair values, aggregated by investment category and length of time that individual securities have been in a continuous unrealized loss position, as of the dates indicated. Included in the amounts as of March 31, 20192020 and December 31, 20182019 are loaned securities under securities lending agreements that are classified as other assets in our condensed consolidated balance sheets, as further described below.
Radian Group Inc.
Notes to Unaudited Condensed Consolidated Financial Statements (Continued)
| | | | | March 31, 2019 | | March 31, 2020 |
($ in thousands) Description of Securities | | Less Than 12 Months | | 12 Months or Greater | | Total | | Less Than 12 Months | | 12 Months or Greater | | Total |
| | # of securities | | Fair Value | | Unrealized Losses | | # of securities | | Fair Value | | Unrealized Losses | | # of securities | | Fair Value | | Unrealized Losses | | # of securities | | Fair Value | | Unrealized Losses | | # of securities | | Fair Value | | Unrealized Losses | | # of securities | | Fair Value | | Unrealized Losses |
| U.S. government and agency securities | | — |
| | $ | — |
| | $ | — |
| | 9 |
| | $ | 38,177 |
| | $ | 528 |
| | 9 |
| | $ | 38,177 |
| | $ | 528 |
| |
| State and municipal obligations | | 1 |
| | 6,487 |
| | 27 |
| | 3 |
| | 10,983 |
| | 274 |
| | 4 |
| | 17,470 |
| | 301 |
| | 6 |
| | $ | 19,560 |
| | $ | 318 |
| | — |
| | $ | — |
| | $ | — |
| | 6 |
| | $ | 19,560 |
| | $ | 318 |
|
| Corporate bonds and notes | | 54 |
| | 220,831 |
| | 2,676 |
| | 148 |
| | 656,876 |
| | 11,839 |
| | 202 |
| | 877,707 |
| | 14,515 |
| | 174 |
| | 763,279 |
| | 48,577 |
| | — |
| | — |
| | — |
| | 174 |
| | 763,279 |
| | 48,577 |
|
| RMBS | | 9 |
| | 60,465 |
| | 124 |
| | 24 |
| | 67,863 |
| | 2,626 |
| | 33 |
| | 128,328 |
| | 2,750 |
| | 3 |
| | 19,874 |
| | 656 |
| | 4 |
| | 22,323 |
| | 147 |
| | 7 |
| | 42,197 |
| | 803 |
|
| CMBS | | 33 |
| | 138,708 |
| | 621 |
| | 19 |
| | 41,516 |
| | 838 |
| | 52 |
| | 180,224 |
| | 1,459 |
| | 60 |
| | 201,504 |
| | 11,534 |
| | 8 |
| | 7,052 |
| | 463 |
| | 68 |
| | 208,556 |
| | 11,997 |
|
| Other ABS | | 71 |
| | 321,040 |
| | 2,958 |
| | 41 |
| | 179,398 |
| | 2,030 |
| | 112 |
| | 500,438 |
| | 4,988 |
| | 151 |
| | 483,803 |
| | 29,259 |
| | 26 |
| | 122,186 |
| | 13,431 |
| | 177 |
| | 605,989 |
| | 42,690 |
|
| Foreign government and agency securities | | | 1 |
| | 4,947 |
| | 146 |
| | — |
| | — |
| | — |
| | 1 |
| | 4,947 |
| | 146 |
|
| Total | | 168 |
| | $ | 747,531 |
| | $ | 6,406 |
| | 244 |
| | $ | 994,813 |
| | $ | 18,135 |
| | 412 |
| | $ | 1,742,344 |
| | $ | 24,541 |
| | 395 |
| | $ | 1,492,967 |
| | $ | 90,490 |
| | 38 |
| | $ | 151,561 |
| | $ | 14,041 |
| | 433 |
| | $ | 1,644,528 |
| | $ | 104,531 |
|
| | | | | December 31, 2018 | | December 31, 2019 |
($ in thousands) Description of Securities | | Less Than 12 Months | | 12 Months or Greater | | Total | | Less Than 12 Months | | 12 Months or Greater | | Total |
| | # of securities | | Fair Value | | Unrealized Losses | | # of securities | | Fair Value | | Unrealized Losses | | # of securities | | Fair Value | | Unrealized Losses | | # of securities | | Fair Value | | Unrealized Losses | | # of securities | | Fair Value | | Unrealized Losses | | # of securities | | Fair Value | | Unrealized Losses |
| U.S. government and agency securities | | 2 |
| | $ | 27,415 |
| | $ | 796 |
| | 8 |
| | $ | 23,476 |
| | $ | 712 |
| | 10 |
| | $ | 50,891 |
| | $ | 1,508 |
| | 2 |
| | $ | 26,142 |
| | $ | 731 |
| | 2 |
| | $ | 2,529 |
| | $ | 2 |
| | 4 |
| | $ | 28,671 |
| | $ | 733 |
|
| State and municipal obligations | | 12 |
| | 41,263 |
| | 955 |
| | 16 |
| | 39,982 |
| | 945 |
| | 28 |
| | 81,245 |
| | 1,900 |
| | 1 |
| | 3,959 |
| | 41 |
| | — |
| | — |
| | — |
| | 1 |
| | 3,959 |
| | 41 |
|
| Corporate bonds and notes | | 330 |
| | 1,208,430 |
| | 36,284 |
| | 126 |
| | 601,533 |
| | 27,604 |
| | 456 |
| | 1,809,963 |
| | 63,888 |
| | 25 |
| | 110,871 |
| | 1,728 |
| | — |
| | — |
| | — |
| | 25 |
| | 110,871 |
| | 1,728 |
|
| RMBS | | 15 |
| | 92,315 |
| | 782 |
| | 28 |
| | 77,395 |
| | 3,704 |
| | 43 |
| | 169,710 |
| | 4,486 |
| | 27 |
| | 184,378 |
| | 535 |
| | 16 |
| | 36,192 |
| | 992 |
| | 43 |
| | 220,570 |
| | 1,527 |
|
| CMBS | | 62 |
| | 328,696 |
| | 3,973 |
| | 33 |
| | 125,728 |
| | 3,385 |
| | 95 |
| | 454,424 |
| | 7,358 |
| | 36 |
| | 109,589 |
| | 478 |
| | 8 |
| | 6,346 |
| | 147 |
| | 44 |
| | 115,935 |
| | 625 |
|
| Other ABS | | 129 |
| | 503,109 |
| | 7,917 |
| | 26 |
| | 89,628 |
| | 983 |
| | 155 |
| | 592,737 |
| | 8,900 |
| | 63 |
| | 225,944 |
| | 670 |
| | 44 |
| | 209,661 |
| | 3,004 |
| | 107 |
| | 435,605 |
| | 3,674 |
|
| Total | | 550 |
| | $ | 2,201,228 |
| | $ | 50,707 |
| | 237 |
| | $ | 957,742 |
| | $ | 37,333 |
| | 787 |
| | $ | 3,158,970 |
| | $ | 88,040 |
| | 154 |
| | $ | 660,883 |
| | $ | 4,183 |
| | 70 |
| | $ | 254,728 |
| | $ | 4,145 |
| | 224 |
| | $ | 915,611 |
| | $ | 8,328 |
|
Although we held securities inImpairment. We recognize an impairment on a security with an unrealized loss position asthrough the statement of March 31, 2019,operations if: (i) we didintend to sell the impaired security; (ii) it is more likely than not consider those securitiesthat we will be required to be other-than-temporarilysell the impaired assecurity prior to recovery of such date. For all investment categories,its amortized cost basis; or (iii) the unrealized lossespresent value of 12 months or greater duration as of March 31, 2019 were generally caused by interest rate or credit spread movements since the purchase date, and as such,cash flows we expect to recovercollect is less than the amortized cost basis of these securities.the impaired security.
If a sale is likely, the full amount of the impairment is recognized as a loss in the statement of operations. Otherwise, unrealized losses on securities are separated into: (i) the portion of loss that represents the credit loss and (ii) the portion that is due to other factors. As described in Note 1, ASU 2016-13 requires that the credit loss portion be recognized as a loss in the statement of operations, while the loss due to other factors is recognized in other comprehensive income (loss), net of taxes. Factors evaluated to determine if a credit loss exists include: (i) the extent to which the fair value is less than amortized cost; (ii) adverse conditions related to the security, industry sector or geographic area; (iii) downgrades in the security’s credit rating; and (iv) failure of the issuer to make scheduled payment. As of March 31, 2019,2020, we evaluated these factors and determined there were no credit impairments indicated.
To the extent we determine that a security is deemed credit-impaired, an impairment loss is recognized in earnings. On initial recognition and at each reporting date, we recognize an allowance for remaining lifetime expected credit losses. This amount is calculated as the difference between the amortized cost and the present value of future expected cash flows, limited to the difference between the carrying amount (i.e. fair value) and amortized cost. Subsequent changes (favorable and
Radian Group Inc.
Notes to Unaudited Condensed Consolidated Financial Statements (Continued)
unfavorable) in expected credit losses are recognized immediately in net income as a credit loss expense or a reversal of credit loss expense.
During the three months ended March 31, 2020, we recorded impairment losses in earnings of $0.6 million due to our intent to sell certain debt securities at a loss. We did not have the intent to sell any additional available for sale debt securities in an unrealized loss position, and we determined that it is more likely than not that we will not be required to sell the securities before recovery of their cost basis, which may be at maturity; therefore,maturity.
Securities Lending Agreements
We participate in a securities lending program whereby we did not considerloan certain securities in our investment portfolio to third-party borrowers for short periods of time. Although we report such securities at fair value within other assets in our condensed consolidated balance sheets, rather than within investments, the detailed information we provide in this Note 5 includes these investmentssecurities. See Note 4 for additional detail on the loaned securities, and see Notes 2 and 6 of Notes to be other-than-temporarily impaired atConsolidated Financial Statements in our 2019 Form 10-K for additional information about our accounting policies with respect to our securities lending agreements and the collateral requirements thereunder, respectively.
All of our securities lending agreements are classified as overnight and revolving. Securities collateral on deposit with us from third-party borrowers totaling $33.4 million and $42.4 million as of March 31, 2019.
Other-than-temporary Impairment Activity. To the extent we determine that a security is deemed to have had an other-than-temporary impairment, an impairment loss is recognized. We recognized no other-than-temporary impairment losses in earnings during the three months ended March2020 and December 31, 2019, respectively, may not be transferred or re-pledged unless the third-party borrower is in default, and $0.8 millionis therefore not reflected in our condensed consolidated financial statements.
Net Gains (Losses) on Investments
Net gains (losses) on investments consisted of:
|
| | | | | | | |
| | Three Months Ended
March 31, |
| (In thousands) | 2020 | | 2019 |
| Net realized gains (losses): | | | |
Fixed-maturities available for sale (1) | $ | 11,247 |
| | $ | (495 | ) |
| Trading securities | 49 |
| | (684 | ) |
| Equity securities | 310 |
| | (680 | ) |
| Other investments | 33 |
| | 172 |
|
| Net realized gains (losses) on investments | 11,639 |
| | (1,687 | ) |
| Impairment losses | (622 | ) | | — |
|
| Net unrealized gains (losses) on investments | (26,845 | ) | | 19,469 |
|
| Total net gains (losses) on investments | $ | (15,828 | ) | | $ | 17,782 |
|
______________________
(1)Components of other-than-temporary impairment losses in earningsnet realized gains (losses) on fixed-maturities available for sale include: |
| | | | | | | |
| | Three Months Ended
March 31, |
| (In thousands) | 2020 | | 2019 |
| Gross investment gains from sales and redemptions | $ | 11,899 |
| | $ | 4,165 |
|
| Gross investment losses from sales and redemptions | (652 | ) | | (4,660 | ) |
Radian Group Inc.
Notes to Unaudited Condensed Consolidated Financial Statements (Continued)
for the three months ended March 31, 2018. There were no other-than-temporary impairment losses recognized in accumulated other comprehensive income (loss) for those periods.
Trading Securities
The trading securities within our investment portfolio, which are recorded at fair value, consisted of the following as of the dates indicated:
|
| | | | | | | |
| (In thousands) | March 31,
2019 | | December 31,
2018 |
| Trading securities: | | | |
| State and municipal obligations | $ | 128,339 |
| | $ | 168,359 |
|
| Corporate bonds and notes | 203,014 |
| | 228,151 |
|
| RMBS | 18,257 |
| | 21,083 |
|
| CMBS | 34,382 |
| | 51,478 |
|
| Total | $ | 383,992 |
| | $ | 469,071 |
|
Securities Lending Agreements
We participate in a securities lending program whereby we loan certain securities in our investment portfolio to Borrowers for short periods of time. See Notes 2 and 6 of Notes to Consolidated Financial Statements in our 2018 Form 10-K for additional information about our securities lending agreements.
Key balances related to our securities lending agreements consisted of the following as of the dates indicated:
|
| | | | | | | |
| (In thousands) | March 31,
2019 | | December 31,
2018 |
Loaned securities (1): | | | |
| U.S. government and agency securities | $ | — |
| | $ | 9,987 |
|
| Corporate bonds and notes | 6,526 |
| | 7,818 |
|
| Equity securities | 16,080 |
| | 10,055 |
|
| Total loaned securities, at fair value | $ | 22,606 |
| | $ | 27,860 |
|
| | | | |
| Total loaned securities, at amortized cost | $ | 22,537 |
| | $ | 28,992 |
|
Securities collateral on deposit from Borrowers (2) | 17,372 |
| | 16,815 |
|
Reinvested cash collateral, at estimated fair value (3) | 6,233 |
| | 11,699 |
|
______________________
| |
(1) | Our securities loaned under securities lending agreements are reported at fair value within other assets in our condensed consolidated balance sheets. All of our securities lending agreements are classified as overnight and revolving. None of the amounts are subject to offsetting. |
| |
(2) | Securities collateral on deposit with us from Borrowers may not be transferred or re-pledged unless the Borrower is in default, and is therefore not reflected in our condensed consolidated financial statements. |
| |
(3) | All cash collateral received has been reinvested in accordance with the securities lending agreements and is included in short-term investments in our condensed consolidated balance sheets. Amounts payable on the return of cash collateral under securities lending agreements are included within other liabilities in our condensed consolidated balance sheets. |
Radian Group Inc.
Notes to Unaudited Condensed Consolidated Financial Statements (Continued)
Net Gains (Losses) on Investments and Other Financial Instruments
Net gains (losses) on investments and other financial instruments consisted of:
|
| | | | | | | |
| | Three Months Ended
March 31, |
| (In thousands) | 2019 | | 2018 |
| Net realized gains (losses): | | | |
Fixed-maturities available for sale (1) | $ | (495 | ) | | $ | (3,120 | ) |
| Equity securities | (680 | ) | | 142 |
|
| Trading securities | (684 | ) | | (538 | ) |
| Other invested assets | 87 |
| | 62 |
|
| Other gains (losses) | 85 |
| | 12 |
|
| Net realized gains (losses) on investments | (1,687 | ) | | (3,442 | ) |
| Other-than-temporary impairment losses | — |
| | (844 | ) |
| Net unrealized gains (losses) on investment securities | 19,469 |
| | (12,804 | ) |
| Total net gains (losses) on investments | 17,782 |
| | (17,090 | ) |
| Net gains (losses) on other financial instruments | 4,131 |
| | (1,797 | ) |
| Net gains (losses) on investments and other financial instruments | $ | 21,913 |
| | $ | (18,887 | ) |
______________________
(1)Components of net realized gains (losses) on fixed-maturities available for sale include: |
| | | | | | | |
| | Three Months Ended
March 31, |
| (In thousands) | 2019 | | 2018 |
| Gross investment gains from sales and redemptions | $ | 4,165 |
| | $ | 598 |
|
| Gross investment losses from sales and redemptions | (4,660 | ) | | (3,718 | ) |
Net Unrealized Gains (Losses) on Investment Securities
For each period indicated, the net change in unrealized gains (losses) on investment securities shown below represents a component of net gains (losses) on investments and other financial instruments. The net changes in unrealized gains (losses) recognized in earnings on trading securities and equity securitiesinvestments that were still held at each period endperiod-end were as follows:
| | | | Three Months Ended
March 31, | Three Months Ended
March 31, |
| (In thousands) | 2019 | | 2018 | 2020 | | 2019 |
| Net changes in unrealized gains (losses): | | | | |
| Net unrealized gains (losses) on investments still held: | | | | |
| Trading securities | $ | 8,587 |
| | $ | (11,420 | ) | $ | (2,034 | ) | | $ | 8,587 |
|
| Equity securities | 7,919 |
| | (1,806 | ) | (24,020 | ) | | 7,919 |
|
| Net changes in unrealized gains (losses) on investment securities | $ | 16,506 |
| | $ | (13,226 | ) | |
| Other investments | | 804 |
| | — |
|
| Net unrealized gains (losses) on investments still held | | $ | (25,250 | ) | | $ | 16,506 |
|
Radian Group Inc.
Notes to Unaudited Condensed Consolidated Financial Statements (Continued)
Contractual Maturities
The contractual maturities of fixed-maturity investmentsfixed-maturities available for sale were as follows:
| | | | March 31, 2019 | March 31, 2020 |
| | Available for Sale | Available for Sale |
| (In thousands) | Amortized Cost | | Fair Value | Amortized Cost | | Fair Value |
Due in one year or less (1) | $ | 93,413 |
| | $ | 93,208 |
| $ | 105,520 |
| | $ | 104,855 |
|
Due after one year through five years (1) | 828,387 |
| | 832,653 |
| 823,582 |
| | 829,134 |
|
Due after five years through 10 years (1) | 1,051,235 |
| | 1,060,529 |
| 1,082,394 |
| | 1,089,685 |
|
Due after 10 years (1) | 369,044 |
| | 376,401 |
| 493,353 |
| | 526,338 |
|
RMBS (2) | 348,746 |
| | 350,238 |
| 747,271 |
| | 779,590 |
|
CMBS (2) | 512,190 |
| | 515,604 |
| 609,518 |
| | 610,877 |
|
Other ABS (2) | 679,444 |
| | 675,477 |
| 708,357 |
| | 666,918 |
|
Total (3) | $ | 3,882,459 |
| | $ | 3,904,110 |
| |
| Total | | 4,569,995 |
| | 4,607,397 |
|
| Less: loaned securities | | 5,379 |
| | 3,784 |
|
| Total fixed-maturities available for sale | | $ | 4,564,616 |
| | $ | 4,603,613 |
|
______________________
| |
| (1) | Actual maturities may differ as a result of calls before scheduled maturity. |
| |
| (2) | RMBS, CMBS and Other ABS are shown separately, as they are not due at a single maturity date. |
| |
(3) | Includes securities loaned under securities lending agreements with a fair value of $6.5 million. |
Other
For the three months ended March 31, 2019,2020, we did not transfer any securities to or from the available for sale or trading categories.
At March 31, 2019 and December 31, 2018, we had aggregate amounts of $114.6 million and $88.4 million, respectively, of U.S. government and agency securities and RMBS, classified asOur fixed-maturities available for sale within our investmentinclude securities portfolio,totaling $17.1 million and $16.8 million at March 31, 2020 and December 31, 2019, respectively, on deposit and serving as collateral with various state regulatory authorities. Our fixed-maturities available for sale also include securities serving as collateral for our FHLB advances. See Note 1211 for additional information.information about our FHLB advances.
Our investments include securities on deposit with various state insurance commissioners
Radian Group Inc.
Notes to Unaudited Condensed Consolidated Financial Statements (Continued)
6. Goodwill and Other Acquired Intangible Assets, Net
All of our goodwill and other acquired intangible assets relate to our ServicesReal Estate segment. The purchase price allocation for the acquisition of Five Bridges was finalized in the first quarter of 2019. In comparison to the preliminary fair value amounts recorded as of December 31, 2018, the final calculations resulted in: (i) an increase in goodwill of $0.5 million and (ii) decreases in intangible assets of $0.4 million related to technology and $0.1 million related to customer relationships.
The following table shows the changes in the carrying amount of goodwill for the year-to-date periods ended December 31, 20182019 and March 31, 2019:2020:
| | | (In thousands) | Goodwill | | Accumulated Impairment Losses | | Net | Goodwill | | Accumulated Impairment Losses | | Net |
| Balance at December 31, 2017 | $ | 197,391 |
| | $ | (186,469 | ) | | $ | 10,922 |
| |
| Goodwill acquired | 3,170 |
| | — |
| | 3,170 |
| |
| Balance at December 31, 2018 | 200,561 |
| | (186,469 | ) | | 14,092 |
| $ | 200,561 |
| | $ | (186,469 | ) | | $ | 14,092 |
|
| Goodwill acquired | 538 |
| | — |
| | 538 |
| 538 |
| | — |
| | 538 |
|
| Balance at March 31, 2019 | $ | 201,099 |
| | $ | (186,469 | ) | | $ | 14,630 |
| |
| Impairment losses | | — |
| | (4,828 | ) | | (4,828 | ) |
| Balance at December 31, 2019 | | 201,099 |
| | (191,297 | ) | | 9,802 |
|
| Goodwill acquired | | — |
| | — |
| | — |
|
| Impairment losses | | — |
| | — |
| | — |
|
| Balance at March 31, 2020 | | $ | 201,099 |
| | $ | (191,297 | ) | | $ | 9,802 |
|
The following is a summary of the gross and net carrying amounts and accumulated amortization (including impairment) of our other acquired intangible assets as of the periods indicated:
|
| | | | | | | | | | | |
| | March 31, 2020 |
| (In thousands) | Gross Carrying Amount | | Accumulated Amortization | | Net Carrying Amount |
| Client relationships | $ | 43,550 |
| | $ | (28,095 | ) | | $ | 15,455 |
|
| Technology | 8,285 |
| | (6,761 | ) | | 1,524 |
|
| Trade name and trademarks | 480 |
| | (423 | ) | | 57 |
|
| Licenses | 463 |
| | (93 | ) | | 370 |
|
| Total | $ | 52,778 |
| | $ | (35,372 | ) | | $ | 17,406 |
|
|
| | | | | | | | | | | |
| | December 31, 2019 |
| (In thousands) | Gross Carrying Amount | | Accumulated Amortization | | Net Carrying Amount |
| Client relationships | $ | 43,550 |
| | $ | (27,269 | ) | | $ | 16,281 |
|
| Technology | 8,435 |
| | (6,789 | ) | | 1,646 |
|
| Trade name and trademarks | 480 |
| | (404 | ) | | 76 |
|
| Licenses | 463 |
| | (81 | ) | | 382 |
|
| Total | $ | 52,928 |
| | $ | (34,543 | ) | | $ | 18,385 |
|
Interim Impairment Analysis
Goodwill is deemed to have an indefinite useful life and is subject to review for impairment annually, or more frequently, if certain events and circumstances indicate potential impairment. We generally perform our annual goodwill impairment test during the fourth quarter of each year, using balances as of the prior quarter. Events and circumstances that could result in an interim assessment of goodwill and other acquired intangible assets and/or a potential impairment loss include, but are not limited to: (i) significant under-performance of the Real Estate segment relative to historical or projected future operating results; (ii) significant changes in the strategy for the Real Estate segment; (iii) significant negative industry or economic trends; and (iv) a decline in market capitalization below the book value attributable to the Real Estate segment.
Due to the rapidly changing social and economic impacts associated with the COVID-19 pandemic on the U.S. and global economies generally, and in particular on the U.S. housing, real estate and housing finance markets during the first quarter of 2020, we opted to perform an interim quantitative impairment assessment of our goodwill and other acquired intangible assets.
Radian Group Inc.
Notes to Unaudited Condensed Consolidated Financial Statements (Continued)
The following is a summary ofWe first evaluated the gross and net carrying amounts and accumulated amortizationrecoverability of our other acquired intangible assets, as factors affecting the estimated fair value of our goodwill also affect the estimated recoverability of our other acquired intangible assets. Based on our analysis in the first quarter of 2020, no impairment was indicated for other acquired intangible assets, as the remaining carrying amounts were estimated to be recoverable despite the recent market disruptions associated with the COVID-19 pandemic.
The value of our goodwill and other acquired intangible assets is supported by cash flow projections, which are primarily driven by projected transaction volume and margins. Lower earnings over sustained periods can lead to impairment of goodwill, which could result in a charge to earnings. Given that our goodwill and other acquired intangible assets analysis continues to rely on achieving our projected future cash flows, failure to meet those projections may result in impairment in a future period.
Our assumptions related to projected cash flows did not significantly change as a result of the periods indicated:
|
| | | | | | | | | | | |
| | March 31, 2019 |
| (In thousands) | Original Amount Acquired | | Accumulated Amortization and Impairment | | Net Carrying Amount |
| Client relationships | $ | 83,860 |
| | $ | (49,751 | ) | (1) | $ | 34,109 |
|
| Technology | 16,964 |
| | (13,575 | ) | (2) | 3,389 |
|
| Trade name and trademarks | 8,340 |
| | (4,080 | ) | | 4,260 |
|
| Non-competition agreements | 185 |
| | (179 | ) | | 6 |
|
| Licenses | 463 |
| | (46 | ) | | 417 |
|
| Total | $ | 109,812 |
| | $ | (67,631 | ) | | $ | 42,181 |
|
|
| | | | | | | | | | | |
| | December 31, 2018 |
| (In thousands) | Original Amount Acquired | | Accumulated Amortization | | Net Carrying Amount |
| Client relationships | $ | 84,000 |
| | $ | (48,227 | ) | (1) | $ | 35,773 |
|
| Technology | 17,362 |
| | (13,141 | ) | (2) | 4,221 |
|
| Trade name and trademarks | 8,340 |
| | (3,864 | ) | | 4,476 |
|
| Non-competition agreements | 185 |
| | (177 | ) | | 8 |
|
| Licenses | 463 |
| | (35 | ) | | 428 |
|
| Total | $ | 110,350 |
| | $ | (65,444 | ) | | $ | 44,906 |
|
______________________
| |
(1) | Includes an impairment charge of $14.9 million in the quarter ended June 30, 2017. |
| |
(2) | Includes an impairment charge of $0.9 million in the quarter ended June 30, 2017. |
The estimated aggregate amortization expense for the remainderobserved market conditions. Based on our quantitative goodwill impairment assessment as of 2019 and thereafterMarch 31, 2020, we concluded that no impairment of goodwill is as follows (in thousands):
|
| | | |
| 2019 | $ | 6,416 |
|
| 2020 | 7,236 |
|
| 2021 | 5,822 |
|
| 2022 | 5,290 |
|
| 2023 | 4,839 |
|
| 2024 and thereafter | 12,578 |
|
| Total | $ | 42,181 |
|
For additional information on our accounting policies for goodwill and other acquired intangible assets, see Notes 2 and 7 of Notes to Consolidated Financial Statements in our 20182019 Form 10-K.
7. Reinsurance
In our mortgageinsurance business,and title insurance businesses, we use reinsurance as part of our risk distribution strategy, including to manage our capital position and risk profile. Premiums are primarilyThe reinsurance arrangements for our mortgage insurance business include premiums ceded under the QSR Program, the Single Premium QSR Program the QSR Program and the Excess-of-Loss Program. The amount of credit that we receive under the PMIERs financial requirements for our third-party reinsurance transactions is subject to ongoing review and approval by the GSEs.
The effect of all of our reinsurance programs on our net income is as follows:
|
| | | | | | | |
| | Three Months Ended
March 31, |
| (In thousands) | 2020 |
| 2019 |
| Net premiums written—insurance: | | | |
| Direct | $ | 279,482 |
| | $ | 261,031 |
|
Assumed (1) | 3,451 |
| | 2,445 |
|
Ceded (2) | (19,543 | ) | | (10,156 | ) |
| Net premiums written—insurance | $ | 263,390 |
| | $ | 253,320 |
|
| | | | |
| Net premiums earned—insurance: | | | |
| Direct | $ | 301,254 |
| | $ | 280,223 |
|
Assumed (1) | 3,456 |
| | 2,450 |
|
Ceded (2) | (27,295 | ) | | (19,161 | ) |
| Net premiums earned—insurance | $ | 277,415 |
| | $ | 263,512 |
|
| | | | |
Ceding commissions earned (3) | $ | 9,966 |
| | $ | 8,685 |
|
| Ceded losses | 1,962 |
| | 1,687 |
|
______________________
| |
| (1) | Includes premiums earned from our participation in certain credit risk transfer programs. |
| |
| (2) | Net of profit commission. |
| |
| (3) | Deferred ceding commissions of $71.6 million and $88.1 million are included in other liabilities on our condensed consolidated balance sheets at March 31, 2020 and 2019, respectively. |
Single Premium QSR Program
Radian Guaranty entered into each of the 2016 Single Premium QSR Agreement, 2018 Singles Premium QSR Agreement and 2020 Single Premium QSR Agreement with panels of third-party reinsurers to cede a contractual quota share percent of our Single Premium NIW as of the effective date of each agreement (as set forth in the table below), subject to certain conditions. Radian Guaranty receives a ceding commission for ceded premiums written pursuant to these transactions. Radian Guaranty
Radian Group Inc.
Notes to Unaudited Condensed Consolidated Financial Statements (Continued)
also receives a profit commission, provided that the loss ratio on the loans covered under the agreement generally remains below the applicable prescribed thresholds. Losses on the ceded risk above this level reduce Radian Guaranty’s profit commission on a dollar-for-dollar basis.
Each of the agreements is subject to a scheduled termination date as set forth in the table below; however, Radian Guaranty has the option, based on certain conditions and subject to a termination fee, to terminate any of the agreements at the end of any calendar quarter on or after the applicable optional termination date. If Radian Guaranty exercises this option in the future, it would result in Radian Guaranty reassuming the related RIF in exchange for a net payment to the reinsurer calculated in accordance with the terms of the applicable agreement. Radian Guaranty also may terminate any of the agreements prior to the applicable scheduled termination date under certain circumstances/conditions, including if one or both of the GSEs no longer grant full PMIERs credit for the reinsurance.
The effect of all of our reinsurance programs2020 Single Premium QSR Agreement is the only QSR agreement under which Radian Guaranty is currently ceding NIW. Under the 2020 Single Premium QSR Agreement, NIW for policies issued between January 1, 2020 and December 31, 2021 is being ceded, subject to certain conditions and a limitation on our netceded premiums written and earned is as follows:of $250 million. The parties may mutually agree to increase the amount of ceded risk above this level.
The following table sets forth additional details regarding the Single Premium QSR Program:
|
| | | | | | | |
| | Three Months Ended
March 31, |
| (In thousands) | 2019 |
| 2018 |
| Net premiums written—insurance: | | | |
| Direct | $ | 261,031 |
| | $ | 256,599 |
|
Assumed (1) | 2,445 |
| | 1,312 |
|
Ceded (2) | (10,156 | ) | | (19,931 | ) |
| Net premiums written—insurance | $ | 253,320 |
| | $ | 237,980 |
|
| | | | |
| Net premiums earned—insurance: | | | |
| Direct | $ | 280,223 |
| | $ | 257,431 |
|
Assumed (1) | 2,450 |
| | 1,318 |
|
Ceded (2) | (19,161 | ) | | (16,199 | ) |
| Net premiums earned—insurance | $ | 263,512 |
| | $ | 242,550 |
|
|
| | | | | | | | | | | |
| (In millions) | 2016 Singles QSR | | 2018 Singles QSR | | 2020 Singles QSR |
| Policy In-force Dates | Jan 1, 2012-Dec 31, 2017 | | Jan 1, 2018-Dec 31, 2019 | | Jan 1, 2020-Dec 31, 2021 |
| Effective Date | January 1, 2016 | | January 1, 2018 | | January 1, 2020 |
| Scheduled Termination Date | December 31, 2027 | | December 31, 2029 | | December 31, 2031 |
| Optional Termination Date | January 1, 2020 | | January 1, 2022 | | January 1, 2024 |
| Quota Share % | 20% - 65% | (1) | 65% | | 65% |
| Ceding Commission % | 25% | | 25% | | 25% |
| Profit Commission % | Up to 55% | | Up to 56% | | Up to 56% |
| | | | | | |
| | As of March 31, 2020 |
| RIF Ceded | $ | 5,080 |
| | $ | 3,066 |
| | $ | 435 |
|
| | | | | | |
| | As of December 31, 2019 |
| RIF Ceded | $ | 5,351 |
| | $ | 3,231 |
| | $ | — |
|
______________________
| |
| (1) | Includes premiums earnedEffective December 31, 2017, we amended the 2016 Single Premium QSR Agreement to increase the amount of ceded risk on performing loans under the agreement from our participation35% to 65% for the 2015 through 2017 vintages. Loans included in certain Front-endthe 2012 through 2014 vintages, and Back-end creditany other loans subject to the agreement that were delinquent at the time of the amendment, were unaffected by the change and therefore the amount of ceded risk transfer programs. |
| |
(2) | Net of profit commission.for those loans continues to range from 20% to 35%. |
Single Premium QSRExcess-of-Loss Program
In the first quarter of 2016, Radian Guaranty entered into the 2016 Single Premium QSR Agreement with a panel of third-party reinsurers. As of January 1, 2018, Radian Guaranty is no longer ceding NIW under this arrangement. RIF ceded under the 2016 Single Premium QSR Agreement was $6.1 billion and $6.8 billion as ofThrough March 31, 2019 and 2018, respectively.
In October 2017, we entered into the 2018 Single Premium QSR Agreement with a panel of third-party reinsurers. Under the 2018 Single Premium QSR Agreement, we expect to cede 65% of our Single Premium NIW beginning with the business written in January 2018, subject to certain conditions that may affect the amount ceded, including a limitation on ceded premiums written equal to $335 million for policies issued between January 1, 2018 and December 31, 2019. Notwithstanding this limitation, the parties may mutually agree to amend the agreement, including with respect to any limitations on the amounts of insurance that may be ceded. RIF ceded under the 2018 Single Premium QSR Agreement was $2.1 billion and $0.4 billion as of March 31, 2019 and 2018, respectively.
Ceding commissions earned under the Single Premium QSR Program were $5.8 million and $5.3 million for the three months ended March 31, 2019 and 2018, respectively, and ceded losses were $1.5 million and $0.9 million for the three months ended March 31, 2019 and 2018, respectively.
QSR Program
In 2012, Radian Guaranty entered into the QSR Program with a third-party reinsurance provider.2020, Radian Guaranty has ceded the maximum amount permitted under the QSR Program and is no longer ceding NIW under this program. RIF ceded under the QSR Program was $0.8 billion and $1.1 billion as of March 31, 2019 and 2018, respectively. Ceding commissions earned under the QSR Program were $2.9 million and $3.5 million for the three months ended March 31, 2019 and 2018, respectively, and ceded losses were $0.2 million for the three months ended March 31, 2019 and 2018.
Excess-of-Loss Program
In November 2018, Radian Guaranty entered into a3 fully collateralized reinsurance agreementarrangements with the Eagle Re 2018-1.Issuers. For the respective coverage periods, Radian Guaranty retains the first-loss layer of aggregate losses, as well as any losses in excess of the outstanding reinsurance coverage amounts. The Eagle Re 2018-1 is a VIE and is not a subsidiary or affiliate of Radian Guaranty. This reinsurance agreement provides forIssuers provide second layer coverage up to $434.0 millionthe outstanding coverage amounts. For each of these 3 reinsurance arrangements, the Eagle Re Issuers financed their coverage by issuing mortgage insurance-linked notes to eligible third-party capital markets investors in unregistered private offerings. The aggregate excess-of-loss reinsurance coverage for the applicable percentage of mortgage insurance losses on new defaults on an existing portfolio of eligible Recurring Premium Policies issued between January 1, 2017 and December 31, 2017, with an initial RIF of $9.1 billion. In addition, Radian Guaranty entered into a separate excess-of-loss reinsurance agreement for up to $21.4 million of coverage, representing a pro rata share of the credit risk alongside the risk assumed by Eagle Re 2018-1 on those Recurring Premium Policies.
Radian Group Inc.
Notes to Unaudited Condensed Consolidated Financial Statements (Continued)
The aggregate excess of loss reinsurance coveragethese transactions decreases over a ten-year10-year period as the principal balances of the underlying covered mortgages decrease and as any claims are paid by the applicable Eagle Re 2018-1Issuer or the mortgage insurance is canceled. The outstanding reinsurance coverage amount will begin amortizing after an initial period in which a target level of credit enhancement is obtained and will stop amortizing if certain thresholds are reached, such as if the reinsured mortgages were to experience an elevated level of delinquencies or certain credit enhancement tests were not maintained. Radian Guaranty has rights to terminate the reinsurance agreementagreements upon the occurrence of certain events.
Radian Group Inc.
Notes to Unaudited Condensed Consolidated Financial Statements (Continued)
The following table sets forth additional details regarding the Excess-of-Loss Program:
|
| | | | | | | | | | | | |
| (In millions) | Eagle Re 2020-1 | | Eagle Re 2019-1 | | Eagle Re 2018-1 | |
| Issued | February 2020 | | April 2019 | | November 2018 | |
| Policy In-force Dates | Jan 1, 2019-Sep 30, 2019 | | Jan 1, 2018-Dec 31, 2018 | | Jan 1, 2017-Dec 31, 2017 | |
| Initial RIF | $ | 9,866 |
| | $ | 10,705 |
| | $ | 9,109 |
| |
| Initial Coverage | 488 |
| | 562 |
| | 434 |
| (1) |
| First Layer Retention | 202 |
| | 268 |
| | 205 |
| |
| | | | | | | |
| | As of March 31, 2020 |
| RIF | $ | 9,200 |
| | $ | 7,679 |
| | $ | 6,482 |
| |
| Remaining Coverage | 488 |
| | 421 |
| | 299 |
| (1) |
| First Layer Retention | 202 |
| | 267 |
| | 203 |
| |
______________________
| |
| (1) | Excludes a separate excess-of-loss reinsurance agreement entered into by Radian Guaranty that initially provided up to $21.4 million of coverage. |
The Eagle Re 2018-1 financed itsIssuers are not subsidiaries or affiliates of Radian Guaranty. Based on the accounting guidance that addresses VIEs, we have not consolidated any of the Eagle Re Issuers in our consolidated financial statements, because Radian does not have: (i) the power to direct the activities that most significantly affect the Eagle Re Issuers’ economic performances or (ii) the obligation to absorb losses or the right to receive benefits from the Eagle Re Issuers that potentially could be significant to the Eagle Re Issuers. See Note 2 of Notes to Consolidated Financial Statements in our 2019 Form 10-K for more information on our accounting treatment of VIEs.
The reinsurance premium due to the Eagle Re Issuers is calculated by multiplying the outstanding reinsurance coverage amount at the beginning of a period by issuing mortgage insurance-linked notesa coupon rate, which is the sum of one-month LIBOR plus a contractual risk margin, and then subtracting actual investment income collected on the assets in an aggregatethe reinsurance trust during the preceding month. As a result, the premiums we pay will vary based on: (i) the spread between LIBOR and the rates on the investments held by the reinsurance trust and (ii) the outstanding amount of $434.0 millionreinsurance coverage. As the reinsurance premium will vary based on changes in these rates, we concluded that the reinsurance agreements contain embedded derivatives, which we have accounted for separately as freestanding derivatives and recorded in other assets or other liabilities on our condensed consolidated balance sheets.
See Note 2 of Notes to eligible third-party capital markets investorsConsolidated Financial Statements in an unregistered private offering. Although there is no recourse to Radian Guaranty by the holdersour 2019 Form 10-K for more information on our fair value measurements of the mortgage insurance-linked notes, reinsurance does not relieve us of our obligations to our policyholders. financial instruments.
In the event the VIEan Eagle Re Issuer is unable to meet its future obligations to us, if any, our insurance subsidiaries would be liable to make claims payments to our policyholders. In the event that all of the assets in the reinsurance trust (consisting of U.S. government money market funds, cash or U.S. Treasury securities) have become worthless and the VIEEagle Re Issuer is unable to make its payments to us, our maximum potential loss would be the amount of mortgage insurance claim payments for losses on the insured policies, net of the aggregate reinsurance payments already received, up to the full $434.0 million aggregate excess-of-loss reinsurance coverage amount. In the same scenario, the related embedded derivative of $1.7 million, currently recorded in other assets, would no longer have value.
Eagle Re 2018-1 represents See Note 4 for additional information on our only VIE as of March 31, 2019. The following table presents the total assets of Eagle Re 2018-1 as well as Radian Guaranty’s maximum exposure to loss associated with Eagle Re 2018-1, as of the dates indicated.
|
| | | | | | | | | | | | | | | |
| | | At March 31, 2019 |
| | | | | Maximum Exposure to Loss |
| (In thousands) | | Total VIE Assets (1) | | On - Balance Sheet | | Off - Balance Sheet (2) | | Total |
| Eagle Re 2018-1 | | $ | 434,034 |
| | $ | 1,683 |
| (3) | $ | 434,034 |
| | 435,717 |
|
| Total | | $ | 434,034 |
| | $ | 1,683 |
| | $ | 434,034 |
| | 435,717 |
|
| | | | | | | | | |
| | | At December 31, 2018 |
| | | | | Maximum Exposure to Loss |
| (In thousands) | | Total VIE Assets (1) | | On - Balance Sheet | | Off - Balance Sheet (2) | | Total |
| Eagle Re 2018-1 | | $ | 434,034 |
| | $ | 1,114 |
| (3) | $ | 434,034 |
| | 435,148 |
|
| Total | | $ | 434,034 |
| | $ | 1,114 |
| | $ | 434,034 |
| | 435,148 |
|
______________________
| |
(1) | Assets of Eagle Re 2018-1 are required to be invested in U.S. government money market funds, cash or U.S. Treasury securities. Liabilities of Eagle Re 2018-1 consist of its mortgage insurance-linked notes of $434.0 million, as described above. |
| |
(2) | Represents the maximum amount that would be payable in the future by Radian Guaranty to its policyholders on claims, without the benefit of any corresponding reinsurance recoverables, in the event of the combination of two events: (i) all of the assets in the reinsurance trust (consisting of U.S. government money market funds, cash or U.S. Treasury securities) have become worthless and (ii) $660.4 million of claims have been paid on the reinsured RIF. |
| |
(3) | Represents the fair value of the related embedded derivative, included in other assets in our condensed consolidated balance sheets. |
There were no ceding commissions earned or ceded losses under the Excess-of-Loss Program for the three months ended March 31, 2019.
Activity Subsequent to March 31, 2019
In April 2019, Radian Guaranty entered into a fully collateralized reinsurance agreement with Eagle Re 2019-1. Eagle Re 2019-1 is a VIE and is not a subsidiary or affiliate of Radian Guaranty. This reinsurance agreement provides for up to $562.0 million of aggregate excess-of-loss reinsurance coverage for the mortgage insurance losses on new defaults on an existing portfolio of eligible Recurring Premium Policies issued between January 1, 2018 and December 31, 2018, with an initial RIF of $10.7 billion. Eagle Re 2019-1 financed its coverage by issuing mortgage insurance-linked notes in an aggregate amount of $562.0 million to eligible third-party capital markets investors in an unregistered private offering.embedded derivatives.
Radian Group Inc.
Notes to Unaudited Condensed Consolidated Financial Statements (Continued)
The Eagle Re Issuers represent our only VIEs as of March 31, 2020 and December 31, 2019. The following table presents the total assets and liabilities of the Eagle Re Issuers as of the dates indicated.
|
| | | | | | | |
| | Total VIE Assets and Liabilities (1) |
| (In thousands) | March 31,
2020 | | December 31,
2019 |
| Eagle Re 2020-1 | $ | 488,385 |
| | $ | — |
|
| Eagle Re 2019-1 | 421,367 |
| | 508,449 |
|
| Eagle Re 2018-1 | 298,817 |
| | 357,005 |
|
| Total | $ | 1,208,569 |
| | $ | 865,454 |
|
______________________
| |
| (1) | Assets held by the Eagle Re Issuers are required to be invested in U.S. government money market funds, cash or U.S. Treasury securities. Liabilities of the Eagle Re Issuers consist of their mortgage insurance-linked notes, described above. |
Other Collateral
Although we use reinsurance as one of our risk management tools, reinsurance does not relieve us of our obligations to our policyholders. In the event the reinsurers are unable to meet their obligations to us, our insurance subsidiaries would be liable for any defaulted amounts. However, in all of our reinsurance transactions,consistent with the PMIERs reinsurer counterparty collateral requirements, Radian Guaranty’s reinsurers have established a trusttrusts to help secure our potential cash recoveries. In addition to the total VIE assets of the Eagle Re Issuers discussed above, the amount held in other reinsurance trusts was $221.8 million as of March 31, 2020, compared to $203.2 million as of December 31, 2019. In addition, for the Single Premium QSR Program, Radian Guaranty holds amounts received fromrelated to ceded premiums written to collateralize the reinsurers’ obligations, which is reported in reinsurance funds withheld on our condensed consolidated balance sheets. Any loss recoveries and profit commissions paid to Radian Guaranty related to the Single Premium QSR Program are expected to be realized from this account.
Other
In our title insurance business, we also use reinsurance as part of our risk distribution strategy. EnTitle Insurance’s reinsurance agreement with a third-party reinsurer provides for coverage of 100% of losses in excess of $1.0 million ultimate net loss on a per claim basis, subject to certain aggregate limits. For the three months ended March 31, 2019 and the year ended December 31, 2018, the effect of this agreement was immaterial to our results of operations. In addition, on March 27, 2018, EnTitle Insurance entered into a loss portfolio transfer reinsurance transaction in which all policies issued by EnTitle Insurance and outstanding at the time, subject to certain limitations, became reinsured by a third party.
See Note 8 of Notes to Consolidated Financial Statements in our 20182019 Form 10-K for more information about our reinsurance transactions.
8. Other Assets
The following table shows the components of other assets as of the dates indicated:
|
| | | | | | | |
| (In thousands) | March 31,
2019 | | December 31,
2018 |
| Company-owned life insurance | $ | 85,729 |
| | $ | 83,377 |
|
Right-of-use assets (1) | 47,150 |
| | — |
|
Internal-use software (2) | 46,611 |
| | 51,367 |
|
Property and equipment (3) | 39,530 |
| | 37,090 |
|
| Accrued investment income | 33,275 |
| | 34,878 |
|
| Unbilled receivables | 22,967 |
| | 19,917 |
|
| Loaned securities (Note 5) | 22,606 |
| | 27,860 |
|
| Deferred policy acquisition costs | 17,594 |
| | 17,311 |
|
| Reinsurance recoverables | 15,401 |
| | 14,402 |
|
Current federal income tax receivable (4) | — |
| | 44,506 |
|
| Other | 42,815 |
| | 36,992 |
|
| Total other assets | $ | 373,678 |
| | $ | 367,700 |
|
______________________
| |
(1) | Represents right-of-use assets recognized as a result of our adoption, as of January 1, 2019, of the new accounting and disclosure requirements for leases of property, plant and equipment. See Note 1 for additional information. Right-of-use assets are shown less accumulated amortization of $2.3 million at March 31, 2019. |
| |
(2) | Internal-use software, at cost, has been reduced by accumulated amortization of $63.7 million and $60.3 million at March 31, 2019 and December 31, 2018, respectively, as well as $3.8 million of impairment charges in the three months ended March 31, 2019, and $5.1 million of impairment charges in 2018. Amortization expense was $3.1 million and $2.8 million for the three-month periods ended March 31, 2019 and 2018, respectively. |
| |
(3) | Property and equipment at cost, less accumulated depreciation of $64.5 million and $62.9 million at March 31, 2019 and December 31, 2018, respectively. Depreciation expense was $2.1 million and $1.9 million for the three-month periods ended March 31, 2019 and 2018, respectively. |
| |
(4) | During the three months ended March 31, 2019, current federal income tax receivable was reduced by our receipt of the remaining $57.2 million refund from amounts on deposit with the IRS related to the settlement of the IRS Matter. |
Radian Group Inc.
Notes to Unaudited Condensed Consolidated Financial Statements (Continued)
8. Other Assets
The following table shows the components of other assets as of the dates indicated:
|
| | | | | | | |
| (In thousands) | March 31,
2020 | | December 31,
2019 |
| Prepaid federal income taxes (Note 9) | $ | 134,800 |
| | $ | 134,800 |
|
| Company-owned life insurance | 104,141 |
| | 105,721 |
|
| Internal-use software (net of accumulated amortization of $74,601 and $73,498) | 59,790 |
| | 58,356 |
|
| Loaned securities (Note 5) | 47,520 |
| | 66,442 |
|
| Right-of-use assets | 35,837 |
| | 37,866 |
|
| Accrued investment income | 32,559 |
| | 32,333 |
|
| Property and equipment (net of accumulated depreciation of $67,008 and $68,436) | 28,125 |
| | 29,523 |
|
| Deferred policy acquisition costs | 20,855 |
| | 20,759 |
|
| Reinsurance recoverables | 17,722 |
| | 16,976 |
|
| Unbilled receivables | 5,130 |
| | 13,772 |
|
Assets held for sale (1) | — |
| | 24,908 |
|
| Other | 26,708 |
| | 26,163 |
|
| Total other assets | $ | 513,187 |
| | $ | 567,619 |
|
______________________
| |
| (1) | Related to the sale of Clayton. See Note 4 and 7 of Notes to Consolidated Financial Statements in our 2019 Form 10-K for additional information on assets held for sale. Liabilities held for sale at December 31, 2019 are included in other liabilities on our condensed consolidated balance sheets. |
9. Income Taxes
As of March 31, 2020 and December 31, 2019, we have $2.1our current income tax liability was $42.4 million and $39.1 million, respectively, and is included as a component of federal NOL carryforwards. These NOL carryforwards relate toother liabilities in our condensed consolidated balance sheets. As of March 2018 acquisition of EnTitle Direct31, 2020 and are subject to limitation under IRC Section 382. To the extent not utilized, the NOL carryforwards will expire byDecember 31, 2019 our deferred tax year 2038.liability was $90.5 million and $71.1 million, respectively, and is included in other liabilities in our condensed consolidated balance sheets.
Certain entities within our consolidated group have generated deferred tax assets of approximately $67.7 million, relating primarily to state and local NOL carryforwards, which, if unutilized, will expire during various future tax periods. We are required to establish a valuation allowance against our deferred tax assets when it is more likely than not that all or some portion of our deferred tax assets will not be realized. At each balance sheet date, we assess our need for a valuation allowance and this assessment is based on all available evidence, both positive and negative. This requires management to exercise judgment and make assumptions regarding whether our deferred tax assets will be realized in future periods. We have determined that certain non-insurance entities within Radian Group may continue to generate taxable losses on a separate company basis in the near term and may not be able to fully utilize certain of their state and local NOLs on their state and local tax returns. Therefore, with respect to deferred tax assets relating to these state and local NOLs and other state timing adjustments, we retained a valuation allowance of $64.4$67.4 million at March 31, 2019.
In July 2018, we finalized a settlement with the IRS related to adjustments we had been contesting that resulted from the examination of our 2000 through 2007 consolidated federal income tax returns. The IRS was opposing the recognition of certain tax losses and deductions that were generated through our investment in a portfolio of non-economic REMIC residual interests and proposed denying the associated tax benefits of these items. During 2018, under the terms of the settlement, Radian utilized its qualified deposits with the U.S. Treasury to settle its $31.0 million obligation to the IRS, and during the first quarter of 2019, the IRS refunded to Radian the remaining $57.2 million that was previously on deposit. See Note 8 for additional information about this refund.2020.
As a mortgage guaranty insurer, we are eligible for a tax deduction, subject to certain limitations, under IRCInternal Revenue Code Section 832(e) for amounts required by state law or regulation to be set aside in statutory contingency reserves. The deduction is allowed only to the extent that, in conjunction with quarterly federal tax payment due dates, we purchase non-interest bearing U.S. Mortgage Guaranty Tax and Loss Bonds (“T&L Bonds”) issued by the U.S. Department of the Treasury in an amount equal to the tax benefit derived from deducting any portion of our statutory contingency reserves. As of March 31, 2020 and December 31, 2019, we held no T&L Bonds. However, we do anticipate purchasing T&L Bonds on a routine basis during the coming quarters.
For additional information on our$134.8 million of these bonds, which are included as prepaid federal income taxes including our accounting policies, see Notes 2 and 10 of Notes to Consolidated Financial Statementswithin other assets in our 2018 Form 10-K.
10. Losses and Loss Adjustment Expense
Our reserve for losses and LAE, atcondensed consolidated balance sheets. The corresponding deduction of our statutory contingency reserves resulted in the endrecognition of each period indicated, consisted of:a deferred tax liability, which is included in other liabilities in our condensed consolidated balance sheets.
|
| | | | | | | |
| (In thousands) | March 31,
2019 | | December 31,
2018 |
| Mortgage insurance loss reserves | $ | 385,361 |
| | $ | 397,891 |
|
Services loss reserves (1) | 3,423 |
| | 3,470 |
|
| Total reserve for losses and LAE | $ | 388,784 |
| | $ | 401,361 |
|
______________________
| |
(1) | A majority of this amount is subject to reinsurance, with the related reinsurance recoverables reported in other assets in our condensed consolidated balance sheet, and relates to EnTitle Insurance. See Note 7 for information about our use of reinsurance in our title insurance business. |
Radian Group Inc.
Notes to Unaudited Condensed Consolidated Financial Statements (Continued)
The following table showsFor additional information on our mortgage insuranceincome taxes, including our accounting policies, see Notes 2 and 10 of Notes to Consolidated Financial Statements in our 2019 Form 10-K.
10. Losses and Loss Adjustment Expense
Our reserve for losses and LAE, by category at the end of each period indicated:indicated, consisted of:
|
| | | | | | | |
| (In thousands) | March 31,
2019 | | December 31,
2018 |
Reserve for losses by category (1): | | | |
| Prime | $ | 240,489 |
| | $ | 242,135 |
|
| Alt-A and A minus and below | 111,955 |
| | 119,553 |
|
| IBNR and other | 13,008 |
| | 13,864 |
|
| LAE | 8,994 |
| | 10,271 |
|
| Total primary reserves | 374,446 |
| | 385,823 |
|
| Total pool reserves | 10,621 |
| | 11,640 |
|
| Total First-lien reserves | 385,067 |
| | 397,463 |
|
Other (2) | 294 |
| | 428 |
|
| Total reserve for losses | $ | 385,361 |
| | $ | 397,891 |
|
|
| | | | | | | |
| (In thousands) | March 31,
2020 | | December 31,
2019 |
Mortgage insurance loss reserves (1) | $ | 414,678 |
| | $ | 401,273 |
|
Title insurance loss reserves (2) | 3,524 |
| | 3,492 |
|
| Total reserve for losses and LAE | $ | 418,202 |
| | $ | 404,765 |
|
______________________
| |
| (1) | Includes ceded losses onPrimarily comprises first lien primary case reserves of $353.2 million and $339.8 million at March 31, 2020 and December 31, 2019, respectively. |
| |
| (2) | A portion of this amount is subject to reinsurance, transactions, which are expected to be recovered and are included inwith the related reinsurance recoverables reported in other assets in our condensed consolidated balance sheets. See Note 8. |
| |
(2) | DoesFor all periods presented, total incurred losses and paid claims for title insurance were not include our second-lien premium deficiency reserve that is included in other liabilities.material. |
The following table presents information relating to our mortgage insurance reserve for losses, including our IBNR reserve and LAE, but excluding our second-lien mortgage loan premium deficiency reserve, for the periods indicated:
| | | | Three Months Ended
March 31, | Three Months Ended
March 31, |
| (In thousands) | 2019 | | 2018 | 2020 | | 2019 |
| Balance at beginning of period | $ | 397,891 |
| | $ | 507,588 |
| $ | 401,273 |
| | $ | 397,891 |
|
Less: Reinsurance recoverables (1) | 11,009 |
| | 8,350 |
| 14,594 |
| | 11,009 |
|
| Balance at beginning of period, net of reinsurance recoverables | 386,882 |
| | 499,238 |
| 386,679 |
| | 386,882 |
|
| Add: Losses and LAE incurred in respect of default notices reported and unreported in: | | | | | | |
Current year (2) | 38,922 |
| | 36,516 |
| 41,242 |
| | 38,922 |
|
| Prior years | (18,173 | ) | | 391 |
| (5,876 | ) | | (18,173 | ) |
| Total incurred | 20,749 |
| | 36,907 |
| 35,366 |
| | 20,749 |
|
| Deduct: Paid claims and LAE related to: | | | | | | |
Current year (2) | 295 |
| | 226 |
| — |
| | 295 |
|
| Prior years | 34,294 |
| | 59,700 |
| 23,391 |
| | 34,294 |
|
| Total paid | 34,589 |
| | 59,926 |
| 23,391 |
| | 34,589 |
|
| Balance at end of period, net of reinsurance recoverables | 373,042 |
| | 476,219 |
| 398,654 |
| | 373,042 |
|
Add: Reinsurance recoverables (1) | 12,319 |
| | 8,973 |
| 16,024 |
| | 12,319 |
|
| Balance at end of period | $ | 385,361 |
| | $ | 485,192 |
| $ | 414,678 |
| | $ | 385,361 |
|
______________________
| |
| (1) | Related to ceded losses recoverable, if any, on reinsurance transactions. See Note 7 for additional information. |
| |
| (2) | Related to underlying defaulted loans with a most recent default notice dated in the year indicated. For example, if a loan had defaulted in a prior year, but then subsequently cured and later re-defaulted in the current year, that default would be considered a current year default. |
Radian Group Inc.
Notes to Unaudited Condensed Consolidated Financial Statements (Continued)
Reserve Activity
First Quarter 2019 ActivityIncurred Losses
Our mortgage insurance loss reserves at March 31, 2019 declined as compared to December 31, 2018, primarily as a result of the amount of paid claims and the favorable reserve development on prior year defaults exceeding losses incurred related to new default notices reported in the current year. Reserves established for new default notices were the primary driver of our total incurred losses for the three months ended March 31, 2020, and 2019, and they were primarily impacted by the number of new primary default notices received in the period and our related gross Default to Claim Rate assumption applied to those new defaults, which was 8.0% as of March 31, 2019. This assumed rate reflects seasonal patterns as well as a continuation of improvement in cure rates. Historically, new defaults reported in the first quarter have cured at higher rates than subsequent quarters, and we considered this pattern in developing the estimate for the quarter. The provision for losses during the first three months of 2019 was positively impacted by favorable reserve development on prior year defaults, which was primarily driven by a reduction during the period in certain Default to Claim Rate assumptions for these prior year defaults compared to the assumptions used at December 31, 2018. The reductions in Default to Claim Rate assumptions resulted from observed trends, primarily higher Cures than were previously estimated.
Total claims paid decreased for the three months ended March 31, 2019, compared to the same period in 2018. The decrease in claims paid is consistent with the ongoing decline in the outstanding default inventory.
First Quarter 2018 Activity
Our loss reserves at March 31, 2018 declined as compared to December 31, 2017, primarily as a result of the amount of paid claims continuing to outpace losses incurred related to new default notices reported in the current year. Reserves established for new default notices were the primary driver of our total incurred loss for the three months ended March 31, 2018, and they were primarily impacted by the number of new primary default notices received in the period and our relateddefaults. Our gross Default to Claim Rate assumption applied to those new defaults which, except as discussed below for FEMA Designated Areas associated with Hurricanes Harvey and Irma, was 9.5% as of March 31, 2018. This assumed rate reflects seasonal patterns7.5%, as well as a continuation of a general improvement in cure rates. The net effect of changes in reserve estimates for defaults reported in prior years was not material for the three months ended March 31, 2018.
We had assigned a 3% Default to Claim Rate assumption to the new primary defaults from FEMA Designated Areas associated with Hurricanes Harvey and Irma that were reported subsequent to those two natural disasters and through February 2018. While we observed an increase in new primary defaults from FEMA Designated Areas associated with Hurricanes Harvey and Irma, most of them cured by the end of 2018, as expected, and at higher cure rates than the rates of our general population of defaults. These incremental defaults did not have a material impact on our provision for losses as of March 31, 2018.
Mortgage Insurance Reserve Assumptions
Default to Claim Rate
Our aggregate weighted-average net Default to Claim Rate assumption (net of Claim Denials and Rescissions) used in estimating our primary reserve for losses was 33% at both March 31, 2019 and December 31, 2018. As of March 31, 2019 our grossother Default to Claim Rate assumptions on our primary portfolio ranged from 8.0% for new defaults, up to 68% for defaults not in foreclosure stage, and 72% for Foreclosure Stage Defaults. Our Default to Claim Rate estimates on defaulted loans are mainly developed based on the Stage of Default and Time in Default of the underlying defaulted loans grouped according to the period in which the default occurred, as measured by the progress toward foreclosure sale and the number of months in default. Our estimate of expected Rescissions and Claim Denials (net of expected Reinstatements) embedded in our estimated Default to Claim Rate is generally based on our recent experience. Consideration is also given to any differences in characteristics between those rescinded policies and denied claims and the loans remaining in our defaulted inventory.
Loss Mitigation
As our insurance written in years prior to and including 2008 has become a smaller percentage of our overall insured portfolio, a reduced amount of Loss Mitigation Activity has occurred with respect to the claims we receive, and we expect this general trend to continue. As a result, our future Loss Mitigation Activity is not expected to mitigate our paid losses significantly. Our estimate, with respect to future Rescissions, Claim Denials and Claim Curtailments, inclusive of claim withdrawals, reduced our loss reserve as of March 31, 2019 and December 31, 2018 by year$32 million.
Our reported Rescission, Claim Denial and Claim Curtailment activity in any given period is subject to challenge by our lender and servicer customers. We expect that a portion of previous Rescissions will be reinstated and previous Claim Denials
Radian Group Inc.
Notes to Unaudited Condensed Consolidated Financial Statements (Continued)
will be resubmitteddefaults, were unchanged as of March 31, 2020 compared to December 31, 2019. While observed trends in claim submissions and Cures during the first quarter of 2020 were more favorable than previously estimated, favorable reserve development from prior year defaults was limited as we did not make any material adjustments to our reserve assumptions during the period due primarily to increased uncertainty that such favorable trends would persist given the potential impacts of the COVID-19 pandemic. See Note 1 for additional information on the elevated risks and uncertainties resulting from the COVID-19 pandemic to our business and Note 2 of Notes to Consolidated Financial Statements in our 2019 Form 10-K for discussion of the reserving methodology for the mortgage insurance industry, which requires that reserves for losses are generally not established until receipt of notification from servicers that a borrower has missed two payments.
Our gross default to claim rate assumption applied to new defaults was 8.0% as of March 31, 2019. Our provision for losses during the first three months of 2019 was positively impacted by favorable reserve development on prior year defaults. This favorable development was primarily driven by a reduction during the periods in certain Default to Claim Rate assumptions for these prior year defaults based on observed trends, primarily higher Cures than previously estimated.
Claims Paid
Total claims paid decreased for the three months ended March 31, 2020, compared to the same period in 2019. The decrease in claims paid is consistent with the required documentationongoing decline in the outstanding default inventory.
For additional information about our Reserve for Losses and ultimately paid; therefore, we have incorporated this expectation intoLAE, including our IBNR reserve estimate. Our IBNR reserve estimateaccounting policies, see Notes 2 and 11 of $10.4 million and $11.3 million at March 31,Notes to Consolidated Financial Statements in our 2019 and December 31, 2018, respectively, includes reserves for this activity.Form 10-K.
11. Senior NotesBorrowings and Financing Activities
The carrying value of our senior notesdebt at March 31, 20192020 and December 31, 20182019 was as follows:
|
| | | | | | | | |
| (In thousands) | | March 31,
2019 | | December 31,
2018 |
| 5.500% | Senior Notes due 2019 | $ | 158,502 |
| | $ | 158,324 |
|
| 5.250% | Senior Notes due 2020 | 232,961 |
| | 232,729 |
|
| 7.000% | Senior Notes due 2021 | 196,056 |
| | 195,867 |
|
| 4.500% | Senior Notes due 2024 | 443,678 |
| | 443,428 |
|
| | Total Senior Notes | $ | 1,031,197 |
| | $ | 1,030,348 |
|
|
| | | | | | | |
| (In thousands) | March 31,
2020 | | December 31,
2019 |
| Senior notes: | | | |
| 4.500% Senior Notes due 2024 | $ | 444,707 |
| | $ | 444,445 |
|
| 4.875% Senior Notes due 2027 | 442,877 |
| | 442,665 |
|
| Total senior notes | $ | 887,584 |
| | $ | 887,110 |
|
| | | | |
| FHLB advances: | | | |
| FHLB advances due 2020 | $ | 97,902 |
| | $ | 79,002 |
|
| FHLB advances due 2021 | 24,000 |
| | 19,000 |
|
| FHLB advances due 2022 | 16,925 |
| | 11,925 |
|
| FHLB advances due 2023 | 14,994 |
| | 14,994 |
|
| FHLB advances due 2024 | 9,954 |
| | 9,954 |
|
| FHLB advances due 2025 | 9,985 |
| | — |
|
| Total FHLB advances | $ | 173,760 |
| | $ | 134,875 |
|
12. Other Liabilities
The following table shows the components of other liabilities as of the dates indicated:
|
| | | | | | | |
| (In thousands) | March 31,
2019 | | December 31,
2018 |
| FHLB advances | $ | 108,532 |
| | $ | 82,532 |
|
| Deferred ceding commission | 88,110 |
| | 91,400 |
|
| Lease liability | 70,927 |
| | — |
|
Payable for securities (1) | 35,981 |
| | 7,949 |
|
| Current federal income taxes | 25,245 |
| | — |
|
| Accrued compensation | 19,112 |
| | 61,452 |
|
Amount payable on the return of cash collateral under securities lending agreements (2) | 6,233 |
| | 11,699 |
|
| Other | 65,330 |
| | 78,627 |
|
| Total other liabilities | $ | 419,470 |
| | $ | 333,659 |
|
______________________
| |
(1) | Represents the payable for purchases of securities that have not yet settled as of the balance sheet date. |
| |
(2) | Amounts payable on the return of cash collateral under securities lending agreements are classified as other liabilities in our condensed consolidated balance sheets. See Note 5 for additional information. |
FHLB Advances
As of March 31, 2019, Radian Guaranty and Radian Reinsurance2020, we had $108.5$173.8 million of fixed-rate advances outstanding with a weighted average interest rate of 2.77%1.50%. Interest on the FHLB advances is payable quarterly, or at maturity if the term of the advance is less than 90 days. As of March 31, 2019, $86.5 million of the FHLB advances mature in 2019, $3.0 million mature in 2020, $8.0 million mature in 2021, $9.0 million mature in 2023, and $2.0 million mature in 2024 and thereafter. Principal is due at maturity. For obligations with maturities greater than or equal to 90 days, we may prepay the debt at any time, subject to a prepayment fee calculation.
The FHLB advances are required to be collateralized by eligible assets with a market value that must be maintained at a minimum of approximately 103% to 105% of the principal balance of the FHLB advances. Our fixed-maturities available for sale include securities totaling $185.7 million and $143.1 million at March 31, 2020 and December 31, 2019, respectively, which serve as collateral for our FHLB advances to satisfy this requirement. See Note 1312 of Notes to Consolidated Financial Statements in our 20182019 Form 10-K for additional information about our FHLB advances.
Lease Liability
Our lease liability represents the present value of future lease payments over the lease term. Our leases do not provide a readily determinable implicit rate. Therefore, we must estimate our incremental borrowing rate, on a collateralized basis, to discount the lease payments based on information available at lease commencement. Our leases expire periodically through August 2032, and contain provisions for scheduled periodic rent increases. We estimate the incremental borrowing rate based on the yields of several Radian Group corporate bonds, as adjusted to reflect a collateralized borrowing rate, which mature periodically through 2024. While the majority of our lease population expires within one year of one of the corporate bonds,
Radian Group Inc.
Notes to Unaudited Condensed Consolidated Financial Statements (Continued)
our more significant leases expire more than one year beyond 2024. For those leases, we adjust the corporate bond rate for both U.S. Treasury rate yields and a corporate spread adjustment determined from recent market data, resulting in discount rates ranging from 4.22% to 7.08%.
The following tables provide additional information related to our leases, including: (i) the components of our total lease cost; (ii) the cash flows arising from our lease transactions; (iii) supplemental balance sheet information; (iv) the weighted-average remaining lease term; (v) the weighted-average discount rate used for our leases; and (vi) the remaining maturities of our lease liabilities, as of and for the periods indicated:
|
| | | |
| ($ in thousands) | Three Months Ended March 31, 2019 |
| Lease cost | |
| Operating lease cost | $ | 2,319 |
|
| Short-term lease cost | 23 |
|
| Total lease cost | $ | 2,342 |
|
| | |
| Cash paid for amounts included in the measurement of lease liabilities: | |
| Operating cash flows from operating leases | $ | (2,637 | ) |
| | |
|
| | | |
| ($ in thousands) | March 31, 2019 |
| Operating leases: | |
Operating lease right-of-use assets (1) | $ | 47,150 |
|
Operating lease liabilities (2) | 70,927 |
|
| | |
| Weighted-average remaining lease term - operating leases (in years) | 10.4 years |
|
| | |
| Weighted-average discount rate - operating leases | 6.75 | % |
| | |
| Remaining maturities of lease liabilities for the remainder of 2019 and thereafter is as follows: | |
| 2019 | $ | 7,873 |
|
| 2020 | 10,428 |
|
| 2021 | 9,964 |
|
| 2022 | 10,136 |
|
| 2023 | 10,275 |
|
| 2024 and thereafter | 56,542 |
|
| Total lease payments | 105,218 |
|
| Less: Imputed interest | (34,291 | ) |
Present value of lease liabilities (2) | $ | 70,927 |
|
______________________
| |
(1) | Classified in other assets in our condensed consolidated balance sheets. See Note 8. |
| |
(2) | Classified in other liabilities in our condensed consolidated balance sheets. |
Radian Group Inc.
Notes to Unaudited Condensed Consolidated Financial Statements (Continued)
Pursuant to the previous lease accounting standard, rent expense for the three months ended March 31, 2018 was $1.2 million. Our commitment for non-cancelable leases in future years as of December 31, 2018 was as follows (in thousands):
|
| | | |
| 2019 | $ | 11,310 |
|
| 2020 | 10,847 |
|
| 2021 | 10,165 |
|
| 2022 | 10,100 |
|
| 2023 | 10,251 |
|
| 2024 and thereafter | 56,317 |
|
| Total | $ | 108,990 |
|
At December 31, 2018, there were no future minimum receipts expected from sublease rental payments.
Revolving Credit Facility
On October 16, 2017, Radian Group entered intohas in place a three-year, $225$267.5 million unsecured revolving credit facility with a syndicate of bank lenders. TermsEffective May 6, 2020, the credit facility was amended to extend the maturity date from October 16, 2020 to January 18, 2022 and to change a defined term related to LIBOR replacement rates. No other terms or conditions of the credit facility include an accordion feature that allowswere amended. At March 31, 2020, Radian Group at its option, to increase the total borrowing capacity during the termwas in compliance with all of the agreement, subject to our obtaining the necessary increased commitments from lenders (which may include then existing or other lenders), up to a total of $300 million. Effective October 26, 2018, Radian Group exercised its rights under the accordion feature to add another global bank to the existing syndicate of bank lenders and to increase the amount of total commitments under the credit facility by $42.5 million, bringing the aggregate unsecuredcovenants, and there were 0 amounts outstanding. For more information regarding our revolving credit facility, to $267.5 million.
Subject toincluding certain limitations, borrowings under the credit facility may be used for working capital and general corporate purposes, including capital contributions to Radian Group’s insurance and reinsurance subsidiaries as well as growth initiatives. The credit facility contains customary representations, warranties, covenants,of its terms and conditions. Our ability to borrow under the credit facility is conditioned on the satisfaction of certain financial and other covenants, including covenants related to minimum net worth and statutory surplus, a maximum debt-to-capitalization level, limits on certain types of indebtedness and liens, minimum liquidity levels and Radian Guaranty’s eligibility as a private mortgage insurer with the GSEs. Seesee Note 1312 of Notes to Consolidated Financial Statements in our 20182019 Form 10-K. At March 31, 2019, Radian Group was in compliance with all the covenants and there were no amounts outstanding under this revolving credit facility.
13.12. Commitments and Contingencies
We are routinely involved in a number of legal actions and proceedings, including litigation and other disputes arising in the ordinary course of our business. The legal and regulatory matters discussed below and in our 20182019 Form 10-K could result in adverse judgments, settlements, fines, injunctions, restitutions or other relief that could require significant expenditures or have other effects on our business. Management believes, based on current knowledge and after consultation with counsel, that the outcome of such actions will not have a material adverse effect on our consolidated financial condition. However, theThe outcome of litigation and other legal and regulatory matters and proceedings is inherently uncertain, and it is possible that one1 or more of the matters currently pending or threatened could have an unanticipated adverse effect on our liquidity, financial condition or results of operations for any particular period.
On December 22, 2016, Ocwen Loan Servicing, LLC and Homeward Residential, Inc. (collectively, “Ocwen”) filed a complaint in the U.S. District Court for the Eastern District of Pennsylvania against Radian Guaranty alleging breach of contract and bad faith claims and seeking monetary damages and declaratory relief. Ocwen has also initiated similar legal proceedings against several other mortgage insurers. On December 17, 2016, Ocwen separately filed a parallel arbitration petition against Radian Guaranty before the American Arbitration Association (“AAA”) asserting substantially the same allegations (the “Arbitration”). Ocwen’s filings together listed 9,420 mortgage insurance certificates issued under multiple insurance policies, including Pool Insurance policies, as subject to the dispute. On June 5, 2017, Ocwen filed an amended complaint and an amended petition (collectively, the “Amended Filings”) with both the court and the AAA, respectively, together listing 8,870 certificates as subject to the dispute. On April 11, 2018, the parties entered into a confidential agreement with respect to all certificates subject to the dispute. The confidential agreement resolved certain categories of claims involved in the dispute and, on April 12, 2018, the parties filed a stipulation of voluntary dismissal of the federal court proceeding and the trial judge issued an Orderorder dismissing all claims and counterclaims subject to the parties’ agreement. Radian Guaranty was not required to make any payment in connection with this confidential agreement. Pursuant to the confidential agreement, the
Radian Group Inc.
Notes to Unaudited Condensed Consolidated Financial Statements (Continued)
parties: (1) dismissed the federal court proceeding; (2) narrowed the scope of the dispute to Ocwen’s breach of contract claims seeking payment of insurance benefits on approximately 2,500 certificates that Ocwen was previously pursuing through the Amended Filings; and (3) agreed to resolve the remaining dispute through the Arbitration. The Arbitration is proceeding, and Radian Guaranty believes that Ocwen’s allegations and claims in the legal proceedings described above are without merit and legally deficient, and planscontinues to defend theseagainst Ocwen’s claims vigorously. We are not able to estimate a reasonably possible loss, if any, or range of loss in this matter because of the current stage of the Arbitration.
On August 31, 2018, Nationstar Mortgage LLC d/b/a Mr. Cooper (“Nationstar”) filed a complaint in the U.S. District Court for the Eastern District of Pennsylvania against Radian Guaranty (the “Complaint”) alleging breach of contract, bad faith, equitable indemnification, unjust enrichment, and conversion claims and seeking monetary damages and declaratory relief. TheExhibit 1 to the Complaint lists 3,014 mortgage insurance certificates issued under multiple insurance policies as subject to disputes involving insurance coverage decisions. Thedecisions (the “Coverage Disputed Loans”). Exhibit 2 to the Complaint further lists 2,231 mortgage insurance certificates issued under multiple insurance policies as subject to disputes involving premium refund requests. Radian Guaranty believes that Nationstar’s allegations and claims in the legal proceedings described above are without merit and legally deficient, and plans to defend these claims vigorously. In December 2018, Radian Guaranty filed a motion to dismiss the Complaint. In March 2019, the trial judge issued an Orderorder granting in part, and denying in part, our motion to dismiss, and dismissed Nationstar’s unjust enrichment and conversion claims. In May 2019, Radian Guaranty filed an answer, with affirmative defenses and counterclaims, in response to the Complaint. WeOn September 23, 2019, the trial judge entered as an order a joint stipulation submitted by Nationstar and Radian Guaranty that narrowed the scope of the dispute involving Coverage Disputed Loans to claims relating to 1,704 mortgage insurance certificates. Radian Guaranty believes that Nationstar’s allegations and claims in the legal proceedings described above are not ablewithout merit and legally deficient, and continues to defend against these claims vigorously.
In the three months ended March 31, 2020, there was no change in the Company’s previously established IBNR reserve estimate a reasonably possible loss, if any, or rangerelated to our best estimate of our probable loss in this matter becauseconnection with the above legal proceedings. While Radian believes it has substantial defenses in these matters and intends to continue to defend against these claims vigorously, it is not feasible to predict the ultimate outcome of these disputes, and the preliminary stageCompany could in the future be required to pay amounts as a result of the litigation.settlements or decisions in these matters, potentially in excess of accruals.
Radian Group Inc.
Notes to Unaudited Condensed Consolidated Financial Statements (Continued)
We also are periodically subject to reviews and audits, as well as inquiries, information-gathering requests and investigations. In connection with these matters, from time to time we receive requests and subpoenas seeking information and documents related to aspects of our business.
Our Master Policies establish the timeline within which any suit or action arising from any right of an insured under the policy generally must be commenced. In general, any suit or action arising from any right of an insured under the policy must be commenced within two years after such right first arose for primary insurance and within three years for certain other policies, including certain Pool Insurance policies. Although we believe that our Loss Mitigation Activities are justified under our policies, from time to time we face challenges from certain lender and servicer customers regarding our Loss Mitigation Activities, which have resulted in some reversals of our decisions regarding Rescissions, Claim Denials or Claim Curtailments. We are currently in discussions with these customers regarding our Loss Mitigation Activities and claim payment practices, which if not resolved,Activities. These challenges could result in additional arbitration or judicial proceedings and we may need to reassume the risk on, and increase loss reserves for, the associated policies or pay additional claims. See Note 10
The legal and regulatory matters discussed above could result in adverse judgments, settlements, fines, injunctions, restitutions or other relief that could require significant expenditures or have other effects on our business in excess of amounts we have established as reserves for such matters.
Lease Liability
Our lease liability represents the present value of future lease payments over the lease term. Our leases do not provide a readily determinable implicit rate. Therefore, we must estimate our incremental borrowing rate, on a collateralized basis, to discount the lease payments based on information available at lease commencement. Our leases expire periodically through August 2032, and contain provisions for scheduled periodic rent increases. We estimate the incremental borrowing rate based on the yields of Radian Group corporate bonds, as adjusted to reflect a collateralized borrowing rate, resulting in discount rates ranging from 4.22% to 7.08%. While the majority of our leases expire within one year of one of the Radian Group corporate bonds, our more significant leases do not. For those leases, we adjust the corporate bond rate for both U.S. Department of the Treasury rate yields and a corporate spread adjustment determined from recent market data.
The following tables provide additional information.information related to our leases, including: (i) the components of our total lease cost; (ii) the cash flows arising from our lease transactions; (iii) supplemental balance sheet information; (iv) the weighted-average remaining lease term; (v) the weighted-average discount rate used for our leases; and (vi) the remaining maturities of our lease liabilities, as of and for the periods indicated:
|
| | | | | | | |
| | Three Months Ended March 31, |
| ($ in thousands) | 2020 | | 2019 |
| Operating lease cost | $ | 2,244 |
| | $ | 2,319 |
|
| Short-term lease cost | 11 |
| | 23 |
|
| Total lease cost | $ | 2,255 |
| | $ | 2,342 |
|
| | | | |
| Cash paid for amounts included in the measurement of lease liabilities: | | | |
| Operating cash flows from operating leases | $ | (2,574 | ) | | $ | (2,637 | ) |
Radian Group Inc.
Notes to Unaudited Condensed Consolidated Financial Statements (Continued)
|
| | | |
| ($ in thousands) | March 31, 2020 |
| Operating leases: | |
Operating lease right-of-use assets (1) | $ | 35,837 |
|
Operating lease liabilities (2) | 57,097 |
|
| | |
| Weighted-average remaining lease term - operating leases (in years) | 9.8 years |
|
| | |
| Weighted-average discount rate - operating leases | 6.81 | % |
| | |
| Remaining maturities of lease liabilities for the remainder of 2020 and thereafter is as follows: | |
| 2020 | $ | 7,567 |
|
| 2021 | 9,299 |
|
| 2022 | 9,474 |
|
| 2023 | 9,593 |
|
| 2024 | 9,316 |
|
| 2025 and thereafter | 44,350 |
|
| Total lease payments | 89,599 |
|
| Less: Imputed interest | (32,502 | ) |
Present value of lease liabilities (2) | $ | 57,097 |
|
______________________
| |
| (1) | Classified in other assets in our condensed consolidated balance sheets. See Note 8. |
| |
| (2) | Classified in other liabilities in our condensed consolidated balance sheets. |
See Note 141 for additional information about our leases and Note 13 of Notes to Consolidated Financial Statements in our 20182019 Form 10-K for further information regarding our commitments and contingencies and our accounting policies for contingencies.
14.13. Capital Stock
Share Repurchase Program
On August 16, 2018,14, 2019, Radian Group’s board of directors approved a share repurchase program that authorizedauthorizes the Company to repurchasespend up to $100$200 million, of itsexcluding commissions, to repurchase Radian Group common stock in the open market or in privately negotiated transactions, based on market and business conditions, stock price and other factors. On March 20, 2019, Radian Group’s board of directors approved a $150 million increase in authorization for this program, bringing the total authorization to repurchase shares up to $250 million, excluding commissions. Radian operates this program pursuant to a trading plan under Rule 10b5-1 of the Exchange Act, which permits the companyCompany to purchase shares, at pre-determined price targets, when it may otherwise be precluded from doing so. On February 13, 2020, Radian Group’s board of directors authorized a $275 million increase in this program, bringing the total authorization to repurchase shares up to $475 million, excluding commissions, and extended the expiration of this program extension from July 31, 2020 to August 31, 2021. During the three months ended March 31, 2019,2020, the Company purchased 1,546,67411,036,248 shares at an average price of $20.54 per share,$20.51, including commissions. As of March 31, 2019,2020, purchase authority of up to $218.2$198.9 million remained available under this program, which expires on July 31, 2020.program.
Subsequent toEffective March 31, 2019,19, 2020, the Company purchased 4,131,329 shares of its common stock undersuspended its share repurchase program and canceled its current 10b5-1 plan. Radian may initiate a new 10b5-1 plan at its discretion in the future, during an average priceopen trading window and in accordance with SEC rules. The expiration date of $21.94 perthe current share including commissions. As of May 6, 2019, purchase authority of up to a maximum of $127.7 million remained available under this program.repurchase authorization remains August 31, 2021.
Other Purchases
We may purchase shares on the open market to settle stock options exercised by employees and purchases under our Employee Stock Purchase Plan. In addition, upon the vesting of certain restricted stock awards under our equity compensation plans, we may withhold from such vested awards shares of our common stock to satisfy the tax liability of the award recipients.
Dividends and Dividend Equivalents
In each of the quarters during 2019 we declared quarterly cash dividends on our common stock equal to $0.0025 per share. On February 13, 2020, Radian Group’s board of directors authorized an increase to the Company’s quarterly cash dividend from $0.0025 to $0.125 per share, beginning with the dividend declared in the first quarter of 2020.
Radian Group Inc.
Notes to Unaudited Condensed Consolidated Financial Statements (Continued)
Dividends Paid
In eachFebruary 2020, the Compensation and Human Capital Management Committee of Radian Group’s board of directors approved the amendment of outstanding performance-based restricted stock unit awards and time-based restricted stock unit awards held by eligible employees (including former employees) and directors of the quarters during 2019 and 2018, weCompany to add certain dividend equivalent rights to such equity awards. Therefore, beginning in the first quarter of 2020, dividend equivalents are accrued on these awards when dividends are declared quarterly cash dividends on ourthe Company’s common stock equal to $0.0025 per share.stock.
15.14. Accumulated Other Comprehensive Income (Loss)
The following table shows the rollforward of accumulated other comprehensive income (loss) as of the periods indicated: | | | | Three Months Ended March 31, 2019 | Three Months Ended March 31, 2020 |
| (In thousands) | Before Tax | | Tax Effect | | Net of Tax | Before Tax | | Tax Effect | | Net of Tax |
| Balance at beginning of period | $ | (77,114 | ) | | $ | (16,194 | ) | | $ | (60,920 | ) | $ | 139,858 |
| | $ | 29,370 |
| | $ | 110,488 |
|
| Other comprehensive income (loss): | | | | | | | | | | |
| Unrealized gains (losses) on investments: | | | | | | | | | | |
| Unrealized holding gains (losses) arising during the period | 98,763 |
| | 20,740 |
| | 78,023 |
| (91,511 | ) | | (19,218 | ) | | (72,293 | ) |
Less: Reclassification adjustment for net gains (losses) included in net income (1) | (495 | ) | | (104 | ) | | (391 | ) | 10,625 |
| | 2,231 |
| | 8,394 |
|
| Net unrealized gains (losses) on investments | 99,258 |
| | 20,844 |
| | 78,414 |
| (102,136 | ) | | (21,449 | ) | | (80,687 | ) |
| Other comprehensive income (loss) | 99,258 |
| | 20,844 |
| | 78,414 |
| (102,136 | ) | | (21,449 | ) | | (80,687 | ) |
| Balance at end of period | $ | 22,144 |
| | $ | 4,650 |
| | $ | 17,494 |
| $ | 37,722 |
| | $ | 7,921 |
| | $ | 29,801 |
|
| | | | | | | | | | | |
| | Three Months Ended March 31, 2018 | Three Months Ended March 31, 2019 |
| (In thousands) | Before Tax | | Tax Effect | | Net of Tax | Before Tax | | Tax Effect | | Net of Tax |
| Balance at beginning of period | $ | 32,669 |
| | $ | 9,584 |
| | $ | 23,085 |
| $ | (77,114 | ) | | $ | (16,194 | ) | | $ | (60,920 | ) |
| Cumulative effect of adopting the accounting standard update for financial instruments | 284 |
| | 60 |
| | 224 |
| |
| Cumulative effect of adopting the accounting standard update for the reclassification of certain tax effects | — |
| | (2,724 | ) | | 2,724 |
| |
| Balance adjusted for cumulative effect of adopting accounting standard updates | 32,953 |
| | 6,920 |
| | 26,033 |
| |
| Other comprehensive income (loss): | | | | | | | | | | |
| Unrealized gains (losses) on investments: | | | | | | | | | | |
| Unrealized holding gains (losses) arising during the period | (76,763 | ) | | (16,120 | ) | | (60,643 | ) | 98,763 |
| | 20,740 |
| | 78,023 |
|
Less: Reclassification adjustment for net gains (losses) included in net income (1) | (3,964 | ) | | (832 | ) | | (3,132 | ) | (495 | ) | | (104 | ) | | (391 | ) |
| Net unrealized gains (losses) on investments | (72,799 | ) | | (15,288 | ) | | (57,511 | ) | 99,258 |
| | 20,844 |
| | 78,414 |
|
| Unrealized foreign currency translation adjustments | 4 |
| | 1 |
| | 3 |
| |
| Other comprehensive income (loss) | (72,795 | ) | | (15,287 | ) | | (57,508 | ) | 99,258 |
| | 20,844 |
| | 78,414 |
|
| Balance at end of period | $ | (39,842 | ) | | $ | (8,367 | ) | | $ | (31,475 | ) | $ | 22,144 |
| | $ | 4,650 |
| | $ | 17,494 |
|
______________________
| |
| (1) | Included in net gains (losses) on investments and other financial instruments on our condensed consolidated statements of operations. |
16.15. Statutory Information
We prepareState insurance regulations include various capital requirements and dividend restrictions based on our insurance subsidiaries’ statutory financial statements in accordance with the accounting practices required or permitted, if applicable, by the insurance departmentsposition and results of the respective states of domicile of our insurance subsidiaries. Required SAPP are established by a variety of NAIC publications,operations, as well as state laws, regulations and general administrative rules. In addition, insurance departments have the right to permit other specific practices that may deviate from prescribed practices.described below. As of March 31, 2019, we did not have any prescribed or permitted statutory accounting practices for2020, the amount of restricted net assets held by our consolidated insurance subsidiaries (which represents our equity investment in those insurance subsidiaries) totaled $4.0 billion of our consolidated net assets.
Under state insurance regulations, our mortgage insurance subsidiaries are required to maintain minimum surplus levels. In certain RBC States, mortgage insurers licensed in those states must also satisfy a Statutory RBC Requirement that resultedis a minimum ratio of statutory capital relative to the level of net RIF, or Risk-to-capital. Other RBC States require mortgage insurers licensed in reported statutorythose states to satisfy a MPP Requirement that is calculated on both risk and surplus levels. Our mortgage insurance subsidiaries were in compliance with the Statutory RBC Requirements or risk-based capital being different from what would have been reported had NAIC statutory accounting practices been followed.MPP Requirements, to the extent applicable, in each of the RBC States as of March 31, 2020.
Radian Group Inc.
Notes to Unaudited Condensed Consolidated Financial Statements (Continued)
State insurance regulations include various capital requirements and dividend restrictions based on our insurance subsidiaries’ statutory financial position and results of operations, as described below. Our failureIn addition, in order to maintain adequate levels of capital could leadbe eligible to interventioninsure loans purchased by the various insurance regulatory authorities, which could materially and adversely affect our business, business prospects and financial condition. As of March 31, 2019, the amount of restricted net assets held by our consolidated insurance subsidiaries (which represents our equity investment in those insurance subsidiaries) totaled $3.9 billion of our consolidated net assets.
Under state insurance regulations, Radian Guaranty is required to maintain minimum surplus levels and, in certain states, a minimum ratio of statutory capital relative to the level of net RIF, or Risk-to-capital. There are 16 RBC States that currently impose a Statutory RBC Requirement. The most common Statutory RBC Requirement is that aGSEs, mortgage insurer’s Risk-to-capital may not exceed 25 to 1. In certain of the RBC States, a mortgage insurer must satisfy a MPP Requirement. The statutory capital requirements for the non-RBC States are de minimis (ranging from $1 million to $5 million); however, the insurance laws of these states generally grant broad supervisory powers to state agencies or officials to enforce rules or exercise discretion affecting almost every significant aspect of the insurance business, including the power to revoke or restrict an insurance company’s ability to write new business. Unless an RBC State grants a waiver or other form of relief, if a mortgage insurer,insurers such as Radian Guaranty must meet the GSEs’ eligibility requirements, or PMIERs. At March 31, 2020, Radian Guaranty is notan approved mortgage insurer under the PMIERs and is in compliance with the Statutory RBC Requirementcurrent PMIERs financial requirements. Under the PMIERs there are increased financial requirements for loans in default, including as a result of that state,natural disasters and pandemics. As a result, increases in defaults related to the mortgage insurer may be prohibited from writing new mortgage insurance business in that state. Radian Guaranty’s domiciliary state, Pennsylvania, is not one of the RBC States.
COVID-19 pandemic would subject Radian Guaranty wasto an increase in Minimum Required Assets under the PMIERs, and therefore, could impact our compliance with the Statutory RBC RequirementsPMIERs or MPP Requirements, as applicable, in eachnegatively impact our results of the RBC States as of March 31, 2019. The NAIC is in the process of developing a new Model Act for mortgage insurers, which is expected to include, among other items, new capital adequacy requirements for mortgage insurers. In May 2016, a working group of state regulators released an exposure draft of this Model Act. The process for developing this framework is ongoing. While the outcome and timing of this process are uncertain, the new Model Act, if and when finalized by the NAIC, has the potential to increase capital requirements in those states that adopt the Model Act. However, we continue to believe the changes to the Model Act will not result in financial requirements that require greater capital than the level currently required under the PMIERs financial requirements.operations. See Note 1 hereinfor discussion about the elevated risks and uncertainties associated with the COVID-19 pandemic and Note 118 of Notes to Consolidated Financial Statements in our 20182019 Form 10-K for additional information regarding the PMIERs, which set requirements for private mortgage insurers to remain approved insurers of loans purchased by the GSEs.PMIERs.
Radian Guaranty’s Risk-to-capital calculation appears in the table below. For purposes of the Risk-to-capital requirements imposed by certain states, statutory capital is defined as the sum of statutory policyholders’ surplus plus statutory contingency reserves.
| | | | March 31,
2019 | | December 31,
2018 | March 31,
2020 | | December 31,
2019 |
| ($ in millions) | | | | | | |
RIF, net (1) | $ | 41,283.5 |
| | $ | 40,711.3 |
| $ | 49,820.3 |
| | $ | 44,076.7 |
|
| | | | | | | |
| Common stock and paid-in capital | $ | 1,416.0 |
| | $ | 1,416.0 |
| $ | 1,041.0 |
| | $ | 1,041.0 |
|
| Surplus Note | 100.0 |
| | 100.0 |
| 300.0 |
| | 100.0 |
|
| Unassigned earnings (deficit) | (651.1 | ) | | (701.9 | ) | (819.8 | ) | | (503.3 | ) |
| Statutory policyholders’ surplus | 864.9 |
| | 814.1 |
| 521.2 |
| | 637.7 |
|
| Contingency reserve | 2,224.5 |
| | 2,109.9 |
| 3,089.6 |
| | 2,607.8 |
|
| Statutory capital | $ | 3,089.4 |
| | $ | 2,924.0 |
| $ | 3,610.8 |
| | $ | 3,245.5 |
|
| | | | | | | |
| Risk-to-capital | 13.4:1 |
| | 13.9:1 | 13.8:1 |
| | 13.6:1 |
______________________
| |
| (1) | Excludes risk ceded through all reinsurance programs (including with affiliates) and RIF on defaulted loans. |
Radian Guaranty’s statutory capital increased by $165.4$365.3 million in the first three months of 2019,2020, primarily due to Radian Guaranty’s statutory net income of $165.1$195.5 million during this period.period and the impact of the additional surplus note issued in January 2020, as described below. The net decreaseincrease in Radian Guaranty’s Risk-to-capital in the first three months of 20192020 was primarily due to the increase in overall statutory capital,RIF resulting from both NIW and the termination of the intercompany reinsurance agreement as described below, partially offset by anthe increase in RIF.overall statutory capital. Due to Radian Guaranty’s negative unassigned surplus position, 0 dividends or other ordinary distributions can be paid in 2020.
The Risk-to-capital ratio for our combined mortgage insurance operations was 12.4 to 1 as of March 31, 2019,2020, compared to 12.812.3 to 1 as of December 31, 2018.
Radian Group Inc.
Notes to Unaudited Condensed Consolidated Financial Statements (Continued)
In April 2019,January 2020, in connection with the termination of an intercompany reinsurance agreement between Radian Reinsurance and Radian Guaranty, Radian Reinsurance transferred $6.0 billion in RIF to Radian Guaranty and released substantially all of its contingency reserves to unassigned surplus. In turn, Radian Guaranty established equivalent contingency reserves with a corresponding decrease to its unassigned surplus. As part of these actions, the Pennsylvania Insurance Department approved a $375$465 million distributionreturn of capital from Radian GuarantyReinsurance to Radian Group which was paid on April 30, 2019 inas well as the formtransfer of $200 million of cash and marketable securities.securities from Radian Group to Radian Guaranty in exchange for a surplus note. This transfer was approvedintercompany surplus note has a 3% interest rate and a stated maturity of January 31, 2030. The surplus note may be redeemed at any time upon 30 days prior notice, subject to a request by Radian Guaranty for the approval of the Pennsylvania Insurance Department as an Extraordinary DistributionDepartment.
For a description of our compliance with statutory and will result in a $375 million decrease in Radian Guaranty’sother regulations for our mortgage insurance and title insurance businesses, including statutory policyholders’ surplus.
EnTitle Insurance
EnTitle Insurance’s statutory policyholders’ surpluscapital requirements and statutory net loss were $26.1 million and $0.4 million, respectively, asdivided restrictions, see Note 18 of and for the three months ended March 31, 2019.
Through EnTitle Insurance, we maintain escrow deposits as a serviceNotes to our customers. Amounts held in escrow and excluded from assets and liabilitiesConsolidated Financial Statements in our condensed consolidated balance sheets totaled $2.4 million and $4.7 million as of March 31, 2019 and December 31, 2018, respectively. These amounts were held at third-party financial institutions and not considered assets of the Company. Should one or more of the financial institutions at which escrow deposits are maintained fail, there is no guarantee that we would recover the funds deposited, whether through Federal Deposit Insurance Corporation coverage or otherwise. In the event of any such failure, we could be held liable for the disposition of these funds owned by third parties.Form 10-K.
Part I. Item 2. Management’s Discussion and Analysis of Financial Condition and Results of Operations
Item 2. Management’s Discussion and Analysis of Financial Condition and Results of Operations.
The following analysis ofdisclosures in this quarterly report are complementary to those made in our financial condition2019 Form 10-K and results of operations should be read in conjunction with our unaudited condensed consolidated financial statements and the notes thereto included in this report, andas well as our audited financial statements, notes thereto and Management’s Discussion and Analysis of Financial Condition and Results of Operations included in our 20182019 Form 10-K,10-K.
Subsequent to the sale of Clayton in January 2020, our Chief Executive Officer (Radian’s chief operating decision maker) implemented certain organizational changes that caused the composition of our reportable segments to change. See Note 3 of Notes to Unaudited Condensed Consolidated Financial Statements for a more complete understandinginformation regarding the basis of our segment reporting, including the related allocations and the impacts of the sale of Clayton in January 2020 and subsequent organizational changes made in the first quarter of 2020.
The following analysis of our financial positioncondition and results of operations.operations for the three months ended March 31, 2020 provides information that evaluates our financial condition as of March 31, 2020 compared with December 31, 2019 and our results of operations for the three months ended March 31, 2020, compared to the same period last year. Certain terms and acronyms used throughout this report are defined in the Glossary of Abbreviations and Acronyms included as part of this report. In addition, investors should review the “Cautionary Note Regarding Forward-LookingStatements— Statements—Safe Harbor Provisions” above, “Item 1A. Risk Factors” in our 2019 Form 10-K and “Item 1A. Risk Factors” in our 2018 Form 10-Kthis report for a discussion of those risks and uncertainties that have the potential to adversely affect our business, financial condition, results of operations, cash flows or prospects. Our results of operations for interim periods are not necessarily indicative of results to be expected for the full year or for any other period. See “Overview” and Note 1 of Notes to Unaudited Condensed Consolidated Financial Statements for additional information.
|
| |
| Index to Management’s Discussion and Analysis of Financial Condition and Results of Operations |
| | PAGE |
| |
| |
| |
| |
| |
| |
| |
| |
| |
Overview
We are a diversified mortgage and real estate services business, withproviding both credit-related mortgage insurance coverage and a broad array of other mortgage and real estate services. We have two reportable business segments—Mortgage Insurance and Services.Real Estate. Our Mortgage Insurance segment provides credit-related insurance coverage, principally through private mortgage insurance, on residential first-lien mortgage loans, as well as other credit risk management and contract underwriting solutions, to mortgage lending institutions and mortgage credit investors. We provide our mortgage insurance products and services mainly through our wholly-owned subsidiary, Radian Guaranty. Our ServicesReal Estate segment is primarily a fee-for-service business that offers a broad array of mortgage,title, valuation, asset management and other real estate and title services to market participants across the mortgage and real estate value chain, as further detailed in “Results of Operations—Services.” These services, comprising mortgage services, real estate services and title services, are provided primarily through our subsidiaries, including Clayton, Green River Capital, Radian Settlement Services and Red Bell. In 2018, we also acquired the businesses of EnTitle Direct and Independent Settlement Services, as well as the assets of Five Bridges, to enhance our Services offerings.chain.
Operating Environment
As a seller of mortgage credit protection and other mortgage and credit risk management solutions, as well as a provider of mortgage, real estate and title services, our Mortgage business results are subject to macroeconomic conditions and other events that impact the housing finance and real estate markets, including seasonal fluctuations that specifically impact the mortgage origination environment, the credit performance of our underlying insured assets and our future business opportunities.
Recently, The macroeconomic conditions, seasonality and other events that impact the housing, mortgage originations for home purchases have increasedfinance and become a larger proportion of total mortgage originations, as refinancing activity has declined due to rising interest rates. This is a positive trendrelated real estate markets also affect the demand for our business because mortgage insurance penetration in the insurable mortgage market is generally three to five times higher for purchase originations than for refinancings. Additionally, mortgage insurance penetration rates on purchase transactions have gradually increased over the past few years. The decline in refinance originations partially offset by a slight increase in home purchase transactions resulted in a mortgage insurance market in the first three months of 2019 comparable to the same period of 2018.
Mortgage Market Credit Characteristics. Loans originated for the private mortgage insurance market since 2008 consist primarily of high credit quality loans with significantly better credit performance than the loans originated during 2008 and prior periods. Significant contributors to the improved loan quality include the greater risk discipline of loan originators and theservices offered through our Real Estate segment.
Part I. Item 2. Management’s Discussion and Analysis of Financial Condition and Results of Operations (continued)
Following the financial crisis of 2007-2008 and through the first quarter of 2020, our mortgage insurance business benefited from continued improvement in market conditions evidenced by, among other things, the strength of the U.S. economy and housing finance industry. During this period, we achieved record levels of NIW on a flow basis due to strong demand for home purchases by first-time home buyers and other purchasers requiring low down payment loans. Our NIW since 2008 has consisted primarily of high credit quality loans and mortgage underwriting quality remained strong through the first quarter of 2020. These high credit quality loans have had significantly better credit performance than the loans originated during 2008 and prior periods, benefiting from the positive economic and housing market performance through the first quarter of 2020. Significant contributors to the improved loan quality of our post-2008 insured portfolio include the greater risk discipline of loan originators and private mortgage insurance providers, the Qualified Mortgage (QM)QM loan requirements under the Dodd Frank Act (including the safe harbor for loans meeting GSE underwriting and product guidelines) and the loan-level criteria of the PMIERs financial requirements.
Competitive Environment. In our mortgage insurance business, our primary competitors include other private mortgage insurers and governmental agencies, principally the FHAAdvancements in risk-based pricing frameworks and the VA. We currently compete with other private mortgage insurers onincreased use of risk distribution strategies also helped increase the basis of price, underwriting guidelines, overall service, customer relationships, perceived financial strength (including based on comparative credit ratings) and reputation, as well as the breadth and qualityflexibility of the services offered through our Services business that complement our mortgage insurance products. We compete with the FHA and VA primarily on the basis of loan limits, pricing, credit guidelines, terms of our insurance policies and loss mitigation practices.
Pricing is highly competitive in the mortgage insurance industry with industry participants competing for market share and customer relationships. We continually evaluate our pricing based on many factors, and our pricing strategies are designed to growin recent years. During 2019, the long-term economic value of our mortgage insurance portfolio and to align with our overall strategic objectives.
The mortgage insurance industry is migrating away fromcontinued to shift to a predominantly rate-card-based pricing model to oneenvironment where a variety of pricing methodologies and pricing levels are being deployed with differing degrees of risk-based granularity. ThisThe shift has led to anaway from a predominately rate card-based pricing model and the increase in the frequency of pricing changes. Although the current“black box” and other pricing frameworks continue to leverageprovides a more dynamic pricing capability that allows for more frequent pricing changes throughout the same general risk attributes as mortgage insurance industry and the ability to respond to macroeconomic shifts more quickly. See “—COVID-19 Impacts” below for discussion about our response to the pandemic, including pricing historically, they incorporate more granular risk-based pricing factors.adjustments.
In recent years, participants in the private mortgage insurance industry, including Radian, have also engaged in a range of risk distribution strategies. In our mortgage insurance business, we use reinsurance as a capital and risk management tool that we expect to lower the risk profile and financial volatility of our mortgage insurance portfolio through economic cycles. We currently employ proprietaryhave distributed risk through third-party quota share and customer analytics,excess-of-loss reinsurance arrangements, as well as through the capital markets by using mortgage insurance-linked notes transactions, all of which are designed to provide additional claims paying resources during periods of economic stress. As of March 31, 2020, 68% of our primary RIF is subject to a digital pricing delivery platform,form of risk distribution. This risk distribution is weighted more heavily toward recent origination vintages that have not experienced as much growth in home prices as our older vintages. The accumulation of home equity in older vintages may reduce the level of defaults and make it more likely that foreclosures will result in the loan being satisfied. Our expanded use of risk distribution structures in recent years has reduced our required capital, enhanced our projected return on capital and is expected to deliver loanprovide a level pricing electronicallyof protection in periods of economic stress such as we are currently experiencing.
In addition, the growth in home prices and historically low levels of unemployment through the first quarter of 2020 have contributed to the strong credit performance of our customers.existing portfolio of IIF and favorable results in recent years, including, among other things, improvements in our levels of new defaults, incurred losses, paid claims and cure rates. See “Results of Operations—Consolidated” for an overview of our financial results for the three months ended March 31, 2020. While these trends continued through the first quarter of 2020 and we produced strong operating results during the quarter, we expect the COVID-19 pandemic to adversely impact our business and future financial results. See “—COVID-19 Impacts” below for further discussion of the expected impact of the COVID-19 pandemic on our business and financial condition. See “Item 1A. Risk Factors” for additional information.
COVID-19 Impacts
The COVID-19 pandemic has significantly impacted the global economy, disrupted global supply chains, lowered equity market valuations, created significant volatility and disruption in financial markets, disrupted the housing finance system and real estate markets and increased unemployment levels. In January 2019,addition, the pandemic has resulted in temporary closures of many businesses and the institution of social distancing and sheltering in place requirements throughout the United States, which has further contributed to the rapid and significant rise in unemployment. In response to the COVID-19 pandemic, we broadly introducedhave suspended our share repurchase program, aligned our business with the temporary origination and servicing guidelines announced by the GSEs, and, through our RADAR Rates “black box” pricing framework, RADAR Rates, aswe have increased our newestrisk-based pricing option that is poweredand have made adjustments to our underwriting guidelines to account for the increased risk and uncertainty posed by Radian’s proprietary RADAR risk modelthe COVID-19 pandemic. In addition, we have taken a number of actions to focus on protecting and analyzes credit risk inputssupporting our workforce, while continuing to customize a rate quoteserve our customers with excellence and support our communities. We have activated our business continuity program by transitioning to a borrower’s individual risk profile, loan attributeswork-from-home virtual workforce model with certain essential activities supported by limited staff in controlled office environments, and property characteristics. Our customized pricing is tailoredin order to support our communities during this unprecedented time, we have, among other things, pledged financial support to certain charitable organizations focused on assisting first responders, health care workers and their families. Further actions to respond to the specific business needs of our customersCOVID-19 pandemic and their risk profiles. This framework represents a continuation of our strategy to consistently apply an approach to pricing that provides a full spectrum of pricing options that are customer-centric, flexible and customizable based on a lender’s loan origination process, as well as balancedcomply with our own objectives for managing the risk and return profile of our mortgage insurance portfolio. We expect that RADAR Rates, which leverages our proprietary risk model, will enhance our ability to continue to build a high quality mortgage insurance portfolio. Our customers are increasingly utilizing RADAR Rates; for the month of March 2019, RADAR Rates was utilized for more than half of Radian’s NIW and currently a majority of our NIW is being priced through RADAR Rates.
PMIERs. In order to be eligible to insure loans purchased by the GSEs, mortgage insurers such as Radian Guaranty must meet the GSEs’ eligibility requirements, or PMIERs. The GSEs have significant discretion under the PMIERs and may amend the PMIERs at any time. On September 27, 2018, the GSEs issued revisions to the PMIERs, or PMIERs 2.0, which became effective on March 31, 2019. Radian Guaranty currently is an approved mortgage insurer under the PMIERs and is in compliance with the current PMIERs financial requirements.
Services. The macroeconomic conditions, seasonality and other events that impact the housing, mortgage finance and related real estate markets also affect the demand for our mortgage, real estate and title services offered through our Services business segment. As described in “Item 7. Management’s Discussion and Analysis of Financial Condition and Results of Operations—Key Factors Affecting our Results—Services” in our 2018 Form 10-K, revenues for our Services segment are subject to fluctuations from period to period, in part due to the combination of the transactional nature of our business and the overall activity in the housing and mortgage finance markets as well as seasonality of these markets. See also in our 2018 Form 10-K Note 1 of Notes to Consolidated Financial Statements, “Item 1. Business—Services—Services Business Overview” and “Item 7. Management’s Discussion and Analysis of Financial Condition and Results of Operations—Overview—Other 2018 Developments,” for additional information regarding the Services segment.governmental
Part I. Item 2. Management’s Discussion and Analysis of Financial Condition and Results of Operations (continued)
Business Strategyregulations and government and GSE programs adopted in response to the pandemic may be necessary as conditions continue to evolve.
Radian’s objectives include driving strong growth, increasing value creationWe expect that the unprecedented and providing attractive stockholder returns. Consistentrapidly changing social and economic impacts associated with these objectives,the COVID-19 pandemic on the U.S. and global economies generally, and in particular on the U.S. housing, real estate and housing finance markets, will negatively impact our business strategy, as highlighted below, is focused on growingand our businessesfinancial results in the second quarter and diversifying our revenue sources, while at the same time enhancing our operationslater periods of 2020, and developing a one-company market view by integrating our product and services offerings more effectively.

Write high-quality and profitable NIW to drive future earnings, in a mannerpotentially thereafter. While we believe that enhances the long-term housing market fundamentals and outlook remain positive, including low interest rates, demographics supporting growth in the population of first-time homebuyers and a relatively constrained supply of homes available for sale, we expect that the economic valueimpact of the pandemic as well as public and private sector initiatives to reduce the transmission of COVID-19, such as the imposition of restrictions on business activities, will in the near term affect: (i) the number of new mortgages available for us to insure and real estate transactions available for our insured mortgage portfolio
Leverage our core competencies and increase our competitive differentiation in order to:
| |
– | Grow our traditional mortgage insurance business in innovative ways |
| |
– | Expand our presence in the mortgage and real estate value chain beyond traditional mortgage insurance |
| |
– | Enhance our value to customers with increased diversification of services delivered by our integrated team |
| |
– | Maintain strong comprehensive enterprise risk management based on sound data and analytics |
| |
– | Enhance the quality, efficiency and performance of our operations and delivery of products and services |
Manage our capital and financial flexibility to optimize stockholder value
Drive positive operating leverage by maintaining accretive revenue growth and effective expense management
Our growth strategy includes leveraging our core expertise in mortgage credit risk management and expanding our presenceservices, including as real estate markets confront challenges in the mortgage finance industry,origination and home sale process created by social distancing and stay-at-home orders; (ii) the number of mortgages we have insured that will default; and (iii) the number of defaults that, over time, will result in claims that we must pay.
As a result of the COVID-19 pandemic and its impact on the economy, including by participatingthe significant increase in certain Front-end and Back-end credit risk transferunemployment, we expect a material increase in new defaults as borrowers fail to make timely payments on their mortgages, including as a result of entering mortgage payment forbearance programs developedmandated by the GSEs.CARES Act that allow borrowers to defer mortgage payments. We expect the number of defaults associated with mortgage forbearances to increase significantly as servicers implement these forbearance programs. The number and duration of new defaults and, in turn, the number of defaults that ultimately result in claims will depend on a variety of factors, including the scope, severity and duration of the COVID-19 pandemic, the resulting impact on the economy, including with respect to unemployment and housing prices, and the effectiveness of forbearance and other government efforts such as financial stimulus programs to provide economic and individual relief to assist homeowners.
The expected increase in new defaults resulting from the COVID-19 pandemic may also affect our ability to remain compliant with the PMIERs financial requirements. Our total RIFMaster Policies generally provide that a default occurs when a borrower misses one monthly payment, regardless of why the payment was missed, including if the payment was deferred under a forbearance program. Once two missed payments have occurred, the Front-endPMIERs characterize a loan as “non-performing” and Back-end credit risk transfer programs was $243.8 million at March 31, 2019require us to establish an increased capital charge for that loan regardless of the reason for the missed payments. However, the PMIERs do account for the fact that loans that have become non-performing as a result of a “FEMA Declared Major Disaster” event, including as a result of participation in a forbearance program, have a higher likelihood of curing following the conclusion of the event. As a result, the PMIERs apply a Disaster Related Capital Charge that reduces the capital charges applied to these loans by 70 percent. To date, all states and $196.8 million at December 31, 2018.the District of Columbia have been designated FEMA Declared Major Disaster Areas as a result of the pandemic and, based on our current understanding and interpretation of the PMIERs, we currently are applying the Disaster Related Capital Charge to all loans with an initial default date occurring on or after February 15, 2020, although it is possible that the GSEs may adopt a less favorable interpretation or application of the Disaster Related Capital Charge. We expect that our current, broad-based application of the Disaster Related Capital Charge will significantly reduce the total amount of capital that Radian Guaranty otherwise would be required to hold against COVID-19-related defaults. Nonetheless, we expect the overall volume of new defaults resulting from the pandemic, even after giving effect to the Disaster Related Capital Charge, will result in a significant increase in Radian Guaranty’s Minimum Required Assets and a material decrease in Radian Guaranty’s PMIERs cushion, beginning with the second quarter of 2020. This increase in defaults is expected to negatively impact our results of operations in the second quarter of 2020 and in future quarters, primarily due to the need to increase our reserve for losses related to the volume of new defaults. See Note 2 of Notes to Consolidated Financial Statements in our 2019 Form 10-K for discussion of the reserving methodology for the mortgage insurance industry. While we expect Radian Guaranty to continue to participatemaintain a meaningful PMIERs cushion, there are scenarios in thesewhich the projected increase in new defaults could impact Radian Guaranty’s ability to comply with the PMIERs financial requirements and other similar programscould require us to contribute additional capital to Radian Guaranty. See “Item 1A. Risk Factors—Radian Guaranty may fail to maintain its eligibility status with the GSEs” and “Radian Group’s sources of liquidity may be insufficient to fund its obligations.”
Although we are uncertain of the potential magnitude or duration of the business and economic impacts of the COVID-19 pandemic, we expect it will have a material negative impact on our business, results of operations and financial condition in the second quarter of 2020 and in future subjectquarters. As described above, this negative impact is expected to availabilityinclude increased capital requirements under the PMIERs and the need to increase our evaluation of risk-adjusted returns.
We have been focused on repositioning our Services business by implementing our restructuring plan, using the mortgage, real estate and title services we offerreserve for losses due to complement our Mortgage Insurance business and investingan increase in new products and services to innovate and provide integrated solutions fordefaults, which will negatively affect our clients. Our strategy is designed to satisfy demand infuture earnings. Ultimately, the market, grow our fee-based revenues, strengthen our existing customer relationships, attract new customers and differentiate us from other mortgage insurance companies.
Other 2019 Developments
Capital and Liquidity Actions. On March 20, 2019, Radian Group’s boardimpact of directors approved a $150 million increase in authorization for the Company’s existing share repurchase plan, bringing the total authorization to repurchase shares up to $250 million, excluding commissions. During the three months ended March 31, 2019, the Company purchased 1,546,674 shares at an average price of $20.54 per share, including commissions. At March 31, 2019, purchase authority of up to $218.2 million remained available under this program, which expires on July 31, 2020. Subsequent to March 31, 2019, we purchased 4,131,329 shares of its common stock under this program at an average price of $21.94 per share, including commissions. See Note 14 of Notes to Unaudited Condensed Consolidated Financial Statements for additional detailsCOVID-19 on our share repurchase program.
In April 2019,businesses will depend on, among other things: the Pennsylvania Insurance Department approved a $375 million distributionextent and duration of capital from Radian Guaranty to Radian Group, which was paid on April 30, 2019 in the formpandemic, the severity of cash and marketable securities. See Note 16 of Notes to Unaudited Condensed Consolidated Financial Statements for a discussion of this distribution of capital.
Reinsurance. Radian’s reinsurance programs represent a component of our long-term risk distribution strategy. From time to time, we enter into reinsurance transactions as part of our strategy to optimize the amounts and types of capital and risk distribution deployed against insured risk, including by accessing both the capitaldisease and the reinsurance markets to distribute risk. We expect our risk distribution strategy to: (i) support our overall capital plans; (ii) lower our costnumber of capital;people infected with the virus and (iii) reduce portfolio risk and financial volatility through economic cycles.
As part of our risk distribution strategy, in April 2019, Radian Guaranty entered into a fully collateralized reinsurance agreement with Eagle Re 2019-1. Eagle Re 2019-1 is a VIE and is not a subsidiary or affiliate of Radian Guaranty. This
Part I. Item 2. Management’s Discussion and Analysis of Financial Condition and Results of Operations (continued)
reinsurance agreement provides for upwhether an effective anti-viral treatment or vaccine is developed; the effects on the economy of the pandemic and of the measures taken by governmental authorities and other third parties restricting day-to-day life as well as the length of time that such measures remain in place; governmental programs implemented to $562.0 millionassist new and existing borrowers, including programs and policies instituted by the GSEs to assist borrowers experiencing a COVID-19-related hardship such as forbearance plans and suspensions of aggregate excess-of-loss reinsurance coverage forforeclosure and evictions; and the impact on the mortgage origination market. See “Item 1A. Risk Factors—The COVID-19 pandemic has adversely impacted our business, and its ultimate impact on our business and financial results will depend on future developments, which are highly uncertain and cannot be predicted, including the scope and duration of the pandemic and actions taken by governmental authorities in response to the pandemic.”
Despite the risks and uncertainties posed by COVID-19, we believe that the steps we have taken in recent years, such as improving our debt maturity profile, enhancing our financial flexibility, implementing greater risk-based granularity into our pricing and increasing our use of risk distribution strategies to lower the risk profile and financial volatility of our mortgage insurance lossesportfolio, will help position the Company to better withstand the negative effects from macroeconomic stresses associated with the COVID-19 pandemic, such as we expect to occur in connection with new defaults on an existing portfoliothe second quarter of eligible Recurring Premium Policies issued between January 1, 20182020 and December 31, 2018, with an initial RIFin subsequent periods.
Legislative and Regulatory Developments
Our subsidiaries are subject to comprehensive regulations and other requirements. In addition to the discussion below, see “Item 1. Business—Regulation” in our 2019 Form 10-K for a discussion of $10.7 billion. Eagle Re 2019-1 financed its coverage by issuing mortgage insurance-linked notes in an aggregate amount of $562.0 million to eligible third-party capital markets investors in an unregistered private offering. This reinsurance agreement will reduce net RIF by a total of $562.0 million,the regulations that impact our business, as well as legislative and is expected to reduceregulatory developments affecting the capital requiredhousing finance industry.
In order to be held ateligible to insure loans purchased by the GSEs, mortgage insurers such as Radian Guaranty by reducingmust meet the GSEs’ eligibility requirements, or PMIERs. The most recent revisions to the PMIERs, Minimum Required Assets byor PMIERs 2.0, became effective on March 31, 2019. Radian Guaranty currently is an approved mortgage insurer under the same amount. ForPMIERs. See “Liquidity and Capital Resources—Mortgage” for further discussion about PMIERs. In Item 1A. Risk Factors, see “—Radian Guaranty may fail to maintain its eligibility status with the GSEs” for additional information about the impact of the COVID-19 pandemic on our reinsurance arrangements seePMIERs eligibility and “—Changes in the charters, business practices, or role of the GSEs in the U.S. housing market generally, could significantly impact our mortgage insurance business.”
On March 27, 2020, the CARES Act was enacted in response to the COVID-19 pandemic. The CARES Act, among other things, provides: (i) loans, loan guarantees, grants, assistance payments, contracts and tax incentives to eligible businesses; (ii) tax relief for businesses, including a five-year net operating loss carryback, payroll tax relief and other provisions; (iii) direct cash assistance for individuals; and (iv) emergency funding for hospitals and assistance to state and local governments responding to the COVID-19 pandemic. In addition, under the CARES Act, upon request by borrowers of federally backed mortgage loans who attest to financial hardship related to the pandemic, mortgage servicers are required to provide these borrowers with up to 180 days forbearance on their mortgage payments, which may be extended for an additional 180 days upon request, without requiring validation by the borrowers of their hardship. The GSEs have amended their forbearance programs to align with the CARES Act, and we understand that a significant number of borrowers are participating in such programs, which we expect will increase the number of defaults in our mortgage insurance portfolio and negatively impact our results of operations, financial condition and required capital under the PMIERs in future periods. See “Item 1A. Risk Factors” for additional information on the potential impacts of the CARES Act on the GSEs, loan servicers and our PMIERs financial requirements.
Quarterly Highlights and Recent Company Developments
During the first quarter of 2020, Radian repurchased approximately 11.0 million shares of Radian Group common stock, or approximately $226.3 million, including commissions. In response to the COVID-19 pandemic, we suspended our share repurchase program and canceled our current 10b5-1 plan effective March 19, 2020. We may initiate a new 10b5-1 plan in the future, during an open trading window and in accordance with SEC rules. Purchase authority of up to $198.9 million remains available under the existing share repurchase authorization, which expires on August 31, 2021.
On February 13, 2020, Radian Group’s board of directors authorized an increase to the Company’s quarterly cash dividend to $0.125 per share and paid the dividend on March 6, 2020. See Note 7 in13 of Notes to Unaudited Condensed Consolidated Financial Statements and “Results of Operations—Mortgage Insurance—NIW, IIF, RIF—Net Premiums Written and Earned.” See “Liquidity and Capital Resources—Radian Group—Short-Term Liquidity Needs—Capital Support for Subsidiaries” for additional informationdetails on our share repurchase and dividend programs.
Radian Guaranty continued to expand its risk distribution strategy in the first quarter of 2020 by entering into the 2020 Single Premium QSR Agreement and supplementing its Excess-of-Loss Program through its entry into a reinsurance agreement with Eagle Re 2020-1, by which the company obtained $488.4 million of credit risk protection. See Note 7 of Notes to Unaudited Condensed Consolidated Financial Statements for additional details on our reinsurance programs.
Part I. Item 2. Management’s Discussion and Analysis of Financial Condition and Results of Operations (continued)
Radian Guaranty also terminated its intercompany reinsurance agreement with Radian Reinsurance in January 2020, resulting in the transfer of approximately $6 billion in RIF back to Radian Guaranty. See Note 15 of Notes to Unaudited Condensed Consolidated Financial Statements for additional details on the PMIERs.impact of the intercompany actions related to this termination.
Finally, we completed the sale of Clayton in January 2020 and implemented changes to our organizational structure as a result. See Note 3 of Notes to Unaudited Condensed Consolidated Financial Statements for additional details on the impact of these changes and our revised segment reporting structure.
Key Factors Affecting Our Results
The key factors affecting our results are discussed in our 20182019 Form 10-K. There have been no material changes to these key factors.
Results of Operations—Consolidated
Three Months Ended March 31, 20192020 Compared to Three Months Ended March 31, 20182019
Radian Group serves as the holding company for our operating subsidiaries and does not have any operations of its own. Our consolidated operating results for the three-month periodsthree months ended March 31, 20192020 and March 31, 20182019 primarily reflect the financial results and performance of our two reportable business segments—Mortgage Insurance and Services.Real Estate. See Note 3 of Notes to Unaudited Condensed Consolidated Financial Statements for information regarding the basis ofrecent modifications to our segment reporting, including the related allocations.allocations and the impacts of the sale of Clayton in January 2020 and subsequent organizational changes made in the first quarter of 2020. See “Results of Operations—Mortgage Insurance”Mortgage” and “Results of Operations—Services”Real Estate” for the operating results of these business segments for the three months ended March 31, 2019,2020, compared to the same periodsperiod in 2018.2019.
In addition to the results of our operating segments, pretax income (loss) is also affected by those factors described in “Item 7. Management’s Discussion and Analysis of Financial Condition and Results of Operations—Key Factors Affecting Our Results” in our 20182019 Form 10-K.
Part I. Item 2. Management’s Discussion and Analysis of Financial Condition and Results of Operations (continued)
The following table highlights selected information related to our consolidated results of operations for the three months ended March 31, 20192020 and 2018:2019:
| | | | | | | | Change | | | | | Change |
| | Three Months Ended
March 31, | | Favorable (Unfavorable) | Three Months Ended
March 31, | | Favorable (Unfavorable) |
| (In millions, except per-share amounts) | 2019 |
| 2018 | | 2019 vs. 2018 | 2020 |
| 2019 | | 2020 vs. 2019 |
| Pretax income | $ | 216.1 |
| | $ | 142.4 |
| | $ | 73.7 |
| $ | 181.3 |
| | $ | 216.1 |
| | $ | (34.8 | ) |
| Net income | 171.0 |
| | 114.5 |
| | 56.5 |
| 140.5 |
| | 171.0 |
| | (30.5 | ) |
| Diluted net income per share | 0.78 |
| | 0.52 |
| | 0.26 |
| 0.70 |
| | 0.78 |
| | (0.08 | ) |
| Book value per share at March 31 | 17.49 |
| | 14.16 |
| | 3.33 |
| 20.30 |
| | 17.49 |
| | 2.81 |
|
| | | | | | | | | | | |
Net premiums earned—insurance (1) | 263.5 |
| | 242.6 |
| | 20.9 |
| 277.4 |
| | 263.5 |
| | 13.9 |
|
Services revenue (2) | 32.8 |
| | 33.2 |
| | (0.4 | ) | 31.9 |
| | 32.8 |
| | (0.9 | ) |
Net investment income (1) | 43.8 |
| | 34.0 |
| | 9.8 |
| 40.9 |
| | 43.8 |
| | (2.9 | ) |
| Net gains (losses) on investments and other financial instruments | 21.9 |
| | (18.9 | ) | | 40.8 |
| (22.0 | ) | | 21.9 |
| | (43.9 | ) |
Provision for losses (1) | 20.8 |
| | 37.3 |
| | 16.5 |
| 36.0 |
| | 20.8 |
| | (15.2 | ) |
Cost of services (2) | 24.2 |
| | 23.1 |
| | (1.1 | ) | 22.1 |
| | 24.2 |
| | 2.1 |
|
| Other operating expenses | 78.8 |
| | 63.2 |
| | (15.6 | ) | 69.1 |
| | 78.8 |
| | 9.7 |
|
| Income tax provision | 45.2 |
| | 28.0 |
| | (17.2 | ) | 40.8 |
| | 45.2 |
| | 4.4 |
|
Adjusted pretax operating income (3) | 202.1 |
| | 164.1 |
| | 38.0 |
| 204.6 |
| | 202.1 |
| | 2.5 |
|
Adjusted diluted net operating income per share (3) | 0.73 |
| | 0.59 |
| | 0.14 |
| 0.80 |
| | 0.73 |
| | 0.07 |
|
| | | | | | | | | | | |
| Return on equity | 19.0 | % | | 15.1 | % | | 3.9 | % | 14.2 | % | | 19.0 | % | | (4.8 | )% |
Adjusted net operating return on equity (3) | 17.7 | % | | 17.1 | % | | 0.6 | % | 16.3 | % | | 17.7 | % | | (1.4 | )% |
______________________
| |
| (1) | Relates primarily to the Mortgage Insurance segment. See “Results of Operations—Mortgage Insurance”Mortgage” for more information. |
| |
| (2) | Relates primarily to our ServicesReal Estate segment. See “Results of Operations—Services”Real Estate” for more information. |
| |
| (3) | See “—Use of Non-GAAP Financial Measures” below. |
Net Income. OurAs discussed in more detail below, our net income increaseddecreased for the three months ended March 31, 2019,2020, compared to the same period in 2018,2019, primarily reflecting: (i) losses on investments and other financial instruments compared to gains in the same period in 2019 and (ii) an increase in provision for losses. Partially offsetting these items is: (i) an increase in net gains on investmentspremiums earned and other financial instruments; (ii) an increase in net premiums earned; (iii) a decrease in provision for losses; and (iv) an increase in net investment income. Partially offsetting these items is an increase in other operating expenses. See “Results of Operations—Mortgage Insurance” and “Results of Operations—Services” for more information on our segment results.
Diluted Net Income Per Share. The increasechange in diluted net income per share for the three months ended March 31, 2019,2020, compared to the same period in 2018,2019, is primarily due to the increasechange in net income, as discussed above.
Book Value Per Share. The slight increase in book value per share from $16.34$20.13 at December 31, 2018,2019, to $17.49$20.30 at March 31, 2019,2020, is primarily due to (i) our first quarter 2019 net income and (ii) anfor the three months ended March 31, 2020. This increase was partially offset by: (i) a decrease of $0.37$0.40 per share due to net unrealized gainslosses in our available for sale securities, recorded in accumulated other comprehensive income.income; (ii) a $0.13 per share impact of dividends; and (iii) a $0.03 per share net impact of our share repurchases for the three months ended March 31, 2020, inclusive of the cost of these repurchases.
ReturnNet Gains (Losses) on equity.Investments and Other Financial Instruments. The increase in returnnet losses on equityinvestments and other financial instruments for the three months ended March 31, 2020, as compared to net gains on investments and other financial instruments for the same period in 2019, is primarily due to the increase in net incomeunrealized losses in our trading securities related to changes in fair value resulting from a decline in equity markets and wider credit-spreads, partially offset by net realized gains on our fixed-maturities available for sale. See Note 5 of Notes to Unaudited Condensed Consolidated Financial Statements for additional information on net gains (losses) on investments.
Other Operating Expenses. Other operating expenses for the increasethree months ended March 31, 2020 decreased as compared to the same period in stockholders’ equity.2019, primarily due to: (i) a decrease in legal and other professional services expense and (ii) an increase
Part I. Item 2. Management’s Discussion and Analysis of Financial Condition and Results of Operations (continued)
Net Gains (Losses) on Investments and Other Financial Instruments. The increase in net gains on investments and other financial instrumentsceding commissions. Partially offsetting these items for the three months ended March 31, 2019, as compared to the same period in 2018,2020 is primarily due to the increase in unrealized gains in our trading portfolio related to changes in fair value resulting from lower interest rates. The components of the net gains (losses) on investments and other financial instruments for the periods indicated are as follows:
|
| | | | | | | |
| | Three Months Ended
March 31, |
| (In millions) | 2019 | | 2018 |
| Net unrealized gains (losses) related to change in fair value of trading securities and other investments | $ | 19.5 |
| | $ | (12.8 | ) |
| Net realized gains (losses) on investments | (1.7 | ) | | (3.4 | ) |
| Other-than-temporary impairment losses | — |
| | (0.9 | ) |
| Net gains (losses) on other financial instruments | 4.1 |
| | (1.8 | ) |
| Net gains (losses) on investments and other financial instruments | $ | 21.9 |
| | $ | (18.9 | ) |
| | | | |
Other Operating Expenses. Other operating expenses for the three months ended March 31, 2019, increased as compared to the same period in 2018, primarily as a result of: (i) increases due to the businesses acquired in 2018 and the resulting inclusion of their operating expenses; (ii) higher legal and other professional services expense; and (iii) higher compensation expense in 2019,2020, including variable and incentive-based compensation. In addition to these items, the three months ended March 31, 2019, as compared to the same period in 2018, also included an increase in non-operating items, primarily related to impairment of other long-lived assets.
Income Tax Provision. Our effective tax rate was 22.5% and 20.9% for the three months ended March 31, 2020 and 2019, which approximates the federal statutory rate. For the same periodrespectively. The increase in 2018, the difference between our effective tax rate of 19.6% andfor the federal statutory tax rate of 21%three months ended March 31, 2020 was primarily due to an increased annualized effective tax rate before Discrete Items. The proportional effects of our permanent book-to-tax adjustments to a lower expected annual pre-tax income resulted in an increased annualized effective tax rate before Discrete Items of 22.3% for the first quarter of 2020. See “Overview—COVID-19 Impacts” for additional information on expected impacts to our liability for uncertainshort-term future earnings. The impact of Discrete Items on our effective tax positions.rate may fluctuate from period to period.
Return on Equity. The change in return on equity is primarily due to the increase in stockholders’ equity.
Use of Non-GAAP Financial Measures. In addition to the traditional GAAP financial measures, we have presented “adjusted pretax operating income,” “adjusted diluted net operating income per share” and “adjusted net operating return on equity,” which are non-GAAP financial measures for the consolidated company, among our key performance indicators to evaluate our fundamental financial performance. These non-GAAP financial measures align with the way our business performance is evaluated by both management and by our board of directors. These measures have been established in order to increase transparency for the purposes of evaluating our operating trends and enabling more meaningful comparisons with our peers. Although on a consolidated basis “adjusted pretax operating income,” “adjusted diluted net operating income per share” and “adjusted net operating return on equity” are non-GAAP financial measures, for the reasons discussed above we believe these measures aid in understanding the underlying performance of our operations. Our senior management, including our Chief Executive Officer (Radian’s chief operating decision maker),maker, uses adjusted pretax operating income (loss) as our primary measure to evaluate the fundamental financial performance of the Company’s business segments and to allocate resources to the segments.
Adjusted pretax operating income is defined as GAAP consolidated pretax income (loss) excluding the effects of: (i) net gains (losses) on investments and other financial instruments; (ii) loss on induced conversionextinguishment of debt; (iii) amortization and debt extinguishment; (iii) acquisition-related expenses; (iv) amortization or impairment of goodwill and other acquired intangible assets; and (v) net(iv) impairment of other long-lived assets and other non-operating items, such as losses recognized in earningsfrom the sale of lines of business and infrequent or unusual non-operating items.acquisition-related expenses. Adjusted diluted net operating income per share is calculated by dividing (i) adjusted pretax operating income attributable to common stockholders, net of taxes computed using the company’sCompany’s statutory tax rate, by (ii) the sum of the weighted average number of common shares outstanding and all dilutive potential common shares outstanding. Interest expense on convertible debt, share dilution from convertible debt and the impact of share-based compensation arrangements have been reflected in the per share calculations consistent with the accounting standard regarding earnings per share, whenever the impact is dilutive. Adjusted net operating return on equity is calculated by dividing annualized adjusted pretax operating income, net of taxes computed using the company’sCompany’s statutory tax rate, by average stockholders’ equity, based on the average of the beginning and ending balances for each period presented.
Part I. Item 2.Notes to Consolidated Financial Statements and “Item 7. Management’s Discussion and Analysis of Financial Condition and Results of Operations (continued)
Operations—Results of Operations—Consolidated—AlthoughUse of Non-GAAP Financial Measures”each inour 2019 Form 10-K for detailed information regarding items excluded from adjusted pretax operating income excludes certain items that have occurred in the past and are expected to occur in the future, the excluded items represent those that are: (i) not viewed as part of the operating performance of our primary activities or (ii) not expected to result in an economic impact equal to the amount reflected in pretax income. These adjustments, along with the reasons for their treatment, are described below.treatment.
| |
(1) | Net gains (losses) on investments and other financial instruments. The recognition of realized investment gains or losses can vary significantly across periods as the activity is highly discretionary based on the timing of individual securities sales due to such factors as market opportunities, our tax and capital profile and overall market cycles. Unrealized gains and losses arise primarily from changes in the market value of our investments that are classified as trading or equity securities. These valuation adjustments may not necessarily result in realized economic gains or losses.
|
Trends in the profitability of our fundamental operating activities can be more clearly identified without the fluctuations of these realized and unrealized gains or losses and changes in fair value of other financial instruments. We do not view them to be indicative of our fundamental operating activities. Therefore, these items are excluded from our calculation of adjusted pretax operating income (loss).
| |
(2) | Loss on induced conversion and debt extinguishment. Gains or losses on early extinguishment of debt and losses incurred to purchase our convertible debt prior to maturity are discretionary activities that are undertaken in order to take advantage of market opportunities to strengthen our financial and capital positions; therefore, we do not view these activities as part of our operating performance. Such transactions do not reflect expected future operations and do not provide meaningful insight regarding our current or past operating trends. Therefore, these items are excluded from our calculation of adjusted pretax operating income (loss).
|
| |
(3) | Acquisition-related expenses. Acquisition-related expenses represent the costs incurred to effect an acquisition of a business (i.e., a business combination). Because we pursue acquisitions on a strategic and selective basis, we do not view acquisition-related expenses as a primary business activity. Therefore, we do not consider these expenses to be part of our operating performance and they are excluded from our calculation of adjusted pretax operating income (loss).
|
| |
(4) | Amortization or impairment of goodwill and other acquired intangible assets. Amortization of acquired intangible assets represents the periodic expense required to amortize the cost of acquired intangible assets over their estimated useful lives. Acquired intangible assets with an indefinite useful life are also periodically reviewed for potential impairment, and impairment adjustments are made whenever appropriate. These charges are not viewed as part of the operating performance of our primary activities and therefore are excluded from our calculation of adjusted pretax operating income (loss).
|
| |
(5) | Net impairment losses recognized in earnings and infrequent or unusual non-operating items. The recognition of net impairment losses on investments and the impairment of other long-lived assets can vary significantly in both amount and frequency, depending on market credit cycles and other factors. Infrequent and unusual non-operating items reflect activities that we do not view to be indicative of our fundamental operating activities. Therefore, whenever such income or loss items occur, we exclude them from our calculation of adjusted pretax operating income (loss).
|
Total adjusted pretax operating income, adjusted diluted net operating income per share and adjusted net operating return on equity are not measures of totaloverall profitability, and therefore should not be considered in isolation or viewed as substitutes for GAAP pretax income, diluted net income per share or return on equity. Our definitions of adjusted pretax operating income, adjusted diluted net operating income per share and adjusted net operating return on equity may not be comparable to similarly-named measures reported by other companies.
Part I. Item 2. Management’s Discussion and Analysis of Financial Condition and Results of Operations (continued)
The following tables provide reconciliations of the most comparable GAAP measures of consolidated pretax income, diluted net income per share and return on equity, to our non-GAAP financial measures for the consolidated company of adjusted pretax operating income, adjusted diluted net operating income per share and adjusted net operating return on equity, respectively:
|
| | | | | | | |
| Reconciliation of Consolidated Pretax Income to Adjusted Pretax Operating Income |
| | Three Months Ended
March 31, |
| (In thousands) | 2019 | | 2018 |
| Consolidated pretax income | $ | 216,136 |
| | $ | 142,442 |
|
| Less income (expense) items: | | | |
| Net gains (losses) on investments and other financial instruments | 21,913 |
| | (18,887 | ) |
Acquisition-related expenses (1) | (233 | ) | | — |
|
| Amortization and impairment of other acquired intangible assets | (2,187 | ) | | (2,748 | ) |
Impairment of other long-lived assets and infrequent or unusual non-operating items (2) | (5,427 | ) | | (26 | ) |
Total adjusted pretax operating income (3) | $ | 202,070 |
|
| $ | 164,103 |
|
| | | | |
|
| | | | | | | |
Reconciliation of Consolidated Pretax Income to Adjusted Pretax Operating Income |
| | Three Months Ended
March 31, |
| (In thousands) | 2020 | | 2019 |
| Consolidated pretax income | $ | 181,293 |
| | $ | 216,136 |
|
| Less reconciling income (expense) items: | | | |
| Net gains (losses) on investments and other financial instruments | (22,027 | ) | | 21,913 |
|
| Amortization and impairment of other acquired intangible assets | (979 | ) | | (2,187 | ) |
Impairment of other long-lived assets and other non-operating items (1) | (300 | ) | | (5,660 | ) |
Total adjusted pretax operating income (2) | $ | 204,599 |
|
| $ | 202,070 |
|
| | | | |
______________________
| |
| (1) | Acquisition-related expenses represent expenses incurred to effect the acquisition of a business, net of adjustments to accruals previously recorded for acquisition expenses. |
| |
(2) | The amount for the three months ended March 31, 2019 primarily relates to impairments of other long-lived assets and is included in other operating expenses on the condensed consolidated statement of operations and primarily relates to impairments of other long-lived assets. The amount for the three months ended March 31, 2018 is included within restructuring and other exit costs on the condensed consolidated statement of operations. |
| |
(3)(2) | Total adjusted pretax operating income on a consolidated basis consists of adjusted pretax operating income (loss) for our Mortgage Insurancesegment, our Real Estate segment and our Services segment,All Other activities, as further detailed in in Note 3 of Notes to Unaudited Condensed Consolidated Financial Statements. |
|
| | | | | | | |
Reconciliation of Diluted Net Income Per Share
to Adjusted Diluted Net Operating Income Per Share |
| | Three Months Ended
March 31, |
| (In thousands) | 2020 | | 2019 |
| Diluted net income per share | $ | 0.70 |
| | $ | 0.78 |
|
| | | | |
| Less per-share impact of reconciling income (expense) items: | | | |
| Net gains (losses) on investments and other financial instruments | (0.11 | ) | | 0.10 |
|
| Amortization and impairment of other acquired intangible assets | — |
| | (0.01 | ) |
| Impairment of other long-lived assets and other non-operating items | — |
| | (0.02 | ) |
Income tax (provision) benefit on reconciling income (expense) items (1) | 0.02 |
| | (0.01 | ) |
Difference between statutory and effective tax rates | (0.01 | ) | | (0.01 | ) |
| Per-share impact of reconciling income (expense) items | (0.10 | ) | | 0.05 |
|
Adjusted diluted net operating income per share (1) | $ | 0.80 |
| | $ | 0.73 |
|
| | | | |
______________________
| |
| (1) | Calculated using the Company’s federal statutory tax rate of 21%. Any permanent tax adjustments and state income taxes on these items have been deemed immaterial and are not included. |
Part I. Item 2. Management’s Discussion and Analysis of Financial Condition and Results of Operations (continued)
|
| | | | | | | |
Reconciliation of Diluted Net Income Per Share to Adjusted Diluted Net Operating Income Per Share |
| | Three Months Ended
March 31, |
| (In thousands) | 2019 | | 2018 |
| Diluted net income per share | $ | 0.78 |
| | $ | 0.52 |
|
| | | | |
| Less per-share impact of reconciling income (expense) items: | | | |
| Net gains (losses) on investments and other financial instruments | 0.10 |
| | (0.09 | ) |
| Amortization and impairment of other acquired intangible assets | (0.01 | ) | | (0.01 | ) |
| Impairment of other long-lived assets and infrequent or unusual non-operating items | (0.02 | ) | | — |
|
Income tax provision (benefit) on other income (expense) items (1) | 0.01 |
| | (0.02 | ) |
| Difference between statutory and effective tax rate | (0.01 | ) | | 0.01 |
|
| Per-share impact of other income (expense) items | 0.05 |
| | (0.07 | ) |
Adjusted diluted net operating income per share (1) | $ | 0.73 |
| | $ | 0.59 |
|
| | | | |
______________________
| |
(1) | Calculated using the company’s federal statutory tax rate of 21%. Any permanent tax adjustments and state income taxes on these items have been deemed immaterial and are not included. |
| | Reconciliation of Return on Equity to Adjusted Net Operating Return on Equity (1) | Reconciliation of Return on Equity to Adjusted Net Operating Return on Equity (1) | Reconciliation of Return on Equity to Adjusted Net Operating Return on Equity (1) |
| | Three Months Ended
March 31, | Three Months Ended
March 31, |
| (In thousands) | 2019 | | 2018 | 2020 | | 2019 |
Return on equity (1) | 19.0 | % | | 15.1 | % | 14.2 | % | | 19.0 | % |
Less impact of reconciling income (expense) items: (2) | | | | | | |
| Net gains (losses) on investments and other financial instruments | 2.4 |
| | (2.5 | ) | (2.2 | ) | | 2.4 |
|
| Amortization and impairment of other acquired intangible assets | (0.2 | ) | | (0.4 | ) | (0.1 | ) | | (0.2 | ) |
| Impairment of other long-lived assets and infrequent or unusual non-operating items | (0.6 | ) | | — |
| |
Income tax provision (benefit) on reconciling income (expense) items (3) | 0.3 |
| | (0.6 | ) | |
| Difference between statutory and effective tax rate | — |
| | 0.3 |
| |
| Impairment of other long-lived assets and other non-operating items | | — |
| | (0.6 | ) |
Income tax (provision) benefit on reconciling income (expense) items (3) | | 0.5 |
| | (0.3 | ) |
| Difference between statutory and effective tax rates | | (0.3 | ) | | — |
|
| Impact of reconciling income (expense) items | 1.3 |
|
| (2.0 | ) | (2.1 | ) |
| 1.3 |
|
| Adjusted net operating return on equity | 17.7 | % | | 17.1 | % | 16.3 | % | | 17.7 | % |
| | | | | | | |
______________________
| |
| (1) | Calculated by dividing annualized net income by average stockholders’ equity, based on the average of the beginning and ending balances for each period presented. |
| |
| (2) | Annualized, as a percentage of average stockholders’ equity. |
| |
| (3) | Calculated using the company’sCompany’s federal statutory tax rate of 21%. Any permanent tax adjustments and state income taxes on these items have been deemed immaterial and are not included. |
Part I. Item 2. Management’s Discussion and Analysis of Financial Condition and Results of Operations (continued)
Results of Operations—Mortgage Insurance
Three Months Ended March 31, 20192020 Compared to Three Months Ended March 31, 20182019
The following table summarizes our Mortgage Insurance segment’s results of operations for the three months ended March 31, 20192020 and 2018:2019:
|
| | | | | | | | | | | |
| | | | | | $ Change |
| | Three Months Ended
March 31, | | Favorable (Unfavorable) |
| (In millions) | 2019 | | 2018 | | 2019 vs. 2018 |
Adjusted pretax operating income (1) | $ | 208.2 |
| | $ | 171.7 |
| | $ | 36.5 |
|
Net premiums written—insurance (2) | 251.6 |
| | 238.0 |
| | 13.6 |
|
(Increase) decrease in unearned premiums (2) | 10.2 |
| | 4.6 |
| | 5.6 |
|
Net premiums earned—insurance (2) | 261.8 |
| | 242.6 |
| | 19.2 |
|
| Net investment income | 43.7 |
| | 34.0 |
| | 9.7 |
|
| Provision for losses | 20.8 |
| | 37.4 |
| | 16.6 |
|
Other operating expenses (3) | 56.0 |
| | 50.5 |
| | (5.5 | ) |
| Interest expense | 15.7 |
| | 10.6 |
| | (5.1 | ) |
|
| | | | | | | | | | | |
| | | | | | $ Change |
| | Three Months Ended
March 31, | | Favorable (Unfavorable) |
| (In millions) | 2020 | | 2019 | | 2020 vs. 2019 |
Adjusted pretax operating income (1) (2) | $ | 205.7 |
| | $ | 203.6 |
| | $ | 2.1 |
|
| Net premiums written—insurance | 261.0 |
| | 251.6 |
| | 9.4 |
|
| (Increase) decrease in unearned premiums | 14.0 |
| | 10.2 |
| | 3.8 |
|
| Net premiums earned—insurance | 275.0 |
| | 261.8 |
| | 13.2 |
|
| Net investment income | 36.2 |
| | 38.8 |
| | (2.6 | ) |
| Provision for losses | 35.2 |
| | 20.8 |
| | (14.4 | ) |
| Policy acquisition costs | 7.4 |
| | 5.9 |
| | (1.5 | ) |
Other operating expenses (2) | 52.8 |
| | 55.8 |
| | 3.0 |
|
| Interest expense | 12.2 |
| | 15.7 |
| | 3.5 |
|
______________________
| |
| (1) | Our senior management uses adjusted pretax operating income (loss) as our primary measure to evaluate the fundamental financial performance of each of the Company’s business segments. See Note 3 of Notes to Unaudited Condensed Consolidated Financial Statements. |
| |
| (2) | NetIncludes allocation of premiums ceded under our reinsurance programs.corporate operating expenses of $29.1 million and $25.6 million for the three months ended March 31, 2020 and 2019, respectively. See Note 73 of Notes to Unaudited Condensed Consolidated Financial Statements for more information. |
| |
(3) | Includesinformation about our allocation of corporate operating expenses of $25.6 million for the three months ended March 31, 2019 and $18.6 million for the three months ended March 31, 2018.to segments. |
Adjusted Pretax Operating Income. Our Mortgage Insurance segment’s adjusted pretax operating income increased for the three months ended March 31, 2019,2020, compared to the same period in 2018,2019, primarily reflecting: (i) an increase in net premiums earned; (ii) a decrease in interest expense and (iii) a decrease in other operating expenses. Partially offsetting these items are: (i) an increase in provision for losses;losses and (iii) an increase(ii) a decrease in net investment income. Partially offsetting these items are increases in: (i) other operating expensesSee “—NIW, IIF, RIF—Net Premiums Written and (ii) interest expense. See “Results of Operations—Services—EarnedThree Months Ended March 31, 2019 Compared to Three Months Ended March 31, 2018—Interest Expense” and “.—NIW, IIF, RIF—Provision for Losses” for more information about our net premiums earned and provision for losses, respectively.
NIW, IIF, RIF
A key component of our current business strategy is to write profitable insurance on high credit quality mortgages in the U.S. Consistent with this objective, weNIW. We wrote $10.9$16.7 billion of primary new mortgage insurance in the three months ended March 31, 2019,2020 compared to $11.7$10.9 billion of NIW in the three months ended March 31, 2018.2019. Our Persistency RateNIW for the twelve months ended March 31, 2019 increased to 83.4%, as compared to 81.0% for the twelve months ended March 31, 2018. The combinationfirst quarter of 2020, partially offset by cancellations and amortization within our NIW and our Persistency Rateexisting portfolio, resulted in an increase in IIF from $221.4to $241.6 billion at DecemberMarch 31, 2018 to $223.72020, from $240.6 billion at MarchDecember 31, 2019 as shown in the chart below.
Part I. Item 2. Management’s Discussion and Analysis of Financial Condition and Results of Operations (continued)
______________________
| |
| (1) | Policy years represent the original policy years, and have not been adjusted to reflect subsequent HARP refinancing activity.activity under HARP. |
| |
| (2) | Adjusted to reflect subsequent HARP refinancing activity under HARP, this percentage would decrease to 5.7%4.5%, 6.0%4.7% and 7.7%5.7% as of March 31, 2019,2020, December 31, 20182019 and March 31, 2018,2019, respectively. |
Our IIF is one of the primary driversdriver of the future premiums that we expect to earn over time. Although not reflected in the current period financial statements, nor in our reported book value, we expect our IIF to generate substantial earningspremiums in future periods, due to the high credit quality of our current mortgage insurance portfolio and its expected persistency over multiple years. See “Item 7. Management’s Discussion and Analysis of Financial Condition and Results of Operations—Key Factors Affecting Our Results—Mortgage Insurance—IIF; Persistency Rate; Mix of Business” in our 20182019 Form 10-K for more information.
Our earnings in future periods are subject to elevated risks and uncertainties due to the potential impact of the unprecedented and rapidly changing social and economic impacts associated with the current COVID-19 pandemic on the U.S. and global economies generally, and in particular on the U.S. housing, real estate and housing finance markets. See Note 1 of Notes to Unaudited Condensed Consolidated Financial Statements for additional information about the COVID-19 pandemic, which could have a material negative effect on the Company’s business, liquidity, results of operations and financial condition. See “Overview—COVID-19 Impacts”and“Item 1A. Risk Factors” for additional information,
Our NIW decreasedincreased by 6.6%53.3% for the three months ended March 31, 2019,2020 compared to the same period in 2018, primarily attributable to decreased refinance originations.
Although it is difficult to project future volumes, industry sources expect the total2019, aided by a strong mortgage origination market for the full year 2019 to increase slightly compared to 2018, driven by an expected increase in purchase originations, partially offset by a decline in refinance originations as a result of higher anticipated interest rates. Mortgage insurance penetration in the purchase origination market has graduallyand increased over the past few years. Because the penetration rate for mortgage insurance is generally three to five times higher on purchase originations than on refinancing transactions, we currently expect the private mortgage insurance market for the full year 2019 to be comparable to 2018. Based on industry forecasts and our projections, we expect our NIW in 2019 to be in excess of $50 billion.
penetration rates. We believe total mortgage origination volume was lowerhigher for the three months ended March 31, 2019,2020, as compared to the comparable period in 2018, primarily2019, due to a decrease in refinance mortgage originations resulting from the slightly higher interest rate environment, partially offset by a modestan increase in both purchase originations. Given the higher penetration rate for private mortgage insurance in the purchase origination market, as discussed above, we believe that even though the total mortgage origination volume wasand refinance originations, with refinances increasing more than 200% driven largely by lower the private mortgage insurance market for the three-month period ended March 31, 2019 was comparable to the same period in 2018. Consistent with these trends in the mortgage origination market described above, the level of our purchase origination volume increased and our refinance origination volume decreased, each as a percentage of our total NIW, during the three-month period ended March 31, 2019, compared to the same period in 2018.
Part I. Item 2. Management’s Discussion and Analysis of Financial Condition and Results of Operations (continued)
Beginninginterest rates. Consistent with these trends in the second half of 2017, the private mortgage insurance industry experienced a shift in the mix of mortgage lending products toward higher LTVs and higher debt-to-income ratios. As a percentage of our total NIW,origination market, the volume of both our NIW on mortgage loans with LTVs greater than 95% alsopurchase originations and our refinance originations increased during the three-month periodthree months ended March 31, 2019,2020, compared to the same periodperiods in 2018. In contrast, while loans2019.
Although it is difficult to borrowers with higher debt-to-income ratios, including debt-to-income ratios greater than 45%, remain elevatedproject future volumes, industry sources expect the total mortgage origination market for the full year 2020 to increase compared to levels prior2019, driven primarily by an increase in refinance originations as a result of lower interest rates. Based on industry forecasts and our projections, we currently expect our NIW in 2020 to be more than $60 billion, although the risks and uncertainties related to this projection have increased due to the second halfCOVID-19 pandemic, as described above. See “Item 1A. Risk Factors” for more information.
Historical loan performance data indicates that credit scores and underwriting quality are key drivers of 2017, they have been trending down. This trend continued during the three-month period ended March 31, 2019, and we experienced a decrease in the percentage of our total NIW on mortgage loans to borrowers with higher debt-to-income ratios, including debt-to-income ratios greater than 45%, compared to the same period in 2018. See “Overview—Operating Environment” for additional information.
credit performance. As of March 31, 2019,2020, our portfolio of business written aftersubsequent to 2008, including refinancings under HARP, refinancings, represented approximately 94.3%95.5% of our total primary RIF. Notwithstanding the mix shift toward higher LTVs and debt-to-income ratios, as discussed above, loanLoan originations after 2008 consisthave consisted primarily of high credit quality loans with significantly better credit performance than loans originated during 2008 and prior periods. The volume of insurance that we have written on high credit quality loans after 2008 has significantly improved our mortgage insurance portfolio mix.
Our To date, our actual and expected future losses on our portfolio written after 2008, together with refinancings under HARP, refinancings, arehave been significantly lower than those experienced on our NIW prior to and including 2008. The following charts illustrateHowever, the trends ofimpact to our cumulative incurred loss ratios by year of origination and development year.future losses from the COVID-19 pandemic, including from recent increases in unemployment, is highly uncertain.
______________________
| |
(1) | Represents inception-to-date losses incurred as a percentage of net premiums earned. |
| |
(2) | Incurred losses in 2017 were slightly, but not materially, elevated due to the impact of Hurricanes Harvey and Irma. |
| |
(3) | Radian’s stochastic modeling, used for pricing, indicates an approximate 20% through-the-cycle loss ratio on newly originated mortgage insurance business. |
Part I. Item 2. Management’s Discussion and Analysis of Financial Condition and Results of Operations (continued)
The following tables provide selected information as of and for the periods indicated related to mortgage insurance NIW, RIF and IIF. Policy years represent the original policy years and have not been adjusted to reflect subsequent HARP refinancing activity.activity under HARP. Throughout this report, unless otherwise noted, RIF is presented on a gross basis and includes the amount ceded under reinsurance. NIW, RIF and IIF for direct Single Premiums include policies written on an individual basis (as each loan is originated) and on an aggregated basis (in which each individual loan in a group of loans is insured in a single transaction, typically after the loans have been originated).
| | | Primary NIW | | | | | | |
| | Three Months Ended
March 31, | Three Months Ended
March 31, |
| ($ in millions) | 2019 | | 2018 | 2020 | | 2019 |
| Total primary NIW | $ | 10,900 |
| | $ | 11,664 |
| $ | 16,706 |
| | $ | 10,900 |
|
| Total primary risk written | $ | 2,732 |
| | $ | 2,929 |
| $ | 3,900 |
| | $ | 2,732 |
|
| Average coverage percentage | 25.1 | % | | 25.1 | % | 23.3 | % | | 25.1 | % |
| | | | | | | |
| Primary NIW by Loan Purpose: | | | | | | |
| Purchases | 92.2 | % | | 88.8 | % | 66.2 | % | | 92.2 | % |
| Refinances | 7.8 | % | | 11.2 | % | 33.8 | % | | 7.8 | % |
| | | | | | | |
| Primary NIW by Premium Type: | | | | | | |
| Direct monthly and other recurring premiums | 83.4 | % | | 79.0 | % | |
| |
|
| | | |
Borrower-paid (1) | 12.7 |
| | 5.3 |
| |
| Lender-paid | 3.9 |
| | 15.7 |
| |
| Direct single premiums | 16.6 |
| | 21.0 |
| |
| Direct Monthly and Other Recurring Premiums | | 81.1 | % | | 83.4 | % |
| Direct single premiums: | | | | |
| Borrower-paid | | 16.5 |
| | 12.7 |
|
Lender-paid (1) | | 2.4 |
| | 3.9 |
|
| Total | 100.0 | % | | 100.0 | % | 100.0 | % | | 100.0 | % |
| | | | | | | |
| Total borrower-paid | 95.1 | % | | 83.1 | % | 96.7 | % | | 95.1 | % |
| | | | | | | |
Primary NIW by FICO Score (2) : | | | | | | |
| >=740 | 57.6 | % | | 56.4 | % | 65.7 | % | | 57.6 | % |
| 680-739 | 34.7 | % | | 35.9 | % | 31.1 | % | | 34.7 | % |
| 620-679 | 7.7 | % | | 7.7 | % | 3.2 | % | | 7.7 | % |
| <=619 | — | % | | — | % | |
| | | | | | | |
| Primary NIW by LTV: | | | | | | |
| 95.01% and above | 19.7 | % | | 15.4 | % | 9.9 | % | | 19.7 | % |
| 90.01% to 95.00% | 40.9 | % | | 44.5 | % | 37.6 | % | | 40.9 | % |
| 85.01% to 90.00% | 27.3 | % | | 27.5 | % | 30.3 | % | | 27.3 | % |
| 85.00% and below | 12.1 | % | | 12.6 | % | 22.2 | % | | 12.1 | % |
| | | | | |
______________________
| |
| (1) | Borrower-paidLender-paid Single Premium Policies have lowerhigher Minimum Required Assets under the PMIERs as compared to lender-paidborrower-paid Single Premium Policies. See “Item 1. Business—Regulation—GSE Requirements—PMIERs—Private Mortgage Insurer Eligibility Requirements” in our 2019 Form 10-K for additional information.
|
| |
| (2) | For loans with multiple borrowers, the percentage of primary new insurance writtenNIW by FICO score represents the lowest of the borrowers’ FICO scores. All periods prior to March 31, 2019 had previously been presented based on the FICO score of the primary borrower and have been restated to reflect the lowest of the borrowers’ FICO scores. |
Part I. Item 2. Management’s Discussion and Analysis of Financial Condition and Results of Operations (continued)
| | | Primary IIF and RIF | | | | | | | | | | |
| ($ in millions) | March 31, 2019 | | December 31, 2018 | | March 31, 2018 | March 31, 2020 | | December 31, 2019 | | March 31, 2019 |
| Total primary IIF | $ | 223,734 |
| | $ | 221,443 |
| | $ | 204,025 |
| $ | 241,586 |
| | $ | 240,558 |
| | $ | 223,734 |
|
| Total primary RIF | $ | 57,361 |
| | $ | 56,728 |
| | $ | 52,153 |
| $ | 60,923 |
| | $ | 60,921 |
| | $ | 57,361 |
|
| Average coverage percentage | 25.6 | % | | 25.6 | % | | 25.6 | % | 25.2 | % | | 25.3 | % | | 25.6 | % |
| | | | | | | | | | | |
| Total primary RIF on defaulted loans | $ | 1,002 |
| | $ | 1,032 |
| | $ | 1,223 |
| $ | 1,001 |
| | $ | 1,061 |
| | $ | 1,002 |
|
| Percentage of RIF in default | 1.7 | % | | 1.8 | % | | 2.3 | % | 1.6 | % | | 1.7 | % | | 1.7 | % |
| | | | | | | | | | | |
| Persistency Rate (12 months ended) | 83.4 | % | | 83.1 | % | | 81.0 | % | 75.4 | % | | 78.2 | % | | 83.4 | % |
Persistency Rate (quarterly, annualized) (1) | 85.4 | % | | 85.5 | % | | 84.3 | % | 76.5 | % | | 75.0 | % | | 85.4 | % |
| | | | | | | | | | | |
Net premium yield (in basis points) (2) | | 45.6 |
| | 47.1 |
| | 47.0 |
|
| | | | | | | |
| Primary RIF by Premium Type: | | | | | | | | | | |
| Direct monthly and other recurring premiums | 70.6 | % | | 70.3 | % | | 69.3 | % | |
| |
| |
| |
| |
Borrower-paid (2) | 7.6 |
| | 7.3 |
| | 5.8 |
| |
| Lender-paid | 21.8 |
| | 22.4 |
| | 24.9 |
| |
| Direct Monthly and Other Recurring Premiums | | 72.6 | % | | 72.4 | % | | 70.6 | % |
| Borrower-paid | | 9.6 |
| | 9.1 |
| | 7.6 |
|
Lender-paid (3) | | 17.8 |
| | 18.5 |
| | 21.8 |
|
| Direct single premiums | 29.4 |
| | 29.7 |
| | 30.7 |
| 27.4 |
| | 27.6 |
| | 29.4 |
|
| Total | 100.0 | % | | 100.0 | % | | 100.0 | % | 100.0 | % | | 100.0 | % | | 100.0 | % |
| | | | | | | | | | | |
| Total borrower-paid | 75.2 | % | | 74.5 | % | | 71.5 | % | 79.7 | % | | 78.9 | % | | 75.2 | % |
| | | | | | | | | | | |
Primary RIF by FICO Score (3) : | | | | | | |
Primary RIF by FICO Score (4) : | | | | | | |
| >=740 | 55.2 | % | | 55.1 | % | | 55.0 | % | 57.2 | % | | 56.9 | % | | 55.2 | % |
| 680-739 | 34.8 | % | | 34.8 | % | | 34.5 | % | 34.2 | % | | 34.2 | % | | 34.8 | % |
| 620-679 | 9.2 | % | | 9.3 | % | | 9.5 | % | 8.0 | % | | 8.2 | % | | 9.2 | % |
| <=619 | 0.8 | % | | 0.8 | % | | 1.0 | % | 0.6 | % | | 0.7 | % | | 0.8 | % |
| | | | | | | | | | | |
| Primary RIF by LTV: | | | | | | | | | | |
| 95.01% and above | 12.2 | % | | 11.6 | % | | 9.7 | % | 14.3 | % | | 14.2 | % | | 12.2 | % |
| 90.01% to 95.00% | 53.0 | % | | 53.1 | % | | 53.2 | % | 51.0 | % | | 51.3 | % | | 53.0 | % |
| 85.01% to 90.00% | 28.6 | % | | 29.0 | % | | 30.2 | % | 27.9 | % | | 27.9 | % | | 28.6 | % |
| 85.00% and below | 6.2 | % | | 6.3 | % | | 6.9 | % | 6.8 | % | | 6.6 | % | | 6.2 | % |
| | | | | | | | | | | |
| Primary RIF by Policy Year: | | | | | | | | | | |
| 2008 and prior | 9.6 | % | | 10.1 | % | | 13.0 | % | 7.5 | % | | 7.8 | % | | 9.6 | % |
| 2009 - 2013 | 10.4 | % | | 11.4 | % | | 15.5 | % | 6.9 | % | | 7.5 | % | | 10.4 | % |
| 2014 | 5.8 | % | | 6.1 | % | | 7.9 | % | 4.0 | % | | 4.3 | % | | 5.8 | % |
| 2015 | 9.7 | % | | 10.2 | % | | 13.0 | % | 6.9 | % | | 7.4 | % | | 9.7 | % |
| 2016 | 16.0 | % | | 16.8 | % | | 20.5 | % | 11.7 | % | | 12.5 | % | | 16.0 | % |
| 2017 | 20.3 | % | | 21.1 | % | | 24.5 | % | 14.8 | % | | 16.0 | % | | 20.3 | % |
| 2018 | 23.5 | % | | 24.3 | % | | 5.6 | % | 16.4 | % | | 17.9 | % | | 23.5 | % |
| 2019 | 4.7 | % | | — | % | | — | % | 25.4 | % | | 26.6 | % | | 4.7 | % |
| | | | | | | |
| 2020 | | 6.4 | % | | — | % | | — | % |
______________________
| |
| (1) | The Persistency Rate on a quarterly, annualized basis is calculated based on loan-level detail for the quarter ending as of the date shown. It may be impacted by seasonality or other factors, including the level of refinance activity during the applicable periods, and may not be indicative of full-year trends. |
| |
(2) | Borrower-paid Single Premium Policies have lower Minimum Required Assets under the PMIERs as compared to lender-paid Single Premium Policies.
|
| |
(3) | For loans with multiple borrowers, the percentage of primary risk in force by FICO score represents the lowest of the borrowers’ FICO scores. All periods prior to March 31, 2019 had previously been presented based on the FICO score of the primary borrower and have been restated to reflect the lowest of the borrowers’ FICO scores. |
Part I. Item 2. Management’s Discussion and Analysis of Financial Condition and Results of Operations (continued)
| |
| (2) | Calculated by dividing net premiums earned by average primary IIF. For 2019, includes a 1.4 basis point increase resulting from the impact of the cumulative adjustments in 2019 related to an update to the amortization rates used to recognize revenue for Single Premium Policies. |
| |
| (3) | Lender-paid Single Premium Policies have higher Minimum Required Assets under the PMIERs as compared to borrower-paid Single Premium Policies. |
| |
| (4) | For loans with multiple borrowers, the percentage of primary RIF by FICO score represents the lowest of the borrowers’ FICO scores. |
Net Premiums Written and Earned. Net premiums written and earned for the three months ended March 31, 20192020 increased compared to the same period in 2018, primarily due to2019, reflecting an increase in our IIF primarily related to an increase in our Monthly Premium Policies.monthly premium policies.
The table below provides additional information about the components of mortgage insurance net premiums earned for the periods indicated.indicated, including the effects of our reinsurance programs.
| | | | Three Months Ended
March 31, | Three Months Ended
March 31, |
| (in thousands) | 2019 | | 2018 | |
| (In thousands) | | 2020 | | 2019 | |
Net premiums earned—insurance: | | | | | | | |
| Direct | | | | | | | |
| Premiums earned, excluding revenue from cancellations | $ | 268,496 |
| | $ | 245,096 |
| $ | 274,647 |
| | $ | 268,496 |
| |
| Single Premium Policy cancellations | 9,957 |
| | 12,335 |
| 24,133 |
| | 9,957 |
| |
| Direct | 278,453 |
| | 257,431 |
| 298,780 |
| | 278,453 |
| |
| | | | | | | | |
Assumed (1) | 2,450 |
| | 1,318 |
| 3,456 |
| | 2,450 |
| |
| | | | | | | | |
| Ceded | | | | | | | |
| Premiums earned, excluding revenue from cancellations | (24,486 | ) | | (20,303 | ) | (28,609 | ) | | (24,486 | ) | |
Single Premium Policy cancellations (2) | (2,953 | ) | | (3,301 | ) | (7,183 | ) | | (2,953 | ) | |
Profit commission—other (3) | 8,314 |
| | 7,405 |
| 8,555 |
| | 8,314 |
| |
| Ceded premiums, net of profit commission | (19,125 | ) | | (16,199 | ) | (27,237 | ) | | (19,125 | ) | |
| | | | | | | | |
Total net premiums earned—insurance | $ | 261,778 |
| | $ | 242,550 |
| $ | 274,999 |
| | $ | 261,778 |
| |
| | | | | | | | |
______________________
| |
| (1) | Includes premiums earned from our participation in certain Front-end and Back-end credit risk transfer programs. |
| |
| (2) | Includes the impact of related profit commissions. |
| |
| (3) | The amounts represent the profit commission on the Single Premium QSR Program, excluding the impact of Single Premium Policy cancellations. |
The impactlevel of mortgage prepayment speeds on the mix of business we writeprepayments affects the revenue ultimately produced by our mortgage insurance business.business and is influenced by the mix of business we write. We believe that writing a mix of Single Premium Policies and Monthly Premium Policies has the potential to moderate the overall impact on our results if actual prepayments are significantly different from expectations. However, the impact of this moderating effect may be impactedis affected by the amount of reinsurance we obtain on portions of our portfolio, with the Single Premium QSR Program currently reducing the proportion of retained Single Premium Policies in our portfolio. See “Item 7. Management’s Discussion and Analysis of Financial Condition and Results of Operations—Key Factors Affecting Our Results—Mortgage Insurance—IIF; Persistency Rate; Mix of Business” in our 2019 Form 10-K for more information.
We experienced an increase in our total mix of Single Premium Policies to 18.9% of our NIW for the three months ended March 31, 2020, compared to 16.6% for the same period in 2019. Borrower-paid Single Premium Policies were 87.3% of our total direct Single Premium NIW for the three months ended March 31, 2020, compared to 76.5% for the same period in 2019 (with the balance lender-paid). We expect our production level for Single Premium Policies to fluctuate over time based on various factors, which include risk-returnrisk/return considerations and risk-mix considerations, as well as market conditions. See the table above, which illustrates the premium impact
Part I. Item 2. Management’s Discussion and Analysis of Financial Condition and Results of Operations—Key Factors Affecting Our Results—Mortgage Insurance—IIF; Persistency Rate; Mix of Business” in our 2018 Form 10-K for more information.Operations (continued)
Net Premiums Written and Earned—Ceded. We use third-party reinsurance in our mortgage insurance business as part of our risk distribution strategy, including to manage our capital position and risk in an effort to optimize the amounts and types of capital and risk distribution deployed against insured risk.profile. When we enter into a reinsurance agreement, the reinsurer receives a premium and, in exchange, agrees to insureinsures an agreed-upon portion of incurred losses. While these arrangements have the impact of reducing our earned premiums, they reduce our required capital and are expected to increase Radian Guaranty’sour return on required capital for the related policies. The impact of these programs on our financial results will vary depending on the level of ceded RIF, as well as the levels of prepayments and incurred losses on the reinsured portfolios, among other factors. See “Item 7. Management’s Discussion and Analysis of Financial Condition and Results of Operations—Key Factors Affecting Our Results—Mortgage Insurance—Third-Party ReinsuranceRisk Distribution” and Note 8 of Notes to Consolidated Financial Statements in our 20182019 Form 10-K for more information about our reinsurance transactions.
The following table provides information related to the premium impact of our reinsurance transactions. See Note 7 of Notes to Unaudited Condensed Consolidated Financial Statements for more information about our reinsurance programs.
|
| | | | | | | |
| | Three Months Ended
March 31, |
| (In thousands) | 2020 | | 2019 |
| Ceded premiums earned: | | | |
| QSR Program | $ | 2,328 |
| | $ | 3,729 |
|
| Single Premium QSR Program | 16,384 |
| | 11,947 |
|
| Excess-of-Loss Program | 8,405 |
| | 3,265 |
|
Total ceded premiums earned (1) | $ | 27,117 |
| | $ | 18,941 |
|
| | | | |
| Percentage of total direct and assumed premiums earned | 9.0 | % | | 6.7 | % |
| | | | |
______________________
| |
| (1) | Does not include ceded premiums earned related to our captive reinsurance arrangements or the benefit from ceding commissions on our Single Premium QSR Programs, which are included in other operating expenses on the condensed consolidated statement of operations. See Note 7 of Notes to Unaudited Condensed Consolidated Financial Statements for additional information. |
The table below provides information about the amounts by which Radian Guaranty’s reinsurance programs reduced its Minimum Required Assets as of the dates indicated.
|
| | | | | | | | | | | |
| (In thousands) | March 31, 2020 | | December 31, 2019 (1) | | March 31, 2019 (1) |
| PMIERs impact - reduction in Minimum Required Assets: | | | | | |
| QSR Program | $ | 31,638 |
| | $ | 35,382 |
| | $ | 45,477 |
|
| Single Premium QSR Program | 501,668 |
| | 511,695 |
| | 507,656 |
|
| Excess-of-Loss Program | 1,066,464 |
| | 738,386 |
| | 454,641 |
|
| Total PMIERs impact | $ | 1,599,770 |
| | $ | 1,285,463 |
| | $ | 1,007,774 |
|
| | | | | | |
| Percentage of gross Minimum Required Assets | 35.3 | % | | 27.4 | % | | 22.2 | % |
| | | | | | |
______________________
| |
| (1) | Excludes the impact of intercompany reinsurance agreement with Radian Reinsurance, which was terminated in January 2020. See Note 15 of Notes to Unaudited Condensed Consolidated Financial Statements for additional information. |
Net Investment Income. Lower investment yields, partially offset by higher average investment balances, resulted in decreases in net investment income for the three months ended March 31, 2020, compared to the same period in 2019. Our higher investment balances were primarily a result of investing our positive cash flows from operations.
Part I. Item 2. Management’s Discussion and Analysis of Financial Condition and Results of Operations (continued)
The following table provides information related to the premium impact of our reinsurance programs. See Note 7 of Notes to Unaudited Condensed Consolidated Financial Statements for more information about our reinsurance programs, including the ceded amounts related to those programs.
|
| | | | | |
| | Three Months Ended
March 31, |
| | 2019 | | 2018 |
| % of total direct and assumed premiums written | | | |
| QSR Program | 1.0 | % | | 1.5 | % |
| Single Premium QSR Program | 1.7 | % | | 6.1 | % |
| Excess-of-Loss Program | 1.1 | % | | — | % |
| | | | |
| % of total direct and assumed premiums earned | | | |
| QSR Program | 1.3 | % | | 2.2 | % |
| Single Premium QSR Program | 4.2 | % | | 4.0 | % |
| Excess-of-Loss Program | 1.2 | % | | — | % |
| | | | |
Net Investment Income. Increasing yields from higher interest rates, combined with higher average investment balances, resulted in increases in net investment income for the three months ended March 31, 2019, compared to the same period in 2018. Our higher investment balances were primarily a result of investing our positive cash flow from operations. All periods include full allocation to the Mortgage Insurance segment of net investment income from investments held at Radian Group.
Provision for Losses. The following table details the financial impact of the significant components of our provision for losses for the periods indicated:
| | | | Three Months Ended
March 31, | Three Months Ended
March 31, |
| (In millions) | 2019 | | 2018 | 2020 | | 2019 |
Current period defaults (1) | $ | 38.9 |
| | $ | 36.5 |
| $ | 41.2 |
| | $ | 38.9 |
|
Prior period defaults (2) | (18.2 | ) | | 0.4 |
| (5.9 | ) | | (18.2 | ) |
| Second-lien mortgage loan premium deficiency reserve and other | 0.1 |
| | 0.5 |
| (0.1 | ) | | 0.1 |
|
| Provision for losses | $ | 20.8 |
| | $ | 37.4 |
| $ | 35.2 |
| | $ | 20.8 |
|
| | | | | | | |
Loss ratio (3) | 8.0 | % | | 15.4 | % | 12.8 | % | | 8.0 | % |
| | | | | | | |
______________________
| |
| (1) | Related to defaulted loans with a most recent default notice dated in the period indicated. For example, if a loan had defaulted in a prior period, but then subsequently cured and later re-defaulted in the current period, the default would be considered a current period default. |
| |
| (2) | Related to defaulted loans with a default notice dated in a period earlier than the period indicated, which have been continuously in default since that time. |
| |
| (3) | Provision for losses as a percentage of net premiums earned. See below and “—Net Premiums Written and Earned” for further discussion of the components of this ratio. |
Our mortgage insurance provision for losses for the three months ended March 31, 2019 decreased2020 increased by $16.6$14.4 million, as compared to the same period in 2018.2019. Reserves established for new default notices were the primary driver of our total incurred losses for the three months ended March 31, 20192020 and 2018.2019. Current period new primary defaults increaseddecreased by 12.4%2.5% for the three months ended March 31, 2019,2020, compared to the same period in 2018.2019. This increasedecrease primarily relates to new defaults on insurance written prior to and including 2008, partially offset by an increase in new defaults on insurance written after 2008, andwhich is consistent with typical default seasoning patterns for our recent NIW vintages. Our gross Default to Claim Rate assumption for new primary defaults was 7.5% at March 31, 2020, compared to 8.0% at March 31, 2019, compared to 9.5% at March 31, 2018.2019. This reduction in the estimated gross Default to Claim Rate assumption which was based on observed trends, partially mitigated the increase in ourtrends.
Our provision for losses relatedduring the three months ended March 31, 2020 benefited from favorable reserve development on prior period defaults, although this positive development was more muted in comparison to the same period in 2019. We did not make any material adjustments to our reserve assumptions during the first quarter of 2020, despite favorable observed trends, due primarily to increased numberuncertainty that such trends would persist given the potential impacts of new defaults inthe COVID-19 pandemic. See Notes 1 and 10 of Notes to Unaudited Condensed Consolidated Financial Statements and “Item 1A. Risk Factors” for additional information. The favorable development for the three months ended March 31, 2019 was primarily driven by a reduction during the period in certain Default to Claim Rate assumptions for prior year defaults compared to the same period inassumptions used at December 31, 2018.
Part I. Item 2. Management’s Discussion and Analysis of Financial Condition and Results of Operations (continued)
Our provision for losses for the three months ended March 31, 2019 was reduced by positive reserve development on prior period defaults, primarily due to reductions in certain Default to Claim Rate assumptions based on observed trends of higher Cures than were previously estimated on those prior period defaults.
As expected, Radian Guaranty experienced an increase in reported delinquencies in FEMA Designated Areas associated with Hurricanes Harvey and Irma during the third and fourth quarters of 2017, followed by cure rates for these delinquencies that are higher than the rates for the rest of our portfolio. These incremental hurricane-related defaults did not result in a material increase in our incurred losses or paid claims.
Although the number of incremental defaults associated with areas that have been impacted by natural disasters may become somewhat elevated, consistent with our past experience we do not expect these incremental defaults to result in a material increase in our incurred losses or paid claims, given the limitations on our coverage related to property damage. However, the future reserve impact of these incremental defaults from natural disasters may differ from our previous expectations due to overall economic conditions, the pace of economic recovery in the affected areas or other factors. See Note 10 of Notes to Unaudited Condensed Consolidated Financial Statements.
Our primary default rate at March 31, 20192020 was 2.0%1.8% compared to 2.1%2.0% at December 31, 2018. Our primary defaulted inventory comprised 20,122 loans at March 31, 2019, compared to 21,093 loans at December 31, 2018, representing a decrease of 4.6%. The reduction in our primary defaulted inventory is the result of the total number of defaulted loans: (i) that have cured or (ii) for which claim payments have been made, collectively, exceeding the total number of new defaults on insured loans. Consistent with typical default seasoning patterns, the shift in our portfolio composition toward our recent vintages is expected to result in slightly increased levels of new defaults in our total portfolio for 2019 as compared to 2018, because we do not expect that the reductions in new defaults from our portfolio of insurance written prior to and including 2008 will continue to outpace the anticipated increase in new defaults from more recent vintages.
The following table shows the number of primary loans that we have insured, the number of loans in default and the percentage of loans in default as of the dates indicated:
|
| | | | | | | | |
| | March 31,
2019 | | December 31,
2018 | | March 31,
2018 |
| Default Statistics—Primary Insurance: | | | | | |
| Total Primary Insurance | | | | | |
| Prime | | | | | |
| Number of insured loans | 994,865 |
| | 986,704 |
| | 925,648 |
|
| Number of loans in default | 14,831 |
| | 15,402 |
| | 17,887 |
|
| Percentage of loans in default | 1.49 | % | | 1.56 | % | | 1.93 | % |
| Alt-A and A minus and below | | | | | |
| Number of insured loans | 34,763 |
| | 35,906 |
| | 40,661 |
|
| Number of loans in default | 5,291 |
| | 5,691 |
| | 6,710 |
|
| Percentage of loans in default | 15.22 | % | | 15.85 | % | | 16.50 | % |
| Total Primary Insurance | | | | | |
| Number of insured loans | 1,029,628 |
| | 1,022,610 |
| | 966,309 |
|
Number of loans in default (1) | 20,122 |
| | 21,093 |
| | 24,597 |
|
| Percentage of loans in default | 1.95 | % | | 2.06 | % | | 2.55 | % |
| Default Statistics—Pool Insurance: | | | | | |
| Number of loans in default | 1,607 |
| | 1,713 |
| | 1,907 |
|
______________________
| |
(1) | Included in this amount at March 31, 2019 and December 31, 2018 are the defaults in the FEMA Designated Areas associated with Hurricanes Harvey and Irma, which occurred during the third quarter of 2017. At March 31, 2019, December 31, 2018 and March 31, 2018, defaults in these areas were 2,420; 2,627; and 5,780, respectively. |
Part I. Item 2. Management’s Discussion and Analysis of Financial Condition and Results of Operations (continued)
2019. The following table shows a rollforward of our primary loans in default, including new defaults from our insurance written in years: (i) prior to and including 2008 and (ii) after 2008:
| | | | Three Months Ended
March 31, | Three Months Ended
March 31, |
| | 2019 | | 2018 | 2020 | | 2019 |
| Beginning default inventory | 21,093 |
| | 27,922 |
| 21,266 |
| | 21,093 |
|
Plus: New defaults on insurance written in years: (1) | | | | | | |
| Prior to and including 2008 | 4,548 |
| | 5,013 |
| 3,752 |
| | 4,548 |
|
| After 2008 | 5,668 |
| | 4,076 |
| 6,208 |
| | 5,668 |
|
| Total new defaults | 10,216 |
| | 9,089 |
| 9,960 |
| | 10,216 |
|
Less: Cures (1) | 10,479 |
| | 11,367 |
| |
Less: Claims paid (2) | 662 |
| | 1,052 |
| |
Less: Rescissions and Claim Denials, net of (Reinstatements) (3) | 46 |
| | (5 | ) | |
| Less: Cures | | 10,966 |
| | 10,479 |
|
Less: Claims paid (1) | | 471 |
| | 662 |
|
Less: Rescissions and Claim Denials, net of (Reinstatements) (2) | | 8 |
| | 46 |
|
| Ending default inventory | 20,122 |
| | 24,597 |
| 19,781 |
| | 20,122 |
|
| | | | | | | |
______________________
| |
| (1) | Amounts include the new defaults and Cures in the FEMA Designated Areas associated with Hurricanes Harvey and Irma, which occurred during the third quarter of 2017. Forthe three months ended March 31, 2019 and 2018, new defaults and Cures in these areas were as follows:
|
|
| | | | | |
| | Three Months Ended
March 31, |
| | 2019 | | 2018 |
| New defaults | 1,106 |
| | 989 |
|
| Cures | 1,239 |
| | 2,168 |
|
| |
(2) | Includes those charged to a deductible or captive reinsurance transactions, as well as commutations. |
| |
(3)(2) | Net of any previous Rescissions and Claim Denials that were reinstated during the period. Such reinstated Rescissions and Claim Denials may ultimately result in a paid claim. |
We develop our Default to Claim Rate estimates based on models that use a variety of loan characteristics to determine the likelihood that a default will reach claim status. Our gross Default to Claim Rate estimates on defaulted loans are mainly developed based on the Stage of Default and Timetime in Defaultdefault of the underlying defaulted loans, as measured by the progress toward a foreclosure sale and the number of months in default. Our grossSee Note 11 of Notes to Consolidated Financial Statements in our 2019 Form 10-K for additional details about our Default to Claim Rate assumption for new primary defaults, was 8% at December 31, 2018 and March 31, 2019. As of March 31, 2019, our gross Default to Claim Rate assumptions on our primary portfolio ranged from 8% for new defaults, up to 68% for defaults not in foreclosure stage, and 72% for Foreclosure Stage Defaults.assumptions.
Part I. Item 2. Management’s Discussion and Analysis of Financial Condition and Results of Operations (continued)
The following tables show additional information about our primary loans in default as of the dates indicated:
| | | | March 31, 2019 | March 31, 2020 |
| | Total | | Foreclosure Stage Defaulted Loans | | Cure % During the 1st Quarter | | Reserve for Losses | | % of Reserve | Total | | Foreclosure Stage Defaulted Loans | | Cure % During the 1st Quarter | | Reserve for Losses | | % of Reserve |
| ($ in thousands) | # | | % | | # | | % | | $ | | % | # | | % | | # | | % | | $ | | % |
| Missed payments: | | | | | | | | | | | | | | | | | | | | | | |
| Three payments or less | 9,248 |
| | 46.0 | % | | 122 |
| | 39.0 | % | | $ | 82,416 |
| | 23.4 | % | 9,450 |
| | 47.8 | % | | 105 |
| | 41.0 | % | | $ | 92,572 |
| | 26.2 | % |
| Four to eleven payments | 6,051 |
| | 30.1 |
| | 444 |
| | 23.0 |
| | 90,616 |
| | 25.7 |
| 6,114 |
| | 30.9 |
| | 458 |
| | 23.7 |
| | 99,388 |
| | 28.2 |
|
| Twelve payments or more | 4,215 |
| | 20.9 |
| | 1,254 |
| | 7.4 |
| | 147,525 |
| | 41.9 |
| 3,611 |
| | 18.2 |
| | 1,048 |
| | 7.5 |
| | 127,599 |
| | 36.1 |
|
| Pending claims | 608 |
| | 3.0 |
| | N/A |
| | 4.0 |
| | 31,887 |
| | 9.0 |
| 606 |
| | 3.1 |
| | N/A |
| | 5.3 |
| | 33,616 |
| | 9.5 |
|
| Total | 20,122 |
| | 100.0 | % | | 1,820 |
| | | | 352,444 |
| | 100.0 | % | 19,781 |
| | 100.0 | % | | 1,611 |
| | | | 353,175 |
| | 100.0 | % |
| IBNR and other | | | | | | | | | 13,008 |
| | | | | | | | | | | 40,583 |
| | |
| LAE | | | | | | | | | 8,994 |
| | | | | | | | | | | 9,216 |
| | |
| Total primary reserve | | | | | | | | | $ | 374,446 |
| | | | | | | | | | | $ | 402,974 |
| | |
| | | | | | | | | | | | | | | | | | | | | | | |
| | | March 31, 2019 | |
| March 31, 2020 | | March 31, 2020 |
Key Reserve Assumptions | | Gross Default to Claim Rate % | | Net Default to Claim Rate % | | Claim Severity % | | Net Default to Claim Rate % | | Claim Severity % |
| 35% | | 33% | | 98% | |
| 34% | | | 33% | | 98% |
| | | | December 31, 2018 | December 31, 2019 |
| | Total | | Foreclosure Stage Defaulted Loans | | Cure % During the 4th Quarter | | Reserve for Losses | | % of Reserve | Total | | Foreclosure Stage Defaulted Loans | | Cure % During the 4th Quarter | | Reserve for Losses | | % of Reserve |
| ($ in thousands) | # | | % | | # | | % | | $ | | % | # | | % | | # | | % | | $ | | % |
| Missed payments: | | | | | | | | | | | | | | | | | | | | | | |
| Three payments or less | 10,038 |
| | 47.6 | % | | 148 |
| | 33.2 | % | | $ | 83,540 |
| | 23.1 | % | 10,816 |
| | 50.9 | % | | 125 |
| | 32.6 | % | | $ | 89,187 |
| | 26.2 | % |
| Four to eleven payments | 5,905 |
| | 28.0 |
| | 422 |
| | 24.7 |
| | 87,210 |
| | 24.1 |
| 6,222 |
| | 29.3 |
| | 462 |
| | 21.5 |
| | 94,912 |
| | 27.9 |
|
| Twelve payments or more | 4,468 |
| | 21.2 |
| | 1,365 |
| | 6.5 |
| | 156,808 |
| | 43.4 |
| 3,646 |
| | 17.1 |
| | 1,077 |
| | 7.0 |
| | 124,534 |
| | 36.7 |
|
| Pending claims | 682 |
| | 3.2 |
| | N/A |
| | 4.3 |
| | 34,130 |
| | 9.4 |
| 582 |
| | 2.7 |
| | N/A |
| | 3.7 |
| | 31,187 |
| | 9.2 |
|
| Total | 21,093 |
| | 100.0 | % | | 1,935 |
| | | | 361,688 |
| | 100.0 | % | 21,266 |
| | 100.0 | % | | 1,664 |
| | | | 339,820 |
| | 100.0 | % |
| IBNR and other | | | | | | | | | 13,864 |
| | | | | | | | | | | 40,920 |
| | |
| LAE | | | | | | | | | 10,271 |
| | | | | | | | | | | 8,918 |
| | |
| Total primary reserve | | | | | | | | | $ | 385,823 |
| | | | | | | | | | | $ | 389,658 |
| | |
| | | | | | | | | | | | | | | | | | | | | | | |
| | | December 31, 2018 | |
| December 31, 2019 | | December 31, 2019 |
Key Reserve Assumptions | | Gross Default to Claim Rate % | | Net Default to Claim Rate % | | Claim Severity % | | Net Default to Claim Rate % | | Claim Severity % |
| 35% | | 33% | | 96% | |
| 31% | | | 30% | | 98% |
______________________
N/A – Not applicable
Our aggregate weighted average net Default to Claim Rate assumption for our primary loans used in estimating our reserve for losses, which is net of estimated Claim Denials and Rescissions, was approximately 33% and 30% at both March 31, 20192020 and December 31, 2018.2019, respectively. This increase was primarily due to a shift in the mix of defaults during the three months ended March 31, 2020, given the smaller proportion of loans with fewer missed payments. Our net Default to Claim Rate and loss reserve estimate incorporates our expectations with respect to future Rescissions, Claim Denials and Claim Curtailments, inclusive of claim withdrawals, reduced our loss reserve as of March 31, 2019 and December 31, 2018 by $32 million. These expectations are based primarily on our recent experience with respect to the number of claims that have been denied due to the policyholder’s
Part I. Item 2. Management’s Discussion and Analysis of Financial Condition and Results of Operations (continued)
Curtailments. Our estimate of such net future Loss Mitigation Activities, inclusive of claim withdrawals, reduced our loss reserve as of March 31, 2020 and December 31, 2019 by $19 million for both periods. These expectations are based primarily on recent claim withdrawal activity and our recent experience with respect to the number of claims that have been denied due to the policyholder’s failure to submit sufficient documentation to perfect a claim within the time period permitted under our Master Policies and also our recent experience with respect to the number of insurance certificates that have been rescinded due to fraud, underwriter negligence or other factors. See Note 11 of Notes to Consolidated Financial Statements in our 2018 Form 10-K.
Our mortgage insurance total loss reserve as a percentage of our mortgage insurance total RIF was 0.7% at both March 31, 20192020 and December 31, 2018.2019. See Note 10 of Notes to Unaudited Condensed Consolidated Financial Statements for information regarding our reserves for losses by category and a reconciliation of our Mortgage Insurance segment’s beginning and ending reserves for losses and LAE.
Our primary reserve per default (calculated as primary reserve excluding IBNR and other reserves divided by the number of primary defaults) was $17,962 and $17,634 at March 31, 2019 and December 31, 2018, respectively.
We considered the sensitivity of our loss reserve estimates at March 31, 20192020 by assessing the potential changes resulting from a parallel shift in Claim Severity and Default to Claim Rate for primary loans. For example, assuming all other factors remain constant, for every one percentage point absolute change in primary Claim Severity for our primary insurance risk exposure (which we estimated to be 98% of our risk exposure at March 31, 2019)2020), we estimated that our total loss reserve at March 31, 20192020 would change by approximately $4 million. Assuming the portfolio mix and all other factors remain constant, for every one percentage point absolute change in our primary net Default to Claim Rate, we estimated a $10 million change in our primary loss reserve at March 31, 2019.2020.
In addition, as partTotal mortgage insurance claims paid of our claims review process, we assess whether defaulted loans were serviced appropriately in accordance with our insurance policies and servicing guidelines. To the extent a servicer has failed to satisfy its servicing obligations, our policies provide that we may curtail the claim payment for such default, and in some circumstances, cancel coverage or deny the claim. Before consideration of any subsequent challenges by our lender and servicer customers, Claim Curtailments due to servicer noncompliance with our insurance policies and servicing guidelines, which impact the severity of our claim payments, were $0.6$23.4 million for the three months ended March 31, 2019, compared to $1.5 million for the same period in 2018.
Total mortgage insurance2020 decreased from claims paid of $34.6 million for the three months ended March 31, 2019 decreased from claims paid of $59.9 million for the three months ended March 31, 2018.same respective period in 2019. The decrease in claims paid is consistent with the ongoing decline in the outstanding default inventory. Claims paid in both periods also include the impact of commutations. Although expected claims are included in our reserve for losses, the timing of claims paid is subject to fluctuation from quarter to quarter, based on the rate that defaults cure and other factors (as described in “Item 1. Business—Mortgage Insurance—Defaults and Claims” in our 20182019 Form 10-K) that make the timing of paid claims difficult to predict.
The following table shows net claims paid by product and average claim paid by product for the periods indicated:
|
| | | | | | | |
| | Three Months Ended
March 31, |
| (In thousands) | 2020 | | 2019 |
Net claims paid: (1) | | | |
| Total primary claims paid | $ | 24,358 |
| | $ | 33,360 |
|
| Total pool and other | (911 | ) | | 1,230 |
|
| Subtotal | 23,447 |
| | 34,590 |
|
Impact of commutations and settlements (2) | (56 | ) | | — |
|
| Total net claims paid | $ | 23,391 |
| | $ | 34,590 |
|
| | | | |
Total average net primary claim paid (1) (3) | $ | 50.3 |
| | $ | 48.6 |
|
| | | | |
Average direct primary claim paid (3) (4) | $ | 51.4 |
| | $ | 49.2 |
|
______________________
| |
| (1) | Net of reinsurance recoveries. |
| |
| (2) | Includes payments to commute mortgage insurance coverage on certain performing and non-performing loans and the impact of captive terminations. |
| |
| (3) | Calculated without giving effect to the impact of captive reinsurance terminations and other commutations. |
| |
| (4) | Before reinsurance recoveries. |
Other Operating Expenses. Other operating expenses for the three months ended March 31, 2020 decreased as compared to the same period in 2019, primarily due to an increase in ceding commissions. This decrease in expense for the three months ended March 31, 2020 due to ceding commissions was partially offset by higher allocated corporate operating expenses.
Our expense ratio on a net premiums earned basis represents our Mortgage segment’s operating expenses (which include policy acquisition costs and other operating expenses, as well as allocated corporate operating expenses), expressed as a percentage of net premiums earned. Our expense ratio was 21.9% for the three months ended March 31, 2020, compared to
Part I. Item 2. Management’s Discussion and Analysis of Financial Condition and Results of Operations (continued)
The following table shows claims paid by product and average claim paid by product23.6% for the periods indicated:
|
| | | | | | | |
| | Three Months Ended
March 31, |
| (In thousands) | 2019 | | 2018 |
Net claims paid: (1) | | | |
| Prime | $ | 23,863 |
| | $ | 37,142 |
|
| Alt-A and A minus and below | 9,497 |
| | 21,416 |
|
| Total primary claims paid | 33,360 |
| | 58,558 |
|
| Pool | 1,109 |
| | 1,152 |
|
| Other | 121 |
| | 148 |
|
| Subtotal | 34,590 |
| | 59,858 |
|
Impact of commutations (2) | — |
| | 68 |
|
| Total net claims paid | $ | 34,590 |
| | $ | 59,926 |
|
| | | | |
Average net claim paid: (1) (3) | | | |
| Prime | $ | 47.1 |
| | $ | 50.0 |
|
| Alt-A and A minus and below | 53.1 |
| | 63.0 |
|
| Total average net primary claim paid | 48.6 |
| | 54.1 |
|
| | | | |
Average direct primary claim paid (3) (4) | $ | 49.2 |
| | $ | 54.5 |
|
______________________
| |
(1) | Net of reinsurance recoveries.
|
| |
(2) | Includes the impact of captive terminations. |
| |
(3) | Calculated without giving effect to the impact of the termination of captive transactions and commutations. |
| |
(4) | Before reinsurance recoveries.
|
Other Operating Expenses. Other operating expenses forsame period in 2019. The increase in net premiums earned during 2020 was the three months ended March 31, 2019,primary driver of the decrease in the expense ratio as compared to the same periods in 2018, reflect an increase primarily resulting from higher allocated corporate operating expenses. The increase in allocated corporate operating expenses is primarily due to (i) higher legal and other professional services expense and (ii) higher compensation expense, including variable and incentive-based compensation. See “Results2019.
Results of Operations—ConsolidatedReal Estate
—Three Months Ended March 31, 20192020 Compared to Three Months Ended March 31, 2018—Other Operating Expenses.”
Our expense ratio on a net premiums earned basis represents our Mortgage Insurance segment’s operating expenses (which include policy acquisition costs and other operating expenses, as well as allocated corporate operating expenses), expressed as a percentage of net premiums earned. Our expense ratio was 23.7% in each of the three months ended March 31, 2019 and 2018.
Part I. Item 2. Management’s Discussion and Analysis of Financial Condition and Results of Operations (continued)
Results of Operations—Services
Three Months Ended March 31, 2019 Compared to Three Months Ended March 31, 2018
The following table summarizes our ServicesReal Estate segment’s results of operations for the three months ended March 31, 20192020 and 2018:2019:
| | | | | | | | $ Change | | | | | $ Change |
| | Three Months Ended
March 31, | | Favorable (Unfavorable) | Three Months Ended
March 31, | | Favorable (Unfavorable) |
| (In millions) | 2019 | | 2018 | | 2019 vs. 2018 | 2020 | | 2019 | | 2020 vs. 2019 |
Adjusted pretax operating income (loss) (1) | $ | (6.1 | ) | | $ | (7.6 | ) | | $ | 1.5 |
| |
Adjusted pretax operating income (loss) (1) (2) | | $ | (4.9 | ) | | $ | (3.9 | ) | | $ | (1.0 | ) |
| Net premiums earned—insurance | 1.7 |
| | — |
| | 1.7 |
| 2.4 |
| | 1.7 |
| | 0.7 |
|
| Services revenue | 33.7 |
| | 34.2 |
| | (0.5 | ) | 26.0 |
| | 20.7 |
| | 5.3 |
|
| Cost of services | 24.6 |
| | 23.3 |
| | (1.3 | ) | 17.9 |
| | 14.3 |
| | (3.6 | ) |
Other operating expenses (2) (3) | 17.6 |
| | 13.5 |
| | (4.1 | ) | |
| Interest expense | — |
| | 4.5 |
| | 4.5 |
| |
| | | | | | | |
Other operating expenses (2) | | 14.8 |
| | 12.7 |
| | (2.1 | ) |
______________________
| |
| (1) | Our senior management uses adjusted pretax operating income (loss) as our primary measure to evaluate the fundamental financial performance of each of the Company’s business segments. See Note 3 of Notes to Unaudited Condensed Consolidated Financial Statements. |
| |
| (2) | Includes allocation of corporate operating expenses of $4.2$3.8 million for the three-month period ended March 31, 2019, and $2.8 million for the three-month periodthree months ended March 31, 2018,2020 and 2019, respectively. |
| |
(3) | Does not include impairment of long-lived assets and infrequent or unusual non-operating items, which are not considered components of adjusted pretax operating income. |
Our Services segment offers a broad array of mortgage, real estate and title services to market participants across the
mortgage and real estate value chain, primarily through our subsidiaries, including Clayton, Green River Capital, Radian Settlement Services and Red Bell. In 2018, we also acquired the businesses of EnTitle Direct and Independent Settlement Services, as well as the assets of Five Bridges, to enhance our Services offerings. In connection with the restructuring of our Services business, we have refined our Services business strategy going forward and are focused on our core mortgage, real estate and title services. These services provide mortgage lenders, financial institutions, mortgage and real estate investors and government entities, among others, with information and other resources that are used to originate, evaluate, acquire, securitize, service and monitor residential real estate and loans secured by residential real estate. Effective with our acquisition of EnTitle Direct, we provide title insurance to mortgage lenders as well as directly to borrowers.
Adjusted Pretax Operating Income (Loss). Our ServicesReal Estate segment’s adjusted pretax operating loss for the three months ended March 31, 20192020 was $6.1$4.9 million compared to adjusted pretax operating loss of $7.6$3.9 million for the same period in 2018.2019. The decreaseincrease in our adjusted pretax operating loss for the three months ended March 31, 2019,2020, as compared to the same period in 2018,2019, was primarily driven by a decrease in interest expense,higher cost of services and other operating expenses, partially offset by an increase in other operating expenses resulting from the impact of the businesses acquired in 2018 and the inclusion of other operating expenses for these businesses from their respective dates of acquisition.services revenue.
Net premiums earned—insurance.Premiums Earned—Insurance. Net premiums earned for the three months ended March 31, 20192020 increased compared to the same period in 2018, as a result of the acquisition of EnTitle Direct and the inclusion of its operations.2019, primarily due to ongoing growth in title services provided by Radian Title Insurance.
Services Revenue. Services revenue decreasedincreased for the three months ended March 31, 2019,2020, as compared to the same periods in 2018, primarily due to a decline in mortgage services, partially offset by an increase in real estate services. This decrease in services revenue is primarily attributable to fluctuations in the overall activity in the housing and mortgage finance markets, including a decline in the refinance mortgage origination market for the three months ended March 31, 2019, compared to the same period in 2018, partially offset by the inclusion of revenue from businesses acquired2019, primarily due to ongoing growth in 2018 since their respective dates of acquisition.title services.
Cost of Services. Our cost of services is primarily affected by our level of services revenue. The level of these costs may also fluctuate if market rates of compensation change, or if there is decreased availability or a loss of qualified employees.
Part I. Item 2. Management’s Discussion and Analysis of Financial Condition and Results of Operations (continued)
Other Operating Expenses. Other operating expenses primarily consist of compensation costs not classified as cost of services because they are related to employees, such as sales and corporate employees, who are not directly involved in providing client services. Other operating expenses for the three months ended March 31, 2019 were impacted by businesses acquired in 2018 and the resulting inclusion of other operating expenses for these businesses from their respective dates of acquisition. Other operating expenses also include other selling, general and administrative expenses, depreciation, and allocations of corporate general and administrative expenses. Other operating expenses for the three months ended March 31, 2020 increased compared to the same period in 2019, due in part to higher allocated corporate operating expenses. See “Results of Operations—Consolidated—Three Months Ended March 31, 20192020 Compared to Three Months Ended March 31, 2018—2019—Other Operating Expenses.”
Interest Expense. Effective January 1, 2019, the Clayton Intercompany Note was repaid using proceeds from an additional capital contribution from Radian Group. As a result of the intercompany note repayment, the Services segment no longer incurs interest expense on the intercompany note.
Off-Balance Sheet Arrangements
There have been no material changes in off-balance sheet arrangements from those specified in our 2018 Form 10-K.
Contractual Obligations and Commitments
There have been no material changes outsideResults of the ordinary course of business in our contractual obligations and commitments from those specified in our 2018 Form 10-K.
Liquidity and Capital Resources
Radian Group—Short-Term Liquidity NeedsOperations—All Other
Radian Group serves as the holding company for our insurance and other subsidiaries and does not have any operations of its own. AtThree Months Ended March 31, 2020 Compared to Three Months Ended March 31, 2019 Radian Group had available, either directly or through an unregulated subsidiary, unrestricted cash and liquid investments of $723.4 million. Total liquidity as of March 31, 2019 was $990.9 million, and includes
All Other activities include income (losses) from assets held by our undrawn $267.5 million unsecured revolving credit facility as of that time. Available liquidity and total liquidity at March 31, 2019 exclude certain additional cash and liquid investments that have been advanced to Radian Group from our subsidiaries for corporate expenses and interest payments. In addition, these amounts do not take into consideration transactions subsequent to March 31, 2019, including: (i) $90.6 million in repurchases of Radian Group common stock, excluding commissions, pursuant to the existing share repurchase authorization and (ii) the $375 million distribution of capital from Radian Guaranty to Radian Group. See “—Sources of Liquidity” below. Subject to certain limitations, borrowings under the credit facility may be used for working capital andholding company, related general corporate purposes, including, without limitation, capital contributionsoperating expenses not attributable or allocated to Radian Group’s insuranceour reportable segments and, reinsurance subsidiaries as well as growth initiatives.for all periods through the first quarter of 2020, income and expenses related to Clayton prior to its sale on January 21, 2020. See Note 123 of Notes to Unaudited Condensed Consolidated Financial Statements for additional details.
On March 20, 2019, Radian Group’s board of directors approved a $150 million increase in authorization for the Company’s existing share repurchase plan, bringing the total authorization to repurchase shares up to $250 million, excluding commissions. During the three months ended March 31, 2019, the Company purchased 1,546,674 shares at an average price of $20.54 per share, including commissions. At March 31, 2019, purchase authority of up to a maximum of $218.2 million remained available under this program, which expires on July 31, 2020. Subsequent to March 31, 2019, Radian Group has purchased an additional 4,131,329 shares of its common stock, which reduced available holding company liquidity from the amount reported above. See Note 14 of Notes to Unaudited Condensed Consolidated Financial Statements for additional details on our share repurchase program.
Radian Group’s principal liquidity demands for the next 12 months are: (i) the payment of corporate expenses, including taxes; (ii) the payment of $158.6 million principal amount of our outstanding Senior Notes due in June 2019; (iii) interest payments on our outstanding debt obligations; (iv) the payment of dividends on our common stock; and (v) the potential use of up to $218.2 million to repurchase Radian Group common stock pursuant to the existing share repurchase authorization ($90.6 million of which was used for the purchases made subsequent to March 31, 2019 through May 6, 2019, excluding commissions). Radian Group’s liquidity demands for the next 12 months or in future periods could also include: (i) capital support for Radian Guaranty and our other subsidiaries (if needed); (ii) repayments, repurchases or early redemptions of portions of our debt obligations; and (iii) potential investments to support our business strategy.
Corporate Expenses and Interest Expense. Radian Group has expense-sharing arrangements in place with its principal operating subsidiaries that require those subsidiaries to pay their allocated share of certain holding company expenses, including interest payments on most of Radian Group’s outstanding debt obligations. Payments of these corporate expenses forinformation.
Part I. Item 2. Management’s Discussion and Analysis of Financial Condition and Results of Operations (continued)
the next 12 months, excluding interest payments on Radian Group’s debt, are expected to be approximately $90 million to $100 million. For the same period, payments of interest on Radian Group’s debt obligations are expected to be approximately $51 million. We expect most of these holding company expenses to be reimbursed by our subsidiaries under our expense-sharing arrangements. See “—Radian Group—Long-Term Liquidity Needs” and “—Services.” The expense-sharing arrangements between Radian Group and our insurance subsidiaries, as amended, have been approved by the applicable insurance departments, but such approval may be modified or revoked at any time.
Capital Support for Subsidiaries. Private mortgage insurers, including Radian Guaranty, are required to comply with the PMIERs to remain approved insurers of loans purchased by the GSEs. Radian Guaranty currently is an approved mortgage insurer and is in compliance with the PMIERs financial requirements. At March 31, 2019, Radian Guaranty’s Available Assets under the current PMIERs financial requirements totaled approximately $3.5 billion, resulting in excess available resources or a “cushion” of $488 million, or 16%, over its Minimum Required Assets of $3.0 billion. See Note 16 of Notes to Unaudited Condensed Consolidated Financial Statements for additional details regarding the capital requirements of our subsidiaries.
While the amount of this cushion could fluctuate on a quarterly basis, we expect it to increase over time based, in part, on our expectations regarding the future financial performance of Radian Guaranty, including our projected NIW, expected decrease in defaults and risk distribution strategy. See Notes 1 and 7 of Notes to Unaudited Condensed Consolidated Financial Statements for additional information about the PMIERs and our reinsurance programs, respectively. Additionally, notwithstanding our cushion, our holding company liquidity of $723.4 million and our $267.5 million unsecured revolving credit facility (both as of March 31, 2019) may be utilized to enhance Radian Guaranty’s PMIERs cushion, as necessary, subject to a $35 million minimum liquidity requirement under our unsecured revolving credit facility. See Note 12 of Notes to Unaudited Condensed Consolidated Financial Statements for additional information on the unsecured revolving credit facility.
Part I. Item 2. Management’s Discussion and Analysis of Financial Condition and Results of Operations (continued)
The chart belowfollowing table summarizes our “cushion” underAll Other results of operations for the PMIERs and Radian’s excess available resources as ofthree months ended March 31, 2018, December 31, 20182020 and March 31, 2019, calculated based on the PMIERs financial requirements in effect for each date shown. Our excess available resources include our unsecured revolving credit facility and holding company liquidity, which may be utilized to enhance Radian Guaranty’s PMIERs cushion.2019:
|
| | | | | | | | | | | |
| | | | | | $ Change |
| | Three Months Ended
March 31, | | Favorable (Unfavorable) |
| (In millions) | 2020 | | 2019 | | 2020 vs. 2019 |
Adjusted pretax operating income (loss) (1) | $ | 3.8 |
| | $ | 2.4 |
| | $ | 1.4 |
|
| Services revenue | 2.9 |
| | 11.6 |
| | (8.7 | ) |
| Net investment income | 4.6 |
| | 4.9 |
| | (0.3 | ) |
| Cost of services | 2.6 |
| | 9.7 |
| | 7.1 |
|
| Other operating expenses | 1.3 |
| | 4.7 |
| | 3.4 |
|
______________________
| |
| (1) | Represents Radian Group’s Liquidity, netOur senior management uses adjusted pretax operating income (loss) as our primary measure to evaluate the fundamental financial performance of each of the $35 million minimum liquidity requirement under the unsecured revolving credit facility. Radian Group’s Liquidity asCompany’s business segments. See Note 3 of December 31, 2018 includes $450 million from the December 2018 distribution of capitalNotes to our holding company from its mortgage insurance subsidiary, as approved by the Pennsylvania Insurance Department. |
| |
(2) | Represents Radian Guaranty’s excess of Available Assets over its Minimum Required Assets, calculated in accordance with the PMIERs financial requirements in effect for each date shown. PMIERs 1.0 was in effect for March 31, 2018 and December 31, 2018; PMIERs 2.0 was in effect for March 31, 2019. |
| |
(3) | Percentages represent the values shown as a percentage of Minimum Required Assets under the applicable PMIERs financial requirements in effect for the dates shown.Unaudited Condensed Consolidated Financial Statements. |
PMIERs 1.0 required Radian to maintain significantly more Minimum Required Assets for delinquent loans than for performing loans. Therefore, the increaseOff-Balance Sheet Arrangements
There have been no material changes in new primary defaults received during 2017off-balance sheet arrangements from areas affected by Hurricanes Harvey and Irma required us to maintain an elevated level of Minimum Required Assets at March 31, 2018, compared to levels prior to these hurricanes. As of December 31, 2018, the impact of these hurricanes on our level of our Minimum Required Assets had substantially decreased, consistent with our expectation that most of the hurricane-related defaults would cure during 2018, and these incremental defaults did not result in a material increasethose specified in our incurred losses or paid claims. See2019 Form 10-K, other than as described below.
Variable Interest Entity
In February 2020, Radian Guaranty entered into a fully collateralized reinsurance agreement with Eagle Re 2020-1, an unaffiliated special purpose reinsurer domiciled in Bermuda. The Eagle Re Issuers are special purpose VIEs that are not consolidated in our consolidated financial statements because we do not have the unilateral power to direct those activities that are significant to their economic performance.
For additional information about the Eagle Re Issuers and our other reinsurance arrangements, see Note 117 of Notes to Unaudited Condensed Consolidated Financial StatementsStatements.
Contractual Obligations and Commitments
There have been no material changes outside of the ordinary course of business in our 2018contractual obligations and commitments from those specified in our 2019 Form 10-K. Subject to certain requirements, defaulted loans in FEMA-declared major disaster areas require a reduced level of Minimum Required Assets under PMIERs 2.0, as compared to under PMIERs 1.0, which we expect to help reduce the future volatility of our Minimum Required Asset levels upon the occurrence of a similar event.
Liquidity and Capital Resources
Consolidated Cash Flows
The two reinsurance agreements we entered into in November 2018 as partfollowing table summarizes our consolidated cash flows from operating, investing and financing activities:
|
| | | | | | | |
| (In thousands) | Three Months Ended
March 31, |
| 2020 | | 2019 |
| Net cash provided by (used in): | | | |
| Operating activities | $ | 155,800 |
| | $ | 217,778 |
|
| Investing activities | 31,993 |
| | (185,343 | ) |
| Financing activities | (222,142 | ) | | (11,683 | ) |
| Increase (decrease) in cash and restricted cash | $ | (34,349 | ) | | $ | 20,752 |
|
| | | | |
Operating Activities. Our most significant source of operating cash flows is generally from premiums received from our Excess-of-Loss Program reducedmortgage insurance policies, while our levelmost significant uses of Minimum Required Assets by $455.4 million. This benefit was approximately offset by the distribution of capital from Radian Guaranty to Radian Group in December 2018, which reduced Radian Guaranty’s Available Assets by $450 million.operating cash flows are generally for claims paid on our mortgage insurance policies and our operating expenses. Net cash provided by operating activities alsototaled $155.8 million for the three months ended March 31, 2020, a decrease compared to $217.8 million for the same period in 2019. This decrease was
principally the result of cash received from the IRS in the first quarter of 2019, which included a $57.2 million refund which was previously on deposit with the IRS.
Investing Activities. Net cash provided by investing activities was $32.0 million for the three months ended March 31, 2020, compared to net cash used in investing activities of $185.3 million for the same period in 2019. This change was primarily the result of a decrease in net purchases of short-term investments. This decrease was partially offset by: (i) a decrease in proceeds from sales, net of purchases, of fixed-maturity investments available for sale; (ii) a decrease in proceeds from sales of trading securities; and (iii) a decrease in proceeds from sales, net of purchases, of equity securities.
Financing Activities. Net cash used in financing activities increased Available Assetsfor the three months ended March 31, 2020, compared to net cash used in financing activities during 2018the same period in 2019. For the three months ended March 31, 2020, our primary financing activities included: (i) an increase in repurchases of our common shares and 2019.(ii) an increase in dividends paid. See Notes 7 and 16Note13 of Notes to Unaudited Condensed Consolidated Financial Statements for additional information regarding our share repurchases and increased dividends.
See “Item 1. Financial Statements (Unaudited)—Condensed Consolidated Statements of Cash Flows (Unaudited)” for additional information.
Liquidity Analysis—Holding Company
Radian Group serves as the holding company for our operating subsidiaries and does not have any operations of its own. At March 31, 2020, Radian Group had available, either directly or through unregulated subsidiaries, unrestricted cash and liquid investments of $648.2 million. Available liquidity at March 31, 2020 excludes certain additional cash and liquid investments that have been advanced to Radian Group from our subsidiaries to pay for corporate expenses and interest payments. Total liquidity, which includes our undrawn $267.5 million unsecured revolving credit facility, as described below, was $915.7 million as of March 31, 2020.
During the three months ended March 31, 2020, Radian Group’s available liquidity decreased by $4.4 million, due primarily to Radian Reinsurance’s return of $465 million in capital to Radian Group in January 2020, as approved by the Pennsylvania Insurance Department. The effects of this return of capital were partially offset by the cost of share repurchases and dividends, as described below, and the transfer of $200 million of cash and marketable securities to Radian Guaranty in exchange for a surplus note in the same amount. See “—Mortgage” below for additional information.
In addition to available cash and marketable securities, Radian Group’s principal sources of cash to fund future liquidity needs include: (i) payments made to Radian Group by its subsidiaries under expense- and tax-sharing arrangements; (ii) net investment income earned on its cash and marketable securities; (iii) to the extent available, dividends or other distributions from our subsidiaries; and (iv) amounts that Radian Guaranty is able to repay under the Surplus Notes. Radian Group also has in place a $267.5 million unsecured revolving credit facility with a syndicate of bank lenders. At March 31, 2020, the full $267.5 million remains undrawn and available under the facility. Subject to certain limitations, borrowings under the credit facility may be used for working capital and general corporate purposes, including, without limitation, capital contributions to our insurance and reinsurance subsidiaries as well as growth initiatives. See Note 12 of Notes to Consolidated Financial Statements in our 2019 Form 10-K for additional information on the unsecured revolving credit facility.
We expect Radian Group’s principal liquidity demands for the next 12 months to be: (i) the payment of corporate expenses, including taxes; (ii) interest payments on our outstanding debt obligations; and (iii) subject to approval by our board of directors and our ongoing assessment of our financial condition and potential capital demands in our mortgage insurance business, the payment of quarterly dividends on our common stock, which we recently increased to $0.125 per share.
In addition to our ongoing short-term liquidity needs discussed above, our most significant need for liquidity beyond the next 12 months is the repayment of $900 million aggregate principal amount of our senior debt due in future years. See “—Capitalization—Holding Company” below for details of our debt maturity profile. Radian Group’s liquidity demands for the next 12 months or in future periods could also include: (i) early repurchases or redemptions of portions of our debt obligations; (ii) the repurchase of shares of our common stock pursuant to the share repurchase authorization, as described below, for which $198.9 million in authorization remains outstanding; (iii) potential additional investments to support our business strategy; and (iv) potential additional capital contributions to our subsidiaries, including due to the impact that the COVID-19 pandemic could have on the liquidity, results of operations and financial condition of Radian Group and our subsidiaries. As a result of the COVID-19 pandemic and its impact on the economy, including the significant increase in unemployment, we expect a material increase in new defaults as borrowers fail to make timely payments on their mortgages, including as a result of entering mortgage forbearance programs that allow borrowers to defer mortgage payments. While we expect it will take a number of
Part I. Item 2. Management’s Discussion and Analysis of Financial Condition and Results of Operations (continued)
The GSEsmonths or years before any new defaults resulting from the pandemic would require a claim payment, Radian Group may amend the PMIERs at any time, although the GSEs have communicated that for material changes, including material changes affecting Minimum Required Assets, they will generally provide written notice 180 days priorbe required to the effective date. The GSEs also have broad discretioncontribute additional capital to interpret the PMIERs, which could impact the calculation of Radian Guaranty’s Available Assets and/or Minimum Required Assets. On September 27, 2018, the GSEs issued revisions to the PMIERs, or PMIERs 2.0, which became effective on March 31, 2019. These changes did not result in a material change in Radian’s Minimum Required Assets, but, as shown in the chart above, reduced Radian’s PMIERs cushion. The reduction insupport Radian Guaranty’s PMIERs cushion is primarily due to a reduction in Available Assetsincreased capital requirements on defaulted loans. See “Item 1A. Risk Factors,” including “—Radian Group’s sources of approximately $200 million as a result of the elimination in PMIERs 2.0 of any credit for future premiums for insurance policies written priorliquidity may be insufficient to fund its obligations” and including 2008, which was permitted under PMIERs 1.0.
“—In April 2019, Radian Guaranty entered into a fully collateralized reinsurance agreementmay fail to maintain its eligibility status with Eagle Re 2019-1 that will reduce net RIF by a total of $562.0 million, and is expected to reduce the capital required to be held at Radian Guaranty by reducing the PMIERs Minimum Required Assets by the same amount. This expected growth in PMIERs excess available resources has not been reflected in the information provided above. See “Overview—Other 2019 Developments—ReinsuranceGSEs” for additional information on this new agreement.
In April 2019,discussion about the Pennsylvania Insurance Department approved a $375 million distribution of capital from Radian Guarantyelevated risks and uncertainties associated with the COVID-19 pandemic and the potential impact to Radian Guaranty’s Minimum Required Assets. See also Notes 1 and 15 of Notes to Unaudited Condensed Consolidated Financial Statements and “Overview—COVID-19 Impacts” for further information.
If Radian Group’s current sources of liquidity are insufficient to fund its obligations, or if we otherwise decide to increase our liquidity position, Radian Group may seek additional capital, including by incurring additional debt, issuing additional equity, or selling assets, which was paidwe may not be able to do on April 30, 2019favorable terms, if at all.
Share Repurchases. During the three months ended March 31, 2020, the Company repurchased 11.0 million shares of Radian Group common stock under programs authorized by Radian Group’s board of directors, at a total cost of $226.3 million, including commissions. Effective March 19, 2020, the Company suspended its share repurchase program and canceled its current 10b5-1 plan. Radian may initiate a new 10b5-1 plan at its discretion in the formfuture, during an open trading window and in accordance with SEC rules. The expiration date of cash and marketable securities. This distribution will reduce our PMIERs Available Assets by $375 million.the current share repurchase authorization remains August 31, 2021. See Note 1613 of Notes to Unaudited Condensed Consolidated Financial Statements for a discussion of this distribution of capital.
Radian Guaranty’s Risk-to-capital as of March 31, 2019 was 13.4 to 1. See Note 16 of Notes to Unaudited Condensed Consolidated Financial Statements for more information. Our combined Risk-to-capital, which represents the consolidated Risk-to-capital measure for all ofadditional details on our Mortgage Insurance subsidiaries, was 12.4 to 1 as of March 31, 2019. Radian Guaranty is not expected to need additional capital to satisfy state insurance regulatory requirements in their current form.
The NAIC is in the process of reviewing the minimum capital and surplus requirements for mortgage insurers and has been considering changes to the Model Act. While the timing and outcome of this process is not known, in the event the NAIC adopts changes to the Model Act, we expect that the capital requirements in states that adopt the new Model Act may increase as a result of the changes. However, we continue to believe the changes to the Model Act will not result in financial requirements that require greater capital than the level currently required under the PMIERs financial requirements.
Title insurance companies, including EnTitle Insurance, are subject to comprehensive state regulations, including minimum net worth requirements. EnTitle Insurance was in compliance with its minimum net worth requirements at March 31, 2019. In the event the cash flow from operations of EnTitle Insurance is not adequate to fund all of its needs, Radian Group may provide additional funds to EnTitle Insurance in the form of an intercompany note or other capital contribution, subject to the approval of the Ohio Department of Insurance, if needed. Radian Group may also provide additional funds to other subsidiaries in our Services segment to help fund their operations, if needed. See also “—Services.” Additional capital support may also be required for potential investments in new business initiatives to support our strategy of growing our businesses.share repurchase programs.
Dividends. OurIn 2019, our quarterly common stock dividend currently iswas $0.0025 per share and, basedshare. Effective February 13, 2020, Radian Group’s board of directors authorized an increase to the Company’s quarterly cash dividend to $0.125 per share. Based on our current outstanding shares of common stock, we would require approximately $2.1$95 million in the aggregate to pay our quarterly dividends for the next 12 months. Radian Group is not subject to any limitations on its ability to pay dividends except those generally applicable to corporations that are incorporated in Delaware. The declaration and payment of future quarterly cash dividends remains subject to the board of directors’ determination. Delaware corporation law provides that dividends are only payable out of a corporation’s capital surplus or (subject to certain limitations) recent net profits. As of March 31, 2019,2020, our capital surplus was $3.7$3.8 billion, representing our dividend limitation under Delaware law.
SourcesCorporate Expenses and Interest Expense. Radian Group has expense-sharing arrangements in place with its principal operating subsidiaries that require those subsidiaries to pay their allocated share of Liquidity. In addition to available cash and marketable securities,certain holding-company-level expenses, including interest payments on Radian Group’s principal sourcesoutstanding debt obligations. Corporate expenses and interest expense on Radian Group’s debt obligations allocated under these arrangements during the three months ended March 31, 2020 of cash$33 million and $12 million, respectively, were substantially all reimbursed by our subsidiaries. We expect substantially all of our holding company expenses to fund future short-term liquidity needs include payments madecontinue to be reimbursed by our subsidiaries under our expense-sharing arrangements. The expense-sharing arrangements between Radian Group under expense- and tax-sharing arrangements with its subsidiaries. See also “our mortgage insurance subsidiaries, as amended, have been approved by the Pennsylvania Insurance Department, but such approval may be modified or revoked at any time.
Taxes—Radian Group—Long-Term Liquidity Needs” and “—Services.”. Pursuant to our tax-sharing agreements, our operating subsidiaries pay Radian Group an amount equal to any federal income tax the subsidiary would have paid on a standalone basis if they were not part of our consolidated tax return. As a result, from time to time, under the provisions of our tax-sharing agreements, Radian Group may pay to or receive cash from its operating subsidiaries amounts that is in excess ofdiffer from Radian Group’s consolidated federal tax payment obligation. For 2019, we do not expect these excess taxDuring the three months ended March 31, 2020, Radian Group neither made any payments to the IRS nor received any tax-sharing payments from our subsidiaries to exceed Radian Group’s federal tax payment obligation to the same extent as in 2018.its operating subsidiaries.
In addition to the primary sources of liquidity listed above, Radian Group has in place a $267.5 million unsecured revolving credit facility with a syndicate of bank lenders. At March 31, 2019, the full $267.5 million remains undrawn and
Part I. Item 2. Management’s Discussion and Analysis of Financial Condition and Results of Operations (continued)
availableCapitalization—Holding Company
The following table presents our holding company capital structure:
|
| | | | | | | |
| (In thousands) | March 31,
2020 | | December 31,
2019 |
| Debt: | | | |
| 4.500% Senior Notes due 2024 | $ | 450,000 |
| | $ | 450,000 |
|
| 4.875% Senior Notes due 2027 | 450,000 |
| | 450,000 |
|
| Deferred debt costs on senior notes | (12,416 | ) | | (12,890 | ) |
| Revolving credit facility | — |
| | — |
|
| Total | 887,584 |
| | 887,110 |
|
| | | | |
| Stockholders’ equity | 3,864,508 |
| | 4,048,723 |
|
| | | | |
| Total capitalization | $ | 4,752,092 |
| | $ | 4,935,833 |
|
| | | | |
| Debt-to-capital ratio | 18.7 | % | | 18.0 | % |
Stockholders’ equity decreased by $184.2 million from December 31, 2019 to March 31, 2020. The net decrease in stockholders’ equity resulted primarily from: (i) shares repurchased under our share repurchase programs of $226.3 million, including commissions; (ii) net unrealized losses on investments of $80.7 million; and (iii) dividends of $25.4 million. These items were partially offset by our net income of $140.5 million for the facility. See Note 12 of Notes to Unaudited Condensed Consolidated Financial Statements for additional information on the unsecured revolving credit facility.
If Radian Group’s current sources of liquidity are insufficient for Radian Group to fund its obligations during the next 12three months or if we otherwise decide to increase our liquidity position, Radian Group may seek additional capital, including by incurring additional debt, issuing additional equity, or selling assets, which we may not be able to do on favorable terms, if at all.ended March 31, 2020.
We regularly evaluate opportunities, based on market conditions, to finance our operations by accessing the capital markets or entering into other types of financing arrangements with institutional and other lenders and financing sources, and consider various measures to improve our capital and liquidity positions, as well as to strengthen our balance sheet, and improve Radian Group’s debt maturity profile.profile and maintain adequate liquidity for our operations. In the past we have repurchased and exchanged, prior to maturity, some of our outstanding debt, and in the future, we may from time to time seek to redeem, repurchase or exchange for other securities, or otherwise restructure or refinance some or all of our outstanding debt prior to maturity in the open market through other public or private transactions, including pursuant to one or more tender offers or through any combination of the foregoing, as circumstances may allow. The timing or amount of any potential transactions will depend on a number of factors, including market opportunities and our views regarding our capital and liquidity positions and potential future needs.needs, including as a result of the effects of the COVID-19 pandemic. There can be no assurance that any such transactions will be completed on favorable terms, or at all.
Mortgage
The principal demands for liquidity in our mortgage insurance business include: (i) the payment of claims and potential claim settlement transactions, net of reinsurance; (ii) expenses (including those allocated from Radian Group—Long-Term Liquidity Needs
In additionGroup); (iii) repayments of FHLB advances; (iv) interest expense and repayments associated with the Surplus Notes; and (v) taxes, including potential additional purchases of U.S. Mortgage Guaranty Tax and Loss Bonds. See Note 9 of Notes to Unaudited Condensed Consolidated Financial Statements for additional information related to these non-interest bearing instruments. The principal sources of liquidity in our short-term liquidity needs discussed above,mortgage insurance business currently include insurance premiums, net investment income and cash flows from: (i) investment sales and maturities; (ii) FHLB advances; and (iii) capital contributions from Radian Group. We believe that the operating cash flows generated by each of our most significantmortgage insurance subsidiaries will provide these subsidiaries with a substantial portion of the funds necessary to satisfy their needs for liquidity beyond the next 12 months are:
| |
(1) | the repayment of the following principal amounts in connection with our outstanding Senior Notes (excluding the $158.6 million principal amount of outstanding debt due in June 2019): |
$234.1 million principal amountforeseeable future. However, see “Overview—COVID-19 Impacts” and Note 1 of outstanding debt due in June 2020;Notes to Unaudited Condensed Consolidated Financial Statements for discussion about the elevated risks and uncertainties associated with the COVID-19 pandemic, including the impact on our PMIERs cushion.
$197.7 million principal amount of outstanding debt due in March 2021;
$450.0 million principal amount of outstanding debt due in October 2024; and
| |
(2) | potential additional capital contributions to our subsidiaries. |
As of March 31, 2019, certain2020, our Mortgage segment maintained claims paying resources of our subsidiaries have incurred federal NOLs that could not be carried-back and utilized$4.7 billion on a separate company tax return basis. As a result, we are not currently obligated under our tax-sharing agreement to reimburse these subsidiaries for their separate company federal NOL carryforward. However, if in a future period, onestatutory basis, which consists of these subsidiaries utilizes its share of federal NOL carryforwards on a separate entity basis, then Radian Group may be obligated to fund such subsidiary’s share of our consolidated tax liability to the IRS. Certain subsidiaries, including Clayton, currently have federal NOLs on a separate entity basis that are available for future utilization. However, we do not expect to fund material obligations related to these subsidiary NOLs. See also “—Radian Group—Short-Term Liquidity Needs—Sources of Liquidity.”
We expect to meet the long-term liquidity needs of Radian Group with a combination of: (i) available cash and marketable securities; (ii) private or public issuances of debt or equity securities, which we may not be able to do on favorable terms, if at all; (iii) cash received under tax- and expense-sharing arrangements with our subsidiaries; (iv) to the extent available, dividends or returns of capital from our subsidiaries; and (v) any amounts that Radian Guaranty is able to successfully repay under the Surplus Note.
Under Pennsylvania’s insurance laws, ordinary dividends and other distributions may only be paid out of an insurer’s positive unassigned surplus, measured as of the end of the prior fiscal year. Despite the fact that Radian Guaranty and Radian Reinsurance maintained significant positivecontingency reserves, statutory policyholders’ surplus, balances, Radian Guarantypremiums received but not yet earned and Radian Reinsurance had negative unassigned surplus at March 31, 2019loss reserves. In addition, our reinsurance programs are designed to provide additional claims-paying resources during times of $651.1 millioneconomic stress and $76.6 million, respectively. Therefore, no ordinary dividends or other distributions can be paid by these subsidiaries in 2019. Due in part to the need to set aside contingency reserves, we do not expect that Radian Guaranty or Radian Reinsurance will have positive unassigned surplus, and therefore we expect that they will not have the ability to pay ordinary dividends, for the foreseeable future. Under Pennsylvania’s insurance laws, an insurer may request an Extraordinary Distribution, but payment is subject to the approval of the Pennsylvania Insurance Commissioner.elevated losses. See Note 167 of Notes to Unaudited Condensed Consolidated Financial Statements for additional information.
There can also be no assurance thatRadian Guaranty’s Risk-to-capital as of March 31, 2020 was 13.8 to 1. Our combined Risk-to-capital, which represents the consolidated Risk-to-capital measure for all of our Services segment will generate sufficient cash flowmortgage insurance subsidiaries, was 12.4 to pay dividends. See “—Services” below.1 as of March 31, 2020.
Part I. Item 2. Management’s Discussion and Analysis of Financial Condition and Results of Operations (continued)
Mortgage InsuranceRadian Guaranty is not expected to need additional capital to satisfy state insurance regulatory requirements in their current form. See Note 15 of Notes to Unaudited Condensed Consolidated Financial Statements, “Overview—COVID-19 Impacts” and “Item 1A. Risk Factors” for more information about our statutory and PMIERs requirements and the potential effects of increased defaults due to the COVID-19 pandemic.
AsPrivate mortgage insurers, including Radian Guaranty, are required to comply with the PMIERs to remain approved insurers of loans purchased by the GSEs. Radian Guaranty currently is an approved mortgage insurer under the PMIERs. At March 31, 2020, Radian Guaranty’s Available Assets under the current PMIERs financial requirements totaled approximately $4.1 billion, resulting in excess available resources or a “cushion” of $1.1 billion, or 38%, over its Minimum Required Assets of $2.9 billion.
The chart below summarizes our “cushion” under the PMIERs and Radian’s excess available resources as of March 31, 2019, December 31, 2019 and March 31, 2020, calculated based on the PMIERs financial requirements in effect for each date shown. Our excess available resources include our Mortgage Insurance segment maintained claims paying resourcesunsecured revolving credit facility and holding company liquidity. Our PMIERs cushion as of $4.5 billion on a statutory basis, which consistsMarch 31, 2020 includes the benefit from our reinsurance agreement with Eagle Re 2020-1 effective February 2020 and the transfer of contingency reserves, statutory policyholders’ surplus, premiums received but not yet earned$200 million of cash and loss reserves.
The principal demands for liquidity in our mortgage insurance business include: (i) the payment of claims and potential claim settlement transactions, net of reinsurance; (ii) operating expenses (including those allocatedmarketable securities from Radian Group) and (iii) taxes. In addition,Group in exchange for a surplus note in the same amount in January 2020, partially offset by an increase in Minimum Required Assets due to the termination of the intercompany reinsurance agreement with Radian Reinsurance. While these resources may be utilized to enhance Radian Guaranty’s SurplusPMIERs cushion, the impact of the COVID-19 pandemic could affect our ability to remain compliant with the PMIERs financial requirements as the increase in defaults and resulting increase to our Minimum Required Assets could reduce or potentially exhaust our PMIERs “cushion” or exceed our Available Assets. See “Item 1A. Risk Factors” for additional information.
______________________
| |
| (1) | Represents Radian Group’s liquidity, net of the $35 million minimum liquidity requirement under the unsecured revolving credit facility. |
| |
| (2) | Represents Radian Guaranty’s excess of Available Assets over its Minimum Required Assets, calculated in accordance with the PMIERs financial requirements in effect for each date shown. |
| |
| (3) | Percentages represent the values shown as a percentage of Minimum Required Assets under the applicable PMIERs financial requirements in effect for the dates shown. |
Part I. Item 2. Management’s Discussion and Analysis of Financial Condition and Results of Operations (continued)
In February 2020, Radian Guaranty entered into a fully collateralized reinsurance agreement with Eagle Re 2020-1 that reduced net RIF by a total of $488.4 million, reducing the PMIERs Minimum Required Assets by the same amount at inception.
See Note 7 of Notes to Radian Group has a due date of December 31, 2027. The Surplus Note may be redeemed at any time upon 30 days prior notice, subject to the approval ofUnaudited Condensed Consolidated Financial Statements for additional information on this new agreement.
In January 2020, the Pennsylvania Insurance Department.
In August 2016,Department approved the termination of the intercompany reinsurance agreement between Radian Guaranty and Radian Reinsurance, becameas well as a $465 million return of capital from Radian Reinsurance to Radian Group as an Extraordinary Distribution and the transfer of $200 million of cash and marketable securities from Radian Group to Radian Guaranty in exchange for a surplus note in the same amount. See Note 15 of Notes to Unaudited Condensed Consolidated Financial Statements for additional information on these intercompany actions.
Even though they hold assets in excess of the minimum statutory capital thresholds and PMIERs financial requirements, the ability of Radian’s mortgage insurance subsidiaries to pay dividends on their common stock is restricted by certain provisions of the insurance laws of Pennsylvania, their state of domicile. Under Pennsylvania’s insurance laws, ordinary dividends and other distributions may only be paid out of an insurer’s positive unassigned surplus, measured as of the end of the prior fiscal year, unless the Pennsylvania Insurance Department approves the payment of dividends or other distributions from another source. In light of Radian Guaranty’s negative unassigned surplus related to operating losses in prior periods, the ongoing need to set aside contingency reserves, and the current ongoing economic uncertainty related to the COVID-19 pandemic which is expected to increase losses in the second quarter of 2020 and in future periods, we do not anticipate that Radian Guaranty will be permitted under applicable insurance laws to pay ordinary dividends to Radian Group for the foreseeable future. See Note 18 of Notes to Consolidated Financial Statements in our 2019 Form 10-K for additional information on contingency reserve requirements.
Radian Guaranty and Radian Reinsurance are both members of the FHLB. As members, they may borrow from the FHLB, subject to certain conditions, which include the needrequirements to post collateral and the requirement to maintain a minimum investment in FHLB stock. Advances from the FHLB may be used to provide low-cost, supplemental liquidity for various purposes, including to fund incremental investments. Radian’s current strategy includes using FHLB advances as financing to purchase additional investment securities that have similar durations, for the purpose of generating additional earnings from our investment securities portfolio with minimal incremental risk. As of March 31, 2019,2020, there were $108.5$173.8 million of FHLB advances outstanding.
The principal sources of liquidity in our mortgage insurance business currently include insurance premiums, net investment income and cash flows from: (i) investment sales and maturities; (ii) FHLB advances; or (iii) capital contributions from Radian Group. We believe that the operating cash flows generated by each of our mortgage insurance subsidiaries will provide these subsidiaries with a substantial portion of the funds necessary to satisfy their claim payments, operating expenses and taxes for the foreseeable future.
Private mortgage insurers, including Radian Guaranty, are required to comply with the PMIERs to remain approved insurers of loans purchased by the GSEs. Radian Guaranty currently is an approved mortgage insurer under the PMIERs and is in compliance with the current PMIERs financial requirements. See “—Radian Group—Short-Term Liquidity Needs—Capital Support for Subsidiaries”and Note 111 of Notes to Unaudited Condensed Consolidated Financial Statements for additional information.
Securities Lending Agreements. Radian Guaranty and Radian Reinsurance from time to time enter into certain short-term securities lending agreements with third-party Borrowers for the purpose of increasing the yield on our investment securities portfolio with minimal incremental risk. We have the right to request the return of the loaned securities at any time.
We are indemnified against counterparty credit risk by the intermediary. For additional information on our securities lending agreements, see Note 5 of Notes to Unaudited Condensed Consolidated Financial Statements.
ServicesReal Estate
As of March 31, 2019,2020, our ServicesReal Estate segment maintained cash and liquid investments totaling $39.9 million, primarily held by Radian Title Insurance. The sale of Clayton, in January 2020, did not have a material impact on our liquidity.
Title insurance companies, including Radian Title Insurance, are subject to comprehensive state regulations, including minimum net worth requirements. Radian Title Insurance was in compliance with its respective regulatory minimum net worth requirements at March 31, 2020. In the event the cash equivalents totaling $8.9 million, which included restricted cashflow from operations of $1.9 million.
The principal demands for liquidity in our Servicesthe Real Estate segment include: (i)is not adequate to fund all of its needs, including the paymentregulatory capital needs of employee compensation and other direct operating expenses; (ii) reimbursements toRadian Title Insurance, Radian Group for its portion of allocated expense; and (iii) dividends to Radian Group, if any.
The principal sources of liquidity in our Services segment are cash generated by operations and,may provide additional funds to the extent necessary,Real Estate segment in the form of an intercompany note or other capital contributions from Radian Group.contribution, subject to the approval of the Ohio Department of Insurance, if needed. Additional capital support may also be required for potential investments in new business initiatives to support our strategy of growing our businesses.
Liquidity levels may fluctuate depending on the levels and contractual timing of our invoicing and the payment practices of the Servicesour Real Estate clients, in combination with the timing of Services’the Real Estate segment’s payments for employee compensation and to external vendors. The amount, if any, and timing of the ServicesReal Estate segment’s dividend paying capacity will depend primarily on the amount of excess cash flow generated by the segment.
The Services segment has not generated sufficient cash flows to pay dividends to Radian Group. Additionally, while cash flow has been sufficient to pay the Services segment’s direct operating expenses, it has not been sufficient to reimburse Radian Group for its accumulated allocated expenses, including interest expense associated with the Clayton Intercompany Note. Effective January 1, 2019, Radian Group recapitalized the Services segment with a capital contribution that enabled the Services segment to repay its accumulated allocated operating expense and interest expense, as well as to repay the Clayton Intercompany Note. While this action had no immediate net impact to Radian Group’s available liquidity, we expect that the
Part I. Item 2. Management’s Discussion and Analysis of Financial Condition and Results of Operations (continued)
Services segment will now be more likely to satisfy its reimbursement obligations in the future. In the event the cash flow from operations of the Services segment is not adequate to fund all of its needs, Radian Group may provide additional funds to the Services segment in the form of a capital contribution or an intercompany note.
Cash Flows
The following table summarizes our consolidated cash flows from operating, investing and financing activities:
|
| | | | | | | |
| (In thousands) | Three Months Ended
March 31, |
| 2019 | | 2018 |
| Net cash provided by (used in): | | | |
| Operating activities | $ | 217,778 |
| | $ | 118,447 |
|
| Investing activities | (185,343 | ) | | (119,740 | ) |
| Financing activities | (11,683 | ) | | 35,154 |
|
| Effect of exchange rate changes on cash and restricted cash | — |
| | (1 | ) |
| Increase (decrease) in cash and restricted cash | $ | 20,752 |
| | $ | 33,860 |
|
| | | | |
Operating Activities. Our most significant source of operating cash flows is generally from premiums received from our insurance policies, while our most significant uses of operating cash flows are generally for claims paid on our insured policies and our operating expenses. Net cash provided by operating activities totaled $217.8 million for the three months ended March 31, 2019, compared to $118.4 million for the same period in 2018. This increase in net cash provided by operating activities in the three months ended March 31, 2019, compared to the same period in 2018, was principally the result of: (i) an increase in cash received from the IRS, including the remaining $57.2 million refund which was previously on deposit with the IRS; and (ii) a reduction in claims paid in 2019.
Investing Activities. Net cash used in investing activities increased in the three months ended March 31, 2019, compared to the same period in 2018, primarily as a result of an increase in purchases of short-term investments partially offset by an increase in proceeds, net of purchases, from fixed-maturity investments available for sale.
Financing Activities. Net cash used in financing activities increased for the three months ended March 31, 2019, as compared to net cash provided in financing activities during the same period in 2018. For the three months ended March 31, 2019, our primary financing activities included an increase in purchases of our common shares.
See “Item 1. Financial Statements (Unaudited)—Condensed Consolidated Statements of Cash Flows (Unaudited)” for additional information.
Stockholders’ Equity
Stockholders’ equity increased by $221.4 million from December 31, 2018 to March 31, 2019. The net increase in stockholders’ equity resulted primarily from: (i) our net income of $171.0 million for the three months ended March 31, 2019 and (ii) net unrealized gains on investments of $78.4 million, partially offset by shares repurchased under our share repurchase program of $31.8 million, including commissions. See Note 14 of Notes to Unaudited Condensed Consolidated Financial Statements for additional information.
During the first three months of 2019, Radian’s holding company debt-to-capital ratio decreased to 21.7% at March 31, 2019 from 22.8% at December 31, 2018 and 25.2% at March 31, 2018.
Part I. Item 2. Management’s Discussion and Analysis of Financial Condition and Results of Operations (continued)
Ratings
Radian Group, Radian Guaranty and Radian Reinsurance have been assigned the ratings set forth in the chart below. We believe that ratings often are considered by others in assessing our credit strength and the financial strength of our primary mortgage insurance subsidiaries. The following ratings have been independently assigned by third-party statistical rating organizations, are for informational purposes only and are subject to change. For a discussion of how the COVID-19 pandemic has affected and may further affect our ratings, see “Item 1A. Risk Factors—The current financial strength ratings assigned to our mortgage insurance subsidiaries could weaken our competitive position and potential downgrades by rating agencies to these ratings and the ratings assigned to Radian Group could adversely affect the Company.”
|
| | | |
| | Moody’s (1) | | S&P (2) |
| Radian Group | Ba2Ba1 | | BB+ |
| Radian Guaranty | Baa2Baa1 | | BBB+ |
| Radian Reinsurance | N/A | | BBB+ |
______________________
| |
| (1) | Based on the October 1, 201817, 2019 update, Moody’s outlook for Radian Group and Radian Guaranty currently is Stable. |
| |
| (2) | Based on the October 11, 2018March 26, 2020 update, S&P’s outlook for Radian Group, Radian Guaranty and Radian Reinsurance is currently Stable.Negative. |
Critical Accounting Policies
As of the filing date of this report, there were no significant changes in our critical accounting policies from those discussed in our 20182019 Form 10-K, other than described below. See Note 1 of Notes to Unaudited Condensed Consolidated Financial Statements for accounting pronouncements issued but not yet adopted that may impact the Company’s consolidated financial position, earnings, cash flows or disclosures.
Leases
We determineadopted ASU 2016-13 on January 1, 2020 using the modified retrospective adoption approach. This ASU and the associated subsequent amendments require that financial assets measured at their amortized cost basis be presented at the net amount expected to be collected. Credit losses relating to our available-for-sale debt securities are recorded through an allowance for credit losses, rather than a write-down of the asset, with the amount of the allowance limited to the amount by which fair value is less than amortized cost. This allowance method will allow reversals of credit losses if an arrangement includes a lease at inception. A rightthe estimate of use assetcredit losses declines. This ASU affected certain of our accounts and lease liability is recognized for operating leasesnotes receivable, including premiums receivable, and is included incertain of our other assets, including reinsurance recoverables; however, the update did not have a material effect on our financial statements and other liabilities, respectively, in our condensed consolidated balance sheet at March 31, 2019. Right-of-use assets represent our right to use an underlying asset for the lease term and lease liabilities represent our obligation to make lease payments arising from the lease. Operating lease right-of-use assets and liabilities are recognized at the lease commencement date based on the present value of lease payments over the lease term. Right of use assets are recognized net of any payments made or received from the lessor. In determining the net present value of lease payments, we use our incremental borrowing rate based on the information available at the lease commencement date or as of our date of adoption, January 1, 2019.
Lease expense is recognized on a straight-line basis over the expected lease term. For lease agreements entered into after thedisclosures. The adoption of this update did not have a material effect on our financial statements and disclosures. See Note 5 of Notes to Unaudited Condensed Consolidated Financial Statements for additional information.
We adopted ASU 2019-04, Codification Improvements related to Financial Instruments—Credit Losses, Derivatives and Hedging, and Financial Instruments on January 1, 2020. This update to the accounting standard that include leasestandards regarding financial instruments and non-lease components, such components are generally not accounted for separately. For our building leases, as a result of us having elected to adoptderivatives and hedging clarifies the package of practical expedients permitted under the transition guidance, we accountaccounting treatment for the leasemeasurement of credit losses and non-lease components, such as common area maintenance charges, as a single lease component. We have elected the short-term exemption for contracts with lease termsprovides further clarification on previously issued updates. The adoption of 12 months or less. Prior period amounts continue to be reported in accordance with our historic accounting under previous lease guidance.
Our lease agreements primarily relate to operating leases for office space we use in our operations. Certain of our leases include renewal options and/or termination options that wethis update did not consider in the determination of the right-of-use asset or the lease liability as we did not consider it reasonably certain that we would exercise such options. Our lease agreements do not contain any variable lease payments, material residual value guarantees or material restrictive covenants. We do not have material sublease agreements. As of March 31, 2019, there were no leases which had not yet commenced but that create significant rightsan effect on our financial statements and obligations for us.disclosures.
Item 3. Quantitative and Qualitative Disclosures About Market Risk.
Market risk represents the potential for loss due to adverse changes in the value of financial instruments as a result of changes in market conditions. Examples of market risk include changes in interest rates, credit spreads, equity prices, and foreign currency exchange rates. The primary market risks in our investment portfolio are interest-rate risk and credit-spread risk, namely the fair value sensitivity of our fixed income securities to changes in interest rates and credit spreads, respectively.equity prices. We regularly analyze our exposure to interest-rate risk and credit-spread risk and have determined that the fair value of our investments is materially exposed to changes in both interest rates and credit spreads. See “Item 1A. Risk Factors—Our success depends, in part, on our ability to manage risks in our investment portfolio.”
Our market risk exposures at March 31, 20192020 have not materially changed from those identified in our 2018 2019Form 10-K.
Item 4. Controls and Procedures.
Evaluation of Disclosure Controls and Procedures
We maintain disclosure controls and procedures designed to provide reasonable assurance that information required to be disclosed in the reports we file or submit under the Exchange Act is recorded, processed, summarized and reported within the
time periods specified in the SEC’s rules and forms and that such information is accumulated and communicated to our management, including our Chief Executive Officer and Chief Financial Officer, as appropriate, to allow timely decisions regarding required disclosure.
Our management, including our Chief Executive Officer and Chief Financial Officer, conducted an evaluation of the effectiveness of our disclosure controls and procedures (as defined in Rules 13a-15(e) and 15d-15(e) of the Exchange Act) as of March 31, 2019,2020, pursuant to Rule 15d-15(b) under the Exchange Act. Based upon that evaluation, our Chief Executive Officer and Chief Financial Officer concluded that, as of March 31, 2019,2020, our disclosure controls and procedures were effective to provide reasonable assurance that the information required to be disclosed by us in the reports we file or submit under the Exchange Act is recorded, processed, summarized and reported within the time periods specified in the SEC’s rules and forms.
Changes in Internal Control Over Financial Reporting
During the three-month period ended March 31, 2019,2020, there has been no change in our internal control over financial reporting (as defined in Rule 13a-15(f) of the Exchange Act) that has materially affected, or is reasonably likely to materially affect, our internal control over financial reporting.
PART II—OTHER INFORMATION
Item 1. Legal Proceedings.
We are routinely involved in a number of legal actions and proceedings, including litigation and other disputes arising in the ordinary course of our business.
On December 22, 2016, Ocwen Loan Servicing, LLC and Homeward Residential, Inc. (collectively, “Ocwen”) filed a complaint in the U.S. District Court for the Eastern District of Pennsylvania against Radian Guaranty alleging breach of contract and bad faith claims and seeking monetary damages and declaratory relief. Ocwen has also initiated similar legal proceedings against several other mortgage insurers. On December 17, 2016, Ocwen separately filed a parallel arbitration petition against Radian Guaranty before the American Arbitration Association (“AAA”) asserting substantially the same allegations (the “Arbitration”). Ocwen’s filings together listed 9,420 mortgage insurance certificates issued under multiple insurance policies, including Pool Insurance policies, as subject to the dispute. On June 5, 2017, Ocwen filed an amended complaint and an amended petition (collectively, the “Amended Filings”) with both the court and the AAA, respectively, together listing 8,870 certificates as subject to the dispute. On April 11, 2018, the parties entered into a confidential agreement with respect to all certificates subject to the dispute. The confidential agreement resolved certain categories of claims involved in the dispute and, on April 12, 2018, the parties filed a stipulation of voluntary dismissal of the federal court proceeding and the trial judge issued an Orderorder dismissing all claims and counterclaims subject to the parties’ agreement. Radian Guaranty was not required to make any payment in connection with this confidential agreement. Pursuant to the confidential agreement, the parties: (1) dismissed the federal court proceeding; (2) narrowed the scope of the dispute to Ocwen’s breach of contract claims seeking payment of insurance benefits on approximately 2,500 certificates that Ocwen was previously pursuing through the Amended Filings; and (3) agreed to resolve the remaining dispute through the Arbitration. The Arbitration is proceeding and Radian Guaranty believes that Ocwen’s allegations and claims in the legal proceedings described above are without merit and legally deficient, and planscontinues to defend theseagainst Ocwen’s claims vigorously. We are not able to estimate a reasonably possible loss, if any, or range of loss in this matter because of the current stage of the Arbitration.
On August 31, 2018, Nationstar Mortgage LLC d/b/a Mr. Cooper (“Nationstar”) filed a complaint in the U.S. District Court for the Eastern District of Pennsylvania against Radian Guaranty (the “Complaint”) alleging breach of contract, bad faith, equitable indemnification, unjust enrichment, and conversion claims and seeking monetary damages and declaratory relief. TheExhibit 1 to the Complaint lists 3,014 mortgage insurance certificates issued under multiple insurance policies as subject to disputes involving insurance coverage decisions. Thedecisions (the “Coverage Disputed Loans”). Exhibit 2 to the Complaint further lists 2,231 mortgage insurance certificates issued under multiple insurance policies as subject to disputes involving premium refund requests. Radian Guaranty believes that Nationstar’s allegations and claims in the legal proceedings described above are without merit and legally deficient, and plans to defend these claims vigorously. In December 2018, Radian Guaranty filed a motion to dismiss the Complaint. In March 2019, the trial judge issued an Orderorder granting in part, and denying in part, our motion to dismiss, and dismissed Nationstar’s unjust enrichment and conversion claims. In May 2019, Radian Guaranty filed an answer, with affirmative defenses and counterclaims, in response to the Complaint. WeOn September 23, 2019, the trial judge entered as an order a joint stipulation submitted by Nationstar and Radian Guaranty that narrowed the scope of the dispute involving Coverage Disputed Loans to claims relating to 1,704 mortgage insurance certificates. Radian Guaranty believes that Nationstar’s allegations and claims in the legal proceedings described above are not ablewithout merit and legally deficient, and continues to defend against these claims vigorously.
In the three months ended March 31, 2020, there was no change in the Company’s previously established IBNR reserve estimate a reasonably possible loss, if any, or rangerelated to our best estimate of our probable loss in this matter becauseconnection with the above legal proceedings. While Radian believes it has substantial defenses in these matters and intends to continue to defend against these claims vigorously, it is not feasible to predict the ultimate outcome of these disputes, and the preliminary stageCompany could in the future be required to pay amounts as a result of the litigation.settlements or decisions in these matters, potentially in excess of accruals.
We also are periodically subject to reviews and audits, as well as inquiries, information-gathering requests and investigations. In connection with these matters, from time to time we receive requests and subpoenas seeking information and documents related to aspects of our business.
The legal and regulatory matters discussed above and in our 20182019 Form 10-K could result in adverse judgments, settlements, fines, injunctions, restitutions or other relief that could require significant expenditures or have other effects on our business. Management believes, based on current knowledge and after consultation with counsel, that the outcome of such actions will not have a material adverse effect on our consolidated financial condition. However, theThe outcome of litigation and other legal and regulatory matters and proceedings is inherently uncertain, and it is possible that one or more of the matters currently pending or threatened could have an unanticipated adverse effect on our liquidity, financial condition or results of operations for any particular period.
Item 1A. Risk Factors.
ThereExcept as provided below, there have been no material changes to our risk factors from those previously disclosed in our 2018 Form2019 From 10-K.
The COVID-19 pandemic has adversely impacted our business, and its ultimate impact on our business and financial results will depend on future developments, which are highly uncertain and cannot be predicted, including the scope and duration of the pandemic and actions taken by governmental authorities in response to the pandemic.
The COVID-19 pandemic has significantly impacted the global economy, disrupted global supply chains, lowered equity market valuations, created significant volatility and disruption in financial markets, disrupted the housing finance system and real estate markets and increased unemployment levels. In addition, the pandemic has resulted in temporary closures of many businesses and the institution of social distancing and sheltering in place requirements in most states and communities in the United States. As a result, the demand for certain of our products and services has been impacted, and this impact may continue for an unknown period and could expand in scope. Our business operations may also be disrupted if significant portions of our workforce are unable to work effectively, including because of illness, remote technology interruptions, quarantines, government actions, or other restrictions in connection with the pandemic. To date, we have suspended our share repurchase program, aligned our business with the temporary origination and servicing guidelines announced by the GSEs, and activated our business continuity program by transitioning to a work-from-home virtual workforce model with certain essential activities supported by limited staff in controlled office environments.
We expect that the COVID-19 pandemic and measures taken to reduce its spread will pervasively impact our business, subjecting us to the following risks:
| |
| • | We expect the pandemic to result in a material increase in new defaults as borrowers fail to make timely payments on their mortgages, including as a result of entering mortgage forbearance programs that allow borrowers to defer mortgage payments, which may impact Radian Guaranty’s ability to remain compliant with the PMIERs financial requirements. See“—The credit performance of our mortgage insurance portfolio is impacted by macroeconomic conditions and specific events that affect the ability of borrowers to pay their mortgages” and “—Radian Guaranty may fail to maintain its eligibility status with the GSEs.” |
| |
| • | The increase in new mortgage defaults resulting from the COVID-19 pandemic is expected to significantly decrease and could potentially exhaust Radian Guaranty’s excess of Available Assets over Minimum Required Assets under the PMIERs, in which case we may be required to contribute capital to Radian Guaranty. The amount that Radian Group could be required to contribute to Radian Guaranty to support PMIERs compliance is uncertain, but could be significant and, under extreme economic scenarios, exhaust Radian Group’s available liquidity. See “—Radian Group’s sources of liquidity may be insufficient to fund its obligations.” |
| |
| • | The pandemic is likely to place a significant strain on the operations and financial condition of mortgage servicers, which could disrupt the servicing of mortgage loans covered by our insurance policies or result in servicers failing to appropriately report the status of loans, including whether the loans are subject to a COVID-19-related forbearance program. We could receive less mortgage insurance premiums as a result of loans going into default. See “—Our business depends, in part, on effective and reliable loan servicing.” |
| |
| • | As a result of COVID-19-related relief programs, we anticipate that defaults related to the pandemic, if not cured, could remain in our defaulted loan inventory for a protracted period of time, potentially resulting in higher levels of Claim Severity for those loans that ultimately result in a claim. See “—An extension in the period of time that a loan remains in our defaulted loan inventory may increase the severity of claims that we ultimately are required to pay.” |
| |
| • | Our assumptions upon which our premium levels are based may ultimately prove to be inaccurate, especially in a period of high market volatility and economic uncertainty as currently exists due to the pandemic. We anticipate that the pandemic will result in a high volume of new defaults, both as a result of payment forbearance programs and otherwise, beginning in the second quarter of 2020. These anticipated new defaults are not currently reflected in our mortgage insurance loss reserves because we generally are not permitted to establish reserves in anticipation of such defaults. As a result, our loss reserves are expected to increase significantly in the second quarter of 2020, and potentially in future quarters as these new defaults are reported, which is expected to negatively impact our results of operations and financial condition. See “—Our success depends on our ability to assess and manage our underwriting risks; the premiums we charge may not be adequate to compensate us for |
our liability for losses and the amount of capital we are required to hold against our insured risks. We expect to incur future provisions for losses beyond what we have reserved for in our financial statements.”
| |
| • | The GSEs’ business practices have changed in response to the COVID-19 pandemic, with the primary objectives of supporting borrowers impacted by the pandemic and protecting the ongoing functioning of the housing finance system. As the situation continues to evolve, the actions of the FHFA and GSEs in response to COVID-19 are likely to continue to significantly impact the housing finance system. Because traditional mortgage insurance is an important component of this system, these actions have had, and may continue to have, an impact on our mortgage insurance operations and performance. See “—Changes in the charters, business practices, or role of the GSEs in the U.S. housing market generally, could significantly impact our businesses.” |
| |
| • | The number of home purchases or mortgage refinancings may be materially affected by the impacts of the pandemic on general economic conditions, including the unemployment rate, and on the availability of credit for mortgage loans. In addition, public and private sector initiatives to reduce the transmission of COVID-19, such as the imposition of restrictions on business activities, are likely to affect the number of new mortgages available for us to insure, including as real estate markets confront challenges in the mortgage origination and home sale process created by social distancing and stay-at-home orders. See“—A decrease in the volume of mortgage originations could result in fewer opportunities for us to write new mortgage insurance business and conduct our Real Estate business.” |
| |
| • | The models, assumptions and estimates we use to establish loss reserves may not be accurate, especially in the event of an extended economic downturn or a period of extreme market volatility and uncertainty such as we are currently experiencing due to the COVID-19 pandemic. For example, the ultimate cure rate for loan defaults resulting from the pandemic may be lower than we have previously experienced in the context of other FEMA declared emergencies and lower than our expectations. See “—If the estimates we use in establishing loss reserves are incorrect, we may be required to take unexpected charges to income, which could adversely affect our results of operations.” |
| |
| • | The rating agencies continually review the financial strength ratings assigned to Radian Group and its mortgage insurance subsidiaries, and the ratings are subject to change. The COVID-19 pandemic and its impact on our financial results and condition, could cause one or more of the rating agencies to downgrade the ratings assigned to Radian Group and its mortgage insurance subsidiaries. See “—The current financial strength ratings assigned to our mortgage insurance subsidiaries could weaken our competitive position and potential downgrades by rating agencies to these ratings and the ratings assigned to Radian Group could adversely affect the Company.” |
| |
| • | The markets for credit and interest-rate-sensitive securities have been adversely affected by the COVID-19 pandemic. The value of our fixed income securities has decreased, which has increased the risk that we will not achieve our investment objectives. If, as a result of the COVID-19 pandemic or otherwise, we underestimate our liabilities or improperly structure our investments to meet our expected liabilities, including claim payments in our mortgage insurance business, we could have unexpected losses resulting from the forced liquidation of investments before their maturity, which could adversely affect our results of operations. See“—Our success depends, in part, on our ability to manage risks in our investment portfolio.” |
Ultimately, the impact of COVID-19 on our businesses will depend on, among other things: the extent and duration of the pandemic, the severity of the disease and the number of people infected with the virus and whether an effective anti-viral treatment or vaccine is developed; the effects on the economy of the pandemic and of the measures taken by governmental authorities and other third parties restricting day-to-day life and the length of time that such measures remain in place; governmental programs implemented to assist new and existing borrowers, including programs and policies instituted by the GSEs to assist borrowers experiencing a COVID-19-related hardship such as forbearance plans and suspensions of foreclosure and evictions; and the impact on the mortgage origination market. Due to the unprecedented and rapidly changing social and economic impacts associated with the COVID-19 pandemic on the U.S. and global economies generally, and in particular on the U.S. housing, real estate and housing finance markets, there is significant uncertainty regarding the ultimate impact on our business, business prospects, operating results and financial condition and our estimates or predictions regarding such impact may be materially wrong.
Radian Guaranty may fail to maintain its eligibility status with the GSEs.
In order to be eligible to insure loans purchased by the GSEs, mortgage insurers such as Radian Guaranty must meet the GSEs’ eligibility requirements, or PMIERs. The PMIERs are comprehensive, covering virtually all aspects of the business of a private mortgage insurer, including internal risk management and quality controls, the relationship between the GSEs and the
approved insurer and the approved insurer’s financial condition, as well as extensive requirements related to the conduct and operations of a mortgage insurer’s business. If Radian Guaranty is unable to satisfy the requirements set forth in the PMIERs, the GSEs could restrict it from conducting certain types of business with them or take actions that may include not purchasing loans insured by Radian Guaranty.
The PMIERs financial requirements currently require that a mortgage insurer’s Available Assets meet or exceed its Minimum Required Assets. At March 31, 2020, Radian Guaranty was in compliance with the PMIERs financial requirements and had Available Assets of $4.1 billion, which resulted in an excess or “cushion” of $1.1 billion over its Minimum Required Assets of $2.9 billion. Radian Guaranty’s ability to continue to comply with the PMIERs financial requirements could be impacted by, among other factors: (i) the product mix of our NIW and factors affecting the performance of our mortgage insurance portfolio, including our level of new defaults, prepayments, the losses we incur on new or existing defaults and the credit characteristics of our mortgage insurance; (ii) the amount of credit that we receive under the PMIERs financial requirements for our third-party reinsurance transactions (which is subject to initial and ongoing review by the GSEs); and (iii) potential amendments or updates to the PMIERs.
As a result of the pandemic and its impact on the economy, including the significant increase in unemployment levels, we expect a material increase in new defaults as borrowers fail to make timely payments on their mortgages, including as a result of entering mortgage forbearance programs that allow borrowers to defer mortgage payments. Under the CARES Act, upon request by borrowers of federally backed mortgage loans who attest to financial hardship related to the pandemic, mortgage servicers are required to provide these borrowers with up to 180 days forbearance on their mortgage payments, which may be extended for an additional 180 days upon request, without requiring validation by the borrowers of their hardship. The GSEs have amended their forbearance programs to align with the CARES Act, and we understand that a significant number of borrowers are participating in such programs. We expect the number of GSE mortgage forbearances to continue to increase as servicers implement the forbearance programs mandated by the CARES Act and for borrowers with loans covered by private mortgage insurance to represent a higher percentage of these forbearance programs given the riskier credit profile of these loans. In light of the current economic uncertainty, we believe it also is possible that many borrowers may seek to take advantage of forbearance programs notwithstanding their ability to continue to make mortgage payments on a timely basis.
Our Master Policies generally provide that a default occurs when a borrower misses one monthly payment, regardless of why the payment was missed, including if the payment was deferred under a forbearance program. Once two missed payments have occurred, the PMIERs characterize a loan as “non-performing” and require us to establish an increased capital charge for that loan regardless of the reason for the missed payments. However, the PMIERs do account for the fact that loans that have become non-performing as a result of a “FEMA Declared Major Disaster” event, including as a result of participation in a forbearance program, have a higher likelihood of curing following the conclusion of the event. As a result, the PMIERs apply a 0.30 multiplier to the capital charges that otherwise would be applied to these non-performing loans, effectively reducing the capital charges applied to these loans by 70 percent. Under the PMIERs, the Disaster Related Capital Charge applies to non-performing loans on properties in a FEMA Declared Major Disaster Area that either: (1) are subject to a forbearance plan executed in response to a FEMA Declared Major Disaster Area eligible for “Individual Assistance” (a range of assistance programs administered by FEMA); or (2) have an initial default date occurring up to either 30 days prior to or 90 days following the FEMA Declared Major Disaster event. To date, all states and the District of Columbia have been designated FEMA Declared Major Disaster Areas as a result of the COVID-19 pandemic, with 41 states that represent 89% of Radian Guaranty’s RIF having been approved by FEMA for Individual Assistance. Under the PMIERs, the Disaster Related Capital Charge applies for up to 120 days from the initial default date of the non-performing loan, or if greater, the period of time that the loan is subject to a forbearance plan executed in response to a FEMA Declared Major Disaster Area eligible for Individual Assistance.
In light of the current nationwide application of the Disaster Related Capital Charge, we currently are applying this charge to all loans with an initial default date (determined as of the date that a loan is deemed non-performing under PMIERs) occurring on or after February 15, 2020. We plan to continue to apply the Disaster Related Capital Charge to all non-performing loans through the date that is 90 days following the declared end date of the disaster event in any FEMA Declared Major Disaster Area. The disaster event is currently deemed to be “continuing” in all 50 states and the District of Columbia. We do not believe that the Disaster Related Capital Charge provision in the PMIERs was drafted in contemplation of a nationwide disaster event such as the COVID-19 pandemic. As a result, the GSEs could apply this provision differently than we have, which could impact Radian Guaranty’s Minimum Required Assets and PMIERs “cushion.” Further, we understand that the GSEs are considering an amendment to the PMIERs related to the pandemic. We believe the GSEs intend for this amendment to preserve the nationwide applicability of the Disaster Related Capital Charge, including the 0.30 multiplier applied to capital charges on non-performing loans. We understand the GSEs also may extend the Disaster Related Capital Charge to all loans in pandemic-
related forbearance programs by eliminating the distinction between programs executed in response to a FEMA Declared Major Disaster Area eligible for Individual Assistance compared to those areas eligible for other forms of assistance. However, the likelihood, timing and terms of the amendment remain uncertain, and it is possible that any amendment, if adopted, will include additional restrictions on our mortgage insurance business, operations and capital position.
We expect that our current, broad-based application of the Disaster Related Capital Charge will significantly reduce the total amount of capital that Radian Guaranty otherwise would be required to hold against pandemic-related defaults. Nonetheless, we expect the overall volume of new defaults resulting from the pandemic, even after giving effect to the Disaster Related Capital Charge, will result in a significant increase in Radian Guaranty’s Minimum Required Assets and a material decrease in Radian Guaranty’s PMIERs cushion, beginning with the second quarter of 2020. This increase in defaults is expected to negatively impact our results of operations in the second quarter of 2020 and in future quarters, primarily due to the need to increase our reserve for losses related to the volume of new defaults. Further, under the PMIERs, increased capital charges are applied against defaulted loans based on the amount of time the loans remain in default, with increases taking place upon four, six and twelve missed monthly payments. As a result, the total amount of capital we may be required to hold against defaulted loans will increase over time, including for loans that remain in forbearance programs.
The magnitude of the increase in Radian Guaranty’s Minimum Required Assets generally will depend on the number, timing and duration of defaults related to the pandemic, including those resulting from a forbearance program, which in turn will depend on the scope, severity and duration of the pandemic, its resulting impact on the economy, including unemployment levels and housing prices, and the ability of government programs to provide economic and individual relief. Based on our current projections for our financial position as of June 30, 2020, which are subject to risks and uncertainties, we expect Radian Guaranty’s projected PMIERs cushion as of June 30, 2020 to be able to absorb a default rate of approximately 15% of our estimated total mortgage insurance portfolio as of that date. If defaults approach or exceed this level, we may be required or otherwise choose to contribute capital to Radian Guaranty, seek additional capital relief through reinsurance or otherwise, which may not be available on acceptable terms or on terms that would be approved by the GSEs, or alter our strategy with respect to our NIW. Further, Radian Guaranty’s Minimum Required Assets may increase and its PMIERs cushion could be negatively impacted if: (1) the GSEs require, through an amendment or interpretation, a less favorable application of the Disaster Related Capital Charge than we currently expect; or (2) the application of the Disaster Related Capital Charge is not extended to all loans in pandemic-related forbearance programs by eliminating the distinction between programs executed in response to a FEMA Declared Major Disaster Area eligible for Individual Assistance compared to those areas eligible for other forms of assistance.
Under the PMIERs financial requirements, in addition to non-performing loans, there are increased financial requirements for performing loans with a higher likelihood of default and/or certain credit characteristics, such as higher LTVs and lower FICO scores, as well as for loans originated after January 1, 2016 that are insured under lender-paid mortgage insurance policies not subject to automatic termination under the Homeowners Protection Act. Therefore, if our mix of business includes more loans that are subject to these increased financial requirements, it increases our Minimum Required Assets. Depending on the circumstances, we may limit the type and volume of business we are willing to write for certain of our products based on the increased financial requirements associated with certain loans. This could reduce the amount of NIW we write, which could reduce our future revenues.
The GSEs may amend the PMIERs at any time and also have broad discretion to interpret the PMIERs, which could impact the calculation of Radian Guaranty’s Available Assets and/or Minimum Required Assets. The most recent revisions to PMIERs, or PMIERs 2.0, became effective on March 31, 2019. In addition to the potential amendment related to the pandemic, we expect the GSEs to continue to update the PMIERs periodically in the future, including if and when there are changes to the GSEs’ capital requirements, such as if and when the CCF is finalized.
Compliance with the PMIERs financial requirements could impact our holding company liquidity. If additional capital is required to support Radian Guaranty’s compliance with the PMIERs financial requirements, it may make it more difficult for Radian Guaranty to return capital to Radian Group in the form of dividends or otherwise, and depending on the circumstances, could require Radian Group to make capital contributions to Radian Guaranty, which would leave less liquidity to satisfy Radian Group’s other obligations. Depending on the amount of liquidity that is utilized from Radian Group, we may be required (or may decide) to seek additional capital by incurring additional debt, issuing additional equity, or selling assets, which we may not be able to do on favorable terms, if at all.
In addition to the PMIERs financial requirements, the PMIERs contain requirements related to the operations of our mortgage insurance business, including extensive operational requirements in areas such as claim processing, loss mitigation, document retention, underwriting, quality control, reporting and monitoring, among others. These increased operational
requirements have resulted in additional expenses and have required substantial time and effort from management and our employees, which we expect will continue. Further, as discussed above, the GSEs could amend the PMIERS to address the pandemic in ways that change our operations and/or restrict the rights available under our Master Policies.
The PMIERs prohibit Radian Guaranty from engaging in certain activities such as insuring loans originated or serviced by an affiliate (except under certain circumstances) and require Radian Guaranty to obtain the prior consent of the GSEs before taking many actions, which may include entering into various intercompany agreements, settling loss mitigation disputes with customers and commuting risk, among others. These restrictions could prohibit or delay Radian Guaranty from taking certain actions that would be advantageous to it or its affiliates.
Although we expect Radian Guaranty to retain its eligibility status with the GSEs and to continue to comply with the PMIERs financial requirements, including as potentially updated in the future, we cannot provide assurance that this will occur. Loss of Radian Guaranty’s eligibility status with the GSEs would have an immediate and material adverse impact on the franchise value of our mortgage insurance business and our future prospects, as well as a material negative impact on our future results of operations and financial condition.
Our business depends, in part, on effective and reliable loan servicing.
We depend on third-party servicing of the loans that we insure. Dependable servicing is necessary for timely billing and premium payments to us and effective loss mitigation opportunities for delinquent or near-delinquent loans. Servicers are required to comply with a multitude of legal and regulatory requirements, procedures and standards for servicing residential mortgages such as the CFPB’s mortgage servicing rules. While these requirements are intended to ensure a high level of servicing performance, they also impose a high cost of compliance on servicers that may impact their financial condition and their operating effectiveness. The COVID-19 pandemic has created significant financial and operational challenges for many servicers. Challenging economic and market conditions or periods of economic stress and high mortgage defaults such as currently exist make it more difficult for servicers to effectively service the loans that we insure. Further, the various servicing-related requirements imposed by the CARES Act, the GSEs, the FHA and other federal and state governmental and regulatory bodies and agencies to address the impact of the COVID-19 pandemic on mortgage borrowers heighten the operational challenges confronting servicers in the current environment. This strain may be further heightened by the short timeframe over which these events have occurred, which has resulted in a high volume of COVID-19 related servicing demands, such as administering forbearance requests for borrowers, generally occurring and moving forward on similar timeframes, further stressing servicer performance as these matters develop and progress through various stages.
In the event a borrower fails to make mortgage payments, including as the result of a forbearance program, servicers often are required to advance such amounts, including principal and interest on the mortgage and amounts to cover taxes and insurance, for a period of time, including with respect to loans purchased by the GSEs. These required “advances” have increased the financial strain on servicers, which is expected to continue and could result in their financial insolvency or otherwise disrupt their operations. If we experience a disruption in the servicing of mortgage loans covered by our insurance policies or a failure by servicers to appropriately report the status of a loan, including whether the loan is subject to a COVID-19 related forbearance program, this, in turn, could impact the amount of capital Radian Guaranty is required to hold under the PMIERs or ultimately contribute to a rise in claims among those loans, which could have a material adverse effect on our business, financial condition and operating results.
Under the terms of our 2014 Master Policy and 2020 Master Policy, mortgage insurance premiums are not required to be paid following an event of default. However, if a defaulted loan then cures, all mortgage insurance premiums must be brought current for our insurance coverage to continue, including all premiums that were not paid during the period following the event of default and through the date of cure. Because premiums must be brought current upon a cure, mortgage servicers typically continue to pay mortgage insurance premiums while loans remain in default, understanding that Radian Guaranty will refund these premiums if the loans fail to cure and ultimately go to claim. If we fail to receive mortgage insurance premiums following mortgage defaults, including the high volume of defaults that are anticipated to result from the COVID-19 pandemic, Radian Guaranty’s cash flow could be reduced, potentially requiring Radian Guaranty to liquidate investments at a loss to pay future claims or otherwise require us to alter our investment strategy.
Radian Group’s sources of liquidity may be insufficient to fund its obligations.
Radian Group serves as the holding company for our operating subsidiaries and does not have any operations of its own. As of March 31, 2020, Radian Group had available, either directly or through unregulated subsidiaries, unrestricted cash and liquid investments of $648.2 million. This amount excludes certain additional cash and liquid investments that have been advanced to Radian Group from our subsidiaries for corporate expenses and interest payments. Total liquidity, which includes
our undrawn $267.5 million unsecured revolving credit facility which has been extended until January 18, 2022, was $915.7 million as of March 31, 2020.
We expect Radian Group’s principal liquidity demands for the next 12 months to be: (i) the payment of corporate expenses, including taxes; (ii) interest payments on our outstanding debt obligations; and (iii) subject to approval by our board of directors and our ongoing assessment of our financial condition and potential capital demands in our mortgage insurance business, the payment of quarterly dividends on our common stock, which we recently increased to $0.125 per share.
In addition to our ongoing short-term liquidity needs discussed above, our most significant need for liquidity beyond the next 12 months is the repayment of $900 million aggregate principal amount of our senior debt due in future years. Radian Group’s liquidity demands for the next 12 months or in future periods could also include: (i) early repurchases or redemptions of portions of our debt obligations; (ii) the repurchase of shares of our common stock pursuant to the share repurchase authorization, for which $198.9 million in authorization remains outstanding; (iii) potential additional investments to support our business strategy; and (iv) potential additional capital contributions to our subsidiaries, including due to the impact that the COVID-19 pandemic could have on the liquidity, results of operations and financial condition of Radian Group and our subsidiaries.
As a result of the COVID-19 pandemic and its impact on the economy, including the significant increase in unemployment, we expect a material increase in new defaults as borrowers fail to make timely payments on their mortgages, including as a result of entering mortgage forbearance programs that allow borrowers to defer mortgage payments. The number and duration of new defaults and, in turn, the number of defaults that ultimately result in claims will depend, among other factors, on the scope, severity and duration of the pandemic, the resulting impact on the economy, including unemployment and housing prices, and the impact of government programs to provide economic and individual relief. Based on our current projections for our financial position as of June 30, 2020, which are subject to risks and uncertainties, we expect Radian Guaranty’s projected PMIERs cushion as of June 30, 2020 to be able to absorb a default rate of approximately 15% of our estimated total mortgage insurance portfolio as of that date. If defaults exceed this level, we may be required to contribute capital to Radian Guaranty.
If such additional capital support for Radian Guaranty is required, in light of the amount of surplus notes currently outstanding between Radian Group and Radian Guaranty, we do not expect that Radian Guaranty would receive PMIERs credit for additional amounts contributed through surplus notes. As a result, any further amounts contributed to Radian Guaranty likely would be made in the form of capital contributions. The amount that Radian Group could be required to contribute to Radian Guaranty to support PMIERs compliance is uncertain, but could be significant and, under extreme economic scenarios, exhaust Radian Group’s available liquidity. Based on our current projections for our financial position as of June 30, 2020, which are subject to risks and uncertainties, we expect that our projected total available resources (which includes Radian Guaranty’s projected PMIERs cushion, Radian Group’s projected total liquidity, and amounts available under our unsecured credit facility) would be able to absorb a default rate of approximately 25% of our estimated mortgage insurance portfolio as of that date.
In addition to available cash and marketable securities, Radian Group’s principal sources of cash to fund future liquidity needs include: (i) payments made to Radian Group by its subsidiaries under expense- and tax-sharing arrangements; (ii) net investment income earned on its cash and marketable securities; (iii) to the extent available, dividends or other distributions from our subsidiaries; and (iv) amounts that Radian Guaranty is able to repay under the Surplus Notes. Radian Group also has in place a $267.5 million unsecured revolving credit facility with a syndicate of bank lenders. At March 31, 2020, the full $267.5 million remains undrawn and available under the facility. Radian Group’s expense-sharing arrangements with its principal operating subsidiaries require those subsidiaries to pay their allocated share of certain holding-company-level expenses, including interest payments on Radian Group’s outstanding senior notes. The expense-sharing arrangements between Radian Group and our mortgage insurance subsidiaries, as amended, have been approved by the Pennsylvania Insurance Department, but such approval may be modified or revoked at any time.
In light of Radian Guaranty’s negative unassigned surplus related to operating losses in prior periods, the ongoing need to set aside contingency reserves, and the current ongoing economic uncertainty related to the COVID-19 pandemic which is expected to increase losses in the second quarter of 2020 and in future periods, we do not anticipate that Radian Guaranty will be permitted under applicable insurance laws to pay ordinary dividends to Radian Group for the foreseeable future. See Note 18 of Notes to Consolidated Financial Statements in our 2019 Form 10-K for additional information on contingency reserve requirements.
In light of Radian Group’s short- and long-term needs, it is possible that our sources of liquidity could be insufficient to fund our obligations and could exceed available holding company funds. If this were to occur, we may need or otherwise may decide to increase our available liquidity, which we may be unable to do on favorable terms, if at all.
An extension in the period of time that a loan remains in our defaulted loan inventory may increase the severity of claims that we ultimately are required to pay.
High levels of defaults and corresponding delays in foreclosures could delay our receipt of claims, resulting in an increase in the period of time that a loan remains in our defaulted loan inventory, and as a result, the Claim Severity. Following the financial crisis, the average time that it took for us to receive a claim increased. This was, in part, due to loss mitigation protocols that were established by servicers and also to a significant backlog of foreclosure proceedings in many states, and especially in those states that impose a judicial process for foreclosures. Generally, foreclosure delays do not stop the accrual of interest or affect other expenses on a loan, and unless a loan is cured during such delay, once title to the property ultimately is obtained and a claim is filed, our paid claim amount may include additional interest and expenses, increasing the Claim Severity.
In response to the COVID-19 pandemic, numerous federal and state governmental and regulatory agencies have instituted borrower relief programs, including payment and foreclosure forbearance, with the objective of supporting borrowers through the economic turmoil resulting from the pandemic and allowing borrowers to remain in their homes. In addition to the mortgage payment forbearance relief discussed above in “—Radian Guaranty may fail to maintain its eligibility status with the GSEs,” the CARES Act also instituted a 60-day foreclosure moratorium on GSE loans. As a result of COVID-19-related relief programs, we anticipate that defaults related to the pandemic, if not cured, could remain in our default loan inventory for a protracted period of time, resulting in higher levels of Claim Severity for those loans that ultimately result in a claim. Higher levels of Claim Severity would increase our incurred losses and could negatively impact our results of operations and financial condition.
Our success depends on our ability to assess and manage our underwriting risks; the premiums we charge may not be adequate to compensate us for our liability for losses and the amount of capital we are required to hold against our insured risks. We expect to incur future provisions for losses beyond what we have reserved for in our financial statements.
The estimates and expectations we use to establish premium rates are based on assumptions made at the time our insurance is written.Our mortgage insurance premiums are based on, among other items, the amount of capital we are required to hold against our insured risks and our estimates of the long-term risk of claims on insured loans. Our premium rates are established based on performance models that consider a broad range of borrower, loan and property characteristics, as well as capital requirements and market and economic conditions. Our assumptions may ultimately prove to be inaccurate, especially in a period of high market volatility and economic uncertainty as currently exists due to the pandemic. The risk of inaccurate or unreliable data may have an adverse impact on our ability to effectively perform critical business operations, such as servicing, loss management, external reporting or data-driven internal analysis.
If the risk underlying a mortgage loan we have insured develops more adversely than we anticipated, we generally cannot increase the premium rates on this in-force business, or cancel coverage or elect not to renew coverage, to mitigate the effects of such adverse developments. Similarly, we cannot adjust our premiums if the amount of capital we are required to hold against our insured risks increases from the amount we were required to hold at the time a policy was written. As a result, if we are unable to compensate for or offset the increased capital requirements in other ways, the returns on our business may be lower than we assumed or expected. Our premiums earned and the associated investment income on those premiums may ultimately prove to be inadequate to compensate for the losses that we may incur and may not provide an adequate return on increased capital that may be required. As a result, our results of operations and financial condition could be negatively impacted.
Additionally, in accordance with industry practice, we do not establish reserves in our mortgage insurance business until we are notified that a borrower has failed to make at least two monthly payments when due. Because our mortgage insurance reserving does not account for the impact of future losses that we expect to incur with respect to performing (non-defaulted) loans, our obligation for ultimate losses that we expect to incur at any period end is not reflected in our financial statements, except to the extent that a premium deficiency exists. As discussed above in “—Radian Guaranty may fail to maintain its eligibility status with the GSEs,” we anticipate that the pandemic will result in a high volume of new defaults, both as a result of payment forbearance programs and otherwise, beginning in the second quarter of 2020. These anticipated new defaults are not currently reflected in our mortgage insurance loss reserves given that we generally are not permitted to establish reserves in anticipation of such defaults. As a result, our loss reserves are expected to increase significantly in the second quarter of 2020,
and potentially in future quarters, as these new defaults are reported, which is expected to negatively impact our results of operations and financial condition.
The credit performance of our mortgage insurance portfolio is impacted by macroeconomic conditions and specific events that affect the ability of borrowers to pay their mortgages.
As a seller of mortgage credit protection, our results are subject to macroeconomic conditions and specific events that impact the housing finance and real estate markets, including events that impact mortgage originations and the credit performance of our mortgage insurance portfolio. Many of these conditions are beyond our control, including housing prices, unemployment levels, interest rate changes, the availability of credit and other factors that may be derived from national and regional economic conditions. The COVID-19 pandemic has significantly impacted the global economy, disrupted global supply chains, lowered equity market valuations, created significant volatility and disruption in financial markets, and resulted in material increases in unemployment levels. In general, a deterioration in economic conditions such as we are currently experiencing increases the likelihood that borrowers will be unable to satisfy their mortgage obligations. A deteriorating economy can adversely affect housing values, which in turn can influence the willingness of borrowers to continue to make mortgage payments despite having the financial resources to do so.
Mortgage defaults can occur due to a variety of specific events affecting borrowers, including death or illness, divorce or other family problems, unemployment, or other events. In addition, factors impacting regional economic conditions, acts of terrorism, war or other severe conflicts, event-specific economic depressions or other catastrophic events such as natural disasters and the COVID-19 pandemic could result in increased defaults due to the impact of such events on the ability of borrowers to satisfy their mortgage obligations and the value of affected homes. Further, as discussed above under “—Radian Guaranty may fail to maintain its eligibility status with the GSEs,” payment forbearance programs available as a result of COVID-19 are expected to result in an increase in new defaults. Due to these factors, among others, we expect the COVID-19 pandemic to have a negative impact on the credit performance of our mortgage insurance portfolio, including increases in defaults and losses, beginning in the second quarter of 2020 and in future periods. The pandemic’s effect on the number of new defaults and level of losses will depend, among other factors, on the pandemic’s scope, severity and length, its resulting impact on the economy including unemployment levels and housing prices, and the ability of government programs to provide economic and individual relief.
Unfavorable macroeconomic developments, including the current ongoing economic uncertainty related to the COVID-19 pandemic and the other factors cited above, are expected to have a material negative impact on our results of operations and could have a material negative impact on our financial condition.
Changes in the charters, business practices, or role of the GSEs in the U.S. housing market generally, could significantly impact our businesses.
Our current business model is highly dependent on the GSEs as the GSEs are the primary beneficiaries of most of our mortgage insurance policies. The GSEs’ federal charters generally require credit enhancement for low down payment mortgage loans (i.e., a loan amount that exceeds 80% of a home’s value) in order for such loans to be eligible for purchase by them.
Lenders generally have used private mortgage insurance to satisfy this credit enhancement requirement. As a result, low down payment mortgages purchased by the GSEs generally are insured with private mortgage insurance. In order to be eligible to insure loans purchased by the GSEs, mortgage insurers such as Radian Guaranty must meet the GSEs’ eligibility requirements, or PMIERs.
The GSEs’ business practices may be impacted by their results of operations, by administrative policy decisions such as supporting the housing finance system during times of stress as is currently occurring as a result of the COVID-19 pandemic, as well as by legislative or regulatory changes, including the CARES Act. Since September 2008, the GSEs have been operating under the conservatorship of the FHFA. With respect to loans purchased by the GSEs, changes in the business practices of the GSEs, which can be implemented by the GSEs acting independently or through their conservator, the FHFA, could negatively impact our businesses and financial performance, including changes to:
eligibility requirements for a mortgage insurer to become and remain an approved eligible insurer for the GSEs;
underwriting standards on mortgages they purchase, including as a result of the FHFA’s more recent focus on reducing the GSEs’ risk profile with respect to loans with multiple higher risk characteristics;
policies or requirements that may result in a reduction in the number of mortgages they acquire;
the national conforming loan limit for mortgages they acquire;
the level of mortgage insurance required, including expanding the loans that are eligible for reduced insurance coverage;
the terms on which mortgage insurance coverage may be canceled before reaching the cancellation thresholds established by law;
the terms required to be included in master policies for the mortgage insurance policies they acquire, including limitations on our ability to mitigate losses on insured mortgages that are in default;
the amount of loan level price adjustments (based on risk) or guarantee fees (which may result in a higher cost to borrowers) that the GSEs charge on loans that require mortgage insurance; and
the degree of influence that the GSEs have over a mortgage lender’s selection of the mortgage insurer providing coverage.
In addition, as discussed above under “—Radian Guaranty may fail to maintain its eligibility status with the GSEs,” the GSEs’ business practices have changed in response to the COVID-19 pandemic, with the primary objectives of supporting borrowers impacted by the pandemic and protecting the ongoing functioning of the housing finance system. For example, in response to the pandemic, the FHFA and the GSEs have suspended all foreclosures and evictions for at least 60 days; instituted mortgage forbearance for up to 12 months; temporarily streamlined the appraisal, employment verification, and loan closing processes to address frictions in the mortgage origination process created by social distancing and stay-at-home orders; agreed to purchase loans in forbearance subject to significantly increased loan level price adjustments; announced a four-month limit on servicer advance obligations for loans in forbearance; and provided that loans in COVID-19 forbearance will remain in MBS pools for at least the duration of the forbearance. The significant impact of the COVID-19 pandemic on housing markets and the housing finance system is wide-ranging and unprecedented in scope. As the situation continues to evolve, the actions or potential inactions of the FHFA and GSEs in response to COVID-19 are likely to continue to have significant impact on the overall functioning of the housing finance system. Because traditional mortgage insurance is an important component of this system and because our Real Estate businesses depend on the health of the housing finance system and housing markets in particular, these actions have impacted, and may continue to impact our business operations and performance.
The FHFA has called for the GSEs to transfer a meaningful portion of credit risk, known as a “credit risk transfer,” to the private sector. This mandate builds upon the goals set in each of the last four years for the GSEs to increase the role of private capital by experimenting with different forms of transactions and structures. We continue to participate in these credit risk transfer programs developed by the GSEs. Additional information about these programs may be found in “Item 1. Business—Regulation—Federal Regulation—Housing Finance Reform” and “Item 1. Business—Mortgage Insurance—Mortgage Insurance Business Overview—Mortgage Insurance Products—Other Mortgage Insurance Products—GSE Credit Risk Transfer” in our 2019 Form 10-K.
It is difficult to predict what other types of credit risk transfer transactions and structures may be used in the future. If any of the credit risk transfer transactions and structures were to displace primary loan level or standard levels of mortgage insurance, the amount of insurance we write may be reduced, which could negatively impact our franchise value, results of operations and financial condition. As a result, the impact of any credit risk transfer products and transactions or other structures implemented by the GSEs is uncertain and hard to predict. For example, in 2018 Freddie Mac and Fannie Mae announced the launch of pilot programs, IMAGIN and EPMI, respectively, as alternative ways for lenders to obtain credit enhancement and sell loans with LTVs greater than 80% to the GSEs. These investor-paid mortgage insurance programs, in which insurance is acquired directly by each GSE, have many of the same features as private mortgage insurance and represent an alternative to traditional private mortgage insurance products that are provided to individual lenders. Participants in IMAGIN and EPMI are not subject to compliance with the PMIERs which may create a competitive disadvantage for private mortgage insurers if these pilot programs are expanded. See “Item 1. Business—Regulation—Federal Regulation—Housing Finance Reform How the private mortgage insurance industry performs though the COVID-19 pandemic, including the resiliency of the industry’s capital position under the PMIERs, could impact the perception of the industry and traditional mortgage insurance execution as the predominant form of first-loss credit protection, which could influence future debates regarding alternative forms of mortgage insurance execution.
Since the FHFA was appointed as conservator of the GSEs, there has been a wide range of legislative proposals to reform the U.S. housing finance market, including proposals for GSE reform ranging from nearly complete privatization and elimination of the role of the GSEs to a system that combines a federal role with private capital. In September 2019, the U.S. Department of the Treasury and the U.S. Department of Housing and Urban Development (“HUD”) released the Treasury Plan and the HUD Plan to reform the housing finance market, and with respect to the Treasury Plan, to release the GSEs from conservatorship after certain conditions were met. Leadership at the FHFA and HUD have stated that they plan to use the Plans
to guide the direction and activities of the GSEs and FHA. With the Plans serving as a roadmap, we expect HUD and FHFA will continue to take actions to shape the role of the FHA and GSEs in the housing finance market and to prepare the GSEs to exit conservatorship. In particular, the FHFA has stated a desire to reduce the GSEs’ exposure to loans with multiple higher risk characteristics in light of the fact that the GSEs currently maintain limited capital positions to support such risk. Following the onset of the COVID-19 pandemic, FHFA leadership has indicated that it remains committed to its path of recapitalizing the GSEs and releasing them from conservatorship. However, with the recent contraction of secondary market execution outside of government supported execution such as the GSEs and FHA and the FHFA’s commitment to continuing to support the housing financial system through the COVID-19 pandemic, the near-term priorities of the FHFA and GSEs remain uncertain and it is unclear if and to what extent the FHFA will continue to advance its reform objectives. As a result, it is difficult to predict when, whether or how the Treasury Plan and HUD Plan may be implemented and what impact actions taken in furtherance of these plans could have on our business, financial condition and results of operations. See “Item 1. Business—Regulation—Federal Regulation—Housing Finance Reform” in our 2019 Form 10-K.
The future structure of the residential housing finance system remains uncertain, including whether comprehensive housing reform legislation will be adopted and, if so, what form it may ultimately take. It is difficult to predict the impact of any changes on our business. See “Item 1. Business—Regulation—Federal Regulation—Housing Finance Reform” in our 2019 Form 10-K. Although we believe that traditional private mortgage insurance will continue to play an important role in any future housing finance structure, developments in the practices of the GSEs, including potentially new federal legislation that reduces the level of private mortgage insurance coverage used by the GSEs as credit enhancement, or even eliminates the requirement, may diminish the franchise value of our mortgage insurance business and materially and adversely affect our business prospects, results of operations and financial condition.
A decrease in the volume of mortgage originations could result in fewer opportunities for us to write new mortgage insurance business and conduct our Real Estate business.
The amount of new mortgage insurance business we write and real estate transactions we support depends, among other things, on a steady flow of low down payment mortgages that benefit from our mortgage insurance and the volume of real estate transactions that require our services. The volume of mortgage originations is impacted by a number of factors, including:
restrictions on mortgage credit due to changes in lender underwriting standards, capital requirements affecting lenders, regulatory requirements such as the QM designation for mortgage loans, and the health of the private securitization market;
mortgage interest rates;
the health of the domestic economy generally, as well as specific conditions in regional and local economies;
housing affordability;
tax laws and policies and their impact on, among other things, deductions for mortgage insurance premiums, mortgage interest payments and real estate taxes;
demographic trends, including the rate of household formation;
the rate of home price appreciation;
government housing policy encouraging loans to first-time homebuyers; and
the practices of the GSEs, including the extent to which the guaranty fees, loan level price adjustments (based on risk), credit underwriting guidelines and other business terms provided by the GSEs affect the cost of mortgages and lenders’ willingness to extend credit for low down payment mortgages.
While we believe that the long-term housing market fundamentals and outlook remain positive, including low interest rates, demographics supporting growth in the population of first-time homebuyers and a relatively constrained supply of homes available for sale, we expect that the economic impact of the pandemic as well as public and private sector initiatives to reduce the transmission of COVID-19, such as the imposition of restrictions on business activities, will in the near term affect the number of new mortgages available for us to insure and real estate transactions available for our services, including as real estate markets confront challenges in the mortgage origination and home sale process created by social distancing and stay-at-home orders.
If the overall volume of new mortgage originations declines, we could experience a reduced opportunity to write new insurance business and conduct our real estate services and likely will be subject to increased competition, which could negatively affect our business prospects, results of operations and financial condition.
If the estimates we use in establishing loss reserves are incorrect, we may be required to take unexpected charges to income, which could adversely affect our results of operations.
We establish loss reserves in our mortgage insurance business to provide for the estimated cost of future claims on defaulted loans. Setting our loss reserves requires significant judgment by management with respect to the likelihood, magnitude and timing of each potential loss, including an estimate of the impact of our Loss Mitigation Activities with respect to defaulted loans. The models, assumptions and estimates we use to establish loss reserves may not prove to be accurate, especially in the event of an extended economic downturn or a period of extreme market volatility and uncertainty such as we are currently experiencing due to the COVID-19 pandemic. Because of this, claims paid may be substantially different than our loss reserves and these reserves may be insufficient to satisfy the full amount of claims that we ultimately have to pay. Changes to our estimates could adversely impact our results of operations and financial condition.
As discussed above in “—Radian Guaranty may fail to maintain its eligibility status with the GSEs,” we anticipate that the pandemic will result in a high volume of new defaults, both as a result of payment forbearance programs and otherwise, beginning in the second quarter of 2020. These anticipated new defaults are not currently reflected in our mortgage insurance loss reserves given that we generally are not permitted to establish reserves in anticipation of such defaults. As a result, our loss reserves are expected to increase significantly in the second quarter of 2020, and potentially in future quarters, as these new defaults are reported, which is expected to negatively impact our results of operations and financial condition.
In response to the pandemic, numerous federal and state governmental and regulatory agencies have instituted borrower relief programs, including payment and foreclosure forbearance, with the objective of supporting borrowers through the economic turmoil resulting from the pandemic and allowing borrowers to remain in their homes. In addition to the mortgage payment forbearance relief discussed above in “—Radian Guaranty may fail to maintain its eligibility status with the GSEs,” the CARES Act also institutes a 60-day foreclosure moratorium on GSE loans. As a result of COVID-19-related relief programs, we anticipate that defaults related to the pandemic, if not cured, could remain in our default loan inventory for a protracted period of time, resulting in a higher likelihood of claim for loans in default for an extended period of time and higher levels of Claim Severity for those loans that ultimately result in a claim.
A portion of the defaulted loans in our portfolio originated in the years prior to and including 2008 have been in default for an extended period of time. While these loans are generally assigned a higher loss reserve based on our belief that they are more likely to result in a claim, we also assume, based on historical trends, that a significant portion of these loans will cure or otherwise not result in a claim. Given the significant period of time that these loans have been in default, it is possible that the ultimate cure rate for these defaulted loans will be less than our current estimates of Cures for this inventory of defaults, due to the negative impacts of the COVID-19 pandemic or otherwise.
If our loss reserve estimates are inadequate, we may be required to increase our reserves, which could have a material adverse effect on our results of operations and financial condition
The current financial strength ratings assigned to our mortgage insurance subsidiaries could weaken our competitive position and potential downgrades by rating agencies to these ratings and the ratings assigned to Radian Group could adversely affect the Company.
Radian Guaranty has been assigned a rating of Baa1 by Moody’s and a rating of BBB+ by S&P. While Radian Guaranty’s financial strength ratings currently are investment grade, these ratings are below the ratings assigned to certain other private mortgage insurers. We do not believe our ratings have had a material adverse effect on our relationships with existing customers. However, if financial strength ratings become a more prominent consideration for lenders, we may be competitively disadvantaged by customers choosing to do business with private mortgage insurers that have higher financial strength ratings. In addition, the current PMIERs do not include a specific ratings requirement with respect to eligibility, but if this were to change in the future, we may become subject to a ratings requirement in order to retain our eligibility status under the PMIERs.
The GSEs currently consider financial strength ratings, among other items, to determine the amount of collateral that an insurer must post when participating in the credit risk transfer transactions currently being conducted by the GSEs. As a result, the returns that we are able to achieve when participating in these transactions are dependent, in part, on our financial strength ratings. We currently use Radian Reinsurance to participate in the GSEs’ credit risk transfer transactions. Radian Reinsurance has been assigned a rating of BBB+ by S&P. Market participants with higher ratings than us are assigned lower collateral requirements by the GSEs for these transactions and generally have a lower cost of capital, which may give them a competitive advantage, including the ability to price more aggressively for these transactions.
We believe that financial strength ratings remain a significant consideration for participants seeking to secure credit enhancement in the non-GSE mortgage market, which includes most non-qualified mortgage loans. While this market has
remained limited since the financial crisis and has further contracted as a result of COVID-19, we view this market as an area of potential long-term future growth, which could be further accelerated by changes to the QM rule currently under consideration by the CFPB, and our ability to successfully participate in this market could depend on our ability to secure higher ratings for our mortgage insurance subsidiaries. In addition, if legislative or regulatory changes were to alter the current state of the housing finance industry such that the GSEs no longer operate in their current capacity, we may be forced to compete in a new marketplace in which financial strength ratings may play a greater role.
The rating agencies continually review the financial strength ratings assigned to Radian Group and its mortgage insurance subsidiaries, and the ratings are subject to change. The COVID-19 pandemic and its impact on our financial results and condition, could cause one or more of the rating agencies to downgrade the ratings assigned to Radian Group and its mortgage insurance subsidiaries. Based on its March 26, 2020 update, S&P’s outlook for the financial strength ratings assigned to our mortgage insurance subsidiaries and Radian Group senior debt have been changed to negative. Downgrades to the ratings of our mortgage insurance subsidiaries and Radian Group could adversely affect our cost of funds, liquidity, access to capital markets and competitive position. If we are unable to compete effectively in the current or any future markets as a result of the financial strength ratings assigned to our mortgage insurance subsidiaries, the franchise value and future prospects for our mortgage insurance business could be negatively affected.
Our success depends, in part, on our ability to manage risks in our investment portfolio.
Our investment portfolio is an important source of revenue and is our primary source of claims paying resources. Although our investment portfolio consists mostly of highly-rated fixed income investments, our investment strategy is affected by general economic conditions, which may adversely affect the markets for credit and interest-rate-sensitive securities, including the extent and timing of investor participation in these markets, the level and volatility of interest rates and credit spreads and, consequently, the value of our fixed income securities, and as such, we may not achieve our investment objectives. As a result of the disruption in the financial markets due to the COVID-19 pandemic and its impact on economic conditions, the markets for credit and interest-rate-sensitive securities have been adversely affected and have experienced a lack of liquidity and our investment portfolio has become volatile. In addition, as of March 31, 2020, the aggregate value of our fixed income securities has decreased, which has increased the risk of loss if we need to sell investments prior to maturity. In addition, the risk of impairments of our investments has increased and LIBOR and U.S. Treasury yields have declined. If the disruption and volatility in the financial markets continues or worsens as a result of the COVID-19 pandemic or otherwise, it could have a material adverse effect on our liquidity, financial condition and results of operations.
Interest rates and investment yields on our investments continue to be low compared to historical averages, which has reduced the investment income we generate. For the significant portion of our investment portfolio held by our insurance subsidiaries, to receive favorable treatment under insurance regulatory requirements and full capital credit under the PMIERs, we generally are limited to investing in investment grade fixed income investments that are unlikely to increase our investment yields. Because we depend on our investments as a source of revenue, a prolonged period of lower than expected investment yields would have an adverse impact on our revenues and could potentially adversely affect our results of operations. Further, future updates to the Model Act or PMIERs could restrict our investment choices, which could negatively impact our investment strategy.
In addition, we structure our investment portfolio to satisfy our expected liabilities, including claim payments in our mortgage insurance business. If we underestimate our liabilities or improperly structure our investments to meet these liabilities, as a result of COVID-19 or otherwise, we could have unexpected losses resulting from the forced liquidation of investments before their maturity, which could adversely affect our results of operations.
Item 2. Unregistered Sales of Equity Securities and Use of Proceeds.
Issuance of Unregistered Securities
During the three months ended March 31, 2019,2020, no equity securities of Radian Group were sold that were not registered under the Securities Act.
Issuer Purchases of Equity Securities
The following table provides information about purchases of Radian Group common stock by us (and our affiliated purchasers) during the three months ended March 31, 2019.2020.
| | Issuer Purchases of Equity Securities | | ($ in thousands, except per-share amounts) | | | | | | | | | | | | | | |
| Period | Total Number of Shares Purchased (1) | | Average Price Paid per Share | | Total Number of Shares Purchased as Part of Publicly Announced Plans or Programs | | Approximate Dollar Value of Shares That May Yet Be Purchased Under the Plans or Programs (2) | Total Number of Shares Purchased (1) | | Average Price Paid per Share | | Total Number of Shares Purchased as Part of Publicly Announced Plans or Programs (2) | | Approximate Dollar Value of Shares That May Yet Be Purchased Under the Plans or Programs (2) |
| Share repurchase program | | | | | | | | |
| 1/1/2019 to 1/31/2019 | 2,460 |
| | $ | 19.23 |
| | — |
| | $ | 100,000 |
| |
| 2/1/2019 to 2/28/2019 | 11,269 |
| | $ | 21.04 |
| | — |
| | $ | 100,000 |
| |
| 3/1/2019 to 3/31/2019 | 1,554,871 |
| | $ | 20.54 |
| | 1,546,674 |
| | $ | 218,249 |
| |
| Share repurchase programs | | | | | | | | |
| 1/1/2020 to 1/31/2020 | | 381,331 |
| | $ | 24.54 |
| | 381,331 |
| | $ | 415,648 |
|
| 2/1/2020 to 2/29/2020 | | 3,447,008 |
| | 23.38 |
| | 3,440,305 |
| | 335,278 |
|
| 3/1/2020 to 3/31/2020 | | 7,225,326 |
| | 18.92 |
| | 7,214,612 |
| | 198,860 |
|
| Total | 1,568,600 |
| | | | 1,546,674 |
| |
| 11,053,665 |
| | | | 11,036,248 |
| |
|
| | | | | | | | | | | | | | | |
______________________
| |
| (1) | Includes 21,92617,417 shares tendered by employees as payment of taxes withheld on the vesting of certain restricted stock awards granted under the Company’s equity compensation plans. |
| |
| (2) | On March 20,August 14, 2019, Radian Group’s board of directors approved a $150share repurchase program that authorizes the Company to spend up to $200 million to repurchase Radian Group common stock. On February 13, 2020, Radian Group’s board of directors authorized a $275 million increase in authorization for the Company’s existing share repurchase plan,this program, bringing the total authorization to repurchase shares up to $250$475 million, excluding commissions. Pursuant to this authorization, during the three months ended March 31, 2019, we2020, the Company purchased a total of 1,546,67411,036,248 shares at an average price of $20.54$20.51 per share, including commissions. This share repurchase program expires on JulyAugust 31, 2020.2021. See Note 1413 of Notes to Unaudited Condensed Consolidated Financial Statements for additional details on our share repurchase program.programs. |
Item 5. Other Information.
The description of the amendment to the credit agreement herein is qualified in its entirety by reference to the full text of the amendment, which will be filed as an exhibit to our Quarterly Report on Form 10-Q for the quarter ended June 30, 2020.
Item 6. Exhibits
|
| | |
| Exhibit No. | | Exhibit Name |
| | | |
3.1+*10.1 | | |
| | |
3.2 | | |
| | | |
| *31 | | |
| | | |
| **32 | | |
| | | |
*101101.INS | | Pursuant to Rule 405 of Regulation S-T,Inline XBRL Instance Document - the following financial information from Radian Group Inc.’s Quarterly Report on Form 10-Q forinstance document does not appear in the quarter ended March 31, 2019 is formattedInteractive Data File because its XBRL tags are embedded within the Inline XBRL document. |
| | |
| *101.SCH | | Inline XBRL Taxonomy Extension Schema Document |
| | |
| *101.CAL | | Inline XBRL Taxonomy Extension Calculation Linkbase Document |
| | |
| *101.DEF | | Inline XBRL Taxonomy Extension Definition Linkbase Document |
| | |
| *101.LAB | | Inline XBRL Taxonomy Extension Label Linkbase Document |
| | |
| *101.PRE | | Inline XBRL Taxonomy Extension Presentation Linkbase Document |
| | |
| *104 | | Cover Page Interactive Data File (formatted as Inline XBRL and contained in XBRL (eXtensible Business Reporting Language): (i) Condensed Consolidated Balance Sheets as of March 31, 2019 and December 31, 2018; (ii) Condensed Consolidated Statements of Operations for the three months ended March 31, 2019 and 2018; (iii) Condensed Consolidated Statements of Comprehensive Income (Loss) for the three months ended March 31, 2019 and 2018; (iv) Condensed Consolidated Statements of Changes in Common Stockholders’ Equity for the three months ended March 31, 2019 and 2018; (v) Condensed Consolidated Statements of Cash Flows for the three months ended March 31, 2019 and 2018; and (vi) the Notes to Unaudited Condensed Consolidated Financial Statements.Exhibit 101.INS) |
______________________
+ Management contract, compensatory plan or arrangement.
* Filed herewith.
** Furnished herewith.
| |
| + | Management contract, compensatory plan or arrangement. |
SIGNATURES
Pursuant to the requirements of the Securities Exchange Act of 1934, the registrant has duly caused this report to be signed on its behalf by the undersigned thereunto duly authorized.
|
| | |
| | Radian Group Inc. |
| | | |
| Date: | May 8, 20196, 2020 | /s/ J. FRANKLIN HALL |
| | | J. Franklin Hall |
| | Senior Executive Vice President, Chief Financial Officer |
| | | |
| | /s/ ROBERT J. QUIGLEY |
| | | Robert J. Quigley |
| | Senior Vice President, Controller |