UNITED STATES
SECURITIES AND EXCHANGE COMMISSION
Washington, D.C. 20549
_____________________________
FORM 10-Q
_____________________________
(Mark One)
| | | | | |
| ☒ | QUARTERLY REPORT PURSUANT TO SECTION 13 OR 15(d) OF THE SECURITIES EXCHANGE ACT OF 1934 |
For the quarterly period ended SeptemberJune 30, 20202021
OR
| | | | | |
| ☐ | TRANSITION REPORT PURSUANT TO SECTION 13 OR 15(d) OF THE SECURITIES EXCHANGE ACT OF 1934 |
For the transition period from to
Commission File Number 1-11356
Radian Group Inc.
(Exact name of registrant as specified in its charter)
_______________________________ | | | | | | | | | | | | | | | | | | | | |
| Delaware | | 23-2691170 |
| (State or other jurisdiction of incorporation or organization) | | (I.R.S. Employer Identification No.) |
| | | | | | |
| 1500 Market Street | , | Philadelphia | , | PA | | 19102 |
| (Address of principal executive offices) | | (Zip Code) |
(215) 231-1000
(Registrant’s telephone number, including area code)
Securities registered pursuant to Section 12(b) of the Act: | | | | | | | | |
| Title of each class | Trading Symbol(s) | Name of each exchange on which registered |
| Common Stock, $0.001 par value per share | RDN | New York Stock Exchange |
Indicate by check mark whether the registrant: (1) has filed all reports required to be filed by Section 13 or 15(d) of the Securities Exchange Act of 1934 during the preceding 12 months (or for such shorter period that the registrant was required to file such reports), and (2) has been subject to such filing requirements for the past 90 days. Yes ☒ No ☐
Indicate by check mark whether the registrant has submitted electronically every Interactive Data File required to be submitted pursuant to Rule 405 of Regulation S-T (§232.405 of this chapter) during the preceding 12 months (or for such shorter period that the registrant was required to submit such files). Yes ☒ No ☐
Indicate by check mark whether the registrant is a large accelerated filer, an accelerated filer, a non-accelerated filer, a smaller reporting company, or an emerging growth company. See the definitions of “large accelerated filer,” “accelerated filer,” “smaller reporting company” and “emerging growth company” in Rule 12b-2 of the Exchange Act.
| | | | | | | | | | | | | | | | | | | | | | | | | | | | | | | | | | | | | | | | | |
| Large Accelerated Filer | ☒ | | Accelerated filer | ☐ | | Non-accelerated filer | ☐ | | Smaller reporting company | ☐ | | Emerging growth company | ☐ |
If an emerging growth company, indicate by check mark if the registrant has elected not to use the extended transition period for complying with any new or revised financial accounting standards provided pursuant to Section 13(a) of the Exchange Act. ☐
Indicate by check mark whether the registrant is a shell company (as defined in Rule 12b-2 of the Exchange Act). Yes ☐ No ☒
APPLICABLE ONLY TO CORPORATE ISSUERS:
Indicate the number of shares outstanding of each of the issuer’s classes of common stock, as of the latest practicable date: 191,556,568185,557,493 shares of common stock, $0.001 par value per share, outstanding on November 5, 2020.August 4, 2021.
Table of Contents
| | | | | | | | |
|
| | | Page
Number |
| | |
| |
| | |
| |
| | |
| |
Item 1.1 | | |
| | |
| | |
| | |
| | |
| | |
| | |
| | |
| | |
| | |
| | |
| | |
| | |
| | |
| | |
| | |
| | |
| | |
| | |
| | |
| | |
| | |
| | |
Item 2.2 | | |
Item 3.3 | | |
Item 4.4 | | |
| | |
| |
Item 1.1 | | |
Item 1A.1A | | |
Item 2.2 | | |
Item 6.6 | | |
| | |
| |
Glossary of Abbreviations and Acronyms
The following list defines various abbreviations and acronyms used throughout this report, including the Condensed Consolidated Financial Statements, the Notes to Unaudited Condensed Consolidated Financial Statements and Management’s Discussion and Analysis of Financial Condition and Results of Operations.
| | | | | |
| Term | Definition |
| 2020 Form 10-K | Annual Report on Form 10-K for the year ended December 31, 2020, filed with the SEC on February 26, 2021 |
| 2014 Master Policy | Radian Guaranty’s master insurance policy, setting forth the terms and conditions of our mortgage insurance coverage, which became effective October 1, 2014 |
| 2020 Master Policy | Radian Guaranty’s master insurance policy, setting forth the terms and conditions of our mortgage insurance coverage, which became effective March 1, 2020 |
| 2016 Single Premium QSR Agreement | Quota share reinsurance agreement entered into with a panel of third-party reinsurance providers in the first quarter of 2016 and subsequently amended in the fourth quarter of 2017 |
| 2018 Single Premium QSR Agreement | Quota share reinsurance agreement entered into with a panel of third-party reinsurance providers in October 2017 to cede a portion of Single Premium NIW beginning January 1, 2018 |
2020 Master Policy | Radian Guaranty’s master insurance policy, setting forth the terms and conditions of our mortgage insurance coverage, which became effective March 1, 2020 |
2020 Single Premium QSR Agreement | Quota share reinsurance agreement entered into with a panel of third-party reinsurance providers in January 2020 to cede a portion of Single Premium NIW beginning January 1, 2020 |
| 2017 Surplus Note | The $100 million 0.0% intercompany surplus note issued by Radian Guaranty to Radian Group, due December 31, 2027 |
| 2020 Surplus Note | The $200 million 3.0% intercompany surplus note issued by Radian Guaranty to Radian Group, which was initially due January 31, 2030 but was converted to contributed surplus effective April 1, 2021 |
| ABS | Asset-backed securities |
| All Other | Radian’s non-reportable operating segments and other business activities, includingincluding: (i) income (losses) from assets held by our holding company,company; (ii) related general corporate operating expenses not attributable or allocated to our reportable segments and,segments; (iii) for all periods throughprior to its sale in the first quarter of 2020, prior to its sale, income and expenses related to ClaytonClayton; (iv) for all periods presented, the income and expenses related to our traditional appraisal services; and (v) certain other immaterial revenue and expense items |
| ASU | Accounting Standards Update, issued by the FASB to communicate changes to GAAP |
| Available Assets | As defined in the PMIERs, assets primarily including the most liquid assets of a mortgage insurer, and reduced by, among other items, premiums received but not yet earned and reinsurance funds withheld |
| CARES Act | Coronavirus Aid, Relief, and Economic Security Act signed into law on March 27, 2020 |
CFPB | Consumer Financial Protection Bureau |
| Claim Curtailment | Our legal right, under certain conditions, to reduce the amount of a claim, including due to servicer negligence |
| Claim Denial | Our legal right, under certain conditions, to deny a claim |
| Claim Severity | The total claim amount paid divided by the original coverage amount |
| Clayton | Clayton Services LLC, ana former indirect subsidiary of Radian Group whichthat was sold on January 21, 2020, through which we provided services related to loan acquisition, RMBS securitization and distressed asset reviews and servicer and loan surveillance |
| CLO | Collateralized loan obligations |
| CMBS | Commercial mortgage-backed securities |
| COVID-19 | The novel coronavirus disease declared a pandemic by the World Health Organization and the Centers for Disease Control and Prevention in March 2020 |
| COVID-19 Amendment | Temporary amendmentAmendment to the PMIERs effective June 30, 2020, primarily to recognize the COVID-19 pandemic as a nationwide “FEMA Declared Major Disaster” and to set forth guidelines on the application of the Disaster Related Capital Charge to COVID-19 Defaulted Loans |
| COVID-19 Crisis Period | Time period extending from March 1, 2020 to January 1,March 31, 2021 |
| | | | | |
| Term | Definition |
| COVID-19 Defaulted Loans | All non-performing loans that either: (i) have an Initial Missed Payment occurring during the COVID-19 Crisis Period or (ii) are subject to a forbearance plan granted in response to a financial hardship related to COVID-19 (which is assumed under the COVID-19 Amendment to be the case for any loan that has an Initial Missed Payment occurring during the COVID-19 Crisis Period and is subject to a forbearance plan), the terms of which are materially consistent with the terms of forbearance plans offered by the GSEs |
| Cures | Loans that were in default as of the beginning of a period and are no longer in default because payments were received such that the loan is no longer 60 or more days past due |
| Default to Claim Rate | The percentage of defaulted loans that are assumed to result in a claim |
| | | | | |
TermDemotech | DefinitionDemotech, Inc. |
| Disaster Related Capital Charge | Under the PMIERs, multiplier of 0.30 applied to the required asset amount factor for each non-performing loan: (i) backed by a property located in a FEMA Designated Area and (ii) either subject to a certain forbearance plan or with an initial default date occurring within a certain timeframe |
Discrete Item(s) | For tax calculation purposes, certain items that are required to be accounted for in the provision for income taxes as they occur and are not considered components of the estimated annualized effective tax rate for purposes of reporting interim results. Generally, these are items that are: (i) clearly defined (such as changes in tax rate or tax law); (ii) infrequent or unusual in nature; or (iii) gains or losses that are not components of continuing operating income, such as income from discontinued operations or losses reflected as components of other comprehensive income. These items impact the difference between the statutory rate and Radian’s effective tax rate. |
| Dodd-Frank Act | Dodd-Frank Wall Street Reform and Consumer Protection Act, as amended |
| Eagle Re Issuer(s) | A group of unaffiliated special purpose reinsurersinsurers (VIEs) domiciled in Bermuda, comprising Eagle Re 2018-1 Ltd., Eagle Re 2019-1 Ltd., Eagle Re 2020-1 Ltd., Eagle Re 2020-2 Ltd., and/or Eagle Re 2020-12021-1 Ltd., which provide reinsurance coverage under Radian Guaranty’s Excess-of-Loss Program. Effective in October 2020, also includes Eagle Re 2020-2 Ltd. |
ECF | Enterprise Regulatory Capital Framework proposed by the FHFA on June 30, 2020 |
| Excess-of-Loss Program | The credit risk protection obtained by Radian Guaranty in the form of excess-of-loss reinsurance, which indemnifies the ceding company against loss in excess of a specific agreed limit, up to a specified sum. The program includes reinsurance agreements with the Eagle Re Issuers in connection with various issuances of mortgage insurance-linked notes. The program also includes a separate agreement with a third-party reinsurer, representing a pro rata share of the credit risk alongside the risk assumed by Eagle Re 2018-1 Ltd., an Eagle Re Issuer. |
| Exchange Act | Securities Exchange Act of 1934, as amended |
| Extraordinary Distribution | A dividend or distribution of capital that is required to be approved by an insurance company’s primary regulator that is greater than would be permitted as an ordinary distribution (which does not require regulatory approval) |
| Fannie Mae | Federal National Mortgage Association |
| FASB | Financial Accounting Standards Board |
| FEMA | Federal Emergency Management Agency, an agency of the U.S. Department of Homeland Security |
| FEMA Designated Area | Generally, an area that has been subject to a disaster, designated by FEMA as an individual assistance disaster area for the purpose of determining eligibility for various forms of federal assistance |
| FHA | Federal Housing Administration |
| FHFA | Federal Housing Finance Agency |
| FHLB | Federal Home Loan Bank of Pittsburgh |
| FICO | Fair Isaac Corporation (“FICO”) credit scores, for Radian’s portfolio statistics, represent the borrower’s credit score at origination and, in circumstances where there are multiple borrowers, the lowest of the borrowers’ FICO scores is utilized |
| Fitch | Fitch Ratings, Inc. |
| Foreclosure Stage Default | The stageStage of defaultDefault of a loan in which a foreclosure sale has been scheduled or held |
| Freddie Mac | Federal Home Loan Mortgage Corporation |
| GAAP | Generally accepted accounting principles in the U.S., as amended from time to time |
| GSE(s) | Government-Sponsored Enterprises (Fannie Mae and Freddie Mac) |
| HARP | Home Affordable Refinance Program |
| homegenius | Radian’s business segment (formerly known as “Real Estate”) that offers a broad array of title, valuation, asset management, SaaS and other real estate services to mortgage lenders, mortgage and real estate investors, GSEs, real estate brokers and agents |
| IBNR | Losses incurred but not reported |
| IIF | Insurance in force, equal to the aggregate unpaid principal balances of the underlying loans |
| | | | | |
| Term | Definition |
| Initial Missed Payment | The first missed monthly payment, which would be reported to us as delinquent as of the last day of the month for which it was due. (For example, for a loan first reported to the approved insurer in May as having missed its payments due on April 1 and May 1, the Initial Missed Payment shall be deemed to have occurred on April 30. In this example, the loan would become a non-performing primary mortgage guaranty insurance loan in May and, if applicable, the 0.30 multiplierDisaster Related Capital Charge would be applied for May, June, and July.) |
| | | | | |
Term | Definition |
IRS | Internal Revenue Service |
| LAE | Loss adjustment expenses, which include the cost of investigating and adjusting losses and paying claims |
| LIBOR | London Inter-bank Offered Rate |
| Loss Mitigation Activity/Activities | Activities such as Rescissions, Claim Denials, Claim Curtailments and cancellations |
| LTV | Loan-to-value ratio, calculated as the percentageratio of the original loan amount to the original value of the property, expressed as a percentage |
| Master Policies | The Prior Master Policy, the 2014 Master Policy, and the 2020 Master Policy, together |
| Minimum Required Asset(s) | A risk-based minimum required asset amount, as defined in the PMIERs, calculated based on net RIF (RIF, net of credits permitted for reinsurance) and a variety of measures related to expected credit performance and other factors, including the impact of the Disaster Related Capital Charge |
| Model Act | Mortgage Guaranty Insurance Model Act, as issued by the NAICNational Association of Insurance Commissioners to establish minimum capital and surplus requirements for mortgage insurers |
| Monthly and Other Recurring Premiums (or Recurring Premium Policies) | Insurance premiums or policies, respectively, where premiums are paid on a monthly or other installment basis, in contrast to Single Premium Policies |
| Monthly Premium Policies | Insurance policies where premiums are paid on a monthly installment basis |
| Moody’s | Moody’s Investors Service |
| Mortgage | Radian’s mortgage insurance and risk services business segment, which provides credit-related insurance coverage, principally through private mortgage insurance on residential first-lien mortgage loans, as well as other credit risk management, contract underwriting and fulfillment solutions, to mortgage lending institutions and mortgage credit investors |
| MPP Requirement | Certain states’ statutory or regulatory risk-based capital requirement that the mortgage insurer must maintain a minimum policyholder position, which is calculated based on both risk and surplus levels |
NAIC | National Association of Insurance Commissioners |
| NIW | New insurance written, representing the aggregate original principal amount of the mortgages underlying the Primary Mortgage Insurance |
| NOL | Net operating loss; for tax purposes, accumulated during years a company reported more tax deductions than taxable income. NOLs may be carried back or carried forward a certain number of years, depending on various factors which can reduce a company’s tax liability. |
| Persistency Rate | The percentage of IIF that remains in force over a period of time |
| PMIERs | Private Mortgage Insurer Eligibility Requirements issued by the GSEs under oversight of the FHFA to set forth requirements an approved insurer must meet and maintain to provide mortgage guaranty insurance on loans acquired by the GSEs. The current PMIERs requirements, sometimes referred to as PMIERs 2.0, incorporate the most recent revisions to the PMIERs that became effective on March 31, 2019. |
| PMIERs Cushion | Under PMIERs, Radian Guaranty's excess of Available Assets over Minimum Required Assets |
| Pool Mortgage Insurance | Pool Insurance differs from primary insurance in that our maximum liability is not limited toprovides a specific coverage percentagelender or investor protection against default on a group or “pool” of mortgages, rather than on an individual mortgage loan. Instead,loan basis, generally subject to an aggregate exposure limit, or “stop loss,” and/or deductible is applied to the initial aggregate loan balance of the entire pool, pursuant to the terms of the applicable insurance agreement |
| Primary Mortgage Insurance | Insurance that provides a lender or investor protection against default on an individual mortgage loan basis, at a group or “pool”specified coverage percentage for each loan, pursuant to the terms of mortgages.the applicable Master Policy |
| Prior Master Policy | Radian Guaranty’s master insurance policy, setting forth the terms and conditions of our mortgage insurance coverage, which was in effect prior to the effective date of the 2014 Master Policy |
| QM | Qualified mortgage; a mortgage that possesses certain low-risk characteristics that enable it to qualify for lender protection under the ability to repay rule instituted by the Dodd-Frank Act |
| | | | | |
| Term | Definition |
| QSR Program | The quota share reinsurance agreements entered into with a third-party reinsurance provider in the second and fourth quarters of 2012, collectively |
| Radian | Radian Group Inc. together with its consolidated subsidiaries |
| Radian Group | Radian Group Inc., our insurance holding company |
| Radian Guaranty | Radian Guaranty Inc., a Pennsylvania domiciled insurance subsidiary of Radian Group and our approved insurer under the PMIERs, through which we provide mortgage insurance products and services |
| Radian Reinsurance | Radian Reinsurance Inc., a Pennsylvania domiciled insurance subsidiary of Radian Group, |
| | | | | |
Term | Definition through which we provide mortgage credit risk insurance and reinsurance, including through participation in credit risk transactions issued by the GSEs |
| Radian Title Insurance | Radian Title Insurance Inc., formerly known as EnTitle Insurance Company, an Ohio domiciled insurance company and an indirect subsidiary of Radian Group, through which we offer title insurance |
| RBC States | Risk-based capital states, which are those states that currently impose a statutory or regulatory risk-based capital requirement |
Real Estate | Radian’s business segment that is primarily a fee-for-service business that offers a broad array
of title, valuation, asset management and other real estate services to market participants across the real estate value chain |
Reinstatements | Reversals of previous Rescissions, Claim Denials and Claim Curtailments |
| Rescission | Our legal right, under certain conditions, to unilaterally rescind coverage on our mortgage insurance policies if we determine that a loan did not qualify for insurance |
| RIF | Risk in force; for primary insurance,Primary Mortgage Insurance, RIF is equal to the underlying loan unpaid principal balance multiplied by the insurance coverage percentage, whereas for Pool Mortgage Insurance, it represents the remaining exposure under the agreements |
| Risk-to-capital | Under certain state regulations, a maximum ratio of net RIF calculated relative to the level of statutory capital |
| RMBS | Residential mortgage-backed securities |
| S&P | Standard & Poor’s Financial Services LLC |
| SaaS | Software-as-a-Service |
| SAP | Statutory accounting principles and practices, including those required or permitted, if applicable, by the insurance departments of the respective states of domicile of our insurance subsidiaries |
| SEC | United States Securities and Exchange Commission |
| Securities Act | Securities Act of 1933, as amended |
| Senior Notes due 2024 | Our 4.500% unsecured senior notes due October 2024 ($450 million original principal amount) |
| Senior Notes due 2025 | Our 6.625% unsecured senior notes due March 2025 ($525 million original principal amount) |
| Senior Notes due 2027 | Our 4.875% unsecured senior notes due March 2027 ($450 million original principal amount) |
Single Premium NIW / IIF | NIW or IIF, respectively, on Single Premium Policies |
| Single Premium Policy / Policies | Insurance policies where premiums are paid in a single payment, which includes policies written on an individual basis (as each loan is originated) and on an aggregated basis (in which each individual loan in a group of loans is insured in a single transaction, typically shortly after the loans have been originated) |
| Single Premium QSR Program | The 2016 Single Premium QSR Agreement, the 2018 Single Premium QSR Agreement and the 2020 Single Premium QSR Agreement, togethercollectively |
| SOFR | Secured Overnight Financing Rate |
| Stage of Default | The stage a loan is in relative to the foreclosure process, based on whether a foreclosure sale has been scheduled or held |
| Statutory RBC Requirement | Risk-based capital requirement imposed by the RBC States, requiring a minimum surplus level and, in certain states, a minimum ratio of statutory capital relative to the level of risk |
Surplus NotesTime in Default | Collectively: (i)The time period from the point a $100 million 0.0% intercompany surplus note issued by Radian Guarantyloan reaches default status (based on the month the default occurred) to Radian Group, due December 31, 2027 and (ii) a $200 million 3.0% intercompany surplus note issued by Radian Guaranty to Radian Group, due January 31, 2030the current reporting date |
| VIE | Variable interest entity |
Cautionary Note Regarding Forward-Looking Statements—Statements
—Safe Harbor Provisions
All statements in this report that address events, developments or results that we expect or anticipate may occur in the future are “forward-looking statements” within the meaning of Section 27A of the Securities Act, Section 21E of the Exchange Act and the Private Securities Litigation Reform Act of 1995. In most cases, forward-looking statements may be identified by words such as “anticipate,” “may,” “will,” “could,” “should,” “would,” “expect,” “intend,” “plan,” “goal,” “contemplate,” “believe,” “estimate,” “predict,” “project,” “potential,” “continue,” “seek,” “strategy,” “future,” “likely” or the negative or other variations on these words and other similar expressions. These statements, which may include, without limitation, projections regarding our future performance and financial condition, are made on the basis of management’s current views and assumptions with respect to future events, including management’s current views regarding the likely impacts of the COVID-19 pandemic. Any forward-looking statement is not a guarantee of future performance and actual results could differ materially from those contained in the forward-looking statement. These statements speak only as of the date they were made, and we undertake no obligation to update or revise any forward-looking statements, whether as a result of new information, future events or otherwise. We operate in a changing environment where new risks emerge from time to time and it is not possible for us to predict all risks that may affect us, particularly those associated with the COVID-19 pandemic, which has had wide-ranging and continually evolving effects. The forward-looking statements are not guarantees of future performance, and the forward-looking statements, as well as our prospects as a whole, are subject to risks and uncertainties that could cause actual results to differ materially from those set forth in the forward-looking statements. These risks and uncertainties include, without limitation:
■the COVID-19 pandemic, which has significantly impacted the global economy, disrupted global supply chains, lowered certain equity market valuations, createdcaused significant economic disruption, high unemployment, periods of significant volatility and disruption in financial markets, and required adjustments in the housing finance system and real estate markets and increased unemployment levels. In addition, themarkets. The COVID-19 pandemic has resulted in travel restrictions, stay-at-home, quarantine and similar orders, which have resulted in the closures of manyadversely impacted our businesses, and for those permitted to open, numerous operating limitations such as social distancing and other extensive health and safety measures. As a result, the demand for certain of our products and services has been impacted, and this impact may continue for an unknown period and could expand in scope. Wewe expect that the COVID-19 pandemic and measures taken to reduce its spread will pervasivelycould further impact our business and subject us to certain risks, including those discussed in “Item 1A. Risk Factors—The COVID-19 pandemic has adversely impacted our business,us, and its ultimate impact on our business and financial results will depend on future developments, which are highly uncertain and cannot be predicted, including the scope, severity and duration of the pandemic and actions taken by governmental authorities in response to the pandemic” and the other risk factors in this report;our 2020 Form 10-K;
■further changes in economic and political conditions including those resulting from the November 2020 elections and COVID-19, that impact the size of the insurable market, the credit performance of our insured portfolio, and our business prospects;
■changes in the way customers, investors, ratings agencies, regulators or legislators perceive our performance, financial strength and future prospects;
■Radian Guaranty’s ability to remain eligible under the PMIERs including potential future changes to the PMIERs, and other applicable requirements imposed by the FHFA and by the GSEs to insure loans purchased by the GSEs;
■the proposed ECF that would, among other items, establish significant capital requirements for the GSEs once finalized, which could impact the GSEs’ operations and the size of the insurable mortgage insurance market, and which may form the basis for future versions of the PMIERs;
■our ability to successfully execute and implement our capital plans, including our risk distribution strategy through the capital markets and reinsurance markets, and to maintain sufficient holding company liquidity to meet our liquidity needs;
■our ability to successfully execute and implement our business plans and strategies, including plans and strategies that require GSE and/or regulatory approvals and various licenses and complex compliance requirements;
■our ability to maintain an adequate level of capital in our insurance subsidiaries to satisfy existing and future regulatory requirements, including the PMIERs and any changes thereto, such as the application of the COVID-19 Amendment, and potential changes to the Model Act currently under consideration;
■changes in the charters or business practices of, or rules or regulations imposed by or applicable to, the GSEs, which may include changes in response to the COVID-19 pandemic, changes in the requirements for Radian Guaranty to remain an approved insurer to the GSEs, changes in the GSEs’ interpretation and application of the PMIERs, as well asor changes impacting loans purchased by the GSEs;
■the effects of the Enterprise Regulatory Capital Framework which was finalized by the FHFA in December 2020 and which, among other things, increases the capital requirements for the GSEs including changes toand reduces the GSEs’ business practices in response tocredit they receive for risk transfer, which could impact their operations and pricing as well as the COVID-19 pandemic;size of the insurable mortgage insurance market, and which may form the basis for future versions of the PMIERs;
■changes in the current housing finance system in the United States, including the roleroles of the FHA, the GSEs and private mortgage insurers in this system;
■our ability to successfully execute and implement our capital plans, including our risk distribution strategy through the capital markets and reinsurance markets, and to maintain sufficient holding company liquidity to meet our liquidity needs;
■our ability to successfully execute and implement our business plans and strategies, including plans and strategies that require GSE and/or regulatory approvals and licenses or are subject to complex compliance requirements that we may be unable to satisfy, or that may expose us to new risks including those that could impact our capital and liquidity positions;
■uncertainty from the expectedupcoming discontinuance of LIBOR and transition to one or more alternative benchmarks that could cause interest rate volatility and, among other things, impact our investment portfolio, cost of debt and cost of reinsurance through mortgage insurance-linked notes transactions;
■any disruption in the servicing of mortgages covered by our insurance policies, as well as poor servicer performance, which could result frombe impacted by the burdens placed on many servicers due to the impact of the COVID-19 pandemic;
■a decrease in the Persistency Rates of our mortgage insurance on monthly premium products;Monthly Premium Policies;
■competition in the private mortgage insurance industry generally, and more specifically: price competition in our mortgage insurance business, including price competitionas a result of the increased use of loan-level pricing delivery methodologies that are less transparent than historical pricing practices; and competition from the FHA and the U.S. Department of Veterans Affairs as well as from other forms of credit enhancement, includingsuch as GSE-sponsored alternatives to traditional mortgage insurance;
■the effect of the Dodd-Frank Act on the financial services industry in general, and on our businesses in particular, including the proposed changes to the QM loan requirements which currently are being considered by the CFPB;particular;
■legislative and regulatory activity (or inactivity), including the adoption of (or failure to adopt) new laws and regulations, or changes in existing laws and regulations, or the way they are interpreted or applied, including potential changes in tax law under the enactment of the CARES Act and the adoption, interpretation or application of laws and regulations in response to COVID-19;Biden Administration;
■legal and regulatory claims, assertions, actions, reviews, audits, inquiries and investigations that could result in adverse judgments, settlements, fines, injunctions, restitutions or other relief that could require significant expenditures, new or increased reserves or have other effects on our business;
■the amount and timing of potential settlements, payments or adjustments associated with federal or other tax examinations;
■the possibility that we may fail to estimate accurately, especially in the event of an extended economic downturn or a period of extreme market volatility and economic uncertainty, such as we are currently experiencing due to the COVID-19 pandemic, the likelihood, magnitude and timing of losses in establishing loss reserves for our mortgage insurance business or to accurately calculate and/or project our Available Assets and Minimum Required Assets under the PMIERs, which will be impacted by, among other things, the size and mix of our IIF, the level of defaults in our portfolio, the reported status of defaults in our portfolio, including whether they are subject to forbearance, a repayment plan or a loan modification trial period undergranted in response to a loan modification in responsefinancial hardship related to COVID-19, the level of cash flow generated by our insurance operations and our risk distribution strategies;
■volatility in our financial results caused by changes in the fair value of our assets and liabilities, including with respect to our use of derivatives and within our investment portfolio;
■changes in GAAP or SAP rules and guidance, or their interpretation;
■our ability and related costs to develop, launch and implement new and innovative technologies and digital products and services, and whether we will have broad customer acceptance of these products and services;
■effectiveness and security of our information technology systems and digital products and services, including the risk that these systems, products or services fail to operate as expected or planned or expose us to cybersecurity or third party risks, including due to computer viruses, unauthorized access, cyber-attack, natural disasters or other similar events;
■our ability to attract and retain key employees; and
■legal and other limitations on amounts we may receive from our subsidiaries, including dividends or ordinary course distributions under our internal tax- and expense-sharing arrangements.
For more information regarding these risks and uncertainties as well as certain additional risks that we face, you should refer to “Item 1A. Risk Factors” in this report and “Item 1A. Risk Factors” in our Annual Report on2020 Form 10-K, for the year ended December 31, 2019, and to subsequent reports and registration statements filed from time to time with the SEC. We caution you not to place undue reliance on these forward-looking statements, which are current only as of the date on which we issued this report. We do not intend to, and we disclaim any duty or obligation to, update or revise any forward-looking statements to reflect new information or future events or for any other reason.
PART I—FINANCIAL INFORMATION
Item 1. Financial Statements (Unaudited)
Radian Group Inc. and Subsidiaries
Index to Condensed Consolidated Balance SheetsFinancial Statements
(Unaudited) | | | | | |
| Page |
| Quarterly Financial Statements | |
| |
| |
| |
| |
| |
| |
| Notes to Unaudited Condensed Consolidated Financial Statements | |
| |
| |
| |
| |
| |
| |
| |
| |
| |
| |
| |
| |
| |
| |
| |
| |
| | | | | | | | | | | |
| (In thousands, except per-share amounts) | September 30,
2020 | | December 31,
2019 |
| | | |
| Assets | | | |
| Investments (Notes 5 and 6) | | | |
| Fixed-maturities available for sale—at fair value, net of allowance for credit losses of $2,290 as of September 30, 2020 (amortized cost of $5,338,536 and $4,549,534) | $ | 5,628,992 | | | $ | 4,688,911 | |
| Trading securities—at fair value (amortized cost of $262,131 and $297,505) | 291,650 | | | 317,150 | |
| Equity securities—at fair value (cost of $92,638 and $125,311) | 91,317 | | | 130,221 | |
| Short-term investments—at fair value (includes $33,121 and $25,561 of reinvested cash collateral held under securities lending agreements) | 567,146 | | | 518,393 | |
| Other invested assets—at fair value | 5,472 | | | 4,072 | |
| Total investments | 6,584,577 | | | 5,658,747 | |
| Cash | 82,020 | | | 92,729 | |
| Restricted cash | 4,424 | | | 3,545 | |
| | | |
| | | |
| Accounts and notes receivable | 145,164 | | | 93,630 | |
| | | |
| | | |
| | | |
| Goodwill and other acquired intangible assets, net (Note 7) | 25,268 | | | 28,187 | |
| Prepaid reinsurance premium | 295,062 | | | 363,856 | |
| Other assets (Note 9) | 640,830 | | | 567,619 | |
| Total assets | $ | 7,777,345 | | | $ | 6,808,313 | |
| | | |
| Liabilities and Stockholders’ Equity | | | |
| Unearned premiums | $ | 501,787 | | | $ | 626,822 | |
| Reserve for losses and loss adjustment expense (Note 11) | 825,792 | | | 404,765 | |
| Senior notes (Note 12) | 1,404,759 | | | 887,110 | |
| FHLB advances (Note 12) | 141,058 | | | 134,875 | |
| Reinsurance funds withheld | 318,773 | | | 291,829 | |
| Other liabilities | 462,797 | | | 414,189 | |
| Total liabilities | 3,654,966 | | | 2,759,590 | |
| Commitments and contingencies (Note 13) | | | |
| Stockholders’ equity | | | |
| Common stock: par value $0.001 per share; 485,000 shares authorized at September 30, 2020 and December 31, 2019; 210,061 and 219,123 shares issued at September 30, 2020 and December 31, 2019, respectively; 191,556 and 201,164 shares outstanding at September 30, 2020 and December 31, 2019, respectively | 210 | | | 219 | |
| Treasury stock, at cost: 18,505 and 17,959 shares at September 30, 2020 and December 31, 2019, respectively | (909,745) | | | (901,657) | |
| Additional paid-in capital | 2,238,869 | | | 2,449,884 | |
| Retained earnings | 2,561,076 | | | 2,389,789 | |
| Accumulated other comprehensive income (loss) (Note 15) | 231,969 | | | 110,488 | |
| Total stockholders’ equity | 4,122,379 | | | 4,048,723 | |
| Total liabilities and stockholders’ equity | $ | 7,777,345 | | | $ | 6,808,313 | |
See Notes to Unaudited Condensed Consolidated Financial Statements.
9
Radian Group Inc. and Subsidiaries
Condensed Consolidated Statements of Operations
Balance Sheets (Unaudited)
| | | | | | | | | | | | | | | | | | | | | | | |
| Three Months Ended
September 30, | | Nine Months Ended
September 30, |
| (In thousands, except per-share amounts) | 2020 | | 2019 | | 2020 | | 2019 |
| Revenues: | | | | | | | |
| Net premiums earned (Note 8) | $ | 286,471 | | | $ | 281,185 | | | $ | 813,181 | | | $ | 843,863 | |
| Services revenue (Note 4) | 33,943 | | | 42,509 | | | 93,945 | | | 114,565 | |
| Net investment income | 36,255 | | | 42,756 | | | 115,922 | | | 130,364 | |
| Net gains (losses) on investments and other financial instruments | 17,652 | | | 13,009 | | | 42,901 | | | 47,462 | |
| Other income | 913 | | | 879 | | | 2,807 | | | 2,677 | |
| Total revenues | 375,234 | | | 380,338 | | | 1,068,756 | | | 1,138,931 | |
| Expenses: | | | | | | | |
| Provision for losses | 88,084 | | | 29,231 | | | 428,453 | | | 97,412 | |
| Policy acquisition costs | 10,166 | | | 6,435 | | | 23,594 | | | 18,531 | |
| Cost of services | 24,353 | | | 29,044 | | | 64,466 | | | 81,046 | |
| Other operating expenses | 69,377 | | | 76,384 | | | 199,069 | | | 225,235 | |
| | | | | | | |
| Interest expense | 21,088 | | | 13,492 | | | 49,981 | | | 44,150 | |
| Loss on extinguishment of debt | 0 | | | 5,940 | | | 0 | | | 22,738 | |
| | | | | | | |
| Amortization and impairment of other acquired intangible assets | 961 | | | 2,139 | | | 2,919 | | | 6,465 | |
| Total expenses | 214,029 | | | 162,665 | | | 768,482 | | | 495,577 | |
| Pretax income | 161,205 | | | 217,673 | | | 300,274 | | | 643,354 | |
| Income tax provision | 26,102 | | | 44,235 | | | 54,661 | | | 132,229 | |
| Net income | $ | 135,103 | | | $ | 173,438 | | | $ | 245,613 | | | $ | 511,125 | |
| | | | | | | |
| Net Income Per Share: | | | | | | | |
| Basic | $ | 0.70 | | | $ | 0.85 | | | $ | 1.25 | | | $ | 2.45 | |
| Diluted | $ | 0.70 | | | $ | 0.83 | | | $ | 1.25 | | | $ | 2.39 | |
| | | | | | | |
| Weighted-average number of common shares outstanding—basic | 193,176 | | | 203,107 | | | 196,120 | | | 208,561 | |
| Weighted-average number of common and common equivalent shares outstanding—diluted | 194,156 | | | 208,691 | | | 197,247 | | | 213,963 | |
| | | | | | | | | | | | | | |
| (In thousands, except per-share amounts) | | June 30,
2021 | | December 31,
2020 |
| Assets | | | | |
| Investments (Notes 5 and 6) | | | | |
| Fixed-maturities available for sale—at fair value, net of allowance for credit losses of $0 and $948 (amortized cost of $5,349,405 and $5,393,623) | | $ | 5,572,813 | | | $ | 5,723,340 | |
| Trading securities—at fair value (amortized cost of $241,657 and $260,773) | | 267,980 | | | 290,885 | |
| Equity securities—at fair value (cost of $160,224 and $145,501) | | 175,147 | | | 151,240 | |
| Short-term investments—at fair value (includes $32,435 and $15,587 of reinvested cash collateral held under securities lending agreements) | | 662,095 | | | 618,004 | |
| Other invested assets—at fair value | | 3,624 | | | 4,973 | |
| Total investments | | 6,681,659 | | | 6,788,442 | |
| Cash | | 134,939 | | | 87,915 | |
| Restricted cash | | 2,968 | | | 6,231 | |
| Accrued investment income | | 32,223 | | | 34,047 | |
| Accounts and notes receivable | | 153,128 | | | 121,294 | |
| Reinsurance recoverables (includes $7 and $32 for paid losses) | | 75,411 | | | 73,202 | |
| Deferred policy acquisition costs | | 17,873 | | | 18,305 | |
| Property and equipment, net | | 74,288 | | | 80,457 | |
| Goodwill and other acquired intangible assets, net (Note 7) | | 21,318 | | | 23,043 | |
| Other assets (Note 9) | | 815,261 | | | 715,085 | |
| | | | |
| Total assets | | $ | 8,009,068 | | | $ | 7,948,021 | |
| | | | |
| Liabilities and Stockholders’ Equity | | | | |
| Liabilities | | | | |
| Unearned premiums | | $ | 373,031 | | | $ | 448,791 | |
| Reserve for losses and LAE (Note 11) | | 885,498 | | | 848,413 | |
| Senior notes (Note 12) | | 1,407,545 | | | 1,405,674 | |
| FHLB advances (Note 12) | | 153,983 | | | 176,483 | |
| Reinsurance funds withheld | | 285,406 | | | 278,555 | |
| Net deferred tax liability (Note 10) | | 266,330 | | | 213,897 | |
| Other liabilities | | 303,442 | | | 291,855 | |
| Total liabilities | | 3,675,235 | | | 3,663,668 | |
| Commitments and contingencies (Note 13) | | | | |
| Stockholders’ equity | | | | |
| Common stock: par value $0.001 per share; 485,000 shares authorized at June 30, 2021 and December 31, 2020; 207,250 and 210,130 shares issued at June 30, 2021 and December 31, 2020, respectively; 188,290 and 191,606 shares outstanding at June 30, 2021 and December 31, 2020, respectively | | 207 | | | 210 | |
| Treasury stock, at cost: 18,960 and 18,524 shares at June 30, 2021 and December 31, 2020, respectively | | (920,225) | | | (910,115) | |
| Additional paid-in capital | | 2,161,857 | | | 2,245,897 | |
| Retained earnings | | 2,913,138 | | | 2,684,636 | |
| Accumulated other comprehensive income (loss) (Note 15) | | 178,856 | | | 263,725 | |
| Total stockholders’ equity | | 4,333,833 | | | 4,284,353 | |
| Total liabilities and stockholders’ equity | | $ | 8,009,068 | | | $ | 7,948,021 | |
See Notes to Unaudited Condensed Consolidated Financial Statements.
10
Radian Group Inc. and Subsidiaries
Condensed Consolidated Statements of Comprehensive Income
Operations (Unaudited)
| | | | | | | | | | | | | | | | | | | | | | | |
| Three Months Ended
September 30, | | Nine Months Ended
September 30, |
| (In thousands) | 2020 | | 2019 | | 2020 | | 2019 |
| | | | | | | |
| Net income | $ | 135,103 | | | $ | 173,438 | | | $ | 245,613 | | | $ | 511,125 | |
| Other comprehensive income (loss), net of tax (Note 15): | | | | | | | |
| Unrealized gains (losses) on investments: | | | | | | | |
| Unrealized holding gains (losses) arising during the period for which an allowance for expected losses has not been recognized | 30,839 | | | 40,654 | | | 143,602 | | | 190,677 | |
| Less: Reclassification adjustment for net gains (losses) included in net income (loss): | | | | | | | |
| Net realized gains (losses) on disposals and non-credit related impairment losses | 10,884 | | | 3,477 | | | 24,172 | | | 4,115 | |
| Net decrease (increase) in expected credit losses | 147 | | | 0 | | | (2,051) | | | 0 | |
| Net unrealized gains (losses) on investments | 19,808 | | | 37,177 | | | 121,481 | | | 186,562 | |
| | | | | | | |
| | | | | | | |
| | | | | | | |
| Net foreign currency translation adjustments | 0 | | | 0 | | | 0 | | | (3) | |
| | | | | | | |
| Other comprehensive income (loss), net of tax | 19,808 | | | 37,177 | | | 121,481 | | | 186,559 | |
| Comprehensive income | $ | 154,911 | | | $ | 210,615 | | | $ | 367,094 | | | $ | 697,684 | |
| | | | | | | | | | | | | | | | | | | | | | | | | | |
| | Three Months Ended
June 30, | | Six Months Ended
June 30, |
| (In thousands, except per-share amounts) | | 2021 | | 2020 | | 2021 | | 2020 |
| Revenues | | | | | | | | |
| Net premiums earned (Note 8) | | $ | 254,756 | | | $ | 249,295 | | | $ | 526,628 | | | $ | 526,710 | |
| Services revenue (Note 4) | | 29,464 | | | 28,075 | | | 52,359 | | | 60,002 | |
| Net investment income | | 36,291 | | | 38,723 | | | 74,542 | | | 79,667 | |
| Net gains (losses) on investments and other financial instruments | | 15,661 | | | 47,276 | | | 10,480 | | | 25,249 | |
| Other income | | 822 | | | 1,072 | | | 1,798 | | | 1,894 | |
| Total revenues | | 336,994 | | | 364,441 | | | 665,807 | | | 693,522 | |
| | | | | | | | | |
| Expenses | | | | | | | | |
| Provision for losses | | 3,648 | | | 304,418 | | | 49,791 | | | 340,369 | |
| Policy acquisition costs | | 4,838 | | | 6,015 | | | 13,834 | | | 13,428 | |
| Cost of services | | 24,615 | | | 17,972 | | | 44,861 | | | 40,113 | |
| Other operating expenses | | 86,469 | | | 60,582 | | | 156,731 | | | 129,692 | |
| | | | | | | | |
| Interest expense | | 21,065 | | | 16,699 | | | 42,180 | | | 28,893 | |
| | | | | | | | |
| | | | | | | | |
| Amortization and impairment of other acquired intangible assets | | 863 | | | 979 | | | 1,725 | | | 1,958 | |
| Total expenses | | 141,498 | | | 406,665 | | | 309,122 | | | 554,453 | |
| | | | | | | | |
| Pretax income (loss) | | 195,496 | | | (42,224) | | | 356,685 | | | 139,069 | |
| Income tax provision (benefit) | | 40,290 | | | (12,273) | | | 75,871 | | | 28,559 | |
| Net income (loss) | | $ | 155,206 | | | $ | (29,951) | | | $ | 280,814 | | | $ | 110,510 | |
| | | | | | | | | |
| Net Income (Loss) Per Share | | | | | | | | |
| Basic | | $ | 0.80 | | | $ | (0.15) | | | $ | 1.45 | | | $ | 0.56 | |
| Diluted | | $ | 0.80 | | | $ | (0.15) | | | $ | 1.44 | | | $ | 0.56 | |
| | | | | | | | |
| Weighted-average number of common shares outstanding—basic | | 193,436 | | | 193,299 | | | 193,692 | | | 197,545 | |
| Weighted-average number of common and common equivalent shares outstanding—diluted | | 194,638 | | | 193,299 | | | 194,986 | | | 198,746 | |
See Notes to Unaudited Condensed Consolidated Financial Statements.
11
Radian Group Inc. and Subsidiaries
Condensed Consolidated Statements of Changes in Common Stockholders’ Equity
Comprehensive Income (Loss) (Unaudited)
| | | | | | | | | | | | | | | | | | | | | | | |
| Three Months Ended
September 30, | | Nine Months Ended
September 30, |
| (In thousands) | 2020 | | 2019 | | 2020 | | 2019 |
| Common Stock | | | | | | | |
| Balance, beginning of period | $ | 210 | | | $ | 223 | | | $ | 219 | | | $ | 231 | |
| Issuance of common stock under incentive and benefit plans | 0 | | | 0 | | | 2 | | | 1 | |
| Shares repurchased under share repurchase program (Note 14) | 0 | | | (3) | | | (11) | | | (12) | |
| Balance, end of period | 210 | | | 220 | | | 210 | | | 220 | |
| | | | | | | |
| Treasury Stock | | | | | | | |
| Balance, beginning of period | (909,738) | | | (901,419) | | | (901,657) | | | (894,870) | |
| Repurchases of common stock under incentive plans | (7) | | | (137) | | | (8,088) | | | (6,686) | |
| Balance, end of period | (909,745) | | | (901,556) | | | (909,745) | | | (901,556) | |
| | | | | | | |
| Additional Paid-in Capital | | | | | | | |
| Balance, beginning of period | 2,232,949 | | | 2,539,803 | | | 2,449,884 | | | 2,724,733 | |
| Issuance of common stock under incentive and benefit plans | 825 | | | 1,660 | | | 3,096 | | | 4,418 | |
| Share-based compensation | 5,095 | | | 5,169 | | | 12,183 | | | 15,119 | |
| Shares repurchased under share repurchase program (Note 14) | 0 | | | (77,535) | | | (226,294) | | | (275,173) | |
| Balance, end of period | 2,238,869 | | | 2,469,097 | | | 2,238,869 | | | 2,469,097 | |
| | | | | | | |
| Retained Earnings | | | | | | | |
| Balance, beginning of period | 2,450,423 | | | 2,056,175 | | | 2,389,789 | | | 1,719,541 | |
| Net income | 135,103 | | | 173,438 | | | 245,613 | | | 511,125 | |
| Dividends and dividend equivalents declared | (24,450) | | | (506) | | | (74,326) | | | (1,559) | |
| Balance, end of period | 2,561,076 | | | 2,229,107 | | | 2,561,076 | | | 2,229,107 | |
| | | | | | | |
| Accumulated Other Comprehensive Income (Loss) | | | | | | | |
| Balance, beginning of period | 212,161 | | | 88,462 | | | 110,488 | | | (60,920) | |
| Net unrealized gains (losses) on investments, net of tax | 19,808 | | | 37,177 | | | 121,481 | | | 186,562 | |
| Net foreign currency translation adjustment, net of tax | 0 | | | 0 | | | 0 | | | (3) | |
| | | | | | | |
| Balance, end of period | 231,969 | | | 125,639 | | | 231,969 | | | 125,639 | |
| | | | | | | |
| Total Stockholders’ Equity | $ | 4,122,379 | | | $ | 3,922,507 | | | $ | 4,122,379 | | | $ | 3,922,507 | |
| | | | | | | | | | | | | | | | | | | | | | | | | | |
| | Three Months Ended
June 30, | | Six Months Ended
June 30, |
| (In thousands) | | 2021 | | 2020 | | 2021 | | 2020 |
| Net income (loss) | | $ | 155,206 | | | $ | (29,951) | | | $ | 280,814 | | | $ | 110,510 | |
| Other comprehensive income (loss), net of tax (Note 15) | | | | | | | | |
| Unrealized holding gains (losses) on investments arising during the period for which an allowance for expected losses has not been recognized | | 64,477 | | | 185,056 | | | (82,892) | | | 112,763 | |
| Less: Reclassification adjustment for net gains (losses) on investments included in net income (loss) | | | | | | | | |
| Net realized gains (losses) on disposals and non-credit related impairment losses | | 1,876 | | | 4,894 | | | 1,252 | | | 13,288 | |
| Net decrease (increase) in expected credit losses | | 480 | | | (2,198) | | | 725 | | | (2,198) | |
| | | | | | | | |
| | | | | | | | |
| Other comprehensive income (loss), net of tax | | 62,121 | | | 182,360 | | | (84,869) | | | 101,673 | |
| Comprehensive income | | $ | 217,327 | | | $ | 152,409 | | | $ | 195,945 | | | $ | 212,183 | |
See Notes to Unaudited Condensed Consolidated Financial Statements.
12
Radian Group Inc. and Subsidiaries
Condensed Consolidated Statements of Cash Flows
Changes in Common Stockholders’ Equity (Unaudited)
| | | | | | | | | | | |
|
|
| | | |
| (In thousands) | Nine Months Ended
September 30, |
| 2020 | | 2019 |
| Cash Flows from Operating Activities: | | | |
| Net cash provided by (used in) operating activities | $ | 498,756 | | | $ | 506,805 | |
| Cash Flows from Investing Activities: | | | |
| Proceeds from sales of: | | | |
| Fixed-maturities available for sale | 894,998 | | | 770,393 | |
| Trading securities | 11,602 | | | 120,875 | |
| Equity securities | 77,445 | | | 52,295 | |
| Proceeds from redemptions of: | | | |
| Fixed-maturities available for sale | 443,723 | | | 287,557 | |
| Trading securities | 22,112 | | | 36,827 | |
| | | |
| Purchases of: | | | |
| Fixed-maturities available for sale | (2,099,281) | | | (1,352,883) | |
| | | |
| Equity securities | (69,206) | | | (45,748) | |
| Sales, redemptions and (purchases) of: | | | |
| Short-term investments, net | (21,797) | | | (12,199) | |
| Other assets and other invested assets, net | 989 | | | 687 | |
| | | |
| Proceeds from sale of a subsidiary, net of cash sold | 16,481 | | | 0 | |
| Purchases of property and equipment, net | (14,723) | | | (20,707) | |
| | | |
| | | |
| Net cash provided by (used in) investing activities | (737,657) | | | (162,903) | |
| Cash Flows from Financing Activities: | | | |
| Dividends and dividend equivalents paid | (73,365) | | | (1,559) | |
| Issuance of senior notes, net | 515,567 | | | 442,498 | |
| | | |
| Repayments and repurchases of senior notes | 0 | | | (610,739) | |
| | | |
| Issuance of common stock | 1,505 | | | 2,126 | |
| Repurchases of common shares | (226,305) | | | (275,185) | |
| Credit facility commitment fees paid | (1,993) | | | (710) | |
| Change in secured borrowings, net (with terms three months or less) | (19,191) | | | 9,568 | |
| Proceeds from secured borrowings (with terms greater than three months) | 138,909 | | | 73,011 | |
| Repayments of secured borrowings (with terms greater than three months) | (105,977) | | | (37,550) | |
| Repayments of other borrowings | (79) | | | (114) | |
| Net cash provided by (used in) financing activities | 229,071 | | | (398,654) | |
| Effect of exchange rate changes on cash and restricted cash | 0 | | | (4) | |
| Increase (decrease) in cash and restricted cash | (9,830) | | | (54,756) | |
| Cash and restricted cash, beginning of period | 96,274 | | | 107,002 | |
| Cash and restricted cash, end of period | $ | 86,444 | | | $ | 52,246 | |
| | | | | | | | | | | | | | | | | | | | | | | | | | |
| | Three Months Ended
June 30, | | Six Months Ended
June 30, |
| (In thousands) | | 2021 | | 2020 | | 2021 | | 2020 |
| Common Stock | | | | | | | | |
| Balance, beginning of period | | $ | 210 | | | $ | 208 | | | $ | 210 | | | $ | 219 | |
| Issuance of common stock under incentive and benefit plans | | 1 | | | 2 | | | 1 | | | 2 | |
| Shares repurchased under share repurchase program (Note 14) | | (4) | | | 0 | | | (4) | | | (11) | |
| Balance, end of period | | 207 | | | 210 | | | 207 | | | 210 | |
| | | | | | | | | |
| Treasury Stock | | | | | | | | |
| Balance, beginning of period | | (910,347) | | | (902,024) | | | (910,115) | | | (901,657) | |
| Repurchases of common stock under incentive plans | | (9,878) | | | (7,714) | | | (10,110) | | | (8,081) | |
| Balance, end of period | | (920,225) | | | (909,738) | | | (920,225) | | | (909,738) | |
| | | | | | | | | |
| Additional Paid-in Capital | | | | | | | | |
| Balance, beginning of period | | 2,242,950 | | | 2,231,670 | | | 2,245,897 | | | 2,449,884 | |
| Issuance of common stock under incentive and benefit plans | | 770 | | | 36 | | | 1,937 | | | 2,271 | |
| Share-based compensation | | 8,191 | | | 1,243 | | | 12,714 | | | 7,088 | |
| Shares repurchased under share repurchase program (Note 14) | | (90,054) | | | 0 | | | (98,691) | | | (226,294) | |
| Balance, end of period | | 2,161,857 | | | 2,232,949 | | | 2,161,857 | | | 2,232,949 | |
| | | | | | | | | |
| Retained Earnings | | | | | | | | |
| Balance, beginning of period | | 2,785,744 | | | 2,504,853 | | | 2,684,636 | | | 2,389,789 | |
| Net income (loss) | | 155,206 | | | (29,951) | | | 280,814 | | | 110,510 | |
| Dividends and dividend equivalents declared | | (27,812) | | | (24,479) | | | (52,312) | | | (49,876) | |
| Balance, end of period | | 2,913,138 | | | 2,450,423 | | | 2,913,138 | | | 2,450,423 | |
| | | | | | | | |
| Accumulated Other Comprehensive Income (Loss) | | | | | | | | |
| Balance, beginning of period | | 116,735 | | | 29,801 | | | 263,725 | | | 110,488 | |
| Net unrealized gains (losses) on investments, net of tax | | 62,121 | | | 182,360 | | | (84,869) | | | 101,673 | |
| | | | | | | | |
| Balance, end of period | | 178,856 | | | 212,161 | | | 178,856 | | | 212,161 | |
| | | | | | | | |
| Total Stockholders’ Equity | | $ | 4,333,833 | | | $ | 3,986,005 | | | $ | 4,333,833 | | | $ | 3,986,005 | |
See Notes to Unaudited Condensed Consolidated Financial Statements.
13
Radian Group Inc. and Subsidiaries
Condensed Consolidated Statements of Cash Flows (Unaudited)
| | | | | | | | | | | | | | |
| | Six Months Ended
June 30, |
| (In thousands) | | 2021 | | 2020 |
| Cash Flows from Operating Activities | | | | |
| Net cash provided by (used in) operating activities | | $ | 275,896 | | | $ | 305,291 | |
| | | | |
| Cash Flows from Investing Activities | | | | |
| Proceeds from sales of: | | | | |
| Fixed-maturities available for sale | | 329,072 | | | 735,154 | |
| Trading securities | | 7,952 | | | 11,602 | |
| Equity securities | | 4,440 | | | 75,793 | |
| Proceeds from redemptions of: | | | | |
| Fixed-maturities available for sale | | 619,265 | | | 271,477 | |
| Trading securities | | 10,606 | | | 17,810 | |
| Purchases of: | | | | |
| Fixed-maturities available for sale | | (944,618) | | | (1,216,333) | |
| | | | |
| Equity securities | | (61,235) | | | (65,427) | |
| Sales, redemptions and (purchases) of: | | | | |
| Short-term investments, net | | (41,925) | | | (418,744) | |
| Other assets and other invested assets, net | | 5,043 | | | 2,346 | |
| Proceeds from sale of subsidiary, net of cash sold | | 0 | | | 16,481 | |
| Purchases of property and equipment | | (4,993) | | | (10,594) | |
| | | | |
| Net cash provided by (used in) investing activities | | (76,393) | | | (580,435) | |
| | | | |
| Cash Flows from Financing Activities | | | | |
| Dividends and dividend equivalents paid | | (52,036) | | | (49,301) | |
| Issuance of senior notes, net | | 0 | | | 516,083 | |
| | | | |
| Issuance of common stock | | 1,112 | | | 1,480 | |
| Repurchases of common shares | | (98,695) | | | (226,305) | |
| Credit facility commitment fees paid | | (471) | | | (1,754) | |
| Change in secured borrowings, net (with terms three months or less) | | 4,348 | | | (17,535) | |
| Proceeds from secured borrowings (with terms greater than three months) | | 32,000 | | | 106,960 | |
| Repayments of secured borrowings (with terms greater than three months) | | (42,000) | | | (66,013) | |
| Repayments of other borrowings | | 0 | | | (79) | |
| Net cash provided by (used in) financing activities | | (155,742) | | | 263,536 | |
| | | | |
| Increase (decrease) in cash and restricted cash | | 43,761 | | | (11,608) | |
| Cash and restricted cash, beginning of period | | 94,146 | | | 96,274 | |
| Cash and restricted cash, end of period | | $ | 137,907 | | | $ | 84,666 | |
See Notes to Unaudited Condensed Consolidated Financial Statements
Statements.
14
| | | | | |
| Radian Group Inc.
Notes to Unaudited Condensed Consolidated Financial Statements
|
1. Description of Business Overview and Recent Developments
Business Overview
We are a diversified mortgage and real estate business, providing both credit-related mortgage insurance coverage and a broad array of other mortgage, risk, title, valuation, asset management, SaaS and other real estate services. We have 2 reportable business segments—Mortgage and Real Estate.homegenius. Our homegenius segment was previously named “Real Estate” and during the second quarter of 2021 we renamed it “homegenius” to align with updates to our branding strategy for the segment’s products and services.
Mortgage
Our Mortgage segment provides credit-related insurance coverage, principally through private mortgage insurance on residential first-lien mortgage loans, as well as other credit risk management, and contract underwriting and fulfillment solutions, to mortgage lending institutions and mortgage credit investors. We provide our mortgage insurance products and services mainly through our wholly-owned subsidiary, Radian Guaranty. Private mortgage insurance plays an important role in the U.S. housing finance system because it promotes affordable home ownership and helps protect mortgage lenders and investors, andas well as other beneficiaries, by mitigating default-related losses on residential mortgage loans. Generally, these loans are made to homebuyers who make down payments of less than 20% of the purchase price for their home or, in the case of refinancings, have less than 20% equity in their home. Private mortgage insurance also facilitates the sale of these low down payment loans in the secondary mortgage market, most of which are currently sold to the GSEs. Our total direct primary mortgage IIF and RIF were $245.5$237.3 billion and $61.0$58.0 billion, respectively, as of SeptemberJune 30, 2020,2021, compared to $240.6$246.1 billion and $60.9$60.7 billion, respectively, as of December 31, 2019.2020. In addition to providing private mortgage insurance, we participate in credit risk transfer programs developed by the GSEs as part of their initiative to distribute mortgage credit risk and increase the role of private capital in the mortgage market. Our additional RIF under credit risk transfer transactions, resulting from our participation in these programs with the GSEs, totaled $389.1$434.7 million as of SeptemberJune 30, 20202021 compared to $275.2$392.0 million as of December 31, 2019.2020.
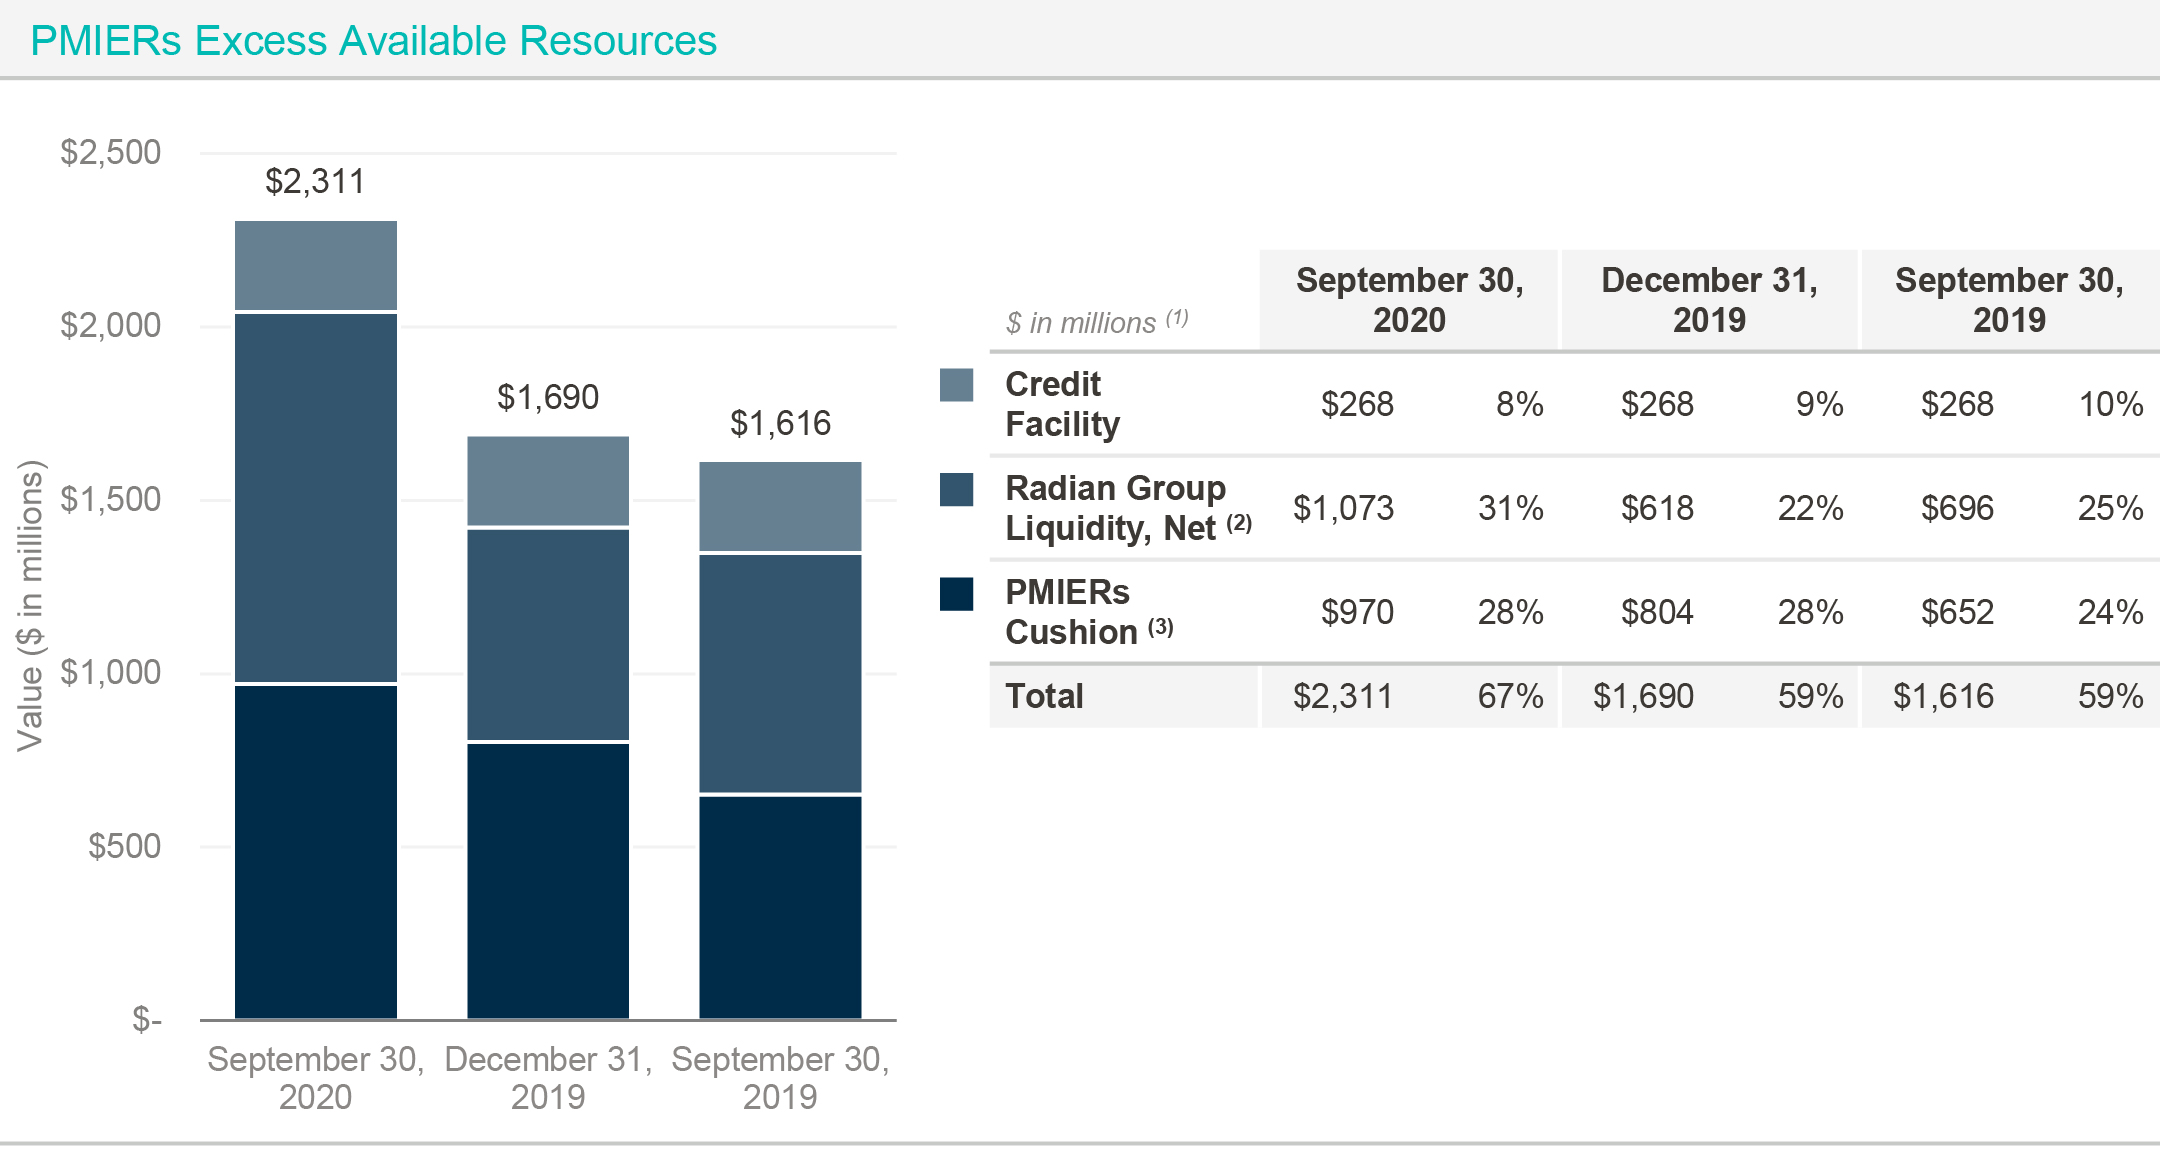
The GSEs and state insurance regulators impose various capital and financial requirements on our mortgage insurance subsidiaries. These include Risk-to-capital, other risk-based capital measures and surplus requirements, as well as the PMIERs financial requirements. Failure to comply with these capital and financial requirements may limit the amount of insurance that our mortgage insurance subsidiaries write or may prohibit them from writing insurance altogether. The GSEs and state insurance regulators possess significant discretion with respect to our mortgage insurance subsidiaries and all aspects of their business. See Note 16 for additional information on PMIERs and other regulatory information, and “—Recent Developments” below for a discussion of the elevated risks posed by the COVID-19 pandemic, which has led to an increase in mortgage defaults in our insured portfolio and a resulting increase in our Minimum Required Assets during 2020.Assets.
Real Estatehomegenius
Our Real Estatehomegenius segment is primarily a fee-for-service business that offers a broad array of products and services to market participants across the real estate value chain. Our Real Estatehomegenius products and services include title, valuation, asset management, SaaS and other real estate services offered primarily to financial institutions,mortgage lenders, mortgage and real estate investors, GSEs, real estate brokers and agents. Our Real EstateThese products and services help lenders, investors, consumers and real estate agents evaluate, manage, monitor, acquire and sell properties. These products and services include software as a serviceSaaS solutions and platforms, as well as managed services, such as real estate owned asset management, single family rental services real estate valuation services and real estate brokeragevaluation services. In addition, we provide title insurance and non-insurance title, closing and settlement services to mortgage lenders, GSEs and mortgage investors, as well as directly to consumers for residential mortgage loans.
See Note 4 for additional information about our reportable segments and All Other business activities, including the sale of Clayton and the impact of organizational changes in the first quarter of 2020.activities.
Recent Developments
As a seller of mortgage credit protection, our results are subject to macroeconomic conditions and specific events that impact the housing finance and real estate markets, including events that impact mortgage originations and the credit performance of our RIF. Many of these conditions are beyond our control, including housing prices, unemployment, levels, interest rate changes, the availability of credit and other factors that may be derived from national and regional economic conditions. In general, a deterioration in economic conditions increases the likelihood that borrowers will be unable to satisfy their mortgage obligations. A deteriorating economy can adversely affect housing values, which in turn can influence the willingness of borrowers to continue to make mortgage payments regardless of whether they have the financial resources to do so. Mortgage defaults can also occur due to a variety of specific events affecting borrowers, including death or illness, divorce or other family problems, unemployment, or other events. In addition, factors impacting regional economic conditions, acts of terrorism, war or other severe conflicts, event-specific economic depressions or other catastrophic events such as natural disasters and
Radian Group Inc.
Notes to Unaudited Condensed Consolidated Financial Statements (Continued)
pandemics could result in increased defaults due to the impact of such events on the ability of borrowers to satisfy their mortgage obligations and on the value of affected homes.
Beginning in March 2020, the
| | | | | |
| Radian Group Inc.
Notes to Unaudited Condensed Consolidated Financial Statements
|
The unprecedented and continually evolving social and economic impacts associated with the COVID-19 pandemic on the U.S. and global economies generally, and in particular on the U.S. housing, real estate and housing finance markets, had a negative effect on our business and our financial results for the second quarter of 2020, and since then to a lesser extent the third quarter of 2020, and are expected to adversely impact our business and results of operations in future periods.extent. Specifically, and primarily as a result of an increase in the number of new defaults forsince the nine months ended September 30, 2020,start of the pandemic, our financial results include:have included: (i) an increase in provision for losses and (ii) an increase in our Minimum Required Assets required under the PMIERs. TheWhile the number of new defaults increased significantly during the second quarter of 2020, and while the new defaults during the third quarter remain elevated compared to levels before the pandemic, they decreased by 67.5% from the prior quarter.have subsequently trended down. See Note 11 for additional information on our reserve for losses. In response to the uncertainties associated with COVID-19, during the second quarter
We expect that certain future developments, such as anticipated increases in our claims paid once current foreclosure moratoriums are lifted, will have an adverse impact on aspects of 2020 we strengthened our capital and liquidity positions by extending our existing credit facility and issuing $525 million aggregate principal amount of Senior Notes due 2025. See Note 12 for additional information on our borrowings and financing activities.business in future periods. The ultimate significancelong-term impact of the COVID-19 pandemic on our businesses will depend on, among other things: the extent and duration of the pandemic, the severity of illness and number of people infected with the virus and whether an effectivethe acceptance and long-term effectiveness of anti-viral treatment or vaccine is developedtreatments and made widely available;vaccines, especially as new strains of COVID-19 have emerged; the wider economic effects of the pandemic and the scope and duration of governmental and other third partythird-party measures restricting day-to-day life and business operations; the impact of economic stimulus efforts to support the economy through the pandemic; and governmental and GSE programs implemented to assist borrowers experiencing a COVID-19-related hardship, including forbearance programs and suspensions of foreclosures and evictions. Although we are uncertain of the potential magnitude or duration of the business and economic impacts of the COVID-19 pandemic, these and other factors, including those discussed in our 20192020 Form 10-K, could continue to have a material negative effect on the Company’s business, liquidity, results of operations and financial condition.
2. Significant Accounting Policies
Basis of Presentation
Our condensed consolidated financial statements are prepared in accordance with GAAP and include the accounts of Radian Group Inc. and its subsidiaries. All intercompany accounts and transactions, and intercompany profits and losses, have been eliminated. We have condensed or omitted certain information and footnote disclosures normally included in consolidated financial statements prepared in accordance with GAAP pursuant to the instructions set forth in Article 10 of Regulation S-X of the SEC.
We refer to Radian Group Inc. together with its consolidated subsidiaries as “Radian,” the “Company,” “we,” “us” or “our,” unless the context requires otherwise. We generally refer to Radian Group Inc. alone, without its consolidated subsidiaries, as “Radian Group.” Unless otherwise defined in this report, certain terms and acronyms used throughout this report are defined in the Glossary of Abbreviations and Acronyms included as part of this report.
The financial information presented for interim periods is unaudited; however, such information reflects all adjustments that are, in the opinion of management, necessary for the fair statement of the financial position, results of operations, comprehensive income (loss) and cash flows for the interim periods presented. Such adjustments are of a normal recurring nature. The year-end condensed balance sheet data was derived from our audited financial statements, but does not include all disclosures required by GAAP.
To fully understand the basis of presentation, these interim financial statements and related notes contained herein should be read in conjunction with the audited financial statements and notes thereto included in our 20192020 Form 10-K. The results of operations for interim periods are not necessarily indicative of results to be expected for the full year or for any other period. See Note 1 for discussion of the elevated risks to our future business, liquidity, results of operations and financial condition due to the COVID-19 pandemic.
Certain prior period amounts have been reclassified to conform to current period presentation. See Note 4 for additional information on ourpresentation, including: (i) certain balance sheet line items now reported in other assets and (ii) certain segment reporting reclassifications.balances due to changes in the composition of our segments during 2020.
Use of Estimates
The preparation of financial statements in conformity with GAAP requires us to make estimates and assumptions that affect the reported amounts of assets and liabilities and disclosure of our contingent assets and liabilities at the dates of the financial statements, as well as the reported amounts of revenues and expenses during the reporting periods. While the amounts included in our condensed consolidated financial statements include our best estimates and assumptions, actual results may vary materially.
Radian Group Inc.
Notes to Unaudited Condensed Consolidated Financial Statements (Continued)
Other Significant Accounting Policies
See Note 2 of Notes to Consolidated Financial Statements in our 20192020 Form 10-K for information regarding other significant accounting policies. There have been no significant changes in our significant accounting policies from those
| | | | | |
| Radian Group Inc.
Notes to Unaudited Condensed Consolidated Financial Statements
|
discussed in our 20192020 Form 10-K, other than described below in “—Investments” and “—Recent Accounting Pronouncements—Accounting Standards Adopted During 2020.2021.”
Investments
Investments in fixed-maturity securities not classified as held to maturity or trading securities are classified as available for sale and are reported at fair value, with unrealized gains and losses (net of tax) reported as a separate component of stockholders’ equity as accumulated other comprehensive income (loss), unless: (i) we intend to sell the impaired security; (ii) it is more likely than not that we will be required to sell the impaired security prior to recovery of its amortized cost basis; or (iii) the present value of cash flows we expect to collect is less than the amortized cost basis of a security. In those instances, we record an impairment loss through earnings that varies depending on specific circumstances, as described below.
If a sale is likely, the full amount of the impairment is recognized as a loss in the statement of operations. Otherwise, unrealized losses on securities are separated into: (i) the portion of loss that represents the credit loss and (ii) the portion that is due to other factors. As a result of the adoption, effective January 2020, of ASU 2016-13, Financial Instruments—Credit Losses (“ASU 2016-13”), described below, in evaluating whether a decline in value for other securities relates to an existing credit loss, we consider several factors, including, but not limited to, the following:
■the extent to which the amortized cost basis is greater than fair value;
■reasons for the decline in value (e.g., adverse conditions related to industry or geographic area, changes in financial condition to the issuers or underlying loan obligors);
■any changes to the rating of the security by a rating agency;
■the failure of the issuer to make a scheduled payment;
■the financial position, access to capital and near-term prospects of the issuer, including the current and future impact of any specific events; and
■our best estimate of the present value of cash flows expected to be collected.
In addition, we no longer consider the duration of the decline in value in assessing whether our fixed income securities available for sale have a credit loss impairment.
On initial recognition and at each reporting date after a credit loss is identified, we recognize an allowance for remaining lifetime expected credit losses. This amount is calculated as the difference between the amortized cost and the present value of future expected cash flows, limited to the difference between the carrying amount (i.e., fair value) and amortized cost. If a credit loss is determined to exist, the credit loss impairment is included in net gains (losses) on investments and other financial instruments in the statement of operations, with an offset to an allowance for credit losses. Subsequent changes (favorable and unfavorable) in expected credit losses are recognized immediately in net income (loss) as a credit loss impairment or a reversal of credit loss impairment.
Recent Accounting Pronouncements
Accounting Standards Adopted During 20202021
In December 2019, the FASB issued ASU 2019-12, Income Taxes—Simplifying the Accounting for Income Taxes. This update simplifies the accounting for income taxes by removing certain exceptions to the general principles of ASC Topic 740 in GAAP and clarifies certain aspects to promote consistency among reporting entities. We adopted ASU 2016-13 onthis update effective January 1, 2020 using the modified retrospective2021. The adoption approach. This ASU and the associated subsequent amendments require that financial assets measured at their amortized cost basis be presented at the net amount expected to be collected. Credit losses relating to our available-for-sale debt securities are recorded through an allowance for credit losses, rather than a write-down of the asset, with the amount of the allowance limited to the amount by which fair value is less than amortized cost. This allowance method will allow reversals of credit losses if the estimate of credit losses declines. This ASU affected certain of our accounts and notes receivable, including premiums receivable, and certain of our other assets, including reinsurance recoverables; however, thethis update did not have a material effectan impact on our financial statements and disclosures. See Note 6
In October 2020, the FASB issued ASU 2020-08, Codification Improvements to Subtopic 310-20, Receivables—Nonrefundable Fees and Other Costs. This update clarifies that, for additional information.
each reporting period, to the extent the amortized cost basis of an individual callable debt security exceeds the amount repayable by the issuer at the next call date, the excess (i.e., the premium) should be amortized to the next call date. We adopted ASU 2019-04, Codification Improvements related to Financial Instruments—Credit Losses, Derivatives and Hedging, and Financial Instruments2020-08 on January 1, 2020. This update to the accounting standards regarding financial instruments and derivatives and hedging clarifies the accounting treatment for the measurement of credit losses and provides further clarification2021 on previously issued updates.a prospective basis. The adoption of this update did not have a material effectimpact on our financial statements and disclosures.
Radian Group Inc.
Notes to Unaudited Condensed Consolidated Financial Statements (Continued)
Accounting Standards Not Yet Adopted
In August 2018, the FASB issued ASU 2018-12, Financial Services—Insurance. The new standard: (i) requires that assumptions used to measure the liability for future policy benefits be reviewed at least annually; (ii) defines and simplifies the measurement of market risk benefits; (iii) simplifies the amortization of deferred acquisition costs; and (iv) enhances the required disclosures about long-duration contracts. This update is effective for fiscal years beginning after December 15, 2022, including interim periods within those fiscal years. Early adoption is permitted. We are currently evaluating the impact on our financial statements and future disclosures as a result of this update.
In December 2019, the FASB issued ASU 2019-12, Income Taxes—Simplifying the Accounting for Income Taxes. This update simplifies the accounting for income taxes by removing certain exceptions to the general principals of ASC Topic 740 in GAAP. This update is effective for fiscal years beginning after December 15, 2020, including interim periods within those fiscal years. Early adoption is permitted. We are currently evaluating the impact on our financial statements and future disclosures as a result of this update.
In March 2020, the FASB issued ASU 2020-04, Reference Rate Reform—Facilitation of the Effects of Reference Reform on Financial Reporting. This update provides optional expedients and exceptions for applying GAAP to contracts, hedging relationships, and other transactions affected by reference rate reform. The amendments in this update are optional and may be elected from the date of issuance through December 31, 2022, as reference rate reform activities occur. We are currently evaluating the impact of the guidance and our options related to the practical expedients.
In October 2020, the FASB issued ASU 2020-08, Codification Improvements to Subtopic 310-20, Receivables—Nonrefundable Fees and Other Costs. This update clarifies that an entity should reevaluate whether a callable debt security is within the scope of ASC paragraph 310-20-35-33 for each reporting period. This update is effective for fiscal years beginning after December 15, 2020, including interim periods within those fiscal years. Early adoption is not permitted. Entities are required to apply ASU 2020-08 on a prospective basis as of the beginning of the period of adoption for existing or newly purchased callable debt securities. We are currently evaluating the impact on our financial statements and future disclosures as a result of this update.
| | | | | |
| Radian Group Inc.
Notes to Unaudited Condensed Consolidated Financial Statements
|
3. Net Income (Loss) Per Share
Basic net income (loss) per share is computed by dividing net income (loss) by the weighted-average number of common shares outstanding, while diluted net income (loss) per share is computed by dividing net income (loss) attributable to common stockholders by the sum of the weighted-average number of common shares outstanding and the weighted-average number of dilutive potential common shares. Dilutive potential common shares relate to our share-based compensation arrangements.
The calculation of basic and diluted net income (loss) per share is as follows:follows.
| | | | | | | | | | | | | | | | | | | | | | | |
| Three Months Ended
September 30, | | Nine Months Ended
September 30, |
| (In thousands, except per-share amounts) | 2020 | | 2019 | | 2020 | | 2019 |
| Net income —basic and diluted | $ | 135,103 | | | $ | 173,438 | | | $ | 245,613 | | | $ | 511,125 | |
| | | | | | | |
Average common shares outstanding—basic (1) | 193,176 | | | 203,107 | | | 196,120 | | | 208,561 | |
Dilutive effect of share-based compensation arrangements (2) | 980 | | | 5,584 | | | 1,127 | | | 5,402 | |
| Adjusted average common shares outstanding—diluted | 194,156 | | | 208,691 | | | 197,247 | | | 213,963 | |
| | | | | | | |
| Net income per share: | | | | | | | |
| | | | | | | |
| Basic | $ | 0.70 | | | $ | 0.85 | | | $ | 1.25 | | | $ | 2.45 | |
| | | | | | | |
| Diluted | $ | 0.70 | | | $ | 0.83 | | | $ | 1.25 | | | $ | 2.39 | |
______________________ | | | | | | | | | | | | | | | | | | | | | | | | | | |
| Net income (loss) per share |
| | | | | | | | |
| | Three Months Ended
June 30, | | Six Months Ended
June 30, |
| (In thousands, except per-share amounts) | | 2021 | | 2020 | | 2021 | | 2020 |
| Net income (loss)—basic and diluted | | $ | 155,206 | | | $ | (29,951) | | | $ | 280,814 | | | $ | 110,510 | |
| | | | | | | | |
| Average common shares outstanding—basic | | 193,436 | | | 193,299 | | | 193,692 | | | 197,545 | |
Dilutive effect of share-based compensation arrangements (1) | | 1,202 | | | 0 | | | 1,294 | | | 1,201 | |
| Adjusted average common shares outstanding—diluted | | 194,638 | | | 193,299 | | | 194,986 | | | 198,746 | |
| | | | | | | | |
| Net income (loss) per share: | | | | | | | | |
| Basic | | $ | 0.80 | | | $ | (0.15) | | | $ | 1.45 | | | $ | 0.56 | |
| Diluted | | $ | 0.80 | | | $ | (0.15) | | | $ | 1.44 | | | $ | 0.56 | |
(1)IncludesThere were 0 dilutive shares for the impactthree months ended June 30, 2020, as a result of fully vested shares under our share-based compensation programs.
(2)net loss for the period. The following number of shares of our common stock equivalents issued under our share-based compensation arrangements are not included in the calculation of diluted net income (loss) per share because they are anti-dilutive: | | | | | | | | | | | | | | | | | | | | | | | |
| Three Months Ended
September 30, | | Nine Months Ended
September 30, |
| (In thousands) | 2020 | | 2019 | | 2020 | | 2019 |
| Shares of common stock equivalents | 710 | | | 0 | | | 1,046 | | | 160 | |
| | | | | | | |
Glossary | | | | | | | | | | | | | | | | | | | | | | | | | | |
| | Three Months Ended
June 30, | | Six Months Ended
June 30, |
| (In thousands) | | 2021 | | 2020 | | 2021 | | 2020 |
| Shares of common stock equivalents | | 0 | | | 2,295 | | | 0 | | | 1,213 | |
Radian Group Inc.
Notes to Unaudited Condensed Consolidated Financial Statements (Continued)
4. Segment Reporting
We have 2 strategic business units that we manage separately—Mortgage and Real Estate.homegenius. Our Mortgage segment derives its revenue from mortgage insurance and other mortgage and risk services, including contract underwriting servicesand fulfillment solutions provided to lenders.mortgage lending institutions and mortgage credit investors. Our Real Estatehomegenius segment offers a broad array of title, valuation, asset management, SaaS and other real estate services to market participants across themortgage lenders, mortgage and real estate value chain.investors, GSEs, real estate brokers and agents. In addition, we report as All Other activities that includeinclude: (i) income (losses) from assets held by our holding company,company; (ii) related general corporate operating expenses not attributable or allocated to our reportable segments and,segments; (iii) for all periods through the first quarter ofits sale in January 2020, income and expenses related to Clayton priorClayton; (iv) for all periods presented, the income and expenses related to its saleour traditional appraisal services, which we wound down beginning in January 2020.the fourth quarter of 2020; and (v) certain other immaterial revenue and expense items.
SubsequentAs described in Note 4 of Notes to Consolidated Financial Statements in our 2020 Form 10-K, we implemented several changes to our segment reporting in 2020, including related to the salewind down of Clayton, our Chief Executive Officer (Radian’s chief operating decision maker) implemented certain organizationaltraditional appraisal business announced in the fourth quarter of 2020. All changes that causedto the composition of our reportable segments to change. As revised, the Company’s Mortgage and Real Estate segments are managed by our President of Mortgage and Co-Heads of Real Estate, respectively, who are responsible for the overall profitability of their respective segments and who are directly accountable to our chief operating decision maker.
The differences in the basis of segmentation compared to our 2019 Form 10-K are as follows:
| | | | | | | | |
Business Activity | Current Segmentation | Prior Segmentation |
Mortgage insurance and risk services | Mortgage | Mortgage Insurance |
Contract underwriting services | Mortgage | Services |
Title and real estate services (1)
| Real Estate | Services |
Clayton | All Other | Services |
Income (loss) from holding company assets (and related corporate expenses) | All Other | Mortgage Insurance |
______________________
(1)Includes single family rental services.
These segment reporting changes align with the changes in personnel reporting lines, management oversight and branding following the sale of Clayton, and are consistent with the way our chief operating decision maker began assessing the performance of our reportable segments and other business activities effective in the first quarter of 2020. These changes to our reportable segments have been reflected in our segment operating results for all periods presented. See Note 1 for additional details about
During the second quarter of 2021, our Mortgage and Real Estate businesses.segment was renamed “homegenius” to align with updates to our branding strategy for the segment’s products and services. The homegenius segment name change had no impact on the composition of our segments or on our previously reported historical financial position, results of operations, cash flow or segment level results.
We allocate corporate operating expenses to both reportable segments based on each segment’s forecasted annual percentage of total revenue, which approximates the estimated percentage of management time spent on each segment. In addition, we allocate all corporate interest expense to our Mortgage segment, due to the capital-intensive nature of our mortgage insurance business.
| | | | | |
| Radian Group Inc.
Notes to Unaudited Condensed Consolidated Financial Statements
|
With the exception of goodwill and other acquired intangible assets that relate to our Real Estatehomegenius segment, which are reviewed as part of our annual goodwill impairment assessment, we do not manage assets by segment.
See Note 1 for additional details about our Mortgage and homegenius businesses.
Adjusted Pretax Operating Income (Loss)
Our senior management, including our Chief Executive Officer (Radian’s chief operating decision maker,maker), uses adjusted pretax operating income (loss) as our primary measure to evaluate the fundamental financial performance of each of Radian’s business segments and to allocate resources to the segments. Adjusted pretax operating income (loss) is defined as pretax income (loss) excluding the effects of: (i) net gains (losses) on investments and other financial instruments; (ii) loss on extinguishment of debt; (iii) amortization and impairment of goodwill and other acquired intangible assets; and (iv) impairment of other long-lived assets and other non-operating items, such as impairment of internal-use software, gains (losses) from the sale of lines of business and acquisition-related income and expenses. See Note 4 of Notes to Consolidated Financial Statements in our 20192020 Form 10-K for detailed information regarding items excluded from adjusted pretax operating income (loss), including the reasons for their treatment.
Although adjusted pretax operating income (loss) excludes certain items that have occurred in the past and are expected to occur in the future, the excluded items represent those that are: (i) not viewed as part of the operating performance of our primary activities or (ii) not expected to result in an economic impact equal to the amount reflected in pretax income (loss).
Adjusted pretax operating income (loss) for each segment represents segment results on a standalone basis; therefore, inter-segment eliminations and reclassifications required for consolidated GAAP presentation have not been reflected. Inter-segment activities are recorded at market rates for segment reporting and eliminated in consolidation.
Radian Group Inc.
Notes to Unaudited Condensed Consolidated Financial Statements (Continued)
The reconciliation of adjusted pretax operating income (loss) for our reportable segments to consolidated pretax income (loss) is as follows:follows.
| | | | | | | | | | | | | | | | | | | | | | | | | | |
| Three Months Ended
September 30, | | Nine Months Ended
September 30, | |
| (In thousands) | 2020 | | 2019 | | 2020 | | 2019 | |
| Adjusted pretax operating income (loss): | | | | | | | | |
Mortgage (1) | $ | 145,836 | | | $ | 209,601 | | | $ | 263,182 | | | $ | 627,942 | | (2) |
Real Estate (3) | (5,941) | | | (2,541) | | | (15,625) | | | (10,238) | | |
| Total adjusted pretax operating income (loss) for reportable segments | 139,895 | | | 207,060 | | | 247,557 | | | 617,704 | | |
| All Other adjusted pretax operating income (loss) | 5,085 | | | 5,683 | | | 13,523 | | | 12,948 | | |
| Net gains (losses) on investments and other financial instruments | 17,652 | | | 13,009 | | | 42,901 | | | 47,462 | | |
| Loss on extinguishment of debt | 0 | | | (5,940) | | | 0 | | | (22,738) | | |
| Amortization and impairment of other acquired intangible assets | (961) | | | (2,139) | | | (2,919) | | | (6,465) | | |
| Impairment of other long-lived assets and other non-operating items | (466) | | | 0 | | | (788) | | | (5,557) | | |
| Consolidated pretax income | $ | 161,205 | | | $ | 217,673 | | | $ | 300,274 | | | $ | 643,354 | | |
______________________ | | | | | | | | | | | | | | | | | | | | | | | | | | |
| Reconciliation of adjusted pretax operating income (loss) by segment |
| | | | | | | | |
| | Three Months Ended
June 30, | | Six Months Ended
June 30, |
| (In thousands) | | 2021 | | 2020 | | 2021 | | 2020 |
| Adjusted pretax operating income (loss) | | | | | | | | |
| Mortgage | | $ | 191,462 | | | $ | (85,821) | | | $ | 365,749 | | | $ | 119,846 | |
| homegenius | | (9,198) | | | (3,909) | | | (19,651) | | | (7,062) | |
Total adjusted pretax operating income (loss) for reportable segments (1) | | 182,264 | | | (89,730) | | | 346,098 | | | 112,784 | |
| All Other adjusted pretax operating income (loss) | | 2,455 | | | 1,231 | | | 5,937 | | | 3,316 | |
| Net gains (losses) on investments and other financial instruments | | 15,661 | | | 47,276 | | | 10,480 | | | 25,249 | |
| | | | | | | | |
| Amortization and impairment of other acquired intangible assets | | (863) | | | (979) | | | (1,725) | | | (1,958) | |
| Impairment of other long-lived assets and other non-operating items | | (4,021) | | | (22) | | | (4,105) | | | (322) | |
| Consolidated pretax income (loss) | | $ | 195,496 | | | $ | (42,224) | | | $ | 356,685 | | | $ | 139,069 | |
(1)Includes allocated corporate operating expenses and depreciation expense as follows:follows.
| | | | | | | | | | | | | | | | | | | | | | | | | | |
| Three Months Ended
September 30, | | Nine Months Ended
September 30, | |
| (In thousands) | 2020 | | 2019 | | 2020 | | 2019 | |
| Allocated corporate operating expenses | $ | 29,435 | | | $ | 26,671 | | | $ | 83,700 | | | $ | 76,684 | | |
| Depreciation expense | 2,895 | | | 3,817 | | | 9,719 | | | 11,528 | | |
(2)Includes a cumulative adjustment to unearned premiums recorded in the second quarter of 2019, as further described below.
(3)Includes allocated corporate operating expenses and depreciation expense as follows:
| | | | | | | | | | | | | | | | | | | | | | | | | | |
| Three Months Ended
September 30, | | Nine Months Ended
September 30, | |
| (In thousands) | 2020 | | 2019 | | 2020 | | 2019 | |
| Allocated corporate operating expenses | $ | 3,818 | | | $ | 2,910 | | | $ | 10,993 | | | $ | 8,364 | | |
| Depreciation expense | 683 | | | 561 | | | 2,125 | | | 1,769 | | |
Our results for the nine months ended September 30, 2019 include a $32.9 million increase in net premiums earned and a $0.12 increase in net income per share due to a reduction in our unearned premiums, resulting from a cumulative adjustment in the second quarter of 2019 related to an update to the amortization rates used to recognize revenue for Single Premium Policies. See Note 2 of Notes to Consolidated Financial Statements in our 2019 Form 10-K for additional information regarding this adjustment and our accounting policies for insurance premiums revenue recognition. | | | | | | | | | | | | | | | | | | | | | | | | | | |
| | Three Months Ended
June 30, | | Six Months Ended
June 30, |
| (In thousands) | | 2021 | | 2020 | | 2021 | | 2020 |
| Mortgage | | | | | | | | |
| Allocated corporate operating expenses | | $ | 33,000 | | | $ | 25,359 | | | $ | 60,884 | | | $ | 54,573 | |
| Depreciation expense | | 1,660 | | | 2,656 | | | 3,470 | | | 5,926 | |
| homegenius | | | | | | | | |
| Allocated corporate operating expenses | | $ | 4,721 | | | $ | 2,823 | | | $ | 8,717 | | | $ | 6,190 | |
| Depreciation expense | | 491 | | | 719 | | | 945 | | | 1,329 | |
Radian Group Inc.
Notes to Unaudited Condensed Consolidated Financial Statements (Continued)
| | | | | |
| Radian Group Inc.
Notes to Unaudited Condensed Consolidated Financial Statements
|
Revenue
The reconciliation of revenue for our reportable segments to consolidated revenues is as follows:follows.
| | | | | | | | | | | | | | | | | | | | | | | | | | |
| Three Months Ended
September 30, | | Nine Months Ended
September 30, | |
| (In thousands) | 2020 | | 2019 | | 2020 | | 2019 | |
| Revenues: | | | | | | | | |
Mortgage (1) | $ | 320,013 | | | $ | 317,646 | | | $ | 922,040 | | | $ | 956,660 | | (2) |
Real Estate (1) | 33,328 | | | 30,139 | | | 88,003 | | | 80,789 | | |
| Total revenues for reportable segments | 353,341 | | | 347,785 | | | 1,010,043 | | | 1,037,449 | | |
All Other revenues (3) | 5,858 | | | 19,812 | | | 19,984 | | | 55,170 | | |
| Net gains (losses) on investments and other financial instruments | 17,652 | | | 13,009 | | | 42,901 | | | 47,462 | | |
| Other non-operating revenue | 0 | | | 0 | | | 247 | | | 0 | | |
Elimination of inter-segment revenues (3) | (1,617) | | | (268) | | | (4,419) | | | (1,150) | | |
| Total revenues | $ | 375,234 | | | $ | 380,338 | | | $ | 1,068,756 | | | $ | 1,138,931 | | |
______________________ | | | | | | | | | | | | | | | | | | | | | | | | | | |
| Reconciliation of revenues by segment |
| | | | | | | | |
| | Three Months Ended
June 30, | | Six Months Ended
June 30, |
| (In thousands) | | 2021 | | 2020 | | 2021 | | 2020 |
| Revenues | | | | | | | | |
Mortgage (1) | | $ | 284,301 | | | $ | 286,943 | | | $ | 588,098 | | | $ | 602,027 | |
homegenius (2) | | 33,451 | | | 22,548 | | | 59,246 | | | 49,073 | |
| Total revenues for reportable segments | | 317,752 | | | 309,491 | | | 647,344 | | | 651,100 | |
All Other revenues (1) | | 3,643 | | | 7,537 | | | 8,104 | | | 17,228 | |
| Net gains (losses) on investments and other financial instruments | | 15,661 | | | 47,276 | | | 10,480 | | | 25,249 | |
| Other non-operating revenue | | 0 | | | 247 | | | 0 | | | 247 | |
| Elimination of inter-segment revenues | | (62) | | | (110) | | | (121) | | | (302) | |
| Total revenues | | $ | 336,994 | | | $ | 364,441 | | | $ | 665,807 | | | $ | 693,522 | |
(1)Includes immaterial inter-segment revenues for the three and ninesix months ended SeptemberJune 30, 2020 and 2019.2020.
(2)Includes a cumulative adjustment to unearned premiums recorded in the second quarter of 2019 as further described above.
(3)Includes $1.5 million and $4.0 millionimmaterial inter-segment revenues for the three and ninesix months ended SeptemberJune 30, 2020, respectively, related to the $200 million 3% intercompany surplus note issued by Radian Guaranty to Radian Group in January2021 and 2020.
The accounting standard on revenue from contracts with customers is primarily applicable to our services revenue and is not applicable to our investments and insurance products, which represent the majority of our revenue. See Note 2 of Notes to Consolidated Financial Statements in our 2019 Form 10-K for additional information regarding our accounting policies and the services we offer.
The table below, which represents total services revenue on our condensed consolidated statements of operations for the periods indicated, represents the disaggregation of services revenues from external customers, by type:type.
| | | | | | | | | | | | | | | | | | | | | | | |
| Three Months Ended
September 30, | | Nine Months Ended
September 30, |
| (In thousands) | 2020 | | 2019 | | 2020 | | 2019 |
| Services revenue | | | | | | | |
| Real Estate services: | | | | | | | |
| Valuation services | $ | 11,881 | | | $ | 14,772 | | | $ | 31,519 | | | $ | 40,836 | |
| Title services | 9,081 | | | 4,590 | | | 25,445 | | | 11,189 | |
| Asset management services | 8,453 | | | 6,567 | | | 21,791 | | | 19,300 | |
| Other real estate services | 614 | | | 335 | | | 1,364 | | | 407 | |
| Mortgage services | 3,914 | | | 2,340 | | | 10,965 | | | 4,856 | |
All Other services (1) | 0 | | | 13,905 | | | 2,861 | | | 37,977 | |
| Total services revenue | $ | 33,943 | | | $ | 42,509 | | | $ | 93,945 | | | $ | 114,565 | |
______________________ | | | | | | | | | | | | | | | | | | | | | | | | | | |
| Services revenue |
| | | | | | | | |
| | Three Months Ended
June 30, | | Six Months Ended
June 30, |
| (In thousands) | | 2021 | | 2020 | | 2021 | | 2020 |
| homegenius services | | | | | | | | |
| Title services | | $ | 9,399 | | | $ | 6,021 | | | $ | 17,456 | | | $ | 12,586 | |
| Asset management services | | 6,824 | | | 6,036 | | | 11,438 | | | 14,896 | |
| Valuation services | | 8,494 | | | 3,837 | | | 13,380 | | | 10,018 | |
| SaaS | | 909 | | | 1,099 | | | 1,829 | | | 1,981 | |
| Other real estate services | | 62 | | | 586 | | | 76 | | | 1,239 | |
| Mortgage services | | 3,732 | | | 3,918 | | | 8,083 | | | 7,051 | |
All Other services (1) | | 44 | | | 6,578 | | | 97 | | | 12,231 | |
| Total services revenue | | $ | 29,464 | | | $ | 28,075 | | | $ | 52,359 | | | $ | 60,002 | |
(1)Includes services revenue from Clayton prior to its sale in January 2020.
Our services revenues are recognized over time2020 and measured each period based on the progress to date as services are performed and made available to customers. Our contracts with customers, including payment terms, are generally short-term in nature; therefore, any impactamounts related to timing is immaterial. Revenue expected to be recognizedour traditional appraisal business, which we wound down beginning in any future period related to remaining performance obligations, such as contracts where revenue is recognized as invoiced and contracts with variable consideration related to undelivered performance obligations, is not material.the fourth quarter of 2020.
Revenue recognized related to services made available to customers and billed is reflected in accounts and notes receivable. Accounts and notes receivable includes $28.9$17.0 million and $10.8$18.8 million as of SeptemberJune 30, 20202021 and December 31, 2019,2020, respectively, related to services revenue contracts. Revenue recognized related to services performed and not yet billed is recorded in unbilled receivables and reflected in other assets. See Note 9 for additional information. Deferred revenue, which
Radian Group Inc.
Notes to Unaudited Condensed Consolidated Financial Statements (Continued)
represents advance payments received from customers in advance of revenue recognition, is immaterialour 2020 Form 10-K for all periods presented. We have 0 material bad-debt expense.information regarding our accounting policies and the services we offer.
5. Fair Value of Financial Instruments
For discussion of our valuation methodologies for assets and liabilities measured at fair value and the fair value hierarchy, see Note 5 of Notes to Consolidated Financial Statements in our 20192020 Form 10-K.
| | | | | |
| Radian Group Inc.
Notes to Unaudited Condensed Consolidated Financial Statements
|
The following istables include a list of assets that are measured at fair value by hierarchy level as of SeptemberJune 30, 2020:2021 and December 31, 2020.
| | | | | | | | | | | | | | | | | | | | |
| (In thousands) | Level I | | Level II | | | | Total | |
| Assets at fair value | | | | | | | | |
| Investments: | | | | | | | | |
| Fixed-maturities available for sale: | | | | | | | | |
| U.S. government and agency securities | $ | 157,407 | | | $ | 29,494 | | | | | $ | 186,901 | | |
| State and municipal obligations | 0 | | | 159,975 | | | | | 159,975 | | |
| Corporate bonds and notes | 0 | | | 2,898,357 | | | | | 2,898,357 | | |
| RMBS | 0 | | | 850,113 | | | | | 850,113 | | |
| CMBS | 0 | | | 718,962 | | | | | 718,962 | | |
| Other ABS | 0 | | | 809,388 | | | | | 809,388 | | |
| Foreign government and agency securities | 0 | | | 5,296 | | | | | 5,296 | | |
| | | | | | | | |
| Total fixed-maturities available for sale | 157,407 | | | 5,471,585 | | | | | 5,628,992 | | |
| | | | | | | | |
| Trading securities: | | | | | | | | |
| | | | | | | | |
| State and municipal obligations | 0 | | | 120,547 | | | | | 120,547 | | |
| | | | | | | | |
| Corporate bonds and notes | 0 | | | 122,858 | | | | | 122,858 | | |
| RMBS | 0 | | | 13,930 | | | | | 13,930 | | |
| CMBS | 0 | | | 34,315 | | | | | 34,315 | | |
| | | | | | | | |
| | | | | | | | |
| | | | | | | | |
| Total trading securities | 0 | | | 291,650 | | | | | 291,650 | | |
| | | | | | | | |
| Equity securities | 84,255 | | | 7,062 | | | | | 91,317 | | |
| | | | | | | | |
| Short-term investments: | | | | | | | | |
| U.S. government and agency securities | 29,716 | | | 0 | | | | | 29,716 | | |
| State and municipal obligations | 0 | | | 26,973 | | | | | 26,973 | | |
| Money market instruments | 232,105 | | | 0 | | | | | 232,105 | | |
| Corporate bonds and notes | 0 | | | 106,013 | | | | | 106,013 | | |
| | | | | | | | |
| | | | | | | | |
| | | | | | | | |
| | | | | | | | |
Other investments (1) | 0 | | | 172,339 | | | | | 172,339 | | |
| Total short-term investments | 261,821 | | | 305,325 | | | | | 567,146 | | |
| | | | | | | | |
Total investments at fair value (2) | 503,483 | | | 6,075,622 | | | | | 6,579,105 | | |
| | | | | | | | |
| Other: | | | | | | | | |
Loaned securities: (3) | | | | | | | | |
| | | | | | | | |
| Corporate bonds and notes | 0 | | | 13,932 | | | | | 13,932 | | |
| | | | | | | | |
| Equity securities | 43,990 | | | 0 | | | | | 43,990 | | |
Total assets at fair value (2) | $ | 547,473 | | | $ | 6,089,554 | | | | | $ | 6,637,027 | | |
| | | | | | | | |
| | | | | | | | |
| | | | | | | | |
______________________ | | | | | | | | | | | | | | | | | | | | | | | | | | |
| Assets carried at fair value by hierarchy level |
| | | | | | | | |
| | June 30, 2021 |
| (In thousands) | | Level I | | Level II | | Level III | | Total |
| Investments | | | | | | | | |
| Fixed-maturities available for sale | | | | | | | | |
| U.S. government and agency securities | | $ | 178,709 | | | $ | 29,954 | | | $ | 0 | | | $ | 208,663 | |
| State and municipal obligations | | 0 | | | 157,944 | | | 0 | | | 157,944 | |
| Corporate bonds and notes | | 0 | | | 2,970,142 | | | 0 | | | 2,970,142 | |
| RMBS | | 0 | | | 719,840 | | | 0 | | | 719,840 | |
| CMBS | | 0 | | | 714,671 | | | 0 | | | 714,671 | |
| CLO | | 0 | | | 521,153 | | | 0 | | | 521,153 | |
| Other ABS | | 0 | | | 226,968 | | | 0 | | | 226,968 | |
| Foreign government and agency securities | | 0 | | | 5,399 | | | 0 | | | 5,399 | |
Mortgage insurance-linked notes (1) | | 0 | | | 48,033 | | | 0 | | | 48,033 | |
| Total fixed-maturities available for sale | | 178,709 | | | 5,394,104 | | | 0 | | | 5,572,813 | |
| Trading securities | | | | | | | | |
| | | | | | | | |
| State and municipal obligations | | 0 | | | 101,454 | | | 0 | | | 101,454 | |
| Corporate bonds and notes | | 0 | | | 121,377 | | | 0 | | | 121,377 | |
| RMBS | | 0 | | | 11,134 | | | 0 | | | 11,134 | |
| CMBS | | 0 | | | 34,015 | | | 0 | | | 34,015 | |
| | | | | | | | |
| | | | | | | | |
| | | | | | | | |
| Total trading securities | | 0 | | | 267,980 | | | 0 | | | 267,980 | |
| Equity securities | | 167,610 | | | 7,537 | | | 0 | | | 175,147 | |
| Short-term investments | | | | | | | | |
| U.S. government and agency securities | | 21,997 | | | 0 | | | 0 | | | 21,997 | |
| State and municipal obligations | | 0 | | | 15,940 | | | 0 | | | 15,940 | |
| Money market instruments | | 406,808 | | | 0 | | | 0 | | | 406,808 | |
| Corporate bonds and notes | | 0 | | | 19,931 | | | 0 | | | 19,931 | |
| | | | | | | | |
| CMBS | | 0 | | | 4,780 | | | 0 | | | 4,780 | |
| | | | | | | | |
| Other ABS | | 0 | | | 431 | | | 0 | | | 431 | |
| | | | | | | | |
Other investments (2) | | 0 | | | 192,208 | | | 0 | | | 192,208 | |
| Total short-term investments | | 428,805 | | | 233,290 | | | 0 | | | 662,095 | |
Other invested assets (3) | | 0 | | | 0 | | | 3,000 | | | 3,000 | |
Total investments at fair value (3) | | 775,124 | | | 5,902,911 | | | 3,000 | | | 6,681,035 | |
| | | | | | | | |
| Other | | | | | | | | |
Embedded derivatives (4) | | 0 | | | 0 | | | 5,905 | | | 5,905 | |
Loaned securities (5) | | | | | | | | |
| U.S. government and agency securities | | 5,550 | | | 0 | | | 0 | | | 5,550 | |
| Corporate bonds and notes | | 0 | | | 95,318 | | | 0 | | | 95,318 | |
| | | | | | | | |
| Equity securities | | 29,982 | | | 0 | | | 0 | | | 29,982 | |
Total assets at fair value (3) | | $ | 810,656 | | | $ | 5,998,229 | | | $ | 8,905 | | | $ | 6,817,790 | |
| | | | | | | | |
| | | | | | | | |
| | | | | | | | |
(1)Comprises the notes purchased by Radian Group in connection with the Excess-of-Loss Program. See Note 8 for more information about our reinsurance programs.
(2)Comprising short-term certificates of deposit and commercial paper.
(2)(3)Does not include other invested assets of $2.5$0.6 million that are primarily invested in limited partnership investments valued using the net asset value as a practical expedient and $3.0 million investedexpedient.
(4)Embedded derivatives related to our Excess-of-Loss Program are classified as other assets in a private convertible promissory note.our consolidated balance sheets. See Note 8 for more information about our reinsurance programs.
| | | | | |
| Radian Group Inc.
Notes to Unaudited Condensed Consolidated Financial Statements
|
Radian Group Inc.
Notes to Unaudited Condensed Consolidated Financial Statements (Continued)
(3)(5)Securities loaned to third-party borrowers under securities lending agreements are classified as other assets in our condensed consolidated balance sheets. See Note 6 for more information.
The following is a list of assets that are measured at fair value by hierarchy level as of December 31, 2019:
| | | | | | | | | | | | | | | | | | | | |
| (In thousands) | Level I | | Level II | | | | Total | |
| Assets at fair value | | | | | | | | |
| Investments: | | | | | | | | |
| Fixed-maturities available for sale: | | | | | | | | |
| U.S. government and agency securities | $ | 143,884 | | | $ | 35,700 | | | | | $ | 179,584 | | |
| State and municipal obligations | 0 | | | 119,994 | | | | | 119,994 | | |
| Corporate bonds and notes | 0 | | | 2,237,611 | | | | | 2,237,611 | | |
| RMBS | 0 | | | 779,354 | | | | | 779,354 | | |
| CMBS | 0 | | | 608,015 | | | | | 608,015 | | |
| Other ABS | 0 | | | 759,129 | | | | | 759,129 | | |
| Foreign government and agency securities | 0 | | | 5,224 | | | | | 5,224 | | |
| | | | | | | | |
| Total fixed-maturities available for sale | 143,884 | | | 4,545,027 | | | | | 4,688,911 | | |
| | | | | | | | |
| Trading securities: | | | | | | | | |
| | | | | | | | |
| State and municipal obligations | 0 | | | 118,949 | | | | | 118,949 | | |
| | | | | | | | |
| Corporate bonds and notes | 0 | | | 147,232 | | | | | 147,232 | | |
| RMBS | 0 | | | 16,180 | | | | | 16,180 | | |
| CMBS | 0 | | | 34,789 | | | | | 34,789 | | |
| | | | | | | | |
| | | | | | | | |
| | | | | | | | |
| Total trading securities | 0 | | | 317,150 | | | | | 317,150 | | |
| | | | | | | | |
| Equity securities | 124,009 | | | 6,212 | | | | | 130,221 | | |
| | | | | | | | |
| Short-term investments: | | | | | | | | |
| U.S. government and agency securities | 127,152 | | | 0 | | | | | 127,152 | | |
| State and municipal obligations | 0 | | | 21,475 | | | | | 21,475 | | |
| Money market instruments | 202,461 | | | 0 | | | | | 202,461 | | |
| Corporate bonds and notes | 0 | | | 20,298 | | | | | 20,298 | | |
| | | | | | | | |
| | | | | | | | |
| | | | | | | | |
| | | | | | | | |
Other investments (1) | 0 | | | 147,007 | | | | | 147,007 | | |
| Total short-term investments | 329,613 | | | 188,780 | | | | | 518,393 | | |
| | | | | | | | |
Total investments at fair value (2) | 597,506 | | | 5,057,169 | | | | | 5,654,675 | | |
| | | | | | | | |
| Other: | | | | | | | | |
Loaned securities: (3) | | | | | | | | |
| U.S. government and agency securities | 35,309 | | | 0 | | | | | 35,309 | | |
| Corporate bonds and notes | 0 | | | 3,669 | | | | | 3,669 | | |
| | | | | | | | |
| Equity securities | 27,464 | | | 0 | | | | | 27,464 | | |
Total assets at fair value (2) | $ | 660,279 | | | $ | 5,060,838 | | | | | $ | 5,721,117 | | |
| | | | | | | | |
| | | | | | | | |
| | | | | | | | |
| | | | | | | | |
______________________ | | | | | | | | | | | | | | | | | | | | | | | | | | |
| Assets carried at fair value by hierarchy level | | | | | | | | |
| | | | | | | | |
| | December 31, 2020 |
| (In thousands) | | Level I | | Level II | | Level III | | Total |
| Investments | | | | | | | | |
| Fixed-maturities available for sale | | | | | | | | |
| U.S. government and agency securities | | $ | 140,034 | | | $ | 29,189 | | | $ | 0 | | | $ | 169,223 | |
| State and municipal obligations | | 0 | | | 165,271 | | | 0 | | | 165,271 | |
| Corporate bonds and notes | | 0 | | | 3,047,189 | | | 0 | | | 3,047,189 | |
| RMBS | | 0 | | | 833,939 | | | 0 | | | 833,939 | |
| CMBS | | 0 | | | 681,265 | | | 0 | | | 681,265 | |
| CLO | | 0 | | | 568,558 | | | 0 | | | 568,558 | |
| Other ABS | | 0 | | | 252,457 | | | 0 | | | 252,457 | |
| Foreign government and agency securities | | 0 | | | 5,438 | | | 0 | | | 5,438 | |
| | | | | | | | |
| Total fixed-maturities available for sale | | 140,034 | | | 5,583,306 | | | 0 | | | 5,723,340 | |
| Trading securities | | | | | | | | |
| | | | | | | | |
| State and municipal obligations | | 0 | | | 120,449 | | | 0 | | | 120,449 | |
| Corporate bonds and notes | | 0 | | | 123,142 | | | 0 | | | 123,142 | |
| RMBS | | 0 | | | 13,000 | | | 0 | | | 13,000 | |
| CMBS | | 0 | | | 34,294 | | | 0 | | | 34,294 | |
| | | | | | | | |
| | | | | | | | |
| | | | | | | | |
| | | | | | | | |
| Total trading securities | | 0 | | | 290,885 | | | 0 | | | 290,885 | |
| Equity securities | | 142,761 | | | 8,479 | | | 0 | | | 151,240 | |
| Short-term investments | | | | | | | | |
| | | | | | | | |
| State and municipal obligations | | 0 | | | 21,819 | | | 0 | | | 21,819 | |
| Money market instruments | | 268,900 | | | 0 | | | 0 | | | 268,900 | |
| Corporate bonds and notes | | 0 | | | 30,495 | | | 0 | | | 30,495 | |
| | | | | | | | |
| | | | | | | | |
| | | | | | | | |
| Other ABS | | 0 | | | 219 | | | 0 | | | 219 | |
| | | | | | | | |
Other investments (1) | | 0 | | | 296,571 | | | 0 | | | 296,571 | |
| Total short-term investments | | 268,900 | | | 349,104 | | | 0 | | | 618,004 | |
Other invested assets (2) | | 0 | | | 0 | | | 3,000 | | | 3,000 | |
Total investments at fair value (2) | | 551,695 | | | 6,231,774 | | | 3,000 | | | 6,786,469 | |
| Other | | | | | | | | |
Embedded derivatives (3) | | 0 | | | 0 | | | 5,513 | | | 5,513 | |
Loaned securities (4) | | | | | | | | |
| U.S. government and agency securities | | 4,876 | | | 0 | | | 0 | | | 4,876 | |
| Corporate bonds and notes | | 0 | | | 31,324 | | | 0 | | | 31,324 | |
| | | | | | | | |
| Equity securities | | 21,299 | | | 0 | | | 0 | | | 21,299 | |
Total assets at fair value (2) | | $ | 577,870 | | | $ | 6,263,098 | | | $ | 8,513 | | | $ | 6,849,481 | |
| | | | | | | | |
| | | | | | | | |
| | | | | | | | |
| | | | | | | | |
(1)Comprising short-term certificates of deposit and commercial paper.
(2)Does not include other invested assets of $2.6$2.0 million that are primarily invested in limited partnership investments valued using the net asset value as a practical expedient and $1.5 million invested in a private convertible promissory note.expedient.
(3)Embedded derivatives related to our Excess-of-Loss Program are classified as other assets in our consolidated balance sheets. See Note 8 for more information about our reinsurance programs.
(4)Securities loaned to third-party borrowers under securities lending agreements are classified as other assets in our condensed consolidated balance sheets. See Note 6 for more information.
At September 30, 2020 and December 31, 2019, we had a Level III asset of $5.5 million and $0.4 million, respectively, measured at fair value, included in other assets in our condensed consolidated balance sheets. The Level III asset represents the embedded derivatives associated with mortgage insurance-linked notes transactions in connection with our Excess-of-Loss
Radian Group Inc.
Notes to Unaudited Condensed Consolidated Financial Statements (Continued)
Program, as described in Note 8. The total fair value of the embedded derivatives at September 30, 2020 and December 31, 2019 consists of impacts related to the fair value accounting for derivatives associated with our reinsurance contracts and the related fluctuations from period to period. The estimated fair value related to our embedded derivatives reflects the present value impact of the future variation in premiums we will pay, and includes significant unobservable inputs associated with LIBOR rates and the yield on investments held by trust. | | | | | |
| Radian Group Inc.
Notes to Unaudited Condensed Consolidated Financial Statements
|
There were 0 investment transfers to or from Level III for the three and ninesix months ended SeptemberJune 30, 20202021 or the year ended December 31, 2019. Except for the activity related to the embedded derivatives described above, activity2020. Activity related to Level III assets and liabilities (including realized and unrealized gains and losses, purchases, sales, issuances, settlements and transfers) was immaterial for the three and ninesix months ended SeptemberJune 30, 20202021 and the year ended December 31, 2019.2020.
Other Fair Value Disclosure
The carrying value and estimated fair value of other selected liabilities not carried at fair value in our condensed consolidated balance sheets were as follows as of the dates indicated:indicated.
| | Financial liabilities not carried at fair value | | Financial liabilities not carried at fair value |
| | | September 30, 2020 | | December 31, 2019 | | June 30, 2021 | | December 31, 2020 |
| (In thousands) | (In thousands) | Carrying
Amount | | Estimated
Fair Value | | Carrying
Amount | | Estimated
Fair Value | (In thousands) | | Carrying
Amount | | Estimated
Fair Value | | Carrying
Amount | | Estimated
Fair Value |
| Liabilities: | | | | | | | | |
| Senior notes | Senior notes | $ | 1,404,759 | | | $ | 1,450,590 | | | $ | 887,110 | | | $ | 949,500 | | Senior notes | | $ | 1,407,545 | | | $ | 1,563,796 | | | $ | 1,405,674 | | | $ | 1,563,503 | |
| FHLB advances | FHLB advances | 141,058 | | | 144,280 | | | 134,875 | | | 135,997 | | FHLB advances | | 153,983 | | | 156,116 | | | 176,483 | | | 179,578 | |
The fair value of our senior notes is estimated based on their quoted market prices. The fair value of our FHLB advances is estimated based on expected cash flows for similar borrowings. These liabilities are categorized in Level II of the fair value hierarchy. See Note 12 for further information on our senior notes and FHLB advances.about these borrowings.
6. Investments
Available for Sale Securities
Our available for sale securities within our investment portfolio consisted of the following as of the dates indicated:indicated.
| | Available for sale securities | | Available for sale securities |
| | | September 30, 2020 | | June 30, 2021 |
| (In thousands) | (In thousands) | Amortized
Cost | | Allowance for Credit Losses | | Gross
Unrealized
Gains | | Gross
Unrealized
Losses | | Fair Value | (In thousands) | | Amortized
Cost | | Allowance for Credit Losses | | Gross
Unrealized
Gains | | Gross
Unrealized
Losses | | Fair Value |
| Fixed-maturities available for sale: | | | | | | | | | | |
| Fixed-maturities available for sale | | Fixed-maturities available for sale | |
| U.S. government and agency securities | U.S. government and agency securities | $ | 186,457 | | | $ | 0 | | | $ | 2,105 | | | $ | (1,661) | | | $ | 186,901 | | U.S. government and agency securities | | $ | 213,954 | | | $ | 0 | | | $ | 1,161 | | | $ | (902) | | | $ | 214,213 | |
| State and municipal obligations | State and municipal obligations | 145,318 | | | 0 | | | 14,850 | | | (193) | | | 159,975 | | State and municipal obligations | | 141,431 | | | 0 | | | 16,635 | | | (122) | | | 157,944 | |
| Corporate bonds and notes | Corporate bonds and notes | 2,703,446 | | | (2,290) | | | 218,127 | | | (7,471) | | | 2,911,812 | | Corporate bonds and notes | | 2,909,453 | | | 0 | | | 175,493 | | | (19,486) | | | 3,065,460 | |
| RMBS | RMBS | 813,006 | | | 0 | | | 37,137 | | | (30) | | | 850,113 | | RMBS | | 701,664 | | | 0 | | | 21,478 | | | (3,302) | | | 719,840 | |
| CMBS | CMBS | 686,414 | | | 0 | | | 37,339 | | | (4,791) | | | 718,962 | | CMBS | | 685,595 | | | 0 | | | 31,437 | | | (2,361) | | | 714,671 | |
| CLO | | CLO | | 519,909 | | | 0 | | | 1,851 | | | (607) | | | 521,153 | |
| Other ABS | Other ABS | 811,687 | | | 0 | | | 4,051 | | | (6,350) | | | 809,388 | | Other ABS | | 225,012 | | | 0 | | | 2,190 | | | (234) | | | 226,968 | |
| Foreign government and agency securities | Foreign government and agency securities | 5,098 | | | 0 | | | 198 | | | 0 | | | 5,296 | | Foreign government and agency securities | | 5,105 | | | 0 | | | 294 | | | 0 | | | 5,399 | |
| Mortgage insurance-linked notes (1) | | Mortgage insurance-linked notes (1) | | 45,384 | | | 0 | | | 2,649 | | | 0 | | | 48,033 | |
| Total securities available for sale, including loaned securities | Total securities available for sale, including loaned securities | 5,351,426 | | | $ | (2,290) | | | $ | 313,807 | | | $ | (20,496) | | | 5,642,447 | | Total securities available for sale, including loaned securities | | 5,447,507 | | | $ | 0 | | | $ | 253,188 | | | $ | (27,014) | | | 5,673,681 | |
| Less: loaned securities | 12,890 | | | | | | | | | 13,455 | | |
Less: loaned securities (2) | | Less: loaned securities (2) | | 98,102 | | | | | | | | | 100,868 | |
| Total fixed-maturities available for sale | Total fixed-maturities available for sale | $ | 5,338,536 | | | $ | 5,628,992 | | Total fixed-maturities available for sale | | $ | 5,349,405 | | | $ | 5,572,813 | |
(1)Comprises the notes purchased by Radian Group in connection with the Excess-of-Loss Program. See Note 8 for more information about our reinsurance programs.
(2)Included in other assets in our consolidated balance sheet as further described below. See below for a discussion of our securities lending agreements.
| | | | | |
| Radian Group Inc.
Notes to Unaudited Condensed Consolidated Financial Statements
|
| | | | | | | | | | | | | | | | | | | | | | | | | | | | | | | | |
| Available for sale securities |
| | | | | | | | | | |
| | December 31, 2020 |
| (In thousands) | | Amortized
Cost | | Allowance for Credit Losses | | Gross
Unrealized
Gains | | Gross
Unrealized
Losses | | Fair Value |
| Fixed-maturities available for sale | | | | | | | | | | |
| U.S. government and agency securities | | $ | 176,033 | | | $ | 0 | | | $ | 1,677 | | | $ | (3,611) | | | $ | 174,099 | |
| State and municipal obligations | | 149,258 | | | 0 | | | 16,113 | | | (100) | | | 165,271 | |
| Corporate bonds and notes | | 2,832,350 | | | (948) | | | 250,771 | | | (3,758) | | | 3,078,415 | |
| RMBS | | 799,814 | | | 0 | | | 34,439 | | | (314) | | | 833,939 | |
| CMBS | | 645,071 | | | 0 | | | 39,495 | | | (3,301) | | | 681,265 | |
| CLO | | 569,173 | | | 0 | | | 2,026 | | | (2,641) | | | 568,558 | |
| Other ABS | | 249,988 | | | 0 | | | 2,901 | | | (432) | | | 252,457 | |
| Foreign government and agency securities | | 5,100 | | | 0 | | | 338 | | | 0 | | | 5,438 | |
| | | | | | | | | | |
| Total securities available for sale, including loaned securities | | 5,426,787 | | | $ | (948) | | | $ | 347,760 | | | $ | (14,157) | | | 5,759,442 | |
Less: loaned securities (1) | | 33,164 | | | | | | | | | 36,102 | |
| Total fixed-maturities available for sale | | $ | 5,393,623 | | | | | | | | | $ | 5,723,340 | |
(1)Included in other assets in our consolidated balance sheet as further described below. See below for a discussion of Contentsour securities lending agreements.
Radian Group Inc.
Notes to Unaudited Condensed Consolidated Financial Statements (Continued)
| | | | | | | | | | | | | | | | | | | | | | | |
| December 31, 2019 |
| (In thousands) | Amortized
Cost | | Gross
Unrealized
Gains | | Gross
Unrealized
Losses | | Fair Value |
| Fixed-maturities available for sale: | | | | | | | |
| U.S. government and agency securities | $ | 198,613 | | | $ | 2,048 | | | $ | (733) | | | $ | 199,928 | |
| State and municipal obligations | 112,003 | | | 8,032 | | | (41) | | | 119,994 | |
| Corporate bonds and notes | 2,136,819 | | | 106,189 | | | (1,728) | | | 2,241,280 | |
| RMBS | 766,429 | | | 14,452 | | | (1,527) | | | 779,354 | |
| CMBS | 593,647 | | | 14,993 | | | (625) | | | 608,015 | |
| Other ABS | 760,785 | | | 2,018 | | | (3,674) | | | 759,129 | |
| Foreign government and agency securities | 5,091 | | | 133 | | | 0 | | | 5,224 | |
| | | | | | | |
| Total securities available for sale, including loaned securities | 4,573,387 | | | $ | 147,865 | | | $ | (8,328) | | | 4,712,924 | |
| Less: loaned securities | 23,853 | | | | | | | 24,013 | |
| Total fixed-maturities available for sale | $ | 4,549,534 | | | | | | | $ | 4,688,911 | |
The following table provides a rollforward of the allowance for credit losses on fixed-maturities available for sale, which relates entirely to corporate bonds and notes for the periods indicated:indicated.
| | Rollforward of allowance for credit losses on fixed-maturities available for sale | | Rollforward of allowance for credit losses on fixed-maturities available for sale |
| | | | | | | | | | | | | Three Months Ended
June 30, | | Six Months Ended
June 30, |
| (In thousands) | (In thousands) | Three Months Ended September 30, 2020 | | Nine Months Ended September 30, 2020 | (In thousands) | | 2021 | | 2020 | | 2021 | | 2020 |
| Beginning balance | Beginning balance | $ | 2,476 | | | $ | 0 | | Beginning balance | | $ | 638 | | | $ | 0 | | | $ | 948 | | | $ | 0 | |
| Current provision for securities without prior allowance | Current provision for securities without prior allowance | 0 | | | 2,596 | | Current provision for securities without prior allowance | | 0 | | | 2,782 | | | 0 | | | 2,782 | |
| Net increases (decreases) in allowance on previously impaired securities | Net increases (decreases) in allowance on previously impaired securities | (186) | | | 0 | | Net increases (decreases) in allowance on previously impaired securities | | (608) | | | 0 | | | (918) | | | 0 | |
| Reduction for securities sold | Reduction for securities sold | 0 | | | (306) | | Reduction for securities sold | | (30) | | | (306) | | | (30) | | | (306) | |
| Ending balance | Ending balance | $ | 2,290 | | | $ | 2,290 | | Ending balance | | $ | 0 | | | $ | 2,476 | | | $ | 0 | | | $ | 2,476 | |
Gross Unrealized Losses and Related Fair Value of Available for Sale Securities
For our availablesecurities deemed “available for sale securitiessale” that are in an unrealized loss position and for which an allowance for credit loss has not been established, the following tables show the gross unrealized losses and fair values,value, aggregated by investment category and length of time that individual securities have been in a continuous unrealized loss position, as of the dates indicated. Included in the amounts as of SeptemberJune 30, 20202021 and December 31, 20192020 are loaned securities under securities lending agreements that are classified as other assets in our condensed consolidated balance sheets, as further described below.
| | | | | | | | | | | | | | | | | | | | | | | | | | | | | | | | | | | | | | | | | | | | | | | | | | | | | | | | |
| | September 30, 2020 |
($ in thousands) Description of Securities | | Less Than 12 Months | | 12 Months or Greater | | Total |
| # of
securities | | Fair Value | | Unrealized
Losses | | # of
securities | | Fair Value | | Unrealized
Losses | | # of
securities | | Fair Value | | Unrealized
Losses |
| U.S. government and agency securities | | 4 | | | $ | 99,250 | | | $ | (1,661) | | | 0 | | | $ | 0 | | | $ | 0 | | | 4 | | | $ | 99,250 | | | $ | (1,661) | |
| State and municipal obligations | | 10 | | | 27,543 | | | (193) | | | 0 | | | 0 | | | 0 | | | 10 | | | 27,543 | | | (193) | |
| Corporate bonds and notes | | 130 | | | 306,915 | | | (7,471) | | | 0 | | | 0 | | | 0 | | | 130 | | | 306,915 | | | (7,471) | |
| RMBS | | 4 | | | 11,723 | | | (19) | | | 2 | | | 956 | | | (11) | | | 6 | | | 12,679 | | | (30) | |
| CMBS | | 60 | | | 176,482 | | | (4,537) | | | 6 | | | 7,146 | | | (254) | | | 66 | | | 183,628 | | | (4,791) | |
| Other ABS | | 101 | | | 308,637 | | | (3,025) | | | 29 | | | 152,098 | | | (3,325) | | | 130 | | | 460,735 | | | (6,350) | |
| | | | | | | | | | | | | | | | | | |
| Total | | 309 | | | $ | 930,550 | | | $ | (16,906) | | | 37 | | | $ | 160,200 | | | $ | (3,590) | | | 346 | | | $ | 1,090,750 | | | $ | (20,496) | |
| | | | | |
| Radian Group Inc.
Notes to Unaudited Condensed Consolidated Financial Statements
|
Radian Group Inc. | | | | | | | | | | | | | | | | | | | | | | | | | | | | | | | | | | | | | | | | | | | | | | | | | | | | | | | | |
| Unrealized losses on fixed-maturities available for sale by category and length of time |
| | | | | | | | | | | | | | | | | | |
| | June 30, 2021 |
| ($ in thousands) | | Less Than 12 Months | | 12 Months or Greater | | Total |
| Description of Securities | | # of
securities | | Fair Value | | Unrealized
Losses | | # of
securities | | Fair Value | | Unrealized
Losses | | # of
securities | | Fair Value | | Unrealized
Losses |
| U.S. government and agency securities | | 6 | | | $ | 59,708 | | | $ | (902) | | | 0 | | | $ | 0 | | | $ | 0 | | | 6 | | | $ | 59,708 | | | $ | (902) | |
| State and municipal obligations | | 8 | | | 10,034 | | | (122) | | | 0 | | | 0 | | | 0 | | | 8 | | | 10,034 | | | (122) | |
| Corporate bonds and notes | | 174 | | | 684,401 | | | (19,380) | | | 1 | | | 2,626 | | | (106) | | | 175 | | | 687,027 | | | (19,486) | |
| RMBS | | 35 | | | 260,712 | | | (3,292) | | | 2 | | | 803 | | | (10) | | | 37 | | | 261,515 | | | (3,302) | |
| CMBS | | 49 | | | 106,289 | | | (1,280) | | | 16 | | | 35,577 | | | (1,081) | | | 65 | | | 141,866 | | | (2,361) | |
| CLO | | 43 | | | 151,791 | | | (242) | | | 16 | | | 76,845 | | | (365) | | | 59 | | | 228,636 | | | (607) | |
| Other ABS | | 45 | | | 93,360 | | | (210) | | | 1 | | | 677 | | | (24) | | | 46 | | | 94,037 | | | (234) | |
| | | | | | | | | | | | | | | | | | |
| Total | | 360 | | | $ | 1,366,295 | | | $ | (25,428) | | | 36 | | | $ | 116,528 | | | $ | (1,586) | | | 396 | | | $ | 1,482,823 | | | $ | (27,014) | |
Notes to Unaudited Condensed Consolidated Financial Statements (Continued)
| | | December 31, 2019 | | December 31, 2020 |
($ in thousands) Description of Securities | | Less Than 12 Months | | 12 Months or Greater | | Total | |
| # of
securities | | Fair Value | | Unrealized
Losses | | # of
securities | | Fair Value | | Unrealized
Losses | | # of
securities | | Fair Value | | Unrealized
Losses | |
| ($ in thousands) | | ($ in thousands) | | Less Than 12 Months | | 12 Months or Greater | | Total |
| Description of Securities | | Description of Securities | | # of
securities | | Fair Value | | Unrealized
Losses | | # of
securities | | Fair Value | | Unrealized
Losses | | # of
securities | | Fair Value | | Unrealized
Losses |
| U.S. government and agency securities | U.S. government and agency securities | | 2 | | | $ | 26,142 | | | $ | (731) | | | 2 | | | $ | 2,529 | | | $ | (2) | | | 4 | | | $ | 28,671 | | | $ | (733) | | U.S. government and agency securities | | 4 | | | $ | 90,591 | | | $ | (3,611) | | | 0 | | | $ | 0 | | | $ | 0 | | | 4 | | | $ | 90,591 | | | $ | (3,611) | |
| State and municipal obligations | State and municipal obligations | | 1 | | | 3,959 | | | (41) | | | 0 | | | 0 | | | 0 | | | 1 | | | 3,959 | | | (41) | | State and municipal obligations | | 4 | | | 9,626 | | | (100) | | | 0 | | | 0 | | | 0 | | | 4 | | | 9,626 | | | (100) | |
| Corporate bonds and notes | Corporate bonds and notes | | 25 | | | 110,871 | | | (1,728) | | | 0 | | | 0 | | | 0 | | | 25 | | | 110,871 | | | (1,728) | | Corporate bonds and notes | | 60 | | | 174,848 | | | (3,758) | | | 0 | | | 0 | | | 0 | | | 60 | | | 174,848 | | | (3,758) | |
| RMBS | RMBS | | 27 | | | 184,378 | | | (535) | | | 16 | | | 36,192 | | | (992) | | | 43 | | | 220,570 | | | (1,527) | | RMBS | | 5 | | | 42,003 | | | (305) | | | 2 | | | 915 | | | (9) | | | 7 | | | 42,918 | | | (314) | |
| CMBS | CMBS | | 36 | | | 109,589 | | | (478) | | | 8 | | | 6,346 | | | (147) | | | 44 | | | 115,935 | | | (625) | | CMBS | | 43 | | | 118,345 | | | (3,035) | | | 6 | | | 8,312 | | | (266) | | | 49 | | | 126,657 | | | (3,301) | |
| CLO | | CLO | | 52 | | | 173,459 | | | (970) | | | 25 | | | 137,506 | | | (1,671) | | | 77 | | | 310,965 | | | (2,641) | |
| Other ABS | Other ABS | | 63 | | | 225,944 | | | (670) | | | 44 | | | 209,661 | | | (3,004) | | | 107 | | | 435,605 | | | (3,674) | | Other ABS | | 26 | | | 70,759 | | | (322) | | | 3 | | | 12,119 | | | (110) | | | 29 | | | 82,878 | | | (432) | |
| | Total | Total | | 154 | | | $ | 660,883 | | | $ | (4,183) | | | 70 | | | $ | 254,728 | | | $ | (4,145) | | | 224 | | | $ | 915,611 | | | $ | (8,328) | | Total | | 194 | | | $ | 679,631 | | | $ | (12,101) | | | 36 | | | $ | 158,852 | | | $ | (2,056) | | | 230 | | | $ | 838,483 | | | $ | (14,157) | |
See “Net Gains (Losses) on Investments” below for additional details on our net gains (losses) on investments, including the changes in the allowance for credit losses on fixed maturities available for sale and other impairments due to our intent to sell securities in an unrealized loss position. See Note 2 of Notes to Consolidated Financial Statements in our 2020 Form 10-K for a discussion ofinformation regarding our accounting policy for impairments, including our adoption of ASU 2016-13 effective January 2020.impairments.
Securities Lending Agreements
We participate in a securities lending program whereby we loan certain securities in our investment portfolio to third-party borrowers for short periods of time. Although we report such securities at fair value within other assets in our condensed consolidated balance sheets, rather than within investments, the detailed information we provide in this Note 6 includes these securities. See Note 5 for additional detail on the loaned securities, and see Note 6 of Notes to Consolidated Financial Statements in our 20192020 Form 10-K for additional information about our accounting policies with respect to our securities lending agreements and the collateral requirements thereunder.
| | | | | |
| Radian Group Inc.
Notes to Unaudited Condensed Consolidated Financial Statements
|
All of our securities lending agreements are classified as overnight and revolving. Securities collateral on deposit with us from third-party borrowers totaling $26.3$102.0 million and $42.4$43.3 million as of SeptemberJune 30, 20202021 and December 31, 2019,2020, respectively, may not be transferred or re-pledged unless the third-party borrower is in default, and is therefore not reflected in our condensed consolidated financial statements.
Radian Group Inc.
Notes to Unaudited Condensed Consolidated Financial Statements (Continued)
Net Gains (Losses) on Investments
Net gains (losses) on investments consisted of:of the following.
| | | | | | | | | | | | | | | | | | | | | | | |
| Three Months Ended
September 30, | | Nine Months Ended
September 30, |
| (In thousands) | 2020 | | 2019 | | 2020 | | 2019 |
| Net realized gains (losses): | | | | | | | |
Fixed-maturities available for sale (1) | $ | 13,777 | | | $ | 4,401 | | | $ | 31,998 | | | $ | 5,209 | |
| Trading securities | 0 | | | 19 | | | 4 | | | (391) | |
| Equity securities | 0 | | | (28) | | | 361 | | | (708) | |
| Other investments | 196 | | | 205 | | | 273 | | | 521 | |
| Net realized gains (losses) on investments | 13,973 | | | 4,597 | | | 32,636 | | | 4,631 | |
| Impairment losses due to intent to sell | 0 | | | 0 | | | (1,401) | | | 0 | |
| Net decrease (increase) in expected credit losses | 186 | | | 0 | | | (2,596) | | | 0 | |
| Net unrealized gains (losses) on investments | 2,813 | | | 4,419 | | | 916 | | | 33,005 | |
| Total net gains (losses) on investments | $ | 16,972 | | | $ | 9,016 | | | $ | 29,555 | | | $ | 37,636 | |
| | | | | | | |
| | | | | | | |
______________________ | | | | | | | | | | | | | | | | | | | | | | | | | | | |
| Net gains (losses) on investments |
| | | | | | | | | |
| | Three Months Ended
June 30, | | | Six Months Ended
June 30, |
| (In thousands) | | 2021 | | 2020 | | | 2021 | | 2020 |
| Net realized gains (losses) | | | | | | | | | |
Fixed-maturities available for sale (1) | | $ | 2,376 | | | $ | 6,974 | | | | $ | 1,586 | | | $ | 18,221 | |
| Trading securities | | (112) | | | (45) | | | | 391 | | | 4 | |
| Equity securities | | (227) | | | 51 | | | | (227) | | | 361 | |
| Other investments | | 2,229 | | | 44 | | | | 2,334 | | | 77 | |
| Net realized gains (losses) on investments | | 4,266 | | | 7,024 | | | | 4,084 | | | 18,663 | |
| Impairment losses due to intent to sell | | 0 | | | (779) | | | | 0 | | | (1,401) | |
| Net decrease (increase) in expected credit losses | | 608 | | | (2,782) | | | | 918 | | | (2,782) | |
| Net unrealized gains (losses) on investments | | 8,036 | | | 24,948 | | | | 5,517 | | | (1,897) | |
| Total net gains (losses) on investments | | $ | 12,910 | | | $ | 28,411 | | | | $ | 10,519 | | | $ | 12,583 | |
(1)Components of net realized gains (losses) on fixed-maturities available for sale include:include the following. | | | Three Months Ended
September 30, | | Nine Months Ended
September 30, | | Three Months Ended
June 30, | | Six Months Ended
June 30, |
| (In thousands) | (In thousands) | 2020 | | 2019 | | 2020 | | 2019 | (In thousands) | | 2021 | | 2020 | | 2021 | | 2020 |
| Gross investment gains from sales and redemptions | Gross investment gains from sales and redemptions | $ | 14,219 | | | $ | 4,697 | | | $ | 34,422 | | | $ | 10,926 | | Gross investment gains from sales and redemptions | | $ | 9,597 | | | $ | 8,304 | | | $ | 13,714 | | | $ | 20,203 | |
| Gross investment losses from sales and redemptions | Gross investment losses from sales and redemptions | (442) | | | (296) | | | (2,424) | | | (5,717) | | Gross investment losses from sales and redemptions | | (7,221) | | | (1,330) | | | (12,128) | | | (1,982) | |
The net changes in unrealized gains (losses) recognized in earnings on investments that were still held at each period-end were as follows:follows.
| | Net changes in unrealized gains (losses) on investments still held | | Net changes in unrealized gains (losses) on investments still held |
| | | Three Months Ended
September 30, | | Nine Months Ended
September 30, | | Three Months Ended
June 30, | | Six Months Ended
June 30, |
| (In thousands) | (In thousands) | 2020 | | 2019 | | 2020 | | 2019 | (In thousands) | | 2021 | | 2020 | | 2021 | | 2020 |
| Net unrealized gains (losses) on investments still held: | | | | | | | | |
| Net unrealized gains (losses) on investments still held | | Net unrealized gains (losses) on investments still held | | | | | | |
| Trading securities | Trading securities | $ | (1,150) | | | $ | 4,132 | | | $ | 9,990 | | | $ | 18,962 | | Trading securities | | $ | 4,601 | | | $ | 13,790 | | | $ | (3,448) | | | $ | 11,131 | |
| Equity securities | Equity securities | 4,455 | | | 563 | | | (8,158) | | | 9,170 | | Equity securities | | 5,140 | | | 10,443 | | | 9,983 | | | (12,612) | |
| Other investments | Other investments | (173) | | | 47 | | | 152 | | | (64) | | Other investments | | 178 | | | (201) | | | 1,062 | | | 471 | |
| Net unrealized gains (losses) on investments still held | Net unrealized gains (losses) on investments still held | $ | 3,132 | | | $ | 4,742 | | | $ | 1,984 | | | $ | 28,068 | | Net unrealized gains (losses) on investments still held | | $ | 9,919 | | | $ | 24,032 | | | $ | 7,597 | | | $ | (1,010) | |
Radian Group Inc.
Notes to Unaudited Condensed Consolidated Financial Statements (Continued)
| | | | | |
| Radian Group Inc.
Notes to Unaudited Condensed Consolidated Financial Statements
|
Contractual Maturities
The contractual maturities of fixed-maturities available for sale were as follows:follows.
| | | | | | | | | | | |
| September 30, 2020 |
| Available for Sale |
| (In thousands) | Amortized
Cost | | Fair
Value |
Due in one year or less (1) | $ | 94,375 | | | $ | 94,832 | |
Due after one year through five years (1) | 984,406 | | | 1,034,592 | |
Due after five years through 10 years (1) | 1,246,319 | | | 1,351,007 | |
Due after 10 years (1) | 715,219 | | | 783,553 | |
Asset-backed and other mortgage-backed securities (2) | 2,311,107 | | | 2,378,463 | |
| Total | 5,351,426 | | | 5,642,447 | |
| Less: loaned securities | 12,890 | | | 13,455 | |
| Total fixed-maturities available for sale | $ | 5,338,536 | | | $ | 5,628,992 | |
______________________ | | | | | | | | | | | | | | |
| Contractual maturities of fixed-maturities available for sale |
| | | | |
| | June 30, 2021 |
| | Available for Sale |
| (In thousands) | | Amortized
Cost | | Fair
Value |
| Due in one year or less | | $ | 187,546 | | | $ | 189,292 | |
Due after one year through five years (1) | | 1,130,214 | | | 1,182,709 | |
Due after five years through 10 years (1) | | 1,242,012 | | | 1,308,582 | |
Due after 10 years (1) | | 710,171 | | | 762,433 | |
Asset-backed and mortgage-backed securities (2) | | 2,177,564 | | | 2,230,665 | |
| Total | | 5,447,507 | | | 5,673,681 | |
| Less: loaned securities | | 98,102 | | | 100,868 | |
| Total fixed-maturities available for sale | | $ | 5,349,405 | | | $ | 5,572,813 | |
(1)Actual maturities may differ as a result of calls before scheduled maturity.
(2)Includes RMBS, CMBS, andCLO, Other ABS and mortgage insurance-linked notes, which are not due at a single maturity date.
Other
For the ninethree and six months ended SeptemberJune 30, 2020,2021, we did not transfer any securities to or from the available for sale or trading categories.
Our fixed-maturities available for sale include securities totaling $17.0$18.1 million and $16.8$16.9 million at SeptemberJune 30, 20202021 and December 31, 2019,2020, respectively, on deposit and serving as collateral with various state regulatory authorities. Our fixed-maturities available for sale also include securities serving as collateral for our FHLB advances. See Note 12 for additional information about our FHLB advances.
7. Goodwill and Other Acquired Intangible Assets, Net
All of our goodwill and other acquired intangible assets relate to our Real Estatehomegenius segment. The following table showsThere was no change to our goodwill balance of $9.8 million during the changes in the carrying amount of goodwill for the year-to-date periodsthree and six months ended December 31, 2019 and SeptemberJune 30, 2020:
| | | | | | | | | | | | | | | | | |
| (In thousands) | Goodwill | | Accumulated Impairment Losses | | Net |
| Balance at December 31, 2018 | $ | 200,561 | | | $ | (186,469) | | | $ | 14,092 | |
| Goodwill acquired | 538 | | | — | | | 538 | |
| Impairment losses | — | | | (4,828) | | | (4,828) | |
| Balance at December 31, 2019 | 201,099 | | | (191,297) | | | 9,802 | |
Goodwill disposed (1) | (191,297) | | | 191,297 | | | 0 | |
| Balance at September 30, 2020 | $ | 9,802 | | | $ | 0 | | | $ | 9,802 | |
______________________
(1)Related to the sale of Clayton in January 2020. See Note 7 of Notes to Consolidated Financial Statements in our 2019 Form 10-K for additional information on the sale of Clayton.
Radian Group Inc.
Notes to Unaudited Condensed Consolidated Financial Statements (Continued)
2021.The following is a summary of the gross and net carrying amounts and accumulated amortization (including impairment) of our other acquired intangible assets as of the periods indicated:indicated.
| | | | | | | | | | | | | | | | | |
| September 30, 2020 |
| (In thousands) | Gross Carrying Amount | | Accumulated Amortization | | Net Carrying Amount |
| Client relationships | $ | 43,550 | | | $ | (29,748) | | | $ | 13,802 | |
| Technology | 8,285 | | | (6,988) | | | 1,297 | |
| Trade name and trademarks | 480 | | | (461) | | | 19 | |
| | | | | |
| Licenses | 463 | | | (115) | | | 348 | |
| Total | $ | 52,778 | | | $ | (37,312) | | | $ | 15,466 | |
| | | | | | | | | | | | | | | | | |
| December 31, 2019 |
| (In thousands) | Gross Carrying Amount | | Accumulated Amortization | | Net Carrying Amount |
| Client relationships | $ | 43,550 | | | $ | (27,269) | | | $ | 16,281 | |
| Technology | 8,435 | | | (6,789) | | | 1,646 | |
| Trade name and trademarks | 480 | | | (404) | | | 76 | |
| | | | | |
| Licenses | 463 | | | (81) | | | 382 | |
| Total | $ | 52,928 | | | $ | (34,543) | | | $ | 18,385 | |
Interim Impairment Analysis
Goodwill is deemed to have an indefinite useful life and is subject to review for impairment annually, or more frequently, if certain events and circumstances indicate potential impairment. We generally perform our annual goodwill impairment test during the fourth quarter of each year, using balances as of the prior quarter. Events and circumstances that could result in an interim assessment of goodwill and other acquired intangible assets and/or a potential impairment loss include, but are not limited to: (i) significant under-performance of the Real Estate segment relative to historical or projected future operating results; (ii) significant changes in the strategy for the Real Estate segment; (iii) significant negative industry or economic trends; and (iv) a decline in market capitalization below the book value attributable to the Real Estate segment.
Due to the rapidly changing social and economic impacts associated with the COVID-19 pandemic on the U.S. and global economies generally, and in particular on the U.S. housing, real estate and housing finance markets during the first quarter of 2020, we opted to perform an interim quantitative impairment assessment of our goodwill and other acquired intangible assets for the first quarter of 2020. In connection with that assessment, we first evaluated the recoverability of our other acquired intangible assets, as factors affecting the estimated fair value of our goodwill also affect the estimated recoverability of our other acquired intangible assets. Based on our quantitative goodwill impairment assessment as of March 31, 2020, 0 impairment was indicated for other acquired intangible assets, as the remaining carrying amounts were estimated to be recoverable despite the recent market disruptions associated with the COVID-19 pandemic. Based on our analysis in the first quarter of 2020, and the evaluation of factors that affect our estimated fair value as of September 30, 2020, we concluded that there were no events or circumstances that would more likely than not reduce the fair value of our reporting unit, including acquired intangible assets. Our assumptions related to projected cash flows did not significantly change as a result of the observed market conditions during the first three quarters of 2020.
The value of our goodwill and other acquired intangible assets is supported by cash flow projections, which are primarily driven by projected transaction volume and margins. Given that the value of our goodwill and other acquired intangible assets continues to rely on achieving our projected future cash flows, failure to meet those projections and lower earnings over sustained periods may result in impairment in a future period, which could result in a charge to earnings. | | | | | | | | | | | | | | | | | | | | | | | | | | | | | | | | | | | | | | |
| Other acquired intangible assets |
| | | | | | | | | | | | |
| | June 30, 2021 | | December 31, 2020 |
| (In thousands) | | Gross Carrying Amount | | Accumulated Amortization | | Net Carrying Amount | | Gross Carrying Amount | | Accumulated Amortization | | Net Carrying Amount |
| Client relationships | | $ | 43,550 | | | $ | (33,090) | | | $ | 10,460 | | | $ | 43,550 | | | $ | (31,559) | | | $ | 11,991 | |
| Technology | | 8,285 | | | (7,523) | | | 762 | | | 8,285 | | | (7,370) | | | 915 | |
| Licenses | | 463 | | | (169) | | | 294 | | | 463 | | | (128) | | | 335 | |
| Total | | $ | 52,298 | | | $ | (40,782) | | | $ | 11,516 | | | $ | 52,298 | | | $ | (39,057) | | | $ | 13,241 | |
For additional information on our accounting policies for goodwill and other acquired intangible assets, see Notes 2 and 7 of Notes to Consolidated Financial Statements in our 20192020 Form 10-K.
| | | | | |
| Radian Group Inc.
Notes to Unaudited Condensed Consolidated Financial Statements
|
8. Reinsurance
In our mortgage insurance and title insurance businesses, we use reinsurance as part of our risk distribution strategy, including to manage our capital position and risk profile. The reinsurance arrangements for our mortgage insurance business include premiums ceded under the QSR Program, the Single Premium QSR Program and the Excess-of-Loss Program. The
Radian Group Inc.
Notes to Unaudited Condensed Consolidated Financial Statements (Continued)
amount of credit that we receive under the PMIERs financial requirements for our third-party reinsurance transactions is subject to ongoing review and approval by the GSEs.
The effect of all of our reinsurance programs on our net income (loss) is as follows:follows.
| | | | | | | | | | | | | | | | | | | | | | | | | | | |
| Three Months Ended
September 30, | | Nine Months Ended
September 30, |
| (In thousands) | 2020 | | 2019 | | 2020 | | 2019 | | |
| Net premiums written: | | | | | | | | | |
| Direct | $ | 269,240 | | | $ | 287,000 | | | $ | 820,267 | | | $ | 828,022 | | | |
Assumed (1) | 2,942 | | | 2,608 | | | 9,585 | | | 7,528 | | | |
Ceded (2) | (9,789) | | | (15,455) | | | (72,912) | | | (39,900) | | | |
| Net premiums written | $ | 262,393 | | | $ | 274,153 | | | $ | 756,940 | | | $ | 795,650 | | | |
| | | | | | | | | |
| Net premiums earned: | | | | | | | | | |
| Direct | $ | 328,728 | | | $ | 305,493 | | | $ | 945,287 | | | $ | 919,507 | | (3) | |
Assumed (1) | 2,946 | | | 2,614 | | | 9,599 | | | 7,545 | | | |
Ceded (2) | (45,203) | | | (26,922) | | | (141,705) | | | (83,189) | | (3) | |
| Net premiums earned | $ | 286,471 | | | $ | 281,185 | | | $ | 813,181 | | | $ | 843,863 | | (3) | |
| | | | | | | | | |
Ceding commissions earned (4) | $ | 17,038 | | | $ | 12,153 | | | $ | 40,457 | | | $ | 37,191 | | (3) | |
| Ceded losses | 10,189 | | | 771 | | | 51,786 | | | 4,326 | | | |
______________________ | | | | | | | | | | | | | | | | | | | | | | | | | | |
| Reinsurance impacts |
| | | | | | | | |
| | Three Months Ended
June 30, | | Six Months Ended
June 30, |
| (In thousands) | | 2021 | | 2020 | | 2021 | | 2020 |
| Net premiums written | | | | | | | | |
| Direct | | $ | 248,849 | | | $ | 271,545 | | | $ | 509,468 | | | $ | 551,027 | |
Assumed (1) | | 1,615 | | | 3,192 | | | 3,913 | | | 6,643 | |
Ceded (2) | | (11,766) | | | (43,580) | | | (20,601) | | | (63,123) | |
| Net premiums written | | $ | 238,698 | | | $ | 231,157 | | | $ | 492,780 | | | $ | 494,547 | |
| Net premiums earned | | | | | | | | |
| Direct | | $ | 282,507 | | | $ | 315,305 | | | $ | 585,228 | | | $ | 616,559 | |
Assumed (1) | | 1,615 | | | 3,197 | | | 3,913 | | | 6,653 | |
Ceded (2) | | (29,366) | | | (69,207) | | | (62,513) | | | (96,502) | |
| Net premiums earned | | $ | 254,756 | | | $ | 249,295 | | | $ | 526,628 | | | $ | 526,710 | |
| | | | | | | | |
Ceding commissions earned (3) | | $ | 7,919 | | | $ | 13,453 | | | $ | 18,326 | | | $ | 23,419 | |
| Ceded losses | | (1,078) | | | 39,635 | | | 2,668 | | | 41,597 | |
(1)IncludesPrimarily includes premiums earned from our participation in certain credit risk transfer programs.
(2)Net of profit commission, which is impacted by the level of ceded losses recoverable, if any, on reinsurance transactions. See Note 11 for additional information on our reserve for losses and reinsurance recoverables.
(3)Includes a cumulative adjustment to unearned premiums recorded in the second quarter of 2019 related to an update to the amortization rates used to recognize revenue for Single Premium Policies. See Note 4 for further information.
(4)Deferred ceding commissions of $59.2$43.6 million and $77.8$52.5 million are included in other liabilities on our condensed consolidated balance sheets at SeptemberJune 30, 20202021 and 2019,December 31, 2020, respectively.
Single Premium QSR Program
Radian Guaranty entered into each of the 2016 Single Premium QSR Agreement, 2018 Single Premium QSR Agreement and 2020 Single Premium QSR Agreement with panels of third-party reinsurers to cede a contractual quota share percent of our Single Premium NIW as of the effective date of each agreement (as set forth in the table below), subject to certain conditions. Radian Guaranty receives a ceding commission for ceded premiums written pursuant to these transactions. Radian Guaranty also receives a profit commission annually, provided that the loss ratio on the loans covered under the agreement generally remains below the applicable prescribed thresholds. Losses on the ceded risk up to this level reduce Radian Guaranty’s profit commission on a dollar-for-dollar basis.
Each of the agreements is subject to a scheduled termination date as set forth in the table below; however, Radian Guaranty has the option, based on certain conditions and subject to a termination fee, to terminate any of the agreements at the end of any calendar quarter on or after the applicable optional termination date. If Radian Guaranty exercises this option in the future, it would result in Radian Guaranty reassuming the related RIF in exchange for a net payment to the reinsurer calculated in accordance with the terms of the applicable agreement. Radian Guaranty also may terminate any of the agreements prior to the applicable scheduled termination date under certain circumstances/conditions,circumstances, including if one or both of the GSEs no longer grant full PMIERs creditcapital relief for the reinsurance.
The 2020 Single Premium QSR Agreement is the only QSR agreement under which Radian Guaranty is currently ceding NIW. Under the 2020 Single Premium QSR Agreement, NIW for policiesSingle Premium Policies issued between January 1, 2020 and December 31, 2021 is being ceded, subject to certain conditions and a limitation on ceded premiums written of $250 million. The parties may mutually agree to increase the amount of ceded risk above this level.
Radian Group Inc.
Notes to Unaudited Condensed Consolidated Financial Statements (Continued)
| | | | | |
| Radian Group Inc.
Notes to Unaudited Condensed Consolidated Financial Statements
|
The following table sets forth additional details regarding the Single Premium QSR Program:Program.
| | | | | | | | | | | | | | | | | | | | |
| (In millions) | 2020 Single Premium
QSR Agreement | | 2018 Single Premium
QSR Agreement | | 2016 Single Premium
QSR Agreement | |
| | | | | | |
| NIW Policy Dates | Jan 1, 2020-Dec 31, 2021 | | Jan 1, 2018-Dec 31, 2019 | | Jan 1, 2012-Dec 31, 2017 | |
| Effective Date | January 1, 2020 | | January 1, 2018 | | January 1, 2016 | |
| Scheduled Termination Date | December 31, 2031 | | December 31, 2029 | | December 31, 2027 | |
| Optional Termination Date | January 1, 2024 | | January 1, 2022 | | January 1, 2020 | |
| Quota Share % | 65% | | 65% | | 20% - 65% | (1) |
| Ceding Commission % | 25% | | 25% | | 25% | |
| Profit Commission % | Up to 56% | | Up to 56% | | Up to 55% | |
| As of September 30, 2020 | |
| RIF Ceded | $ | 1,331 | | | $ | 2,352 | | | $ | 3,676 | | |
| | | | | | |
| As of December 31, 2019 | |
| RIF Ceded | $ | 0 | | | $ | 3,231 | | | $ | 5,351 | | |
______________________ | | | | | | | | | | | | | | | | | | | | |
| Single Premium QSR Program |
| | | | | | |
| | 2020 Singles QSR | | 2018 Singles QSR | | 2016 Singles QSR |
| NIW Policy Dates | | Jan 1, 2020-Dec 31, 2021 | | Jan 1, 2018-Dec 31, 2019 | | Jan 1, 2012-Dec 31, 2017 |
| Effective Date | | January 1, 2020 | | January 1, 2018 | | January 1, 2016 |
| Scheduled Termination Date | | December 31, 2031 | | December 31, 2029 | | December 31, 2027 |
| Optional Termination Date | | January 1, 2024 | | January 1, 2022 | | January 1, 2020 |
| Quota Share % | | 65% | | 65% | | 20% - 65% (1) |
| Ceding Commission % | | 25% | | 25% | | 25% |
| Profit Commission % | | Up to 56% | | Up to 56% | | Up to 55% |
| | | | | | |
| (In millions) | | As of June 30, 2021 |
| RIF Ceded | | $ | 1,897 | | | $ | 1,465 | | | $ | 2,366 | |
| | | | | | |
| (In millions) | | As of December 31, 2020 |
| RIF Ceded | | $ | 1,597 | | | $ | 1,979 | | | $ | 3,071 | |
(1)Effective December 31, 2017, we amended the 2016 Single Premium QSR Agreement to increase the amount of ceded risk on performing loans under the agreement from 35% to 65% for the 2015 through 2017 vintages. Loans included in the 2012 through 2014 vintages, and any other loans subject to the agreement that were delinquent at the time of the amendment, were unaffected by the change and therefore the amount of ceded risk for those loans continues to range from 20% to 35%.
Excess-of-Loss Program
As of SeptemberJune 30, 2020,2021, Radian Guaranty hashad entered into 35 fully collateralized reinsurance arrangements with the Eagle Re Issuers. For the respective coverage periods, Radian Guaranty retains the first-loss layer of aggregate losses, as well as any losses in excess of the outstanding reinsurance coverage amounts. The Eagle Re Issuers provide second layer coverage up to the outstanding coverage amounts. For each of these 35 reinsurance arrangements, the Eagle Re Issuers financed their coverage by issuing mortgage insurance-linked notes to eligible third-party capital markets investors in unregistered private offerings. The aggregate excess-of-loss reinsurance coverage for these transactions begins amortizing after an initial period in which a target level of credit enhancement is obtained, decreasingarrangements decreases over a 10-year period as the principal balances of the underlying covered mortgages decrease and as any claims are paid by the applicable Eagle Re Issuer or the mortgage insurance is canceled. Radian Guaranty has rights to terminate the reinsurance agreements upon the occurrence of certain events.
InUnder each of the insurance-linked notes transactions,reinsurance agreements, the outstanding reinsurance coverage amount will begin amortizing after an initial period in which a target level of credit enhancement is obtained and will stop amortizing if certain thresholds, or triggers, are reached, including a delinquency trigger event based on an elevated level of delinquencies as defined in the related insurance-linked notes transaction agreements. Based onWith the current levelexception of defaults reported to us,insurance-linked notes issued by Eagle Re 2020-2 Ltd and Eagle Re 2021-1 Ltd., the insurance-linked notes issued by the Eagle Re Issuers in connection with our Excess-of-Loss Program are currently subject to a delinquency trigger event, which was first reported to the insurance-linked note investors on June 25, 2020. BothFor the insurance-linked notes that are subject to a delinquency trigger event, both the amortization of the outstanding reinsurance coverage amount pursuant to our reinsurance arrangements with the Eagle Re Issuers and the amortization of the principal amount of the related insurance-linked notes issued by the Eagle Re Issuers have been suspended and will continue to be suspended during the pendency of the trigger event.
Radian Group Inc.
Notes to Unaudited Condensed Consolidated Financial Statements (Continued)
| | | | | |
| Radian Group Inc.
Notes to Unaudited Condensed Consolidated Financial Statements
|
The following table sets forth additional details regarding the Excess-of-Loss Program as of SeptemberJune 30, 2020:2021.
| | | | | | | | | | | | | | | | | | | | |
| (In millions) | Eagle Re 2020-1 Ltd. | | Eagle Re 2019-1 Ltd. | | Eagle Re 2018-1 Ltd. | |
| Issued | February 2020 | | April 2019 | | November 2018 | |
| NIW Policy Dates | Jan 1, 2019-Sep 30, 2019 | | Jan 1, 2018-Dec 31, 2018 | | Jan 1, 2017-Dec 31, 2017 | |
| Initial RIF | $ | 9,866 | | | $ | 10,705 | | | $ | 9,109 | | |
| Initial Coverage | 488 | | | 562 | | | 434 | | (1) |
| Initial First Layer Retention | 202 | | | 268 | | | 205 | | |
| | | | | | |
| As of September 30, 2020 |
| RIF | $ | 7,155 | | | $ | 5,514 | | | $ | 4,742 | | |
| Remaining Coverage | 488 | | | 385 | | | 276 | | (1) |
| First Layer Retention | 202 | | | 266 | | | 202 | | |
______________________ | | | | | | | | | | | | | | | | | | | | | | | | | | | | | | | | | | | | | | | | | | | | | | | |
| Excess-of-Loss Program |
| | | | | | | | | | | | | | | |
| (In millions) | | Eagle Re
2021-1 Ltd. | | Eagle Re
2020-2 Ltd. | | Eagle Re
2020-1 Ltd. | | Eagle Re
2019-1 Ltd. | | Eagle Re
2018-1 Ltd. |
| Issued | | April 2021 | | October 2020 | | February 2020 | | April 2019 | | November 2018 |
| NIW Policy Dates | | Aug 1, 2020-
Dec 31, 2020 | | Oct 1, 2019-
Jul 31, 2020 | | Jan 1, 2019-
Sep 30, 2019 | | Jan 1, 2018-
Dec 31, 2018 | | Jan 1, 2017-
Dec 31, 2017 |
| Initial RIF | | $ | 11,061 | | | | $ | 13,011 | | | | $ | 9,866 | | | | $ | 10,705 | | | | $ | 9,109 | | |
| Initial Coverage | | 498 | | (1) | | 390 | | | | 488 | | | | 562 | | | | 434 | | (2) |
| Initial First Layer Retention | | 221 | | | | 423 | | | | 202 | | | | 268 | | | | 205 | | |
| | | | | | | | | | | | | | | |
| (In millions) | | As of June 30, 2021 |
| RIF | | $ | 10,546 | | | | $ | 9,516 | | | | $ | 4,397 | | | | $ | 3,289 | | | | $ | 2,818 | | |
| Remaining Coverage | | 498 | | | | 285 | | | | 488 | | | | 385 | | | | 276 | | (2) |
| First Layer Retention | | 221 | | | | 423 | | | | 202 | | | | 264 | | | | 201 | | |
| | | | | | | | | | | | | | | |
| (In millions) | | As of December 31, 2020 |
| RIF | | $ | 0 | | | | $ | 11,748 | | | | $ | 6,121 | | | | $ | 4,657 | | | | $ | 3,986 | | |
| Remaining Coverage | | 0 | | | | 390 | | | | 488 | | | | 385 | | | | 276 | | (2) |
| First Layer Retention | | 0 | | | | 423 | | | | 202 | | | | 265 | | | | 201 | | |
(1)Radian Group purchased $45.4 million original principal amount of these mortgage insurance-linked notes, which are included in fixed-maturities available for sale on our condensed consolidated balance sheet at June 30, 2021. See Notes 5 and 6 for additional information.
(2)Excludes a separate excess-of-loss reinsurance agreement entered into by Radian Guaranty that initially provided up towith both initial and remaining coverage of $21.4 million of coverage.million.
The Eagle Re Issuers are not subsidiaries or affiliates of Radian Guaranty. Based on the accounting guidance that addresses VIEs, we have not consolidated any of the assets and liabilities of the Eagle Re Issuers in our consolidated financial statements, because Radian does not have: (i) the power to direct the activities that most significantly affect the Eagle Re Issuers’ economic performances or (ii) the obligation to absorb losses or the right to receive benefits from the Eagle Re Issuers that potentially could be significant to the Eagle Re Issuers. See Note 2 of Notes to Consolidated Financial Statements in our 20192020 Form 10-K for more information on our accounting treatment of VIEs.
The reinsurance premium due to the Eagle Re Issuers is calculated by multiplying the outstanding reinsurance coverage amount at the beginning of a period by a coupon rate, which is the sum of one-month LIBOR (or an acceptable alternative to LIBOR) or SOFR, as applicable, plus a contractual risk margin, and then subtracting actual investment income collected on the assets in the reinsurance trust during the preceding month. As a result, the premiums we pay will vary based on: (i) the spread between LIBOR (or an acceptable alternative to LIBOR) or SOFR, as provided in each applicable reinsurance agreement, and the rates on the investments held by the reinsurance trust and (ii) the outstanding amount of reinsurance coverage. As the reinsurance premium will vary based on changes in these rates, we concluded that the reinsurance agreements contain embedded derivatives, which we have accounted for separately as freestanding derivatives and recorded in other assets or other liabilities on our condensed consolidated balance sheets. Changes in the fair value of these embedded derivatives are recorded in net gains (losses) on investments and other financial instruments in our condensed consolidated statements of operations. See Note 5 herein and Note 5 of Notes to Consolidated Financial Statements in our 2020 Form 10-K for additionalmore information on our fair value measurements of financial instruments, including our embedded derivatives.
In the event an Eagle Re Issuer is unable to meet its future obligations to us, if any, our insurance subsidiaries would be liable to make claims payments to our policyholders. In the event that all of the assets in the reinsurance trust (consisting of U.S. government money market funds, cash or U.S. Treasury securities) have become worthless and the Eagle Re Issuer is unable to make its payments to us, our maximum potential loss would be the amount of mortgage insurance claim payments for losses on the insured policies, net of the aggregate reinsurance payments already received, up to the full aggregate excess-of-loss reinsurance coverage amount. In the same scenario, the related embedded derivative would no longer have value. See Note 2 of Notes to Consolidated Financial Statements in our 2019 Form 10-K for more information on our fair value measurements of financial instruments.
| | | | | |
| Radian Group Inc.
Notes to Unaudited Condensed Consolidated Financial Statements
|
The Eagle Re Issuers represent our only VIEs as of SeptemberJune 30, 20202021 and December 31, 2019.2020. The following table presents the total assets and liabilities of the Eagle Re Issuers as of the dates indicated.
| | | | | | | | | | | |
| Total VIE Assets and Liabilities (1) |
| (In thousands) | September 30,
2020 | | December 31,
2019 |
| Eagle Re 2020-1 Ltd. | $ | 488,385 | | | $ | 0 | |
| Eagle Re 2019-1 Ltd. | 384,602 | | | 508,449 | |
| Eagle Re 2018-1 Ltd. | 275,718 | | | 357,005 | |
| Total | $ | 1,148,705 | | | $ | 865,454 | |
______________________ | | | | | | | | | | | | | | |
Total assets and liabilities of Eagle Re Issuers (1) |
| | | | |
| (In thousands) | | June 30,
2021 | | December 31,
2020 |
| Eagle Re 2021-1 Ltd. | | $ | 497,735 | | | $ | 0 | |
| Eagle Re 2020-2 Ltd. | | 284,730 | | | 390,324 | |
| Eagle Re 2020-1 Ltd. | | 488,385 | | | 488,385 | |
| Eagle Re 2019-1 Ltd. | | 384,602 | | | 384,602 | |
| Eagle Re 2018-1 Ltd. | | 275,718 | | | 275,718 | |
| Total | | $ | 1,931,170 | | | $ | 1,539,029 | |
(1)Assets held by the Eagle Re Issuers are required to be invested in U.S. government money market funds, cash or U.S. Treasury securities. Liabilities of the Eagle Re Issuers consist of their mortgage insurance-linked notes, described above.
In October 2020, Radian Guaranty entered into a fourth fully collateralized reinsurance agreement, with Assets and liabilities are equal to each other for each of the Eagle Re 2020-2 Ltd. Eagle Re 2020-2 Ltd. is a VIE and is not a subsidiary or affiliate of Radian Guaranty. This reinsurance agreement provides for up to $390.3 million of aggregate excess-of-loss reinsurance coverage for the mortgage insurance losses on new defaults on
Radian Group Inc.
Notes to Unaudited Condensed Consolidated Financial Statements (Continued)
an existing portfolio of eligible Recurring Premium Policies with initial RIF of $13.0 billion that were issued between October 1, 2019 and July 31, 2020. Eagle Re 2020-2 Ltd. financed its coverage by issuing mortgage insurance-linked notes in an aggregate amount of $390.3 million to eligible third-party capital markets investors in an unregistered private offering.Issuers.
Other Collateral
Although we use reinsurance as one of our risk management tools, reinsurance does not relieve us of our obligations to our policyholders. In the event the reinsurers are unable to meet their obligations to us, our insurance subsidiaries would be liable for any defaulted amounts. However, consistent with the PMIERs reinsurer counterparty collateral requirements, Radian Guaranty’s reinsurers have established trusts to help secure our potential cash recoveries.recoveries. In addition to the total VIE assets of the Eagle Re Issuers discussed above, the amount held in other reinsurance trusts was $256.2$197.8 million as of SeptemberJune 30, 2020,2021, compared to $203.2$228.6 million as of December 31, 2019.2020. In addition, for the Single Premium QSR Program, Radian Guaranty holds amounts related to ceded premiums written to collateralize the reinsurers’ obligations, which is reported in reinsurance funds withheld on our condensed consolidated balance sheets. Any loss recoveries and profit commissions paid to Radian Guaranty related to the Single Premium QSR Program are expected to be realized from this account.
See Note 8 of Notes to Consolidated Financial Statements in our 20192020 Form 10-K for more information about our reinsurance transactions.
9. Other Assets
The following table shows the components of other assets as of the dates indicated:indicated.
| | | | | | | | | | | |
| (In thousands) | September 30,
2020 | | December 31,
2019 |
| Prepaid federal income taxes (Note 10) | $ | 191,889 | | | $ | 134,800 | |
| Company-owned life insurance | 112,311 | | | 105,721 | |
| Reinsurance recoverables | 66,515 | | | 16,976 | |
| Internal-use software (net of accumulated amortization of $80,060 and $73,498) | 61,549 | | | 58,356 | |
| Loaned securities (Note 5) | 57,922 | | | 66,442 | |
| Accrued investment income | 36,093 | | | 32,333 | |
| Right-of-use assets | 34,662 | | | 37,866 | |
| Property and equipment (net of accumulated depreciation of $70,519 and $68,436) | 27,168 | | | 29,523 | |
| Deferred policy acquisition costs | 17,926 | | | 20,759 | |
| Unbilled receivables | 8,581 | | | 13,772 | |
Assets held for sale (1) | 0 | | | 24,908 | |
| | | |
| Other | 26,214 | | | 26,163 | |
| Total other assets | $ | 640,830 | | | $ | 567,619 | |
______________________ | | | | | | | | | | | | | | |
| Other assets |
| | | | |
| (In thousands) | | June 30,
2021 | | December 31,
2020 |
| Prepaid federal income taxes (Note 10) | | $ | 275,623 | | | $ | 210,889 | |
Prepaid reinsurance premiums (1) | | 225,727 | | | 267,638 | |
| Loaned securities (Note 5) | | 130,850 | | | 57,499 | |
Company-owned life insurance (2) | | 112,638 | | | 115,586 | |
| Right-of-use assets (Note 13) | | 34,662 | | | 32,985 | |
| Other | | 35,761 | | | 30,488 | |
| Total other assets | | $ | 815,261 | | | $ | 715,085 | |
(1)RelatedRelates to our Single Premium QSR Program.
(2)We are the beneficiary of insurance policies on the lives of certain of our current and past officers and employees. The balances reported in other assets reflect the amounts that could be realized upon surrender of the insurance policies as of each respective date.
Right-of-Use Assets
We assess our various asset groups, which include right-of-use assets, for changes in grouping and for potential impairment when certain events occur or when there are changes in circumstances, including potential alternative uses. If circumstances require a change in asset groupings or a right-of-use asset to be tested for possible impairment, and the carrying value of the right-of-use asset is not recoverable on an undiscounted cash flow basis, an impairment is recognized to the sale of Clayton. See Note 4 and 7extent that the carrying value exceeds its fair value.
| | | | | |
| Radian Group Inc.
Notes to Unaudited Condensed Consolidated Financial Statements
|
During the second quarter of 2021, in response to the COVID-19 pandemic and Radian’s successful transition to a virtual work environment, we made the decision to exit, and to actively market for sublease, all office space in our 2019 Form 10-K for additional informationcurrent corporate headquarters. As part of this change, we also entered into a new lease with reduced square footage at another Philadelphia area location, which upon opening we intend to designate as our new corporate headquarters location. Accordingly, during the three months ended June 30, 2021, we recognized an impairment of $3.5 million related to our current corporate headquarter leases, reducing the carrying value of certain lease assets and the related property and equipment to its estimated fair value. The right-of-use asset fair value was estimated using an income approach based on assets held for sale. Liabilities held for sale at December 31, 2019 are includedforecasted future cash flows expected to be derived from the property based on current sublease market rent, which could differ from actual results and require us to revise our initial estimates. Following this impairment, which was recorded within other operating expenses in other liabilities on our condensed consolidated balance sheets.statement of operations, the aggregate carrying value of the right-of-use assets and leasehold improvements related to the 2 corporate headquarter leases that we plan to sublease was $28.4 million as of June 30, 2021.
10. Income Taxes
As of SeptemberJune 30, 20202021 and December 31, 2019,2020, our current income tax liability was $26.6$18.1 million and $39.1$17.5 million, respectively, and is included as a component of other liabilities in our condensed consolidated balance sheets. As of September 30, 2020 and December 31, 2019 our deferred tax liability was $166.1 million and $71.1 million, respectively, and is included in other liabilities in our condensed consolidated balance sheets.
Certain entities within our consolidated group have generated deferred tax assets relating primarily to state and local NOL carryforwards, which, if unutilized, will expire during various future tax periods. We are required to establish a valuation allowance against our deferred tax assets when it is more likely than not that all or some portion of our deferred tax assets will not be realized. At each balance sheet date, we assess our need for a valuation allowance and this assessment is based on all available evidence, both positive and negative. This requires management to exercise judgment and make assumptions regarding whether our deferred tax assets will be realized in future periods. We have determined that certain entities within
Radian Group Inc.
Notes to Unaudited Condensed Consolidated Financial Statements (Continued)
Radian Group may continue to generate taxable losses on a separate company basis in the near term and may not be able to fully utilize certain of their state and local NOLs on their state and local tax returns. Therefore, with respect to deferred tax assets relating to these state and local NOLs and other state timing adjustments, we retained a valuation allowance of $67.9 $80.7 million at SeptemberJune 30, 2020.2021.
As a mortgage guaranty insurer, we are eligible for a tax deduction, subject to certain limitations, under Internal Revenue Code Section 832(e) for amounts required by state law or regulation to be set aside in statutory contingency reserves. The deduction is allowed only to the extent that, in conjunction with quarterly federal tax payment due dates, we purchase non-interest bearing U.S. Mortgage Guaranty Tax and Loss Bonds issued by the U.S. Department of the Treasury in an amount equal to the tax benefit derived from deducting any portion of our statutory contingency reserves. As of SeptemberJune 30, 20202021 and December 31, 2019,2020, we held $191.9$275.6 million and $134.8$210.9 million of these bonds, respectively, which are included as prepaid federal income taxes within other assets in our condensed consolidated balance sheets. The corresponding deduction of our statutory contingency reserves resulted in the recognition of a net deferred tax liability, which is included in other liabilitiesliability. See Note 16 of Notes to Consolidated Financial Statements in our condensed consolidated balance sheets.
In late July 2020 the IRS notified us that it had completed its examination ofForm 10-K for additional information about our 2015U.S. Mortgage Guaranty Tax and 2017 tax years. This examination resulted in 0 adjustments to the tax returns filed for those years.Loss Bonds.
For additional information on our income taxes, including our accounting policies, see Notes 2 and 10 of Notes to Consolidated Financial Statements in our 20192020 Form 10-K.
| | | | | |
| Radian Group Inc.
Notes to Unaudited Condensed Consolidated Financial Statements
|
11. Losses and Loss Adjustment ExpenseLAE
Our reserve for losses and LAE, at the end of each period indicated, consisted of:of the following.
| | | | | | | | | | | |
| (In thousands) | September 30,
2020 | | December 31,
2019 |
Mortgage insurance loss reserves (1) | $ | 821,708 | | | $ | 401,273 | |
| Title insurance loss reserves | 4,084 | | | 3,492 | |
| Total reserve for losses and LAE | $ | 825,792 | | | $ | 404,765 | |
______________________ | | | | | | | | | | | | | | |
| Reserve for losses and LAE |
| | | | |
| (In thousands) | | June 30,
2021 | | December 31,
2020 |
Mortgage insurance loss reserves (1) | | $ | 880,763 | | | $ | 844,107 | |
| Title insurance loss reserves | | 4,735 | | | 4,306 | |
| Total reserve for losses and LAE | | $ | 885,498 | | | $ | 848,413 | |
(1)Primarily comprises first lien primary case reserves of $744.6$840.8 million and $339.8$799.5 million at SeptemberJune 30, 20202021 and December 31, 2019,2020, respectively.
TheFor the periods indicated, the following table presents information relating to our mortgage insurance reserve for losses, including our IBNR reserve and LAE, but excluding our second-lien mortgage loan premium deficiency reserve, for the periods indicated:reserve.
| | | | | | | | | | | |
| Nine Months Ended
September 30, |
| (In thousands) | 2020 | | 2019 |
| Balance at beginning of period | $ | 401,273 | | | $ | 397,891 | |
Less: Reinsurance recoverables (1) | 14,594 | | | 11,009 | |
| Balance at beginning of period, net of reinsurance recoverables | 386,679 | | | 386,882 | |
| Add: Losses and LAE incurred in respect of default notices reported and unreported in: | | | |
Current year (2) | 448,584 | | | 107,866 | |
| Prior years | (21,494) | | | (10,579) | |
| Total incurred | 427,090 | | | 97,287 | |
| Deduct: Paid claims and LAE related to: | | | |
Current year (2) | 2,841 | | | 1,784 | |
| Prior years | 54,167 | | | 101,927 | |
| Total paid | 57,008 | | | 103,711 | |
| Balance at end of period, net of reinsurance recoverables | 756,761 | | | 380,458 | |
Add: Reinsurance recoverables (1) | 64,947 | | | 13,629 | |
| Balance at end of period | $ | 821,708 | | | $ | 394,087 | |
______________________ | | | | | | | | | | | | | | |
| Rollforward of mortgage insurance reserve for losses |
| | | | |
| | Six Months Ended
June 30, |
| (In thousands) | | 2021 | | 2020 |
| Balance at beginning of period | | $ | 844,107 | | | $ | 401,273 | |
Less: Reinsurance recoverables (1) | | 71,769 | | | 14,594 | |
| Balance at beginning of period, net of reinsurance recoverables | | 772,338 | | | 386,679 | |
| Add: Losses and LAE incurred in respect of default notices reported and unreported in: | | | | |
Current year (2) | | 85,807 | | | 356,555 | |
| Prior years | | (36,695) | | | (17,223) | |
| Total incurred | | 49,112 | | | 339,332 | |
| Deduct: Paid claims and LAE related to: | | | | |
Current year (2) | | 246 | | | 1,594 | |
| Prior years | | 14,447 | | | 44,580 | |
| Total paid | | 14,693 | | | 46,174 | |
| Balance at end of period, net of reinsurance recoverables | | 806,757 | | | 679,837 | |
Add: Reinsurance recoverables (1) | | 74,006 | | | 55,154 | |
| Balance at end of period | | $ | 880,763 | | | $ | 734,991 | |
(1)Related to ceded losses recoverable, if any, on reinsurance transactions. See Note 8 for additional information.
Radian Group Inc.
Notes to Unaudited Condensed Consolidated Financial Statements (Continued)
(2)Related to underlying defaulted loans with a most recent default notice dated in the year indicated. For example, if a loan had defaulted in a prior year, but then subsequently cured and later re-defaulted in the current year, that default would be considered a current year default.
Reserve Activity
Incurred Losses
Case reserves established for new default notices were the primary driver of our total incurred losses for the ninesix months ended SeptemberJune 30, 2020,2021 and 2019,2020, and they were primarily impacted by the number of new primary default notices received in the period and our related gross Default to Claim Rate assumption applied to those new defaults.
For the ninesix months ended SeptemberJune 30, 2020,2021, we experienced a significant increasedecrease in the number of new primary default notices, compared to the six months ended June 30, 2020, substantially all of which related to defaults of loans subject to forbearance programs implemented in response to the COVID-19 pandemic. Our gross Default to Claim Rate assumption applied to new defaults was 8.5%8.0% as of SeptemberJune 30, 2020, compared to 7.5% as of December 31, 2019. This increase reflects the estimated impact of a worsening macroeconomic environment, partially offset by the expected beneficial effects of mortgage relief options and other protections, including forbearance programs under the CARES Act.
While our other Default to Claim Rate assumptions for prior year defaults were not materially changed as of September 30, 2020 compared to December 31, 2019, our2021. Our provision for losses during the first ninesix months of 20202021 was positively impacted by favorable reserve development on prior year defaults, primarily due to higheras a result of more favorable trends in Cures than previously estimated.originally estimated, resulting in a reduction from 8.5% to 8.0% in the Default to Claim Rate assumption for default notices reported
| | | | | |
| Radian Group Inc.
Notes to Unaudited Condensed Consolidated Financial Statements
|
between April and December 2020. See Note 1 for additional information on the elevated risks and uncertainties resulting from the COVID-19 pandemic to our business and Note 2 of Notes to Consolidated Financial Statements in our 2019 Form 10-K for discussion of the reserving methodology for the mortgage insurance industry, which requires that reserves for losses are generally not established until receipt of notification from servicers that a borrower has missed 2 payments.business.
OurOur gross Default to Claim Rate assumption applied to new defaults was 7.5%was 8.5% as of SeptemberJune 30, 2019. 2020. Our provision for losses during the first ninesix months of 20192020 was positively impacted by favorable reserve development on prior year defaults. This favorable development was primarily driven by a reduction during the periods in certain Default to Claim Rate assumptions for these prior year defaults based on observed trends, primarily due to higher Cures than previously estimated.
Claims Paid
Total claims paid decreased for the ninesix months ended SeptemberJune 30, 2020,2021 compared to the same period in 2019.2020. Claims paid in 2021 include payments made to settle certain previously disclosed legal proceedings. See Note 13 for additional information about these legal proceedings. The decrease in claims paid is primarily attributable to COVID-19-related hardship forbearance plans and suspensions of foreclosure and evictions.
For additional information about our Reserve for Losses and LAE, including our accounting policies, see Notes 2 and 11 of Notes to Consolidated Financial Statements in our 20192020 Form 10-K.
12. Borrowings and Financing Activities
The carrying value of our debt at SeptemberJune 30, 20202021 and December 31, 20192020 was as follows:follows.
| | | | | | | | | | | |
| (In thousands) | September 30,
2020 | | December 31,
2019 |
| Senior notes: | | | |
| Senior Notes due 2024 | $ | 445,241 | | | $ | 444,445 | |
| Senior Notes due 2025 | 516,210 | | | 0 | |
| Senior Notes due 2027 | 443,308 | | | 442,665 | |
| Total senior notes | $ | 1,404,759 | | | $ | 887,110 | |
| | | |
| FHLB advances: | | | |
| FHLB advances due 2020 | $ | 52,200 | | | $ | 79,002 | |
| FHLB advances due 2021 | 30,000 | | | 19,000 | |
| FHLB advances due 2022 | 16,925 | | | 11,925 | |
| FHLB advances due 2023 | 21,995 | | | 14,994 | |
| FHLB advances due 2024 | 9,954 | | | 9,954 | |
| FHLB advances due 2025 | 9,984 | | | 0 | |
| Total FHLB advances | $ | 141,058 | | | $ | 134,875 | |
Radian Group Inc.
Notes to Unaudited Condensed Consolidated Financial Statements (Continued)
Senior Notes due 2025
In May 2020, we issued $525 million aggregate principal amount of Senior Notes due 2025 and received net proceeds of $515.6 million. These notes mature on March 15, 2025 and bear interest at a rate of 6.625% per annum, payable semi-annually on March 15 and September 15 of each year, which interest payments commenced on September 15, 2020.
We have the option to redeem these notes, in whole or in part, at any time, or from time to time, prior to September 15, 2024 (the date that is six months prior to the maturity date of the notes) (the “Par Call Date”), at a redemption price equal to the greater of (i) 100% of the aggregate principal amount of the notes to be redeemed and (ii) the make-whole amount, which is the sum of the present values of the remaining scheduled payments of principal and interest in respect of the notes to be redeemed from the redemption date to the Par Call Date discounted to the redemption date at the applicable treasury rate plus 50 basis points, plus, in each case, accrued and unpaid interest thereon to, but excluding, the redemption date. At any time on or after the Par Call Date, we may, at our option, redeem the notes in whole or in part, at a redemption price equal to 100% of the aggregate principal amount of the notes to be redeemed, plus accrued and unpaid interest thereon to, but excluding, the redemption date.
The indenture governing the Senior Notes due 2025 contains covenants customary for securities of this nature, including covenants related to the payments of the notes, reports to be provided, compliance certificates to be issued and the ability to modify the covenants. Additionally, the indenture includes covenants restricting us from encumbering the capital stock of a designated subsidiary (as defined in the indenture for the notes) or disposing of any capital stock of any designated subsidiary unless either all of the stock is disposed of or we retain more than 80% of the stock. | | | | | | | | | | | | | | |
| Borrowings |
| | | | |
| (In thousands) | | June 30,
2021 | | December 31,
2020 |
| Senior notes | | | | |
| Senior Notes due 2024 | | $ | 446,065 | | | $ | 445,512 | |
| Senior Notes due 2025 | | 517,503 | | | 516,634 | |
| Senior Notes due 2027 | | 443,977 | | | 443,528 | |
| Total senior notes | | $ | 1,407,545 | | | $ | 1,405,674 | |
| FHLB advances | | | | |
| FHLB advances due 2021 | | $ | 13,000 | | | $ | 67,500 | |
| FHLB advances due 2022 | | 61,050 | | | 61,050 | |
| FHLB advances due 2023 | | 52,995 | | | 27,995 | |
| FHLB advances due 2024 | | 13,954 | | | 9,954 | |
| FHLB advances due 2025 | | 9,984 | | | 9,984 | |
| FHLB advances due 2027 | | 3,000 | | | 0 | |
| Total FHLB advances | | $ | 153,983 | | | $ | 176,483 | |
FHLB Advances
As of SeptemberJune 30, 2020,2021, we had $141.1$154.0 million of fixed-rate advances outstanding with a weighted average interest rate of 1.35%1.03%. Interest on the FHLB advances is payable quarterly, or at maturity if the term of the advance is less than 90 days. Principal is due at maturity. For obligations with maturities greater than or equal to 90 days, we may prepay the debt at any time, subject to a prepayment fee calculation.
The principal balance of the FHLB advances are required to be collateralized by eligible assets with a market value that must be maintained generally within a minimum range of 103% to 111% of market value,the amount borrowed, depending on the type of collateralassets pledged. Our fixed-maturities available for sale and trading securities include securities totaling $158.9$175.5 million and $143.1$188.0 million at SeptemberJune 30, 20202021 and December 31, 2019,2020, respectively, which serve as collateral for our FHLB advances to satisfy this requirement. See Note 12 of Notes to Consolidated Financial Statements in our 20192020 Form 10-K for additional information about our FHLB advances.
Revolving Credit Facility
Radian Group has in place a $267.5 million unsecured revolving credit facility with a syndicate of bank lenders, which has a maturity date of January 18, 2022. At SeptemberJune 30, 2020,2021, Radian Group was in compliance with all of the credit facility covenants, and there were 0 amounts outstanding. For more information regarding our revolving credit facility, including certain of its terms and covenants, see Note 12 of Notes to Consolidated Financial Statements in our 20192020 Form 10-K.
| | | | | |
| Radian Group Inc.
Notes to Unaudited Condensed Consolidated Financial Statements
|
13. Commitments and Contingencies
Legal Proceedings
We are routinely involved in a number of legal actions and proceedings, including litigation and other disputes arising in the ordinary course of our business. The legalLegal and regulatory matters such as discussed below and in our 20192020 Form 10-K could result in adverse judgments, settlements, fines, injunctions, restitutions or other relief that could require significant expenditures or have other effects on our business. Management believes, based on current knowledge and after consultation with counsel, that the outcome of suchany currently pending or threatened actions will not have a material adverse effect on our consolidated financial condition. The outcome of litigation and other legal and regulatory matters and proceedings is inherently uncertain, and it is possible that 1 or more of the matters currently pending or threatened could have an adverse effect on our liquidity, financial condition or results of operations for any particular period.
On December 22, 2016, Ocwen Loan Servicing, LLC and Homeward Residential, Inc. (collectively, “Ocwen”) filed a complaint in the U.S. District Court for the Eastern District of Pennsylvania against Radian Guaranty alleging breach of contract and bad faith claims and seeking monetary damages and declaratory relief (the “Litigation”). Ocwen has also initiated similar legal proceedings against several other mortgage insurers. On December 17, 2016, Ocwen separately filed a parallel arbitration petition against Radian Guaranty before the American Arbitration Association (“AAA”) asserting substantially the same allegations (the “Arbitration”). Ocwen’s filings together listed 9,420 mortgage insurance certificates issued under multiple insurance policies, including Pool Insurance policies, as subject to the dispute. On June 5, 2017, Ocwen filed an amended complaint and an amended petition (collectively, the “Amended Filings”) with the court and the AAA, respectively, together listing 8,870 certificates as subject to the dispute. On April 11, 2018, the parties entered into a confidential agreement with respect to all certificates subject to the dispute. The confidential agreement resolved certain categories of claims involved in the dispute and,
Radian Group Inc.
Notes to Unaudited Condensed Consolidated Financial Statements (Continued)
on April 12, 2018, the parties filed a stipulation of voluntary dismissal of the Litigation and the trial judge issued an order dismissing all claims and counterclaims in the Litigation. Radian Guaranty was not required to make any payment in connection with this confidential agreement. Pursuant to the confidential agreement, the parties: (i) dismissed the Litigation; (ii) narrowed the scope of the Arbitration to Ocwen’s breach of contract claims seeking payment of insurance benefits on approximately 2,500 certificates that Ocwen was previously pursuing through the Amended Filings; and (iii) agreed to resolve the Arbitration through an alternative dispute resolution process administered by the AAA (the “ADR Process”). Effective June 30, 2020, Radian Guaranty, PHH Mortgage Corporation, on behalf of itself, and as successor by merger to Ocwen (collectively, “PHH”), and Ocwen Financial Corporation entered into a Confidential Settlement Agreement and Release (the “Ocwen Settlement”) to fully resolve, among other things, all claims subject to the ADR Process. Pursuant to the Ocwen Settlement, among other things: (i) Radian agreed to make a cash settlement payment following the implementation of the Ocwen Settlement and (ii) each party agreed to release the other with respect to all known or unknown claims with respect to the certificates subject to the ADR Process as well as with respect to all other certificates issued on loans serviced by PHH for which Radian decided claims prior to January 1, 2019. On July 2, 2020, the ADR Process panel ordered that all proceedings in the ADR Process are stayed pending final dismissal after receipt of the required consents. Implementation of the Ocwen Settlement, which was subject to the condition precedent that the GSEs consent to the settlement agreement, became effective on November 1, 2020 upon finalization of the consents.
On August 31, 2018, Nationstar Mortgage LLC d/b/a Mr. Cooper (“Nationstar”) filed a complaint in the U.S. District Court for the Eastern District of Pennsylvania against Radian Guaranty (the “Complaint”) alleging breach of contract, bad faith, equitable indemnification, unjust enrichment, and conversion claims and seeking monetary damages and declaratory relief. Exhibit 1related to the Complaint lists 3,014 mortgage insurance certificates issued under multiple insurance policies as subject to disputes involvingcertain insurance coverage decisions (the “Coverage Disputed Loans”). Exhibit 2 to the Complaint further lists 2,231 mortgage insurance certificates issued under multiple insurance policies as subject to disputes involvingand premium refund requests. In December 2018,decisions made by Radian Guaranty filed a motion to dismiss the Complaint. In March 2019, the trial judge issued an order granting in part, and denying in part, our motion to dismiss, and dismissed Nationstar’s unjust enrichment and conversion claims. In May 2019, Radian Guaranty filed an answer to the Complaint, with affirmative defenses and counterclaims. On September 23, 2019, the trial judge entered as an order a joint stipulation submitted by Nationstar and Radian Guaranty that narrowed the scope of the dispute involving Coverage Disputed Loans to claims relating to 1,704 mortgage insurance certificates.Guaranty. Effective June 26, 2020, Radian Guaranty and Nationstar entered into a Confidential Settlement Agreement and Release (the “Nationstar Settlement”) to fully resolve, among other things, all claims and counterclaims in this litigation. Implementation of the Nationstar Settlement, which was subject to the condition precedent that the GSEs consent to the Nationstar Settlement, became effective on March 1, 2021, and the litigation was subsequently dismissed with prejudice. Pursuant to the Nationstar Settlement, among other things: (i) Radian agreed to makemade a cash settlement payment following the implementation of theto Nationstar Settlementon March 5, 2021 and (ii) each party agreed to release the other with respect to all known or unknown claims with respect to the certificates subject to this litigation as well as with respect to all other certificates issued under certain policies on loans serviced by Nationstar for which Radian decided claims prior to January 1, 2019. ImplementationSee Note 13 of the Nationstar Settlement remains subjectNotes to the condition precedent that the GSEs consent to the settlement agreement. On July 9,Consolidated Financial Statements in our 2020 the trial judge granted the parties’ joint motion requesting to stayForm 10-K for additional background on this litigation pending receipt of required consents. On October 7, 2020, counsel for Radian and Nationstar submitted a joint status report to the trial judge reporting that the parties are continuing to diligently work on obtaining the required GSE consents, and they will provide the trial judge with another joint status report by January 7, 2021, should the case not be dismissed before then.
As previously disclosed, based on developments in the Ocwen and Nationstar legal proceedings discussed above, the Company’s IBNR reserve was increased in 2019 to reflect our best estimate of our probable loss in connection with these legal proceedings.matter. The settlement agreements are materially consistent with these estimates, and as a result, the implementation of the Ocwen Settlement, which became effective as of November 1, 2020, and the execution and expected implementation of the Nationstar Settlement dodid not have a material impact on our mortgage insurance reserves for these legal proceedings. A failure to receive the required consents of the GSEs to the Nationstar Settlement could restart the applicable legal proceeding, the outcome of which could have an adverse effect on our future results of operations, liquidity or financial condition.this proceeding.
We also are periodically subject to reviews and audits, as well as inquiries, information-gathering requests and investigations.investigations, by regulatory entities. In connection with these matters, from time to time we receive requests and subpoenas seeking information and documents related to aspects of our business.
Our Master Policies establish the timeline within which any suit or action arising from any right of an insured under the policy generally must be commenced. In general, any suit or action arising from any right of an insured under the policy must be commenced within two years after such right first arose for primary insurance and within three years for certain other policies, including certain Pool Mortgage Insurance policies. Although we believe that our Loss Mitigation Activities are justified under our policies, from time to time we face challenges from certain lender and servicer customers regarding our Loss Mitigation Activities. These challenges could result in additional arbitration or judicial proceedings and we may need to reassume the risk on, and increase loss reserves for, the associated policies or pay additional claims.
The legal and regulatory matters discussed above could result in adverse judgments, settlements, fines, injunctions, restitutions or other relief that could require significant expenditures or have other effects on our business in excess of amounts we have established as reserves for such matters.
Radian Group Inc.
Notes to Unaudited Condensed Consolidated Financial Statements (Continued)
Lease Liability
Our lease liability represents the present value of future lease payments over the lease term. The following table provides additional information related to our leases:
| | | | | |
($ in thousands) | September 30, 2020 |
Operating leases: | |
Operating lease right-of-use assets (1)
| $ | 34,662 | |
Operating lease liabilities (2)
| 55,334 | |
| |
Weighted-average remaining lease term - operating leases (in years) | 9.5 |
Weighted-average discount rate - operating leases | 6.71% |
| |
| |
| |
| |
| |
| |
| |
| |
| |
| |
| |
______________________
(1)ClassifiedOur operating lease liability was $56.0 million and $53.4 million as of June 30, 2021 and December 31, 2020, respectively, and is classified in other assetsliabilities in our condensed consolidated balance sheets. See Note 9.
(2)Classified9 for additional information on our operating lease right-of-use assets, including an impairment recognized in other liabilitiesthe second quarter of 2021 related to a decision to sublease the office space in our condensed consolidated balance sheets.current corporate headquarters.
See Note 13 of Notes to Consolidated Financial Statements in our 20192020 Form 10-K for further information regarding our commitments and contingencies and our accounting policies for contingencies.
14. Capital Stock
Share Repurchase ProgramActivity
On August 14, 2019, Radian Group’s board of directors approved a share repurchase program that authorizes the Company to spend up to $200 million, excluding commissions, to repurchase Radian Group common stock in the open market or in privately negotiated transactions, based on market and business conditions, stock price and other factors. Radian operated this program pursuant to a trading plan under Rule 10b5-1 of the Exchange Act, which permits the Company to purchase shares, at pre-determined price targets, when it may otherwise be precluded from doing so. On February 13, 2020, Radian Group’s board of directors authorized a $275 million increase in this program, bringing the total authorization to
| | | | | |
| Radian Group Inc.
Notes to Unaudited Condensed Consolidated Financial Statements
|
repurchase shares up to $475 million, excluding commissions, and extended the expiration of this program from July 31, 2020 to August 31, 2021. In March 2021, the Company entered into a new 10b5-1 plan and resumed purchases under this program which had been temporarily suspended in March 2020 in response to the COVID-19 pandemic. During the ninethree and six months ended SeptemberJune 30, 2020,2021, the Company purchased 11,036,2483,892,456 and 4,305,597 shares at an average price of $20.51,$23.14 and $22.92 per share, respectively, including commissions. As of SeptemberJune 30, 2020,2021, purchase authority of up to $198.9$100.2 million remained available under this program.
Effective March 19, 2020,During July, the Company suspendedpurchased 2,808,658 shares of its common stock under its share repurchase program and canceled the 10b5-1 plan that had been in effect. Radian may initiate a new 10b5-1 plan at its discretion in the future. The expiration datean average price of the current$21.86 per share, repurchase authorization remains August 31, 2021.including commissions. After giving consideration to these repurchases, purchase authority of up to $38.9 million remained available under this program.
Other Purchases
We may purchase shares on the open market to settle stock options exercised by employees and purchases under the Amended and Restated Radian Group Inc. Employee Stock Purchase Plan. In addition, upon the vesting of certain restricted stock awards under our equity compensation plans, we may withhold from such vested awards shares of our common stock to satisfy the tax liability of the award recipients.
Dividends and Dividend Equivalents
InDuring the first quarter of 2021 and each quarter of the quarters during 20192020, we declared quarterly cash dividends on our common stock equal to $0.0025$0.125 per share. On February 13, 2020,May 4, 2021, Radian Group’s board of directors authorized an increase to the Company’s quarterly cash dividend from $0.0025$0.125 to $0.125$0.14 per share, which wasbeginning with the dividend declared and paid in each of the first three quarters of 2020.
In February 2020, the Compensation and Human Capital Management Committee of Radian Group’s board of directors approved the amendment of outstanding performance-based restricted stock unit (“RSU”) awards and time-based RSU awards held by eligible employees (including former employees) and directors of the Company to add certain dividend equivalent rights to such equity awards. Therefore, beginning in the firstsecond quarter of 2020, dividend equivalents are accrued on these awards when dividends are declared on the Company’s common stock.
Radian Group Inc.
Notes to Unaudited Condensed Consolidated Financial Statements (Continued)
2021.Share-Based and Other Compensation Programs
We have granted performance-based or time-based awards in the form of non-qualified stock options, restricted stock, RSUs, phantom stock, or stock appreciation rights. See Note 15 of Notes to Consolidated Financial Statements in our 2019 Form 10-K for additional information regarding the Company’s share-based and other compensation programs.
During the second quarter of 2020,2021, executive and non-executive officers were granted time-vested and performance-based RSUs to be settled in common stock. The maximum payout of performance-based RSUs at the end of the three-yearthree-year performance period is 200% of a grantee’s target number.number of RSUs granted. The vesting of the performance-based RSUs granted to each executive officer and non-executive will beofficers is based upon the cumulative growth in Radian’s book value per share, adjusted for certain defined items, over a three-yearthree-year performance period. Performance-based RSUs granted to executive officers are subject to a one-year post vesting holding period.
The time-vested RSU awards granted to executive and non-executive officers in 20202021 generally vest in pro rata installments on each of the first 3 anniversaries of the grant date. In addition, time-vested RSU awards were also granted to non-employee directors and generally are subject to one-yearone-year cliff vesting. See Note 17 of Notes to Consolidated Financial Statements in our 2020 Form 10-K for additional information regarding the Company’s share-based and other compensation programs.
Information with regard to RSUs to be settled in stock for periods indicated is as follows:follows.
| | | | | | | | | | | | | | | | | | | | | | | |
| Performance-Based | | Time-Vested |
| Number of Shares | | Weighted-Average Grant Date
Fair Value | | Number of Shares | | Weighted-Average Grant Date
Fair Value |
Unvested, December 31, 2019 (1) | 2,448,347 | | | $ | 17.03 | | | 697,576 | | | $ | 19.72 | |
Granted (2) | 1,175,062 | | | $ | 12.02 | | | 709,598 | | | $ | 13.72 | |
Performance adjustment (3) | (788,256) | | | $ | 0 | | | 0 | | | $ | 0 | |
Vested (4) | (591,118) | | | $ | 17.59 | | | (446,966) | | | $ | 17.17 | |
| Forfeited | (25,701) | | | $ | 17.90 | | | (7,255) | | | $ | 19.12 | |
Unvested, September 30, 2020 (1) | 2,218,334 | | | $ | 14.68 | | | 952,953 | | | $ | 16.45 | |
______________________ | | | | | | | | | | | | | | | | | | | | | | | | | | |
| Rollforward of RSUs |
| | | | | | | | |
| | Performance-Based | | Time-Vested |
| | Number of Shares | | Weighted-Average Grant Date Fair Value | | Number of Shares | | Weighted-Average Grant Date Fair Value |
Outstanding, December 31, 2020 (1) | | 2,186,244 | | | $ | 15.71 | | | 2,118,885 | | | $ | 13.16 | |
Granted (2) | | 580,180 | | | $ | 20.40 | | | 461,339 | | | $ | 21.56 | |
Performance adjustment (3) | | 421,357 | | | $ | 0 | | | 0 | | | $ | 0 | |
Vested (4) | | (811,578) | | | $ | 15.98 | | | (438,825) | | | $ | 15.82 | |
| Forfeited | | (14,371) | | | $ | 16.80 | | | (13,829) | | | $ | 16.13 | |
Outstanding, June 30, 2021 (1) | | 2,361,832 | | | $ | 16.78 | | | 2,127,570 | | | $ | 14.41 | |
(1)Outstanding RSUs represent shares that have not yet been issued because not all conditions necessary to earn the right to benefit from the instruments have been satisfied. The final number of RSUs distributed depends on the levelcumulative growth in Radian's book value over the respective three-year performance period and, with the exception of performance achieved along with each employee’scertain retirement-eligible employees, continued service through the vestvesting date, which could result in changes in vested RSUs.
(2)For performance-based RSUs, amountnumber represents the probable outcomenumber of target shares at grant date.
(3)Represents an adjustment toFor performance-based RSUs, represents the difference between the number of unvested performance-based RSUs due to changes duringtarget shares at grant date and the period in our estimated payouts,number of shares vested at settlement, which can range from 0 to 200% of target depending on results over the applicable performance periods.
(4)Represents amounts vested during the year, which can include both original shares granted andincluding the impact of performance adjustments.adjustments for performance-based awards.
Radian Group Inc.
Notes to Unaudited Condensed Consolidated Financial Statements (Continued)
| | | | | |
| Radian Group Inc.
Notes to Unaudited Condensed Consolidated Financial Statements
|
15. Accumulated Other Comprehensive Income (Loss)
The following table shows the rollforward of accumulated other comprehensive income (loss) as of the periods indicated:indicated.
| | | | | | | | | | | | | | | | | | | | | | | | | | | | | | | | | | | |
| Three Months Ended
September 30, 2020 | | Nine Months Ended
September 30, 2020 |
| (In thousands) | Before Tax | | Tax Effect | | Net of Tax | | Before Tax | | Tax Effect | | Net of Tax |
| Balance at beginning of period | $ | 268,558 | | | $ | 56,397 | | | $ | 212,161 | | | $ | 139,858 | | | $ | 29,370 | | | $ | 110,488 | |
| Other comprehensive income (loss): | | | | | | | | | | | |
| Unrealized gains (losses) on investments: | | | | | | | | | | | |
| Unrealized holding gains (losses) arising during the period for which an allowance for expected credit losses has not been recognized | 39,037 | | | 8,198 | | | 30,839 | | | 181,775 | | | 38,173 | | | 143,602 | |
Less: Reclassification adjustment for net gains (losses) included in net income (loss): (1) | | | | | | | | | | | |
| Net realized gains (losses) on disposals and non-credit related impairment losses | 13,777 | | | 2,893 | | | 10,884 | | | 30,597 | | | 6,425 | | | 24,172 | |
| Net decrease (increase) in expected credit losses | 186 | | | 39 | | | 147 | | | (2,596) | | | (545) | | | (2,051) | |
| Net unrealized gains (losses) on investments | 25,074 | | | 5,266 | | | 19,808 | | | 153,774 | | | 32,293 | | | 121,481 | |
| | | | | | | | | | | |
| | | | | | | | | | | |
| | | | | | | | | | | |
| | | | | | | | | | | |
| | | | | | | | | | | |
| Other comprehensive income (loss) | 25,074 | | | 5,266 | | | 19,808 | | | 153,774 | | | 32,293 | | | 121,481 | |
| Balance at end of period | $ | 293,632 | | | $ | 61,663 | | | $ | 231,969 | | | $ | 293,632 | | | $ | 61,663 | | | $ | 231,969 | |
| | | | | | | | | | | |
| | Three Months Ended
September 30, 2019 | | Nine Months Ended
September 30, 2019 |
| (In thousands) | Before Tax | | Tax Effect | | Net of Tax | | Before Tax | | Tax Effect | | Net of Tax |
| Balance at beginning of period | $ | 111,977 | | | $ | 23,515 | | | $ | 88,462 | | | $ | (77,114) | | | $ | (16,194) | | | $ | (60,920) | |
| Other comprehensive income (loss): | | | |
| Unrealized gains (losses) on investments: | |
| Unrealized holding gains (losses) arising during the period | 51,460 | | | 10,806 | | | 40,654 | | | 241,363 | | | 50,686 | | | 190,677 | |
Less: Reclassification adjustment for net gains (losses) included in net income (loss) (1) | 4,401 | | | 924 | | | 3,477 | | | 5,209 | | | 1,094 | | | 4,115 | |
| Net unrealized gains (losses) on investments | 47,059 | | | 9,882 | | | 37,177 | | | 236,154 | | | 49,592 | | | 186,562 | |
| | | | | | | | | | | |
| | | | | | | | | | | |
| | | | | | | | | | | |
| Unrealized foreign currency translation adjustments | 0 | | | 0 | | | 0 | | | (4) | | | (1) | | | (3) | |
| | | | | | | | | | | |
| Other comprehensive income (loss) | 47,059 | | | 9,882 | | | 37,177 | | | 236,150 | | | 49,591 | | | 186,559 | |
| Balance at end of period | $ | 159,036 | | | $ | 33,397 | | | $ | 125,639 | | | $ | 159,036 | | | $ | 33,397 | | | $ | 125,639 | |
______________________ | | | | | | | | | | | | | | | | | | | | | | | | | | | | | | | | | | | | | | |
| Rollforward of accumulated other comprehensive income |
| | | | | | | | | | | | |
| | Three Months Ended
June 30, 2021 | | Six Months Ended
June 30, 2021 |
| (In thousands) | | Before Tax | | Tax Effect | | Net of Tax | | Before Tax | | Tax Effect | | Net of Tax |
| Balance at beginning of period | | $ | 147,766 | | | $ | 31,031 | | | $ | 116,735 | | | $ | 333,829 | | | $ | 70,104 | | | $ | 263,725 | |
| Other comprehensive income (loss) | | | | | | | | | | | | |
| Unrealized holding gains (losses) on investments arising during the period for which an allowance for expected credit losses has not been recognized | | 81,617 | | | 17,140 | | | 64,477 | | | (104,926) | | | (22,034) | | | (82,892) | |
Less: Reclassification adjustment for net gains (losses) on investments included in net income (loss) (1) | | | | | | | | | | | | |
| Net realized gains (losses) on disposals and non-credit related impairment losses | | 2,375 | | | 499 | | | 1,876 | | | 1,585 | | | 333 | | | 1,252 | |
| Net decrease (increase) in expected credit losses | | 608 | | | 128 | | | 480 | | | 918 | | | 193 | | | 725 | |
| | | | | | | | | | | | |
| | | | | | | | | | | | |
| Other comprehensive income (loss) | | 78,634 | | | 16,513 | | | 62,121 | | | (107,429) | | | (22,560) | | | (84,869) | |
| Balance at end of period | | $ | 226,400 | | | $ | 47,544 | | | $ | 178,856 | | | $ | 226,400 | | | $ | 47,544 | | | $ | 178,856 | |
| | | | | | | | | | | | | |
| | | Three Months Ended
June 30, 2020 | | Six Months Ended
June 30, 2020 |
| (In thousands) | | Before Tax | | Tax Effect | | Net of Tax | | Before Tax | | Tax Effect | | Net of Tax |
| Balance at beginning of period | | $ | 37,722 | | | $ | 7,921 | | | $ | 29,801 | | | $ | 139,858 | | | $ | 29,370 | | | $ | 110,488 | |
| Other comprehensive income (loss) | | | | | | | | | | | | |
| | | | | | | | | | | | |
| Unrealized holding gains (losses) on investments arising during the period for which an allowance for expected credit losses has not been recognized | | 234,249 | | | 49,193 | | | 185,056 | | | 142,738 | | | 29,975 | | | 112,763 | |
Less: Reclassification adjustment for net gains (losses) on investments included in net income (loss) (1) | | | | | | | | | | | | |
| Net realized gains (losses) on disposals and non-credit related impairment losses | | 6,195 | | | 1,301 | | | 4,894 | | | 16,820 | | | 3,532 | | | 13,288 | |
| Net decrease (increase) in expected credit losses | | (2,782) | | | (584) | | | (2,198) | | | (2,782) | | | (584) | | | (2,198) | |
| | | | | | | | | | | | |
| | | | | | | | | | | | |
| Other comprehensive income (loss) | | 230,836 | | | 48,476 | | | 182,360 | | | 128,700 | | | 27,027 | | | 101,673 | |
| Balance at end of period | | $ | 268,558 | | | $ | 56,397 | | | $ | 212,161 | | | $ | 268,558 | | | $ | 56,397 | | | $ | 212,161 | |
(1)Included in net gains (losses) on investments and other financial instruments on our condensed consolidated statements of operations.
| | | | | |
| Radian Group Inc.
Notes to Unaudited Condensed Consolidated Financial Statements
|
16. Statutory Information
Our insurance subsidiaries’ statutory net income for the year-to-date periods ended June 30, 2021 and 2020 and statutory policyholders’ surplus as of June 30, 2021 and December 31, 2020 were as follows.
| | | | | | | | | | | | | | |
| Statutory net income |
| | | | |
| | Six Months Ended June 30, |
| (In thousands) | | 2021 | | 2020 |
| Radian Guaranty | | $ | 348,307 | | | $ | 103,153 | |
| Radian Reinsurance | | 7,418 | | | 27,039 | |
| Other Mortgage Subsidiaries | | 629 | | | 378 | |
| Radian Title Insurance | | 2,623 | | | 843 | |
| | | | |
| Statutory policyholders’ surplus |
| | | | |
| (In thousands) | | June 30,
2021 | | December 31,
2020 |
| Radian Guaranty | | $ | 595,981 | | | $ | 481,484 | |
| Radian Reinsurance | | 364,783 | | | 360,704 | |
| Other Mortgage Subsidiaries | | 42,331 | | | 41,327 | |
| Radian Title Insurance | | 31,627 | | | 28,849 | |
State insurance regulations include various capital requirements and dividend restrictions based on our insurance subsidiaries’ statutory financial position and results of operations, as described below. As of SeptemberJune 30, 2020,2021, the amount of restricted net assets held by our consolidated insurance subsidiaries (which represents our equity investment in those insurance subsidiaries) totaled $4.0$4.6 billion of our consolidated net assets.
In light of Radian Guaranty’s negative unassigned surplus related to operating losses in prior periods and the ongoing need to set aside contingency reserves, which totaled $3.6 billion as of June 30, 2021, we do not anticipate that Radian Guaranty will be permitted under applicable insurance laws to pay ordinary dividends or other distributions to Radian Group for the foreseeable future without the prior approval from the Pennsylvania Insurance Department.
Under state insurance regulations, our mortgage insurance subsidiaries areRadian Guaranty is required to maintain minimum surplus levels. Inlevels and, in certain states, a maximum ratio of net RIF relative to statutory capital, or Risk-to-capital. There are 16 RBC States mortgage insurers licensed in those states must also satisfythat currently impose a Statutory RBC Requirement. The most common Statutory RBC Requirement is that is a minimum ratiomortgage insurer’s Risk-to-capital may not exceed 25 to 1. In certain of statutory capital relative to the level of net RIF, or Risk-to-capital. Other RBC States, requirea mortgage insurers
Radian Group Inc.
Notes to Unaudited Condensed Consolidated Financial Statements (Continued)
licensed in those states toinsurer must satisfy a MPP Requirement that is calculated on both risk and surplus levels. Our mortgage insurance subsidiaries wereRequirement. Radian Guaranty was in compliance with theall applicable Statutory RBC Requirements orand MPP Requirements to the extent applicable, in each of the RBC States as of SeptemberJune 30, 2020.2021. Radian Guaranty’s Risk-to-capital was 11.4:1 and 12.7:1 as of June 30, 2021 and December 31, 2020, respectively. For purposes of the Risk-to-capital requirements imposed by certain states, statutory capital is defined as the sum of statutory policyholders’ surplus plus statutory contingency reserves. Our other mortgage insurance and title insurance subsidiaries were also in compliance with all statutory and counterparty capital requirements as of June 30, 2021.
In addition, in order to be eligible to insure loans purchased by the GSEs, mortgage insurers such as Radian Guaranty must meet the GSEs’ eligibility requirements, or PMIERs. At SeptemberJune 30, 2020,2021, Radian Guaranty is an approved mortgage insurer under the PMIERs and is in compliance with the current PMIERs financial requirements. Under the PMIERs there are increased financial requirements for loans in default, including as a result of natural disasters and pandemics. As a result, increases in defaults related to the COVID-19 pandemic have subjected Radian Guaranty to an increase in Minimum Required Assets under the PMIERs, and therefore, could impact our compliance with the PMIERsif these continue or increase, would continue to negatively impact our results of operations. However, as further described below, the PMIERs apply a multiplier that reduces the Minimum Required Asset factor for loans that have become non-performing as a result of a “FEMA Declared Major Disaster” event, including as a result of participation in a forbearance program, because those loans generally have a higher likelihood of curing following the conclusion of the event. For these defaults, the PMIERs apply the Disaster Related Capital Charge, which is a 0.30 multiplier to the factor that normally would be applied to such default, effectively reducing the required asset amount by 70%, unless the resulting Minimum Required Asset amount after applying the Disaster Related Capital Charge would be less than the Minimum Required Asset amount for the loan if it was performing, in which case the Minimum Required Asset amount would equal the performing level amount. Pursuant to the COVID-19 Amendment that temporarily amends the PMIERs effective June 30, 2020, the COVID-19 pandemic is recognized as a nationwide FEMA Declared Major Disaster,operations and therefore, the Disaster Related Capital Charge is now applied nationwide to all COVID-19 Defaulted Loans for no longer than three calendar months beginningcould impact our compliance with the month the loan becomes non-performing (i.e., missed 2 monthly payments), or if greater, the period of time that the loan is subject to a forbearance plan, repayment plan or loan modification trial period granted in response to a financial hardship related to COVID-19.PMIERs. See Note 1 for discussion about the elevated risks and uncertainties associated with the COVID-19 pandemic and Note 1816 of Notes to Consolidated Financial Statements in our 20192020 Form 10-K for additional information regarding the PMIERs.PMIERs, including the benefit provided by the Disaster Related Capital Charge.
Radian Guaranty’s Risk-to-capital calculation appears in the table below. For purposes of the Risk-to-capital requirements imposed by certain states, statutory capital is defined as the sum of statutory policyholders’ surplus plus statutory contingency reserves.
| | | | | | | | | | | |
| September 30,
2020 | | December 31,
2019 |
| ($ in millions) | | | |
RIF, net (1) | $ | 48,914.0 | | | $ | 44,076.7 | |
| | | |
| Common stock and paid-in capital | $ | 1,041.0 | | | $ | 1,041.0 | |
| Surplus Note | 300.0 | | | 100.0 | |
| Unassigned earnings (deficit) | (857.6) | | | (503.3) | |
| Statutory policyholders’ surplus | 483.4 | | | 637.7 | |
| Contingency reserve | 3,212.1 | | | 2,607.8 | |
| Statutory capital | $ | 3,695.5 | | | $ | 3,245.5 | |
| | | |
| Risk-to-capital | 13.2:1 | | 13.6:1 |
______________________
(1)Excludes risk ceded through all reinsurance programs (including with affiliates, if any) and RIF on defaulted loans.
Radian Guaranty’s statutory capital increased by $450.0 million in the first nine months of 2020, primarily due to Radian Guaranty’s statutory net income of $260.2 million during this period and the impact of the additional surplus note issued in January 2020, as described below. The net decrease in Radian Guaranty’s Risk-to-capital in the first nine months of 2020 was primarily due to an increase in overall statutory capital, partially offset by a net increase in RIF. Radian Guaranty’s net RIF increased during the first nine months of the year primarily due to the termination of the intercompany reinsurance agreement, as described below, and strong NIW, offset by a reduction in the Persistency Rate on prior vintages due to the high level of refinancing activity in the first nine months of 2020. Due to Radian Guaranty’s negative unassigned surplus position, 0 dividends or other ordinary distributions can be paid in 2020.
In January 2020, in connection with the termination of an intercompany reinsurance agreement between Radian Reinsurance and Radian Guaranty, Radian Reinsurance transferred $6.0 billion in RIF to Radian Guaranty and released substantially all of its contingency reserves to unassigned surplus. In turn, Radian Guaranty established equivalent contingency reserves with a corresponding decrease to its unassigned surplus. As part of these actions,Effective April 1, 2021, the Pennsylvania Insurance Department approved the termination of the 2020 Surplus Note via a $465 million return of capital from Radian Reinsuranceconversion to Radian Group as well as the transfer of $200 million of cashGuaranty’s gross paid-in and marketable securities fromcontributed surplus account. This conversion had no effect on Radian Group to Radian Guaranty in exchange for aGuaranty’s total statutory policyholders’ surplus, note. This
Radian Group Inc.
Notes to Unaudited Condensed Consolidated Financial Statements (Continued)
intercompany surplus note has a 3% interest rate and a stated maturity of January 31, 2030. The surplus note may be redeemed at any time upon 30 days prior notice, subject to a request by Radian Guaranty for the approval of the Pennsylvania Insurance Department.Risk-to-capital or PMIERs Cushion.
For a description of our compliance with statutory and other regulations for our mortgage insurance and title insurance businesses, including statutory capital requirements and divided restrictions, see Note 1816 of Notes to Consolidated Financial Statements in our 20192020 Form 10-K.
Part I. Item 2. Management’s Discussion and Analysis of Financial Condition and Results of Operations
Item 2. Management’s Discussion and Analysis of Financial Condition and Results of Operations
The disclosures in this quarterly report are complementary to those made in our 20192020 Form 10-K and should be read in conjunction with our unaudited condensed consolidated financial statements and the notes thereto included in this report, as well as our audited financial statements, notes thereto and Management’s Discussion and Analysis of Financial Condition and Results of Operations included in our 20192020 Form 10-K.
Subsequent to the sale of Clayton in January 2020, our Chief Executive Officer (Radian’s chief operating decision maker) implemented certain organizational changes that caused the composition of our reportable segments to change. See Note 4 of Notes to Unaudited Condensed Consolidated Financial Statements for information regarding the basis of our segment reporting, including the related allocations and the impacts of the sale of Clayton in January 2020 and subsequent organizational changes made in the first quarter of 2020.
The following analysis of our financial condition and results of operations for the three and ninesix months ended SeptemberJune 30, 20202021 provides information that evaluates our financial condition as of SeptemberJune 30, 20202021 compared with December 31, 20192020 and our results of operations for the three and ninesix months Septemberended June 30, 2020,2021, compared to the same periodsperiod last year. Certain terms and acronyms used throughout this report are defined in the Glossary of Abbreviations and Acronyms included as part of this report. In addition, investors should review the “Cautionary Note Regarding Forward-Looking Statements—Safe Harbor Provisions” above, and “Item 1A. Risk Factors” in our 20192020 Form 10-K and “Item 1A. Risk Factors” in this report for a discussion of those risks and uncertainties that have the potential to adversely affect our business, financial condition, results of operations, cash flows or prospects. Our results of operations for interim periods are not necessarily indicative of results to be expected for the full year or for any other period. See “Overview” and Note 1 of Notes to Unaudited Condensed Consolidated Financial Statements for additional information.
Index to Item 2
| | | | | |
Index to Management’s Discussion and Analysis
of Financial Condition and Results of Operations
|
| Item | Page
Number |
| |
| |
| |
| |
| |
| |
| |
| |
| |
| |
| |
| |
| |
Overview
We are a diversified mortgage and real estate business providing both credit-related mortgage insurance coverage and a broad array of other mortgage and real estate services. We havewith two reportable business segments—Mortgage and Real Estate.homegenius. Our Mortgage segment provides credit-related insurance coverage, principally through private mortgage insurance on residential first-lien mortgage loans, as well as other credit risk management, and contract underwriting and fulfillment solutions, to mortgage lending institutions and mortgage credit investors. Our Real Estatehomegenius segment is primarily a fee-for-service business that offers a broad array of title, valuation, asset management, SaaS and other real estate services to market participants across themortgage lenders, mortgage and real estate value chain.investors, GSEs, real estate brokers and agents. Our homegenius segment was previously named “Real Estate” and during the second quarter of 2021 we renamed it “homegenius” to align with updates to our branding strategy for the segment’s products and services. As further discussed in Note 4 of Notes to Unaudited Condensed Consolidated Financial Statements, the homegenius segment name change had no impact on the composition of our segments or on our previously reported historical financial position, results of operations, cash flow or segment level results.
Current Operating Environment
As a seller of mortgage credit protection and other mortgage and credit risk management solutions, our Mortgage business results are subject to macroeconomic conditions and other events that impact the housing, real estate and housing finance markets, the credit performance of our underlying insured assets as well asand our future business opportunities, including the
Part I. Item 2. Management’s Discussion and Analysis of Financial Condition and Results of Operations (continued)
current global pandemic as well as seasonal fluctuations that specifically affect the mortgage origination environment. The macroeconomic conditions, seasonality and other events that impact the housing, mortgage finance and related real estate markets also affect the demand for our products and services offered through our Real Estatehomegenius segment.
Following the financial crisis of 2007-2008 and until the first quarter of 2020, our mortgage insurance business benefited from continued improvement in market conditions evidenced by, among other things, the strength of the U.S. economy and housing finance industry. Our NIW since 2008 has consisted primarily of high credit quality loans that have had significantly better credit performance than the loans originated during 2008 and prior periods. Significant contributors to the improved loan quality of our post-2008 insured portfolio include the greater risk discipline of loan originators and private mortgage insurance providers, the QM loan requirements under the Dodd Frank Act and the loan-level criteria of the PMIERs financial requirements.
Beginning in March 2020, theThe unprecedented and continually evolving social and economic impacts associated with the COVID-19 pandemic on the U.S. and global economies generally, and in particular on the U.S. housing, real estate and housing finance markets, had a
| | |
Part I. Item 2. Management’s Discussion and Analysis of Financial Condition and Results of Operations
|
negative effect on our business and our financial results for the second quarter of 2020, and since then to a lesser extentextent. See “—COVID-19 Impacts” below for further discussion of the third quarter of 2020, and are expected to adversely impactimpacts on our business associated with the COVID-19 pandemic, including an increase in our new defaults and results of operations in future periods. our Minimum Required Assets under the PMIERs financial requirements.
Despite the effects of the COVID-19 pandemic, we continued to writewrote record levels of NIW in 2020, totaling $105.0 billion. In the third quarterfirst half of 2020 and2021 we wrote NIW of $41.8 billion, a decrease of 1% compared to our NIW in the first half of 2020. We continue to believe that the long-term housing market fundamentals and outlook remain positive, including low interest rates, demographics supporting growth in the population of first-time homebuyers and a relatively constrained supply of homes available for sale. However, the economic impact of the pandemic as well as public and private sector initiatives to reduce the transmission of COVID-19, such as social distancing and the imposition of restrictions on business activities, have affected and we expect will continuelow interest rate environment in the near term to affect: (i) the number of new mortgages available for us to insure and real estate transactions available for our services; (ii) the number of mortgages we have insured that will default; and (iii) the number of defaults that, over time, will resultrecent periods has also resulted in claims that we must pay. See “—COVID-19 Impacts” below for further discussion of the expected impacts on our businessan increase in policy cancellations associated with the COVID-19 pandemic, includinghigh level of refinance activity, which has reduced our Persistency Rate, and in turn contributed to a reduction in our IIF, particularly as a result of a decline in our Single Premium Policies. This refinance activity has moderated in the effectsthree months ended June 30, 2021, and if this trend continues in the second half of low interest rates2021 we would expect the Persistency Rate for our portfolio to increase. See “Mortgage Insurance Portfolio” for additional details on our mortgage insuranceNIW and investment portfolios. Further, beginning in March 2020, the market volatility stemming from the COVID-19 pandemic caused a temporary disruption in the market for reinsurance, including new mortgage insurance-linked notes transactions. While new insurance-linked notes reinsurance transactions recently have been completed by Radian Guaranty and other private mortgage insurers, these transactions are on less favorable terms than similar reinsurance transactions executed prior to the pandemic. See “—Quarterly Highlights and Recent Company Developments” below for additional information on the reinsurance transaction with Eagle Re 2020-2 Ltd. completed in October 2020.IIF.
In recent years, Radian and other participants in the private mortgage insurance industry have engaged in a range of risk distribution transactions and strategies and refinedimplemented enhanced risk-based pricing frameworks, which we believe have helped increase the financial strength and flexibility of the mortgage insurance industry. Our expanded use ofindustry by mitigating credit risk distribution is expected to manage the risk profile and financial volatility of our mortgage insurance portfolio through varying economic cycles. We have distributed risk through third-party quota share and excess-of-loss reinsurance arrangements, as well as through the capital markets by using mortgage insurance-linked notes transactions, all of which are designed to provide additional claims paying resources during periods of economic stress. As of SeptemberJune 30, 2020, 53%2021, 71% of our primary RIF is subject to a form of risk distribution and our estimated reinsurance recoverables related to our mortgage insurance portfolio was $64.9were $74.0 million. After consideration of the Eagle Re 2020-2 Ltd. insurance-linked notes transaction that was completed in October 2020, 74% of our primary RIF as of September 30, 2020 is subject to a form of risk distribution. Through ourOur use of risk distribution structures we havehas reduced our required capital and enhanced our projected return on capital, and we expect these structures are expected to provide a level of protection in periods of economic stress such as we are currently experiencing.
In addition to the increased use of risk distribution, the mortgage insurance industry has continued to shift to a pricing environment where a variety of pricing methodologies and pricing levels are deployed with differing degrees of risk-based granularity. This shift away from a predominately rate card-based pricing model and the increase in “black box” and other pricing frameworks provides a more dynamic pricing capability that allows for more frequent pricing changes throughout the mortgage insurance industry and the ability to respond to macroeconomic shifts more quickly. See “—COVID-19 Impacts” below for discussion about our response to the pandemic, including pricing adjustments.stress.
COVID-19 Impacts
The COVID-19 pandemic has significantly impacted the global economy, disrupted global supply chains, lowered certain equity market valuations, created periods of significant economic disruption, high unemployment, volatility and disruption in financial markets, and required adjustments in the housing finance system and real estate markets and increased unemployment levels.markets. In addition, the pandemic has resulted in travel restrictions, temporary business shutdowns, and stay-at-home, quarantine, and similar orders, all of which contributed to a rapid and even as somesignificant rise in unemployment that peaked in the second quarter of 2020. Since then, businesses have been reopened, and unemployment levels have declined from their peak, but numerous operating limitations such as social distancing and extensive health and safety measures have limited operations, all of which has further contributedcontinue to the rapidlimit operations. As a result, unemployment levels remain elevated compared to pre-pandemic levels, and significant rise in unemployment, which may continue toremain elevated or may rise if the current economic disruption is prolonged.prolonged, especially in light of the recent spread of COVID-19 variants.
As a result of the COVID-19 pandemic and its impact on the economy, including the significant increase in unemployment, levels, we have experienced a material increase in new defaults including as a resultin 2020, substantially all of mortgage paymentwhich related to defaults of loans subject to forbearance
Part I. Item 2. Management’s Discussion and Analysis of Financial Condition and Results of Operations (continued)
programs. programs implemented in response to the COVID-19 pandemic. The increase in the number of new mortgage defaults resulting from the COVID-19 pandemic has had a negative effect on our results of operations and our reserve for losses beginning in the second quarter of 2020, and2020. See Note 11 of Notes to a lesser extent the third quarter of 2020. This negative impact could continue in future quarters, primarily due to the need to increaseUnaudited Condensed Consolidated Financial Statements for additional information on our reserve for losses related tolosses.
Our primary default rate was 4.0% at June 30, 2021, down from a peak of 6.5% at June 30, 2020, which was elevated by the volume of new defaults. See Note 2 of Notes to Consolidated Financial Statements in our 2019 Form 10-K for discussion of the reserving methodology for the mortgage insurance industry.
As a result of this material increase in new defaults our primary default rate increased from 2.0% at December 31, 2019 to 6.5% atin the three months ended June 30, 2020 and 5.9% at September 30, 2020. Favorable trends in the number of new defaults and curesCures were the primary drivers of the decline in our default inventory and default rate, in the third quarter of 2020, compared to their peaks at June 30, 2020. As a result of these recent more favorable trends, we updated the projections of our default rate, which we previously estimated would peak in the approximate range of 8-9% sometime later this year or in early 2021, and we currently expect this rate to remain below 6%, based on an assumption of continued economic recovery. We expect the elevated levels of both total defaults and new defaults, including defaults related to forbearances, to continue, although theThe number, timing and duration of new defaults and, in turn, the number of defaults that ultimately result in claims will depend on a variety of factors, including the scope, severity and duration of the COVID-19 pandemic, the resulting impact on the economy, including with respect to unemployment and housing prices, and the effectiveness of forbearance and other government efforts such as financial stimulus programs, to provide long-term economic and individual relief to assist homeowners. Similarly,Consequently, the number and rate of total defaults is difficult to predict and in addition towill depend on the foregoing factors will depend onand other factors, including the number and timing of Cures and claims paid and the net impact on IIF from our Persistency Rate and future NIW. See “Item 1A. Risk Factors” in our 2020 Form 10-K for additional discussion of these factors and other risks and uncertainties.
The increase in new defaults resulting from the COVID-19 pandemic may also affect our ability to remain compliant with the PMIERs financial requirements. Our Master Policies generally provide that a default occurs when a borrower misses one monthly payment, regardless of why the payment was missed, including if the payment was deferred under a forbearance program. Once two missed payments have occurred on an insured loan, the PMIERs characterize athe loan as “non-performing” and require us to establish an increased Minimum Required Asset factor for that loan regardless of the reason for the missed payments. However, as further described in “Item 1A. Risk Factors—Radian Guaranty may fail to maintain its eligibility status withDuring the GSEs, and the additional capital required to support Radian Guaranty’s eligibility could reduce our available liquidity,”COVID-19 Crisis Period, pursuant to the COVID-19 Amendment that temporarily amends the PMIERs, a Disaster Related Capital Charge that effectively reduces the Minimum Required Asset factor by 70% is nowhas been applied nationwide to all COVID-19 Defaulted Loans for no longer than three calendar months beginning with the month the loan becomes non-performing (i.e.(i.e., missed two monthly payments), or if greater, the period of time that the loan is subject to a forbearance plan, repayment plan or loan modification trial period granted in response to a financial hardship related to COVID-19. Under the terms of the COVID-19 Amendment, the COVID-19 Crisis Period ended March 31, 2021. As a result, after March 31, 2021 the Disaster Related Capital Charge will no longer be applied to all new defaults, and instead will be applied only to new defaults if they are subject to a COVID-19 forbearance plan, regardless of whether the forbearance plan
| | |
Part I. Item 2. Management’s Discussion and Analysis of Financial Condition and Results of Operations
|
was entered into before or after the expiration of the COVID-19 Crisis Period. See “—COVID-19 Amendment to PMIERs” below for more information.
The current broad-based application of the Disaster Related Capital Charge has significantly reduced the total amount of assets that Radian Guaranty otherwise would be required to hold against COVID-19 Defaulted Loans.Loans under the PMIERs. Nonetheless, even after giving effect to the Disaster Related Capital Charge, since March 31, 2020, the overall volume of new defaults resulting from the pandemic even after giving effect to the Disaster Related Capital Charge,has resulted in an increase in Radian Guaranty’s Minimum Required Assets and a decrease innegatively impacted Radian Guaranty’s excess of Available Assets over Minimum Required Assets (“PMIERs cushion”)Cushion as of SeptemberJune 30, 2020.2021. While we expect Radian Guaranty to continue to maintain its eligibility status with the GSEs, there are possible scenarios in which the projected increase innumber of new defaults could impact Radian Guaranty’s ability to comply with the PMIERs financial requirementsrequirements. See “Item 1A. Risk Factors—Radian Guaranty may fail to maintain its eligibility status with the GSEs, and could require us to contributethe additional capital required to support Radian Guaranty, whichGuaranty’s eligibility could negatively impactreduce our holding company liquidity.available liquidity
Further, the impact of the COVID-19 pandemic, including as a result of government stimulus efforts in response to the pandemic, has resulted in a historically low interest rate environment. As discussed above, this low interest rate environment contributed to strong NIW volume in the third quarter of 2020, including from continued elevated levels of refinance activity. Mortgage prepayment speeds impact the ultimate profitability of our mortgage insurance business. The increase in policy cancellations associated with the high level of refinance activity during 2020 has reduced our Persistency Rate, and in turn, limited the growth of our IIF, which is one of the primary drivers of future premiums that we expect to earn over time. If refinance activity remains elevated, resulting in earlier than anticipated loan prepayments, it could result in a decrease” in our future revenues, particularly from our Recurring Premium Policies. The low interest rate environment also affected our investment portfolio, resulting in an increase in our unrealized gains on investments in the second and third quarters of 2020 and we expect it will result in the recognition of lower net investment income in future periods if the current low interest rate environment persists and we must reinvest cash flows in lower yielding securities. In addition, the negative impacts to the global economy could result in increased defaults on corporate bonds and other financial instruments, which could increase the frequency and severity of impairments in our investment portfolio. See Note 6 of Notes to Unaudited Condensed Consolidated Financial Statements for additional information about our investments.Form 10-K.
As further described in this report, although we are uncertain of the potential magnitude or duration of the business and economic impactsas a result of the COVID-19 pandemic, we believe the resultinghave experienced increased financial requirements under the PMIERs, reducedlower Persistency Rates due to a low interest rate environment and increased reserves for losses due to higher new defaults will negatively affect ourdefaults. Although we are uncertain of the ultimate magnitude or duration of the business results of operations and financial condition. The ultimate significanceeconomic impacts of the COVID-19 pandemic, we expect that certain future developments, such as anticipated increases in our claims paid once current foreclosure moratoriums are lifted, will have an adverse impact on aspects of our businesses will depend on, among other things: the extentbusiness in future periods. See Note 1 of Notes to Unaudited Condensed Consolidated Financial Statements in this report and duration of the pandemic, the severity of and number of people infected with the virus and whether an effective anti-viral treatment or vaccine is developed and made widely
Part I. Item 2. Management’s Discussion and Analysis of Financial Condition and Results of Operations (continued)
available; the wider economic effects of the pandemic and the scope and duration of governmental and other third party measures restricting day-to-day life and business operations; the impact of economic stimulus efforts to support the economy through the pandemic; and governmental and GSE programs implemented to assist borrowers experiencing a COVID-19-related hardship, including forbearance programs and suspensions of foreclosures and evictions. See “Item 1A. Risk Factors—The COVID-19 pandemic has adversely impacted our business,us, and its ultimate impact on our business and financial results will depend on future developments, which are highly uncertain and cannot be predicted, including the scope, severity and duration of the pandemic and actions taken by governmental authorities in response to the pandemic.”
In response to the COVID-19 pandemic, we have raised in our 2020 Form 10-K for additional capital, suspended our share repurchase program, aligned our business with the temporary origination and servicing guidelines announced by the GSEs, and made adjustments to our pricing and our underwriting guidelines to account for the increased risk and uncertainty associated with the COVID-19 pandemic. In addition, we have taken a number of actions to focus on protecting and supporting our workforce, while continuing to serve our customers with excellence and support our communities. We have activated our business continuity program by transitioning to a work-from-home virtual workforce model with certain essential activities supported by limited staff in controlled office environments, and in order to support our communities during this unprecedented time, we have, among other things, pledged financial support to certain charitable organizations focused on assisting first responders, health care workers and their families. Further actions to respond to the COVID-19 pandemic and comply with governmental regulations and government and GSE programs adopted in response to the pandemic may be necessary as conditions continue to evolve.
Despite the risks and uncertainties posed by COVID-19, we believe that the steps we have taken in recent years, such as improving our debt maturity profile, enhancing our financial flexibility, implementing greater risk-based granularity into our pricing and increasing our use of risk distribution strategies to lower the risk profile and financial volatility of our mortgage insurance portfolio, will help position the Company to better withstand the negative effects from macroeconomic stresses associated with the COVID-19 pandemic, such as we expect to continue in future periods.information.
Legislative and Regulatory Developments
Our subsidiariesWe are subject to comprehensive regulation by both federal and state regulatory authorities. For a description of significant state and federal regulations and other requirements. In addition to the discussion below, see “Item 1. Business—Regulation” in our 2019 Form 10-K for a discussionrequirements of the regulationsGSEs that impactare applicable to our business,businesses, as well as legislative and regulatory developments affecting the housing finance industry.industry, see “Item 1. Business—Regulation” in our 2020 Form 10-K. Except as discussed below, there were no significant regulatory developments impacting our businesses from those discussed in our 2020 Form 10-K.
PMIERs. In orderCOVID-19 Amendment to be eligible to insure loans purchased by the GSEs, mortgage insurers such as Radian Guaranty must meet the GSEs’ eligibility requirements, or PMIERs. Radian Guaranty currently is an approved mortgage insurer under the PMIERs. See “Liquidity and Capital Resources—Mortgage” for further discussion about PMIERs. For a discussion of the impact of the COVID-19 pandemic on our PMIERs eligibility and the most recent amendments to the PMIERs that were adopted effective June 30,
In 2020, in response to the COVID-19 pandemic, the GSEs issued guidelines (“National Emergency Guidelines”) that became effective June 30, 2020 and, among other things, adopted the COVID-19 Amendment to the PMIERs to apply a Disaster Related Capital Charge nationwide to certain non-performing loans that we refer to as COVID-19 Defaulted Loans, which comprise non-performing loans that either: (i) have an Initial Missed Payment (discussed below) occurring during the COVID-19 Crisis Period or (ii) are subject to a forbearance plan granted in response to a financial hardship related to COVID-19 (which is assumed under the COVID-19 Amendment to be the case for any loan that has an Initial Missed Payment occurring during the COVID-19 Crisis Period and is subject to a forbearance plan), the terms of which are materially consistent with the terms of forbearance plans offered by the GSEs. The Disaster Related Capital Charge effectively reduces the Minimum Required Asset factor that applies to COVID-19 Defaulted Loans in recognition of the fact that these loans generally have a higher likelihood of curing. Under the COVID-19 Amendment, the Disaster Related Capital Charge applies for three calendar months beginning with the month the loan becomes non-performing (i.e., missed two monthly payments), or if greater, the period of time that the loan is subject to a forbearance plan, repayment plan or loan modification trial period granted in response to a financial hardship related to COVID-19.
Under the terms of the COVID-19 Amendment, the COVID-19 Crisis Period ended March 31, 2021. As a result, as of April 1, 2021 the Disaster Related Capital Charge is no longer applied to all new defaults, and instead is applied only to new defaults if they are subject to a COVID-19 forbearance plan, regardless of whether the forbearance plan was entered into before or after the expiration of the COVID-19 Crisis Period. The Disaster Related Capital Charge will continue to be applied to these COVID-19 Defaulted Loans for as long as they remain in the COVID-19 forbearance plan. With respect to defaults that occurred during the COVID-19 Crisis Period, the Disaster Related Capital Charge will continue to apply until: (i) they fail to enter a COVID-19 forbearance program within three calendar months beginning with the month the loan becomes non-performing (i.e., missed two monthly payments) or (ii) for defaults subject to a COVID-19 forbearance plan, repayment plan or loan modification trial period, they exit the program, plan or trial period without curing the default status. Given the ongoing improvement in new default trends, we do not expect the expiration of the COVID-19 Crisis Period to have a material impact on our business, results of operations or financial condition.
Further, pursuant to the National Emergency Guidelines, through June 30, 2021, certain capital preservation measures were instituted that required the consent of the GSEs for private mortgage insurers, including Radian Guaranty, to: (i) pay dividends or make payments of principal or increase payments of interest beyond those commitments made prior to June 30, 2020 associated with the Surplus Notes; (ii) make any other payments, unless related to expenses incurred in the normal course of business or to commitments made prior to June 30, 2020; (iii) pledge or transfer asset(s) to any affiliate or investor;
| | |
Part I. Item 2. Management’s Discussion and Analysis of Financial Condition and Results of Operations
|
or (iv) enter into any new arrangements or alter any existing arrangements under tax-sharing and intercompany expense-sharing agreements other than renewals and extensions of agreements in effect prior to June 30, 2020 (collectively, the “Capital Preservation Actions”). Effective July 1, 2021, the National Emergency Guidelines were modified to extend the capital preservation measures through December 31, 2021 and to provide an exception that would permit Radian Guaranty and the other private mortgage insurers to pay dividends and take the other Capital Preservation Actions without the GSEs’ prior consent as long as the private mortgage insurer’s PMIERs Cushion remains above an applicable threshold, as further described below. From July 1, 2021 through September 30, 2021, a private mortgage insurer may pay dividends or take the other Capital Preservation Actions without the prior consent of the GSEs as long as its PMIERs Cushion is 50% or greater than its Minimum Required Assets and taking such actions would not cause its PMIERs cushion to fall below 50% of its Minimum Required Assets as of the end of the quarter ending September 30, 2021. From October 1, 2021 through December 30, 2021, a private mortgage insurer may pay dividends or take the other Capital Preservation Actions without the prior consent of the GSEs as long as its PMIERs Cushion is 15% or greater than its Minimum Required Assets and taking such actions would not cause its PMIERs Cushion to fall below 15% of its Minimum Required Assets as of the end of the quarter ending December 31, 2021.
For additional information on the risks associated with the expiration of the COVID-19 Crisis Period and the capital preservation measures, see “Item 1A. Risk Factors—Radian Guaranty may fail to maintain its eligibility status with the GSEs, and the additional capital required to support Radian Guaranty’s eligibility could reduce our available liquidity.liquidity” and “Radian Group’s sources of liquidity may be insufficient to fund its obligations” in our 2020 Form 10-K.
CARES Act. Change in FHFA Leadership
On March 27, 2020,June 23, 2021, following a U.S. Supreme Court decision that determined that the CARES ActFHFA director may be removed by the President other than for cause, President Biden removed FHFA director Dr. Mark Calabria, who was enacted in response to the COVID-19 pandemic. The CARES Act, among other things, provides: (i) loans, loan guarantees, grants, assistance payments, contracts and tax incentives to eligible businesses; (ii) tax relief for businesses, including a five-year NOL carryback, payroll tax relief and other provisions; (iii) direct cash assistance for individuals; and (iv) emergency funding for hospitals and assistance to state and local governments responding to the COVID-19 pandemic. In addition,appointed under the CARES Act, upon request by borrowersTrump Administration, and appointed Sandra Thompson as acting director of federally backed mortgage loans who attest to financial hardship related to the pandemic, mortgage servicers are required to provide these borrowers with up to 180 days forbearance on their mortgage payments, which may be extended for an additional 180 days upon request, without requiring validation by the borrowers of their hardship. The GSEs have amended their forbearance programs to align with the CARES Act, and we understand that a significant number of borrowers are participating in such programs, which has increased the number of defaults in our mortgage insurance portfolio and negatively impacted our results of operations, financial condition and Minimum Required AssetsFHFA. As discussed under the PMIERs. See “Item 1A. Risk Factors” for additional information onFactors—Changes in the potential impactscharters, business practices, or role of the CARES ActGSEs in the U.S. housing market generally, could significantly impact our businesses” in our 2020 Form 10-K, a change in leadership at the FHFA could alter the policy priorities at the FHFA and modify the GSEs’ business practices in ways that have a significant impact on the GSEs, loan servicers and our PMIERs financial requirements.businesses.
Qualified Mortgage (QM) Requirements - Ability to Repay Requirements. Pursuant toRequirements
Under the Dodd FrankDodd-Frank Act, the Ability to Repay Rule requires mortgage lenders tomust make a reasonable and good faith determination that, at the time the loan is consummated, the consumer has a reasonable ability to repay the loan.loan (the “Ability to Repay Rule”). The Dodd-Frank Act provides that a creditor may presume that a borrower will be able to repay a loan if the loan has certain low-risk characteristics that meet the definition of a qualified mortgage, or QM (“QM(the “QM Rule”). This QM presumption is generally rebuttable; however, loans that are deemed to have the lowest risk profiles are granted a safe harbor from liability (“QM Safe Harbor”) related to the borrower’s ability to repay the loan. In adoptingimplementing the QM Rule, the CFPBConsumer Financial Protection Bureau (“CFPB”) established rigorous underwriting and product feature requirements for the loans to be deemed qualified mortgages. Within those regulations,QMs (“Original QM Definition”), including that the borrower does not exceed a 43% debt-to-income ratio after giving effect to the loan. As part of the Original QM Definition, the CFPB also created a special exemption for the GSEs, thatwhich is generally referred to as the QM“QM Patch, and” that allows any loan that meets the GSE underwriting and product guidelinesfeature requirements to be deemed to be a QM. On October 20,QM, regardless of whether the loan exceeds the 43% debt-to-income ratio. The QM Patch expired on July 1, 2021.
In December 2020, the CFPB issued a final rule that extends the QM Patch until thefinalized two new definitions of QM. One of these new QM Definition (defined below) becomes effective. For additional information about the QM Rule and the QM Patch, see “Item 1. Business—Regulation—Federal Regulation—The Dodd Frank Act” in our 2019 Form 10-K.
Part I. Item 2. Management’s Discussion and Analysis of Financial Condition and Results of Operations (continued)
In June 2020, the CFPB issued for comment a proposed new definition of QMdefinitions (the “New General QM Definition”) that wouldis intended to replace the underwriting focused approach of the Original QM Definition, including the 43% debt-to-income ratio limit from the current definition of a QM (the “Current QM Definition”)limitation, with a new pricing-based loan definition such thatapproach to QM. Under the New General QM Definition, certain underwriting considerations are retained, but QM status would be determined based on a loan’s price in relation togenerally is achieved if the loan is priced at no greater than 2.25% above the Average Prime Offer Rate (“APOR”). In addition, on August 18, 2020,Loans priced at or less than 1.5% above APOR are subject to the QM Safe Harbor, while all other QM loans would receive the general rebuttable presumption that the loans met the ability to repay standard. Separately, the CFPB issued acreated another new proposal to create a new category of QMs (Seasoned QMs)QM definition (“Seasoned QM”) for first-lien, fixed-rate loans that meet certain performance requirements over a 36-month seasoning period and are held in the lender’s portfolio until the end of the seasoning period. Both new QM definitions became effective on March 1, 2021. The comment periodsNew General QM Definition originally had a mandatory compliance date of July 1, 2021, after which the Original QM Definition and QM Patch would no longer apply. The CFPB recently issued a rule delaying the mandatory compliance deadline for these proposals have concluded,the New General QM Definition until October 1, 2022, thereby preserving the Original QM Definition and we understandQM Patch until such date.
On April 8, 2021, the GSEs announced that for loan applications received on or after July 1, 2021 they will only purchase loans satisfying the New General QM Definition. As a result, even though the CFPB is currently considering these comments in finalizinghas delayed the mandatory compliance date for the New General QM Definition until October 1, 2022, for GSE-acquired loans with applications received on or after July 1, 2021, the QM Patch effectively will be limited to loans that satisfy the New General QM Definition. We expect that this decision by the GSEs will reduce the number of loans that otherwise would be designated QM compared to those receiving QM designation under the QM Patch, although not materially. For more information regarding the CFPB’s proposed New General QM Definition and the risks it may present for us, see “Item 1A. Risk Factors—A decrease in the volume of mortgage originations could result in fewer opportunities for us to write new mortgage insurance business and conduct our Real Estate business.business” in our 2020 Form 10-K.
42
Enterprise Regulatory Capital Framework (ECF). As part of its priority to recapitalize the GSEs, the FHFA is seeking to finalize capital requirements for the GSEs. In May 2020, the FHFA issued for comment a re-proposed ECF for the GSEs, which among other things, would: (i) significantly increase the capital requirements of the GSEs; (ii) decrease the capital credit provided to the GSEs by credit risk transfer transactions; and (iii) reduce the overall capital relief extended to the GSEs for loans with private mortgage insurance. The comment period for the re-proposed ECF concluded on August 31, 2020, and we understand the FHFA is currently reviewing these comments and considering proposed changes to the re-proposed ECF. We believe the FHFA is committed to finalizing the ECF in the near term, although the ultimate form and timing of the final rule is uncertain. If and when the ECF is finalized, we anticipate that the GSEs will seek to amend the PMIERs financial requirements to align with the final form of the ECF. For more information regarding the ECF and its potential impact on our business, see “Item 1A. Risk Factors—Changes in the charters, business practices, or role of the GSEs in the U.S. housing market generally, could significantly impact our businesses.”
| | |
Part I. Item 2. Management’s Discussion and Analysis of Financial Condition and Results of Operations
|
Recent Company Developments
In October 2020, Radian GuarantyDuring the second quarter of 2021, we introduced “homegenius” as the new name for our former Real Estate segment. We renamed the segment “homegenius” to align with updates to our branding strategy for the segment’s products and services. Our homegenius business segment encompasses a suite of existing and emerging digital products and services that leverage big data and analytics and are powered by advanced technology to serve real estate agents, lenders, investors and consumers across the real estate ecosystem. We expect the homegenius segment to contribute to the future growth and results of operations of the Company.
During the second quarter of 2021, in response to the COVID-19 pandemic and Radian’s successful transition to a virtual work environment, we made the decision to exit, and to actively market for sublease, all office space in our current corporate headquarters. As part of this change, we also entered into a fourth fully collateralized reinsurance agreement,new lease with Eagle Re 2020-2 Ltd. Eagle Re 2020-2 Ltd. is a VIEreduced square footage at another Philadelphia area location, which will offer flexible, virtual and is not a subsidiary or affiliate of Radian Guaranty. This reinsurance agreement provides for uphybrid work arrangements to $390.3 million of aggregate excess-of-loss reinsurance coverage for the mortgage insurance losses onour employees and upon opening we intend to designate as our new defaults on an existing portfolio of eligible Recurring Premium Policies with initial RIF of $13.0 billion that were issued between October 1, 2019 and July 31, 2020. Eagle Re 2020-2 Ltd. financed its coverage by issuing mortgage insurance-linked notes in an aggregate amount of $390.3 million to eligible third-party capital markets investors in an unregistered private offering. For additional information about our reinsurance arrangements, see Note 8 of Notes to Unaudited Condensed Consolidated Financial Statements.
In October 2020, consistent with increased market demand for more technology-driven solutions, we announced the wind down of our traditional appraisal business, which offers residential real estate appraisal services through a panel of independent contractor appraisers. This action reinforces our strategic focus on our core Real Estate business and is not expected to have a material impact on our future results of operations, liquidity or financial condition. We continue to invest in and offer automated valuation products and other digital valuation services.corporate headquarters location. See Note 19 of Notes to Unaudited Condensed Consolidated Financial Statements for additional discussion of our Real Estate segment and the other core products and services that we continue to offer.information, including details on related impairments.
Key Factors Affecting Our Results
The key factors affecting our results are discussed in our 20192020 Form 10-K. There have been no material changes to these key factors.
Part I. Item 2. Management’s Discussion and Analysis of Financial Condition and Results of Operations (continued)
Mortgage Insurance Portfolio
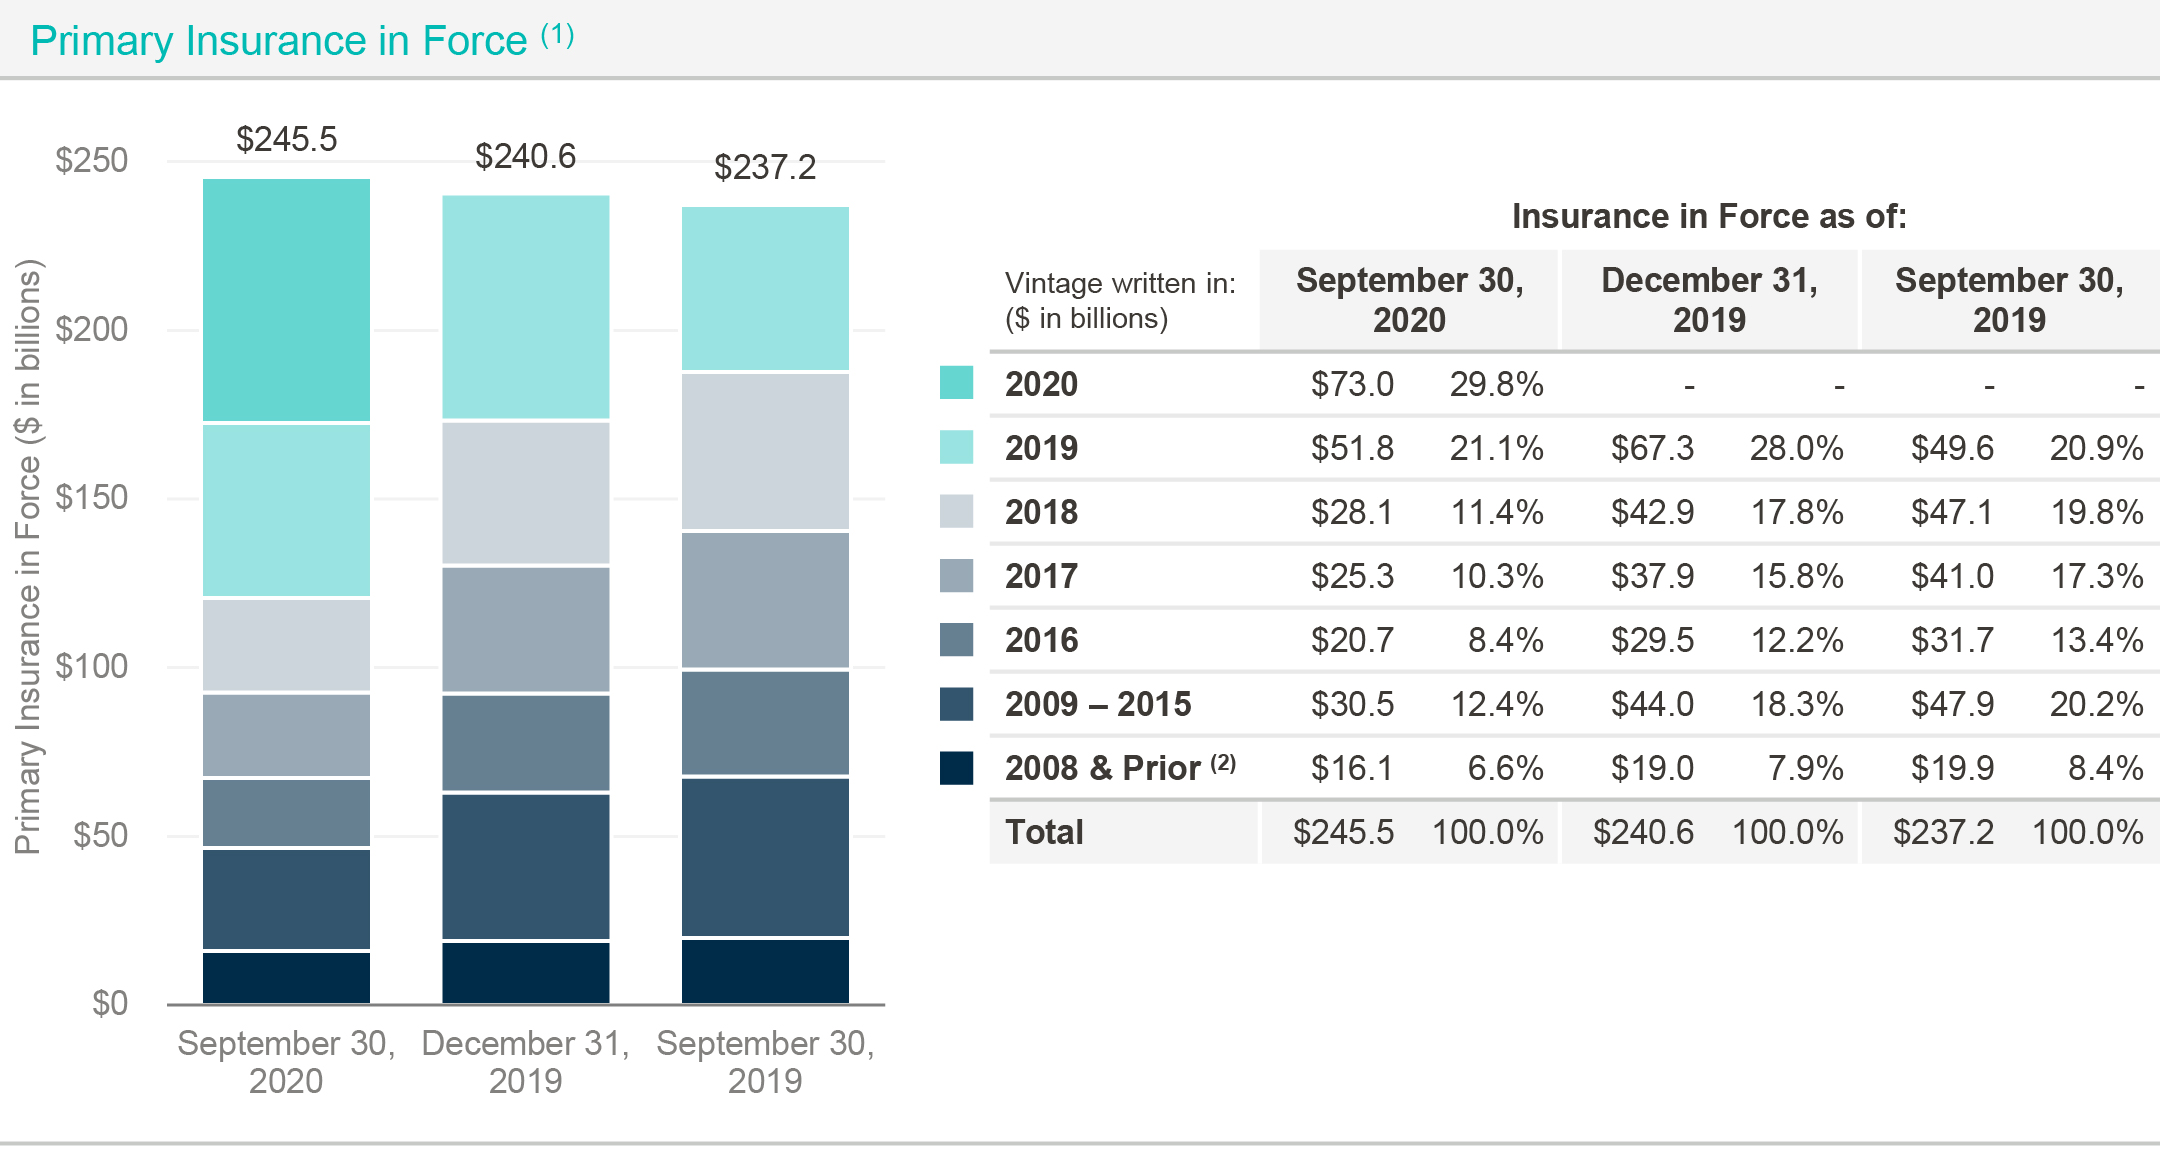
| | |
IIF by origination vintage (1) |
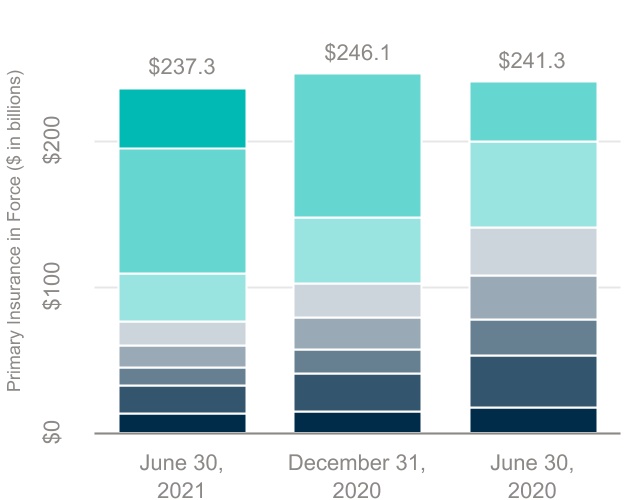
| | | | | | | | | | | | | | | | | | | | | | | |
| | Insurance in Force as of: |
| Vintage written in:
($ in billions) | June 30,
2021 | December 31, 2020 | June 30,
2020 |
| ¢ | 2021 | $41.0 | 17.3 | % | $— | — | % | $— | — | % |
| ¢ | 2020 | 86.9 | 36.6 | | 98.8 | 40.2 | | 41.5 | 17.2 | |
| ¢ | 2019 | 32.3 | 13.6 | | 44.6 | 18.1 | | 58.4 | 24.2 | |
| ¢ | 2018 | 16.7 | 7.1 | | 23.5 | 9.5 | | 33.1 | 13.7 | |
| ¢ | 2017 | 15.2 | 6.4 | | 21.2 | 8.6 | | 30.4 | 12.6 | |
| ¢ | 2016 | 13.0 | 5.5 | | 17.5 | 7.1 | | 24.6 | 10.2 | |
| ¢ | 2009 - 2015 | 19.1 | 8.0 | | 25.7 | 10.5 | | 36.1 | 15.0 | |
| ¢ | 2008 & Prior (2) | 13.1 | 5.5 | | 14.8 | 6.0 | | 17.2 | 7.1 | |
| Total | $237.3 | 100.0 | % | $246.1 | 100.0 | % | $241.3 | 100.0 | % |
| | | | | | | |
(1)Policy years represent the original policy years, and have not been adjusted to reflect subsequent refinancing activity under HARP.
(2)Adjusted to reflect subsequent refinancing activity under HARP, these percentages would decrease to 3.9%3.5%, 4.7%3.7% and 5.0%4.2% as of SeptemberJune 30, 2020,2021, December 31, 20192020 and SeptemberJune 30, 2019,2020, respectively.
New Insurance Written
A key component of our current business strategy is to write profitable NIW. We wrote $33.3$21.7 billion and $75.4$41.8 billion of primary new mortgage insurance in the three and ninesix months ended SeptemberJune 30, 2020,2021, respectively, compared to $22.0$25.5 billion and $51.4$42.1 billion of NIW in the three and ninesix months ended SeptemberJune 30, 2019,2020, respectively. Our NIW forAs shown in the third quarter ofchart above, IIF decreased to $237.3 billion at June 30, 2021, from $246.1 billion at December 31, 2020, partially offsetdriven by a lower Persistency Rate, as described below, resulted in an increase in IIF to $245.5 billion at September 30, 2020, from $240.6 billion at December 31, 2019 as shown inpartially offset by our NIW for the chart above.first six months of 2021.
Our NIW increaseddecreased by 51.2%14.9% and 46.6%0.9% for the three and ninesix months ended SeptemberJune 30, 2020,2021, respectively, compared to the same periods in 2019,2020, due to a strongour lower market share partially offset by increases in purchase mortgage origination market including higher refinance activity, aided by a historically low interest rate environment, and increased private mortgage insurance penetration rates.originations. According to industry forecasts, total mortgage origination volume was higher for the three and ninesix months ended SeptemberJune 30, 2020,2021, as compared to the comparable periodsperiod in 2019,2020, due to a strong purchase market and, a significantfor the six months ended June 30, 2021, an increase in refinance originations driven largely by lowerresulting from the low interest rates.rate environment.
Although it is difficult to project future volumes, industry sources expectrecent market projections for 2021 estimate total mortgage originations of approximately $3.9 trillion, which would represent a decline in the total annual mortgage origination market for the full year 2020 to increase significantly of 5-10% as
| | |
Part I. Item 2. Management’s Discussion and Analysis of Financial Condition and Results of Operations
|
compared to 2019, driven by the increase2020, with a private mortgage insurance market of $550 to $600 billion. This outlook anticipates a decrease in refinance originations in the second half of 2021. While expectations for refinance volume vary, there is consensus around a large purchase market driven by increased home sales, which is a positive for mortgage insurers given the higher likelihood that purchase loans will utilize private mortgage insurance as a resultcompared to refinance loans. If refinance volume declines, we would expect the Persistency Rate for our portfolio to increase, benefiting the size of lower interest rates. Based on industry forecasts and our projections, we currently expect our NIW in 2020 to be more than $100 billion, although the risks and uncertainties related to this projection have increased due to the COVID-19 pandemic.IIF portfolio. See "Overview—COVID-19 Impacts” above and “Item 1A. Risk Factors” in our 2020 Form 10-K for more information.
NIW for direct Single Premiums include policies written on an individual basis (as each loan is originated) and on an aggregated basis (in which each individual loan in a group of loans is insured in a single transaction, typically after the loans
Part I. Item 2. Management’s Discussion and Analysis of Financial Condition and Results of Operations (continued)
have been originated). The following table provides selected information as of and for the periods indicated related to our mortgage insurance NIW.
| | NIW | | NIW |
| | | Three Months Ended
September 30, | | Nine Months Ended
September 30, | | Three Months Ended
June 30, | | Six Months Ended
June 30, |
| ($ in millions) | ($ in millions) | 2020 | | 2019 | | 2020 | | 2019 | ($ in millions) | | 2021 | | 2020 | | 2021 | | 2020 |
Total primary NIW | $ | 33,320 | | | $ | 22,037 | | | $ | 75,391 | | | $ | 51,416 | | |
Total primary risk written | $ | 7,970 | | | $ | 5,261 | | | $ | 17,712 | | | $ | 12,531 | | |
| NIW | | NIW | | $ | 21,662 | | | $ | 25,459 | | | $ | 41,761 | | | $ | 42,143 | |
| Primary risk written | | Primary risk written | | $ | 5,236 | | | $ | 5,864 | | | $ | 9,747 | | | $ | 9,758 | |
| Average coverage percentage | Average coverage percentage | 23.9 | % | | 23.9 | % | | 23.5 | % | | 24.4 | % | Average coverage percentage | | 24.2 | % | | 23.0 | % | | 23.3 | % | | 23.2 | % |
| | Primary NIW by Loan Purpose: | | | | | | | |
| NIW by loan purpose | | NIW by loan purpose | | | | | | | | |
| Purchases | Purchases | 70.5 | % | | 80.7 | % | | 64.8 | % | | 86.4 | % | Purchases | | 77.1 | % | | 56.4 | % | | 68.5 | % | | 60.3 | % |
| Refinances | Refinances | 29.5 | % | | 19.3 | % | | 35.2 | % | | 13.6 | % | Refinances | | 22.9 | % | | 43.6 | % | | 31.5 | % | | 39.7 | % |
| | Primary NIW by Premium Type: | | | | | | | |
| Total borrower-paid NIW | | Total borrower-paid NIW | | 99.1 | % | | 97.8 | % | | 99.2 | % | | 97.4 | % |
| | NIW by premium type | | NIW by premium type | | | | | | | | |
| Direct Monthly and Other Recurring Premiums | Direct Monthly and Other Recurring Premiums | 90.0 | % | | 85.0 | % | | 86.2 | % | | 84.0 | % | Direct Monthly and Other Recurring Premiums | | 93.1 | % | | 84.7 | % | | 91.7 | % | | 83.3 | % |
| Borrower-paid | 9.0 | | | 13.1 | | | 12.3 | | | 13.5 | | |
Lender-paid (1) | 1.0 | | | 1.9 | | | 1.5 | | | 2.5 | | |
| Direct single premiums | 10.0 | | | 15.0 | | | 13.8 | | | 16.0 | | |
| Total | 100.0 | % | | 100.0 | % | | 100.0 | % | | 100.0 | % | |
Direct single premiums (1) | | Direct single premiums (1) | | 6.9 | % | | 15.3 | % | | 8.3 | % | | 16.7 | % |
| | Total borrower-paid | 98.5 | % | | 97.1 | % | | 97.9 | % | | 96.5 | % | |
| Primary NIW by FICO Score (2) : | | | | | | | |
NIW by FICO Score (2) | | NIW by FICO Score (2) | | | | | | | | |
| >=740 | >=740 | 66.2 | % | | 64.1 | % | | 66.5 | % | | 62.1 | % | >=740 | | 61.4 | % | | 67.3 | % | | 62.9 | % | | 66.6 | % |
| 680-739 | 680-739 | 30.7 | % | | 31.5 | % | | 30.6 | % | | 32.5 | % | 680-739 | | 33.1 | % | | 30.1 | % | | 32.3 | % | | 30.5 | % |
| 620-679 | 620-679 | 3.1 | % | | 4.4 | % | | 2.9 | % | | 5.4 | % | 620-679 | | 5.5 | % | | 2.6 | % | | 4.8 | % | | 2.9 | % |
| | | Primary NIW by LTV: | | | | | | | |
| NIW by LTV | | NIW by LTV | | | | | | | | |
| 95.01% and above | 95.01% and above | 9.7 | % | | 16.8 | % | | 9.2 | % | | 18.7 | % | 95.01% and above | | 10.9 | % | | 8.3 | % | | 9.5 | % | | 8.9 | % |
| 90.01% to 95.00% | 90.01% to 95.00% | 39.6 | % | | 37.4 | % | | 38.1 | % | | 38.5 | % | 90.01% to 95.00% | | 40.4 | % | | 36.4 | % | | 36.2 | % | | 36.9 | % |
| 85.01% to 90.00% | 85.01% to 90.00% | 28.3 | % | | 27.4 | % | | 29.3 | % | | 27.2 | % | 85.01% to 90.00% | | 27.6 | % | | 29.8 | % | | 29.4 | % | | 30.0 | % |
| 85.00% and below | 85.00% and below | 22.4 | % | | 18.4 | % | | 23.4 | % | | 15.6 | % | 85.00% and below | | 21.1 | % | | 25.5 | % | | 24.9 | % | | 24.2 | % |
|
(1)Lender-paidBorrower-paid Single Premium Policies have higher Minimum Required Assets underwere 6.6% and 8.0% of NIW for the PMIERs asthree and six months ended June 30, 2021, respectively, compared to borrower-paid Single Premium Policies.13.6% and 14.8% for the same periods in2020, respectively. See “Item 1. Business—Regulation—Federal Regulation—GSE Requirements—PMIERs—Private Mortgage Insurer Eligibility Requirements”Requirements” in our 20192020 Form 10-K for additional information.
(2)For loans with multiple borrowers, the percentage of primary NIW by FICO score represents the lowest of the borrowers’ FICO scores.
Insurance and Risk in Force
IIF at SeptemberJune 30, 2020 increased 3.5%2021 decreased 1.7% as compared to the same period last year, reflecting a 10.0% increase28.2% decline in MonthlySingle Premium Policies in force, partially offset by a 12.7% declinean 8.1% increase in SingleMonthly Premium Policies in force. As shown in the table below, our Persistency Rate at September 30, 2020 declined as compared to the same period in 2019. Historically, there is a close correlation between interest rates and Persistency Rates. Lower interest rate environments generally increase refinancings, which increase the cancellation rate of our insurance and negatively affect our Persistency Rates. As shown in the table below, our Persistency Rate for the 12 months ended June 30, 2021 declined as compared to the same period in 2020. The decline in our Persistency Rate and the related decline in our Single Premium Policies in force at SeptemberJune 30, 2020 was primarily2021, were attributable to increased refinance activity resulting from historically low interest rates, and resulted inwhich led to an increase in single premium cancellations and the declineSingle
| | |
Part I. Item 2. Management’s Discussion and Analysis of Financial Condition and Results of Operations
|
Premium Policy cancellations. This increase in Single Premium PoliciesPolicy cancellations was the primary driver of the decrease in force.unearned premiums on our condensed consolidated balance sheet at June 30, 2021 as compared to December 31, 2020.
Our IIF is the primary driver of the future premiums that we expect to earn over time. Although not reflected in the current period financial statements, nor in our reported book value, we expect our IIF to generate substantial premiums in future periods, due to the high credit quality of our current mortgage insurance portfolio and its expected persistency over multiple years. See “Item 7. Management’s Discussion and Analysis of Financial Condition and Results of Operations—Key Factors Affecting Our Results—Mortgage Insurance—IIF; Persistency Rate; Mix of Business”Mortgage—IIF and Related Drivers” in our 20192020 Form 10-K for more information.
Our earnings in future periods are subject to elevated risks and uncertainties due to the potential impact of the unprecedented and continually evolving social and economic impacts associated with the current COVID-19 pandemic on the
Part I. Item 2. Management’s Discussion and Analysis of Financial Condition and Results of Operations (continued)
U.S. and global economies generally, and in particular on the U.S. housing, real estate and housing finance markets. See Note 1 of Notes to Unaudited Condensed Consolidated Financial Statements for additional information about the COVID-19 pandemic, which could have a material negative effect on the Company’s business, liquidity, results of operations and financial condition. See “Overview—COVID-19 Impacts”and,“Item in our 2020 Form 10-K, “Item 1A. Risk Factors” for additional information.
Historical loan performance data indicates that credit scores and underwriting quality are key driverspredictors of credit performance. As of SeptemberJune 30, 2020,2021, substantially all of our total primary RIF is comprised of our portfolio of business written subsequent to 2008 including refinancings under HARP, represented approximately 96.1% of our total primary RIF. Loan originations after 2008 haveand has consisted primarily of high credit quality loans with significantly better credit performance than loans originated during 2008 and prior periods. The volume of insurance that we have written on high credit quality loans after 2008 has significantly improved our mortgage insurance portfolio mix. To date,Although our actual and expected future losses on our portfolio written after 2008, together with refinancings under HARP, have beenare significantly lower than those experienced on our NIW prior to and including 2008. However,2008, the impact to our future losses from the COVID-19 pandemic, including from recent and continuing increases inelevated levels of unemployment, which may be prolonged, is highly uncertain.
Throughout this report, unless otherwise noted, RIF is presented on a gross basis and includes the amount ceded under reinsurance. RIF and IIF for direct Single Premiums include policies written on an individual basis (as each loan is originated) and on an aggregated basis (in which each individual loan in a group of loans is insured in a single transaction, typically after the loans have been originated).
| | |
Part I. Item 2. Management’s Discussion and Analysis of Financial Condition and Results of Operations
|
The following table provides selected information as of and for the periods indicated related to mortgage insurance IIF and RIF.
| | | IIF and RIF | | IIF and RIF |
| | ($ in millions) | ($ in millions) | September 30, 2020 | | December 31, 2019 | | September 30, 2019 | ($ in millions) | | June 30, 2021 | | December 31, 2020 | | June 30, 2020 |
Total primary IIF | $ | 245,467 | | | $ | 240,558 | | | $ | 237,158 | | |
Total primary RIF | $ | 60,989 | | | $ | 60,921 | | | $ | 60,420 | | |
| Primary IIF | | Primary IIF | | $ | 237,302 | | | $ | 246,144 | | | $ | 241,306 | |
| Primary RIF | | Primary RIF | | $ | 58,040 | | | $ | 60,656 | | | $ | 60,311 | |
| Average coverage percentage | Average coverage percentage | 24.8 | % | | 25.3 | % | | 25.5 | % | Average coverage percentage | | 24.5 | % | | 24.6 | % | | 25.0 | % |
| Total primary RIF on defaulted loans | Total primary RIF on defaulted loans | $ | 3,747 | | | $ | 1,061 | | | $ | 1,012 | | Total primary RIF on defaulted loans | | $ | 2,345 | | | $ | 3,250 | | | $ | 4,263 | |
| Percentage of RIF in default | 6.1 | % | | 1.7 | % | | 1.7 | % | |
| | Persistency Rate (12 months ended) | Persistency Rate (12 months ended) | 65.6 | % | (1) | 78.2 | % | | 81.5 | % | Persistency Rate (12 months ended) | | 57.7 | % | | 61.2 | % | | 70.2 | % |
Persistency Rate (quarterly, annualized) (2) | 60.0 | % | (1) | 75.0 | % | | 75.5 | % | |
Persistency Rate (quarterly, annualized) (1) | | Persistency Rate (quarterly, annualized) (1) | | 66.3 | % | | 60.4 | % | | 63.8 | % |
| | Primary RIF by Premium Type: | | | | | |
| Total borrower-paid RIF | | Total borrower-paid RIF | | 88.4 | % | | 86.3 | % | | 81.2 | % |
| | Primary RIF by Premium Type | | Primary RIF by Premium Type | | | | | | |
| Direct Monthly and Other Recurring Premiums | Direct Monthly and Other Recurring Premiums | 76.8 | % | | 72.4 | % | | 72.0 | % | Direct Monthly and Other Recurring Premiums | | 81.2 | % | | 79.1 | % | | 73.8 | % |
Direct single premiums (2) | | Direct single premiums (2) | | 18.8 | % | | 20.9 | % | | 26.2 | % |
| | Borrower-paid | 9.7 | | | 9.1 | | | 8.5 | | |
Lender-paid (3) | 13.5 | | | 18.5 | | | 19.5 | | |
| Direct single premiums | 23.2 | | | 27.6 | | | 28.0 | | |
| Total | 100.0 | % | | 100.0 | % | | 100.0 | % | |
| | Total borrower-paid | 84.2 | % | | 78.9 | % | | 77.8 | % | |
| Primary RIF by FICO Score (4) : | | | | | |
Primary RIF by FICO Score (3) | | Primary RIF by FICO Score (3) | | | | | | |
| >=740 | >=740 | 57.6 | % | | 56.9 | % | | 56.2 | % | >=740 | | 57.5 | % | | 57.5 | % | | 57.4 | % |
| 680-739 | 680-739 | 34.3 | % | | 34.2 | % | | 34.5 | % | 680-739 | | 34.8 | % | | 34.6 | % | | 34.3 | % |
| 620-679 | 620-679 | 7.5 | % | | 8.2 | % | | 8.6 | % | 620-679 | | 7.2 | % | | 7.3 | % | | 7.7 | % |
| <=619 | <=619 | 0.6 | % | | 0.7 | % | | 0.7 | % | <=619 | | 0.5 | % | | 0.6 | % | | 0.6 | % |
| | Primary RIF by LTV: | | | | | |
| Primary RIF by LTV | | Primary RIF by LTV | | | | | | |
| 95.01% and above | 95.01% and above | 14.3 | % | | 14.2 | % | | 13.9 | % | 95.01% and above | | 14.5 | % | | 14.4 | % | | 14.2 | % |
| 90.01% to 95.00% | 90.01% to 95.00% | 50.1 | % | | 51.3 | % | | 51.9 | % | 90.01% to 95.00% | | 48.5 | % | | 49.3 | % | | 50.4 | % |
| 85.01% to 90.00% | 85.01% to 90.00% | 27.9 | % | | 27.9 | % | | 27.9 | % | 85.01% to 90.00% | | 28.1 | % | | 28.0 | % | | 28.1 | % |
| 85.00% and below | 85.00% and below | 7.7 | % | | 6.6 | % | | 6.3 | % | 85.00% and below | | 8.9 | % | | 8.3 | % | | 7.3 | % |
| |
(1)The Persistency Rate was reduced in part by an increase in cancellations identified by our ongoing servicer monitoring process for Single Premium Policies.
Part I. Item 2. Management’s Discussion and Analysis of Financial Condition and Results of Operations (continued)
(2)The Persistency Rate on a quarterly, annualized basis is calculated based on loan-level detail for the quarter ending as of the date shown. It may be impacted by seasonality or other factors, including the level of refinance activity during the applicable periods, and may not be indicative of full-year trends.
(3)(2)Lender-paidBorrower-paid Single Premium Policies have higher Minimum Required Assets underwere 9.2%, 9.4% and 9.9% of primary RIF for the PMIERs as compared to borrower-paid Single Premium Policies.periods indicated, respectively.
(4)(3)For loans with multiple borrowers, the percentage of primary RIF by FICO score represents the lowest of the borrowers’ FICO scores.
Risk Distribution
We use third-party reinsurance in our mortgage insurance business as part of our risk distribution strategy, including to manage our capital position and risk profile. When we enter into a reinsurance agreement, the reinsurer receives a premium and, in exchange, insures an agreed-upon portion of incurred losses. While these arrangements have the impact of reducing our earned premiums, they reduce our required capital and are expected to increase our return on required capital for the related policies. The impact of these programs on our financial results will vary depending on the level of ceded RIF, as well as the levels of prepayments and incurred losses on the reinsured portfolios, among other factors. See “Item 7. Management’s Discussion and Analysis of Financial Condition and Results of Operations—Key Factors Affecting Our Results—Mortgage Insurance—Mortgage—Risk Distribution”Distribution” and Note 8 of Notes to Consolidated Financial Statements in our 20192020 Form 10-K for more information about our reinsurance transactions.
| | |
Part I. Item 2. Management’s Discussion and Analysis of Financial Condition and Results of Operations
|
The table below provides information about the amounts by which Radian Guaranty’s reinsurance programs reduced its Minimum Required Assets as of the dates indicated.
| | (In thousands) | September 30, 2020 | | December 31, 2019 (1) | | September 30, 2019 (1) | |
| PMIERs impact - reduction in Minimum Required Assets: | | | | | | |
| PMIERs benefit from risk distribution | | PMIERs benefit from risk distribution |
| | ($ in thousands) | | ($ in thousands) | | June 30, 2021 | | December 31, 2020 | | June 30, 2020 |
| PMIERs impact - reduction in Minimum Required Assets | | PMIERs impact - reduction in Minimum Required Assets | |
| Excess-of-Loss Program | | Excess-of-Loss Program | | $ | 907,112 | | | $ | 912,734 | | | $ | 970,294 | |
| Single Premium QSR Program | | Single Premium QSR Program | | 355,115 | | | 423,712 | | | 517,028 | |
| QSR Program | QSR Program | $ | 26,213 | | | $ | 35,382 | | | $ | 38,227 | | QSR Program | | 16,545 | | | 22,712 | | | 30,837 | |
| Single Premium QSR Program | 469,625 | | | 511,695 | | | 513,832 | | |
| Excess-of-Loss Program | 783,842 | | | 738,386 | | | 834,072 | | |
| Total PMIERs impact | Total PMIERs impact | $ | 1,279,680 | | | $ | 1,285,463 | | | $ | 1,386,131 | | Total PMIERs impact | | $ | 1,278,772 | | | $ | 1,359,158 | | | $ | 1,518,159 | |
| Percentage of gross Minimum Required Assets | Percentage of gross Minimum Required Assets | 26.8 | % | | 27.4 | % | | 29.6 | % | Percentage of gross Minimum Required Assets | | 28.7 | % | | 28.8 | % | | 32.0 | % |
|
(1)Excludes the impact of intercompany reinsurance agreement with Radian Reinsurance, which was terminated in January 2020. See Note 16 of Notes to Unaudited Condensed Consolidated Financial Statements for additional information.
Results of Operations—Consolidated
Three and NineSix Months Ended SeptemberJune 30, 20202021 Compared to Three and NineSix Months Ended SeptemberJune 30, 20192020
Radian Group serves as the holding company for our operating subsidiaries and does not have any operations of its own. Our consolidated operating results for the three and ninesix months ended SeptemberJune 30, 20202021 and SeptemberJune 30, 20192020 primarily reflect the financial results and performance of our two reportable business segments—Mortgage and Real Estate.homegenius. See Note 4 of Notes to Unaudited Condensed Consolidated Financial Statements for information regarding modifications to our segment reporting in 2020, including for the related allocations and the impactswind down of the sale of Clayton in January 2020 and subsequent organizational changes madeour traditional appraisal business announced in the firstfourth quarter of 2020. All changes in 2020 to the composition of our reportable segments have been reflected in our segment operating results for all periods presented. See “Results of Operations—Mortgage” and “Results of Operations—Real Estate”homegenius” for the operating results of these business segments for the three and ninesix months ended SeptemberJune 30, 2020,2021, compared to the same periods in 2019.2020.
In addition to the results of our operating segments, pretax income (loss) is also affected by those factors described in “Item 7. Management’s Discussion and Analysis of Financial Condition and Results of Operations—Key Factors Affecting Our Results” in our 20192020 Form 10-K.
| | |
Part I. Item 2. Management’s Discussion and Analysis of Financial Condition and Results of Operations
Part I. Item 2. Management’s Discussion and Analysis of Financial Condition and Results of Operations (continued)
|
The following table highlights selected information related to our consolidated results of operations for the three and ninesix months ended SeptemberJune 30, 20202021 and 2019:2020.
| | Summary results of operations - Consolidated | | Summary results of operations - Consolidated |
| | | Change | | Change | | | | | |
| | | Three Months Ended
September 30, | | Favorable (Unfavorable) | | Nine Months Ended
September 30, | | Favorable (Unfavorable) | | | Three Months Ended
June 30, | | Change Favorable (Unfavorable) | | Six Months Ended
June 30, | | Change Favorable (Unfavorable) |
| (In millions, except per-share amounts) | (In millions, except per-share amounts) | 2020 | | 2019 | | 2020 vs. 2019 | | 2020 | | 2019 | | 2020 vs. 2019 | (In millions, except per-share amounts) | | 2021 | | 2020 | | 2021 vs. 2020 | | 2021 | | 2020 | | 2021 vs. 2020 |
| Pretax income | $ | 161.2 | | | $ | 217.7 | | | $ | (56.5) | | | $ | 300.3 | | | $ | 643.4 | | | $ | (343.1) | | |
| Net income | 135.1 | | | 173.4 | | | (38.3) | | | 245.6 | | | 511.1 | | | (265.5) | | |
| Diluted net income per share | 0.70 | | | 0.83 | | | (0.13) | | | 1.25 | | | 2.39 | | | (1.14) | | |
| Book value per share at September 30 | 21.52 | | | 19.40 | | | 2.12 | | | 21.52 | | | 19.40 | | | 2.12 | | |
| | Pretax income (loss) | | Pretax income (loss) | | $ | 195.5 | | | $ | (42.2) | | | $ | 237.7 | | | $ | 356.7 | | | $ | 139.1 | | | $ | 217.6 | |
| Net income (loss) | | Net income (loss) | | 155.2 | | | (30.0) | | | 185.2 | | | 280.8 | | | 110.5 | | | 170.3 | |
| Diluted net income (loss) per share | | Diluted net income (loss) per share | | 0.80 | | | (0.15) | | | 0.95 | | | 1.44 | | | 0.56 | | | 0.88 | |
| Book value per share at June 30 | | Book value per share at June 30 | | 23.02 | | | 20.82 | | | 2.20 | | | 23.02 | | | 20.82 | | | 2.20 | |
Net premiums earned (1) | Net premiums earned (1) | 286.5 | | | 281.2 | | | 5.3 | | | 813.2 | | | 843.9 | | | (30.7) | | Net premiums earned (1) | | 254.8 | | | 249.3 | | | 5.5 | | | 526.6 | | | 526.7 | | | (0.1) | |
Services revenue (2) | Services revenue (2) | 33.9 | | | 42.5 | | | (8.6) | | | 93.9 | | | 114.6 | | | (20.7) | | Services revenue (2) | | 29.5 | | | 28.1 | | | 1.4 | | | 52.4 | | | 60.0 | | | (7.6) | |
Net investment income (1) | Net investment income (1) | 36.3 | | | 42.8 | | | (6.5) | | | 115.9 | | | 130.4 | | | (14.5) | | Net investment income (1) | | 36.3 | | | 38.7 | | | (2.4) | | | 74.5 | | | 79.7 | | | (5.2) | |
| Net gains (losses) on investments and other financial instruments | Net gains (losses) on investments and other financial instruments | 17.7 | | | 13.0 | | | 4.7 | | | 42.9 | | | 47.5 | | | (4.6) | | Net gains (losses) on investments and other financial instruments | | 15.7 | | | 47.3 | | | (31.6) | | | 10.5 | | | 25.2 | | | (14.7) | |
| Provision for losses (1) | Provision for losses (1) | 88.1 | | | 29.2 | | | (58.9) | | | 428.5 | | | 97.4 | | | (331.1) | | Provision for losses (1) | | 3.6 | | | 304.4 | | | 300.8 | | | 49.8 | | | 340.4 | | | 290.6 | |
| Policy acquisition costs (1) | | Policy acquisition costs (1) | | 4.8 | | | 6.0 | | | 1.2 | | | 13.8 | | | 13.4 | | | (0.4) | |
Cost of services (2) | Cost of services (2) | 24.4 | | | 29.0 | | | 4.6 | | | 64.5 | | | 81.0 | | | 16.5 | | Cost of services (2) | | 24.6 | | | 18.0 | | | (6.6) | | | 44.9 | | | 40.1 | | | (4.8) | |
Other operating expenses | Other operating expenses | 69.4 | | | 76.4 | | | 7.0 | | | 199.1 | | | 225.2 | | | 26.1 | | Other operating expenses | | 86.5 | | | 60.6 | | | (25.9) | | | 156.7 | | | 129.7 | | | (27.0) | |
| Interest expense (1) | Interest expense (1) | 21.1 | | | 13.5 | | | (7.6) | | | 50.0 | | | 44.2 | | | (5.8) | | Interest expense (1) | | 21.1 | | | 16.7 | | | (4.4) | | | 42.2 | | | 28.9 | | | (13.3) | |
| Loss on extinguishment of debt | — | | | 5.9 | | | 5.9 | | | — | | | 22.7 | | | 22.7 | | |
| | Income tax provision | 26.1 | | | 44.2 | | | 18.1 | | | 54.7 | | | 132.2 | | | 77.5 | | |
Adjusted pretax operating income (3) | 145.0 | | | 212.7 | | | (67.7) | | | 261.1 | | | 630.7 | | | (369.6) | | |
Adjusted diluted net operating income per share (3) | 0.59 | | | 0.81 | | | (0.22) | | | 1.05 | | | 2.33 | | | (1.28) | | |
| | Income tax provision (benefit) | | Income tax provision (benefit) | | 40.3 | | | (12.3) | | | (52.6) | | | 75.9 | | | 28.6 | | | (47.3) | |
Adjusted pretax operating income (loss) (4) | | Adjusted pretax operating income (loss) (4) | | 184.7 | | | (88.5) | | | 273.2 | | | 352.0 | | | 116.1 | | | 235.9 | |
Adjusted diluted net operating income (loss) per share (4) | | Adjusted diluted net operating income (loss) per share (4) | | 0.75 | | | (0.36) | | | 1.11 | | | 1.43 | | | 0.46 | | | 0.97 | |
| Return on equity | Return on equity | 13.3 | % | | 18.0 | % | | (4.7) | % | | 8.0 | % | | 18.4 | % | | (10.4) | % | Return on equity | | 14.5 | % | | (3.1) | % | | 17.6 | % | | 13.0 | % | | 5.5 | % | | 7.5 | % |
Adjusted net operating return on equity (3) | 11.3 | % | | 17.4 | % | | (6.1) | % | | 6.7 | % | | 17.9 | % | | (11.2) | % | |
Adjusted net operating return on equity (4) | | Adjusted net operating return on equity (4) | | 13.6 | % | | (7.1) | % | | 20.7 | % | | 12.9 | % | | 4.6 | % | | 8.3 | % |
(1)Relates primarily to the Mortgage segment. See “Results of Operations—Mortgage” for more information.
(2)Relates primarily to our Real Estatehomegenius segment. See “Results of Operations—Real Estate”homegenius” for more information.
(3)See “Results of Operations—Mortgage,” “Results of Operations—homegenius” and “Results of Operations—All Other” for more information on both direct and allocated operating expenses.
(4)See “—Use of Non-GAAP Financial Measures” below.
Net Income.Income (Loss). As discussed in more detail below, our net income for the three and six months ended SeptemberJune 30, 2020, decreased2021, increased as compared to the same periodperiods in 2019,2020, primarily reflecting an increasea decrease in provision for losses.losses related to our Mortgage segment. Partially offsetting this item is:was: (i) a decrease in other operating expenses; (ii) a decrease in loss on extinguishment of debt; (iii) an increase in net premiums earned; and (iv) an increase in net gains on investments and other financial instruments. Our net income for the nine months ended September 30, 2020, decreased compared to the same period in 2019, reflecting: (i)instruments; (ii) an increase in provision for losses and (ii) a decrease in net premiums earned. Partially offsetting these items are decreases in: (i) our income tax provision; (ii) other operating expenses; and (iii) loss on extinguishment of debt.an increase in interest expense.
Diluted Net Income (Loss) Per Share. The decreaseincrease in diluted net income per share for the three and ninesix months ended SeptemberJune 30, 2020,2021, compared to the same periods in 2019,2020, is primarily due to the decreaseincrease in net income, as discussed above.
Book Value Per Share. The increase in book value per share from $20.13$22.36 at December 31, 2019,2020, to $21.52$23.02 at SeptemberJune 30, 2020,2021, is primarily due to: (i)to our net income for the ninesix months ended SeptemberJune 30, 2020 and (ii) an increase2021. Partially offsetting this item is: (i) a decrease of $0.60$0.44 per share due to net unrealized gainslosses in our available for sale securities, recorded in accumulated other comprehensive income. Partially offsetting these items is: (i)income and (ii) a $0.37$0.27 per share impact of dividends and (ii) a $0.09 per share net impact of our share repurchases for the nine months ended September 30, 2020, inclusive of the cost of these repurchases.dividends.
Net Gains (Losses) on Investments and Other Financial Instruments. The increasedecrease in net gains on investments and other financial instruments for the three months ended SeptemberJune 30, 2020,2021 as compared to the same period in 2019,2020, is primarily due to an increaseto: (i) a decrease in net unrealized gains on our trading securities; (ii) a decrease in net realized gains on our fixed-maturities available for sale, partially offset by lower gains on other financial instruments.sale; and (iii) a decrease in the fair value of our embedded derivatives. The decreasein net gains on investments and other financial instruments for the ninesix months ended SeptemberJune 30, 2020,2021, as compared to the same period in 2019,2020, is primarily due to theto: (i) a decrease in unrealized gains in our trading securities and an increase in impairments recorded in earnings, partially offset by increases in net realized gains on our fixed-maturities available for salesale; (ii) a decrease in the fair value of our embedded derivatives; and net(iii) a decrease in gains on other financial instruments. These decreases were partially offset by an
| | |
Part I. Item 2. Management’s Discussion and Analysis of Financial Condition and Results of Operations
|
increase in net unrealized gains on our trading securities. See NoteNotes 5 and 6 of Notes to Unaudited Condensed Consolidated Financial Statements for additional information onabout the embedded derivatives associated with our reinsurance obtained through mortgage linked-notes transactions and net gains (losses) on investments.
Part I. Item 2. Management’s Discussion and Analysis of Financial Condition and Results of Operations (continued)
Other Operating Expenses.Other operating expenses for the three months ended September 30, 2020 decreased as compared to the same period in 2019, primarily due to: (i) an increase in ceding commissions and (ii) a decrease in variable compensation expense. The decrease in other operating expenses for the nine months ended September 30, 2020 compared to the same period in 2019 was primarily due to: (i) a decrease in technology-related expenses; (ii) a decrease in variable and share-based compensation expense; and (iii) an increase in ceding commissions.investments, respectively.
Income Tax Provision. Our income tax provision increased in 2021 primarily due to higher pretax income. Our effective tax rate was 16.2%20.6% and 18.2%21.3% for the three and ninesix months ended SeptemberJune 30, 2020,2021, respectively, as compared to 20.3%29.1% and 20.6%20.5% for the same respective periods in 2019, respectively. This resulted in an income2020. Our effective tax provision of $26.1 million and $54.7 million, respectively,rate for the three and ninesix months ended SeptemberJune 30, 2020, as compared to a $44.2 million and $132.2 million tax provision, respectively, for2021 approximated the corresponding periodsfederal statutory rate of 2019.21%. The decreaseincrease in our effective tax rate for the three and nine months ended SeptemberJune 30, 2020 was primarily due to the proportional effects of a Discrete Item recorded in the third quarter of 2020 relatedpermanent book-to-tax adjustments to our liabilitypretax loss for uncertain tax positions. Our effective tax rate for the three and nine months ended September 30, 2019, approximated the federal statutory tax rate of 21%.that three-month period.
Return on Equity. The change in return on equity is primarily due to the decreaseincrease in net income for the three and six months ended SeptemberJune 30, 2020,2021, as described above.
Use of Non-GAAP Financial Measures. In addition to the traditional GAAP financial measures, we have presented “adjusted pretax operating income (loss),” “adjusted diluted net operating income (loss) per share” and “adjusted net operating return on equity,” which are non-GAAP financial measures for the consolidated company, among our key performance indicators to evaluate our fundamental financial performance. These non-GAAP financial measures align with the way our business performance is evaluated by both management and by our board of directors. These measures have been established in order to increase transparency for the purposes of evaluating our operating trends and enabling more meaningful comparisons with our peers. Although on a consolidated basis “adjusted pretax operating income (loss),” “adjusted diluted net operating income (loss) per share” and “adjusted net operating return on equity” are non-GAAP financial measures, for the reasons discussed above we believe these measures aid in understanding the underlying performance of our operations.
Total adjusted pretax operating income (loss), adjusted diluted net operating income (loss) per share and adjusted net operating return on equity are not measures of overall profitability, and therefore should not be considered in isolation or viewed as substitutes for GAAP pretax income (loss), diluted net income (loss) per share or return on equity. Our definitions of adjusted pretax operating income (loss), adjusted diluted net operating income (loss) per share and adjusted net operating return on equity, as discussed and reconciled below to the most comparable respective GAAP measures, may not be comparable to similarly-named measures reported by other companies.
Our senior management, including our Chief Executive Officer (Radian’s chief operating decision maker,maker), uses adjusted pretax operating income (loss) as our primary measure to evaluate the fundamental financial performance of the Company’s business segments and to allocate resources to the segments. See Note 4 of Notes to Consolidated Financial Statements and “Item 7. Management’s Discussion and Analysis of Financial Condition and Results of Operations—Results of Operations—Consolidated—Use of Non-GAAP Financial Measures” each in our 20192020 Form 10-K for detailed information regarding items excluded from adjusted pretax operating income and the reasons for their treatment.
Adjusted pretax operating income (loss) is defined as GAAP consolidated pretax income (loss) excluding the effects of: (i) net gains (losses) on investments and other financial instruments; (ii) loss on extinguishment of debt; (iii) amortization and impairment of goodwill and other acquired intangible assets; and (iv) impairment of other long-lived assets and other non-operating items, such as impairment of internal-use software, gains (losses) from the sale of lines of business and acquisition-related income and expenses.
The following table provides a reconciliation of consolidated pretax income (loss) to our non-GAAP financial measure for the consolidated company of adjusted pretax operating income:income (loss).
| | | | | | | | | | | | | | | | | | | | | | | |
|
| Three Months Ended
September 30, | | Nine Months Ended
September 30, |
| (In thousands) | 2020 | | 2019 | | 2020 | | 2019 |
| Consolidated pretax income | $ | 161,205 | | | $ | 217,673 | | | $ | 300,274 | | | $ | 643,354 | |
| Less reconciling income (expense) items: | | | | | | | |
| Net gains (losses) on investments and other financial instruments | 17,652 | | | 13,009 | | | 42,901 | | | 47,462 | |
| Loss on extinguishment of debt | — | | | (5,940) | | | — | | | (22,738) | |
| Amortization and impairment of other acquired intangible assets | (961) | | | (2,139) | | | (2,919) | | | (6,465) | |
Impairment of other long-lived assets and other non-operating items (1) | (466) | | | — | | | (788) | | | (5,557) | |
Total adjusted pretax operating income (2) | $ | 144,980 | | | $ | 212,743 | | | $ | 261,080 | | | $ | 630,652 | |
| | | | | | | |
| | | | | | | | | | | | | | | | | | | | | | | | | | |
| | | | | | | | |
| Reconciliation of consolidated pretax income (loss) to consolidated adjusted pretax operating income (loss) |
| | | | | | | | |
| | Three Months Ended
June 30, | | Six Months Ended
June 30, |
| (In thousands) | | 2021 | | 2020 | | 2021 | | 2020 |
| Consolidated pretax income (loss) | | $ | 195,496 | | | $ | (42,224) | | | $ | 356,685 | | | $ | 139,069 | |
| Less reconciling income (expense) items | | | | | | | | |
| Net gains (losses) on investments and other financial instruments | | 15,661 | | | 47,276 | | | 10,480 | | | 25,249 | |
| | | | | | | | |
| Amortization and impairment of other acquired intangible assets | | (863) | | | (979) | | | (1,725) | | | (1,958) | |
| Impairment of other long-lived assets and other non-operating items | | (4,021) | | | (22) | | | (4,105) | | | (322) | |
Total adjusted pretax operating income (loss) (1) | | $ | 184,719 | | | $ | (88,499) | | | $ | 352,035 | | | $ | 116,100 | |
(1)The amount for the nine months ended September 30, 2019 primarily relates to impairments of other long-lived assets and is included in other operating expenses on the condensed consolidated statement of operations.
Part I. Item 2. Management’s Discussion and Analysis of Financial Condition and Results of Operations (continued)
(2)Total adjusted pretax operating income (loss) on a consolidated basis consists of adjusted pretax operating income (loss) for our Mortgage segment, our Real Estatehomegenius segment and All Other activities, as further detailed in Note 4 of Notes to Unaudited Condensed Consolidated Financial Statements.
| | |
Part I. Item 2. Management’s Discussion and Analysis of Financial Condition and Results of Operations
|
Adjusted diluted net operating income (loss) per share is calculated by dividing (i) adjusted pretax operating income (loss) attributable to common stockholders, net of taxes computed using the Company’s statutory tax rate, by (ii) the sum of the weighted average number of common shares outstanding and all dilutive potential common shares outstanding. The following table provides a reconciliation of diluted net income (loss) per share to our non-GAAP financial measure for the consolidated company of adjusted diluted net operating income (loss) per share:share.
| | Reconciliation of diluted net income (loss) per share to adjusted diluted net operating income (loss) per share | | Reconciliation of diluted net income (loss) per share to adjusted diluted net operating income (loss) per share |
| | | | Three Months Ended
June 30, | | Six Months Ended
June 30, |
| | Three Months Ended
September 30, | | Nine Months Ended
September 30, | | | 2021 | | 2020 | | 2021 | | 2020 |
| (In thousands) | 2020 | | 2019 | | 2020 | | 2019 | |
| Diluted net income per share | $ | 0.70 | | | $ | 0.83 | | | $ | 1.25 | | | $ | 2.39 | | |
| Diluted net income (loss) per share | | Diluted net income (loss) per share | | $ | 0.80 | | | $ | (0.15) | | | $ | 1.44 | | | $ | 0.56 | |
| Less per-share impact of reconciling income (expense) items | | Less per-share impact of reconciling income (expense) items | | | | | | | | |
| Net gains (losses) on investments and other financial instruments | | Net gains (losses) on investments and other financial instruments | | 0.08 | | | 0.24 | | | 0.05 | | | 0.13 | |
| | Less per-share impact of reconciling income (expense) items: | | | | | | | | |
| Net gains (losses) on investments and other financial instruments | 0.09 | | | 0.06 | | | 0.22 | | | 0.22 | | |
| Loss on extinguishment of debt | — | | | (0.03) | | | — | | | (0.11) | | |
| Amortization and impairment of other acquired intangible assets | Amortization and impairment of other acquired intangible assets | — | | | (0.01) | | | (0.01) | | | (0.03) | | Amortization and impairment of other acquired intangible assets | | — | | | (0.01) | | | (0.01) | | | (0.01) | |
| Impairment of other long-lived assets and other non-operating items | Impairment of other long-lived assets and other non-operating items | — | | | — | | | — | | | (0.03) | | Impairment of other long-lived assets and other non-operating items | | (0.02) | | | — | | | (0.02) | | | — | |
Income tax (provision) benefit on reconciling income (expense) items (1) | Income tax (provision) benefit on reconciling income (expense) items (1) | (0.02) | | | — | | | (0.04) | | | (0.01) | | Income tax (provision) benefit on reconciling income (expense) items (1) | | (0.01) | | | (0.05) | | | (0.01) | | | (0.02) | |
Difference between statutory and effective tax rates | Difference between statutory and effective tax rates | 0.04 | | | — | | | 0.03 | | | 0.02 | | Difference between statutory and effective tax rates | | — | | | 0.03 | | | — | | | — | |
| Per-share impact of reconciling income (expense) items | Per-share impact of reconciling income (expense) items | 0.11 | | | 0.02 | | | 0.20 | | | 0.06 | | Per-share impact of reconciling income (expense) items | | 0.05 | | | 0.21 | | | 0.01 | | | 0.10 | |
Adjusted diluted net operating income per share (1) | $ | 0.59 | | | $ | 0.81 | | | $ | 1.05 | | | $ | 2.33 | | |
| Adjusted diluted net operating income (loss) per share (1) | | Adjusted diluted net operating income (loss) per share (1) | | $ | 0.75 | | | $ | (0.36) | | | $ | 1.43 | | | $ | 0.46 | |
(1)Calculated using the Company’s federal statutory tax rate of 21%. Any permanent tax adjustments and state income taxes on these items have been deemed immaterial and are not included.
Adjusted net operating return on equity is calculated by dividing annualized adjusted pretax operating income (loss), net of taxes computed using the Company’s statutory tax rate, by average stockholders’ equity, based on the average of the beginning and ending balances for each period presented. The following table provides a reconciliation of return on equity to our non-GAAP financial measure for the consolidated company of adjusted net operating return on equity:equity.
| | Reconciliation of return on equity to adjusted net operating return on equity | | Reconciliation of return on equity to adjusted net operating return on equity |
| | | | Three Months Ended
June 30, | | Six Months Ended
June 30, |
| | Three Months Ended
September 30, | | Nine Months Ended
September 30, | | | 2021 | | 2020 | | 2021 | | 2020 |
| (In thousands) | 2020 | | 2019 | | 2020 | | 2019 | |
Return on equity (1) | Return on equity (1) | 13.3 | % | | 18.0 | % | | 8.0 | % | | 18.4 | % | Return on equity (1) | | 14.5 | % | | (3.1) | % | | 13.0 | % | | 5.5 | % |
Less impact of reconciling income (expense) items: (2) | | | | | | | | |
Less impact of reconciling income (expense) items (2) | | Less impact of reconciling income (expense) items (2) | | | | | | | | |
| Net gains (losses) on investments and other financial instruments | Net gains (losses) on investments and other financial instruments | 1.7 | | | 1.4 | | | 1.4 | | | 1.7 | | Net gains (losses) on investments and other financial instruments | | 1.5 | | | 4.8 | | | 0.5 | | | 1.3 | |
| Loss on extinguishment of debt | — | | | (0.6) | | | — | | | (0.8) | | |
| | Amortization and impairment of other acquired intangible assets | Amortization and impairment of other acquired intangible assets | (0.1) | | | (0.2) | | | (0.1) | | | (0.2) | | Amortization and impairment of other acquired intangible assets | | (0.1) | | | (0.1) | | | (0.1) | | | (0.1) | |
| Impairment of other long-lived assets and other non-operating items | Impairment of other long-lived assets and other non-operating items | — | | | — | | | — | | | (0.2) | | Impairment of other long-lived assets and other non-operating items | | (0.4) | | | — | | | (0.2) | | | — | |
Income tax (provision) benefit on reconciling income (expense) items (3) | Income tax (provision) benefit on reconciling income (expense) items (3) | (0.3) | | | (0.1) | | | (0.3) | | | (0.1) | | Income tax (provision) benefit on reconciling income (expense) items (3) | | (0.2) | | | (1.0) | | | — | | | (0.2) | |
| Difference between statutory and effective tax rates | Difference between statutory and effective tax rates | 0.7 | | | 0.1 | | | 0.3 | | | 0.1 | | Difference between statutory and effective tax rates | | 0.1 | | | 0.3 | | | (0.1) | | | (0.1) | |
| Impact of reconciling income (expense) items | Impact of reconciling income (expense) items | 2.0 | | | 0.6 | | | 1.3 | | | 0.5 | | Impact of reconciling income (expense) items | | 0.9 | | | 4.0 | | | 0.1 | | | 0.9 | |
| Adjusted net operating return on equity | Adjusted net operating return on equity | 11.3 | % | | 17.4 | % | | 6.7 | % | | 17.9 | % | Adjusted net operating return on equity | | 13.6 | % | | (7.1) | % | | 12.9 | % | | 4.6 | % |
|
(1)Calculated by dividing annualized net income (loss) by average stockholders’ equity, based on the average of the beginning and ending balances for each period presented.
(2)Annualized, as a percentage of average stockholders’ equity.
(3)Calculated using the Company’s federal statutory tax rate of 21%. Any permanent tax adjustments and state income taxes on these items have been deemed immaterial and are not included.
| | |
Part I. Item 2. Management’s Discussion and Analysis of Financial Condition and Results of Operations
Part I. Item 2. Management’s Discussion and Analysis of Financial Condition and Results of Operations (continued)
|
Results of Operations—Mortgage
Three and NineSix Months Ended SeptemberJune 30, 20202021 Compared to Three and NineSix Months Ended SeptemberJune 30, 20192020
The following table summarizes our Mortgage segment’s results of operations for the three and ninesix months ended SeptemberJune 30, 20202021 and 2019:2020.
| | | | | | | | | | | | | | | | | | | | | | | | | | | | | | | | | | | |
| | | | | Change | | | | | | Change |
| Three Months Ended
September 30, | | Favorable (Unfavorable) | | Nine Months Ended
September 30, | | Favorable (Unfavorable) |
| (In millions) | 2020 | | 2019 | | 2020 vs. 2019 | | 2020 | | 2019 | | 2020 vs. 2019 |
Adjusted pretax operating income (1) (2) | $ | 145.8 | | | $ | 209.6 | | | $ | (63.8) | | | $ | 263.2 | | | $ | 627.9 | | | $ | (364.7) | |
| Net premiums written | 259.3 | | | 270.6 | | | (11.3) | | | 749.7 | | | 787.5 | | | (37.8) | |
| (Increase) decrease in unearned premiums | 24.1 | | | 7.0 | | | 17.1 | | | 56.2 | | | 48.2 | | | 8.0 | |
| Net premiums earned | 283.4 | | | 277.6 | | | 5.8 | | | 806.0 | | | 835.7 | | | (29.7) | |
| Net investment income | 32.1 | | | 37.0 | | | (4.9) | | | 103.0 | | | 113.7 | | | (10.7) | |
| | | | | | | | | | | |
| Provision for losses | 87.8 | | | 29.1 | | | (58.7) | | | 427.0 | | | 97.1 | | | (329.9) | |
| Policy acquisition costs | 10.2 | | | 6.4 | | | (3.8) | | | 23.6 | | | 18.5 | | | (5.1) | |
Other operating expenses (2) | 50.8 | | | 57.4 | | | 6.6 | | | 147.5 | | | 165.7 | | | 18.2 | |
| Interest expense | 22.6 | | | 13.5 | | | (9.1) | | | 54.0 | | | 44.2 | | | (9.8) | |
| | | | | | | | | | | | | | | | | | | | | | | | | | | | | | | | | | | | | | |
| Summary results of operations - Mortgage |
| | | | | | | | | | | | |
| | Three Months Ended
June 30, | | Change Favorable (Unfavorable) | | Six Months Ended
June 30, | | Change Favorable (Unfavorable) |
| (In millions) | | 2021 | | 2020 | | 2021 vs. 2020 | | 2021 | | 2020 | | 2021 vs. 2020 |
Adjusted pretax operating income (loss) (1) (2) | | $ | 191.5 | | | $ | (85.8) | | | $ | 277.3 | | | $ | 365.7 | | | $ | 119.8 | | | $ | 245.9 | |
| Net premiums written | | 231.0 | | | 229.5 | | | 1.5 | | | 477.9 | | | 490.4 | | | (12.5) | |
| (Increase) decrease in unearned premiums | | 16.1 | | | 18.1 | | | (2.0) | | | 33.8 | | | 32.2 | | | 1.6 | |
| Net premiums earned | | 247.1 | | | 247.6 | | | (0.5) | | | 511.8 | | | 522.6 | | | (10.8) | |
| Services revenue | | 3.7 | | | 3.9 | | | (0.2) | | | 8.1 | | | 7.1 | | | 1.0 | |
| Net investment income | | 32.8 | | | 34.7 | | | (1.9) | | | 66.9 | | | 70.9 | | | (4.0) | |
| | | | | | | | | | | | |
| Provision for losses | | 3.3 | | | 304.0 | | | 300.7 | | | 49.2 | | | 339.3 | | | 290.1 | |
| Policy acquisition costs | | 4.8 | | | 6.0 | | | 1.2 | | | 13.8 | | | 13.4 | | | (0.4) | |
| Cost of services | | 3.2 | | | 2.1 | | | (1.1) | | | 6.4 | | | 3.9 | | | (2.5) | |
Other operating expenses (2) | | 60.4 | | | 43.9 | | | (16.5) | | | 110.8 | | | 96.7 | | | (14.1) | |
| Interest expense | | 21.1 | | | 16.7 | | | (4.4) | | | 42.2 | | | 28.9 | | | (13.3) | |
(1)Our senior management uses adjusted pretax operating income (loss) as our primary measure to evaluate the fundamental financial performance of each of the Company’s business segments. See Note 4 of Notes to Unaudited Condensed Consolidated Financial Statements.
(2)Includes allocation of corporate operating expenses of $29.4$33.0 million and $83.7$60.9 million for the three and ninesix months ended SeptemberJune 30, 2020,2021, respectively, and $26.7$25.4 million and $76.7$54.6 million for the same periods in 2019, respectively.2020. See Note 4 of Notes to Unaudited Condensed Consolidated Financial Statements for more information about our allocation of corporate operating expenses to segments.
Adjusted Pretax Operating Income.Income (Loss). Our Mortgage segment’s adjusted pretax operating income decreased for the three and six months ended SeptemberJune 30, 20202021, compared to adjusted pretax operating loss for the same period in 2019,2020, primarily reflecting increases in: (i)reflects a decrease in provision for losses and (ii) interest expense.losses. Partially offsetting these items are:this item is: (i) a decreasean increase in other operating expenses and (ii) an increase in net premiums earned. Adjustedinterest expense. Our Mortgage segment’s adjusted pretax operating income for the ninesix months ended SeptemberJune 30, 2020 decreased2021 as compared to the same period in 2019, primarily reflecting: (i) an increase in provision for losses; (ii)2020, was also impacted by a decrease in net premiums earned; (iii) a decrease in net investment income; and (iv) an increase in interest expense. These items were partially offset by a decrease in other operating expenses.earned. See “—Net Premiums Written and Earned” and “—Provision for Losses” below for more information about our net premiums earned and provision for losses, respectively.
Net Premiums Written and Earned. Net premiums written for the three and nine months ended SeptemberJune 30, 20202021 increased, while net premiums written for the six months ended June 30, 2021 decreased, compared to the same periods in 2019. The decreases2020. Higher ceded losses recorded in both the three and ninesix months ended SeptemberJune 30, 2020, reflectresulted in elevated ceded premiums due to a reduction in accrued profit commissions, which lowered net premiums written in those periods. The subsequent improvement in accrued profit commissions in 2021 was partially offset for the three months ended June 30, 2021, and more than offset for the six months ended June 30, 2021, by lower direct premium rates on our IIF portfolio compared to the same periods in 2019,2020, as well as a lower proportion of Single Premium Policies. In addition, net premiums written for the nine months ended September 30, 2020 reflect an increase in ceded premiums resulting from a reduction to accrued profit commissions, due to higher ceded losses primarily recorded in the second quarter of 2020.
| | |
Part I. Item 2. Management’s Discussion and Analysis of Financial Condition and Results of Operations
Part I. Item 2. Management’s Discussion and Analysis of Financial Condition and Results of Operations (continued)
|
The table below provides additional information about the components of mortgage insurance net premiums earned for the periods indicated, including the effects of our reinsurance programs.
| | | | | | | | | | | | | | | | | | | | | | | | | | |
| Three Months Ended
September 30, | | Nine Months Ended
September 30, | |
| (In thousands) | 2020 | | 2019 | | 2020 | | 2019 | |
| Net premiums earned: | | | | | | | | |
| Direct | | | | | | | | |
| Premiums earned, excluding revenue from cancellations | $ | 259,889 | | | $ | 274,595 | | | $ | 798,004 | | | $ | 858,200 | | (1) |
| Single Premium Policy cancellations | 65,667 | | | 27,254 | | | 139,823 | | | 53,004 | | |
| Direct | 325,556 | | | 301,849 | | | 937,827 | | | 911,204 | | (1) |
| | | | | | | | |
Assumed (2) | 2,946 | | | 2,614 | | | 9,599 | | | 7,545 | | |
| | | | | | | | |
| Ceded | | | | | | | | |
| Premiums earned, excluding revenue from cancellations | (25,120) | | | (28,457) | | | (80,222) | | | (106,891) | | (1) |
Single Premium Policy cancellations (3) | (18,679) | | | (8,137) | | | (40,286) | | | (15,923) | | |
Profit commission—other (4) | (1,347) | | | 9,729 | | | (20,967) | | | 39,775 | | (1) |
| Ceded premiums, net of profit commission | (45,146) | | | (26,865) | | | (141,475) | | | (83,039) | | (1) |
| | | | | | | | |
Total net premiums earned | $ | 283,356 | | | $ | 277,598 | | | $ | 805,951 | | | $ | 835,710 | | (1) |
| | | | | | | | |
Direct premium yield (in basis points) (5) | 43.2 | | | 47.4 | | | 44.3 | | | 50.3 | | (1) |
| | | | | | | | |
Net premium yield (in basis points) (6) | 46.6 | | | 47.5 | | | 44.2 | | | 48.6 | | (1) |
| Average primary IIF | $ | 243.4 | | | $ | 234.0 | | | $ | 243.0 | | | $ | 229.3 | | |
| | | | | | | | |
| | | | | | | | | | | | | | | | | | | | | | | | | | |
| Net premiums earned |
| | | | | | | | |
| | Three Months Ended
June 30, | | Six Months Ended
June 30, |
| (In thousands, except as otherwise indicated) | | 2021 | | 2020 | | 2021 | | 2020 |
| Direct | | | | | | | | |
| Premiums earned, excluding revenue from cancellations | | $ | 243,077 | | | $ | 263,468 | | | $ | 499,982 | | | $ | 538,115 | |
| Single Premium Policy cancellations | | 31,592 | | | 50,023 | | | 70,102 | | | 74,156 | |
| Direct premiums | | 274,669 | | | 313,491 | | | 570,084 | | | 612,271 | |
Assumed (1) | | 1,615 | | | 3,197 | | | 3,913 | | | 6,653 | |
| Ceded | | | | | | | | |
| Premiums earned, excluding revenue from cancellations | | (27,324) | | | (26,493) | | | (52,697) | | | (55,102) | |
Single Premium Policy cancellations (2) | | (9,036) | | | (14,424) | | | (20,145) | | | (21,607) | |
Profit commission—other (3) | | 7,162 | | | (28,175) | | | 10,595 | | | (19,620) | |
| Ceded premiums | | (29,198) | | | (69,092) | | | (62,247) | | | (96,329) | |
| Total net premiums earned | | $ | 247,086 | | | $ | 247,596 | | | $ | 511,750 | | | $ | 522,595 | |
| | | | | | | | |
Direct premium yield (in basis points) (4) | | 41.1 | | | 44.3 | | | 41.7 | | | 45.3 | |
Net premium yield (in basis points) (5) | | 41.5 | | | 41.0 | | | 42.3 | | | 43.4 | |
| Average primary IIF (in billions) | | $ | 238.1 | | | $ | 241.5 | | | $ | 241.7 | | | $ | 240.9 | |
(1)Includes a cumulative adjustment to unearned premiums recorded in the second quarter of 2019 related to an update to the amortization rates used to recognize revenue for Single Premium Policies. This adjustment increased the 2019 direct premium yield and net premium yield by 1.9 and 1.4 basis points, respectively. See Note 4 of Notes to Unaudited Condensed Consolidated Financial Statements for further information.
(2)IncludesPrimarily includes premiums earned from our participation in certain credit risk transfer programs.
(3)(2)Includes the impact of related profit commissions.
(4)(3)The amounts representRepresents the profit commission on the Single Premium QSR Program, excluding the impact of Single Premium Policy cancellations.
(5)(4)Calculated by dividing annualized direct premiums earned, including assumed revenue and excluding revenue from cancellations, by average primary IIF.
(6)(5)Calculated by dividing annualized net premiums earned by average primary IIF. For the nine months ended September 30, 2020, incorporates the impact of profit commission adjustments related to our Single Premium QSR Program, including a significant impact for nine months ended September 30, 2020 due to increased ceded losses. See Note 8 of Notes to Unaudited Condensed Consolidated Financial Statements for further information.
Net premiums earned increaseddecreased for the three and six months ended SeptemberJune 30, 20202021 compared to the same periodperiods in 2019,2020, primarily due to an increaseto: (i) a decrease in premiums earned on our in-force Single Premium Policies and Monthly Premium Policies and (ii) a decrease in the impact, net of reinsurance, from Single Premium Policy cancellations related to increased refinancingdecreased refinance activity, as compared to the same period in 2019,2020. These decreases were partially offset by higher ceded premiums related to Single Premium Policies. Thea decrease in net premiums earned for the nine months ended September 30, 2020, as compared to the same period in 2019, was primarily impacted by the increase in ceded premiums, resulting from increased Single Premium Policy cancellations andwhich were elevated in 2020 due to reduced profit commissions as a result of higher ceded losses. Also contributing to the decline for the nine months ended September 30, 2020 compared to the comparable periodlosses in 2019 was a $32.9 million cumulative adjustment in 2019 related to an update to the amortization rates used to recognize revenue for Single Premium Policies. See Note 4 of Notes to Unaudited Condensed Consolidated Financial Statements for further information. These decreases to net premiums earned for the nine months ended September 30, 2020 were partially offset by the increase in direct premiums earned from Single Premium Policy cancellations, as compared to the same period in 2019.2020.
The level of mortgage prepayments affects the revenue ultimately produced by our mortgage insurance business and is influenced by the mix of business we write. We believe that writing a mix of Single Premium Policies and Monthly Premium Policies has the potential to moderate the overall impact on our results if actual prepayments are significantly different from expectations. However, the impact of this moderating effect is affected by the amount of reinsurance we obtain on portions of our portfolio, with the Single Premium QSR Program currently reducing the proportion of retained Single Premium Policies in our portfolio. See “Item 7. Management’s Discussion and Analysis of Financial Condition and Results of Operations—Key Factors Affecting Our Results—Mortgage—IIF and Related Drivers” in our 2020 Form 10-K for more information.
Part I. Item 2. Management’s Discussion and Analysis of Financial Condition and Results of Operations (continued)
Affecting Our Results—Mortgage Insurance—IIF; Persistency Rate; Mix of Business” in our 2019 Form 10-K for more information. | | |
Part I. Item 2. Management’s Discussion and Analysis of Financial Condition and Results of Operations
|
The following table provides information related to the premium impact of our reinsurance transactions. See Note 8 of Notes to Unaudited Condensed Consolidated Financial Statements for more information about our reinsurance programs.
| | Ceded premiums earned | | Ceded premiums earned |
| | | Three Months Ended
September 30, | | Nine Months Ended
September 30, | | Three Months Ended
June 30, | | Six Months Ended
June 30, |
| (In thousands) | 2020 | | 2019 | | 2020 | | 2019 | |
| Ceded premiums earned: | | | | | | | | |
| QSR Program | $ | 2,164 | | | $ | 2,962 | | | $ | 6,662 | | | $ | 11,296 | | |
| ($ in thousands) | | ($ in thousands) | | 2021 | | 2020 | | 2021 | | 2020 |
| Single Premium QSR Program | Single Premium QSR Program | 34,578 | | | 16,333 | | | 109,444 | | | 52,887 | | Single Premium QSR Program | | $ | 12,473 | | | $ | 58,482 | | | $ | 31,942 | | | $ | 74,866 | |
| Excess-of-Loss Program | Excess-of-Loss Program | 8,290 | | | 7,452 | | | 25,016 | | | 18,379 | | Excess-of-Loss Program | | 15,601 | | | 8,321 | | | 27,755 | | | 16,726 | |
| QSR Program | | QSR Program | | 1,018 | | | 2,170 | | | 2,337 | | | 4,498 | |
| Other | | Other | | 106 | | | 119 | | | 213 | | | 239 | |
Total ceded premiums earned (1) | Total ceded premiums earned (1) | $ | 45,032 | | | $ | 26,747 | | | $ | 141,122 | | | $ | 82,562 | | Total ceded premiums earned (1) | | $ | 29,198 | | | $ | 69,092 | | | $ | 62,247 | | | $ | 96,329 | |
| Percentage of total direct and assumed premiums earned | Percentage of total direct and assumed premiums earned | 13.7 | % | | 8.7 | % | | 14.9 | % | | 8.9 | % | Percentage of total direct and assumed premiums earned | | 10.3 | % | | 21.8 | % | | 10.5 | % | | 15.5 | % |
|
(1)Does not include ceded premiums earned related to our captive reinsurance arrangements or the benefit from ceding commissions on our Single Premium QSR Programs, which are included in other operating expenses on the condensed consolidated statement of operations. See Note 8 of Notes to Unaudited Condensed Consolidated Financial Statements for additional information.
Net Investment Income. Lower investment yields, partially offset by higher average investment balances, resulted in decreases in net investment income for the three and ninesix months ended SeptemberJune 30, 2020,2021, compared to the same periods in 2019.2020. Our higher average investment balances were a result of investing our positive cash flows from operations and the proceeds from our May 2020 issuance of Senior Notes due 2025.operations.
Provision for Losses. The following table details the financial impact of the significant components of our provision for losses for the periods indicated:indicated.
| | Provision for losses | | Provision for losses |
| | | Three Months Ended
September 30, | | Nine Months Ended
September 30, | | Three Months Ended
June 30, | | Six Months Ended
June 30, |
| (In millions, except reserve per new default) | 2020 | | 2019 | | 2020 | | 2019 | |
| ($ in millions, except reserve per new default) | | ($ in millions, except reserve per new default) | | 2021 | | 2020 | | 2021 | | 2020 |
Current period defaults (1) | Current period defaults (1) | $ | 96.0 | | | $ | 42.0 | | | $ | 448.5 | | | $ | 107.9 | | Current period defaults (1) | | $ | 34.3 | | | $ | 309.2 | | | $ | 85.8 | | | $ | 356.6 | |
Prior period defaults (2) | Prior period defaults (2) | (8.2) | | | (12.6) | | | (21.4) | | | (10.6) | | Prior period defaults (2) | | (31.0) | | | (5.3) | | | (36.7) | | | (17.2) | |
| Second-lien mortgage loan premium deficiency reserve and other | Second-lien mortgage loan premium deficiency reserve and other | — | | | (0.3) | | | (0.1) | | | (0.2) | | Second-lien mortgage loan premium deficiency reserve and other | | — | | | 0.1 | | | 0.1 | | | (0.1) | |
| Provision for losses | Provision for losses | $ | 87.8 | | | $ | 29.1 | | | $ | 427.0 | | | $ | 97.1 | | Provision for losses | | $ | 3.3 | | | $ | 304.0 | | | $ | 49.2 | | | $ | 339.3 | |
| Loss ratio (3) | Loss ratio (3) | 31.0 | % | | 10.5 | % | | 53.0 | % | | 11.6 | % | Loss ratio (3) | | 1.3 | % | | 122.8 | % | | 9.6 | % | | 64.9 | % |
| Reserve per new default (4) | Reserve per new default (4) | $ | 4,681 | | | $ | 3,977 | | | $ | 4,798 | | | $ | 3,583 | | Reserve per new default (4) | | $ | 4,211 | | | $ | 4,908 | | | $ | 4,291 | | | $ | 4,887 | |
(1)Related to defaulted loans with a most recent default notice dated in the period indicated. For example, if a loan had defaulted in a prior period, but then subsequently cured and later re-defaulted in the current period, the default would be considered a current period default.
(2)Related to defaulted loans with a default notice dated in a period earlier than the period indicated, which have been continuously in default since that time.
(3)Provision for losses as a percentage of net premiums earned. See below and “—Net Premiums Written and Earned”Earned” for further discussion of the components of this ratio.
(4)Calculated by dividing provision for losses for new defaults, net of reinsurance, by new primary defaults for each period.
Our mortgage insurance provision for losses for the three and ninesix months ended SeptemberJune 30, 2020 increased2021 decreased by $58.7$300.7 million and $329.9$290.1 million, respectively, as compared to the same periods in 2019.2020. Reserves established for new default notices were the primary driver of our total incurred losses for the three and ninesix months ended SeptemberJune 30, 20202021 and 2019.2020. Current period new primary defaults increaseddecreased significantly for the three and ninesix months ended SeptemberJune 30, 2020, respectively,2021, compared to the same periods in 2019,2020, as shown below. The increasesdecreases primarily relate to a significant increasedecrease in the number of new default notices as a result ofrelated to the effects of the COVID-19 pandemic, substantially all dueas compared to borrowers in forbearance programs.the same periods last year. Our gross Default to Claim Rate assumption for new primary defaults was 8.0% at June 30, 2021, compared to 8.5% at SeptemberJune 30, 2020, compared to 7.5% at September 30, 2019. This increase reflects the estimated impact of a worsening macroeconomic environment, partially offset by the expected beneficial effects of mortgage relief options and protections, including forbearance programs under the CARES Act. In addition, the new defaults reported in 2020 are concentrated in more recent origination vintages and have higher average loan balances, which in turn contributes to higher reserves per new default.2020.
Our provision for losses during the three and ninesix months ended SeptemberJune 30, 20202021 benefited from favorable reserve development on prior period defaults, based on more favorable cure activity. Despite the favorabletrends in Cures than originally estimated. As a result of these observed trends we made only modest adjustments to our reserve assumptions during the three and ninesix months ended SeptemberJune 30, 2021, we made adjustments to the prior Default to Claim Rate assumptions for default notices reported between April 2020 given the
Part I. Item 2. Management’s Discussion and Analysis of Financial Condition and Results of Operations (continued)
increased uncertainty of the potential impacts of the COVID-19 pandemic.December 2020. See Notes 1 and 11 of Notes to Unaudited Condensed Consolidated Financial Statements and, in our 2020 Form 10-K, “Item 1A. Risk Factors” for additional information. The favorable development for the three and nine months ended September 30, 2019 was primarily driven by a reduction during the period in certain Default to Claim Rate assumptions for prior year defaults compared to the assumptions used at December 31, 2018, partially offset by an increase in our IBNR reserve estimate during the three and nine months ended September 30, 2019.
| | |
Part I. Item 2. Management’s Discussion and Analysis of Financial Condition and Results of Operations
|
Our primary default rate as a percentage of total insured loans at SeptemberJune 30, 20202021 was 5.9%4.0% compared to 2.0%5.2% at December 31, 2019.2020. The following table shows a rollforward of our primary loans in default:default.
| | Rollforward of primary loans in default | | Rollforward of primary loans in default |
| | | Three Months Ended
September 30, | | Nine Months Ended
September 30, | | Three Months Ended
June 30, | | Six Months Ended
June 30, |
| | 2020 | | 2019 | | 2020 | | 2019 | | 2021 | | 2020 | | 2021 | | 2020 |
| Beginning default inventory | Beginning default inventory | 69,742 | | | 19,643 | | | 21,266 | | | 21,093 | | Beginning default inventory | | 50,106 | | | 19,781 | | | 55,537 | | | 21,266 | |
| | New defaults | New defaults | 20,508 | | | 10,562 | | | 93,473 | | | 30,116 | | New defaults | | 8,145 | | | 63,005 | | | 19,996 | | | 72,965 | |
| Cures | Cures | (27,283) | | | (9,215) | | | (50,837) | | | (28,886) | | Cures | | (17,681) | | | (12,588) | | | (34,818) | | | (23,554) | |
Claims paid (1) | (240) | | | (818) | | | (1,154) | | | (2,084) | | |
Rescissions and Claim Denials, net of Reinstatements (2) | 10 | | | 12 | | | (11) | | | (55) | | |
| Claims paid | | Claims paid | | (98) | | | (443) | | | (241) | | | (914) | |
Rescissions and Claim Denials, net of Reinstatements (1) | | Rescissions and Claim Denials, net of Reinstatements (1) | | (8) | | | (13) | | | (10) | | | (21) | |
| Ending default inventory | Ending default inventory | 62,737 | | | 20,184 | | | 62,737 | | | 20,184 | | Ending default inventory | | 40,464 | | | 69,742 | | | 40,464 | | | 69,742 | |
|
(1)Includes those charged to a deductible under pool insurance arrangements, as well as commutations.
(2)Net of any previous Rescissions and Claim Denials that were reversed and reinstated during the period. Such reinstated Rescissions and Claim Denials may ultimately result in a paid claim.
The following tables show additional information about our primary loans in default as of the dates indicated:indicated.
| | Primary loans in default - additional information | | Primary loans in default - additional information |
| | | September 30, 2020 | | | June 30, 2021 |
| | Total | | Foreclosure Stage Defaulted Loans | | Cure % During the 3rd Quarter | | Reserve for Losses | | % of Reserve | | | Total | | Foreclosure Stage Defaulted Loans | | Cure % During the 2nd Quarter | | Reserve for Losses | | % of Reserve |
| ($ in thousands) | ($ in thousands) | # | | % | | # | | % | | $ | | % | ($ in thousands) | | # | | % | | # | | % | | $ | | % |
| Missed payments: | | | | | | | | | | | | |
| Missed payments | | Missed payments | |
| Three payments or less | Three payments or less | 16,942 | | | 27.0 | % | | 74 | | | 35.4 | % | | $ | 133,583 | | | 17.9 | % | Three payments or less | | 6,891 | | | 17.0 | % | | 52 | | | 42.8 | % | | $ | 63,159 | | | 7.5 | % |
| Four to eleven payments | Four to eleven payments | 41,110 | | | 65.5 | | | 210 | | | 16.7 | | | 443,867 | | | 59.6 | | Four to eleven payments | | 14,101 | | | 34.9 | | | 135 | | | 30.1 | | | 221,462 | | | 26.3 | |
| Twelve payments or more | Twelve payments or more | 4,381 | | | 7.0 | | | 820 | | | 6.3 | | | 150,348 | | | 20.2 | | Twelve payments or more | | 19,170 | | | 47.4 | | | 822 | | | 18.3 | | | 540,250 | | | 64.3 | |
| Pending claims | Pending claims | 304 | | | 0.5 | | | N/A | | 6.1 | | | 16,835 | | | 2.3 | | Pending claims | | 302 | | | 0.7 | | | N/A | | 12.6 | | | 15,893 | | | 1.9 | |
| Total | Total | 62,737 | | | 100.0 | % | | 1,104 | | | 744,633 | | | 100.0 | % | Total | | 40,464 | | | 100.0 | % | | 1,009 | | | 840,764 | | | 100.0 | % |
| IBNR and other | IBNR and other | | | | | | | 43,153 | | | | IBNR and other | | | | | | | | 5,464 | | | |
| LAE | LAE | | 18,745 | | | | LAE | | | | | | | | | | 21,180 | | | |
| Total primary reserve | Total primary reserve | | $ | 806,531 | | | | Total primary reserve | | $ | 867,408 | | |
|
| | | December 31, 2019 | | | December 31, 2020 |
| | Total | | Foreclosure Stage Defaulted Loans | | Cure % During the 4th Quarter | | Reserve for Losses | | % of Reserve | | Total | | Foreclosure Stage Defaulted Loans | | Cure % During the 4th Quarter | | Reserve for Losses | | % of Reserve |
| ($ in thousands) | ($ in thousands) | # | | % | | # | | % | | $ | | % | ($ in thousands) | | # | | % | | # | | % | | $ | | % |
| Missed payments: | | | | | | | | | | | | |
| Missed payments | | Missed payments | |
| Three payments or less | Three payments or less | 10,816 | | | 50.9 | % | | 125 | | | 32.6 | % | | $ | 89,187 | | | 26.2 | % | Three payments or less | | 12,504 | | | 22.5 | % | | 64 | | | 36.5 | % | | $ | 99,491 | | | 12.4 | % |
| Four to eleven payments | Four to eleven payments | 6,222 | | | 29.3 | | | 462 | | | 21.5 | | | 94,912 | | | 27.9 | | Four to eleven payments | | 37,691 | | | 67.9 | | | 190 | | | 26.3 | | | 512,248 | | | 64.1 | |
| Twelve payments or more | Twelve payments or more | 3,646 | | | 17.1 | | | 1,077 | | | 7.0 | | | 124,534 | | | 36.7 | | Twelve payments or more | | 5,067 | | | 9.1 | | | 861 | | | 5.4 | | | 172,161 | | | 21.5 | |
| Pending claims | Pending claims | 582 | | | 2.7 | | | N/A | | 3.7 | | | 31,187 | | | 9.2 | | Pending claims | | 275 | | | 0.5 | | | N/A | | 8.2 | | | 15,614 | | | 2.0 | |
| Total | Total | 21,266 | | | 100.0 | % | | 1,664 | | | 339,820 | | | 100.0 | % | Total | | 55,537 | | | 100.0 | % | | 1,115 | | | 799,514 | | | 100.0 | % |
| IBNR and other | IBNR and other | | | | | | | 40,920 | | | | IBNR and other | | | | | | | | 9,966 | | | |
| LAE | LAE | | 8,918 | | | | LAE | | | | | | | | | | 20,172 | | | |
| Total primary reserve | Total primary reserve | | $ | 389,658 | | | | Total primary reserve | | $ | 829,652 | | |
|
N/A – Not applicable
Part I. Item 2. Management’s Discussion and Analysis of Financial Condition and Results of Operations (continued)
We develop our Default to Claim Rate estimates based primarily on models that use a variety of loan characteristics to determine the likelihood that a default will reach claim status. Our gross Default to Claim Rate estimates are mainly developed
| | |
Part I. Item 2. Management’s Discussion and Analysis of Financial Condition and Results of Operations
|
based on the Stage of Default and timeTime in defaultDefault of the underlying defaulted loans, as measured by the progress toward foreclosure sale and the number of months in default. See Note 11 of Notes to Consolidated Financial Statements in our 20192020 Form 10-K for additional details about our Default to Claim Rate assumptions.
Our aggregate weighted average net Default to Claim Rate assumption for our primary loans used in estimating our reserve for losses, which is net of estimated Claim Denials and Rescissions, was approximately 19%34% and 30%24% at SeptemberJune 30, 20202021 and December 31, 2019,2020, respectively. This decreaseincrease was primarily due to a shift in the mix of defaults during the three months ended SeptemberJune 30, 2020,2021, given the largersmaller proportion of more recent defaults, including defaults of loans subject to forbearance programs implemented in response to the COVID-19 pandemic.with fewer missed payments. Our net Default to Claim Rate and loss reserve estimate incorporates our expectations with respect to future Rescissions, Claim Denials and Claim Curtailments. Our estimate of such net future Loss Mitigation Activities, inclusive of claim withdrawals, reduced our loss reserve as of SeptemberJune 30, 20202021 and December 31, 20192020 by $28$29.8 million and $19$29.1 million, respectively. These expectations are based primarily on recent claim withdrawal activity and our recent experience with respect to the number of claims that have been denied due to the policyholder’s failure to submit sufficient documentation to perfect a claim within the time period permitted under our Master Policies and also our recent experience with respect to the number of insurance certificates that have been rescinded due to fraud, underwriter negligence or other factors.
Our mortgage insurance total loss reserve as a percentage of our mortgage insurance total RIF was 1.3%1.5% and 0.7%1.4% at SeptemberJune 30, 20202021 and December 31, 2019,2020, respectively. See Note 11 of Notes to Unaudited Condensed Consolidated Financial Statements for information regarding our reserves for losses and a reconciliation of our Mortgage segment’s beginning and ending reserves for losses and LAE.
We considered the sensitivity of our loss reserve estimates at SeptemberJune 30, 20202021 by assessing the potential changes resulting from a parallel shift in Claim Severity and Default to Claim Rate for primary loans. For example, assuming all other factors remain constant, for every one percentage point absolute change in primary Claim Severity for our primary insurance risk exposure (which we estimated to be 97%98.3% of our risk exposure at SeptemberJune 30, 2020,2021, compared to 98%97.5% at December 31, 2019)2020), we estimated that our total loss reserve at SeptemberJune 30, 20202021 would change by approximately $8$8.6 million. Assuming the portfolio mix and all other factors remain constant, for every one percentage point absolute change in our primary net Default to Claim Rate, we estimated a $39$24.4 million change in our primary loss reserve at SeptemberJune 30, 2020.2021.
Total mortgage insurance claims paid of $10.8$4.2 million and $57.0$14.7 million for the three and ninesix months ended SeptemberJune 30, 2020,2021, respectively, decreased from claims paid of $36.7$22.8 million and $103.7$46.2 million for the same respective periods in 2019.2020. The decrease in claims paid is primarily attributable to COVID-19-related forbearance plans and suspensions of foreclosure and evictions. Claims paid in both periods also include the impact of commutations.commutations and settlements. Although expected claims are included in our reserve for losses, the timing of claims paid is subject to fluctuation from quarter to quarter, based on the rate that defaults cure and other factors (as described in “Item 1. Business—Mortgage Insurance—Defaults and Claims” in our 20192020 Form 10-K) that make the timing of paid claims difficult to predict.
The following table shows net claims paid by product and average primary claim paid by product for the periods indicated:indicated.
| | Claims paid | | Claims paid |
| | | Three Months Ended
September 30, | | Nine Months Ended
September 30, | | Three Months Ended
June 30, | | Six Months Ended
June 30, |
| (In thousands) | (In thousands) | 2020 | | 2019 | | 2020 | | 2019 | (In thousands) | | 2021 | | 2020 | | 2021 | | 2020 |
Net claims paid: (1) | | | | | | | | |
| Net claims paid (1) | | Net claims paid (1) | |
| Total primary claims paid | Total primary claims paid | $ | 11,331 | | | $ | 28,981 | | | $ | 57,833 | | | $ | 94,281 | | Total primary claims paid | | $ | 4,870 | | | $ | 22,144 | | | $ | 11,481 | | | $ | 46,502 | |
| Total pool and other | Total pool and other | (230) | | | 901 | | | (502) | | | 2,603 | | Total pool and other | | (649) | | | 639 | | | (787) | | | (272) | |
| Subtotal | Subtotal | 11,101 | | | 29,882 | | | 57,331 | | | 96,884 | | Subtotal | | 4,221 | | | 22,783 | | | 10,694 | | | 46,230 | |
Impact of commutations and settlements (2) | Impact of commutations and settlements (2) | (267) | | | 6,812 | | | (323) | | | 6,827 | | Impact of commutations and settlements (2) | | — | | | — | | | 4,000 | | | (56) | |
| Total net claims paid | Total net claims paid | $ | 10,834 | | | $ | 36,694 | | | $ | 57,008 | | | $ | 103,711 | | Total net claims paid | | $ | 4,221 | | | $ | 22,783 | | | $ | 14,694 | | | $ | 46,174 | |
| Total average net primary claim paid (1) (3) | Total average net primary claim paid (1) (3) | $ | 46.4 | | | $ | 47.0 | | | $ | 48.6 | | | $ | 48.6 | | Total average net primary claim paid (1) (3) | | $ | 46.8 | | | $ | 47.9 | | | $ | 45.2 | | | $ | 49.2 | |
| | Average direct primary claim paid (3) (4) | Average direct primary claim paid (3) (4) | $ | 47.8 | | | $ | 48.1 | | | $ | 49.7 | | | $ | 49.5 | | Average direct primary claim paid (3) (4) | | $ | 48.4 | | | $ | 49.0 | | | $ | 46.8 | | | $ | 50.2 | |
(1)NetIncludes the impact of reinsurance recoveries.recoveries and LAE.
(2)Includes payments to commute mortgage insurance coverage on certain performing and non-performing loans. For the six months ended June 30, 2021, primarily includes payments made to settle certain previously disclosed legal proceedings.
(3)Calculated without giving effect to the impact of other commutations.commutations and settlements.
(4)Before reinsurance recoveries.
Other Operating Expenses. Other operating expenses for the three and six months ended SeptemberJune 30, 2020 decreased2021 increased as compared to the same periodperiods in 2019,2020, primarily due to: (i) an increase in ceding commissionsvariable and share-based incentive compensation expense in 2021, including as part of allocated corporate operating expenses and (ii) a decrease in variable compensation expense. The decrease in other operating expenses for the nine months ended September 30, 2020 as comparedceding commissions.
Part I. Item 2. Management’s Discussion and Analysis of Financial Condition and Results of Operations (continued)
to the same period in 2019 is primarily due to: (i) a decrease in technology-related expenses; (ii) a decrease in compensation expense in 2020 including variable and share-based compensation; and (iii) an increase in ceding commissions. This decrease in expense for the three and nine months ended September 30, 2020 as compared to the same periods in 2019, was partially offset by higher allocated corporate operating expenses. | | |
Part I. Item 2. Management’s Discussion and Analysis of Financial Condition and Results of Operations
|
Our expense ratio on a net premiums earned basis represents our Mortgage segment’s operating expenses (which include policy acquisition costs and other operating expenses, as well as allocated corporate operating expenses), expressed as a percentage of net premiums earned. Our expense ratio was 21.5%26.4% and 21.2%24.4% for the three and ninesix months ended SeptemberJune 30, 2020,2021, respectively, compared to 23.0%20.2% and 22.0%21.1% for the same periods in 2019,2020, respectively. For both the three and nine months ended September 30, 2020, the decreaseThe increase in other operating expenses, as compared to the same periods in the prior year, was the primary driver of the decreaseincrease in the expense ratio.
Interest Expense. The increase in interest expense for the three and ninesix months ended SeptemberJune 30, 2020,2021, as compared to the same periods in 2019,2020, primarily reflects: (i)reflects an increase in our senior notes outstanding in 2020 and (ii) interest on the $200.0 million 3% intercompany surplus note issued by Radian Guaranty2021 compared to Radian Group in January 2020. These increases in interest expense, were partially offset by the positive impact of our net reduction in senior notes outstanding in 2019. See NotesNote 12 and 16 of Notes to Unaudited Condensed Consolidated Financial Statements for additional information on our senior notes and Surplus Notes, respectively.notes.
Results of Operations—Real Estatehomegenius
Three and NineSix Months Ended SeptemberJune 30, 20202021 Compared to Three and NineSix Months Ended SeptemberJune 30, 20192020
As noted above in Results of Operations—Consolidated and as further discussed in Note 4 of Notes to Unaudited Condensed Consolidated Financial Statements, we made certain modifications to our segment reporting in 2020. These changes to our reportable segments have been reflected in our homegenius segment operating results for all periods presented. The following table summarizes our Real Estatehomegenius segment’s results of operations for the three and ninesix months ended SeptemberJune 30, 20202021 and 2019:2020.
| | Summary results of operations - homegenius | | Summary results of operations - homegenius |
| | | Change | | Change | | | | | |
| | Three Months Ended
September 30, | | Favorable (Unfavorable) | | Nine Months Ended
September 30, | | Favorable (Unfavorable) | | | Three Months Ended
June 30, | | Change Favorable (Unfavorable) | | Six Months Ended
June 30, | | Change Favorable (Unfavorable) |
| (In millions) | (In millions) | 2020 | | 2019 | | 2020 vs. 2019 | | 2020 | | 2019 | | 2020 vs. 2019 | (In millions) | | 2021 | | 2020 | | 2021 vs. 2020 | | 2021 | | 2020 | | 2021 vs. 2020 |
Adjusted pretax operating income (loss) (1) (2) | Adjusted pretax operating income (loss) (1) (2) | $ | (5.9) | | | $ | (2.5) | | | $ | (3.4) | | | $ | (15.6) | | | $ | (10.2) | | | $ | (5.4) | | Adjusted pretax operating income (loss) (1) (2) | | $ | (9.2) | | | $ | (3.9) | | | $ | (5.3) | | | $ | (19.7) | | | $ | (7.1) | | | $ | (12.6) | |
| Net premiums earned | Net premiums earned | 3.1 | | | 3.6 | | | (0.5) | | | 7.2 | | | 8.2 | | | (1.0) | | Net premiums earned | | 7.7 | | | 4.7 | | | 3.0 | | | 14.9 | | | 7.9 | | | 7.0 | |
| Services revenue | Services revenue | 30.1 | | | 26.4 | | | 3.7 | | | 80.5 | | | 72.1 | | | 8.4 | | Services revenue | | 25.8 | | | 17.7 | | | 8.1 | | | 44.3 | | | 40.9 | | | 3.4 | |
| Cost of services | Cost of services | 21.5 | | | 18.2 | | | (3.3) | | | 55.3 | | | 50.2 | | | (5.1) | | Cost of services | | 21.4 | | | 12.7 | | | (8.7) | | | 38.5 | | | 27.7 | | | (10.8) | |
Other operating expenses (2) | Other operating expenses (2) | 17.4 | | | 14.3 | | | (3.1) | | | 46.8 | | | 40.3 | | | (6.5) | | Other operating expenses (2) | | 20.9 | | | 13.4 | | | (7.5) | | | 39.8 | | | 27.3 | | | (12.5) | |
|
(1)Our senior management uses adjusted pretax operating income (loss) as our primary measure to evaluate the fundamental financial performance of each of the Company’s business segments. See Note 4 of Notes to Unaudited Condensed Consolidated Financial Statements.
(2)Includes allocation of corporate operating expenses of $3.8$4.7 million and $11.0$8.7 million for the three and ninesix months ended SeptemberJune 30, 2020,2021, respectively, and $2.9$2.8 million and $8.4$6.2 million for the same periods in 2019,2020, respectively.
Adjusted Pretax Operating Income (Loss). Our Real Estatehomegenius segment’s adjusted pretax operating loss for the three and ninesix months ended SeptemberJune 30, 20202021 was $5.9$9.2 million and $15.6$19.7 million, respectively, compared to adjusted pretax operating loss of $2.5$3.9 million and $10.2$7.1 million for the same periods in 2019,2020, respectively. The increase in our adjusted pretax operating loss for the three and ninesix months ended SeptemberJune 30, 2020,2021, as compared to the same periods in 2019,2020, was primarily driven by higher other operating expenses and cost of services, partially offset byby: (i) an increase in services revenue.
Services Revenue.Services revenue increased for the threevariable and nine months ended September 30, 2020,share-based incentive compensation expense in 2021, including as compared to the same periods in 2019, primarily due to ongoing growth in title services.
Other Operating Expenses. Other operating expenses include other selling, general and administrative expenses, depreciation, and allocationspart of corporate general and administrative expenses. Other operating expenses for the three and nine months ended September 30, 2020 increased compared to the same periods in 2019, due in part to higher allocated corporate operating expenses and (ii) continued strategic investments focused on our title and digital real estate businesses. Such investments contributed to an increase in ongoing strategic initiatives. See “Results of Operations—Consolidated—Threetotal expenses, which was partially offset by increases in net premiums earned and Nine Months Ended September 30, 2020 Comparedservices revenue attributable to Threeour title and Nine Months Ended September 30, 2019—Other Operating Expenses.”valuation services businesses.
Part I. Item 2. Management’s Discussion and Analysis of Financial Condition and Results of Operations (continued)
Results of Operations—All Other
Three and NineSix Months Ended SeptemberJune 30, 20202021 Compared to Three and NineSix Months Ended SeptemberJune 30, 20192020
All Other activities includeinclude: (i) income (losses) from assets held by our holding company,company; (ii) related general corporate operating expenses not attributable or allocated to our reportable segments and,segments; (iii) for all periods throughprior to its sale in the first quarter of 2020, income and expenses related to Clayton priorClayton; (iv) for all periods presented, the income and expenses related to its sale on January 21, 2020.our traditional appraisal services; and (v) certain other immaterial revenue and expense items. See Note 4 of Notes to Unaudited Condensed Consolidated Financial Statements for additional information.
| | |
Part I. Item 2. Management’s Discussion and Analysis of Financial Condition and Results of Operations
|
The following table summarizes our All Other results of operations for the three and ninesix months ended SeptemberJune 30, 20202021 and 2019:2020.
| | Summary results of operations - All Other | | Summary results of operations - All Other |
| | | Change | | Change | | | | | |
| | Three Months Ended
September 30, | | Favorable (Unfavorable) | | Nine Months Ended
September 30, | | Favorable (Unfavorable) | | | Three Months Ended
June 30, | | Change Favorable (Unfavorable) | | Six Months Ended
June 30, | | Change Favorable (Unfavorable) |
| (In millions) | (In millions) | 2020 | | 2019 | | 2020 vs. 2019 | | 2020 | | 2019 | | 2020 vs. 2019 | (In millions) | | 2021 | | 2020 | | 2021 vs. 2020 | | 2021 | | 2020 | | 2021 vs. 2020 |
Adjusted pretax operating income (loss) (1) | Adjusted pretax operating income (loss) (1) | $ | 5.1 | | | $ | 5.7 | | | $ | (0.6) | | | $ | 13.5 | | | $ | 12.9 | | | $ | 0.6 | | Adjusted pretax operating income (loss) (1) | | $ | 2.5 | | | $ | 1.2 | | | $ | 1.3 | | | $ | 5.9 | | | $ | 3.3 | | | $ | 2.6 | |
| Services revenue | Services revenue | — | | | 14.0 | | | (14.0) | | | 2.9 | | | 38.4 | | | (35.5) | | Services revenue | | — | | | 6.6 | | | (6.6) | | | 0.1 | | | 12.2 | | | (12.1) | |
| Net investment income | Net investment income | 5.6 | | | 5.5 | | | 0.1 | | | 16.6 | | | 16.2 | | | 0.4 | | Net investment income | | 3.4 | | | 3.9 | | | (0.5) | | | 7.6 | | | 8.5 | | | (0.9) | |
| Cost of services | Cost of services | — | | | 9.4 | | | 9.4 | | | 2.5 | | | 28.2 | | | 25.7 | | Cost of services | | — | | | 3.2 | | | 3.2 | | | — | | | 8.7 | | | 8.7 | |
| Other operating expenses | Other operating expenses | 0.8 | | | 4.7 | | | 3.9 | | | 3.9 | | | 14.0 | | | 10.1 | | Other operating expenses | | 1.2 | | | 3.1 | | | 1.9 | | | 2.1 | | | 5.2 | | | 3.1 | |
(1)Our senior management uses adjusted pretax operating income (loss) as our primary measure to evaluate the fundamental financial performance of each of the Company’s business segments. See Note 4 of Notes to Unaudited Condensed Consolidated Financial Statements.
Off-Balance Sheet Arrangements
There have been no material changes in off-balance sheet arrangements from those specified in our 2019 Form 10-K, other than as described below.
Variable Interest Entity
In February 2020, Radian Guaranty entered into a fully collateralized reinsurance agreement with Eagle Re 2020-1 Ltd., an unaffiliated special purpose reinsurer domiciled in Bermuda. The Eagle Re Issuers are special purpose VIEs that are not consolidated in our consolidated financial statements because we do not have the unilateral power to direct those activities that are significant to their economic performance.
For additional information about the Eagle Re Issuers and our other reinsurance arrangements, see Note 8 of Notes to Unaudited Condensed Consolidated Financial Statements.
Contractual Obligations and Commitments
There have been no material changes outside of the ordinary course of business in our contractual obligations and commitments from those specified in our 2019 Form 10-K. See Notes 11 and 12 of Notes to Unaudited Condensed Consolidated Financial Statements for additional information on increases in 2020 to our reserve for losses and LAE and our long-term debt obligations, respectively.
Part I. Item 2. Management’s Discussion and Analysis of Financial Condition and Results of Operations (continued)
Liquidity and Capital Resources
Consolidated Cash Flows
The following table summarizes our consolidated cash flows from operating, investing and financing activities:activities.
| | (In thousands) | Nine Months Ended
September 30, | |
| Summary cash flows - Consolidated |
| | | | Six Months Ended
June 30, |
| (In thousands) | (In thousands) | 2020 | | 2019 | (In thousands) | | 2021 | | 2020 |
| | | Net cash provided by (used in): | |
| Operating activities | Operating activities | $ | 498,756 | | | $ | 506,805 | | Operating activities | | $ | 275,896 | | | $ | 305,291 | |
| Investing activities | Investing activities | (737,657) | | | (162,903) | | Investing activities | | (76,393) | | | (580,435) | |
| Financing activities | Financing activities | 229,071 | | | (398,654) | | Financing activities | | (155,742) | | | 263,536 | |
| Effect of exchange rate changes on cash and restricted cash | — | | | (4) | | |
| | Increase (decrease) in cash and restricted cash | Increase (decrease) in cash and restricted cash | $ | (9,830) | | | $ | (54,756) | | Increase (decrease) in cash and restricted cash | | $ | 43,761 | | | $ | (11,608) | |
|
Operating Activities. Our most significant source of operating cash flows is generally from premiums received from our mortgage insurance policies, while our most significant uses of operating cash flows are generally for our operating expenses and claims paid on our mortgage insurance policies and our operating expenses.policies. Net cash provided by operating activities totaled $498.8$275.9 million for the ninesix months ended SeptemberJune 30, 2020,2021, a slight decrease compared to $506.8$305.3 million for the same period in 2019.2020. This decrease was principally the result of cash received from the IRS in the first quarter of 2019, which included a $57.2 million refund which was previously on deposit with the IRS,due to lower direct premiums written, partially offset by a reduction in claims paid for the ninesix months ended SeptemberJune 30, 2020.2021.
Investing Activities. Net cash used in investing activities was $737.7$76.4 million for the ninesix months ended SeptemberJune 30, 2020,2021, compared to $162.9$580.4 million used in investing activities for the same period in 2019.2020. This change was primarily the result of: (i)of an increase in purchases, net of proceeds from sales,redemptions and decreases in purchases of both short-term investments, net, and fixed-maturity investments available for sale, and (ii) a decreasepartially offset by decreases in proceeds from sales of trading securities.investments.
Financing Activities. Net cash used in financing activities was $155.7 million for the six months ended June 30, 2021, compared to net cash provided by financing activities increasedof $263.5 million for the nine months ended September 30, 2020, compared to net cash used in financing activities during the same period in 2019.2020. For the ninesix months ended SeptemberJune 30, 2020,2021, our primary financing activities included: (i) repurchases of our common shares; (ii) payment of dividends; and (iii) net repayments of secured borrowings. For the six months ended June 30, 2020, cash provided by financing activities included the issuance of Senior Notes due 2025, partially offset by: (i) an increase in repurchases of our common shares and (ii) an increase in dividends paid.payments of dividends. See Notes 12 and14 of Notes to Unaudited Condensed Consolidated Financial Statements for additional information regarding our senior note issuance,borrowings and share repurchases, and increased dividends.respectively.
See “Item 1. Financial Statements (Unaudited)—Condensed Consolidated Statements of Cash Flows (Unaudited)” for additional information.
| | |
Part I. Item 2. Management’s Discussion and Analysis of Financial Condition and Results of Operations
|
Liquidity Analysis—Holding Company
Radian Group serves as the holding company for our operating subsidiaries and does not have any operations of its own. At SeptemberJune 30, 2020,2021, Radian Group had available, either directly or through unregulated subsidiaries, unrestricted cash and liquid investments of $1.1 billion.$923.0 million. Available liquidity at SeptemberJune 30, 20202021 excludes certain additional cash and liquid investments that have been advanced to Radian Group from ourits subsidiaries to pay for corporate expenses and interest payments. Total liquidity, which includes our undrawn $267.5 million unsecured revolving credit facility, as described below, was $1.4$1.2 billion as of SeptemberJune 30, 2020.2021.
During the ninesix months ended SeptemberJune 30, 2020,2021, Radian Group’s available liquidity increaseddecreased by $455.5$179.7 million, primarily due primarily to net proceeds of $515.6 million from the issuance of Senior Notes due 2025 (see “—Capitalization—Holding Company” belowpayments for details) and Radian Reinsurance’s return of $465 million of capital to Radian Group in January 2020, as approved by the Pennsylvania Insurance Department. The effects of the debt issuance and return of capital were partially offset by the cost of share repurchases and dividends, as described below, and the transfer of $200 million of cash and marketable securities to Radian Guaranty in exchange for a surplus note in the same amount. See “—Mortgage” below for additional information.below.
In addition to available cash and marketable securities, Radian Group’s principal sources of cash to fund future liquidity needs include: (i) payments made to Radian Group by its subsidiaries under expense- and tax-sharing arrangements; (ii) net investment income earned on its cash and marketable securities; (iii) to the extent available, dividends or other distributions from ourits subsidiaries; and (iv) amounts, if any, that Radian Guaranty is able to repay under the 2017 Surplus Notes.Note. Radian Group also has in place a $267.5 million unsecured revolving credit facility with a syndicate of bank lenders, which has a maturity date of January 18, 2022. At September 30, 2020, the full $267.5 million remains undrawn and available under the facility. Subject to
Part I. Item 2. Management’s Discussion and Analysis of Financial Condition and Results of Operations (continued)
certain limitations, borrowings under the credit facility may be used for working capital and general corporate purposes, including, without limitation, capital contributions to our insurance and reinsurance subsidiaries as well as growth initiatives. At June 30, 2021, the full $267.5 million remains undrawn and available under the facility. The credit facility has a minimum liquidity requirement of $35 million. See Note 12 of Notes to Consolidated Financial Statements in our 20192020 Form 10-K for additional information on the unsecured revolving credit facility and Note 12 of Notes to Unaudited Condensed Consolidated Financial Statements for information on the most recent amendment, effective May 6, 2020, to that facility.
We expect Radian Group’s principal liquidity demands for the next 12 months to be: (i) the payment of corporate expenses, including taxes; (ii) interest payments on our outstanding debt obligations; and (iii) subject to approval by our board of directors and our ongoing assessment of our financial condition, and potential capital demands in our mortgage insurance business, the payment of quarterly dividends on our common stock.stock, which we increased in May 2021 from $0.125 to $0.14 per share; and (iv) the potential continued repurchases of shares of our common stock pursuant to our current and potential future share repurchase authorizations.
In addition to our ongoing short-term liquidity needs discussed above, our most significant need for liquidity beyond the next 12 months is the repayment of $1.4 billion aggregate principal amount of our senior debt due in future years. See “—Capitalization—Holding Company” below for details of our debt maturity profile. Radian Group’s liquidity demands for the next 12 months or in future periods could also include: (i) early repurchases or redemptions of portions of our debt obligations; (ii) the repurchase of shares of our common stock, including pursuant to the share repurchase authorization, as described below, for which $198.9 million in authorization remains outstanding; (iii) potential additional investments to support our business strategy; and (iv)(iii) potential additional capital contributions to ourits subsidiaries, including due to the continuing impact that the COVID-19 pandemic could have on the liquidity, results of operations and financial condition of Radian Group and its subsidiaries. In our subsidiaries. As a result of the COVID-19 pandemic and its impact on the economy, including the significant increase in unemployment levels, we experienced a material increase in new defaults in the second quarter, and to a lesser extent the third quarter, of 2020 including as a result of mortgage forbearance programs. While we expect it will take a number of months or years before any new defaults resulting from the pandemic would require a claim payment, Radian Group may be required to contribute additional capital to support Radian Guaranty’s PMIERs cushion due to increased minimum asset requirements on defaulted loans. SeeForm 10-K, see “Item 1A. Risk Factors,” including “—Radian Group’s sources of liquidity may be insufficient to fund its obligations” and “—and“—Radian Guaranty may fail to maintain its eligibility status with the GSEs, and the additional capital required to support Radian Guaranty’s eligibility could reduce our available liquidity” for additional discussion about the elevated risks and uncertainties associated with the COVID-19 pandemic and the potential impact to Radian Guaranty’s Minimum Required Assets. See also Notes 1 and 16 of Notes to Unaudited Condensed Consolidated Financial Statements and “Overview—COVID-19 Impacts” for further information.
If Radian Group’s current sources of liquidity are insufficient to fund its obligations, or if we otherwise decide to increase our liquidity position, Radian Group may seek additional capital, including by incurring additional debt, issuing additional equity, or selling assets, which we may not be able to do on favorable terms, if at all.
Share Repurchases. During the ninesix months ended SeptemberJune 30, 2020,2021, the Company repurchased 11.04.3 million shares of Radian Group common stock under programs authorized by Radian Group’s board of directors, at a total cost of $226.3$98.7 million, including commissions. Effective March 19, 2020, the Company suspended its share repurchase program and canceled its current 10b5-1 plan. Radian may initiate a new 10b5-1 plan at its discretion in the future. The expiration date of the current share repurchase authorization remains August 31, 2021. See Note 14 of Notes to Unaudited Condensed Consolidated Financial Statements for additional details on our share repurchase programs.program.
Dividends.Dividends and Dividend Equivalents. In 2019,Throughout 2020, and for the first quarter of 2021, our quarterly common stock dividend was $0.0025$0.125 per share. Effective February 13, 2020,May 4, 2021, Radian Group’s board of directors authorized an increase to the Company’s quarterly cash dividend to $0.125$0.14 per share. Based on our current outstanding shares of common stock and restricted stock units, we would require approximately $96$106 million in the aggregate to pay our quarterly dividends and dividend equivalents for the next 12 months. Radian Group is not subject to any limitations on its ability to pay dividends except those generally applicable to corporations that are incorporated in Delaware. The declaration and payment of future quarterly cash dividends remains subject to the board of directors’ determination.
Corporate Expenses and Interest Expense. Radian Group has expense-sharing arrangements in place with its principal operating subsidiaries that require those subsidiaries to pay their allocated share of certain holding-company-level expenses, including interest payments on Radian Group’s outstanding debt obligations. Corporate expenses and interest expense on Radian Group’s debt obligations allocated under these arrangements during the ninesix months ended SeptemberJune 30, 20202021 of $94.7$69.6 million and $48.3$41.3 million, respectively, were substantially all reimbursed by ourits subsidiaries. We expect substantially all of our holding company expenses to continue to be reimbursed by our subsidiaries under our expense-sharing arrangements.
| | |
Part I. Item 2. Management’s Discussion and Analysis of Financial Condition and Results of Operations
|
The expense-sharing arrangements between Radian Group and ourits mortgage insurance subsidiaries, as amended, have been approved by the Pennsylvania Insurance Department, but such approval may be modified or revoked at any time.
Taxes. Pursuant to our tax-sharing agreements, our operating subsidiaries pay Radian Group an amount equal to any federal income tax the subsidiary would have paid on a standalone basis if they were not part of our consolidated tax return. As a result, from time to time, under the provisions of our tax-sharing agreements, Radian Group may pay to or receive from its operating subsidiaries amounts that differ from Radian Group’s consolidated federal tax payment obligation.obligation. During the ninesix months ended SeptemberJune 30, 2020,2021, Radian Group received $9.4$12.7 million of tax-sharing agreement payments from its operating subsidiaries.
Part I. Item 2. Management’s Discussion and Analysis of Financial Condition and Results of Operations (continued)
Capitalization—Holding Company
The following table presents our holding company capital structure:structure.
| | Capital structure | | Capital structure |
| | (In thousands) | (In thousands) | September 30,
2020 | | December 31,
2019 | (In thousands) | | June 30,
2021 | | December 31,
2020 |
| Debt: | | | | |
| Debt | | Debt | |
| Senior Notes due 2024 | Senior Notes due 2024 | $ | 450,000 | | | $ | 450,000 | | Senior Notes due 2024 | | $ | 450,000 | | | $ | 450,000 | |
| Senior Notes due 2025 | Senior Notes due 2025 | 525,000 | | | — | | Senior Notes due 2025 | | 525,000 | | | 525,000 | |
| Senior Notes due 2027 | Senior Notes due 2027 | 450,000 | | | 450,000 | | Senior Notes due 2027 | | 450,000 | | | 450,000 | |
| Deferred debt costs on senior notes | Deferred debt costs on senior notes | (20,241) | | | (12,890) | | Deferred debt costs on senior notes | | (17,455) | | | (19,326) | |
| Revolving credit facility | Revolving credit facility | — | | | — | | Revolving credit facility | | — | | | — | |
| Total | Total | 1,404,759 | | | 887,110 | | Total | | 1,407,545 | | | 1,405,674 | |
| | Stockholders’ equity | Stockholders’ equity | 4,122,379 | | | 4,048,723 | | Stockholders’ equity | | 4,333,833 | | | 4,284,353 | |
| | Total capitalization | Total capitalization | $ | 5,527,138 | | | $ | 4,935,833 | | Total capitalization | | $ | 5,741,378 | | | $ | 5,690,027 | |
| | Debt-to-capital ratio | Debt-to-capital ratio | 25.4 | % | | 18.0 | % | Debt-to-capital ratio | | 24.5 | % | | 24.7 | % |
Stockholders’ equity increased by $73.7$49.5 million from December 31, 20192020 to SeptemberJune 30, 2020.2021. The net increase in stockholders’ equity for the six months ended June 30, 2021 resulted primarily from our net income of $245.6$280.8 million, and netpartially offset by share repurchases of $98.7 million, unrealized gainslosses on investments of $121.5$84.9 million for the nine months ended September 30, 2020. These items were partially offset by shares repurchased under our share repurchase programs of $226.3 million, including commissions, and dividends of $74.3$52.3 million.
We regularly evaluate opportunities, based on market conditions, to finance our operations by accessing the capital markets or entering into other types of financing arrangements with institutional and other lenders and financing sources, and consider various measures to improve our capital and liquidity positions, as well as to strengthen our balance sheet, improve Radian Group’s debt maturity profile and maintain adequate liquidity for our operations. In the past we have repurchased and exchanged, prior to maturity, some of our outstanding debt, and in the future, we may from time to time seek to redeem, repurchase or exchange for other securities, or otherwise restructure or refinance some or all of our outstanding debt prior to maturity in the open market through other public or private transactions, including pursuant to one or more tender offers or through any combination of the foregoing, as circumstances may allow. The timing or amount of any potential transactions will depend on a number of factors, including market opportunities and our views regarding our capital and liquidity positions and potential future needs, including as a result of the effects of the COVID-19 pandemic. There can be no assurance that any such transactions will be completed on favorable terms, or at all.
In May 2020, we issued $525 million aggregate principal amount of Senior Notes due 2025 and received net proceeds of $515.6 million. These notes mature on March 15, 2025 and bear interest at a rate of 6.625% per annum, payable semi-annually on March 15 and September 15 of each year, which interest payments commenced on September 15, 2020. See Note 12 of Notes to Unaudited Condensed Consolidated Financial Statements for additional information.
Mortgage
The principal demands for liquidity in our mortgage insuranceMortgage business currently include: (i) the payment of claims and potential claim settlement transactions, net of reinsurance; (ii) expenses (including those allocated from Radian Group); (iii) repayments of FHLB advances; (iv) interest expense and repayments, if any, associated with the 2017 Surplus Notes;Note; and (v) taxes, including potential additional purchases of U.S. Mortgage Guaranty Tax and Loss Bonds. See NoteNotes 10 and 16 of Notes to Unaudited Condensed Consolidated Financial Statements in our 2020 Form 10-K for additional information related to these non-interest bearing instruments.
The principal sources of liquidity in our mortgage insurance business currently include insurance premiums, net investment income and cash flows from: (i) investment sales and maturities; (ii) FHLB advances; and (iii) capital contributions from Radian Group. We believe that the operating cash flows generated by each of our mortgage insurance subsidiaries will provide these subsidiaries with a substantial portion of the funds necessary to satisfy their needs for the foreseeable future. However, see “Overview—COVID-19 Impacts” and Note 1 of Notes to Unaudited Condensed Consolidated Financial Statements for discussion about the elevated risks and uncertainties associated with the COVID-19 pandemic, including the impact on our PMIERs cushion.Cushion.
| | |
Part I. Item 2. Management’s Discussion and Analysis of Financial Condition and Results of Operations
|
As of SeptemberJune 30, 2020,2021, our Mortgage segmentmortgage insurance subsidiaries maintained claims paying resources of $5.1$5.6 billion on a statutory basis, which consists of contingency reserves, statutory policyholders’ surplus, premiums received but not yet earned and loss reserves. In addition, our reinsurance programs are designed to provide additional claims-paying resources during times of economic stress and elevated losses. See Note 8 of Notes to Unaudited Condensed Consolidated Financial Statements for additional information.
Part I. Item 2. Management’s Discussion and Analysis of Financial Condition and Results of Operations (continued)
Radian Guaranty’s Risk-to-capital as of SeptemberJune 30, 20202021 was 13.211.4 to 1. Radian Guaranty is not expected to need additional capital to satisfy state insurance regulatory requirements in their current form. At June 30, 2021, Radian Guaranty had statutory policyholders’ surplus of $596.0 million. This balance includes a $275.6 million benefit from U.S. Mortgage Guaranty Tax and Loss Bonds issued by the U.S. Department of the Treasury, which mortgage guaranty insurers such as Radian Guaranty may purchase in order to be eligible for a tax deduction, subject to certain limitations, related to amounts required to be set aside in statutory contingency reserves. See Note 16 of Notes to Unaudited Condensed Consolidated Financial Statements, “Overview—COVID-19 Impacts” and “Item 1A. Risk Factors” in our 2020 Form 10-K for more information about these bonds and the risks associated with potential corporate tax rate increases, our statutory and PMIERs requirements and the potential effects of increased defaults due to the COVID-19 pandemic.
Radian Guaranty currently is an approved mortgage insurer under the PMIERs. Private mortgage insurers, including Radian Guaranty, are required to comply with the PMIERs to remain approved insurers of loans purchased by the GSEs. Radian Guaranty currently is an approved mortgage insurer under the PMIERs. At SeptemberJune 30, 2020,2021, Radian Guaranty’s Available Assets under the current PMIERs financial requirements totaled approximately $4.5$5.0 billion, resulting in a PMIERs cushionCushion of $1.0$1.9 billion, or 28%58%, over its Minimum Required Assets. Those amounts compare to Available Assets of $3.5 billion.
In addition to theand a PMIERs cushion heldof $4.7 billion and $1.3 billion, respectively, at Radian Guaranty, our excess available resources include our unsecured revolving credit facility and holding company liquidity. While these resources may be utilized to enhanceDecember 31, 2020.
The primary driver of the increase in Radian Guaranty’s PMIERs cushion,Cushion during the impact of the COVID-19 pandemic could affect our ability to remain compliant with the PMIERs financial requirements assix months ended June 30, 2021 is the increase in defaults and resulting increase to ourAvailable Assets, reflecting positive cash flows from operating activities, combined with a decrease in Minimum Required Assets. During the six months ended June 30, 2021, Radian Guaranty’s Minimum Required Assets could reduce or potentially exhaust our PMIERs cushion or exceed our Available Assets. See “Item 1A. Risk Factors” for additional information.
The following chart summarizes our PMIERs cushion and Radian’s excess available resources as of September 30, 2019, December 31, 2019 and September 30, 2020, calculated based on the PMIERs financial requirements in effect for each date shown.
(1)Percentages represent the values showndecreased primarily as a percentageresult of a decrease in the number of primary loans in default and an overall decline in IIF. Radian Guaranty’s Minimum Required Assets underinclude a benefit as a result of reinsurance agreements, including the applicable PMIERs financial requirements in effect for the dates shown.
(2)Represents Radian Group’s liquidity, netaddition of the $35 million minimum liquidity requirement under the unsecured revolving credit facility.
(3)Represents Radian Guaranty’s excess of Available Assets over its Minimum Required Assets, calculated in accordance with the PMIERs financial requirements in effect for each date shown.
Our PMIERs cushion as of September 30, 2020 includes the benefit from ourEagle Re 2021-1 Ltd. reinsurance agreement with Eagle Re 2020-1 Ltd. effective February 2020 and the transfer of $200 million of cash and marketable securities from Radian Group in exchange for a surplus note in the same amount in January 2020, partially offset by an increase in Minimum Required Assets due to the termination of the intercompany reinsurance agreement with Radian Reinsurance.April 2021. See Notes 8 and 16 of Notes to Unaudited Condensed Consolidated Financial Statements, respectively, for additional information on Eagle Re 2020-1 Ltd. and these intercompany actions.
In October 2020, Radian Guaranty entered into a fourth fully collateralized reinsurance agreement, with Eagle Re 2020-2 Ltd. that will reduce net RIF by $390.3 million, and is expected to reduce the capital required to be held at Radian Guaranty by reducing the PMIERs Minimum Required Assets by the same amount. This expected growth in PMIERs excess available resources has not been reflected in the information provided above. After consideration of the reinsurance agreement with Eagle Re 2020-2 Ltd., Radian Guaranty’s excess of Available Assets over its Minimum Required Assets under PMIERs would have
Part I. Item 2. Management’s Discussion and Analysis of Financial Condition and Results of Operations (continued)
increased from 28% to 42%. See “Overview—Quarterly Highlights and Recent Company Developments” and Note 8 of Notes to Unaudited Condensed Consolidated Financial Statements for additional information on thisour reinsurance agreements.
Our PMIERs Cushion at June 30, 2021, also includes a benefit from the application of the Disaster Related Capital Charge that has reduced the total amount of Minimum Required Assets that Radian Guaranty otherwise would have been required to hold against pandemic-related defaults by approximately $435 million as of June 30, 2021, taking into consideration our risk distribution structures in effect as of that date. We expect that application of the Disaster Related Capital Charge will continue to materially reduce Radian Guaranty’s PMIERs Minimum Required Assets, but will diminish over time.
Notwithstanding the continued application of the Disaster Related Capital Charge, the total amount of Minimum Required Assets we may be required to hold against defaulted loans will increase over time, because the 0.30 multiplier is applied to a higher base factor for the defaulting loans (including those in forbearance) as they age, with increases taking place upon four, six and 12 missed monthly payments. Additionally, given the lack of an expiration date under the CARES Act, it is difficult to estimate how long the GSEs may continue to offer COVID-19 forbearance programs for new agreement.defaults. It is also difficult to assess how long the GSEs may continue to apply the COVID-19 Amendment to loans in a COVID-19 related forbearance program. As described above, the COVID-19 Crisis Period expired March 31, 2021. See “Item 1. Business—Regulation—Federal Regulation—GSE Requirements” in our 2020 Form 10-K for more information about the Disaster Related Capital Charge, and for further information, including on the expiration of the COVID-19 Crisis Period, see “Overview—Legislative and Regulatory Developments—COVID-19 Amendment to PMIERs.”
Even though they hold assets in excess of the minimum statutory capital thresholds and PMIERs financial requirements, the ability of Radian’s mortgage insurance subsidiaries to pay dividends on their common stock is restricted by certain provisions of the insurance laws of Pennsylvania, their state of domicile. Under Pennsylvania’s insurance laws, ordinary dividends and other distributions may only be paid out of an insurer’s positive unassigned surplus, measured as of the end of the prior fiscal year, unless the Pennsylvania Insurance Department approves the payment of dividends or other distributions from another source. In light of Radian Guaranty’s negative unassigned surplus related to operating losses in prior periods, the ongoing need to set aside contingency reserves, and the current ongoing economic uncertainty related to the COVID-19 pandemic, which increased losses in 2020 and is expected to further increasecould cause losses in future periods, we do not anticipate that Radian Guaranty will be permitted under applicable insurance laws to pay ordinary dividends or other distributions for the foreseeable future without prior approval from the Pennsylvania Insurance Department. Under Pennsylvania’s insurance laws, an insurer must obtain the Pennsylvania Insurance Department’s approval to pay an Extraordinary Distribution. Radian Guaranty sought and received such approval to return capital by paying Extraordinary Distributions to Radian Group for the foreseeable future.in 2019 and 2018. See Note 1816 of Notes to Consolidated Financial Statements in our 20192020 Form 10-K for additional information on our Extraordinary Distributions, statutory dividend restrictions and contingency reserve requirements.
Radian Guaranty and Radian Reinsurance are both members of the FHLB. As members, they may borrow from the FHLB, subject to certain conditions, which include requirements to post collateral and to maintain a minimum investment in FHLB stock. Advances from the FHLB may be used to provide low-cost, supplemental liquidity for various purposes, including to fund incremental investments. Radian’s current strategy includes using FHLB advances as financing to purchasefor general cash management purposes and for purchases of additional investment securities that have similar durations, for the purpose of generating additional earnings from our investment securities portfolio with minimallimited incremental risk. As of SeptemberJune 30, 2020,2021, there
| | |
Part I. Item 2. Management’s Discussion and Analysis of Financial Condition and Results of Operations
|
were $141.1$154.0 million of FHLB advances outstanding. See Note 12 of Notes to Unaudited Condensed Consolidated Financial Statements for additional information.
Real Estatehomegenius
As of SeptemberJune 30, 2020,2021, our Real Estatehomegenius segment maintained cash and liquid investments totaling $48.1$69.6 million, primarily held by Radian Title Insurance. The sale of Clayton, in January 2020, did not have a material impact on our liquidity.
Title insurance companies, including Radian Title Insurance, are subject to comprehensive state regulations, including minimum net worth requirements. Radian Title Insurance was in compliance with all of its respective regulatory minimum net worth requirements at SeptemberJune 30, 2020.2021. In the event the cash flowflows from operations of the Real Estatehomegenius segment isare not adequate to fund all of its needs, including the regulatory capital needs of Radian Title Insurance, Radian Group may provide additional funds to the Real Estatehomegenius segment in the form of an intercompany note or other capital contribution, and if needed for Radian Title Insurance, subject to the approval of the Ohio Department of Insurance, if needed.Insurance. Additional capital support may also be required for potential investments in new business initiatives to support our strategy of growing our businesses.
Liquidity levels may fluctuate depending on the levels and contractual timing of our invoicing and the payment practices of our Real Estatehomegenius clients, in combination with the timing of the Real Estateour homegenius segment’s payments for employee compensation and to external vendors. The amount, if any, and timing of the Real Estatehomegenius segment’s dividend paying capacity will depend primarily on the amount of excess cash flow generated by the segment.
Ratings
Radian Group, Radian Guaranty, Radian Reinsurance and Radian ReinsuranceTitle Insurance have been assigned the ratings set forth in the chart below. We believe that ratings often are considered by others in assessing our credit strength and the financial strength of our primary mortgage insurance subsidiaries. The following ratings have been independently assigned by third-party statistical rating organizations, are for informational purposes only and are subject to change. For a discussion of how the COVID-19 pandemic has affected and may further affect our ratings, seeSee “Item 1A. Risk Factors—The current financial strength ratings assigned to our mortgage insurance subsidiaries could weaken our competitive position and potential downgrades by rating agencies to these ratings and the ratings assigned to Radian Group could adversely affect the Company.Company” in our 2020 Form 10-K.
| | | | | | | | | | | | | | | | | | | | | | | | | | | |
| Ratings |
| | | | | | | | | |
| Subsidiary | | Moody’s (1) | | S&P (2) | | Fitch (3) | | Demotech (4) | |
Radian Group | | Ba1 | | BB+ | | BBB- | | N/A | |
Radian Guaranty | | Baa1 | | BBB+ | | A- | | N/A | |
Radian Reinsurance | | N/A | | BBB+ | | N/A | |
| | | | | N/A | |
| Radian Title Insurance | | N/A | | N/A | | N/A | | A | |
(1)Based on the October 17, 2019July 14, 2020 update, Moody’s outlook for Radian Group and Radian Guaranty currently is Stable.
(2)Based on the March 26, 2020April 28, 2021 update, S&P’s outlook for Radian Group, Radian Guaranty and Radian Reinsurance is currently Negative.Stable.
(3)Based on the May 12, 20203, 2021 release, Fitch’s outlook for Radian Group and Radian Guaranty is currently Negative.Stable.
(4)Based on the May 20, 2021 release, Demotech’s outlook for Radian Title Insurance is currently Exceptional.
Critical Accounting PoliciesEstimates
As of the filing date of this report, there were no significant changes in our critical accounting policiesestimates from those discussed in our 20192020 Form 10-K, other than described below.10-K. See Note 2 of Notes to Unaudited Condensed Consolidated Financial
Part I. Item 2. Management’s Discussion and Analysis of Financial Condition and Results of Operations (continued)
Statements for accounting pronouncements issued but not yet adopted that may impact the Company’s consolidated financial position, earnings, cash flows or disclosures.
We adopted ASU 2016-13 on January 1, 2020 using the modified retrospective adoption approach. This ASU and the associated subsequent amendments require that financial assets measured at their amortized cost basis be presented at the net amount expected to be collected. Credit losses relating to our available-for-sale debt securities are recorded through an allowance for credit losses, rather than a write-down of the asset, with the amount of the allowance limited to the amount by which fair value is less than amortized cost. This allowance method will allow reversals of credit losses if the estimate of credit losses declines. This ASU affected certain of our accounts and notes receivable, including premiums receivable, and certain of our other assets, including reinsurance recoverables; however, the update did not have a material effect on our financial statements and disclosures. See Note 6 of Notes to Unaudited Condensed Consolidated Financial Statements for additional information.
We adopted ASU 2019-04, Codification Improvements related to Financial Instruments—Credit Losses, Derivatives and Hedging, and Financial Instruments on January 1, 2020. This update to the accounting standards regarding financial instruments and derivatives and hedging clarifies the accounting treatment for the measurement of credit losses and provides further clarification on previously issued updates. The adoption of this update did not have a material effect on our financial statements and disclosures.
Item 3. Quantitative and Qualitative Disclosures About Market Risk
Market risk represents the potential for loss due to adverse changes in the value of financial instruments as a result of changes in market conditions. Examples of market risk include changes in interest rates, credit spreads, foreign currency exchange rates and equity prices. We regularly analyze our exposure to interest-rate risk and credit-spread risk and have determined that the fair value of our investments is materially exposed to changes in both interest rates and credit spreads.spreads. See “Item 1A. Risk Factors—Our success depends, in part, on our ability to manage risks in our investment portfolio.portfolio” in our 2020 Form 10-K.
Our market risk exposures at SeptemberJune 30, 20202021 have not materially changed from those identified in our 20192020
Form 10-K.
Item 4. Controls and Procedures
Evaluation of Disclosure Controls and Procedures
We maintain disclosure controls and procedures designed to provide reasonable assurance that information required to be disclosed in the reports we file or submit under the Exchange Act is recorded, processed, summarized and reported within the time periods specified in the SEC’s rules and forms and that such information is accumulated and communicated to our management, including our Chief Executive Officer and Chief Financial Officer, as appropriate, to allow timely decisions regarding required disclosure.
Our management, including our Chief Executive Officer and Chief Financial Officer, conducted an evaluation of the effectiveness of our disclosure controls and procedures (as defined in Rules 13a-15(e) and 15d-15(e) of the Exchange Act) as of SeptemberJune 30, 2020,2021, pursuant to Rule 15d-15(b) under the Exchange Act. Based upon that evaluation, our Chief Executive Officer and Chief Financial Officer concluded that, as of SeptemberJune 30, 2020,2021, our disclosure controls and procedures were effective to provide reasonable assurance that the information required to be disclosed by us in the reports we file or submit under the Exchange Act is recorded, processed, summarized and reported within the time periods specified in the SEC’s rules and forms.
Changes in Internal Control Over Financial Reporting
During the three-month period ended SeptemberJune 30, 2020,2021, there has been no change in our internal control over financial reporting (as defined in Rule 13a-15(f) of the Exchange Act) that has materially affected, or is reasonably likely to materially affect, our internal control over financial reporting.
PART II—OTHER INFORMATION
Item 1. Legal Proceedings
We are routinely involved in a number of legal actions and proceedings, including reviews, audits and inquiries by various regulatory entities, as well as litigation and other disputes arising in the ordinary course of our business.
On December 22, 2016, Ocwen Loan Servicing, LLC and Homeward Residential, Inc. (collectively, “Ocwen”) filed a complaint in the U.S. District Court See Note 13 of Notes to Unaudited Condensed Consolidated Financial Statements for the Eastern District of Pennsylvania against Radian Guaranty alleging breach of contract and bad faith claims and seeking monetary damages and declaratory relief (the “Litigation”). Ocwen has also initiated similar legal proceedings against several other mortgage insurers. On December 17, 2016, Ocwen separately filed a parallel arbitration petition against Radian Guaranty before the American Arbitration Association (“AAA”) asserting substantially the same allegations (the “Arbitration”). Ocwen’s filings together listed 9,420 mortgage insurance certificates issued under multiple insurance policies, including Pool Insurance policies, as subject to the dispute. On June 5, 2017, Ocwen filed an amended complaint and an amended petition (collectively, the “Amended Filings”) with the court and the AAA, respectively, together listing 8,870 certificates as subject to the dispute. On April 11, 2018, the parties entered into a confidential agreement with respect to all certificates subject to the dispute. The confidential agreement resolved certain categories of claims involved in the dispute and, on April 12, 2018, the parties filed a stipulation of voluntary dismissal of the Litigation and the trial judge issued an order dismissing all claims and counterclaims in the Litigation. Radian Guaranty was not required to make any payment in connection with this confidential agreement. Pursuant to the confidential agreement, the parties: (i) dismissed the Litigation; (ii) narrowed the scope of the Arbitration to Ocwen’s breach of contract claims seeking payment of insurance benefits on approximately 2,500 certificates that Ocwen was previously pursuing through the Amended Filings; and (iii) agreed to resolve the Arbitration through an alternative dispute resolution process administered by the AAA (the “ADR Process”). Effective June 30, 2020, Radian Guaranty, PHH Mortgage Corporation, on behalf of itself, and as successor by merger to Ocwen (collectively, “PHH”), and Ocwen Financial Corporation entered into a Confidential Settlement Agreement and Release (the “Ocwen Settlement”) to fully resolve, among other things, all claims subject to the ADR Process. Pursuant to the Ocwen Settlement, among other things: (i) Radian agreed to make a cash settlement payment following the implementation of the Ocwen Settlement and (ii) each party agreed to release the other with respect to all known or unknown claims with respect to the certificates subject to the ADR Process as well as with respect to all other certificates issued on loans serviced by PHH for which Radian decided claims prior to January 1, 2019. On July 2, 2020, the ADR Process panel ordered that all proceedings in the ADR Process are stayed pending final dismissal after receipt of the required consents. Implementation of the Ocwen Settlement, which was subject to the condition precedent that the GSEs consent to the settlement agreement, became effective on November 1, 2020 upon finalization of the consents.
On August 31, 2018, Nationstar Mortgage LLC d/b/a Mr. Cooper (“Nationstar”) filed a complaint in the U.S. District Court for the Eastern District of Pennsylvania against Radian Guaranty (the “Complaint”) alleging breach of contract, bad faith, equitable indemnification, unjust enrichment, and conversion claims and seeking monetary damages and declaratory relief. Exhibit 1 to the Complaint lists 3,014 mortgage insurance certificates issued under multiple insurance policies as subject to disputes involving insurance coverage decisions (the “Coverage Disputed Loans”). Exhibit 2 to the Complaint further lists 2,231 mortgage insurance certificates issued under multiple insurance policies as subject to disputes involving premium refund requests. In December 2018, Radian Guaranty filed a motion to dismiss the Complaint. In March 2019, the trial judge issued an order granting in part, and denying in part, our motion to dismiss, and dismissed Nationstar’s unjust enrichment and conversion claims. In May 2019, Radian Guaranty filed an answer to the Complaint, with affirmative defenses and counterclaims. On September 23, 2019, the trial judge entered as an order a joint stipulation submitted by Nationstar and Radian Guaranty that narrowed the scope of the dispute involving Coverage Disputed Loans to claims relating to 1,704 mortgage insurance certificates. Effective June 26, 2020, Radian Guaranty and Nationstar entered into a Confidential Settlement Agreement and Release (the “Nationstar Settlement”) to fully resolve, among other things, all claims and counterclaims in this litigation. Pursuant to the Nationstar Settlement, among other things: (i) Radian agreed to make a cash settlement payment following the implementation of the Nationstar Settlement and (ii) each party agreed to release the other with respect to all known or unknown claims with respect to the certificates subject to this litigation as well as with respect to all other certificates issued under certain policies on loans serviced by Nationstar for which Radian decided claims prior to January 1, 2019. Implementation of the Nationstar Settlement remains subject to the condition precedent that the GSEs consent to the settlement agreement. On July 9, 2020, the trial judge granted the parties’ joint motion requesting to stay this litigation pending receipt of required consents. On October 7, 2020, counsel for Radian and Nationstar submitted a joint status report to the trial judge reporting that the parties are continuing to diligently work on obtaining the required GSE consents, and they will provide the trial judge with another joint status report by January 7, 2021, should the case not be dismissed before then.
As previously disclosed, based on developments in the Ocwen and Nationstar legal proceedings discussed above, the Company’s IBNR reserve was increased in 2019 to reflect our best estimate of our probable loss in connection with these legal proceedings. The settlement agreements are materially consistent with these estimates, and as a result, the implementation of
the Ocwen Settlement, which became effective as of November 1, 2020, and the execution and expected implementation of the Nationstar Settlement, do not have a material impact on our mortgage insurance reserves for these legal proceedings. A failure to receive the required consents of the GSEs to the Nationstar Settlement could restart the applicable legal proceeding, the outcome of which could have an adverse effect on our future results of operations, liquidity or financial condition.
We also are periodically subject to reviews and audits, as well as inquiries, information-gathering requests and investigations. In connection with these matters, from time to time we receive requests and subpoenas seekingadditional information and documents related to aspects of our business.
The legal and regulatory matters discussed above and in our 2019 Form 10-K could result in adverse judgments, settlements, fines, injunctions, restitutions or other relief that could require significant expenditures or have other effects on our business. Management believes, based on current knowledge and after consultation with counsel, that the outcome of such actions will not have a material adverse effect on our consolidated financial condition. The outcome of litigation and otherregarding legal and regulatory matters and proceedings is inherently uncertain, and it is possible that one or more of the matters currently pending or threatened could have an adverse effect on our liquidity, financial condition or results of operations for any particular period.proceedings.
Item 1A. Risk Factors
Except as provided below, thereThere have been no material changes to our risk factors from those previously disclosed in our 20192020 Form 10-K.
The COVID-19 pandemic has adversely impacted our business, and its ultimate impact on our business and financial results will depend on future developments, which are highly uncertain and cannot be predicted, including the scope, severity and duration of the pandemic and actions taken by governmental authorities in response to the pandemic.
The COVID-19 pandemic has significantly impacted the global economy, disrupted global supply chains, lowered certain equity market valuations, created periods of significant volatility and disruption in financial markets, required adjustments in the housing finance system and real estate markets and increased unemployment levels. In addition, the pandemic has resulted in temporary closures of many businesses and the institution of social distancing and sheltering in place requirements in most states and communities in the United States. As a result, the demand for certain of our products and services has been impacted, and this impact may continue for an unknown period and could expand in scope. Our business operations may also be disrupted if significant portions of our workforce are unable to work effectively, including because of illness, remote technology interruptions, quarantines, government actions, or other restrictions in connection with the pandemic. To date, in response to the pandemic, among other things, we have raised additional capital, aligned our business with the temporary origination and servicing guidelines announced by the GSEs, and activated our business continuity program by transitioning to a work-from-home virtual workforce model with certain essential activities supported by limited staff in controlled office environments, and made adjustments to our pricing and our underwriting guidelines to account for the increased risk and uncertainty associated with the COVID-19 pandemic.
We expect that the COVID-19 pandemic and measures taken to reduce its spread will continue to impact our business, subjecting us to the following risks:
■As a result of the COVID-19 pandemic and its impact on the economy, including the significant increase in unemployment levels, we have experienced a material increase in new defaults, including as a result of mortgage forbearance programs. If these conditions persist or deteriorate, it could impact Radian Guaranty’s ability to remain compliant with the PMIERs financial requirements. See“—The credit performance of our mortgage insurance portfolio is impacted by macroeconomic conditions and specific events that affect the ability of borrowers to pay their mortgages” and “—Radian Guaranty may fail to maintain its eligibility status with the GSEs, and the additional capital required to support Radian Guaranty’s eligibility could reduce our available liquidity.”
■The increase in the number of new mortgage defaults resulting from the COVID-19 pandemic could potentially exhaust Radian Guaranty’s excess of Available Assets over Minimum Required Assets under the PMIERs, in which case we may be required to contribute capital to Radian Guaranty. The amount that Radian Group could be required to contribute to Radian Guaranty to support PMIERs compliance is uncertain, but could be significant and, under extreme economic scenarios, exhaust Radian Group’s available liquidity. See “—Radian Guaranty may fail to maintain its eligibility status with the GSEs, and the additional capital required to support Radian Guaranty’s eligibility could reduce our available liquidity” and “—Radian Group’s sources of liquidity may be insufficient to fund its obligations.”
■The pandemic has placed additional significant strain on the operations and financial condition of mortgage servicers, which could result in the disruption of the servicing of mortgage loans covered by our insurance policies or result in servicers failing to appropriately report the status of loans, including whether the loans are subject to a COVID-19-related forbearance program. We could receive less mortgage insurance premiums as a result of loans going into default. See “—Our business depends, in part, on effective and reliable loan servicing.”
■As a result of COVID-19-related relief programs, we anticipate that defaults related to the pandemic, if not cured, could remain in our defaulted loan inventory for a protracted period of time, potentially resulting in higher levels of Claim Severity for those loans that ultimately result in a claim. See ��—An extension in the period of time that a loan remains in our defaulted loan inventory may increase the severity of claims that we ultimately are required to pay.”
■The assumptions upon which we base our premium levels may ultimately prove to be inaccurate, especially in a period of high market volatility and economic uncertainty as currently exists due to the pandemic. We have experienced a material increase in new defaults as a result of the pandemic and we may continue to experience a high volume of new defaults associated with the pandemic in future periods. Future new defaults are not currently reflected in our mortgage insurance loss reserves because we generally are not permitted to establish reserves in anticipation of such defaults. As a result of the material increase in new defaults that we have experienced, our loss reserves increased significantly in the second quarter of 2020. Our loss reserves could continue to increase significantly in future periods as a result of new defaults stemming from the pandemic, which would negatively impact our results of operations and financial condition. See “—Our success depends on our ability to assess and manage our underwriting risks; the premiums we charge may not be adequate to compensate us for our liability for losses and the amount of capital we are required to hold against our insured risks. We expect to incur future provisions for losses beyond what we have reserved for in our financial statements.”
■The GSEs’ business practices have changed in response to the COVID-19 pandemic, with the primary objectives of supporting borrowers impacted by the pandemic and protecting the ongoing functioning of the housing finance system. As the situation continues to evolve, the actions of the FHFA and GSEs in response to COVID-19 are likely to continue to significantly impact the housing finance system. Because traditional mortgage insurance is an important component of this system, these actions have had, and may continue to have, an impact on our mortgage insurance operations and performance. See “—Changes in the charters, business practices, or role of the GSEs in the U.S. housing market generally, could significantly impact our businesses.”
■The number of home purchases or mortgage refinancings may be materially affected by the impacts of the pandemic on general economic conditions, including the unemployment rate, and on the availability of credit for mortgage loans. In addition, public and private sector initiatives to reduce the transmission of COVID-19, such as the imposition of restrictions on business activities, may affect the number of new mortgages available for us to insure, including as real estate markets confront challenges in the mortgage origination and home sale process created by social distancing and stay-at-home orders. See“—A decrease in the volume of mortgage originations could result in fewer opportunities for us to write new mortgage insurance business and conduct our Real Estate business.”
■The models, assumptions and estimates we use to establish loss reserves may not be accurate, especially in the event of an extended economic downturn or a period of extreme market volatility and uncertainty such as we are currently experiencing due to the COVID-19 pandemic. For example, the ultimate cure rate for loan defaults resulting from the pandemic may be lower than we have previously experienced in the context of other FEMA declared emergencies and lower than our expectations. See “—If the estimates we use in establishing loss reserves are incorrect, we may be required to take unexpected charges to income, which could adversely affect our results of operations.”
■The rating agencies continually review the financial strength ratings assigned to Radian Group and its mortgage insurance subsidiaries, and the ratings are subject to change. The COVID-19 pandemic and its impact on our financial results and condition, could cause one or more of the rating agencies to downgrade the ratings assigned to Radian Group and its mortgage insurance subsidiaries. See “—The current financial strength ratings assigned to our mortgage insurance subsidiaries could weaken our competitive position and potential downgrades by rating agencies to these ratings and the ratings assigned to Radian Group could adversely affect the Company.”
■The markets for credit and interest-rate-sensitive securities have been affected by the COVID-19 pandemic. The value of our fixed income securities has been volatile, which increases the risk that we will not achieve our investment objectives. If, as a result of the COVID-19 pandemic or otherwise, we underestimate our liabilities or improperly structure our investments to meet our expected liabilities, including claim payments in our mortgage insurance business, we could have unexpected losses resulting from the forced liquidation of investments before their maturity, which could adversely affect our results of operations. See“—Our success depends, in part, on our ability to manage risks in our investment portfolio.”
Although we are uncertain of the ultimate magnitude or duration of the business and economic impacts of the COVID-19 pandemic, their ultimate effect on our businesses will depend on, among other things: the extent and duration of the pandemic; the severity of and the number of people infected with the virus and whether an effective anti-viral treatment or vaccine is developed and made widely available; the wider economic effects of the pandemic and the scope and duration of governmental and other third party measures restricting day-to-day life and business operations; the impact of economic stimulus efforts to support the economy through the pandemic; and governmental and GSE programs implemented to assist borrowers
experiencing a COVID-19-related hardship, including forbearance programs and suspensions of foreclosures and evictions. Due to the unprecedented and continually evolving social and economic impacts associated with the COVID-19 pandemic on the U.S. and global economies generally, and in particular on the U.S. housing, real estate and housing finance markets, there is significant uncertainty regarding the ultimate impact on our business, business prospects, operating results and financial condition and our estimates or predictions regarding such impact may be materially wrong.
Radian Guaranty may fail to maintain its eligibility status with the GSEs, and the additional capital required to support Radian Guaranty’s eligibility could reduce our available liquidity.
In order to be eligible to insure loans purchased by the GSEs, mortgage insurers such as Radian Guaranty must meet the GSEs’ eligibility requirements, or PMIERs. The PMIERs are comprehensive, covering virtually all aspects of the business of a private mortgage insurer, including internal risk management and quality controls, the relationship between the GSEs and the approved insurer and the approved insurer’s financial condition, as well as extensive requirements related to the conduct and operations of a mortgage insurer’s business. If Radian Guaranty is unable to satisfy the requirements set forth in the PMIERs, the GSEs could restrict it from conducting certain types of business with them or take actions that may include not purchasing loans insured by Radian Guaranty.
The PMIERs financial requirements currently require that a mortgage insurer’s Available Assets meet or exceed its Minimum Required Assets. At September 30, 2020, Radian Guaranty was in compliance with the PMIERs financial requirements and had Available Assets of $4.5 billion, which resulted in an excess of Available Assets over Minimum Required Assets (“PMIERs cushion”) of $1.0 billion over its Minimum Required Assets of $3.5 billion. Radian Guaranty’s ability to continue to comply with the PMIERs financial requirements could be impacted by, among other factors: (i) the volume and product mix of our NIW; (ii) factors affecting the performance of our mortgage insurance portfolio, including the level of new defaults and prepayments; (iii) for existing defaults, the aging of these existing defaults and whether they are subject to, and remain in, forbearance programs, and the ultimate losses we incur on new or existing defaults; (iv) the application of the Disaster Related Capital Charge (as discussed below) under the PMIERs and the amount of credit that we receive under the PMIERs financial requirements for our third-party reinsurance transactions (which is subject to initial and ongoing review by the GSEs); and (v) potential amendments or updates to the PMIERs.
As a result of the COVID-19 pandemic and its impact on the economy, including the significant increase in unemployment levels, we have experienced a material increase in new defaults, including as a result of borrowers participating in mortgage forbearance programs. As of September 30, 2020, Radian Guaranty’s default rate was 5.9%. The overall volume of new defaults resulting from the pandemic has resulted in an increase in Radian Guaranty’s Minimum Required Assets and a decrease in Radian Guaranty’s PMIERs cushion. This increase in defaults has also negatively impacted our results of operations since the onset of the pandemic, with the largest impact in the second quarter of 2020 following implementation of the forbearance programs, primarily due to the need to increase our reserve for losses related to the volume of new defaults. We may continue to experience a high level of defaults as a result of the pandemic for the foreseeable future, which defaults would continue to negatively impact Radian Guaranty’s PMIERs Minimum Required Assets and our results of operations. The amount of Minimum Required Assets Radian Guaranty is required to maintain, including potential future increases in Minimum Required Assets, will depend on the number, timing and duration of defaults related to the pandemic, including those defaulted loans participating in forbearance programs. This, in turn, will depend on the scope, severity and duration of the pandemic, its resulting impact on the economy, including unemployment levels and housing prices, and the ability of current and any future government programs to provide economic and individual relief, all of which will likely have an impact on the ability of borrowers to remain current on their mortgage payments and, if they have entered into forbearance or other relief programs, to resume making payments upon the expiration of the forbearance period. The expanded unemployment benefits provided under the CARES Act expired July 31, 2020 and while there has been ongoing congressional debate regarding extension of such benefits, it is unclear if and to what extent the benefits may be continued.
The predominant portion of Radian Guaranty’s defaulted loans as of September 30, 2020 were subject to forbearance programs. Under the CARES Act, upon request by borrowers of federally backed mortgage loans who attest to financial hardship related to the pandemic, mortgage servicers are required to provide these borrowers with up to 180 days’ forbearance on their mortgage payments, which may be extended for an additional 180 days upon request, without requiring validation by the borrowers of their hardship. The CARES Act does not provide an expiration date for these forbearance requirements. The GSEs have amended their forbearance programs to align with the CARES Act, and a significant number of borrowers are participating in such programs. We expect that borrowers with loans covered by private mortgage insurance will continue to represent a high percentage of borrowers participating in GSE forbearance programs given the higher credit risk profile of these loans. In light of the current economic uncertainty, we believe many borrowers may have taken advantage of forbearance programs even if they are able to continue to make mortgage payments on a timely basis and that some borrowers have entered into forbearance programs while continuing to make their monthly mortgage payments.
Our Master Policies generally provide that a default occurs when a borrower misses one monthly payment, regardless of why the payment was missed, including if the payment was deferred under a forbearance program. Once two missed payments have occurred, the PMIERs characterize a loan as “non-performing” and require us to establish an increased Minimum Required Asset factor for that loan regardless of the reason for the missed payments. However, as further described below, the PMIERs
apply a multiplier that reduces the Minimum Required Asset factor for loans that have become non-performing as a result of a “FEMA Declared Major Disaster” event, including as a result of participation in a forbearance program, because those loans generally have a higher likelihood of curing following the conclusion of the event. For these defaults, the PMIERs apply the Disaster Related Capital Charge, which is a 0.30 multiplier to the factor that normally would be applied to such default, effectively reducing the required asset amount by 70%, unless the resulting Minimum Required Asset amount after applying the Disaster Related Capital Charge would be less than the Minimum Required Asset amount for the loan if it was performing, in which case the Minimum Required Asset amount would equal the performing level amount. The GSEs recently issued guidelines (the “National Emergency Guidelines”) that, among other things, implement the COVID-19 Amendment such that the Disaster Related Capital Charge is now applied nationwide to all non-performing loans that either: (i) have an Initial Missed Payment (discussed below) occurring during the COVID-19 Crisis Period or (ii) are subject to a forbearance plan granted in response to a financial hardship related to COVID-19 (which the COVID-19 Amendment deems to be the case for any loan that has an Initial Missed Payment occurring during the COVID-19 Crisis Period), the terms of which are materially consistent with terms of forbearance plans offered by the GSEs. Under the COVID-19 Amendment, the Disaster Related Capital Charge applies for no longer than three calendar months beginning with the month the loan becomes non-performing (i.e., missed two monthly payments), or if greater, the period of time that the loan is subject to a forbearance plan, repayment plan or loan modification trial period granted in response to a financial hardship related to COVID-19. Under the COVID-19 Amendment, the Initial Missed Payment means the first missed monthly payment, which would be reported to us as delinquent as of the last day of the month for which it was due. For example, for a loan first reported to the approved insurer in May as having missed its payments due on April 1 and May 1, the Initial Missed Payment shall be deemed to have occurred on April 30. In this example, the loan would become a non-performing primary mortgage guaranty insurance loan in May and the 0.30 multiplier would be applied for May, June, and July. The National Emergency Guidelines state that they will be updated if the GSEs determine that the COVID-19 Crisis Period needs to be extended.
The current broad-based application of the Disaster Related Capital Charge has reduced the total amount of Minimum Required Assets that Radian Guaranty otherwise would have been required to hold against pandemic-related defaults as of September 30, 2020 by approximately $1.0 billion, taking into consideration our existing risk distribution structures. Primarily as a consequence of the Disaster Related Capital Charge, Radian Guaranty maintained a significant PMIERs cushion as of September 30, 2020 and would have been able to absorb a default rate of approximately 20% and remain in compliance with the PMIERs financial requirements. We expect that application of the Disaster Related Capital Charge will continue to materially reduce Radian Guaranty’s PMIERs Minimum Required Assets for the foreseeable future; however, the benefit that Radian Guaranty currently is receiving from the Disaster Related Capital Charge is expected to diminish over time. Under the terms of the COVID-19 Amendment, unless extended by the GSEs, the COVID-19 Crisis Period ends January 1, 2021. If the COVID-19 Crisis Period is not extended, the Disaster Related Capital Charge would continue to apply to defaults then subject to such Disaster Related Capital Charge for as long as provided under the COVID-19 Amendment discussed above, but would no longer be applied to new defaults that have an Initial Missed Payment occurring after January 1, 2021 unless the loan was then subject to a forbearance plan granted in response to a financial hardship related to COVID-19. Given the lack of an expiration date under the CARES Act, it is difficult to estimate how long the GSEs may continue to offer COVID-19 forbearance programs for new defaults.
With respect to existing defaults that are subject to the Disaster Related Capital Charge, the Disaster Related Capital Charge would no longer would apply, and they would then be subject to the full Minimum Required Asset factors required by the PMIERs, if: (i) they fail to enter a COVID-19 forbearance program within the period prescribed by the COVID-19 Amendment or (ii) for defaults subject to a forbearance program, repayment plan or loan modification trial period, they exit the program, plan or trial period without curing the default status. For loans that continue to remain in forbearance, increased asset factors under the PMIERs are applied against defaulted loans based on the amount of time the loans remain in default, with increases taking place upon four, six and twelve missed monthly payments. As a result, notwithstanding the continued application of the Disaster Related Capital Charge, the total amount of Minimum Required Assets we may be required to hold against defaulted loans will increase over time, including for loans subject to forbearance programs, because the 0.30 multiplier is applied to a higher base factor for the defaulting loans as they age.
If existing and future new defaults continue to materially reduce Radian Guaranty’s Minimum Required Assets, we may be required or otherwise choose to: (i) contribute capital to Radian Guaranty; (ii) alter our strategy with respect to our NIW; or (iii) seek additional capital relief through reinsurance or otherwise, which may not be available on acceptable terms or on terms that would be approved by the GSEs. With respect to reinsurance, the market volatility stemming from the COVID-19 pandemic temporarily disrupted the market for new insurance-linked notes transactions. While new insurance-linked notes reinsurance transactions recently have been completed by Radian Guaranty and other private mortgage insurers, these transactions are on less favorable terms than similar reinsurance transactions executed prior to the pandemic.
Under the PMIERs financial requirements, in addition to non-performing loans, there are increased financial requirements for performing loans with a higher likelihood of default and/or certain credit characteristics, such as higher LTVs and lower FICO scores, as well as for loans originated after January 1, 2016 that are insured under lender-paid mortgage insurance policies not subject to automatic termination under the Homeowners Protection Act of 1998. Therefore, if our mix of business includes more loans that are subject to these increased financial requirements, our Minimum Required Assets will increase. Depending on the
circumstances, we may limit the type and volume of business we are willing to write for certain of our products based on the increased financial requirements associated with certain loans. This could reduce the amount of NIW we write, which could reduce our future revenues.
The GSEs may amend the PMIERs at any time and also have broad discretion to interpret the PMIERs, which could impact the calculation of Radian Guaranty’s Available Assets and/or Minimum Required Assets. The most recent large-scale revisions to PMIERs, or PMIERs 2.0, became effective on March 31, 2019. We expect the GSEs to continue to update the PMIERs periodically in the future, including if and when there are changes to the GSEs’ capital requirements, such as if and when the ECF is finalized.
Compliance with the PMIERs financial requirements could impact our holding company liquidity. If additional capital support for Radian Guaranty is required for it to comply with the PMIERs financial requirements, in light of the amount of Surplus Notes currently outstanding between Radian Group and Radian Guaranty, we do not expect that Radian Guaranty would receive PMIERs credit for additional amounts contributed through surplus notes. As a result, any further amounts contributed to Radian Guaranty to support PMIERs compliance likely would be made in the form of capital contributions. The amount that Radian Group could be required to contribute to Radian Guaranty for this purpose is uncertain, but could be significant and, under extreme economic scenarios, exhaust Radian Group’s available liquidity. Based on our total available resources as of September 30, 2020 (which includes Radian Guaranty’s PMIERs cushion, Radian Group’s projected total liquidity, and amounts available under our unsecured credit facility) and assuming all amounts were contributed to Radian Guaranty to support compliance, Radian Guaranty would have been able to absorb a default rate of approximately 45% and remain in compliance with the PMIERs financial requirements. As discussed above, the default rate that Radian Guaranty would have been able to absorb as of September 30, 2020, inclusive of Radian Group’s total available liquidity, reflects the significant benefit Radian Guaranty is continuing to receive from application of the Disaster Related Capital Charge to defaults, which benefit is expected to diminish over time.
Further, if Radian Guaranty becomes capital constrained, it may be more difficult for Radian Guaranty to return capital to Radian Group, which would compound the negative liquidity impact to Radian Group of the contributions it makes to Radian Guaranty and leave less liquidity to satisfy Radian Group’s other obligations. Depending on the amount of liquidity that is utilized from Radian Group, we may be required (or may decide) to seek additional capital by incurring additional debt, issuing additional equity, or selling assets, which we may not be able to do on favorable terms, if at all.
In addition to the PMIERs financial requirements, the PMIERs contain requirements related to the operations of our mortgage insurance business, including extensive operational requirements in areas such as claim processing, loss mitigation, document retention, underwriting, quality control, reporting and monitoring, among others. These increased operational requirements have resulted in additional expenses and have required substantial time and effort from management and our employees, which we expect will continue. Further, as discussed above, the GSEs could amend the PMIERS to address the pandemic in ways that change our operations and/or restrict the rights available under our Master Policies.
The PMIERs prohibit Radian Guaranty from engaging in certain activities such as insuring loans originated or serviced by an affiliate (except under certain circumstances) and require Radian Guaranty to obtain the prior consent of the GSEs before taking many actions, which may include, among other things, entering into various intercompany agreements, settling loss mitigation disputes with customers and commuting risk. Further, pursuant to the National Emergency Guidelines, through March 31, 2021, the consent of the GSEs is required for Radian Guaranty to: (i) pay dividends, make payments of principal or increase payments of interest beyond those commitments made prior to June 30, 2020 associated with the Surplus Notes; (ii) make any other payments, unless related to expenses incurred in the normal course of business or to commitments made prior to June 30, 2020; (iii) pledge or transfer asset(s) to any affiliate or investor; or (iv) enter into any new arrangements or alter any existing arrangements under tax sharing and intercompany expense-sharing agreements other than renewals and extensions of agreements in effect prior to June 30, 2020. These restrictions could prohibit or delay Radian Guaranty from taking certain actions that would be advantageous to it or to Radian Group.
Although we expect Radian Guaranty to retain its eligibility status with the GSEs and to continue to comply with the PMIERs financial requirements, including as potentially updated in the future, we cannot provide assurance that this will occur. Loss of Radian Guaranty’s eligibility status with the GSEs would have an immediate and material adverse impact on the franchise value of our mortgage insurance business and our future prospects, as well as a material negative impact on our future results of operations and financial condition.
Our business depends, in part, on effective and reliable loan servicing.
We depend on third-party servicing of the loans that we insure. Dependable servicing is necessary for timely billing and premium payments to us and effective loss mitigation opportunities for delinquent or near-delinquent loans. Servicers are required to comply with a multitude of legal and regulatory requirements, procedures and standards for servicing residential mortgages such as the CFPB’s mortgage servicing rules. While these requirements are intended to ensure a high level of servicing performance, they also impose a high cost of compliance on servicers that may impact their financial condition and their operating effectiveness. The COVID-19 pandemic has placed additional burdens on many servicers. Challenging economic and market conditions or periods of economic stress and high mortgage defaults such as currently exist make it more difficult for
servicers to effectively service the loans that we insure. Further, the various servicing-related requirements imposed by the CARES Act, the GSEs, the FHA and other federal and state governmental and regulatory bodies and agencies to address the impact of the COVID-19 pandemic on mortgage borrowers heighten the burdens placed on servicers in the current environment. This strain may be further heightened by the short timeframe over which these events have occurred, which has resulted in a high volume of COVID-19 related servicing demands, such as administering forbearance requests for borrowers, generally occurring and moving forward on similar timeframes, further stressing servicer performance as these matters develop and progress through various stages.
In the event a borrower fails to make mortgage payments, including as the result of a forbearance program, servicers often are required to advance such amounts, including principal and interest on the mortgage and amounts to cover taxes and insurance, for a period of time, including with respect to loans purchased by the GSEs. These required “advances” have increased the financial strain on servicers, which could result in their financial insolvency or otherwise disrupt their operations. If we experience a disruption in the servicing of mortgage loans covered by our insurance policies or a failure by servicers to appropriately report the status of a loan, including whether the loan is subject to a COVID-19 related forbearance program, this, in turn, could impact the amount of assets Radian Guaranty is required to hold under the PMIERs or ultimately contribute to a rise in claims among those loans, which could have a material adverse effect on our business, financial condition and operating results.
Under the terms of our 2014 Master Policy and 2020 Master Policy, mortgage insurance premiums are not required to be paid following an event of default. However, if a defaulted loan then cures, all mortgage insurance premiums must be brought current for our insurance coverage to continue, including all premiums that were not paid during the period following the event of default and through the date of cure. Because premiums must be brought current upon a cure, mortgage servicers typically continue to pay mortgage insurance premiums while loans remain in default, understanding that Radian Guaranty will refund these premiums if the loans fail to cure and ultimately go to claim. As part of the National Emergency Guidelines, the GSEs temporarily amended the PMIERs to require that mortgage insurers notify the GSEs before coverage is canceled in specific circumstances, and to give the GSEs the opportunity to pay the premium on behalf of the servicer to keep coverage in force. If we fail to receive mortgage insurance premiums following mortgage defaults resulting from the COVID-19 pandemic, Radian Guaranty’s cash flow could be reduced, potentially requiring Radian Guaranty to liquidate investments at a loss to pay future claims or otherwise require us to alter our investment strategy.
Radian Group’s sources of liquidity may be insufficient to fund its obligations.
Radian Group serves as the holding company for our operating subsidiaries and does not have any operations of its own. As of September 30, 2020, Radian Group had available, either directly or through unregulated subsidiaries, unrestricted cash and liquid investments of $1.1 billion. This amount excludes certain additional cash and liquid investments that have been advanced to Radian Group from our subsidiaries for corporate expenses and interest payments. Total liquidity, which includes our undrawn $267.5 million unsecured revolving credit facility was $1.4 billion as of September 30, 2020.
We expect Radian Group’s principal liquidity demands for the next 12 months to be: (i) the payment of corporate expenses, including taxes; (ii) interest payments on our outstanding debt obligations; and (iii) subject to approval by our board of directors following an assessment of our financial condition and potential capital demands in our mortgage insurance business, the payment of quarterly dividends on our common stock.
In addition to our ongoing short-term liquidity needs discussed above, our most significant need for liquidity beyond the next 12 months is the repayment of our senior debt due in future years. Radian Group’s liquidity demands for the next 12 months or in future periods could also include: (i) early repurchases or redemptions of portions of our debt obligations; (ii) the repurchase of shares of our common stock, including pursuant to our remaining share repurchase authorization; (iii) potential additional investments to support our business strategy; and (iv) potential additional capital contributions to our subsidiaries. See “Item 2. Management’s Discussion and Analysis of Financial Condition and Results of Operations—Liquidity and Capital Resources—Liquidity Analysis—Holding Company” for more information on our liquidity demands, including as impacted by the COVID-19 pandemic.
As a result of the COVID-19 pandemic and its impact on the economy, including the significant increase in unemployment levels, we experienced a material increase in new defaults, including as a result of mortgage forbearance programs, and we may continue to experience an elevated level of new defaults in future periods due to the COVID-19 pandemic. The number, timing and duration of new defaults and, in turn, the number of defaults that ultimately result in claims will depend, among other factors, on the scope, severity and duration of the pandemic, the resulting impact on the economy, including unemployment and housing prices, and the impact of government programs to provide economic and individual relief. If existing and future new defaults continue to materially reduce Radian Guaranty’s PMIERs cushion, we may be required or otherwise choose to contribute capital to Radian Guaranty. See “—Radian Guaranty may fail to maintain its eligibility status with the GSEs, and the additional capital required to support Radian Guaranty’s eligibility could reduce our available liquidity” above for additional information.
If such additional capital support for Radian Guaranty is required, in light of the amount of Surplus Notes currently outstanding between Radian Group and Radian Guaranty, we do not expect that Radian Guaranty would receive PMIERs credit for additional amounts contributed through surplus notes. As a result, any further amounts contributed to Radian Guaranty to
support PMIERs compliance likely would be made in the form of capital contributions. The amount that Radian Group could be required to contribute to Radian Guaranty for this purpose is uncertain, but could be significant and, under extreme economic scenarios, exhaust Radian Group’s available liquidity.
In addition to available cash and marketable securities, Radian Group’s principal sources of cash to fund future liquidity needs include: (i) payments made to Radian Group by its subsidiaries under expense- and tax-sharing arrangements; (ii) net investment income earned on its cash and marketable securities; (iii) to the extent available, dividends or other distributions from our subsidiaries; and (iv) amounts that Radian Guaranty is able to repay under the Surplus Notes. Radian Group also has in place a $267.5 million unsecured revolving credit facility with a syndicate of bank lenders, which has a maturity date of January 18, 2022. At September 30, 2020, the full $267.5 million remains undrawn and available under the facility. Radian Group’s expense-sharing arrangements with its principal operating subsidiaries require those subsidiaries to pay their allocated share of certain holding-company-level expenses, including interest payments on Radian Group’s outstanding senior notes. The expense-sharing arrangements between Radian Group and our mortgage insurance subsidiaries, as amended, have been approved by the Pennsylvania Insurance Department, but such approval may be modified or revoked at any time.
In light of Radian Guaranty’s negative unassigned surplus related to operating losses in prior periods, the ongoing need to set aside contingency reserves, and the current ongoing economic uncertainty related to the COVID-19 pandemic, which could increase losses in future periods, we do not anticipate that Radian Guaranty will be permitted under applicable insurance laws to pay ordinary dividends to Radian Group for the foreseeable future. See Note 18 of Notes to Consolidated Financial Statements in our 2019 Form 10-K for additional information on contingency reserve requirements. In addition, pursuant to the National Emergency Guidelines, through March 31, 2021, the consent of the GSEs is required for Radian Guaranty to: (i) pay dividends or make payments of principal or increase payments of interest beyond those commitments made prior to June 30, 2020 associated with the Surplus Notes; (ii) make any other payments, unless related to expenses incurred in the normal course of business or to commitments made prior to June 30, 2020; (iii) pledge or transfer asset(s) to any affiliate or investor; or (iv) enter into any new arrangements or alter any existing arrangements under tax sharing and intercompany expense-sharing agreements other than renewals and extensions of agreements in effect prior to June 30, 2020. These restrictions could prohibit or delay Radian Guaranty from taking certain actions that would be advantageous to it or to Radian Group.
In light of Radian Group’s short- and long-term needs, it is possible that our sources of liquidity could be insufficient to fund our obligations and could exceed available holding company funds. If this were to occur, we may need or otherwise may decide to increase our available liquidity, which we may be unable to do on favorable terms, if at all.
An extension in the period of time that a loan remains in our defaulted loan inventory may increase the severity of claims that we ultimately are required to pay.
High levels of defaults and corresponding delays in foreclosures could delay our receipt of claims, resulting in an increase in the period of time that a loan remains in our defaulted loan inventory, and as a result, the Claim Severity. Following the financial crisis, the average time that it took for us to receive a claim increased. This was, in part, due to loss mitigation protocols that were established by servicers and also due to a significant backlog of foreclosure proceedings in many states, and especially in those states that impose a judicial process for foreclosures. Generally, foreclosure delays do not stop the accrual of interest or affect other expenses on a loan, and unless a loan is cured during such delay, once title to the property ultimately is obtained and a claim is filed, our paid claim amount may include additional interest and expenses, increasing the Claim Severity.
In response to the COVID-19 pandemic, numerous federal and state governmental and regulatory agencies have instituted borrower relief programs, including payment and foreclosure forbearance, with the objective of supporting borrowers through the economic turmoil resulting from the pandemic and allowing borrowers to remain in their homes. In addition to the mortgage payment forbearance relief discussed above in “—Radian Guaranty may fail to maintain its eligibility status with the GSEs, and the additional capital required to support Radian Guaranty’s eligibility could reduce our available liquidity,” the CARES Act also instituted a temporary foreclosure moratorium on GSE loans. As a result of COVID-19-related relief programs, we anticipate that defaults related to the pandemic, if not cured, could remain in our default loan inventory for a protracted period of time, resulting in higher levels of Claim Severity for those loans that ultimately result in a claim. Higher levels of Claim Severity would increase our incurred losses and could negatively impact our results of operations and financial condition.
Our success depends on our ability to assess and manage our underwriting risks; the premiums we charge may not be adequate to compensate us for our liability for losses and the amount of capital we are required to hold against our insured risks. We expect to incur future provisions for losses beyond what we have reserved for in our financial statements.
The estimates and expectations we use to establish premium rates are based on assumptions made at the time our insurance is written.Our mortgage insurance premiums are based on, among other items, the amount of capital we are required to hold against our insured risks and our estimates of the long-term risk of claims on insured loans. Our premium rates are established based on performance models that consider a broad range of borrower, loan and property characteristics, as well as capital requirements and market and economic conditions. Our assumptions may ultimately prove to be inaccurate, especially in a period of high market volatility and economic uncertainty as currently exists due to the pandemic. The risk of inaccurate or
unreliable data may have an adverse impact on our ability to effectively perform critical business operations, such as servicing, loss management, external reporting or data-driven internal analysis. The premium structure we apply is subject to approval by state regulatory agencies, which can delay or limit our ability to increase our premiums if further filings or approvals are necessary to institute pricing adjustments.
If the risk underlying a mortgage loan that we have insured develops more adversely than we anticipated, we generally cannot increase the premium rates on this in-force business, or cancel coverage or elect not to renew coverage, to mitigate the effects of such adverse developments. Similarly, we cannot adjust our premiums if the amount of capital we are required to hold against our insured risks increases from the amount we were required to hold at the time a policy was written. As a result, if we are unable to compensate for or offset the increased capital requirements in other ways, the returns on our business may be lower than we assumed or expected. Our premiums earned and the associated investment income on those premiums may ultimately prove to be inadequate to compensate for the losses that we may incur and may not provide an adequate return on increased capital that may be required. As a result, our results of operations and financial condition could be negatively impacted.
Additionally, in accordance with industry practice, we do not establish reserves in our mortgage insurance business until we are notified that a borrower has failed to make at least two monthly payments when due. Because our mortgage insurance reserving does not account for the impact of future losses that we expect to incur with respect to performing (non-defaulted) loans, our obligation for ultimate losses that we expect to incur at any period end is not reflected in our financial statements, except to the extent that a premium deficiency exists. As discussed above in “—Radian Guaranty may fail to maintain its eligibility status with the GSEs, and the additional capital required to support Radian Guaranty’s eligibility could reduce our available liquidity,” we anticipate that the pandemic may continue to result in a high volume of new defaults, both as a result of payment forbearance programs and otherwise, in future periods. Future new defaults are not currently reflected in our mortgage insurance loss reserves given that we generally are not permitted to establish reserves in anticipation of such defaults. As a result, our loss reserves could increase significantly in future periods if we continue to experience a high volume of new defaults, which would negatively impact our results of operations and financial condition.
The credit performance of our mortgage insurance portfolio is impacted by macroeconomic conditions and specific events that affect the ability of borrowers to pay their mortgages.
As a seller of mortgage credit protection, our results are subject to macroeconomic conditions and specific events that impact the housing finance and real estate markets, including events that impact mortgage originations and the credit performance of our mortgage insurance portfolio. Many of these conditions are beyond our control, including housing prices, unemployment levels, interest rate changes, the availability of credit and other factors that may be derived from national and regional economic conditions. The COVID-19 pandemic has significantly impacted the global economy, disrupted global supply chains, lowered certain equity market valuations, created periods of significant volatility and disruption in financial markets, required adjustments in the housing finance system and real estate markets and increased unemployment levels. In general, challenging economic conditions such as we are currently experiencing increases the likelihood that borrowers will be unable to satisfy their mortgage obligations. A deteriorating economy can adversely affect housing values, which in turn can influence the willingness of borrowers to continue to make mortgage payments despite having the financial resources to do so.
Mortgage defaults can occur due to a variety of specific events affecting borrowers, including death or illness, divorce or other family problems, unemployment, or other events. In addition, factors impacting regional economic conditions, acts of terrorism, war or other severe conflicts, event-specific economic depressions, natural disasters and other catastrophic events such as the COVID-19 pandemic could result in increased defaults due to the impact of such events on the ability of borrowers to satisfy their mortgage obligations and the value of affected homes. Further, as discussed above under “—Radian Guaranty may fail to maintain its eligibility status with the GSEs, and the additional capital required to support Radian Guaranty’s eligibility could reduce our available liquidity,” payment forbearance programs available as a result of COVID-19 may continue to result in an elevated level of new defaults. Due to these factors, among others, we expect the COVID-19 pandemic may continue to have a negative impact on the credit performance of our mortgage insurance portfolio, including potential further increases in defaults and losses. The pandemic’s effect on the number of new defaults and level of losses will depend, among other factors, on the pandemic’s scope, severity and duration, its resulting impact on the economy including unemployment levels and housing prices, and the ability of current and any future government programs to provide economic and individual relief, all of which will likely have an impact on borrowers’ ability to remain current on their mortgage payments, and if they have entered into forbearance or other relief programs, to resume making payments upon the expiration of the forbearance period. The expanded unemployment benefits provided under the CARES Act expired July 31, 2020 and, while there has been ongoing congressional debate regarding extension of such benefits, it is unclear if and to what extent the benefits may be continued.
Unfavorable macroeconomic developments, including the current ongoing economic uncertainty related to the COVID-19 pandemic and the other factors cited above, may continue to have a material negative impact on our results of operations and a material negative impact on our financial condition.
Changes in the charters, business practices, or role of the GSEs in the U.S. housing market generally, could significantly impact our businesses.
Our current business model is highly dependent on the GSEs as the GSEs are the primary beneficiaries of most of our mortgage insurance policies. The GSEs’ federal charters generally require credit enhancement for low down payment mortgage loans (i.e., a loan amount that exceeds 80% of a home’s value) in order for such loans to be eligible for purchase by them.
Lenders generally have used private mortgage insurance to satisfy this credit enhancement requirement. As a result, low down payment mortgages purchased by the GSEs generally are insured with private mortgage insurance. In order to be eligible to insure loans purchased by the GSEs, mortgage insurers such as Radian Guaranty must meet the GSEs’ eligibility requirements, or PMIERs.
The GSEs’ business practices may be impacted by their results of operations, by administrative policy decisions such as supporting the housing finance system during times of stress as is currently occurring as a result of the COVID-19 pandemic, as well as by legislative or regulatory changes, including the CARES Act. Since September 2008, the GSEs have been operating under the conservatorship of the FHFA. Changes in the business practices of the GSEs, which can be implemented by the GSEs acting independently or through their conservator, the FHFA, could negatively impact our businesses and financial performance, including changes to:
■eligibility requirements for a mortgage insurer to become and remain an approved eligible insurer for the GSEs;
■underwriting standards on mortgages they purchase, including as a result of the FHFA’s more recent focus on reducing the GSEs’ risk profile with respect to loans with multiple higher risk characteristics;
■policies or requirements that may result in a reduction in the number of mortgages they acquire;
■the national conforming loan limit for mortgages they acquire;
■the level of mortgage insurance required, including expanding the loans that are eligible for reduced insurance coverage;
■the terms on which mortgage insurance coverage may be canceled before reaching the cancellation thresholds established by law;
■the terms required to be included in master policies for the mortgage insurance policies they acquire, including limitations on our ability to mitigate losses on insured mortgages that are in default;
■the amount of loan level price adjustments (based on risk) or guarantee fees (which may result in a higher cost to borrowers) that the GSEs charge on loans that require mortgage insurance; and
■the degree of influence that the GSEs have over a mortgage lender’s selection of the mortgage insurer providing coverage.
In addition, as discussed above under “—Radian Guaranty may fail to maintain its eligibility status with the GSEs, and the additional capital required to support Radian Guaranty’s eligibility could reduce our available liquidity,” the GSEs’ business practices have changed in response to the COVID-19 pandemic, with the primary objectives of supporting borrowers impacted by the pandemic and protecting the ongoing functioning of the housing finance system. For example, in response to the pandemic, the FHFA and the GSEs have temporarily suspended all foreclosures and evictions; temporarily instituted mortgage forbearance; temporarily streamlined the appraisal, employment verification, and loan closing processes to address frictions in the mortgage origination process created by social distancing and stay-at-home orders; agreed to purchase loans in forbearance subject to significantly increased loan level price adjustments; announced a four-month limit on servicer advance obligations for loans in forbearance; adopted the COVID-19 Amendment to the PMIERs effective June 30, 2020; and provided that loans in COVID-19 forbearance will remain in mortgage-backed securities pools for at least the duration of the forbearance. The significant impact of the COVID-19 pandemic on housing markets and the housing finance system is wide-ranging and unprecedented in scope. As the situation continues to evolve, the actions or potential inactions of the FHFA and GSEs in response to COVID-19 are likely to continue to have a significant impact on the overall functioning of the housing finance system. Because traditional mortgage insurance is an important component of this system and because our businesses depend on the health of the housing finance system and housing markets in particular, these actions have impacted, and may continue to impact our business operations and performance.
The FHFA has called for the GSEs to transfer a meaningful portion of credit risk, known as a “credit risk transfer,” to the private sector. This mandate builds upon the goals set in each of the last four years for the GSEs to increase the role of private capital by experimenting with different forms of transactions and structures. We continue to participate in these credit risk transfer programs developed by the GSEs. Additional information about these programs may be found in “Item 1. Business—Regulation—Federal Regulation—Housing Finance Reform” and “Item 1. Business—Mortgage Insurance—Mortgage Insurance Business Overview—Mortgage Insurance Products—Other Mortgage Insurance Products—GSE Credit Risk Transfer” in our 2019 Form 10-K.
The GSEs have in the past and may in the future pursue new products and activities in pursuit of their business strategies, subject to providing the FHFA with notice of these proposed activities and obtaining prior approval from the FHFA before offering these proposed products in accordance with the Housing and Economic Recovery Act of 2008. The FHFA recently released for comment a proposed rule regarding the process for how it will consider and approve new GSE activities and products. Among other things, the proposed rule would redefine criteria for determining what constitutes a new activity that requires prior notice to the FHFA and for determining whether the activity constitutes a “new product” that merits public notice and comment, describing a new product as “any new activity that FHFA determines merits public notice and comment on matters of compliance with the applicable sections of a [GSE’s] authorizing statute, safety and soundness, or public interest.” It is difficult to predict what types of new products and activities may be proposed in the future and, if applicable, whether they may be approved by the FHFA. If any existing or future credit risk transfer transactions and structures were to displace primary loan level or standard levels of mortgage insurance, the amount of insurance we write may be reduced, which could negatively impact our franchise value, results of operations and financial condition. As a result, the impact of any credit risk transfer products and transactions or other structures implemented by the GSEs is uncertain and hard to predict. For example, in 2018 Freddie Mac and Fannie Mae announced the launch of pilot programs, IMAGIN and EPMI, respectively, as alternative ways for lenders to obtain credit enhancement and sell loans with LTVs greater than 80% to the GSEs. These investor-paid mortgage insurance programs, in which insurance is acquired directly by each GSE, have many of the same features as private mortgage insurance and represent an alternative to traditional private mortgage insurance products that are provided to individual lenders. Participants in IMAGIN and EPMI are not subject to compliance with the PMIERs, which may create a competitive disadvantage for private mortgage insurers if these pilot programs are expanded. See “Item 1. Business—Regulation—Federal Regulation—Housing Finance Reform” in our 2019 Form 10-K. How the private mortgage insurance industry performs though the COVID-19 pandemic, including the resiliency of the industry’s capital position under the PMIERs, could impact the perception of the industry and traditional mortgage insurance execution as the predominant form of first-loss credit protection, which could influence future debates regarding alternative forms of mortgage insurance execution.
Since the FHFA was appointed as conservator of the GSEs, there has been a wide range of legislative proposals to reform the U.S. housing finance market, including proposals for GSE reform ranging from nearly complete privatization and elimination of the role of the GSEs to a system that combines a federal role with private capital. In September 2019, the U.S. Department of the Treasury and the U.S. Department of Housing and Urban Development (“HUD”) released the Treasury Plan and the HUD Plan to reform the housing finance market, and with respect to the Treasury Plan, to release the GSEs from conservatorship after certain conditions were met. Leadership at the FHFA and HUD have stated that they plan to use the Plans to guide the direction and activities of the GSEs and FHA. With the Plans serving as a roadmap, we expect HUD and FHFA will continue to take actions to shape the role of the FHA and GSEs in the housing finance market and to prepare the GSEs to exit conservatorship. In particular, the FHFA has stated a desire to reduce the GSEs’ exposure to loans with multiple higher risk characteristics in light of the fact that the GSEs currently maintain limited capital positions to support such risk. Following the onset of the COVID-19 pandemic, FHFA leadership has indicated that it remains committed to its path of recapitalizing the GSEs and releasing them from conservatorship. However, with the recent contraction of secondary market execution outside of government supported execution such as the GSEs and FHA and the FHFA’s commitment to continuing to support the housing financial system through the COVID-19 pandemic, the near-term priorities of the FHFA and GSEs remain uncertain and it is unclear if and to what extent the FHFA will continue to advance its reform objectives. As a result, it is difficult to predict when, whether or how the Treasury Plan and HUD Plan may be implemented and what impact actions taken in furtherance of these plans could have on our business, financial condition and results of operations. See “Item 1. Business—Regulation—Federal Regulation—Housing Finance Reform” in our 2019 Form 10-K.
As part of its priority to recapitalize the GSEs, the FHFA is seeking to finalize capital requirements for the GSEs. In May 2020, the FHFA issued for comment a re-proposed ECF for the GSEs, which among other things, would: (i) significantly increase the capital requirements of the GSEs; (ii) decrease the capital credit provided to the GSEs by credit risk transfer transactions; and (iii) reduce the overall capital relief extended to the GSEs for loans with private mortgage insurance. The comment period for the re-proposed ECF concluded on August 31, 2020, and we understand the FHFA is currently reviewing these comments and considering proposed changes to the re-proposed ECF. We believe the FHFA is committed to finalizing the ECF in the near term, although the ultimate form and timing of the final rule is uncertain. If the ECF is finalized in its proposed form, the GSEs could be required to increase pricing to produce an acceptable level of returns. In particular, should the FHFA continue to prioritize release of the GSEs from conservatorship, this likely will require them to seek additional capital from private investors. An increase in GSE pricing could make alternatives to the GSEs such as selling loans to the FHA or private securitization market more attractive, which could reduce the GSEs’ market position and reduce the number of loans available for private mortgage insurance.
If and when the ECF is finalized, we anticipate that the GSEs will seek to amend the PMIERs financial requirements to align with the final form of the ECF. It remains uncertain when and how the PMIERs will be aligned with the ECF, which as re-proposed, is structured similarly to capital requirements imposed on banks and not insurance companies; however, the changes could include: (i) an increase in the level of Radian Guaranty’s required capital and (ii) a decrease in the amount of PMIERs credit that Radian Guaranty receives for existing or future reinsurance or insurance-linked notes transactions.
The future structure of the residential housing finance system remains uncertain, including whether comprehensive housing reform legislation will be adopted and, if so, what form it may ultimately take. It is difficult to predict the impact of any changes on our business. See “Item 1. Business—Regulation—Federal Regulation—Housing Finance Reform” in our 2019 Form 10-K. Although we believe that traditional private mortgage insurance will continue to play an important role in any future housing finance structure, developments in the practices of the GSEs, including potentially new federal legislation that reduces the level of private mortgage insurance coverage used by the GSEs as credit enhancement, or even eliminates the requirement, may diminish the franchise value of our mortgage insurance business and materially and adversely affect our business prospects, results of operations and financial condition.
A decrease in the volume of mortgage originations could result in fewer opportunities for us to write new mortgage insurance business and conduct our Real Estate business.
The amount of new mortgage insurance business we write and real estate transactions we support depends, among other things, on a steady flow of low down payment mortgages that benefit from our mortgage insurance and the volume of real estate transactions that require our services. The volume of mortgage originations is impacted by a number of factors, including:
■restrictions on mortgage credit due to changes in lender underwriting standards, capital requirements affecting lenders, regulatory requirements such as the QM designation for mortgage loans, and the health of the private securitization market;
■mortgage interest rates;
■the health of the domestic economy generally, as well as specific conditions in regional and local economies;
■housing affordability;
■tax laws and policies and their impact on, among other things, deductions for mortgage insurance premiums, mortgage interest payments and real estate taxes;
■demographic trends, including the rate of household formation;
■the rate of home price appreciation;
■government housing policy encouraging loans to first-time homebuyers; and
■the practices of the GSEs, including the extent to which the guaranty fees, loan level price adjustments (based on risk), credit underwriting guidelines and other business terms provided by the GSEs affect the cost of mortgages and lenders’ willingness to extend credit for low down payment mortgages.
To date, the housing and real estate markets have been able to withstand the impacts of the COVID-19 pandemic, with markets generally supported by low interest rates, favorable demographics supporting growth in the population of first-time homebuyers and a relatively constrained supply of homes available for sale. However, the ongoing economic impact of the pandemic remains uncertain and unfavorable developments with respect to unemployment, consumer confidence and underwriting standards, as well as the implementation of public and private sector initiatives to reduce the transmission of COVID-19, such as the imposition of restrictions on business activities, could affect the number of new mortgages available for us to insure and real estate transactions available for our services, including as real estate markets confront challenges in the mortgage origination and home sale process created by social distancing and stay-at-home orders.
In June 2020, the CFPB issued for comment a proposed definition of qualified mortgage, or QM (“New QM Definition”) that would replace the 43% debt-to-income ratio limit from the current definition of a QM (“Current QM Definition”) with a new pricing-based loan definition such that QM status is achieved only if the loan is priced at no greater than 2% above the Average Prime Offer Rate (“APOR”). The New QM Definition also provides that loans priced at or less than 1.5% above APOR would be provided with legal protection from lawsuits that allege that a lender failed to verify a borrower’s ability to repay the loan (a “safe harbor”), while QM loans priced above the safe harbor threshold would receive a “rebuttable presumption” that the loans met the ability to repay standard. The New QM Definition is intended to replace the current “QM Patch,” which effectively provides that loans eligible for purchase by the GSEs are deemed QM loans regardless of whether they exceed the 43% debt-to-income ratio limitation that exists in the Current QM Definition. On August 18, 2020, the CFPB issued a new proposal to create a new category of QMs (Seasoned QMs) for first-lien, fixed-rate loans that meet certain performance requirements over a 36-month seasoning period and are held in the lender’s portfolio until the end of the seasoning period. The comment periods for these proposals have concluded, and we understand the CFPB is currently considering these comments in finalizing the New QM Definition. On October 20, 2020, the CFPB issued a final rule extending the QM Patch until the New QM Definition becomes effective.
The Dodd-Frank Act also granted the FHA, U.S. Department of Veterans Affairs (“VA”) and the U.S. Department of Agriculture flexibility to establish their own definitions of qualified mortgages for their insurance guaranty programs. Both the FHA and VA have created their own definition of qualified mortgages that differ from both the CFPB’s definition and the current underwriting and product guidelines of the GSEs that are subject to the QM Patch. For example, the FHA’s QM safe harbor definition currently applies to loans priced at or less than APOR plus the sum of 115 basis points and the FHA’s annual mortgage
insurance premium rate, which is effectively broader than the APOR plus 1.5% safe harbor pricing metric currently being proposed by the CFPB as a replacement to the QM Patch. As a result, these alternate definitions of QM may be more favorable to lenders and mortgage holders than the New QM Definition that would apply to the GSEs upon termination of the QM Patch, which could drive business to these agencies and have a negative impact on our mortgage insurance business.
If the overall volume of new mortgage originations declines, we could experience a reduced opportunity to write new insurance business and conduct our real estate services and likely will be subject to increased competition, which could negatively affect our business prospects, results of operations and financial condition.
If the estimates we use in establishing loss reserves are incorrect, we may be required to take unexpected charges to income, which could adversely affect our results of operations.
We establish loss reserves in our mortgage insurance business to provide for the estimated cost of future claims on defaulted loans. Setting our loss reserves requires significant judgment by management with respect to the likelihood, magnitude and timing of each potential loss, including an estimate of the impact of our Loss Mitigation Activities with respect to defaulted loans. The models, assumptions and estimates we use to establish loss reserves may not prove to be accurate, especially in the event of an extended economic downturn or a period of extreme market volatility and uncertainty such as we are currently experiencing due to the COVID-19 pandemic. Because of this, claims paid may be substantially different than our loss reserves and these reserves may be insufficient to satisfy the full amount of claims that we ultimately have to pay. Changes to our estimates could adversely impact our results of operations and financial condition.
As discussed above in “—Radian Guaranty may fail to maintain its eligibility status with the GSEs, and the additional capital required to support Radian Guaranty’s eligibility could reduce our available liquidity,” we experienced a material increase in new defaults following the onset of the pandemic and we anticipate that the pandemic may continue to result in a high volume of new defaults, both as a result of payment forbearance programs and otherwise. Future new defaults are not currently reflected in our mortgage insurance loss reserves given that we generally are not permitted to establish reserves in anticipation of such defaults. As a result, our loss reserves could increase significantly in future periods if we continue to experience a high volume of new defaults, which would negatively impact our results of operations and financial condition.
In response to the pandemic, numerous federal and state governmental and regulatory agencies have instituted borrower relief programs, including payment and foreclosure forbearance, with the objective of supporting borrowers through the economic turmoil resulting from the pandemic and allowing borrowers to remain in their homes. In addition to the mortgage payment forbearance relief discussed above in “—Radian Guaranty may fail to maintain its eligibility status with the GSEs, and the additional capital required to support Radian Guaranty’s eligibility could reduce our available liquidity,” the CARES Act also instituted a temporary foreclosure moratorium on GSE loans. As a result of COVID-19-related relief programs, we anticipate that defaults related to the pandemic, if not cured, could remain in our default loan inventory for a protracted period of time, resulting in a higher likelihood of claim for loans in default for an extended period of time and higher levels of Claim Severity for those loans that ultimately result in a claim.
A portion of the defaulted loans in our portfolio originated in the years prior to and including 2008 have been in default for an extended period of time. While these loans are generally assigned a higher loss reserve based on our belief that they are more likely to result in a claim, we also assume, based on historical trends, that a significant portion of these loans will cure or otherwise not result in a claim. Given the significant period of time that these loans have been in default, it is possible that the ultimate cure rate for these defaulted loans will be less than our current estimates of Cures for this inventory of defaults, due to the negative impacts of the COVID-19 pandemic or otherwise.
If our loss reserve estimates are inadequate, we may be required to increase our reserves, which could have a material adverse effect on our results of operations and financial condition
The current financial strength ratings assigned to our mortgage insurance subsidiaries could weaken our competitive position and potential downgrades by rating agencies to these ratings and the ratings assigned to Radian Group could adversely affect the Company.
Radian Guaranty has been assigned a rating of Baa1 by Moody’s, a rating of BBB+ by S&P and a rating of A- by Fitch. While Radian Guaranty’s financial strength ratings currently are investment grade, certain of these ratings are below the ratings assigned to certain other private mortgage insurers. We do not believe our ratings have had a material adverse effect on our relationships with existing customers. However, if financial strength ratings become a more prominent consideration for lenders, we may be competitively disadvantaged by customers choosing to do business with private mortgage insurers that have higher financial strength ratings. In addition, the current PMIERs do not include a specific ratings requirement with respect to eligibility, but if this were to change in the future, we may become subject to a ratings requirement in order to retain our eligibility status under the PMIERs.
The GSEs currently consider financial strength ratings, among other items, to determine the amount of collateral that an insurer must post when participating in the credit risk transfer transactions currently being conducted by the GSEs. As a result, the returns that we are able to achieve when participating in these transactions are dependent, in part, on our financial strength ratings. We currently use Radian Reinsurance to participate in the GSEs’ credit risk transfer transactions. Radian Reinsurance
has been assigned a rating of BBB+ by S&P. Market participants with higher ratings than us are assigned lower collateral requirements by the GSEs for these transactions and generally have a lower cost of capital, which may give them a competitive advantage, including the ability to price more aggressively for these transactions.
We believe that financial strength ratings remain a significant consideration for participants seeking to secure credit enhancement in the non-GSE mortgage market, which includes most non-QM loans. While this market has remained limited since the financial crisis and has further contracted as a result of COVID-19, we view this market as an area of potential long-term future growth, which could be further accelerated by proposed changes to the QM rule currently under consideration by the CFPB, and our ability to successfully participate in this market could depend on our ability to secure higher ratings for our mortgage insurance subsidiaries. In addition, if legislative or regulatory changes were to alter the current state of the housing finance industry such that the GSEs no longer operate in their current capacity, we may be forced to compete in a new marketplace in which financial strength ratings may play a greater role.
The rating agencies continually review the financial strength ratings assigned to Radian Group and its mortgage insurance subsidiaries, and the ratings are subject to change. The COVID-19 pandemic and its impact on our financial results and condition, could cause one or more of the rating agencies to downgrade the ratings assigned to Radian Group and its mortgage insurance subsidiaries. Currently, S&P and Fitch have assigned a negative outlook for the financial strength ratings assigned to our mortgage insurance subsidiaries and Radian Group senior debt. Downgrades to the ratings of our mortgage insurance subsidiaries and Radian Group could adversely affect our cost of funds, liquidity, access to capital markets and competitive position. If we are unable to compete effectively in the current or any future markets as a result of the financial strength ratings assigned to our mortgage insurance subsidiaries, the franchise value and future prospects for our mortgage insurance business could be negatively affected.
Our success depends, in part, on our ability to manage risks in our investment portfolio.
Our investment portfolio is an important source of revenue and is our primary source of claims paying resources. Although our investment portfolio consists primarily of highly-rated fixed income investments, our investment strategy is affected by general economic conditions, which may adversely affect the markets for credit and interest-rate-sensitive securities, including the extent and timing of investor participation in these markets, the level and volatility of interest rates and credit spreads and, consequently, the value of our fixed income securities, and as such, we may not achieve our investment objectives. Volatility or lack of liquidity in the markets in which we invest has at times reduced, and we expect that it will continue to reduce, the market value of some of our investments as a result of the disruption in the financial markets due to the COVID-19 pandemic. In addition, if the credit environment experiences additional deterioration, the risk of impairments of our investments could increase. LIBOR, U.S. Treasury yields and credit spreads have declined, which could further lower investment yields. If the financial markets experience additional disruption and volatility as a result of the COVID-19 pandemic or otherwise, it could have a material adverse effect on our liquidity, financial condition and results of operations.
Interest rates and investment yields on our investments continue to be low compared to historical averages, which has reduced the investment income we generate. For the significant portion of our investment portfolio held by our insurance subsidiaries, to receive favorable treatment under insurance regulatory requirements and full asset credit under the PMIERs, we generally are limited to investing in investment grade fixed income investments that are unlikely to increase our investment yields. Because we depend on our investments as a source of revenue, a prolonged period of lower than expected investment yields would have an adverse impact on our revenues and could potentially adversely affect our results of operations. Further, future updates to the Model Act or PMIERs could restrict our investment choices, which could negatively impact our investment strategy.
In addition, we structure our investment portfolio to satisfy our expected liabilities, including claim payments in our mortgage insurance business. If we underestimate our liabilities or improperly structure our investments to meet these liabilities, as a result of COVID-19 or otherwise, we could have unexpected losses resulting from the forced liquidation of investments before their maturity, which could adversely affect our results of operations.
Item 2. Unregistered Sales of Equity Securities and Use of Proceeds
Issuance of Unregistered Securities
During the three and nine months ended SeptemberJune 30, 2020,2021, no equity securities of Radian Group were sold that were not registered under the Securities Act.
Issuer Purchases of Equity Securities
The following table provides information about purchases of Radian Group common stock by us (and our affiliated purchasers) during the three months ended SeptemberJune 30, 2020.2021.
| | | | | | | | | | | | | | | | | | | | | | | |
| Issuer Purchases of Equity Securities |
| ($ in thousands, except per-share amounts) | | | | | | | |
| Period | Total Number of Shares Purchased (1) | | Average Price Paid per Share | | Total Number of Shares Purchased as Part of Publicly Announced Plans or Programs (2) | | Approximate Dollar Value of Shares That May Yet Be Purchased Under the Plans or Programs (2) |
| Share repurchase programs | | | | | | | |
7/1/2020 to 7/31/2020 | — | | | $ | — | | | — | | | $ | 198,860 | |
8/1/2020 to 8/31/2020 | 471 | | | 14.97 | | | — | | | 198,860 | |
9/1/2020 to 9/30/2020 | — | | | — | | | — | | | 198,860 | |
Total | 471 | | | | | — | | | |
| | | | | | | |
| | | | | | | | | | | | | | | | | | | | | | | | | | |
| Share repurchase program |
| | | | | | | | |
| ($ in thousands, except per-share amounts) | | Total Number of Shares Purchased (1) | | Average Price Paid per Share | | Total Number of Shares Purchased as Part of Publicly Announced Plans or Programs (2) | | Approximate Dollar Value of Shares That May Yet Be Purchased Under the Plans or Programs (2) |
| Period: | | | | | | | | |
| 4/1/2021 to 4/30/2021 | | — | | | $ | — | | | — | | | $ | 190,229 | |
| 5/1/2021 to 5/31/2021 | | 422,920 | | | 23.21 | | | — | | | 190,229 | |
| 6/1/2021 to 6/30/2021 | | 3,895,099 | | | 23.14 | | | 3,892,456 | | | 100,229 | |
| Total | | 4,318,019 | | | | | 3,892,456 | | | |
(1)Includes 471425,563 shares tendered by employees as payment of taxes withheld on the vesting of certain restricted stock awards granted under the Company’s equity compensation plans.
(2)On August 14, 2019, Radian Group’s board of directors approved a share repurchase program that authorizes the Company to spend up to $200 million to repurchase Radian Group common stock. On February 13, 2020, Radian Group’s board of directors authorized a $275 million increase in this program, bringing the total authorization to repurchase shares up to $475 million, excluding commissions. EffectiveIn March 19, 2020,2021, the Company entered into a new 10b5-1 plan and resumed purchases under this program which had been temporarily suspended its share repurchase program and canceled its current 10b5-1 plan. The Company purchased no shares duringin March 2020 in response to the COVID-19 pandemic. During the three months ended SeptemberJune 30, 2020,2021, the Company purchased 3,892,456 shares at an average price of $23.14, including commissions, under this share repurchase program which expires on August 31, 2021. See Note 14 of Notes to Unaudited Condensed Consolidated Financial Statements for additional details on our share repurchase programs.program.
Item 6. Exhibits
| | | | | | | | |
Exhibit No.Number | | Exhibit Name |
| | |
| +*10.1 | | |
| +*10.2 | | |
| +*10.3 | | |
| +*10.4 | | |
| +10.5 | | |
| *31 | | |
| | |
| **32 | | |
| | |
| *101.INS | | Inline XBRL Instance Document - the instance document does not appear in the Interactive Data File because its XBRL tags are embedded within the Inline XBRL document. |
| | |
| *101.SCH | | Inline XBRL Taxonomy Extension Schema Document |
| | |
| *101.CAL | | Inline XBRL Taxonomy Extension Calculation Linkbase Document |
| | |
| *101.DEF | | Inline XBRL Taxonomy Extension Definition Linkbase Document |
| | |
| *101.LAB | | Inline XBRL Taxonomy Extension Label Linkbase Document |
| | |
| *101.PRE | | Inline XBRL Taxonomy Extension Presentation Linkbase Document |
| | |
| *104 | | Cover Page Interactive Data File (formatted as Inline XBRL and contained in Exhibit 101.INS) |
______________________
* Filed herewith.
** Furnished herewith.
+ Management contract, compensatory plan or arrangement.
Signatures
Pursuant to the requirements of the Securities Exchange Act of 1934, the registrant has duly caused this report to be signed on its behalf by the undersigned thereunto duly authorized.
| | | | | | | | |
| | Radian Group Inc. |
| | |
| Date: | November 9, 2020August 6, 2021 | /s/ J. FRANKLIN HALL |
| | J. Franklin Hall |
| | Senior Executive Vice President, Chief Financial Officer |
| | |
| | /s/ ROBERT J. QUIGLEY |
| | Robert J. Quigley |
| | Executive Vice President, Controller and Chief Accounting Officer |