UNITED STATES
SECURITIES AND EXCHANGE COMMISSION
Washington, D.C. 20549
_________________________________________________________
FORM 10-Q
_________________________________________________________
|
| |
| x | QUARTERLY REPORT PURSUANT TO SECTION 13 OR 15(d) OF THE SECURITIES EXCHANGE ACT OF 1934 |
For the quarterly period ended June 30, 20162017
|
| |
| o | TRANSITION REPORT PURSUANT TO SECTION 13 OR 15(d) OF THE SECURITIES EXCHANGE ACT OF 1934 |
For the transition period from to
Commission file number: 1-11718
_________________________________________________________
EQUITY LIFESTYLE PROPERTIES, INC.
(Exact Name of Registrant as Specified in Its Charter)
_________________________________________________________
|
| |
| Maryland | 36-3857664 |
(State or Other Jurisdiction of Incorporation or Organization) | (I.R.S. Employer Identification No.) |
| | |
| Two North Riverside Plaza, Suite 800, Chicago, Illinois | 60606 |
| (Address of Principal Executive Offices) | (Zip Code) |
(312) 279-1400
(Registrant’s Telephone Number, Including Area Code)
_________________________________________________________
Indicate by check mark whether the registrant (1) has filed all reports required to be filed by Section 13 or 15(d) of the Securities Exchange Act of 1934 during the preceding 12 months (or for such shorter period that the registrant was required to file such reports), and (2) has been subject to such filing requirements for the past 90 days. Yes x No o
Indicate by check mark whether the registrant has submitted electronically and posted on its corporate Web site, if any, every Interactive Data File required to be submitted and posted pursuant to Rule 405 of Regulation S-T (§232.405 of this chapter) during the preceding 12 months (or for such shorter period that the registrant was required to submit and post such files). Yes x No o
Indicate by check mark whether the registrant is a large accelerated filer, an accelerated filer, a non-accelerated filer, or a smaller reporting company, or an emerging growth company. See the definitions of “large accelerated filer,” “accelerated filer” andfiler,” “smaller reporting company”company,” and "emerging growth company" in Rule 12b-2 of the Exchange Act. (Check one):
|
| | | |
| Large accelerated filer | x | Accelerated filer | o |
| Non-accelerated filer | o (Do not check if a smaller reporting company) | Smaller reporting company | o |
| | Emerging growth company | o |
If an emerging growth company, indicate by check mark if the registrant has elected not to use the extended transition period for complying with any new or revised financial accounting standards provided pursuant to Section 13(a) of the Exchange Act o
Indicate by check mark whether the registrant is a shell company (as defined in Rule 12b-2 of the Exchange Act). Yes o No x
Indicate the number of shares outstanding of each of the issuer’s classes of common stock, as of the latest practicable date:
85,296,90387,005,128 shares of Common Stock as of July 25, 2016.24, 2017.
Equity LifeStyle Properties, Inc.
Table of Contents
|
| | |
| | | Page |
|
| Item 1. | Financial Statements | |
| Index To Financial Statements | |
Consolidated Balance Sheets as of June 30, 20162017 (unaudited) and December 31, 20152016 | |
Consolidated Statements of Income and Comprehensive Income for the quarters and six months ended June 30, 20162017 and 20152016 (unaudited) | |
Consolidated StatementsStatement of Changes in Equity for the six months ended June 30, 20162017 (unaudited) | |
Consolidated Statements of Cash Flows for the six months ended June 30, 20162017 and 20152016 (unaudited) | |
| |
| Item 2. | | |
| Item 3. | | |
| Item 4. | | |
|
| Item 1. | | |
| Item 1A. | | |
| Item 2. | | |
| Item 3. | | |
| Item 4. | | |
| Item 5. | | |
| Item 6. | | |
Equity LifeStyle Properties, Inc.
Consolidated Balance Sheets
As of June 30, 20162017 and December 31, 20152016
(amounts in thousands, except share and per share data)
| | | | June 30,
2016 | | December 31,
2015 | June 30,
2017 | | December 31,
2016 |
| | (unaudited) | | (unaudited) | |
| Assets | | | | | | |
| Investment in real estate: | | | | | | |
| Land | $ | 1,142,651 |
| | $ | 1,101,676 |
| $ | 1,167,510 |
| | $ | 1,163,987 |
|
| Land improvements | 2,867,006 |
| | 2,787,882 |
| 2,922,201 |
| | 2,893,759 |
|
| Buildings and other depreciable property | 608,204 |
| | 588,041 |
| 641,931 |
| | 627,590 |
|
| | 4,617,861 |
| | 4,477,599 |
| 4,731,642 |
| | 4,685,336 |
|
| Accumulated depreciation | (1,339,298 | ) | | (1,282,423 | ) | (1,459,931 | ) | | (1,399,531 | ) |
| Net investment in real estate | 3,278,563 |
| | 3,195,176 |
| 3,271,711 |
| | 3,285,805 |
|
| Cash | 74,871 |
| | 80,258 |
| 67,740 |
| | 56,340 |
|
| Notes receivable, net | 33,837 |
| | 35,463 |
| 48,253 |
| | 34,520 |
|
| Investment in unconsolidated joint ventures | 23,223 |
| | 17,741 |
| 21,766 |
| | 19,369 |
|
| Deferred commission expense | 31,084 |
| | 30,865 |
| 31,453 |
| | 31,375 |
|
| Escrow deposits, goodwill, and other assets, net | 43,997 |
| | 40,897 |
| 44,435 |
| | 51,578 |
|
| Total Assets | $ | 3,485,575 |
| | $ | 3,400,400 |
| $ | 3,485,358 |
| | $ | 3,478,987 |
|
| Liabilities and Equity | | | | | | |
| Liabilities: | | | | | | |
| Mortgage notes payable | $ | 1,915,834 |
| | $ | 1,926,880 |
| |
| Mortgage notes payable, net | | $ | 1,855,028 |
| | $ | 1,891,900 |
|
| Term loan | 199,276 |
| | 199,172 |
| 199,483 |
| | 199,379 |
|
| Unsecured lines of credit | — |
| | — |
| — |
| | — |
|
| Accrued expenses and accounts payable | 79,418 |
| | 76,044 |
| 93,451 |
| | 89,864 |
|
| Deferred revenue – upfront payments from right-to-use contracts | 79,505 |
| | 78,405 |
| 83,580 |
| | 81,484 |
|
| Deferred revenue – right-to-use annual payments | 13,017 |
| | 9,878 |
| 12,559 |
| | 9,817 |
|
| Accrued interest payable | 8,488 |
| | 8,715 |
| 8,044 |
| | 8,379 |
|
| Rents and other customer payments received in advance and security deposits | 84,821 |
| | 74,300 |
| 88,543 |
| | 76,906 |
|
| Distributions payable | 39,300 |
| | 34,315 |
| 45,259 |
| | 39,411 |
|
| Total Liabilities | 2,419,659 |
| | 2,407,709 |
| 2,385,947 |
| | 2,397,140 |
|
| Equity: | | | | | | |
| Stockholders’ Equity: | | | | | | |
| Preferred stock, $0.01 par value, 9,945,539 shares authorized as of June 30, 2016 and December 31, 2015; none issued and outstanding. | — |
| | — |
| |
| 6.75% Series C Cumulative Redeemable Perpetual Preferred Stock, $0.01 par value, 54,461 shares authorized and 54,458 issued and outstanding as of June 30, 2016 and December 31, 2015 at liquidation value | 136,144 |
| | 136,144 |
| |
| Common stock, $0.01 par value, 200,000,000 shares authorized as of June 30, 2016 and December 31, 2015; 85,295,182 and 84,253,065 shares issued and outstanding as of June 30, 2016 and December 31, 2015, respectively | 852 |
| | 843 |
| |
| Preferred stock, $0.01 par value, 9,945,539 shares authorized as of June 30, 2017 and December 31, 2016; none issued and outstanding. | | — |
| | — |
|
| 6.75% Series C Cumulative Redeemable Perpetual Preferred Stock, $0.01 par value, 54,461 shares authorized and 54,458 issued and outstanding as of June 30, 2017 and December 31, 2016 at liquidation value | | 136,144 |
| | 136,144 |
|
| Common stock, $0.01 par value, 200,000,000 shares authorized as of June 30, 2017 and December 31, 2016; 87,004,507 and 85,529,386 shares issued and outstanding as of June 30, 2017 and December 31, 2016, respectively | | 868 |
| | 854 |
|
| Paid-in capital | 1,094,152 |
| | 1,039,140 |
| 1,121,307 |
| | 1,103,048 |
|
| Distributions in excess of accumulated earnings | (236,623 | ) | | (250,506 | ) | (219,641 | ) | | (231,276 | ) |
| Accumulated other comprehensive loss | (1,197 | ) | | (553 | ) | |
| Accumulated other comprehensive loss/(income) | | 30 |
| | (227 | ) |
| Total Stockholders’ Equity | 993,328 |
| | 925,068 |
| 1,038,708 |
| | 1,008,543 |
|
| Non-controlling interests – Common OP Units | 72,588 |
| | 67,623 |
| 60,703 |
| | 73,304 |
|
| Total Equity | 1,065,916 |
| | 992,691 |
| 1,099,411 |
| | 1,081,847 |
|
| Total Liabilities and Equity | $ | 3,485,575 |
| | $ | 3,400,400 |
| $ | 3,485,358 |
| | $ | 3,478,987 |
|
The accompanying notes are an integral part of the financial statements.these Consolidated Financial Statements.
Equity LifeStyle Properties, Inc.
Consolidated Statements of Income and Comprehensive Income
For the Quarters Ended and Six Months EndedJune 30, 20162017 and 20152016
(amounts in thousands, except per share data)
| | | | Quarters Ended | | Six Months Ended | Quarters Ended | | Six Months Ended |
| | June 30,
2016 | | June 30,
2015 | | June 30,
2016 | | June 30,
2015 | June 30,
2017 | | June 30,
2016 | | June 30,
2017 | | June 30,
2016 |
| Revenues: | | | | | | | | | | | | | | |
| Community base rental income | $ | 115,385 |
| | $ | 110,073 |
| | $ | 229,461 |
| | $ | 219,343 |
| $ | 121,964 |
| | $ | 115,385 |
| | $ | 242,656 |
| | $ | 229,461 |
|
| Rental home income | 3,543 |
| | 3,559 |
| | 7,088 |
| | 7,113 |
| 3,632 |
| | 3,543 |
| | 7,237 |
| | 7,088 |
|
| Resort base rental income | 44,732 |
| | 41,427 |
| | 100,166 |
| | 93,072 |
| 50,055 |
| | 44,732 |
| | 111,123 |
| | 100,166 |
|
| Right-to-use annual payments | 11,187 |
| | 10,945 |
| | 22,241 |
| | 21,926 |
| 11,350 |
| | 11,187 |
| | 22,602 |
| | 22,241 |
|
| Right-to-use contracts current period, gross | 3,086 |
| | 3,578 |
| | 5,618 |
| | 6,375 |
| 3,798 |
| | 3,086 |
| | 7,004 |
| | 5,618 |
|
| Right-to-use contract upfront payments, deferred, net | (798 | ) | | (1,455 | ) | | (1,100 | ) | | (2,228 | ) | (1,321 | ) | | (798 | ) | | (2,096 | ) | | (1,100 | ) |
| Utility and other income | 19,523 |
| | 18,901 |
| | 40,316 |
| | 37,983 |
| 20,650 |
| | 19,523 |
| | 42,776 |
| | 40,316 |
|
| Gross revenues from home sales | 9,130 |
| | 9,526 |
| | 17,344 |
| | 16,463 |
| 7,833 |
| | 9,130 |
| | 14,860 |
| | 17,344 |
|
| Brokered resale revenues and ancillary services revenues, net | 398 |
| | 1,012 |
| | 1,816 |
| | 2,994 |
| 444 |
| | 398 |
| | 2,105 |
| | 1,816 |
|
| Interest income | 1,625 |
| | 1,736 |
| | 3,285 |
| | 3,556 |
| 1,798 |
| | 1,625 |
| | 3,568 |
| | 3,285 |
|
| Income from other investments, net | 2,270 |
| | 2,178 |
| | 3,993 |
| | 3,297 |
| 1,109 |
| | 2,270 |
| | 1,866 |
| | 3,993 |
|
| Total revenues | 210,081 |
| | 201,480 |
| | 430,228 |
| | 409,894 |
| 221,312 |
| | 210,081 |
|
| 453,701 |
|
| 430,228 |
|
| Expenses: | | | | | | | | | | | | | | |
| Property operating and maintenance | 66,647 |
| | 64,178 |
| | 129,601 |
| | 125,295 |
| 72,901 |
| | 66,647 |
| | 140,955 |
| | 129,601 |
|
| Rental home operating and maintenance | 1,581 |
| | 1,689 |
| | 3,106 |
| | 3,358 |
| 1,657 |
| | 1,581 |
| | 3,208 |
| | 3,106 |
|
| Real estate taxes | 12,869 |
| | 12,652 |
| | 26,067 |
| | 25,246 |
| 13,943 |
| | 12,869 |
| | 27,980 |
| | 26,067 |
|
| Sales and marketing, gross | 2,931 |
| | 3,512 |
| | 5,424 |
| | 6,034 |
| 2,894 |
| | 2,931 |
| | 5,584 |
| | 5,424 |
|
| Right-to-use contract commissions, deferred, net | (116 | ) | | (764 | ) | | (12 | ) | | (1,007 | ) | (112 | ) | | (116 | ) | | (196 | ) | | (12 | ) |
| Property management | 12,044 |
| | 11,099 |
| | 23,807 |
| | 22,389 |
| 13,023 |
| | 12,044 |
| | 25,583 |
| | 23,807 |
|
| Depreciation on real estate assets and rental homes | 29,029 |
| | 28,335 |
| | 57,684 |
| | 56,451 |
| 30,247 |
| | 29,029 |
| | 60,357 |
| | 57,684 |
|
| Amortization of in-place leases | 428 |
| | 669 |
| | 763 |
| | 1,334 |
| 958 |
| | 428 |
| | 1,990 |
| | 763 |
|
| Cost of home sales | 9,481 |
| | 9,093 |
| | 17,762 |
| | 15,817 |
| 7,895 |
| | 9,481 |
| | 15,014 |
| | 17,762 |
|
| Home selling expenses | 805 |
| | 720 |
| | 1,639 |
| | 1,525 |
| 929 |
| | 805 |
| | 1,854 |
| | 1,639 |
|
| General and administrative | 8,255 |
| | 7,541 |
| | 15,663 |
| | 14,947 |
| 8,461 |
| | 8,255 |
| | 15,834 |
| | 15,663 |
|
| Property rights initiatives and other | 527 |
| | 694 |
| | 1,181 |
| | 1,247 |
| |
| Early debt retirement | — |
| | (69 | ) | | — |
| | 16,922 |
| |
| Property rights initiatives and other, net | | 271 |
| | 527 |
| | 490 |
| | 1,181 |
|
| Interest and related amortization | 25,561 |
| | 26,145 |
| | 51,195 |
| | 53,421 |
| 24,822 |
| | 25,561 |
| | 49,701 |
| | 51,195 |
|
| Total expenses | 170,042 |
| | 165,494 |
| | 333,880 |
| | 342,979 |
| 177,889 |
| | 170,042 |
|
| 348,354 |
|
| 333,880 |
|
| Income before equity in income of unconsolidated joint ventures | 40,039 |
| | 35,986 |
| | 96,348 |
| | 66,915 |
| 43,423 |
| | 40,039 |
|
| 105,347 |
|
| 96,348 |
|
| Equity in income of unconsolidated joint ventures | 765 |
| | 840 |
| | 1,646 |
| | 1,724 |
| 1,040 |
| | 765 |
| | 2,190 |
| | 1,646 |
|
| Consolidated net income | 40,804 |
| | 36,826 |
| | 97,994 |
| | 68,639 |
| 44,463 |
| | 40,804 |
|
| 107,537 |
|
| 97,994 |
|
| | | | | | | | | | | | | | | |
| Income allocated to non-controlling interests – Common OP Units | (2,998 | ) | | (2,724 | ) | | (7,308 | ) | | (5,054 | ) | (2,649 | ) | | (2,998 | ) | | (6,539 | ) | | (7,308 | ) |
| Series C Redeemable Perpetual Preferred Stock Dividends | (2,316 | ) | | (2,316 | ) | | (4,613 | ) | | (4,613 | ) | (2,316 | ) | | (2,316 | ) | | (4,613 | ) | | (4,613 | ) |
| Net income available for Common Stockholders | $ | 35,490 |
| | $ | 31,786 |
| | $ | 86,073 |
| | $ | 58,972 |
| $ | 39,498 |
| | $ | 35,490 |
|
| $ | 96,385 |
|
| $ | 86,073 |
|
| | | | | | | | | | | | | | | |
| Consolidated net income | $ | 40,804 |
| | $ | 36,826 |
| | $ | 97,994 |
| | $ | 68,639 |
| $ | 44,463 |
| | $ | 40,804 |
| | $ | 107,537 |
| | $ | 97,994 |
|
| Other comprehensive (loss) income (“OCI”): | | | | | | | | |
| Other comprehensive income (loss) (“OCI”): | | | | | | | | |
| Adjustment for fair market value of swap | (36 | ) | | 204 |
| | (644 | ) | | (653 | ) | 30 |
| | (36 | ) | | 257 |
| | (644 | ) |
| Consolidated comprehensive income | 40,768 |
| | 37,030 |
| | 97,350 |
| | 67,986 |
| 44,493 |
| | 40,768 |
|
| 107,794 |
|
| 97,350 |
|
| Comprehensive income allocated to non-controlling interests – Common OP Units | (2,995 | ) | | (2,740 | ) | | (7,257 | ) | | (5,003 | ) | (2,651 | ) | | (2,995 | ) | | (6,555 | ) | | (7,257 | ) |
| Series C Redeemable Perpetual Preferred Stock Dividends | (2,316 | ) | | (2,316 | ) | | (4,613 | ) | | (4,613 | ) | (2,316 | ) | | (2,316 | ) | | (4,613 | ) | | (4,613 | ) |
| Comprehensive income attributable to Common Stockholders | $ | 35,457 |
| | $ | 31,974 |
| | $ | 85,480 |
| | $ | 58,370 |
| $ | 39,526 |
| | $ | 35,457 |
|
| $ | 96,626 |
|
| $ | 85,480 |
|
The accompanying notes are an integral part of the financial statements.these Consolidated Financial Statements.
Equity LifeStyle Properties, Inc.
Consolidated Statements of Income and Comprehensive Income (Continued)
For the Quarters Ended and Six Months Ended June 30, 20162017 and 20152016
(amounts in thousands, except per share data)
(unaudited)
| | | | Quarters Ended | | Six Months Ended | Quarters Ended | | Six Months Ended |
| | June 30,
2016 | | June 30,
2015 | | June 30,
2016 | | June 30,
2015 | June 30,
2017 | | June 30,
2016 | | June 30,
2017 | | June 30,
2016 |
| Earnings per Common Share – Basic: | | | | | | | | | | | | | | |
| Net income available for Common Stockholders | $ | 0.42 |
| | $ | 0.38 |
| | $ | 1.02 |
| | $ | 0.70 |
| $ | 0.46 |
| | $ | 0.42 |
| | $ | 1.12 |
| | $ | 1.02 |
|
| Earnings per Common Share – Fully Diluted: | | | | | | | | | | | | | | |
| Net income available for Common Stockholders | $ | 0.42 |
| | $ | 0.38 |
| | $ | 1.01 |
| | $ | 0.70 |
| $ | 0.45 |
| | $ | 0.42 |
| | $ | 1.11 |
| | $ | 1.01 |
|
| | | | | | | | | | | | | | | |
| Distributions declared per Common Share outstanding | $ | 0.425 |
| | $ | 0.375 |
| | $ | 0.850 |
| | $ | 0.750 |
| $ | 0.488 |
| | $ | 0.425 |
| | $ | 0.975 |
| | $ | 0.850 |
|
| Weighted average Common Shares outstanding – basic | 84,516 |
| | 84,031 |
| | 84,419 |
| | 83,996 |
| 86,763 |
| | 84,516 |
| | 86,408 |
| | 84,419 |
|
| Weighted average Common Shares outstanding – fully diluted | 92,264 |
| | 91,851 |
| | 92,163 |
| | 91,829 |
| 93,063 |
| | 92,264 |
| | 93,041 |
| | 92,163 |
|
The accompanying notes are an integral part of the financial statements.these Consolidated Financial Statements.
Equity LifeStyle Properties, Inc.
Consolidated StatementsStatement of Changes in Equity
For the Six Months EndedJune 30, 20162017
(amounts in thousands)
(unaudited)
| | | | Common Stock | | Paid-in Capital | | 6.75% Series C Cumulative Redeemable Perpetual Preferred Stock | | Distributions in Excess of Accumulated Earnings | | Non- controlling interests – Common OP Units | | Accumulated Other Comprehensive Loss | | Total Equity | Common Stock | | Paid-in Capital | | 6.75% Series C Cumulative Redeemable Perpetual Preferred Stock | | Distributions in Excess of Accumulated Earnings | | Non- controlling interests – Common OP Units | | Accumulated Other Comprehensive Loss/(Income) | | Total Equity |
| Balance, December 31, 2015 | $ | 843 |
| | $ | 1,039,140 |
| | $ | 136,144 |
| | $ | (250,506 | ) | | $ | 67,623 |
| | $ | (553 | ) | | $ | 992,691 |
| |
| Balance, December 31, 2016 | | $ | 854 |
| | $ | 1,103,048 |
| | $ | 136,144 |
| | $ | (231,276 | ) | | $ | 73,304 |
| | $ | (227 | ) | | $ | 1,081,847 |
|
| Conversion of Common OP Units to Common Stock | — |
| | 38 |
| | — |
| | — |
| | (38 | ) | | — |
| | — |
| 14 |
| | 16,423 |
| | — |
| | — |
| | (16,437 | ) | | — |
| | — |
|
| Issuance of Common Stock through exercise of options | 2 |
| | 5,230 |
| | — |
| | — |
| | — |
| | — |
| | 5,232 |
| |
| Issuance of Common Stock through employee stock purchase plan | — |
| | 275 |
| | — |
| | — |
| | — |
| | — |
| | 275 |
| — |
| | 764 |
| | — |
| | — |
| | — |
| | — |
| | 764 |
|
| Issuance of Common Stock | 7 |
| | 49,993 |
| | — |
| | — |
| | — |
| | — |
| | 50,000 |
| |
| Compensation expenses related to restricted stock | — |
| | 4,393 |
| | — |
| | — |
| | — |
| | — |
| | 4,393 |
| — |
| | 4,257 |
| | — |
| | — |
| | — |
| | — |
| | 4,257 |
|
| Repurchase of Common Stock or Common OP units | — |
| | (274 | ) | | — |
| | — |
| | — |
| | — |
| | (274 | ) | |
| Adjustment for Common OP Unitholders in the Operating Partnership | — |
| | (3,820 | ) | | — |
| | — |
| | 3,820 |
| | — |
| | — |
| — |
| | (3,037 | ) | | — |
| | — |
| | 3,037 |
| | — |
| | — |
|
| Adjustment for fair market value of swap | — |
| | — |
| | — |
| | — |
| | — |
| | (644 | ) | | (644 | ) | — |
| | — |
| | — |
| | — |
| | — |
| | 257 |
| | 257 |
|
| Net income | — |
| | — |
| | 4,614 |
| | 86,073 |
| | 7,308 |
| | — |
| | 97,995 |
| — |
| | — |
| | 4,613 |
| | 96,385 |
| | 6,539 |
| | — |
| | 107,537 |
|
| Distributions | — |
| | — |
| | (4,614 | ) | | (72,190 | ) | | (6,125 | ) | | — |
| | (82,929 | ) | — |
| | — |
| | (4,613 | ) | | (84,750 | ) | | (5,740 | ) | | — |
| | (95,103 | ) |
| Other | — |
| | (823 | ) | | — |
| | — |
| | — |
| | — |
| | (823 | ) | — |
| | (148 | ) | | — |
| | — |
| | — |
| | — |
| | (148 | ) |
| Balance, June 30, 2016 | $ | 852 |
| | $ | 1,094,152 |
| | $ | 136,144 |
| | $ | (236,623 | ) | | $ | 72,588 |
| | $ | (1,197 | ) | | $ | 1,065,916 |
| |
| Balance, June 30, 2017 | | $ | 868 |
| | $ | 1,121,307 |
| | $ | 136,144 |
| | $ | (219,641 | ) | | $ | 60,703 |
| | $ | 30 |
| | $ | 1,099,411 |
|
The accompanying notes are an integral part of the financial statements.these Consolidated Financial Statements.
Equity LifeStyle Properties, Inc.
Consolidated Statements of Cash Flows
For the Six Months Ended June 30, 20162017 and 20152016
(amounts in thousands)
(unaudited)
| | | | June 30,
2016 | | June 30,
2015 | June 30,
2017 | | June 30,
2016 |
| Cash Flows From Operating Activities: | | | | | | |
| Consolidated net income | $ | 97,994 |
| | $ | 68,639 |
| $ | 107,537 |
| | $ | 97,994 |
|
| Adjustments to reconcile consolidated net income to net cash provided by operating activities: | | | | | | |
| Early debt retirement | — |
| | 16,922 |
| |
| Depreciation | 58,242 |
| | 56,989 |
| 60,960 |
| | 58,242 |
|
| Amortization of in-place leases | 763 |
| | 1,334 |
| 1,990 |
| | 763 |
|
| Amortization of loan costs | 1,876 |
| | 2,103 |
| 1,788 |
| | 1,876 |
|
| Debt premium amortization | (1,730 | ) | | (2,094 | ) | (1,166 | ) | | (1,730 | ) |
| Equity in income of unconsolidated joint ventures | (1,646 | ) | | (1,724 | ) | (2,190 | ) | | (1,646 | ) |
| Distributions of income from unconsolidated joint ventures | 1,041 |
| | 1,161 |
| 1,800 |
| | 1,041 |
|
| Amortization of stock-related compensation | 4,393 |
| | 3,960 |
| |
| Stock-based compensation | | 4,257 |
| | 4,393 |
|
| Revenue recognized from right-to-use contract upfront payments | (4,518 | ) | | (4,147 | ) | (4,908 | ) | | (4,518 | ) |
| Commission expense recognized related to right-to-use contracts | 2,019 |
| | 1,696 |
| 2,202 |
| | 2,019 |
|
| Long term incentive plan compensation | (3,852 | ) | | 657 |
| 674 |
| | (3,852 | ) |
| Recovery of uncollectible rents receivable | (679 | ) | | (344 | ) | |
| Recovery for uncollectible rents receivable | | 214 |
| | (679 | ) |
| Changes in assets and liabilities: | | | | | | |
| Notes receivable activity, net | 361 |
| | (101 | ) | (282 | ) | | 361 |
|
| Deferred commission expense | (2,238 | ) | | (3,067 | ) | (2,280 | ) | | (2,238 | ) |
| Escrow deposits, goodwill and other assets | 13,137 |
| | 27,540 |
| 21,814 |
| | 13,137 |
|
| Accrued expenses and accounts payable | 2,453 |
| | 18,475 |
| 316 |
| | 2,453 |
|
| Deferred revenue – upfront payments from right-to-use contracts | 5,618 |
| | 6,375 |
| 7,004 |
| | 5,618 |
|
| Deferred revenue – right-to-use annual payments | 3,139 |
| | 3,492 |
| 2,742 |
| | 3,139 |
|
| Rents received in advance and security deposits | 10,434 |
| | 12,080 |
| 11,630 |
| | 10,434 |
|
| Net cash provided by operating activities | 186,807 |
| | 209,946 |
| 214,102 |
| | 186,807 |
|
| Cash Flows From Investing Activities: | | | | | | |
| Real estate acquisition | (76,203 | ) | | (23,687 | ) | (2,053 | ) | | (76,203 | ) |
| Investment in unconsolidated joint ventures | (5,000 | ) | | (4,000 | ) | (2,267 | ) | | (5,000 | ) |
| Repayments of notes receivable | 5,176 |
| | 5,366 |
| 5,054 |
| | 5,176 |
|
| Issuance of notes receivable | (4,356 | ) | | (4,035 | ) | (18,696 | ) | | (4,356 | ) |
| Capital improvements | (55,707 | ) | | (42,259 | ) | (53,464 | ) | | (55,707 | ) |
| Net cash used in investing activities | (136,090 | ) | | (68,615 | ) | (71,426 | ) | | (136,090 | ) |
| Cash Flows From Financing Activities: | | | | | | |
| Proceeds from stock options and employee stock purchase plan | 5,233 |
| | 4,252 |
| 764 |
| | 5,331 |
|
| Share based award tax withholding | | — |
| | (98 | ) |
| Gross proceeds from sale of Common Stock | 50,000 |
| | — |
| — |
| | 50,000 |
|
| Distributions: | | | | | | |
| Common Stockholders | (67,565 | ) | | (58,862 | ) | (78,699 | ) | | (67,565 | ) |
| Common OP Unitholders | (5,766 | ) | | (5,057 | ) | (5,942 | ) | | (5,766 | ) |
| Preferred Stockholders | (4,613 | ) | | (4,613 | ) | (4,613 | ) | | (4,613 | ) |
| Principal payments and mortgage debt payoff | (32,564 | ) | | (437,279 | ) | (42,637 | ) | | (32,564 | ) |
| New mortgage notes payable financing proceeds | — |
| | 395,323 |
| |
| Debt issuance and defeasance costs | (5 | ) | | (23,541 | ) | — |
| | (5 | ) |
| Other | (824 | ) | | (323 | ) | (149 | ) | | (824 | ) |
| Net cash used in financing activities | (56,104 | ) | | (130,100 | ) | (131,276 | ) | | (56,104 | ) |
| Net (decrease) increase in cash and cash equivalents | (5,387 | ) | | 11,231 |
| |
| Net increase (decrease) in cash | | 11,400 |
| | (5,387 | ) |
| Cash, beginning of period | 80,258 |
| | 73,714 |
| 56,340 |
| | 80,258 |
|
| Cash, end of period | $ | 74,871 |
| | $ | 84,945 |
| $ | 67,740 |
| | $ | 74,871 |
|
The accompanying notes are an integral part of the financial statements.these Consolidated Financial Statements.
Equity LifeStyle Properties, Inc.
Consolidated Statements of Cash Flows (continued)
For the Six Months Ended June 30, 20162017 and 20152016
(amounts in thousands)
(unaudited)
| | | | June 30,
2016 | | June 30,
2015 | June 30,
2017 | | June 30,
2016 |
| Supplemental Information: | | | | | | |
| Cash paid during the period for interest | $ | 53,121 |
| | $ | 54,330 |
| $ | 51,135 |
| | $ | 53,121 |
|
| Capital improvements – used homes acquired by repossessions | $ | 445 |
| | $ | 443 |
| 192 |
| | 445 |
|
| Net repayments of notes receivable – used homes acquired by repossessions | $ | (445 | ) | | $ | (443 | ) | (192 | ) | | (445 | ) |
| Building and other depreciable property – reclassification of rental homes | $ | 15,986 |
| | $ | 14,046 |
| 15,322 |
| | 15,986 |
|
| Escrow deposits and other assets – reclassification of rental homes | $ | (15,986 | ) | | $ | (14,046 | ) | (15,322 | ) | | (15,986 | ) |
| | | | | | | |
| Real estate acquisitions: | | | | | | |
| Investment in real estate | $ | (100,148 | ) | | $ | (23,900 | ) | |
| Investment in real estate, fair value | | $ | (7,985 | ) | | $ | (100,148 | ) |
| Escrow deposits and other assets | (20 | ) | | (53 | ) | — |
| | (20 | ) |
| Debt assumed and financed on acquisition | 22,010 |
| | — |
| |
| Debt assumed | | 5,900 |
| | 22,010 |
|
| Accrued expenses and accounts payable | 1,955 |
| | 62 |
| 32 |
| | 1,955 |
|
| Rents and other customer payments received in advance and security deposits | — |
| | 204 |
| |
| Real estate acquisitions, net | $ | (76,203 | ) | | $ | (23,687 | ) | $ | (2,053 | ) | | $ | (76,203 | ) |
The accompanying notes are an integral part of the financial statements.these Consolidated Financial Statements.
Equity LifeStyle Properties, Inc.
Notes to Consolidated Financial Statements
Definition
Note 1 – Basis of TermsPresentation
Equity LifeStyle Properties, Inc., a Maryland corporation, together with MHC Operating Limited Partnership (the “Operating Partnership”) and other consolidated subsidiaries (“Subsidiaries”) are referred to herein as “we,” “us,” and “our.” Capitalized terms used but not defined herein are as defined in our Annual Report on Form 10-K (“20152016 Form 10-K”) for the year ended December 31, 2015.2016. These unaudited Consolidated Financial Statements have been prepared pursuant to Securities and Exchange Commission (“SEC”) rules and regulations. Accordingly, they do not include all of the information and note disclosures required by U.S. Generally Accepted Accounting Principles ("GAAP") for complete financial statements and should be read in conjunction with the financial statements and notes thereto included in the 2016 Form 10-K.
The following notes to the Consolidated Financial Statements highlight significant changes to the notes included in the 2016 Form 10-K and present interim disclosures as required by the SEC. The accompanying Consolidated Financial Statements reflect, in the opinion of management, all adjustments and estimates necessary for a fair presentation of the interim financial statements, which are of a normal, recurring nature. Revenues and expenses are subject to seasonal fluctuations and accordingly, quarterly interim results may not be indicative of full year results. Note 12 – Summary of Significant Accounting Policies
| |
| (a) | Basis of Presentation and Principles of Consolidation |
We follow accounting standards set by the Financial Accounting Standards Board, commonly referred to as the “FASB.” The FASB sets generally accepted accounting principles (“GAAP”),consolidate our majority-owned Subsidiaries in which we followhave the ability to ensure that we consistently report our financial condition, results ofcontrol the operations and cash flows. Referencesall variable interest entities with respect to GAAP issued bywhich we are the FASBprimary beneficiary. We also consolidate entities in these footnotes are to the FASB Accounting Standards Codification (the “Codification”).
These unaudited Consolidated Financial Statementswhich we have been prepared pursuant to Securities and Exchange Commission (“SEC”) rules and regulations. Accordingly, they do not include all of the information and footnotes required by GAAP for complete financial statements and should be read in conjunction with the financial statements and notes thereto included in the 2015 Form 10-K. The following notes to the Consolidated Financial Statements highlight significant changes to the notes included in the 2015 Form 10-K and present interim disclosures as required by the SEC. The accompanying Consolidated Financial Statements reflect, in the opinion of management, all adjustments and estimates necessary for a fair presentation of the interim financial statements, which are of a normal, recurring nature. Revenues are subject to seasonal fluctuations and accordingly, quarterly interim results may not be indicative of full year results.
The accompanying Consolidated Financial Statements include the consolidation of our accounts. We do not havedirect or indirect controlling interests in any of our joint ventures (“JV”), which are therefore treated under the equity method of accounting and not consolidated in our financial statements. The holders of limited partnership interests in the Operating Partnership (“Common OP Unitholders”) receive an allocation of net income that is based on their respective ownership percentage of the Operating Partnership which is shown in our Consolidated Financial Statements as Non-controlling interests-Common OP Units.or voting interest. All significant intercompany balances and transactions have been eliminated in consolidation.
Effective January 1, 2016, we adopted (“ASU 2015-02”) Consolidation (Topic 810): Amendments to the Consolidation Analysis. ASU 2015-02 required us to evaluate whether we should consolidate certain legal entities. Principally,The adoption of this standard did not result in any changes to our accounting of interests in less than wholly-owned joint ventures; however, the new consolidation standard modifiedOperating Partnership now meets the evaluation of whether limited partnerships and similar legal entities are variable interest entities ("VIE") or voting interest entities. Based on our review and subsequent analysis of the structure of our legal entities, wecriteria as a VIE. We concluded that the Operating Partnership is a VIE because the limited partners of the Operating Partnership do not have substantive kick-out or participating rights. Wewe are the general partner and controlling owner of approximately 92.2%93.7% of the Operating Partnership and the limited partners do not have substantive kick-out or participating rights. Our sole significant asset is our investment in the Operating Partnership, and consequently, substantially all of our assets and liabilities represent those assets and liabilities of the Operating Partnership. The Company has the power to direct the VIE's activities and the obligation to absorb its losses or the right to receive its benefits, which are significant to the VIE. Accordingly, we are the primary beneficiary and we will continue to consolidate the Operating Partnership under this new guidance. With
We apply the equity method of accounting to entities in which we do not have a direct or indirect controlling interest or for variable interest entities where we are not considered the primary beneficiary, but can exercise influence over the entity with respect to our investment in unconsolidated joint ventures, the new consolidation standard did not have an impact on our previous consolidation conclusions.
Effective January 1, 2016, we adopted (“ASU 2015-03”) Interest - Imputation of Interest (Subtopic 835-30): Simplifying the Presentation of Debt Issuance Costsits operations and (“ASU 2015-15”) Presentation and Subsequent Measurement of Debt Issuance Costs Associated with Line-of-Credit Arrangements. ASU 2015-03 requires that debt issuance costs be deducted from the carrying value of the financial liability and not recorded as separate assets, previously classified as deferred financing costs. The recognition and measurement guidance for debt issuance costs are not affected by ASU 2015-03. ASU 2015-15 states that presentation of costs associated with securing a revolving line of credit as an asset is permitted, regardless of whether a balance is outstanding. ASU 2015-03 and 2015-15 require retrospective adoption and as a result we reclassified deferred financing costs on our Consolidated Balance Sheets as of December 31, 2015, as presented herein (See Note 7 to the Consolidated Financial Statements for further details).major decisions.
| |
| (b) | Identified Intangibles and Goodwill |
As of both June 30, 20162017 and December 31, 2015,2016, the gross carrying amount of identified intangible assets and goodwill, a component of escrow deposits, goodwill and other assets, net on our consolidated balance sheets, was approximately $12.1 million. As of both June 30, 20162017 and December 31, 2015,2016, this amount was comprised of approximately $4.3 million of identified intangible assets and approximately $7.8 million of goodwill. Accumulated amortization of identified intangible assets was approximately $2.7$2.9 million and $2.6$2.8 million as of June 30, 20162017 and December 31, 2015,2016, respectively. For the quarters and six months ended
As of both June 30, 2017 and December 31, 2016, the gross carrying amount of in-place lease intangible assets, a component of buildings and 2015,other depreciable property on our consolidated balance sheets, was approximately $76.7 million. Accumulated amortization expense for the identifiedof in-place lease intangible assets was approximately $0.1 million.$75.9 million and $74.0 million as of June 30, 2017 and December 31, 2016, respectively.
Cash as of both June 30, 2017 and December 31, 2016 included approximately $5.3 million of restricted cash for the payment of capital improvements, insurance or real estate taxes.
Equity LifeStyle Properties, Inc.
Notes to Consolidated Financial Statements
Note 12 – Summary of Significant Accounting Policies (continued)
Our cash balance as of June 30, 2016 and December 31, 2015 included approximately $5.3 million and $5.0 million respectively, of restricted cash for the payment of capital improvements, insurance or real estate taxes.
| |
| (d) | Fair Value of Financial Instruments |
Our financial instruments include notes receivable, accounts receivable, accounts payable, other accrued expenses, interest rate swaps and mortgage notes payable. We disclose the estimated fair value of our financial instruments according to a fair value hierarchy (Level 1, 2 and 3).
Our mortgage notes payable and term loan, excluding deferred financing costs of approximately $18.9$17.8 million and $19.7$18.9 million, respectively, had aan aggregate carrying value of approximately $2.1 billion$2,072.3 million and $2,110.2 million as of June 30, 20162017 and December 31, 2015,2016, respectively, and a fair value of approximately $2.2 billion$2,106.4 million and $2,081.2 million as of June 30, 20162017 and December 31, 2015,2016, respectively. The fair value iswas measured using quoted prices and observable inputs from similar liabilities (Level 2). At June 30, 20162017 and December 31, 2015,2016, our cash flow hedge of interest rate risk included in accrued expenses and accounts payable was measured using quoted prices and observable inputs from similar assets and liabilities (Level 2). We consider our own credit risk as well as the credit risk of our counterparties when evaluating the fair value of our derivative. The fair values of our notes receivable approximate their carrying or contract values. We also utilize Level 2 and Level 3 inputs as part of our determination of the purchase price allocation for our acquisitions, as discussed in Note 4 to the Consolidated Financial Statements.acquisitions.
| |
| (e) | Deferred Financing Costs, net |
Deferred financing costs includes fees and costs incurred to obtain long-term financing and are amortized over the terms of the respective loans on a basis that approximates level yield. Unamortized deferred financing fees are written-off when debt is retired before the maturity date. Upon amendment of the line of credit or refinancing of mortgage debt, unamortized deferred financing fees are accounted for in accordance with Codification Sub-Topic Modifications and Extinguishments (“FASB ASC 470-50-40”). Accumulated amortization for such costs was $35.6 million and $33.7 million at June 30, 2016 and December 31, 2015, respectively.
| |
(f) | RecentNew Accounting Pronouncements |
In January 2017, the FASB issued ("ASU 2017-01") Business Combinations (Topic 805): Clarifying the Definition of a Business. ASU 2017-01 clarifies the definition of a business with the objective of adding guidance to assist entities with evaluating whether transactions should be accounted for as acquisitions (or disposals) of assets or businesses. ASU 2017-01 will be effective for annual reporting beginning after December 15, 2017. We are currently in the process of evaluating the potential impact that the adoption of this standard may have on our consolidated financial statements and related disclosures.
In August 2016, the FASB issued (“ASU 2016-15”) Statement of Cash Flows (Topic 230). ASU 2016-15 provides guidance on how certain cash receipts and cash payments are to be presented and classified in the statement of cash flows. ASU 2016-15 will be effective for annual reporting periods beginning after December 15, 2017. Early adoption is permitted. We are currently in the process of evaluating the potential impact, if any, that adoption of this standard may have on our consolidated financial statements and related disclosures.
In June 2016, the FASB issued (“ASU 2016-13”) Financial Instruments - Credit Losses (Topic 326). ASU 2016-13 requires entities to measure all expected credit losses for financial assets held at the reporting date based on historical experience, current conditions, and reasonable and supportable forecasts. Entities will now use forward-looking information to better form their credit loss estimates. ASU 2016-13 also requires enhanced disclosures to help financial statement users better understand significant estimates and judgments used in estimating credit losses, as well as the credit quality and underwriting standards of an entity’s portfolio. ASU 2016-13 will be effective for annual reporting periods beginning after December 15, 2019. Early adoption is permitted. We are currently in the process of evaluating the potential impact, if any, that adoption of this standard may have on our consolidated financial statements and related disclosures.
In February 2016, the FASB issued ("ASU 2016-02") Leases. ASU 2016-02 amends the existing accounting standards for lease accounting, including requiring lessees to recognize most leases on their balance sheets and making targeted changes to lessor accounting. ASU 2016-02 requires a modified retrospective transition approach for all leases existing at, or entered into after, the date of initial application, with an option to use certain transition relief. ASU 2016-02 will continue to classify leases as either finance or operating, with classification affecting the pattern of expense recognition in the statement of income. ASU 2016-02 will be effective for annual reporting periods beginning after December 15, 2018. Early adoption is permitted. We are currently in the process of evaluating the potential impact this standard may have on our consolidated financial statements and related disclosures.
In May 2014, the FASB issued ("ASU 2014-09") Revenue from Contracts with Customers which along with related subsequent amendments will replace most existing revenue recognition guidance in U.S. GAAP. The core principle of ASU 2014-09 is that an entity should recognize revenue for the transfer of goods or services equal to the amount that it expects to be entitled to receive for those goods or services. ASU 2014-09 requires additional disclosure about the nature, amount, timing and uncertainty of revenue and cash flows arising from customer contracts, including significant judgments and changes in judgments. ASU 2014-09 does not apply to lease contracts accountedThe new standard will be effective for under ASC 840, Leases. Entities canthe Company beginning on January 1, 2018. The standard permits the use of either the full retrospective or modified retrospective transition to the standard either retrospectively or as a cumulative-effect adjustment as of the date of adoption. On July 9, 2015, the FASB deferred the effective date by one year for annual reporting periods beginning after December 15, 2017. The FASB will permit early adoption of themethod.
Equity LifeStyle Properties, Inc.
Notes to Consolidated Financial Statements
Note 12 – Summary of Significant Accounting Policies (continued)
standard, but not beforeWe expect to adopt ASU 2014-09 on January 1, 2018, using the original effective date of December 15, 2016.modified retrospective transition method. We are currentlyevaluating the complete impact of the adoption to our consolidated financial results. Our primary source of revenue is generated through leasing arrangements, which are excluded from ASU 2014-09. We continue to evaluate and are in the process of evaluatingquantifying the impact, thatif any, the adoption of the standardASU 2014-09 will have on our consolidated financial statementsnon-lease revenue streams, including right-to-use annual payments, right-to-use contracts, and related disclosures.utility and other income.
Note 23 – Earnings Per Common Share
The following table sets forth the computation of the basic and diluted earnings per Common Share for the quarters and six months ended June 30, 20162017 and 20152016 (amounts in thousands, except per share data):
| | | | Quarters Ended | | Six Months Ended | Quarters Ended | | Six Months Ended |
| | June 30, | | June 30, | June 30, | | June 30, |
| | 2016 | | 2015 | | 2016 | | 2015 | 2017 | | 2016 | | 2017 | | 2016 |
| Numerators: | | | | | | | | |
| Numerator: | | | | | | | | |
| Net Income Available for Common Stockholders: | | | | | | | | | | | | | | |
| Net income available for Common Stockholders – basic | $ | 35,490 |
| | $ | 31,786 |
| | $ | 86,073 |
| | $ | 58,972 |
| $ | 39,498 |
| | $ | 35,490 |
| | $ | 96,385 |
| | $ | 86,073 |
|
| Amounts allocated to dilutive securities | 2,998 |
| | 2,724 |
| | 7,308 |
| | 5,054 |
| 2,649 |
| | 2,998 |
| | 6,539 |
| | 7,308 |
|
| Net income available for Common Stockholders – fully diluted | $ | 38,488 |
| | $ | 34,510 |
| | $ | 93,381 |
| | $ | 64,026 |
| $ | 42,147 |
| | $ | 38,488 |
| | $ | 102,924 |
| | $ | 93,381 |
|
| Denominator: | | | | | | | | | | | | | | |
| Weighted average Common Shares outstanding – basic | 84,516 |
| | 84,031 |
| | 84,419 |
| | 83,996 |
| 86,763 |
| | 84,516 |
| | 86,408 |
| | 84,419 |
|
| Effect of dilutive securities: | | | | | | | | | | | | | | |
| Redemption of Common OP Units for Common Shares | 7,205 |
| | 7,221 |
| | 7,206 |
| | 7,223 |
| |
| Conversion of Common OP Units to Common Shares | | 5,886 |
| | 7,205 |
| | 6,235 |
| | 7,206 |
|
| Stock options and restricted shares | 543 |
| | 599 |
| | 538 |
| | 610 |
| 414 |
| | 543 |
| | 398 |
| | 538 |
|
| Weighted average Common Shares outstanding – fully diluted | 92,264 |
| | 91,851 |
| | 92,163 |
| | 91,829 |
| 93,063 |
| | 92,264 |
| | 93,041 |
| | 92,163 |
|
| | | | | | | | | | | | | | | |
| Earnings per Common Share – Basic: | | | | | | | | | | | | | | |
| Net income available for Common Stockholders | $ | 0.42 |
| | $ | 0.38 |
| | $ | 1.02 |
| | $ | 0.70 |
| $ | 0.46 |
| | $ | 0.42 |
| | $ | 1.12 |
| | $ | 1.02 |
|
| | | | | | | | | | | | | | | |
| Earnings per Common Share – Fully Diluted: | | | | | | | | | | | | | | |
| Net income available for Common Stockholders | $ | 0.42 |
| | $ | 0.38 |
| | $ | 1.01 |
| | $ | 0.70 |
| $ | 0.45 |
| | $ | 0.42 |
| | $ | 1.11 |
| | $ | 1.01 |
|
Note 34 – Common Stock and Other Equity Related Transactions
Dividends
The following regular quarterly distributions have been declared on our depositary shares (each representing 1/100 of a share of our Series C Preferred Stock) and paid to our preferred shareholdersstockholders for the six months endedJune 30, 2016:2017.
|
| | | | | | |
Distribution Amount Per Share | | For the Quarter Ending | | Stockholder Record Date | | Payment Date |
$0.421875 | | March 31, 2016 | | March 21, 2016 | | March 31, 2016 |
$0.421875 | | June 30, 2016 | | June 17, 2016 | | June 30, 2016 |
|
| | | | | | | | |
| Distribution Amount Per Share | | For the Quarter Ended | | Stockholder Record Date | | Payment Date |
| $ | 0.421875 |
| | March 31, 2017 | | March 10, 2017 | | March 31, 2017 |
| $ | 0.421875 |
| | June 30, 2017 | | June 15, 2017 | | June 30, 2017 |
The following regular quarterly distributions have been declared and paid to common stockholders and common OP Unit non-controlling interest holders for the six months ended June 30, 2016:2017.
|
| | | | | | |
Distribution Amount Per Share | | For the Quarter Ending | | Stockholder Record Date | | Payment Date |
$0.425 | | March 31, 2016 | | March 25, 2016 | | April 8, 2016 |
$0.425 | | June 30, 2016 | | June 24, 2016 | | July 8, 2016 |
|
| | | | | | | | |
| Distribution Amount Per Share | | For the Quarter Ended | | Stockholder Record Date | | Payment Date |
| $ | 0.4875 |
| | March 31, 2017 | | March 31, 2017 | | April 14, 2017 |
| $ | 0.4875 |
| | June 30, 2017 | | June 30, 2017 | | July 14, 2017 |
Conversions
Subject to certain limitations, holders of Common Operating Partnership units ("OP units") can convert their units to Common Stock at any time. During the six months ended June 30, 2017, 1,334,747 OP units were converted to an equal number of shares of Common Stock.
Equity LifeStyle Properties, Inc.
Notes to Consolidated Financial Statements
Note 3 – Common Stock and Other Equity Related Transactions (continued)
Note 5 – Real Estate Acquisitions
On May
4, 2015, we extended our at-the-market (“ATM”) offering program by entering into new separate equity distribution agreements with certain sales agents, pursuant to which we may sell, from time-to-time, shares of our Common Stock, par value $0.01 per share, having an aggregate offering price of up to $125.0 million. The following table presents the shares that were issued under the ATM equity offering program during the six months ended June 30, 2016 (amounts in thousands, except stock data): |
| | | | |
| | | Six Months Ended June 30, 2016 |
| Shares of Common Stock sold | | 683,548 |
|
| Weighted average price | | $ | 73.15 |
|
| Total gross proceeds | | $ | 50,000 |
|
| Commissions paid to sales agents | | $ | 657 |
|
We did not sell any shares under the ATM offering program for the comparable six month period in 2015. As June 30, 2016, approximately $75.0 million of Common Stock remained available for issuance under this ATM equity offering program.
Note 4 – Investment in Real Estate
Acquisitions
All acquisitions have been accounted for utilizing the acquisition method of accounting in accordance with FASB ASC 805 and, accordingly, the results of operations of acquired assets are included in the Consolidated Statements of Income and Comprehensive Income from the dates of acquisition. Certain purchase price adjustments may be made within one year following the acquisition and applied prospectively in accordance with ASU 2015-16 Business Combinations (Topic 805): Simplifying the Accounting for Measurement-Period Adjustments.
On June 15, 2016,10, 2017, we completed the acquisition of Forest Lake Estates,Paradise Park Largo, a 1,168-Site property located in Zephryhills, Florida. This property consists of 894108-site manufactured home community Sites and 274 RV resort Sites. The purchase price of $75.2 million was funded with proceeds from the ATM offering program and the assumption of mortgage debt of approximately $22.6 million.
On May 26, 2016, we closed on the acquisition of Portland Fairview, a 407-Site RV resort located in Fairview, Oregon.Largo, Florida. The purchase price of approximately $17.6$8.0 million was funded with available cash.
On January 27, 2016, we completed the acquisitioncash and an assumed loan. The $5.9 million loan has an interest rate of Rose Bay, a 303-Site RV resort, located4.6% that matures in Port Orange, Florida. The total purchase price of approximately $7.4 million was funded with available cash.
During the year ended December 31, 2015, we acquired two RV resorts, Whispering Pines and Miami Everglades, collectively containing 581 Sites, and one manufactured home community, Bogue Pines, containing 150 Sites. The combined purchase price of approximately $23.9 million was funded with available cash.
Equity LifeStyle Properties, Inc.
Notes to Consolidated Financial Statements
Note 4 – Investment in Real Estate (continued)
The following table summarizes the estimated fair value of the assets acquired and liabilities assumed in the acquisitions for the six months ended June 30, 2016 and the year ended December 31, 2015, which we determined using Level-2, for mortgage notes payable and other liabilities, and Level-3 inputs (amounts in thousands):
|
| | | | | | | |
| | Six Months Ended | | Year Ended |
| | June 30,
2016 | | December 31,
2015 |
| Assets acquired | | | |
| Land | $ | 40,975 |
| | $ | 8,985 |
|
| Buildings and other depreciable property | 58,676 |
| | 13,948 |
|
| Manufactured homes | 22 |
| | 345 |
|
| In-place leases | 475 |
| | 622 |
|
| Net investment in real estate | 100,148 |
| | 23,900 |
|
| Other assets | 20 |
| | 53 |
|
| Total Assets acquired | $ | 100,168 |
| | $ | 23,953 |
|
| | | | |
| Liabilities assumed | | | |
| Mortgage notes payable | $ | 22,010 |
| | $ | — |
|
| Other liabilities | 1,955 |
| | 266 |
|
| Total Liabilities assumed | $ | 23,965 |
| | $ | 266 |
|
| Net assets acquired | $ | 76,203 |
| | $ | 23,687 |
|
Dispositions and real estate held for disposition
As of June 30, 2016, we did not have any Properties designated as held for disposition pursuant to FASB ASC 360-10-35.2040.
Note 56 – Investment in Unconsolidated Joint Ventures
We recorded approximately $1.6 million and $1.7 million (each net of approximately $0.6 million and $0.5 million of depreciation expense, for the six months endedOn June 30, 2016 and 2015, respectively) of equity15, 2017, we entered into a joint venture agreement to purchase Crosswinds Mobile Home Park, a 376-site manufactured home community located in income from unconsolidated joint ventures for eachSt. Petersburg, Florida. The purchase price of the six months ended June 30, 2016 and 2015, respectively.Property was $18.4 million. We received approximately $1.0contributed $2.2 million and $1.2 millionfor a 49% equity interest in distributions from thesethe joint venturesventure. The joint venture is accounted for under the six months ended June 30, 2016 and 2015, respectively.
On January 4, 2016,equity method of accounting. As part of the transaction, we contributed approximately $5.0issued a short term loan of $13.8 million to the ECHO Financing, LLC joint venture (the "ECHO JV") which brought our total investmentventure. The loan bears interest at 5% per annum, can be repaid with no penalty prior to approximately $15.4 million.maturity and matures on December 12, 2017.
The following table summarizes our investment in unconsolidated joint ventures as of June 30, 2016 and December 31, 2015 (investment amounts in thousands with the number of Properties shown parenthetically)parenthetically as of June 30, 2017 and December 31, 2016):
| | | | | | | | | | | Investment as of | | JV Income (loss) for the Six Months Ended | | | | | | | | | Investment as of | | Joint Venture Income/(Loss) for the Six Months Ended |
| Investment | Location | | Number of Sites | | Economic
Interest (a) | | | June 30,
2016 | | December 31,
2015 | | June 30,
2016 | | June 30,
2015 | | Location | | Number of Sites | | Economic
Interest (a) | | | June 30,
2017 | | December 31,
2016 | | June 30,
2017 | | June 30,
2016 |
| Meadows | Various (2,2) | | 1,077 |
| | 50 | % | | $ | 139 |
| | $ | 162 |
| | $ | 577 |
| | $ | 742 |
| | Various (2,2) | | 1,077 |
| | 50 | % | | $ | 240 |
| | $ | 510 |
| | $ | 1,130 |
| | $ | 577 |
|
| Lakeshore | Florida (2,2) | | 342 |
| | 65 | % | | 50 |
| | 46 |
| | 160 |
| | 177 |
| | Florida (3,2) | | 720 |
| | (b) |
| | 2,321 |
| | 56 |
| | 147 |
| | 160 |
|
| Voyager | Arizona (1,1) | | 1,706 |
| | 50 | % | (b) | | 7,676 |
| | 7,166 |
| | 917 |
| | 740 |
| | Arizona (1,1) | | 1,801 |
| | 50 | % | (c) | | 3,799 |
| | 3,376 |
| | 800 |
| | 917 |
|
| ECHO JV | Various | | — |
| | 50 | % | | 15,358 |
| | 10,367 |
| | (8 | ) | | 65 |
| | Various | | — |
| | 50 | % | | 15,406 |
| | 15,427 |
| | 113 |
| | (8 | ) |
| | | 3,125 |
| | | | $ | 23,223 |
| | $ | 17,741 |
| | $ | 1,646 |
| | $ | 1,724 |
| | 3,598 |
| | | | $ | 21,766 |
| | $ | 19,369 |
| | $ | 2,190 |
| | $ | 1,646 |
|
| |
| (a) | The percentages shown approximate our economic interest as of June 30, 2016.2017. Our legal ownership interest may differ. |
| |
| (b) | Includes two joint ventures in which we own a 65% interest and Crosswinds joint venture in which we own a 49% interest. |
| |
| (c) | Voyager joint venture primarily consists of a 50% interest in Voyager RV Resort and 33% interest in the utility plant servicing the Property. |
Note 6 - Notes Receivable
In certain cases, we purchase loans made by others to financeWe received approximately $1.8 million and $1.0 million in distributions from these joint ventures for the sales of homes to our customers (“Chattel Loans”). Our Chattel Loans receivable require monthly principalsix months ended June 30, 2017 and interest payments2016, respectively. Approximately $0.3 million and are collateralized by homes at certain$0.5 million of the Properties. As ofdistributions made to us exceeded our basis in joint ventures for the quarter and six months ended June 30, 20162017, and December 31, 2015, we had approximately $16.6 millionas such were recorded as income from unconsolidated joint ventures. None of the distributions made to us exceeded our basis in joint ventures for the quarter and $17.6 million, respectively, of these Chattel Loans included in notes receivable. As ofsix months ended June 30, 2016, the Chattel Loans receivable had a stated per annum average rate of
Equity LifeStyle Properties, Inc.
Notes to Consolidated Financial Statements
Note 6 – Notes Receivable (continued)
approximately 7.8%, with a yield of 19.7%, and had an average term remaining of approximately 11 years. These Chattel Loans are recorded net of allowances of approximately $0.3 million as of June 30, 2016 and December 31, 2015, respectively.
We also provide financing for non-refundable upgrades to existing right-to-use contracts (“Contracts Receivable”). As of June 30, 2016 and December 31, 2015, we had approximately $17.2 million and $17.8 million, respectively, of Contracts Receivable, net of allowances of approximately $0.6 million. The Contracts Receivable have an average stated interest rate of 16.1% per annum, have a weighted average term remaining of approximately four years and require monthly payments of principal and interest.2016.
Note 7 – Borrowing Arrangements
With the adoption of ASU 2015-03 and ASU 2015-15, we reclassified deferred financing costs to mortgage notes payable in the amount of $18.9 million as of December 31, 2015. In addition, we reclassified deferred financing costs to term loan in the amount of $0.8 million as of December 31, 2015. Also, we reclassified deferred financing costs related to our unsecured line of credit to Escrow deposits, goodwill, and other assets, net in the amount of $3.7 million as of December 31, 2015.
Mortgage Notes Payable
As of June 30, 20162017 and December 31, 2015,2016, we had outstanding mortgage indebtedness of approximately $1.9 billion, excluding$1,855.0 million and $1,891.9 million, respectively, net of deferred financing costs. In connection with the Paradise Park Largo acquisition during the quarter ended June 30, 2017, we assumed approximately $5.9 million of mortgage debt secured by the manufactured home community with an interest rate of 4.6% that matures in 2040. During the quarter ended March 31, 2017, we paid off one maturing mortgage loan of approximately $21.1 million, with a weighted average interest rate of 5.76% per annum, secured by one manufactured home Property.
The weighted average interest rate, including the impact of premium/discount amortization and loan cost amortization on this mortgage indebtedness, for the six months ended June 30, 20162017 was approximately 4.9% per annum. The debt bears interest at stated rates ranging from 3.5% to 8.9% per annum and matures on various dates ranging from 20162017 to 2040.2041. The debt encumbered a total of 126 and 127 of our Properties as of both June 30, 20162017 and December 31, 2015, respectively,2016, and the carrying value of such Properties was approximately $2.3 billion$2,282.1 million and $2.2 billion, respectively,$2,296.6 million, as of such dates.
In connection with the Forest Lake Estates acquisition, we assumed approximately $22.6 million of mortgage debt secured by the manufactured home community, with a stated interest rate of 4.51% per annum, which is set to mature in 2038.
During the six months ended June 30, 2016, we paid off two maturing mortgage loans of approximately $13.1 million, with a weighted average interest rate of 5.53% per annum, secured by two manufactured home Properties.
On July 1, 2016, we paid off two maturing mortgage loans of approximately $23.9 million in the aggregate, with weighted average interest rate of 5.99%, secured by one RV resort2017 and one manufactured home Property.
During the year ended December 31, 2015, we closed on loans with total gross proceeds of $395.3 million. The loans have a weighted average maturity of 21 years, carry a weighted average interest rate of 3.93% per annum and were secured by 26 manufactured home Properties and RV resorts. Proceeds from the financings were used to retire by defeasance and prepayment approximately $370.2 million of loans maturing at various times throughout 2015 and 2016, with a weighted average interest rate of 5.58% per annum, which were secured by 32 manufactured home Properties and RV resorts. We incurred approximately $17.0 million in early debt retirement expense related to these loans.
Term Loanrespectively.
As of June 30, 2016 and December 31, 2015, our $200.0 million unsecured Term Loan (the “Term Loan”) matures on January 10, 2020 and has an interest rate of LIBOR plus 1.35% to 1.95% per annum and, subject to certain conditions, may be prepaid at any time without premium or penalty. The spread over LIBOR is variable quarterly based on leverage measured quarterly throughout the loan term. The Term Loan contains customary representations, warranties, and negative and affirmative covenants, and provides for acceleration of principal and payment of all other amounts payable thereunder upon the occurrence of certain events of default. In connection with the Term Loan, we also entered into a three year LIBOR Swap Agreement (the “2014 Swap”) allowing us to trade the variable interest rate for a fixed interest rate on the Term Loan (See Note 8 to the Consolidated Financial Statements for further information on the accounting for the 2014 Swap).
Unsecured Line of Credit
As of June 30, 2016 and December 31, 2015, our unsecured Line of Credit (“LOC”) had a borrowing capacity of $400.0 million, with the option to increase the borrowing capacity by $100.0 million, subject to certain conditions, with no amounts outstanding as of those dates. The LOC bears interest at a rate of LIBOR plus 1.20% to 1.65%, requires an annual facility fee of
Equity LifeStyle Properties, Inc.
Notes to Consolidated Financial Statements
Note 7 – Borrowing Arrangements (continued)
0.20% to 0.35% and matures on July 17, 2018, with an option to extend for one additional year, subject to certain conditions. The spread over LIBOR is variable quarterly based on leverage throughout the loan term.
As of June 30, 2016,2017, we are in compliance in all material respects with the covenants in our borrowing arrangements.
Note 8 – Derivative Instruments and Hedging Activities
Cash Flow Hedges of Interest Rate Risk
In connection with our Term Loan, we entered into the 2014 Swap (see Note 7 to the Consolidated Financial Statements for information about the Term Loan related to the 2014 Swap) allowing us to trade the variable interest rate for a fixed interest rate on the Term Loan. The 2014 Swap fixes the underlying LIBOR rate on the Term Loan at 1.04% per annum for the first three years and matures on August 1, 2017. Based on the leverage as of June 30, 2016, our spread over LIBOR is 1.35% resulting in an estimated all-in interest rate of 2.39% per annum.
We have designated the 2014 Swap as a cash flow hedge. No gain or loss was recognized in the Consolidated Statements of Income and Comprehensive Income related to hedge ineffectiveness or to amounts excluded from effectiveness testing on our cash flow hedge during the quarters and six months ended June 30, 2016 and 2015.
Amounts reported in accumulated other comprehensive loss on the Consolidated Balance Sheets related to derivatives are reclassified to interest expense as interest payments are made on our variable-rate debt. During the next twelve months, we estimate that an additional $1.1 million will be reclassified as an increase to interest expense. This estimate may be subject to change as the underlying LIBOR rate changes.
Derivative Instruments and Hedging Activities
The table below presents the fair value of our derivative financial instrument as well as our classification on our Consolidated Balance Sheets as of June 30, 2016 and December 31, 2015 (amounts in thousands):
|
| | | | | | | | | | |
| Derivatives in Cash Flow Hedging Relationship | | Balance Sheet Location | | June 30,
2016 | | December 31,
2015 |
| Interest Rate Swap | | Accrued expenses and accounts payable | | $ | 1,197 |
| | $ | 553 |
|
Tabular Disclosure of the Effect of Derivative Instruments on the Income Statement
The tables below present the effect of our derivative financial instrument on the Consolidated Statements of Income and Comprehensive Income for the quarters ended June 30, 2016 and 2015 (amounts in thousands):
|
| | | | | | | | | | | | | | | | | | |
| Derivatives in Cash Flow Hedging Relationship | | Amount of loss recognized
in OCI on derivative | | Location of loss
reclassified from
accumulated OCI into income | | Amount of loss
reclassified from
accumulated OCI into
income |
| | June 30,
2016 | | June 30,
2015 | | | June 30,
2016 | | June 30,
2015 |
| Interest Rate Swap | | $ | 338 |
| | $ | 230 |
| | Interest Expense | | $ | 302 |
| | $ | 434 |
|
The tables below present the effect of our derivative financial instrument on the Consolidated Statements of Income and Comprehensive Income for the six months ended June 30, 2016 and 2015 (amounts in thousands):
|
| | | | | | | | | | | | | | | | | | |
| Derivatives in Cash Flow Hedging Relationship | | Amount of loss recognized
in OCI on derivative | | Location of loss
reclassified from
accumulated OCI into income | | Amount of loss
reclassified from
accumulated OCI into
income |
| | June 30,
2016 | | June 30,
2015 | | | June 30,
2016 | | June 30,
2015 |
| Interest Rate Swap | | $ | 1,258 |
| | $ | 1,522 |
| | Interest Expense | | $ | 614 |
| | $ | 869 |
|
We determined that no adjustment was necessary for non-performance risk on our derivative obligation. As of June 30, 2016, we have not posted any collateral related to this agreement.
Equity LifeStyle Properties, Inc.
Notes to Consolidated Financial Statements
Note 9 – Deferred Revenue-entry of right-to-use contracts and Deferred Commission Expense
As of June 30, 2016 and 2015, the components of the change in deferred revenue-entry of right-to-use contracts and deferred commission expense are as follows (amounts in thousands):
|
| | | | | | | |
| | Six Months Ended June 30,
|
| | 2016 | | 2015 |
| Deferred revenue–upfront payments from right-to-use contracts, as of January 1, | $ | 78,405 |
| | $ | 74,174 |
|
| Right-to-use contracts current period, gross | 5,618 |
| | 6,375 |
|
| Revenue recognized from right-to-use contract upfront payments | (4,518 | ) | | (4,147 | ) |
| Right-to-use contract upfront payments, deferred, net | 1,100 |
| | 2,228 |
|
| Deferred revenue–upfront payments from right-to-use contracts, as of June 30, | $ | 79,505 |
| | $ | 76,402 |
|
| | | | |
| Deferred commission expense, as of January 1, | $ | 30,865 |
| | $ | 28,589 |
|
| Deferred commission expense | 2,238 |
| | 3,067 |
|
| Commission expense recognized | (2,019 | ) | | (1,696 | ) |
| Net increase in deferred commission expense | 219 |
| | 1,371 |
|
| Deferred commission expense, as of June 30, | $ | 31,084 |
| | $ | 29,960 |
|
Note 108 – Equity Incentive Awards
Stock-based compensation expense, reported in general and administrative on the Consolidated Statements of Income and Comprehensive Income, for both of the quarters ended June 30, 20162017 and 20152016 was approximately $2.5 million and $2.2 million, respectively, and for the six months ended June 30, 20162017 and 20152016 was approximately $4.4$4.3 million and $4.0$4.4 million respectively.
Our 2014 Equity Incentive Plan (the “2014 Plan”) was adopted by our Board of Directors on March 11, 2014 and approved by our stockholders on May 13, 2014. Pursuant to the 2014 Plan, our officers, directors, employees and consultants may be awarded (i) shares of common stock (“Restricted Stock Grants”Stock”), (ii) options to acquire shares of common stock (“Options”), including non-qualified stock options and incentive stock options within the meaning of Section 422 of the Internal Revenue Code, and (iii) other forms of equity awards, subject to conditions and restrictions determined by the Compensation, Nominating, and Corporate Governance Committee of our Board of Directors (the “Compensation Committee”). The Compensation Committee will determine the vesting schedule, if any, of each Restricted Stock Grant or Option and the term of each Option, which term shall not exceed ten years from the date of grant. Shares that do not vest are forfeited. Dividends paid on restricted stock are not returnable, even if the underlying stock does not entirely vest. A maximum of 3,750,000 shares of common stock were originally available for grant under the 2014 Plan. As of June 30, 2016, 3,264,2822017, 3,126,885 shares remained available for grant. For the six months ended June 30, 2016, Options for 220,000 shares of common stock were exercised for gross proceeds of approximately $5.2 million.
Grants under the 2014 Plan are approved by the Compensation Committee, which determines the individuals eligible to receive awards, the types of awards, and the terms, conditions and restrictions applicable to any award, except grants to directors which are approved by the Board of Directors.
Grants Issued
On May 10, 2016,2, 2017, we awarded Restricted Stock Grants for 14,705to certain members of our Board of Directors, 55,238 shares of common stockRestricted Stock at a fair market value of approximately $1.1$4.5 million and awarded Options to purchase 7,5506,930 shares of common stock with an exercise price of $74.53$81.15 per share to certain members of our Board of Directors.Theshare. The shares of common stock covered by these awards are subject to multiple tranches that vest as soon asbetween November 10, 20162, 2017 and as late as May 10, 2019.2, 2020.
On February 1, 2016,2017, we awarded Restricted Stock Grants for 73,00075,000 shares of common stockRestricted Stock at a fair market value of approximately $4.9$5.4 million to certain members of our senior management for their service in 2016.2017. These Restricted Stock Grantsrestricted stock grants will vest on December 31, 2016.
On February 1, 2016, we awarded Restricted Stock Grants for 45,784 shares of common stock at a fair market value of approximately $3.1 million to certain members of our Board of Directors for their services as Chairman of the Board, Chairman of the Compensation Committee and Lead Director, Chairman of the Executive Committee and Chairman of the Audit Committee in 2016. One-third of the shares of restricted common stock covered by these awards will vest on each of December 31, 2016, December 31, 2017, and December 31, 2018.
Equity LifeStyle Properties, Inc.
Notes to Consolidated Financial Statements
Note 10 – Equity Incentive Awards (continued)
2017.
The fair market value of our restricted stock grants was determined by using the closing share price of our common stock on the date the shares were issued and is recorded as compensation expense and paid in capital over the vesting period.
Note 11 – Long-Term Cash Incentive Plan
On February 12, 2016, our Compensation Committee approved a Long-Term Cash Incentive Plan Award (the "2016 LTIP") to provide a long-term cash bonus opportunity to certain members of our management. The 2016 LTIP was approved by the Compensation Committee pursuant to the authority set forth in the Long Term Cash Incentive Plan approved by our Board of Directors on May 15, 2007. The total cumulative payment for all participants (the "Eligible Payment") is based upon certain performance conditions being met over a three year period ending December 31, 2018.
The Compensation Committee has responsibility for administering the 2016 LTIP and may use its reasonable discretion to adjust the performance criteria or Eligible Payments to take into account the impact of any major or unforeseen transaction or event. Our named executive officers are not participants in the 2016 LTIP. The Eligible Payment will be paid, at the discretion of our Compensation Committee, in cash upon completion of our annual audit for the 2018 fiscal year and upon satisfaction of the vesting conditions as outlined in the 2016 LTIP and, including employer costs, is currently estimated to be approximately $5.6 million. As of June 30, 2016, we had accrued compensation expense of approximately $1.0 million for the 2016 LTIP.
The amount accrued for the 2016 LTIP reflects our evaluation of the 2016 LTIP based on forecasts and other available information and is subject to performance in line with forecasts and final evaluation and determination by the Compensation Committee. There can be no assurances that our estimates of the probable outcome will be representative of the actual outcome.
Note 129 – Commitments and Contingencies
California Rent Control Litigation
As part of our effort to realize the value of our Properties subject to rent control, we previously initiated lawsuits against certain localities in California with the goal of achieving a level of regulatory fairness in California's rent control jurisdictions, and in particular those jurisdictions that prohibit increasing rents to market upon turnover. Such regulations allow tenants to sell their homes for a price that includes a premium above the intrinsic value of the homes. The premium represents the value of the future discounted rent-controlled rents, which is fully capitalized into the prices of the homes sold. In our view, such regulations result in a transfer to the tenants of the value of our land, which would otherwise be reflected in market rents. We have discovered through the litigation process that certain municipalities considered condemning our Properties at values well below the value of the underlying land. In our view, a failure to articulate market rents for Sites governed by restrictive rent control would put us at risk for condemnation or eminent domain proceedings based on artificially reduced rents. Such a physical taking, should it occur, could represent substantial lost value to stockholders. We are cognizant of the need for affordable housing in the jurisdictions, but assert that restrictive rent regulation does not promote this purpose because tenants pay to their sellers as part of the purchase price of the home all the future rent savings that are expected to result from the rent control regulations, eliminating any supposed improvement in the affordability of housing. In a more well-balanced regulatory environment, we would receive market rents that would eliminate the price premium for homes, which would trade at or near their intrinsic value. Such efforts have included the following matters:
We sued the City of San Rafael on October 13, 2000 in the U.S. District Court for the Northern District of California, challenging its rent control ordinance on constitutional grounds. While the trial courtDistrict Court found the rent control ordinance unconstitutional, the United States Court of Appeals for the Ninth Circuit reversed the trial courtDistrict Court and ruled that the ordinance had not unconstitutionally taken our property. On September 3, 2013, we filed a petition for review by the U.S. Supreme Court, which was denied.
Equity LifeStyle Properties, Inc.
Notes to Consolidated Financial Statements
Note 9 – Commitments and Contingencies (continued)
On January 31, 2012, we sued the City of Santee in the United States District for the Southern District of California challenging its rent control ordinance on constitutional grounds. On September 26, 2013, we entered a settlement agreement with the City pursuant to which we are able to increase Site rents at the Meadowbrook community through January 1, 2034 as follows: (a) a one-time 2.5% rent increase on all Sites in January 2014; plus (b) annual rent increases of 100% of the consumer price index (CPI) beginning in 2014; and (c) a 10% increase in the rent on a site upon turnover of that site. Absent the settlement, the rent control ordinance limited us to annual rent increases of at most 70% of CPI with no increases on turnover of a site.
Equity LifeStyle Properties, Inc.
Notes to Consolidated Financial Statements
Note 12 – Commitments and Contingencies (continued)
Colony ParkSettlement of California Lawsuits
On December 1, 2006, a groupJanuary 18, 2017, we entered into agreements pursuant to which we agreed to settle three California lawsuits related to our California Hawaiian property in San Jose, our Monte del Lago property in Castroville and our Santiago Estates property in Sylmar. Each of tenants at our Colony Park Property in Ceres, California filed a complaint in the California Superior Court for Stanislaus County allegingthree plaintiff groups was represented by the same law firm and alleged that we hadthe Company failed to properly maintain the Propertyrespective properties. The settlement agreements provided for $9.9 million to be paid to settle the California Hawaiian matter, $1.5 million to be paid to settle the Monte del Lago matter and had improperly reduced$1.9 million to be paid to settle the services providedSantiago Estates matter. As a result, a litigation settlement payable was recorded in Accrued expenses and accounts payable as of December 31, 2016. In addition, an insurance receivable was recorded in escrow deposits, goodwill and other assets, net as of December 31, 2016, resulting in a net settlement of approximately $2.4 million reflected as a component of property rights initiatives and other, net on the consolidated statement of income for the year ended December 31, 2016. During the quarter ended March 31, 2017, the settlements were finalized, the settlement payments were made and the insurance payments were received. These settlements resolved all pending matters brought by plaintiffs’ counsel against us or any of our affiliates. Pursuant to the tenants, among other allegations. We answered the complaint by denyingsettlement agreements, all material allegations and filed a counterclaim for declaratory relief and damages. The case proceeded in Superior Court because our motionplaintiffs provided full releases to compel arbitration was denied and the denial was upheld on appeal. Trialeach of the case began on July 27, 2010. After just over three months of trial in which the plaintiffs asked the jury to award a total of approximately $6.8 million in damages, the jury rendered verdicts awarding a total of less than $44,000 to six out of the 72 plaintiffs,defendants and awarding nothing to the other 66 plaintiffs. The plaintiffs who were awarded nothing filed a motion for a new trial or alternatively for judgment notwithstanding the jury's verdict, which the Court denied on February 14, 2011. All but three of the 66 plaintiffs to whom the jury awarded nothing appealed. Oral argument in the appeal was held on September 19, 2013 and the matter was taken under submission by the California Court of Appeal.
By orders entered on December 14, 2011, the Superior Court awarded us approximately $2.0 million in attorneys' fees and other costs jointly and severally against the plaintiffs to whom the jury awarded nothing, and awarded no attorneys' fees or costs to either sidetheir affiliates including with respect to the six plaintiffs to whomclaims alleged in the jury awarded less than $44,000. Plaintiffs filedlawsuits, and each of the lawsuits and related appeals were dismissed with prejudice. The settlements do not constitute an appeal from the approximately $2.0 million awardadmission of liability by us or any of our attorneys' feesaffiliates and other costs. Oral argumentwere made to avoid the costs, risks and uncertainties inherent in that appeal was also held on September 19, 2013. On December 3, 2013, the Court of Appeal issued a partially published opinion that rejected all of plaintiffs' claims on appeal except one, relating to whether the park's rules prohibited the renting of spaces to recreational vehicles. The Court of Appeal reversed the judgment on the recreational vehicle issue and remanded for further proceedings regarding that issue. Because the judgment was reversed, the award of attorney's fees and other costs was also reversed. Both sides filed rehearing petitions with the Court of Appeal. On December 31, 2013, the Court of Appeal granted the defendants' rehearing petition and ordered the parties to submit supplemental briefing, which the parties did. On March 10, 2014, the Court of Appeal issued a new partially published opinion in which it again rejected all of the plaintiffs' claims on appeal except the one relating to whether the park's rules prohibited the renting of spaces to recreational vehicles, reversing the judgment on that issue and remanding it for further proceedings, and accordingly vacating the award of attorney's fees and other costs.
As of result of a settlement we reached with the plaintiffs remaining in the litigation, pursuant to which among other provisions the parties agreed to mutually release all of their claims in the litigation without any payment by us, on September 28, 2015 the plaintiffs filed with the Superior Court a request for dismissal with prejudice of the entire action, to which we consented. On July 14, 2016, the Superior Court entered a dismissal of the action with prejudice.
California Hawaiian
On April 30, 2009, a group of tenants at our California Hawaiian Property in San Jose, California filed a complaint in the California Superior Court for Santa Clara County, Case No. 109CV140751, alleging that we have failed to properly maintain the Property and have improperly reduced the services provided to the tenants, among other allegations. We moved to compel arbitration and stay the proceedings, to dismiss the case, and to strike portions of the complaint. By order dated October 8, 2009, the Court granted our motion to compel arbitration and stayed the court proceedings pending the outcome of the arbitration. The plaintiffs filed with the California Court of Appeal a petition for a writ seeking to overturn the trial court's arbitration and stay orders. On May 10, 2011, the Court of Appeal granted the petition and ordered the trial court to vacate its order compelling arbitration and to restore the matter to its litigation calendar for further proceedings. On May 24, 2011, we filed a petition for rehearing requesting the Court of Appeal to reconsider its May 10, 2011 decision. On June 8, 2011, the Court of Appeal denied the petition for rehearing. On June 16, 2011, we filed with the California Supreme Court a petition for review of the Court of Appeal's decision. On August 17, 2011, the California Supreme Court denied the petition for review.
The trial commenced on January 27, 2014. On April 14-15, 2014, the jury entered verdicts against our Operating Partnership of approximately $15.3 million in compensatory damages and approximately $95.8 million in punitive damages. On October 6, 2014, we filed a motion for a new trial and a motion for partial judgment notwithstanding the jury's verdict. On December 5, 2014, after briefing and a hearing on those motions, the trial court entered an order granting us a new trial on the issue of damages while upholding the jury's determination of liability. As grounds for the ruling, the court cited excessive damages and insufficiency of the evidence to support the verdict as to the amount of damages awarded by the jury. The Court's ruling overturned the April 2014 verdicts of $15.3 million in compensatory damages and $95.8 million in punitive damages. On January 28, 2015, we and the plaintiffs each served notices of appeal from the trial court's December 5, 2014 order. The Court of Appeal issued an order setting the briefing sequence and ordered commencement of the briefing. On December 15, 2015, the plaintiffs filed their opening appellants’ brief; on March 25, 2016, we filed our combined respondents’ and opening brief; and on July 8, 2016, the plaintiffs filed their combined reply and cross-respondents’ brief. We intend to continue to vigorously defend ourselves in this litigation.
Equity LifeStyle Properties, Inc.
Notes to Consolidated Financial Statements
Note 12 – Commitments and Contingencies (continued)
At June 30, 2016, based on the information available to us, a material loss was neither probable nor estimable. We have taken into consideration the events that have occurred after the reporting period and before the financial statements were issued. We anticipate a lengthy time period to achieve resolution of this case.
Monte del Lago
On February 13, 2015, a group of tenants at our Monte del Lago Property in Castroville, California filed a complaint in the California Superior Court for Monterey County, Case No. M131016, alleging that we have failed to properly maintain the Property and have improperly reduced the services provided to the tenants, among other allegations. We believe the allegations are without merit and intend to vigorously defend ourselves in the lawsuit. On May 13, 2015, we filed a motion to compel arbitration with respect to certain plaintiffs and to stay the litigation pending the conclusion of the arbitration proceedings. Hearings on the motion were held on July 17, 2015 and September 18, 2015. On October 7, 2015, the court denied our motion. On December 3, 2015, we filed a notice of appeal from the denial of our motion.
Santiago Estates
On September 4, 2015, a group of tenants at our Santiago Estates Property in Sylmar, California filed a complaint in the California Superior Court for Los Angeles County, Case No. BC593831, alleging that we have failed to properly maintain the Property and have improperly reduced the services provided to the tenants, among other allegations. We believe the allegations are without merit and intend to vigorously defend ourselves in the lawsuit. On November 24, 2015, we filed a motion to compel arbitration with respect to certain plaintiffs and to stay the litigation pending the conclusion of the arbitration proceedings. The hearing date for that motion is August 19, 2016.
Civil Investigation by Certain California District Attorneys
In November 2014, we received a civil investigative subpoena from the office of the District Attorney for Monterey County, California ("MCDA"), seeking information relating to, among other items, statewide compliance with asbestos and hazardous waste regulations dating back to 2005 primarily in connection with demolition and renovation projects performed by third-party contractors at our California Properties. We responded by providing the information required by the subpoena.
On October 20, 2015, we attended a meeting with representatives of the MCDA and certain other District Attorneys' offices at which the MCDA reviewed the preliminary results of their investigation including, among other things, (i) alleged violations of asbestos and related regulations associated with approximately 200 historical demolition and renovation projects in California; (ii) potential exposure to civil penalties and unpaid fees; and (iii) next steps with respect to a negotiated resolution of the alleged violations. No legal proceedings have been instituted to date and we are involved in settlement discussions with the District Attorneys' offices. We continue to assess the allegations and the underlying facts, and at this time we are unable to predict the outcome of the investigation or reasonably estimate any possible loss.
Alpine Lake RV Resort OSHA Citations
On February 19, 2016, we received a Citation and Notice of Penalty from the Occupational Safety and Health Administration (“OSHA”) alleging two willful and seven serious safety violations relating to the design and maintenance of the electrical system at our Alpine Lake RV Resort in Corinth, New York, and assessing fines totaling $187,000. We have been working with a certified third-party electrician to address the items raised in the citations.
On March 9, 2016, we attended an informal conference in Albany, New York with the OSHA Area Director. The matter was not resolved at the meeting, and we filed the required notice of contest on March 10, 2016 after which the matter was transferred to the Occupational Safety & Health Review Commission, which is represented by a solicitor from the Department of Labor. The solicitor filed a complaint on May 20, 2016, and the parties participated in a formal settlement conference on June 22, 2016. The parties did not reach a settlement at the formal settlement conference. Absent the parties reaching a settlement, we anticipate that this matter will proceed to trial. We intend to continue to vigorously defend ourselves, and at this time we are unable to predict the outcome of this matter.
Other
In addition to legal matters discussed above, we are involved in various other legal and regulatory proceedings ("Other Proceedings") arising in the ordinary course of business. The Other Proceedings include, but are not limited to, notices, consent
Equity LifeStyle Properties, Inc.
Notes to Consolidated Financial Statements
Note 12 – Commitments and Contingencies (continued)
decrees, information requests, and additional permit requirements and other similar enforcement actions by governmental agencies relating to our utility infrastructure, including water and wastewater treatment plants and other waste treatment facilities and electrical systems. Additionally, in the ordinary course of business, our operations are subject to audit by various taxing authorities. Management believes these Other Proceedings taken together do not represent a material liability. In addition, to the extent any such proceedings or audits relate to newly acquired Properties, we consider any potential indemnification obligations of sellers in our favor.
Note 1310 – Reportable Segments
Operating segments are defined as components of an entity for which separate financial information is available that is evaluated regularly by the chief operating decision maker. The chief operating decision maker evaluates and assesses performance on a monthly basis. Segment operating performance is measured on Net Operating Income (“NOI”). NOI is defined as total operating revenues less total operating expenses. Segments are assessed before interest income, depreciation and amortization of in-place leases.
We have identified two reportable segments which are: (i) Property Operations and (ii) Home Sales and Rentals Operations. The Property Operations segment owns and operates land lease Properties and the Home Sales and Rentals Operations segment purchases, sells and leases homes at the Properties. The distribution of the Properties throughout the United States reflects our belief that geographic diversification helps insulate the portfolio from regional economic influences.
Equity LifeStyle Properties, Inc.
Notes to Consolidated Financial Statements
Note 10 - Reportable Segments (Continued)
All revenues are from external customers and there is no customer who contributed 10% or more of our total revenues during the quarters and six months ended June 30, 20162017 or 2015.2016.
The following tables summarize our segment financial information for the quarters and six months ended June 30, 20162017 and 20152016 (amounts in thousands):
Quarter Ended June 30, 2017 |
| | | | | | | | | | | |
| | Property Operations | | Home Sales and Rentals Operations | | Consolidated |
| Operations revenues | $ | 206,594 |
| | $ | 11,811 |
| | $ | 218,405 |
|
| Operations expenses | (102,649 | ) | | (10,481 | ) | | (113,130 | ) |
| Income from segment operations | 103,945 |
| | 1,330 |
| | 105,275 |
|
| Interest income | 754 |
| | 1,041 |
| | 1,795 |
|
| Depreciation on real estate assets and rental homes | (27,609 | ) | | (2,638 | ) | | (30,247 | ) |
| Amortization of in-place leases | (958 | ) | | — |
| | (958 | ) |
| Income (loss) from operations | $ | 76,132 |
| | $ | (267 | ) | | $ | 75,865 |
|
| Reconciliation to Consolidated net income: | | | | | |
| Corporate interest income | | | | | 3 |
|
| Income from other investments, net | | | | | 1,109 |
|
| General and administrative | | | | | (8,461 | ) |
| Property rights initiatives and other | | | | | (271 | ) |
| Interest and related amortization | | | | | (24,822 | ) |
| Equity in income of unconsolidated joint ventures | | | | | 1,040 |
|
| Consolidated net income | | | | | $ | 44,463 |
|
| | | | | | |
| Total assets | $ | 3,267,947 |
| | $ | 217,411 |
| | $ | 3,485,358 |
|
Quarter Ended June 30, 2016 | | | | Property Operations | | Home Sales and Rentals Operations | | Consolidated | Property Operations | | Home Sales and Rentals Operations | | Consolidated |
| Operations revenues | $ | 193,184 |
| | $ | 13,002 |
| | $ | 206,186 |
| $ | 193,184 |
| | $ | 13,002 |
| | $ | 206,186 |
|
| Operations expenses | (94,375 | ) | | (11,867 | ) | | (106,242 | ) | (94,375 | ) | | (11,867 | ) | | (106,242 | ) |
| Income from segment operations | 98,809 |
| | 1,135 |
| | 99,944 |
| 98,809 |
| | 1,135 |
| | 99,944 |
|
| Interest income | 736 |
| | 867 |
| | 1,603 |
| 736 |
| | 867 |
| | 1,603 |
|
| Depreciation on real estate assets and rental homes | (26,317 | ) | | (2,712 | ) | | (29,029 | ) | (26,317 | ) | | (2,712 | ) | | (29,029 | ) |
| Amortization of in-place leases | (428 | ) | | — |
| | (428 | ) | (428 | ) | | — |
| | (428 | ) |
| Income (loss) from operations | $ | 72,800 |
| | $ | (710 | ) | | 72,090 |
| $ | 72,800 |
| | $ | (710 | ) | | $ | 72,090 |
|
| Reconciliation to Consolidated net income: | | | | | | | | | | |
| Corporate interest income | | | | | 22 |
| | | | | 22 |
|
| Income from other investments, net | | | | | 2,270 |
| | | | | 2,270 |
|
| General and administrative | | | | | (8,255 | ) | | | | | (8,255 | ) |
| Property rights initiatives and other | | | | | (527 | ) | | | | | (527 | ) |
| Interest and related amortization | | | | | (25,561 | ) | | | | | (25,561 | ) |
| Equity in income of unconsolidated joint ventures | | | | | 765 |
| | | | | 765 |
|
| Consolidated net income | | | | | $ | 40,804 |
| | | | | $ | 40,804 |
|
| | | | | | | | | | | |
| Total assets | $ | 3,249,375 |
| | $ | 236,200 |
| | $ | 3,485,575 |
| $ | 3,249,375 |
| | $ | 236,200 |
| | $ | 3,485,575 |
|
Equity LifeStyle Properties, Inc.
Notes to Consolidated Financial Statements
Note 1310 - Segment Reporting (continued)Reportable Segments (Continued)
QuarterSix Months Ended June 30, 20152017
| | | | Property Operations | | Home Sales and Rentals Operations | | Consolidated | Property Operations | | Home Sales and Rentals Operations | | Consolidated |
| Operations revenues | $ | 184,125 |
| | $ | 13,441 |
| | $ | 197,566 |
| $ | 425,582 |
| | $ | 22,685 |
| | $ | 448,267 |
|
| Operations expenses | (90,677 | ) | | (11,502 | ) | | (102,179 | ) | (199,906 | ) | | (20,076 | ) | | (219,982 | ) |
| Income from segment operations | 93,448 |
| | 1,939 |
| | 95,387 |
| 225,676 |
| | 2,609 |
| | 228,285 |
|
| Interest income | 713 |
| | 1,001 |
| | 1,714 |
| 1,484 |
| | 2,079 |
| | 3,563 |
|
| Depreciation on real estate assets and rental homes | (25,586 | ) | | (2,749 | ) | | (28,335 | ) | (55,062 | ) | | (5,295 | ) | | (60,357 | ) |
| Amortization of in-place leases | (669 | ) | | — |
| | (669 | ) | (1,990 | ) | | — |
| | (1,990 | ) |
| Income from operations | $ | 67,906 |
| | $ | 191 |
| | 68,097 |
| |
| Income (loss) from operations | | $ | 170,108 |
| | $ | (607 | ) | | $ | 169,501 |
|
| Reconciliation to Consolidated net income: | | | | | | | | | | |
| Corporate interest income | | | | | 22 |
| | | | | 5 |
|
| Income from other investments, net | | | | | 2,178 |
| | | | | 1,866 |
|
| General and administrative | | | | | (7,541 | ) | | | | | (15,834 | ) |
| Property rights initiatives and other | | | | | (694 | ) | | | | | (490 | ) |
| Early debt retirement | | | | | 69 |
| |
| Interest and related amortization | | | | | (26,145 | ) | | | | | (49,701 | ) |
| Equity in income of unconsolidated joint ventures | | | | | 840 |
| | | | | 2,190 |
|
| Consolidated net income | | | | | $ | 36,826 |
| | | | | $ | 107,537 |
|
| | | | | | | | | | | |
| Total assets | $ | 3,192,050 |
| | $ | 255,458 |
| | $ | 3,447,508 |
| $ | 3,267,947 |
| | $ | 217,411 |
| | $ | 3,485,358 |
|
| Capital improvements | | $ | 31,731 |
| | $ | 21,733 |
| | $ | 53,464 |
|
Six Months Ended June 30, 2016
|
| | | | | | | | | | | |
| | Property Operations | | Home Sales and Rentals Operations | | Consolidated |
| Operations revenues | $ | 397,910 |
| | $ | 25,040 |
| | $ | 422,950 |
|
| Operations expenses | (184,887 | ) | | (22,507 | ) | | (207,394 | ) |
| Income from segment operations | 213,023 |
| | 2,533 |
| | 215,556 |
|
| Interest income | 1,453 |
| | 1,785 |
| | 3,238 |
|
| Depreciation on real estate assets and rental homes | (52,281 | ) | | (5,403 | ) | | (57,684 | ) |
| Amortization of in-place leases | (763 | ) | | — |
| | (763 | ) |
| Income (loss) from operations | $ | 161,432 |
| | $ | (1,085 | ) | | $ | 160,347 |
|
| Reconciliation to Consolidated net income: | | | | | |
| Corporate interest income | | | | | 47 |
|
| Income from other investments, net | | | | | 3,993 |
|
| General and administrative | | | | | (15,663 | ) |
| Property rights initiatives and other | | | | | (1,181 | ) |
| Interest and related amortization | | | | | (51,195 | ) |
| Equity in income of unconsolidated joint ventures | | | | | 1,646 |
|
| Consolidated net income | | | | | $ | 97,994 |
|
| | | | | | |
| Total assets | $ | 3,249,375 |
| | $ | 236,200 |
| | $ | 3,485,575 |
|
Six Months EndedJune 30, 2016 |
| | | | | | | | | | | |
| | Property Operations | | Home Sales and Rentals Operations | | Consolidated |
| Operations revenues | $ | 397,910 |
| | $ | 25,040 |
| | $ | 422,950 |
|
| Operations expenses | (184,887 | ) | | (22,507 | ) | | (207,394 | ) |
| Income from segment operations | 213,023 |
| | 2,533 |
| | 215,556 |
|
| Interest income | 1,453 |
| | 1,785 |
| | 3,238 |
|
| Depreciation on real estate assets and rental homes | (52,281 | ) | | (5,403 | ) | | (57,684 | ) |
| Amortization of in-place leases | (763 | ) | | — |
| | (763 | ) |
| Income (loss) from operations | $ | 161,432 |
| | $ | (1,085 | ) | | 160,347 |
|
| Reconciliation to Consolidated net income: | | | | | |
| Corporate interest income | | | | | 47 |
|
| Income from other investments, net | | | | | 3,993 |
|
| General and administrative | | | | | (15,663 | ) |
| Property rights initiatives and other | | | | | (1,181 | ) |
| Interest and related amortization | | | | | (51,195 | ) |
| Equity in income of unconsolidated joint ventures | | | | | 1,646 |
|
| Consolidated net income | | | | | $ | 97,994 |
|
| | | | | | |
| Total assets | $ | 3,249,375 |
| | $ | 236,200 |
| | $ | 3,485,575 |
|
| Capital improvements | $ | 37,551 |
| | $ | 30,984 |
| | $ | 55,707 |
|
Equity LifeStyle Properties, Inc.
Notes to Consolidated Financial Statements
Note 1310 - Segment Reporting (continued)Reportable Segments (Continued)
Six Months Ended June 30, 2015
|
| | | | | | | | | | | |
| | Property Operations | | Home Sales and Rentals Operations | | Consolidated |
| Operations revenues | $ | 378,814 |
| | $ | 24,227 |
| | $ | 403,041 |
|
| Operations expenses | (177,957 | ) | | (20,700 | ) | | (198,657 | ) |
| Income from segment operations | 200,857 |
| | 3,527 |
| | 204,384 |
|
| Interest income | 1,422 |
| | 2,089 |
| | 3,511 |
|
| Depreciation on real estate assets and rental homes | (50,965 | ) | | (5,486 | ) | | (56,451 | ) |
| Amortization of in-place leases | (1,334 | ) | | — |
| | (1,334 | ) |
| Income from operations | $ | 149,980 |
| | $ | 130 |
| | 150,110 |
|
| Reconciliation to Consolidated net income: | | | | | |
| Corporate interest income | | | | | 45 |
|
| Income from other investments, net | | | | | 3,297 |
|
| General and administrative | | | | | (14,947 | ) |
| Property rights initiatives and other | | | | | (1,247 | ) |
| Early debt retirement | | | | | (16,922 | ) |
| Interest and related amortization | | | | | (53,421 | ) |
| Equity in income of unconsolidated joint ventures | | | | | 1,724 |
|
| Consolidated net income | | | | | $ | 68,639 |
|
| | | | | | |
| Total assets | $ | 3,192,050 |
| | $ | 255,458 |
| | $ | 3,447,508 |
|
| Capital improvements | $ | 22,557 |
| | $ | 19,702 |
| | $ | 42,259 |
|
The following table summarizes our financial information for the Property Operations segment for the quarters and six months ended June 30, 20162017 and 20152016 (amounts in thousands):
|
| | | | | | | | | | | | | | | |
| | Quarters Ended | | Six Months Ended |
| | June 30,
2016 | | June 30,
2015 | | June 30,
2016 | | June 30,
2015 |
| Revenues: | | | | | | | |
| Community base rental income | $ | 115,385 |
| | $ | 110,073 |
| | $ | 229,461 |
| | $ | 219,343 |
|
| Resort base rental income | 44,732 |
| | 41,427 |
| | 100,166 |
| | 93,072 |
|
| Right-to-use annual payments | 11,187 |
| | 10,945 |
| | 22,241 |
| | 21,926 |
|
| Right-to-use contracts current period, gross | 3,086 |
| | 3,578 |
| | 5,618 |
| | 6,375 |
|
| Right-to-use contract upfront payments, deferred, net | (798 | ) | | (1,455 | ) | | (1,100 | ) | | (2,228 | ) |
| Utility and other income | 19,523 |
| | 18,901 |
| | 40,316 |
| | 37,983 |
|
| Ancillary services revenues, net | 69 |
| | 656 |
| | 1,208 |
| | 2,343 |
|
| Total property operations revenues | 193,184 |
| | 184,125 |
| | 397,910 |
| | 378,814 |
|
| Expenses: | | | | | | | |
| Property operating and maintenance | 66,647 |
| | 64,178 |
| | 129,601 |
| | 125,295 |
|
| Real estate taxes | 12,869 |
| | 12,652 |
| | 26,067 |
| | 25,246 |
|
| Sales and marketing, gross | 2,931 |
| | 3,512 |
| | 5,424 |
| | 6,034 |
|
| Right-to-use contract commissions, deferred, net | (116 | ) | | (764 | ) | | (12 | ) | | (1,007 | ) |
| Property management | 12,044 |
| | 11,099 |
| | 23,807 |
| | 22,389 |
|
| Total property operations expenses | 94,375 |
| | 90,677 |
| | 184,887 |
| | 177,957 |
|
| Income from property operations segment | $ | 98,809 |
| | $ | 93,448 |
| | $ | 213,023 |
| | $ | 200,857 |
|
Equity LifeStyle Properties, Inc.
Notes to Consolidated Financial Statements
Note 13 - Segment Reporting (continued)
|
| | | | | | | | | | | | | | | |
| | Quarters Ended | | Six Months Ended |
| | June 30,
2017 | | June 30,
2016 | | June 30,
2017 | | June 30,
2016 |
| Revenues: | | | | | | | |
| Community base rental income | $ | 121,964 |
| | $ | 115,385 |
| | $ | 242,656 |
| | $ | 229,461 |
|
| Resort base rental income | 50,055 |
| | 44,732 |
| | 111,123 |
| | 100,166 |
|
| Right-to-use annual payments | 11,350 |
| | 11,187 |
| | 22,602 |
| | 22,241 |
|
| Right-to-use contracts current period, gross | 3,798 |
| | 3,086 |
| | 7,004 |
| | 5,618 |
|
| Right-to-use contract upfront payments, deferred, net | (1,321 | ) | | (798 | ) | | (2,096 | ) | | (1,100 | ) |
| Utility and other income | 20,650 |
| | 19,523 |
| | 42,776 |
| | 40,316 |
|
| Ancillary services revenues, net | 98 |
| | 69 |
| | 1,517 |
| | 1,208 |
|
| Total property operations revenues | 206,594 |
| | 193,184 |
| | 425,582 |
| | 397,910 |
|
| Expenses: | | | | | | | |
| Property operating and maintenance | 72,901 |
| | 66,647 |
| | 140,955 |
| | 129,601 |
|
| Real estate taxes | 13,943 |
| | 12,869 |
| | 27,980 |
| | 26,067 |
|
| Sales and marketing, gross | 2,894 |
| | 2,931 |
| | 5,584 |
| | 5,424 |
|
| Right-to-use contract commissions, deferred, net | (112 | ) | | (116 | ) | | (196 | ) | | (12 | ) |
| Property management | 13,023 |
| | 12,044 |
| | 25,583 |
| | 23,807 |
|
| Total property operations expenses | 102,649 |
| | 94,375 |
| | 199,906 |
| | 184,887 |
|
| Income from property operations segment | $ | 103,945 |
| | $ | 98,809 |
| | $ | 225,676 |
| | $ | 213,023 |
|
The following table summarizes our financial information for the Home Sales and Rentals Operations segment for the quarters and six months ended June 30, 20162017 and 20152016 (amounts in thousands):
| | | | Quarters Ended | | Six Months Ended | Quarters Ended | | Six Months Ended |
June 30,
2016 | | June 30,
2015 | | June 30,
2016 | | June 30,
2015 | June 30,
2017 | | June 30,
2016 | | June 30,
2017 | | June 30,
2016 |
| Revenues: | | | | | | | | | | | | | | |
| Gross revenue from home sales | $ | 9,130 |
| | $ | 9,526 |
| | $ | 17,344 |
| | $ | 16,463 |
| $ | 7,833 |
| | $ | 9,130 |
| | $ | 14,860 |
| | $ | 17,344 |
|
| Brokered resale revenues, net | 329 |
| | 356 |
| | 608 |
| | 651 |
| 346 |
| | 329 |
| | 588 |
| | 608 |
|
Rental home income (a) | 3,543 |
| | 3,559 |
| | 7,088 |
| | 7,113 |
| 3,632 |
| | 3,543 |
| | 7,237 |
| | 7,088 |
|
| Total revenues | 13,002 |
| | 13,441 |
| | 25,040 |
| | 24,227 |
| 11,811 |
| | 13,002 |
| | 22,685 |
| | 25,040 |
|
| Expenses: | | | | | | | | | | | | | | |
| Cost of home sales | 9,481 |
| | 9,093 |
| | 17,762 |
| | 15,817 |
| 7,895 |
| | 9,481 |
| | 15,014 |
| | 17,762 |
|
| Home selling expenses | 805 |
| | 720 |
| | 1,639 |
| | 1,525 |
| 929 |
| | 805 |
| | 1,854 |
| | 1,639 |
|
| Rental home operating and maintenance | 1,581 |
| | 1,689 |
| | 3,106 |
| | 3,358 |
| 1,657 |
| | 1,581 |
| | 3,208 |
| | 3,106 |
|
| Total expenses | 11,867 |
| | 11,502 |
| | 22,507 |
| | 20,700 |
| 10,481 |
| | 11,867 |
| | 20,076 |
| | 22,507 |
|
| Income from home sales and rentals operations segment | $ | 1,135 |
| | $ | 1,939 |
| | $ | 2,533 |
| | $ | 3,527 |
| $ | 1,330 |
| | $ | 1,135 |
| | $ | 2,609 |
| | $ | 2,533 |
|
______________________
| |
(a) | Segment information does not include Site rental income included in Community base rental income. |
Item 2. Management’s Discussion and Analysis of Financial Condition and Results of Operations
The following discussion and analysis should be read in conjunction with the Consolidated Financial Statements and related Notes included elsewhere in this Quarterly Report on Form 10-Q and in our Annual Report on Form 10-K for the year ended December 31, 2016, and with the information under the heading "Management's Discussion and Analysis of Financial Condition and Results of Operations" in our Annual Report on Form 10-K for the year ended December 31, 2016.
Overview and Outlook
We are a self-administered, self-managed, real estate investment trust (“REIT”) with headquarters in Chicago, Illinois. We are a fully integrated owner and operator of lifestyle-oriented properties (“Properties”) consisting primarily of manufactured home ("MH") communities and recreational vehicle ("RV") resorts and campgrounds. We lease individual developed areas (“Sites”) with access to utilities for placement of factory built homes, cottages, cabins or RVs. Customers may lease individual Sites or enter right-to-use contracts providing the customer access to specific Properties for limited stays. As of June 30, 2016,2017, we owned or had an ownership interest in a portfolio of 390393 Properties located throughout the United States and Canada containing 145,804147,107 Sites. These properties are located in 32 states and British Columbia.
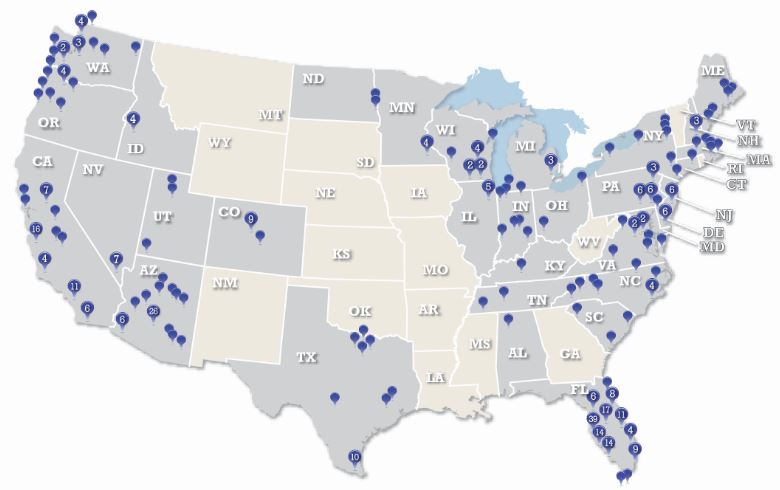
This Quarterly Report on Form 10-Q for the quarter ended June 30, 2016 includes certain “forward-looking statements”Columbia, with more than 80 Properties with lake, river or ocean frontage and more than 100 Properties within the meaning10 miles of the Private Securities Litigation Reform Act of 1995. When used, words such as “anticipate,” “expect,” “believe,” “project,” “intend,” “may be” and “will be” and similar words or phrases, orcoastal United States.
We generate the negative thereof, unless the context requires otherwise, are intended to identify forward-looking statements and may include without limitation, information regarding our expectations, goals or intentions regarding the future, and the expected effectmajority of our acquisitions. These forward-looking statements are subject to numerous assumptions, risks and uncertainties, including, but not limited to:
our ability to control costs, real estate market conditions, the actual rate of decline in customers, the actual use of Sites by customers and our success in acquiring new customers at our Properties (including those that we may acquire);
our ability to maintain historical or increase future rental rates and occupancy with respect to Properties currently owned or that we may acquire;
our ability to retain and attract customers renewing, upgrading and entering right-to-use contracts;
our assumptions about rental and home sales markets;
our ability to manage counterparty risk;
in the age-qualified Properties, home sales results could be impacted by the ability of potential home buyers to sell their existing residences as well as by financial, credit and capital markets volatility;
results from home sales and occupancy will continue to be impacted by local economic conditions, lack of affordable manufactured home financing and competition from alternative housing options including site-built single-family housing;
impact of government intervention to stabilize site-built single-family housing and not manufactured housing;
effective integration of recent acquisitions and our estimates regarding the future performance of recent acquisitions;
Management's Discussion (continued)
the completion of future transactions in their entirety, if any, and timing and effective integration with respect thereto;
unanticipated costs or unforeseen liabilities associated with recent acquisitions;
ability to obtain financing or refinance existing debt on favorable terms or at all;
the effect of interest rates;
the dilutive effects of issuing additional securities;
the effect of accounting for the entry of contracts with customers representing a right-to-use the Properties under the Codification Topic "Revenue Recognition;"
the outcome of pending or future lawsuits filed against us, including those disclosed in our filings with the Securities and Exchange Commission, by tenant groups seeking to limit rent increases and/or seeking large damage awards for our alleged failure to properly maintain certain Properties or other tenant related matters, such as the case currently pending in the California Court of Appeal, Sixth Appellate District, Case No. H041913, involving our California Hawaiian manufactured home property, including any further proceedings on appeal or in the trial court; and
other risks indicated from time to time in our filings with the Securities and Exchange Commission.
These forward-looking statements are based on management's present expectations and beliefs about future events. As with any projection or forecast, these statements are inherently susceptible to uncertainty and changes in circumstances. We are under no obligation to, and expressly disclaim any obligation to, update or alter our forward-looking statements whether as a result of such changes, new information, subsequent events or otherwise.
The following chart lists the Properties acquired or invested in since January 1, 2015 through June 30, 2016.
|
| | | | |
Property | Transaction Date | | Sites |
| | | |
Total Sites as of January 1, 2015 | | | 143,113 |
|
Property or Portfolio: | | | |
Acquisitions: | | | |
Bogue Pines | February 9, 2015 | | 150 |
|
Whispering Pines | February 9, 2015 | | 278 |
|
Miami Everglades | June 26, 2015 | | 303 |
|
Rose Bay | January 27, 2016 | | 303 |
|
Portland Fairview | May 26, 2016 | | 407 |
|
Forest Lake Estates | June 15, 2016 | | 1,168 |
|
Expansion Site Development and other: | | | |
Net Sites added (reconfigured) in 2015 | | | 94 |
|
Net Sites added (reconfigured) in 2016 | | | (12 | ) |
Total Sites as of June 30, 2016 | | | 145,804 |
|
| | | |
Our gross investment in real estate has increased approximately $140.0 million to $4,618 million as of June 30, 2016 from $4,478 million as of December 31, 2015 primarily due to the acquisition of Rose Bay, Portland Fairview and Forest Lake Estates as well as increased capital expenditures.
We actively seek to acquire and are currently engaged in various stages of negotiations relating to the possible acquisition of additional properties, which may include contracts outstanding to acquire such properties that are subject to the satisfactory completion of our due diligence review.
Occupancy in our Properties, as well as our ability to increase rental rates, directly affects revenues. Our revenue streams are predominantly derivedrevenues from customers renting our Sites, on a long-term basis. Some revenue streams are subjector entering into right-to-use contracts (also referred to seasonal fluctuations and accordingly, quarterly interim results may not be indicative of full fiscal year results.
Management's Discussion (continued)
The following table shows the breakdown ofas membership products) which provide our Sites by type.customers access to specific Properties for limited stays. Our MH community Sites and annual RV resort Sites are leased on an annual basis. Seasonal Sites are leased to customers generally for one to six months. Transient Sites are leased to customers on a short-term basis. The revenue from seasonal and transient Sites is generally higher during the first and third quarters. We consider the transient revenue stream to be our most volatile as it is subject to weather conditions and other factors affecting the marginal RV customer's vacation and travel preferences. Sites designated as right-to-use Sites are primarily utilized to service the approximately 104,800106,500 customers who have entered into right-to-use contracts.contracts (otherwise referred to as "memberships" or "membership dues"). We also have interests in joint venture Properties for which revenue is classified as Equity in income from unconsolidated joint ventures in the Consolidated Statements of Income and Comprehensive Income. The breakdown of our Sites by type are as follows (amounts are approximate):
|
| | |
| | Total Sites as of June 30, 20162017 |
| Community Sites | 71,00071,100 |
|
| Resort Sites: | |
| Annual | 26,30026,600 |
|
| Seasonal | 10,80011,200 |
|
| Transient | 10,500 |
|
Right-to-use (1) | 24,100 |
|
Joint Ventures (2) | 3,1003,600 |
|
| | 145,800147,100 |
|
_________________________
| |
(1) | Includes approximately 5,5005,700 Sites rented on an annual basis. |
| |
(2) | Joint ventures have approximately 2,2002,700 annual Sites, approximately 400 seasonal Sites and approximately 500 transient Sites.Sites and includes Crosswinds Mobile Home Park joint venture that we entered into during the quarter ended June 30, 2017. |
For the periods presented,
In our Core Portfolio (“Core Portfolio”) consists ofHome Sales and Rental Operations business our revenue streams include home sales, home rentals, brokerage services and ancillary activities. We generate revenue through home sales and rental operations by selling or leasing Site Set homes that are located in Properties owned and operated during the entire period. This measure is useful to investors for annual comparison as it removes the fluctuations associated with acquisitions, dispositions and significant transactions or unique situations, which are included in income from property operations, excluding deferrals and property management. For the quarter ended June 30, 2016, property operating revenues in our Core Portfolio, excluding deferrals, were up 4.2% and property operating expenses in our Core Portfolio, excluding deferrals and property management, were up 1.7%, resulting in an increase in Core net operating income before deferrals and property management of 6.1%.
Approximately one third of our rental agreements on community Sites have rent increases that are directly or indirectly connected to published CPI statistics that are issued from June through September of the year prior to the increase effective date. Approximately one half of those rental agreements have a CPI floor of approximately 3.0%.
State and local rent control regulations affect 27 Properties, including 19 of our 49 California Properties, all of our seven Delaware Properties and one of our five Massachusetts Properties. The impact of the rent control regulations is to limit our ability to implement rent increases based on prevailing market conditions. The regulations generally permit us to increase ratesmanaged by a percentage of the increase in the CPI, which may be national, regional or local, depending on the rent control ordinance. The limit on rent increases may range from 60% to 100% of CPI with certain maximum limits depending on the jurisdiction.
In the years following the disruption in the site-built housing market, our home sales business was negatively affected by our customers' inability to sell their existing site-built homes and relocate to their retirement destination. As a result, we focused on home rentals rather than sales as our primary source of occupancy upon turnover. As we managed and expanded our portfolio of rental homes, we placed homes in communities where we believed we could successfully sell homes as the market improved. At these Properties, we have been successful at selling homes and driving occupancy gains through increased home ownership. We continue to allocate capital to home purchases based on our assessment of market conditions and emphasize home sales. We continue to see population growth in our key markets, increased access to distribution channels for our products and a renewed willingness by our customers to commit to us for longer periods of time. We have also seen a decrease in homes coming back to us, which generally means that our residents have the opportunity to resell their homes to new residents. While we continue to focus on selling homes, we continue to evaluate rental units, and based on market conditions, we expect to invest in additional new homes for customer rentals.
us. We continue to focus on the qualityour rental operations, as we believe renting our vacant new homes may represent an attractive source of occupancy growth by increasingand the number of homeowners in our Core portfolio. As of June 30, 2016, we increased occupancy in our Core Portfolio by 271 Sites, which includedopportunity to convert to a gain of 377 homeowners. This compares to the first six months of 2015, during which occupancy increased by 306 Sites resulting from a gain of 758 homeowners.
Since 2013, we have experienced an increasenew homebuyer in the sales volume of newfuture. We also sell and used homes in our communities. We attribute this increase to various factors including management's focus on increasing the number of homeowners within our communities, changes to incentive structures for our on-site personnel to emphasize home sales rather than rentals and willingness of an increasing number of customers to commit their capital to purchase a home in one of our communities. New home sales in the manufactured home communities in our Core Portfolio during the six months ended June 30, 2016 increased by 72 new homes over the same
Management's Discussion (continued)
period in the prior year. The recent new home sales have been primarily in our California, Colorado and Florida communities. (See the Home Sales Operations tables in the sections below for additional detail regarding our home sales activity.)
In the ordinary course of business, we acquire used homes from customers through purchase, foreclosure of a lien, or abandonment. In a vibrant home sales market in which residents are able to resell their homes, we generally acquire fewerrent homes through foreclosure or abandonment. Used homes may require rehabilitation before renting them to new customers.
During 2013 we formed aour joint venture, ECHO Financing, LLC (the "ECHO JV"), with. We provide brokerage services to residents of our Properties who move from a home manufacturer to buyProperty but do not relocate their home. In addition, we operate ancillary activities at certain Properties, such as golf courses, pro shops, stores and sell homes, as well as to purchase loans made by an unaffiliated lender to purchasers of such homes at our Properties. The ECHO JV may also rent homes to customers in our communities. We also have a limited program under which we purchase loans made by an unaffiliated lender to purchasers of homes at our Properties.restaurants.
In the manufactured housing industry chattel financing options are limited. Financing options available today include community owner funded programs or third party lender programs that provide subsidized financing to customers and require the community owner to guarantee customer defaults. Third party lender programs have stringent underwriting criteria, sizable down payment requirements, short loan amortization and high interest rates. We have a limited program under which we purchase loans made by an unaffiliated lender to purchasers of homes at our Properties.
AsWe invest in Properties in sought-after locations near retirement and vacation destinations and urban areas across the United States with a focus on increasing operating cash flows. We seek growth in earnings, funds from operations ("FFO") and cash flows by enhancing the profitability and operation of our Properties and investments. We seek to accomplish this by attracting high quality customers to our Properties and retaining these customers who take pride in the Property and in their homes and efficiently
Management's Discussion (continued)
managing our Properties to increase operating margins by increasing occupancy, maintaining competitive market rents and controlling expenses.
We actively seek to acquire and are currently engaged in various stages of negotiations relating to the possible acquisition of additional properties, which may include contracts outstanding to acquire such properties that are subject to the satisfactory completion of our due diligence review.
In addition to Net income computed in accordance with GAAP, we assess and measure our overall financial and operating performance using certain Non-GAAP supplemental measures, which include: (i) FFO, (ii) Normalized funds from operations ("NFFO"), (iii) Income from property operations, (iv) Income from property operations, excluding deferrals and property management, (v) Core Portfolio income from property operations, excluding deferrals and property management, (operating results for properties owned and operated in both periods under comparison) and (vi) Income from rental operations, net of depreciation. We use these measures internally to evaluate the operating performance of our portfolio and provide a basis for comparison with other real estate companies. Definitions and reconciliations of these measures to the most comparable GAAP measures are included below in this discussion.
Results Overview
Net income available for Common Stockholders increased $4.0 million, to $39.5 million for the quarter ended June 30, 2016, we had 4,861 occupied rental homes in our MH communities. For2017, compared to $35.5 million for the quartersquarter ended June 30, 2016. Net income available for Common Stockholders increased $10.3 million, to $96.4 million for the six months ended June 30, 2017, compared to $86.1 million for the six months ended June 30, 2016. Both FFO per diluted share and NFFO per diluted share for the quarter ended June 30, 2017 were $0.81 compared to $0.75 for the quarter ended June 30, 2016 driven by improved Core and 2015, home rental program net operatingNon-Core income was approximately $8.3 millionfrom property operations. Both FFO per diluted share and $8.4 million, respectively, net of rental asset depreciation expense of approximately $2.7 million for both periods. Approximately $9.0 million and $9.2 million of home rental operations revenue was included in community base rental incomeNFFO per diluted share for the quarterssix months ended June 30, 2017 were $1.81 compared to $1.67 for the six months ended June 30, 2016.
For the quarter ended June 30, 2017 property operating revenues in our Core Portfolio, excluding deferrals, were up 5.5% and property operating expenses in our Core Portfolio, excluding deferrals and property management, were up 6.5% from the quarter ended June 30, 2016, resulting in an increase in our income from property operations before deferrals and 2015, respectively (seeproperty management of 4.8%, from the Rental Operations tables in the sections below for additional detail regarding our rental activity). We believe at this time we compete effectively with other types of rentals (i.e., apartments).
quarter ended June 30, 2016. For the six months ended June 30, 20162017 property operating revenues in our Core Portfolio, excluding deferrals, were up 4.9% and 2015, home rental program netproperty operating income was approximately $16.6 millionexpenses in our Core Portfolio, excluding deferrals and $17.0 million, respectively, net of rental asset depreciation expense of approximately $5.3 million and $5.4 million, respectively. Approximately $18.0 million and $18.6 million of home rental operations revenue was included in community base rental income forproperty management, were up 5.9% from the six months ended June 30, 2016, and 2015, respectively (see the Rental Operations tablesresulting in the sections below for additional detail regarding our rental activity).
In our RV resorts, we are focused on engaging with our existing customers and providing them the lifestyle they seek as well as attracting additional customers interestedan increase in our Properties. income from property operations before deferrals and property management of 4.3%, from the six months ended June 30, 2016.
We continue to focus on the quality of occupancy growth by increasing the number of manufactured homeowners in our Core Portfolio. Our Core Portfolio average occupancy consists of occupied home sites in our MH communities (both homeowners and renters) and was 94.2% for the quarter ended June 30, 2017, compared to 94.0% for the quarter ended March 31, 2017 and 93.3% for the quarter ended June 30, 2016. During the quarter ended June 30, 2017, we increased occupancy of manufactured homes within our Core Portfolio by 114 sites with an increase in homeowner occupancy of 204 sites compared to occupancy as of March 31, 2017. By comparison, as of June 30, 2016, our Core Portfolio occupancy increased 128 sites with an increase in homeowner occupancy of 229 sites compared to occupancy at March 31, 2016.
We continue to experience growth in revenues in our annual revenuesCore RV Portfolio as a result of our ability to increase rental rates and occupancy. Our second quarterRV revenues in our Core Portfolio annual revenuesfor the quarter ended June 30, 2017 were 5.0%8.1% higher than the second quarter ended June 30, 2016. Annual, seasonal and transient revenues for the quarter ended June 30, 2017 increased 6.0%, 13.7% and 12.3%, respectively, from the quarter ended June 30, 2016. RV revenues in our Core Portfolio for the six months ended June 30, 2017 were 5.3% higher than the six months ended June 30, 2016. Annual, seasonal and transient revenues for the six months ended June 30, 2017 increased 5.3%, 3.8% and 6.7%, respectively, from the six months ended June 30, 2016.
We continue to offer the Thousand Trails Camping Pass (“TTC”) and as a customer acquisition tool we have relationships with a network of last year. We believe our customer base is loyalRV dealers to provide them with a free one-year TTC membership to give to their customers in connection with the purchase of an RV. During the quarter ended June 30, 2017 online TTC sales increased 45% from the quarter ended June 30, 2016. During the quarter ended June 30, 2017 we sold approximately 4,700 TTCs and engaged inactivated approximately 5,700 RV dealer TTCs. For the lifestylesix months ended June 30, 2017 we offer at our Properties. We have annual customers who have stayed with us for more than ten yearssold approximately 7,300 TTCs and our member base includes members who have camped with us for more than twenty years. activated approximately 9,200 RV dealer TTCs.
Our social media presence has increasedcontinues to increase within this memberour RV customer base and we have also beencontinue to be successful at providing a venue for our customers to promote our Properties by encouraging them to share their memories of their adventuresexperiences at our resorts. We believe this is an important factor in a customer's decision to relocate. Our customers continue to increase the amount of time spent shopping online for their home and vacation decisions. We have also expanded our marketing efforts to reach approximately 40 million outdoor enthusiasts (according to the 2014 American Camper Report) to inform them about our product offerings.
For our membership based RV resorts, we offer low-cost membership products that focus on the installed base of approximately nine million RV owners. Such products include right-to-use contracts that entitle the customer to use certain Properties. We are offering a Thousand Trails Camping Pass (“TTC”) (formerly Zone Park Pass), which can be purchased for one to five geographic areas of the United States and requires an annual payment of $545. A single zone TTC requires no additional upfront payment while additional zones may be purchased for modest additional upfront payments. Since the introduction of low-cost membership products,Year-over-year we have entered into approximately 91,700 TTCs. Our renewal rate for these memberships is approximately 45.1%seen an increase in social media fans of 30%.
We have arranged with RV dealers to feature Through our TTC as part of the dealers’ sales andsummer marketing efforts. We provide the dealer with a TTC membership to give to their customers in connection with the purchase of an RV. No cash is received from the member during the first year of membership for memberships activated through the RV dealer program. Since inception,campaigns, we have activated 37,548 TTCs through the RV dealer program. Our renewal rate for these RV dealer memberships is approximately 18.0%.
Management's Discussion (continued)
The table below provides additional details regardingincreased the awareness of our TTCs:
|
| | | | | | | | | | | | | | |
| | Years Ended December 31, | | Six Months Ended June 30, |
| | 2012 | | 2013 | | 2014 | | 2015 | | 2016 |
| TTC Origination | 10,198 |
| | 15,607 |
| | 18,187 |
| | 25,544 |
| | 14,723 |
|
| TTC Sales | 8,909 |
| | 9,289 |
| | 10,014 |
| | 11,877 |
| | 6,622 |
|
| RV Dealer TTC Activations | 1,289 |
| | 6,318 |
| | 8,173 |
| | 13,667 |
| | 8,101 |
|
Existingproduct offering and our customers are eligibleincreasingly choosing the web as a vehicle to upgrade their right-to-use contract from time-to-time. An upgrade is distinguishable from atransact with us.
We continue to see high demand for our homes and communities. We closed 120 new right-to-use contract that a customer would enter by, depending onhome sales in the type of upgrade, offering (1) increased length of consecutive stay by 50% (i.e., upquarter ended June 30, 2017 compared to 21 days); (2) ability180 during the quarter ended June 30, 2016 and 240 new home sales in the six months ended June 30, 2017 compared to make earlier advance reservations; (3) discounts on rental units; (4) access to additional Properties, which may include use of Sites at non-membership RV resorts and (5) membership in discount travel programs. Each upgrade contract requires a nonrefundable upfront payment. For certain customers, we finance the nonrefundable upfront payment of these upgrades.
Critical Accounting Policies and Estimates
Refer to the 2015 Form 10-K for a discussion of our critical accounting policies, which includes impairment of real estate assets and investments, revenue recognition and business combinations. There have been no changes to these policies301 during the six months ended June 30, 2016. The new home sales during the quarter and six months ended June 30, 2017 were primarily in our Florida and Colorado communities.
SupplementalAs of June 30, 2017, we had 4,674 occupied rental homes in our MH communities. For the quarters ended June 30, 2017 and 2016, home rental program net operating income was approximately $8.2 million and $8.3 million, respectively, net of rental asset depreciation expense of approximately $2.6 million for the quarter ended June 30, 2017 and $2.7 million for the quarter ended June 30, 2016. Approximately $8.8 million and $9.0 million of home rental operations revenue was included in community base rental income for the quarters ended June 30, 2017 and June 30, 2016, respectively. For the six months ended June 30, 2017 and 2016, home rental program net operating income was approximately $16.4 million and $16.8 million, respectively, net of rental asset depreciation expense of approximately $5.3 million for both the six months ended June 30, 2017 and six months ended June 30, 2016. Approximately $17.7 million and $18.1 million of home rental operations revenue was included in community base rental income for the six months ended June 30, 2017 and six months ended June 30, 2016, respectively.
On May 10, 2017, we completed the acquisition of Paradise Park Largo, a 108-site manufactured home community located in Largo, Florida for a purchase price of approximately $8.0 million. Our gross investment in real estate has increased approximately $46.3 million to $4,731.6 million as of June 30, 2017 from $4,685.3 million as of December 31, 2016 primarily due to the acquisition of Paradise Park Largo and increased capital expenditures.
The following chart lists both the Properties acquired or invested in from January 1, 2016 through June 30, 2017, which represents our Non-Core Portfolio; and Sites added through expansion opportunities at our existing Properties.
|
| | | | | | | | | |
| Property | | Location | | Type of Property | | Transaction Date | | Sites |
| | | | | | | | |
| Total Sites as of January 1, 2016 | | | | | | | | 143,938 |
|
| Acquisitions: | | | | | | | | |
| Rose Bay | | Port Orange, Florida | | RV | | January 27, 2016 | | 303 |
|
| Portland Fairview | | Fairview, Oregon | | RV | | May 26, 2016 | | 407 |
|
| Forest Lake Estates | | Zephryhills, Florida | | RV, MH | | June 15, 2016 | | 1,168 |
|
| Riverside RV | | Arcadia, Florida | | RV | | October 13, 2016 | | 499 |
|
| Paradise Park Largo | | Largo, Florida | | MH | | May 10, 2017 | | 108 |
|
| Joint Venture: | | | | | | | | |
| Crosswinds | | St. Petersburg, Florida | | MH | | June 15, 2017 | | 376 |
|
| Expansion Site Development and other: | | | | | | | | |
| Net Sites added (reconfigured) in 2016 | | | | | | | | 295 |
|
| Net Sites added (reconfigured) in 2017 | | | | | | | | 13 |
|
| Total Sites as of June 30, 2017 | | | | | | | | 147,107 |
|
| | | | | | | | |
Non-GAAP Financial Measures
Management's discussionIncome from Property Operations and analysis of financial condition and results of operations include certain non-GAAP financial measures that in management's view of the business we believe are meaningful as they allow the investor the ability to understand key operating details of our business both with and without regard to certain accounting conventions or items that may not always be indicative of recurring annual cash flow of the portfolio. These non-GAAP financial measures as determined and presented by us may not be comparable to similarly titled measures reported by other companies, and includeCore Portfolio
We use Income from property operations Funds from Operations ("FFO") and Normalized Funds from Operations ("Normalized FFO"). We believe investors should review FFO, Normalized FFO and Income from property operations, along with GAAP netexcluding deferrals and property management and Core Portfolio income from property operations, excluding deferrals and cash flow fromproperty management, as alternative measures to evaluate the operating activities, investing activitiesresults of our manufactured home and financing activities, when evaluating an equity REIT’s operating performance. A discussion of FFO, Normalized FFO and a reconciliation to net income is included in the presentation of FFO following our "Results of Operations."
RV communities. Income from property operations, represents rental income, utility income and right-to-use income less property operating and maintenance expenses, real estate taxes,tax, sales and marketing expenses and property management expenses. We believe that Income from property operations, excluding deferrals and property management represents income from property operations excluding property management expenses and the impact of the GAAP deferral of right-to-use contract upfront payments and related commissions, net. Our Core Portfolio consists of our Properties owned and operated since December 31, 2015. Core Portfolio income from property operations, excluding deferrals and property management is useful to investors for annual comparison as it removes the fluctuations associated with acquisitions, dispositions and significant transactions or unique situations. Our Non-Core Portfolio (or Acquisitions) includes all Properties that were not owned and operated during 2016 and 2017.
Management's Discussion (continued)
Funds from Operations ("FFO") and Normalized Funds from Operations ("NFFO")
We define FFO as net income, computed in accordance with GAAP, excluding gains and actual or estimated losses from sales of properties, plus real estate related depreciation and amortization, impairments, if any, and after adjustments for unconsolidated partnerships and joint ventures. Adjustments for unconsolidated partnerships and joint ventures are calculated to reflect FFO on the same basis. We compute FFO in accordance with our interpretation of standards established by the National Association of Real Estate Investment Trusts (“NAREIT”), which may not be comparable to FFO reported by other REITs that do not define the term in accordance with the current NAREIT definition or that interpret the current NAREIT definition differently than we do. We receive up-front non-refundable payments from the entry of right-to-use contracts. In accordance with GAAP, the upfront non-refundable payments and related commissions are deferred and amortized over the estimated customer life. Although the NAREIT definition of FFO does not address the treatment of non-refundable right-to-use payments, we believe that it is appropriate to adjust for the impact of the deferral activity in our calculation of FFO.
We define NFFO as FFO excluding the following non-operating income and expense items: a) the financial impact of contingent consideration; b) gains and losses from early debt extinguishment, including prepayment penalties and defeasance costs; c) property acquisition and other transaction costs related to mergers and acquisitions; and d) other miscellaneous non-comparable items. NFFO presented herein is not necessarily comparable to NFFO presented by other real estate companies due to the fact that not all real estate companies use the same methodology for computing this amount.
We believe that FFO and Normalized FFO are helpful to investors as supplemental measures of the performance of an equity REIT. We believe that by excluding the effect of depreciation, amortization, impairments, if any, and actual or estimated gains or losses from sales of real estate, all of which are based on historical costs and which may be of limited relevance in evaluating current performance, FFO can facilitate comparisons of operating performance between periods and among other equity REITs. We further believe that Normalized FFO provides useful information to investors, analysts and our management because it allows them to compare our operating performance to the operating performance of other real estate companies and between periods on a consistent basis without having to account for differences not related to our operations. For example, we believe that excluding the early extinguishment of debt, property acquisition and other transaction costs related to mergers and acquisitions from NFFO allows investors, analysts and our management to assess the sustainability of operating performance in future periods because these costs do not affect the future operations of the properties. In some cases, we provide information about identified non-cash components of FFO and NFFO because it allows investors, analysts and our management to assess the impact of those items.
Income from Rental Operations, Net of Depreciation
We use Income from rental operations, net of depreciation as aan alternative measure ofto evaluate the operating results of our manufactured home rental program. Income from rental operations, net of depreciation, represents income from rental operations less depreciation expense on rental homes. We believe this measure is meaningful for investors as it provides a complete picture of the home rental program operating results including the impact of depreciation which affects our home rental program investment decisions.
Our definitions and RV communities.calculations of these non-GAAP financial and operating measures and other terms may differ from the definitions and methodologies used by other REITs and, accordingly, may not be comparable. These non-GAAP financial and operating measures do not represent cash generated from operating activities in accordance with GAAP, nor do they represent cash available to pay distributions and should not be considered as an alternative to net income, determined in accordance with GAAP, as an indication of our financial performance, or to cash flow from operating activities, determined in accordance with GAAP, as a measure of our liquidity, nor is it indicative of funds available to fund our cash needs, including our ability to make cash distributions.
Management's Discussion (continued)
The following table reconciles Income before equity inNet income of unconsolidated joint venturesavailable for Common Stockholders to incomeIncome from property operations for the quarters and six months ended June 30, 20162017 and 2015June 30, 2016 (amounts in thousands):
| | | | | Total Portfolio | | Quarters ended
June 30, | | Six Months Ended
June 30, |
| | | Quarters Ended | | Six Months Ended | | 2017 | | 2016 | | 2017 | | 2016 |
| | | June 30,
2016 | | June 30,
2015 | | June 30,
2016 | | June 30,
2015 | |
| Computation of Income from Property Operations: | | | | | | | | | |
| Net income available for Common Stockholders | | | $ | 39,498 |
| | $ | 35,490 |
| | $ | 96,385 |
| | $ | 86,073 |
|
| Series C Redeemable Perpetual Preferred Stock Dividends | | | 2,316 |
| | 2,316 |
| | 4,613 |
| | 4,613 |
|
| Income allocated to non-controlling interests - Common OP Units | | | 2,649 |
| | 2,998 |
| | 6,539 |
| | 7,308 |
|
| Equity in income of unconsolidated joint ventures | | | (1,040 | ) | | (765 | ) | | (2,190 | ) | | (1,646 | ) |
| Income before equity in income of unconsolidated joint ventures | | | 43,423 |
| | 40,039 |
| | 105,347 |
| | 96,348 |
|
| Total other expenses, net | | | 61,852 |
| | 59,905 |
| | 122,938 |
| | 119,208 |
|
| Income from home sales operations and other | | | 547 |
| | 758 |
| | (97 | ) | | 241 |
|
| Income from property operations | | $ | 100,702 |
| | $ | 94,662 |
| | $ | 215,797 |
| | $ | 202,269 |
| | $ | 105,822 |
| | $ | 100,702 |
| | $ | 228,188 |
| | $ | 215,797 |
|
| (Loss) income from home sales operations and other | | (758 | ) | | 725 |
| | (241 | ) | | 2,115 |
| |
| Total other income and expenses, net | | (59,905 | ) | | (59,401 | ) | | (119,208 | ) | | (137,469 | ) | |
| Income before equity in income of unconsolidated joint ventures | | $ | 40,039 |
| | $ | 35,986 |
| | $ | 96,348 |
| | $ | 66,915 |
| |
The following table presents a calculation of FFO available for Common Stock and OP Unit holders and Normalized FFO available for Common Stock and OP Unit holders for the quarters and six months ended June 30, 2017 and June 30, 2016 (amounts in thousands):
|
| | | | | | | | | | | | | | | | |
| | | Quarters ended
June 30, | | Six Months Ended
June 30, |
| | | 2017 | | 2016 | | 2017 | | 2016 |
| Computation of FFO and Normalized FFO: | | | | | | | | |
| Net income available for Common Stockholders | | $ | 39,498 |
| | $ | 35,490 |
| | $ | 96,385 |
| | $ | 86,073 |
|
| Income allocated to common OP units | | 2,649 |
| | 2,998 |
| | 6,539 |
| | 7,308 |
|
| Right-to-use contract upfront payments, deferred, net | | 1,321 |
| | 798 |
| | 2,096 |
| | 1,100 |
|
| Right-to-use contract commissions, deferred, net | | (112 | ) | | (116 | ) | | (196 | ) | | (12 | ) |
| Depreciation on real estate assets | | 27,608 |
| | 26,362 |
| | 55,061 |
| | 52,370 |
|
| Depreciation on rental homes | | 2,639 |
| | 2,667 |
| | 5,296 |
| | 5,314 |
|
| Amortization of in-place leases | | 958 |
| | 428 |
| | 1,990 |
| | 763 |
|
| Depreciation on unconsolidated joint ventures | | 364 |
| | 305 |
| | 811 |
| | 595 |
|
| FFO available for Common Stock and OP Unit holders | | 74,925 |
| | 68,932 |
| | 167,982 |
| | 153,511 |
|
| Transaction costs | | 220 |
| | 398 |
| | 324 |
| | 598 |
|
| Normalized FFO available for Common Stock and OP Unit holders | | $ | 75,145 |
| | $ | 69,330 |
| | $ | 168,306 |
| | $ | 154,109 |
|
| Weighted average Common Shares outstanding – fully diluted | | 93,063 |
| | 92,264 |
| | 93,041 |
| | 92,163 |
|
Management's Discussion (continued)
Management's Discussion (continued)
Results of Operations
Comparison of the Quarter Ended June 30, 20162017 to the Quarter Ended June 30, 20152016
Income from Property Operations
The following table summarizes certain financial and statistical data for the Core Portfolio and the total portfolio for the quarters ended June 30, 20162017 and 20152016 (amounts in thousands). The Core Portfolio may change from time-to-time depending on acquisitions, dispositions and significant transactions or unique situations. The Core Portfolio in this Form 10-Qdiscussion includes all Properties acquired prior toon or before December 31, 20142015 and which we have owned and operated continuously since January 1, 20152016. Core Portfolio growth percentages exclude the impact of GAAP deferrals of upfront payments from right-to-use contracts and related commissions.
| | | | Core Portfolio | | Total Portfolio | Core Portfolio | | Total Portfolio |
| | 2016 | | 2015 | | Variance | | % Change | | 2016 | | 2015 | | Variance | | % Change | 2017 | | 2016 | | Variance | | % Change | | 2017 | | 2016 | | Variance | | % Change |
| Community base rental income | $ | 115,079 |
| | $ | 109,957 |
| | $ | 5,122 |
| | 4.7 | % | | $ | 115,385 |
| | $ | 110,073 |
| | $ | 5,312 |
| | 4.8 | % | $ | 120,699 |
| | $ | 115,188 |
| | $ | 5,511 |
| | 4.8 | % | | $ | 121,964 |
| | $ | 115,385 |
| | $ | 6,579 |
| | 5.7 | % |
| Rental home income | 3,543 |
| | 3,559 |
| | (16 | ) | | (0.4 | )% | | 3,543 |
| | 3,559 |
| | (16 | ) | | (0.4 | )% | 3,632 |
| | 3,543 |
| | 89 |
| | 2.5 | % | | 3,632 |
| | 3,543 |
| | 89 |
| | 2.5 | % |
| Resort base rental income | 43,670 |
| | 41,203 |
| | 2,467 |
| | 6.0 | % | | 44,732 |
| | 41,427 |
| | 3,305 |
| | 8.0 | % | 47,753 |
| | 44,173 |
| | 3,580 |
| | 8.1 | % | | 50,055 |
| | 44,732 |
| | 5,323 |
| | 11.9 | % |
| Right-to-use annual payments | 11,187 |
| | 10,945 |
| | 242 |
| | 2.2 | % | | 11,187 |
| | 10,945 |
| | 242 |
| | 2.2 | % | 11,350 |
| | 11,187 |
| | 163 |
| | 1.5 | % | | 11,350 |
| | 11,187 |
| | 163 |
| | 1.5 | % |
| Right-to-use contracts current period, gross | 3,086 |
| | 3,578 |
| | (492 | ) | | (13.8 | )% | | 3,086 |
| | 3,578 |
| | (492 | ) | | (13.8 | )% | 3,798 |
| | 3,086 |
| | 712 |
| | 23.1 | % | | 3,798 |
| | 3,086 |
| | 712 |
| | 23.1 | % |
| Utility and other income | 19,381 |
| | 18,876 |
| | 505 |
| | 2.7 | % | | 19,523 |
| | 18,901 |
| | 622 |
| | 3.3 | % | 20,319 |
| | 19,468 |
| | 851 |
| | 4.4 | % | | 20,650 |
| | 19,523 |
| | 1,127 |
| | 5.8 | % |
| Property operating revenues, excluding deferrals | 195,946 |
| | 188,118 |
| | 7,828 |
| | 4.2 | % | | 197,456 |
| | 188,483 |
| | 8,973 |
| | 4.8 | % | 207,551 |
| | 196,645 |
| | 10,906 |
| | 5.5 | % | | 211,449 |
| | 197,456 |
| | 13,993 |
| | 7.1 | % |
| | | | | | | | | | | | | | | |
|
| | | | | | | | | | | | | | |
|
|
| Property operating and maintenance | 65,978 |
| | 64,005 |
| | 1,973 |
| | 3.1 | % | | 66,647 |
| | 64,178 |
| | 2,469 |
| | 3.8 | % | 71,096 |
| | 66,363 |
| | 4,733 |
| | 7.1 | % | | 72,901 |
| | 66,647 |
| | 6,254 |
| | 9.4 | % |
| Rental home operating and maintenance | 1,581 |
| | 1,689 |
| | (108 | ) | | (6.4 | )% | | 1,581 |
| | 1,689 |
| | (108 | ) | | (6.4 | )% | 1,657 |
| | 1,581 |
| | 76 |
| | 4.8 | % | | 1,657 |
| | 1,581 |
| | 76 |
| | 4.8 | % |
| Real estate taxes | 12,746 |
| | 12,640 |
| | 106 |
| | 0.8 | % | | 12,869 |
| | 12,652 |
| | 217 |
| | 1.7 | % | 13,462 |
| | 12,781 |
| | 681 |
| | 5.3 | % | | 13,943 |
| | 12,869 |
| | 1,074 |
| | 8.3 | % |
| Sales and marketing, gross | 2,931 |
| | 3,512 |
| | (581 | ) | | (16.5 | )% | | 2,931 |
| | 3,512 |
| | (581 | ) | | (16.5 | )% | 2,894 |
| | 2,931 |
| | (37 | ) | | (1.3 | )% | | 2,894 |
| | 2,931 |
| | (37 | ) | | (1.3 | )% |
| Property operating expenses, excluding deferrals and Property management | 83,236 |
| | 81,846 |
| | 1,390 |
| | 1.7 | % | | 84,028 |
| | 82,031 |
| | 1,997 |
| | 2.4 | % | 89,109 |
| | 83,656 |
| | 5,453 |
| | 6.5 | % | | 91,395 |
| | 84,028 |
| | 7,367 |
| | 8.8 | % |
Income from property operations, excluding deferrals and Property management (1) | 112,710 |
| | 106,272 |
| | 6,438 |
| | 6.1 | % | | 113,428 |
| | 106,452 |
| | 6,976 |
| | 6.6 | % | 118,442 |
| | 112,989 |
| | 5,453 |
| | 4.8 | % | | 120,054 |
| | 113,428 |
| | 6,626 |
| | 5.8 | % |
| Property management | 12,044 |
| | 11,099 |
| | 945 |
| | 8.5 | % | | 12,044 |
| | 11,099 |
| | 945 |
| | 8.5 | % | 13,023 |
| | 12,044 |
| | 979 |
| | 8.1 | % | | 13,023 |
| | 12,044 |
| | 979 |
| | 8.1 | % |
Income from property operations, excluding deferrals (1) | 100,666 |
| | 95,173 |
| | 5,493 |
| | 5.8 | % | | 101,384 |
| | 95,353 |
| | 6,031 |
| | 6.3 | % | 105,419 |
| | 100,945 |
| | 4,474 |
| | 4.4 | % | | 107,031 |
| | 101,384 |
| | 5,647 |
| | 5.6 | % |
| Right-to-use contracts, deferred and sales and marketing, deferred, net | 682 |
| | 691 |
| | (9 | ) | | (1.3 | )% | | 682 |
| | 691 |
| | (9 | ) | | (1.3 | )% | 1,209 |
| | 682 |
| | 527 |
| | 77.3 | % | | 1,209 |
| | 682 |
| | 527 |
| | 77.3 | % |
Income from property operations (1) | $ | 99,984 |
| | $ | 94,482 |
| | $ | 5,502 |
| | 5.8 | % | | $ | 100,702 |
| | $ | 94,662 |
|
| $ | 6,040 |
| | 6.4 | % | $ | 104,210 |
| | $ | 100,263 |
| | $ | 3,947 |
| | 3.9 | % | | $ | 105,822 |
| | $ | 100,702 |
|
| $ | 5,120 |
| | 5.1 | % |
__________________________
(1) Non-GAAP measure.
The increase in total portfolioTotal Portfolio income from property operations, which includes recently acquired properties, is primarily due to increasesfor the quarter ended June 30, 2017 increased $5.1 million, or 5.1%, from the quarter ended June 30, 2016, driven by an increase of $3.9 million, or 3.9%, in our Core communityPortfolio income from property operations and a $1.2 million increase in our Non-Core income from property operations.
Property Operating Revenues
Community base rental income in our Core resort base rental income,Portfolio for the quarter ended June 30, 2017 increased utility and other property income, partially offset by decreases in membership sales and marketing expenses. The increase is partially offset by an overall increase in expenses, with the most significant increases relating to property payroll, repairs and maintenance and utility expense.
The $5.1$5.5 million, or 4.7%, increase in Core Portfolio community base rental income primarily4.8% from the quarter ended June 30, 2016, which reflects a 3.8%3.9% growth from rate increases and approximately 0.9% growth from occupancy gains. The average monthly base rentrental income per Site increased to approximately $611 for the quarter ended June 30, 2017 from approximately $588 for the quarter ended June 30, 2016 from approximately $567 for the corresponding quarter in 2015.2016. The average occupancy for the Core Portfolio increased to 93.4%94.2% for the quarter ended June 30, 20162017 from 92.5%93.3% for the corresponding quarter in 2015.
The increase in property operating and maintenance expenses was primarily driven by increased property payroll, repair and maintenance and utility expense. The increase in property payroll resulted from additional employees and 2016 salary increases, while the increase in repair and maintenance was largely due to extraordinary expenses, mainly due to excess water hauling expense as a result of significant rainfall in the South region, increased landscaping expenses and other extraordinary expenses.ended June 30, 2016.
Management's Discussion (continued)
Resort base rental income in our Core Portfolio for the quarter ended June 30, 2017 increased $3.6 million, or 8.1%, from the quarter ended June 30, 2016 primarily due to increased rates. Resort base rental income is comprised of the following (amounts in thousands):
| | | | Core Portfolio | | Total Portfolio | Core Portfolio | | Total Portfolio |
| | 2016 | | 2015 | | Variance | | % Change | | 2016 | | 2015 | | Variance | | % Change | 2017 | | 2016 | | Variance | | % Change | | 2017 | | 2016 | | Variance | | % Change |
| Annual | $ | 29,809 |
| | $ | 28,379 |
| | $ | 1,430 |
| | 5.0 | % | | $ | 30,360 |
| | $ | 28,547 |
| | $ | 1,813 |
| | 6.4 | % | $ | 31,884 |
| | $ | 30,089 |
| | $ | 1,795 |
| | 6.0 | % | | $ | 32,869 |
| | $ | 30,360 |
| | $ | 2,509 |
| | 8.3 | % |
| Seasonal | 3,845 |
| | 3,644 |
| | 201 |
| | 5.5 | % | | 4,114 |
| | 3,668 |
| | 446 |
| | 12.2 | % | 4,481 |
| | 3,942 |
| | 539 |
| | 13.7 | % | | 4,902 |
| | 4,114 |
| | 788 |
| | 19.2 | % |
| Transient | 10,016 |
| | 9,180 |
| | 836 |
| | 9.1 | % | | 10,258 |
| | 9,212 |
| | 1,046 |
| | 11.4 | % | 11,388 |
| | 10,142 |
| | 1,246 |
| | 12.3 | % | | 12,284 |
| | 10,258 |
| | 2,026 |
| | 19.8 | % |
| Resort base rental income | $ | 43,670 |
| | $ | 41,203 |
| | $ | 2,467 |
| | 6.0 | % | | $ | 44,732 |
| | $ | 41,427 |
| | $ | 3,305 |
| | 8.0 | % | $ | 47,753 |
| | $ | 44,173 |
| | $ | 3,580 |
| | 8.1 | % | | $ | 50,055 |
| | $ | 44,732 |
| | $ | 5,323 |
| | 11.9 | % |
Right-to-use contracts current period, gross, net of sales and marketing, gross, decreasedincreased by $0.7 million, primarily as a result of loweran increase in the average price per upgrade sale and a higher number of upgrade sales by our third party sales agent.during the quarter ended June 30, 2017 compared to the quarter ended June 30, 2016. During the quarter ended June 30, 2017 there were 635 upgrade sales with an average price per upgrade sale of $5,980. This compares to 626 upgrade sales with an average price per upgrade sale of $4,930. This compares to 757 upgrade sales with an average price per sale of $4,730 for$4,930 during the quarter ended June 30, 2015. This decrease in sales from our third party sales agent was partially offset by an increase in upgrade sales by our in-park staff as we continue to experience increased demand for our upgraded product from our newest TTC members.2016.
The increase in utility and other income is primarily due to proceeds of approximately $0.4insurance recovery revenue related to California storm events and increased electric, water, gas, and sewer income recovery.
Property Operating Expenses
Property operating expenses, excluding deferrals and property management, in our Core Portfolio for the quarter ended June 30, 2017 increased $5.5 million, or 6.5%, from the quarter ended June 30, 2016 primarily driven by an increase in utility expenses, property payroll and repairs and maintenance. The increase in utility expense was driven by increases in electric, sewer, and gas expenses, which is partially offset by an increase in utility income recovery. The increase in property payroll expense primarily resulted from 2017 salary increases. The increase in repairs and maintenance expense was primarily due to clean-up costs as a result of the land easement at a certain Property in Pennsylvania.California storm events.
Home Sales and Rental Operations
Home Sales and Other
The following table summarizes certain financial and statistical data for the Home Sales Operations for the quarters endedJune 30, 20162017 and 20152016 (amounts in thousands, except home sales volumes).
| | | | | 2016 | | 2015 | | Variance | | % Change | | 2017 | | 2016 | | Variance | | % Change |
Gross revenues from new home sales (1) | | $ | 6,044 |
| | $ | 5,355 |
| | $ | 689 |
| | 12.9 | % | | $ | 4,548 |
| | $ | 6,044 |
| | $ | (1,496 | ) | | (24.8 | )% |
Cost of new home sales (1) | | 6,246 |
| | 4,925 |
| | 1,321 |
| | 26.8 | % | | (4,419 | ) | | (6,246 | ) | | 1,827 |
| | 29.3 | % |
| Gross (loss) profit from new home sales | | (202 | ) | | 430 |
| | (632 | ) | | (147.0 | )% | |
| Gross profit (loss) from new home sales | | | 129 |
| | (202 | ) | | 331 |
| | 163.9 | % |
| | | | | | | | | | | | | | | | | |
| Gross revenues from used home sales | | 3,086 |
| | 4,171 |
| | (1,085 | ) | | (26.0 | )% | | 3,285 |
| | 3,086 |
| | 199 |
| | 6.4 | % |
| Cost of used home sales | | 3,235 |
| | 4,168 |
| | (933 | ) | | (22.4 | )% | | (3,476 | ) | | (3,235 | ) | | (241 | ) | | (7.4 | )% |
| Gross (loss) profit from used home sales | | (149 | ) | | 3 |
| | (152 | ) | | (5,066.7 | )% | |
| Loss from used home sales | | | (191 | ) | | (149 | ) | | (42 | ) | | (28.2 | )% |
| | | | | | | | | | | | | | | | | |
| Brokered resale revenues and ancillary services revenues, net | | 398 |
| | 1,012 |
| | (614 | ) | | (60.7 | )% | | 444 |
| | 398 |
| | 46 |
| | 11.6 | % |
| Home selling expenses | | 805 |
| | 720 |
| | 85 |
| | 11.8 | % | | (929 | ) | | (805 | ) | | (124 | ) | | (15.4 | )% |
| (Loss) income from home sales operations and other | | $ | (758 | ) | | $ | 725 |
| | $ | (1,483 | ) | | (204.6 | )% | |
| Loss from home sales and other | | | $ | (547 | ) | | $ | (758 | ) | | $ | 211 |
| | 27.8 | % |
| | | | | | | | | | | | | | | | | |
| Home sales volumes | | | | | | | | | | | | | | | | |
Total new home sales(2) | | 180 |
| | 143 |
| | 37 |
| | 25.9 | % | | 120 |
| | 180 |
| | (60 | ) | | (33.3 | )% |
| New Home Sales Volume - ECHO JV | | 63 |
| | 49 |
| | 14 |
| | 28.6 | % | | 41 |
| | 63 |
| | (22 | ) | | (34.9 | )% |
| Used home sales | | 342 |
| | 436 |
| | (94 | ) | | (21.6 | )% | | 338 |
| | 342 |
| | (4 | ) | | (1.2 | )% |
| Brokered home resales | | 217 |
| | 261 |
| | (44 | ) | | (16.9 | )% | | 252 |
| | 217 |
| | 35 |
| | 16.1 | % |
(1) New home sales gross revenues and costs of new home sales does not include the revenues and costs associated with our ECHO JV.
(2) Total new home sales volume includes home sales from our ECHO JV for the quarters ended June 30, 2016 and 2015, respectively.JV.
The decrease in income from home sales operations and other is primarily due to lower revenue from ancillary services, which includes retail sales at various Properties, as well as lower gross profits from new home sales.
Management's Discussion (continued)
Loss from home sales and other was $0.5 million and $0.8 million for the quarters ended June 30, 2017 and 2016, respectively. The decrease in loss from home sales and other from the quarter ended June 30, 2016 was primarily due to an increase in the gross profit from new home sales, partially offset by an increase in home selling expenses.
Rental Operations
The following table summarizes certain financial and statistical data for manufactured home Rental Operations for the quarters endedJune 30, 20162017 and 20152016 (amounts in thousands, except rental unit volumes).
| | | | | 2016 | | 2015 | | Variance | | % Change | | 2017 | | 2016 | | Variance | | % Change |
| Manufactured homes: | | | | | | | | | | | | | | | | |
| New Home | | $ | 6,332 |
| | $ | 5,173 |
| | $ | 1,159 |
| | 22.4 | % | | $ | 6,985 |
| | $ | 6,332 |
| | $ | 653 |
| | 10.3 | % |
| Used Home | | 6,198 |
| | 7,613 |
| | (1,415 | ) | | (18.6 | )% | | 5,483 |
| | 6,250 |
| | (767 | ) | | (12.3 | )% |
Rental operations revenue (1) | | 12,530 |
| | 12,786 |
| | (256 | ) | | (2.0 | )% | | 12,468 |
| | 12,582 |
| | (114 | ) | | (0.9 | )% |
| Rental home operating and maintenance | | 1,581 |
| | 1,689 |
| | (108 | ) | | (6.4 | )% | | (1,657 | ) | | (1,581 | ) | | (76 | ) | | (4.8 | )% |
| Income from rental operations | | 10,949 |
| | 11,097 |
| | (148 | ) | | (1.3 | )% | | 10,811 |
| | 11,001 |
| | (190 | ) | | (1.7 | )% |
Depreciation on rental homes (2) | | 2,667 |
| | 2,681 |
| | (14 | ) | | (0.5 | )% | | (2,639 | ) | | (2,667 | ) | | 28 |
| | 1.0 | % |
| Income from rental operations, net of depreciation | | $ | 8,282 |
| | $ | 8,416 |
| | $ | (134 | ) | | (1.6 | )% | | $ | 8,172 |
| | $ | 8,334 |
| | $ | (162 | ) | | (1.9 | )% |
| | | | | | | | | | | | | | | | | |
Gross investment in new manufactured home rental units (3) | | $ | 120,708 |
| | $ | 108,937 |
| | $ | 11,771 |
| | 10.8 | % | | $ | 129,868 |
| | $ | 120,708 |
| | $ | 9,160 |
| | 7.6 | % |
| Gross investment in used manufactured home rental units | | $ | 54,655 |
| | $ | 60,822 |
| | $ | (6,167 | ) | | (10.1 | )% | | $ | 48,182 |
| | $ | 54,675 |
| | $ | (6,493 | ) | | (11.9 | )% |
| | | | | | | | | | | | | | | | | |
| Net investment in new manufactured home rental units | | $ | 96,167 |
| | $ | 89,097 |
| | $ | 7,070 |
| | 7.9 | % | | $ | 104,710 |
| | $ | 99,428 |
| | $ | 5,282 |
| | 5.3 | % |
| Net investment in used manufactured home rental units | | $ | 30,375 |
| | $ | 42,443 |
| | $ | (12,068 | ) | | (28.4 | )% | | $ | 28,182 |
| | $ | 36,690 |
| | $ | (8,508 | ) | | (23.2 | )% |
| | | | | | | | | | | | | | | | | |
Number of occupied rentals – new, end of period (4) | | 2,267 |
| | 2,062 |
| | 205 |
| | 9.9 | % | | 2,517 |
| | 2,267 |
| | 250 |
| | 11.0 | % |
| Number of occupied rentals – used, end of period | | 2,594 |
| | 2,981 |
| | (387 | ) | | (13.0 | )% | | 2,157 |
| | 2,595 |
| | (438 | ) | | (16.9 | )% |
______________________
| |
(1) | Rental operations revenue consists of Site rental income and home rental income. Approximately $9.0$8.8 million and $9.2$9.0 million for the quarters ended June 30, 20162017 and 2015,2016, respectively, of Site rental income are included in Community base rental income in the Income from Property Operations table. The remainder of home rental income is included in Rental home income in the Income from Property Operations table. |
| |
(2) | Included in depreciation on real estate and other costs in the Consolidated Statements of Income and Comprehensive Income. |
| |
(3) | New home cost basis does not include the costs associated with our ECHO JV. Our investment in the ECHO JV was $15.4 million and $10.4 million at both June 30, 20162017 and 2015, respectively.December 31, 2016. |
| |
(4) | IncludesOccupied rentals as of the end of the period in our Core Portfolio and includes 257 and 143 and 65 homes rented through our ECHO JV during the quarters ended June 30, 20162017 and 2015,2016, respectively. |
The decrease in income from rental operations, isnet of depreciation, was primarily due to a decrease in the number of used occupied rental units. The occupancy decrease isunits, partially offset by the change in the mix of occupied rentals, driven by an increasedincrease in the number of occupied new rental homes at a higher rental rate.
Other Income and Expenses
The following table summarizes other income and expenses, net for the quarters ended June 30, 20162017 and 20152016 (amounts in thousands, expenses shown as negative).
| | | | | 2016 | | 2015 | | Variance | | % Change | | 2017 | | 2016 | | Variance | | % Change |
| Depreciation on real estate and rental homes | | $ | (29,029 | ) | | $ | (28,335 | ) | | $ | (694 | ) | | (2.4 | )% | | $ | (30,247 | ) | | $ | (29,029 | ) | | $ | (1,218 | ) | | (4.2 | )% |
| Amortization of in-place leases | | (428 | ) | | (669 | ) | | 241 |
| | 36.0 | % | | (958 | ) | | (428 | ) | | (530 | ) | | (123.8 | )% |
| Interest income | | 1,625 |
| | 1,736 |
| | (111 | ) | | (6.4 | )% | | 1,798 |
| | 1,625 |
| | 173 |
| | 10.6 | % |
| Income from other investments, net | | 2,270 |
| | 2,178 |
| | 92 |
| | 4.2 | % | | 1,109 |
| | 2,270 |
| | (1,161 | ) | | (51.1 | )% |
| General and administrative (excluding transaction costs) | | (7,857 | ) | | (7,491 | ) | | (366 | ) | | (4.9 | )% | | (8,241 | ) | | (7,857 | ) | | (384 | ) | | (4.9 | )% |
| Transaction costs | | (398 | ) | | (50 | ) | | (348 | ) | | (696.0 | )% | | (220 | ) | | (398 | ) | | 178 |
| | 44.7 | % |
| Property rights initiatives and other | | (527 | ) | | (694 | ) | | 167 |
| | 24.1 | % | | (271 | ) | | (527 | ) | | 256 |
| | 48.6 | % |
| Early debt retirement | | — |
| | 69 |
| | (69 | ) | | 100.0 | % | |
| Interest and related amortization | | (25,561 | ) | | (26,145 | ) | | 584 |
| | 2.2 | % | | (24,822 | ) | | (25,561 | ) | | 739 |
| | 2.9 | % |
| Total other income and expenses, net | | $ | (59,905 | ) | | $ | (59,401 | ) | | $ | (504 | ) | | (0.8 | )% | | $ | (61,852 | ) | | $ | (59,905 | ) | | $ | (1,947 | ) | | (3.3 | )% |
Depreciation
Other expenses, net increased $1.9 million for the quarter ended June 30, 2017, compared to the quarter ended June 30, 2016. The increase from the quarter ended June 30, 2016 was primarily due to an increase in depreciation on real estate and rental
Management's Discussion (continued)
homes increased primarilyand amortization of in-place leases due to increased capital expenditures2016 acquisition activity and a decrease in income from other investments, net, due to the acquisitions that occurredtermination of the Tropical Palms RV ground lease in 2016.
This was partially offset by a decrease in interest and related amortization as a result of the refinancing activities completed during the first half of 2016 (see Note 47 to the Consolidated Financial Statements for additional detail regarding our recent acquisition activity)borrowing arrangements).
A decrease in secured debt, resulting from the 2015 refinancing and prepayment activity, and lower weighted average interest rates contributed to the decrease in interest and related amortization.
Management's Discussion (continued)
Comparison of the Six Months Ended June 30, 20162017 to the Six Months Ended June 30, 20152016
Income from Property Operations
The following table summarizes certain financial and statistical data for the Core Portfolio and the total portfolio for the six months ended June 30, 20162017 and 20152016 (amounts in thousands). The Core Portfolio may change from time-to-time depending on acquisitions, dispositions and significant transactions or unique situations. The Core Portfolio in this Form 10-Qdiscussion includes all Properties acquired prior toon or before December 31, 20142015 and which we have owned and operated continuously since January 1, 2015.2016. Core Portfolio growth percentages exclude the impact of GAAP deferrals of upfront payments from right-to-use contracts and related commissions.
| | | | Core Portfolio | | Total Portfolio | Core Portfolio | | Total Portfolio |
| | 2016 | | 2015 | | Variance | | % Change | | 2016 | | 2015 | | Variance | | % Change | 2017 | | 2016 | | Variance | | % Change | | 2017 | | 2016 | �� | Variance | | % Change |
| Community base rental income | $ | 229,047 |
| | $ | 219,166 |
| | $ | 9,881 |
| | 4.5 | % | | $ | 229,461 |
| | $ | 219,343 |
| | $ | 10,118 |
| | 4.6 | % | $ | 240,278 |
| | $ | 229,264 |
| | $ | 11,014 |
| | 4.8 | % | | $ | 242,656 |
| | $ | 229,461 |
| | $ | 13,195 |
| | 5.8 | % |
| Rental home income | 7,088 |
| | 7,113 |
| | (25 | ) | | (0.4 | )% | | 7,088 |
| | 7,113 |
| | (25 | ) | | (0.4 | )% | 7,237 |
| | 7,089 |
| | 148 |
| | 2.1 | % | | 7,237 |
| | 7,088 |
| | 149 |
| | 2.1 | % |
| Resort base rental income | 97,941 |
| | 92,738 |
| | 5,203 |
| | 5.6 | % | | 100,166 |
| | 93,072 |
| | 7,094 |
| | 7.6 | % | 104,603 |
| | 99,380 |
| | 5,223 |
| | 5.3 | % | | 111,123 |
| | 100,166 |
| | 10,957 |
| | 10.9 | % |
| Right-to-use annual payments | 22,241 |
| | 21,926 |
| | 315 |
| | 1.4 | % | | 22,241 |
| | 21,926 |
| | 315 |
| | 1.4 | % | 22,602 |
| | 22,241 |
| | 361 |
| | 1.6 | % | | 22,602 |
| | 22,241 |
| | 361 |
| | 1.6 | % |
| Right-to-use contracts current period, gross | 5,618 |
| | 6,375 |
| | (757 | ) | | (11.9 | )% | | 5,618 |
| | 6,375 |
| | (757 | ) | | (11.9 | )% | 7,004 |
| | 5,618 |
| | 1,386 |
| | 24.7 | % | | 7,004 |
| | 5,618 |
| | 1,386 |
| | 24.7 | % |
| Utility and other income | 40,064 |
| | 37,947 |
| | 2,117 |
| | 5.6 | % | | 40,316 |
| | 37,983 |
| | 2,333 |
| | 6.1 | % | 42,003 |
| | 40,249 |
| | 1,754 |
| | 4.4 | % | | 42,776 |
| | 40,316 |
| | 2,460 |
| | 6.1 | % |
| Property operating revenues, excluding deferrals | 401,999 |
| | 385,265 |
| | 16,734 |
| | 4.3 | % | | 404,890 |
| | 385,812 |
| | 19,078 |
| | 4.9 | % | 423,727 |
| | 403,841 |
| | 19,886 |
| | 4.9 | % | | 433,398 |
| | 404,890 |
| | 28,508 |
| | 7.0 | % |
| | | | | | | | | | | | | | | |
|
| | | | | | |
|
| | | | | | | | |
| Property operating and maintenance | 128,405 |
| | 125,024 |
| | 3,381 |
| | 2.7 | % | | 129,601 |
| | 125,295 |
| | 4,306 |
| | 3.4 | % | 137,429 |
| | 129,186 |
| | 8,243 |
| | 6.4 | % | | 140,955 |
| | 129,601 |
| | 11,354 |
| | 8.8 | % |
| Rental home operating and maintenance | 3,106 |
| | 3,358 |
| | (252 | ) | | (7.5 | )% | | 3,106 |
| | 3,358 |
| | (252 | ) | | (7.5 | )% | 3,208 |
| | 3,105 |
| | 103 |
| | 3.3 | % | | 3,208 |
| | 3,106 |
| | 102 |
| | 3.3 | % |
| Real estate taxes | 25,886 |
| | 25,225 |
| | 661 |
| | 2.6 | % | | 26,067 |
| | 25,246 |
| | 821 |
| | 3.3 | % | 27,032 |
| | 25,957 |
| | 1,075 |
| | 4.1 | % | | 27,980 |
| | 26,067 |
| | 1,913 |
| | 7.3 | % |
| Sales and marketing, gross | 5,424 |
| | 6,034 |
| | (610 | ) | | (10.1 | )% | | 5,424 |
| | 6,034 |
| | (610 | ) | | (10.1 | )% | 5,583 |
| | 5,426 |
| | 157 |
| | 2.9 | % | | 5,584 |
| | 5,424 |
| | 160 |
| | 2.9 | % |
| Property operating expenses, excluding deferrals and Property management | 162,821 |
| | 159,641 |
| | 3,180 |
| | 2.0 | % | | 164,198 |
| | 159,933 |
| | 4,265 |
| | 2.7 | % | 173,252 |
| | 163,674 |
| | 9,578 |
| | 5.9 | % | | 177,727 |
| | 164,198 |
| | 13,529 |
| | 8.2 | % |
Income from property operations, excluding deferrals and Property management (1) | 239,178 |
| | 225,624 |
| | 13,554 |
| | 6.0 | % | | 240,692 |
| | 225,879 |
| | 14,813 |
| | 6.6 | % | 250,475 |
| | 240,167 |
| | 10,308 |
| | 4.3 | % | | 255,671 |
| | 240,692 |
| | 14,979 |
| | 6.2 | % |
| Property management | 23,807 |
| | 22,389 |
| | 1,418 |
| | 6.3 | % | | 23,807 |
| | 22,389 |
| | 1,418 |
| | 6.3 | % | 25,583 |
| | 23,807 |
| | 1,776 |
| | 7.5 | % | | 25,583 |
| | 23,807 |
| | 1,776 |
| | 7.5 | % |
Income from property operations, excluding deferrals (1) | 215,371 |
| | 203,235 |
| | 12,136 |
| | 6.0 | % | | 216,885 |
| | 203,490 |
| | 13,395 |
| | 6.6 | % | 224,892 |
| | 216,360 |
| | 8,532 |
| | 3.9 | % | | 230,088 |
| | 216,885 |
| | 13,203 |
| | 6.1 | % |
| Right-to-use contracts, deferred and sales and marketing, deferred, net | 1,088 |
| | 1,221 |
| | (133 | ) | | (10.9 | )% | | 1,088 |
| | 1,221 |
| | (133 | ) | | (10.9 | )% | 1,900 |
| | 1,088 |
| | 812 |
| | 74.6 | % | | 1,900 |
| | 1,088 |
| | 812 |
| | 74.6 | % |
Income from property operations (1) | $ | 214,283 |
| | $ | 202,014 |
| | $ | 12,269 |
| | 6.1 | % | | $ | 215,797 |
| | $ | 202,269 |
|
| $ | 13,528 |
| | 6.7 | % | $ | 222,992 |
| | $ | 215,272 |
| | $ | 7,720 |
| | 3.6 | % | | $ | 228,188 |
| | $ | 215,797 |
| | $ | 12,391 |
| | 5.7 | % |
__________________________
(1) Non-GAAP measure.
The increase in total portfolioTotal Portfolio income from property operations, which includes recently acquired properties, is primarily due to increasesfor the six months ended June 30, 2017 increased $12.4 million, or 5.7%, from the six months ended June 30, 2016, driven by an increase of $7.7 million, or 3.6%, in our Core communityPortfolio income from property operations and a $4.7 million increase in our Non-Core income from property operations.
Property Operating Revenues
Community base rental income in our Core resort base rental income as well asPortfolio for the six months ended June 30, 2017 increased utility and other property income. The increase is partially offset by an overall increase in expenses, with the most significant increases relating to repairs and maintenance, payroll and property taxes.
The $9.9$11.0 million, or 4.5%, increase in Core Portfolio community base rental income primarily4.8% from the six months ended June 30, 2016, which reflects a 3.7%3.9% growth from rate increases and a 0.8%approximately 0.9% growth from occupancy gains. The average monthly base rentrental income per Site increased to approximately $586 in 2016$608 for the six months ended June 30, 2017 from approximately $566$586 for the corresponding quarter in 2015.six months ended June 30, 2016. The average occupancy for the Core Portfolio increased to 94.1% for the six months ended June 30, 2017 from 93.2% in 2016 from 92.4% in 2015.
The increase in property operating and maintenance expenses was primarily driven by increased repair and maintenance, property payroll and utility expense. The increase in repair and maintenance was largely due to excess water hauling expense as a result of significant rainfall infor the South region, increased landscaping expenses, snow removal costs in the Northeast region and other extraordinary expenses, while the increase in property payroll resulted from additional employees and 2016 salary increases.six months ended June 30, 2016.
Management's Discussion (continued)
Resort base rental income in our Core Portfolio for the six months ended June 30, 2017 increased $5.2 million, or 5.3%, from the quarter ended June 30, 2016 primarily due to an increase in annual and transient revenues as a result of increased rates. Resort base rental income is comprised of the following (amounts in thousands):
| | | | Core Portfolio | | Total Portfolio | Core Portfolio | | Total Portfolio |
| | 2016 | | 2015 | | Variance | | % Change | | 2016 | | 2015 | | Variance | | % Change | 2017 | | 2016 | | Variance | | % Change | | 2017 | | 2016 | | Variance | | % Change |
| Annual | $ | 59,397 |
| | $ | 56,208 |
| | $ | 3,189 |
| | 5.7 | % | | $ | 60,370 |
| | $ | 56,475 |
| | $ | 3,895 |
| | 6.9 | % | $ | 63,123 |
| | $ | 59,953 |
| | $ | 3,170 |
| | 5.3 | % | | $ | 64,965 |
| | $ | 60,370 |
| | $ | 4,595 |
| | 7.6 | % |
| Seasonal | 19,676 |
| | 18,620 |
| | 1,056 |
| | 5.7 | % | | 20,329 |
| | 18,651 |
| | 1,678 |
| | 9.0 | % | 20,864 |
| | 20,100 |
| | 764 |
| | 3.8 | % | | 23,401 |
| | 20,329 |
| | 3,072 |
| | 15.1 | % |
| Transient | 18,868 |
| | 17,910 |
| | 958 |
| | 5.3 | % | | 19,467 |
| | 17,946 |
| | 1,521 |
| | 8.5 | % | 20,616 |
| | 19,327 |
| | 1,289 |
| | 6.7 | % | | 22,757 |
| | 19,467 |
| | 3,290 |
| | 16.9 | % |
| Resort base rental income | $ | 97,941 |
| | $ | 92,738 |
| | $ | 5,203 |
| | 5.6 | % | | $ | 100,166 |
| | $ | 93,072 |
| | $ | 7,094 |
| | 7.6 | % | $ | 104,603 |
| | $ | 99,380 |
| | $ | 5,223 |
| | 5.3 | % | | $ | 111,123 |
| | $ | 100,166 |
| | $ | 10,957 |
| | 10.9 | % |
Right-to-use contracts current period, gross, net of sales and marketing, gross, decreasedincreased by $1.4 million, primarily as a result of lowera higher average price per upgrade sale and higher upgrade sales by our third party sales agent.during the six months ended June 30, 2017 compared to the six months ended June 30, 2016. During the six months ended June 30, 2016,2017 there were 1,260 upgrade sales with an average price per upgrade sale of $5,557. This compares to 1,152 upgrade sales with an average price per upgrade sale of $4,877. This compares to 1,354 upgrade sales with an average price per sale of $4,710$4,877 for the six months ended ended June 30, 2015. This decrease in sales by our third party sales agent was partially offset by an increase in upgrade sales by our in-park staff as we continue to experience increased demand for our upgraded product from our newest TTC members.2016.
The increase in utility and other income is primarily due to insurance proceeds of approximately $0.8 millionrecovery revenue related to two priorCalifornia storm events that impacted certain propertiesand increased electric, water, gas, and sewer income recovery.
Property Operating Expenses
Property operating expenses, excluding deferrals and property management, in Californiaour Core Portfolio for the six months ended June 30, 2017 increased $9.6 million, or 5.9%, from the six months ended June 30, 2016. The increase was primarily due to an increase in utility expenses, property payroll and Floridarepairs and proceeds of approximately $0.4 millionmaintenance. The increase in utility expense was driven by increases in electric, sewer, trash and gas expenses, which was partially offset by increased utility income recovery. The increase in property payroll expense resulted from 2017 salary increases. The increase in repairs and maintenance expense was primarily due to clean-up costs as a result of California storm events and the land easement at a certain Propertyhurricanes in Pennsylvania.Florida in 2016, and an increase in landscaping costs.
Home Sales and Rental Operations
Home Sales and Other
The following table summarizes certain financial and statistical data for the Home Sales Operations for the six months ended June 30, 20162017 and 2015June 30, 2016 (amounts in thousands, except home sales volumes).
| | | | | 2016 | | 2015 | | Variance | | % Change | | 2017 | | 2016 | | Variance | | % Change |
Gross revenues from new home sales (1) | | $ | 11,443 |
| | $ | 8,285 |
| | $ | 3,158 |
| | 38.1 | % | | $ | 9,491 |
| | $ | 11,443 |
| | $ | (1,952 | ) | | (17.1 | )% |
Cost of new home sales (1) | | 11,698 |
| | 7,670 |
| | 4,028 |
| | 52.5 | % | | (9,191 | ) | | (11,698 | ) | | 2,507 |
| | 21.4 | % |
| Gross (loss) profit from new home sales | | (255 | ) | | 615 |
| | (870 | ) | | (141.5 | )% | |
| Gross profit (loss) from new home sales | | | 300 |
| | (255 | ) | | 555 |
| | 217.6 | % |
| | | | | | | | | | | | | | | | | |
| Gross revenues from used home sales | | 5,901 |
| | 8,178 |
| | (2,277 | ) | | (27.8 | )% | | 5,369 |
| | 5,901 |
| | (532 | ) | | (9.0 | )% |
| Cost of used home sales | | 6,064 |
| | 8,147 |
| | (2,083 | ) | | (25.6 | )% | | (5,823 | ) | | (6,064 | ) | | 241 |
| | 4.0 | % |
| Gross (loss) profit from used home sales | | (163 | ) | | 31 |
| | (194 | ) | | (625.8 | )% | |
| Loss from used home sales | | | (454 | ) | | (163 | ) | | (291 | ) | | (178.5 | )% |
| | | | | | | | | | | | | | | | | |
| Brokered resale revenues and ancillary services revenues, net | | 1,816 |
| | 2,994 |
| | (1,178 | ) | | (39.3 | )% | | 2,105 |
| | 1,816 |
| | 289 |
| | 15.9 | % |
| Home selling expenses | | 1,639 |
| | 1,525 |
| | 114 |
| | 7.5 | % | | (1,854 | ) | | (1,639 | ) | | (215 | ) | | (13.1 | )% |
| (Loss) income from home sales operations and other | | $ | (241 | ) | | $ | 2,115 |
| | $ | (2,356 | ) | | (111.4 | )% | |
| Income (loss) from home sales and other | | | $ | 97 |
| | $ | (241 | ) | | $ | 338 |
| | 140.2 | % |
| | | | | | | | | | | | | | | | | |
| Home sales volumes | | | | | | | | | | | | | | | | |
Total new home sales(2) | | 301 |
| | 229 |
| | 72 |
| | 31.4 | % | | 240 |
| | 301 |
| | (61 | ) | | (20.3 | )% |
| New Home Sales Volume - ECHO JV | | 97 |
| | 88 |
| | 9 |
| | 10.2 | % | | 78 |
| | 97 |
| | (19 | ) | | (19.6 | )% |
| Used home sales | | 653 |
| | 817 |
| | (164 | ) | | (20.1 | )% | | 623 |
| | 653 |
| | (30 | ) | | (4.6 | )% |
| Brokered home resales | | 403 |
| | 466 |
| | (63 | ) | | (13.5 | )% | | 420 |
| | 403 |
| | 17 |
| | 4.2 | % |
(1) New home sales gross revenues and costs of new home sales does not include the revenues and costs associated with our ECHO JV.
(2) Total new home sales volume includes home sales from our ECHO JV for the six months ended June 30, 20162017 and 2015,June 30, 2016, respectively.
Management's Discussion (continued)
The decreaseincrease in income from home sales operations and other iswas primarily due to lower revenue from ancillary services, which includes retail sales at various Properties, as well as loweran increase in the gross profitsprofit from new home sales, partially offset by an increase in the loss from used home sales.
Management's Discussion (continued)
Rental Operations
The following table summarizes certain financial and statistical data for manufactured home Rental Operations for the six months ended June 30, 20162017 and 2015June 30, 2016 (amounts in thousands, except rental unit volumes).
| | | | | 2016 | | 2015 | | Variance | | % Change | | 2017 | | 2016 | | Variance | | % Change |
| Manufactured homes: | | | | | | | | | | | | | | | | |
| New Home | | $ | 12,473 |
| | $ | 10,310 |
| | $ | 2,163 |
| | 21.0 | % | | $ | 13,618 |
| | $ | 12,473 |
| | $ | 1,145 |
| | 9.2 | % |
| Used Home | | 12,588 |
| | 15,427 |
| | (2,839 | ) | | (18.4 | )% | | 11,267 |
| | 12,715 |
| | (1,448 | ) | | (11.4 | )% |
Rental operations revenue (1) | | 25,061 |
| | 25,737 |
| | (676 | ) | | (2.6 | )% | | 24,885 |
| | 25,188 |
| | (303 | ) | | (1.2 | )% |
| Rental home operating and maintenance | | 3,106 |
| | 3,358 |
| | (252 | ) | | (7.5 | )% | | (3,208 | ) | | (3,106 | ) | | (102 | ) | | (3.3 | )% |
| Income from rental operations | | 21,955 |
| | 22,379 |
| | (424 | ) | | (1.9 | )% | | 21,677 |
| | 22,082 |
| | (405 | ) | | (1.8 | )% |
Depreciation on rental homes (2) | | 5,314 |
| | 5,387 |
| | (73 | ) | | (1.4 | )% | | (5,296 | ) | | (5,314 | ) | | 18 |
| | 0.3 | % |
| Income from rental operations, net of depreciation | | $ | 16,641 |
| | $ | 16,992 |
| | $ | (351 | ) | | (2.1 | )% | | $ | 16,381 |
| | $ | 16,768 |
| | $ | (387 | ) | | (2.3 | )% |
| | | | | | | | | | | | | | | | | |
Gross investment in new manufactured home rental units (3) | | $ | 120,708 |
| | $ | 108,937 |
| | $ | 11,771 |
| | 10.8 | % | | $ | 129,868 |
| | $ | 120,708 |
| | $ | 9,160 |
| | 7.6 | % |
| Gross investment in used manufactured home rental units | | $ | 54,655 |
| | $ | 60,822 |
| | $ | (6,167 | ) | | (10.1 | )% | | $ | 48,182 |
| | $ | 54,675 |
| | $ | (6,493 | ) | | (11.9 | )% |
| | | | | | | | | | | | | | | | | |
| Net investment in new manufactured home rental units | | $ | 96,167 |
| | $ | 89,097 |
| | $ | 7,070 |
| | 7.9 | % | | $ | 104,710 |
| | $ | 99,428 |
| | $ | 5,282 |
| | 5.3 | % |
| Net investment in used manufactured home rental units | | $ | 30,375 |
| | $ | 42,443 |
| | $ | (12,068 | ) | | (28.4 | )% | | $ | 28,182 |
| | $ | 36,690 |
| | $ | (8,508 | ) | | (23.2 | )% |
| | | | | | | | | | | | | | | | | |
Number of occupied rentals – new, end of period (4) | | 2,267 |
| | 2,062 |
| | 205 |
| | 9.9 | % | | 2,517 |
| | 2,267 |
| | 250 |
| | 11.0 | % |
| Number of occupied rentals – used, end of period | | 2,594 |
| | 2,981 |
| | (387 | ) | | (13.0 | )% | | 2,157 |
| | 2,595 |
| | (438 | ) | | (16.9 | )% |
______________________
| |
(1) | Rental operations revenue consists of Site rental income and home rental income. Approximately $18.017.7 million and 18.6$18.1 million for the six months ended June 30, 2017 and June 30, 2016, and 2015, respectively, of Site rental income are included in Community base rental income in the Income from Property Operations table. The remainder of home rental income is included in Rental home income in the Income from Property Operations table. |
| |
(2) | Included in depreciation on real estate and other costs in the Consolidated Statements of Income and Comprehensive Income. |
| |
(3) | New home cost basis does not include the costs associated with our ECHO JV. Our investment in the ECHO JV was $15.4 million and $10.4 million at both June 30, 20162017 and 2015, respectively.December 31, 2016. |
| |
(4) | IncludesOccupied rentals as of the end of the period in our Core Portfolio and includes 257 and 143 and 65 homes rented through our ECHO JV induring the six months ended June 30, 2017 and June 30, 2016, and 2015, respectively. |
The decrease in income from rental operations, isnet of depreciation, was primarily due to a decrease in the number of occupied rental units. The occupancy decrease isunits, which was partially offset by the change in the mix of occupied rentals, driven by an increased number of occupied new homes at a higher rental rate.
Other Income and Expenses
The following table summarizes other income and expenses for the six months ended June 30, 20162017 and 2015June 30, 2016 (amounts in thousands, expenses shown as negative).
| | | | | 2016 | | 2015 | | Variance | | % Change | | 2017 | | 2016 | | Variance | | % Change |
| Depreciation on real estate and rental homes | | $ | (57,684 | ) | | $ | (56,451 | ) | | $ | (1,233 | ) | | (2.2 | )% | | $ | (60,357 | ) | | $ | (57,684 | ) | | $ | (2,673 | ) | | (4.6 | )% |
| Amortization of in-place leases | | (763 | ) | | (1,334 | ) | | 571 |
| | 42.8 | % | | (1,990 | ) | | (763 | ) | | (1,227 | ) | | (160.8 | )% |
| Interest income | | 3,285 |
| | 3,556 |
| | (271 | ) | | (7.6 | )% | | 3,568 |
| | 3,285 |
| | 283 |
| | 8.6 | % |
| Income from other investments, net | | 3,993 |
| | 3,297 |
| | 696 |
| | 21.1 | % | | 1,866 |
| | 3,993 |
| | (2,127 | ) | | (53.3 | )% |
| General and administrative (excluding transaction costs) | | (15,065 | ) | | (14,465 | ) | | (600 | ) | | (4.1 | )% | | (15,510 | ) | | (15,065 | ) | | (445 | ) | | (3.0 | )% |
| Transaction costs | | (598 | ) | | (482 | ) | | (116 | ) | | (24.1 | )% | | (324 | ) | | (598 | ) | | 274 |
| | 45.8 | % |
| Property rights initiatives and other | | (1,181 | ) | | (1,247 | ) | | 66 |
| | 5.3 | % | | (490 | ) | | (1,181 | ) | | 691 |
| | 58.5 | % |
| Early debt retirement | | — |
| | (16,922 | ) | | 16,922 |
| | 100.0 | % | |
| Interest and related amortization | | (51,195 | ) | | (53,421 | ) | | 2,226 |
| | 4.2 | % | | (49,701 | ) | | (51,195 | ) | | 1,494 |
| | 2.9 | % |
| Total other income and expenses, net | | $ | (119,208 | ) | | $ | (137,469 | ) | | $ | 18,261 |
| | 13.3 | % | | $ | (122,938 | ) | | $ | (119,208 | ) | | $ | (3,730 | ) | | (3.1 | )% |
Depreciation
Other expenses, net increased $3.7 million for the six months ended June 30, 2017, compared to the six months ended June 30, 2016. The increase in other expenses, net from the six months ended June 30, 2016 was primarily due to an increase in depreciation on real estate and rental homes increased primarilyand amortization of in-place leases due to increased capital expenditures2016 acquisition activity and a a decrease in income from other investments, net, due to the acquisitions that occurredtermination of the Tropical Palms RV ground lease in 2016.
Management's Discussion (continued)
This was partially offset by a decrease in interest and related amortization as a result of the refinancing activities completed during the first half of 2016 (see Note 47 to the Consolidated Financial Statements for additional detail regarding our recent acquisition activity)borrowing arrangements).
Early debt retirement expense was higher in 2015 as a result of the defeasance and prepayment activity that occurred during the first quarter of 2015.
A decrease in secured debt, resulting from the aforementioned refinancing and prepayment activity, and lower weighted average interest rates contributed to the decrease in interest and related amortization.
Management's Discussion (continued)
Liquidity and Capital Resources
Liquidity
Our primary demands for liquidity include payment of operating expenses, debt service, including principal and interest, capital improvements on properties, purchasing both new and pre-owned homes, acquisitions of new Properties, and distributions. We expect similar demandsdemand for liquidity will continue for the short-term and long-term. Our primary sources of cash include operating cash flows, proceeds from financings, borrowings under our unsecured Line of Credit ("LOC") and proceeds from issuance of equity and debt securities.
On May 4, 2015, we extended ourWe have entered into an at-the-market (“ATM”) offering program, by entering into new separate equity distribution agreements with certain sales agents, pursuant to which we may sell, from time-to-time, shares of our common stock, par value $0.01 per share, having an aggregate offering price of up to $125.0 million. For the six months ended June 30, 2016, we sold 683,548 shares of our common stock under the ATM offering Program for gross cash proceeds of approximately $50.0 million before expenses of approximately $0.7 million. As of June 30, 2016,2017, $75.0 million of common stock remained available for issuance under the ATM equity offering program. In addition, we have available liquidity in the form of authorized and unissued preferred stock of approximately 9.9 million shares and approximately 114.7113.0 million shares of authorized but unissued common stock registered for sale under the Securities Act of 1933, as amended, by a shelf registration statement which was automatically effective when filed with the SEC. Our charter allows us to issue up to 200.0 million shares of common stock, par value $0.01 per share, and up to 10.0 million shares of preferred stock, par value $0.01 per share.
One of our stated objectives is to maintain financial flexibility. Achieving this objective allows us to take advantage of strategic opportunities that may arise. We believe effective management of our balance sheet, including maintaining various access points to raise capital, manage future debt maturities and borrow at competitive rates enables us to meet this objective. We believe that as of June 30, 2016,2017, we have sufficient liquidity, in the form of $69.6$62.5 million in available cash, net of restricted cash, and $400.0 million available on our LOC, to satisfy our near term obligations. Our LOC has a borrowing capacity of $400.0 million with the option to increase the borrowing capacity by $100.0 million, subject to certain conditions (See Note 7conditions. The LOC bears interest at a rate of LIBOR plus 1.20% to the Consolidated Financial Statements).1.65%, requires an annual facility fee of 0.20% to 0.35% and matures on July 17, 2018, with an option to extend for one additional year, subject to certain conditions.
We expect to meet our short-term liquidity requirements, including distributions for the second quarter distribution of approximately $39.3 million paid on July 8, 2016, as well as all the remaining distributions,next twelve months, generally through available cash as well as net cash provided by operating activities and availability under our existing LOC. We consider these resources to be adequate to meet our operating requirements for capital improvements, amortizing debt and payment of dividends and distributions.
We expect to meet certain long-term liquidity requirements such as scheduled debt maturities, property acquisitions and capital improvements by use of our current cash balance, long-term collateralized and uncollateralized borrowings including borrowings under the existing LOC and the issuance of debt securities or additional equity securities, in addition to net cash provided by operating activities. As of June 30, 2016,2017, we have approximately $66.9$6.9 million of scheduled debt maturities in 20162017 (excluding scheduled principal payments on debt maturing in 20162017 and beyond). We expect to satisfy our 20162017 maturities with existing cash and anticipated operating cash flow.
During the six months ended June 30, 2017 we paid off one maturing mortgage loan and assumed debt in the purchase of Paradise Park Largo. The mortgage loan we paid off was approximately $21.1 million, with a weighted average interest rate of 5.76% per annum, secured by one manufactured home Property. In connection with the Paradise Park Largo acquisition completed induring the quarter ended June 2016,30, 2017, we assumed approximately $22.6$5.9 million of mortgage debt secured by the Forest Lake Estates manufactured home community with a statedan interest rate of 4.51% per annum, which is set to mature4.6% that matures in 2038.
During the six months ended June 30, 2016, we paid off two maturing mortgages of approximately $13.1 million, with weighted average interest rate of 5.53% per annum, each secured by one manufactured home property.
On July 1, 2016, we paid off two maturing mortgage loans of approximately $23.9 million. The loans had a weighted average interest rate of 5.99% per annum respectively and were secured by one RV resort and one manufactured home property.
Management's Discussion (continued)
2040.
The table below summarizes cash flow activity for the six months ended June 30, 20162017 and 20152016 (amounts in thousands):
| | | | Six Months Ended June 30,
| Six Months Ended
June 30, |
| | 2016 | | 2015 | 2017 | | 2016 |
| Net cash provided by operating activities | $ | 186,807 |
| | $ | 209,946 |
| $ | 214,102 |
| | $ | 186,807 |
|
| Net cash used in investing activities | (136,090 | ) | | (68,615 | ) | (71,426 | ) | | (136,090 | ) |
| Net cash used in financing activities | (56,104 | ) | | (130,100 | ) | (131,276 | ) | | (56,104 | ) |
| Net (decrease)/increase in cash | $ | (5,387 | ) | | $ | 11,231 |
| |
| Net increase (decrease) in cash | | $ | 11,400 |
| | $ | (5,387 | ) |
Management's Discussion (continued)
Operating Activities
Net cash provided by operating activities decreased $23.1increased $27.3 million to $214.1 million for the six months ended June 30, 2017, from $186.8 million for the six months ended June 30, 2016, from $209.9 million for the six months ended June 30, 2015.2016. The overall decreaseincrease in net cash provided by operating activities iswas primarily due to a decreasehigher income from property operations of $16.0$12.4 million, receipt of insurance proceeds of $10.8 million related to the California failure to maintain lawsuits, long term incentive plan payments of $4.3 million during the first quarter of 2016, increase of $1.2 million in Accrued expenses and accounts payable, a decrease in Escrow deposits, goodwill and other assets of $14.4 million, as well as an decrease of $1.6 million in Rentsrents received in advance and security deposits,an increase of $0.8 million in distributions from unconsolidated joint ventures. These increases were partially offset by an increase in Income from property operationsthe litigation settlement payment of $13.5 million.$13.3 million related to the California failure to maintain lawsuits.
Investing Activities
Net cash used in investing activities was $71.4 million for the six months ended June 30, 2017 compared to $136.1 million for the six months ended June 30, 2016 compared2016. The decrease in net cash used in investing activities was primarily due to $68.6 million forthe acquisitions of Forest Lake Estates, Portland Fairview and Rose Bay during the six months ended June 30, 2015. Significant components2016, partially offset by the short-term loan of net cash used in investing activities include:
We paid approximately $76.2$13.8 million in 2016 to acquire the Rose Bay RV Resort, Forest Lakes Estates and Portland Fairview which resulted in an additional 984 RV Sites and 894 manufactured home Sites. We paid approximately $23.7 million in 2015 to acquire the Bogue Pines MH Property, Whispering Pines RV Resort and Miami Everglades RV Resort. These acquisitions contributed an additional 731 Sites.
We contributed $5.0 million to our ECHO JV in 2016 comparedissued to the $4.0 million we invested in 2015. (see Note 5 to the Consolidated Financial Statements for a description of ourCrosswinds joint ventures).
We paid approximately $55.7 million and $42.3 million for capital improvementsventure during the quarters ended June 30, 2016 and 2015, respectively (see Capital Improvements table below).second quarter of 2017.
Capital Improvements
The table below summarizes capital improvement activity for the six months ended June 30, 20162017 and 20152016 (amounts in thousands):
|
| | | | | | | |
| | Six Months Ended
June 30, (1) |
| | 2017 | | 2016 |
Recurring Capital Expenditures (2) | $ | 18,808 |
| | $ | 18,317 |
|
| Property upgrades and site development | 11,870 |
| | 5,961 |
|
New home investments (3)(4) | 19,542 |
| | 27,774 |
|
Used home investments (4) | 2,191 |
| | 3,210 |
|
| Total Property | 52,411 |
| | 55,262 |
|
| Corporate | 1,053 |
| | 445 |
|
| Total Capital improvements | $ | 53,464 |
| | $ | 55,707 |
|
|
| | | | | | | |
| | Six Months ended
June 30, (1) |
| | 2016 | | 2015 |
Recurring Capital Expenditures (2) | $ | 18,317 |
| | $ | 18,265 |
|
| Property upgrades and site development | 5,961 |
| | 3,749 |
|
New home investments (3) | 27,774 |
| | 15,905 |
|
| Used home investments | 3,210 |
| | 3,797 |
|
| Total Property | 55,262 |
| | 41,716 |
|
| Corporate | 445 |
| | 543 |
|
| Total Capital improvements | $ | 55,707 |
| | $ | 42,259 |
|
______________________(2) Recurring capital expenditures are primarily comprised of common area improvements, furniture, and mechanical improvements.
| |
(1)(3) Excludes new home investment associated with our ECHO JV. (4) Net proceeds from new and used home sale activities are reflected within Operating Activities. | Excludes non-cash activity of approximately $0.4 million of used homes acquired through foreclosure of Chattel Loans for the six months ended June 30, 2016 and 2015, respectively. |
| |
(2)
| Recurring capital expenditures are primarily comprised of common area improvements, furniture, and mechanical improvements. |
| |
(3)
| Excludes new home investment associated with our ECHO JV. |
Financing Activities
Net cash used in financing activities was $131.3 million for the six months ended June 30, 2017 compared to net cash used in financing activities of $56.1 million for the six months ended June 30, 2016 compared to2016. The increase in net cash used in financing activities of $130.1 million forwas primarily due to the six months ended June 30, 2015. Significant components of net cash used in financing activities include:
We paid approximately $19.4$50.0 million of amortizing principal debt and approximately $13.1 million to repay two maturing mortgage in 2016. This compares to 2015 where we had approximately $18.4 million of amortizing principal debt, approximately $48.7 million of maturing mortgage, defeased approximately $370.2 million of debt and paid a total of
Management's Discussion (continued)
approximately $23.5 million in debt issuance and defeasance costs as well as early debt retirement costs. (See Note 7 to the Consolidated Financial Statements for a description of our borrowing arrangements).
We sold 683,548 shares of our common stock under the ATM offering program for gross cash proceeds of approximately $50.0 million before expensesreceived during the six months ended June 30, 2016 (see Note 3 to the Consolidated Financial Statements foras a descriptionresult of our equity transactions).
We received $395.3 million in financing proceeds in 2015. (see Note 7 to the Consolidated Financial Statements for a description of our borrowing arrangements).
We made distributions of approximately $77.9 million in the first six months of 2016 to Common Stockholders, Common OP unitholders and preferred stockholders which were partially offset by proceeds received of approximately $5.2 million from the exercise of stock options and the sale of shares throughstock under the employee stock purchase plan (see Note 3 to the Consolidated Financial Statements for a description of ourATM equity transactions).offering program.
We made distributions of approximately $68.5 million in the first quarter of 2015 to Common Stockholders, Common OP unitholders and preferred stockholders and paid approximately $0.3 million for offering costs, offset by proceeds received of approximately $4.3 million from the exercise of stock options and the sale of shares through the employee stock purchase plan (see Note 3 to the Consolidated Financial Statements for a description of our equity transactions).
Management's Discussion (continued)
Contractual Obligations
As of June 30, 20162017, we were subject to certain contractual payment obligations as described in the table below (amounts in thousands):
|
| | | | | | | | | | | | | | | | | | | | | | | | | | | |
| | Total (5) | | 2017 | | 2018 | | 2019 | | 2020 | | 2021 | | Thereafter |
Long Term Borrowings (1) | $ | 2,068,016 |
| | $ | 28,900 |
| | $ | 239,608 |
| | $ | 234,920 |
| | $ | 352,089 |
| | $ | 211,650 |
| | $ | 1,000,849 |
|
Interest Expense (2) | 605,441 |
| | 48,266 |
| | 87,925 |
| | 73,013 |
| | 57,639 |
| | 49,742 |
| | 288,856 |
|
| Operating Lease | 9,444 |
| | 1,090 |
| | 2,221 |
| | 2,062 |
| | 2,011 |
| | 1,711 |
| | 349 |
|
LOC Maintenance Fee (3) | 849 |
| | 409 |
| | 440 |
| | — |
| | — |
| | — |
| | — |
|
Ground Lease (4) | 16,035 |
| | 993 |
| | 1,980 |
| | 1,983 |
| | 1,984 |
| | 1,987 |
| | 7,108 |
|
| Total Contractual Obligations | $ | 2,699,785 |
| | $ | 79,658 |
| | $ | 332,174 |
| | $ | 311,978 |
| | $ | 413,723 |
| | $ | 265,090 |
| | $ | 1,297,162 |
|
| Weighted average interest rates - Long Term Borrowings | 4.41 | % | | 4.69 | % | | 4.61 | % | | 4.40 | % | | 4.49 | % | | 4.39 | % | | 4.25 | % |
|
| | | | | | | | | | | | | | | | | | | | | | | | | | | |
| | Total (5) | | 2016 | | 2017 | | 2018 | | 2019 | | 2020 | | Thereafter |
Long Term Borrowings (1) | $ | 2,126,878 |
| | $ | 86,816 |
| | $ | 98,153 |
| | $ | 230,697 |
| | $ | 232,073 |
| | $ | 349,125 |
| | $ | 1,130,014 |
|
Interest Expense (2) | 654,066 |
| | 49,875 |
| | 93,482 |
| | 84,214 |
| | 69,499 |
| | 54,242 |
| | 302,754 |
|
| Operating Lease | 11,588 |
| | 1,063 |
| | 2,171 |
| | 2,221 |
| | 2,062 |
| | 2,011 |
| | 2,060 |
|
LOC Maintenance Fee (3) | 1,660 |
| | 409 |
| | 811 |
| | 440 |
| | — |
| | — |
| | — |
|
Ground Lease (4) | 17,380 |
| | 981 |
| | 1,963 |
| | 1,957 |
| | 1,960 |
| | 1,961 |
| | 8,558 |
|
| Total Contractual Obligations | $ | 2,811,572 |
| | $ | 139,144 |
| | $ | 196,580 |
| | $ | 319,529 |
| | $ | 305,594 |
| | $ | 407,339 |
| | $ | 1,443,386 |
|
| Weighted average interest rates - Long Term Borrowings | 4.54 | % | | 4.81 | % | | 4.75 | % | | 4.66 | % | | 4.45 | % | | 4.56 | % | | 4.36 | % |
______________________________ | |
(1) | Balance excludes note premiums of $7.1$4.3 million and deferred financing costs of approximately $18.9$17.8 million. Balances include debt maturing, and scheduled periodic principal payments.payments, and Paradise Park Largo mortgage debt of $5.9 million. |
| |
(2) | Amounts include interest expected to be incurred on our secured debt and Term Loan based on obligations outstanding as of June 30, 2016.2017. |
| |
(3) | As of June 30, 2016,2017, assumes we will not exercise our one year extension option on July 17, 2018 and assumes we will maintain our current leverage ratios as defined by the LOC. |
| |
(4) | We also lease land under non-cancelable operating leases at certain of the Properties expiring in various years from 2017 to 2054. The majority of the lease terms require twelve equal payments per year plus additional rents calculated as a percentage of gross revenues. |
| |
(5) | We do not include insurance, property taxes and cancelable contracts in the contractual obligations table. |
We believe that we will be able to refinance our maturing debt obligations on a secured or unsecured basis; however, to the extent we are unable to refinance our debt as it matures, we believe that we will be able to repay such maturing debt through available cash as well as operating cash flow, asset sales and/or the proceeds from equity issuances. With respect to any refinancing of maturing debt, our future cash flow requirements could be impacted by significant changes in interest rates or other debt terms, including required amortization payments.
Inflation
Substantially all of the leases at the Properties allow for monthly or annual rent increases which provide us with the opportunity to achieve increases, where justified by the market, as each lease matures. Such types of leases generally minimize our risks of inflation. In addition, our resort Properties are not generally subject to leases and rents are established for these Sites on an annual basis. Our right-to-use contracts generally provide for an annual dues increase, but dues may be frozen under the terms of certain contracts if the customer is over 61 years of age.
Off Balance Sheet Arrangements
As of June 30, 2016,2017, we have no off balance sheet arrangements.
Critical Accounting Policies and Estimates
Refer to the 2016 Form 10-K for a discussion of our critical accounting policies, which includes impairment of real estate assets and investments, revenue recognition and business combinations. There have been no changes to these policies during the quarter ended June 30, 2017.
Management's Discussion (continued)
Funds From OperationsForward Looking Statements
Funds from Operations ("FFO") is a non-GAAP financial measure. We define FFOThis Quarterly Report on Form 10-Q for the quarter ended June 30, 2017 includes certain “forward-looking statements” within the meaning of the Private Securities Litigation Reform Act of 1995. When used, words such as net income, computed in accordance with GAAP, excluding gains“anticipate,” “expect,” “believe,” “project,” “intend,” “may be” and actual“will be” and similar words or estimated losses from salesphrases, or the negative thereof, unless the context requires otherwise, are intended to identify forward-looking statements and may include without limitation, information regarding our expectations, goals or intentions regarding the future, and the expected effect of properties, plusour acquisitions. These forward-looking statements are subject to numerous assumptions, risks and uncertainties, including, but not limited to:
our ability to control costs, real estate related depreciationmarket conditions, the actual rate of decline in customers, the actual use of Sites by customers and amortization, impairments,our success in acquiring new customers at our Properties (including those that we may acquire);
our ability to maintain historical or increase future rental rates and occupancy with respect to Properties currently owned or that we may acquire;
our ability to retain and attract customers renewing, upgrading and entering right-to-use contracts;
our assumptions about rental and home sales markets;
our ability to manage counterparty risk;
in the age-qualified Properties, home sales results could be impacted by the ability of potential home buyers to sell their existing residences as well as by financial, credit and capital markets volatility;
results from home sales and occupancy will continue to be impacted by local economic conditions, lack of affordable manufactured home financing and competition from alternative housing options including site-built single-family housing;
impact of government intervention to stabilize site-built single-family housing and not manufactured housing;
effective integration of recent acquisitions and our estimates regarding the future performance of recent acquisitions;
the completion of future transactions in their entirety, if any, and after adjustmentstiming and effective integration with respect thereto;
unanticipated costs or unforeseen liabilities associated with recent acquisitions;
ability to obtain financing or refinance existing debt on favorable terms or at all;
the effect of interest rates;
the dilutive effects of issuing additional securities;
the effect of accounting for unconsolidated partnerships and joint ventures. Adjustments for unconsolidated partnerships and joint ventures are calculated to reflect FFO on the same basis. We compute FFO in accordance with our interpretation of standards established by the National Association of Real Estate Investment Trusts (“NAREIT”), which may not be comparable to FFO reported by other REITs that do not define the term in accordance with the current NAREIT definition or that interpret the current NAREIT definition differently than we do. We receive up-front non-refundable payments from the entry of contracts with customers representing a right-to-use contracts. In accordance with GAAP, the upfront non-refundable payments and related commissions are deferred and amortized overProperties under the estimated customer life. Although Codification Topic "Revenue Recognition";
the NAREIT definitionoutcome of FFO does not address the treatment of non-refundable right-to-use payments, we believe that it is appropriate to adjust for the impact of the deferral activitypending or future lawsuits or actions brought against us, including those disclosed in our calculation of FFO.filings with the Securities and Exchange Commission; and
We believe FFO, as defined byother risks indicated from time to time in our filings with the Board of Governors of NAREIT, is generally a measure of performance for an equity REIT. While FFO is a relevantSecurities and widely used measure of operating performance for equity REITs, it does not represent cash flow from operations or net income as defined by GAAP, and it should not be considered as an alternative to these indicators in evaluating liquidity or operating performance.Exchange Commission.
Normalized Funds from Operations ("Normalized FFO") is a non-GAAP measure. We define Normalized FFO as FFO excluding the following non-operating income and expense items: a) the financial impact of contingent consideration; b) gains and losses from early debt extinguishment, including prepayment penalties and defeasance costs; c) property acquisition and other transaction costs related to mergers and acquisitions; and d) other miscellaneous non-comparable items. Normalized FFO presented herein is not necessarily comparable to Normalized FFO presented by other real estate companies due to the fact that not all real estate companies use the same methodology for computing this amount.
We believe that FFO and Normalized FFO are helpful to investors as supplemental measures of the performance of an equity REIT. We believe that by excluding the effect of depreciation, amortization, impairments, if any, and actual or estimated gains or losses from sales of real estate, all of whichThese forward-looking statements are based on historical costsmanagement's present expectations and which may be of limited relevancebeliefs about future events. As with any projection or forecast, these statements are inherently susceptible to uncertainty and changes in evaluating current performance, FFO can facilitate comparisons of operating performance between periodscircumstances. We are under no obligation to, and among other equity REITs. We further believe that Normalized FFO provides useful informationexpressly disclaim any obligation to, investors, analysts andupdate or alter our management because it allows them to compare our operating performance to the operating performance of other real estate companies and between periods on a consistent basis without having to account for differences not related to our operations. For example, we believe that excluding the early extinguishment of debt, property acquisition and other transaction costs related to mergers and acquisitions from Normalized FFO allows investors, analysts and our management to assess the sustainability of operating performance in future periods because these costs do not affect the future operations of the properties. In some cases, we provide information about identified non-cash components of FFO and Normalized FFO because it allows investors, analysts and our management to assess the impact of those items.
Our definitions and calculations of these non-GAAP financial and operating measures and other terms may differ from the definitions and methodologies used by other REITs and, accordingly, may not be comparable. These non-GAAP financial and operating measures do not represent cash generated from operating activities in accordance with GAAP, nor do they represent cash available to pay distributions and should not be considered as an alternative to net income, determined in accordance with GAAP, as an indication of our financial performance, or to cash flow from operating activities, determined in accordance with GAAP,forward-looking statements whether as a measureresult of our liquidity, nor is it indicative of funds available to fund our cash needs, including our ability to make cash distributions.
Management's Discussion (continued)
The following table presents a calculation of FFO available for Common Stock and OP Unit holders and Normalized FFO available for Common Stock and OP Unit holders for the quarters ended June 30, 2016 and 2015 (amounts in thousands):
|
| | | | | | | | | | | | | | | | |
| | | Quarters Ended
June 30, | | Six Months Ended June 30,
|
| | | 2016 | | 2015 | | 2016 | | 2015 |
| Computation of FFO and Normalized FFO: | | | | | | | | |
| Net income available for Common Stockholders | | $ | 35,490 |
| | $ | 31,786 |
| | $ | 86,073 |
| | $ | 58,972 |
|
| Income allocated to common OP units | | 2,998 |
| | 2,724 |
| | 7,308 |
| | 5,054 |
|
| Right-to-use contract upfront payments, deferred, net | | 798 |
| | 1,455 |
| | 1,100 |
| | 2,228 |
|
| Right-to-use contract commissions, deferred, net | | (116 | ) | | (764 | ) | | (12 | ) | | (1,007 | ) |
| Depreciation on real estate assets | | 26,362 |
| | 25,654 |
| | 52,370 |
| | 51,064 |
|
| Depreciation on rental homes | | 2,667 |
| | 2,681 |
| | 5,314 |
| | 5,387 |
|
| Amortization of in-place leases | | 428 |
| | 669 |
| | 763 |
| | 1,334 |
|
| Depreciation on unconsolidated joint ventures | | 305 |
| | 282 |
| | 595 |
| | 525 |
|
| FFO available for Common Stock and OP Unit holders | | 68,932 |
| | 64,487 |
| | 153,511 |
| | 123,557 |
|
| Transaction costs | | 398 |
| | 50 |
| | 598 |
| | 482 |
|
| Early debt retirement | | — |
| | (69 | ) | | — |
| | 16,922 |
|
| Normalized FFO available for Common Stock and OP Unit holders | | $ | 69,330 |
| | $ | 64,468 |
| | $ | 154,109 |
| | $ | 140,961 |
|
| Weighted average Common Shares outstanding – fully diluted | | 92,264 |
| | 91,851 |
| | 92,163 |
| | 91,829 |
|
| |
| Item 3. | Quantitative and Qualitative Disclosure of Market Risk |
We disclosed a quantitative and qualitative analysis regarding market risk in Part II, Item 7A. Quantitative and Qualitative Disclosures About Market Risk on Form 10-K for the year ended December 31, 2015.2016. There have been no material changes in the assumptions used or results obtained regarding market risk since December 31, 2015.2016.
| |
| Item 4. | Controls and Procedures |
Evaluation of Disclosure Controls and Procedures
Our management, with the participation of our Chief Executive Officer (principal executive officer) and Chief Financial Officer (principal financial and accounting officer), has evaluated the effectiveness of our disclosure controls and procedures as of June 30, 20162017. Based on that evaluation, our Chief Executive Officer and Chief Financial Officer concluded that our disclosure controls and procedures were effective to give reasonable assurances to the timely collection, evaluation and disclosure of information relating to us that would potentially be subject to disclosure under the Securities and Exchange Act of 1934, as amended (the “Exchange Act”), and the rules and regulations promulgated thereunder as of June 30, 20162017.
Notwithstanding the foregoing, a control system, no matter how well designed and operated, can provide only reasonable, not absolute, assurance that it will detect or uncover failures within us to disclose material information otherwise required to be set forth in our periodic reports.
Changes in Internal Control Over Financial Reporting
During the secondquarter of 2016,ended June 30, 2017, there were no changes in our internal control over financial reporting (as defined in Rules 13a-15(f) and 15d-15(f) under the Exchange Act) that have materially affected, or are reasonably likely to materially affect, our internal control over financial reporting.
Part II – Other Information
See Note 129 of the Consolidated Financial Statements contained herein.
There have been no material changes to the risk factors discussed in “Item 1A. Risk Factors” in our Annual Report on Form 10-K for the year ended December 31, 2015 other than those disclosed2016 and in our Quarterly Report on Form 10-Q for the quarter ended March 2016.31, 2017.
| |
| Item 2. | Unregistered Sales of Equity Securities and Use of Proceeds |
None.
| |
| Item 3. | Defaults Upon Senior Securities |
None.
| |
| Item 4. | Mine Safety Disclosure |
None.
None.
|
| |
10.4 | Amended and Restated Equity LifeStyle Properties, Inc. 1997 Non-Qualified Employee Stock Purchase Plan, effective May 10, 2016. |
| 31.1 | |
| 31.2 | |
| 32.1 | |
| 32.2 | |
| 101 | The following materials from Equity LifeStyle Properties, Inc.’s Quarterly Report on Form 10-Q for the quarter ended June 30, 20162017 formatted in XBRL (Extensible Business Reporting Language): (i) Consolidated Balance Sheets, (ii) Consolidated Statements of Income and Comprehensive Income, (iii) Consolidated Statements of Changes in Equity, (iv) Consolidated Statements of Cash Flow, and (v) Notes to Consolidated Financial Statements, filed herewith. |
Pursuant to the requirements of the Securities Exchange Act of 1934, the Registrant has duly caused this Report to be signed on its behalf by the undersigned thereunto duly authorized.
|
| | |
| | EQUITY LIFESTYLE PROPERTIES, INC. |
| | | |
Date: July 27, 201626, 2017 | By: | /s/ Marguerite Nader |
| | | Marguerite Nader |
| | | President and Chief Executive Officer |
| | | (Principal Executive Officer) |
| | | |
Date: July 27, 201626, 2017 | By: | /s/ Paul Seavey |
| | | Paul Seavey |
| | | Executive Vice President, Chief Financial Officer and Treasurer |
| | | (Principal Financial Officer) |
| | |
Date: July 27, 2016 | By: | /s/ Ann Wallin |
| | Ann Wallin |
| | Vice President and Chief Accounting Officer |
| | (Principal Accounting Officer) |