UNITED STATES
SECURITIES AND EXCHANGE COMMISSION
Washington, D.C. 20549
____________________
FORM 10-Q
____________________
(Mark One)
| | | | | |
| ☒ | |
x | QUARTERLY REPORT PURSUANT TO SECTION 13 OR 15(d) OF THE SECURITIES EXCHANGE ACT OF 1934 |
For the Quarterly Period Ended DecemberMarch 31, 20172024
OR
| | | | | |
| ☐ | |
o | TRANSITION REPORT PURSUANT TO SECTION 13 OR 15(d) OF THE SECURITIES EXCHANGE ACT OF 1934 |
For the Transition Period From to
Commission File Number 000-23554
____________________
INTL FCStoneStoneX Group Inc.
(Exact name of registrant as specified in its charter)
____________________
| | | | | | | | |
| Delaware | | 59-2921318 |
| | |
Delaware | | 59-2921318 |
(State or other jurisdiction of
incorporation or organization)
| | (I.R.S. Employer
Identification No.)
|
708 Third Avenue, Suite 1500230 Park Ave, 10th Floor
New York, NY 1001710169
(Address of principal executive offices) (Zip Code)
(212) 485-3500
(Registrant’s telephone number, including area code)
____________________
Securities registered pursuant to Section 12(b) of the Act:
| | | | | | | | | | | | | | |
| Title of Each Class | | Trading Symbol | | Name of each exchange on which registered |
| Common Stock, $0.01 par value | | SNEX | | The Nasdaq Stock Market LLC |
Indicate by check mark whether the registrant (1) has filed all reports required to be filed by Section 13 or 15(d) of the Securities Exchange Act of 1934 during the preceding 12 months (or for such shorter period that the registrant was required to file such reports), and (2) has been subject to such filing requirements for the past 90 days. Yes x☒No o☐
Indicate by check mark whether the registrant has submitted electronically and posted on its corporate Web site, if any, every Interactive Data File required to be submitted and posted pursuant to Rule 405 of Regulation S-T (§232.405 of this chapter) during the preceding 12 months (or for such shorter period that the registrant was required to submit and post such files). Yes x ☒No o☐
Indicate by check mark whether the registrant is a large accelerated filer, an accelerated filer, a non-accelerated filer, ora smaller reporting company or an emerging growth company. See the definitions of “large accelerated filer,” “accelerated filer”filer, ” “smaller reporting company,” and “smaller reporting“emerging growth company” in Rule 12b-2 of the Exchange Act. | | | | | | | | | | | | | | |
| | | | |
| Large accelerated filer | ox | | Accelerated filer | x☐ |
| | | | |
| Non-accelerated filer | o | | (Do not check if a smaller reporting company)Smaller reporting company | o☐ |
| | | | |
| | | Emerging growth company | o☐ |
If an emerging growth company, indicate by check mark if the registrant has elected not to use the extended transition period for complying with any new or revised financial accounting standards provided pursuant to Section 13(a) of the Exchange Act. o☐
Indicate by check mark whether the registrant is a shell company (as defined in Rule 12b-2 of the Exchange Act). Yes o☐ No x☒
As of February 5, 2018,May 6, 2024, there were 18,844,50231,716,068 shares of the registrant’s common stock outstanding. INTL FCStone
StoneX Group Inc.
Quarterly Report on Form 10-Q for the Quarterly Period Ended DecemberMarch 31, 20172024
Table of Contents
| | | | | | | | |
| | Page |
| | |
| | Page |
| Part I. FINANCIAL INFORMATION | |
| | |
| Item 1. | | |
| | |
| | |
| | |
| | |
| | |
| | |
| | |
| | |
| | |
| | |
| | |
| | |
| | |
| Item 2. | | |
| | |
| Item 3. | | |
| | |
| Item 4. | | |
| |
| Part II. OTHER INFORMATION | |
| | |
| Item 1. | | |
| | |
| Item 1A. | | |
| | |
| Item 2. | | |
| | |
Item 6.5. | | |
| | |
| Item 6. | | |
| | |
| | |
PART I. FINANCIAL INFORMATION
Item 1. Financial Statements
INTL FCStoneStoneX Group Inc.
Condensed Consolidated Balance Sheets
| | | (in millions, except par value and share amounts) | December 31,
2017 | | September 30,
2017 | (in millions, except par value and share amounts) | March 31,
2024 | | September 30,
2023 |
| ASSETS | | | |
| Cash and cash equivalents | $ | 321.8 |
| | $ | 314.9 |
|
| Cash, securities and other assets segregated under federal and other regulations (including $16.5 and $54.5 at fair value at December 31, 2017 and September 30, 2017, respectively) | 464.4 |
| | 518.8 |
|
| Cash and cash equivalents | |
| Cash and cash equivalents | |
| Restricted cash | |
| Cash, securities and other assets segregated under federal and other regulations (including $4.1 million and $5.8 million at fair value at March 31, 2024 and September 30, 2023, respectively) | |
| Collateralized transactions: | | | |
| Securities purchased under agreements to resell | 559.5 |
| | 406.6 |
|
| Securities purchased under agreements to resell | |
| Securities purchased under agreements to resell | |
| Securities borrowed | 95.7 |
| | 86.6 |
|
| Deposits with and receivables from broker-dealers, clearing organizations and counterparties (including $53.7 and $204.7 at fair value at December 31, 2017 and September 30, 2017, respectively) | 2,628.2 |
| | 2,625.1 |
|
| Receivables from customers, net | 254.4 |
| | 232.7 |
|
| Notes receivable | 10.6 |
| | 10.6 |
|
| | Deposits with and receivables from broker-dealers, clearing organizations and counterparties, net (including $4,157.3 million and $4,248.3 million at fair value at March 31, 2024 and September 30, 2023, respectively) | |
| | Deposits with and receivables from broker-dealers, clearing organizations and counterparties, net (including $4,157.3 million and $4,248.3 million at fair value at March 31, 2024 and September 30, 2023, respectively) | |
| | Deposits with and receivables from broker-dealers, clearing organizations and counterparties, net (including $4,157.3 million and $4,248.3 million at fair value at March 31, 2024 and September 30, 2023, respectively) | |
| Receivable from clients, net (including $(3.4) million and $(7.9) million at fair value at March 31, 2024 and September 30, 2023, respectively) | |
| Notes receivable, net | |
| Income taxes receivable | 0.5 |
| | 0.4 |
|
| Financial instruments owned, at fair value (includes securities pledged as collateral that can be sold or repledged of $3.4 and $19.4 at December 31, 2017 and September 30, 2017, respectively) | 2,055.9 |
| | 1,731.8 |
|
| Physical commodities inventory, net (including $142.7 and $73.2 at fair value at December 31, 2017 and September 30, 2017, respectively) | 244.7 |
| | 124.8 |
|
| Deferred income taxes, net | 22.9 |
| | 42.6 |
|
| Financial instruments owned, at fair value (includes securities pledged as collateral that can be sold or repledged of $1,860.8 million and $1,466.4 million at March 31, 2024 and September 30, 2023, respectively) | |
| Physical commodities inventory, net (including $355.2 million and $386.5 million at fair value at March 31, 2024 and September 30, 2023, respectively) | |
| Deferred tax asset | |
| Property and equipment, net | 40.3 |
| | 38.7 |
|
| Operating right of use assets | |
| Goodwill and intangible assets, net | 57.6 |
| | 59.4 |
|
| Other assets | 52.4 |
| | 50.4 |
|
| Total assets | $ | 6,808.9 |
| | $ | 6,243.4 |
|
| LIABILITIES AND STOCKHOLDERS' EQUITY | | | |
| Liabilities: | | | |
| Accounts payable and other accrued liabilities (including $1.0 at fair value at September 30, 2017) | $ | 111.5 |
| | $ | 135.6 |
|
| Liabilities: | |
| Liabilities: | |
| Accounts payable and other accrued liabilities (including $1.7 million and $1.5 million at fair value at March 31, 2024 and September 30, 2023, respectively) | |
| Accounts payable and other accrued liabilities (including $1.7 million and $1.5 million at fair value at March 31, 2024 and September 30, 2023, respectively) | |
| Accounts payable and other accrued liabilities (including $1.7 million and $1.5 million at fair value at March 31, 2024 and September 30, 2023, respectively) | |
| Operating lease liabilities | |
| Payables to: | | | |
| Customers | 3,063.8 |
| | 3,072.9 |
|
| Broker-dealers, clearing organizations and counterparties (including $1.1 and $4.8 at fair value at December 31, 2017 and September 30, 2017, respectively) | 197.1 |
| | 125.7 |
|
| Clients (including $585.6 million and $79.8 million at fair value at March 31, 2024 and September 30, 2023, respectively) | |
| Clients (including $585.6 million and $79.8 million at fair value at March 31, 2024 and September 30, 2023, respectively) | |
| Clients (including $585.6 million and $79.8 million at fair value at March 31, 2024 and September 30, 2023, respectively) | |
| Broker-dealers, clearing organizations and counterparties (including $(21.3) million and $10.2 million at fair value at March 31, 2024 and September 30, 2023, respectively) | |
| Lenders under loans | 422.9 |
| | 230.2 |
|
| Senior secured borrowings, net | |
| Income taxes payable | 7.9 |
| | 7.3 |
|
| Deferred tax liability | |
| Collateralized transactions: | | | |
| Securities sold under agreements to repurchase | |
| Securities sold under agreements to repurchase | |
| Securities sold under agreements to repurchase | 1,650.4 |
| | 1,393.1 |
|
| Securities loaned | 108.8 |
| | 111.1 |
|
| Financial instruments sold, not yet purchased, at fair value | 803.3 |
| | 717.6 |
|
| | Total liabilities | |
| Total liabilities | |
| Total liabilities | 6,365.7 |
| | 5,793.5 |
|
| Commitments and contingencies (Note 11) |
| |
| Commitments and contingencies (Note 11) | | | |
| Stockholders' Equity: | | | |
| Stockholders' equity: | |
| | Preferred stock, $0.01 par value. Authorized 1,000,000 shares; no shares issued or outstanding | — |
| | — |
|
| Common stock, $0.01 par value. Authorized 30,000,000 shares; 20,931,720 issued and 18,809,763 outstanding at December 31, 2017 and 20,855,243 issued and 18,733,286 outstanding at September 30, 2017 | 0.2 |
| | 0.2 |
|
| Common stock in treasury, at cost - 2,121,957 shares at December 31, 2017 and September 30, 2017 | (46.3 | ) | | (46.3 | ) |
| Additional paid-in capital | 261.4 |
| | 259.0 |
|
| | Preferred stock, $0.01 par value. Authorized 1,000,000 shares; no shares issued or outstanding | |
| | Preferred stock, $0.01 par value. Authorized 1,000,000 shares; no shares issued or outstanding | |
| Common stock, $0.01 par value. Authorized 200,000,000 shares; 35,561,232 issued and 31,650,247 outstanding at March 31, 2024 and 35,105,852 issued and 31,194,867 outstanding at September 30, 2023 | |
| Common stock in treasury, at cost. 3,910,985 shares at March 31, 2024 and September 30, 2023 | |
| Additional paid-in-capital | |
| Retained earnings | 254.6 |
| | 261.5 |
|
| Accumulated other comprehensive loss, net | (26.7 | ) | | (24.5 | ) |
| Total stockholders' equity | 443.2 |
| | 449.9 |
|
| | Total equity | |
| | Total equity | |
| | Total equity | |
| Total liabilities and stockholders' equity | $ | 6,808.9 |
| | $ | 6,243.4 |
|
See accompanying notes to the condensed consolidated financial statements.
INTL FCStone
StoneX Group Inc.
Condensed Consolidated Income Statements
(Unaudited)
| | | | Three Months Ended December 31, | | Three Months Ended March 31, | | Six Months Ended March 31, |
| (in millions, except share and per share amounts) | 2017 | | 2016 | (in millions, except share and per share amounts) | 2024 | | 2023 | | 2024 | | 2023 |
| Revenues: | | | |
| Sales of physical commodities | $ | 7,714.4 |
| | $ | 5,896.0 |
|
| Trading gains, net | 85.8 |
| | 83.0 |
|
| Sales of physical commodities | |
| Sales of physical commodities | |
| Principal gains, net | |
| Commission and clearing fees | 77.8 |
| | 69.2 |
|
| Consulting, management, and account fees | 16.6 |
| | 15.7 |
|
| Interest income | 24.0 |
| | 10.4 |
|
| Other income | — |
| | 0.1 |
|
| Total revenues | 7,918.6 |
| | 6,074.4 |
|
| Cost of sales of physical commodities | 7,706.0 |
| | 5,888.9 |
|
| Operating revenues | 212.6 |
| | 185.5 |
|
| Transaction-based clearing expenses | 36.9 |
| | 33.6 |
|
| Introducing broker commissions | 31.1 |
| | 28.7 |
|
| Interest expense | 14.3 |
| | 8.9 |
|
| Interest expense on corporate funding | |
| Net operating revenues | 130.3 |
| | 114.3 |
|
| Compensation and other expenses: | | | |
| Compensation and benefits | 77.2 |
| | 70.6 |
|
| Compensation and benefits | |
| Compensation and benefits | |
| Trading systems and market information | 8.2 |
| | 8.9 |
|
| Professional fees | |
| Non-trading technology and support | |
| Occupancy and equipment rental | 4.1 |
| | 3.4 |
|
| Professional fees | 4.7 |
| | 4.8 |
|
| Selling and marketing | |
| Travel and business development | 3.5 |
| | 3.6 |
|
| Non-trading technology and support | 3.1 |
| | 2.9 |
|
| Communications | |
| Depreciation and amortization | 2.7 |
| | 2.4 |
|
| Communications | 1.4 |
| | 1.2 |
|
| Bad debts | 1.1 |
| | 2.5 |
|
| Bad debts (recoveries), net | |
| Other | 5.7 |
| | 5.6 |
|
| Total compensation and other expenses | 111.7 |
| | 105.9 |
|
| Gain on acquisition and other gains | |
| Income before tax | 18.6 |
| | 8.4 |
|
| Income tax expense | 25.5 |
| | 2.1 |
|
| Net (loss) income | $ | (6.9 | ) | | $ | 6.3 |
|
| (Loss) earnings per share: | | | |
| Net income | |
| Earnings per share: | |
| Basic | |
| Basic | |
| Basic | $ | (0.37 | ) | | $ | 0.34 |
|
| Diluted | $ | (0.37 | ) | | $ | 0.34 |
|
| Weighted-average number of common shares outstanding: | | | |
| Basic | 18,419,072 |
| | 18,248,244 |
|
| Basic | |
| Basic | |
| Diluted | 18,419,072 |
| | 18,484,995 |
|
|
See accompanying notes to the condensed consolidated financial statements.
INTL FCStone
StoneX Group Inc.
Condensed Consolidated Statements of Comprehensive (Loss) Income
(Unaudited)
|
| | | | | | | |
| | Three Months Ended December 31, |
| (in millions) | 2017 | | 2016 |
| Net (loss) income | $ | (6.9 | ) | | $ | 6.3 |
|
| Other comprehensive loss, net of tax: | | | |
| Foreign currency translation adjustment | (2.2 | ) | | (0.9 | ) |
| Other comprehensive loss | (2.2 | ) | | (0.9 | ) |
| Comprehensive (loss) income | $ | (9.1 | ) | | $ | 5.4 |
|
| | | | |
| | | | | | | | | | | | | | | | | | | | | | | |
| | Three Months Ended March 31, | | Six Months Ended March 31, |
| (in millions) | 2024 | | 2023 | | 2024 | | 2023 |
| Net income | $ | 53.1 | | | $ | 41.7 | | | $ | 122.2 | | | $ | 118.3 | |
| Other comprehensive (loss)/gain, net of tax: | | | | | | | |
| Foreign currency translation adjustment | (4.6) | | | 3.2 | | | 2.3 | | | 11.4 | |
| Cash flow hedges | (0.8) | | | 14.3 | | | 19.9 | | | 29.0 | |
| | | | | | | |
| | | | | | | |
| | | | | | | |
| | | | | | | |
| | | | | | | |
| | | | | | | |
| | | | | | | |
| | | | | | | |
| Total other comprehensive (loss)/gain, net of tax | (5.4) | | | 17.5 | | | 22.2 | | | 40.4 | |
| Comprehensive income | $ | 47.7 | | | $ | 59.2 | | | $ | 144.4 | | | $ | 158.7 | |
| | | | | | | |
See accompanying notes to the condensed consolidated financial statements.
INTL FCStone
StoneX Group Inc.
Condensed Consolidated Statements of Cash Flows
(Unaudited)
|
| | | | | | | |
| | Three Months Ended December 31, |
| (in millions) | 2017 | | 2016 |
| Cash flows from operating activities: | | | |
| Net (loss) income | $ | (6.9 | ) | | $ | 6.3 |
|
| Adjustments to reconcile net (loss) income to net cash used in operating activities: | | | |
| Depreciation and amortization | 2.7 |
| | 2.4 |
|
| Bad debts | 1.1 |
| | 2.5 |
|
| Deferred income taxes | 19.7 |
| | (3.5 | ) |
| Amortization of debt issuance costs | 0.3 |
| | 1.2 |
|
| Amortization of share-based compensation | 1.6 |
| | 0.8 |
|
| Gain on sale of property and equipment | (0.6 | ) | | (0.3 | ) |
| Changes in operating assets and liabilities, net: | | | |
| Cash, securities and other assets segregated under federal and other regulations | 24.2 |
| | 148.3 |
|
| Securities purchased under agreements to resell | (153.0 | ) | | (160.9 | ) |
| Securities borrowed | (9.0 | ) | | — |
|
| Deposits with and receivables from broker-dealers, clearing organizations, and counterparties | (14.2 | ) | | (151.4 | ) |
| Receivables from customers, net | (54.0 | ) | | (11.4 | ) |
| Notes receivable, net | — |
| | (1.3 | ) |
| Income taxes receivable | (0.4 | ) | | (1.3 | ) |
| Financial instruments owned, at fair value | (292.0 | ) | | (129.6 | ) |
| Physical commodities inventory, net | (121.0 | ) | | (88.6 | ) |
| Other assets | (2.5 | ) | | (7.8 | ) |
| Accounts payable and other accrued liabilities | (20.4 | ) | | (7.6 | ) |
| Payables to customers | 26.7 |
| | (35.3 | ) |
| Payables to broker-dealers, clearing organizations and counterparties | 69.6 |
| | (148.1 | ) |
| Income taxes payable | 0.9 |
| | 4.0 |
|
| Securities sold under agreements to repurchase | 257.4 |
| | 399.1 |
|
| Securities loaned | (2.3 | ) | | — |
|
| Financial instruments sold, not yet purchased, at fair value | 86.1 |
| | 65.9 |
|
| Net cash used in operating activities | (186.0 | ) | | (116.6 | ) |
| Cash flows from investing activities: | | | |
| Cash paid for acquisitions, net | — |
| | (6.0 | ) |
| Purchase of property and equipment | (3.2 | ) | | (3.0 | ) |
| Net cash used in investing activities | (3.2 | ) | | (9.0 | ) |
| Cash flows from financing activities: | | | |
| Net change in payable to lenders under loans | 192.9 |
| | 130.0 |
|
| Repayment of senior unsecured notes | — |
| | (45.5 | ) |
| Payments of note payable | (0.2 | ) | | (0.2 | ) |
| Deferred payments on acquisitions | (2.3 | ) | | — |
|
| Debt issuance costs | (0.1 | ) | | (0.1 | ) |
| Exercise of stock options | 1.5 |
| | 2.0 |
|
| Withholding taxes on stock option exercises | (0.8 | ) | | — |
|
| Income tax benefit on stock options and awards | — |
| | 0.6 |
|
| Net cash provided by financing activities | 191.0 |
| | 86.8 |
|
| Effect of exchange rates on cash and cash equivalents | 5.1 |
| | 1.4 |
|
| Net increase (decrease) in cash and cash equivalents | 6.9 |
| | (37.4 | ) |
| Cash and cash equivalents at beginning of period | 314.9 |
| | 316.2 |
|
| Cash and cash equivalents at end of period | $ | 321.8 |
| | $ | 278.8 |
|
| Supplemental disclosure of cash flow information: | | | |
| Cash paid for interest | $ | 11.3 |
| | $ | 7.6 |
|
| Income taxes paid, net of cash refunds | $ | 5.3 |
| | $ | 2.4 |
|
| Supplemental disclosure of non-cash investing and financing activities: | | | |
| Identified intangible assets from asset acquisitions | $ | — |
| | $ | 6.0 |
|
| | | | | | | | | | | |
| | Six Months Ended March 31, |
| (in millions) | 2024 | | 2023 |
| Cash flows from operating activities: | | | |
| Net income | $ | 122.2 | | | $ | 118.3 | |
| Adjustments to reconcile net income to net cash provided by/(used in) operating activities: | | | |
| Depreciation and amortization | 23.5 | | | 25.8 | |
| Amortization of right of use assets | 9.1 | | | 5.7 | |
| Bad debts (recoveries), net | (0.7) | | | 3.7 | |
| | | |
| Deferred income taxes | (3.3) | | | 1.8 | |
| Amortization of debt issuance costs | 2.6 | | | 2.8 | |
| | | |
| Amortization of share-based compensation | 16.8 | | | 14.9 | |
| | | |
| Gain on acquisition | — | | | (23.5) | |
| Changes in operating assets and liabilities, net: | | | |
| Securities and other assets segregated under federal and other regulations | 1.7 | | | 579.6 | |
| Securities purchased under agreements to resell | (765.1) | | | (951.2) | |
| Securities borrowed | (301.5) | | | 456.1 | |
| Deposits with and receivables from broker-dealers, clearing organizations, and counterparties, net | 133.2 | | | (1,314.1) | |
| Receivables from clients, net | (609.6) | | | (363.3) | |
| | | |
| Income taxes receivable | (7.7) | | | 3.7 | |
| Financial instruments owned, at fair value | (616.3) | | | (859.3) | |
| Physical commodities inventory, net | (79.6) | | | (36.1) | |
| | | |
| Other assets | (68.7) | | | (45.2) | |
| Accounts payable and other accrued liabilities | (41.7) | | | 60.1 | |
| Operating lease liabilities | (0.8) | | | (0.5) | |
| Payables to clients | 1,189.4 | | | 274.1 | |
| Payables to broker-dealers, clearing organizations, and counterparties | (50.7) | | | (101.8) | |
| Income taxes payable | (1.5) | | | 9.2 | |
| Securities sold under agreements to repurchase | 1,485.1 | | | 1,827.5 | |
| Securities loaned | 341.3 | | | (425.0) | |
| Financial instruments sold, not yet purchased, at fair value | 158.7 | | | 134.0 | |
| Net cash provided by/(used in) operating activities | 936.4 | | | (602.7) | |
| Cash flows from investing activities: | | | |
| Proceeds from notes receivable | 5.0 | | | — | |
| Acquisition of businesses and assets, net of cash received | (1.1) | | | (6.1) | |
| | | |
| Sale of exchange memberships and common stock | 0.1 | | | — | |
| | | |
| Purchases of property and equipment | (30.1) | | | (22.5) | |
| Net cash used in investing activities | (26.1) | | | (28.6) | |
| Cash flows from financing activities: | | | |
| Net change in payables to lenders under loans with maturities 90 days or less | (87.4) | | | 67.0 | |
| Proceeds from payables to lenders under loans with maturities greater than 90 days | — | | | 150.0 | |
| Repayments of payables to lenders under loans with maturities greater than 90 days | — | | | (151.0) | |
| | | |
| | | |
| Proceeds from issuance of senior secured notes | 550.0 | | | — | |
| | | |
| | | |
| | | |
| Deferred payments on acquisitions | — | | | (17.2) | |
| | | |
| | | |
| Debt issuance costs | (7.9) | | | — | |
| Shares withheld to cover taxes on vesting of equity awards | (1.2) | | | — | |
| Exercise of stock options | 3.5 | | | 3.6 | |
| | | |
| | | |
| Net cash provided by financing activities | 457.0 | | | 52.4 | |
| Effect of exchange rates on cash, restricted cash, segregated cash, cash equivalents, and segregated cash equivalents | 2.2 | | | 11.1 | |
| Net increase/(decrease) in cash, restricted cash, segregated cash, cash equivalents, and segregated cash equivalents | 1,369.5 | | | (567.8) | |
| Cash, restricted cash, segregated cash, cash equivalents, and segregated cash equivalents at beginning of period | 6,041.7 | | | 6,285.1 | |
| Cash, restricted cash, segregated cash, cash equivalents, and segregated cash equivalents at end of period | $ | 7,411.2 | | | $ | 5,717.3 | |
| Supplemental disclosure of cash flow information: | | | |
| Cash paid for interest | $ | 548.6 | | | $ | 337.5 | |
| Income taxes paid, net of cash refunds | $ | 56.0 | | | $ | 19.5 | |
| Supplemental disclosure of non-cash investing and financing activities: | | | |
| Additional consideration payable related to acquisition of customer list | $ | 0.8 | | | $ | — | |
| Identified intangible assets and goodwill on acquisitions | $ | — | | | $ | 10.3 | |
| Additional consideration payable related to acquisitions, net | $ | — | | | $ | 28.7 | |
| | | |
| Acquisition of business: | | | |
| Assets acquired | $ | — | | | $ | 143.0 | |
| Liabilities assumed | — | | | 84.1 | |
| Total net assets acquired | $ | — | | | $ | 58.9 | |
| | | |
| | | |
See accompanying notes to the condensed consolidated financial statements.
INTL FCStone
StoneX Group Inc.
Condensed Consolidated StatementStatements of Cash Flows - Continued
(Unaudited)
The following table provides a reconciliation of cash, segregated cash, cash equivalents, and segregated cash equivalents reported within the Condensed Consolidated Balance Sheets.
| | | | | | | | | | | |
| March 31, |
| (in millions) | 2024 | | 2023 |
| Cash and cash equivalents | $ | 1,305.1 | | | $ | 1,263.9 | |
Restricted cash(3) | 363.0 | | | — | |
Cash segregated under federal and other regulations(1) | 2,834.3 | | | 2,486.4 | |
Securities segregated under federal and other regulations(1) | — | | | 0.2 | |
Cash segregated and deposited with or pledged to exchange-clearing organizations and other futures commission merchants (“FCMs”)(2) | 1,362.9 | | | 1,032.5 | |
Securities segregated and pledged to exchange-clearing organizations(2) | 1,545.9 | | | 934.3 | |
| Total cash, restricted cash, segregated cash, cash equivalents, and segregated cash equivalents shown in the condensed consolidated statements of cash flows | $ | 7,411.2 | | | $ | 5,717.3 | |
(1) Represents segregated client cash held at third-party banks. Excludes segregated commodity warehouse receipts, segregated U.S. Treasury obligations with original or acquired maturities of greater than 90 days, and other assets of $4.1 million and $25.7 million as of March 31, 2024 and 2023, respectively, included within Cash, securities and other assets segregated under federal and other regulations on the Condensed Consolidated Balance Sheets.
(2) Represents segregated client cash and U.S. Treasury obligations on deposit with, or pledged to, exchange clearing organizations and other FCMs. Excludes non-segregated cash, segregated U.S. Treasury obligations pledged to exchange-clearing organizations with original or acquired maturities greater than 90 days, and other assets of $4,797.7 million and $5,649.5 million as of March 31, 2024 and 2023, respectively, included within Deposits with and receivables from broker-dealers, clearing organizations, and counterparties, net on the Condensed Consolidated Balance Sheets.
(3) Represents restricted cash held in an escrow account, as further described in Note 1 and Note 9.
See accompanying notes to the condensed consolidated financial statements.
StoneX Group Inc.
Condensed Consolidated Statements of Stockholders’ Equity
(Unaudited)
| | | | | | | | | | | | | | | | | | | | | | | | | | | | | | | | | | | |
| Three Months Ended March 31, 2023 |
| (in millions) | Common Stock | | Treasury Stock | | Additional Paid-in Capital | | Retained Earnings | | Accumulated Other Comprehensive Loss, net | | Total |
| Balances as of December 31, 2022 | $ | 0.4 | | | $ | (69.3) | | | $ | 347.0 | | | $ | 966.2 | | | $ | (67.7) | | | $ | 1,176.6 | |
| | | | | | | | | | | |
| | | | | | | | | | | |
| Net income | — | | | — | | | — | | | 41.7 | | | — | | | 41.7 | |
| Other comprehensive gain, net of tax | — | | | — | | | — | | | — | | | 17.5 | | | 17.5 | |
| Exercise of stock options | — | | | — | | | 2.1 | | | — | | | — | | | 2.1 | |
| Share-based compensation | — | | | — | | | 9.4 | | | — | | | — | | | 9.4 | |
| | | | | | | | | | | |
| Balances as of March 31, 2023 | $ | 0.4 | | | $ | (69.3) | | | $ | 358.5 | | | $ | 1,007.9 | | | $ | (50.2) | | | $ | 1,247.3 | |
|
| | | | | | | | | | | | | | | | | | | | | | | |
| (in millions) | Common Stock | | Treasury Stock | | Additional Paid-in Capital | | Retained Earnings | | Accumulated Other Comprehensive Loss, net | | Total |
| Balances as of September 30, 2017 | $ | 0.2 |
| | $ | (46.3 | ) | | $ | 259.0 |
| | $ | 261.5 |
| | $ | (24.5 | ) | | $ | 449.9 |
|
| Net loss | | | | | | | (6.9 | ) | | | | (6.9 | ) |
| Other comprehensive loss | | | | | | | | | (2.2 | ) | | (2.2 | ) |
| Exercise of stock options | | | | | 0.8 |
| | | | | | 0.8 |
|
| Share-based compensation | | | | | 1.6 |
| | | | | | 1.6 |
|
| Balances as of December 31, 2017 | $ | 0.2 |
| | $ | (46.3 | ) | | $ | 261.4 |
| | $ | 254.6 |
| | $ | (26.7 | ) | | $ | 443.2 |
|
| | | | | | | | | | | | | | | | | | | | | | | | | | | | | | | | | | | |
| Three Months Ended March 31, 2024 |
| (in millions) | Common Stock | | Treasury Stock | | Additional Paid-in Capital | | Retained Earnings | | Accumulated Other Comprehensive Loss, net | | Total |
| Balances as of December 31, 2023 | $ | 0.4 | | | $ | (69.3) | | | $ | 378.7 | | | $ | 1,197.2 | | | $ | (24.2) | | | $ | 1,482.8 | |
| Net income | — | | | — | | | — | | | 53.1 | | | — | | | 53.1 | |
| Other comprehensive loss, net of tax | — | | | — | | | — | | | — | | | (5.4) | | | (5.4) | |
| Exercise of stock options | — | | | — | | | 3.0 | | | — | | | — | | | 3.0 | |
| Shares withheld to cover taxes on vesting of equity awards | — | | | — | | | (0.1) | | | — | | | — | | | (0.1) | |
| Share-based compensation | — | | | — | | | 9.2 | | | — | | | — | | | 9.2 | |
| | | | | | | | | | | |
| Balances as of March 31, 2024 | $ | 0.4 | | | $ | (69.3) | | | $ | 390.8 | | | $ | 1,250.3 | | | $ | (29.6) | | | $ | 1,542.6 | |
| | | | | | | | | | | | | | | | | | | | | | | | | | | | | | | | | | | |
| Six Months Ended March 31, 2023 |
| (in millions) | Common Stock | | Treasury Stock | | Additional Paid-in Capital | | Retained Earnings | | Accumulated Other Comprehensive Loss, net | | Total |
| Balances as of September 30, 2022 | $ | 0.4 | | | $ | (69.3) | | | $ | 340.0 | | | $ | 889.6 | | | $ | (90.6) | | | $ | 1,070.1 | |
| | | | | | | | | | | |
| | | | | | | | | | | |
| Net income | — | | | — | | | — | | | 118.3 | | | — | | | 118.3 | |
| Other comprehensive gain, net of tax | — | | | — | | | — | | | — | | | 40.4 | | | 40.4 | |
| Exercise of stock options | — | | | — | | | 3.6 | | | — | | | — | | | 3.6 | |
| Share-based compensation | — | | | — | | | 14.9 | | | — | | | — | | | 14.9 | |
| | | | | | | | | | | |
| Balances as of March 31, 2023 | $ | 0.4 | | | $ | (69.3) | | | $ | 358.5 | | | $ | 1,007.9 | | | $ | (50.2) | | | $ | 1,247.3 | |
| | | | | | | | | | | | | | | | | | | | | | | | | | | | | | | | | | | |
| Six Months Ended March 31, 2024 |
| (in millions) | Common Stock | | Treasury Stock | | Additional Paid-in Capital | | Retained Earnings | | Accumulated Other Comprehensive Loss, net | | Total |
| Balances as of September 30, 2023 | $ | 0.4 | | | $ | (69.3) | | | $ | 371.7 | | | $ | 1,128.1 | | | $ | (51.8) | | | $ | 1,379.1 | |
| Net income | — | | | — | | | — | | | 122.2 | | | — | | | 122.2 | |
| Other comprehensive gain, net of tax | — | | | — | | | — | | | — | | | 22.2 | | | 22.2 | |
| Exercise of stock options | — | | | — | | | 3.5 | | | — | | | — | | | 3.5 | |
| Shares withheld to cover taxes on vesting of equity awards | — | | | — | | | (1.2) | | | — | | | — | | | (1.2) | |
| Share-based compensation | — | | | — | | | 16.8 | | | — | | | — | | | 16.8 | |
| | | | | | | | | | | |
| Balances as of March 31, 2024 | $ | 0.4 | | | $ | (69.3) | | | $ | 390.8 | | | $ | 1,250.3 | | | $ | (29.6) | | | $ | 1,542.6 | |
See accompanying notes to the condensed consolidated financial statements.
INTL FCStone
StoneX Group Inc.
Notes to the Condensed Consolidated Financial Statements
(Unaudited)
Note 1 – Basis of Presentation and Consolidation and Accounting Standards Adopted
INTL FCStoneStoneX Group Inc., a Delaware corporation, and its consolidated subsidiaries (collectively “INTL”“StoneX” or “the Company”), is a diversified global financial services organizationnetwork that connects companies, organizations, traders and investors to the global market ecosystem through a unique blend of digital platforms, end-to-end clearing and execution services, high touch service, and deep expertise. The Company strives to be the one trusted partner to its clients, providing its network, products and services to allow them to pursue trading opportunities, manage their market risks, make investments and improve their business performance. The Company offers a vertically integrated product suite, beginning with high-touch and electronic access to nearly all major financial markets worldwide, as well as numerous liquidity venues. The Company delivers access and services through the entire lifecycle of a trade, by delivering deep market expertise and on-the-ground intelligence, best execution, risk management and advisory services,finally post-trade clearing, custody, as well as settlement services. The Company has created revenue streams, diversified by asset class, client type and geography, that earn commissions, spreads, and principal revenue as clients execute transactions across its financial network, while monetizing non-trading client activity including interest and fee earnings on client balances as well as earning consulting fees for market intelligence and clearing services across asset classes and markets around the world. The Company’s services include comprehensive risk management advisory services for commercial customers; execution of listed futures and options on futures contracts on all major commodity exchanges; structured over-the-counter (“OTC”) products in a wide range of commodities; physical trading and hedging of precious metals and select other commodities; trading of more than 140 foreign currencies; market-making in international equities; fixed income; debt origination and asset management.services.
The Company provides theseits services to a diverse group of clients in more than 20,000 predominantly wholesale organizations located throughout the world, including producers, processors180 countries. These clients include more than 54,000 commercial, institutional, and end-users of nearly all widely-traded physical commodities to manage their riskspayments clients and enhance margins; toover 400,000 retail clients. The Company’s clients include commercial counterparties who are end-users of the Company’s productsentities, asset managers, regional, national and services; to governmental and non-governmental organizations; and to commercial banks,introducing broker-dealers, insurance companies, brokers, institutional investors and majorprofessional traders, commercial and investment banks.banks and government and non-governmental organizations (“NGOs”).
The Company’s common stock trades on The NASDAQ Global Select Market under the symbol “SNEX”.
Basis of Presentation and Consolidation
The accompanying unaudited condensed consolidated balance sheetCondensed Consolidated Balance Sheet as of September 30, 2017,2023, which has been derived from the audited consolidated financial statements,balance sheet of September 30, 2023, and the unaudited interim condensed consolidated financial statements have been prepared pursuant to the rules and regulations of the Securities and Exchange Commission (“SEC”). Certain information and note disclosures normally included in annual consolidated financial statements prepared in accordance with accounting principles generally accepted in the United States of America (“U.S. GAAP”) have been condensed or omitted pursuant to those rules and regulations. The Company believes that the included disclosures made are adequate to makeclearly and fairly present the information presented not misleading.within. In themanagement’s opinion, of management, all adjustments, (consistinggenerally consisting of normal recurring accruals)accruals, considered necessary for a fair presentation ofto fairly present the condensed consolidated financial statements for the interim periods presented have been reflected as required by Rule 10-01 of Regulation S-X.
Operating results for interim periods are not necessarily indicative of the results that may be expected for the full year. These interim condensed consolidated financial statements should be read in conjunction with the Company’s audited consolidated financial statements and related notes contained in the Company’s Annual Report on Form 10-K for the fiscal year ended September 30, 20172023, as filed with the SEC.
These condensed consolidated financial statements include the accounts of INTL FCStoneStoneX Group Inc. and all other entities in which the Company has a controlling financial interest. All material intercompany transactions and balances have been eliminated in consolidation.
The Company’s fiscal year end is September 30, and theits fiscal quarters end on December 31, March 31, June 30 and September 30. Unless otherwise stated, all dates refer to fiscal years and fiscal interim periods.
The preparation ofPreparing condensed consolidated financial statements in conformity with U.S. GAAP requires management to make estimates and assumptions that affect the reported amounts of assets and liabilities, disclosure of contingent liabilities as of the date of the condensed consolidated financial statements and the reported amounts of revenue and expenses during the reporting period. The most significant of these estimates and assumptions relate to fair value measurement for financial instruments, and investments, revenue recognition, the provision for potential losses from bad debts, valuation of inventories, valuationand income taxes. These estimates are based on management’s best knowledge of goodwillcurrent events and intangible assets, incomes taxes,actions the Company may undertake in the future. The Company reviews all significant estimates affecting the financial statements on a recurring basis and contingencies.records the effect of any necessary adjustments prior to financial statement issuance. Although these and other estimates and assumptions are based on the best available information, actual results could be materially different from these estimates. Estimates and assumptions were considered and made in context with the information reasonably available to the Company as of March 31, 2024 and through the date of this Form 10-Q.
In the condensed consolidated income statements,Condensed Consolidated Income Statements, the total revenues reported combine gross revenues for the physical commodities business and net revenues for all other businesses. The subtotal ‘operating revenues’Operating revenues in the condensed consolidated income statementsCondensed
Consolidated Income Statements is calculated by deducting physical commodities costCost of sales of physical commoditiesfrom total revenues.Total revenues. The subtotal ‘netNet operating revenues’revenues in the condensed consolidated income statementsCondensed Consolidated Income Statements is calculated as operatingOperating revenues less transaction-based clearing expenses, introducing broker commissions and interest expense. Transaction-based clearing expenses, Introducing broker commissions, Interest expense, and Interest expense on corporate funding. Transaction-based clearing expenses represent variable expenses paid to executing brokers, exchanges, clearing organizations and banks in relation to transactional volumes. Introducing broker commissions include commission paid to certain non-employee third parties that have introduced customersclients to the Company. Net operating revenues represent revenues available to pay variable compensation to risk management consultants and traders, and direct non-variable expenses, as well as variable and non-variable expenses ofto operational and administrative employees.
Common Stock Split
ReclassificationsOn November 7, 2023, the Company’s Board of Directors approved a three-for-two split of its common stock, to be effected as a stock dividend. The stock split was effective on November 24, 2023, and entitled each shareholder of record as of November 17, 2023 to receive one additional share of common stock for every two shares owned and cash in lieu of fractional shares.
DuringThe stock split increased the quarter ended December 31, 2017,number of shares of common stock outstanding. All share and per share amounts contained herein have been retroactively adjusted for the Company separately classified non-trading technology and support costs that were previously included within ‘Other’ onstock split.
The shares of common stock retain a par value of $0.01 per share. Accordingly, an amount equal to the condensed consolidated income statements. Additionally, during the quarter ended December 31, 2017, the Company separately classified communications related expenses separately from trading systems and market information related costs. In performing these reclassifications, the Company has made immaterial, retrospective adjustments to conform to our current period presentation. For the three months December 31, 2016, ‘Other’ expenses included $2.9 million of expenses that are now included within ‘Non-trading technology and support’ on the condensed consolidated income statements. For the three months ended December 31, 2016, ‘Trading systems and market information’ included $1.2 million of expenses that are now included within ‘Communications’ on the condensed consolidated income statements.
Accounting Standards Adopted
In March 2016, the Financial Accounting Standards Board (“FASB”) issued Accounting Standards Update No. 2016-09, “Compensation - Stock Compensation (Topic 718): Improvements to Employee Share-Based Payment Accounting” (“ASU 2016-09”), which simplifies several aspectspar value of the accounting for share-based payment transactions. Under ASU 2016-09, excess tax benefits and tax deficiencies are recognized as income tax expense or benefit inincreased shares resulting from the income statement instead of additional paid in capital. ASU 2016-09 also provides entities with the optionstock split was reclassified from Additional paid-in-capital to elect an accounting policy to estimate forfeitures of stock-based awards over the service period (current GAAP) or account for forfeitures when they occur. Under ASU 2016-09, previously unrecognized excess tax benefits should be recognized using a modified retrospective transition. In addition, amendments requiring recognition of excess tax benefits and tax deficiencies in the income statement, as well as changes in the computation of weighted-average diluted shares outstanding, should be applied prospectively. ASU 2016-09 is effective for and was adopted by the Company in the first quarter of 2018 and the impact of the adoption resulted in the following:Common stock.
Restricted Cash
During the three months ended DecemberMarch 31, 2017,2024, the Company recognized excess tax benefits from stock-based compensationestablished an escrow account designated to hold immediately available funds deposited by the Company and distribute the same amount on June 15, 2024, the intended redemption date, for the settlement of $0.2 million within income tax expense on the condensed consolidated income statement and within net income on the condensed consolidated cash flow statement. Prior to adoption, the tax effect of stock-based awards would have been recognized in additional paid-in-capital on the condensed consolidated balance sheets and separately stated in the financing activities in the condensed consolidated cash flow statements.its 8.625% Senior Secured Notes due 2025. The Company has electedclassified these funds as restricted because the funding is irrevocable, and the Company does not have the ability to adopt this guidance prospectively.withdraw the funds. See Note 9.
Gain on Acquisition
In October 2022, the Company’s wholly owned subsidiary, StoneX Netherlands B.V., acquired CDI-Societe Cotonniere De Distribution S.A. The fair value of identifiable net assets acquired was approximately $66.2 million and the purchase price was approximately $42.7 million. The value that the Company acquired in excess of consideration paid resulted in a gain on acquisition of $23.5 million for the six months ended March 31, 2023.
Accounting Standards
The Company has elected to estimate forfeitures of stock-based awards as they occur. The Company elected to account for forfeitures as they occur using a modified retrospective transition method. The adoption of this guidance did not have a material impact on our condensed consolidated financial statements.
The excess tax benefits from the assumed proceeds available to repurchase shares were excluded in the computation of diluted earnings per share foradopt any new accounting standards during the three and six months ended DecemberMarch 31, 2017. The Company has elected to adopt this guidance prospectively.2024.
For the three months ended December 31, 2017, the Company has classified as a financing activity in the condensed consolidated cash flow statement $0.8 million of cash paid to taxing authorities for restricted stock shares withheld to satisfy statutory income tax withholding obligations. The retrospective application of this guidance had no impact on the condensed consolidated cash flow statement for the three months ended December 31, 2016.
In July 2015, the FASB issued ASU No. 2015-11, “Simplifying the Measurement of Inventory (Topic 330).” Under ASU 2015-11, inventory that is measured using the first-in, first-out (FIFO), specific identification, or average cost methods should be measured at the lower of cost or net realizable value. This ASU does not impact inventory measurement under the last-in, first-out (LIFO) or retail inventory methods. For public companies, this ASU is effective for financial statements issued for annual periods beginning after December 15, 2016, and interim periods within those annual periods, with early adoption permitted. The amendments from this update are to be applied prospectively. The Company adopted this ASU prospectively on the effective date of October 1, 2017. The adoption of this ASU has not had a material impact on our condensed consolidated financial statements.
Note 2 – Earnings (loss) per Share
The Company presents basic and diluted earnings (loss) per share (“EPS”) using the two-class method, which requires all outstanding unvested share-based payment awards that contain rights to non-forfeitable dividends and therefore participate in undistributed earnings with common stockholders be included in computing earnings (loss) per share. Under the two-class method, net earnings areincome is reduced by the amount of dividends declared in the period for each class of common stock and participating security. The remaining undistributed earnings (loss) are then allocated to common stock and participating securities, based on their respective rights to receive dividends. Restricted stock awards granted to certain employees and directors contain non-forfeitable rights to dividends at the same rate as common stock and are considered participating securities. Basic EPS has been computed by dividing net (loss) income by the weighted-average number of common shares outstanding.
The following is a reconciliation of the numerator and denominator of the diluted earnings (loss) per share computations for the periods presented below.
| | | | | | | | | | | | | | | | | | | | | | | |
| | Three Months Ended March 31, | | Six Months Ended March 31, |
| (in millions, except share amounts) | 2024 | | 2023 | | 2024 | | 2023 |
| Numerator: | | | | | | | |
| Net income | $ | 53.1 | | | $ | 41.7 | | | $ | 122.2 | | | $ | 118.3 | |
| Less: Allocation to participating securities | (1.9) | | | (1.5) | | | (4.3) | | | (4.0) | |
| Net income allocated to common stockholders | $ | 51.2 | | | $ | 40.2 | | | $ | 117.9 | | | $ | 114.3 | |
| | | | | | | |
| | | | | | | |
| | | | | | | |
| | | | | | | |
| | | | | | | |
| | | | | | | |
| Denominator: | | | | | | | |
| Weighted average number of: | | | | | | | |
| Common shares outstanding | 30,473,856 | | | 29,895,041 | | | 30,352,824 | | | 29,775,078 | |
| Dilutive potential common shares outstanding: | | | | | | | |
| Share-based awards | 1,025,087 | | | 1,036,751 | | | 1,020,915 | | | 1,055,792 | |
| Diluted weighted-average common shares | 31,498,943 | | | 30,931,792 | | | 31,373,739 | | | 30,830,870 | |
|
| | | | | | | |
| | Three Months Ended December 31, |
| (in millions, except share amounts) | 2017 | | 2016 |
| Numerator: | | | |
| Net (loss) income | $ | (6.9 | ) | | $ | 6.3 |
|
| Less: Allocation to participating securities | — |
| | (0.1 | ) |
| Net (loss) income allocated to common stockholders | $ | (6.9 | ) | | $ | 6.2 |
|
| Denominator: | | | |
| Weighted average number of: | | | |
| Common shares outstanding | 18,419,072 |
|
| 18,248,244 |
|
| Dilutive potential common shares outstanding: | | | |
| Share-based awards | — |
| | 236,751 |
|
| Diluted weighted-average common shares | 18,419,072 |
| | 18,484,995 |
|
The dilutive effect of share-based awards is reflected in diluted earnings (loss)net income per share by application ofapplying the treasury stock method, which includes consideration of unamortized share-based compensation expense required under the Compensation – Stock Compensation Topic of the ASC.expense.
Options to purchase 489,7211,849,986 and 914,453185,058 shares of common stock for the three months ended DecemberMarch 31, 20172024 and 2016,2023, respectively, were excluded from the calculation of diluted earnings per share as they would have been anti-dilutive. Options to purchase 1,321,535 and 272,094 shares of common stock for the six months ended March 31, 2024 and 2023, respectively, were excluded from the calculation of diluted earnings per share as they would have been anti-dilutive.
Note 3 – Assets and Liabilities, at Fair Value
Fair value is defined by U.S. GAAP as the exchange price that would be received for an asset or paid to transfer a liability (an exit price) in the principal or most advantageous market for the asset or liability in an orderly transaction between willing market participants on the measurement date.
Fair value is a market-based measure considered from the perspective of a market participant rather than an entity-specific measure. Therefore, evenEven when market assumptions are not readily available, the Company is required to develop a set of assumptions that reflect those that market participants would use in pricing thean asset or liability at the measurement date. The Company uses prices and inputs that are current as of the measurement date, including periods of market dislocation. In periods of market dislocation, the observability of prices and inputs may be reduced for many securities. This condition could cause a security to be reclassified to a lower level within the fair value hierarchy.
The Company has designed independent price verification controls and periodically performs such controls to ensuremitigate risks related to the reasonableness of such values.prices.
Financial and nonfinancial assets and liabilities are classified in their entirety based on the lowest level of input that is significant to the fair value measurement. The hierarchy gives the highest priority to unadjusted quoted prices in active markets for identical assets or liabilities (Level 1 measurements) and the lowest priority to unobservable inputs (Level 3 measurements). A market is active if there are sufficient transactions on an ongoing basis to provide current pricing information for the asset or liability, pricing information is released publicly, and price quotations do not vary substantially either over time or among market participants. Observable inputs reflect the assumptions market participants would use in pricing the asset or liability developed based on market data obtained from sources independent of the reporting entity.
Relevant guidance requires the Company to consider counterparty credit risk of all parties to outstanding derivative instruments that would be considered by a market participant in the transfer or settlement of such contracts (exit price). The Company’s exposure to credit risk on derivative financial instruments principally relates to the portfolio of Over-the-counter (“OTC”) derivative contracts as all exchange-traded contracts held can be settled on an active market with a credit guarantee from the respective exchange. The Company requires each counterparty to deposit margin collateral for all OTC instruments and is also required to deposit margin collateral with counterparties. The Company has assessed the nature of these deposits and used its discretion to adjust each based on the underlying credit considerations for the counterparty and determined that the collateral deposits minimize the exposure to counterparty credit risk in the evaluation of the fair value of OTC instruments as determined by a market participant.
In accordance with FASB ASCFinancial Accounting Standards Board (“FASB”) Accounting Standards Codification (“ASC”) 820, Fair Value Measurement, the Company groups its assets and liabilities measured at fair value in three levels based on the markets in which the assets and liabilities are traded and the reliability of the assumptions used to determine fair value. These levels are:
Level 1 - Valuation is based upon unadjusted quoted prices in active markets that are accessible at the measurement date for identical, unrestricted assets or liabilities. Level 1 consists of financial assets and liabilities whose fair values are estimated using quoted market prices.
Level 2 - Valuation is based upon quoted prices for identical or similar assets or liabilities in markets that are less active, that is, markets in which there are few transactions for the asset or liability that are observable for substantially the full term. Included in Level 2 are those financial assets and liabilities for which fair values are estimated using models or other valuation methodologies. These models are primarily industry-standard models that consider various observable inputs, including time value, yield curve, volatility factors, observable current market and contractual prices for the underlying financial instruments, as well as other relevant economic measures.
Level 3 - Valuation is generated frombased on prices or valuation techniques that require an inputinputs that isare both significant to the fair value measurement and unobservable (i.e., supported by little or no market activity). Level 3 comprises financial assets and liabilities whose fair value is estimated based on internally developed models or methodologies utilizing significant inputs that are not readily observable from objective sources.
Financial and nonfinancial assets and Level 3 includes contingent liabilities that have been valued using an income approach based upon management developed discounted cash flow projections, which are classified in their entirety based on the lowest level of input that is significant to the fair value measurement. The hierarchy gives the highest priority to unadjusted quoted prices in active markets for identical assets or liabilities (Level 1 measurements) and the lowest priority toan unobservable inputs (Level 3 measurements). A market is active if there are sufficient transactions on an ongoing basis to provide current pricing information for the asset or liability, pricing information is released publicly, and price quotations do not vary substantially either over time or among market makers. Observable inputs reflect the assumptions market participants would use in pricing the asset or liability developed based on market data obtained from sources independent of the reporting entity.
The guidance requires the Company to consider counterparty credit risk of all parties of outstanding derivative instruments that would be considered by a market participant in the transfer or settlement of such contracts (exit price). The Company’s exposure to credit risk on derivative financial instruments relates to the portfolio of OTC derivative contracts as all exchange-traded contracts held can be settled on an active market with a credit guarantee by the respective exchange. The Company requires each counterparty to deposit margin collateral for all OTC instruments and is also required to deposit margin collateral with counterparties. The Company has assessed the nature of these deposits and used its discretion to adjust each based on the underlying credit considerations for the counterparty and determined that the collateral deposits minimize the exposure to counterparty credit risk in the evaluation of the fair value of OTC instruments as determined by a market participant.input.
Fair value of financial and nonfinancial assets and liabilities that are carried on the Condensed Consolidated Balance Sheets at fair value on a recurring basis
Cash and cash equivalents reported at fair value on a recurring basis includes certificates of deposit and money market mutual funds, which are stated at cost plus accrued interest, which approximates fair value.
Cash, securities and other assets segregated under federal and other regulations reported at fair value on a recurring basis include the value of pledged investments, primarily U.S. Treasury obligations and commodities warehouse receipts.
Deposits with and receivables from broker-dealers, clearing organizations and counterparties and payable to customersclients and broker-dealers, clearing organizations and counterparties includeincludes the fair value of pledged investments, primarily U.S. Treasury obligations and foreign government obligations. These balances also include the fair value of exchange-traded options on futures and exchange-cleared OTC forwards, swaps and options determined by quoted prices on the applicable exchange.options.
Financial instruments owned and sold, not yet purchased include the fair value of equity securities, which includes common, preferred, and preferred stock,foreign ordinary shares, American Depository Receipts (“ADRs”), and Global Depository Receipts (“GDRs”), exchangeable foreign ordinary equities, ADRs, and GDRs,exchange-traded funds (“ETFs”), corporate and municipal debt obligations,bonds, U.S. Treasury obligations, U.S. government agency obligations, foreign government obligations, agency mortgage-backed obligations, asset-backed obligations, derivative financial instruments, commodities warehouse receipts, exchange firm common stock, and mutual funds and investments in managed funds. The fair value of exchange firm common stock is determined by quoted market prices, and the fair value of exchange memberships is determined by recent sale transactions.
Physical commodities inventory recorded at fair value on a recurring basis includes precious metals that are a part of the trading activities of a regulated broker-dealer subsidiary and is recorded at fair value using spot prices. Physical commodities inventory also includes agricultural commodities that are a part of the trading activities of a non-broker dealer subsidiary and are also recorded at net realizable value using spot prices. Precious metals inventory held by subsidiaries that are not broker-dealers are valued at fair value on a non-recurring basis. Except as disclosed in Note 6, the Company did not have any fair value adjustments for assets or liabilities measured at fair value on a non-recurring basis as of December 31, 2017 and September 30, 2017.
Cash equivalents, debt and equity securities, commodities warehouse receipts, physical commodities inventory, derivative financial instruments and contingent liabilities are carried at fair value, on a recurring basis, and are classified and disclosed into three levels in the fair value hierarchy.
The following section describes the valuation methodologies used by the Company to measure classes of financial instruments at fair value and specifies the level within the fair value hierarchy where various financial instruments are classified.
The Company uses quoted prices in active markets, where available, and classifies instruments with such instrumentsquotes within Level 1 of the fair value hierarchy. Examples include U.S. Treasury obligations, foreign government obligations, commodities warehouse receipts, some common and preferred stock, ADRs, and GDRs, some exchangeable foreign ordinary equities, ADRs, and GDRs, some corporate and municipal obligations,certain equity securities traded in active markets, physical precious metals agricultural, and energy commodities, equityinventory held by a regulated broker-dealer subsidiary, exchange firm common stock, investments in exchange firms, mutualmanaged funds,
as well as futures and options on futures contracts traded on national exchanges. The fair value of exchange membershipsfirm common stock is determined by recent sale transactions and is included within Level 1.
When instruments are traded in secondary markets and observable prices are not available for substantially the full term, the Company generally relies on internal valuation techniques based upon observable inputs for comparable financial instruments, or prices obtained from third-party pricing services or brokers or a combination thereof, and accordingly, classified these instruments as Level 2. Examples include corporate and municipal bonds, U.S. government agency obligations, agency-mortgage backed obligations, asset-backed obligations, foreign government obligations, some common and preferred stock, ADRs, and GDRs, certain exchangeable foreign ordinary equities, ADRs, and GDRs, OTC commodity and foreign exchange forwards, swaps, and options, OTC firm purchase and sale commitments related to precious metals commodities,equity securities traded in less active markets, and OTC firmderivative contracts, which include purchase and sale commitments related to the Company’s foreign exchange, agricultural, and energy commodities.
DerivativesCertain derivatives without a quoted price in an active market and derivatives executed OTC are valued using internal valuation techniques, including pricing models which utilize significant inputs observable to market participants. The valuation techniques and inputs depend on the type of derivative and the nature of the underlying instrument. The key inputs depend upon the type of derivative and the nature of the underlying instrument and include interest yield curves, foreign exchange rates, commodity prices, volatilities and correlation. These derivative instruments are included within Level 2 of the fair value hierarchy.
Physical commodities inventory includes precious metals that are a part of the trading activities of a regulated broker-dealer subsidiary and is recorded at fair value using exchange-quoted prices. Physical commodities inventory also includes agricultural commodities that are a part of the trading activities of a non-broker dealer subsidiary and are recorded at net realizable value using exchange-quoted prices. The fair value of precious metals physical commodities inventory is based upon unadjusted exchange-quoted prices and is, therefore, classified within Level 1 of the fair value hierarchy. The fair value of agricultural physical commodities inventory and the related OTC firm sale and purchase commitments are generally based upon exchange-quoted prices, adjusted for basis or differences in local markets, broker or dealer quotations or market transactions in either listed or OTC markets. Exchange-quoted prices are adjusted for location and quality because the exchange-quoted prices for agricultural and energy related products represent contracts that have standardized terms for commodity, quantity, future delivery period, delivery location, and commodity quality or grade. The basis or local market adjustments are observable inputs or have an insignificant impact on the measurement of fair value and, therefore, the agricultural physical commodities inventory, as well as the related OTC forward firm sale and purchase commitments have been included within Level 2 of the fair value hierarchy.
With the exception of certain derivative instruments where the valuation approach is disclosed above, financial instruments owned and sold are primarily valued using third partythird-party pricing sources. Third partyThird-party pricing vendors compile prices from various sources and often apply matrix pricing for similar securities when no pricesmarket-observable transactions for the instruments are observable.not
observable for substantially the full term. The Company reviews the pricing methodologies providedused by the variousthird-party pricing vendors in order to determine if observable market information is being used, versus unobservable inputs.evaluate the fair value hierarchy classification of vendor-priced financial instruments and the accuracy of vendor pricing, which typically involves comparing of primary vendor prices to internal trader prices or secondary vendor prices. When evaluating the propriety of an internal trader price compared with vendorvendor-priced financial instruments using secondary prices, considerations include the range and quality of vendor prices. Trader or broker prices, are used to ensure the reasonablenesslevel of a vendor price; however valuing financialobservable transactions for identical and similar instruments, involvesand judgments acquired frombased upon knowledge of a particular market.market and asset class. If a trader asserts that athe primary vendor or market price isdoes not reflective of marketrepresent fair value, justification for using the tradera secondary price, including recent sales activity where possible, must be providedsource data used to make the determination, is subject to review and approvedapproval by the appropriate levels of management.authorized personnel prior to using a secondary price. Financial instruments owned and sold that are valued using third party pricing sources are included within either Level 1 or Level 2 of the fair value hierarchy based upon the observability of the inputs used and the level of activity in the market.
Level 3 comprises financial assets and liabilities whose fair value is estimated based on internally developed models or methodologies utilizing significant inputs that are not readily observable from objective sources. Included in Level 3 are some common stock and ADRs, some corporate and municipal obligations, and contingent liabilities. Level 3 assets and liabilities are valued using an income approach based upon management developed discounted cash flow projections, which are an unobservable input.
The fair value estimates presented herein are based on pertinent information available to management as of DecemberMarch 31, 20172024 and September 30, 2017.2023. Although management is not aware of any factors that would significantly affect the estimated fair value amounts, such amounts have not been comprehensively revalued for purposes of these condensed consolidated financial statements since that date and current estimates of fair value may differ significantly from the amounts presented herein.
The following tables set forth the Company’s financial and nonfinancial assets and liabilities accounted for at fair value, on a recurring basis, as of DecemberMarch 31, 20172024 and September 30, 2023 by level in the fair value hierarchy. |
| | | | | | | | | | | | | | | | | | | |
| | December 31, 2017 |
| (in millions) | Level 1 | | Level 2 | | Level 3 | | Netting and
Collateral
(1) | | Total |
| Assets: | | | | | | | | | |
| Unrestricted cash equivalents - certificate of deposits | $ | 4.7 |
| | $ | — |
| | $ | — |
| | $ | — |
| | $ | 4.7 |
|
| Commodities warehouse receipts | 14.9 |
| | — |
| | — |
| | — |
| | 14.9 |
|
| U.S. Treasury obligations | 1.6 |
| | — |
| | — |
| | — |
| | 1.6 |
|
| Securities and other assets segregated under federal and other regulations | 16.5 |
| | — |
| | — |
| | — |
| | 16.5 |
|
| U.S. Treasury obligations | 219.1 |
| | — |
| | — |
| | — |
| | 219.1 |
|
| "To be announced" (TBA) and forward settling securities | — |
| | 1.7 |
| | — |
| | (0.6 | ) | | 1.1 |
|
| Foreign government obligations | — |
| | 6.2 |
| | — |
| | — |
| | 6.2 |
|
| Derivatives | 3,068.1 |
| | 188.7 |
| | — |
| | (3,429.5 | ) | | (172.7 | ) |
| Deposits with and receivables from broker-dealers, clearing organization and counterparties | 3,287.2 |
| | 196.6 |
| | — |
| | (3,430.1 | ) | | 53.7 |
|
| Common and preferred stock, ADRs, and GDRs | 30.5 |
| | 3.4 |
| | 0.1 |
| | — |
| | 34.0 |
|
| Exchangeable foreign ordinary equities, ADRs, and GDRs | 9.0 |
| | 1.1 |
| | — |
| | — |
| | 10.1 |
|
| Corporate and municipal bonds | 45.1 |
| | 0.6 |
| | — |
| | — |
| | 45.7 |
|
| U.S. Treasury obligations | 76.8 |
| | — |
| | — |
| | — |
| | 76.8 |
|
| U.S. government agency obligations | — |
| | 587.7 |
| | — |
| | — |
| | 587.7 |
|
| Foreign government obligations | — |
| | 11.3 |
| | — |
| | — |
| | 11.3 |
|
| Agency mortgage-backed obligations | — |
| | 1,053.4 |
| | — |
| | — |
| | 1,053.4 |
|
| Asset-backed obligations | — |
| | 21.6 |
| | — |
| | — |
| | 21.6 |
|
| Derivatives | 1.4 |
| | 1,577.8 |
| | — |
| | (1,444.3 | ) | | 134.9 |
|
| Commodities leases | — |
| | 178.9 |
| | — |
| | (168.5 | ) | | 10.4 |
|
| Commodities warehouse receipts | 56.1 |
| | — |
| | — |
| | — |
| | 56.1 |
|
| Exchange firm common stock | 8.9 |
| | — |
| | — |
| | — |
| | 8.9 |
|
| Mutual funds and other | 5.0 |
| | — |
| | — |
| | — |
| | 5.0 |
|
| Financial instruments owned | 232.8 |
| | 3,435.8 |
| | 0.1 |
| | (1,612.8 | ) | | 2,055.9 |
|
| Physical commodities inventory, net | 142.7 |
| | — |
| | — |
| | — |
| | 142.7 |
|
| Total assets at fair value | $ | 3,683.9 |
| | $ | 3,632.4 |
| | $ | 0.1 |
| | $ | (5,042.9 | ) | | $ | 2,273.5 |
|
| Liabilities: | | | | | | | | | |
| TBA and forward settling securities | — |
| | 1.7 |
| | — |
| | (0.6 | ) | | 1.1 |
|
| Derivatives | 3,169.6 |
| | 212.5 |
| | — |
| | (3,382.1 | ) | | — |
|
| Payable to broker-dealers, clearing organizations and counterparties | 3,169.6 |
| | 214.2 |
| | — |
| | (3,382.7 | ) | | 1.1 |
|
| Common and preferred stock, ADRs, and GDRs | 48.6 |
| | 1.2 |
| | — |
| | — |
| | 49.8 |
|
| Exchangeable foreign ordinary equities, ADRs, and GDRs | 10.2 |
| | — |
| | — |
| | — |
| | 10.2 |
|
| Corporate and municipal bonds | 0.3 |
| | — |
| | — |
| | — |
| | 0.3 |
|
| U.S. Treasury obligations | 404.6 |
| | — |
| | — |
| | — |
| | 404.6 |
|
| U.S. government agency obligations | — |
| | 35.5 |
| | — |
| | — |
| | 35.5 |
|
| Agency mortgage-backed obligations | — |
| | 3.9 |
| | — |
| | — |
| | 3.9 |
|
| Derivatives | — |
| | 1,634.6 |
| | — |
| | (1,385.3 | ) | | 249.3 |
|
| Commodities leases | — |
| | 186.4 |
| | — |
| | (136.7 | ) | | 49.7 |
|
| Financial instruments sold, not yet purchased | 463.7 |
| | 1,861.6 |
| | — |
| | (1,522.0 | ) | | 803.3 |
|
| Total liabilities at fair value | $ | 3,633.3 |
| | $ | 2,075.8 |
| | $ | — |
| | $ | (4,904.7 | ) | | $ | 804.4 |
|
| |
(1) | Represents cash collateral and the impact of netting across the levels of the fair value hierarchy. Netting among positions classified within the same level is included in that level. |
The following table sets forth the Company’s financial and nonfinancial assets and liabilities accounted for at All fair value measurements were performed on a recurring basis as of March 31, 2024 and September 30, 2017 by2023.
| | | | | | | | | | | | | | | | | | | | | | | | | | | | | |
| | March 31, 2024 |
| (in millions) | Level 1 | | Level 2 | | Level 3 | | Netting (1) | | Total |
| Assets: | | | | | | | | | |
| Certificates of deposit | $ | 18.1 | | | $ | — | | | $ | — | | | $ | — | | | $ | 18.1 | |
| Money market mutual funds | 99.9 | | | — | | | — | | | — | | | 99.9 | |
| Cash and cash equivalents | 118.0 | | | — | | | — | | | — | | | 118.0 | |
| Commodities warehouse receipts | 4.1 | | | — | | | — | | | — | | | 4.1 | |
| | | | | | | | | |
| Securities and other assets segregated under federal and other regulations | 4.1 | | | — | | | — | | | — | | | 4.1 | |
| U.S. Treasury obligations | 3,405.5 | | | — | | | — | | | — | | | 3,405.5 | |
| To be announced and forward settling securities | — | | | 25.3 | | | — | | | (22.4) | | | 2.9 | |
| Foreign government obligations | 19.0 | | | — | | | — | | | — | | | 19.0 | |
| Derivatives | 4,489.9 | | | 1,592.6 | | | — | | | (5,352.6) | | | 729.9 | |
| Deposits with and receivables from broker-dealers, clearing organizations and counterparties, net | 7,914.4 | | | 1,617.9 | | | — | | | (5,375.0) | | | 4,157.3 | |
| Receivables from clients, net - Derivatives | 167.0 | | | 533.9 | | | — | | | (704.3) | | | (3.4) | |
| Equity securities | 466.7 | | | 14.5 | | | — | | | — | | | 481.2 | |
| Corporate and municipal bonds | — | | | 339.9 | | | — | | | — | | | 339.9 | |
| U.S. Treasury obligations | 517.7 | | | — | | | — | | | — | | | 517.7 | |
| U.S. government agency obligations | — | | | 466.2 | | | — | | | — | | | 466.2 | |
| Foreign government obligations | 41.3 | | | — | | | — | | | — | | | 41.3 | |
| Agency mortgage-backed obligations | — | | | 3,186.0 | | | — | | | — | | | 3,186.0 | |
| Asset-backed obligations | — | | | 136.9 | | | — | | | — | | | 136.9 | |
| Derivatives | 0.5 | | | 960.5 | | | — | | | (600.5) | | | 360.5 | |
| Commodities leases | — | | | 15.3 | | | — | | | — | | | 15.3 | |
| Commodities warehouse receipts | 74.9 | | | — | | | — | | | — | | | 74.9 | |
| Exchange firm common stock | 12.9 | | | — | | | — | | | — | | | 12.9 | |
| Cash flow hedges | — | | | 7.1 | | | — | | | — | | | 7.1 | |
| Mutual funds and other | 23.8 | | | — | | | 2.8 | | | — | | | 26.6 | |
| Financial instruments owned | 1,137.8 | | | 5,126.4 | | | 2.8 | | | (600.5) | | | 5,666.5 | |
| Physical commodities inventory | 166.8 | | | 188.4 | | | — | | | — | | | 355.2 | |
| Total assets at fair value | $ | 9,508.1 | | | $ | 7,466.6 | | | $ | 2.8 | | | $ | (6,679.8) | | | $ | 10,297.7 | |
| Liabilities: | | | | | | | | | |
| Accounts payable and other accrued liabilities | $ | — | | | $ | — | | | $ | 1.7 | | | $ | — | | | $ | 1.7 | |
| Payables to clients - Derivatives | 4,483.9 | | | 225.7 | | | — | | | (4,124.0) | | | 585.6 | |
| TBA and forward settling securities | — | | | 22.9 | | | — | | | (21.9) | | | 1.0 | |
| Derivatives | 166.8 | | | 1,747.0 | | | — | | | (1,936.1) | | | (22.3) | |
| Payable to broker-dealers, clearing organizations and counterparties | 166.8 | | | 1,769.9 | | | — | | | (1,958.0) | | | (21.3) | |
| Equity securities | 275.8 | | | 4.8 | | | — | | | — | | | 280.6 | |
| Foreign government obligations | 45.0 | | | — | | | — | | | — | | | 45.0 | |
| Corporate and municipal bonds | — | | | 174.4 | | | — | | | — | | | 174.4 | |
| U.S. Treasury obligations | 2,239.4 | | | — | | | — | | | — | | | 2,239.4 | |
| U.S. government agency obligations | — | | | 27.2 | | | — | | | — | | | 27.2 | |
| Agency mortgage-backed obligations | — | | | 7.6 | | | — | | | — | | | 7.6 | |
| Asset-backed obligations | — | | | 5.3 | | | — | | | — | | | 5.3 | |
| Derivatives | 9.3 | | | 974.1 | | | — | | | (546.7) | | | 436.7 | |
| Cash flow hedges | — | | | 5.7 | | | — | | | — | | | 5.7 | |
| | | | | | | | | |
| Other | — | | | — | | | 1.1 | | | — | | | 1.1 | |
| Financial instruments sold, not yet purchased | 2,569.5 | | | 1,199.1 | | | 1.1 | | | (546.7) | | | 3,223.0 | |
| Total liabilities at fair value | $ | 7,220.2 | | | $ | 3,194.7 | | | $ | 2.8 | | | $ | (6,628.7) | | | $ | 3,789.0 | |
(1)Represents cash collateral and the impact of netting across at each level inof the fair value hierarchy.
| | | | September 30, 2017 | | September 30, 2023 |
| (in millions) | Level 1 | | Level 2 | | Level 3 | | Netting and
Collateral
(1) | | Total | (in millions) | Level 1 | | Level 2 | | Level 3 | | Netting (1) | | Total |
| Assets: | | | | | | | | | |
| Unrestricted cash equivalents - certificates of deposits | $ | 3.8 |
| | $ | — |
| | $ | — |
| | $ | — |
| | $ | 3.8 |
|
| Certificates of deposit | |
| Certificates of deposit | |
| Certificates of deposit | |
| Money market mutual funds | |
| Cash and cash equivalents | |
| Commodities warehouse receipts | 21.0 |
| | — |
| | — |
| | — |
| | 21.0 |
|
| U.S. Treasury obligations | 33.5 |
| | — |
| | — |
| | — |
| | 33.5 |
|
| | Securities and other assets segregated under federal and other regulations | |
| Securities and other assets segregated under federal and other regulations | |
| Securities and other assets segregated under federal and other regulations | 54.5 |
| | — |
| | — |
| | — |
| | 54.5 |
|
| U.S. Treasury obligations | 244.7 |
| | — |
| | — |
| | — |
| | 244.7 |
|
| "To be announced" (TBA) and forward settling securities | — |
| | 8.8 |
| | — |
| | — |
| | 8.8 |
|
| TBA and forward settling securities | |
| Foreign government obligations | — |
| | 6.4 |
| | — |
| | — |
| | 6.4 |
|
| Derivatives | 2,608.6 |
| | 289.1 |
| | — |
| | (2,952.9 | ) | | (55.2 | ) |
| Deposits with and receivables from broker-dealers, clearing organizations, and counterparties | 2,853.3 |
| | 304.3 |
| | — |
| | (2,952.9 | ) | | 204.7 |
|
| Common and preferred stock, ADRs, and GDRs | 31.2 |
| | 3.4 |
| | 0.1 |
| | — |
| | 34.7 |
|
| Exchangeable foreign ordinary equities, ADRs, and GDRs | 9.2 |
| | 1.2 |
| | — |
| | — |
| | 10.4 |
|
| Deposits with and receivables from broker-dealers, clearing organizations and counterparties, net | |
| Receivables from clients, net - Derivatives | |
| Equity securities | |
| Corporate and municipal bonds | 28.2 |
| | 0.9 |
| | — |
| | — |
| | 29.1 |
|
| U.S. Treasury obligations | 60.0 |
| | — |
| | — |
| | — |
| | 60.0 |
|
| U.S. government agency obligations | — |
| | 368.9 |
| | — |
| | — |
| | 368.9 |
|
| Foreign government obligations | — |
| | 10.2 |
| | — |
| | — |
| | 10.2 |
|
| Agency mortgage-backed obligations | — |
| | 920.9 |
| | — |
| | — |
| | 920.9 |
|
Asset-backed obligations
| — |
| | 47.3 |
| | — |
| | — |
| | 47.3 |
|
| Derivatives | 1.3 |
| | 1,413.4 |
| | — |
| | (1,252.6 | ) | | 162.1 |
|
| Commodities leases | — |
| | 174.1 |
| | — |
| | (138.7 | ) | | 35.4 |
|
| Commodities warehouse receipts | 38.5 |
| | — |
| | — |
| | — |
| | 38.5 |
|
| Exchange firm common stock | 8.3 |
| | — |
| | — |
| | — |
| | 8.3 |
|
| Cash flow hedges | |
| Mutual funds and other | 6.0 |
| | — |
| | — |
| | — |
| | 6.0 |
|
| | Financial instruments owned | 182.7 |
| | 2,940.3 |
| | 0.1 |
| | (1,391.3 | ) | | 1,731.8 |
|
| Physical commodities inventory, net | 73.2 |
| | — |
| | — |
| | — |
| | 73.2 |
|
| Financial instruments owned | |
| Financial instruments owned | |
| Physical commodities inventory | |
| Total assets at fair value | $ | 3,167.5 |
| | $ | 3,244.6 |
| | $ | 0.1 |
| | $ | (4,344.2 | ) | | $ | 2,068.0 |
|
| Liabilities: | | | | | | | | | |
| Accounts payable and other accrued liabilities - contingent liabilities | $ | — |
| | $ | — |
| | $ | 1.0 |
| | $ | — |
| | $ | 1.0 |
|
| Accounts payable and other accrued liabilities - contingent liabilities | |
| Accounts payable and other accrued liabilities - contingent liabilities | |
| Payables to clients - Derivatives | |
| TBA and forward settling securities | — |
| | 4.9 |
| | — |
| | (0.1 | ) | | 4.8 |
|
| Derivatives | 2,476.2 |
| | 292.8 |
| | — |
| | (2,769.0 | ) | | — |
|
| Payable to broker-dealers, clearing organizations and counterparties | 2,476.2 |
| | 297.7 |
| | — |
| | (2,769.1 | ) | | 4.8 |
|
| Common and preferred stock, ADRs, and GDRs | 33.7 |
| | 0.7 |
| | — |
| | — |
| | 34.4 |
|
| Exchangeable foreign ordinary equities, ADRs, and GDRs | 10.3 |
| | 0.2 |
| | — |
| | — |
| | 10.5 |
|
| Equity securities | |
| Foreign government obligations | |
| Corporate and municipal bonds | 0.3 |
| | — |
| | — |
| | — |
| | 0.3 |
|
| U.S. Treasury obligations | 285.9 |
| | — |
| | — |
| | — |
| | 285.9 |
|
| U.S. government agency obligations | — |
| | 27.9 |
| | — |
| | — |
| | 27.9 |
|
| Agency mortgage-backed obligations | — |
| | 0.1 |
| | — |
| | — |
| | 0.1 |
|
| Derivatives | — |
| | 1,427.2 |
| | — |
| | (1,110.2 | ) | | 317.0 |
|
| Commodities leases | — |
| | 191.1 |
| | — |
| | (149.6 | ) | | 41.5 |
|
| Cash flow hedges | |
| Other | |
| | Financial instruments sold, not yet purchased | |
| Financial instruments sold, not yet purchased | |
| Financial instruments sold, not yet purchased | 330.2 |
| | 1,647.2 |
| | — |
| | (1,259.8 | ) | | 717.6 |
|
| Total liabilities at fair value | $ | 2,806.4 |
| | $ | 1,944.9 |
| | $ | 1.0 |
| | $ | (4,028.9 | ) | | $ | 723.4 |
|
| |
(1) | Represents cash collateral and the impact of netting across the levels of the fair value hierarchy. Netting among positions classified within the same level is included in that level. |
(1)Represents cash collateral and the impact of netting across at each level of the fair value hierarchy.
Realized and unrealized gains and losses are included in ‘tradingPrincipal gains, net’net, Interest income, and ‘interest income’Cost of sales of physical commodities in the condensed consolidated income statements.Condensed Consolidated Income Statements.
Information on Level 3 Financial Assets and Liabilities
The Company’s financial assets at fair value classified in Level 3
|
| | | | | | | |
| (in millions) | December 31, 2017 | | September 30, 2017 |
| Total Level 3 assets | $ | 0.1 |
| | $ | 0.1 |
|
| Level 3 assets for which the Company bears economic exposure | $ | 0.1 |
| | $ | 0.1 |
|
| Total assets | $ | 6,808.9 |
| | $ | 6,243.4 |
|
| Total assets at fair value | $ | 2,273.5 |
| | $ | 2,068.0 |
|
| Total Level 3 assets as a percentage of total assets | — | % | | — | % |
| Level 3 assets for which the Company bears economic exposure as a percentage of total assets | — | % | | — | % |
| Total Level 3 assets as a percentage of total financial assets at fair value | — | % | | — | % |
The following tables set forth a summary of changes in the fair value of the Company’s Level 3 financial assets and liabilities during the three months ended December 31, 2017 and 2016, including a summary of unrealized gains (losses) during the respective periods on the Company’s Level 3 financial assets and liabilities still held as of December 31, 2017.
|
| | | | | | | | | | | | | | | | | | | | | | | | | | | |
| | Level 3 Financial Assets and Financial Liabilities For the Three Months Ended December 31, 2017 |
| (in millions) | Balances at
beginning of
period | | Realized gains
(losses) during
period | | Unrealized
gains (losses)
during period | | Purchases/issuances | | Settlements | | Transfers in
or (out) of
Level 3 | | Balances at
end of period |
| Assets: | | | | | | | | | | | | | |
| Common stock and ADRs | $ | 0.1 |
| | $ | — |
| | $ | — |
| | $ | — |
| | $ | — |
| | $ | — |
| | $ | 0.1 |
|
| | $ | 0.1 |
| | $ | — |
| | $ | — |
| | $ | — |
| | $ | — |
| | $ | — |
| | $ | 0.1 |
|
| | | | | | | | | | | | | | |
|
| | | | | | | | | | | | | | | | | | | | | | | | | | | |
| | Level 3 Financial Assets and Financial Liabilities For the Three Months Ended December 31, 2016 |
| (in millions) | Balances at
beginning of
period | | Realized gains
(losses) during
period | | Unrealized
gains (losses)
during period | | Purchases/issuances | | Settlements | | Transfers in
or (out) of
Level 3 | | Balances at
end of period |
| Assets: | | | | | | | | | | | | | |
| Common stock and ADRs | $ | 0.2 |
| | $ | — |
| | $ | — |
| | $ | — |
| | $ | — |
| | $ | — |
| | $ | 0.2 |
|
| Corporate and municipal bonds | 3.0 |
| | — |
| | — |
| | — |
| | (3.0 | ) | | — |
| | — |
|
| | $ | 3.2 |
| | $ | — |
| | $ | — |
| | $ | — |
| | $ | (3.0 | ) | | $ | — |
| | $ | 0.2 |
|
| | | | | | | | | | | | | | |
| (in millions) | Balances at
beginning of
period | | Realized (gains)
losses during
period | | Unrealized
(gains) losses
during period | | Purchases/issuances | | Settlements | | Transfers in
or (out) of
Level 3 | | Balances at
end of period |
| Liabilities: | | | | | | | | | | | | | |
| Contingent liabilities | $ | 0.8 |
| | $ | — |
| | $ | — |
| | $ | — |
| | $ | — |
| | $ | — |
| | $ | 0.8 |
|
The Company is required to make additional future cash payments based on certain financial performance measures of an acquired business. The Company was required to remeasure the fair value of contingent consideration arrangements on a recurring basis. As of September 30, 2017, the Company had classified its liability for the contingent consideration within Level 3 of the fair value hierarchy because the fair value was determined using significant unobservable inputs, which included projected cash flows. The estimated fair value of the earn-outs was based upon management-developed earnings forecasts for the remaining contingency period, which was a Level 3 input in the fair value hierarchy. The fair value of the contingent consideration increased by less than $0.1 million during the three months ended December 31, 2017 and 2016 with the corresponding amount classified as ‘other’ in the condensed consolidated income statements. The contingency period for the contingent consideration arrangements ended as of December 31, 2017. The accrued balance of $1.0 million is included within ‘accounts payable and other accrued liabilities’ on the condensed consolidated balance sheet at an amount approximating fair value with the final payment due in February 2018.
The Company reports transfers in and out of Levels 1, 2 and 3, as applicable, using the fair value of the securities as of the beginning of the reporting period in which the transfer occurred. The Company did not have any transfers in and out of Levels 1, 2, and 3 during the three months ended December 31, 2017 and 2016.
Additional disclosures about the fair value of financial instruments that are not carried on the Condensed Consolidated Balance Sheets at fair value
Many, but not all, of the financial instruments that the Company holds are recorded at fair value in the Condensed Consolidated Balance Sheets. The following represents financial instruments infor which the ending balance at DecemberMarch 31, 20172024 and September 30, 20172023 was not carried at fair value on the Condensed Consolidated Balance Sheets in accordance with U.S. GAAP on our Condensed Consolidated Balance Sheets:GAAP:
Short-term financial instruments: instruments:The carrying value of short-term financial instruments, including cash and cash equivalents, cash segregated under federal and other regulations, securities purchased under agreements to re-sellresell and securities sold under agreements to re-purchase,repurchase, and securities borrowed and loaned are recorded at amounts that approximate the fair value of these instruments due to their short-term nature and level of collateralization. These financial instruments generally expose usthe Company to limited credit risk and have no stated maturities or have short-term maturities and carry interest rates that approximate market rates. Under the fair value hierarchy, cash and cash equivalents and cash segregated under federal and other regulations are classified as Level 1. Securities purchased under agreements to re-sellresell and securities sold under agreements to re-purchase,repurchase, and securities borrowed and loaned are classified as Level 2 under the fair value hierarchy as they are generally overnight or short-term in nature and are collateralized by common stock,equity securities, U.S. Treasury obligations, U.S. government agency obligations, agency mortgage-backed obligations, and asset-backed obligations.
Receivables and other assets: Receivablesassets:Receivables from broker-dealers, clearing organizations, and counterparties, receivables from customers,clients, net, notes receivables, net and certain other assets are recorded at amounts that approximate fair value due to their short-term nature and are classified as Level 2 under the fair value hierarchy.
Payables: PayablesPayables:Payables to customersclients and payables to brokers-dealers,broker-dealers, clearing organizations, and counterparties are recorded at amounts that approximate fair value due to their short-term nature and are classified as Level 2 under the fair value hierarchy.
LenderLenders under loans: Payables to lenders under loans carry variable rates of interest and thus approximate fair value and are classified as Level 2 under the fair value hierarchy.
Senior secured borrowings, net: Senior secured borrowings, net includes the Company's 8.625% Senior Secured Notes due 2025 (the “Senior Secured Notes 2025”) and the Company’s 7.875% Senior Secured Notes due 2031 (the “Senior Secured Notes 2031”), as further described in Note 9, with a carrying value of $343.7 million and $542.2 million, respectively, as of March 31, 2024. The carrying value of the Senior Secured Notes 2025 and Senior Secured Notes 2031 represent their principal amount net of unamortized deferred financing costs and original issue discount. As of March 31, 2024, the Senior Secured Notes 2025 had a fair value of $349.4 million and the Senior Secured Notes 2031 had a fair value of $557.8 million, with both being classified as Level 2 under the fair value hierarchy. Note 4 – Financial Instruments with Off-Balance Sheet Risk and Concentrations of Credit Risk
The Company is party to certain financial instruments with off-balance sheet risk in the normal course of its business. The Company has sold financial instruments that it does not currently own and will therefore be obliged to purchase such financial instruments at a future date. The Company has recorded these obligations in the condensed consolidated financial statements as of DecemberMarch 31, 20172024 and September 30, 20172023 at the fair values of the related financial instruments. The Company will incur losses if the fair value of the underlying financial instruments increases subsequent to DecemberMarch 31, 2017.2024. The total financial instruments sold, not yet purchased of $803.3$3,223.0 million and $717.6$3,085.6 million as of DecemberMarch 31, 20172024 and September 30, 2017,2023, respectively, includes $249.3$436.7 million and $317.0$261.2 million for derivative contracts not designated as hedges, respectively, which represented a liability to the Company based on their fair values as of DecemberMarch 31, 20172024 and September 30, 2017.2023.
Derivatives
The Company utilizes derivative products in its trading capacity as a dealer in order to satisfy customerclient needs and mitigate risk. The Company manages risks from both derivatives and non-derivative cash instruments on a consolidated basis. The risks of derivatives should not be viewed in isolation, but in aggregate with the Company’s other trading activities. The majority of the Company’s derivative positions are included in the condensed consolidated balance sheetsCondensed Consolidated Balance Sheets in ‘DepositsDeposits with and receivables from broker-dealers, clearing organizations and counterparties’counterparties, ‘FinancialReceivables from clients, net, Financial instruments owned at fair value’, ‘Financial instrumentsand sold, not yet purchased, at fair value’value, Payable to clients and ‘PayablesPayables to broker-dealers, clearing organizations and counterparties’counterparties.
The Company employs an interest rate risk management strategy using derivative financial instruments in the form
Listed below are the fair values of the Company’s derivative assets and liabilities as of DecemberMarch 31, 20172024 and September 30, 2017.2023. Assets represent net unrealized gains and liabilities represent net unrealized losses. | | | | December 31, 2017 | | September 30, 2017 | | March 31, 2024 | | September 30, 2023 |
| (in millions) | Assets (1) | | Liabilities (1) | | Assets (1) | | Liabilities (1) | (in millions) | Assets (1) | | Liabilities (1) | | Assets (1) | | Liabilities (1) |
| Derivative contracts not accounted for as hedges: | | | | | | | |
| Exchange-traded commodity derivatives | |
| Exchange-traded commodity derivatives | |
| Exchange-traded commodity derivatives | $ | 2,515.9 |
| | $ | 2,660.1 |
| | $ | 2,094.2 |
| | $ | 1,975.0 |
|
| OTC commodity derivatives | 1,208.9 |
| | 1,270.9 |
| | 1,084.0 |
| | 1,110.3 |
|
| Exchange-traded foreign exchange derivatives | 53.0 |
| | 32.3 |
| | 66.0 |
| | 52.0 |
|
| OTC foreign exchange derivatives | 533.4 |
| | 530.8 |
| | 618.5 |
| | 609.8 |
|
| Exchange-traded interest rate derivatives | 203.1 |
| | 234.8 |
| | 228.4 |
| | 203.6 |
|
| OTC interest rate derivatives | 24.2 |
| | 24.2 |
| | — |
| | — |
|
| Exchange traded equity index derivatives | 297.5 |
| | 263.6 |
| | 221.3 |
| | 245.4 |
|
| Exchange-traded equity index derivatives | |
| OTC equity and indices derivatives | |
| TBA and forward settling securities | 1.7 |
| | 1.7 |
| | 8.8 |
| | 4.9 |
|
| Subtotal | |
| Derivative contracts designated as hedging instruments: | |
| Interest rate contracts | |
| Interest rate contracts | |
| Interest rate contracts | |
| Foreign currency forward contracts | |
| Subtotal | |
| Gross fair value of derivative contracts | 4,837.7 |
| | 5,018.4 |
| | 4,321.2 |
| | 4,201.0 |
|
| Impact of netting and collateral | (4,874.4 | ) | | (4,768.0 | ) | | (4,205.5 | ) | | (3,879.2 | ) |
| Total fair value included in ‘Deposits with and receivables from broker-dealers, clearing organizations, and counterparties’ | $ | (171.6 | ) | | | | $ | (46.4 | ) | | |
| Total fair value included in ‘Financial instruments owned, at fair value’ | $ | 134.9 |
| | | | $ | 162.1 |
| | |
| Total fair value included in ‘Payables to broker-dealers, clearing organizations and counterparties | | | $ | 1.1 |
| | | | $ | 4.8 |
|
| Fair value included in ‘Financial instruments sold, not yet purchased, at fair value’ | | | $ | 249.3 |
| | | | $ | 317.0 |
|
Total fair value included in Deposits with and receivables from broker-dealers, clearing organizations, and counterparties, net | |
Total fair value included in Receivable from clients, net | |
Total fair value included in Receivable from clients, net | |
Total fair value included in Receivable from clients, net | |
Total fair value included in Financial instruments owned, at fair value | |
Total fair value included in Financial instruments owned, at fair value | |
Total fair value included in Financial instruments owned, at fair value | |
Total fair value included in Payables to clients | |
Total fair value included in Payables to clients | |
Total fair value included in Payables to clients | |
Total fair value included in Payables to broker-dealers, clearing organizations and counterparties | |
Total fair value included in Financial instruments sold, not yet purchased, at fair value | |
| |
(1) | As of December 31, 2017 and September 30, 2017, the Company’s derivative contract volume for open positions were approximately 6.8 million and 6.1 million contracts, respectively.(1)As of March 31, 2024 and September 30, 2023, the Company’s derivative contract volume for open positions was approximately 11.8 million and 13.4 million contracts, respectively.
|
The Company’s derivative contracts are principally held in its Institutional, Commercial, Hedging and Clearing and Execution ServicesRetail segments. The Company provides its Institutional segment clients access to exchanges at which they can carry out their trading strategies. The Company assists its Commercial Hedging segment customersclients in protecting the value of their future production by entering into option or forward agreements with them on an OTC basis. The Company also provides its Commercial Hedging segment customersclients with optionexchange products, including combinations of buying and selling puts and calls. In its Retail segment, the Company provides its retail clients with access to spot foreign exchange, precious metals trading, as well as contracts for difference (“CFD”) and spread bets, where permitted. The Company mitigates its risk by generally offsetting the customer’sclient’s transaction simultaneously with one of the Company’s trading counterparties or will offset that transaction with a similar but not identical exchange-traded position.position on the exchange. The risk mitigation of these offsetting trades is not within the documented hedging designation requirements of the Derivatives and Hedging Topic of the ASC. These derivative contracts are traded along with cash transactions because of the integrated nature of the markets for these products. The Company manages the risks associated with derivatives on an aggregate basis along with the risks associated with its proprietary trading and market-making activities in cash instruments as part of its firm-wide risk management policies. In particular, the risks related to derivative positions may be partially offset by inventory, unrealized gains in inventoryother derivatives, or cash collateral paid or received.
Hedging Activities
The Company has derivative instruments, which consist of mortgage-backed TBA securities and forward settling transactions that are used to manage risk exposuresuses interest rate derivatives, in the form of swaps, to hedge risk related to variability in overnight rates. These hedges are designated cash flow hedges, through which the Company mitigates uncertainty in its interest income by converting floating-rate interest income to fixed-rate interest income. While the swaps mitigate interest rate risk, they do introduce credit risk, which is the possibility that the Company’s trading inventorycounterparty fails to meet its obligation. The Company minimizes this risk by entering into its swaps with highly-rated, multi-national institutions. In addition to credit risk, there is market risk
associated with the swap positions. The Company’s market risk is limited, because any amounts the Company must pay from having exchanged variable interest will be funded by the variable interest the Company receives on its deposits. As of March 31, 2024, the Company’s hedges will all have matured in less than 1 year from the end of the current period.
The Company also uses foreign currency derivatives, in the form of forward contracts, to hedge risk related to the variability in exchange rates relative to certain of the Company’s domestic institutionalnon-USD expenditures. These hedges are designated cash flow hedges, through which the Company mitigates variability in exchange rates by exchanging foreign currency for USD at fixed income business.exchange rates at a pre-determined future date, or several cash flows at several pre-determined future dates. While the forward contracts mitigate exchange rate variability risk, they do introduce credit risk, which is the possibility that the Company’s trading counterparty fails to meet its obligation. The Company minimizes this risk by entering into its forward contracts with highly-rated, multi-national institutions. These hedges will all mature within 2 years from the end of the current period.
The Company assesses the effectiveness of its hedges at each reporting period to identify any required reclassifications into current earnings. During the three months ended March 31, 2024 and 2023, the Company did not designate any portion of its hedges as ineffective and thus did not have any values in current earnings related to ineffective hedges. The fair value on these transactions are recorded in deposits with and receivables from or payables to broker-dealers, clearing organizations and counterparties. Realized and unrealized gains and losses on securities andvalues of derivative transactions are reflected in ‘trading gains, net’.
The Company enters into TBA securities transactionsinstruments designated for the sole purposehedging held as of managing risk associated with the purchase of mortgage pass-through securities. TBA securities are included within deposits with and receivables from and payables to broker-dealers, clearing organizations and counterparties. Forward settling securities represent non-regular way securities and are included in financial instruments owned and sold. As of DecemberMarch 31, 20172024 and September 30, 2017, these transactions2023 are summarizedas follow:
| | | | | | | | | | | | | | | | | |
| | | | March 31, 2024 | | September 30, 2023 |
| (in millions) | Balance Sheet Location | | Fair Value | | Fair Value |
| Asset Derivatives | | | | | |
| Derivatives designated as hedging instruments: | | | | | |
| | | | | |
| Foreign currency forward contracts | Financial instruments owned, net | | $ | 7.1 | | | $ | 1.7 | |
| Total derivatives designated as hedging instruments | | | $ | 7.1 | | | $ | 1.7 | |
| | | | | |
Derivative assets expected to be released from Other comprehensive income into current earnings: | | | | | |
| | | | | |
| Foreign currency forward contracts | | | $ | 5.6 | | | $ | 1.4 | |
Total expected to be released from Other comprehensive income into earnings | | | $ | 5.6 | | | $ | 1.4 | |
| | | | | |
| Liability Derivatives | | | | | |
| Derivatives designated as hedging instruments: | | | | | |
| Interest rate contracts | Financial instruments sold, not yet purchased | | $ | 5.7 | | | $ | 24.6 | |
| Foreign currency forward contracts | Financial instruments sold, not yet purchased | | — | | | 2.5 | |
| Total derivatives designated as hedging instruments | | | $ | 5.7 | | | $ | 27.1 | |
| | | | | |
Derivative liabilities expected to be released from Other comprehensive income into current earnings: | | | | | |
| Interest rate contracts | | | $ | 5.7 | | | $ | 20.3 | |
| Foreign currency forward contracts | | | — | | | 1.0 | |
Total expected to be released from Other comprehensive income into earnings | | | $ | 5.7 | | | $ | 21.3 | |
The notional values of derivative instruments designated for hedging held as of March 31, 2024 and September 30, 2023 are as follows:
| | | | | | | | | | | | | | |
| | | March 31, 2024 | | September 30, 2023 |
| (in millions) | | Notional Value | | Notional Value |
| Derivatives designated as hedging instruments: | | | | |
| Interest rate contracts | | $ | 1,000.0 | | | $ | 2,000.0 | |
| Foreign currency forward contracts: | | | | |
| Foreign currency forward contracts to purchase Polish Zloty: | | | | |
| Local currency | | zł | 156.1 | | | zł | 156.1 | |
| USD | | $ | 35.8 | | | $ | 34.0 | |
| Foreign currency forward contracts to purchase British Pound Sterling: | | | | |
| Local currency | | £ | 120.0 | | | £ | 168.0 | |
| USD | | $ | 147.6 | | | $ | 206.9 | |
|
| | | | | | | | | | | | | | | |
| | December 31, 2017 | | September 30, 2017 |
| (in millions) | Gain / (Loss) | | Notional Amounts | | Gain / (Loss) | | Notional Amounts |
| Unrealized gain on TBA securities purchased within receivables from broker-dealers, clearing organizations and counterparties and related notional amounts (1) | $ | 0.9 |
| | $ | 525.4 |
| | $ | — |
| | $ | 51.3 |
|
| Unrealized loss on TBA securities purchased within receivables from broker-dealers, clearing organizations and counterparties and related notional amounts (1) | $ | (0.1 | ) | | $ | 203.1 |
| | $ | (2.9 | ) | | $ | 1,236.8 |
|
| Unrealized gain on TBA securities sold within payables to broker-dealers, clearing organizations and counterparties and related notional amounts (1) | $ | 0.5 |
| | $ | (554.8 | ) | | $ | 5.8 |
| | $ | (1,881.9 | ) |
| Unrealized loss on TBA securities sold within payables to broker-dealers, clearing organizations and counterparties and related notional amounts (1) | $ | (1.4 | ) | | $ | (1,041.7 | ) | | $ | (0.1 | ) | | $ | (404.1 | ) |
| Unrealized gain (loss) on forward settling securities purchased within receivables from broker-dealers, clearing organizations and counterparties and related notional amounts | $ | 0.3 |
| | $ | 240.2 |
| | $ | (2.0 | ) | | $ | 882.9 |
|
| Unrealized (loss) gain on forward settling securities sold within receivables from and payables to broker-dealers, clearing organizations and counterparties and related notional amounts | $ | (0.2 | ) | | $ | (107.6 | ) | | $ | 3.0 |
| | $ | (590.2 | ) |
| (1) The notional amounts of these instruments reflect the extent of the Company's involvement in TBA and forward settling securities and do not represent risk of loss due to counterparty non-performance. | | | | | | | |
| | | | | | | | | | | | | | | | | | | | | | | | | |
| (in millions) | Income Statement Location | | Three Months Ended March 31, 2024 | | Six Months Ended March 31, 2024 | | |
| Total amounts reclassified from Accumulated Other Comprehensive Income into Income: | | | | | | | | | | | | | |
| Interest rate contracts | Interest income | | $ | (4.6) | | | $ | (20.5) | | | | | | | | | |
| Foreign currency forward contracts | Compensation and benefits | | 1.8 | | | 3.7 | | | | | | | | | |
| Total derivatives designated as hedging instruments | | | $ | (2.8) | | | $ | (16.8) | | | | | | | | | |
| | | | | | | | | | | | | |
| | | | | | | | | | | | | |
| | | | | | | | | | | | | |
| Amount of gain reclassified from accumulated other comprehensive income into income as a result of a forecasted transaction that is no longer probable of occurring | | | $ | — | | | $ | — | | | | | | | | | |
| | | | | | | | | | | | | | | | | | | | | | | | | |
| (in millions) | Income Statement Location | | Three Months Ended March 31, 2023 | | Six Months Ended March 31, 2023 | | |
| Total amounts reclassified from Accumulated Other Comprehensive Income into Income: | | | | | | | | | | | | | |
| Interest rate contracts | Interest Income | | $ | (11.6) | | | $ | (17.0) | | | | | | | | | |
| Foreign currency forward contracts | Compensation and benefits | | 0.7 | | | 0.5 | | | | | | | | | |
| Total derivatives designated as hedging instruments | | | $ | (10.9) | | | $ | (16.5) | | | | | | | | | |
| | | | | | | | | | | | | |
| | | | | | | | | | | | | |
| | | | | | | | | | | | | |
| Amount of gain reclassified from accumulated other comprehensive income into income as a result of a forecasted transaction that is no longer probable of occurring | | | $ | — | | | $ | — | | | | | | | | | |
The accumulated other comprehensive income effects of derivative instruments designated for hedging held for three and six months ended March 31, 2024 and 2023 are as follow:
| | | | | | | | | | | |
| Amount of Gain/(Loss) Recognized in Other Comprehensive Income on Derivatives, net of tax |
| (in millions) | Three Months Ended March 31, 2024 | | Three Months Ended March 31, 2023 |
| Derivatives in Cash Flow Hedging Relationships: | | | |
| Interest rate contracts | $ | 1.7 | | | $ | 10.6 | |
| Foreign currency forward contracts | (2.5) | | | 3.7 | |
| Total | $ | (0.8) | | | $ | 14.3 | |
| | | | | | | | | | | |
| Amount of Gain Recognized in Other Comprehensive Income on Derivatives, net of tax |
| (in millions) | Six Months Ended March 31, 2024 | | Six Months Ended March 31, 2023 |
| Derivatives in Cash Flow Hedging Relationships: | | | |
| Interest rate contracts | $ | 14.3 | | | $ | 9.2 | |
| Foreign currency forward contracts | 5.6 | | | 19.8 | |
| Total | $ | 19.9 | | | $ | 29.0 | |
The following table sets forth the Company’s gains net gains/(losses) related to derivative financial instruments for the three and six months ended DecemberMarch 31, 20172024 and 20162023 in accordance with the Derivatives and Hedging Topic of the ASC. The net gainsgains/(losses) set forth below are included in ‘CostPrincipal gains, net and Cost of sales of physical commodities’ and ‘Trading gains, net’commodities in the condensed consolidated income statements.Condensed Consolidated Income Statements.
| | | | | | | | | | | | | | | | | | | | | | | |
| Three Months Ended March 31, | | Six Months Ended March 31, |
| (in millions) | 2024 | | 2023 | | 2024 | | 2023 |
| Commodities | $ | 30.4 | | | $ | 147.8 | | | $ | 117.5 | | | $ | 202.0 | |
| Foreign exchange | 32.6 | | | (72.8) | | | 57.8 | | | (24.0) | |
| | | | | | | |
| Interest rate, equities, and indices | 15.5 | | | 25.6 | | | 42.9 | | | 33.9 | |
| TBA and forward settling securities | 25.5 | | | (14.1) | | | (67.7) | | | (37.1) | |
| Net gains from derivative contracts | $ | 104.0 | | | $ | 86.5 | | | $ | 150.5 | | | $ | 174.8 | |
|
| | | | | | | |
| | Three Months Ended December 31, |
| (in millions) | 2017 | | 2016 |
| Commodities | $ | 7.7 |
| | $ | 4.9 |
|
| Foreign exchange | 2.3 |
| | 1.2 |
|
| Interest rate | 0.4 |
| | (1.0 | ) |
| TBA and forward settling securities | (0.4 | ) | | 13.4 |
|
| Net gains from derivative contracts | $ | 10.0 |
| | $ | 18.5 |
|
Credit Risk
In the normal course of business, the Company purchases and sells financial instruments, commodities and foreign currencies as either a principal or agent on behalf of its customers.clients. If either the customerclient or counterparty fails to perform, the Company may be required to discharge the obligations of the nonperforming party. In such circumstances, the Company may sustain a loss if the fair value of the financial instrument, commodity, or foreign currency is different from the contract value of the transaction.
The majority of the Company’s transactions and, consequently, the concentration of its credit exposure are with commodity exchanges, customers,clients, broker-dealers and other financial institutions. These activities primarily involve collateralized and uncollateralized arrangements and may result in credit exposure in the event that a counterparty fails to meet its contractual obligations. The Company’s exposure to credit risk can be directly impacted by volatile financial markets, which may impair thecounterparties’ ability of counterparties to satisfy their contractual obligations. The Company seeks to control its credit risk through a variety of reporting and control procedures, including establishing credit and/or position limits based upon a review of the counterparties’ financial condition and credit ratings. The Company monitors collateral levels on a daily basis for compliance with regulatory and internal guidelines and requests changes in collateral levels as appropriate.
The Company is a party to financial instruments in the normal course of its business through customerclient and proprietary trading accounts in exchange-traded and OTC derivative instruments. These instruments are primarily the result of the execution of orders for commodity futures, options on futures, OTC swaps and options and spot and forward foreign currency contracts on behalf of its customers,clients, substantially all of which are transacted on a margin basis. Such transactions may expose the Company to significant credit risk in the event that margin requirements are not sufficient to fully cover losses which customersclients may incur. The Company controls the risks associated with these transactions by requiring customersclients to maintain margin deposits in compliance with individual exchange regulations and internal guidelines. The Company monitors required margin levels daily,
and therefore, may require customersclients to deposit additional collateral or reduce positions when necessary. The Company also establishes credit limits for customers,clients, which are monitored daily. The Company evaluates each customer’sclient’s creditworthiness on a case by case basis. Clearing, financing, and settlement activities may require the Company to maintain funds with or pledge securities as collateral with other financial institutions. Generally, these exposures to both customersclients and exchanges are subject to master netting, or customerclient agreements, which reduce the exposure to the Company by permitting receivables and payables with such customersclients to be offset in the event of a customerclient default. Management believes that the margin deposits held as of DecemberMarch 31, 20172024 and September 30, 20172023 were adequate to minimize the risk of material loss that could be created by positions held at that time. Additionally, the Company monitors collateral fair value on a daily basis and adjusts collateral levels in the event of excess market exposure. Generally, these exposures to both customers and counterparties are subject to master netting or customer agreements which reduce the exposure to the Company.
Derivative financial instruments involve varying degrees of off-balance sheet market risk whereby changes in the fair values of underlying financial instruments may result in changes in the fair value of the financial instruments in excess of the amounts reflected in the condensed consolidated balance sheets. Exposure to market risk is influenced by a number of factors, including the relationships between the financial instruments and the Company’s positions, as well as the volatility and liquidity in the markets in which the financial instruments are traded. The principal risk components of financial instruments include, among other things, interest rate volatility, the duration of the underlying instruments and changes in commodity pricing and foreign exchange rates. The Company attempts to manage its exposure to market risk through various techniques. Aggregate market limits have been established and market risk measures are routinely monitored against these limits.
Note 5 – Allowance for Doubtful Accounts
The allowance for doubtful accounts related to receivables from customers was $7.6 million as of December 31, 2017 and September 30, 2017. The allowance for doubtful accounts related to deposits with and receivables from broker-dealers, clearing organizations, and counterparties was$48.1 million and $47.0was $0.0 million as of DecemberMarch 31, 20172024 and $0.1 million as of September 30, 2023. The allowance for doubtful accounts related to receivables from clients was $57.0 million and $59.8 million as of March 31, 2024 and September 30, 2017,2023, respectively. The Company had no allowance for doubtful accounts related to notes receivable as of March 31, 2024 and September 30, 2023.
DuringActivity in the threeallowance for doubtful accounts for the six months ended DecemberMarch 31, 2017, the Company recorded2024 was as follows:
| | | | | |
| (in millions) | |
| Balance as of September 30, 2023 | $ | 59.9 | |
Recovery of bad debts(1) | (2.1) | |
| Allowance charge-offs | (1.2) | |
| |
| Other | 0.4 | |
| Balance as of March 31, 2024 | $ | 57.0 | |
(1) An additional $1.4 million is included in bad debt expense of $1.1 million, primarily related tofor the Company’s Physical Commodities segment. During the threesix months ended DecemberMarch 31, 2017,2024 on the Company recorded an additional provision related to a bad debtconsolidated income statement, which is not included in the physical coal business for amounts due toallowance at the Company from a coal supplier for demurrage and other charges related to contracts with delivery dates subsequent to September 30, 2017.period then ended.During the three months ended December 31, 2016, the Company recorded bad debt expense
Note 6 – Physical Commodities Inventory
The Company’s inventories consist of finished physical commodities. Inventories by component of the Company’s Physical Commodities segment arecommodities as shown below. |
| | | | | | | |
| (in millions) | December 31,
2017 | | September 30,
2017 |
Physical Ag & Energy(1) | $ | 125.1 |
| | $ | 65.1 |
|
Precious metals - held by broker-dealer subsidiary(2) | 20.1 |
| | 13.3 |
|
Precious metals - held by non-broker-dealer subsidiaries(3) | 99.5 |
| | 46.4 |
|
| Physical commodities inventory | $ | 244.7 |
| | $ | 124.8 |
|
| | | | | | | | | | | |
| (in millions) | March 31,
2024 | | September 30,
2023 |
Physical Ag & Energy(1) | $ | 188.4 | | | $ | 146.2 | |
| Precious metals - held by broker-dealer subsidiary | 166.8 | | | 240.3 | |
| Precious metals - held by non-broker-dealer subsidiaries | 261.7 | | | 150.8 | |
| Physical commodities inventory, net | $ | 616.9 | | | $ | 537.3 | |
(1) Physical Ag & Energy maintainsconsists of agricultural commodity inventories, including corn, soybeans, wheat, dried distillers grain, canola, sorghum, coffee, cocoa, cotton, and others. The agriculturalvarious energy commodity inventories are carried at net realizable value, which approximates fair value less disposal costs, with changes in net realizable value included as a component of ‘cost of sales of physical commodities’ on the condensed consolidated income statements. The agriculturalinventories. Agricultural inventories have reliable, readily determinable and realizable market prices, have relatively insignificant costs of disposal and are available for immediate delivery. Physical Ag & Energy also maintains energy related inventory, primarily kerosene, which is valued at the lower of cost or net realizable value.
(2) Precious metals held by the Company’s subsidiary, INTL FCStone Ltd, a United Kingdom based broker-dealer subsidiary, is measured at fair value, with changes in fair value included as a component of ‘trading gains, net’ on the condensed consolidated income statements, in accordance with U.S. GAAP accounting requirements for broker-dealers.
(3) Precious metals inventory held by subsidiaries that are not broker-dealers are valued at the lower of cost or net realizable value.
The Company has recorded lower of cost or net realizable adjustments for certain precious metals inventory of $1.3 million and $0.7 million as of December 31, 2017 and September 30, 2017, respectively. The adjustments are includedrecords changes to these values in ‘costCost of sales of physical commodities’ incommodities on the condensed consolidated income statements.Condensed Consolidated Income Statements.
Note 7 – Goodwill
The carrying value of goodwill isGoodwill allocated to the Company’s operating segments is as follows: |
| | | | | | | |
| (in millions) | December 31,
2017 | | September 30,
2017 |
| Commercial Hedging | $ | 30.3 |
| | $ | 30.7 |
|
| Global Payments | 6.3 |
| | 6.3 |
|
| Physical Commodities | 2.4 |
| | 2.4 |
|
| Securities | 6.9 |
| | 7.7 |
|
| Goodwill | $ | 45.9 |
| | $ | 47.1 |
|
| | | | | | | | | | | |
| (in millions) | March 31,
2024 | | September 30,
2023 |
| Commercial | $ | 33.5 | | | $ | 33.7 | |
| Institutional | 9.8 | | | 9.8 | |
| Retail | 5.8 | | | 5.8 | |
| Payments | 10.0 | | | 10.0 | |
| Total Goodwill | $ | 59.1 | | | $ | 59.3 | |
The Company recorded $1.2had $0.2 million inof foreign exchange revaluation adjustments on goodwill fortranslation decline during the three months ended December 31, 2017.current year related to Goodwill.
Note 8 – Intangible Assets
The gross and net carrying values of intangible assets as of the balance sheet dates, by major intangible asset class are as follows (in millions): | | | | | | | | | | | | | | | | March 31, 2024 | | September 30, 2023 |
| Gross Amount | | | Gross Amount | | Accumulated
Amortization | | Net Amount | | Gross Amount | | Accumulated
Amortization | | Net Amount |
| Intangible assets subject to amortization | |
| Trade/domain names | |
| Trade/domain names | |
| Trade/domain names | |
| Software programs/platforms | |
| Client and supplier base | |
| Total intangible assets subject to amortization | |
| | December 31, 2017 | | September 30, 2017 |
| | Gross Amount | | Accumulated Amortization | | Net Amount | | Gross Amount | | Accumulated Amortization | | Net Amount |
| Intangible assets subject to amortization: | | | | | | | | | | | |
| Software programs/platforms | 2.7 |
| | (2.5 | ) | | 0.2 |
| | 2.7 |
| | (2.5 | ) | | 0.2 |
|
| Customer base | 20.0 |
| | (8.5 | ) | | 11.5 |
| | 20.0 |
| | (7.9 | ) | | 12.1 |
|
| Intangible assets not subject to amortization | |
| Intangible assets not subject to amortization | |
| Intangible assets not subject to amortization | |
| Website domains | |
| Website domains | |
| Website domains | |
| Business licenses | |
| Total intangible assets not subject to amortization | |
| Total intangible assets | $ | 22.7 |
| | $ | (11.0 | ) | | $ | 11.7 |
| | $ | 22.7 |
| | $ | (10.4 | ) | | $ | 12.3 |
|
Amortization expense related to intangible assets was $0.6$2.1 million and $0.7$4.1 million for the three months ended DecemberMarch 31, 20172024 and 2016,2023, respectively. Amortization expense related to intangible assets was $4.1 million and $8.0 million for the six months ended March 31, 2024 and 2023, respectively.
The Company wrote off $27.8 million of fully amortized intangible assets during the six months ended March 31, 2024.
As of DecemberMarch 31, 2017, the2024, estimated future amortization expense was as follows:
|
| | | |
| (in millions) | |
| Fiscal 2018 (remaining nine months) | $ | 1.6 |
|
| Fiscal 2019 | 2.2 |
|
| Fiscal 2020 | 2.0 |
|
| Fiscal 2021 | 1.9 |
|
| Fiscal 2022 and thereafter | 4.0 |
|
| | $ | 11.7 |
|
| | | | | |
| (in millions) | |
| Fiscal 2024 (remaining months) | $ | 3.0 | |
| Fiscal 2025 | 3.7 | |
| Fiscal 2026 | 2.9 | |
| Fiscal 2027 | 2.3 | |
| Fiscal 2028 and thereafter | 2.8 | |
| Total intangible assets subject to amortization | $ | 14.7 | |
Note 9 – Credit Facilities
Variable-RateCommitted Credit Facilities
The Company has fourand its subsidiaries have committed credit facilities under which the Company and its subsidiariesthey may borrow up to $532.0$1,200.0 million, subject to the terms and conditions forof these facilities. The amounts outstanding under these credit facilities are short term borrowings and carry variable rates of interest, thus approximating fair value. The Company’s committed credit facilities consistgenerally have covenant requirements that relate to various leverage, debt to net worth, fixed charge, tangible net worth, excess net capital, or profitability measures. The Company and its subsidiaries were in compliance with all relevant covenants as of the following:March 31, 2024.
$262.0 million facility available to INTL FCStone Inc. for general working capital requirements.
$75.0 million facility available to the Company’s wholly owned subsidiary, INTL FCStone Financial, Inc., for short-term funding of margin to commodity exchanges. The facility is subject to annual review and guaranteed by INTL FCStone Inc.
$170.0 million facility available to the Company’s wholly owned subsidiary, FCStone Merchant Services, LLC, for financing traditional commodity financing arrangements and commodity repurchase agreements. The facility is subject to annual review and is guaranteed by INTL FCStone Inc.
$25.0 million facility available to the Company’s wholly owned subsidiary, INTL FCStone Ltd, for short-term funding of margin to commodity exchanges. The facility is subject to annual review and is guaranteed by INTL FCStone Inc.Uncommitted Credit Facilities
The Company also has a secured,access to certain uncommitted loan facility, under which the Company’s wholly owned subsidiary, INTL FCStone Ltd may borrow up to approximately $25.0 million, collateralized byfinancing agreements that support its ordinary course securities and commodities warehouse receipts, to facilitate financing of commodities under repurchase agreement services to its customers,inventories. The agreements are subject to certain borrowing terms and conditions of the credit agreement.
The Company also has a secured, uncommitted loan facility, under which the Company’s wholly owned subsidiary, INTL FCStone Financial, Inc. may borrow up to $50.0 million, collateralized by commodities warehouse receipts, to facilitate U.S. commodity exchange deliveries of its customers, subject to certain terms and conditions of the credit agreement. There were $32.1 million and $23.0 million in borrowings outstanding under this credit facility at December 31, 2017, and September 30, 2017, respectively.
The Company also has a secured, uncommitted loan facility, under which the Company’s wholly owned subsidiary, INTL FCStone Financial, Inc. may borrow for short term funding of firm and customer securities margin requirements, subject to certain terms and conditions of the agreement. The uncommitted amount available to be borrowed is not specified, and all requests for borrowing are subject to the sole discretion of the lender. The borrowings are secured by first liens on firm owned marketable securities or customer owned securities which have been pledged to us under a clearing arrangement. The amounts borrowed under the facilities are payable on demand. As of December 31, 2017, there were $37.0 million in borrowings outstanding under this credit facility and no borrowings outstanding as of September 30, 2017.
The Company also has a secured, uncommitted loan facility, under which the Company’s wholly owned subsidiary, INTL FCStone Financial, Inc. may borrow up to $100.0 million for short term funding of firm and customer securities margin requirements, subject to certain terms and conditions of the agreement. The borrowings are secured by first liens on firm owned marketable securities or customer owned securities which have been pledged to us under a clearing arrangement. The amounts borrowed under the facilities are payable on demand. There were $2.0 million and $11.0 million in borrowings outstanding under this credit facility at December 31, 2017, and September 30, 2017, respectively.conditions.
Note Payable to Bank
The Company has a loan fromnotes payable to a commercial bank related to the financing of certain equipment which secures the notes.
Senior Secured Notes
On March 1, 2024, the Company issued $550 million in aggregate principal amount of the Company’s 7.875% Senior Secured Notes due 2031 (the “Notes due 2031”) at the offering price of 100% of the aggregate principal amount. The Notes due 2031 are fully and unconditionally guaranteed, jointly and severally, on a senior secured second lien basis by equipment purchased witheach of the proceeds. The noteCompany’s existing and future subsidiaries that guarantees indebtedness under the Company’s senior secured revolving credit facility and certain other senior indebtedness. Interest related to these notes is payable twice annually, in monthly installments, ending in March 2020.arrears. The note bearsCompany incurred debt issuance costs of $7.9 million, which are being amortized over the term of the Notes due 2031 under the effective interest method.
The Company used a portion of the proceeds from the issuance of the Notes due 2031 to irrevocably fund an account holding funds to satisfy its 8.625% Senior Secured Notes due 2025 (the “Notes due 2025”) via an in-substance defeasance. The defeasance included placing $363.0 million of immediately available funds, representing the aggregate principal amount outstanding and all unpaid interest (accrued and yet to be accrued) through, but not including, June 15, 2024, into an escrow account designated to hold and distribute the same amount on the intended redemption date of June 15, 2024. These funds are reported within Restricted Cash on the Condensed Consolidated Balance Sheets.
The Notes due 2025 are scheduled to mature on June 15, 2025. Interest on the Notes due 2025 accrues at a rate of 8.625% per annum equaland is payable semiannually in arrears. The Company incurred debt issuance costs of $9.5 million in connection with the issuance of the Notes due 2025 in June 2020, which are being amortized over the term of the Notes due 2025 under the effective interest method. The Company has had the right, since June 15, 2022, to LIBOR plus 2.00%.redeem the Notes due 2025, in whole or in part, at the redemption prices set forth in the indenture governing the Notes due 2025.
The following table sets forth a listing of credit facilities, the current committed amounts as of the report date on the facilities, and outstanding borrowings(in millions, except for percentages):
| | | | | | | | | | | | | | | | | | | | | | | | | | | | | |
| | | | | | | | |
| (in millions) | | | | | | Amounts Outstanding |
| Borrower | Security | Renewal/Expiration Date | | Total Commitment | | March 31, 2024 | | September 30,
2023 |
| Committed Credit Facilities | | | | | | | | |
| | | | | | | | | |
| Senior StoneX Group Inc. Committed Credit Facility - Revolving Line of Credit | (1) | April 21, 2026 | | $ | 500.0 | | | $ | 25.0 | | (5) | $ | 150.0 | |
| | | | | | | | | |
| StoneX Financial Inc. | None | October 29, 2024 | | 190.0 | | | — | | (5) | — | |
| StoneX Commodity Solutions LLC | Certain assets | July 28, 2024 | | 400.0 | | | 71.0 | | (5) | 103.0 | |
| StoneX Financial Ltd. | None | October 12, 2024 | | 100.0 | | | 50.0 | | (5) | 25.0 | |
| StoneX Financial Pte. Ltd. | None | September 6, 2024 | | 10.0 | | | — | | (5) | — | |
| | | | | $ | 1,200.0 | | | $ | 146.0 | | | $ | 278.0 | |
| | | | | | | | | |
| | | | | | | | |
| | | | | | | | | |
| | | | | | | | | |
| | | | | | | | | |
| | | | | | | | | |
| Uncommitted Credit Facilities | Various | | | | | 100.4 | | (5) | 55.5 | |
| Note Payable to Bank | Certain equipment | | | | | 7.2 | | (5) | 7.5 | |
| Senior Secured Notes due 2031 | (2) | | | | | 542.2 | | (4) | — | |
| Senior Secured Notes due 2025 | (2) | | | | | 343.7 | | (3) | 342.1 | |
| Total outstanding borrowings | | | | | | $ | 1,139.5 | | | $ | 683.1 | |
| | | | | | | | | |
(1) The StoneX Group Inc. senior committed credit facility is a revolving facility secured by substantially all of the assets of StoneX Group Inc. and certain subsidiaries identified in the credit facility agreement as obligors, and pledged equity of certain subsidiaries identified in the credit facility as limited guarantors. The maturity date remains April 21, 2025 for one lender representing $17.5 million of the facility commitment.
(2) The Notes and the related guarantees are secured by liens on substantially all of the Company’s and the guarantors’ assets, subject to certain customary and other exceptions and permitted liens. The liens on the facilities,assets that secure the Notes and the related guarantees are contractually subordinated to the liens on the assets that secure the Company’s and the guarantors’ existing and future first lien secured indebtedness, including indebtedness under the Company’s senior committed credit facility.
(3) Included in Senior secured borrowings, net on the Condensed Consolidated Balance Sheets. Amounts outstanding under the Notes due 2025 are reported net of unamortized original issue discount and unamortized deferred financing costs of $4.2 million and $5.8 million, in the respective periods presented. The amounts payable under Notes due 2025 have been defeased as well as indebtedness the Company has placed the necessary funds in escrow, reported in Restricted cash on a promissory note asthe Condensed Consolidated Balance Sheets.
(4) Included in Senior secured borrowings, net on the Condensed Consolidated Balance Sheets. Amounts outstanding under the Notes due 2031 are reported net of December 31, 2017 and September 30, 2017:unamortized deferred financing costs of $7.8 million. |
| | | | | | | | | | | | | | | |
| (in millions) | | | | | | | | |
| Credit Facilities | | | | | | Amounts Outstanding |
| | Borrower | Security | Renewal / Expiration Date | | Total Commitment | | December 31,
2017 | | September 30,
2017 |
| Committed Credit Facilities | | | | | | | | |
| | INTL FCStone Inc. | Pledged shares of certain subsidiaries | March 18, 2019 | | $ | 262.0 |
| | $ | 210.0 |
| | $ | 150.0 |
|
| | INTL FCStone Financial, Inc. | None | April 5, 2018 |
| 75.0 |
|
| 36.5 |
|
| — |
|
| | FCStone Merchants Services, LLC | Certain commodities assets | May 1, 2018 | | 170.0 |
| | 103.5 |
| | 44.2 |
|
| | INTL FCStone Ltd. | None | November 7, 2018 | | 25.0 |
| | — |
| | — |
|
| | | | | | $ | 532.0 |
| | 350.0 |
| | 194.2 |
|
| | | | | | | | | | |
| Uncommitted Credit Facilities | | | | | | | | |
| | INTL FCStone Financial, Inc. | Commodities warehouse receipts and certain pledged securities | n/a | | $ | — |
| | $ | 71.1 |
| | $ | 34.0 |
|
| | INTL FCStone Ltd. | Commodities warehouse receipts | n/a | | $ | — |
| | $ | — |
| | $ | — |
|
| | | | | | | | | | |
| Note Payable to Bank | | | | | | | | |
| | Monthly installments, due March 2020 and secured by certain equipment | | | | 1.8 |
| | 2.0 |
|
| Total indebtedness | | | | | | $ | 422.9 |
| | $ | 230.2 |
|
As reflected above, $270.0 millioncertain of the Company’s committed credit facilities are scheduled to expire withinduring the next twelve months of this filing.following the quarterly period ended March 31, 2024. The Company intends to renew or replace this facility when it expires,the facilities as they expire, and based on the Company’s liquidity position and capital structure, the Company believes it will be able to do so.
The Company’s credit facility agreements contain financial covenants relating to financial measures on a consolidated basis, as well as on a certain stand-alone subsidiary basis, including minimum tangible net worth, minimum regulatory capital, minimum net unencumbered liquid assets, maximum net loss, minimum fixed charge coverage ratio and maximum funded debt to net worth ratio. Failure to comply with these covenants could result in the debt becoming payable on demand. As of December 31, 2017, the Company was in compliance with all of its financial covenants under its credit facilities.
Note 10 – Securities and Commodity Financing Transactions
The Company’s outstanding notes receivable in connection with repurchase agreements for agricultural and energy commodities, wherebysecurities borrowing and lending arrangements are generally recorded at cost in the customersCondensed Consolidated Balance Sheets, which is a reasonable approximation of their fair values due to their short-term nature. Secured borrowing and lending arrangements are entered into to obtain collateral necessary to effect settlement, finance inventory positions, meet customer needs or re-lend as part of our dealer operations. The fair value of securities loaned and borrowed is monitored daily compared with the related payable or receivable, and additional collateral or returning excess collateral is requested, as appropriate. These arrangements may serve to limit credit risk resulting from our transactions with our counterparties. Financial instruments are pledged as collateral under repurchase agreements, securities lending agreements and other secured arrangements, including clearing arrangements. Agreements with counterparties generally contain contractual provisions allowing counterparties the right to sell toor repledge collateral. Either the Company certain commodity inventory and agree to repurchaseor its counterparties may require additional collateral. All collateral is held by the commodity inventory atCompany or a future date at a fixed price were $1.8 million and $0.8 million as of December 31, 2017 and September 30 2017, respectively.custodian.
The Company enters intofollowing tables set forth the carrying value of repurchase agreements, and securities lending agreements by remaining contractual maturity (in millions):
| | | | | | | | | | | | | | | | | | | | | | | | | | | | | |
| March 31, 2024 |
| Overnight and Open | | Less than 30 Days | | 30-90 Days | | Over 90 Days | | Total |
| Securities sold under agreements to repurchase | $ | 10,183.8 | | | $ | 1,183.1 | | | $ | 610.6 | | | $ | 97.5 | | | $ | 12,075.0 | |
| Securities loaned | 1,458.6 | | | — | | | — | | | — | | | 1,458.6 | |
| Gross amount of secured financing | $ | 11,642.4 | | | $ | 1,183.1 | | | $ | 610.6 | | | $ | 97.5 | | | $ | 13,533.6 | |
| | | | | | | | | | | | | | | | | | | | | | | | | | | | | |
| September 30, 2023 |
| Overnight and Open | | Less than 30 Days | | 30-90 Days | | Over 90 Days | | Total |
| Securities sold under agreements to repurchase | $ | 8,300.0 | | | $ | 786.8 | | | $ | 107.0 | | | $ | 2.6 | | | $ | 9,196.4 | |
| Securities loaned | 1,117.3 | | | — | | | — | | | — | | | 1,117.3 | |
| Gross amount of secured financing | $ | 9,417.3 | | | $ | 786.8 | | | $ | 107.0 | | | $ | 2.6 | | | $ | 10,313.7 | |
Offsetting of Collateralized Transactions
The following table sets forth the carrying value of repurchase agreements and securities lending agreements by class of collateral pledged (in millions):
| | | | | | | | | | | |
| Securities sold under agreements to repurchase | March 31, 2024 | | September 30, 2023 |
| U.S. Treasury obligations | $ | 9,017.4 | | | $ | 3,696.1 | |
| U.S. government agency obligations | 99.1 | | | 542.2 | |
| Asset-backed obligations | 40.9 | | | 102.9 | |
| Agency mortgage-backed obligations | 2,302.5 | | | 4,371.6 | |
| Foreign government obligations | 318.2 | | | 148.1 | |
| Corporate bonds | 296.9 | | | 335.5 | |
| Total securities sold under agreement to repurchase | $ | 12,075.0 | | | $ | 9,196.4 | |
| | | |
| Securities loaned | | | |
| Equity securities | $ | 1,458.6 | | | $ | 1,117.3 | |
| Total securities loaned | 1,458.6 | | | 1,117.3 | |
| Gross amount of secured financing | $ | 13,533.6 | | | $ | 10,313.7 | |
The following tables provide the netting of securities purchased under agreements to resell, securities sold under agreements to repurchase, securities borrowed and securities loaned transactions to, among other things, finance financial instruments, acquire securities to cover short positions, acquire securities for settlement, and to accommodate counterparties’ needs. These agreements are recorded as collateralized financings at their contractual amounts plus accrued interest. The related interest is recorded in the consolidated income statements as interest income or interest expense, as applicable. In connection with these agreements and transactions, it is the policy of the Company to receive or pledge cash or securities to adequately collateralize such agreements and transactions in accordance with general industry guidelines and practices. The valueperiods indicated (in millions): | | | | | | | | | | | | | | | | | |
| March 31, 2024 |
| Offsetting of collateralized transactions: | Gross Amounts Recognized | | Amounts Offset in the Condensed Consolidated Balance Sheet | | Net Amounts Presented in the Condensed Consolidated Balance Sheet |
| Securities purchased under agreements to resell | $ | 9,807.9 | | | $ | (6,063.3) | | | $ | 3,744.6 | |
| Securities borrowed | $ | 1,430.6 | | | $ | — | | | $ | 1,430.6 | |
| Securities sold under agreements to repurchase | $ | 12,075.0 | | | $ | (6,063.3) | | | $ | 6,011.7 | |
| Securities loaned | $ | 1,458.6 | | | $ | — | | | $ | 1,458.6 | |
| | | | | | | | | | | | | | | | | |
| September 30, 2023 |
| Offsetting of collateralized transactions: | Gross Amounts Recognized | | Amounts Offset in the Condensed Consolidated Balance Sheet | | Net Amounts Presented in the Condensed Consolidated Balance Sheet |
| Securities purchased under agreements to resell | $ | 7,649.3 | | | $ | (4,669.8) | | | $ | 2,979.5 | |
| Securities borrowed | $ | 1,129.1 | | | $ | — | | | $ | 1,129.1 | |
| Securities sold under agreements to repurchase | $ | 9,196.4 | | | $ | (4,669.8) | | | $ | 4,526.6 | |
| Securities loaned | $ | 1,117.3 | | | $ | — | | | $ | 1,117.3 | |
The Company pledges financial instrumentssecurities owned to collateralize repurchase agreements. At December 31, 2017, financial instruments owned, atas collateral in both tri-party and bilateral arrangements. Pledged securities under tri-party arrangements may not be repledged or sold by the Company’s counterparties, whereas bilaterally pledged securities may be. The approximate fair value of $3.4 million were pledged as collateral under repurchase agreements. The counterpartysecurities that can be sold or repledged by the Company’s counterparties has the right to repledge the collateral in connection with these transactions. These financial instruments owned have been pledged as collateral and have been parenthetically disclosed on the consolidated balance sheet.Condensed Consolidated Balance Sheets.
The Company also has repledgedreceives securities borrowed and securities held on behalf of correspondent brokers to collateralize securities loaned agreements with a fair value of $101.9 million as of December 31, 2017.
In addition, as of December 31, 2017, the Company pledged financial instruments owned, at fair value of $1,687.3 million as collateral for tri-party repurchase agreements. For these securities, the counterparties do not have the right to sell or repledge the collateral.
At December 31, 2017, the Company has accepted collateral that it is permitted by contract to sell or repledge. This collateral consists primarily of securities received inunder reverse repurchase agreements, securities borrowed agreements, and margin securities held on behalf of correspondent brokers. The fair value of such collateral at December 31, 2017, was $819.0 million of which $472.8 million was used to cover securities sold short which are recorded in financial instruments sold, not yet purchased on the consolidated balance sheet. In the normal course of business, thiscounterparties. This collateral is used by the Company to cover financial instruments sold, not yet purchased,purchased; to obtain financing in the form of repurchase agreements,agreements; and to meet counterparties’ needs under lending arrangements. At December 31, 2017, substantially all of the abovearrangement and matched-booked trading strategies. Additional securities collateral had been delivered against financial instruments sold, not yet purchased or repledged byis obtained as necessary to ensure such transactions are adequately collateralized. In many instances, the Company is permitted by contract to obtain financing.repledge the securities received as collateral, which may include pledges to cover collateral requirements for tri-party repurchase agreements.
The following tables provide the contractual maturities of gross obligations under repurchase and securities lending agreements as of December 31, 2017 and September 30, 2017 (in millions): |
| | | | | | | | |
| | December 31, 2017 |
| | Overnight and Open | Less than 30 Days | 30-90 Days | Over 90 Days | Total |
| Securities sold under agreements to repurchase | $1,121.4 | $239.0 | $290.0 | — |
| $1,650.4 |
| Securities loaned | 108.8 | — |
| — |
| — |
| 108.8 |
| Gross amount of secured financing | $1,230.2 | $239.0 | $290.0 | $0.0 | $1,759.2 |
|
| | | | | | | | |
| | September 30, 2017 |
| | Overnight and Open | Less than 30 Days | 30-90 Days | Over 90 Days | Total |
| Securities sold under agreements to repurchase | $640.2 | $432.9 | $320.0 | — |
| $1,393.1 |
| Securities loaned | 111.1 | — |
| — |
| — |
| 111.1 |
| Gross amount of secured financing | $751.3 | $432.9 | $320.0 | — |
| $1,504.2 |
The following table providessets forth the underlyingcarrying value, which approximates fair value because of its short term nature, of collateral types of the gross obligations under repurchasepledged, received and securities lending agreements as of December 31, 2017 and September 30, 2017repledged (in millions):
| | | | | | | | | | | |
| March 31, 2024 | | September 30, 2023 |
| Securities pledged or repledged to cover collateral requirements for tri-party arrangements | $ | 5,827.0 | | | $ | 4,726.6 | |
| Securities received as collateral that may be repledged | $ | 14,131.4 | | | $ | 9,180.1 | |
| Securities received as collateral that may be repledged covering securities sold short | $ | 2,563.7 | | | $ | 2,461.1 | |
| Repledged securities borrowed and client securities held under custodial clearing arrangements to collateralize securities loaned agreements | $ | 1,298.5 | | | $ | 1,097.3 | |
|
| | | | | | | |
| Securities sold under agreements to repurchase: | December 31, 2017 | | September 30, 2017 |
| U.S. Treasury obligations | $ | 3.2 |
| | $ | 7.0 |
|
| U.S. government agency obligations | 358.2 |
| | 332.6 |
|
| Asset-backed obligations | 75.0 |
| | 36.4 |
|
| Agency mortgage-backed obligations | 1,214.0 |
| | 1,017.1 |
|
| Total securities sold under agreements to repurchase | $ | 1,650.4 |
| | $ | 1,393.1 |
|
| | | | |
| Securities loaned: | | | |
| Common stock | 108.8 |
| | 111.1 |
|
| Total securities loaned | 108.8 |
| | 111.1 |
|
| Gross amount of secured financing | $ | 1,759.2 |
| | $ | 1,504.2 |
|
Note 11 – Commitments and Contingencies
Contingencies
The Company had receivables, net of collections and other allowable deductions, of $11.1 million as of March 31, 2024, due from account holders in connection with the OptionSellers matter previously disclosed in the Company’s Annual Report on Form 10-K for the fiscal year ended September 30, 2023. The allowance against these uncollected balances was $3.5 million as of March 31, 2024. The Company is pursuing collection of the outstanding balances through arbitration proceedings against the account holders. The Company will consider developments in these proceedings, and any other relevant matters, in determining whether any changes in the allowance against the uncollected balances are required.
In these and other arbitration proceedings, clients are seeking damages from StoneX Financial Inc. related to the trading losses in their accounts.
During the six months ended March 31, 2024, the Company favorably resolved several of these arbitration claims through arbitration decisions and privately negotiated settlements. All of the arbitration panels that issued decisions during the period awarded StoneX Financial Inc. the full amount of the uncollected balances. As noted, several of the arbitrations were resolved through privately negotiated settlement, pursuant to which the account holders agreed to pay some or all of their outstanding deficit balances. The Company intends to continue vigorously pursuing claims through arbitration and settling cases in what the Company determines to be appropriate circumstances. The ultimate outcome of remaining arbitrations cannot presently be determined.
Depending on future collections and the outcomes of arbitration proceedings, any provisions for bad debts and actual losses may be material to the Company’s financial results. However, the Company believes that the likelihood of a material adverse outcome is remote, and does not currently believe that any potential losses related to this matter would impact its ability to comply with its ongoing liquidity, capital, and regulatory requirements.
Legal Proceedings
From time to time and in the ordinary course of business, the Company is involved in various legal actions and proceedings, including tort claims, contractual disputes, employment matters, workers’ compensation claims and collections. The Company carries insurance that provides protection against certain types of claims, up to the policy limitsrelevant policy’s limits.
On November 13, 2023, BTIG filed a civil complaint (the “BTIG complaint”) against the Company and StoneX Financial Inc. in San Francisco Superior Court (CGC-23-610525) seeking monetary damages and injunctive relief for, among other things, alleged theft of purported trade secrets by former BTIG employees later employed at StoneX. The Company intends to vigorously defend itself. In addition, the Company subsequently received from the U.S. Department of Justice (the “DOJ”) and the SEC subpoenas that the Company believes are related to conduct alleged in the BTIG complaint, and the Company is cooperating with these agencies. The ultimate outcomes of the insurance.BTIG complaint and the DOJ and SEC subpoenas cannot presently be determined.
As of DecemberMarch 31, 20172024 and September 30, 2017,2023, the condensed consolidated balance sheetsCondensed Consolidated Balance Sheets include loss contingency accruals recorded prior to these periods then ended, which are not material, individually or in the aggregate, to the Company’s financial position or liquidity. In the opinion of
management, possible exposure from loss contingencies in excess of the amounts accrued, is not likely to be material to the Company’s earnings, financial position or liquidity.
There have been no material changes to the legal actions and proceedings as compared to September 30, 2017.
Contractual Commitments
Self-Insurance
The Company self-insures its costs related to medical and dental claims. The Company is self-insured, up to a stop loss amount, for eligible participating employees and retirees, and for qualified dependent medical and dental claims, subject to deductibles and limitations. As of DecemberMarch 31, 2017,2024, the Company had $0.7$1.7 million accrued for self-insured medical and dental claims included in ‘accountsAccounts payable and other liabilities’accrued liabilities in the condensed consolidated balance sheet.Condensed Consolidated Balance Sheet.
Note 12 – Capital and Other Regulatory Requirements
The Company’s activities are subject to significant governmental regulation, both in the United States and overseas. The subsidiaries of the Company were in compliance with all of their regulatory requirements as of December 31, 2017, as follows: |
| | | | | | | | | | | | |
| (in millions) | | | | | | As of December 31, 2017 |
| Subsidiary | Regulatory Authority | Jurisdiction | | Requirement Type | | Actual | | Minimum Requirement |
| INTL FCStone Financial Inc. | SEC and Commodity Futures Trading Commission ("CFTC") | United States | | Net capital | | $ | 136.1 |
| | $ | 74.2 |
|
| INTL FCStone Financial Inc. | CFTC | United States | | Segregated funds | | $ | 2,256.9 |
| | $ | 2,204.4 |
|
| INTL FCStone Financial Inc. | CFTC | United States | | Secured funds | | $ | 164.4 |
| | $ | 147.8 |
|
| INTL FCStone Financial Inc. | SEC | United States | | Customer reserve | | $ | 12.0 |
| | $ | — |
|
| INTL FCStone Financial Inc. | SEC | United States | | PAB reserve | | $ | 10.7 |
| | $ | 10.2 |
|
| INTL Custody & Clearing Soluntions Inc. | SEC | United States | | Net capital | | $ | 1.7 |
| | $ | 0.1 |
|
| SA Stone Wealth Management Inc. | SEC | United States | | Net capital | | $ | 4.2 |
| | $ | 0.3 |
|
INTL FCStone Ltd(1) | Financial Conduct Authority ("FCA") | United Kingdom | | Net capital | | $ | 191.8 |
| | $ | 90.2 |
|
| INTL FCStone Ltd | FCA | United Kingdom | | Segregated funds | | $ | 113.8 |
| | $ | 113.8 |
|
INTL Netherlands BV(1) | FCA | United Kingdom | | Net capital | | $ | 191.1 |
| | $ | 90.2 |
|
| INTL FCStone DTVM Ltda. | Brazilian Central Bank and Securities and Exchange Commission of Brazil | Brazil | | Capital adequacy | | $ | 12.6 |
| | $ | 0.5 |
|
| INTL Gainvest S.A. | National Securities Commission ("CNV") | Argentina | | Capital adequacy | | $ | 4.5 |
| | $ | 0.2 |
|
| INTL Gainvest S.A. | CNV | Argentina | | Net capital | | $ | 3.0 |
| | $ | 0.1 |
|
| INTL CIBSA S.A. | CNV | Argentina | | Capital adequacy | | $ | 5.0 |
| | $ | 0.9 |
|
| INTL CIBSA S.A. | CNV | Argentina | | Net capital | | $ | 1.7 |
| | $ | 0.5 |
|
(1) INTL Netherlands BV is a holding company that includes the ownership equity of INTL FCStone Ltd. The associated net capital amounts and minimum requirements should not be considered in aggregate.
Certain other non-U.S. subsidiaries of the Company are also subject to capital adequacy requirements promulgated by authorities of the countries in which they operate. As of December 31, 2017, these subsidiaries were in compliance with their local capital adequacy requirements.
Note 13 – Other Expenses
Other expenses for the three months ended December 31, 2017 and 2016 consisted of the following:
|
| | | | | | | |
| | Three Months Ended December 31, |
| (in millions) | 2017 | | 2016 |
| Insurance | $ | 0.6 |
| | $ | 0.5 |
|
| Advertising, meetings and conferences | 0.9 |
| | 0.9 |
|
| Office supplies and printing | 0.4 |
| | 0.6 |
|
| Other clearing related expenses | 0.5 |
| | 0.4 |
|
| Other non-income taxes | 1.2 |
| | 1.1 |
|
| Other | 2.1 |
| | 2.1 |
|
| Total other expenses | $ | 5.7 |
| | $ | 5.6 |
|
Note 1412 – Accumulated Other Comprehensive Loss, Net
Comprehensive incomeAccumulated other comprehensive loss, net consists of net income and other gains and losses affecting stockholders’ equity that, under U.S. GAAP, are excluded from net income. Other comprehensive lossincome includes net actuarial losses from defined benefit pension plans, and foreign currency translation adjustments.adjustments, and cash flow hedge gains or losses. See note 4 for additional information on cash flow hedges.
The following table summarizes the changes in accumulated other comprehensive loss, net for the threesix months ended DecemberMarch 31, 2017.2024.
| | | | | | | | | | | | | | | | | | | | | | | | | | | | |
| (in millions) | | Foreign Currency Translation Adjustment | | Pension Benefits Adjustment | | Cash Flow Hedge | | | | Accumulated Other Comprehensive Loss, net |
| Balances as of September 30, 2023 | | $ | (31.2) | | | $ | (2.2) | | | $ | (18.4) | | | | | $ | (51.8) | |
| Other comprehensive income, net of tax | | 2.3 | | | — | | | 19.9 | | | | | 22.2 | |
| Balances as of March 31, 2024 | | $ | (28.9) | | | $ | (2.2) | | | $ | 1.5 | | | | | $ | (29.6) | |
| | | | | | | | | | |
Note 13 – Revenue from Contracts with Clients
The Company accounts for revenue earned from contracts with clients for services such as the execution, clearing, brokering, and custody of futures and options on futures contracts, OTC derivatives, and securities, investment management, and underwriting services in accordance with FASB ASC 606, Revenues from Contracts with Customers (Topic 606). Revenues for these services are recognized when the performance obligations related to the underlying transaction are completed.
Revenues are recognized when control of the promised goods or services are transferred to clients, in an amount that reflects the consideration the Company expects to be entitled to in exchange for those goods or services. Revenues are analyzed to determine whether the Company is the principal (i.e. reports revenue on a gross basis) or agent (i.e., reports revenues on a net basis) in the contract. Principal or agent designations depend primarily on the control an entity has over the good or service before control is transferred to a client. The indicators of which party exercises control include primary responsibility over performance obligations, inventory risk before the good or service is transferred, and discretion in establishing the price.
Topic 606 does not apply to revenues associated with dealing, or market-making, activities in financial instruments or contracts in the capacity of a principal, including derivative sales contracts which result in physical settlement and interest income.
Revenues within the scope of Topic 606 are presented within Commission and clearing fees;Consulting, management, and account fees; and Sales of physical commodities on the Condensed Consolidated Income Statements. Revenues that are not within the scope of Topic 606 are presented within Sales of physical commodities, Principal gains, net, and Interest income on the Condensed Consolidated Income Statements.
| | | | | | | | | | | | | | | | | | | | | | | |
| Three Months Ended March 31, | | Six Months Ended March 31, |
| (in millions) | 2024 | | 2023 | | 2024 | | 2023 |
| Revenues from contracts with clients as a percentage of total revenues | 2.3 | % | | 5.7 | % | | 2.7 | % | | 6.4 | % |
|
| | | | | | | | | | | | |
| (in millions) | | Foreign Currency Translation Adjustment | | Pension Benefits Adjustment | | Accumulated Other Comprehensive Loss |
| Balances as of September 30, 2017 | | $ | (21.5 | ) | | $ | (3.0 | ) | | $ | (24.5 | ) |
| Other comprehensive loss, net of tax | | (2.2 | ) | | — |
| | (2.2 | ) |
| Balances as of December 31, 2017 | | $ | (23.7 | ) | | $ | (3.0 | ) | | $ | (26.7 | ) |
| | | | | | | |
| | | | | | | | | | | | | | | | | | | | | | | |
| Three Months Ended March 31, | | Six Months Ended March 31, |
| (in millions) | 2024 | | 2023 | | 2024 | | 2023 |
| Revenues from contracts with clients: | | | | | | | |
| Commission and clearing fees: | | | | | | | |
| Sales-based: | | | | | | | |
| Exchange-traded futures and options | $ | 55.8 | | | $ | 55.3 | | | $ | 107.2 | | | $ | 104.0 | |
| OTC derivative brokerage | 3.0 | | | 4.5 | | | 5.8 | | | 8.1 | |
| Equities and fixed income | 14.5 | | | 15.6 | | | 31.0 | | | 31.0 | |
| Mutual funds | 0.9 | | | 0.9 | | | 1.6 | | | 1.5 | |
| Insurance and annuity products | 3.7 | | | 2.7 | | | 5.7 | | | 4.5 | |
| Other | 0.2 | | | 1.1 | | | 0.1 | | | 2.2 | |
| Total sales-based commission | 78.1 | | | 80.1 | | | 151.4 | | | 151.3 | |
| Trailing: | | | | | | | |
| Mutual funds | 3.2 | | | 3.1 | | | 6.2 | | | 6.1 | |
| Insurance and annuity products | 3.7 | | | 3.5 | | | 7.4 | | | 7.0 | |
| Total trailing commission | 6.9 | | | 6.6 | | | 13.6 | | | 13.1 | |
| | | | | | | |
| Clearing fees | 45.4 | | | 40.0 | | | 88.7 | | | 76.0 | |
| Trade conversion fees | 3.5 | | | 2.0 | | | 7.5 | | | 4.4 | |
| Other | 2.3 | | | 2.0 | | | 4.7 | | | 3.9 | |
| Total commission and clearing fees | 136.2 | | | 130.7 | | | 265.9 | | | 248.7 | |
| Consulting, management, and account fees: | | | | | | | |
| Underwriting fees | 0.1 | | | 0.1 | | | 0.1 | | | 0.3 | |
| Asset management fees | 12.3 | | | 11.1 | | | 23.7 | | | 21.8 | |
| Advisory and consulting fees | 9.0 | | | 9.0 | | | 17.2 | | | 17.7 | |
| Sweep program fees | 11.3 | | | 12.9 | | | 22.7 | | | 24.3 |
| Client account fees | 4.3 | | | 3.7 | | | 8.5 | | | 7.5 | |
| Other | 3.2 | | | 3.9 | | | 6.5 | | | 8.9 | |
| Total consulting, management, and account fees | 40.2 | | | 40.7 | | | 78.7 | | | 80.5 | |
| Sales of physical commodities: | | | | | | | |
| Precious metals sales under ASC Topic 606 | 332.8 | | | 746.4 | | | 792.0 | | | 1,535.0 | |
| Total revenues from contracts with clients | $ | 509.2 | | | $ | 917.8 | | | $ | 1,136.6 | | | $ | 1,864.2 | |
| | | | | | | |
| Method of revenue recognition: | | | | | | | |
| Point-in-time | $ | 469.7 | | | $ | 878.2 | | | $ | 1,059.4 | | | $ | 1,787.3 | |
| Time elapsed | 39.5 | | | 39.6 | | | 77.2 | | | 76.9 | |
| Total revenues from contracts with clients | 509.2 | | | 917.8 | | | 1,136.6 | | | 1,864.2 | |
| Other sources of revenues | | | | | | | |
| Physical precious metals under ASC Topic 815 | 20,067.0 | | | 13,703.1 | | | 37,229.5 | | | 24,182.1 | |
| Physical agricultural and energy products | 922.1 | | | 1,056.7 | | | 2,121.3 | | | 2,192.5 | |
| Principal gains, net | 281.8 | | | 256.6 | | | 575.6 | | | 510.8 | |
| Interest income | 326.0 | | | 226.8 | | | 616.1 | | | 423.0 | |
| Total revenues | $ | 22,106.1 | | | $ | 16,161.0 | | | $ | 41,679.1 | | | $ | 29,172.6 | |
| | | | | | | |
| Total revenues by primary geographic region: | | | | | | | |
| United States | $ | 1,407.7 | | | $ | 1,471.1 | | | $ | 3,011.2 | | | $ | 3,034.7 | |
| Europe | 560.2 | | | 912.0 | | | 1,218.6 | | | 1,827.0 | |
| South America | 105.0 | | | 56.5 | | | 233.0 | | | 118.7 | |
| Middle East and Asia | 20,025.1 | | | 13,720.0 | | | 37,200.7 | | | 24,186.3 | |
| Other | 8.1 | | | 1.4 | | | 15.6 | | | 5.9 | |
| Total revenues | $ | 22,106.1 | | | $ | 16,161.0 | | | $ | 41,679.1 | | | $ | 29,172.6 | |
| | | | | | | |
| Operating revenues by primary geographic region: | | | | | | | |
| United States | $ | 590.0 | | | $ | 538.5 | | | $ | 1,158.0 | | | $ | 1,028.4 | |
| Europe | 161.1 | | | 105.5 | | | 296.7 | | | 207.0 | |
| South America | 25.2 | | | 32.0 | | | 66.4 | | | 63.5 | |
| Middle East and Asia | 33.7 | | | 27.1 | | | 65.7 | | | 54.5 | |
| Other | 8.2 | | | 1.3 | | | 15.6 | | | 5.8 | |
| Total operating revenues | $ | 818.2 | | | $ | 704.4 | | | $ | 1,602.4 | | | $ | 1,359.2 | |
The substantial majority of the Company’s performance obligations for revenues from contracts with clients are satisfied at a point in time and are typically collected from clients by debiting their accounts with the Company.
Commission and clearing fees revenue and Consulting, management, and account fees revenue are primarily related to the Commercial, Institutional and Retail reportable segments. Sales of physical commodities under topic 606 are primarily related to the Company’s Commercial and Retail segments. Principal gains, net are contributed by all of the Company’s reportable segments. Interest income is primarily related to the Commercial and Institutional reportable segments. Precious metals trading and agricultural and energy product trading revenues are primarily related to the Commercial reportable segment. Precious metals sales that are recognized on a point-in-time basis are included in the Retail and the Commercial reportable segments
Principal gains, net also includes dividend income on long equity positions and dividend expense on short equity positions, which are recognized on the ex-dividend date. The following table indicates the relevant income and expense:
| | | | | | | | | | | | | | | | | | | | | | | |
| Three Months Ended March 31, | | Six Months Ended March 31, |
| (in millions) | 2024 | | 2023 | | 2024 | | 2023 |
| Dividend income on long equity positions | $ | 65.8 | | | $ | 3.2 | | | $ | 86.0 | | | $ | 17.4 | |
| Dividend expense on short equity positions | 64.7 | | | 4.1 | | | 83.5 | | | 17.3 | |
| Dividend (loss)/income, net reported within Principal Gains, net | $ | 1.1 | | | $ | (0.9) | | | $ | 2.5 | | | $ | 0.1 | |
Remaining Performance Obligations
Remaining performance obligations are services that the Company has committed to perform in the future in connection with its contracts with clients. The Company’s remaining performance obligations are generally related to its risk management consulting and asset management contracts with clients. Revenues associated with remaining performance obligations related to these contracts with clients are not material to the overall consolidated results of the Company. For the Company’s asset management activities, where fees are calculated based on a percentage of the fair value of eligible assets in client’s accounts, future revenue associated with remaining performance obligations cannot be determined as such fees are subject to fluctuations in the fair value of eligible assets in clients’ accounts.
Note 14 – Other Expenses
Other expenses consisted of the following, for the periods indicated.
| | | | | | | | | | | | | | | | | | | | | | | |
| Three Months Ended March 31, | | Six Months Ended March 31, |
| (in millions) | 2024 | | 2023 | | 2024 | | 2023 |
| Non-income taxes | $ | 2.8 | | | $ | 2.2 | | | $ | 5.3 | | | $ | 6.9 | |
| Insurance | 3.2 | | | 3.0 | | | 6.1 | | | 5.7 | |
| Employee related expenses | 1.7 | | | 2.3 | | | 3.6 | | | 5.9 | |
| Other direct business expenses | 3.5 | | | 4.1 | | | 7.9 | | | 8.1 | |
| Membership fees | 1.0 | | | 1.1 | | | 1.9 | | | 1.9 | |
| Director and public company expenses | 0.7 | | | 0.5 | | | 1.2 | | | 1.0 | |
| Office expenses | 0.5 | | | 0.5 | | | 1.1 | | | 0.9 | |
| Other expenses | 1.9 | | | 1.6 | | | 5.1 | | | 4.3 | |
| Total other expenses | $ | 15.3 | | | $ | 15.3 | | | $ | 32.2 | | | $ | 34.7 | |
Note 15 – Income Taxes
The income tax provision for interim periods is comprised ofcomprises income tax on ordinary income (loss) provided at the most recent estimated annual effective income tax rate, adjusted for the income tax effect of discrete items. Management uses an estimated annual effective income tax rate based on the forecasted pretax income income/(loss) and statutory tax rates in the various jurisdictions in which itthe Company operates. The Company’s effective income tax rate differs from the U.S. statutory income tax rate primarily due to state and local taxes, global intangible low taxed income (“GILTI”), and differing statutory tax rates applied to the income of non-U.S. subsidiaries. The Company records the tax effect of certain discrete items, including the effects of changes in tax laws, tax rates and adjustments with respect to valuation allowances or other unusual or nonrecurring tax adjustments, in the interim period in which they occur, as an addition to, or reduction from, the income tax provision, rather than being included in the estimated effective annual income tax rate. In addition, jurisdictions with a projected loss for the year or a year-to-date loss where no income tax benefit can be recognized are excluded from the estimated annual effective income tax rate.
Deferred income tax balances reflect the effects of temporary differences between the carrying amounts of assets and liabilities and their tax bases and are stated at enacted tax rates expected to be in effect when taxes are actually paid or recovered. The Company is required to assess its deferred tax assets and the need for a valuation allowance at each reporting period. This
assessment requires judgment on the part of management with respect to benefits that may be realized. The Company will record a valuation allowance against deferred tax assets when it is considered more likely than not that all or a portion of the deferred tax assets will not be realized.
Effects of the Tax Cuts and Jobs Act
On December 22, 2017, the President of the United States signed and enacted into law H.R. 1, the Tax Cuts and Jobs Act (“the Tax Reform”). Among the significant changes to the U.S. Internal Revenue Code, the Tax Reform lowers the U.S. federal corporate income tax rate from 35% to 21%, effective January 1, 2018. The Company will compute its income tax expense (benefit) for the September 30, 2018 tax year using a U.S. statutory tax rate of 24.5%. The 21% U.S. statutory tax rate will apply to fiscal years ending September 30, 2019 and thereafter. For the three months ended December 31, 2017, the Company recorded tax expense of $8.9 million related to the remeasurement of deferred tax assets and liabilities. The provisional remeasurement amount is anticipated to change as data becomes available allowing more accurate scheduling of certain deferred tax assets and liabilities. The Tax Reform also includes a one-time mandatory repatriation transition tax on previously untaxed accumulated and current earnings and profits (E&P) of certain of the Company’s foreign subsidiaries. To determine the amount of the transition tax, the Company must determine, in addition to other factors, the amount of post 1986 E&P of the relevant subsidiaries, as well as the amount of non-US income taxes paid on such earnings. The Company made a reasonable estimate of the transition tax and recorded a provisional transition tax obligation of $12.0 million. The Company continues to gather additional information to more precisely compute the amount of the transition tax.
The SEC staff issued Staff Accounting Bulletin No. 118 (SAB 118), which provides guidance on accounting for the tax effects of the Tax Reform. SAB 118 provides a measurement period that should not extend beyond one year from the Tax Reform enactment date for companies to complete the accounting under ASC 740. In accordance with SAB 118, a company must reflect the income tax effects of those aspects of the Tax Reform for which the accounting under ASC 740 is complete. To the extent that a company’s accounting for certain income tax effects of the Tax Reform is incomplete but it can determine a reasonable estimate, it must record a provisional estimate in the financial statements. If a company cannot determine a provisional estimate to be included in the financial statements, it should continue to apply ASC 740 based on the tax laws that were in effect immediately before the enactment of the Tax Reform.
While the Company can make reasonable estimates of the impact of the reduction in corporate rate and the deemed repatriation transition tax, the final impact of the Tax Reform may differ from these estimates, due to, among other things, changes in our
interpretations and assumptions, additional guidance that may be issued by taxing authorities, and actions the Company may take.
The Tax Reform also establishes new tax laws that will affect the fiscal year ending September 30, 2019, including, but not limited to, (1) elimination of the corporate alternative minimum tax, (2) a new provision designed to tax global intangible low-taxed income (GILTI), (3) limitations on the utilization of net operating losses generated after December 31, 2017 to 80 percent of taxable income per tax year, (4) the creation of the base erosion anti-abuse tax (BEAT), (5) a general elimination of U.S. federal income taxes on dividends from foreign subsidiaries, and (6) limitations on the deductibility of certain executive compensation.
Effects of tax law changes where a reasonable estimate of the accounting effects has not yet been made include additional limitations on certain meals and entertainment expenses and the unlimited carryforward of net operating losses. The Company has also not yet determined the potential tax impact of provisions that are not yet effective, such as GILTI, BEAT, elimination of U.S. tax on dividends of future foreign earnings, and a limitation of the utilization of net operating losses generated after fiscal 2018 to 80 percent of taxable income per tax year. The Company expects to make the policy election to treat GILTI as a period expense in the fiscal year ending September 30, 2018.
Current and Prior Period Tax Expense
Income tax expense, of $25.5 million and $2.1 million foras shown on the three months ended December 31, 2017 and 2016, respectively, reflectCondensed Consolidated Income Statements, reflects estimated federal, foreign, state and local income taxes. The Company recorded discrete expense of $20.9 million related to the Tax Reform. Tax expense, excluding the discrete expense related to the Tax Reform, was $4.6 million.
For the three months ended December 31, 2017 and 2016, theThe Company’s effective tax rate was 137%26% and 25%,27% for the three months ended March 31, 2024 and 2023, respectively. The discrete expense of $20.9 million related to tax reform, increased the effective tax rate by 112%. The effective rate for the first quarter of 2018 was 24.5%, excluding the impacts of the Tax Reform. The Company’s effective tax rate decreased 1.2% due to excess tax benefits on share-based compensation recognized during the period related to the adoption of ASU 2016-09. See Note 1 for more information regarding the adoption of ASU 2016-09. The effective rate during the first quarter of fiscal year 2017 was lowerhigher than the U.S. federal statutory rate primarilyof 21% for the three months ended March 31, 2024 due to a higher mix of earnings taxed at lower rates in foreign jurisdictions.
The valuation allowance for deferred tax assets as of December 31, 2017 and September 30, 2017 was $4.5 million and $4.0 million, respectively. The valuation allowances as of December 31, 2017 and September 30, 2017 were primarily related to U.S. state and local taxes, GILTI, U.S. and foreign net operating loss carryforwards that,permanent differences, and the amount of foreign earnings taxed at higher rates.
Note 16 – Regulatory Capital Requirements
The Company’s activities are subject to significant governmental regulation, both in the judgmentU.S. and in the international jurisdictions in which it operates. Subsidiaries of management,the Company were in compliance with all of their regulatory requirements as of March 31, 2024. The following table details those subsidiaries with minimum regulatory requirements in excess of $10.0 million along with the actual balance maintained as of that date.
| | | | | | | | | | | | | | | | | |
| (in millions) | | | As of March 31, 2024 |
| Subsidiary | Regulatory Authority | | Actual | | Minimum
Requirement |
| StoneX Financial Inc. | SEC and CFTC | | $ | 351.2 | | | $ | 257.2 | |
| StoneX Financial Ltd. | FCA | | $ | 455.5 | | | $ | 358.0 | |
| Gain Capital Group, LLC | CFTC and NFA | | $ | 50.6 | | | $ | 29.9 | |
| StoneX Financial Pte. Ltd. | MAS | | $ | 91.3 | | | $ | 25.8 | |
| StoneX Markets LLC | CFTC and NFA | | $ | 219.2 | | | $ | 125.9 | |
Certain other subsidiaries of the Company, typically with a minimum requirement less than $10.0 million, are not more likely than notalso subject to be realized. In assessingnet capital requirements promulgated by authorities in the realizabilitycountries in which they operate. As of deferred tax assets, management considers whether it is more likely than not that some orMarch 31, 2024, all of the deferred tax assets will not be realized.Company’s subsidiaries were in compliance with their local regulatory requirements.
The Company incurred U.S. federal, state, and local taxable income (losses) for the fiscal years ended September 30, 2017, 2016, and 2015 of $(24.7) million, $(9.7) million and $16.5 million, respectively. The differences between actual levels of past taxable income (losses) and pre-tax book income (losses) are primarily attributable to temporary differences in these jurisdictions. When evaluating if U.S. federal, state, and local deferred tax assets are realizable, the Company considered deferred tax liabilities of $5.5 million that are scheduled to reverse from 2018 to 2020 and $2.3 million of deferred tax liabilities associated with unrealized gains in securities which the Company could sell, if necessary. Furthermore, the Company considered its ability to implement business and tax planning strategies that would allow the remaining U.S. federal, state, and local deferred tax assets, net of valuation allowances, to be realized within approximately 5 years. Based on the tax planning strategies that are prudent and feasible, management believes that it is more likely than not that the Company will realize the tax benefit of the deferred tax assets, net of the existing valuation allowance, in the future. However, the realization of deferred income taxes is dependent on future events, and changes in estimates in future periods could result in adjustments to the valuation allowance.
The Company and its subsidiaries file income tax returns with the U.S. federal jurisdiction and various state, local and foreign jurisdictions. The Company has open tax years ranging from September 30, 2010 through September 30, 2017 with U.S. federal and state and local taxing authorities. In the U.K., the Company has open tax years ending September 30, 2016 to September 30, 2017. In Brazil, the Company has open tax years ranging from December 31, 2012 through December 31, 2017. In Argentina, the Company has open tax years ranging from September 30, 2010 to September 30, 2017. In Singapore, the Company has open tax years ranging from September 30, 2012 to September 30, 2017.
Note 1617 – Segment Analysis
The Company reports itsCompany’s operating segments are principally based on services providedthe nature of the clients it serves (commercial, institutional, and retail), and a fourth operating segment, its payments business. The Company manages its business in this manner due to customers. its large global footprint, in which it has approximately 4,300 employees allowing it to serve clients in more than 180 countries.
The Company’s business activities are managed as operating segments, and organized intowhich are our reportable segments for financial statement purposes as follows:shown below.
•Commercial
•Institutional
•Retail
•Payments (previously disclosed as Global Payments)
Commercial
The Company offers commercial clients a comprehensive array of products and services, including risk management and hedging services, execution and clearing of exchange-traded and OTC products, voice brokerage, market intelligence and physical trading, as well as commodity financing and logistics services. The ability to provide these high-value-added products and services differentiates the Company from its competitors and maximizes the opportunity to retain clients.
Institutional
The Company provides institutional clients with a complete suite of equity trading services to help them find liquidity with best execution, consistent liquidity across a robust array of fixed income products, competitive and efficient clearing and execution in all major futures and securities exchanges globally, as well as prime brokerage in equities and major foreign currency pairs and swap transactions. In addition, the Company originates, structures and places debt instruments in the international and domestic capital markets. These instruments include asset-backed securities (primarily in Argentina) and domestic municipal securities.
Commercial Hedging (includes components Financial Agricultural (Ag) & Energy27
Retail
The Company provides retail clients around the world access to over 18,000 global financial markets, including spot foreign exchange ("forex"), both financial trading and LME Metals)
physical investment in precious metals, as well as contracts for difference (“CFDs”), which are investment products with returns linked to the performance of underlying assets. In addition, its independent wealth management business offers a comprehensive product suite to retail investors in the U.S.Global Payments
Securities (includes components Equity Market-Making, Debt Trading, Investment Banking,The Company provides customized foreign exchange and Asset Management)
treasury services to banks and commercial businesses, as well as charities and non-governmental organizations and government organizations. The Company provides transparent pricing and offers payments services in more than 180 countries and 140 currencies, which it believes is more than any other payments solution provider.Physical Commodities (includes components Precious Metals and Physical Ag & Energy)
Clearing and Execution Services (includes components Exchange-traded Futures & Options, FX Prime Brokerage, Correspondent Clearing, Independent Wealth Management, and Derivative Voice Brokerage)
********The total revenues reported combine gross revenues for thefrom physical commodities businesscontracts for subsidiaries that are not broker-dealers and net revenues for all other businesses. In order to reflect the way that the Company’s management views the results, the table below also reflects the segment contribution to ‘operating revenues’, which is shown on the face of the condensed consolidated income statements and which is calculated by deducting physical commodities cost of sales from total revenues.
Segment data includes the profitability measure of net contribution by segment. Net contribution is one of the key measures used by management to assess the performance of each segment and for decisions regarding the allocation of the Company’s resources. Net contribution is calculated as revenue less direct cost of sales, transaction-based clearing expenses, variable compensation, introducing broker commissions, and interest expense. Variable compensation paid to risk management consultants/traders generally represents a fixed percentage of an amount equal to revenues generated, and in some cases, revenues producedgenerated less transaction-based clearing charges,expenses, base salaries and an overhead allocation.
Segment data also includes segment income which is calculated as net contribution less non-variable direct expenses of the segment. These non-variable direct expenses include trader base compensation and benefits, operational employee compensation and benefits, communication and data services, business development, professional fees, bad debt expense and other direct expenses.
Inter-segment revenues, charges,expenses, receivables and payables are eliminated upon consolidation, exceptconsolidation.
Total revenues, operating revenues and costs related to foreign currency transactions undertaken on an arm’s length basis bynet operating revenues shown in the foreign exchange trading business fortable below as “Corporate” primarily consist of interest income from the securities business. The foreign exchange trading business competes for this business as it does any other business. If its rates are not competitive,Company’s centralized corporate treasury function. In the securities businesses buy or sell their foreign currency through other market counterparties.
On a recurring basis,normal course of operations, the Company sweeps excess cash from certain U.S. operating segments tooperates a centralized corporate treasury function in which it may sweep excess cash from certain subsidiaries, where permitted within regulatory limitations, in exchange for ana short-term interest bearing intercompany payable, or provide excess cash to subsidiaries in exchange for a short-term interest bearing intercompany receivable asset.in lieu of the subsidiary borrowing on external credit facilities. The intercompany receivable asset isreceivables and payables are eliminated during consolidation,consolidation.
“Overhead costs and therefore this practice may impact reported total assets betweenexpenses” include costs and expenses of certain shared services such as information technology, accounting and treasury, credit and risk, legal and compliance, and human resources and other activities. These amount represent the gross overhead costs and expenses, before any allocation of overhead costs to operating segments.
Information for the reportable segments is shown in accordance with the Segment Reporting Topic of the ASC as follows:
| | | | | | | | | | | | | | | | | | | | | | | |
| | Three Months Ended March 31, | | Six Months Ended March 31, |
| (in millions) | 2024 | | 2023 | | 2024 | | 2023 |
| Total revenues: | | | | | | | |
| Commercial | $ | 21,479.1 | | | $ | 15,450.7 | | | $ | 40,457.1 | | | $ | 27,744.2 | |
| Institutional | 463.4 | | | 362.5 | | | 899.1 | | | 706.0 | |
| Retail | 111.3 | | | 304.6 | | | 213.0 | | | 620.8 | |
| Payments | 49.3 | | | 49.8 | | | 109.9 | | | 105.2 | |
| Corporate | 14.4 | | | 2.5 | | | 23.6 | | | 15.3 | |
| Eliminations | (11.4) | | | (9.1) | | | (23.6) | | | (18.9) | |
| Total | $ | 22,106.1 | | | $ | 16,161.0 | | | $ | 41,679.1 | | | $ | 29,172.6 | |
| Operating revenues: | | | | | | | |
| Commercial | $ | 200.5 | | | $ | 220.1 | | | $ | 398.9 | | | $ | 402.5 | |
| Institutional | 463.4 | | | 362.5 | | | 899.1 | | | 706.0 | |
| Retail | 102.0 | | | 78.6 | | | 194.5 | | | 149.1 | |
| Payments | 49.3 | | | 49.8 | | | 109.9 | | | 105.2 | |
| Corporate | 14.4 | | | 2.5 | | | 23.6 | | | 15.3 | |
| Eliminations | (11.4) | | | (9.1) | | | (23.6) | | | (18.9) | |
| Total | $ | 818.2 | | | $ | 704.4 | | | $ | 1,602.4 | | | $ | 1,359.2 | |
| Net operating revenues (loss): | | | | | | | |
| Commercial | $ | 164.2 | | | $ | 185.1 | | | $ | 327.6 | | | $ | 337.8 | |
| Institutional | 149.8 | | | 137.9 | | | 298.4 | | | 281.1 | |
| Retail | 74.3 | | | 50.8 | | | 141.3 | | | 94.7 | |
| Payments | 46.8 | | | 47.4 | | | 105.0 | | | 100.7 | |
| Corporate | (12.8) | | | (21.8) | | | (28.4) | | | (32.9) | |
| Total | $ | 422.3 | | | $ | 399.4 | | | $ | 843.9 | | | $ | 781.4 | |
| Net contribution: | | | | | | | |
| (Revenues less cost of sales of physical commodities, transaction-based clearing expenses, variable compensation, introducing broker commissions and interest expense) | | | | |
| Commercial | $ | 119.3 | | | $ | 140.9 | | | $ | 245.7 | | | $ | 256.6 | |
| Institutional | 102.5 | | | 89.3 | | | 202.7 | | | 183.9 | |
| Retail | 69.9 | | | 48.4 | | | 132.5 | | | 87.6 | |
| Payments | 37.3 | | | 38.1 | | | 84.9 | | | 80.2 | |
| Total | $ | 329.0 | | | $ | 316.7 | | | $ | 665.8 | | | $ | 608.3 | |
| Segment income: | | | | | | | |
| (Net contribution less non-variable direct segment costs) | | | | | | |
| Commercial | $ | 85.6 | | | $ | 102.9 | | | $ | 172.8 | | | $ | 185.7 | |
| Institutional | 61.3 | | | 55.8 | | | 126.5 | | | 117.8 | |
| Retail | 33.2 | | | 4.8 | | | 61.9 | | | 0.6 | |
| Payments | 24.6 | | | 15.9 | | | 59.6 | | | 48.2 | |
| Total | $ | 204.7 | | | $ | 179.4 | | | $ | 420.8 | | | $ | 352.3 | |
| Reconciliation of segment income to income before tax: | | | | |
| Segment income | $ | 204.7 | | | $ | 179.4 | | | $ | 420.8 | | | $ | 352.3 | |
| Net operating revenue (loss) with Corporate | (12.8) | | | (21.8) | | | (28.4) | | | (32.9) | |
| Overhead costs and expenses | (119.6) | | | (100.1) | | | (224.4) | | | (189.8) | |
| Gain on acquisition | — | | | — | | | — | | | 23.5 | |
| Income before tax | $ | 72.3 | | | $ | 57.5 | | | $ | 168.0 | | | $ | 153.1 | |
| | | | | | | |
| (in millions) | As of March 31, 2024 | | As of September 30, 2023 | | | | |
| Total assets: | | | | | | | |
| Commercial | $ | 5,154.8 | | | $ | 4,676.3 | | | | | |
| Institutional | 17,684.1 | | | 15,059.3 | | | | | |
| Retail | 1,111.8 | | | 1,014.2 | | | | | |
| Payments | 433.1 | | | 376.6 | | | | | |
| Corporate | 1,267.2 | | | 812.3 | | | | | |
| Total | $ | 25,651.0 | | | $ | 21,938.7 | | | | | |
|
| | | | | | | |
| | Three Months Ended December 31, |
| (in millions) | 2017 | | 2016 |
| Total revenues: | | | |
| Commercial Hedging | $ | 61.5 |
| | $ | 57.5 |
|
| Global Payments | 24.6 |
| | 23.1 |
|
| Securities | 43.0 |
| | 37.4 |
|
| Physical Commodities | 7,716.6 |
| | 5,898.7 |
|
| Clearing and Execution Services | 72.2 |
| | 63.6 |
|
| Corporate unallocated | 0.7 |
| | (5.9 | ) |
| Total | $ | 7,918.6 |
| | $ | 6,074.4 |
|
| Operating revenues (loss): | | | |
| Commercial Hedging | $ | 61.5 |
| | $ | 57.5 |
|
| Global Payments | 24.6 |
| | 23.1 |
|
| Securities | 43.0 |
| | 37.4 |
|
| Physical Commodities | 10.6 |
| | 9.8 |
|
| Clearing and Execution Services | 72.2 |
| | 63.6 |
|
| Corporate unallocated | 0.7 |
| | (5.9 | ) |
| Total | $ | 212.6 |
| | $ | 185.5 |
|
| Net operating revenues (loss): | | | |
| Commercial Hedging | $ | 49.1 |
| | $ | 45.6 |
|
| Global Payments | 23.0 |
| | 20.6 |
|
| Securities | 23.5 |
| | 25.1 |
|
| Physical Commodities | 8.4 |
| | 8.1 |
|
| Clearing and Execution Services | 27.4 |
| | 24.1 |
|
| Corporate unallocated | (1.1 | ) | | (9.2 | ) |
| Total | $ | 130.3 |
| | $ | 114.3 |
|
| Net contribution: | | | |
| (Revenues less cost of sales of physical commodities, transaction-based clearing expenses, variable bonus compensation, introducing broker commissions and interest expense) |
| Commercial Hedging | $ | 36.5 |
| | $ | 33.4 |
|
| Global Payments | 18.4 |
| | 16.4 |
|
| Securities | 17.8 |
| | 19.8 |
|
| Physical Commodities | 5.6 |
| | 5.8 |
|
| Clearing and Execution Services | 20.5 |
| | 18.0 |
|
| Total | $ | 98.8 |
| | $ | 93.4 |
|
| Segment income: | | | |
| (Net contribution less non-variable direct segment costs) | | | |
| Commercial Hedging | $ | 21.1 |
| | $ | 15.4 |
|
| Global Payments | 14.6 |
| | 13.2 |
|
| Securities | 11.0 |
| | 12.9 |
|
| Physical Commodities | 1.1 |
| | 3.0 |
|
| Clearing and Execution Services | 10.5 |
| | 5.7 |
|
| Total | $ | 58.3 |
| | $ | 50.2 |
|
| Reconciliation of segment income to income before tax: |
| Segment income | $ | 58.3 |
| | $ | 50.2 |
|
| Net costs not allocated to operating segments | 39.7 |
| | 41.8 |
|
| Income before tax | $ | 18.6 |
| | $ | 8.4 |
|
| | | | |
| (in millions) | As of December 31, 2017 | | As of September 30, 2017 |
| Total assets: | | | |
| Commercial Hedging | $ | 1,533.3 |
| | $ | 1,650.3 |
|
| Global Payments | 188.2 |
| | 199.5 |
|
| Securities | 2,569.1 |
| | 2,101.7 |
|
| Physical Commodities | 414.7 |
| | 339.5 |
|
| Clearing and Execution Services | 2,005.1 |
| | 1,818.9 |
|
| Corporate unallocated | 98.5 |
| | 133.5 |
|
| Total | $ | 6,808.9 |
| | $ | 6,243.4 |
|
Item 2. Management’s Discussion and Analysis of Financial Condition and Results of Operations
Throughout this document, unless the context otherwise requires, the terms “Company”, “we”, “us” and “our” refer to INTL FCStoneStoneX Group Inc. and its consolidated subsidiaries. INTL FCStone Inc. is a Delaware corporation.
The following discussion and analysis should be read in conjunction with the condensed consolidated financial statements and notes thereto appearing elsewhere in this report. This Quarterly Report on Form 10-Q contains “forward-looking statements” within the meaning of Section 27A of the Securities Act of 1933 and Section 21E of the Securities Exchange Act of 1934. These forward-looking statements involve known and unknown risks and uncertainties, many of which are beyond the control of INTL FCStone Inc. and its subsidiaries,the Company, including adverse changes in economic, political and market conditions, losses from our market-making and trading activities arising from counter-partycounterparty failures and changes in market conditions, the possible loss of key personnel, the impact of increasing competition, the impact of changes in government regulation, the possibility of liabilities arising from violations of foreign, United States (“U.S.”) federal and U.S. state securities laws, and the impact of changes in technology in the securities and commodities trading industries.industries, and other risks discussed in our filings with the SEC, including Part I, Item 1A of our Annual Report on Form 10-K for the year ended September 30, 2023. Although we believe that our forward-looking statements are based upon reasonable assumptions regarding our business and future market conditions, there can be no assurances that our actual results will not differ materially from any results expressed or implied by our forward-looking statements. We undertake no obligation to publicly update or revise any forward-looking statements, whether as a result of new information, future events or otherwise.otherwise, except as required by law. We caution readers that any forward-looking statements are not guarantees of future performance.
Overview
INTL FCStone Inc. isWe operate a diversified global financial services organizationnetwork that connects companies, organizations, traders and investors to the global market ecosystem through a unique blend of digital platforms, end-to-end clearing and execution services, high touch service and deep expertise. We strive to be the one trusted partner to our clients, providing execution, risk managementour network, product and advisory services to allow them to pursue trading opportunities, manage their market intelligence,risks, make investments and clearing services across asset classesimprove their business performance. Our businesses are supported by our global infrastructure of regulated operating subsidiaries, our advanced technology platform and markets around the world. We help our customers access market liquidity, maximize profits and manage risk.
We are a leader in the developmentteam of specialized financial services in commodities, securities, global payments, foreign exchange and other markets. Our revenues are derived primarily from financial products and advisory services intended to fulfill our customers’ real needs and provide bottom-line benefits to their businesses. We work to create added value for our customers by providing access to global financial markets using our industry and financial expertise, deep partner and network relationships, insight and guidance, and integrity and transparency.approximately 4,300 employees as of March 31, 2024. We believe our customer-firstclient-first approach differentiates us from large banking institutions, engenders trust and has enabled us to establish leadership positions in a number of complex fields in financial markets around the world. For additional information, see Overview of Business and Strategy within “Item 1. Business” in our Annual Report on Form 10-K for the fiscal year ended September 30, 2023.
Our leadership positions span markets such as commodity risk management advisory services; global payments; market-making in international equities and other securities; fixed income; correspondent securities clearing and independent wealth management; physical trading and hedging of precious metals and select other commodities; execution of listed futures and optionsWe report our operating segments based primarily on futures contracts on all major commodity exchanges and foreign currency trading, among others. These businesses are supported by our global infrastructure of regulated operating subsidiaries, advanced technology platform and team of more than 1,600 employees. We currently serve more than 20,000 predominantly wholesale organizations, located in more than 130 countries. Our recent acquisitionthe nature of the Sterne Agee correspondent clearingclients we serve (commercial, institutional, and independent wealth management businesses added approximately 50 correspondent clearing relationships with more than 120,000 underlying individual securities accounts,retail), and a fourth operating segment, our payments business. See Segment Information below for a listing of which 65,000 are relatedbusiness activities performed within our reportable segments.
Common Stock Split
On November 7, 2023, our Board of Directors approved a three-for-two split of its common stock, to the independent wealth management business acquired.
Our customers include producers, processors and end-users of nearly all widely traded physical commodities; commercial counterparties who are end-users of our products and services; governmental and non-governmental organizations; and commercial banks, asset managers, introducing broker-dealers, insurance companies, brokers, institutional investors and major investment banks. We believe our customers value us for our focus on their needs, our expertise and flexibility, our global reach, our ability to provide access to hard-to-reach markets and opportunities, and our statusbe effected as a well-capitalizedstock dividend. The stock split was effective on November 24, 2023, and regulatory-compliant organization.entitled each shareholder of record as of November 17, 2023 to receive one additional share of common stock for every two shares owned and cash in lieu of fractional shares.
We believe we are well positioned to capitalize on key trends impactingThe stock split increased the financial services sector. Among others, these trends include the impactnumber of increased regulation on banking institutionsshares of common stock outstanding. All share and other financial services providers; increased consolidation, especially of smaller sub-scale financial services providers and independent securities clearing firms; the growing importance and complexity of conducting secure cross-border transactions; and the demand among financial institutions to transact with well-capitalized counterparties.
We focus on mitigating exposure to market risk, ensuring adequate liquidity to maintain daily operations and making non-interest expenses variable, to the greatest extent possible.
Effects of the Tax Cuts and Jobs Act
On December 22, 2017, the President of the United States signed and enacted into law H.R. 1, the Tax Cuts and Jobs Act (“the Tax Reform”). Among the significant changes to the U.S. Internal Revenue Code, the Tax Reform lowers the U.S. federal corporate income tax rate from 35% to 21%, effective January 1, 2018. We will compute our income tax expense (benefit)per share amounts contained herein have been retroactively adjusted for the September 30, 2018 tax year using a U.S. statutory tax rate of 24.5%. The 21% U.S. statutory tax rate will apply to fiscal years ending September 30, 2019 and thereafter. The Tax Reform also imposes a one-time mandatory repatriation transition tax on previously untaxed accumulated and current earnings and profits (“E&P”) of certain ofstock split.
Executive Summary
In the Company’s foreign subsidiaries.
Our accounting for certain elements of the Tax Reform is incomplete. However, as of December 31, 2017, we can determine a reasonable estimate for certain effects of the Tax Reform and have recorded an estimate as a provisional amount. The provisional remeasurement of the deferred tax assets and liabilities resulted in a $8.9 million discrete tax expense, which increased the effective tax rate by 48% in the firstsecond quarter of fiscal 2018. The provisional remeasurement amount is expected2024, the diversification of our product offering and client segments led to changeimproved performance as data becomes available allowing more accurate scheduling of the deferred tax assets and liabilities.
To determine the amount of the transition tax, we must determine, in additioncompared to other factors, the amount of post 1986 E&P of the relevant subsidiaries, as well as the amount of non-US income taxes paid on such earnings. We can make a reasonable estimate of the transition tax and recorded a provisional transition tax obligation of $12.0 million, which increased the effective tax rate by 64% in the three months ended December 31, 2017. We continue to gather additional information to more precisely compute the amount of the transition tax.
While we can make reasonable estimates of the impact of the reduction in corporate rate and the deemed repatriation transition tax, the final impact of the Tax Reform may differ from these estimates, due to, among other things, changes in our interpretations and assumptions, additional guidance that may be issued by the I.R.S., and actions we may take.
The Tax Reform also establishes new tax laws that will affect the fiscal year ending September 30, 2019, including, but not limited to, (1) elimination of the corporate alternative minimum tax, (2) a new provision designed to tax global intangible low-taxed income (GILTI), (3) limitations on the utilization of net operating losses generated after December 31, 2017 to 80 percent of taxable income per tax year, (4) the creation of the base erosion anti-abuse tax (BEAT), (5) a general elimination of U.S. federal income taxes on dividends from foreign subsidiaries, and (6) limitations on the deductibility of certain executive compensation.
Executive Summary
We achieved record operating revenues of $212.6 million in the first quarter of fiscal 2018, representing 15% growth over the prior year. This resulted in income before tax of $18.6 million which is one of our strongest ever first quarters of a fiscal year and represented a 121%The significant increase over the prior year. We achieved growth in operating revenues in all of our operating segments, despite difficult market conditions, in particularRetail segment, continued low market volatility in most of our key markets and low commodity prices.
For the first quarter of fiscal 2018, we recorded a net loss of $6.9 million, or $0.37 per share, which included an estimated one-time charge of $20.9 million, or $1.12 per share, related to the enactment of the Tax Reform. As noted above, this charge is comprised of $8.9 million related to the re-measurement of our deferred tax assets and liabilities arising from a lower U.S. corporate tax rate and shift to a territorial tax regime, and $12.0 million related to the deemed repatriation of unremitted earnings of foreign subsidiaries. These charges were largely offset by deferred tax assets and thus will not result in a significant increase in cash taxes paid. Excluding the impact of Tax Reform, net income of $14.0 million increased 122% versus the prior year period.
The growth in operating revenues was led by our ClearingInstitutional client volumes and Execution Services, which increased $8.6 million versus the prior year, while our Securitiescontinued growth in interest and Commercial Hedging segments added $5.6 million and $4.0 million, respectively. The Global Payments segment increased operating revenues by $1.5 million while Physical Commodities added $0.8 million.
Overall, segmentfee income increased 16%, or $8.1 million with theearned on client balances, more than offset declines in Commercial Hedging and Clearing and Execution Services (“CES”) segment adding $5.7 million and $4.8 million respectively. In addition, Global Payments segment income increased $1.4 million versus the prior year period. Partially offsetting these increases, our Securities and Physical Commodities segments each declined $1.9 million versus the prior year period.
Commercial Hedging segment income increased 37%, primarily as a result of an increase in both OTC revenues and interest income as well as a $2.6 million decline in non-variable direct expenses. The prior year period included a $2.5 million bad debt expense in our LME metals business.
CES segment income increased 84%, primarily as a result of the increase in operating revenue as well as a $2.3 million decline in non-variable direct expenses. The decline in non-variable expenses, most notable in compensation and benefits as well as trade system costs were a result of cost savings initiatives in our FX Prime Brokerage, Correspondent Clearing and Derivative Voice Brokerage businesses.
Global Payments segment income increased 11%, primarily as a result of the increase in operating revenues, driven by a 7% increase in the number of payments made combined while maintaining a steady average revenue per payment versus the prior year period as well as a $0.9 million decline in introducing broker commissions.
While Physical Commodities segment operating revenues, increased 8%, this was temperedwhich were negatively impacted by a $1.3 milliongenerally lower agricultural market volatility and unrealized losslosses on precious metals derivative positions heldentered into against precious metals inventoryinventories carried at the lower of cost or net realizable value, which will be offset by realized gains in subsequent quarters when these inventories are sold.
Operating revenues increased $113.8 million, or 16%, to $818.2 million in the three months ended March 31, 2024 compared to $704.4 million in the three months ended March 31, 2023, led by our Institutional and Retail segments which added $100.9 million and $23.4 million, respectively, compared to the three months ended March 31, 2023. Operating revenues in our non-broker dealer subsidiaries. In addition, we recorded a $1.0Commercial and Payments segments declined $19.6 million bad debt expense and $0.5 million, in professional fees relatedrespectively, compared to the three months ended March 31, 2023.
Overall segment income increased $25.3 million, or 14%, compared to the three months ended March 31, 2023, with all of our exitsegments experiencing growth versus the prior year, with the exception of our Commercial segment. The growth was led by our Retail segment which added $28.4 million compared to the physical coal business. Securitiesthree months ended March 31, 2023. In addition, our Institutional and Payments segments increased $5.5 million and $8.7 million, respectively, compared to the three months ended March 31, 2023, while our Commercial segment income declined 15%, primarily as a result$17.3 million compared to the three months ended March 31, 2023.
Interest expense related to corporate funding purposes increased $1.3 million to $16.2 million in the three months ended March 31, 2024 compared to $14.9 million in the three months ended March 31, 2023, principally due to incremental interest from our March 1, 2024 issuance of a $5.4 million increase in interest expense insenior secured notes due 2031, partially offset by lower average borrowings on our Debt Trading business as well as a $1.5 million increase in transaction-based clearing expenses in our Equity Market-Making business.revolving credit facility.
On the expense side, we continue to focus on maintaining our variable cost model and limiting the growth of our non-variable
expenses. To that end, variableVariable expenses were 58%51% of total expenses in the current period which was flat withthree months ended March 31, 2024 as compared to 51% in the prior year period.three months ended March 31, 2023. Non-variable expenses, excluding bad debts, increased 5%,$16.5 million compared to the three months ended March 31, 2023, principally due to higher professional fees, occupancy and equipment rental, non-trading technology and support, travel and business development and trading system and market information.
Net income increased $11.4 million to $53.1 million in the three months ended March 31, 2024 compared to $41.7 million in the three months ended March 31, 2023. Net income in the three months ended March 31, 2024 was negatively impacted by the aforementioned unrealized losses on precious metals derivative positions entered into against inventories carried at the lower of cost or $3.4net realizable value. Net income in the three months ended March 31, 2024 includes a nonrecurring gain related to proceeds of $6.9 million year-over-year, primarily asresulting from a result of an increasesettlement in non-variable compensationthe Commodity Exchange Gold Futures and benefits.Options Trading matter, which is included in Gain on acquisition and other gain in the Condensed Consolidated Income Statement. Diluted earnings per share were $1.63 for the three months ended March 31, 2024 compared to $1.30 in the three months ended March 31, 2023.
Selected Summary Financial Information
Results of Operations
TotalOur total revenues, as reported, combine gross revenues for the physical commodities business and net revenues for all other businesses. In order to reflectManagement believes that operating revenues, which deduct the way that we view the results, the table below reflects the calculation of the subtotal ‘operating revenues’, which is calculated by deducting physical commodities cost of sales of physical commodities from total revenues. Belowrevenues, is a discussion of themore useful financial measure with which to assess our results of operations.The table below sets forth our operations,operating revenues, as viewed by management,well as other key financial measures, for the three months ended December 31, 2017 and 2016.periods indicated.
Financial Information (Unaudited)
| | | | | | | | | | | | | | | | | | | | | | | | | | | | | | | | | | | |
| Three Months Ended March 31, | | Six Months Ended March 31, |
| (in millions) | 2024 | | 2023 | | % Change | | 2024 | | 2023 | | % Change |
| Revenues: | | | | | | | | | | | |
| Sales of physical commodities | $ | 21,321.9 | | | $ | 15,506.2 | | | 38% | | $ | 40,142.8 | | | $ | 27,909.6 | | | 44% |
| Principal gains, net | 281.8 | | | 256.6 | | | 10% | | 575.6 | | | 510.8 | | | 13% |
| Commission and clearing fees | 136.2 | | | 130.7 | | | 4% | | 265.9 | | | 248.7 | | | 7% |
| Consulting, management, and account fees | 40.2 | | | 40.7 | | | (1)% | | 78.7 | | | 80.5 | | | (2)% |
| Interest income | 326.0 | | | 226.8 | | | 44% | | 616.1 | | | 423.0 | | | 46% |
| Total revenues | 22,106.1 | | | 16,161.0 | | | 37% | | 41,679.1 | | | 29,172.6 | | | 43% |
| Cost of sales of physical commodities | 21,287.9 | | | 15,456.6 | | | 38% | | 40,076.7 | | | 27,813.4 | | | 44% |
| Operating revenues | 818.2 | | | 704.4 | | | 16% | | 1,602.4 | | | 1,359.2 | | | 18% |
| Transaction-based clearing expenses | 78.5 | | | 69.2 | | | 13% | | 152.8 | | | 136.5 | | | 12% |
| Introducing broker commissions | 42.0 | | | 42.2 | | | —% | | 81.1 | | | 79.0 | | | 3% |
| Interest expense | 259.2 | | | 178.7 | | | 45% | | 495.2 | | | 333.0 | | | 49% |
| Interest expense on corporate funding | 16.2 | | | 14.9 | | | 9% | | 29.4 | | | 29.3 | | | —% |
| Net operating revenues | 422.3 | | | 399.4 | | | 6% | | 843.9 | | | 781.4 | | | 8% |
| Compensation and benefits | 234.4 | | | 232.5 | | | 1% | | 452.5 | | | 431.5 | | | 5% |
| Bad debts (recoveries), net | (0.4) | | | 3.0 | | | n/m | | (0.7) | | | 3.7 | | | n/m |
| Other expenses | 122.9 | | | 106.4 | | | 16% | | 231.0 | | | 216.6 | | | 7% |
| Total compensation and other expenses | 356.9 | | | 341.9 | | | 4% | | 682.8 | | | 651.8 | | | 5% |
| Gain on acquisition and other gains | 6.9 | | | — | | | n/m | | 6.9 | | | 23.5 | | | (71)% |
| Income before tax | 72.3 | | | 57.5 | | | 26% | | 168.0 | | | 153.1 | | | 10% |
| Income tax expense | 19.2 | | | 15.8 | | | 22% | | 45.8 | | | 34.8 | | | 32% |
| Net income | $ | 53.1 | | | $ | 41.7 | | | 27% | | $ | 122.2 | | | $ | 118.3 | | | 3% |
| | | | | | | | | | | |
| Return on average stockholders’ equity | 14.0 | % | | 13.8 | % | | | | 16.7 | % | | 20.4 | % | | |
| | | | | | | | | | | |
| Balance Sheet information: | | | | | | | March 31, 2024 | | March 31, 2023 | | % Change |
| Total assets | | | | | | | $ | 25,651.0 | | | $ | 21,918.9 | | | 17% |
| Payables to lenders under loans | | | | | | | $ | 253.6 | | | $ | 561.3 | | | (55)% |
| Senior secured borrowings, net | | | | | | | $ | 885.9 | | | $ | 340.6 | | | 160% |
| Stockholders’ equity | | | | | | | $ | 1,542.6 | | | $ | 1,247.3 | | | 24% |
| n/m = not meaningful to present as a percentage |
|
| | | | | | | | | | |
| | Three Months Ended December 31, |
| (in millions) | 2017 | | % Change | | 2016 |
| Revenues: | | | | | |
| Sales of physical commodities | $ | 7,714.4 |
| | 31 | % | | $ | 5,896.0 |
|
| Trading gains, net | 85.8 |
| | 3 | % | | 83.0 |
|
| Commission and clearing fees | 77.8 |
| | 12 | % | | 69.2 |
|
| Consulting, management, and account fees | 16.6 |
| | 6 | % | | 15.7 |
|
| Interest income | 24.0 |
| | 131 | % | | 10.4 |
|
| Other income | — |
| | (100 | )% | | 0.1 |
|
| Total revenues | 7,918.6 |
| | 30 | % | | 6,074.4 |
|
| Cost of sales of physical commodities | 7,706.0 |
| | 31 | % | | 5,888.9 |
|
| Operating revenues | 212.6 |
| | 15 | % | | 185.5 |
|
| Transaction-based clearing expenses | 36.9 |
| | 10 | % | | 33.6 |
|
| Introducing broker commissions | 31.1 |
| | 8 | % | | 28.7 |
|
| Interest expense | 14.3 |
| | 61 | % | | 8.9 |
|
| Net operating revenues | 130.3 |
| | 14 | % | | 114.3 |
|
| Compensation and benefits | 77.2 |
| | 9 | % | | 70.6 |
|
| Bad debts | 1.1 |
| | (56 | )% | | 2.5 |
|
| Other expenses | 33.4 |
| | 2 | % | | 32.8 |
|
| Total compensation and other expenses | 111.7 |
| | 5 | % | | 105.9 |
|
| Income before tax | 18.6 |
| | 121 | % | | 8.4 |
|
| Income tax expense | 25.5 |
| | 1,114 | % | | 2.1 |
|
| Net (loss) income | $ | (6.9 | ) | | n/m |
| | $ | 6.3 |
|
| | | | | | |
| Balance Sheet information: | December 31, 2017 | | % Change | | December 31, 2016 |
| Total assets | $ | 6,808.9 |
| | 8 | % | | $ | 6,290.7 |
|
| Payables to lenders under loans | $ | 422.9 |
| | 35 | % | | $ | 312.6 |
|
| Stockholders’ equity | $ | 443.2 |
| | — | % | | $ | 442.6 |
|
The selectedtables below present operating revenues disaggregated across the key products we provide to our clients and select operating data table below reflects key operatingand metrics used by management in evaluating our product lines,performance, for the periods indicated:indicated. |
| | | | | | | | | | |
| | Three Months Ended December 31, |
| | 2017 | | % Change | | 2016 |
| Volumes and Other Data: | | | | | |
| Exchange-traded - futures and options (contracts, 000’s) | 25,862.1 |
| | 7 | % | | 24,112.7 |
|
| OTC (contracts, 000’s) | 327.9 |
| | 9 | % | | 301.8 |
|
| Global Payments (# of payments, 000’s) | 156.3 |
| | 7 | % | | 146.6 |
|
| Gold equivalent ounces traded (000’s) | 33,503.1 |
| | 38 | % | | 24,329.2 |
|
| Equity Market-Making (gross dollar volume, millions) | $ | 24,734.3 |
| | 11 | % | | $ | 22,355.3 |
|
| Debt Trading (gross dollar volume, millions) | $ | 33,233.7 |
| | 1 | % | | $ | 33,045.6 |
|
| FX Prime Brokerage volume (U.S. notional, millions) | $ | 114,302.0 |
| | (33 | )% | | $ | 169,872.6 |
|
| Average assets under management in Argentina (U.S. dollar, millions) | $ | 473.7 |
| | (7 | )% | | $ | 509.8 |
|
| Average customer equity - futures and options (millions) | $ | 2,125.8 |
| | 2 | % | | $ | 2,078.1 |
|
| | | | | | | | | | | | | | | | | | | | | | | | | | | | | | | | | | | |
| Three Months Ended March 31, | | Six Months Ended March 31, |
| 2024 | | 2023 | | % Change | | 2024 | | 2023 | | % Change |
| Operating Revenues (in millions): | | | | | | | | | | | |
| Listed derivatives | $ | 111.7 | | | $ | 110.5 | | | 1% | | $ | 220.9 | | | $ | 210.3 | | | 5% |
| Over-the-counter (“OTC”) derivatives | 53.0 | | | 57.9 | | | (8)% | | 97.5 | | | 100.4 | | | (3)% |
| Securities | 340.7 | | | 249.2 | | | 37% | | 656.9 | | | 483.3 | | | 36% |
| FX / Contracts For Difference (“CFD”) contracts | 80.3 | | | 61.8 | | | 30% | | 154.9 | | | 110.6 | | | 40% |
| Payments | 48.4 | | | 48.5 | | | —% | | 107.8 | | | 102.7 | | | 5% |
| Physical contracts | 45.9 | | | 54.1 | | | (15)% | | 97.3 | | | 113.8 | | | (14)% |
| Interest / fees earned on client balances | 104.2 | | | 103.4 | | | 1% | | 202.6 | | | 189.6 | | | 7% |
| Other | 31.0 | | | 25.6 | | | 21% | | 64.5 | | | 52.1 | | | 24% |
| Corporate | 14.4 | | | 2.5 | | | 476% | | 23.6 | | | 15.3 | | | 54% |
| Eliminations | (11.4) | | | (9.1) | | | 25% | | (23.6) | | | (18.9) | | | 25% |
| $ | 818.2 | | | $ | 704.4 | | | 16% | | $ | 1,602.4 | | | $ | 1,359.2 | | | 18% |
| | | | | | | | | | | |
| Volumes and Other Select Data: |
| Listed derivatives (contracts, 000’s) | 53,805 | | | 41,588 | | | 29% | | 104,563 | | | 81,787 | | | 28% |
Listed derivatives, average rate per contract (1) | $ | 1.98 | | | $ | 2.54 | | | (22)% | | $ | 2.01 | | | $ | 2.42 | | | (17)% |
| Average client equity - listed derivatives (millions) | $ | 6,064 | | | $ | 7,222 | | | (16)% | | $ | 6,117 | | | $ | 7,722 | | | (21)% |
| OTC derivatives (contracts, 000’s) | 810 | | | 858 | | | (6)% | | 1,625 | | | 1,576 | | | 3% |
| OTC derivatives, average rate per contract | $ | 65.66 | | | $ | 67.94 | | | (3)% | | $ | 60.28 | | | $ | 64.37 | | | (6)% |
| Securities average daily volume (“ADV”) (millions) | $ | 7,473 | | | $ | 5,759 | | | 30% | | $ | 6,838 | | | $ | 4,995 | | | 37% |
Securities rate per million (“RPM”) (2) | $ | 239 | | | $ | 282 | | | (15)% | | $ | 265 | | | $ | 341 | | | (22)% |
| Average money market / FDIC sweep client balances (millions) | $ | 1,047 | | | $ | 1,374 | | | (24)% | | $ | 1,054 | | | $ | 1,455 | | | (28)% |
| FX / CFD contracts ADV (millions) | $ | 10,453 | | | $ | 13,490 | | | (23)% | | $ | 10,685 | | | $ | 13,160 | | | (19)% |
| FX / CFD contracts RPM | $ | 120 | | | $ | 72 | | | 67% | | $ | 114 | | | $ | 67 | | | 70% |
| Payments ADV (millions) | $ | 64 | | | $ | 65 | | | (2)% | | $ | 69 | | | $ | 70 | | | (1)% |
| Payments RPM | $ | 12,327 | | | $ | 11,916 | | | 3% | | $ | 12,453 | | | $ | 11,655 | | | 7% |
| | | | | | | | | | | | | | |
| (1) | Give-up fee revenues, related to contract execution for clients of other FCMs, as well as cash and voice brokerage revenues are excluded from the calculation of listed derivatives, average rate per contract. |
| (2) | Interest expense associated with our fixed income activities is deducted from operating revenues in the calculation of Securities RPM, while interest income related to securities lending is excluded. |
Operating Revenues
Three Months Ended DecemberMarch 31, 20172024 Compared to Three Months Ended DecemberMarch 31, 20162023
Operating revenues increased 15%$113.8 million, or 16%, to a record $212.6 million in the first quarter compared to $185.5$818.2 million in the prior year. All operating segments recorded growththree months ended March 31, 2024 compared to $704.4 million in the three months ended March 31, 2023. The table above displays operating revenues led bydisaggregated across the key products we provide to our Clearing and Execution Services and Securities segments, whichclients.
Operating revenues derived from listed derivatives increased $8.6$1.2 million, and $5.6 million, respectively. In addition, the Commercial Hedging segment added $4.0or 1%, to $111.7 million in operating revenues versus the prior year, while Global Payments and Physical Commodities added $1.5three months ended March 31, 2024 compared to $110.5 million and $0.8 million, respectively.
The prior year period included a $5.6 million pre-tax unrealized loss on interest rate swaps and U.S. Treasury notes held as part of our interest rate management strategy, while the first quarter of fiscal 2018 included no unrealized gains/losses on this program as all interest rate swaps and U.S. Treasury notes had been liquidated during fiscal 2017. On a segment basis, these unrealized gains and losses are reported in the Corporate unallocated segment.
Operating revenuesthree months ended March 31, 2023, with a $3.1 million increase in our CESInstitutional segment increased 14% to $72.2 million in the first quarter, primarily asmore than offsetting a result of 29% growth in Exchange-traded Futures & Options revenues, to $35.9 million, driven by increases in contract volumes, the average rate per contract earned and interest income. Our Independent Wealth Management business added $1.2 million versus the prior year and Derivative Voice Brokerage added $0.6 million. These increases were tempered by a $0.8$1.9 million decline in FX Prime BrokerageCommercial segment listed derivative operating revenues as well as a $0.4 million decline in our Correspondent Clearing business.
Operating revenues in our Securities segment increased 15% to $43.0 million in the first quarter compared to the prior year. The Equity Market-Making business added $2.3 million, as the gross dollar volume traded increased 11% as a result of the on-boarding of new customers and increased market share. Operating revenues in our Debt Trading business increased $4.3 million versus the prior year, with increases in our domestic institutional fixed income, Argentina and municipal securities businesses. Asset Management operating revenues declined $0.9 million as compared to the prior year period as a result of a 7% decline of average assets under management.three months ended March 31, 2023.
Operating revenues derived from OTC derivatives declined $4.9 million, or 8%, to $53.0 million in Commercial Hedging increased 7%,the three months ended March 31, 2024 compared to $57.9 million in the prior yearthree months ended March 31, 2023, principally driven by lower client activity in Brazilian agricultural markets.
Operating revenues derived from securities transactions increased $91.5 million, or 37%, to $61.5$340.7 million asin the three months ended March 31, 2024 compared to $249.2 million in the three months ended March 31, 2023. This increase was principally due to a result of a $4.6 million30% increase in OTC revenues and a $1.9 millionADV, as well as an increase in short-term interest income. These increases were temperedrates. Carried interest on fixed income securities is a component of operating revenues, however interest expense associated with financing these positions is not. Our calculation of the securities RPM, in the table above, presents the RPM after deducting from operating revenues the interest expense associated with our fixed income activities. Net operating revenues derived from securities transactions increased $4.4 million, or 5%, to $88.6 million in the three months ended March 31, 2024 compared to $84.2 million in the three months ended March 31, 2023. This increase was principally driven by lower exchange-traded revenues which declined $2.5 million. OTC revenues increased as a result of both a 9%the increase in customer OTC volumes and a 22% increase in the average rate per contract, primarily in agricultural commodities. Exchange-traded revenues declined primarily as a result of a 13% decline in the average rate per contract,ADV noted above, which more than offset the 15% decline in the RPM resulting from a 7% increasetightening of spreads and a change in exchange-traded contract volume.product mix.
Operating revenues in our Global Payments segmentderived from FX/CFD contracts increased 6% in the first quarter$18.5 million, or 30%, to $24.6$80.3 million as a result of a 7% increase in the number of global payments made whilethree months ended March 31, 2024 compared to $61.8 million in the average revenue per trade was stablethree months ended March 31, 2023, with the prior year period.
Our Physical Commodity segment operating revenues increased 8% to $10.6 million, primarily as a result of a $0.9$20.2 million increase in Physical Ag & Energyour Retail segment more than offsetting a $1.7 million decline in Institutional segment FX/CFD contracts operating revenues as compared to the three months ended March 31, 2023.
Operating revenues from payments declined $0.1 million, to $48.4 million in the three months ended March 31, 2024 compared to $48.5 million in the three months ended March 31, 2023, principally driven by a 2% decrease in the ADV, which was partially offset by a $0.13% increase in the RPM as compared to the three months ended March 31, 2023.
Operating revenues derived from physical contracts declined $8.2 million, declineor 15%, to $45.9 million in Precious Metals operating revenues.the three months ended March 31, 2024 compared to $54.1 million in the three months ended March 31, 2023. Precious metals in related operating revenues during the first quarter include a $1.3 millionthree months ended March 31, 2024 were unfavorably impacted by unrealized losslosses on derivative positions of $9.1 million, related to physical inventories held against preciousat the lower of cost or net realizable value. Precious metals inventoryrelated operating revenues during the three months ended March 31, 2023 were favorably impacted by realized gains of $1.8 million on the sale of physical inventories carried at the lower of cost or net realizable value, for which losses on related derivative positions were recognized in prior periods.
Interest and fee income earned on client balances, which is associated with our non-broker dealer subsidiaries.
Interest incomelisted and OTC derivatives, correspondent clearing, and independent wealth management product offerings, increased $13.6$0.8 million, or 1%, to $24.0$104.2 million in the first quarterthree months ended March 31, 2024 compared to $103.4 million in the three months ended March 31, 2023. This was principally driven by an increase in short-term interest rates, which was partially offset by declines in average client equity and average money-market/FDIC sweep client balances of 16% and 24%, respectively, as compared to prior yearthe three months ended March 31, 2023.
Six Months Ended March 31, 2024 Compared to Six Months Ended March 31, 2023
Operating revenues increased $243.2 million, or 18%, to $1,602.4 million in the six months ended March 31, 2024 compared to $1,359.2 million in the six months ended March 31, 2023. The table above displays operating revenues disaggregated across the key products we provide to our clients.
Operating revenues from listed derivatives increased $10.6 million, or 5%, to $220.9 million in the six months ended March 31, 2024 compared to $210.3 million in the six months ended March 31, 2023, with Institutional and Commercial segment listed derivative operating revenues increasing $6.9 million and $3.7 million, respectively, as compared to the six months ended March 31, 2023.
Operating revenues in OTC derivatives declined $2.9 million, or 3%, to $97.5 million in the six months ended March 31, 2024 compared to $100.4 million in the six months ended March 31, 2023. This decline was principally driven by declines in OTC contract volumes and average rate per contract of 6% and 3%, respectively, as compared to the six months ended March 31, 2023.
Operating revenue from securities transactions increased $173.6 million, or 36%, to $656.9 million in the six months ended March 31, 2024 compared to $483.3 million in the six months ended March 31, 2023. This increase was principally due to a 37% increase in securities ADV, as well as a significant increase in interest rates. Carried interest on fixed income securities is a component of operating revenues, however interest expense associated with financing these positions is not. Our calculation of securities RPM, in the table above, presents the RPM after deducting from operating revenues the interest expense associated with our fixed income activities. Net operating revenues derived from securities transactions increased $6.9 million, or 4%, to $184.5 million in the six months ended March 31, 2024 compared to $177.6 million in the three months ended March 31, 2023. This increase was principally driven by the increase in ADV noted above, which more than offset the 22% decline in RPM resulting from a tightening of spreads and a change in product mix.
Operating revenues from FX/CFD contracts increased $44.3 million, or 40%, to $154.9 million in the six months ended March 31, 2024 compared to $110.6 million in the six months ended March 31, 2023, with a $47.2 million increase in our Retail segment more than offsetting a $2.9 million decline in Institutional segment FX/CFD contracts operating revenues as compared to the six months ended March 31, 2023.
Operating revenues from payments increased by $5.1 million, or 5%, to $107.8 million in the six months ended March 31, 2024 compared to $102.7 million in the six months ended March 31, 2023, principally as a result of a 7% increase in payments RPM, which was partially offset by a 1% decline in ADV, as compared to the six months ended March 31, 2023.
Operating revenues from physical contracts declined $16.5 million, or 14%, to $97.3 million in the six months ended March 31, 2024 compared to $113.8 million in the six months ended March 31, 2023, Precious metals related operating revenues were unfavorably impacted during the six months ended March 31, 2024, by unrealized losses on derivative positions of $10.8 million, related to physical inventories held at the lower of cost or net realizable value. Precious metals related operating revenues during the six months ended March 31, 2023 were unfavorably impacted by unrealized losses on derivative positions of $2.1 million, related to physical inventories held at the lower of cost or net realizable value.
Interest and fee income earned on client balances, which is associated with our listed and OTC derivative businesses, as well as our correspondent clearing and independent wealth management businesses, increased $13.0 million, or 7%, to $202.6 million in the six months ended March 31, 2024 compared to $189.6 million in the six months ended March 31, 2023, principally as a result of the effectimpact of increases in short term interest rates on first quarter performance as well as a $4.6 million unrealized loss on U.S Treasury notes in the prior year period. Our Securities segment increased $4.6 million in the first quarter over the prior year. In addition,
average customer equity in the Financial Ag & Energy and Exchange-traded Futures & Options components of our Commercial Hedging and CES segments increased 2% to $2.1 billion in the first quarter compared to the prior year, which combined with the increasesincrease in short-term interest rates, resultedwhich was partially offset by declines in an aggregate $3.7 million increase in interest income in these businesses.average client equity and average money-market/FDIC sweep client balances of 21% and 28%, respectively, as compared to the six months ended March 31, 2023.
See Segment Information below for additional information on activity in each of the segments.
Interest and Transactional Expenses
Three Months Ended DecemberMarch 31, 20172024 Compared to Three Months Ended DecemberMarch 31, 20162023
Transaction-based clearing expenses:Transaction-based clearing expenses increased 10%
| | | | | | | | | | | | | | | | | | | | | | | |
| Three Months Ended March 31, |
| 2024 | | 2023 | | $ Change | | % Change |
| Transaction-based clearing expenses | $ | 78.5 | | | $ | 69.2 | | | $ | 9.3 | | | 13% |
| Percentage of operating revenues | 10% | | 10% | | | | |
Expenses were higher in our Equity Capital Markets business, principally related to $36.9 million in the first quarter compared to $33.6 million in the prior year, and were 17% of operating revenues in the first quarter compared to 18% in the prior year. Thean increase in expense is related to higher volumes in our Financial Ag & EnergyADV, and Exchange-Traded Futures & Options components.
Introducing broker commissions: Introducing broker commissions increased 8% to $31.1 million in the first quarter compared to $28.7 million in the prior year, and were 15% of operating revenues in the first quarter as well as in the prior year. The increase in expense is primarily due to increased business activity and improved performance in our Exchange-Traded Futures & Options, Financial Ag and Energy and LME businesses, principally related to the increase in contracts traded. Partially offsetting these increases were lower expenses in the Retail Forex business, principally related to reducing costs through successful renegotiation of certain vendor contracts.
Introducing broker commissions
| | | | | | | | | | | | | | | | | | | | | | | |
| Three Months Ended March 31, |
| 2024 | | 2023 | | $ Change | | % Change |
| Introducing broker commissions | $ | 42.0 | | | $ | 42.2 | | | $ | (0.2) | | | —% |
| Percentage of operating revenues | 5% | | 6% | | | | |
Expenses were relatively unchanged with lower payouts within our Retail Forex, Correspondent Clearing, and Exchange-Traded Futures & Options businesses nearly offset by higher expenses in our Independent Wealth Management components,business, principally due to increased revenues, and in our Financial Ag and Energy business, principally due to increased volume and client mix traded.
Interest expense
| | | | | | | | | | | | | | | | | | | | | | | |
| Three Months Ended March 31, |
| 2024 | | 2023 | | $ Change | | % Change |
| Interest expense attributable to: | | | | | | | |
| Trading activities: | | | | | | | |
| Institutional dealer in fixed income securities | $ | 198.0 | | | $ | 119.4 | | | $ | 78.6 | | | 66 | % |
| Securities borrowing | 14.0 | | | 8.3 | | | 5.7 | | | 69 | % |
| Client balances on deposit | 31.4 | | | 37.2 | | | (5.8) | | | (16) | % |
| Short-term financing facilities of subsidiaries and other direct interest of operating segments | 15.8 | | | 13.8 | | | 2.0 | | | 14 | % |
| 259.2 | | | 178.7 | | | 80.5 | | | 45 | % |
| Corporate funding | 16.2 | | | 14.9 | | | 1.3 | | | 9 | % |
| Total interest expense | $ | 275.4 | | | $ | 193.6 | | | $ | 81.8 | | | 42 | % |
Increased interest expense attributable to trading activities principally resulted from an increase in our fixed income and securities borrowing activities, as well as the effect of the increase in short-term interest rates, partially offset by a decrease in interest expense attributable to client balances, principally resulting from the decline in average client equity. The increase in interest expense attributable to corporate funding was principally due to incremental interest from our March 1, 2024 issuance of senior secured notes due 2031, partially offset by lower costs in Global Payments.average borrowings on our revolving credit facility.
Interest expense: Interest expense increased 61%Six Months Ended March 31, 2024 Compared to $14.3 million in the first quarter compared to $8.9 million in the prior year. The increase in expense is primarily related to the trading activities of our institutional dealer in fixed income securities, which resulted inSix Months Ended March 31, 2023
Transaction-based clearing expenses
| | | | | | | | | | | | | | | | | | | | | | | |
| Six Months Ended March 31, |
| 2024 | | 2023 | | $ Change | | % Change |
| Transaction-based clearing expenses | $ | 152.8 | | | $ | 136.5 | | | $ | 16.3 | | | 12 | % |
| Percentage of operating revenues | 10 | % | | 10 | % | | | | |
Expenses were higher interest expense of $3.6 million. Also, an increase in short-term rates resulted in higher costs in our Exchange-Traded Futures & Options, component,Financial Ag and Energy and LME businesses, principally related to the increase in contracts traded. Expenses were also higher in our Equity Capital Markets business, principally related to an increase in ADV. Partially offsetting these increases were lower expenses in the Retail Forex business, principally related to reducing costs through successful renegotiation of certain vendor contracts.
Introducing broker commissions
| | | | | | | | | | | | | | | | | | | | | | | |
| Six Months Ended March 31, |
| 2024 | | 2023 | | $ Change | | % Change |
| Introducing broker commissions | $ | 81.1 | | | $ | 79.0 | | | $ | 2.1 | | | 3 | % |
| Percentage of operating revenues | 5 | % | | 6 | % | | | | |
Expenses were higher in our Financial Ag and Energy business, principally due to increased volume and client mix traded, and in our Independent Wealth Management business, principally due to increased revenues. Expenses were also higher in our Physical Ag and Energy business, principally due to the growth in the physical cotton business following the acquisition of CDI, effective October 31, 2022. These increases were partially offset by lower payouts within our Retail Forex, Exchange-Traded Futures & Options, and Correspondent Clearing businesses.
Interest expense
| | | | | | | | | | | | | | | | | | | | | | | |
| Six Months Ended March 31, |
| 2024 | | 2023 | | $ Change | | % Change |
| Interest expense attributable to: | | | | | | | |
| Trading activities: | | | | | | | |
| Institutional dealer in fixed income securities | $ | 370.1 | | | $ | 215.7 | | | $ | 154.4 | | | 72 | % |
| Securities borrowing | 28.6 | | | 16.2 | | | 12.4 | | | 77 | % |
| Client balances on deposit | 67.7 | | | 73.7 | | | (6.0) | | | (8) | % |
| Short-term financing facilities of subsidiaries and other direct interest of operating segments | 28.8 | | | 27.4 | | | 1.4 | | | 5 | % |
| 495.2 | | | 333.0 | | | 162.2 | | | 49 | % |
| Corporate funding | 29.4 | | | 29.3 | | | 0.1 | | | — | % |
| Total interest expense | $ | 524.6 | | | $ | 362.3 | | | $ | 162.3 | | | 45 | % |
Increased interest expense attributable to trading activities principally resulted from an increase in our fixed income and securities borrowing activities, as well as higher costs relatedthe effect of the increase in short-term interest rates. Interest expense attributable to corporate funding was relatively unchanged, as the incremental interest from our stock lending business started up during fiscal 2017 in our Equity Market-Making business. Additionally, higherMarch 1, 2024 issuance of senior secured notes due 2031, was nearly offset by lower average borrowings outstanding on theour revolving credit facilities available for working capital needs resulted in increased expense.facility.
Net Operating Revenues
Net operating revenues is one of the key measures used by management to assess the performance of our operating segments.segment performance. Net operating revenue is calculated as operating revenue less transaction-based clearing expenses, introducing broker commissions and interest expense. Transaction-based clearing expenses represent variable expenses paid to executing brokers, exchanges, clearing organizations and banks in relation to our transactional volumes. Introducing broker commissions include commission paid to non-employee third parties that have introduced customersclients to us. Net operating revenues represent revenues available to pay variable compensation to risk management consultants and traders and direct non-variable expenses, as well as variable and non-variable expenses of operational and administrative employees.employees, including our executive management team.
Three Months Ended December 31, 2017 Compared to Three Months Ended December 31, 2016
NetThe table below presents a disaggregation of consolidated net operating revenues increased $16.0 million, or 14%, to $130.3 millionused by management in evaluating our performance, for the first quarter compared to $114.3 million in the prior year.periods indicated:
| | | | | | | | | | | | | | | | | | | | | | | | | | | | | | | | | | | |
| Three Months Ended March 31, | | Six Months Ended March 31, |
| 2024 | | 2023 | | % Change | | 2024 | | 2023 | | % Change |
| Net Operating Revenues (in millions): | | | | | | | | | | | |
| Listed derivatives | $ | 48.2 | | | $ | 53.6 | | | (10)% | | $ | 98.6 | | | $ | 102.2 | | | (4)% |
| OTC derivatives | 53.0 | | | 57.8 | | | (8)% | | 97.4 | | | 100.3 | | | (3)% |
| Securities | 88.6 | | | 84.2 | | | 5% | | 184.5 | | | 177.6 | | | 4% |
| FX / CFD contracts | 71.8 | | | 50.8 | | | 41% | | 138.0 | | | 88.9 | | | 55% |
| Payments | 45.9 | | | 46.1 | | | —% | | 102.9 | | | 98.2 | | | 5% |
| Physical contracts | 36.8 | | | 43.7 | | | (16)% | | 78.8 | | | 94.7 | | | (17)% |
| Interest, net / fees earned on client balances | 74.0 | | | 68.1 | | | 9% | | 137.0 | | | 117.7 | | | 16% |
| Other | 16.8 | | | 16.9 | | | (1)% | | 35.1 | | | 34.7 | | | 1% |
| Corporate | (12.8) | | | (21.8) | | | (41)% | | (28.4) | | | (32.9) | | | (14)% |
| $ | 422.3 | | | $ | 399.4 | | | 6% | | $ | 843.9 | | | $ | 781.4 | | | 8% |
Compensation and Other Expenses
The following table showspresents a summary of expenses, other than interest and transactional expenses.
| | | | | | | | | | | | | | | | | | | | | | | | | | | | | | | | | | | |
| Three Months Ended March 31, | | Six Months Ended March 31, |
| (in millions) | 2024 | | 2023 | | % Change | | 2024 | | 2023 | | % Change |
| Compensation and benefits: | | | | | | | | | | | |
| Variable compensation and benefits | $ | 123.7 | | | $ | 121.8 | | | 2% | | $ | 245.6 | | | $ | 240.3 | | | 2% |
| Fixed compensation and benefits | 110.7 | | | 110.7 | | | —% | | 206.9 | | | 191.2 | | | 8% |
| 234.4 | | | 232.5 | | | 1% | | 452.5 | | | 431.5 | | | 5% |
| Other expenses: | | | | | | | | | | | |
| Trading systems and market information | 19.4 | | | 17.8 | | | 9% | | 38.1 | | | 35.5 | | | 7% |
| Professional fees | 19.3 | | | 11.3 | | | 71% | | 35.0 | | | 27.2 | | | 29% |
| Non-trading technology and support | 18.0 | | | 16.2 | | | 11% | | 34.9 | | | 31.0 | | | 13% |
| Occupancy and equipment rental | 13.6 | | | 10.6 | | | 28% | | 21.3 | | | 19.5 | | | 9% |
| Selling and marketing | 15.6 | | | 14.2 | | | 10% | | 27.3 | | | 27.1 | | | 1% |
| Travel and business development | 7.1 | | | 5.8 | | | 22% | | 14.2 | | | 11.5 | | | 23% |
| Communications | 2.3 | | | 2.1 | | | 10% | | 4.5 | | | 4.3 | | | 5% |
| Depreciation and amortization | 12.3 | | | 13.1 | | | (6)% | | 23.5 | | | 25.8 | | | (9)% |
| Bad debts, net of recoveries | (0.4) | | | 3.0 | | | n/m | | (0.7) | | | 3.7 | | | (119)% |
| Other | 15.3 | | | 15.3 | | | —% | | 32.2 | | | 34.7 | | | (7)% |
| 122.5 | | | 109.4 | | | 12% | | 230.3 | | | 220.3 | | | 5% |
| Total compensation and other expenses | $ | 356.9 | | | $ | 341.9 | | | 4% | | $ | 682.8 | | | $ | 651.8 | | | 5% |
|
| | | | | | | | | | |
| | Three Months Ended December 31, |
| (in millions) | 2017 | | % Change | | 2016 |
| Compensation and benefits: | | | | | |
| Fixed compensation and benefits | $ | 40.3 |
| | 12 | % | | $ | 36.1 |
|
| Variable compensation and benefits | 36.9 |
| | 7 | % | | 34.5 |
|
| | 77.2 |
| | 9 | % | | 70.6 |
|
| Other non-compensation expenses: | | | | | |
| Trading systems and market information | 8.2 |
| | (8 | )% | | 8.9 |
|
| Occupancy and equipment rental | 4.1 |
| | 21 | % | | 3.4 |
|
| Professional fees | 4.7 |
| | (2 | )% | | 4.8 |
|
| Travel and business development | 3.5 |
| | (3 | )% | | 3.6 |
|
| Non-trading technology and support | 3.1 |
| | 7 | % | | 2.9 |
|
| Depreciation and amortization | 2.7 |
| | 13 | % | | 2.4 |
|
| Communications | 1.4 |
| | 17 | % | | 1.2 |
|
| Bad debts | 1.1 |
| | (56 | )% | | 2.5 |
|
| Other expense | 5.7 |
| | 2 | % | | 5.6 |
|
| | 34.5 |
| | (2 | )% | | 35.3 |
|
| Total compensation and other expenses | $ | 111.7 |
| | 5 | % | | $ | 105.9 |
|
Three Months Ended DecemberMarch 31, 20172024 Compared to Three Months Ended DecemberMarch 31, 20162023
Compensation and Other Expenses: Compensation and other expenses increased $15.0 million, or 4%, to $356.9 million in the three months ended March 31, 2024 compared to $341.9 million in the three months ended March 31, 2023.
Compensation and Benefits:
| | | | | | | | | | | | | | | | | | | | | | | |
| Three Months Ended March 31, |
| (in millions) | 2024 | | 2023 | | $ Change | | % Change |
| Compensation and benefits: | | | | | | | |
| Variable compensation and benefits | | | | | | | |
| Front office | $ | 105.0 | | | $ | 103.6 | | | $ | 1.4 | | | 1% |
| Administrative, executive, and centralized and local operations | 18.7 | | | 18.2 | | | 0.5 | | | 3% |
| Total variable compensation and benefits | 123.7 | | | 121.8 | | | 1.9 | | | 2% |
| Variable compensation and benefits as a percentage of net operating revenues | 29% | | 30% | | | | |
| | | | | | | |
| Fixed compensation and benefits: | | | | | | | |
| Non-variable salaries | 74.6 | | | 66.5 | | | 8.1 | | | 12% |
| Employee benefits and other compensation, excluding share-based compensation | 26.7 | | | 34.9 | | | (8.2) | | | (23)% |
| Share-based compensation | 9.4 | | | 9.3 | | | 0.1 | | | 1% |
| Total fixed compensation and benefits | 110.7 | | | 110.7 | | | — | | | —% |
| Total compensation and benefits | 234.4 | | | 232.5 | | | 1.9 | | | 1% |
| Total compensation and benefits as a percentage of operating revenues | 29% | | 33% | | | | |
| Number of employees, end of period | 4,324 | | | 3,839 | | | 485 | | | 13% |
Non-variable salaries increased principally due to the increased in headcount, as well as the impact of annual merit increases.
Employee benefits and other compensation, excluding share-based compensation, decreased principally due to lower severance costs, partially offset by higher payroll taxes, benefits, and retirement costs principally related to the increase in headcount. During the three months ended March 31, 2024, severance costs were $1.1 million compared to $12.1 million during the three months ended March 31, 2023, which were principally related to a reorganization within the Payments business.
Other Expenses: Other non-compensation expenses increased $13.1 million, or 12%, to $122.5 million in the three months ended March 31, 2024 compared to $109.4 million in the three months ended March 31, 2023.
Trading systems and market information costs increased$5.81.6 million,principally due to higher costs related to certain operations systems and higher market information costs in the Debt Capital Markets business.
Professional fees increased $8.0 million, principally due to higher legal fees related to matters in which we are defendants, as well as related to advisory matters in the normal course of business. To a lesser extent, consulting fees were higher, principally within our Physical Ag & Energy business and IT Development.
Non-trading technology and support increased $1.8 million, principally due to higher non-trading software maintenance and support costs related to various IT systems.
Occupancy and equipment rental increased $3.0 million, principally due to additional office space acquired in London and India, as well as certain accelerated charges incurred as we consolidate office space in London to support our current and anticipated future growth.
Selling and marketing costs increased $1.4 million, principally due to costs related to our global sales summit, held in February 2024, which occurs on a once-every-two years rotation, partially offset by a $1.8 million decrease in direct marketing costs in the Retail Forex business.
Travel and business development increased $1.3 million, principally due to higher transportation and lodging costs also related to the previously mentioned global sales summit.
During the three months ended March 31, 2024, we recorded net recoveries of bad debts of $0.4 million, principally related to recoveries within our Institutional segment of $1.4 million, which were partially offset by bad debt expense of $0.9 million of client receivables in our Payments segment. During the three months ended March 31, 2023, bad debts, net of recoveries were $3.0 million, principally related to a client receivable in the Physical Ag & Energy business.
Other Gains: The results of the three months ended March 31, 2024 include a nonrecurring gain related to proceeds of $6.9 million resulting from settlement of the Commodity Exchange Gold Futures and Options Trading matter, reported within our Commercial segment.
Provision for Taxes: The effective income tax rate was 26% and 27% in the three months ended March 31, 2024 and 2023, respectively. The effective tax rate was higher than the U.S. federal statutory rate of 21% due to U.S. state and local taxes, GILTI, U.S. and foreign permanent differences, and the amount of foreign earnings taxed at higher rates.
Six Months Ended March 31, 2024 Compared to Six Months Ended March 31, 2023
Compensation and Other Expenses: Compensation and other expenses increased $31.0 million, or 5%, to $111.7$682.8 million in the first quartersix months ended March 31, 2024 compared to $105.9$651.8 million in the prior year.six months ended March 31, 2023.
Compensation and Benefits: Total compensation and benefits expense increased 9% to $77.2 million in the first quarter compared to $70.6 million in the prior year. Total compensation and benefits were 36% of operating revenues in the first quarter compared to 38% in the prior year. The variable portion of compensation and benefits increased by 7% to $36.9 million in the first quarter compared to $34.5 million in the prior year. Variable compensation and benefits were 28% of net operating revenues in the first quarter compared to 30% in the prior year. Administrative, centralized operations and executive incentive compensation was $4.3 million in the first quarter compared to $4.4 million in the prior year.
The fixed portion of compensation and benefits increased 12% to $40.3 million in the first quarter compared to $36.1 million in the prior year. | | | | | | | | | | | | | | | | | | | | | | | |
| Six Months Ended March 31, |
| (in millions) | 2024 | | 2023 | | $ Change | | % Change |
| Compensation and benefits: | | | | | | | |
| Variable compensation and benefits | | | | | | | |
| Front office | $ | 204.3 | | | $ | 204.4 | | | $ | (0.1) | | | — | % |
| Administrative, executive, and centralized and local operations | 41.3 | | | 35.9 | | | 5.4 | | | 15 | % |
| Total variable compensation and benefits | 245.6 | | | 240.3 | | | 5.3 | | | 2 | % |
| Variable compensation and benefits as a percentage of net operating revenues | 29 | % | | 31 | % | | | | |
| | | | | | | |
| Fixed compensation and benefits: | | | | | | | |
| Non-variable salaries | 146.6 | | | 127.9 | | | 18.7 | | | 15 | % |
| Employee benefits and other compensation, excluding share-based compensation | 43.3 | | | 48.4 | | | (5.1) | | | (11) | % |
| Share-based compensation | 17.0 | | | 14.9 | | | 2.1 | | | 14 | % |
| Total fixed compensation and benefits | 206.9 | | | 191.2 | | | 15.7 | | | 8 | % |
| Total compensation and benefits | $ | 452.5 | | | $ | 431.5 | | | $ | 21.0 | | | 5 | % |
| Total compensation and benefits as a percentage of operating revenues | 28 | % | | 32 | % | | | | |
| Number of employees, end of period | 4,324 | | | 3,839 | | | 485 | | | 13 | % |
Non-variable salaries increased $1.3 million, or 5%, primarilyprincipally due to the increasedincrease in headcount across operationsresulting from expanding capabilities among our business lines, as well as the growth in our operational and administrative areas. overhead departments supporting our business growth, as well as the impact of annual merit increases.
Employee benefits and other compensation, excluding share-based compensation, increased $1.3 million in the first quarter, primarilydecreased principally due to lower severance costs, partially offset by higher payroll taxes, benefits, and retirement costs principally related to increasedthe increase in headcount. During the six months ended March 31, 2024, severance costs were $2.4 million compared to $12.7 million during the six months ended March 31, 2023, which were principally related to a reorganization within the Payments business. Also partially offsetting the decrease, was a decrease in employee-elected deferred incentive, which is exchanged for restricted stock that will be amortized over a thirty-six month period following the grant date. Share-based compensation, is a component of the fixed portion, and includeswhich comprises stock option and restricted stock expense. Share-based compensation was $1.6 million in expense, increased principally due to the first quarter compared to $0.8 million in issuance of additional stock option awards during the prior year. The number of employees decreased 1% to 1,595 at the end of the first quarter compared to 1,607 at the beginning of the first quarter. The number of employees at the end of the prior year period was 1,542.six months ended March 31, 2024.
Other Non-Compensation Expenses: Other non-compensation expenses decreased 2%increased $10.0 million, or 5%, to $34.5$230.3 million in the first quartersix months ended March 31, 2024 compared to $35.3$220.3 million in the prior year. Tradesix months ended March 31, 2023.
Trading systems and market information decreased $0.7costs increased $2.6 million, as trade systemprincipally due to higher costs decreased $1.0 million, primarily within Clearingrelated to certain operations systems and Execution Services, partially offset by higher market information costs associated with growth acrossin the Financial Ag & Energy and Debt Capital Markets businesses.
Professional fees increased $7.8 million, principally due to higher legal fees related to matters in which we are defendants, as well as related to advisory matters in the normal course of business. To a lesser extent, consulting fees were higher, principally within our Physical Ag & Energy business, as well as overhead, primarily within IT Development.
Non-trading technology and support increased $3.9 million, principally due to higher non-trading software maintenance and support costs related to various IT systems.
Occupancy and equipment rental increased $0.7$1.8 million, primarilyprincipally due to additional office space acquired in London and India, as well as certain accelerated charges incurred as we consolidate office space in London to support our current and anticipated future growth, partially offset by a partial refund of property tax and related expenses covering prior years in London.
Selling and marketing costs increased $0.2 million, principally due to costs related to leased office spaceour global sales summit, held in February 2024, which occurs on a once-every-two years rotation, partially offset by a $4.1 million decrease in direct marketing costs in the Retail Forex business.
Travel and business development increased $2.7 million, principally due to higher transportation and lodging costs across all business lines and support departments, as well as transportation and lodging costs related property charges. to the previously mentioned global sales summit.
Depreciation and amortization increased $0.3decreased $2.3 million, primarilyprincipally due to lower amortization, as certain intangibles, recognized as part the acquisition of Gain Capital Holdings, Inc. in fiscal 2020, became fully amortized during fiscal 2023, partially offset by incremental depreciation expense from internally developed software placed into service.
During the six months ended March 31, 2024, we recorded net recoveries of bad debts of $0.7 million, principally related to depreciationrecoveries within our Institutional segment of the new trading system for certain over-the-counter commodities business activities during the fourth quarter of 2017.
Bad debts decreased $1.4$1.8 million, over the prior year. During the first quarter, we recorded additionalwhich were partially offset by bad debt expense of $1.0 million related to reimbursement due the Company from a coal supplier followingof client receivables in our recorded charge of $47.0Payments segment and $0.1 million during the fourth quarter of fiscal 2017. The expense relates to reimbursement for demurrage and other charges related to contracts with delivery dates during the first quarter of 2018.within our Retail segment. During the prior year,six months ended March 31, 2023, bad debt expense, net of recovery was $2.5$3.7 million, primarilyprincipally related to LME Metals customerclient receivables in the Physical Ag & Energy business and client trading account deficits in our Commercial Hedging segment.Retail segment of $2.9 million and $0.8 million, respectively.
Gain on Acquisition and Other Gains: The results of the six months ended March 31, 2024 include a nonrecurring gain of $6.9 million resulting from settlement of the Commodity Exchange Gold Futures and Options Trading matter. The results of the six months ended March 31, 2023 included a nonrecurring gain of $23.5 million related to the acquisition of CDI.
Provision for Taxes: Our effective income tax rate was 27% and 23% for six months ended March 31, 2024 and 2023, respectively. The gain on acquisition of $23.5 million in the six months ended March 31, 2023 was not taxable and reduced the effective income tax rate 3.2%.
The effective income tax rate was 137% in the first quarter compared to 25% in the prior year. The discrete expense of $20.9 million related to the Tax Act, increased the effective tax rate by 112%. The effective rate for the first quarter of 2018six months ended March 31, 2024 and 2023 was 24.5%, excluding the impacts of the Tax Act. The effective tax rate decreased 1.2% due to excess tax benefits on share-based compensation recognized during the period related to the adoption of ASU 2016-09. The effective rate during the first quarter of fiscal year 2017 was lowerhigher than the U.S. federal statutory rate primarilyof 21% due to a higher mixU.S. state and local taxes, changes in valuation allowances, U.K. bank tax, U.S. permanent differences, and the amount of foreign earnings taxed at lower rates in foreign jurisdictions.higher tax rates.
Unallocated Costs and Expenses
The following table is a breakout of our unallocated costs and expenses from the total costs and expenses shown above. The unallocated costs and expenses include certain shared services such as information technology, accounting and treasury, credit and risk, legal and compliance, and human resources and other activities. |
| | | | | | | | | | |
| | Three Months Ended December 31, |
| (in millions) | 2017 | | % Change | | 2016 |
| Compensation and benefits: | | | | | |
| Fixed compensation and benefits | $ | 16.5 |
| | 29 | % | | $ | 12.8 |
|
| Variable compensation and benefits | 3.8 |
| | (5 | )% | | 4.0 |
|
| | 20.3 |
| | 21 | % | | 16.8 |
|
| Other non-compensation expenses: | | | | | |
| Communication and data services | 0.6 |
| | — | % | | 0.6 |
|
| Occupancy and equipment rental | 4.1 |
| | 21 | % | | 3.4 |
|
| Professional fees | 2.8 |
| | 8 | % | | 2.6 |
|
| Travel and business development | 0.8 |
| | (20 | )% | | 1.0 |
|
| Non-trading technology and support | 2.5 |
| | 25 | % | | 2.0 |
|
| Depreciation and amortization | 2.2 |
| | 10 | % | | 2.0 |
|
| Communications | 1.3 |
| | 18 | % | | 1.1 |
|
| Bad debts | — |
| | — | % | | — |
|
| Other expense | 4.0 |
| | 29 | % | | 3.1 |
|
| | 18.3 |
| | 16 | % | | 15.8 |
|
| Total compensation and other expenses | $ | 38.6 |
| | 18 | % | | $ | 32.6 |
|
Total unallocated costs and other expenses increased $6.0 million to $38.6 million in the first quarter compared to $32.6 million in the prior year. Compensation and benefits increased $3.5 million, or 21% to $20.3 million in the first quarter compared to $16.8 million in the prior year.
During the first quarter, the increase in fixed compensation and benefits is primarily related to higher salary expense due to headcount increases in several administrative departments, and increased share-based costs and long-term incentive costs for executive management.
Variable vs. Fixed Expenses
|
| | | | | | | | | | | | | |
| | Three Months Ended December 31, |
| (in millions) | 2017 | | % of Total | | 2016 | | % of Total |
| Variable compensation and benefits | $ | 36.9 |
| | 21 | % | | $ | 34.5 |
| | 21 | % |
| Transaction-based clearing expenses | 36.9 |
| | 21 | % | | 33.6 |
| | 20 | % |
| Introducing broker commissions | 31.1 |
| | 16 | % | | 28.7 |
| | 17 | % |
| Total variable expenses | 104.9 |
| | 58 | % | | 96.8 |
| | 58 | % |
| Fixed compensation and benefits | 40.3 |
| | 22 | % | | 36.1 |
| | 21 | % |
| Other fixed expenses | 33.4 |
| | 19 | % | | 32.8 |
| | 20 | % |
| Bad debts | 1.1 |
| | 1 | % | | 2.5 |
| | 1 | % |
| Total non-variable expenses | 74.8 |
| | 42 | % | | 71.4 |
| | 42 | % |
| Total non-interest expenses | $ | 179.7 |
| | 100 | % | | $ | 168.2 |
| | 100 | % |
We seek to make our non-interest expenses variable to the greatest extent possible, and to keep our fixed costs as low as possible. The table above shows an analysis ofbelow presents our variable expenses and non-variable expenses as a percentage of total non-interest expenses for the three months ended December 31, 2017 and 2016, respectively.periods indicated.
| | | | | | | | | | | | | | | | | | | | | | | | | | | | | | | | | | | | | | | | | | | | | | | |
| Three Months Ended March 31, | | Six Months Ended March 31, |
| (in millions) | 2024 | | % of
Total | | 2023 | | % of
Total | | 2024 | | % of
Total | | 2023 | | % of
Total |
| Variable compensation and benefits | $ | 123.7 | | | 26% | | $ | 121.8 | | | 27% | | $ | 245.6 | | | 27% | | $ | 240.3 | | | 28% |
| Transaction-based clearing expenses | 78.5 | | | 16% | | 69.2 | | | 15% | | 152.8 | | | 16% | | 136.5 | | | 16% |
| Introducing broker commissions | 42.0 | | | 9% | | 42.2 | | | 9% | | 81.1 | | | 9% | | 79.0 | | | 9% |
| Total variable expenses | 244.2 | | | 51% | | 233.2 | | | 51% | | 479.5 | | | 52% | | 455.8 | | | 53% |
| Fixed compensation and benefits | 110.7 | | | 23% | | 110.7 | | | 24% | | 206.9 | | | 23% | | 191.2 | | | 22% |
| Other fixed expenses | 122.9 | | | 26% | | 106.4 | | | 24% | | 231.0 | | | 25% | | 216.6 | | | 25% |
| Bad debts (recoveries), net | (0.4) | | | —% | | 3.0 | | | 1% | | (0.7) | | | —% | | 3.7 | | | —% |
| Total non-variable expenses | 233.2 | | | 49% | | 220.1 | | | 49% | | 437.2 | | | 48% | | 411.5 | | | 47% |
| Total non-interest expenses | $ | 477.4 | | | 100% | | $ | 453.3 | | | 100% | | $ | 916.7 | | | 100% | | $ | 867.3 | | | 100% |
Our variable expenses include variable compensation paid to traders and risk management consultants, bonuses paid to operational, administrative, and executive employees, transaction-based clearing expenses and introducing broker commissions. As a percentage of totalWe seek to make our non-interest expenses variable expenses were 58% in to the first quartergreatest extent possible, and to keep our fixed costs as welllow as in the prior year.possible.
Segment Information
Our operating segments are based principally on the nature of the clients we serve (commercial, institutional, and retail), and a fourth operating segment, our payments business. We manage our business in this manner due to our large global footprint, in which we have more than 4,300 employees allowing us to serve clients in more than 180 countries.
Our business activities are managed as operating segments,
and organized intowhich are our reportable segments
for financial reporting purposes, as
follows:shown below. | | | | | | | | | | | | | | | | | | | | | | | | | | | | | | | | |
| StoneX Group Inc. |
| | | | | | | | | | |
| | | | | | | | | | |
| Commercial | | Institutional | | Retail | | | | | | | | | | | Payments |
INTL FCStone Inc.Primary Activities: | | Primary Activities: | | Primary Activities: | | Primary Activities: |
Financial Ag
& Energy | | Equity Capital
Markets | | Retail Forex | | | | | | | | | | | Payments |
| LME Metals | | Debt Capital
Markets | | Retail Precious Metals | | | | | | | | | | | Payment Technology
Services |
Commercial HedgingPhysical Ag
& Energy | | FX Prime Brokerage | | Global PaymentsIndependent
Wealth Management | | | Securities | Physical Commodities | | Clearing and Execution Services (“CES”) |
Components: | | Component: | | Components: | | Components: | | Components: |
- Financial Ag
& Energy
| | - Global Payments | | - Equity Market-
Making
| | - Precious Metals | | - Exchange-traded
Exchange-Traded
Futures & Options | | | | |
| - LME Metals | Correspondent
Clearing | | | | | - Debt Trading | - Physical Ag
& Energy
| | - FX Prime Brokerage |
| | | | - Investment Banking | | | - Correspondent
Clearing |
| | | | - Asset Management | | | | - Independent
Wealth Management |
| | | | | | | | - Derivative
Voice Brokerage |
We report ourOperating revenues, net operating segments based on services provided to customers. Netrevenues, net contribution is oneand segment income are some of the key measures used by management to assess the performance of each segment and for decisions regarding the allocation of our resources. Net contribution isOperating revenues are calculated as revenuetotal revenues less direct cost of sales of physical commodities.
Net operating revenues are calculated as operating revenues less transaction-based clearing expenses, introducing broker commissions and interest expense andexpense.
Net contribution is calculated as net operating revenues less variable compensation. Variable compensation paid to risk management consultants and traders generally represents a fixed percentage of an amount equalthat can vary by revenue type. This fixed percentage is applied to revenues generated, and in some cases, revenues generated less transaction-based clearing expenses, and related charges, base salaries and an overhead allocation.other expenses/allocations.
Segment income is calculated as net contribution less non-variable direct expenses of the segment.segment costs. These non-variable direct expenses include trader base compensation and benefits, operational charges, communicationtrading systems and data services,market information, professional fees, travel and business development, professional fees,communications, bad debt expense,debts, trade errors and direct marketing expenses.
Segment income is used by our chief operating decision maker (“CODM”) as the primary measure of segment profit or loss in the evaluation for each of our operating segments. During the three months ended December 31, 2023, we revised our method of allocating certain overhead costs to our operating segments, and, beginning in the three months ended December 31, 2023, the CODM also uses ‘Segment income, less allocation of overhead costs’ as an additional segment measure of our segments’ financial performance. The allocation of overhead costs to operating segments includes costs associated with compliance, technology, and credit and risk costs. The share of allocated costs is based on resources consumed by the relevant businesses. In addition, the allocation of human resources and occupancy costs is principally based on employee costs within the relevant businesses. The measure of segment profit or loss most consistent with the corresponding amounts in the consolidated financial statements is segment income.
In the accompanying segment tables, ‘Allocation of overhead costs’ has been added beneath ‘Segment income’, which reconciles the segment income measure to the segment income, less allocation of overhead costs measure for the three and six months ended March 31, 2024.
Total Segment Results
The following table shows summary information concerning all of our business segments combined. | | | | Three Months Ended December 31, |
| Three Months Ended March 31, | | | Three Months Ended March 31, | | Six Months Ended March 31, |
| (in millions) | 2017 | | % of Operating Revenues | | 2016 | | % of Operating Revenues | (in millions) | 2024 | | % of Operating Revenues | | 2023 | | % of Operating Revenues | | 2024 | | % of Operating Revenues | | 2023 | | % of Operating Revenues |
| Revenues: | |
| Sales of physical commodities | $ | 7,714.4 |
| | $ | 5,896.0 |
| | |
| Trading gains, net | 83.7 |
| | 83.2 |
| |
| Sales of physical commodities | |
| Sales of physical commodities | |
| Principal gains, net | |
| Principal gains, net | |
| Principal gains, net | |
| Commission and clearing fees | |
| Commission and clearing fees | |
| Commission and clearing fees | 77.7 |
| | 69.1 |
| |
| Consulting, management, and account fees | 16.1 |
| | 15.4 |
| |
| Consulting, management, and account fees | |
| Consulting, management, and account fees | |
| Interest income | 26.0 |
| | 16.6 |
| |
| Other | — |
| | — |
| |
| Interest income | |
| Interest income | |
| Total revenues | |
| Total revenues | |
| Total revenues | 7,917.9 |
| | 6,080.3 |
| |
| Cost of sales of physical commodities | 7,706.0 |
| | 5,888.9 |
| |
| Cost of sales of physical commodities | |
| Cost of sales of physical commodities | |
| Operating revenues | |
| Operating revenues | |
| Operating revenues | 211.9 |
| | 100% | | 191.4 |
| | 100% | 815.2 | | | 100% | | 100% | | 711.0 | | | 100% | | 100% | | 1,602.4 | | | 100% | | 100% | | 1,362.8 | | | 100% | | 100% |
| Transaction-based clearing expenses | 36.3 |
| | 17% | | 33.1 |
| | 17% | Transaction-based clearing expenses | 78.1 | | | 10% | | 10% | | 69.4 | | | 10% | | 10% | | 152.1 | | | 9% | | 9% | | 136.5 | | | 10% | | 10% |
| Introducing broker commissions | 31.1 |
| | 15% | | 28.7 |
| | 15% | Introducing broker commissions | 42.0 | | | 5% | | 5% | | 42.2 | | | 6% | | 6% | | 81.1 | | | 5% | | 5% | | 79.0 | | | 6% | | 6% |
| Interest expense | 13.1 |
| | 6% | | 6.1 |
| | 3% | Interest expense | 260.0 | | | 32% | | 32% | | 178.2 | | | 25% | | 25% | | 496.9 | | | 31% | | 31% | | 333.0 | | | 24% | | 24% |
| Net operating revenues | 131.4 |
| |
| | 123.5 |
| |
| Variable direct compensation and benefits | 32.6 |
| | 15% | | 30.1 |
| | 16% |
| Variable direct compensation and benefits | |
| Variable direct compensation and benefits | | 106.1 | | | 13% | | 104.5 | | | 15% | | 206.5 | | | 13% | | 206.0 | | | 15% |
| Net contribution | 98.8 |
| |
| | 93.4 |
| |
| Non-variable direct expenses | 40.5 |
| | 19% | | 43.2 |
| | 23% |
| Fixed compensation and benefits | |
| Fixed compensation and benefits | |
| Fixed compensation and benefits | |
| Other fixed expenses | |
| Other fixed expenses | |
| Other fixed expenses | |
| Bad debts (recoveries), net | |
| Bad debts (recoveries), net | |
| Bad debts (recoveries), net | |
| Total non-variable direct expenses | |
| Total non-variable direct expenses | |
| Total non-variable direct expenses | | 131.2 | | | 16% | | 137.3 | | | 19% | | 251.9 | | | 16% | | 256.0 | | | 19% |
| Other gains | |
| Segment income | $ | 58.3 |
| |
| | $ | 50.2 |
| |
| Segment income | |
| Segment income | |
Allocation of overhead costs (1) | |
Allocation of overhead costs (1) | |
Allocation of overhead costs (1) | |
| Segment income, less allocation of overhead costs | |
| Segment income, less allocation of overhead costs | |
| Segment income, less allocation of overhead costs | |
(1)Includes an allocation of certain overhead costs to our operating segments as noted above for the three months ended March 31, 2024 and six months ended March 31, 2024. These allocations will be provided on an ongoing basis but have not been calculated for comparable periods.
Three Months Ended DecemberMarch 31, 20172024 Compared to Three Months Ended DecemberMarch 31, 20162023
Net contribution for all of our business segments increased 6%$12.3 million, or 4%, to $98.8$329.0 million in the first quarterthree months ended March 31, 2024 compared to $93.4$316.7 million in the prior year.three months ended March 31, 2023. Segment income increased 16%$25.3 million, or 14%, to $58.3$204.7 million in the first quarterthree months ended March 31, 2024 compared to $50.2$179.4 million in the prior year.three months ended March 31, 2023.
Six Months Ended March 31, 2024 Compared to Six Months Ended March 31, 2023 Net contribution for all of our business segments increased $57.5 million, or 9%, to $665.8 million in the six months ended March 31, 2024 compared to $608.3 million in the six months ended March 31, 2023. Segment income increased $68.5 million, or 19%, to $420.8 million in the six months ended March 31, 2024 compared to $352.3 million in the six months ended March 31, 2023.
Commercial Hedging
We serveoffer our commercial customers through our teamclients a comprehensive array of products and services, including risk management consultants,and hedging services, execution and clearing exchange-traded and OTC products, voice brokerage, market intelligence and physical trading, as well as commodity financing and logistics services. We believe providing athese high-value-added service that we believeproducts and services differentiates us from our competitors and maximizes theour opportunity to retain our customers. Our risk management consulting services are designed to quantify and monitor commercial entities’ exposure to commodity and financial risk. Upon assessing this exposure, we develop a plan to control and hedge these risks with post-trade reporting against specific customer objectives. Our customers are assisted in the execution of their hedging strategies through a wide range of products from listed exchange-traded futures and options, to basic OTC instruments that offer greater flexibility, to structured OTC products designed for customized solutions.clients.
Our services span virtually all traded commodity markets, with the largest concentrations in agricultural and energy commodities (consisting primarily of grains, energy and renewable fuels, coffee, sugar, cotton, and food service) and base metals products listed on the LME. Our base metals business includes a position as a Category One ring dealing member of the LME, providing execution, clearing and advisory services in exchange-traded futures and OTC products. We also provide execution of foreign currency forwards and options and interest rate swaps as well as a wide range of structured product solutions to our commercial customers who are seeking cost-effective hedging strategies. Generally, our customers direct their own trading activity, and our risk management consultants do not have discretionary authority to transact trades on behalf of our customers.
The following table providestables below present the financial performance, fora disaggregation of operating revenues, and select operating data and metrics used by management in evaluating the performance of the Commercial Hedgingsegment, for the periods indicated. |
| | | | | | | | | |
| | Three Months Ended December 31, |
| (in millions) | 2017 | | % Change | | 2016 |
| Revenues: | | | | | |
| Sales of physical commodities | $ | — |
| | — | | $ | — |
|
| Trading gains, net | 28.5 |
| | 8% | | 26.5 |
|
| Commission and clearing fees | 25.1 |
| | —% | | 25.0 |
|
| Consulting, management, and account fees | 3.7 |
| | —% | | 3.7 |
|
| Interest income | 4.2 |
| | 83% | | 2.3 |
|
| Other | — |
| | —% | | — |
|
| Total revenues | 61.5 |
| | 7% | | 57.5 |
|
| Cost of sales of physical commodities | — |
| | — | | — |
|
| Operating revenues | 61.5 |
| | 7% | | 57.5 |
|
| Transaction-based clearing expenses | 7.8 |
| | 10% | | 7.1 |
|
| Introducing broker commissions | 4.3 |
| | (9)% | | 4.7 |
|
| Interest expense | 0.3 |
| | 200% | | 0.1 |
|
| Net operating revenues | 49.1 |
| | 8% | | 45.6 |
|
| Variable direct compensation and benefits | 12.6 |
| | 3% | | 12.2 |
|
| Net contribution | 36.5 |
| | 9% | | 33.4 |
|
| Non-variable direct expenses | 15.4 |
| | (14)% | | 18.0 |
|
| Segment income | $ | 21.1 |
| | 37% | | $ | 15.4 |
|
The following tables set forth transactional revenues and selected data for Commercial Hedging | | | | | | | | | | | | | | | | | | | | | | | | | | | | | | | | | | | |
| Three Months Ended March 31, | | Six Months Ended March 31, |
| (in millions) | 2024 | | 2023 | | % Change | | 2024 | | 2023 | | % Change |
| Revenues: | | | | | | | | | | | |
| Sales of physical commodities | $ | 21,310.0 | | | $ | 15,279.3 | | | 39% | | $ | 40,119.5 | | | $ | 27,428.7 | | | 46% |
| Principal gains, net | 73.7 | | | 74.9 | | | (2)% | | 150.8 | | | 144.6 | | | 4% |
| Commission and clearing fees | 47.0 | | | 44.5 | | | 6% | | 91.3 | | | 83.3 | | | 10% |
| Consulting, management and account fees | 7.1 | | | 6.4 | | | 11% | | 12.9 | | | 12.9 | | | —% |
| Interest income | 41.3 | | | 45.6 | | | (9)% | | 82.6 | | | 74.7 | | | 11% |
| Total revenues | 21,479.1 | | | 15,450.7 | | | 39% | | 40,457.1 | | | 27,744.2 | | | 46% |
| Cost of sales of physical commodities | 21,278.6 | | | 15,230.6 | | | 40% | | 40,058.2 | | | 27,341.7 | | | 47% |
| Operating revenues | 200.5 | | | 220.1 | | | (9)% | | 398.9 | | | 402.5 | | | (1)% |
| Transaction-based clearing expenses | 16.9 | | | 14.6 | | | 16% | | 32.7 | | | 27.8 | | | 18% |
| Introducing broker commissions | 10.9 | | | 9.9 | | | 10% | | 21.3 | | | 17.4 | | | 22% |
| Interest expense | 8.5 | | | 10.5 | | | (19)% | | 17.3 | | | 19.5 | | | (11)% |
| Net operating revenues | 164.2 | | | 185.1 | | | (11)% | | 327.6 | | | 337.8 | | | (3)% |
| Variable direct compensation and benefits | 44.9 | | | 44.2 | | | 2% | | 81.9 | | | 81.2 | | | 1% |
| Net contribution | 119.3 | | | 140.9 | | | (15)% | | 245.7 | | | 256.6 | | | (4)% |
| Fixed compensation and benefits | 16.5 | | | 16.3 | | | 1% | | 32.0 | | | 30.0 | | | 7% |
| Other fixed expenses | 24.0 | | | 19.3 | | | 24% | | 47.8 | | | 38.0 | | | 26% |
| Bad debts (recoveries), net | 0.1 | | | 2.4 | | | (96)% | | — | | | 2.9 | | | (100)% |
| Non-variable direct expenses | 40.6 | | | 38.0 | | | 7% | | 79.8 | | | 70.9 | | | 13% |
| Other gains | 6.9 | | | — | | | n/m | | 6.9 | | | — | | | n/m |
| Segment income | 85.6 | | | 102.9 | | | (17)% | | 172.8 | | | 185.7 | | | (7)% |
Allocation of overhead costs (1) | 8.9 | | | — | | | n/m | | 17.7 | | | — | | | n/m |
| Segment income, less allocation of overhead costs | $ | 76.7 | | | $ | 102.9 | | | n/m | | $ | 155.1 | | | $ | 185.7 | | | n/m |
(1)Includes an allocation of certain overhead costs to our operating segments as noted above for the periods indicated.three and six months ended March 31, 2024. These allocations will be provided on an ongoing basis but have not been calculated for comparable periods. |
| | | | | | | | | |
| | Exchange-traded |
| | Three Months Ended December 31, |
| | 2017 | | % Change | | 2016 |
| Transactional revenues (in millions): | | |
| Agricultural | $ | 16.7 |
| | (3)% | | $ | 17.2 |
|
| Energy and renewable fuels | 2.0 |
| | 54% | | 1.3 |
|
| LME metals | 11.7 |
| | (26)% | | 15.8 |
|
| Other | 3.1 |
| | 82% | | 1.7 |
|
| | $ | 33.5 |
| | (7)% | | $ | 36.0 |
|
| Selected data: | | |
| Futures and options (contracts, 000’s) | 6,212.5 |
| | 7% | | 5,820.6 |
|
| Average rate per contract | $ | 5.31 |
| | (13)% | | $ | 6.10 |
|
| Average customer equity - futures and options (millions) | $ | 878.2 |
| | (7)% | | $ | 949.0 |
|
| | | | | | | | | | | | | | | | | | | | | | | | | | | | | | | | | | | |
| Three Months Ended March 31, | | Six Months Ended March 31, |
| 2024 | | 2023 | | % Change | | 2024 | | 2023 | | % Change |
| Operating Revenues (in millions): | | | | | | | | | | | |
| Listed derivatives | $ | 59.1 | | | $ | 61.0 | | | (3)% | | $ | 118.5 | | | $ | 114.8 | | | 3% |
| OTC derivatives | 53.0 | | | 57.9 | | | (8)% | | 97.5 | | | 100.4 | | | (3)% |
| Physical contracts | 43.9 | | | 51.9 | | | (15)% | | 94.5 | | | 105.6 | | | (11)% |
| Interest / fees earned on client balances | 38.1 | | | 43.4 | | | (12)% | | 75.3 | | | 69.5 | | | 8% |
| Other | 6.4 | | | 5.9 | | | 8% | | 13.1 | | | 12.2 | | | 7% |
| $ | 200.5 | | | $ | 220.1 | | | (9)% | | $ | 398.9 | | | $ | 402.5 | | | (1)% |
| | | | | | | | | | | |
| Volumes and Other Select Data: | | |
| Listed derivatives (contracts, 000’s) | 9,635 | | | 8,625 | | | 12% | | 19,157 | | | 16,511 | | | 16% |
Listed derivatives, average rate per contract (1) | $ | 5.91 | | | $ | 6.97 | | | (15)% | | $ | 5.94 | | | $ | 6.75 | | | (12)% |
| Average client equity - listed derivatives (millions) | $ | 1,684 | | | $ | 1,971 | | | (15)% | | $ | 1,692 | | | $ | 2,053 | | | (18)% |
| OTC derivatives (contracts, 000’s) | 810 | | | 858 | | | (6)% | | 1,625 | | | 1,576 | | | 3% |
| OTC derivatives, average rate per contract | $ | 65.66 | | | $ | 67.94 | | | (3)% | | $ | 60.28 | | | $ | 64.37 | | | (6)% |
|
| | | | | | | | | |
| | OTC |
| | Three Months Ended December 31, |
| | 2017 | | % Change | | 2016 |
| Transactional revenues (in millions): | | |
| Agricultural | $ | 15.1 |
| | 62% | | $ | 9.3 |
|
| Energy and renewable fuels | 3.0 |
| | (29)% | | 4.2 |
|
| Other | 2.0 |
| | —% | | 2.0 |
|
| | $ | 20.1 |
| | 30% | | $ | 15.5 |
|
| Selected data: | | |
| Volume (contracts, 000’s) | 327.9 |
| | 9% | | 301.8 |
|
| Average rate per contract | $ | 58.55 |
| | 22% | | $ | 47.80 |
|
| | | | | | | | | | | | | | |
| (1) | Give-up fee revenues, related to contract execution for clients of other FCMs, as well as cash and voice brokerage revenues are excluded from the calculation of listed derivatives, average rate per contract. |
| | | | |
Three Months Ended DecemberMarch 31, 20172024 Compared to Three Months Ended DecemberMarch 31, 20162023
Operating revenues increased 7%decreased $19.6 million, or 9%, to $61.5$200.5 million in the first quarterthree months ended March 31, 2024 compared to $57.5$220.1 million in the prior year. Exchange-tradedthree months ended March 31, 2023. Net operating revenues decreased 7%$20.9 million, or 11%, to $33.5$164.2 million in the first quarter, resulting primarily from a decline LME metals transactional revenues which had a strong performancethree months ended March 31, 2024 compared to $185.1 million in the prior year period driven by increased market volatility. In addition, agriculturalthree months ended March 31, 2023.
Operating revenues derived from listed derivatives declined modestly$1.9 million, or 3%, to $59.1 million in the three months ended March 31, 2024 compared to $61.0 million in the three months ended March 31, 2023. This decline was principally due to a 15% decline in the average rate per contract, primarily as a result of lower customer activity driven by low agricultural prices. The declines werea narrowing of spreads in LME base metals markets. This decline was partially offset by growth in energy and renewable fuels and ana 12% increase in exchange-tradedoverall listed derivatives contract volumes, primarily in agricultural and LME base metal commodity markets, compared to the three months ended March 31, 2023.
Operating revenues derived from omnibus relationships introduced by our commercial hedging employees, which are reflectedOTC derivatives declined $4.9 million, or 8%, to $53.0 million in the ‘Other” category above. Energy and renewable
fuels experienced strong volume growth fromthree months ended March 31, 2024 compared to $57.9 million in the addition of new institutional customers, albeit this new businessthree months ended March 31, 2023. This decline was atprincipally due to a lower6% decrease in OTC derivative volumes, most notably in Brazilian markets, as well as a 3% decline in the average rate per contract as compared to our agricultural business. Overall exchange-traded contract volumes increased 7%, driven by the increases in energy and renewable fuels and omnibus relationships, however the lower rate per contract associated with both of these volumes drove a 13% decline versus the prior year in the average rate per contract to $5.31.three months ended March 31, 2023.
OTCOperating revenues increased 30%derived from physical contracts declined $8.0 million, or 15%, to $20.1$43.9 million in the first quarter,three months ended March 31, 2024 compared to $51.9 million in the three months ended March 31, 2023. This was principally driven by both a 9% increasedeclines of $1.5 million and $6.4 million in OTC volumes and a 22% increaseoperating revenues in the average rate per contract decreasing compared to the prior year. These increases were driven by increases in Brazilian grain activity as well as increased activity in food service, dairy and cotton. These increases were offset by lower coffeeour physical agricultural and energy and renewable fuels revenues.
Consulting, management, and account fees were flat with the prior year, while interest income, increased 83%, to $4.2 million compared to the prior year. The increase in interest income was primarily driven by an increase in short-term rates, as average customer equity declined 7% versus the prior year to $878.2 million in the first quarter.
Segment income increased to $21.1 million in the first quarter compared to $15.4 million in the prior year, primarily as a result of the increase in operating revenues and a $2.5 million decline in bad debt expense. The prior year period included $2.5 million in bad debt expense in our LMEprecious metals business. Variable expenses, excluding interest, expressed as a percentage of operating revenues decreased to 40% compared to 42% in the prior year, primarily as the result of the increase in interest income which has no associated variable expenses.
Global Payments
We provide global payment solutions to banks and commercial businesses, as well as charities, non-governmental organizations and government organizations. We offer payments services in more than 175 countries and 140 currencies, which we believe is more than any other payments solution provider, and provide competitive and transparent pricing.
Our proprietary FXecute global payments platform is integrated with a financial information exchange (“FIX”) protocol. This FIX protocol is an electronic communication method for the real-time exchange of information, and we believe it represents one of the first FIX offerings for cross-border payments in exotic currencies. FIX functionality allows customers to view real time market rates for various currencies, execute and manage orders in real-time, and view the status of their payments through the easy-to-use portal.
Additionally, as a member of SWIFT (Society for Worldwide Interbank Financial Telecommunication), we are able to offer our services to large money center and global banks seeking more competitive international payment services.
Through this single comprehensive platform and our commitment to customer service, we believe we are able to provide simple and fast execution, ensuring delivery of funds in any of these countries quickly through our global network of approximately 300 correspondent banks. In this business, we primarily act as a principal in buying and selling foreign currencies on a spot basis. We derive revenue from the difference between the purchase and sale prices.
We believe our customers value our ability to provide exchange rates that are significantly more competitive than those offered by large international banks, a competitive advantage that stems from our years of foreign exchange expertise focused on smaller, less liquid currencies.
The following table provides the financial performance and selected data for Global Payments for the periods indicated. |
| | | | | | | | | |
| | Three Months Ended December 31, |
| (in millions) | 2017 | | % Change | | 2016 |
| Revenues: | | | | | |
| Sales of physical commodities | $ | — |
| | — | | $ | — |
|
| Trading gains, net | 23.7 |
| | 5% | | 22.6 |
|
| Commission and clearing fees | 0.9 |
| | 80% | | 0.5 |
|
| Consulting, management, account fees | — |
| | — | | — |
|
| Interest income | — |
| | — | | — |
|
| Other income | — |
| | — | | — |
|
| Total revenues | 24.6 |
| | 6% | | 23.1 |
|
| Cost of sales of physical commodities | — |
| | — | | — |
|
| Operating revenues | 24.6 |
| | 6% | | 23.1 |
|
| Transaction-based clearing expenses | 1.2 |
| | —% | | 1.2 |
|
| Introducing broker commissions | 0.4 |
| | (69)% | | 1.3 |
|
| Interest expense | — |
| | — | | — |
|
| Net operating revenues | 23.0 |
| | 12% | | 20.6 |
|
| Variable direct compensation and benefits | 4.6 |
| | 10% | | 4.2 |
|
| Net contribution | 18.4 |
| | 12% | | 16.4 |
|
| Non-variable direct expenses | 3.8 |
| | 19% | | 3.2 |
|
| Segment income | $ | 14.6 |
| | 11% | | $ | 13.2 |
|
| Selected data: | | |
| Global Payments (# of payments, 000’s) | 156.3 |
| | 7% | | 146.6 |
|
| Average revenue per trade | $ | 157.39 |
| | —% | | $ | 157.57 |
|
Three Months Ended December 31, 2017 Compared to Three Months Ended December 31, 2016
Operating revenues increased 6% to a record $24.6 million in the first quarter compared to $23.1 million in the prior year. The volume of payments made increased 7% as we continued to benefit from an increase in financial institutions and other customers utilizing our electronic transaction order system while the average revenue per trade, was flat with the prior year period. The volume of payments declined and the average revenue per trade increasedrespectively, as compared to the most recent third and fourth quartersthree months ended March 31, 2023. Precious metals operating revenues were unfavorably impacted during the three months ended March 31, 2024, by unrealized losses on derivative positions of fiscal 2017, as certain commercial customers who had previously transacted their individual high volume but low value payments through our platform, opened their own bank accounts in certain countries$8.5 million, related to which we had made payments into on their behalf. However, we still made the foreign currency funding payments into their accounts on an aggregated basis in these countries. While we were able to capture similar revenues to the preceding third and fourth quarters, the number of payments made were reduced, the the average revenue per trade increased and variable transaction-based clearing expenses as a percentage of revenue declined due tophysical inventories held at the lower number of payments processed.cost or net realizable value. Precious metals operating revenues during the three months ended March 31, 2023 were favorably impacted by realized gains of $1.8 million on the sale of physical inventories carried at the lower of cost or net realizable value, for which losses on related derivative positions were recognized in prior periods.
SegmentInterest and fee income increased 11%earned on client balances decreased $5.3 million, or 12%, to $14.6$38.1 million in the first quarterthree months ended March 31, 2024 compared to $13.2$43.4 million in the prior year. This increase primarily resulted from the increase in operating revenues, partially offset by a $0.6 million increase in non-variable direct expenses versus the prior year period, primarily driven by higher non-variable compensation and trade system costs. Variable expenses, excluding interest, expressed as a percentage of operating revenues were decreased to 25% in the first quarter as compared to 29% in the prior year,three months ended March 31, 2023, primarily as a result of a decrease15% decline in introducing broker commissions.
Securities
We provide value-added solutions that facilitate cross-border trading and believe our customers value our abilityaverage client equity to manage complex transactions, including foreign exchange, utilizing our understanding of local market convention, liquidity and settlement protocols around the world. Our customers include U.S.-based regional and national broker-dealers and institutions investing or executing customer transactions in international markets and foreign institutions seeking access to the U.S. securities markets. We are one of the leading market makers in foreign securities, including unlisted ADRs, Global Depository Receipts (“GDRs”) and foreign ordinary shares. We make markets in over 3,600 ADRs, GDRs and foreign ordinary shares, of which over 2,000 trade in the OTC market. In addition, we will, on request, make prices in more than 10,000 unlisted foreign securities. We are also a broker-dealer in Argentina, where we are active in providing institutional executions in the local capital markets.
We act as an institutional dealer in fixed income securities, including U.S. Treasury, U.S. government agency, agency mortgage-backed and asset-backed securities to a customer base including asset managers, commercial bank trust and investment departments, broker-dealers, and insurance companies.
We originate, structure and place debt instruments in the international and domestic capital markets. These instruments include complex asset-backed securities (primarily in Argentina) and domestic municipal securities. On occasion, we may invest our own capital in debt instruments before selling them. We also actively trade in a variety of international debt instruments as well as operate an asset management business in which we earn fees, commissions and other revenues for management of third party assets and investment gains or losses on our investments in funds and proprietary accounts managed either by our investment managers or by independent investment managers.
The following table provides the financial performance for Securities for the periods indicated. |
| | | | | | | | | |
| | Three Months Ended December 31, |
| (in millions) | 2017 | | % Change | | 2016 |
| Revenues: | | | | | |
| Sales of physical commodities | $ | — |
| | — | | $ | — |
|
| Trading gains, net | 20.9 |
| | (5)% | | 21.9 |
|
| Commission and clearing fees | 5.0 |
| | 117% | | 2.3 |
|
| Consulting, management, and account fees | 2.8 |
| | (20)% | | 3.5 |
|
| Interest income | 14.3 |
| | 47% | | 9.7 |
|
| Other income | — |
| | — | | — |
|
| Total revenues | 43.0 |
| | 15% | | 37.4 |
|
| Cost of sales of physical commodities | — |
| | — | | — |
|
| Operating revenues | 43.0 |
| | 15% | | 37.4 |
|
| Transaction-based clearing expenses | 7.9 |
| | 27% | | 6.2 |
|
| Introducing broker commissions | 2.2 |
| | 5% | | 2.1 |
|
| Interest expense | 9.4 |
| | 135% | | 4.0 |
|
| Net operating revenues | 23.5 |
| | (6)% | | 25.1 |
|
| Variable direct compensation and benefits | 5.7 |
| | 8% | | 5.3 |
|
| Net contribution | 17.8 |
| | (10)% | | 19.8 |
|
| Non-variable direct expenses | 6.8 |
| | (1)% | | 6.9 |
|
| Segment income | $ | 11.0 |
| | (15)% | | $ | 12.9 |
|
The following table sets forth operating revenues by product line and selected data for Securities for the periods indicated. |
| | | | | | | | | |
| | Three Months Ended December 31, |
| | 2017 | | % Change | | 2016 |
| Operating revenues by product line (in millions): |
| Equity Market-Making | $ | 17.7 |
| | 15% | | $ | 15.4 |
|
| Debt Trading | 22.2 |
| | 24% | | 17.9 |
|
| Investment Banking | 0.6 |
| | (14)% | | 0.7 |
|
| Asset Management | 2.5 |
| | (26)% | | 3.4 |
|
| | $ | 43.0 |
| | 15% | | $ | 37.4 |
|
| Selected data: |
| Equity Market-Making (gross dollar volume, millions) | $ | 24,734.3 |
| | 11% | | $ | 22,355.3 |
|
| Equity Market-Making revenue per $1,000 traded | $ | 0.65 |
| | (6)% | | $ | 0.69 |
|
| Debt Trading (principal dollar volume, millions) | $ | 33,233.7 |
| | 1% | | $ | 33,045.6 |
|
| Debt Trading revenue per $1,000 traded | $ | 0.67 |
| | 24% | | $ | 0.54 |
|
| Average assets under management in Argentina (millions) | $ | 473.7 |
| | (7)% | | $ | 509.8 |
|
Three Months Ended December 31, 2017 Compared to Three Months Ended December 31, 2016
Operating revenues increased 15% to $43.0$1,684 million in the first quarter compared to $37.4 million in the prior year.three months ended March 31, 2024.
Operating revenues in our Securities segment are comprised of activities in four product lines, Equity Market-Making, Debt Trading, Investment Banking and Asset Management. Operating revenues in Equity Market-Making increased 15% in the first quarter compared to the prior year period. Gross dollar volume traded increased 11% driven both by on-boarding of new customers and increased market share, while the average revenue per $1,000 traded declined 6%. Equity Market-Making operating revenues include the trading profits we earn before the related expense deduction for ADR conversion fees. These ADR fees are included in the consolidated income statements as ‘transaction-based clearing expenses’.
Operating revenues in Debt Trading increased 24% in the first quarter compared to the prior year, driven by increases in our domestic institutional fixed income business as well as in our Argentina and municipal securities businesses. Operating
revenues in Investment Banking were relatively flat with the prior year. Asset Management operating revenues decreased 26% in the first quarter as compared to the prior year as assets under management decreased 7% to $473.7 million in the first quarter compared to $509.8 million in the prior year.
Segment income decreased 15% to $11.0 million in the first quarter compared to $12.9 million in the prior year, primarily as a result of an increase in interest expense in our Debt Trading business and to a lesser extent an increase in transaction-based clearing expenses in Equity Market-Making. Variable expenses, excluding interest, expressed as a percentage of operating revenues increased to 37% in the first quarter compared to 36% in the prior year,three months ended March 31, 2024 compared to 31% in the three months ended March 31, 2023, primarily as thea result of anthe impact of the unrealized losses on precious metals derivative positions, discussed above, which are not correlated to variable expenses.
Segment income decreased $17.3 million, or 17%, to $85.6 million in the three months ended March 31, 2024 compared to $102.9 million in the three months ended March 31, 2023, principally due to the decline in operating revenues and to a lesser extent a $2.6 million increase in transaction-based clearingnon-variable direct expenses. These declines were partially offset by a nonrecurring gain of $6.9 million related to proceeds from a settlement in the Commodity Exchange Gold Futures and Options Trading matter.
For the three months ended March 31, 2024, we have calculated an allocation for overhead costs of $8.9 million for the Commercial segment as described in the introduction to Total Segment Results above. An allocation of overhead costs will be provided on an ongoing basis, but we have not calculated historical comparable information. Physical CommoditiesSix Months Ended March 31, 2024 Compared to Six Months Ended March 31, 2023
Operating revenues decreased $3.6 million, or 1%, to $398.9 million in the six months ended March 31, 2024 compared to $402.5 million in the six months ended March 31, 2023. Net operating revenues decreased $10.2 million, or 3%, to $327.6 million in the six months ended March 31, 2024 compared to $337.8 million in the six months ended March 31, 2023.
Operating revenues derived from listed derivatives increased $3.7 million, or 3%, to $118.5 million in the six months ended March 31, 2024 compared to $114.8 million in the six months ended March 31, 2023. This segment consists of our physical Precious Metals tradingwas principally driven by a 16% increase in listed derivative contract volumes, primarily in agricultural and Physical Ag & EnergyLME base metal commodity businesses. In Precious Metals, we providemarkets. This was partially offset by a full range of trading and hedging capabilities, including OTC products, to select producers, consumers, and investors. In our trading activities, we act12% decline in the average rate per contract, primarily as a principal, committing our own capitalresult of a narrowing of spreads in LME base metals commodity markets.
Operating revenues derived from OTC transactions declined $2.9 million, or 3%, to buy and sell$97.5 million in the six months ended March 31, 2024 compared to $100.4 million in the six months ended March 31, 2023. This decrease principally resulted from a 6% decline in the average rate per contract, which was partially offset by a 3% increase in OTC volumes.
Operating revenues derived from physical transactions declined $11.1 million, or 11%, to $94.5 million in the six months ended March 31, 2024 compared to $105.6 million in the six months ended March 31, 2023. Operating revenues derived from physical transactions during the six months ended March 31, 2024 were unfavorably impacted by unrealized losses on precious metals on a spot and forward basis.
In our Physical Ag & Energy commodity business, we act as a principalrelated derivative positions of $10.0 million, related to facilitate financing, structured pricing and logistics services to clients across the commodity complex, including energy commodities, grains, oil seeds, cotton, coffee, cocoa, edible oils and feed products. We provide financing to commercial commodity-related companies against physical inventories. We use sale and repurchase agreements to purchase commodities evidenced by warehouse receipts, subject to a simultaneous agreement to sell such commodities back to the original seller at a later date.
Transactions where the sale and repurchase price are fixed upon execution, and meet additional required conditions, are accounted for as product financing arrangements, and accordingly no commodity inventory, purchases or sales are recorded. Transactions where the repurchase price is not fixed at execution do not meet all the criteria to be accounted for as product financing arrangements, and therefore are recorded as commodity inventory, purchases and sales.
Precious metals inventoryinventories held by INTL FCStone Ltd, a United Kingdom based broker-dealer subsidiary, is measured at fair value, with changes in fair value included as a component of ‘trading gains, net’ in the condensed consolidated income statements. INTL FCStone Ltd precious metals sales and cost of sales are presented on a net basis and included as a component of ‘trading gains, net’ in the condensed consolidated income statements. Precious metals inventory held by our subsidiaries that are not broker-dealers are valued at the lower of cost or net realizable value. Precious metals sales and cost of sales for subsidiaries that are not broker-dealers are recorded on a gross basis.
In our Physical Ag and Energy commodity business, we value our agricultural inventory at net realizable value, which approximates fair value less disposal costs. The agricultural inventories have reliable, readily determinable and realizable market prices, have relatively insignificant costs of disposal and are available for immediate delivery. Revenues generated from our Physical Ag and Energy commodity business are recorded on a gross basis.
Operating gains and losses from our Precious Metals commodities derivatives activities are included in ‘trading gains, net’ in the consolidated income statements. Operating gains and losses from our Physical Ag and Energy commodities derivatives activities are included in ‘cost of sales of physical commodities’ in the consolidated income statements. We generally mitigate the price risk associated with commodities held in inventory through the use of derivatives. We do not elect hedge accounting under U.S. GAAP in accounting for this price risk mitigation. Management continues to evaluate performance and allocate resources on an operating revenue basis.
The following table provides the financial performance for Physical Commodities for the periods indicated. |
| | | | | | | | | |
| | Three Months Ended December 31, |
| (in millions) | 2017 | | % Change | | 2016 |
| Revenues: | | | | | |
| Sales of physical commodities | $ | 7,714.4 |
| | 31% | | $ | 5,896.0 |
|
| Trading gains (losses), net | (0.7 | ) | | n/m | | 0.2 |
|
| Commission and clearing fees | 0.6 |
| | 200% | | 0.2 |
|
| Consulting, management, and account fees | 0.1 |
| | (86)% | | 0.7 |
|
| Interest income | 2.2 |
| | 38% | | 1.6 |
|
| Other income | — |
| | — | | — |
|
| Total revenues | 7,716.6 |
| | 31% | | 5,898.7 |
|
| Cost of sales of physical commodities | 7,706.0 |
| | 31% | | 5,888.9 |
|
| Operating revenues | 10.6 |
| | 8% | | 9.8 |
|
| Transaction-based clearing expenses | 0.2 |
| | —% | | 0.2 |
|
| Introducing broker commissions | 0.1 |
| | —% | | 0.1 |
|
| Interest expense | 1.9 |
| | 36% | | 1.4 |
|
| Net operating revenues | 8.4 |
| | 4% | | 8.1 |
|
| Variable direct compensation and benefits | 2.8 |
| | 22% | | 2.3 |
|
| Net contribution | 5.6 |
| | (3)% | | 5.8 |
|
| Non-variable direct expenses | 3.5 |
| | 25% | | 2.8 |
|
| Bad debt on physical coal | 1.0 |
| | n/m | | — |
|
| Segment income | $ | 1.1 |
| | (63)% | | $ | 3.0 |
|
The following tables set forth operating revenue by product line and selected data for Physical Commodities for the periods indicated. |
| | | | | | | | | |
| | Precious Metals |
| | Three Months Ended December 31, |
| | 2017 | | % Change | | 2016 |
| Total revenues | $ | 7,530.1 |
| | 32% | | $ | 5,722.9 |
|
| Cost of sales of physical commodities | 7,524.8 |
| | 32% | | 5,717.5 |
|
| Operating revenues | $ | 5.3 |
| | (2)% | | $ | 5.4 |
|
| Selected data: | | |
| Gold equivalent ounces traded (000’s) | 33,503.1 |
| | 38% | | 24,329.2 |
|
| Average revenue per ounce traded | $ | 0.16 |
| | (27)% | | $ | 0.22 |
|
|
| | | | | | | | | |
| | Physical Ag & Energy |
| | Three Months Ended December 31, |
| | 2017 | | % Change | | 2016 |
| Total revenues | $ | 186.5 |
| | 6% | | $ | 175.8 |
|
| Cost of sales of physical commodities | 181.2 |
| | 6% | | 171.4 |
|
| Operating revenues | $ | 5.3 |
| | 20% | | $ | 4.4 |
|
Three Months Ended December 31, 2017 Compared to Three Months Ended December 31, 2016
Operating revenues for Physical Commodities increased 8% to $10.6 million induring the first quarter compared to $9.8 million in the prior year.
Precious Metals operating revenues declined 2% to $5.3 million in the first quarter compared to $5.4 million in the prior year, despite a 38% increase in the number of ounces traded, as the average revenue per ounce traded declined 27% versus the prior year. This was primarily due to a $1.3 millionsix months ended March 31, 2023 were unfavorably impacted by unrealized losslosses on derivative positions of $1.8 million, related to physical inventories held against precious metals inventory carried at the lower of cost or net realizable value in our non-broker dealer subsidiaries.value.
Operating revenues in Physical Ag & EnergyInterest and fee income earned on client balances increased 20%$5.8 million, or 8%, to $5.3$75.3 million in the first quartersix months ended March 31, 2024 compared to the prior year. The increase in operating revenues is primarily due to business expansion in our U.S. subsidiary FCStone Merchant Services, LLC.
Segment income decreased 63% to $1.1$69.5 million in the first quarter comparedsix months ended March 31, 2023, as a result of the increase in short-term interest
rates, which was partially offset by an 18% decrease in average client equity to $3.0$1,692 million in the prior year,six months ended March 31, 2024.
Variable expenses, excluding interest, expressed as a percentage of operating revenues declined to 34% in the six months ended March 31, 2024 compared to 31% in the six months ended March 31, 2023, primarily as a result of the impact of the unrealized losses on precious metals derivative positions, discussed above, which are not correlated to variable expenses.
Segment income decreased $12.9 million, or 7%, to $172.8 million in the six months ended March 31, 2024 compared to $185.7 million in the six months ended March 31, 2023, partially due to the decline in operating revenues, as well as an $8.9 million increase in non-variable direct expenses. The increase in non-variable direct expenses was primarily due to a $1.0$2.0 million bad debt expenseincrease in fixed compensation and benefits, a $0.5$1.9 million increase in professional fees, incurreda $1.0 million increase in travel and business development and a $1.2 million increase in depreciation and amortization. The increase in non-variable direct expenses were partially offset by a $2.9 million decline in bad debts, net of recoveries. Also, the decline in segment income was partially offset by a nonrecurring gain of $6.9 million related to our exitproceeds from a settlement in the Commodity Exchange Gold Futures and Options Trading matter.
For the six months ended March 31, 2024, we have calculated an allocation for overhead costs of our physical coal business which was conducted solely$17.7 million for the Commercial segment as described in our Singapore subsidiary.the introduction to Total Segment Results above. An allocation of overhead costs will be provided on an ongoing basis, but we have not calculated historical comparable information.
Clearing and Execution Services
Institutional
We provide institutional clients with a complete suite of equity trading services to help them find liquidity with best execution, consistent liquidity across a robust array of fixed income products, competitive and efficient clearing and execution in all major futures and securities exchanges globally as well as prime brokerage in allequities and major foreign currency pairs and swap transactions. Through our platform, customer orders are accepted and directed to the appropriate exchange for execution. We then facilitate the clearing of customer transactions. Clearing involves the matching of customer trades with the exchange, the collection and management of customer margin deposits to support the transactions, and the accounting and reporting of the transactions to customers.
As of December 31, 2017, we held $2.1 billion in required customer segregated assets, which we believe makes us the third largest independent futures commission merchant (“FCM”) in the United States not affiliated with a major financial institution or commodity intermediary, end-user or producer, as measured by required customer segregated assets. We seek to leverage our capabilities and capacity by offering facilities management or outsourcing solutions to other FCM’s.
Following our acquisition of the Sterne Agee correspondent securities clearing business, we are an independent full-service provider to introducing broker-dealers (“IBD’s”) of clearing, custody, research, syndicated and security-based lending products and services, including a proprietary technology platform which offers seamless connectivity to ensure a positive customer experience through the clearing and settlement process. Also as part of this transaction, we acquired Sterne Agee’s independent wealth management business which offers a comprehensive product suite to retail customers nationwide. As a result we are one of the leading mid-market clearers in the securities industry, with approximately 50 correspondent clearing relationships with over $15 billion in assets under management or administration as of December 31, 2017.
In addition, we believe we are one of the largest non-bank prime brokersoriginate, structure and swap dealersplace debt instruments in the world. Through this offering, we provide prime brokerage foreign exchange (“FX”) services to financial institutionsinternational and professional traders. We provide our customers with the full range of OTC products, including 24-hour a day execution of spot, forwardsdomestic capital markets. These instruments include asset-backed securities (primarily in Argentina) and options as well as non-deliverable forwards in both liquid and exotic currencies. We also operate a proprietary foreign exchange desk that arbitrages the exchange-traded foreign exchange markets with the cash markets.domestic municipal securities.
Following the October 1, 2016 acquisition of ICAP plc’s London-based EMEA oil voice brokerage business, we employ over 30 employees providing brokerage services across the fuel, crude, and middle distillates markets with over 200 well known commercial and institutional customers throughout Europe, the Middle East and Africa.
The following table providestables below present the financial performance, a disaggregation of operating revenues, and selectedselect operating data for Clearing and Execution Servicesmetrics used by management in evaluating the performance of the Institutional segment, for the periods indicated. | | | | Three Months Ended December 31, |
| Three Months Ended March 31, | | | Three Months Ended March 31, | | Six Months Ended March 31, |
| (in millions) | 2017 | | % Change | | 2016 | (in millions) | 2024 | | 2023 | | % Change | | 2024 | | 2023 | | % Change |
| Revenues: | |
| Sales of physical commodities | $ | — |
| | — | | $ | — |
|
| Trading gains, net | 11.3 |
| | (6)% | | 12.0 |
|
| Sales of physical commodities | |
| Sales of physical commodities | | $ | — | | | $ | — | | | —% | | $ | — | | | $ | — | | | —% |
| Principal gains, net | | Principal gains, net | 97.6 | | | 89.1 | | | 10% | | 200.8 | | | 190.3 | | | 6% |
| Commission and clearing fees | 46.1 |
| | 12% | | 41.1 |
| Commission and clearing fees | 74.8 | | | 72.9 | | 72.9 | | | 3% | | 3% | | 148.1 | | | 140.4 | | 140.4 | | | 5% | | 5% |
| Consulting, management, and account fees | 9.5 |
| | 27% | | 7.5 |
|
| Consulting, management and account fees | | Consulting, management and account fees | 17.7 | | | 18.8 | | | (6)% | | 35.0 | | | 35.6 | | | (2)% |
| Interest income | 5.3 |
| | 77% | | 3.0 |
| Interest income | 273.3 | | | 181.7 | | 181.7 | | | 50% | | 50% | | 515.2 | | | 339.7 | | 339.7 | | | 52% | | 52% |
| Other | — |
| | — | | — |
|
| Total revenues | 72.2 |
| | 14% | | 63.6 |
| Total revenues | 463.4 | | | 362.5 | | 362.5 | | | 28% | | 28% | | 899.1 | | | 706.0 | | 706.0 | | | 27% | | 27% |
| Cost of physical commodities sold | — |
| | — | | — |
|
| Cost of sales of physical commodities | | Cost of sales of physical commodities | — | | | — | | | —% | | — | | | — | | | —% |
| Operating revenues | 72.2 |
| | 14% | | 63.6 |
| Operating revenues | 463.4 | | | 362.5 | | 362.5 | | | 28% | | 28% | | 899.1 | | | 706.0 | | 706.0 | | | 27% | | 27% |
| Transaction-based clearing expenses | 19.2 |
| | 4% | | 18.4 |
| Transaction-based clearing expenses | 56.0 | | | 48.3 | | 48.3 | | | 16% | | 16% | | 108.9 | | | 95.3 | | 95.3 | | | 14% | | 14% |
| Introducing broker commissions | 24.1 |
| | 18% | | 20.5 |
| Introducing broker commissions | 8.0 | | | 10.1 | | 10.1 | | | (21)% | | (21)% | | 15.7 | | | 18.7 | | 18.7 | | | (16)% | | (16)% |
| Interest expense | 1.5 |
| | 150% | | 0.6 |
| Interest expense | 249.6 | | | 166.2 | | 166.2 | | | 50% | | 50% | | 476.1 | | | 310.9 | | 310.9 | | | 53% | | 53% |
| Net operating revenues | 27.4 |
| | 14% | | 24.1 |
| Net operating revenues | 149.8 | | | 137.9 | | 137.9 | | | 9% | | 9% | | 298.4 | | | 281.1 | | 281.1 | | | 6% | | 6% |
| Variable direct compensation and benefits | 6.9 |
| | 13% | | 6.1 |
| Variable direct compensation and benefits | 47.3 | | | 48.6 | | 48.6 | | | (3)% | | (3)% | | 95.7 | | | 97.2 | | 97.2 | | | (2)% | | (2)% |
| Net contribution | 20.5 |
| | 14% | | 18.0 |
| Net contribution | 102.5 | | | 89.3 | | 89.3 | | | 15% | | 15% | | 202.7 | | | 183.9 | | 183.9 | | | 10% | | 10% |
| Fixed compensation and benefits | | Fixed compensation and benefits | 20.4 | | | 16.1 | | | 27% | | 36.8 | | | 28.8 | | | 28% |
| Other fixed expenses | | Other fixed expenses | 22.2 | | | 17.3 | | | 28% | | 41.2 | | | 37.3 | | | 10% |
| Bad debts (recoveries), net | | Bad debts (recoveries), net | (1.4) | | | 0.1 | | | n/m | | (1.8) | | | — | | | n/m |
| Non-variable direct expenses | 10.0 |
| | (19)% | | 12.3 |
| Non-variable direct expenses | 41.2 | | | 33.5 | | 33.5 | | | 23% | | 23% | | 76.2 | | | 66.1 | | 66.1 | | | 15% | | 15% |
| | Segment income | $ | 10.5 |
| | 84% | | $ | 5.7 |
|
| Segment income | |
| Segment income | | 61.3 | | | 55.8 | | | 10% | | 126.5 | | | 117.8 | | | 7% |
Allocation of overhead costs (1) | | Allocation of overhead costs (1) | 13.3 | | | — | | | n/m | | 26.1 | | | — | | | n/m |
| Segment income, less allocation of overhead costs | | Segment income, less allocation of overhead costs | $ | 48.0 | | | $ | 55.8 | | | n/m | | $ | 100.4 | | | $ | 117.8 | | | n/m |
The following table sets forth(1)Includes an allocation of certain overhead costs to our operating revenues by product line and selected data for Clearing and Execution Servicessegments as noted above for the periods indicated.three and six months ended March 31, 2024. These allocations will be provided on an ongoing basis but have not been calculated for comparable periods.
| | | | | | | | | | | | | | | | | | | | | | | | | | | | | | | | | | | |
| Three Months Ended March 31, | | Six Months Ended March 31, |
| 2024 | | 2023 | | % Change | | 2024 | | 2023 | | % Change |
| Operating Revenues (in millions): | | | | | | | | | | | |
| Listed derivatives | $ | 52.6 | | | $ | 49.5 | | | 6% | | $ | 102.4 | | | $ | 95.5 | | | 7% |
| | | | | | | | | | | |
| Securities | 314.9 | | | 226.8 | | | 39% | | 608.5 | | | 439.8 | | | 38% |
| FX contracts | 7.6 | | | 9.3 | | | (18)% | | 15.6 | | | 18.5 | | | (16)% |
| Interest / fees earned on client balances | 65.4 | | | 59.2 | | | 10% | | 125.9 | | | 118.5 | | | 6% |
| Other | 22.9 | | | 17.7 | | | 29% | | 46.7 | | | 33.7 | | | 39% |
| $ | 463.4 | | | $ | 362.5 | | | 28% | | $ | 899.1 | | | $ | 706.0 | | | 27% |
| | | | | | | | | | | |
| Volumes and Other Select Data: | | |
| Listed derivatives (contracts, 000’s) | 44,170 | | | 32,964 | | | 34% | | 85,406 | | | 65,276 | | | 31% |
Listed derivatives, average rate per contract (1) | $ | 1.12 | | | $ | 1.38 | | | (19)% | | $ | 1.12 | | | $ | 1.33 | | | (16)% |
| Average client equity - listed derivatives (millions) | $ | 4,380 | | | $ | 5,251 | | | (17)% | | $ | 4,425 | | | $ | 5,669 | | | (22)% |
| Securities ADV (millions) | $ | 7,473 | | | $ | 5,759 | | | 30% | | $ | 6,838 | | | $ | 4,995 | | | 37% |
Securities RPM (2) | $ | 239 | | | $ | 282 | | | (15)% | | $ | 265 | | | $ | 341 | | | (22)% |
| Average money market / FDIC sweep client balances (millions) | $ | 1,047 | | | $ | 1,374 | | | (24)% | | $ | 1,054 | | | $ | 1,455 | | | (28)% |
| FX contracts ADV ( millions) | $ | 4,065 | | | $ | 5,080 | | | (20)% | | $ | 4,017 | | | $ | 4,974 | | | (19)% |
| FX contracts RPM | $ | 30 | | | $ | 29 | | | 3% | | $ | 32 | | | $ | 30 | | | 7% |
|
| | | | | | | | | |
| | Three Months Ended December 31, |
| (in millions) | 2017 | | % Change | | 2016 |
| Operating revenues by product line (in millions): | | |
| Exchange-traded Futures & Options | $ | 35.9 |
| | 29% | | $ | 27.9 |
|
| FX Prime Brokerage | 4.7 |
| | (15)% | | 5.5 |
|
| Correspondent Clearing | 6.0 |
| | (6)% | | 6.4 |
|
| Independent Wealth Management | 18.5 |
| | 7% | | 17.3 |
|
| Derivative Voice Brokerage | 7.1 |
| | 9% | | 6.5 |
|
| Operating revenues | $ | 72.2 |
| | 14% | | $ | 63.6 |
|
| Selected data: | | |
| Exchange-traded - futures and options (contracts, 000’s) | 19,649.6 |
| | 7% | | 18,292.1 |
|
| Exchange-traded - futures and options average rate per contract | $ | 1.55 |
| | 16% | | $ | 1.34 |
|
| Average customer equity - futures and options (millions) | $ | 1,247.6 |
| | 10% | | $ | 1,129.1 |
|
| FX Prime Brokerage volume (U.S. notional, millions) | $ | 114,302.0 |
| | (33)% | | $ | 169,872.6 |
|
| | | | | | | | | | | | | | |
| (1) | Give-up fee revenues, related to contract execution for clients of other FCMs, are excluded from the calculation of listed derivatives, average rate per contract. |
| (2) | Interest expense associated with our fixed income activities is deducted from operating revenues in the calculation of Securities RPM, while interest income related to securities lending is excluded. |
| |
Three Months Ended DecemberMarch 31, 20172024 Compared to Three Months Ended DecemberMarch 31, 20162023
Operating revenues increased 14%$100.9 million, or 28%, to $72.2$463.4 million in the first quarterthree months ended March 31, 2024 compared to $63.6$362.5 million in the prior year.three months ended March 31, 2023. Net operating revenues increased $11.9 million, or 9%, to $149.8 million in the three months ended March 31, 2024 compared to $137.9 million in the three months ended March 31, 2023.
Operating revenues in our Exchange-traded Futures & Options businessderived from listed derivatives increased 29%$3.1 million, or 6%, to $35.9$52.6 million in the first quarterthree months ended March 31, 2024 compared to $27.9$49.5 million in the prior yearthree months ended March 31, 2023, principally due to an 34% increase in listed derivative contract volumes, which was partially offset by a 19% decline in the average rate per contract.
Operating revenues derived from securities transactions increased $88.1 million, or 39%, to $314.9 million in the three months ended March 31, 2024 compared to $226.8 million in the three months ended March 31, 2023. The ADV of securities traded increased 30%, principally driven by increased client activity in both equity and fixed income markets. Carried interest on fixed income securities is a component of operating revenues, however interest expense associated with financing these positions is not. Our calculation of Securities RPM, in the table above, presents the RPM after deducting from operating revenues the interest expense associated with our fixed income activities. The securities RPM decreased 15% in the three months ended March 31, 2024 compared to the three months ended March 31, 2023, principally due to a tightening of spreads and a change in product mix.
Operating revenues derived from FX contracts declined $1.7 million, or 18%, to $7.6 million in the three months ended March 31, 2024 compared to $9.3 million in the three months ended March 31, 2023, principally driven by a 20% decline in the ADV of FX contracts.
Interest and fee income earned on client balances, which is associated with our listed derivative and correspondent clearing businesses increased $6.2 million, to $65.4 million in the three months ended March 31, 2024, principally driven by an increase in short-term interest rates, which was partially offset by declines of 17% and 24% in average client equity and average money market/FDIC sweep client balances, respectively, as compared to the three months ended March 31, 2023.
As a result of the increase in short-term interest rates and the increase in ADV, interest expense increased $83.4 million, to $249.6 million in the three months ended March 31, 2024 compared to $166.2 million in the three months ended March 31, 2023, with interest expense directly associated with serving as an institutional dealer in fixed income securities increasing $78.6 million and interest expense directly attributable to securities lending activities increasing $5.7 million as compared to the three months ended March 31, 2023. Partially offsetting these increases, interest paid to clients declined $6.0 million as compared to the three months ended March 31, 2023.
Variable expenses, excluding interest, expressed as a percentage of operating revenues declined to 24% in the three months ended March 31, 2024 compared to 30% in the three months ended March 31, 2023, primarily as the result of the increase in interest/fees earned on client balances, which is generally not a component of variable compensation.
Segment income increased $5.5 million, or 10%, to $61.3 million in the three months ended March 31, 2024 compared to $55.8 million in the three months ended March 31, 2023, as a result of a 7%the increase in exchange-traded volumesnet operating revenues noted above, which was partially offset by a $7.7 million increase in non-variable direct expenses, including a $4.3 million increase in fixed compensation and a $4.1 million increase in professional fees as compared to the three months ended March 31, 2023. These negative variances were partially offset by a $1.5 million favorable variance in bad debt expense as compared to the three months ended March 31, 2023.
For the three months ended March 31, 2024, we have calculated an allocation for overhead costs of $13.3 million for the Institutional segment as described in the introduction to Total Segment Results above. An allocation of overhead costs will be provided on an ongoing basis, but we have not calculated historical comparable information.
Six Months Ended March 31, 2024 Compared to Six Months Ended March 31, 2023
Operating revenues increased $193.1 million, or 27%, to $899.1 million in the six months ended March 31, 2024 compared to $706.0 million in the six months ended March 31, 2023. Net operating revenues increased $17.3 million, or 6%, to $298.4 million in the six months ended March 31, 2024 compared to $281.1 million in the six months ended March 31, 2023.
Operating revenues derived from listed derivatives increased $6.9 million, or 7%, to $102.4 million in the six months ended March 31, 2024 compared to $95.5 million in the six months ended March 31, 2023, principally driven by a 31% increase in
listed derivative contract volumes, which was partially offset by a 16% increasedecline in the average rate per contract compared to the prior year period. In addition, interest income in the Exchange-traded Futures & Options businesssix months ended March 31, 2023.
Operating revenues derived from securities transactions increased $1.9$168.7 million, or 38%, to $3.5$608.5 million in the first quarter primarilysix months ended March 31, 2024 compared to $439.8 million in the six months ended March 31, 2023. The ADV of securities traded increased 37%, principally driven by increased client activity in both equity and fixed income markets. Carried interest on fixed income securities is a component of operating revenues, however interest expense associated with financing these positions is not. Our calculation of the securities RPM, in the table above, presents the RPM after deducting from operating revenues the interest expense associated with our fixed income activities. The securities RPM decreased 22% in the six months ended March 31, 2024 compared to the six months ended March 31, 2023, principally due to a tightening of spreads and a change in product mix.
Operating revenues derived from FX contracts declined $2.9 million, or 16%, to $15.6 million in the six months ended March 31, 2024 compared to $18.5 million in the six months ended March 31, 2023, principally driven by a 19% decline in the ADV of FX contracts traded, which was partially offset by a 7% increase in the average rate per contract.
Finally, interest and fee income earned on client balances, which is associated with our listed derivative business, as a result ofwell as our correspondent clearing businesses, increased $7.4 million, to $125.9 million in the six months ended March 31, 2024 compared to $118.5 million in the six months ended March 31, 2023, principally driven by an increase in short-term interest rates, which was partially offset by declines of 22% and a 10% increase28% in average customerclient equity to $1.2 billion.
Operating revenues in our FX Prime Brokerage declined 15% compared to the prior year to $4.7 million in the first quarter, as a result of a 33% decline in foreign exchange volumes.
Correspondent Clearing operating revenues declined 6%and average money market/FDIC sweep client balances, respectively, as compared to the prior yearsix months ended March 31, 2023.
As a result of the increase in short-term interest rates and the increase in the ADV, interest expense increased $165.2 million, to $6.0$476.1 million in the first quarter, while operating revenuessix months ended March 31, 2024 compared to $310.9 million the six months ended March 31, 2023, with interest expense directly associated with serving as an institutional dealer in Independent Wealth Management increased 7% versus the prior year to $18.5 million. Included within these operating revenues, Correspondent Clearing and Independent Wealth Management businesses had interestfixed income of $1.5securities increasing $154.4 million and $0.1interest expense directly attributable to securities lending activities increasing $12.4 million respectively. Operating revenues in Derivative Voice Brokerage increased 9%compared to $7.1the six months ended March 31, 2023. Partially offsetting these increases, interest paid to clients decreased $7.2 million in the first quarter as compared to the prior year.six months ended March 31, 2023.
Variable expenses, excluding interest, expressed as a percentage of operating revenues declined to 25% in the six months ended March 31, 2024 compared to 30% in the six months ended March 31, 2023, principally as the result of the increase in interest/fees earned on client balances, which is generally not a component of variable compensation.
Segment income increased $8.7 million, or 7%, to $10.5$126.5 million in the first quartersix months ended March 31, 2024 compared to $5.7$117.8 million in the prior year,six months ended March 31, 2023, primarily as a result of the increase in net operating revenues as well asnoted above, which was partially offset by a $2.3$10.1 million, declineor 15% increase in non-variable direct expenses versus the six months ended March 31, 2023. The increase in non-variable direct expenses was primarily related to an $8.0 million increase in fixed compensation and benefits, a $1.0 million increase in trade systems and trade systemmarket information, a $3.0 million increase in professional fees and a $1.0 million increase in travel and business development. These increases were partially offset by a $1.8 million positive variance in bad debts, net of recoveries and a $1.6 million decline in non-trading technology and support as compared to the six months ended March 31, 2023.
For the six months ended March 31, 2024, we have calculated an allocation for overhead costs in our FX Prime Brokerage, Correspondent Clearing and Derivative Voice Brokerage businesses. Segment incomeof $26.1 million for the Institutional segment as described in the first quarter includesintroduction to Total Segment Results above. An allocation of overhead costs will be provided on an ongoing basis, but we have not calculated historical comparable information.
Retail
We provide our retail clients around the world access to over 18,000 global financial markets, including spot foreign exchange ("forex"), both financial trading and physical investment in precious metals, as well as contracts for difference (“CFDs”), which are investment products with returns linked to the performance of underlying assets. In addition, our independent wealth management business offers a $0.9 million quarterly chargecomprehensive product suite to compensationretail investors in the U.S.
The tables below present the financial performance, a disaggregation of operating revenues, and benefits perselect operating data and metrics used by management in evaluating the termsperformance of the acquisitionRetail segment, for the periods indicated.
| | | | | | | | | | | | | | | | | | | | | | | | | | | | | | | | | | | |
| Three Months Ended March 31, | | Six Months Ended March 31, |
| (in millions) | 2024 | | 2023 | | % Change | | 2024 | | 2023 | | % Change |
| Revenues: | | | | | | | | | | | |
| Sales of physical commodities | $ | 11.9 | | | $ | 226.9 | | | (95)% | | $ | 23.3 | | | $ | 480.9 | | | (95)% |
| Principal gains, net | 61.8 | | | 43.3 | | | 43% | | 117.4 | | | 75.1 | | | 56% |
| Commission and clearing fees | 13.7 | | | 11.9 | | | 15% | | 24.9 | | | 22.6 | | | 10% |
| Consulting, management and account fees | 13.9 | | | 12.7 | | | 9% | | 28.0 | | | 27.6 | | | 1% |
| Interest income | 10.0 | | | 9.8 | | | 2% | | 19.4 | | | 14.6 | | | 33% |
| Total revenues | 111.3 | | | 304.6 | | | (63)% | | 213.0 | | | 620.8 | | | (66)% |
| Cost of sales of physical commodities | 9.3 | | | 226.0 | | | (96)% | | 18.5 | | | 471.7 | | | (96)% |
| Operating revenues | 102.0 | | | 78.6 | | | 30% | | 194.5 | | | 149.1 | | | 30% |
| Transaction-based clearing expenses | 3.5 | | | 4.7 | | | (26)% | | 7.0 | | | 10.0 | | | (30)% |
| Introducing broker commissions | 22.4 | | | 21.7 | | | 3% | | 42.8 | | | 41.9 | | | 2% |
| Interest expense | 1.8 | | | 1.4 | | | 29% | | 3.4 | | | 2.5 | | | 36% |
| Net operating revenues | 74.3 | | | 50.8 | | | 46% | | 141.3 | | | 94.7 | | | 49% |
| Variable direct compensation and benefits | 4.4 | | | 2.4 | | | 83% | | 8.8 | | | 7.1 | | | 24% |
| Net contribution | 69.9 | | | 48.4 | | | 44% | | 132.5 | | | 87.6 | | | 51% |
| Fixed compensation and benefits | 11.3 | | | 11.0 | | | 3% | | 21.6 | | | 24.2 | | | (11)% |
| Other fixed expenses | 25.4 | | | 32.1 | | | (21)% | | 48.9 | | | 62.0 | | | (21)% |
| Bad debts, net of recoveries | — | | | 0.5 | | | (100)% | | 0.1 | | | 0.8 | | | (88)% |
| Non-variable direct expenses | 36.7 | | | 43.6 | | | (16)% | | 70.6 | | | 87.0 | | | (19)% |
| | | | | | | | | | | |
| Segment income | 33.2 | | | 4.8 | | | 592% | | 61.9 | | | 0.6 | | | n/m |
Allocation of overhead costs (1) | 12.0 | | | — | | | n/m | | 23.5 | | | — | | | n/m |
| Segment income, less allocation of overhead costs | $ | 21.2 | | | $ | 4.8 | | | n/m | | $ | 38.4 | | | $ | 0.6 | | | n/m |
| | | | | | | | | | | | | | |
| (1) | Includes an allocation of certain overhead costs to our operating segments as noted above for the three and six months ended March 31, 2024. These allocations will be provided on an ongoing basis, but they have not been calculated for previously reported periods. |
| | | | |
| | | | | | | | | | | | | | | | | | | | | | | | | | | | | | | | | | | |
| Three Months Ended March 31, | | Six Months Ended March 31, |
| 2024 | | 2023 | | % Change | | 2024 | | 2023 | | % Change |
| Operating Revenues (in millions): | | | | | | | | | | | |
| Securities | $ | 25.8 | | | $ | 22.4 | | | 15% | | $ | 48.4 | | | $ | 43.5 | | | 11% |
| FX / CFD contracts | 72.7 | | | 52.5 | | | 38% | | 139.3 | | | 92.1 | | | 51% |
| Physical contracts | 2.0 | | | 2.2 | | | (9)% | | 2.8 | | | 8.2 | | | (66)% |
| Interest / fees earned on client balances | 0.7 | | | 0.8 | | | (13)% | | 1.4 | | | 1.6 | | | (13)% |
| Other | 0.8 | | | 0.7 | | | 14% | | 2.6 | | | 3.7 | | | (30)% |
| $ | 102.0 | | | $ | 78.6 | | | 30% | | $ | 194.5 | | | $ | 149.1 | | | 30% |
| | | | | | | | | | | |
| Volumes and Other Select Data: | | |
| FX / CFD contracts ADV (millions) | $ | 6,388 | | | $ | 8,411 | | | (24)% | | $ | 6,668 | | | $ | 8,186 | | | (19)% |
| FX / CFD contracts RPM | $ | 177 | | | $ | 97 | | | 82% | | $ | 164 | | | $ | 90 | | | 82% |
Three Months Ended March 31, 2024 Compared to Three Months Ended March 31, 2023
Operating revenues increased $23.4 million, or 30%, to $102.0 million in the three months ended March 31, 2024 compared to $78.6 million in the three months ended March 31, 2023. Net operating revenues increased $23.5 million, or 46%, to $74.3 million in the three months ended March 31, 2024 compared to $50.8 million in the three months ended March 31, 2023.
Operating revenues derived from FX/CFD contracts increased $20.2 million, or 38%, to $72.7 million in the three months ended March 31, 2024 compared to $52.5 million in the three months ended March 31, 2023 principally driven by an 82%
increase in FX/CFD contracts RPM, which was principally driven by increased client activity in gold, oil and index contracts, which typically have a higher RPM than do FX contracts. This increase partially offset by a 24% decline in FX/CFD contracts ADV, primarily related to a decline in client activity in FX markets, compared to the three months ended March 31, 2023.
Operating revenues derived from securities transactions, which relate to our independent wealth management activities, increased $3.4 million to $25.8 million in the three months ended March 31, 2024 compared to $22.4 million in the three months ended March 31, 2023.
Operating revenues derived from physical contracts declined $0.2 million, or 9% to $2.0 million in the three months ended March 31, 2024 compared to $2.2 million in the three months ended March 31, 2023. Operating revenues derived from physical contracts were unfavorably impacted during the three months ended March 31, 2024, by losses on derivative positions of $0.6 million, related to physical inventories held at the Derivative Voice Brokerage business which will continuelower of cost or net realizable value.
Interest and fee income earned on client balances was $0.7 million in the three months ended March 31, 2024 as compared to be expensed through$0.8 million in the end of fiscal 2018 based upon the employees’ continued employment. three months ended March 31, 2023.
Variable expenses, excluding interest, as a percentage of operating revenues were 70%30% in the first quarterthree months ended March 31, 2024 compared to 71%37% in the prior year.three months ended March 31, 2023, principally due to the increase in operating revenues derived from FX / CFD contracts which typically incur a lower relative percentage of variable expenses than do our other business lines.
Segment income increased $28.4 million to $33.2 million in the three months ended March 31, 2024 compared to $4.8 million in the three months ended March 31, 2023, principally due to the increase in net operating revenues noted above, as well as a $6.9 million decline in non-variable direct expenses compared to the three months ended March 31, 2023. The decline in non-variable direct expenses was primarily a result of a $2.6 million decrease in amortization, as certain intangibles, recognized as part the acquisition of Gain Capital Holdings, Inc. in fiscal 2020, became fully amortized during fiscal 2023, a $1.8 million decline in selling and marketing, and a $0.5 million decrease in bad debts as compared to the three months ended March 31, 2023. For the three months ended March 31, 2024, we have calculated an allocation for overhead costs of $12.0 million for the Retail segment as described in the introduction to Total Segment Results above. An allocation of overhead costs will be provided on an ongoing basis, but we have not calculated historical comparable information.
Six Months Ended March 31, 2024 Compared to Six Months Ended March 31, 2023
Operating revenues increased $45.4 million, or 30%, to $194.5 million in the six months ended March 31, 2024 compared to $149.1 million in the six months ended March 31, 2023. Net operating revenues increased $46.6 million, or 49%, to $141.3 million in the six months ended March 31, 2024 compared to $94.7 million in the six months ended March 31, 2023.
Operating revenues derived from FX/CFD contracts increased $47.2 million, or 51%, to $139.3 million, primarily as a result of an 82% increase in FX/CFD contracts RPM, which was partially offset by a 19% decline in FX/CFD contracts ADV compared to the six months ended March 31, 2023.
Operating revenues derived from securities transactions, which are related to our independent wealth management activities, increased $4.9 million, or 11%, to $48.4 million in the six months ended March 31, 2024 compared to $43.5 million in the six months ended March 31, 2023.
Operating revenues derived from physical contracts declined $5.4 million, or 66%, to $2.8 million in the six months ended March 31, 2024 compared to $8.2 million in the six months ended March 31, 2023. Operating revenues derived from physical transactions during the six months ended March 31, 2024 were unfavorably impacted by losses on precious metals related derivative positions of $0.8 million, related to physical inventories held at the lower of cost or net realizable value. Operating revenues during the six months ended March 31, 2023 were unfavorably impacted by losses on derivative positions of $0.3 million, related to physical inventories held at the lower of cost or net realizable value.
Interest and fee income earned on client balances was $1.4 million in the six months ended March 31, 2024 as compared to $1.6 million in the six months ended March 31, 2023.
Variable expenses, excluding interest, as a percentage of operating revenues were 30% in the six months ended March 31, 2024 compared to 40% in the six months ended March 31, 2023, principally due to the increase in operating revenues derived from FX / CFD contracts which typically incur a lower relative percentage of variable expenses than do our other business lines.
Segment income increased $61.3 million, to $61.9 million in the six months ended March 31, 2024 compared to $0.6 million in the six months ended March 31, 2023, principally due to the increase in net operating revenues noted above as well as a $16.4 million, or 19%, decline in non-variable direct expenses, compared to the six months ended March 31, 2023. The decline in non-variable direct expenses was principally the result of a $5.3 million decline in depreciation and amortization, as certain
intangibles, recognized as part the acquisition of Gain Capital Holdings, Inc. in fiscal 2020, became fully amortized during fiscal 2023, a $4.1 million decline in direct selling and marketing costs, a $2.6 million decline in fixed compensation and benefits, a $2.7 million decrease in allocated costs from our centralized marketing department, and a $0.7 million decrease in bad debts as compared to the six months ended March 31, 2023.
For the six months ended March 31, 2024, we have calculated an allocation for overhead costs of $23.5 million for the Retail segment as described in the introduction to Total Segment Results above. An allocation of overhead costs will be provided on an ongoing basis, but we have not calculated historical comparable information.
Payments
We provide customized foreign exchange and treasury services to banks and commercial businesses, charities, non-governmental organizations, as well as government organizations. We provide transparent pricing and offer payments services in more than 180 countries and 140 currencies, which we believe is more than any other payments solutions provider.
The tables below present the financial performance, a disaggregation of operating revenues, and select operating data and metrics used by management in evaluating the performance of the Payments segment for the periods indicated.
| | | | | | | | | | | | | | | | | | | | | | | | | | | | | | | | | | | |
| Three Months Ended March 31, | | Six Months Ended March 31, |
| (in millions) | 2024 | | 2023 | | % Change | | 2024 | | 2023 | | % Change |
| Revenues: | | | | | | | | | | | |
| Sales of physical commodities | $ | — | | | $ | — | | | —% | | $ | — | | | $ | — | | | —% |
| Principal gains, net | 46.5 | | | 46.7 | | | —% | | 104.0 | | | 99.3 | | | 5% |
| Commission and clearing fees | 1.4 | | | 1.8 | | | (22)% | | 2.9 | | | 3.4 | | | (15)% |
| Consulting, management, account fees | 0.8 | | | 0.8 | | | —% | | 1.7 | | | 1.8 | | | (6)% |
| Interest income | 0.6 | | | 0.5 | | | 20% | | 1.3 | | | 0.7 | | | 86% |
| Total revenues | 49.3 | | | 49.8 | | | (1)% | | 109.9 | | | 105.2 | | | 4% |
| Cost of sales of physical commodities | — | | | — | | | —% | | — | | | — | | | —% |
| Operating revenues | 49.3 | | | 49.8 | | | (1)% | | 109.9 | | | 105.2 | | | 4% |
| Transaction-based clearing expenses | 1.7 | | | 1.8 | | | (6)% | | 3.5 | | | 3.4 | | | 3% |
| Introducing broker commissions | 0.7 | | | 0.5 | | | 40% | | 1.3 | | | 1.0 | | | 30% |
| Interest expense | 0.1 | | | 0.1 | | | —% | | 0.1 | | | 0.1 | | | —% |
| Net operating revenues | 46.8 | | | 47.4 | | | (1)% | | 105.0 | | | 100.7 | | | 4% |
| Variable compensation and benefits | 9.5 | | | 9.3 | | | 2% | | 20.1 | | | 20.5 | | | (2)% |
| Net contribution | 37.3 | | | 38.1 | | | (2)% | | 84.9 | | | 80.2 | | | 6% |
| Fixed compensation and benefits | 7.3 | | | 17.6 | | | (59)% | | 14.6 | | | 23.1 | | | (37)% |
| Other fixed expenses | 4.5 | | | 4.6 | | | (2)% | | 9.7 | | | 8.9 | | | 9% |
| Bad debts | 0.9 | | | — | | | n/m | | 1.0 | | | — | | | n/m |
| Total non-variable direct expenses | 12.7 | | | 22.2 | | | (43)% | | 25.3 | | | 32.0 | | | (21)% |
| Segment income | 24.6 | | | 15.9 | | | 55% | | 59.6 | | | 48.2 | | | 24% |
Allocation of overhead costs (1) | 5.2 | | | — | | | n/m | | 10.3 | | | — | | | n/m |
| Segment income, less allocation of overhead costs | $ | 19.4 | | | $ | 15.9 | | | n/m | | $ | 49.3 | | | $ | 48.2 | | | n/m |
| | | | | | | | | | | | | | |
| (1) | Includes an allocation of certain overhead costs to our operating segments as noted above for the three and six months ended March 31, 2024. These allocations will be provided on an ongoing basis but have not been calculated for comparable periods. |
| | | | |
| | | | | | | | | | | | | | | | | | | | | | | | | | | | | | | | | | | |
| Three Months Ended March 31, | | Six Months Ended March 31, |
| 2024 | | 2023 | | % Change | | 2024 | | 2023 | | % Change |
| Operating Revenues (in millions): | | | | | | | | | | | |
| Payments | $ | 48.4 | | | $ | 48.5 | | | —% | | $ | 107.8 | | | $ | 102.7 | | | 5% |
| Other | 0.9 | | | 1.3 | | | (31)% | | 2.1 | | | 2.5 | | | (16)% |
| $ | 49.3 | | | $ | 49.8 | | | (1)% | | $ | 109.9 | | | $ | 105.2 | | | 4% |
| | | | | | | | | | | |
| Volumes and Other Select Data: | | |
| Payments ADV (millions) | $ | 64 | | | $ | 65 | | | (2)% | | $ | 69 | | | $ | 70 | | | (1)% |
| Payments RPM | $ | 12,327 | | | $ | 11,916 | | | 3% | | $ | 12,453 | | | $ | 11,655 | | | 7% |
Three Months Ended March 31, 2024 Compared to Three Months Ended March 31, 2023
Operating revenues decreased $0.5 million, or 1%, to $49.3 million in the three months ended March 31, 2024 compared to $49.8 million in the three months ended March 31, 2023. Net operating revenues decreased $0.6 million, or 1%, to $46.8 million in the three months ended March 31, 2024 compared to $47.4 million in the three months ended March 31, 2023.
The decline in operating revenues was principally due to a 2% decrease in the average daily notional payment volume, which was partially offset by a 3% increase in the RPM traded as compared to the three months ended March 31, 2023.
Variable expenses, excluding interest, expressed as a percentage of operating revenues were 24% in the three months ended March 31, 2024 compared to 23% in the three months ended March 31, 2023.
Segment income increased $8.7 million, or 55%, to $24.6 million in the three months ended March 31, 2024 compared to $15.9 million in the three months ended March 31, 2023. This was principally driven by a $9.5 million decline in non-variable direct expenses, primarily as a result of a $10.3 million decline in fixed compensation and benefits, as the three months ended March 31, 2023 included a $10.0 million severance charge related to a reorganization of the business.
For the three months ended March 31, 2024, we have calculated an allocation for overhead costs of $5.2 million for the Payments segment as described in the introduction to Total Segment Results above. An allocation of overhead costs will be provided on an ongoing basis, but we have not calculated historical comparable information.
Six Months Ended March 31, 2024 Compared to Six Months Ended March 31, 2023
Operating revenues increased $4.7 million, or 4%, to $109.9 million in the six months ended March 31, 2024 compared to $105.2 million in the six months ended March 31, 2023. Net operating revenues increased $4.3 million, or 4%, to $105.0 million in the six months ended March 31, 2024 compared to $100.7 million in the six months ended March 31, 2023.
The increase in operating revenues was primarily driven by a 7% increase in the RPM traded compared to the six months ended March 31, 2023, which was partially offset by a 1% decline in the average daily volume.
Variable expenses, excluding interest, expressed as a percentage of operating revenues were 23% in the six months ended March 31, 2024 as compared to 24% in the six months ended March 31, 2023.
Segment income increased $11.4 million, or 24%, to $59.6 million in the six months ended March 31, 2024 compared to $48.2 million in the six months ended March 31, 2023. This was driven by the increase in net operating revenues noted above as well as a $6.7 million decline in non-variable direct expenses. The decline in non-variable direct expenses was primarily driven by a $8.5 million decrease in fixed compensation and benefits as the six months ended March 31, 2023 included $10.0 million in severance related to a reorganization of the business.
For the six months ended March 31, 2024, we have calculated an allocation for overhead costs of $10.3 million for the Payments segment as described in the introduction to Total Segment Results above. An allocation of overhead costs will be provided on an ongoing basis, but we have not calculated historical comparable information.
Overhead Costs and Expenses
We incur overhead costs and expenses, including certain shared services such as information technology, accounting and treasury, credit and risk, legal and compliance, and human resources and other activities. The following table provides information regarding our overhead costs and expenses.
In addition, for the three and six months ended March 31, 2024, the table provides information regarding the allocation of a portion of these costs to the aforementioned operating segments. The allocation of overhead costs to operating segments includes costs associated with compliance, technology, and credit and risk costs. The share of allocated costs is based on resources consumed by the relevant businesses. In addition, the allocation of human resources and occupancy costs is principally based on employee costs within the relevant businesses.
| | | | | | | | | | | | | | | | | | | | | | | | | | | | | | | | | | | |
| Three Months Ended March 31, | | Six Months Ended March 31, |
| (in millions) | 2024 | | 2023 | | % Change | | 2024 | | 2023 | | % Change |
| Compensation and benefits: | | | | | | | | | | | |
| Variable compensation and benefits | $ | 16.4 | | | $ | 16.0 | | | 2% | | $ | 35.8 | | | $ | 31.5 | | | 14% |
| Fixed compensation and benefits | 48.7 | | | 43.7 | | | 11% | | 89.3 | | | 73.6 | | | 21% |
| 65.1 | | | 59.7 | | | 9% | | 125.1 | | | 105.1 | | | 19% |
| Other expenses: | | | | | | | | | | | |
| Occupancy and equipment rental | 13.1 | | | 10.4 | | | 26% | | 20.4 | | | 19.2 | | | 6% |
| Non-trading technology and support | 13.6 | | | 11.3 | | | 20% | | 26.6 | | | 20.9 | | | 27% |
| Professional fees | 8.3 | | | 4.7 | | | 77% | | 15.8 | | | 12.5 | | | 26% |
| Depreciation and amortization | 6.1 | | | 5.7 | | | 7% | | 11.6 | | | 11.4 | | | 2% |
| Communications | 1.6 | | | 1.5 | | | 7% | | 3.2 | | | 3.1 | | | 3% |
| Selling and marketing | 4.3 | | | 1.1 | | | 291% | | 5.6 | | | 2.0 | | | 180% |
| Trading systems and market information | 1.5 | | | 1.6 | | | (6)% | | 3.2 | | | 3.7 | | | (14)% |
| Travel and business development | 2.1 | | | 1.0 | | | 110% | | 3.8 | | | 2.6 | | | 46% |
| | | | | | | | | | | |
| Other | 3.9 | | | 3.1 | | | 26% | | 9.1 | | | 9.3 | | | (2)% |
| 54.5 | | | 40.4 | | | 35% | | 99.3 | | | 84.7 | | | 17% |
| Overhead costs and expenses | 119.6 | | | 100.1 | | | 19% | | 224.4 | | | 189.8 | | | 18% |
Allocation of overhead costs (1) | (39.4) | | | — | | | n/m | | (77.6) | | | — | | | n/m |
| Overhead costs and expense, net of allocation to operating segments | $ | 80.2 | | | $ | 100.1 | | | n/m | | $ | 146.8 | | | $ | 189.8 | | | n/m |
| | | | | | | | | | | | | | |
| (1) | Includes an allocation of certain overhead costs to our operating segments as noted above for the three and six months ended March 31, 2024. The allocations will be provided on an ongoing basis but have not been calculated for comparable periods. |
| | | | |
Three Months Ended March 31, 2024 Compared to Three Months Ended March 31, 2023
Overhead costs and expenses increased $19.5 million, or 19%, to $119.6 million in the three months ended March 31, 2024 compared to $100.1 million in the three months ended March 31, 2023. Compensation and benefits increased $5.4 million, or 9%, to $65.1 million in the three months ended March 31, 2024 compared to $59.7 million in the three months ended March 31, 2023.
The increase in fixed compensation and benefits was principally a result of hiring among our IT, compliance, and human resource departments, principally due to company growth. Average administrative headcount increased 16% in the three months ended March 31, 2024 compared to the three months ended March 31, 2023. Fixed compensation and benefits for the three months ended March 31, 2023 included $3.1 million in accelerated share-based compensation for employee departures that were related to retirements and certain business reorganizations.
Other non-compensation expenses increased $14.1 million, to $54.5 million, in the three months ended March 31, 2024. Occupancy and equipment rental costs increased $2.7 million, principally due to additional office space acquired in London and India, as well as certain accelerated charges incurred as we consolidate office space in London to support our current and anticipated future growth.
Non-trading technology and support increased $2.3 million, principally due to higher non-trading software maintenance and support costs related to various IT systems.
Professional fees increased $3.6 million, principally due to higher legal and consulting fees in our IT Development department.
Selling and marketing costs increased $3.2 million, principally due to costs related to our global sales summit, held in February 2024, which occurs on a once-every-two years rotation.
Travel and business development increased $1.1 million, principally due to higher transportation and lodging costs also related to the previously mentioned global sales summit.
Six Months Ended March 31, 2024 Compared to Six Months Ended March 31, 2023
On a gross basis, overhead costs and other expenses increased $34.6 million, or 18%, to $224.4 million in the six months ended March 31, 2024 compared to $189.8 million in the six months ended March 31, 2023. Compensation and benefits increased $20.0 million, or 19%, to $125.1 million in the six months ended March 31, 2024 compared to $105.1 million in the six months ended March 31, 2023.
The increase in fixed compensation and benefits was principally a result of annual merit increases along with increased headcount among our IT, compliance, and human resource departments. Also, there was a decrease in employee-elected deferred incentive, which is exchanged for restricted stock that will be amortized over a thirty-six month period following the grant date. Share-based compensation related to stock option expense increased principally due to the issuance of additional stock option awards during the six months ended March 31, 2024. Also, the six months ended March 31, 2023 included accelerated share-based compensation for employee departures that were related to retirements and certain business reorganizations. The increase in variable compensation is principally driven by the increased headcount.
Gross other non-compensation expenses increased $14.6 million, or 17%, to $99.3 million in the six months ended March 31, 2024 compared to $84.7 million in the six months ended March 31, 2023.
Non-trading technology and support increased $5.7 million, principally due to higher non-trading software maintenance and support costs related to various IT systems.
Professional fees increased $3.3 million, principally due to higher legal and consulting fees within our technology departments.
Selling and marketing costs increased $3.6 million, principally due to costs related to our global sales summit, held in February 2024, which occurs on a once-every-two years rotation.
Travel and business development increased $1.2 million, principally due to higher transportation and lodging costs related to the previously mentioned global sales summit.
Liquidity, Financial Condition and Capital Resources
Overview
Liquidity is defined as our ability to generate sufficient amounts of cashfunding to meet all of our cash needs. Liquidity is of critical importance to us and imperative to maintainmaintaining our operations on a daily basis. Our seniorSenior management establishes liquidity and capital policies, which we monitor and monitors liquidity on a daily basis. Senior management reviews business performance relative to these policies and monitors the availability of ourreview for funding from both internal and external sources of financing.sources. We continuously evaluate how effectively our policies support our business operations, issuing debt and equity securities, and accessing committed credit facilities. We plan to finance our future operating liquidity and regulatory capital needs in a manner consistent with our past practice. Liquidity and capital matters are reported regularly to our boardBoard of directors.Directors.
INTL FCStoneRegulatory
StoneX Financial Inc. is registered as a broker-dealer with the Securities and Exchange Commission (“SEC”) and is a member of both the Financial Industry Regulatory Authority (“FINRA”) and the Municipal Securities Rulemaking Board (“MSRB”). In addition, INTL FCStoneStoneX Financial Inc. is registered as a futures commission merchant with the CFTC and NFA, and a member of various commodities and futures exchanges in the U.S. and abroad. INTL FCStoneStoneX Financial Inc. has a responsibility to meet margin calls at all exchanges on a daily basis, and even on an intra-day basis, if necessary.deemed necessary by relevant regulators or exchanges. We require our customersclients to make any required margin deposits the next business day, and we require our largest customersclients to make intra-day margin payments during periods of significant price movement. Margin required to be posted to the exchanges is a function of theour clients’ net open positions of our customers and the required margin per contract. INTL FCStoneStoneX Financial Inc. is subject to minimum capital requirements under
Section 4(f)(b) of the Commodity Exchange Act, Part 1.17 of the rules and regulations of the CFTC and the SEC Uniform Net Capital Rule 15c3-1 under the Securities Exchange Act of 1934. These rules specify the minimum amount of capital that must be available to support our customers’ open trading positions, including the amount of assets that INTL FCStoneStoneX Financial must maintain in relatively liquid form, and are designed to measure general financial integrity and liquidity. INTL FCStone FinancialInc. is also subject to the Rule 15c3-3 of the Securities Exchange Act of 1934, as amended (“Customer Protection Rule”).
INTL FCStoneGain Capital Group, LLC is registered as both a futures commission merchant and registered foreign exchange dealer, subject to minimum capital requirements under Section 4(f)(b) of the Commodity Exchange Act, Part 1.17 of the rules and regulations of the CFTC and NFA Financial Requirements, Sections 1 and 11.
StoneX Markets LLC is a CFTC registered swap dealer, whose business is overseen by the NFA. The CFTC imposes rules over net capital requirements, as well as the exchange of initial margin between registered swap dealers and certain counterparties.
These rules specify the minimum amount of capital that must be available to support our clients’ account balances and open trading positions, including the amount of assets that StoneX Financial Inc., Gain Capital Group, LLC and StoneX Markets LLC must maintain in relatively liquid form. Further, the rules are designed to maintain general financial integrity and liquidity.
StoneX Financial Ltd is regulated by the Financial Conduct Authority (“FCA”), the regulator of investor firms in the U.K. as a MiFID investment firm under U.K. law, and is subject to regulations which impose regulatory capital requirements. In Europe, our regulated subsidiaries are subject to E.U. regulation. Across the U.K. regulated subsidiary,and E.U., the respective transpositions of the Market Abuse Regulation, and the General Data Protection Regulation, also apply. StoneX Financial Ltd is a member of various commodities and futures exchanges in the U.K. and Europe and has the responsibility to meet margin calls at all exchanges on a daily basis and intra-day basis, as necessary. StoneX Financial Ltd is required to be compliant with the U.K.’s Individual Liquidity Adequacy Standards (“ILAS”).‘MIFIDPRU’ regulation. To comply with these standards, we have implemented daily liquidity procedures, conduct periodic reviews of liquidity by stressed scenarios, and have createdare required to maintain enough liquidity buffers.for the firm to survive for one year under the appropriate stressed conditions.
Our wholly owned subsidiaries, INTL Custody & Clearing Solutions Inc. (formerly Sterne Agee Clearing, Inc.The regulations discussed above limit funds available for dividends to us. As a result, we may be unable to access our operating subsidiaries’ funds when we need them.
StoneX Financial Pte. Ltd. is regulated by the Monetary Authority of Singapore (“MAS”) and SA Stone Wealth Management Inc. (formerly Sterne Ageeoperates as an approved holder of a Capital Market Services and a Payments Service License. StoneX Financial Services, Inc.) arePte. Ltd. is subject to the SEC Uniform Net Capital Rule 15c3-1 underrequirements of MAS pursuant to the Securities Exchangeand Futures Act and the Payments Services Act 2019. The regulations include those that govern the treatment of 1934.client money and other assets which under certain circumstances must be segregated from the firm’s own assets.
In addition, in our physical commodities trading, commercial hedging OTC, securities and foreign exchange trading activities, we may be calledrequired upon to meet margin calls with our various trading counterparties based upon the underlying open transactions we have in place with those counterparties.
We continuously review our overall credit and capital needs to ensure that our capital needs to ensure thatdetermine whether our capital base, both stockholders’ equity and debt, as well as available credit facilities can appropriately support the anticipated financing needs of our operating subsidiaries.
As of DecemberMarch 31, 2017,2024, we had total equity capital of $443.2$1,542.6 million, outstanding loans under revolving credit facilities and other payables to lenders of $253.6 million, and $885.9 million outstanding bank loanson our senior secured notes, net of $422.9 million.deferred financing costs.
A substantial portion of our assets are liquid. As of DecemberMarch 31, 2017,2024, approximately 97% of our assets consisted of cash; securities purchased under agreements to resell; securities borrowed; deposits with and receivables from exchange-clearing organizations, broker-dealers, clearing organizations and counterparties; customer receivables,client receivables; marketable financial instruments and investments,investments; and physical commodities inventory. All assets that are not customerclient and counterparty depositsdeposit financed are financed by our equity capital, bank loans, short-term borrowings from financial instruments sold, not yet purchased and under repurchase agreements, securities loaned and other payables.
CustomerClient and Counterparty Credit and Liquidity Risk
Our operations expose us to credit risk of default of our customersclients and counterparties. The risk includes liquidity risk to the extent our customersclients or counterparties are unable to make timely payment of margin or other credit support. These risks expose usWe are indirectly exposed to the financing and liquidity risks of our customersclients and counterparties, including the risks that our customersclients and counterparties may not be able to finance their operations.
As a clearing broker, we act on behalf of our customersclients for all trades consummated on exchanges. We must pay initial and variation margin to the exchanges, on a net basis, before we receive the required payments from our customers.clients. Accordingly, we are responsible for our customers’clients’ obligations with respect to these transactions, which exposes us to significant credit risk. Our customersclients are required to make any required margin deposits the next business day, and we require our largest customersclients to make intra-day margin payments during periods of significant price movement. Our customersclients are requiredobligated to maintain initial margin requirements at the level set by the respective exchanges, but we have the ability to increase the margin requirements for customersclients based on their open positions, trading activity, or market conditions.
WithAs it relates to OTC derivative transactions, we act as a principal, which exposes us to the credit risk of both our customersclients and the counterparties with which we offset our customerclient positions. As with exchange-traded transactions, our OTC transactions require that we meet initial and variation margin payments on behalf of our customersclients before we receive therelated required paymentpayments from our customers.clients. OTC customersclients are required to post sufficient collateral to meet margin requirements based on Value-at-Riskvalue-at-risk models, as well as variation margin requirementrequirements based on the price movement of the commodity or security in which they transact. Our customersclients are required to make any required margin deposits the next business day, and we may require our largest customersclients to make intra-day margin payments during periods of significant price movement. WeIn this business as well, we have the ability to increase the margin requirements for customersclients based on their open positions, trading activity, or market conditions. On a limited basis, we provide credit thresholds to certain customers,clients, based on internal evaluations and monitoring of customerclient creditworthiness.
In addition, with OTC transactions, we are at risk that a counterparty will fail to meet its obligations to us when due. We would then be exposed to the risk that the settlement of a transaction which is due a customerclient will not be collected from the respective
counterparty with which the transaction was offset. We continuously monitor the credit quality of our respective counterparties and mark our positions held with each counterparty to market on a daily basis.
We enter into securities purchased under agreements to resell, securities sold under agreements to repurchase, securities borrowed and securities loaned transactions to, among other things, finance financial instruments, acquire securities to cover
short positions, acquire securities for settlement, and to accommodate counterparties’ needs. In connection with these agreements and transactions, it is our policy to receive or pledge cash or securities to adequately collateralize such agreements and transactions in accordance with general industry guidelines and practices. The value of the collateral is valued daily and we may require counterparties to deposit additional collateral or return collateral pledged, when appropriate.
In our Physical Commodities business we act as a principal, which exposes us to the credit risk of both our customers and our suppliers with which we offset our customer positions as well as provide financing to commercial commodity-related companies against physical inventories. We mitigate this risk by securing warehouse receipts and or insurance against potential default by either party. Information related to bad debt expense for the three months ended December 31, 2017 and 2016 can be found in Note 5 of the Condensed Consolidated Financial Statements.
Primary Sources and Uses of Cash
Our cash and cash equivalents and client cash and securities held for clients are held at banks, deposits at liquidity providers, investments in money market funds that invest in highly liquid investment grade securities including U.S. treasury bills, as well as investments in U.S. treasury bills. In general, we believe all of our investments and deposits are of high credit quality and we have more than adequate liquidity to conduct our businesses.
Our assets and liabilities may vary significantly from period to period due to changing customerclient requirements, economic and market conditions, and our growth. Our total assets as of DecemberMarch 31, 20172024 and September 30, 2017,2023, were $6.8$25.7 billion and $6.2$21.9 billion, respectively. Our operating activities generate or utilize cash as a result of net income or loss earned or incurred during each period and fluctuations in our assets and liabilities. The most significant fluctuations arise from changes in the level of customerclient activity, commodities prices, and changes in the balances of financial instruments and commodities inventory. INTL FCStoneStoneX Financial Inc. and INTL FCStoneStoneX Financial Ltd occasionally utilize their margin line credit facilities, on a short-term basis, to meet intraday settlements with the commodity exchanges prior to collecting margin funds from their customers.clients.
The majority of the assets of INTL FCStoneStoneX Financial Inc., StoneX Financial Ltd, StoneX Financial Pte. Ltd, StoneX Markets LLC, and INTL FCStone LtdGain Capital Group, LLC are restricted from being transferred to its parentus or other affiliates due to specific regulatory requirements. This restriction has no current impact on our ability to meet our cash obligations, and no such impact is expected in the future.
We have liquidity and funding policies and processes in place that are intended to maintain significantsufficient flexibility to address both company-specific and industry liquidity needs. The majority of our excess funds areis held with high qualityhigh-quality institutions, under highly-liquid reverse repurchase agreements, U.S. government obligations, interest earning cash deposits and AA-rated money market investments.
We do not hold any direct investmentsintend to distribute earnings of our foreign subsidiaries in a taxable manner, and therefore intend to limit distributions to earnings previously taxed in the general obligationsU.S., or earnings that would qualify for the 100 percent dividends received deduction, and earnings that would not result in any significant foreign taxes. We repatriated $80.0 million and $8.6 million for the six months ended March 31, 2024 and 2023, respectively, of any sovereign nations.earnings previously taxed in the U.S., resulting in no significant incremental taxes. Therefore, the Company has not recognized a deferred tax liability on its investment in foreign subsidiaries.
Senior Secured Notes
On March 1, 2024, we issued $550 million in aggregate principal amount of our 7.875% Senior Secured Notes due 2031 (the “Notes due 2031”). The Notes due 2031 are fully and unconditionally guaranteed, jointly and severally, on a senior secured second lien basis, by certain subsidiaries of the Company that guarantee the Company’s senior committed credit facility and certain of its domestic subsidiaries.
The Notes due 2031 will mature on March 1, 2031. Interest on the Notes accrues at a rate of 7.875% per annum and is payable semiannually in arrears on September 1 and March 1 of each year. We incurred debt issuance costs of $7.9 million in connection with the issuance of the Notes due 2031, which are being amortized over the term of the notes.
In June 2020, we issued $350 million in aggregate principal amount of our 8.625% Senior Secured Notes due 2025 (the “Notes due 2025”) at the offering price of 98.5% of the aggregate principal amount. The Notes due 2025 are fully and unconditionally guaranteed, jointly and severally, on a senior secured second lien basis, by certain subsidiaries of the Company that guarantee the Company’s senior committed credit facility and certain of its domestic subsidiaries.
The Notes due 2025 are scheduled to mature on June 15, 2025. Interest on the Notes accrues at a rate of 8.625% per annum and is payable semiannually in arrears on June 15 and December 15 of each year. We incurred debt issuance costs of $9.5 million in connection with the issuance of the Notes due 2025, which are being amortized over the term of the Notes under the effective interest method. We have had the right, since June 15, 2022, to redeem the Notes due 2025, in whole or in part, at the redemption prices set forth in the indenture governing the Notes due 2025.
In conjunction with the March 1, 2024 issuance of the Notes due 2031, discussed above, we entered into an in-substance defeasance of the Notes due 2025, which included placing $363.0 million of immediately available funds, representing the aggregate principal amount outstanding and all unpaid interest (accrued and yet to be accrued) through, but not including, June 15, 2024, into an escrow account designated to hold and distribute the same amount on the intended redemption date of June 15, 2024. We have classified these funds in escrow as restricted cash as of March 31, 2024 because the funding is irrevocable and we do not have the ability to withdraw the funds.
Committed Credit Facilities
As of DecemberMarch 31, 2017,2024, we had $277.2 million in undistributed foreign earnings. As a result of the Tax Reform, the Company now has the ability to repatriate these funds tax free. While the majority of these undistributed earnings have been reinvested in our foreign regulated subsidiaries, in particular our London-based subsidiary INTL FCStone Ltd., we intend to repatriate available funds to our U.S. operations which will be placed into our central treasury, and available for funding.
As of December 31, 2017, $10.1 million of financial instruments owned and $10.2 million of financial instruments sold, not yet purchased, are exchangeable foreign equities and ADRs.
As of December 31, 2017, we had fourfive committed bank credit facilities, totaling $532.0$1,200.0 million, of which $350.0$146.0 million was outstanding. Additional information regarding ourthe committed bank credit facilities can be found in Note 9 of the Condensed Consolidated Financial Statements. The credit facilities include:
•A three-yearfirst-lien senior secured syndicated loan facility principally committed until March 18, 2019,April 21, 2026, under which INTL FCStone Inc.$500.0 million is entitledavailable to borrow up to $262.0us for general working capital requirements and capital expenditures. The maturity date is April 21, 2025 for one lender representing $17.5 million subject to certain terms and conditions of the facility commitment.
•An unsecured line of credit agreement. The loan proceeds are usedcommitted until October 29, 2024, under which $190.0 million is available to our wholly owned subsidiary, StoneX Financial Inc. to provide short-term funding of margin to commodity exchanges as necessary.
•A syndicated borrowing facility committed until July 28, 2024, under which $400.0 million is available to our wholly owned subsidiary, StoneX Commodity Solutions LLC, to finance our working capital needs of uscommodity financing arrangements and certain subsidiaries.commodity repurchase agreements.
•An unsecured syndicated loan facility committed until April 5, 2018,October 12, 2024, under which our subsidiary, INTL FCStoneStoneX Financial Ltd is entitled to borrow up to $75.0$100.0 million, subject to certain terms and conditions of the credit agreement. This facility is intended to provide short-term funding of margin to commodity exchanges as necessary.
A syndicated loan•An unsecured revolving credit facility committed until May 1, 2018,September 6, 2024, under which our subsidiary, FCStone Merchant Services, LLC$10.0 million is entitled to borrow up to $170.0 million, subject to certain terms and conditions of the credit agreement. The loan proceeds are used to finance traditional commodity financing arrangements and commodity repurchase agreements.
An unsecured syndicated loan facility, committed until November 7, 2018, under which our subsidiary, INTL FCStone Ltd is entitled to borrow up to $25.0 million, subject to certain terms and conditions of the credit agreement. This facility is intended to provide short-term funding of margin to commodity exchanges as necessary.
As reflected above, $270.0 million of our committed credit facilities are scheduled to expire within twelve months of this filing. We intend to renew or replace these facilities as they expire, and based on our liquidity position and capital structure, we believe we will be able to do so.
Additionally, we have a secured, uncommitted loan facility, under which our subsidiary, INTL FCStone Financial may borrow up to $50.0 million, collateralized by commodities warehouse receipts, to facilitate U.S. commodity exchange deliveries of its customers, subject to certain terms and conditions of the credit agreement.
We also have a secured uncommitted loan facility, under which our subsidiary, INTL FCStone Ltd may borrow up to approximately $25.0 million, collateralized by commodities warehouse receipts, to facilitate financing of commodities under repurchases agreement services to its customers, subject to certain terms and conditions of the credit agreement.
We also have a secured uncommitted loan facility, under which our subsidiary, INTL FCStone Financial may borrow requested amounts for short term funding of firm and customer margin requirements. The uncommitted maximum amount available to be borrowed is not specified, and all requests our wholly owned subsidiary, StoneX Financial Pte. Ltd. for borrowing are subject to the sole discretion of the lender. The borrowings are secured by first liens on firm owned marketable securities or customer owned securities which have been pledged to us under a clearing arrangement.
In addition, we have a secured uncommitted loan facility under which our subsidiary INTL FCStone Financial may borrow up to $100.0 million for short term funding of firm and customer margin requirements. The borrowings are secured by first liens on firm owned marketable securities or customer owned securities which have been pledged to us under a clearing arrangement.general working capital requirements.
Our facility agreements contain certain financial covenants relating to financial measures on a consolidated basis, as well as on a stand-alone basis for certain stand-alone subsidiary basis,subsidiaries, including minimum tangible net worth, minimum regulatory capital, minimum net unencumbered liquid assets, maximum net loss, minimum fixed charge coverage ratio and maximum funded debt to net worth ratio. Failure to comply with any such covenants could result in the debt becoming payable on demand. As of DecemberMarch 31, 2017,2024, we and our subsidiaries arewere in compliance with all of our financial covenants under the outstanding facilities.
In accordance with required disclosure as part of our first-lien senior secured syndicated loan facility, during the trailing twelve months ended March 31, 2024, interest expense directly attributable to trading activities includes $711.1 million in connection with trading activities conducted as an institutional dealer in fixed income securities, and $51.8 million in connection with securities lending activities. As reflected above, certain of our committed credit facilities are scheduled to expire during the next twelve months following the quarterly period ended March 31, 2024. We intend to renew or replace these facilities as they expire, and based on our liquidity position and capital structure, we believe we will be able to do so.
Uncommitted Credit Facilities
We have access to certain uncommitted financing agreements that support our ordinary course securities and commodities inventories. The agreements are subject to certain borrowing terms and conditions. As of March 31, 2024 and September 30, 2023, the Company had $100.4 million and $55.5 million total borrowings outstanding under these uncommitted credit facilities, respectively.
Other Capital Considerations
Our activities are subject to various significant governmental regulations and capital adequacy requirements, both in the U.S. and overseas. Certain of our other non-U.S. subsidiaries are also subject to capital adequacy requirements promulgated by authorities ofin the countriesinternational jurisdictions in which theywe operate.
Our subsidiaries are in compliance with all of their capital regulatory
requirements as of DecemberMarch 31, 2017.2024. Additional information on theseour subsidiaries subject to significant net capital and minimum net capital requirements can be found in Note 1216 of the Condensed Consolidated Financial Statements.
The Dodd-Frank Act created a comprehensive new regulatory regime governing the OTC and listed derivatives markets and their participants by requiring, among other things: centralized clearing of standardized derivatives (with certain stated exceptions); the trading of clearable derivatives on swap execution facilities or exchanges; and registration and comprehensive regulation of new categories of market participants as “swap dealers” and swap “introducing brokers.” Our subsidiary, INTL FCStoneStoneX Markets LLC, is a provisionallyCFTC registered swap dealer. Some importantdealer, and under these capital rules is subject to a minimum regulatory capital requirement. StoneX Markets LLC has elected to utilize the “bank-based” approach, as reflected in CFTC Rule 23.101(a)(1)(i) to calculate its capital requirements. Under the “bank-based” approach StoneX Markets LLC must satisfy the following capital requirements: Common Equity Tier 1 (“CET1”) capital of at least $20 million; (ii) CET1 equal to at least 6.5% of its risk weighted assets (“RWA”); (iii) CET1, Additional Tier 1, and Tier 2 (collectively, total aggregate Bank Holding Company (“BHC”) capital) equal to at least 8% of its RWA; (iv) total aggregate BHC capital equal to 8% of its uncleared swap margin; and (v) the minimum capital required by NFA. Aggregate BHC capital and the related net capital requirement may fluctuate on a daily basis.
Compliance with this or other swap-related regulatory capital requirements may require us to devote more capital to these businesses or otherwise restructure our operations, such as those settingby combining these businesses with other regulated subsidiaries that must also satisfy regulatory capital requirements. StoneX Markets LLC has faced, and marginmay continue to face, increased costs due to the registration and regulatory requirementshave not been finalized listed above, as may any other of our subsidiaries that may be required to register, or fully implemented, and it is too early to predict with any degree of certainty how we will be affected.may register voluntarily, as a swap dealer and/or swap execution facility.
Cash Flows
We include restricted cash as well as client cash and securities that meet the short-term requirement for cash classification to be segregated for regulatory purposes in our Condensed Consolidated Statements of Cash Flows. We hold a significant amount of U.S. Treasury obligations, which represent investments of client funds or client-owned investments pledged in lieu of cash margin. U.S. Treasury securities held with third-party banks or pledged with exchange-clearing organizations representing investments of client funds or which are held for particular clients in lieu of cash margin are included in the beginning and ending cash balances reconciled on our Condensed Consolidated Statements of Cash Flows to the extent that they have an original or acquired maturity of 90 days or less and, therefore, meet the definition of a segregated cash equivalent. Purchases and sales of U.S. Treasury securities representing investment of clients’ funds and U.S. Treasury securities pledged or redeemed by particular clients in lieu of cash margin are presented as operating uses and sources of cash, respectively, within the operating section of the consolidated statements of cash flows if they have an original or acquired maturity of greater than 90 days. Typically, there is an offsetting use or source of cash related to the change in the payables to clients. However, we will report a use of cash in periods where segregated U.S. Treasury securities that meet the aforementioned definition of a segregated cash equivalent mature and are replaced with U.S. Treasury securities that have original or acquired maturities that are greater than 90 days.
Our cash, andrestricted cash, segregated cash, cash equivalents, increasedand segregated cash equivalents increased by $1,369.5 million from $314.9$6,041.7 million as of September 30, 20172023 to $321.8$7,411.2 million as of DecemberMarch 31, 2017, a2024. During the six months ended March 31, 2024, netincrease of $6.9 million. Net cash of $186.0$936.4 million was used inprovided by operating activities, $3.2$26.1 million was used in investing activities and net cash of $191.0$457.0 million was provided by financing activities.
Net cash provided by financing activities during the six months ended March 31, 2024 included significant inflows related to the Notes due 2031, which resulted in an inflow of which $192.9$542.1 million, was borrowed as well as outflows from lines of credit and increased the amounts payable payables to lenders under loans. Fluctuations in exchange rates increased our cash and cash equivalents by $5.1 million.90 days of $87.4 million.
In the commodities industry,broker-dealer and related trading industries, companies report trading activities in the operating section of the statement of cash flows. Due to the daily price volatility in the commodities market, as well as changes in margin requirements, fluctuations in the balances of deposits held at various exchanges, marketable securities and customerclient commodity accounts may occur from day-to-day. A use of cash, as calculated on the consolidated statement of cash flows, includes unrestricted cash transferred and pledged to the exchanges or guaranteeguaranty funds. These funds are held in interest-bearing deposit accounts at the exchanges, and based on daily exchange requirements, may be withdrawn and returned to unrestricted cash. Additionally, inwithin our unregulated OTC and foreign exchange operations, cash deposits received from customersclients are reflected as cash provided from operations. Subsequent transfer of these cash deposits to counterparties or exchanges to margin their open positions will be reflected as an operating use of cash to the extent the transfer occurs in a different period than the cash deposit was received.
Unrealized gains and losses on open positions revalued at prevailing foreign currency exchange rates are included in trading revenue but have no direct impact on cash flow from operations. Similarly, gains and losses become realized when client transactions are liquidated, though they do not affect cash flow. To some extent, the amount of net deposits made by our clients in any given period is influenced by the impact of gains and losses on our client balances, such that clients may be required to post additional funds to maintain open positions or may choose to withdraw excess funds on open positions.
We continuously evaluate opportunities to expand our business. Investing activities include $3.2included $30.1 million in capital expenditures for property plant and equipment induring the first quartersix months ended March 31, 2024 compared to $3.0$22.5 million in during the prior year. year. Additionally, we expended $1.1 million of net cash on the Company’s acquisitions.
Fluctuations in capital expenditures are primarily due to the timing of purchases of IT equipmentexchange rates increased our cash, segregated cash, cash equivalents and trade system software as well as the timing on leasehold improvement projects.segregated cash equivalents by $2.2 million.
Apart from what has been disclosed above, there are no known trends, events or uncertainties that have had or are likely to have a material impact on our liquidity, financial condition and capital resources. Based upon our current operations, we
believe that cash flows from operations, available cash and available borrowings under our credit facilities will be adequate to meet our future liquidity needs.needs for the following year.
Commitments
Information about our commitments and contingent liabilities is contained in Note 11 of the Condensed Consolidated Financial Statements.
Off Balance Sheet Arrangements
We are party to certain financial instruments with off-balance sheet risk in the normal course of business as a registered securities broker-dealer, futures commission merchant, U.K. based Financial Services Firm,financial services firm, provisionally registered swap dealer and from our market-making and proprietary trading in the foreign exchange and commodities trading activities.and debt securities markets. These financial instruments include futures, forward and foreign exchange contracts, exchange-traded and OTC options, mortgage-backed TBAs,To Be Announced (“TBA”) securities and interest rate swaps. Derivative financial instruments involve varying degrees of off-statement of financial conditionoff-balance sheet market risk whereby changes in the fair values of underlying financial instruments may result in changes in the fair value of the financial instruments in excess of the amounts reflected in the statement of financial condition.Condensed Consolidated Balance Sheets. Exposure to market risk is influenced by a number of factors, including the relationships between the financial instruments and our positions, as well as the volatility and liquidity in the markets in which the financial instruments are traded. The principal risk components of financial instruments include, among other things, interest rate volatility, the duration of the underlying instruments and changes in commodity pricing and foreign exchange rates. We attempt to manage our exposure to market risk through various techniques. Aggregate market limits have been established and market risk measures are routinely monitored against these limits. Derivative contracts are traded along with cash transactions because of the integrated nature of the markets for such products. We manage the risks associated with derivatives on an aggregate basis along with the risks associated with our proprietary trading and market-making activities in cash instruments as part of our firm-wide risk management policies.
A significant portion of these instruments are primarily the execution of orders for commodity futures and options on futures contracts on behalf of our clients, substantially all of which are transacted on a margin basis. Such transactions may expose us to significant credit risk in the event margin requirements are not sufficient to fully cover losses which clients may incur. We control the risks associated with these transactions by requiring clients to maintain margin deposits in compliance with both clearing organization requirements and internal guidelines. We monitor required margin levels daily and, therefore, may require clients to deposit additional collateral or reduce positions when necessary. We also establish contract limits for clients, which are monitored daily. We evaluate each client’s creditworthiness on a case-by-case basis. Clearing, financing, and settlement activities may require us to maintain funds with or pledge securities as collateral with other financial institutions. Generally, these exposures to exchanges are subject to netting of open positions and collateral, while exposures to clients are subject to netting, per the terms of the client agreements, which reduce the exposure to us by permitting receivables and payables with such clients to be offset in the event of a client default. Management believes that the margin deposits held as of March 31, 2024 are adequate to minimize the risk of material loss that could be created by positions held at that time. Additionally, we monitor collateral fair value on a daily basis and adjust collateral levels in the event of excess market exposure. Generally, these exposures to both counterparties and clients are subject to master netting agreements and the terms of the client agreements, which reduce our exposure.
As a broker-dealer in U.S. Treasury obligations, U.S. government agency obligations, agency mortgage-backed obligations, and asset-backed obligations, we are engaged in various securities trading, borrowing and lending activities serving solely institutional counterparties. Our exposure to credit risk associated with the nonperformance of counterparties in fulfilling their contractual obligations pursuant to these securities transactions and market risk associated with the sale of securities not yet purchased can be directly impacted by volatile trading markets which may impair their ability to satisfy outstanding obligations to us. In the event of non-performance and unfavorable market price movements, we may be required to purchase or sell financial instruments, which may result in a loss to us.
We transact OTC and foreign exchange contracts with our clients, and our OTC and foreign exchange trade desks will generally offset the client’s transaction simultaneously with one of our trading counterparties or will offset that transaction with a similar, but not identical, position on the exchange. These unmatched transactions are intended to be short-term in nature and are conducted to facilitate the most effective transaction for our client.
Additionally, we hold options and futures on options contracts resulting from market-making and proprietary trading activities in these product lines. We assist clients in our commodities trading business to protect the value of their future production (precious or base metals) by selling them put options on an OTC basis. We also provide our physical commodities trading business clients with sophisticated option products, including combinations of buying and selling puts and calls. We mitigate our risk by effecting offsetting options with market counterparties or through the purchase or sale of exchange-traded commodities futures. The risk mitigation of offsetting options is not within the documented hedging designation requirements of the Derivatives and Hedging Topic of the ASC.
As part of the activities discussed above, we carry short positions. We sell financial instruments that we do not own, borrow the financial instruments to make good delivery, and therefore are obliged to purchase such financial instruments at a future date in order to return the borrowed financial instruments. We recordedrecord these obligations in the condensed consolidated financial statements as of DecemberMarch 31, 20172024 and September 30, 2017,2023, at fair value of the related financial instruments, totaling $803.3$3,223.0 million and $717.6$3,085.6 million,, respectively. These positions are held to offset the risks related to financial assets owned, and reported in our condensed consolidated balance sheetsCondensed Consolidated Balance Sheets in ‘financialFinancial instruments owned, at fair value’,value and ‘physicalPhysical commodities inventory, net’net. We will incur losses if the fair value of the financial instruments sold, not yet purchased, increases subsequent to DecemberMarch 31, 2017,2024, which might be partially or wholly offset by gains in the value of assets held as of DecemberMarch 31, 2017.2024. The totals of $803.3$3,223.0 million and $717.6$3,085.6 million include a net liability of $249.3$442.4 million and $317.0$288.3 million for derivatives,derivative contracts, including those designated as hedges, based on their fair value as of DecemberMarch 31, 20172024 and September 30, 2017,2023, respectively.
Except as discussedWe do not anticipate non-performance by counterparties in the above theresituations. We have been no material changesa policy of reviewing the credit standing of each counterparty with which we conduct business. We have credit guidelines that limit our current and potential credit exposure to any one counterparty. We administer limits, monitor credit exposure, and periodically review the financial soundness of counterparties. We manage the credit exposure relating to our trading activities in various ways, including entering into collateral arrangements and limiting the duration of exposure. Risk is mitigated in certain cases by closing out transactions and entering into risk reducing transactions.
We are a member of various exchanges that trade and clear futures and option contracts. We are also a member of and provide guaranties to securities clearinghouses and exchanges in connection with client trading activities. Associated with our memberships, we may be required to pay a proportionate share of the financial obligations of another member who may default on its obligations to the off balance sheetexchanges. While the rules governing different exchange memberships vary, in general our guaranty obligations would arise only if the exchange had previously exhausted its resources. In addition, any such guaranty obligation would be apportioned among the other non-defaulting members of the exchange. Our liability under these arrangements discussedis not quantifiable and could exceed the cash and securities we have posted as collateral at the exchanges. However, management believes that the potential for us to be required to make payments under these arrangements is remote. Accordingly, no contingent liability for these arrangements has been recorded in the Management’s DiscussionCondensed Consolidated Balance Sheets as of March 31, 2024 and Analysis of our Annual Report on Form 10-K for the fiscal year ended September 30, 2016.2023.
Effects of Inflation
Because our assets are, to a large extent, liquid in nature, they are not significantly affected by inflation. Increases in our expenses, such as compensation and benefits, transaction-based clearing expenses, occupancy and equipment rental, due tomay result from inflation, and may not be readily recoverable from increasing the prices of our services. While rising interest rates are generally favorable for us, to the extent that inflation has other adverse effects on the financial markets and on the value of the financial instruments held in inventory, it may adversely affect our financial position and results of operations.
Critical Accounting Policies
See our critical accounting policies discussed in the Management’s Discussion and Analysis of the most recent annual reportAnnual Report filed on Form 10-K. There have been no material changes to these policies, except as described below.policies.
DuringOther Accounting Policies
Note 1 to the quarter ended March 31, 2017,Consolidated Financial Statements included within the most recent Annual Report filed on Form 10-K includes our Securities reportable segment established a securities lending business. Securities borrowed and securities loaned are accounted for as collateralized financings. Securities borrowed and securities loaned are recorded at the amount of cash collateral advanced or received. Stock borrowed and stock loaned is reported on a gross basis as wesignificant accounting policies. There have determined that the right of offset does not exist. Interest income and interest expense are recognized over the life of the arrangements.been no material changes to these policies.
Accounting Development Updates
Recently Issued Accounting Pronouncements
In May 2014,October 2021, the Financial Accounting Standards Board (“FASB”) issued Accounting Standards Update (“ASU”) 2014-09, RevenueNo. 2021-08, “Business Combinations (Topic 805): Accounting for Contract Assets and Contract Liabilities from Contracts with Customers (Topic 606)Customers” (“ASU 2021-08”). ASU 2014-09 completes2021-08 requires an acquirer in a business combination to recognize and measure contract assets and contract liabilities from acquired contracts using the joint effort by the FASB and International
Accounting Standards Board (IASB) to improve financial reporting by creating common revenue recognition guidance for GAAP and International Financial Reportingunder Accounting Standards (IFRS). In March 2016, the FASB issued ASU 2016-08, “RevenueCodification Topic 606, Revenue from ContractsContacts with Customers, (Topic 606): Principal versus Agent Considerations (Reporting Revenue Gross versus Net).” ASU 2016-08 clarifiesin order to recognize contract liabilities in alignment with the implementation guidance on principal versus agent considerations. In April 2016, the FASB issued ASU 2016-10, “Revenue from Contracts with Customers (Topic 606): Identifying Performance Obligations and Licensing.” ASU 2016-10 clarifies the implementation guidance on identifyingdefinition of performance obligations. These ASUs apply to all companies that enter into contracts with customers to transfer goods or services. These ASUs areThe standard is effective for public entities for interim and annual reporting periodsfiscal years beginning after December 15, 2017.2022, including
interim periods within those fiscal years, which means that it will be effective for our fiscal year beginning October 1, 2023. Early adoption is permitted only as of annual reporting periods beginning after December 15, 2016, including interim periods within that reporting period. The Company expects to adopt this guidance starting with the first quarter of fiscal year 2019. Entitiespermitted. Adopting ASU 2021-08 will not have the choice to apply these ASUs either retrospectively to each reporting period presented or by recognizing the cumulative effect of applying these standards at the date of initial application and not adjusting comparative information. The Company plans to adopt the new standard using the modified retrospective method which will result in a cumulative effect adjustment as of the date of adoption. By selecting this adoption method, the Company will disclose the amount, if any, by which eachsignificant impact on our financial statement line item is affected by the standard in the current reporting period as compared with the guidance that was in effect before adoption. Our implementation efforts include identifying revenues and costs within the scope of the ASU, reviewing contracts, and analyzing any changes to its existing revenue recognition policies. As a result of the initial evaluation performed, the Company does not expect that there will be material changes to the timing of revenue, but do anticipate certain changes to the classification of revenue in the consolidated income statements. The Company also expects additional disclosures to be provided in our consolidated financial statements after adoption of the new standard. The Company is continuing to assess the impact of the new standard as we progress through the implementation process and as industry interpretations are resolved.
In February 2016,December 2023, the FASB issued ASU No. 2016-02, Leases2023-09, Income Taxes (Topic 842)740): Improvements to Income Tax Disclosures (“ASU 2023-09”), which supersedes ASC 840, Leases. The Company will adopt this guidance starting with the first quarter of fiscal year 2020 using a modified retrospective transition approach. This accounting update will require the Company asto disclose specified additional information in its income tax rate reconciliation and provide additional information for reconciling items that meet a lesseequantitative threshold. ASU 2023-09 will also require the Company to recognizedisaggregate its income taxes paid disclosure by federal, state and foreign taxes, with further disaggregation required for significant individual jurisdictions. ASU 2023-09 is effective for the Company’s fiscal year ending September 30, 2026. Early adoption is permitted. The guidance allows for adoption using either a prospective or retrospective transition method. We are currently evaluating the impact that adopting this guidance will have on our disclosures.
In November 2023, the consolidated balance sheet all leases with terms exceeding oneFASB issued ASU No. 2023-07, Segment Reporting (Topic 280): Improvements to Reportable Segment Disclosures (“ASU 2023-07”), which will require the Company to disclose segment expenses that are significant and regularly provided to the Company’s chief operating decision maker (“CODM”). In addition, ASU 2023-07 will require the Company to disclose the title and position of its CODM and how the CODM uses segment profit or loss information in assessing segment performance and deciding how to allocate resources. ASU 2023-09 is effective for the Company’s fiscal year which results inending September 30, 2026. Early adoption is permitted. The guidance should be applied retrospectively unless impracticable. We are currently evaluating the recognition of a right of use asset and corresponding lease liability, including for those leasesimpact that we currently classify as operating leases. The right of use asset and lease liabilityadopting this guidance will initially be measured using the present value of the remaining rental payments.have on our disclosures.
Item 3. Quantitative and Qualitative Disclosures about Market Risk
Credit Risk
See also Note 4 to the Condensed Consolidated Financial Statements, ‘Financialcondensed consolidated financial statements, “Financial Instruments with Off-Balance Sheet Risk and Concentrations of Credit Risk’Risk”.
Market Risk
We conduct our market-making and trading activities predominantly as a principal, which subjects our capital to significant risks. These risks include, but are not limited to, absolute and relative price movements, price volatility and changes in liquidity, over which we have virtually no control. Our exposure to market risk varies in accordance with the volume of customer-drivenclient-driven market-making transactions, the size of the proprietary positions and the volatility of the financial instruments traded.
We seek to mitigate exposure to market risk by utilizing a variety of qualitative and quantitative techniques:
•Diversification of business activities and instruments;
•Limitations on positions;
•Allocation of capital and limits based on estimated weighted risks; and
•Daily monitoring of positions and mark-to-market profitability.
We utilize derivative products in a trading capacity as a dealer to satisfy customerclient needs and mitigate risk. We manage risks from both derivatives and non-derivative cash instruments on a consolidated basis. The risks of derivatives should not be viewed in isolation, but in aggregate with our other trading activities.
We are exposed to market risk in connection with our retail trading activities. Because we act as counterparty to our retail clients’ transactions, we are exposed to risk on each trade that the value of our position will decline. Accordingly, accurate and efficient management of our net exposure is a high priority, and we have developed policies addressing both our automated and manual procedures to manage our exposure. These risk-management policies and procedures are established and reviewed regularly by the Risk Committee of our Board of Directors. Our risk-management policies require quantitative analyses by instrument, as well as assessment of a range of market inputs, including trade size, dealing rate, client margin and market liquidity. Our risk-management procedures require our team of senior traders to monitor risk exposure on a continuous basis and update senior management both informally over the course of the trading day and formally through intraday and end of day reporting. A key component of our approach to managing market risk is that we do not initiate market positions for our own account in anticipation of future movements in the relative prices of products we offer.
Management believes that the volatility of revenues is a key indicator of the effectiveness of our risk management techniques. The graph below summarizes volatility of our daily revenue, determined on a marked-to-market basis, during the threesix months ended DecemberMarch 31, 2017.2024.
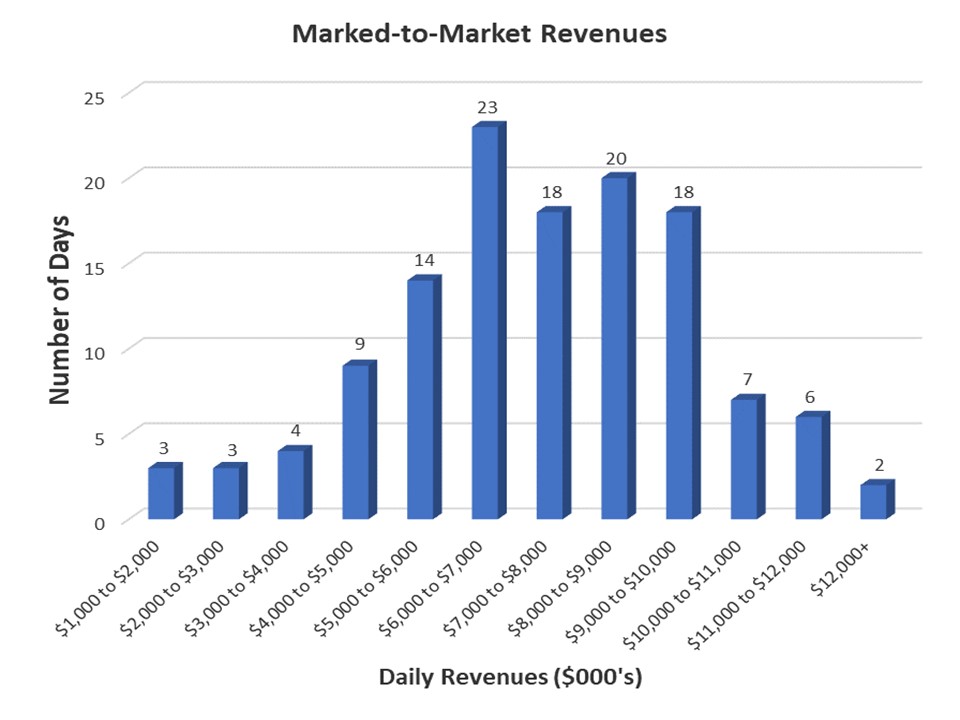 In our Securities market-making and trading activities, we maintain inventories of equity and debt securities. In our
 Physical CommoditiesCommercial segment, our positions include physical commodities inventories, precious metals on lease, forwards, futures and options on futures, and OTC derivatives. Our commodity trading activities are managed as one consolidated book for each commodity encompassing both cash positions and derivative instruments. We monitor the aggregate position for each commodity in equivalent physical ounces, metric tons, or other relevant unit.Interest Rate Risk
In the ordinary course of our operations, we have interest rate risk from the possibility that changes in interest rates will affect the values of financial instruments and impact interest income earned. Within our domestic institutional dealer in fixed income securities business, we maintain a significant amount of trading assets and liabilities which are sensitive to changes in interest rates. These trading activities consists primarily consist of securities trading in connection with U.S. Treasury, U.S. government agency, agency mortgage-backed and agency asset-backed obligations.obligations, as well as investment grade, high-yield, convertible and emerging markets debt securities. Derivative instruments, which consist of futures, mortgage-backed “to be announced” (TBA)TBA securities and forward settling transactions, are used to manage risk exposures in the trading inventory. We enter into TBA securities transactions for the sole purpose of managing risk associated with the purchase of mortgage pass-throughmortgage-backed securities.
In addition, we generate interest income from the positive spread earned on customerclient deposits. We typically invest in U.S. Treasury bills, notes, and obligations issued by government sponsored entities, reverse repurchase agreements involving U.S. Treasury bills and government obligations or AA-rated money market funds. In some instances, we maintain interest earning cash deposits with banks, clearing organizations and counterparties. We have an investment policy which establishes acceptable standards of credit quality and limits the amount of funds that can be invested within a particular fund, institution, clearing organization andor counterparty. We estimate that as of March 31, 2024, an immediate 25 basis point decrease in short-term interest rates would result in approximately $4.8 million less in annual net income.
We employ an interest rate management strategy, where we use derivative financial instruments in the form of interest rate swaps and/or outright purchases of medium-term U.S. Treasury notes to manage a portion of our aggregate interest rate position. On a quarterly basis, we evaluate our overall level of short term investable balances, net of our of variable rate debt, and either invest a portion of these investable balances in medium-term U.S. Treasury notes or enter into interest rate swaps, when a sufficient interest rate spread between short-term and medium-term rates exists. Under this strategy, we do not actively trade in such instruments and generally intend to hold these investment to their maturity date. Under this strategy, excluding cash deposits and our investments in AA-rated money market funds, the weighted average time to maturity of our portfolio is not to exceed 24 months in duration.
As of December 31, 2017, we held no medium-term U.S. Treasury notes and no interest rate swap derivative contracts as part of this strategy. Currently our short term investment balances are held in short term U.S. Treasury bills, interest earning cash deposits and AA-rated money market fund investments. The weighted-average time to maturity of the portfolio, excluding cash deposits and our investments in AA-rated money market funds, is less than three months. For the three months ended December 31, 2017, operating revenues include no unrealized gains or losses on the fair value of U.S. Treasury notes and interest rate swaps while the three months ended December 31, 2016, include an unrealized loss of $5.6 million, related to the change in fair value of these U.S. Treasury notes and interest rate swaps. The U.S. Treasury notes and interest rate swaps are not designated for hedge accounting treatment, and changes in their fair values, which are volatile and can fluctuate from period to period, are included in operating revenues in the current period.
We manage interest expense using a combination of variable and fixed rate debt as well as including the average outstanding borrowings in our calculations of the notional value of interest rate swaps to be entered into as part of our interest rate management strategy discussed above.debt. The debt instruments are carried at their unpaid principal balance which approximates fair value. At DecemberAs of March 31, 2017, $421.12024, $253.6 million of ouroutstanding principal debt was variable-rate debt. We are subject to earnings and liquidity risks for changes in the interest rate on this debt. As of DecemberMarch 31, 2017, we had $1.82024, $897.9 million of outstanding inprincipal debt was fixed-rate long-term debt. There
Foreign Currency Risk
Currency risk arises from the possibility that fluctuations in foreign exchange rates will impact the value of our earnings and assets. Entities that have assets and liabilities denominated in currencies other than the primary economic environment in which the entity operates are no earningssubject to remeasurement. Virtually all sales and related operating costs are denominated in the currency of the local country and translated into USD for consolidated reporting purposes. Although the majority of the assets and liabilities of these subsidiaries are denominated in the functional currency of the subsidiary, they may also hold assets or liquidity risks associated withliabilities denominated in other currencies. As a result, our fixed-rate debt.results of operations and financial position are exposed to changing currency rates. We may consider entering into hedging transactions to mitigate our exposure to foreign currency exchange rates. These hedging transactions may not be successful.
Item 4. Controls and Procedures
In connection with the filing of this Form 10-Q, our management, including the Chief Executive Officer and Chief Financial Officer, evaluated the effectiveness of the design and operation of our disclosure controls and procedures (as such term is defined in Rules 13a-15(e) and 15d-15(e) under the Securities Exchange Act of 1934, as amended (the “Exchange Act”)) as of DecemberMarch 31, 2017.2024. Our Chief Executive Officer and Chief Financial Officer have concluded that our disclosure controls and procedures were not effective to provide reasonable assurance that their objectives were met as of DecemberMarch 31, 2017 based on the material weaknesses discussed in Management’s Report on Internal Control over Financial Reporting described below.2024.
There are limitations inherent in any internal control, such as the possibility of human error and the circumvention or overriding of controls. A control system, no matter how well conceived and operated, can provide only reasonable, not absolute, assurance that the objectives of the control system are met, and may not prevent or detect misstatements. As conditions change over time, so too may the effectiveness of internal controls. As a result, there can be no assurance that a control system will succeed in preventing all possible instances of error and fraud. Our disclosure controls and procedures are designed to provide reasonable assurance of achieving their objectives, and the conclusions our Chief Executive Officer and Chief Financial Officer are made at the “reasonable assurance” level.
In connection with the preparation of our financial statements for the year ended September 30, 2017, management identified the following deficiencies in our internal control over financial reporting as of September 30, 2017. Management concluded that the Company did not:
Design, conduct and document an effective continuous risk assessment process related to new business lines, specifically at one of the Company’s Singapore subsidiaries, to identify, analyze and monitor risks impacting financial reporting, and implement business process level controls and monitoring activities that are responsive to those risks.
Design and operate effective process level controls related to physical coal trading activities in the Company’s Singapore subsidiary, INTL Asia Pte. Ltd., specifically, the Company did not:
| |
◦ | Design and operate controls over the existence of physical commodities inventory. |
| |
◦ | Design and operate controls over the completeness, existence, accuracy and valuation of amounts due to be reimbursed by an INTL Asia Pte. Ltd. supplier. |
| |
◦ | Establish appropriate segregation of duties within the purchasing, accounts payable and cash disbursements process. |
We developed, and are currently implementing, a remediation plan for this material weakness. We continue to execute our remediation plan, which included exiting the physical coal business, which was only conducted in INTL Asia Pte. Ltd. Additionally, we introduced new policies requiring an internal audit of business process level controls and monitoring activities subsequent to new businesses to ensure that information systems, business processes, internal controls, monitoring activities and personnel are fully aligned with our control environment and financial reporting objectives. Also, we introduced a new policy requiring quarterly analysis by management, including consideration of changes in risk assessment, of new business lines in order to conduct and document an effective continuous risk assessment process to identify, analyze, and monitor risks impacting financial reporting, and implement business process level controls and monitoring activities that are responsive to those risks. As we continue to evaluate and work to enhance internal control over financial reporting, we may determine that additional measures should be taken to address these or other control deficiencies, and/or we should modify the remediation plan described above.
We have discussed these remedial actions with the Audit Committee of our board of directors and, as of the date of this report, anticipate that these measures will strengthen our internal control over financial reporting to the extent necessary to remedy the material weakness described above. However, because of the nature of certain of these remedial actions, their operational effectiveness may only be validated over a period of time. Accordingly, their successful implementation will continue to be observed and evaluated before management is able to conclude that the material weakness has been remediated. We cannot give assurances that these remedial actions will be successful or that we will not in the future identify further material weaknesses or significant deficiencies in our internal control over financial reporting.
Other than as described above, thereThere were no changes in our internal controls over financial reporting during the quarter ended DecemberMarch 31, 20172024 that materially affected, or are reasonably likely to materially affect, our internal control over financial reporting.
PART II
Item 1. Legal Proceedings
From timeFor information regarding certain legal proceedings to timewhich we are currently a party, see Note 11, “Commitments and Contingencies” in the ordinary course of business, we are involved in various legal and regulatory actions and proceedings, including tort claims, contractual disputes, employment matters, workers’ compensation claims and collections. We carry insurance that provides protection against certain types of claims, up to the policy limits of our insurance.
There have been no material changesnotes to our disclosuresCondensed Consolidated Financial Statements included in Item 3. Legal Proceedings of our Annualthis Quarterly Report on Form 10-K for the fiscal year ended September 30, 2017.10-Q.
Item 1A. Risk Factors
In addition to the other information set forth in this report, information regarding risks affecting us appears in Part I, Item 1A of our Annual Report on Form 10-K for the fiscal year ended September 30, 2017.2023. These are not the only risks we face. Additional risks and uncertainties not currently known to us or that management currently considers to be non-material may in the future adversely affect our business, financial condition and operating results. There have been no material changes to our risk factors since the filing of our Form 10-K.
Item 2. Unregistered Sales of Equity Securities and Use of Proceeds
On August 17, 2017,30, 2023, our Board of Directors authorized for fiscal year 2018, the repurchase of up to 1.01.5 million shares of our outstanding common stock from time to time in open market purchasepurchases and private transactions, commencing on October 1, 20172023 and ending on September 30, 2018,2024. The repurchases are subject to the discretion of the senior management team to implement our stock repurchase plan, and subject to market conditions and as permitted by securities laws and other legal, regulatory and contractual requirements and covenants.
Our common stock repurchase program activity for the three months ended DecemberMarch 31, 20172024 was as follows.follows:
| | | | | | | | | | | | | | | | | | | | | | | |
| Period | Total Number of Shares Purchased(1) | | Average Price Paid per Share | | Total Number of Shares Purchased as Part of Publicly Announced Program | | Maximum Number of Shares Remaining to be Purchased Under the Program |
| January 1, 2024 to January 31, 2024 | 1,561 | | | $ | 68.66 | | | — | | | 1,500,000 | |
| February 1, 2024 to February 29, 2024 | 20 | | | 66.70 | | | — | | | 1,500,000 | |
| March 1, 2024 to March 31, 2024 | 543 | | | 70.26 | | | — | | | 1,500,000 | |
| Total | 2,124 | | | $ | 69.05 | | | — | | | |
(1) The 2022 Omnibus Incentive Compensation Plan allows for “withhold to cover” as a tax payment method for vesting of restricted stock awards. Pursuant to the “withhold to cover” method, we withheld from certain employees shares noted in the table above to cover tax withholding related to the vesting of their awards. For the three months ended March 31, 2024, a total of 2,124 shares were withheld at an average price of $69.05. |
Item 5. Other Information
|
| | | | | | | | | | | | |
| Period | Total Number of Shares Purchased(1) | | Average Price Paid per Share | | Total Number of Shares Purchased as Part of Publicly Announced Program | | Maximum Number of Shares Remaining to be Purchased Under the Program |
| October 1, 2017 to October 31, 2017 | — |
| | $ | — |
| | — |
| | 1,000,000 |
|
| November 1, 2017 to November 30, 2017 | — |
| | — |
| | — |
| | 1,000,000 |
|
| December 1, 2017 to December 31, 2017 | 17,867 |
| | 41.26 |
| | — |
| | 1,000,000 |
|
| Total | 17,867 |
| | $ | 41.26 |
| | — |
| | |
(1) All shares purchased relates to shares of common stock tendered in the first quarter of 2018 to satisfy employees’ tax obligations upon the vesting of restricted stock.
| | | | | | | | |
| 10.1 | | |
| | |
| 10.2 | | |
| | |
| 31.1 | | |
| | |
| 31.2 | | |
| | |
| 32.1 | | |
| | |
| 32.2 | | |
| | |
| 101.INS | | Inline XBRL Instance Document (the instance document does not appear in the Interactive Data File because its XBRL tags are embedded within the Inline XBRL document) |
| | |
| 101.SCH | | Inline XBRL Taxonomy Extension Schema Document |
| | |
| 101.CAL | | Inline XBRL Taxonomy Extension Calculation Linkbase Document |
| | |
| 101.DEF | | Inline XBRL Taxonomy Extension Definition Linkbase Document |
| | |
| 101.LAB | | Inline XBRL Taxonomy Extension Label Linkbase Document |
| | |
| 101.PRE | | Inline XBRL Taxonomy Extension Presentation Linkbase Document |
| | |
| 104 | | Cover Page Interactive Data File (formatted as inline XBRL and contained in Exhibit 101) |
| * | | Filed as part of this report. |
| ** | | Furnished as part of this report. |
Signatures
Pursuant to the requirements of the Securities Exchange Act of 1934, the registrant has duly caused this report to be signed on its behalf by the undersigned thereunto duly authorized.
INTL FCStoneStoneX Group Inc.
| | | | | | | | | | | | | | |
| Date: | May 8, 2024 | | | |
Date: | February 7, 2018 | | /s/ Sean M. O’Connor | |
| | | | | Sean M. O’Connor | |
| | | | | Chief Executive Officer | |
| | | | |
| Date: | February 7, 2018May 8, 2024 | | /s/ William J. Dunaway | |
| | | | | William J. Dunaway | |
| | | | | Chief Financial Officer | |