UNITED STATES
SECURITIES AND EXCHANGE COMMISSION
Washington, D.C. 20549
FORM 10-Q
(Mark One)
|
| | | | |
x☒ | QUARTERLY REPORT PURSUANT TO SECTION 13 OR 15(d) OF THE SECURITIES EXCHANGE ACT OF 1934 |
For the quarterly period ended December 30, 2017
January 1, 2022
or
|
| | | | |
o☐ | TRANSITION REPORT PURSUANT TO SECTION 13 OR 15(d) OF THE SECURITIES EXCHANGE ACT OF 1934 |
For the transition period from ________to _________
Commission File Number: 001-12696
Plantronics, Inc.
(Exact name of registrant as specified in its charter)
|
| | | | |
| Delaware | 77-0207692 |
| (State or other jurisdiction of incorporation or organization) | (I.R.S. Employer Identification No.) |
345 Encinal Street
Santa Cruz, California 95060
(Address of principal executive offices)
(Zip Code)
(831) 426-5858420-3002
(Registrant's telephone number, including area code)
Securities registered pursuant to Section 12(b) of the Act:
| | | | | | | | |
| Title of each class | Trading Symbol(s) | Name of each exchange on which registered |
| Common Stock, $0.01 par value | POLY | New York Stock Exchange |
Indicate by check mark whether the registrant (1) has filed all reports required to be filed by Section 13 or 15(d) of the Securities Exchange Act of 1934 during the preceding 12 months (or for such shorter period that the registrant was required to file such reports), and (2) has been subject to such filing requirements for the past 90 days. Yes x☒ No o☐
Indicate by check mark whether the registrant has submitted electronically and posted on its corporate Web site, if any, every Interactive Data File required to be submitted and posted pursuant to Rule 405 of Regulation S-T (§232.405 of this chapter) during the preceding 12 months (or for such shorter period that the registrant was required to submit and post such files). Yes x☒ No o☐
Indicate by check mark whether the registrant is a large accelerated filer, an accelerated filer, a non-accelerated filer, a smaller reporting company or an emerging growth company. See the definitions of “large accelerated filer,” “accelerated filer,” “smaller reporting company” and "emerging growth company" in Rule 12b-2 of the Exchange Act.
|
| | | | | | | | | | |
Large accelerated filerx | ☒ | Accelerated filero | ☐ |
Non-accelerated filero | ☐ | Smaller reporting companyo | ☐ |
| | Emerging growth companyo |
| | (Do not check if a smaller reporting company) | | ☐ |
If an emerging growth company, indicate by check mark if the registrant has elected not to use the extended transition period for complying with any new or revised financial accounting standards provided pursuant to Section 13(a) of the Exchange Act. o☐
Indicate by check mark whether the registrant is a shell company (as defined in Rule 12b-2 of the Exchange Act). Yes o ☐No x☒
As of January 26, 2018, 33,075,564 of February 3, 2022,42,778,870 shares of the registrant's common stock were outstanding.
Plantronics, Inc.PLANTRONICS, INC.
FORM 10-Q
TABLE OF CONTENTS
| | | | | | | | |
| |
PART I. FINANCIAL INFORMATION | Page No. |
| PART I | FINANCIAL INFORMATION | |
| | |
| |
| |
| |
| |
| |
| |
| |
| |
| |
| |
| |
| |
| |
| |
| |
| |
| |
| |
| |
| |
| | |
| | |
| | |
| | |
| | |
| | |
| | |
| | |
| | |
| |
| |
| | |
PART II. II | OTHER INFORMATION | |
| |
| | |
| | |
| |
| |
| |
| | |
| | |
| |
| |
| |
| |
| |
Plantronics®Plantronics, Poly, the Propeller design, the Poly logo, and Simply Smarter Communications®Polycom are trademarks or registered trademarks of Plantronics, Inc.
DECT™ is a trademark of ETSI registered for the benefit of its members in France and other jurisdictions.
The Bluetooth name and the Bluetooth® trademarks are owned by Bluetooth SIG, Inc. and are used by Plantronics, Inc. under license. All other trademarks are the property of their respective owners.
Part
PART I --- FINANCIAL INFORMATION
Management’s Discussion and Analysis of Financial Condition and Results of OperationsITEM 1. FINANCIAL STATEMENTS
CERTAIN FORWARD-LOOKING INFORMATION:
PLANTRONICS, INC.
This Quarterly Report on Form 10-Q contains forward-looking statements within the meaning of Section 27A of the Securities Act of 1933 ("Securities Act") and Section 21E of the Securities Exchange Act of 1934 ("Exchange Act"). Forward-looking statements may generally be identified by the use of such words as "anticipate," "believe," “could,” "expect," "intend," “may,” "plan," "potential," "shall," "will," “would,” or variations of such words and similar expressions, or the negativeCONDENSED CONSOLIDATED BALANCE SHEETS
(in thousands)
(Unaudited)
| | | | | | | | | | | |
| January 1, 2022 | | April 3,
2021 |
| ASSETS | | | |
| Current assets | | | |
| Cash and cash equivalents | $ | 182,700 | | | $ | 202,560 | |
| Restricted cash | — | | | 493,908 | |
| Short-term investments | 17,017 | | | 14,559 | |
| Accounts receivable, net | 275,913 | | | 267,464 | |
| Inventory, net | 216,750 | | | 194,405 | |
| Other current assets | 61,484 | | | 65,214 | |
| Total current assets | 753,864 | | | 1,238,110 | |
| Non-current assets | | | |
| | | |
| Property, plant, and equipment, net | 126,973 | | | 140,875 | |
| Purchased intangibles, net | 255,564 | | | 341,614 | |
| Goodwill | 796,216 | | | 796,216 | |
| Deferred tax assets | 211,543 | | | 95,800 | |
| Other non-current assets | 70,332 | | | 51,654 | |
| Total assets | $ | 2,214,492 | | | $ | 2,664,269 | |
| | | |
| LIABILITIES AND STOCKHOLDERS' EQUITY (DEFICIT) | | | |
| Current liabilities | | | |
| Accounts payable | $ | 160,529 | | | $ | 151,244 | |
| Accrued liabilities | 328,551 | | | 394,084 | |
| Current portion of long-term debt | — | | | 478,807 | |
| Total current liabilities | 489,080 | | | 1,024,135 | |
| Non-current liabilities | | | |
| Long-term debt, net | 1,499,228 | | | 1,496,064 | |
| | | |
| Long-term income taxes payable | 76,095 | | | 86,227 | |
| | | |
| Other non-current liabilities | 139,469 | | | 138,609 | |
| Total liabilities | 2,203,872 | | | 2,745,035 | |
| Commitments and contingencies (Note 6) | 0 | | 0 |
| Stockholders' equity (deficit) | | | |
| Common stock | 926 | | | 912 | |
| Additional paid-in capital | 1,596,313 | | | 1,556,272 | |
| Accumulated other comprehensive income (loss) | 11,454 | | | (3,221) | |
| Accumulated deficit | (716,423) | | | (765,233) | |
| Total stockholders' equity before treasury stock | 892,270 | | | 788,730 | |
| Less: Treasury stock, at cost | (881,650) | | | (869,496) | |
| Total stockholders' equity (deficit) | 10,620 | | | (80,766) | |
| Total liabilities and stockholders' equity (deficit) | $ | 2,214,492 | | | $ | 2,664,269 | |
The accompanying notes are an integral part of these terms. Specific forward-looking statements contained within this Form 10-Q include, butcondensed consolidated financial statements.
PLANTRONICS, INC.
CONDENSED CONSOLIDATED STATEMENTS OF OPERATIONS
(in thousands, except per share data)
(Unaudited)
| | | | | | | | | | | | | | | | | | | | | | | |
| Three Months Ended | | Nine Months Ended |
| | January 1, 2022 | | December 26, 2020 | | January 1, 2022 | | December 26, 2020 |
| Net revenues | | | | | | | |
| Net product revenues | $ | 354,022 | | | $ | 420,711 | | | $ | 1,086,607 | | | $ | 1,059,846 | |
| Net service revenues | 55,544 | | | 63,974 | | | 173,155 | | | 191,529 | |
| Total net revenues | 409,566 | | | 484,685 | | | 1,259,762 | | | 1,251,375 | |
| Cost of revenues | | | | | | | |
| Cost of product revenues | 226,994 | | | 236,842 | | | 682,360 | | | 622,718 | |
| Cost of service revenues | 18,386 | | | 21,186 | | | 58,334 | | | 64,921 | |
| Total cost of revenues | 245,380 | | | 258,028 | | | 740,694 | | | 687,639 | |
| | | | | | | |
| Gross profit | 164,186 | | | 226,657 | | | 519,068 | | | 563,736 | |
| | | | | | | |
| Operating expenses | | | | | | | |
| Research, development, and engineering | 46,216 | | | 54,150 | | | 136,090 | | | 156,327 | |
| Selling, general, and administrative | 121,387 | | | 129,641 | | | 364,417 | | | 361,892 | |
| Loss, net from litigation settlements | — | | | — | | | — | | | 17,561 | |
| Restructuring and other related charges | 2,398 | | | 13,977 | | | 33,977 | | | 49,477 | |
| Total operating expenses | 170,001 | | | 197,768 | | | 534,484 | | | 585,257 | |
| | | | | | | |
| Operating (loss) income | (5,815) | | | 28,889 | | | (15,416) | | | (21,521) | |
| | | | | | | |
| Interest expense | 15,948 | | | 18,417 | | | 53,871 | | | 58,182 | |
| Other non-operating income, net | (995) | | | (2,596) | | | (1,664) | | | (4,188) | |
| (Loss) income before income taxes | (20,768) | | | 13,068 | | | (67,623) | | | (75,515) | |
| | | | | | | |
| Income tax benefit | (9,604) | | | (7,045) | | | (116,433) | | | (7,208) | |
| Net (loss) income | $ | (11,164) | | | $ | 20,113 | | | $ | 48,810 | | | $ | (68,307) | |
| | | | | | | |
| Per share data | | | | | | | |
| Basic (loss) earnings per common share | $ | (0.26) | | | $ | 0.49 | | | $ | 1.15 | | | $ | (1.67) | |
| Diluted (loss) earnings per common share | $ | (0.26) | | | $ | 0.48 | | | $ | 1.11 | | | $ | (1.67) | |
| Basic shares used in computing (loss) earnings per common share | 42,745 | | | 41,252 | | | 42,450 | | | 40,894 | |
| Diluted shares used in computing (loss) earnings per common share | 42,745 | | | 42,184 | | | 43,811 | | | 40,894 | |
| | | | | | | |
The accompanying notes are not limited to, statements regarding (i) our beliefs regarding the Enterprise market, market dynamicsan integral part of these condensed consolidated financial statements.
PLANTRONICS, INC.
CONDENSED CONSOLIDATED STATEMENTS OF COMPREHENSIVE (LOSS) INCOME
(in thousands)
(Unaudited)
| | | | | | | | | | | | | | | | | | | | | | | |
| Three Months Ended | | Nine Months Ended |
| January 1, 2022 | | December 26, 2020 | | January 1, 2022 | | December 26, 2020 |
| Net (loss) income | $ | (11,164) | | | $ | 20,113 | | | $ | 48,810 | | | $ | (68,307) | |
| | | | | | | |
| Other comprehensive income, before tax | | | | | | | |
| Unrealized gains on cash flow hedges | | | | | | | |
| Unrealized cash flow hedge gains (losses) | 7,846 | | | (3,754) | | | 8,520 | | | (8,339) | |
| Net (gains) losses reclassified into net revenues | (1,804) | | | 1,054 | | | (671) | | | 1,797 | |
| Net gains reclassified into cost of revenues | (10) | | | — | | | (489) | | | — | |
| Net losses reclassified into interest expense | 2,100 | | | 3,039 | | | 7,582 | | | 10,290 | |
| Net unrealized gains on cash flow hedges | 8,132 | | | 339 | | | 14,942 | | | 3,748 | |
| | | | | | | |
| | | | | | | |
| | | | | | | |
| Income tax benefit (expense) in other comprehensive income | 38 | | | 599 | | | (267) | | | 1,122 | |
| Other comprehensive income | 8,170 | | | 938 | | | 14,675 | | | 4,870 | |
| | | | | | | |
| Comprehensive (loss) income | $ | (2,994) | | | $ | 21,051 | | | $ | 63,485 | | | $ | (63,437) | |
The accompanying notes are an integral part of these condensed consolidated financial statements.
PLANTRONICS, INC.
CONDENSED CONSOLIDATED STATEMENTS OF CASH FLOWS
(in thousands)
(Unaudited)
| | | | | | | | | | | |
| Nine Months Ended |
| | January 1, 2022 | | December 26, 2020 |
| Cash flows from operating activities | | | |
| Net income (loss) | $ | 48,810 | | | $ | (68,307) | |
| Adjustments to reconcile net income (loss) to net cash (used in) provided by operating activities | | | |
| Depreciation and amortization | 112,796 | | | 124,881 | |
| Amortization of debt issuance costs | 5,046 | | | 3,962 | |
| Stock-based compensation | 34,214 | | | 31,104 | |
| Deferred income taxes | (115,660) | | | (15,373) | |
| Provision for excess and obsolete inventories | 8,160 | | | 12,767 | |
| Restructuring and other related charges | 33,977 | | | 49,477 | |
| Cash payments for restructuring charges | (27,515) | | | (28,794) | |
| Other operating activities | (1,526) | | | (6,000) | |
| Changes in assets and liabilities | | | |
| Accounts receivable, net | (8,569) | | | (71,439) | |
| Inventory, net | (24,699) | | | (39,941) | |
| Current and other assets | (9,129) | | | (15,246) | |
| Accounts payable | 9,170 | | | 62,454 | |
| Accrued liabilities | (45,502) | | | 47,529 | |
| Income taxes | (19,625) | | | (15,925) | |
| Net cash (used in) provided by operating activities | (52) | | | 71,149 | |
| | | |
| Cash flows from investing activities | | | |
| Proceeds from sales of short-term investments | 264 | | | 667 | |
| | | |
| Purchases of short-term investments | (760) | | | (394) | |
| | | |
| Capital expenditures | (20,682) | | | (16,753) | |
| Proceeds from sale of property, plant, and equipment | — | | | 1,900 | |
| Other investing activities | (4,000) | | | — | |
| Net cash used in investing activities | (25,178) | | | (14,580) | |
| | | |
| Cash flows from financing activities | | | |
| | | |
| Employees' tax withheld and paid for restricted stock and restricted stock units | (12,154) | | | (3,193) | |
| Proceeds from issuances under stock-based compensation plans | 5,841 | | | 5,731 | |
| Proceeds from revolving line of credit | — | | | 50,000 | |
| Repayments of revolving line of credit | — | | | (50,000) | |
| | | |
| | | |
| Repayments of long-term debt | (480,689) | | | (46,980) | |
| | | |
| Net cash used in financing activities | (487,002) | | | (44,442) | |
| | | |
| Effect of exchange rate changes on cash and cash equivalents and restricted cash | (1,536) | | | 4,059 | |
| Net (decrease) increase in cash and cash equivalents and restricted cash | (513,768) | | | 16,186 | |
| | | |
| Cash and cash equivalents and restricted cash at beginning of period | 696,468 | | | 213,879 | |
| Cash and cash equivalents and restricted cash at end of period | $ | 182,700 | | | $ | 230,065 | |
| | | |
| | | |
| | | |
| | | |
| | | |
The following table provides a reconciliation of cash and customer behavior as well as our position in the market, (ii) our beliefs regarding the Consumer market, our new product introductions and the expected effect of such introductions, (iii) our belief that our "as-a-service" offerings will benefit our growth long-term but their contribution will not be material in the near term, (iv) our intention to provide customer data insight through software and service solutions, (v) the Unified Communications ("UC") market, including adoption of UC products, our position, and timing and growth expectations in this market, (vi) our plans regarding our "as a service" offerings including sales and marketing efforts, (vii) our intentions regarding investments in long-term growth opportunities and our core research and development efforts, in particular in the UC market, (viii) our intentions regarding the focus of our sales, marketing and customer services and support teams on UC, (ix) the future of UC technologies, including the transition of businesses to UC-supported systems and the effects on headset adoption and use, enterprises that adopt UC and our revenue opportunity and profit growth, (x) our expenses, including research, development and engineering expenses and selling, general and administrative expenses, (xi) fluctuations in our cash provided by operating activities as a result of various factors, including fluctuations in revenues and operating expenses, timing of product shipments, accounts receivable collections, inventory and supply chain management, and the timing and amount of taxes and other payments, (xii) our future tax rate and payments related to unrecognized tax benefits, (xiii) our anticipated range of capital expenditures for the remainder of Fiscal Year 2018 and the sufficiency of our cash, cash equivalents and restricted cash from operationsreported within the condensed consolidated balance sheets that sum to sustain future operationsthe total of the same amounts shown in the condensed consolidated statements of cash flows:
| | | | | | | | | | | |
| (in thousands) | January 1, 2022 | | April 3, 2021 |
| Cash and cash equivalents | $ | 182,700 | | | $ | 202,560 | |
| Restricted cash | — | | | 493,908 | |
| Total cash and cash equivalents and restricted cash shown in the condensed consolidated statements of cash flows | $ | 182,700 | | | $ | 696,468 | |
The accompanying notes are an integral part of these condensed consolidated financial statements.
PLANTRONICS, INC.
CONDENSED CONSOLIDATED STATEMENTS OF STOCKHOLDERS' EQUITY (DEFICIT)
(in thousands)
(Unaudited)
| | | | | | | | | | | | | | | | | | | | | | | | | | | | | | | | | | | | | | | | | |
| Three Months Ended January 1, 2022 |
| | Common Stock | | Additional Paid-In Capital | | Accumulated Other Comprehensive Income | | Accumulated Deficit | | Treasury Stock | | Total Stockholders' (Deficit) Equity |
| | Shares | | Amount | | | | | |
| Balances at October 2, 2021 | 42,721 | | | $ | 926 | | | $ | 1,584,088 | | | $ | 3,284 | | | $ | (705,259) | | | $ | (880,806) | | | $ | 2,233 | |
| Net loss | — | | | — | | | — | | | — | | | (11,164) | | | — | | | (11,164) | |
| | | | | | | | | | | | | |
| Net unrealized gains on cash flow hedges, net of tax | — | | | — | | | — | | | 8,170 | | | — | | | — | | | 8,170 | |
| | | | | | | | | | | | | |
| Proceeds from issuances under stock-based compensation plans | 43 | | — | | | — | | | — | | | — | | | — | | | — | |
| | | | | | | | | | | | | |
| | | | | | | | | | | | | |
| | | | | | | | | | | | | |
| Stock-based compensation | — | | | — | | | 12,225 | | — | | | — | | | — | | | 12,225 | |
| | | | | | | | | | | | | |
| | | | | | | | | | | | | |
| Employees' tax withheld and paid for restricted stock and restricted stock units | — | | | — | | | — | | | — | | | — | | | (844) | | | (844) | |
| | | | | | | | | | | | | |
| | | | | | | | | | | | | |
| | | | | | | | | | | | | |
| | | | | | | | | | | | | |
| Balances at January 1, 2022 | 42,764 | | | $ | 926 | | | $ | 1,596,313 | | | $ | 11,454 | | | $ | (716,423) | | | $ | (881,650) | | | $ | 10,620 | |
| | | | | | | | | | | | | | | | | | | | | | | | | | | | | | | | | | | | | | | | | |
| Three Months Ended December 26, 2020 |
| | Common Stock | | Additional Paid-In Capital | | Accumulated Other Comprehensive Loss | | Accumulated Deficit | | Treasury Stock | | Total Stockholders' Deficit |
| | Shares | | Amount | | | | | |
| Balances at September 26, 2020 | 41,246 | | | $ | 907 | | | $ | 1,526,677 | | | $ | (9,650) | | | $ | (796,324) | | | $ | (866,615) | | | $ | (145,005) | |
| Net income | — | | | — | | | — | | | — | | | 20,113 | | | — | | | 20,113 | |
| | | | | | | | | | | | | |
| Net unrealized gains on cash flow hedges, net of tax | — | | | — | | | — | | | 938 | | | — | | | — | | | 938 | |
| | | | | | | | | | | | | |
| Proceeds from issuances under stock-based compensation plans | 19 | | | — | | | — | | | — | | | — | | | — | | | — | |
| | | | | | | | | | | | | |
| | | | | | | | | | | | | |
| Stock-based compensation | — | | | — | | | 11,486 | | | — | | | — | | | — | | | 11,486 | |
| | | | | | | | | | | | | |
| | | | | | | | | | | | | |
| Employees' tax withheld and paid for restricted stock and restricted stock units | (6) | | | — | | | — | | | — | | | — | | | (144) | | | (144) | |
| | | | | | | | | | | | | |
| | | | | | | | | | | | | |
| | | | | | | | | | | | | |
| Other equity changes | — | | | — | | | (3) | | | (409) | | | 3 | | | — | | | (409) | |
| Balances at December 26, 2020 | 41,259 | | | $ | 907 | | | $ | 1,538,160 | | | $ | (9,121) | | | $ | (776,208) | | | $ | (866,759) | | | $ | (113,021) | |
| | | | | | | | | | | | | | | | | | | | | | | | | | | | | | | | | | | | | | | | | | | | | | | |
| Nine Months Ended January 1, 2022 | | | | | | |
| Common Stock | | Additional Paid-In Capital | | Accumulated Other Comprehensive (Loss) Income | | Accumulated Deficit | | Treasury Stock | | Total Stockholders' (Deficit) Equity | | | | | | |
| Shares | | Amount | | | | | | | | | | | |
| Balances at April 3, 2021 | 41,751 | | | $ | 912 | | | $ | 1,556,272 | | | $ | (3,221) | | | $ | (765,233) | | | $ | (869,496) | | | $ | (80,766) | | | | | | | |
| Net income | — | | | — | | | — | | | — | | | 48,810 | | — | | | 48,810 | | | | | | | |
| | | | | | | | | | | | | | | | | | | |
| Net unrealized gains on cash flow hedges, net of tax | — | | | — | | | — | | | 14,675 | | — | | | — | | | 14,675 | | | | | | | |
| | | | | | | | | | | | | | | | | | | |
| Proceeds from issuances under stock-based compensation plans | 785 | | 11 | | — | | | — | | | — | | | — | | | 11 | | | | | | | |
| | | | | | | | | | | | | | | | | | | |
| | | | | | | | | | | | | | | | | | | |
| | | | | | | | | | | | | | | | | | | |
| Stock-based compensation | — | | | — | | | 34,214 | | — | | | — | | | — | | | 34,214 | | | | | | | |
| | | | | | | | | | | | | | | | | | | |
| | | | | | | | | | | | | | | | | | | |
| Employees' tax withheld and paid for restricted stock and restricted stock units | — | | | — | | | — | | | — | | | — | | | (12,154) | | | (12,154) | | | | | | | |
| | | | | | | | | | | | | | | | | | | |
| Proceeds from Employee Stock Purchase Program | 228 | | 3 | | 5,827 | | — | | | — | | | — | | | 5,830 | | | | | | | |
| | | | | | | | | | | | | | | | | | | |
| | | | | | | | | | | | | | | | | | | |
| Balances at January 1, 2022 | 42,764 | | | $ | 926 | | | $ | 1,596,313 | | | $ | 11,454 | | | $ | (716,423) | | | $ | (881,650) | | | $ | 10,620 | | | | | | | |
| | | | | | | | | | | | | | | | | | | | | | | | | | | | | | | | | | | | | | | | | |
| Nine Months Ended December 26, 2020 |
| Common Stock | | Additional Paid-In Capital | | Accumulated Other Comprehensive Loss | | Accumulated Deficit | | Treasury Stock | | Total Stockholders' Deficit |
| Shares | | Amount | | | | | |
| Balances at March 28, 2020 | 40,406 | | | $ | 896 | | | $ | 1,501,340 | | | $ | (13,582) | | | $ | (707,904) | | | $ | (863,566) | | | $ | (82,816) | |
| Net loss | — | | | — | | | — | | | — | | | (68,307) | | | — | | | (68,307) | |
| | | | | | | | | | | | | |
| Net unrealized gains on cash flow hedges, net of tax | — | | | — | | | — | | | 4,870 | | | — | | | — | | | 4,870 | |
| | | | | | | | | | | | | |
| Proceeds from issuances under stock-based compensation plans | 667 | | | 6 | | | — | | | — | | | — | | | — | | | 6 | |
| Repurchase of restricted common stock | (10) | | | — | | | — | | | — | | | — | | | — | | | — | |
| | | | | | | | | | | | | |
| | | | | | | | | | | | | |
| Stock-based compensation | — | | | — | | | 31,104 | | | — | | | — | | | — | | | 31,104 | |
| | | | | | | | | | | | | |
| | | | | | | | | | | | | |
| Employees' tax withheld and paid for restricted stock and restricted stock units | (261) | | | — | | | — | | | — | | | — | | | (3,193) | | | (3,193) | |
| | | | | | | | | | | | | |
| Proceeds from Employee Stock Purchase Program | 457 | | | 5 | | | 5,719 | | | — | | | — | | | — | | | 5,724 | |
| | | | | | | | | | | | | |
| Other equity changes | — | | | — | | | (3) | | | (409) | | | 3 | | | — | | | (409) | |
| Balances at December 26, 2020 | 41,259 | | | $ | 907 | | | $ | 1,538,160 | | | $ | (9,121) | | | $ | (776,208) | | | $ | (866,759) | | | $ | (113,021) | |
The accompanying notes are an integral part of these condensed consolidated financial statements.
PLANTRONICS, INC.
NOTES TO THE CONDENSED CONSOLIDATED FINANCIAL STATEMENTS
(Unaudited)
1. BACKGROUND AND BASIS OF PRESENTATION
Plantronics, Inc. (“Poly,” the “Company”) is a leading global communications company that designs, manufactures, and discretionary cash requirements, (xiv) our abilitymarkets integrated communications and collaboration solutions that span headsets, open Session Initiation Protocol ("SIP") and native ecosystem desktop phones, conference room phones, video conferencing solutions and peripherals, including cameras, speakers, and microphones, cloud management and analytics software solutions, and services. The Company has two operating and reportable segments, Products and Services, and offers its products under the  , Plantronics and Polycom brands.
Founded in 1961, the Company is incorporated in the state of Delaware under the name Plantronics, Inc. and in March 2019, the Company changed the name under which it markets itself to pay future stockholder dividends, (xv) our ability to draw fundsPoly. The Company is listed on our credit facilitythe New York Stock Exchange ("NYSE") under the ticker symbol "POLY."
The accompanying unaudited condensed consolidated financial statements of the Company have been prepared on a basis materially consistent with, and should be reviewed in conjunction with, the Company's audited consolidated financial statements as needed, (xvi)of and for the sufficiency of our capital resources to fund operations,year ended April 3, 2021 and other statements regarding our future operations, financial condition and prospects, and business strategies. Such forward-looking statements are based on current expectations and assumptions and are subject to risks and uncertainties that may cause actual results to differ materially fromnotes thereto included in the forward-looking statements. Factors that could cause actual results and events to differ materially from such forward-looking statements are included, but not limited to, those discussed in this Quarterly Report on Form 10-Q; in Part I, "Item 1A. Risk Factors" of ourCompany's Annual Report on Form 10-K, for the fiscal year ended March 31, 2017,which was filed with the Securities and Exchange Commission (“SEC”("SEC") on May 10, 2017;18, 2021 and other documents weinclude all adjustments necessary to fairly state the information set forth herein. Certain information and footnote disclosures normally included in financial statements prepared pursuant to the rules and regulations of the SEC applicable to interim financial information and in accordance with accounting principles generally accepted in the United States of America ("GAAP") have filed withbeen condensed or omitted pursuant to such rules and regulations. These condensed consolidated financial statements contain all adjustments necessary for a fair presentation of the SEC. We undertake no obligation to update or revise publicly any forward-looking statements, whetherCompany’s consolidated financial position and the consolidated results of operations and cash flows as a result of new information, future events, or otherwise, except as required by applicable law. Given these risksthe dates and uncertainties, readers are cautioned not to place undue reliance on such forward-looking statements.
OVERVIEW
We are a leading designer, manufacturer, and marketer of lightweight communications headsets, telephone headset systems, other communication endpoints, and accessories for the worldwide businessperiods presented and consumer markets under the Plantronics brand. Our major product categories are Enterprise, which includes headsets optimized for Unified Communications (“UC”), other cordednormal and cordless communication headsets, audio processors,recurring in nature. The Company's reporting currency is United States Dollars ("USD.") The interim period results are subject to variation and telephone systems; and Consumer, which includes Bluetooth and corded products for mobile device applications and personal computer gaming headsets. Until July 1, 2017, we also offered specialty products marketed for hearing impaired individuals under our Clarity brand, which was included in our Consumer product category.
We ship our products to approximately 80 countries through a network of distributors, retailers, resellers, wireless carriers, original equipment manufacturers, and telephony service providers. We have well-developed distribution channels in North America, Europe, and in some partsare not necessarily indicative of the Asia Pacific region where useresults of our products is widespread.
|
| |
Net Revenues (in millions)
| Operating Income (in millions)
|
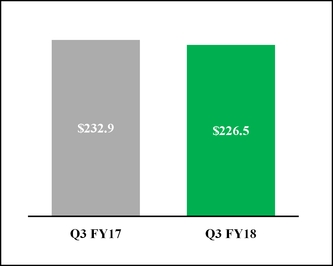
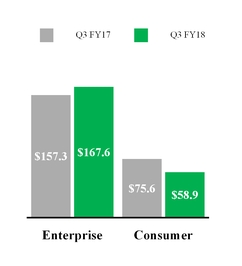
Compared to the third quarter of Fiscal Year 2017, net revenues decreased 2.7% to $226.5 million. The decrease in net revenues was driven by lower revenues within our Consumer product category, which declined 22.1%, or $16.7 million, from the year ago period. Of the declines in Consumer, approximately $8.0 million related to the divestiture of Clarity in the first quarter of Fiscal Year 2018. These declines were partially offset by higher revenues within our Enterprise product category, which grew 6.5%, or $10.3 million from the year ago period.
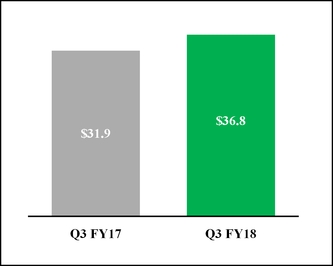
Operating income for the third quarter of Fiscal Year 2018 was $36.8 million and 16.2% of net revenue, compared to $31.9 million and 13.7% of net revenue in the prior year period. The divestiture of Clarity had a negligible impact on operating income for the third quarter of Fiscal Year 2018, and we expect the impactoperations to be negligibleexpected for the full Fiscal Year 2018.
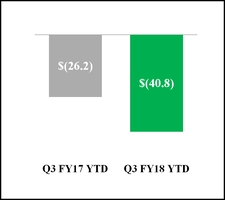
We reported a net loss of $49.5 million forfiscal year. The financial statements include the third quarter of Fiscal Year 2018, representing a decrease of 322.8% from the same quarter last year and driven by the impactaccounts of the Tax CutsCompany and Jobs Act ("its subsidiaries, all of which are wholly-owned. All intercompany balances and transactions have been eliminated.
The Company’s fiscal year ends on the Act")Saturday closest to the last day of March. The Company’s current fiscal year ends on April 2, 2022 and consists of 52 weeks. The Company's prior fiscal year ended on April 3, 2021 and consisted of 53 weeks. The three and nine months ended January 1, 2022 and December 26, 2020 each contain 13 and 39 weeks, respectively.
Risks and uncertainties
The Company is subject to a greater degree of uncertainty than normal in making the judgments and estimates needed to apply its significant accounting policies due to the ongoing COVID-19 pandemic and supply chain disruptions. The Company has assessed accounting estimates and other matters, including those using prospective financial information, using information that was signed into law on December 22, 2017, which resulted in a $76.4 million discrete charge for the quarter. For additional details regarding the impactsis reasonably available as of the Act, referissuance date of the condensed consolidated financial statements. The accounting estimates and other matters the Company has assessed included, but were not limited to, the incomeimpairment of goodwill and other long-lived assets, provisions for doubtful accounts, valuation allowances for deferred tax discussionassets, inventory and related reserves, and revenue recognition and related reserves. The Company may make changes to these estimates and judgments, which could result in Results of Operations and Note 13, Income Taxes, in the accompanying footnotesmaterial impacts to the condensed consolidated financial statements. Instatements in future periods. The extent and duration of the year ago period net income was $22.2 millionimpact of the COVID-19 pandemic and 9.5%the shortage of revenues.
Our primary focus, long-term growth opportunities, strategic initiatives,adequate component supply on the Company's business is highly uncertain and majoritydifficult to predict. The Company relies on contract manufacturers and sourcing of our revenuematerials from the Asia Pacific region, as well as its owned manufacturing facility in Mexico. The Company has experienced disruptions in both its own supply chain as well as those of its contract manufacturers and profits are in our Enterprise business. Withinsuppliers both as a result of COVID-19 as well as the Enterprise product category, we anticipate theglobal shortage of key driver of long-term revenue growthcomponents. Such disruptions have had, and profit opportunity willmay continue to be UC audio solutions. We believe enterprises are increasing adoptionhave, a material impact on the Company's ability to source critical component parts, complete production of UC systemsits products, fulfill customer orders, and adversely affect the ability to reduce costs, improve collaboration,meet customer demands as companies utilize work-from-home and migrate technology from obsolete legacy systems. We expect growth of UC will increase overall headset adoption in enterprise environments, and we believe mosthybrid work models. Additionally, if a significant number of the growthCompany's workforce employed in our Enterprise product category over the next three years will come from headsets designed for UC. As such, UC remains the central focusany of our sales, marketing, and support functions, and we will continue investing in key strategic alliances and integrations with major UC vendors.
Our Enterprise revenues increasedthese manufacturing facilities or in the third quarter of Fiscal Year 2018 when comparedCompany's offices were to contract the same prior year period, resulting from continued growth in UC product sales, which grew atvirus, the Company may experience delays or the inability to develop, produce, and deliver the Company's products on a rate above our long-term growth expectations, partially offsettimely basis. Furthermore, capital markets and economies worldwide have also been negatively impacted by declines in sales of non-UC corded and cordless products.
Revenues from our Consumer products are seasonal and typically strongest in our third fiscal quarter, which includes the majority of the holiday shopping season. Additionally, other factors directly impact our Consumer product category performance, such as product life-cycles (including the introduction and pace of adoption of new technology), the market acceptance of new product introductions, consumer preferencesCOVID-19 pandemic and the competitive retail environment, changes in consumer confidence and other macroeconomic factors, and fluctuations in foreign currency rates relative to the U.S. Dollar ("USD"). In addition, the timing or non-recurrence of retailer placements can cause volatility in quarter-to-quarter results.
When compared to the same prior year period, the decline in Consumer revenues in the third quarter of Fiscal Year 2018 was primarily attributable to a decline in sales of our stereo Bluetooth products where new product introductions have not yet fully integrated into the market to replace revenues from certain older stereo products. Consumer product refreshes and launches typically take multiple quarters to fully integrate into the market,supply chain disruptions, and it is difficult to predict at what point, if ever, these productspossible that it could cause a local and/or global economic recession.
The severity of the impact of the COVID-19 pandemic and supply chain disruptions on the Company's business will materially contribute to results or replace the salesdepend on a number of preceding models. We are currently refreshing our Consumer portfolio, having recently launched the BackBeat 300 and 500, refreshed BackBeat FIT Training and Boost editions, and RIG 800 series. Additionally, the divestiture of our Clarity line of business negatively impacted our Consumer results when comparedfactors, including, but not limited to, the sameduration and severity of these factors and the extent and severity of the impact on its customers and suppliers, all of which are uncertain and cannot be predicted. The Company's future results of operations and liquidity could be adversely impacted by delays in payments of outstanding receivable amounts beyond normal payment terms, including potential write-offs due to financial weakness and/or bankruptcy of its customers, supply chain disruptions and uncertain demand, and the impact of any initiatives or programs that the Company may undertake to address financial and operational challenges faced by its customers and suppliers.
As of the issuance date of these condensed consolidated financial statements, the extent to which the COVID-19 pandemic and supply chain disruptions may materially impact the Company's financial condition, liquidity, or results of operations is uncertain.
Reclassifications
Certain prior year period.amounts have been reclassified for consistency with current year presentation. Each of the reclassifications was immaterial and had no effect on the Company's results of operations or cash flows.
We continue
2. RECENT ACCOUNTING PRONOUNCEMENTS
Recent accounting pronouncements issued by the Financial Accounting Standards Board ("FASB") did not and are not expected to investhave a material impact on the Company's financial position, results of operations, or cash flows.
3. DEFERRED COMPENSATION
As of January 1, 2022, the Company held investments in new ideasmutual funds with a fair value totaling $17.0 million, whose holdings are publicly traded debt and technologyequity securities that are held in a rabbi trust under non-qualified deferred compensation plans. The total related deferred compensation liability was $17.0 million as of January 1, 2022. As of April 3, 2021, the Company held investments in mutual funds with a fair value totaling $14.6 million, all of which related to create additional growth opportunities,debt and equity securities that are held in a rabbi trust under non-qualified deferred compensation plans. The total related deferred compensation liability as of April 3, 2021 was $14.6 million. The investments are recorded at fair value in short-term investments in the condensed consolidated balance sheets. The liability is recorded in accrued liabilities and other non-current liabilities in the condensed consolidated balance sheets.
4. DETAILS OF CERTAIN BALANCE SHEET ACCOUNTS
Accounts receivable, net
| | | | | | | | | | | | | | | |
| (in thousands) | | January 1, 2022 | | April 3, 2021 | |
| Accounts receivable | | $ | 358,877 | | | $ | 352,108 | | |
| | | | | |
| Provisions for promotions, rebates, and other | | (82,155) | | | (82,315) | | |
| Provisions for doubtful accounts and sales allowances | | (809) | | | (2,329) | | |
| Accounts receivable, net | | $ | 275,913 | | | $ | 267,464 | | |
The Company maintains a provision for doubtful accounts for estimated losses resulting from the inability of its customers to make required payments. The Company regularly performs credit evaluations of its customers’ financial conditions and considers factors such as Plantronics Manager Pro, our software-as-a-service ("SaaS") data insights offering introducedhistorical experience, credit quality, age of the accounts receivable balances, geographic or country-specific risks, and economic conditions that may affect a customer's ability to pay.
Inventory, net
| | | | | | | | | | | | | | |
| (in thousands) | | January 1, 2022 | | April 3, 2021 |
| Raw materials | | $ | 85,820 | | | $ | 87,050 | |
| Work in process | | 3,277 | | | 9,511 | |
| Finished goods | | 127,653 | | | 97,844 | |
| Inventory, net | | $ | 216,750 | | | $ | 194,405 | |
Accrued Liabilities
| | | | | | | | | | | | | | | |
| (in thousands) | | January 1, 2022 | | April 3, 2021 | |
| Short-term deferred revenue | | $ | 132,498 | | | $ | 141,375 | | |
| Employee compensation and benefits | | 65,757 | | | 84,318 | | |
| Operating lease liabilities, current | | 16,504 | | | 21,701 | | |
| Warranty obligation | | 16,044 | | | 14,774 | | |
| Provision for returns | | 14,133 | | | 25,133 | | |
| | | | | |
| | | | | |
| | | | | |
| | | | | |
| | | | | |
| | | | | |
| | | | | |
| Accrued other | | 83,615 | | | 106,783 | | |
| Accrued liabilities | | $ | 328,551 | | | $ | 394,084 | | |
The Company's warranty obligation is recorded in Fiscal Year 2017,accrued liabilities and Habitat Soundscaping, our intelligent acoustic management solution launched in July 2017. While we anticipate these investments will benefit our growthother non-current liabilities in the long term, their contribution will not be materialcondensed consolidated balance sheets. Changes in the near term.warranty obligation during the nine months ended January 1, 2022 and December 26, 2020 were as follows:
| | | | | | | | | | | | | | |
| | Nine Months Ended |
| (in thousands) | | January 1, 2022 | | December 26, 2020 |
| Warranty obligation at beginning of period | | $ | 17,384 | | | $ | 15,261 | |
| | | | |
| Warranty provision related to products shipped | | 13,179 | | | 17,092 | |
| Deductions for warranty claims processed | | (19,424) | | | (12,736) | |
| Adjustments related to preexisting warranties | | 8,307 | | | (4,097) | |
| Warranty obligation at end of period | | $ | 19,446 | | | $ | 15,520 | |
We remain cautious about
5. PURCHASED INTANGIBLE ASSETS
As of January 1, 2022 and April 3, 2021, the macroeconomic environment, based primarily on uncertainty around tradecarrying value of purchased intangible assets, excluding fully amortized assets and fiscal policy in the U.S. and broader economic uncertainty in many parts of Europe and Asia Pacific. We will continue to monitor our expenditures and prioritize those that further our strategic long-term growth opportunities, suchgoodwill, is as innovative product development. UC and SaaS are the central focus of our sales force, marketing group, and other customer service and support teams as we continue investing in key strategic alliances and integrations with major UC vendors, and work to expand the market opportunity for our SaaS offering.follows:
| | | | | | | | | | | | | | | | | | | | | | | | | | | | | | | | | | | | | | | | | | | | |
| | January 1, 2022 | | April 3, 2021 |
| (in thousands) | | Gross Carrying Amount | | Accumulated Amortization | | Net Carrying Amount | | Weighted Average Remaining Useful Life | | Gross Carrying Amount | | Accumulated Amortization | | Net Carrying Amount |
| Amortizing Assets | | | | | | | | | | | | | | |
| Existing technology | | $ | 427,123 | | | $ | (325,787) | | | $ | 101,336 | | | 1.6 years | | $ | 427,123 | | | $ | (277,071) | | | $ | 150,052 | |
| Customer relationships | | 240,024 | | | (156,441) | | | 83,583 | | | 2.5 years | | 240,024 | | | (128,740) | | | 111,284 | |
| Trade name/Trademarks | | 115,600 | | | (44,955) | | | 70,645 | | | 5.5 years | | 115,600 | | | (35,322) | | | 80,278 | |
| Total intangible assets | | $ | 782,747 | | | $ | (527,183) | | | $ | 255,564 | | | 3.0 years | | $ | 782,747 | | | $ | (441,133) | | | $ | 341,614 | |
RESULTS OF OPERATIONS
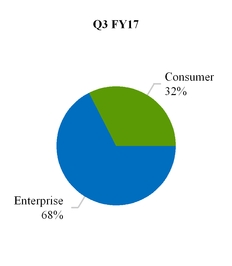
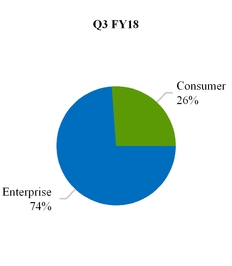
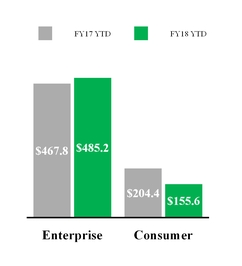
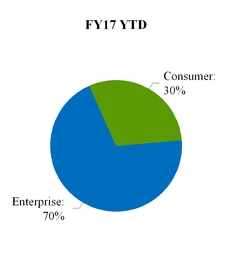
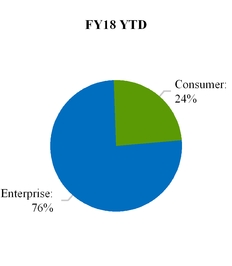
The following graphs display net revenues by product category forDuring the three and nine months ended December 31, 2016January 1, 2022, the Company recognized amortization expense of $27.8 million and 2017:
Net Revenues(in millions) Revenue by Product Category (percent)
Net revenues decreased in the three and nine months ended December 31, 2017 compared to the prior year periods due primarily to lower revenues within our Consumer product category, partially offset by increases in our Enterprise product revenues driven by UC revenues.
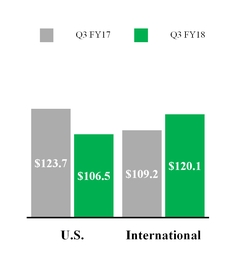
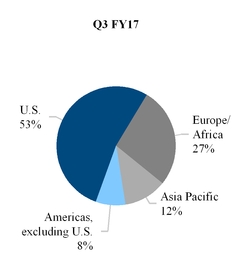
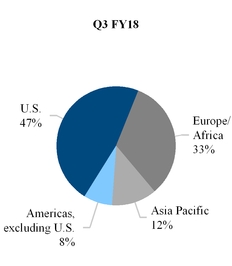
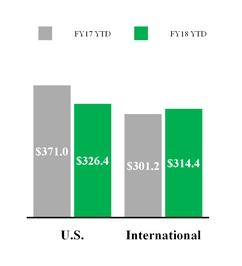
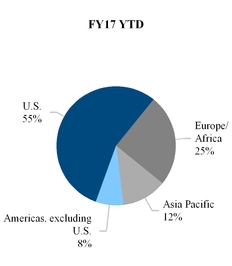
Geographic Information (in millions) Revenue by Region (percent)
Compared to the prior year periods, U.S. net revenues decreased in the three and nine months ended December 31, 2017due primarily to a decline in Consumer product sales volumes, driven by a decline in sales of our stereo Bluetooth products and the divestiture of our Clarity business. These declines were partially offset by increases in Enterprise, resulting from continued growth in UC within both the Voyager and Blackwire product families.
International net revenues for the three and nine months ended December 31, 2017 increased from the same year ago periods due to growth in our Enterprise category, driven primarily by UC product sales. Changes in foreign exchange rates increased net revenues by $4.1$86.0 million, net of the effects of hedging, for the three months ended December 31, 2017, compared to an immaterial impact in the prior year period. During the nine months ended December 31, 2017, changes in foreign exchange rates positively impacted net revenues by $1.3 million, net of the effects of hedging, compared to an immaterial amount in the prior year period.
COST OF REVENUES AND GROSS PROFIT
Cost of revenues consists primarily of direct and contract manufacturing costs, warranty, freight, depreciation, duties, charges for excess and obsolete inventory, royalties, and overhead expenses.
|
| | | | | | | | | | | | | | | | | | | | | | | | | | | | | | |
| | | Three Months Ended | | | | Nine Months Ended | | |
| | | December 31, | | Increase | | December 31, | | Increase |
| (in thousands, except percentages) | | 2016 | | 2017 | | (Decrease) | | 2016 | | 2017 | | (Decrease) |
| Net revenues | | $ | 232,933 |
| | $ | 226,534 |
| | $ | (6,399 | ) | | (2.7 | )% | | $ | 672,222 |
| | $ | 640,760 |
| | $ | (31,462 | ) | | (4.7 | )% |
| Cost of revenues | | 122,753 |
| | 112,409 |
| | (10,344 | ) | | (8.4 | )% | | 338,523 |
| | 315,720 |
| | (22,803 | ) | | (6.7 | )% |
| Gross profit | | $ | 110,180 |
| | $ | 114,125 |
| | $ | 3,945 |
| | 3.6 | % | | $ | 333,699 |
| | $ | 325,040 |
| | $ | (8,659 | ) | | (2.6 | )% |
| Gross profit % | | 47.3 | % | | 50.4 | % | |
|
| | | | 49.6 | % | | 50.7 | % | | | | |
Compared to the same prior year periods, gross profit as a percentage of net revenues increased in the three and nine months ended December 31, 2017, due primarily to product cost reductions and a favorable product mix. Gross profit for the nine months ended December 31, 2017 was also negatively impacted by the loss recorded on the sale of our Clarity division and the write-off of an indirect tax asset in our Brazilian entity, both of which are discussed in detail in Note 8, Restructuring and other related charges (credits), in the accompanying footnotes to the condensed consolidated financial statements.
There are significant variances in gross profit percentages between our higher and lower margin products; therefore, small variations in product mix, which can be difficult to predict, can have a significant impact on gross profit as a percentage of net revenues. Gross profit percentages may also vary based on distribution channel, return rates, and other factors.
RESEARCH, DEVELOPMENT, AND ENGINEERING
Research, development, and engineering costs are expensed as incurred and consist primarily of compensation costs, outside services, including legal fees associated with protecting our intellectual property, expensed materials, travel expenses, depreciation, and overhead expenses.
|
| | | | | | | | | | | | | | | | | | | | | | | | | | | | | | |
| | | Three Months Ended | | | | Nine Months Ended | | |
| | | December 31, | | Increase | | December 31, | | Increase |
| (in thousands, except percentages) | | 2016 | | 2017 | | (Decrease) | | 2016 | | 2017 | | (Decrease) |
| Research, development, and engineering | | $ | 21,393 |
| | $ | 21,257 |
| | $ | (136 | ) | | (0.6 | )% | | $ | 66,116 |
| | $ | 62,402 |
| | $ | (3,714 | ) | | (5.6 | )% |
| % of net revenues | | 9.2 | % | | 9.4 | % | |
| | | | 9.8 | % | | 9.7 | % | | | | |
respectively. During the three and nine months ended December 31, 2017, research, development,26, 2020, the Company recognized amortization expense of $30.7 million and engineering expenses declined when compared$94.5 million, respectively.
Expected amortization expense attributable to purchased intangible assets for each of the prior yearnext five years and thereafter as of January 1, 2022 is as follows:
| | | | | | | | |
| (in thousands) | | Amount |
| 2022 (remaining three months) | | 27,808 |
| 2023 | | 111,232 |
| 2024 | | 65,936 |
| 2025 | | 21,688 |
| 2026 | | 12,844 |
| Thereafter | | 16,056 |
| Total | | $ | 255,564 | |
6. COMMITMENTS AND CONTINGENCIES
Future Minimum Lease Payments
Future minimum lease payments under non-cancelable operating leases as of January 1, 2022 were as follows:
| | | | | | | | |
| (in thousands) | | Operating Leases(1) |
| 2022 (remaining three months) | | $ | 6,443 | |
| 2023 | | 14,875 | |
| 2024 | | 13,419 | |
| 2025 | | 9,669 | |
| 2026 | | 8,100 | |
| Thereafter | | 17,244 | |
| Total lease payments | | 69,750 | |
Less: Imputed interest(2) | | (7,958) | |
| Present value of lease liabilities | | $ | 61,792 | |
(1) The weighted average remaining lease term was 4.8 years as of January 1, 2022.
(2) The weighted average discount rate was 4.6% as of January 1, 2022.
Unconditional Purchase Obligations
We use several contract manufacturers to manufacture raw materials, components, and subassemblies for our products through our supply and demand information that can cover periods due primarilyup to lower compensation expenses, driven primarily by reduced funding78 weeks. The contract manufacturers use this information to acquire components and build products. We also obtain individual components for our products from a wide variety of our variable compensation plansindividual suppliers using a combination of purchase orders, supplier contracts, including annual minimum purchase obligations, and cost reductions from our restructuring actions initiated in prior periods.
SELLING, GENERAL, AND ADMINISTRATIVE
Selling,open orders based on projected demand information. As of January 1, 2022, we had outstanding off-balance sheet third-party manufacturing, component purchase, and other general and administrative expenses consist primarilycommitments of compensation costs, marketing costs, travel expenses, litigation and professional service fees, and overhead expenses.
|
| | | | | | | | | | | | | | | | | | | | | | | | | | | | | | |
| | | Three Months Ended | | | | Nine Months Ended | | |
| | | December 31, | | Increase | | December 31, | | Increase |
| (in thousands, except percentages) | | 2016 | | 2017 | | (Decrease) | | 2016 | | 2017 | | (Decrease) |
| Selling, general, and administrative | | $ | 56,919 |
| | $ | 56,196 |
| | $ | (723 | ) | | (1.3 | )% | | $ | 169,581 |
| | $ | 170,125 |
| | $ | 544 |
| | 0.3 | % |
| % of net revenues | | 24.4 | % |
| 24.8 | % | |
|
| | | | 25.2 | % |
| 26.6 | % | | | | |
Compared to the same year ago periods, selling, general, and administrative expenses were flat in the three and nine months ended December 31, 2017, with increases in legal fees related to our litigation with GN Netcom being offset by lower compensation expenses, driven primarily by reduced funding $615.5 million, including off-balance sheet consigned inventories of our variable compensation plans, lower executive transition costs, cost savings from cost control initiatives and prior period restructuring actions. The litigation with GN Netcom was resolved in October 2017 in favor of the Company on all counts, as discussed further in Note 6, Commitments and Contingencies, in the accompanying footnotes to the condensed consolidated financial statements. As such, we expect legal fees to decrease in future quarters given there are currently no material outstanding legal matters.
(GAIN) LOSS, NET FROM LITIGATION SETTLEMENTS
|
| | | | | | | | | | | | | | | | | | | | | | | | | | | | | | |
| | | Three Months Ended | | | | Nine Months Ended | | |
| | | December 31, | | Increase | | December 31, | | Increase |
| (in thousands, except percentages) | | 2016 | | 2017 | | (Decrease) | | 2016 | | 2017 | | (Decrease) |
| (Gain) loss, net from litigation settlements | | $ | (103 | ) | | $ | (15 | ) | | $ | 88 |
| | (85.4 | )% | | $ | 4,287 |
| | $ | (295 | ) | | $ | (4,582 | ) | | (106.9 | )% |
| % of net revenues | | — | % | | — | % | | | | | | 0.6 | % | | — | % | | | | |
We recognized immaterial gains from litigation in the three months ended December 31, 2016 and 2017. In the nine months ended December 31, 2017, we recognized immaterial gains compared to the prior year period when we recognized a $4.9$65.3 million charge related to discovery sanctions in the GN Netcom litigation.
RESTRUCTURING AND OTHER RELATED CHARGES (CREDITS)
|
| | | | | | | | | | | | | | | | | | | | | | | | | | | | | | |
| | | Three Months Ended | | | | Nine Months Ended | | |
| | | December 31, | | Increase | | December 31, | | Increase |
| (in thousands, except percentages) | | 2016 | | 2017 | | (Decrease) | | 2016 | | 2017 | | (Decrease) |
| Restructuring and other related charges (credits) | | $ | 113 |
| | $ | (84 | ) | | $ | (197 | ) | | (174.3 | )% | | $ | (1,350 | ) | | $ | 2,438 |
| | $ | 3,788 |
| | (280.6 | )% |
| % of net revenues | | — | % | | — | % | | | | | | (0.2 | )% | | 0.4 | % | | | | |
In the three months ended December 31, 2016 and 2017, we recognized immaterial adjustments resulting from changes to the estimates related to restructuring actions recorded in prior periods.
Compared to the prior year period, restructuring and other related charges (credits) increased in the nine months ended December 31, 2017, due to restructuring actions initiated during the first quarter of Fiscal Year 2018. In the prior year period we recorded a net reduction to expenses resulting from changes to the estimates related to our restructuring actions recorded in Fiscal Year 2016.
For more information regarding restructuring activities, refer to Note 8, Restructuring and other related charges (credits), of the accompanying notes to condensed consolidated financial statements.
INTEREST EXPENSE
Interest expense for the three and nine months ended December 31, 2016 and 2017 was $7.3 million and $21.9 million, respectively and relates primarily to our 5.50% Senior Notes.
OTHER NON-OPERATING INCOME AND (EXPENSE), NET |
| | | | | | | | | | | | | | | | | | | | | | | | | | | | | | |
| | | Three Months Ended | | | | Nine Months Ended | | |
| | | December 31, | | Increase | | December 31, | | Increase |
| (in thousands, except percentages) | | 2016 | | 2017 | | (Decrease) | | 2016 | | 2017 | | (Decrease) |
Other non-operating income and (expense), net
| | $ | 427 |
| | $ | 2,490 |
| | $ | 2,063 |
| | 483.1 | % | | $ | 4,119 |
| | $ | 5,230 |
| | $ | 1,111 |
| | 27.0 | % |
| % of net revenues | | 0.2 | % | | 1.1 | % | | | | | | 0.6 | % | | 0.8 | % | | | | |
Other non-operating income and (expense), net for the three months ended December 31, 2017 increased primarily due to favorable changes in the Mexican Peso exchange rate and an increase in interest income from higher average yields on our investment portfolio.
Other non-operating income and (expense), net for the nine months ended December 31, 2017 increased primarily due to increases in interest income from higher average yields on our investment portfolio.
INCOME TAX EXPENSE
|
| | | | | | | | | | | | | | | | | | | | | | | | | | | | | | |
| | | Three Months Ended | | | | | | Nine Months Ended | | | | |
| | | December 31, | | Increase | | December 31, | | Increase |
| (in thousands except percentages) | | 2016 |
| 2017 | | (Decrease) | | 2016 |
| 2017 | | (Decrease) |
| Income before income taxes | | $ | 24,963 |
| | $ | 31,920 |
| | $ | 6,957 |
| | 27.9 | % | | $ | 77,317 |
| | $ | 73,696 |
| | $ | (3,621 | ) | | (4.7 | )% |
| Income tax expense | | 2,742 |
| | 81,424 |
| | 78,682 |
| | 2,869.5 | % | | 14,235 |
| | 84,419 |
| | 70,184 |
| | 493.0 | % |
| Net income | | $ | 22,221 |
| | $ | (49,504 | ) | | $ | (71,725 | ) | | (322.8 | )% | | $ | 63,082 |
| | $ | (10,723 | ) | | $ | (73,805 | ) | | (117.0 | )% |
| Effective tax rate | | 11.0 | % | | 255.1 | % | |
|
| |
| | 18.4 | % | | 114.6 | % | | | | |
On December 22, 2017, the Tax Cuts and Jobs Act (H.R. 1) (the “Act”) was signed into law in the United States. The Act includes several changes to existing tax law, including, among other things, a permanent reduction in the corporate income tax rate from 35% to 21% and the move from a worldwide to a territorial tax system.
The move to a territorial tax system was accompanied by federal taxation of a one-time deemed repatriation of accumulated unremitted earnings (hereafter, the "toll charge"), which we will elect to pay over an eight-year period as permitted under the Act. We recorded a $69.3 million toll charge as part of income tax expense in the quarter ended December 31, 2017, representing a provisional estimate that will be finalized when we complete our review of data spanning a 30-year period. The provisional toll charge increased our effective tax rate by 217.2% and 94.1% for the three and nine months ended December 31, 2017, respectively.
As part of the Act, we also completed our remeasurement of deferred tax assets as of December 31, 2017 to the new future federal tax rate of 21.0%, thereby reducing our deferred tax assets by $2.1 million. The rate change resulted in an overall increase to our effective tax rate by 6.6% and 2.9% for the three and nine months ended December 31, 2017, respectively. In addition, prior to our third quarter of Fiscal Year 2018, we did not recognize a deferred tax liability related to unremitted foreign earnings because our plans did not require us to repatriate earnings from foreign operations to fund U.S. operations. We expect to fund payment of the toll charge by repatriating a portion of our foreign earnings and as such, have recorded a deferred tax liability of $5.0 million related to state income taxes and foreign withholding taxes that will become due as we repatriate our foreign earnings. This increased our effective tax rate by 15.6% and 6.8% for the three and nine months ended December 31, 2017, respectively. Finally, due to our fiscal year-end we are required to pro-rate the new and old tax rates during Fiscal Year 2018. The blended, annualized tax rate applied to Fiscal Year 2018 income is 31.56%. This reduction in the federal tax rate reduced our global tax rate by 2.3% and 1.0% for the three and nine months ended December 31, 2017, respectively.
The provisional estimate for the toll charge will be finalized when we complete our substantive review of unremitted foreign earnings through examination of statutory filings and tax returns of our foreign subsidiaries and fiscal branches that span a 30-year period. We must also analyze the impact of foreign exchange rates and inflation on the historical information to support foreign tax credits available to offset the toll charge. In addition, our estimate of the toll charge obligation may change due to legislative technical corrections, the IRS' promulgation of regulations to interpret the Act, and changes in accounting standards for income taxes or related interpretations in response to the Act. This review and finalization of the toll charge provisional estimate will be completed within a twelve month measurement period from the date of enactment.
We adopted the new stock-based compensation accounting guidance effective the beginning of Fiscal Year 2018. Excess tax benefits associated with employee equity plans were previously recorded in additional paid-in capital and the adoption of this guidance had an immaterial impact on our effective tax rate for the three months ended December 31, 2017, but resulted in a reduction to our effective tax rate by 2.6 percentage points for the nine months ended December 31, 2017. The amount of excess tax benefits or deficiencies will fluctuate from period-to-period based on the price of our stock, the volume of share-based instruments settled or vested, and the value assigned to employee equity awards under U.S. GAAP.
We recorded a correction to the geographic mix of income during the nine months ended December 31, 2017 related to Fiscal Year 2017, which reduced income in a high tax jurisdiction and increased income in a low tax jurisdiction. This correcting adjustment had no impact on the three months ended December 31, 2017, but resulted in a reduction to our effective tax rate by 3.5 percentage points for the nine months ended December 31, 2017 as compared to the prior year period. For additional details regarding this correction refer to Note 1, Basis of Presentation, in the accompanying footnotes to the condensed consolidated financial statements.
We are subject to taxation in various foreign and state jurisdictions, including the U.S. Our Fiscal Year 2016 federal income tax return is currently under examination by the Internal Revenue Service. Foreign income tax matters for material tax jurisdictions have been concluded for tax years prior to Fiscal Year 2012.
FINANCIAL CONDITION
|
| | |
Operating Cash Flow (in millions)
| Investing Cash Flow(in millions)
| Financing Cash Flow (in millions)
|
Our primary source of liquidity is cash provided by operating activities and, on occasion, financing obtained from capital markets and other financing sources, such as our revolving credit line. We believe that internally generated cash flows are generally sufficient to support our business operations, capital expenditures, restructuring activities, principal and interest payment of debt, income tax payments and the payment of stockholder dividends, in addition to investments and share repurchases. We expect that cash provided by operating activities will fluctuate in future periods as a result of a number of factors, including fluctuations in our revenues and operating income, the timing of product shipments during the quarter, accounts receivable collections, inventory and supply chain management, and the timing and amount of tax, interest, annual bonus, and other payments.
Operating Activities
Compared to the same year ago period, net cash provided by operating activities during the nine months ended December 31, 2017 decreased primarily as a result of higher payouts in the first quarter of Fiscal Year 2018 related to Fiscal Year 2017 variable compensation than payouts during the prior year period for Fiscal Year 2016 variable compensation, due to better achievements against Corporate targets in Fiscal Year 2017.
Investing Activities
Compared to the same year ago period, we used more cash for investing activities during the nine months ended December 31, 2017 for increased investment purchases, net of proceeds received from the sale and maturity of securities in our portfolio. This increase was partially offset by lower capital expenditures.
We estimate total capital expenditures for Fiscal Year 2018 will be approximately $14.0 million to $17.0 million. We expect capital expenditures for the remainder of Fiscal Year 2018 to consist primarily of IT investments, capital investment in our manufacturing capabilities, including tooling for new products, and facilities upgrades.
Financing Activities
Net cash used for financing activities during the nine months ended December 31, 2017 increased from the prior year period resulting primarily from an increase in cash used for common stock repurchases due to a lower average stock price, partially offset by higher net proceeds from stock-based compensation plans.
On January 30, 2018, we announced that the Audit Committee of our Board ("the Audit Committee") had declared a cash dividend of $0.15 per share, payable on March 9, 2018 to stockholders of record at the close of business on February 20, 2018. We expect to continue paying a quarterly dividend of $0.15 per share; however, the actual declaration of dividends and the establishment of record and payment dates are subject to final determination by the Audit Committee each quarter after its review of our financial performance and financial position.
Liquidity and Capital Resources
At December 31, 2017, we had working capital of $619.4 million, including $499.1 million of cash, cash equivalents, and short-term investments, compared with working capital of $581.8 million, including $480.1 million of cash, cash equivalents, and short-term investments at March 31, 2017.
Our cash and cash equivalents as of December 31, 2017 consisted of bank deposits with third party financial institutions, US Treasury Bills, and Commercial Paper. We monitor bank balances in our operating accounts and adjust the balances as appropriate. Cash balances are held throughout the world, including substantial amounts held outside of the U.S. As of December 31, 2017, of our $499.1 million of cash, cash equivalents, and short-term investments, $17.8 million was held domestically while $481.2 million was held by foreign subsidiaries, approximately 90% of which was based in USD-denominated investments.
Prior to our third quarter of Fiscal Year 2018, we did not recognize a deferred tax liability related to unremitted foreign earnings because our plans did not require us to repatriate earnings from foreign operations to fund our U.S. operations. The Tax Cuts and Jobs Act (H.R. 1) (the "Act") was signed into law in the U.S. on December 22, 2017, which, among other things, introduced the move from a worldwide to a territorial tax system and imposed a one-time tax on a deemed repatriation of accumulated foreign earnings (hereafter, the "toll charge"). We recorded a $69.3 million toll charge as part of income tax expense in the quarter ended December 31, 2017, representing a provisional estimate of our obligation and which we will pay over an eight-year period as permitted under the Act. We expect to fund payment of the toll charge by repatriating a portion of our foreign earnings and as such, we recorded a deferred tax liability of $5 million related to state income taxes and foreign withholding taxes that will become due as we repatriate foreign earnings. For additional details, refer to Note 13, Income Taxes, in the accompanying footnotes to the condensed consolidated financial statements.
Our primary discretionary cash requirements have historically been for repurchases of our common stock and to fund stockholder dividends. As a result of the issuance of the 5.50% Senior Notes in May 2015, we are required to make interest payments of approximately $13.8 million each November and May through the life of the notes. Both the interest payments on the 5.50% Senior Notes and the payments for the toll charge described above will decrease our liquidity. We generate sufficient operating cash flow and have access to external funding under our revolving credit facility to provide for these payments. For additional details, refer to Note 7, Debt, and Note 13, Income Taxes, in the accompanying footnotes to the condensed consolidated financial statements.
Our short and long-term investments are intended to establish a high-quality portfolio that preserves principal and meets liquidity needs. As of December 31, 2017, our investments were composed of Mutual Funds, US Treasury Notes, Government Agency Securities, Commercial Paper, Corporate Bonds, and Certificates of Deposits ("CDs").
From time to time, depending on market conditions, our Board has authorized plans under which we may repurchase shares of our common stock in the open market or through privately negotiated transactions. During the nine months ended December 31, 2017, we repurchased 1,138,903 shares of our common stock in the open market as part of these publicly announced repurchase programs. The total cost of these repurchases was $52.9 million, with an average price of $46.46 per share. In addition, we withheld 210,416 shares with a total value of $11.2 million in satisfaction of employee tax withholding obligations upon the vesting of restricted stock granted under our stock plans.
As of December 31, 2017, there remained 730,932 shares authorized for repurchase under the stock repurchase program approved by the Board on July 27, 2017. For more information regarding our stock repurchase programs, refer to Note 10, Common Stock Repurchases, in the accompanying notes to the condensed consolidated financial statements.
In May 2011, we entered into a credit agreement with Wells Fargo Bank, National Association ("the Bank"), which was most recently amended in April 2017 (as amended, the "Credit Agreement"). The Credit Agreement provides for a $100.0 million unsecured revolving credit facility. Revolving loans under the Credit Agreement will bear interest, at our election, at (i) the Bank’s announced prime rate less 1.20% per annum or (ii) a daily one-month LIBOR rate plus 1.40% per annum. Principal, together with all accrued and unpaid interest, on the revolving loans is due and payable on May 9, 2020. We are also obligated to pay a commitment fee of 0.37% per annum on the average daily unused amount of the revolving line of credit, which fee shall be payable quarterly in arrears. We may prepay the loans and terminate the commitments under the Credit Agreement at any time, without premium or penalty, subject to the reimbursement of certain costs. During the third quarter of Fiscal Year 2018 we borrowed and repaid $8 million from our line of credit and as of December 31, 2017, we had no outstanding borrowings. The line of credit requires us to comply with the following two financial covenant ratios, in each case at each fiscal quarter end and determined on a rolling four-quarter basis:
maximum ratio of funded debt to earnings before interest, taxes, depreciation and amortization ("EBITDA") of 3.25:1 (previously 3:1); and
minimum EBITDA coverage ratio, which is calculated as interest payments divided by EBITDA.
In addition, we and our subsidiaries are required to maintain unrestricted cash, cash equivalents, and marketable securities plus availability under the Credit Agreement at the end of each fiscal quarter of at least $300.0 million. The Credit Agreement contains customary events of default that include, among other things, payment defaults, covenant defaults, cross-defaults with certain other indebtedness, bankruptcy and insolvency defaults, and judgment defaults. The occurrence of an event of default could result in the acceleration of the obligations under the Credit Agreement. As of December 31, 2017, we were in compliance with all ratios and covenants.
During Fiscal Year 2016, we obtained $488.4 million in aggregate principal amount, net of issuance costs, from the issuance of our 5.50% Senior Notes. The Notes mature on May 31, 2023, and bear interest at a rate of 5.50% per annum, payable semi-annually
on May 15 and November 15. A portion of the proceeds was used to repay all then-outstanding amounts under our revolving line of credit agreement with Wells Fargo Bank and the remaining proceeds were used primarily for share repurchases.
Our liquidity, capital resources, and results of operations in any period could be affected by repurchases of our common stock, the payment of cash dividends, the exercise of outstanding stock options, restricted stock grants under stock plans, and the issuance of common stock under our Employee Stock Purchase Plan ("ESPP"). We receive cash from the exercise of outstanding stock options under our stock plan and the issuance of shares under our ESPP. However, the resulting increase in the number of outstanding shares from these equity grants and issuances could affect our earnings per share. We cannot predict the timing or amount of proceeds from the sale or exercise of these securities or whether they will be exercised, forfeited, canceled, or will expire.
We believe that our current cash and cash equivalents, short-term investments, cash provided by operations, and the availability of additional funds under the Credit Agreement will be sufficient to fund operations for at least the next 12 months; however, any projections of future financial needs and sources of working capital are subject to uncertainty. Readers are cautioned to review the risks, uncertainties, and assumptions set forth in this Quarterly Report on Form 10-Q, including the section entitled "Certain Forward-Looking Information" and the risk factors set forth in our Annual Report on Form 10-K for the fiscal year ended March 31, 2017, filed with the SEC on May 10, 2017, and other periodic filings with the SEC, any of which could affect our estimates for future financial needs and sources of working capital.
OFF BALANCE SHEET ARRANGEMENTS AND CONTRACTUAL OBLIGATIONS
We have not entered into any transactions with unconsolidated entities giving rise to financial guarantees, subordinated retained interests, derivative instruments, or other contingent arrangements that expose us to material continuing risks, contingent liabilities, or any other obligation under a variable interest in an unconsolidated entity that provides us with financing and liquidity support, market risk, or credit risk support.
A substantial portion of the raw materials, components, and subassemblies used in our products are provided by our suppliers on a consignment basis. These consigned inventories are not recorded on our condensed consolidated balance sheetsheets until we take title to the raw materials, components, and subassemblies, which occurs when they are consumed in the production process. Prior to consumption in the production process, our suppliers bear the risk of loss and retain title to the consigned inventory. The terms of the agreements allow us to return parts in excess of maximum order quantities to the suppliers at the supplier’s expense. Returns for other reasons are negotiated with the suppliers on a case-by-case basis and to date have been immaterial. If our suppliers were to discontinue financing consigned inventory, it would require us to make cash outlays and we could incur expenses which, if material, could negatively affect our business and financial results. As of March 31, 2017 and December 31, 2017, we had off-balance sheet consigned inventories of $52.3 million and $56.1 million, respectively.
Unconditional Purchase Obligations
We utilize several contract manufacturers to procure raw materials, components, and subassemblies for our products. We provide these contract manufacturers with demand information that typically covers periods up to 13 weeks, and they use this information to acquire components and build products. We also obtain individual components for our products from a wide variety of individual suppliers. Consistent with industry practice, we acquire components through a combination of purchase orders, supplier contracts, and open orders based on projected demand information. As of December 31, 2017, we had outstanding off-balance sheet third-party manufacturing, component purchase, and other general and administrative commitments of $192.3 million, including off-balance sheet consigned inventories of $56.1 million as discussed above.
During the quarter ended December 31, 2017, our short and long-term tax obligations increased due to introduction of the Tax Cuts and Jobs Act (H.R. 1) (the “Act”), signed into law on December 22, 2017 and requiring the payment of a one-time deemed repatriation of accumulated unremitted earnings (the "toll charge"). As permitted under the Act, we have elected to pay the toll charge obligation over an 8-year period, as follows:
|
| | | | | | | | | | | | | | | |
| (in millions) | Total | Less than 1 year | 1 - 3 years | 3 - 5 years | More than 5 years |
| Toll charge | $ | 69.3 |
| $ | 5.5 |
| $ | 11.0 |
| $ | 11.2 |
| $ | 41.6 |
|
For additional details regarding the Act and the toll charge, refer to Note 13, Income Taxes, in the accompanying footnotes to the condensed consolidated financial statements.
Except as described above, there have been no material changes in our contractual obligations as described in our Annual Report on Form 10-K for the fiscal year ended March 31, 2017.
CRITICAL ACCOUNTING ESTIMATES
For a complete description of what we believe to be the critical accounting estimates used in the preparation of our condensed consolidated financial statements, refer to our Annual Report on Form 10-K for the fiscal year ended March 31, 2017, filed with the SEC on May 10, 2017.
During the quarter ended December 31, 2017, the Tax Cuts and Jobs Act (H.R. 1) (the “Act”) was signed into law in the United States. The Act includes several changes to existing tax law, including, among other things, a permanent reduction in the corporate income tax rate from 35% to 21% and the move from a worldwide to a territorial tax system. The move to a territorial tax system was accompanied by federal taxation of a one-time deemed repatriation of accumulated unremitted earnings (hereafter, the "toll charge"). The toll charge is a provisional estimate and is based on the application of certain tax rates to foreign unremitted cash and cash equivalents and permanently reinvested foreign assets. Our estimate of the toll charge obligation may change due to changes in interpretations of the Act, legislative action to address questions that arise because of the Tax Act, any changes in accounting standards for income taxes or related interpretations in response to the Tax Act, or any updates or changes to estimates we have utilized to calculate the transition impacts, including impacts from foreign exchange rates of foreign subsidiaries and the effects of inflation. We will finalize the estimate within a twelve-month period from the date of enactment of December 22, 2017.
In addition, prior to our third quarter of Fiscal Year 2018, we did not recognize a deferred tax liability related to unremitted foreign earnings because our plans did not require the Company to repatriate earnings from foreign operations to fund U.S. operations. We expect to fund payment of the toll charge by repatriating a portion of our foreign earnings and as such, have recorded a deferred tax liability related to state income taxes and foreign withholding taxes that will become due as the Company repatriates foreign earnings.
Refer to additional details surrounding impacts of the Act at Note 13, Income Taxes,consume unconditional purchase obligations in the accompanying footnotes to the condensed consolidated financial statements.
Other than the above item, there have been no changes to our critical accounting estimates during the nine months ended December 31, 2017.
Recent Accounting Pronouncements
For more information regarding the Recent Accounting Pronouncements that may impact us, refer to Note 2, Recent Accounting Pronouncements, of the accompanying notes to the condensed consolidated financial statements.
Financial Statements (Unaudited)
PLANTRONICS, INC.
CONDENSED CONSOLIDATED BALANCE SHEETS
(in thousands)
|
| | | | | | | |
| | March 31,
2017 | | December 31,
2017 |
| ASSETS | | | |
| Current assets: | | | |
| Cash and cash equivalents | $ | 301,970 |
| | $ | 280,293 |
|
| Short-term investments | 178,179 |
| | 218,773 |
|
| Accounts receivable, net | 141,177 |
| | 143,919 |
|
| Inventory, net | 55,456 |
| | 64,574 |
|
| Other current assets | 22,195 |
| | 19,460 |
|
| Total current assets | 698,977 |
| | 727,019 |
|
| Long-term investments | 127,176 |
| | 118,870 |
|
| Property, plant, and equipment, net | 150,307 |
| | 144,802 |
|
| Goodwill and purchased intangibles, net | 15,577 |
| | 15,498 |
|
| Deferred tax assets | 23,242 |
| | 14,783 |
|
| Other assets | 1,880 |
| | 1,681 |
|
| Total assets | $ | 1,017,159 |
| | $ | 1,022,653 |
|
| | | | |
| LIABILITIES AND STOCKHOLDERS' EQUITY | |
| | |
|
| Current liabilities: | |
| | |
|
| Accounts payable | $ | 42,885 |
| | $ | 45,685 |
|
| Accrued liabilities | 74,285 |
| | 61,906 |
|
| Total current liabilities | 117,170 |
| | 107,591 |
|
| Long term debt, net of issuance costs | 491,059 |
| | 492,146 |
|
| Long-term income taxes payable | 11,729 |
| | 74,476 |
|
| Other long-term liabilities | 15,045 |
| | 19,419 |
|
| Total liabilities | $ | 635,003 |
| | $ | 693,632 |
|
| Commitments and contingencies (Note 6) |
|
| |
|
|
| Stockholders' equity: | |
| | |
|
| Common stock | $ | 804 |
| | $ | 814 |
|
| Additional paid-in capital | 818,777 |
| | 858,253 |
|
| Accumulated other comprehensive income | 4,694 |
| | 1,905 |
|
| Retained earnings | 319,931 |
| | 294,200 |
|
| Total stockholders' equity before treasury stock | 1,144,206 |
| | 1,155,172 |
|
| Less: Treasury stock, at cost | (762,050 | ) | | (826,151 | ) |
| Total stockholders' equity | 382,156 |
| | 329,021 |
|
| Total liabilities and stockholders' equity | $ | 1,017,159 |
| | $ | 1,022,653 |
|
The accompanying notes are an integral part of these condensed consolidated financial statements.
PLANTRONICS, INC.
CONDENSED CONSOLIDATED STATEMENTS OF OPERATIONS
(in thousands, except per share data)
(Unaudited)
|
| | | | | | | | | | | | | | | |
| | Three Months Ended December 31, | | Nine Months Ended
December 31, |
| | 2016 | | 2017 | | 2016 | | 2017 |
| Net revenues | $ | 232,933 |
| | $ | 226,534 |
| | $ | 672,222 |
| | $ | 640,760 |
|
| Cost of revenues | 122,753 |
| | 112,409 |
| | 338,523 |
| | 315,720 |
|
| Gross profit | 110,180 |
| | 114,125 |
| | 333,699 |
| | 325,040 |
|
| Operating expenses: | | | | | | | |
| Research, development, and engineering | 21,393 |
| | 21,257 |
| | 66,116 |
| | 62,402 |
|
| Selling, general, and administrative | 56,919 |
| | 56,196 |
| | 169,581 |
| | 170,125 |
|
| (Gain) loss, net from litigation settlements | (103 | ) | | (15 | ) | | 4,287 |
| | (295 | ) |
| Restructuring and other related charges (credits) | 113 |
| | (84 | ) | | (1,350 | ) | | 2,438 |
|
| Total operating expenses | 78,322 |
| | 77,354 |
| | 238,634 |
| | 234,670 |
|
| Operating income | 31,858 |
| | 36,771 |
| | 95,065 |
| | 90,370 |
|
| Interest expense | (7,322 | ) | | (7,341 | ) | | (21,867 | ) | | (21,904 | ) |
| Other non-operating income and (expense), net | 427 |
| | 2,490 |
| | 4,119 |
| | 5,230 |
|
| Income before income taxes | 24,963 |
| | 31,920 |
| | 77,317 |
| | 73,696 |
|
| Income tax expense | 2,742 |
| | 81,424 |
| | 14,235 |
| | 84,419 |
|
| Net income (loss) | $ | 22,221 |
| | $ | (49,504 | ) | | $ | 63,082 |
| | $ | (10,723 | ) |
| | | | | | | | |
| Earnings (Loss) per common share: | | | | | | | |
| Basic | $ | 0.69 |
| | $ | (1.54 | ) | | $ | 1.96 |
| | $ | (0.33 | ) |
| Diluted | $ | 0.68 |
| | $ | (1.54 | ) | | $ | 1.92 |
| | $ | (0.33 | ) |
| | | | | | | | |
| Shares used in computing earnings (loss) per common share: | | | | | | | |
| Basic | 32,242 |
| | 32,075 |
| | 32,260 |
| | 32,384 |
|
| Diluted | 32,826 |
| | 32,075 |
| | 32,895 |
| | 32,384 |
|
| | | | | | | | |
| Cash dividends declared per common share | $ | 0.15 |
| | $ | 0.15 |
| | $ | 0.45 |
| | $ | 0.45 |
|
The accompanying notes are an integral part of these condensed consolidated financial statements.
PLANTRONICS, INC.
CONDENSED CONSOLIDATED STATEMENTS OF COMPREHENSIVE INCOME (LOSS)
(in thousands)
(Unaudited)
|
| | | | | | | | | | | | | | | |
| | Three Months Ended December 31, | | Nine Months Ended
December 31, |
| | 2016 | | 2017 | | 2016 | | 2017 |
| Net income (loss) | $ | 22,221 |
| | $ | (49,504 | ) | | $ | 63,082 |
| | $ | (10,723 | ) |
| Other comprehensive income (loss): | | | | | | | |
| Foreign currency translation adjustments | 82 |
| | — |
| | (168 | ) | | 257 |
|
| Unrealized gains (losses) on cash flow hedges: | | | | | | | |
| Unrealized cash flow hedge gains (losses) arising during the period | 2,090 |
| | (446 | ) | | 2,394 |
| | (5,093 | ) |
| Net (gains) losses reclassified into income for revenue hedges | (2,178 | ) | | 1,357 |
| | (3,163 | ) | | 2,506 |
|
| Net (gains) losses reclassified into income for cost of revenue hedges | 756 |
| | (61 | ) | | 2,072 |
| | (193 | ) |
| Net unrealized gains (losses) on cash flow hedges | 668 |
| | 850 |
| | 1,303 |
| | (2,780 | ) |
| Unrealized gains (losses) on investments: | | | | | | | |
| Unrealized holding gains (losses) during the period | (628 | ) | | (658 | ) | | (586 | ) | | (449 | ) |
| | | | | | | | |
| Aggregate income tax benefit (expense) of the above items | 156 |
| | 181 |
| | 130 |
| | 182 |
|
| Other comprehensive income (loss) | 278 |
| | 373 |
| | 679 |
| | (2,790 | ) |
| Comprehensive income (loss) | $ | 22,499 |
| | $ | (49,131 | ) | | $ | 63,761 |
| | $ | (13,513 | ) |
The accompanying notes are an integral part of these condensed consolidated financial statements.
PLANTRONICS, INC.
CONDENSED CONSOLIDATED STATEMENTS OF CASH FLOWS
(in thousands)
|
| | | | | | | |
| | Nine Months Ended |
| | December 31, |
| | 2016 | | 2017 |
| CASH FLOWS FROM OPERATING ACTIVITIES | | | |
| Net income (loss) | $ | 63,082 |
| | $ | (10,723 | ) |
| Adjustments to reconcile net income (loss) to net cash provided by operating activities: | | | |
| Depreciation and amortization | 15,624 |
| | 15,894 |
|
| Amortization of debt issuance costs | 1,087 |
| | 1,087 |
|
| Stock-based compensation | 25,005 |
| | 26,047 |
|
| Deferred income taxes | (753 | ) | | 10,490 |
|
| Provision for excess and obsolete inventories | 1,292 |
| | 2,013 |
|
| Restructuring and related charges (credits) | (1,350 | ) | | 2,438 |
|
| Cash payments for restructuring charges | (3,793 | ) | | (2,911 | ) |
| Other operating activities | 633 |
| | (645 | ) |
| Changes in assets and liabilities: | | | |
|
| Accounts receivable, net | (13,448 | ) | | (3,153 | ) |
| Inventory, net | (5,990 | ) | | (9,577 | ) |
| Current and other assets | (2,346 | ) | | (3,066 | ) |
| Accounts payable | 3,626 |
| | 2,783 |
|
| Accrued liabilities | 6,191 |
| | (15,695 | ) |
| Income taxes | (1,141 | ) | | 66,387 |
|
| Cash provided by operating activities | 87,719 |
| | 81,369 |
|
| CASH FLOWS FROM INVESTING ACTIVITIES | | | |
|
| Proceeds from sales of investments | 143,631 |
| | 54,411 |
|
| Proceeds from maturities of investments | 97,253 |
| | 146,989 |
|
| Purchase of investments | (247,491 | ) | | (232,840 | ) |
| Capital expenditures | (19,603 | ) | | (9,403 | ) |
| Cash used for investing activities | (26,210 | ) | | (40,843 | ) |
| CASH FLOWS FROM FINANCING ACTIVITIES | | | |
|
| Repurchase of common stock | (34,236 | ) | | (52,915 | ) |
| Employees' tax withheld and paid for restricted stock and restricted stock units | (9,444 | ) | | (11,186 | ) |
| Proceeds from issuances under stock-based compensation plans | 6,516 |
| | 13,446 |
|
| Proceeds from revolving line of credit | — |
| | 8,000 |
|
| Repayments of revolving line of credit | — |
| | (8,000 | ) |
| Payment of cash dividends | (14,947 | ) | | (15,008 | ) |
| Other financing activity | 761 |
| | — |
|
| Cash used for financing activities | (51,350 | ) | | (65,663 | ) |
| Effect of exchange rate changes on cash and cash equivalents | (2,964 | ) | | 3,460 |
|
| Net increase (decrease) in cash and cash equivalents | 7,195 |
| | (21,677 | ) |
| Cash and cash equivalents at beginning of period | 235,266 |
| | 301,970 |
|
| Cash and cash equivalents at end of period | $ | 242,461 |
| | $ | 280,293 |
|
| SUPPLEMENTAL NON-CASH DISCLOSURES | | | |
| Accounts payable for purchases of property, plant, and equipment | $ | 1,052 |
| | $ | 3,895 |
|
The accompanying notes are an integral part of these condensed consolidated financial statements.
PLANTRONICS, INC.
NOTES TO CONDENSED CONSOLIDATED FINANCIAL STATEMENTS
(Unaudited)
1. BASIS OF PRESENTATION
In the opinion of management, the accompanying unaudited condensed consolidated financial statements ("financial statements") of Plantronics, Inc. ("Plantronics" or "the Company") have been prepared on a basis materially consistent with the Company's March 31, 2017 audited consolidated financial statements and include all adjustments, consisting of normal recurring adjustments, necessary to fairly state the information set forth herein. Certain information and footnote disclosures normally included in financial statements prepared pursuant to the rules and regulations of the Securities and Exchange Commission ("SEC") applicable to interim financial information and in accordance with accounting principles generally accepted in the United States of America ("U.S. GAAP") have been condensed or omitted pursuant to such rules and regulations. The financial statements should be read in conjunction with the audited consolidated financial statements and notes thereto included in the Company's Annual Report on Form 10-K for the fiscal year ended March 31, 2017, which was filed with the SEC on May 10, 2017. The results of operations for the interim period ended December 31, 2017 are not necessarily indicative of the results to be expected for the entire fiscal year or any future period.
The financial statements include the accounts of the Company and its wholly owned subsidiaries. All intercompany balances and transactions have been eliminated.
The Company’s fiscal year ends on the Saturday closest to the last day of March. The Company’s current and prior fiscal years end on March 31, 2018 and April 1, 2017, respectively, and both consist of 52 weeks. The Company’s results of operations for the three and nine months ended December 30, 2017 and December 31, 2016 both contain 13 weeks. For purposes of presentation, the Company has indicated its accounting year as ending on March 31 and its interim quarterly periods as ending on the applicable calendar month end.
Certain immaterial reclassifications to our previously reported financial information have been made to conform to the current period presentation. In addition, refer to Note 2, Recent Accounting Pronouncements, for details regarding reclassifications made in our condensed consolidated statements of cash flows pursuant to the adoption of new share-based payment accounting guidance in the first quarter of Fiscal Year 2018.
Earnings per common share:
The Company has a share-based compensation plan under which employees, non-employee directors, and consultants may be granted share-based payment awards, including shares of restricted stock on which non-forfeitable dividends are paid on unvested shares. As such, shares of restricted stock are considered participating securities under the two-class method of calculating earnings per share. Historically, the two-class method of calculating earnings per share did not have a material impact on the Company's earnings per share calculation under the treasury stock method. Beginning in the second quarter of Fiscal Year 2018, the Company applied the two-class method of calculating earnings per share because the ratio of participating securities to the weighted average number of common shares outstanding has increased as compared to the historical average, and this dilution will continue if the Company continues to repurchase its common stock at current levels. During periods of net loss, no effect is given to participating securities since they do not share in the losses of the Company; therefore, the treasury stock method was used to calculate earnings per common share for the three and nine months ended December 31, 2017. For further details refer to Note 14, Computation of Earnings Per Common Share.
Immaterial Out-of-Period Correction:
During the first quarter of Fiscal Year 2018, the Company recognized an out-of-period correction to its Fiscal Year 2017 geographic mix of taxable income, which resulted in an overstatement of Fiscal Year 2017 income tax expense by $2.8 million. The Company's correction, recognized in the quarter ended June 30, 2017, resulted in a $2.8 million benefit to income tax expense. The Company assessed the materiality of this error and concluded it was not material to Fiscal Year 2017 and is not expected to be material to the full Fiscal Year 2018.
2. RECENT ACCOUNTING PRONOUNCEMENTS
Recently Issued Pronouncements
In May 2014, the Financial Accounting Standards Board ("FASB") issued guidance regarding revenue from contracts with customers. While the standard supersedes existing revenue recognition guidance, it closely aligns with current U.S. GAAP. Under the new standard, revenue will be recognized at the time control of a good or service is transferred to a customer for the amount of consideration received or to be received for that specific good or service. Entities may use a full retrospective approach or report the cumulative effect as of the date of adoption. In March 2016, the FASB issued additional guidance concerning "Principal versus Agent" considerations (reporting revenue gross versus net); in April 2016, the FASB issued additional guidance on identifying performance obligations and licensing; and in May 2016, the FASB issued additional guidance on collectability, non-cash consideration, presentation of sales tax, and transition. These updates are intended to improve the operability and understandability of the implementation guidance and have the same effective date and transition requirements as the greater "contracts with customers" standard. The Company will adopt the standard, as amended, in the first quarter of its fiscal year ending March 31, 2019, utilizing the modified retrospective method of adoption. The Company has completed its initial review of the impact of this guidance, and does not anticipate a material impact on its revenue recognition policies. The Company will continue to assess all potential impacts of the standard, and currently believes the most significantly impacted areas are the following:
Software Revenue: The Company currently defers revenue for the value of software where vendor specific objective evidence ("VSOE") of fair value has not been established for undelivered items. Under Topic 606, revenue for such licenses will be recognized at the transfer of control, rather than ratably, as the VSOE requirement no longer applies and the value of the remaining services are not material in the context of the contract. At December 31, 2017, deferred revenue under Topic 605 for these licenses was $2.1 million. The Company expects the remaining balance of such deferred revenue will be eliminated as a cumulative effect adjustment of implementing Topic 606 in the first quarter of its fiscal year ending March 31, 2019.
Marketing Development Funds: The Company frequently provides marketing development funds to its channel partners. Under topic 605, our marketing development funds are recognized as a reduction of revenue at the later of when the related revenue is recognized or when the program is offered to the channel partner. Applying the criteria of Topic 606, these marketing development programs qualify as variable consideration, and are assigned as a reduction of the transaction price of the contract. This results in a timing difference such that all or some of the funds related to a program may be recognized in different periods than under Topic 605, depending on the circumstances. Based on analysis of prior periods, we anticipate that this timing difference impacts revenue by immaterial amounts in a given period. The full impact of the adjustment is still being analyzed by the Company.
Revenue Reserves: The Company establishes reserves for Discounts and Rebates and Sales Returns at the end of each fiscal period. These reserves are estimated based on current relevant and historical data, but there can be some variability associated with unforeseen changes in customer claim and return patterns. Under Topic 606, in cases where there is uncertainty around the variable consideration amount, a constraint, or an adjustment to ensure that a significant revenue reversal will not occur, on that consideration must be considered. Based on analysis of prior periods, we anticipate that impact of introducing this constraint will not materially impact revenue. The full impact of the adjustment is still being analyzed by the Company.
In addition,the standard also requires new, expanded disclosures regarding revenue recognition. The Company will continue to monitor additional changes, modifications, clarifications or interpretations being undertaken by the FASB, which may impact its current conclusions.
In January 2016, the FASB issued guidance regarding the recognition and measurement of financial assets and liabilities. Changes to the current U.S. GAAP model primarily affect the accounting for equity investments, financial liabilities under the fair value option, and the presentation and disclosure requirements for financial instruments. In addition, the FASB clarified guidance related to the valuation allowance assessment when recognizing deferred tax assets resulting from unrealized losses on available-for-sale debt securities. The Company is required to adopt the standard in the first quarter of its fiscal year ending March 31, 2019, but may elect to adopt earlier as permitted under the standard. The Company is currently evaluating what impact, if any, the adoption of this standard will have on its consolidated financial statements and related disclosures.
In February 2016, the FASB issued guidance regarding both operating and financing leases, requiring lessees to recognize on their balance sheets "right-of-use assets" and corresponding lease liabilities, measured on a discounted basis over the lease term. Virtually all leases will be subject to this treatment except leases that meet the definition of a "short-term lease". For expense recognition, the dual model requiring leases to be classified as either operating or finance leases has been retained from the prior standard. Operating leases will result in straight-line expense while finance leases will result in a front-loaded expense pattern. Classification will use criteria very similar to those applied in current lease accounting, but without explicit bright lines. Extensive additional quantitative and qualitative disclosures, including significant judgments made by management, will be required to provide greater insight into the extent of expense recognized and expected to be recognized. The new lease guidance will essentially eliminate off-balance sheet financing. The guidance is effective for the Company's fiscal year ending March 31, 2020. The new standard must be adopted using a modified retrospective transition that provides for certain practical expedients and requires the new guidance to be applied at the beginning of the earliest comparative period presented. The Company expects adoption of this guidance will materially increase the assets and liabilities recorded on its condensed consolidated balance sheets, but is still evaluating the impact on its consolidated financial statements and related disclosures.
In June 2016, the FASB issued guidance regarding the measurement of credit losses on financial instruments, which changes the impairment model for most financial assets. The new model uses a forward-looking expected loss method, which will generally result in earlier recognition of allowances for losses. The guidance is effective for the Company's fiscal year ending March 31, 2021 with early adoption permitted beginning in the first quarter of Fiscal Year 2020. The Company is currently evaluating the impact the adoption of this standard will have on its consolidated financial statements and related disclosures.
In January 2017, the FASB issued guidance that revises the definition of a business, providing a more robust framework for determining when a set of assets and activities is deemed a business. The guidance is effective for the Company's fiscal year ending March 31, 2019, including interim periods within that year, and is not expected to have a material impact on the Company's consolidated financial statements or related disclosures.
In January 2017, the FASB issued guidance that simplifies the process required to test goodwill for impairment. The guidance is effective for the Company's fiscal year ending March 31, 2021, and is not expected to have a material impact on the Company's consolidated financial statements or related disclosures.
In March 2017, the FASB issued guidance related to the amortization of premiums on purchased callable debt securities. This guidance shortens the amortization period for certain callable debt securities purchased at a premium by requiring that the premium be amortized to the earliest call date instead of the maturity date. This guidance is effective for the Company's fiscal year ending March 31, 2020, including interim periods within that year. The Company expects the impact to be immaterial.
In May 2017, the FASB issued guidance that clarifies the scope of modification accounting with respect to changes to the terms or conditions of a share-based payment award. This guidance is effective for the Company's fiscal year ending March 31, 2019, including interim periods within that year. The Company is currently evaluating the impact the adoption of this standard will have on its consolidated financial statements and related disclosures, but expects the impact to be immaterial.
In August 2017, the FASB issued guidance that eliminates the requirement to separately measure and report hedge ineffectiveness and that generally requires, for qualifying hedges, the entire change in the fair value of a hedging instrument to be presented in the same income statement line as the hedged item. The guidance also modifies the accounting for components excluded from the assessment of hedge effectiveness, eases documentation and assessment requirements, and modifies certain disclosure requirements. The new standard must be adopted using a modified retrospective transition with a cumulative effect adjustment recorded to opening retained earnings as of the initial adoption date. This guidance is effective for the Company's fiscal year ending March 31, 2020, including interim periods within that year. The Company is currently evaluating the impact the adoption of this standard will have on its consolidated financial statements and related disclosures, but expects the impact to be immaterial.
Recently Adopted Pronouncement
Beginning Fiscal Year 2018, the Company adopted the FASB's new guidance, Improvements to Employee Share-Based Payment Accounting, which changes among other things, how the tax effects of share-based awards are recognized. This new guidance requires excess tax benefits and tax deficiencies to be recognized in the provision for income taxes as discrete items in the period when the awards vest or are settled, whereas previously such income tax effects were recorded as part of additional paid-in capital. The provision for income taxes for the three months ended December 31, 2017 included excess tax benefits that did not materially reduce the Company's effective tax rate. The provision for income taxes for the nine months ended December 31, 2017 included excess tax benefits of $1.9 million, which reduced the Company's effective tax rate by 2.6 percentage points. The recognized excess tax benefits resulted from share-based compensation awards that vested or settled in the first nine months of 2017. This guidance also eliminates the requirement to reclassify cash flows related to excess tax benefits from operating activities to financing activities on the consolidated statements of cash flows. The Company adopted this provision retrospectively by reclassifying $1.0 million of excess tax benefits from financing activities to operating activities in the condensed consolidated statement of cash flows for the nine months ended December 31, 2016. The Company also excluded the related tax benefits when applying the treasury stock method for computing diluted shares outstanding on a prospective basis as required by this guidance. In addition, the Company elected to continue its current practice of estimating expected forfeitures. The Company made no changes to its presentation of withholding taxes on the settlement of share-based payment awards, which were already presented as financing activities. The amount of excess tax benefits and deficiencies recognized in the provision for income taxes will fluctuate from period-to-period based on the price of the Company’s stock, the volume of share-based instruments settled or vested, and the value assigned to share-based instruments under U.S. GAAP. Refer to additional discussion in Note 13, Income Taxes.
3. CASH, CASH EQUIVALENTS, AND INVESTMENTS
The following tables summarize the Company’s cash and available-for-sale securities’ amortized cost, gross unrealized gains, gross unrealized losses, and fair value by significant investment category recorded as cash and cash equivalents, short-term, or long-term investments as of December 31, 2017 and March 31, 2017 (in thousands):
|
| | | | | | | | | | | | | | | | | | | | | | | | | | | | |
| December 31, 2017 | | Amortized
Cost | | Gross
Unrealized
Gains | | Gross
Unrealized
Losses | | Fair
Value | | Cash & Cash Equivalents | | Short-term investments (due in 1 year or less) | | Long-term investments (due in 1 to 3 years) |
| Cash | | $ | 272,063 |
| | $ | — |
| | $ | — |
| | $ | 272,063 |
| | $ | 272,063 |
| | $ | — |
| | $ | — |
|
| Level 1: | | | | | | | | | | | | | | |
| Mutual Funds | | 14,298 |
| | 399 |
| | (70 | ) | | 14,627 |
| | — |
| | 14,627 |
| | — |
|
| US Treasury Notes | | 71,684 |
| | — |
| | (210 | ) | | 71,474 |
| | 4,998 |
| | 42,348 |
| | 24,128 |
|
| Money Market Funds | | 239 |
| | — |
| | — |
| | 239 |
| | 239 |
| | — |
| | — |
|
| Subtotal | | 86,221 |
| | 399 |
| | (280 | ) | | 86,340 |
| | 5,237 |
| | 56,975 |
| | 24,128 |
|
| Level 2: | | | | | | | | | | | | | | |
| Government Agency Securities | | 56,667 |
| | — |
| | (276 | ) | | 56,391 |
| | — |
| | 31,300 |
| | 25,091 |
|
| Commercial Paper | | 32,944 |
| | — |
| | — |
| | 32,944 |
| | 2,993 |
| | 29,951 |
| | — |
|
| Corporate Bonds | | 142,148 |
| | 45 |
| | (375 | ) | | 141,818 |
| | — |
| | 77,175 |
| | 64,643 |
|
| Certificates of Deposits ("CDs") | | 28,383 |
| | — |
| | (3 | ) | | 28,380 |
| | — |
| | 23,372 |
| | 5,008 |
|
| Subtotal | | 260,142 |
| | 45 |
| | (654 | ) | | 259,533 |
| | 2,993 |
| | 161,798 |
| | 94,742 |
|
| | | | | | | | | | | | | | | |
Total cash, cash equivalents
and investments measured at fair value | | $ | 618,426 |
| | $ | 444 |
| | $ | (934 | ) | | $ | 617,936 |
| | $ | 280,293 |
| | $ | 218,773 |
| | $ | 118,870 |
|
|
| | | | | | | | | | | | | | | | | | | | | | | | | | | | |
| March 31, 2017 | | Amortized
Cost | | Gross
Unrealized
Gains | | Gross
Unrealized
Losses | | Fair
Value | | Cash & Cash Equivalents | | Short-term investments (due in 1 year or less) | | Long-term investments (due in 1 to 3 years) |
| Cash | | $ | 295,877 |
| | $ | — |
| | $ | — |
| | $ | 295,877 |
| | $ | 295,877 |
| | $ | — |
| | $ | — |
|
| Level 1: | | | | | | | | | | | | | | |
| Mutual Funds | | 12,079 |
| | 352 |
| | (32 | ) | | 12,399 |
| | — |
| | 12,399 |
| | — |
|
| US Treasury Notes | | 35,960 |
| | — |
| | (68 | ) | | 35,892 |
| | — |
| | 17,560 |
| | 18,332 |
|
| Money Market Funds | | — |
| | — |
| | — |
| | — |
| | — |
| | — |
| | — |
|
| Subtotal | | 48,039 |
| | 352 |
| | (100 | ) | | 48,291 |
| | — |
| | 29,959 |
| | 18,332 |
|
| Level 2: | | | | | | | | | | | | | | |
| Government Agency Securities | | 54,415 |
| | 20 |
| | (164 | ) | | 54,271 |
| | — |
| | 15,309 |
| | 38,962 |
|
| Commercial Paper | | 47,152 |
| | — |
| | — |
| | 47,152 |
| | 6,093 |
| | 41,059 |
| | — |
|
| Corporate Bonds | | 141,508 |
| | 64 |
| | (224 | ) | | 141,348 |
| | — |
| | 73,676 |
| | 67,672 |
|
| Certificates of Deposits ("CDs") | | 20,383 |
| | 3 |
| | — |
| | 20,386 |
| | — |
| | 18,176 |
| | 2,210 |
|
| Subtotal | | 263,458 |
| | 87 |
| | (388 | ) | | 263,157 |
| | 6,093 |
| | 148,220 |
| | 108,844 |
|
| | | | | | | | | | | | | | | |
Total cash, cash equivalents
and investments measured at fair value | | $ | 607,374 |
| | $ | 439 |
| | $ | (488 | ) | | $ | 607,325 |
| | $ | 301,970 |
| | $ | 178,179 |
| | $ | 127,176 |
|
As of December 31, 2017 and March 31, 2017, with the exception of assets related to the Company's deferred compensation plan, all of the Company's investments are classified as available-for-sale securities. The carrying value of available-for-sale securities included in cash equivalents approximates fair value because of the short maturity of those instruments. For more information regarding the Company's deferred compensation plan, refer to Note 4, Deferred Compensation.
The Company did not incur any material realized or unrealized gains or losses in the three and nine months ended December 31, 2016 and 2017.
There were no transfers between fair value measurement levels during the three and nine months ended December 31, 2016 and 2017.
All financial assets and liabilities are recognized or disclosed at fair value in the financial statements or the accompanying notes thereto. Fair value is estimated by applying the following hierarchy, which prioritizes the inputs used to measure fair value into three levels and bases the categorization within the hierarchy upon the lowest level of input that is available and significant to the fair value measurement:
Level 1
The Company's Level 1 financial assets consist of Mutual Funds and US Treasury Notes. The fair value of Level 1 financial instruments is measured based on the quoted market price of identical securities.
Level 2
The Company's Level 2 financial assets and liabilities consist of Government Agency Securities, Commercial Paper, Corporate Bonds, and Certificates of Deposits ("CDs"), derivative foreign currency contracts, and long-term debt. The fair value of Level 2 investment securities is determined based on other observable inputs, including multiple non-binding quotes from independent pricing services. Non-binding quotes are based on proprietary valuation models that are prepared by the independent pricing services and use algorithms based on inputs such as observable market data, quoted market prices for similar securities, issuer spreads, and internal assumptions of the broker. The Company corroborates the reasonableness of non-binding quotes received from the independent pricing services using a variety of techniques depending on the underlying instrument, including: (i) comparing them to actual experience gained from the purchases and maturities of investment securities, (ii) comparing them to internally developed cash flow models based on observable inputs, and (iii) monitoring changes in ratings of similar securities and the related impact on fair value. The fair value of Level 2 derivative foreign currency contracts is determined using pricing models that use observable market inputs. For more information regarding the Company's derivative assets and liabilities, refer to Note 12, Foreign Currency Derivatives. The fair value of Level 2 long-term debt is determined based on inputs that were observable in the market, including the trading price of the notes when available. For more information regarding the Company's 5.50% Senior Notes, refer to Note 7, Debt.
Level 3
The Company's unsecured revolving credit facility falls under the Level 3 hierarchy. The fair value of the Company’s line of credit approximates its carrying value because the interest rate is variable and approximates rates currently available to the Company.
4. DEFERRED COMPENSATION
As of December 31, 2017, the Company held bank deposits of $0.8 million and investments in mutual funds totaling $14.6 million, all of which related to debt and equity securities that are held in rabbi trusts under non-qualified deferred compensation plans. The total related deferred compensation liability was $15.9 million at December 31, 2017. As of March 31, 2017, the Company held bank deposits of $0.8 million and investments in mutual funds totaling $12.4 million. The total related deferred compensation liability at March 31, 2017 was $13.7 million.
The bank deposits are recorded on the condensed consolidated balance sheets under "cash and cash equivalents". The securities are classified as trading securities and are recorded on the condensed consolidated balance sheets under "short-term investments". The liability is recorded on the condensed consolidated balance sheets under "other long-term liabilities" and "accrued liabilities".
5. DETAILS OF CERTAIN BALANCE SHEET ACCOUNTS
Accounts receivable, net:
|
| | | | | | | | |
| | | March 31, | | December 31, |
| (in thousands) | | 2017 | | 2017 |
| Accounts receivable | | $ | 184,759 |
| | $ | 196,175 |
|
| Provisions for returns | | (10,541 | ) | | (11,438 | ) |
| Provisions for promotions, rebates, and other | | (32,438 | ) | | (39,886 | ) |
| Provisions for doubtful accounts and sales allowances | | (603 | ) | | (932 | ) |
| Accounts receivable, net | | $ | 141,177 |
| | $ | 143,919 |
|
Inventory, net:
|
| | | | | | | | |
| | | March 31, | | December 31, |
| (in thousands) | | 2017 | | 2017 |
| Raw materials | | $ | 20,260 |
| | $ | 23,485 |
|
| Work in process | | 215 |
| | 243 |
|
| Finished goods | | 34,981 |
| | 40,846 |
|
| Inventory, net | | $ | 55,456 |
| | $ | 64,574 |
|
Accrued Liabilities:
|
| | | | | | | | |
| | | March 31, | | December 31, |
| (in thousands) | | 2017 | | 2017 |
| Employee compensation and benefits | | $ | 36,415 |
| | $ | 23,719 |
|
| Accrued interest on 5.50% Senior Notes | | 10,407 |
| | 3,419 |
|
| Warranty obligation | | 6,863 |
| | 7,418 |
|
| VAT/Sales tax payable | | 5,433 |
| | 6,182 |
|
| Derivative liabilities | | 1,323 |
| | 4,425 |
|
| Accrued other | | 13,844 |
| | 16,743 |
|
| Accrued liabilities | | $ | 74,285 |
| | $ | 61,906 |
|
The Company's warranty obligation is included as a component of accrued liabilities on the condensed consolidated balance sheets. Changes in the warranty obligation during the nine months ended December 31, 2016 and 2017 were as follows:
|
| | | | | | | | |
| | | Nine Months Ended
December 31, |
| (in thousands) | | 2016 | | 2017 |
| Warranty obligation at beginning of period | | $ | 8,537 |
| | $ | 8,697 |
|
| Warranty provision related to products shipped | | 7,248 |
| | 7,367 |
|
| Deductions for warranty claims processed | | (7,246 | ) | | (7,711 | ) |
| Adjustments related to preexisting warranties | | 408 |
| | 1,086 |
|
Warranty obligation at end of period(1) | | $ | 8,947 |
| | $ | 9,439 |
|
(1)Includes both short-term and long-term portion of warranty obligation; the prior table shows only the short-term portion included in accrued liabilities on our condensed consolidated balance sheet. The long-term portion is included in other long-term liabilities.
6. COMMITMENTS AND CONTINGENCIES
Unconditional Purchase Obligations
The Company purchases materials and services from a variety of suppliers and manufacturers. During the normal course of business, net of an immaterial purchase commitments reserve. In certain instances, these agreements allow us the option to cancel, reschedule, and to manage manufacturing operations and general and administrative activities,adjust our requirements based on our business needs in partnering with our suppliers given the Company may enter into firm, non-cancelable, and unconditional purchase obligations for which amounts are not recorded on the consolidated balance sheets. Ascurrent environment.
Other Guarantees and Obligations
In the ordinary course of business, the Company may provide indemnifications of varying scope and terms to customers, vendors, lessors, business partners, purchasers of assets or subsidiaries and other parties with respect to certain matters, including, but not limited to, losses arising out of the Company's breach of agreements or representations and warranties made by the Company, services to be provided by the Company, intellectual property infringement claims made by third parties or, with respect to the sale of assets of a subsidiary, matters related to the Company's conduct of business and tax matters prior to the sale. From time to time, the Company indemnifies customers against combinations of loss, expense, or liability arising from various triggering events relating to the sale and use of its products and services.
In addition, the Company also provides indemnification to customers against claims related to undiscovered liabilities, additional product liability, or environmental obligations. The Company has also entered into indemnification agreements with its directors, officers, and certain other personnel that will require the Company, among other things, to indemnify them against certain liabilities that may arise by reason of their status or service as directors or officers of the Company or certain of its affiliated entities. The Company maintains director and officer liability insurance, which may cover certain liabilities arising from its obligation to indemnify its directors, officers, and certain other personnel in certain circumstances. It is not possible to determine the aggregate maximum potential loss under these agreements due to the limited history of prior claims and the unique facts and circumstances involved in each particular claim. Such indemnification obligations might not be subject to maximum loss clauses. Historically, the Company has not incurred material costs as a result of obligations under these agreements and it has not accrued any liabilities related to such indemnification obligations in the condensed consolidated financial statements.
Claims and Litigation
On October 12, 2012, GN Netcom,January 23, 2018, FullView, Inc. ("GN") sued the Companyfiled a complaint in the United States District Court of the Northern District of California against Polycom, Inc. alleging infringement of two patents and thereafter filed a similar complaint in connection with the same patents in Canada. Polycom thereafter filed an inter partes reexamination ("IPR") of one of the patents, which was then appealed to Federal Circuit Court. Litigation in both matters in the United States and Canada, respectively, were stayed pending the results of that appeal. Polycom also filed an IPR of the second patent and the U.S." Patent Trial and Appeal Board (“PTAB”) denied institution of the IPR petition. FullView also initiated arbitration proceedings under a terminated license agreement with Polycom alleging that Polycom had failed to pay certain royalties due under that agreement. The arbitration panel awarded an immaterial amount to FullView. FullView filed a First and Second Amended Complaint and Polycom filed a motion to dismiss. The Court granted Polycom's partial motion to dismiss without prejudice and invalidated one of the patents in suit. Litigation on the remaining patent is ongoing.
On June 21, 2018, directPacket Research Inc. filed a complaint alleging patent infringement by Polycom, Inc. in the United States District Court for the Eastern District of Delaware (“Court”), alleging violationsVirginia, Norfolk Division. The Court granted Polycom’s Motion to Transfer Venue to the Northern District of California. Polycom filed petitions for IPR of the Sherman Act,asserted patents which were granted by the Clayton Act,PTAB. The District Court matter was stayed pending resolution of the IPRs. After oral argument held in October 2020, on January 11, 2021, the PTAB issued final written decisions invalidating two of the asserted patents. The remaining claims of the third patent were unasserted against the Company. On February 12, 2021, directPacket filed a notice of appeal to the United States Court of Appeals for the Federal Circuit with respect to the PTAB’s final written decision regarding the ’588 patent. On March 15, 2021, Polycom filed a notice of appeal to the United States Court of Appeals for the Federal Circuit with respect to the PTAB’s final written decision regarding the ’978 patent. On December 13, 2021, the Court issued an affirmance of the decision regarding the invalidity of all asserted claims of the ‘978 patent. On January 27, 2022, the Court vacated the PTAB’s finding that certain claims were invalid as obvious and Delaware common law. In itsremanded the case for further proceedings at the PTAB. Litigation is ongoing.
On November 15, 2019, Felice Bassuk, individually and on behalf of others similarly situated, filed a complaint GN specifically alleged four causes of action: monopolization, attempted monopolization, concerted action in restraint of trade, and tortious interference with business relations. GN claimed thatagainst the Company, dominatesits former CEO, Joseph Burton, its CFO, Charles Boynton, and its former CFO, Pamela Strayer, alleging various securities law violations. The Company disputes the market for headsets sold into contact centers inallegations. The Court appointed lead plaintiff and lead counsel and renamed the U.S.action “In re Plantronics, Inc. Securities Litigation” on February 13, 2020. Plaintiffs filed the amended complaint on June 5, 2020 and that a critical channel for sales of headsets to contact centers is through a limited network of specialized independent distributors (“SIDs”). GN asserted that the Company attracts SIDs through exclusive distributor agreementsfiled a Motion to Dismiss the Amended Complaint on August 7, 2020. Plaintiffs filed their opposition on October 2, 2020 and alleged that the useCompany replied on November 16, 2020. The hearing scheduled for January 13, 2021 was vacated and on March 29, 2021, the Court issued its order granting the Company’s motion to dismiss, but allowing the Plaintiffs leave to amend their complaint. On April 13, 2021, pursuant to the parties’ mutual agreement, the Court issued its order granting a stipulation and scheduling order which provides the plaintiffs until June 15, 2021 (subsequently extended to June 22, 2021) to consider whether or not to file a second amended complaint, and if filed, allowing defendants until August 16, 2021 to file a motion to dismiss, with plaintiffs’ opposition to such motion due on or before September 30, 2021, and with
defendants’ reply to be filed on or before November 1, 2021. The Plaintiff filed its second amended complaint on June 22, 2021 and the Company filed its Motion to Dismiss on September 7, 2021. The court is illegal. GN sought injunctive relief, total damagesexpected to rule based on the briefs without a hearing and the parties are awaiting the court's ruling.
On December 17, 2019, Cisco Systems, Inc. filed a First Amended Complaint for Trade Secret Misappropriation against Plantronics, Inc. and certain individuals which amends a previously filed complaint against certain other individuals. The Company disputes the allegations. The Company filed a Motion to Dismiss and the Court granted the Motion with leave to amend as to defendants He, Chung and Williams, granted the Motion to Compel Arbitration for defendant Williams and granted in part and denied in part the Motion to Dismiss by defendants Puorro and the Company. Cisco filed an unspecified amount, plus attorneys’ feesAmended Complaint and costs, as well as unspecified legal and equitable relief.
The case was triedthe defendants moved to a jury in October, 2017, resulting in a verdict in favordismiss or strike portions of the Company. GNAmended Complaint. The Court granted in part and denied in part the Motion to Dismiss. On September 10, 2020, the Company filed a Motion for Protective Order and a Motion to Strike and Challenge the Sufficiency of Cisco’s Trade Secret Disclosure. On December 21, 2020, the Court granted in part and denied in part such Motions. On December 30, 2020, Cisco filed a motion for new trial in November, 2017,leave to file a Motion for Reconsideration. On January 11, 2021 the Company filed its opposition. The Court issued its Case Management and that motionPretrial order setting a settlement conference which occurred on April 1, 2021. During such mediation conference, the parties were unable to reach settlement. The Texas arbitration proceeding between Mr. Williams and Cisco was deniedsettled pursuant to an agreement by the parties, and Mr. Williams was dismissed with prejudice from both that proceeding and from the district court action. On August 13, 2021, Mr. He settled with Cisco pursuant to which he will be permanently enjoined and forever prohibited from receiving, using, and/or distributing Cisco Confidential Business Information except in limited circumstances. Discovery is ongoing.
On July 22, 2020, Koss Corporation filed a complaint alleging patent infringement by the Company and Polycom, Inc. in the United States District Court in January, 2018.for the Western District of Texas, Waco Division. The Company answered the Complaint on October 1, 2020 disputing the claims. On December 18, 2020, the Company filed a motion for attorneys’ fees inMotion to Transfer Venue to the Northern District of California. On January 29, 2021, the plaintiff amended its infringement contentions to add new accused products. On February 12, 2021, the plaintiff filed its opposition to the Motion to Transfer. On May 20, 2021, the judge granted the Company’s Motion to Transfer Venue to the Northern District of California. On November 2017 and that motion was denied by1, 2021, the Court in January, 2018. The Company filed a motion for certain recoverable costs,Motion to Dismiss the suit with the District Court on the grounds of non-patentable subject matter. The Court will rule based on the briefs without a hearing and the parties stipulated to an immaterial amount, which GN will payare awaiting the Company. If the jury verdict were to be overturned on appeal, the Company would have to repay that amount to GN. GN has not indicated whether it plans to file an appeal of the jury’s verdict.Court's ruling.
In a letter dated May 1, 2017, the Company received a Notice of Proposed Debarment from the General Services Administration ("GSA") informing the Company that the GSA has proposed that the Company be debarred from participation in Federal procurement and non-procurement programs based on the above spoliation order issued in the GN litigation matter. The Company submitted a response to the GSA demonstrating that it is a responsible contractor and that a suspension or debarment is neither necessary to protect the government nor warranted. The GSA found “no cause” for debarment of Plantronics and terminated the proceeding against the Company in August 2017.
In addition to the specific mattermatters discussed above, the Company is involved in various legal proceedings and investigations arising in the normal course of conducting business. For such legal proceedings, whereWhere applicable, in relation to the matters described above, the Company has accrued an amount that reflects the aggregate liability deemed probable and estimable, but this amount is not material to the Company's financial condition, results of operations, or cash flows. With respect to proceedings for which no accrual has been made, theThe Company is not able to estimate an amount or range of any reasonably possible additional lossesloss, including in excess of any amount accrued, because of the preliminary nature of many of these proceedings, the difficulty in ascertaining the applicable facts relating to many of these proceedings, the variable treatment of claims made in many of these proceedings, and the difficulty of predicting the settlement value of many of these proceedings.
However, based upon the Company's historical experience, the resolution of these proceedings is not expected to have a material effect on the Company's financial condition, results of operations or cash flows. The Company may incur substantial legal fees, which are expensed as incurred, in defending against these legal proceedings.
7. DEBT
5.50%The carrying value of the Company's outstanding debt as of January 1, 2022 and April 3, 2021 was as follows:
| | | | | | | | | | | |
| (in thousands) | January 1, 2022 | | April 3, 2021 |
| 4.75% Senior Notes | $ | 494,549 | | | $ | 493,985 | |
| 5.50% Senior Notes | — | | | 478,807 | |
| Term loan facility | 1,004,679 | | | 1,002,079 | |
As of January 1, 2022 and April 3, 2021, the net unamortized discount, premium, and debt issuance costs on the Company's outstanding debt were $17.6 millionand $22.6 million, respectively.
4.75% Senior Notes
In May 2015,On March 4, 2021, the Company issued $500.0 million aggregate principal amount of 5.50% senior notes (the “5.50%4.75% Senior Notes”).Notes. The 5.50%4.75% Senior Notes mature on May 31, 2023,March 1, 2029 and bear interest at a rate of 5.50%4.75% per annum, payable semi-annually on May March 1 and
September 1 of each year, commencing on November 15, 2015.September 1, 2021. The Company received net proceeds of $488.4$493.9 million from the issuance of the 5.50%4.75% Senior Notes, net of issuance costs of $11.6$6.1 million, which are presented in the condensed consolidated balance sheets as a reduction to the outstanding amount payable and are being amortized to interest expense using the straight-line method, which approximates the effective interest method for this debt, over the term of the 5.50%4.75% Senior Notes using the effective interest method.Notes. A portion of the proceeds was used to repay all then-outstanding amounts under our revolving line of credit agreement with Wells Fargo Bank and the remaining proceeds were used primarily for share repurchases.
The fair valueoutstanding principal of the 5.50% Senior Notes was determined based on inputs that were observable in the market, including the trading price of the 5.50% Senior Notes when available (Level 2). The estimated fair value and carrying value of the 5.50% Senior Notes were as follows:May 17, 2021.
|
| | | | | | | | | | | | | | | |
| | March 31, 2017 | | December 31, 2017 |
| (in thousands) | Fair Value | | Carrying Value | | Fair Value | | Carrying Value |
| 5.50% Senior Notes | $ | 505,150 |
| | $ | 491,059 |
| | $ | 520,425 |
| | $ | 492,146 |
|
The Company may redeem all or a part of the 5.50%4.75% Senior Notes, upon not less than 30a 15-day or more than a 60 day notice;60-day notice, however, the applicable redemption price will be determined as follows:
|
| | | | | | | | | | | | | | | | | | | | | | |
| Redemption Period Requiring Payment of: | | Redemption Up To 35%40% Using Cash Proceeds From An Equity Offering(3):
|
| Make-Whole(1) | | Premium(2) | | Date | | SpecifiedSpecific Price |
5.50%4.75% Senior Notes | Prior to May 15, 2018March 1, 2024 | | On or after May 15, 2018March 1, 2024 | | Prior to May 15, 2018March 1, 2024 | | 105.500%104.75% |
(1) If the Company redeems the notes prior to the applicable date, the redemption price is principal plus a make-whole premium, equal towhich means, the greater of (i) 1.0% of the principal or (ii) the excess of the present value of the remaining scheduledredemption price at March 1, 2024 plus interest payments as described inthrough March 1, 2024 over the applicable indenture, together with accrued and unpaid interest.principal amount.
(2) If the Company redeems the notes on or after the applicable date, the price is principal plus a premium which declines over time, as specified in the applicable indenture, together with accrued and unpaid interest.
(3) If the Company redeems the notes prior to the applicable date with net cash proceeds of one or more equity offerings, the price is equal to the amount specified above, together with accrued and unpaid interest, subject to a maximum redemption of 35%40% of the aggregate principal amount of the respective note being redeemed.redeemed and at least 50% of the aggregate principal amount remains outstanding immediately after any such redemption (unless the notes are redeemed or repurchased substantially concurrently).
In addition, upon the occurrence of certain change of control triggering events, the Company may be required to repurchase the 5.50%4.75% Senior Notes, at a price equal to 101% of their principal amount, plus accrued and unpaid interest to the date of repurchase. The 5.50%4.75% Senior Notes contain restrictive covenants that, among other things, limit the Company's ability to create certain liensof the Company and enter into sale and leaseback transactions; create, assume,its restricted subsidiaries to incur or guarantee additional indebtedness, make certain investments and other restricted payments, transfer and sell assets, create liens, enter into transactions with affiliates, and engage in mergers, consolidations, or sales of its subsidiaries without such subsidiary guaranteeingassets.
5.50% Senior Notes
In May 2015, the Company issued $500.0 million aggregate principal amount of 5.50% Senior Notes. The 5.50% Senior Notes mature on May 31, 2023, and bear interest at a rate of 5.50% per annum, payable semi-annually on May 15 and November 15 of each year, commencing on November 15, 2015. The Company received net proceeds of $488.4 million from issuance of the 5.50% Senior Notes, on an unsecured unsubordinated basis; and consolidate or merge with, or convey, transfer or lease all or substantially allnet of issuance costs of $11.6 million, which are being amortized to interest expense over the term of the assets5.50% Senior Notes using the straight-line method, which approximates the effective interest method for this debt. A portion of the Company and its subsidiariesproceeds was used to another person. Asrepay all then-outstanding amounts under the Company's revolving line of December 31, 2017, the Company was in compliance with all covenants.
Revolving Credit Agreement
On May 9, 2011, the Company entered into a credit agreement with Wells Fargo Bank and the remaining proceeds were used primarily for share repurchases.
On May 17, 2021, the Company used a portion of the proceeds from the 4.75% Senior Notes to redeem the outstanding principal and accrued interest of the 5.50% Senior Notes of $493.9 million.
Term Loan Facility
In connection with the acquisition of Polycom completed on July 2, 2018, the Company entered into a Credit Agreement with Wells Fargo Bank, National Association, ("as administrative agent, and the Bank"lenders party thereto (the “Credit Agreement.”), The Credit Agreement replaced the Company’s prior revolving credit facility in its entirety. The Credit Agreement provides for (i) a revolving credit facility with an initial maximum aggregate amount of availability of $100 million that matures in July 2023 and (ii) a $1.275 billion term loan facility priced at LIBOR plus 2.50% due in quarterly principal installments commencing on the last business day of March, June, September and December beginning with the first full fiscal quarter ending after the closing date under the Credit Agreement for the aggregate principal amount funded on the closing date under the Credit Agreement multiplied by 0.25% (subject to prepayments outlined in the Credit Agreement) and all remaining outstanding principal due at maturity in July 2025. The Company has paid the full amount of term debt principal due prior to maturity. The Company borrowed the full amount available under the term loan facility of $1.245 billion, net of approximately $30 million of discounts and issuance costs which was most recently amended on April 28, 2017 (as amended, the "Amended Credit Agreement")are being amortized to extendinterest expense over the term of the Credit Agreement by one yearusing the straight-line method, which approximates the effective interest method for this debt. The proceeds from the initial borrowing under the Credit Agreement were used to May 9, 2020,finance the acquisition of Polycom, to refinance certain debt of Polycom, and to amendpay related
fees, commissions and transaction costs. The Company has additional borrowing capacity under the Credit Agreement through the revolving credit facility, which could be used to provide ongoing working capital and capital for other general corporate purposes of the Company and its subsidiaries. The Company’s obligations under the Credit Agreement are currently guaranteed by Polycom and will from time to time be guaranteed by, subject to certain exceptions, any domestic subsidiaries that may become material in the future. Subject to certain exceptions, the Credit Agreement is secured by first-priority perfected lien on, and security interests in, substantially all of the personal property of the Company and each subsidiary guarantor and will from time to time also be secured by certain material real property that the Company or any subsidiary guarantor may acquire. Borrowings under the Credit Agreement bear interest due on a quarterly basis at a variable rate equal to (i) LIBOR plus a specified margin, or (ii) the base rate (which is the highest of (a) the prime rate publicly announced from time to time by Wells Fargo Bank, National Association, (b) the federal funds rate plus 0.50% or (c) the sum of 1% plus one-month LIBOR) plus a specified margin. The Company must also pay (i) an unused commitment fee ranging from 0.200% to 0.300% per annum of the average daily unused portion of the aggregate revolving credit commitments under the Credit Agreement, and (ii) a per annum fee equal to (a) for each performance standby letter of credit outstanding under the Credit Agreement with respect to non-financial contractual obligations, 50% of the applicable margin over LIBOR under the revolving credit facility in effect from time to time multiplied by the daily amount available to be drawn under such letter of credit, and (b) for each other letter of credit outstanding under the Credit Agreement, the applicable margin over LIBOR under the revolving credit facility in effect from time to time multiplied by the daily amount available to be drawn under such letter of credit.
On December 29, 2021, the Company entered into Amendment No. 3 to Credit Agreement (“Amendment No. 3”) by and among the Company, the financial institutions party thereto as lenders, and Wells Fargo Bank, National Association, as administrative agent. Amendment No. 3 amended the Credit Agreement, as previously amended, to (i) increase the maximum Secured Net Leverage Ratio (as defined in the Credit Agreement) permitted to 3.75 to 1.00 as of the end of any fiscal quarter ending during the period beginning on January 2, 2022 through December 31, 2022 and to 3.00 to 1.00 as of the end of any fiscal quarter ending thereafter, except that the maximum Secured Net Leverage Ratio shall be deemed to be 3.00 to 1.00 at all times for purposes of determining pro forma compliance with each Specified Pro Forma Financial Covenant Test (as defined in the Credit Agreement).
Additionally, Amendment No. 3 modified the calculation of the Secured Net Leverage Ratio solely for purposes of determining compliance with Section 7.11(a) of the Credit Agreement for any fiscal quarter ending between January 2, 2022 through December 31, 2022 by amending the definition of Consolidated EBITDA to (a) limit the aggregate amount added back pursuant to clause (vii) thereof (relating to certain acquisition expenses) to the greater of $30,000,000 and 10% of Consolidated EBITDA for such Measurement Period (as defined in the Credit Agreement) (calculated before giving effect to any such expenses to be added back pursuant to such clause (vii) for such Measurement Period), (b) limit the aggregate amount added back pursuant to clause (vii) thereof in respect of integration expenses related to the Polycom Acquisition (as defined in the Credit Agreement) to $30,000,000, and (c) limit the aggregate amount added back pursuant to clause (viii) thereof (relating to certain non-recurring or unusual items reducing consolidated net income) to the greater of $30,000,000 and 10% of Consolidated EBITDA for such Measurement Period (calculated before giving effect to any such items to be added back pursuant to such clause (viii) for such Measurement Period).
The financial covenants under the Credit Agreement, as amended, are for the benefit of the revolving credit lenders only and do not apply to any other debt of the Company. The Credit Agreement also contains various other restrictions and covenants, some of which have become more stringent over time, including restrictions on our, and certain of our subsidiaries, ability to consolidate or merge, create liens, incur additional indebtedness, dispose of assets, consummate acquisitions, make investments, and pay dividends and other distributions. The Company has the unilateral ability to terminate the revolving line of credit such that the financial covenants whichdescribed above are defined below.
no longer applicable. The Amended Credit Agreement provides foralso contains customary events of default. If an event of default under the Credit Agreement occurs and is continuing, then the lenders may declare any outstanding obligations under the Credit Agreement to be immediately due and payable; provided, however, that the occurrence of an event of default as a $100.0 million unsecuredresult of a breach of a financial covenant under the Credit Agreement does not constitute a default or event of default with respect to any term facility under the Credit Agreement unless and until the required revolving lenders shall have terminated their revolving commitments and declared all amounts outstanding under the revolving credit facility. Revolving loansfacility to be due and payable. In addition, if the Company, any subsidiary guarantor or, with certain exceptions, any other subsidiary becomes the subject of voluntary or involuntary proceedings under any bankruptcy, insolvency or similar law, then any outstanding obligations under the Credit Agreement will automatically become immediately due and payable. Loans outstanding under the Credit Agreement will bear interest at the Company’s election, at (i) the Bank’s announced primea rate less 1.20%of 2.00% per annum in excess of the otherwise applicable rate (i) while a payment or bankruptcy event of default exists or (ii) a daily one-month LIBOR rate plus 1.40% per annum. Interest is payable quarterlyupon the lenders’ request, during the continuance of any other event of default. As of January 1, 2022, the Company was in arrears on the first day of each of April, July, October and January. Principal, togethercompliance with all accrued and unpaid interest, on the revolving loans is due and payable on May 9, 2020. The Company is also obligated to pay a commitment feefinancial covenants.
The Company may prepay the loans and terminate the commitments under the Credit Agreement at any time without premium or penalty,penalty. Additionally, the Company is subject to mandatory debt repayments five business days after the reimbursementfiling of certain costs. Duringits consolidated financial statements for any annual period in which the Company generates Excess Cash (as defined in the Credit Agreement). In accordance with the terms of the Credit Agreement, the Company did not generate Excess Cash during the fiscal year ended April 3, 2021 and therefore is not required to make any debt repayments in the fiscal year ended April 2, 2022. During the three and nine months ended December 31, 2017January 1, 2022, the Company borrowed and repaid $8 million from our lineCompany did not prepay any aggregate principal amount of credit, and asthe term loan facility. As of March 31, 2017 and December 31, 2017,January 1, 2022, the Company had no5 letters of credit outstanding borrowings on the line of credit.
The Amended Credit Agreement contains customary affirmative and negative covenants, including, among other things, covenants limiting the ability of the Company to incur debt, make capital expenditures, grant liens, merge or consolidate, and make investments. The Amended Credit Agreement also requires the Company to comply with certain financial covenants, including (i) a maximum ratio of funded debt to EBITDA of 3.25:1 (previously 3:1) and (ii) a minimum EBITDA coverage ratio, in each case, tested as of each fiscal quarter and determined on a rolling four-quarter basis. In addition, the Company and its subsidiaries are required to maintain unrestricted cash, cash equivalents and marketable securities plus availability under the Amended Credit Agreement at the endrevolving credit facility for a total of each fiscal quarter of at least $300.0$2.9 million. The Amended Credit Agreement contains customary events of default that include, among other things, payment defaults, covenant defaults, cross-defaults with certain other indebtedness, bankruptcy and insolvency defaults, and judgment defaults. The occurrence of an event of default could result in the acceleration of the obligations under the Amended Credit Agreement. As of March 31, 2017 and December 31, 2017, the Company was in compliance with all covenants.
8. RESTRUCTURING AND OTHER RELATED CHARGES (CREDITS)
Summary of Restructuring Plans
Fiscal Year 2022 Restructuring Plan
During the first nine months ended January 1, 2022, the Company committed to actions to reduce expenses to enable strategic investments in revenue growth. The costs incurred to date under this plan include severance benefits related to headcount reductions in the Company's global workforce and facility related charges due to the closure or consolidation of offices.
Fiscal Year 2018 and as part of its ongoing effort2021 Restructuring Plan
During Fiscal Year 2021, the Company committed to additional actions to reduce expenses and align its overall cost structure better with projected revenue levels, as well as reorganize its executive management to align to its new Chief Executive Officer's management structure. The costs improve profitability,incurred to date under this plan include severance benefits related to headcount reductions in the Company's global workforce and focus on its key strategic initiatives,facility related charges due to the Company executed an asset sale agreement to disposeclosure or consolidation of substantially all assets of its Clarity division, primarily inventories and tooling fixed assets, for an immaterial sales price. The buyer in this arrangement was a former employee of the Company, who acted as Clarity's President but who was not an executive officer or director of the Company. As part of the buyer's separation from Plantronics, the Company accelerated vesting on his outstanding restricted stock, resulting in an immaterial stock-compensation modification charge.leased offices.
Legacy Restructuring Plans
In connection with the sale,Polycom acquisition, in Fiscal Years 2019 and 2020 the Company is leasing the facility it owns in Chattanooga, Tennessee,initiated actions to the buyer for a period of twelve months. The Company also entered into a transition services agreement with the buyer to provide customer support services on a cost-recovery basis, which are not expected to be material, for a period of one year. The Company also recorded immaterial impairment charges on assets previously used in Clarity operations that have no further value to the Company.
In addition to the sale of the Clarity division and the related restructuring actions, the Company reduced headcount in certain divisions and terminated a lease in the Netherlands before the end of its contractual term, resulting in a charge equal to the present value of the remaining future minimum lease payments. In connection with this exit, the Company wrote off certain fixed assets that will no longer be used. Finally, the Company reorganized its Brazilianrationalize post-acquisition operations and as a result, wrote off an unrecoverable indirect tax asset.realign its cost structure. These actions included streamlining the global workforce, closure or consolidation of leased offices and distribution centers, consumer product portfolio optimization efforts, and legal entity rationalization.
As of December 31, 2017,The following table summarizes the remaining obligation related to severance amounts due is immaterial and will be settled within 12 months.
During the quarter ended December 31, 2017, we recorded an immaterial adjustment to restructuring and other related charges (credits) resulting from a changerecognized in estimate from amounts previously recorded.the Company's condensed consolidated statements of operations:
| | | | | | | | | | | | | | | | | | | | | | | |
| Three Months Ended | | Nine Months Ended |
| (in thousands) | January 1, 2022 | | December 26, 2020 | | January 1, 2022 | | December 26, 2020 |
| Severance | $ | 191 | | | $ | 3,969 | | | $ | 19,592 | | | $ | 27,161 | |
| Facility | — | | | 1,658 | | | (503) | | | 3,300 | |
Other (1) | 374 | | | 1,107 | | | 5,285 | | | 3,416 | |
| Total cash charges | 565 | | | 6,734 | | | 24,374 | | | 33,877 | |
Non-cash charges (2) | 1,833 | | | 7,243 | | | 9,603 | | | 15,600 | |
| Total restructuring and other related charges | $ | 2,398 | | | $ | 13,977 | | | $ | 33,977 | | | $ | 49,477 | |
(1) Other costs primarily represent associated legal and advisory services.
(2) Non-cash charges primarily represent accelerated depreciation due to the closure or consolidation of facilities.
The associatedCompany's restructuring liabilities as of January 1, 2022 are as follows:
| | | | | | | | | | | | | | |
| (in thousands) | As of April 3, 2021 | Accruals (1) | Cash Payments | As of January 1, 2022 |
| Fiscal Year 2022 Plan | | | | |
| Severance | $ | — | | $ | 20,281 | | $ | (15,577) | | $ | 4,704 | |
| Facility | — | | — | | — | | — | |
| Other | — | | 5,313 | | (5,228) | | 85 | |
| Total Fiscal Year 2022 Plan | $ | — | | $ | 25,594 | | $ | (20,805) | | $ | 4,789 | |
| | | | |
| Fiscal Year 2021 Plans | | | | |
| Severance | $ | 6,039 | | $ | (720) | | $ | (3,475) | | $ | 1,844 | |
| Facility | 913 | | 83 | | (465) | | 531 | |
| Other | 186 | | (28) | | (158) | | — | |
| Total Fiscal Year 2021 Plans | $ | 7,138 | | $ | (665) | | $ | (4,098) | | $ | 2,375 | |
| | | | |
| Legacy Plans | | | | |
| Severance | $ | 1,222 | | $ | 31 | | $ | (813) | | $ | 440 | |
| Facility | 3,281 | | (586) | | (1,799) | | 896 | |
| Other | — | | — | | — | | — | |
| Total Legacy Plans | $ | 4,503 | | $ | (555) | | $ | (2,612) | | $ | 1,336 | |
| | | | |
| Total | | | | |
| Severance | $ | 7,261 | | $ | 19,592 | | $ | (19,865) | | $ | 6,988 | |
| Facility | 4,194 | | (503) | | (2,264) | | 1,427 | |
| Other | 186 | | 5,285 | | (5,386) | | 85 | |
| Grand Total | $ | 11,641 | | $ | 24,374 | | $ | (27,515) | | $ | 8,500 | |
(1)Excludes non-cash charges for the nine months ended December 31, 2017 areof $9.6 million recorded in restructuring and other related charges (credits), cost of revenues, and selling, general, and administrative expense in the condensed consolidated statements of operations as follows:
|
| | | | | | | | | | | | |
| | Nine months ended December 31, 2017 |
| (in millions) | Total Charges | Restructuring and Other Related Charges (Credits) | Cost of Revenues | Selling, General, and Administrative |
| Severance benefits from reduction-in-force | $ | 1.3 |
| $ | 1.3 |
| $ | — |
| $ | — |
|
| Lease exit charge and asset impairments in Netherlands | 0.7 |
| 0.7 |
| — |
| — |
|
| Write-off of unrecoverable indirect tax asset in Brazil | 0.7 |
| — |
| 0.7 |
| — |
|
| Asset impairments related to previous Clarity operations | 0.4 |
| 0.4 |
| — |
| — |
|
| Loss on Clarity asset sale | 0.9 |
| — |
| 0.9 |
| — |
|
| Accelerated vesting of restricted stock | 0.2 |
| — |
| — |
| 0.2 |
|
| Totals | $ | 4.2 |
| $ | 2.4 |
| $ | 1.6 |
| $ | 0.2 |
|
9. STOCK-BASED COMPENSATION
The Company recognizes the grant-date fair value of stock-based compensation as compensation expense using the straight-line attribution approach over the service period for which the stock-based compensation is expected to vest. The following table summarizes the amount of stock-based compensation included in the condensed consolidated statements of operations:
|
| | | | | | | | | | | | | | | | |
| | | Three Months Ended December 31, | | Nine Months Ended
December 31, |
| (in thousands) | | 2016 | | 2017 | | 2016 | | 2017 |
| Cost of revenues | | $ | 794 |
| | $ | 917 |
| | $ | 2,414 |
| | $ | 2,709 |
|
| | | | | | | | | |
| Research, development, and engineering | | 1,771 |
| | 2,049 |
| | 6,663 |
| | 6,158 |
|
| Selling, general, and administrative | | 6,124 |
| | 5,063 |
| | 15,928 |
| | 17,180 |
|
| Stock-based compensation included in operating expenses | | 7,895 |
| | 7,112 |
| | 22,591 |
| | 23,338 |
|
| Total stock-based compensation | | 8,689 |
| | 8,029 |
| | 25,005 |
| | 26,047 |
|
| Income tax expense (benefit) | | (2,986 | ) | | 2,039 |
| | (8,635 | ) | | (5,650 | ) |
| Total stock-based compensation, net of tax | | $ | 5,703 |
| | $ | 10,068 |
| | $ | 16,370 |
| | $ | 20,397 |
|
10. COMMON STOCK REPURCHASES
From time to time, the Company's Board of Directors (the "Board") has authorized programs under which the Company may repurchase shares of its common stock, depending on market conditions, in the open market or through privately negotiated transactions. Repurchased shares are held as treasury stock until they are retired or re-issued. Repurchases by the Company pursuant to Board-authorized programs during the nine months ended December 31, 2016 and 2017 are discussed below. As of December 31, 2017, there remained 730,932 shares authorized for repurchase under the repurchase program approved by the Board on July 27, 2017. There were no remaining shares authorized under previously approved programs.January 1, 2022.
In the nine months ended December 31, 2016 and 2017, the Company repurchased 764,176 shares and 1,138,903 shares, respectively, of its common stock in the open market for a total cost of $34.2 million and $52.9 million, respectively, and at an average price per share of $44.80 and $46.46, respectively. In addition, the Company withheld shares valued at $9.4 million and $11.2 million in the nine months ended December 31, 2016 and 2017, respectively, in satisfaction of employee tax withholding obligations upon the vesting of restricted stock granted under the Company's stock plans. The amounts withheld were equivalent to the employees' minimum statutory tax withholding requirements and are reflected as a financing activity within the Company's condensed consolidated statements of cash flows. These share withholdings have the same effect as share repurchases by the Company as they reduce the number of shares that would have otherwise been issued in connection with the vesting of shares subject to the restricted stock grants.
11.9. ACCUMULATED OTHER COMPREHENSIVE INCOME (LOSS)
The components of accumulated other comprehensive income ("AOCI")(loss), net of immaterial tax, effects, are as follows:
| | | | | | | | | | | | | | | | | |
| (in thousands) | | January 1, 2022 | | April 3, 2021 |
| Accumulated unrealized gain (loss) on cash flow hedges | | $ | 6,839 | | | $ | (7,836) | |
| Accumulated foreign currency translation adjustments | | 4,615 | | | 4,615 | |
| | | | |
| Accumulated other comprehensive income (loss) | | $ | 11,454 | | | $ | (3,221) | |
10. DERIVATIVES
|
| | | | | | | | | |
| (in thousands) | | March 31, 2017 | | December 31, 2017 |
Accumulated unrealized gain (loss) on cash flow hedges (1) | | $ | 529 |
| | $ | (2,200 | ) |
| Accumulated foreign currency translation adjustments | | 4,428 |
| | 4,685 |
|
| Accumulated unrealized gain (loss) on investments | | (263 | ) | | (580 | ) |
| Accumulated other comprehensive income | | $ | 4,694 |
| | $ | 1,905 |
|
(1)Refer to Note 12, Foreign Currency Derivatives which discloses the nature of the Company's derivative assets and liabilities as of March 31, 2017and December 31, 2017.
12. FOREIGN CURRENCY DERIVATIVES
The Company's foreign currency derivatives consist primarily of foreign currency forward exchange contracts,and option contracts, and cross-currency swaps.contracts. The Company does not purchase derivative financial instruments for speculative trading purposes. The derivatives expose the Company to credit risk to the extent the counterparties may be unable to meet the terms of the derivative instrument. The Company's maximum exposure to loss that it would incur due toas a result of credit risk if parties to derivative contracts failed completely to perform according to the terms of the contracts was equal to the carrying value of the Company's derivative assets as of December 31, 2017.January 1, 2022 and April 3, 2021. The Company seeks to mitigate such risk by limiting its counterparties to large financial institutions. In addition, the Company monitors the potential risk of loss with any one counterparty resulting from this type of credit risk on an ongoing basis.
The Company enters into master netting arrangements with counterparties when possible to mitigate credit risk in derivative transactions.transactions, when possible. A master netting arrangement may allow each counterparty to net settle amounts owed between the Company and the counterparty as a result of multiple, separate derivative transactions. As of December 31, 2017,January 1, 2022, the Company had International Swaps and Derivatives Association (ISDA)("ISDA") agreements with four5 applicable banks and financial institutions which contained netting provisions. PlantronicsThe Company has elected to present the fair value of derivative assets and liabilities onwithin the Company's condensed consolidated balance sheetsheets on a gross basis even when derivative transactions are subject to master netting arrangements and may otherwise qualify for net presentation. For each counterparty, if netted, the Company would offset the asset and liability balances of all derivatives at the end of the reporting period. Derivatives not subject to master netting agreements are not eligible for net presentation. As of March 31, 2017January 1, 2022 and December 31, 2017,April 3, 2021, no cash collateral had been received or pledged related to these derivative instruments.
Offsetting of Financial Assets/Liabilities under Master Netting Agreements with Derivative Counterparties
As of January 1, 2022
| | | | | | | | | | | | | | |
| Gross Amount of Derivative Assets Presented in the Condensed Consolidated Balance Sheets | Gross Amounts Not Offset in the Condensed Consolidated Balance Sheet that are Subject to Master Netting Agreements | |
| (in thousands) | Gross Amount of Eligible Offsetting Recognized Derivative Liabilities | Cash Collateral Received | Net Amount of Derivative Assets |
| Derivatives subject to master netting agreements | $ | 10,572 | | $ | (4,915) | | $ | — | | $ | 5,657 | |
| Derivatives not subject to master netting agreements | — | | | | — | |
| Total | $ | 10,572 | | | | $ | 5,657 | |
| | | | | | | | | | | | | | |
| Gross Amount of Derivative Liabilities Presented in the Condensed Consolidated Balance Sheets | Gross Amounts Not Offset in the Condensed Consolidated Balance Sheet that are Subject to Master Netting Agreements | |
| (in thousands) | Gross Amount of Eligible Offsetting Recognized Derivative Assets | Cash Collateral Received | Net Amount of Derivative Liabilities |
| Derivatives subject to master netting agreements | $ | (4,915) | | $ | 4,915 | | $ | — | | $ | — | |
| Derivatives not subject to master netting agreements | — | | | | — | |
| Total | $ | (4,915) | | | | $ | — | |
As of April 3, 2021
| | | | | | | | | | | | | | |
| Gross Amount of Derivative Assets Presented in the Condensed Consolidated Balance Sheets | Gross Amounts Not Offset in the Condensed Consolidated Balance Sheet that are Subject to Master Netting Agreements | |
| (in thousands) | Gross Amount of Eligible Offsetting Recognized Derivative Liabilities | Cash Collateral Received | Net Amount of Derivative Assets |
| Derivatives subject to master netting agreements | $ | 5,106 | | $ | (5,106) | | $ | — | | $ | — | |
| Derivatives not subject to master netting agreements | — | | | | — | |
| Total | $ | 5,106 | | | | $ | — | |
| | | | | | | | | | | | | | |
| Gross Amount of Derivative Liabilities Presented in the Condensed Consolidated Balance Sheets | Gross Amounts Not Offset in the Condensed Consolidated Balance Sheet that are Subject to Master Netting Agreements | |
| (in thousands) | Gross Amount of Eligible Offsetting Recognized Derivative Assets | Cash Collateral Received | Net Amount of Derivative Liabilities |
| Derivatives subject to master netting agreements | $ | (11,700) | | $ | 5,106 | | $ | — | | $ | (6,594) | |
| Derivatives not subject to master netting agreements | — | | | | — | |
| Total | $ | (11,700) | | | | $ | (6,594) | |
The gross fair value of the Company's outstanding derivative contracts at the end of each periodJanuary 1, 2022 and April 3, 2021 was as follows:
| | | | | | | | | | | | | | |
| (in thousands) | | January 1, 2022 | | April 3, 2021 |
Derivative assets(1) | | | | |
| Non-designated hedges | | $ | 317 | | | $ | 2,864 | |
| Cash flow hedges | | 2,803 | | | 2,242 | |
| Interest rate swaps | | 7,452 | | | — | |
| Total derivative assets | | $ | 10,572 | | | $ | 5,106 | |
| | | | |
Derivative liabilities(2) | | | | |
| Non-designated hedges | | $ | 1,134 | | | $ | 18 | |
| Cash flow hedges | | 477 | | | 1,819 | |
| Interest rate swaps | | 3,304 | | | 9,863 | |
| Accrued interest | | 22 | | | 102 | |
| Total derivative liabilities | | $ | 4,937 | | | $ | 11,802 | |
|
| | | | | | | | |
| (in thousands) | | March 31, 2017 | | December 31, 2017 |
Derivative Assets(1) | | | | |
| Non-designated hedges | | $ | 86 |
| | $ | 19 |
|
| Cash flow hedges | | 2,034 |
| | 332 |
|
| Total Derivative Assets | | $ | 2,120 |
| | $ | 351 |
|
| | | | | |
Derivative Liabilities(2) | | | | |
| Non-designated hedges | | $ | 286 |
| | $ | 1,155 |
|
| Cash flow hedges | | 1,109 |
| | 3,345 |
|
| Total Derivative Liabilities | | $ | 1,395 |
| | $ | 4,500 |
|
(1) Short-term derivative assets are recorded in "otherother current assets"assets and long-term derivative assets are recorded in "deferred tax and other assets".non-current assets on the condensed consolidated balance sheets. As of December 31, 2017January 1, 2022, the portion of derivative assets classified as long-term was immaterial.$6.9 million. As of April 3, 2021, the portion of derivative assets classified as long-term was $0.1 million.
(2) Short-term derivative liabilities are recorded in "accrued liabilities"accrued liabilities and long-term derivative liabilities are recorded in "other long-term liabilities".other non-current liabilities on the condensed consolidated balance sheets. As of December 31, 2017January 1, 2022, the portion of derivative liabilities classified as long-term was immaterial.$0.1 million. As of April 3, 2021, the portion of derivative liabilities classified as long-term was $2.0 million.
Non-Designated Hedges
As of December 31, 2017,January 1, 2022, the Company had foreign currency forward contracts denominated in EurosEuro ("EUR"), British and Great Britain Pound Sterling ("GBP"GBP."), Australian Dollars ("AUD"), and Canadian Dollars ("CAD"). The Company does not elect to obtain hedge accounting for these forward contracts. These forward contracts hedge against a portion of the Company’s foreign currency-denominated cash balances, accounts receivables, and accounts payables. The following table summarizes the notional value of the Company’s outstanding foreign exchange currency contracts and approximate U.S. Dollar ("USD")USD equivalent at December 31, 2017:January 1, 2022:
| | | | | | | | | | | | | | | | | | | | | | | |
| (in thousands) | Local Currency | | USD Equivalent | | Position | | Maturity |
| EUR | € | 25,000 | | | $ | 28,335 | | | Sell EUR | | 1 month |
| GBP | £ | 10,400 | | | $ | 14,040 | | | Sell GBP | | 1 month |
| | | | | | | |
| | | | | | | |
|
| | | | | | | | | | | |
| (in thousands) | Local Currency | | USD Equivalent | | Position | | Maturity |
| EUR | € | 38,700 |
| | $ | 46,560 |
| | Sell EUR | | 1 month |
| GBP | £ | 5,100 |
| | $ | 6,899 |
| | Sell GBP | | 1 month |
| AUD | A$ | 14,200 |
| | $ | 11,092 |
| | Sell AUD | | 1 month |
| CAD | C$ | 2,900 |
| | $ | 2,315 |
| | Sell CAD | | 1 month |
Effect of Non-Designated Derivative Contracts on the Condensed Consolidated Statements of Operations
The effect of non-designated derivative contracts on results of operations recognized in other non-operating income, and (expense), net in the condensed consolidated statements of operations was as follows:
| | | | | | | | | | | | | | | | | | | | | | | | | | |
| | Three Months Ended | | Nine Months Ended |
| (in thousands) | | January 1, 2022 | | December 26, 2020 | | January 1, 2022 | | December 26, 2020 |
| Gain (loss) on foreign exchange contracts | | $ | 651 | | | $ | (4,440) | | | $ | 1,841 | | | $ | (7,173) | |
|
| | | | | | | | | | | | | | | | |
| | | Three Months Ended December 31, | | Nine Months Ended
December 31, |
| (in thousands) | | 2016 | | 2017 | | 2016 | | 2017 |
| Gain (loss) on foreign exchange contracts | | $ | 3,801 |
| | $ | 848 |
| | $ | 5,551 |
| | $ | 6,083 |
|
Cash Flow Hedges
Costless Collars
The Company hedges a portion of the forecastedforecasted EUR and GBP denominated revenues with costless collars. On a monthly basis, the Company enters into option contracts with a six to eleven monthtwelve-month term. Collar contracts are scheduled to mature at the beginning of each fiscal quarter, at which time the instruments convert to forward contracts. The Company also enters into cash flow forwards with a three monththree-month term. Once the hedged revenues are recognized, the forward contracts become non-designated hedges to protect the resulting foreign monetary asset position for the Company.
The notional value of the Company's outstanding EUR and GBP option and forward contracts at the end of each period was as follows:
|
| | | | | | | | | | | | | | | | | | | | | | | | | |
| | March 31, 2017January 1, 2022 | | December 31, 2017April 3, 2021 |
| (in millions) | | EUR | | GBP | | EUR | | GBP |
| Option contracts | | €73.577.4 | | £23.915.7 | | €75.891.4 | | £22.918.1 |
| Forward contracts | | €11.275.0 | | £3.314.0 | | €13.076.0 | | £4.115.6 |
The Company will reclassify all related amounts in accumulated in other comprehensive income into earnings within the next twelve months.
Cross-currency Swaps
The Company hedges a portion of the forecasted Mexican Peso (“MXN”) denominated expenditures with a cross-currency swap. As of March 31, 2017January 1, 2022, and December 31, 2017,April 3, 2021, the Company had foreign currency swap contracts of approximately MXN 287.2415.9 million andand MXN 76.3564.3 million, respectively.
The following table summarizes the notional value of the Company’sCompany's outstanding MXN cross-currencycurrency swaps and approximate USD Equivalent at DecemberJanuary 1, 2022:
| | | | | | | | | | | | | | | | | | | | | | | |
| (in thousands) | Local Currency | | USD Equivalent | | Position | | Maturity |
| MXN | 415,938 | | | $ | 19,860 | | | Buy MXN | | Monthly over a nine month period |
The Company will reclassify all related amounts in accumulated other comprehensive income into earnings within the next twelve months.
Interest Rate Swaps
On June 15, 2021, the Company entered into a three-year amortizing interest rate swap agreement with Bank of America, N.A. The swap has an initial notional amount of $680 million and matures on July 31, 2017:2024. The swap involves the receipt of floating-rate interest payments for fixed interest rate payments at a rate of 0.39% over the life of the agreement. Additionally, on July 30, 2018, the Company entered into a four-year amortizing interest rate swap agreement with Bank of America, N.A. The swap has an initial notional amount of $831 million and matures on July 31, 2022. The swap involves the receipt of floating-rate interest payments for fixed interest rate payments at a rate of 2.78% over the life of the agreement.
The Company has designated the interest rate swaps as cash flow hedges. The purpose of the interest rate swaps is to hedge against changes in cash flows (interest payments) attributable to fluctuations in the Company's variable rate debt. The swaps are valued based on prevailing LIBOR rate curves on the date of measurement. The Company also evaluates counterparty credit risk when it calculates the fair value of the interest rate swaps. Changes in the fair value of the interest rate swaps are recorded to other comprehensive income and are reclassified to interest expense over the life of the underlying debt as interest is accrued. During the nine months ended January 1, 2022, the Company reclassified into interest expense $7.6 million and had a $4.1 million unrealized gain on its interest rate swaps derivatives designated as cash flow hedges.
The Company will reclassify approximately $2.7 million in accumulated other comprehensive income into earnings within the next twelve months.
|
| | | | | | | | | | | | |
| (in thousands) | Local Currency | | USD Equivalent | | Position | | Maturity |
| MXN | $ | 76,340 |
| | $ | 3,935 |
| | Buy MXN | | Monthly over | 6 months |
Effect of Designated Derivative Contracts on AOCIAccumulated Other Comprehensive Income (Loss) and Condensed Consolidated Statements of Operations
The following table presents the pre-tax effects of derivative instruments designated as cash flow hedges on accumulated other comprehensive income and the condensed consolidated statements of operations for the three and nine months ended January 1, 2022 and December 31, 2016 and 2017:26, 2020:
| | | | | | | | | | | | | | | | | | | | | | | | | | |
| | Three Months Ended | | Nine Months Ended |
| (in thousands) | | January 1, 2022 | | December 26, 2020 | | January 1, 2022 | | December 26, 2020 |
| Loss included in accumulated other comprehensive income (loss), as of beginning of period | | $ | (3,252) | | | $ | (16,747) | | | $ | (10,062) | | | $ | (20,156) | |
| | | | | | | | |
| Gain (loss) recognized in other comprehensive income (loss) | | 7,846 | | | (3,754) | | | 8,520 | | | (8,339) | |
| | | | | | | | |
| Amount of (gain) loss reclassified from accumulated other comprehensive income (loss) into net revenues | | (1,804) | | | 1,054 | | | (671) | | | 1,797 | |
| Amount of gain reclassified from accumulated other comprehensive income (loss) into cost of revenues | | (10) | | | — | | | (489) | | | — | |
| Amount of loss reclassified from accumulated other comprehensive income (loss) into interest expense | | 2,100 | | | 3,039 | | | 7,582 | | | 10,290 | |
| Total amount of loss reclassified from accumulated other comprehensive income to the condensed consolidated statements of operations | | 286 | | | 4,093 | | | 6,422 | | | 12,087 | |
| | | | | | | | |
| | | | | | | | |
| | | | | | | | |
| Gain (loss) included in accumulated other comprehensive income (loss), as of end of period | | $ | 4,880 | | | $ | (16,408) | | | $ | 4,880 | | | $ | (16,408) | |
|
| | | | | | | | | | | | | | | | |
| | | Three Months Ended December 31, | | Nine Months Ended
December 31, |
| (in thousands) | | 2016 | | 2017 | | 2016 | | 2017 |
| Gain (loss) included in AOCI as of beginning of period | | $ | (471 | ) | | $ | (3,089 | ) | | $ | (1,106 | ) | | $ | 541 |
|
| | | | | | | | | |
Amount of gain (loss) recognized in other comprehensive income (“OCI”) (effective portion) | | 2,090 |
| | (446 | ) | | 2,394 |
| | (5,093 | ) |
| | | | | | | | | |
| Amount of gain (loss) reclassified from OCI into net revenues (effective portion) | | 2,178 |
| | 1,357 |
| | 3,163 |
| | 2,506 |
|
| Amount of gain (loss) reclassified from OCI into cost of revenues (effective portion) | | (756 | ) | | (61 | ) | | (2,072 | ) | | (193 | ) |
| Total amount of gain (loss) reclassified from AOCI to income (loss) (effective portion) | | 1,422 |
| | 1,296 |
| | 1,091 |
| | 2,313 |
|
| | | | | | | | | |
| Gain (loss) included in AOCI as of end of period | | $ | 197 |
| | $ | (2,239 | ) | | $ | 197 |
| | $ | (2,239 | ) |
DuringFair value is defined as the exit price, or the amount that would be received to sell an asset or paid to transfer a liability in an orderly transaction between market participants as of the measurement date. The authoritative guidance establishes a hierarchy for inputs used in measuring fair value that maximizes the use of observable inputs and minimizes the use of unobservable inputs by requiring that the most observable inputs be used when available. Observable inputs are from sources independent of the Company. Unobservable inputs reflect the Company’s assumptions about the factors market participants would use in valuing the asset or liability developed based upon the best information available in the circumstances. The categorization of financial assets and liabilities within the valuation hierarchy is based upon the lowest level of input that is significant to the fair value measurement. In determining fair value, we use various valuation approaches. The hierarchy of those valuation approaches is in three levels based on the reliability of inputs. Assets and liabilities are classified in their entirety based on the lowest level of input that is significant to the fair value measurement. The following is a summary of the hierarchy levels:
•Level 1: Inputs are quoted prices in active markets for identical assets or liabilities.
•Level 2: Inputs include quoted prices for similar assets or liabilities in active markets, quoted prices for identical or similar assets or liabilities in markets that are not active, and inputs (other than quoted prices) that are observable for the asset or liability, either directly or indirectly.
•Level 3: Inputs are unobservable for the asset or liability.
| | | | | | | | | | | | | | | | | |
| Carrying Value at
January 1, 2022 | | Fair Value at January 1, 2022
Using Inputs Considered as: |
| (in thousands) | | Level 1 | Level 2 | Level 3 |
| Assets: | | | | | |
| Cash and cash equivalents | $ | 182,700 | | | $ | 182,700 | | $ | — | | $ | — | |
| Short-term investments | 17,017 | | | 17,017 | | — | | — | |
| Derivative instruments | 10,572 | | | — | | 10,572 | | — | |
| | | | | |
| Liabilities: | | | | | |
| Derivative instruments | $ | 4,937 | | | $ | — | | $ | 4,937 | | $ | — | |
| Long-term debt | 1,499,228 | | | — | | 1,474,436 | | — | |
| | | | | | | | | | | | | | | | | |
| Carrying Value at
April 3, 2021 | | Fair Value at April 3, 2021
Using Inputs Considered as: |
| (in thousands) | | Level 1 | Level 2 | Level 3 |
| Assets: | | | | | |
| Cash and cash equivalents | $ | 202,560 | | | $ | 202,560 | | $ | — | | $ | — | |
| Restricted cash | 493,908 | | | 493,908 | | — | | — | |
| Short-term investments | 14,559 | | | 14,559 | | — | | — | |
| Derivative instruments | 5,106 | | | — | | 5,106 | | — | |
| | | | | |
| Liabilities: | | | | | |
| Derivative instruments | $ | 11,802 | | | $ | — | | $ | 11,802 | | $ | — | |
| Current portion of long-term debt | 478,807 | | | — | | 482,669 | | — | |
| Long-term debt | 1,496,064 | | | — | | 1,497,323 | | — | |
Valuation Techniques
•Cash and cash equivalents, short-term investments, and restricted cash are classified within Level 1 of the fair value hierarchy. Financial instruments classified as Level 1 are based on quoted market prices in active markets. The types of financial instruments the Company classifies within Level 1 include bank deposits, money market securities, and publicly traded mutual funds. Restricted cash represents the cash held in trust and restricted for use to redeem the 5.50% Senior Notes. Refer to Note 7, Debt.
•The Company estimates the fair value of derivatives using pricing models that use observable market inputs. The significant Level 2 inputs used in the valuation of derivatives include spot rates and forward rates. These inputs were obtained from pricing services, broker quotes, and other sources.
•The fair value of long-term debt was determined based on inputs that were observable in the market, including the trading price, when available.
The Company did not incur any material realized or unrealized gains or losses in the three and nine months ended January 1, 2022 or December 31, 201626, 2020.
There were no transfers between fair value hierarchy levels during the three and 2017 the Company recognized an immaterial gain and immaterial loss on the ineffective portion of its cash flow hedges, respectively, which is reported in other non-operating income and (expense), net in the condensed consolidated statements of operations.nine months ended January 1, 2022 or December 26, 2020.
13.12. INCOME TAXES
The Company and its subsidiaries are subject to taxation in the U.S. and in various foreign and state jurisdictions. The Company's income tax benefit is determined using an estimated annual effective tax rate, adjusted for discrete items arising during the period. The effective tax rates for the three and nine months ended December 31, 2016January 1, 2022 were 46.2% and 2017 were 11.0% and 255.1%172.2%, respectively. The effective tax rates for the three and nine months ended December 31, 201626, 2020 were (53.9)% and 2017 were 18.4% and 114.6%9.6%, respectively.
On December 22, 2017,Income tax benefit for the Tax Cutsthree and Jobs Act (H.R. 1) (the “Act”)nine months ended January 1, 2022 was signed into law in the United States. The Act includes several changes to existing$(9.6) million and $(116.4) million, respectively. Income tax law, including, among other things, a permanent reduction in the corporate income tax rate from 35% to 21% and the move from a worldwide to a territorial tax system.
The move to a territorial tax system was accompanied by federal taxation of a one-time deemed repatriation of accumulated unremitted earnings (hereafter, the "toll charge"), which the Company will elect to pay over an eight-year period as permitted
under the Act. The Company recorded a $69.3 million toll charge as part of income tax expense in the quarter ended December 31, 2017, representing a provisional estimate based on a 15.5% tax applied to foreign unremitted cash and cash equivalents and an 8% tax applied to permanently reinvested foreign assets. The provisional toll charge increased our effective tax rate by 217.2% and 94.1%benefit for the three and nine months ended December 30, 2017,26, 2020 was $(7.0) million and $(7.2) million, respectively. As partDuring the three months ended October 2, 2021, the Company transferred certain non-Americas intellectual property (“IP”) rights between our wholly-owned subsidiaries ("IP transfer") to align with our evolving business operations, resulting in the derecognition of a deferred tax asset of $91.1 million and the recognition of a new deferred tax asset of $204.3 million, which represents the book and tax basis difference in the IP and was based on the fair value of the Act,IP, in the Company also completed its remeasurementrespective subsidiaries. This results in a net discrete deferred tax benefit of $113.2 million. The impact of the IP transfer to net cash flows on the condensed consolidated statements of cash flows during the nine months ended January 1, 2022 was not material.
The difference between the effective tax rate and the U.S. federal statutory rate primarily relates to the changes in uncertain tax positions, U.S. and foreign income mix, and the valuation allowance on the U.S. federal and state deferred tax assets (DTAs) that continues to be maintained as of December 31, 2017January 1, 2022.
A significant portion of the Company's DTAs relate to the newIP transfer between wholly-owned subsidiaries. At this time, based on evidence currently available, the Company considers it more likely than not that it will have sufficient taxable income in the future federalthat will allow the Company to realize the DTAs; however, failure to generate sufficient future taxable income could result in some or all DTAs not being utilized in the future. If the Company is unable to generate sufficient future taxable income, a substantial valuation allowance to reduce the Company's DTAs may be required.
The Company is subject to the examination of its income tax ratereturns by the Internal Revenue Service and other tax authorities.Significant judgment is required in evaluating our uncertain tax positions and determining the Company's provision for income taxes. During the three months ended January 1, 2022, the amount of 21%, thereby reducinggross unrecognized tax benefits decreased by $3.6 million. As of January 1, 2022, the Company’s deferredCompany has $17.9 million of unrecognized tax assets by $2.1 million. The rate change resultedbenefits, all of which could result in an overall increase toa reduction of the Company’s effective tax rate by 6.6% and 2.9% for the three and nine months ended December 31, 2017, respectively. In addition, prior to its third quarter of Fiscal Year 2018, the Company did not recognize a deferred tax liability related to unremitted foreign earnings because its plans did not require the Company to repatriate earnings from foreign operations to fund U.S. operations. if recognized.The Company expects to fund payment of the toll charge by repatriating a portion of its foreign earnings and as such, has recorded a deferred tax liability of $5.0 million related to state income taxes and foreign withholding taxes that will become due as the Company repatriates foreign earnings. This increased the Company’s effective tax rate by 15.6% and 6.8% for the three and nine months ended December 31, 2017, respectively. Finally, the Company files its federal tax return on a fiscal year-end and is therefore required to pro-rate the new and old tax rates during Fiscal Year 2018. The blended, annualized tax rate applied to Fiscal Year 2018 income is 31.56%. This reduction in the federal tax rate reduced the Company’s global tax rate by 2.3% and 1.0% for the three and nine months ended December 31, 2017, respectively.
The provisional estimate for the toll charge will be finalized when the Company completes its substantive review of unremitted foreign earnings through examination of statutory filings and tax returns of the Company's foreign subsidiaries and fiscal branches that span a 30-year period. The Company must also analyze the impact of foreign exchange rates and inflation on the historical information to support foreign tax credits available to offset the toll charge. In addition, the Company's estimate of the toll charge obligation may change due to legislative technical corrections, the IRS' promulgation of regulations to interpret the Act, and changes in accounting standards for income taxes or related interpretations in response to the Act. This review and finalization of the toll charge provisional estimate will be completed within a twelve month measurement period from the date of enactment.
The Company recorded a correction to the geographic mix of income during the three months ended June 30, 2017 related to Fiscal Year 2017, which reduced income in a high tax jurisdiction and increased income in a low tax jurisdiction. This correction resulted in a reduction to the Company’s effective tax rate by 3.5 percentage points for the nine months ended December 31, 2017 as compared to the prior year period and had no impact on the three months ended December 31, 2017. For additional details regarding this correction refer to Note 1, Basis of Presentation.
The Company adopted new stock-based compensation accounting guidance effective the beginning of Fiscal Year 2018. Excess tax benefits associated with employee equity plans were previously recorded in additional paid-in capital and the adoption of this guidance had an immaterial impact on the Company's effective tax rate for the three months ended December 31, 2017, but resulted in a reduction to the Company's effective tax rate by 2.6 percentage points for the nine months ended December 31, 2017. The amount of excess tax benefits or deficiencies will fluctuate from period-to-period based on the price of the Company’s stock, the volume of share-based instruments settled or vested, and the value assigned to employee equity awards under U.S. GAAP.
Included in long-term income taxes payable in the condensed consolidated balance sheets as of March 31, 2017 and December 31, 2017 weregross unrecognized tax benefits is primarily attributable to the lapse of $12.9 million and $12.3 million, respectively, which would favorably impact the effective tax rate in future periods if recognized. The Company’s continuing practice is to recognize interest and/or penalties related to income tax matters in income tax expense in the condensed consolidated statementsapplicable statute of operations. The accrued interest related to unrecognized tax benefits was $1.7 million and $1.4 million aslimitations.
The Company and its subsidiaries are subject to taxation in the U.S. federal and various foreign and state jurisdictions. The Company’s Fiscal Year 2016 federal income tax return is currently under examination by the Internal Revenue Service. Foreign income tax matters for material tax jurisdictions have been concluded for tax years prior to Fiscal Year 2012.
The Company believes that an adequate provision has been made for any adjustments that may result from tax examinations; however, the outcome of such examinations cannot be predicted with certainty. If any issues addressed in the tax examinations are resolved in a manner inconsistent with the Company's expectations, the Company could be required to adjust its provision for income tax in the period such resolution occurs. The timing of any resolution and/or closure of tax examinations is not certain.
14.13. COMPUTATION OF (LOSS) EARNINGS (LOSS) PER COMMON SHARE
Basic (loss) earnings (loss) per share is calculated by dividing net (loss) income associated with common shareholders by the weighted-average number of common shares outstanding during the period. Diluted (loss) earnings (loss) per share assumes the issuance of additional shares of common stock by the Company upon exercise of all outstanding stock options and vesting of restricted stock, if the effect is dilutive, in accordance with the treasury stock method or two-class method (whichever is more dilutive). Refer to Note 1, Basismethod. The potentially dilutive effect of Presentation, for additional information regardingoutstanding stock options and restricted stock has been excluded from the Company's computation of earnings (loss)diluted loss per common share.share in periods where the Company had a net loss, as their effect is anti-dilutive.
The following table sets forth the computation of basic and diluted (loss) earnings (loss) per common share for the three and nine months ended January 1, 2022 and December 31, 2016 and 2017:26, 2020:
| | | | | | | | | | | | | | | | | | | | | | | | | | |
| | Three Months Ended | | Nine Months Ended |
| (in thousands, except per share data) | | January 1, 2022 | | December 26, 2020 | | January 1, 2022 | | December 26, 2020 |
| Numerator: | | | | | | | | |
| Net (loss) income | | $ | (11,164) | | | $ | 20,113 | | | $ | 48,810 | | | $ | (68,307) | |
| | | | | | | | |
| Denominator: | | | | | | | | |
| Weighted-average basic shares outstanding | | 42,745 | | 41,252 | | | 42,450 | | 40,894 | |
| Weighted-average diluted shares outstanding | | 42,745 | | 42,184 | | | 43,811 | | 40,894 | |
| | | | | | | | |
| Basic (loss) earnings per common share | | $ | (0.26) | | | $ | 0.49 | | | $ | 1.15 | | | $ | (1.67) | |
| Diluted (loss) earnings per common share | | $ | (0.26) | | | $ | 0.48 | | | $ | 1.11 | | | $ | (1.67) | |
| | | | | | | | |
| Potentially dilutive securities excluded from diluted (loss) earnings per common share because their effect is anti-dilutive | | 383 | | 988 | | | 210 | | 1,248 | |
|
| | | | | | | | | | | | | | | | |
| | | Three Months Ended December 31, | | Nine Months Ended
December 31, |
| (in thousands, except per share data) | | 2016 | | 2017 | | 2016 | | 2017 |
| Basic earnings (loss) per common share: | | | | | | | | |
| Numerator: | | | | | | | | |
| Net income (loss) | | $ | 22,221 |
| | $ | (49,504 | ) | | $ | 63,082 |
| | $ | (10,723 | ) |
| | | | | | | | | |
| Denominator: | | | | | | | | |
| Weighted average common shares, basic | | 32,242 |
| | 32,075 |
| | 32,260 |
| | 32,384 |
|
| Dilutive effect of employee equity incentive plans | | 584 |
| | — |
| | 635 |
| | — |
|
| Weighted average common shares-diluted | | 32,826 |
| | 32,075 |
| | 32,895 |
| | 32,384 |
|
| | | | | | | | | |
| Basic earnings (loss) per common share | | $ | 0.69 |
| | $ | (1.54 | ) | | $ | 1.96 |
| | $ | (0.33 | ) |
| Diluted earnings (loss) per common share | | $ | 0.68 |
| | $ | (1.54 | ) | | $ | 1.92 |
| | $ | (0.33 | ) |
| | | | | | | | | |
| Potentially dilutive securities excluded from diluted earnings (loss) per common share because their effect is anti-dilutive | | 473 |
| | 968 |
| | 573 |
| | 1,107 |
|
15.14. REVENUE AND MAJOR CUSTOMERS
The Company designs, manufactures,builds, and markets collaboration solutions which combine legendary audio expertise and sells headsetspowerful video and conferencing capabilities to create endpoints that power meaningful human connections and provide solutions that make life easier when they work together and with our partners' services.
The Company’s major product categories are Headsets, Video, Voice, and Services. Headsets include wired and wireless communication headsets; Voice includes open SIP and native ecosystem desktop phones as well as conference room phones; Video includes video conferencing solutions and peripherals, such as cameras, speakers, and microphones. The broad portfolio of Services include video interoperability, hardware and support for businessour solutions and consumer applications. With respecthardware devices, as well as professional, hosted, and managed services that are grounded in our deep expertise aimed at helping customers achieve their goals for collaboration. The Company's cloud management and analytics software enables IT administrators to headsets,configure and update firmware, monitor device usage, troubleshoot, and gain a deep understanding of user behavior. All of the Company makes products for useCompany's solutions are designed to integrate seamlessly with the platform and services of our customers choice in a wide range of Unified Communications & Collaboration ("UC&C"), Unified Communication as a Service ("UCaaS"), and Video as a Service ("VaaS") environments. The Company's RealPresence collaboration solutions range from infrastructure to endpoints and allow people to connect and collaborate globally, naturally, and seamlessly.
Product revenue is largely comprised of sales of hardware devices, peripherals, and platform software licenses used in communication and collaboration in offices and contact centers, and, with mobile devices, cordless phones, computers, and gaming consoles. computers. Services revenue primarily includes support on hardware devices, professional, hosted and managed services, and solutions to the Company's customers.
The following table presents netdisaggregates revenues by major product groupcategory for the three and nine months ended January 1, 2022 and December 31, 2016 and 2017:26, 2020:
| | | | | | | | | | | | | | | | | | | | | | | | | | |
| | Three Months Ended | | Nine Months Ended |
| (in thousands) | | January 1, 2022 | | December 26, 2020 | | January 1, 2022 | | December 26, 2020 |
| Net revenues | | | | | | | | |
| Headsets | | $ | 195,479 | | | $ | 240,908 | | | $ | 553,452 | | | $ | 618,498 | |
| Voice | | 53,156 | | | 67,076 | | | 174,159 | | | 156,682 | |
| Video | | 105,387 | | | 112,727 | | | 358,996 | | | 284,666 | |
| Services | | 55,544 | | | 63,974 | | | 173,155 | | | 191,529 | |
| Total net revenues | | $ | 409,566 | | | $ | 484,685 | | | $ | 1,259,762 | | | $ | 1,251,375 | |
|
| | | | | | | | | | | | | | | | |
| | | Three Months Ended December 31, | | Nine Months Ended
December 31, |
| (in thousands) | | 2016 | | 2017 | | 2016 | | 2017 |
| Net revenues from unaffiliated customers: | | | | | | | | |
| Enterprise | | $ | 157,345 |
| | $ | 167,640 |
| | $ | 467,784 |
| | $ | 485,152 |
|
| Consumer | | 75,588 |
| | 58,894 |
| | 204,438 |
| | 155,608 |
|
| Total net revenues | | $ | 232,933 |
| | $ | 226,534 |
| | $ | 672,222 |
| | $ | 640,760 |
|
For reporting purposes, revenue is attributed to each geographic region based on the location of the customer. Other than the U.S., no country accounted for 10% or more of the Company's total net revenues for the three and nine months ended January 1, 2022 and December 31, 2016 and 2017.26, 2020. The following table presents total net revenues by geography:
| | | | | | | | | | | | | | | | | | | | | | | | | | |
| | Three Months Ended | | Nine Months Ended |
| (in thousands) | | January 1, 2022 | | December 26, 2020 | | January 1, 2022 | | December 26, 2020 |
| Net product revenues | | | | | | | | |
| U.S. | | $ | 160,731 | | | $ | 169,812 | | | $ | 522,770 | | | $ | 473,633 | |
| | | | | | | | |
| Europe, Middle East, and Africa | | 119,067 | | | 164,896 | | | 327,868 | | | 357,389 | |
| Asia Pacific | | 46,273 | | | 57,481 | | | 161,836 | | | 155,460 | |
| Americas, excluding U.S. | | 27,951 | | | 28,522 | | | 74,133 | | | 73,364 | |
| Total international net product revenues | | 193,291 | | | 250,899 | | | 563,837 | | | 586,213 | |
| | | | | | | | |
| Total net product revenues | | $ | 354,022 | | | $ | 420,711 | | | $ | 1,086,607 | | | $ | 1,059,846 | |
| | | | | | | | |
| Net service revenues | | | | | | | | |
| U.S. | | $ | 21,498 | | | $ | 23,601 | | | $ | 66,347 | | | $ | 71,839 | |
| | | | | | | | |
| Europe, Middle East, and Africa | | 14,117 | | | 16,533 | | | 43,199 | | | 48,545 | |
| Asia Pacific | | 16,140 | | | 19,342 | | | 51,643 | | | 57,196 | |
| Americas, excluding U.S. | | 3,789 | | | 4,498 | | | 11,966 | | | 13,949 | |
| Total international net service revenues | | 34,046 | | | 40,373 | | | 106,808 | | | 119,690 | |
| | | | | | | | |
| Total net service revenues | | $ | 55,544 | | | $ | 63,974 | | | $ | 173,155 | | | $ | 191,529 | |
| | | | | | | | |
| Total net revenues | | $ | 409,566 | | | $ | 484,685 | | | $ | 1,259,762 | | | $ | 1,251,375 | |
Deferred revenue is primarily comprised of non-cancelable maintenance support performance obligations on hardware devices which are typically billed in advance and recognized ratably over the contract term as the services are delivered. As of January 1, 2022 and April 3, 2021, the Company's deferred revenue balance was $199.2 million and $213.8 million, respectively. During the three months ended January 1, 2022, the Company recognized $46.2 million in total net revenues that were recorded in deferred revenue at the beginning of the period.
|
| | | | | | | | | | | | | | | | |
| | | Three Months Ended December 31, | | Nine Months Ended
December 31, |
| (in thousands) | | 2016 | | 2017 | | 2016 | | 2017 |
| Net revenues from unaffiliated customers: | | | | | | | | |
| U.S. | | $ | 123,719 |
| | $ | 106,455 |
| | $ | 371,019 |
| | $ | 326,360 |
|
| | | | | | | | | |
| Europe and Africa | | 63,233 |
| | 73,620 |
| | 168,722 |
| | 184,761 |
|
| Asia Pacific | | 27,164 |
| | 27,553 |
| | 81,979 |
| | 75,664 |
|
| Americas, excluding U.S. | | 18,817 |
| | 18,906 |
| | 50,502 |
| | 53,975 |
|
| Total international net revenues | | 109,214 |
| | 120,079 |
| | 301,203 |
| | 314,400 |
|
| Total net revenues | | $ | 232,933 |
| | $ | 226,534 |
| | $ | 672,222 |
| | $ | 640,760 |
|
| | | | | | | | | | | | | | | | | | | | |
| (in thousands) | | Current | | Non-Current | | Total |
| Unsatisfied (or partially unsatisfied) performance obligations | | $ | 132,498 | | | $ | 66,695 | | | $ | 199,193 | |
One
Sales, value add, and other taxes collected concurrently with revenue producing activities are excluded from revenue.
The Company's indirect channel model includes both a two-tiered distribution structure, where the Company sells to distributors that subsequently sell to resellers, and a one-tiered structure where the Company sells directly to resellers. For these arrangements, transfer of control begins at the time access to the Company's services is made available to the end customer Ingram Micro Group, accountedand entitlements have been contractually established, provided all other criteria for 10.5%revenue recognition are met.
Commercial distributors and 10.6%retailers represent the Company's largest sources of net revenues. Sales through its distribution and retail channels are made primarily under agreements allowing for rights of return and include various sales incentive programs, such as back end rebates, discounts, marketing development funds, price protection, and other sales incentives. The Company has an established sales history for these arrangements and the Company records the estimated reserves at the inception of the contract as a reflection of the reduced transaction price. Customer sales returns are estimated based on historical data, relevant current data, and the monitoring of inventory build-up in the distribution channel. Revenue reserves represent a reasonable estimation made by management and are subject to significant judgment. Estimated reserves may differ from actual returns or incentives provided due to unforeseen customer return or claim patterns or changes in circumstances. For certain customer contracts which have historically demonstrated variability, the Company has considered the likelihood of being under-reserved and has considered a constraint accordingly. Provisions for sales returns are presented within accrued liabilities in the condensed consolidated balance sheets. Provisions for promotions, rebates, and other sales incentives are presented as a reduction of accounts receivable unless there is no identifiable right to offset, in which case they are presented within accrued liabilities on the condensed consolidated balance sheets. See Note 4, Details of Certain Balance Sheet Accounts.
For certain arrangements, the Company pays commissions, bonuses and taxes associated with obtaining the contracts. The Company capitalizes such costs if they are deemed to be incremental and recoverable. The Company has elected to use the practical expedient to record the incremental costs of obtaining a contract as an expense when incurred if the amortization period of the asset that the entity otherwise would have recognized is one year or less. Determining the amortization period of costs related to obtaining a contract involves judgment. Capitalized commissions and related expenses on hardware sales and services recognized at a point in time generally have an amortization period of less than one year. Maintenance-related performance obligations generally have an amortization period greater than one year when considering renewals. Capitalized commissions are amortized to selling, general, and administrative expense on a straight-line basis. The capitalized amount of incremental and recoverable costs of obtaining contracts and related amortization was not material as of and for the three and nine months ended January 1, 2022.
15. SEGMENT REPORTING AND GEOGRAPHIC INFORMATION
The Company's Chief Executive Officer is identified as its Chief Operating Decision Maker ("CODM.") The CODM has organized the Company, manages resource allocations, and measures performance among its 2 operating segments: Products and Services.
The Products reportable segment includes the Headsets, Voice and Video product lines. The Services reportable segment includes maintenance support on hardware devices as well as professional, managed and cloud services and solutions.
In managing the 2 operating segments the CODM uses information about their revenue and gross margin after adjustments to exclude certain non-cash transactions and activities that are not reflective of the Company's ongoing or core operations as further described below. The CODM does not review asset information by segment.
Purchase accounting amortization: Represents the amortization of purchased intangible assets recorded in connection with the acquisition of Polycom.
Deferred revenue purchase accounting: Represents the impact of fair value purchase accounting adjustments related to deferred revenue recorded in connection with the Acquisition of Polycom. The Company's deferred revenue primarily relates to service revenue associated with non-cancelable maintenance support on hardware devices which are typically billed in advance and recognized ratably over the contract term as those services are delivered. This adjustment represents
the amount of additional revenue that would have been recognized during the period absent the write-down to fair value required under purchase accounting guidelines.
Stock compensation expense: Represents the non-cash expense associated with the Company's grant of stock-based awards to employees and non-employee directors.
The following table presents segment results for revenue and gross margin, as reviewed by the CODM, and the related reconciliation to the Company's condensed consolidated GAAP results:
| | | | | | | | | | | | | | | | | | | | | | | | | | |
| | Three Months Ended | | Nine Months Ended |
| (in thousands) | | January 1, 2022 | | December 26, 2020 | | January 1, 2022 | | December 26, 2020 |
| Segment revenues, as reviewed by CODM | | | | | | | | |
| Products | | $ | 354,149 | | | $ | 420,976 | | | $ | 1,087,058 | | | $ | 1,060,733 | |
| Services | | 56,324 | | | 66,998 | | | 175,925 | | | 203,250 | |
| Total segment revenues, as reviewed by CODM | | $ | 410,473 | | | $ | 487,974 | | | $ | 1,262,983 | | | $ | 1,263,983 | |
| | | | | | | | |
| Segment gross profit, as reviewed by CODM | | | | | | | | |
| Products | | $ | 144,630 | | | $ | 201,392 | | | $ | 456,937 | | | $ | 492,262 | |
| Services | | 37,939 | | | 45,812 | | | 117,591 | | | 138,329 | |
| Total segment gross profit, as reviewed by CODM | | $ | 182,569 | | | $ | 247,204 | | | $ | 574,528 | | | $ | 630,591 | |
| | | | | | | | | | | | | | | | | | | | | | | | | | |
| | Three Months Ended | | Nine Months Ended |
| (in thousands) | | January 1, 2022 | | December 26, 2020 | | January 1, 2022 | | December 26, 2020 |
| Total segment revenues, as reviewed by CODM | | $ | 410,473 | | | $ | 487,974 | | | $ | 1,262,983 | | | $ | 1,263,983 | |
| Deferred revenue purchase accounting | | (907) | | | (3,289) | | | (3,221) | | | (12,608) | |
| GAAP net revenues | | $ | 409,566 | | | $ | 484,685 | | | $ | 1,259,762 | | | $ | 1,251,375 | |
| | | | | | | | |
Total segment gross profit, as reviewed by CODM (1) | | $ | 182,569 | | | $ | 247,204 | | | $ | 574,528 | | | $ | 630,591 | |
| Purchase accounting amortization | | (16,238) | | | (16,459) | | | (48,714) | | | (51,873) | |
| Deferred revenue purchase accounting | | (907) | | | (3,289) | | | (3,221) | | | (12,608) | |
| Stock-based compensation | | (1,238) | | | (799) | | | (3,525) | | | (2,374) | |
| GAAP gross profit | | $ | 164,186 | | | $ | 226,657 | | | $ | 519,068 | | | $ | 563,736 | |
(1) Includes depreciation expense of $3.4 million and $3.7 million for the three months ended January 1, 2022 and December 26, 2020, respectively. Includes depreciation expense of $11 million and $10.7 million for the nine months ended January 1, 2022 and December 26, 2020, respectively.
ITEM 2. MANAGEMENT'S DISCUSSION AND ANALYSIS OF FINANCIAL CONDITION AND RESULTS OF OPERATIONS
CERTAIN FORWARD-LOOKING INFORMATION
This Quarterly Report on Form 10-Q contains forward-looking statements within the meaning of Section 27A of the Securities Act of 1933, as amended, and Section 21E of the Securities Exchange Act of 1934, as amended, including statements relating to our intentions, beliefs, projections, outlook, analyses or current expectations that are subject to many risks and uncertainties. Such forward-looking statements and the associated risks and uncertainties include, but are not limited to: (i) our beliefs with respect to the length and severity of the COVID-19 (coronavirus) outbreak, and its impact across our businesses, our operations and global supply chain, including, our expectations that the virus has caused, and will continue to cause, a shift to a hybrid work environment and that the elevated demand we have experienced in certain product lines, including our Video and Voice devices, will continue over the long term; (ii) risks related to global supply chain disruptions, including continued uncertainty and potential impact on future quarters relating to a shortage of adequate component supply, including integrated circuits and manufacturing capacity, long lead times for raw materials and components, increased costs to us and increased pass-through costs to our customers, increased purchase commitments and a delay in our ability to fulfill orders, which has had, and may continue to have, an adverse impact on our business and operating results and which could continue to negatively affect our profitability and/or market share; (iii) expectations related to our ability to manage profitability and maintain margins in light of supply chain challenges, including our efforts to implement productivity improvements in our Tijuana manufacturing facility, while making investments for long-term growth, including investments in strategic alliances and/or acquisitions, in light of the supply chain challenges; (iv) our expectations regarding growth objectives related to our strategic initiatives designed to expand our product and service offerings, including our expectations related to increased demand for our solutions to facilitate hybrid working in and out of offices for our enterprise customers, as well as our expectations related to building strategic alliances and key partnerships with providers of collaboration tools and platforms to drive revenue growth and market share, including expectations related to our expansion of our presence in China; (v) our belief that we will continue to experience increased customer and partner demand in collaboration endpoints, and that we will be able to design new product offerings to meet changes in demand due to a global hybrid work environment; (vi) expectations related to our ability to fulfill the backlog generated by supply constraints and to timely supply the number of products to fulfill current and future customer demand in a timely manner to satisfy perishable demand; (vii) risks associated with our dependence on manufacturing operations conducted in our own facility in Tijuana, Mexico and through contract manufacturers, original design manufacturers, and suppliers to manufacture our products, to timely obtain sufficient quantities of materials and/or finished products of acceptable quality, at acceptable prices, and in the quantities necessary for us to meet critical schedules for the delivery of our own products and services and fulfill our anticipated customer demand; (viii) risks associated with our ability to secure critical components from sole source suppliers or identify alternative suppliers and/or buy component parts on the open market or completed goods in quantities sufficient to meet our requirements on a timely basis, affecting our ability to deliver products and services to our customers; (ix) risks related to increased cost of goods sold, including increased freight and other costs associated with expediting shipment and delivery of high-demand products to key markets in order to meet customer demand; (x) risks associated with passing on increased costs through price increases to customers; (xi) the impact if global or regional economic conditions deteriorate further, on our customers and/or partners, including increased demand for pricing accommodations, delayed payments, delayed deployment plans, insolvency or other issues which may increase credit losses; (xii) risks associated with significant and/or abrupt changes in product demand which increases the complexity of management’s evaluation of potential excess or obsolete inventory; (xiii) expectations related to our Services reportable segment revenues, particularly as we introduce next-generation, less complex, product solutions, or as companies shift from on premises to work from home options for their workforce, which have resulted and may continue to result in decreased demand for our professional, installation and/or managed service offerings; (xiv) expectations related to our efforts to drive sales and sustainable profitable revenue growth, to improve our profitability and cash flow, and accelerate debt reduction and de-levering; (xv) risks associated with forecasting sales and procurement demands, which are inherently difficult, particularly with continuing uncertainty in regional and global economic conditions; (xvi) our expectations regarding our ability to control costs, streamline operations and successfully implement our various cost-reduction activities and realize anticipated cost savings under such cost-reduction initiatives; (xvii) expectations relating to our earnings guidance, particularly as economic uncertainty, including, without limitation, uncertainty related to the continued impact of COVID-19, the current constraints in our ability to source key components for our products, continued uncertainty in the macro-economic climate and other external factors, puts further pressure on management judgments used to develop forward-looking financial guidance and other prospective financial information; (xviii) expectations related to GAAP and non-GAAP financial results for the full Fiscal Year 2022, including net revenues, adjusted earnings before interest, tax, depreciation, and amortization (EBITDA), tax rates, intangibles amortization, diluted weighted average shares outstanding and diluted earnings per share (EPS); (xix) our forecast and estimates with respect to tax matters, including expectations with respect to the valuation of our intellectual property or expectations regarding utilization of our deferred tax assets; and (xx) our expectations regarding pending and potential future litigation, in addition to other matters discussed in this Quarterly Report on Form 10-Q that are not purely historical data. Such forward-looking
statements are based on current expectations and assumptions and are subject to risks and uncertainties that may cause actual results to differ materially from the forward-looking statements.Factors that could cause actual results and events to differ materially from such forward-looking statements are included, but not limited to, those discussed in this Quarterly Report on Form 10-Q; in Part I, "Item 1A. Risk Factors" of our Annual Report on Form 10-K for the fiscal year ended April 3, 2021, filed with the Securities and Exchange Commission ("SEC") on May 18, 2021; and other documents we have filed with the SEC. We undertake no obligation to update or revise publicly any forward-looking statements, whether as a result of new information, future events, or otherwise, except as required by applicable law. Given these risks and uncertainties, readers are cautioned not to place undue reliance on such forward-looking statements.
OVERVIEW
Plantronics, Inc. (“Poly,” “Company,” “we,” “our,” or “us”) is a leading global communications technology company that designs, manufactures, and markets integrated communications and collaboration solutions for professionals. We offer premium audio and video products designed to work in an era where work is no longer a place and enterprise work forces are increasingly distributed. Our products and services are designed and engineered to connect people with high fidelity and incredible clarity. They are professional-grade, easy to use, and work seamlessly with major video and audio-conferencing platforms.
Our major product categories are Headsets, Video, Voice, and Services. Headsets include wired and wireless communication headsets; Voice includes open Session Initiation Protocol ("SIP") and native ecosystem desktop phones, as well as conference room phones; Video includes conferencing solutions and peripherals, such as cameras, speakers, and microphones.All of our solutions are designed to integrate seamlessly with the platform and services of our customers’ choice in a wide range of Unified Communications & Collaboration (“UC&C”), Unified Communication as a Service (“UCaaS”), and Video as a Service (“VaaS”) environments.
Additionally, our cloud management and analytics software enables Information Technology administrators to configure and update firmware, monitor device usage, troubleshoot, and gain a deep understanding of user behavior. We offer a broad portfolio of services including video interoperability, support for our solutions and hardware devices, as well as professional, hosted, and managed services that are grounded in our deep expertise aimed at helping our customers achieve their goals for collaboration.
We sell our products through a well-developed global network of distributors and channel partners, including value-added resellers, integrators, direct marketing resellers, and service providers, as well as through both traditional and online retailers, office supply distributors, and e-commerce channels. We have well-established distribution channels in the Americas, Europe, Middle East, Africa, and Asia Pacific, where use of our products is widespread.
Our fiscal year ends on the Saturday closest to the last day of March. The year ended April 2, 2022 ("Fiscal Year 2022") has 52 weeks, while the year ended April 3, 2021 ("Fiscal Year 2021") had 53 weeks. The three months ended January 1, 2022 ("third quarter Fiscal Year 2022") and December 26, 2020 ("third quarter Fiscal Year 2021") each had 13 weeks. The nine months ended January 1, 2022 and December 26, 2020 each had 39 weeks.
Impact of the Current Environment, Supply Chain Disruptions, and COVID-19 on Our Business
We have experienced and continue to monitor limited supply and longer lead times for certain key components, such as semiconductor chips, necessary to complete production and meet customer demand, including fulfillment of our backlog. We do not manufacture these component parts and currently purchase certain parts, including semiconductor chips and sub-assemblies that require semiconductor chips, from single or limited sources. Additionally, constrained supply has resulted in price inflation for certain components, including semiconductor chips, on the spot market, increased transportation costs, inefficiencies at our owned manufacturing facility in Tijuana, Mexico, and inability to fulfill backlog for certain products timely. We continue to monitor our supply chain and are taking action against limited supply and increasing lead times, including increased spot market purchases, outreach to critical suppliers, and entering into contractual obligations that provide for increased costs, and multi-year commitments, to secure supply. Additionally, to the extent we pass through increased costs to our customers, this may result in reduced demand. These factors, among others, are affecting and are expected to continue to affect total net revenue and gross margin rates.
In addition, COVID-19 has continued to spread globally and continues to add uncertainty and influence global economic activity, the global supply chain, and financial markets. The impact of the pandemic on our operations has varied by local conditions, government mandates, and business limitations, including travel bans, remote work, and other restrictions.
The COVID-19 pandemic led to a massive increase in remote work. As a result, during Fiscal Year 2021 we experienced elevated demand for certain enterprise Headsets and Video devices and a decline in demand for our Voice products and associated Services, as companies shifted from in-office to work-from-home arrangements for many of their office workers. Beginning in the fourth quarter of Fiscal Year 2021 and continuing through the third quarter of Fiscal Year 2022, we experienced elevated demand for certain Video and Voice devices as companies began to shift from work-from-home arrangements to hybrid work models.
However, the impact of COVID-19 is fluid and uncertain, and it has caused, and may continue to cause, various negative effects as we continue to experience constraints in our supply chain, specifically the sourcing of certain components and raw materials, and increased logistics costs to meet customer demand, which, in turn, adversely impacts our gross margins. As a result, the impact of COVID-19 to date has had mixed effects on our results of operations.
The full extent and duration of the impact of the COVID-19 pandemic on our business continues to be uncertain and difficult to predict and will depend on many factors outside of our control, including the extent and duration of the pandemic, mutations, and variants of the virus, the development and availability of effective treatments, including the availability of vaccines for our global workforce, mandates of protective public safety measures, and the impact of the pandemic on the global economy, global supply chains, and demand for our products. It is not possible at this time to foresee whether or when the outbreak of COVID-19 or other events beyond our control will be effectively contained, nor can we estimate the entirety of the impact that COVID-19 or such other pandemics or natural or man-made disaster will have on the global economy, our business, customers, suppliers, or other business partners. As such, impacts from such events on Poly are highly uncertain and we will continue to assess the impact from such events on our condensed consolidated financial statements.
In responding to this pandemic, employee safety continues to be a critical concern for Poly and we have taken measures to protect our employees globally by adherence to public safety and shelter in place directives, physical distancing protocols within offices and manufacturing facilities, providing personal protective equipment, including face masks and hand sanitizers, conducting routine sanitation of facilities, requiring health monitoring before entry into Poly facilities and restricting the number of visitors to our sites. The safety protocols implemented globally meet or exceed current regulations; however, we continue to monitor employees’ safety and evolving regulatory requirements. Although our manufacturing facility remains open and certain office employees may utilize our offices when necessary, the majority of all non-factory employees continue to work from home, using headsets and other Poly-issued equipment. We provided COVID-19 vaccines to our employees and their immediate families, as well as other workers, at our manufacturing facility on a voluntary basis free of charge.
Third Quarter Fiscal Year 2022 Highlights
Total net revenues for the third quarter of Fiscal Year 2022 were $409.6 million, a decrease of $75.1 million or (15.5)%, compared to the third quarter of Fiscal Year 2021, primarily driven by decreased sales in our Headset, Voice, Services and Video product categories.
Products gross margin rate for the third quarter of Fiscal Year 2022 decreased from 43.7% in the third quarter of Fiscal Year 2021 to 35.9%, primarily driven by increased component costs, unfavorable product mix, and increased transportation costs.
During the third quarter of Fiscal Year 2022, we announced the partnership with Appspace, a leading provider of workspace experience software, to deliver dynamic digital signage on Poly video OS devices to enhance the Return to Office experience for employees and visitors. The digital signage was available on Poly Studio X Series (including Poly Studio X30, X50, X70) and G7500 video conference devices with an Appspace subscription. We also announced the updated Poly Room Solutions for Microsoft Teams Rooms on Windows. The new lineup of Poly Studio Kits offers premium audio and video for focus, small, medium, and large rooms, and feature Poly's Director AI technology. These products were available during the third quarter of Fiscal Year 2022 and did not have a material impact on total net revenues.
RESULTS OF OPERATIONS
The Company’s reportable segments are Products and Services. Our Products reportable segment includes the Headsets, Voice, and Video product lines. Our Services reportable segment includes maintenance support on hardware devices, as well as professional, managed, and cloud services and solutions.
Total Net Revenues
The following table sets forth total net revenues by reportable segment for the three and nine months ended January 1, 2022 and December 26, 2020:
| | | | | | | | | | | | | | | | | | | | | | | | | | | | | | | | | | | | | | | | | | | | | | | | | | |
| | Three Months Ended | | | | | | Nine Months Ended | | | | |
| (in thousands, except percentages) | | January 1, 2022 | | December 26, 2020 | | Change | | January 1, 2022 | | December 26, 2020 | | Change |
| Products | | $ | 354,022 | | | $ | 420,711 | | | $ | (66,689) | | | (15.9) | % | | $ | 1,086,607 | | | $ | 1,059,846 | | | $ | 26,761 | | | 2.5 | % |
| Services | | 55,544 | | | 63,974 | | | (8,430) | | | (13.2) | % | | 173,155 | | | 191,529 | | | (18,374) | | | (9.6) | % |
| Total net revenues | | $ | 409,566 | | | $ | 484,685 | | | $ | (75,119) | | | (15.5) | % | | $ | 1,259,762 | | | $ | 1,251,375 | | | $ | 8,387 | | | 0.7 | % |
Products
Total product net revenues decreased in the third quarter of Fiscal Year 2022 compared to the third quarter of Fiscal Year 2021, primarily due to the following:
•Headset, Voice, and Video product categories net revenues decreased primarily due to constrained supply of certain components, such as semiconductor chips.
Total product net revenues increased in the nine months ended January 1, 2022 compared to the nine months ended December 26, 2020, primarily due to the following:
•Video product category net revenues increased, driven by the shift to hybrid work arrangements and the need for office workers to be able to effectively communicate and collaborate regardless of location.
•Voice product category net revenues also increased as companies returned or made plans to return to the office.
•Headsets product category net revenues decreased primarily due to constrained supply of certain components, such as semiconductor chips.
Services
Total services net revenues decreased in the third quarter of Fiscal Year 2022 compared to the third quarter of Fiscal Year 2021 and in the nine months ended January 1, 2022 compared to the nine months ended December 26, 2020, primarily due to the Video product mix shift from legacy Platform and Telepresence to recently launched Studio video bars, which are less complex, easier to install and operate, and carry optional service contracts. The decrease was partially offset by the impact of the deferred revenue fair value adjustment resulting from the Polycom acquisition.
Geographic Region
The following table sets forth total net revenues by geographic region for the three and nine months ended January 1, 2022 and December 26, 2020:
| | | | | | | | | | | | | | | | | | | | | | | | | | | | | | | | | | | | | | | | | | | | | | | | | | |
| | Three Months Ended | | | | | | Nine Months Ended | | | | |
| (in thousands, except percentages) | | January 1, 2022 | | December 26, 2020 | | Change | | January 1, 2022 | | December 26, 2020 | | Change |
| United States | | $ | 182,229 | | | $ | 193,413 | | | $ | (11,184) | | | (5.8) | % | | $ | 589,117 | | | $ | 545,472 | | | $ | 43,645 | | | 8.0 | % |
| | | | | | | | | | | | | | | | |
| International net revenues: | | | | | | | | | | | | | | | | |
| Europe, Middle East, and Africa | | 133,184 | | | 181,429 | | | (48,245) | | | (26.6) | % | | 371,067 | | | 405,933 | | | (34,866) | | | (8.6) | % |
| Asia Pacific | | 62,413 | | | 76,823 | | | (14,410) | | | (18.8) | % | | 213,479 | | | 212,657 | | | 822 | | | 0.4 | % |
| Americas, excluding United States | | 31,740 | | | 33,020 | | | (1,280) | | | (3.9) | % | | 86,099 | | | 87,313 | | | (1,214) | | | (1.4) | % |
| Total international net revenues | | 227,337 | | | 291,272 | | | (63,935) | | | (22.0) | % | | 670,645 | | | 705,903 | | | (35,258) | | | (5.0) | % |
| | | | | | | | | | | | | | | | |
| Total net revenues | | $ | 409,566 | | | $ | 484,685 | | | $ | (75,119) | | | (15.5) | % | | $ | 1,259,762 | | | $ | 1,251,375 | | | $ | 8,387 | | | 0.7 | % |
United States (U.S.)
U.S. total net revenues decreased in the third quarter of Fiscal Year 2022 compared to the third quarter of Fiscal Year 2021, primarily due to decreased net sales in the Voice product category. U.S. Video, Headsets and Services total net revenues were materially unchanged in the third quarter of Fiscal Year 2022 compared to the third quarter of Fiscal Year 2021.
U.S. total net revenues increased in the nine months ended January 1, 2022 compared to the nine months ended December 26, 2020, primarily due to increased net sales in the Video and Voice product categories, partially offset by decreased net sales in the Services category. U.S. Headsets total net revenues were materially unchanged during the nine months ended January 1, 2022 compared to the nine months ended December 26, 2020.
International
International total net revenues decreased in the third quarter of Fiscal Year 2022 compared to the third quarter of Fiscal Year 2021, primarily due to decreased net sales in the Headsets, Video, Services, and Voice product categories.
International total net revenues decreased in the nine months ended January 1, 2022 compared to the nine months ended December 26, 2020, primarily due to decreased net sales in the Headsets and Services product categories, partially offset increased net sales in the Video product category. International Voice total net revenues were materially unchanged during the nine months ended January 1, 2022 compared to the nine months ended December 26, 2020.
During the third quarter of Fiscal Year 2022, changes in foreign exchange rates favorably impacted total net revenues by $1.6 million, net of the effects of hedging, compared to a $8.4 million favorable impact on revenue in the third quarter of fiscal year 2021. During the nine months ended January 1, 2022, changes in foreign exchange rates favorably impacted total net revenues by $16.6 million, net of the effects of hedging, compared to a $5.8 million favorable impact on revenue in the prior year period.
Cost of Revenues and Gross Profit
Cost of revenues consists primarily of direct and contract manufacturing costs, amortization of acquired technology, freight, warranty, charges for excess and obsolete inventory, depreciation, duties, royalties, and overhead expenses.
| | | | | | | | | | | | | | | | | | | | | | | | | | | | | | | | | | | | | | | | | | | | | | | | | | |
| (in thousands, except percentages) | | Three Months Ended | | | | | | Nine Months Ended | | | | |
| January 1, 2022 | | December 26, 2020 | | Change | | January 1, 2022 | | December 26, 2020 | | Change |
| Products: | | | | | | | | | | | | | | | | |
| Net revenues | | $ | 354,022 | | $ | 420,711 | | $ | (66,689) | | | (15.9) | % | | $ | 1,086,607 | | $ | 1,059,846 | | $ | 26,761 | | | 2.5 | % |
| Cost of revenues | | 226,994 | | 236,842 | | (9,848) | | | (4.2) | % | | 682,360 | | 622,718 | | 59,642 | | | 9.6 | % |
| Gross profit | | $ | 127,028 | | $ | 183,869 | | $ | (56,841) | | | (30.9) | % | | $ | 404,247 | | $ | 437,128 | | $ | (32,881) | | | (7.5) | % |
| Gross profit % | | 35.9 | % | | 43.7 | % | | | | | | 37.2 | % | | 41.2 | % | | | | |
| Services: | | | | | | | | | | | | | | | | |
| Net revenues | | $ | 55,544 | | $ | 63,974 | | $ | (8,430) | | | (13.2) | % | | $ | 173,155 | | $ | 191,529 | | $ | (18,374) | | | (9.6) | % |
| Cost of revenues | | 18,386 | | 21,186 | | (2,800) | | | (13.2) | % | | 58,334 | | 64,921 | | (6,587) | | | (10.1) | % |
| Gross profit | | $ | 37,158 | | $ | 42,788 | | $ | (5,630) | | | (13.2) | % | | $ | 114,821 | | $ | 126,608 | | $ | (11,787) | | | (9.3) | % |
| Gross profit % | | 66.9 | % | | 66.9 | % | | | | | | 66.3 | % | | 66.1 | % | | | | |
| Total: | | | | | | | | | | | | | | | | |
| Net revenues | | $ | 409,566 | | $ | 484,685 | | $ | (75,119) | | | (15.5) | % | | $ | 1,259,762 | | $ | 1,251,375 | | $ | 8,387 | | | 0.7 | % |
| Cost of revenues | | 245,380 | | 258,028 | | (12,648) | | | (4.9) | % | | 740,694 | | 687,639 | | 53,055 | | | 7.7 | % |
| Gross profit | | $ | 164,186 | | $ | 226,657 | | $ | (62,471) | | | (27.6) | % | | $ | 519,068 | | $ | 563,736 | | $ | (44,668) | | | (7.9) | % |
| Gross profit % | | 40.1 | % | | 46.8 | % | | | | | | 41.2 | % | | 45.0 | % | | | | |
Products
Gross profit as a percentage of total product net revenues decreased in the third quarter of Fiscal Year 2022 compared to the third quarter of Fiscal Year 2021 and in the nine months ended January 1, 2022 compared to the nine months ended December 26, 2020, primarily due to increased component costs, unfavorable product mix, and increased transportation costs. The increase in component costs was primarily driven by increased spot market purchases of certain key components, such as semiconductor chips, due to global supply shortages. Transportation costs increased as a result of high global demand and limited capacity of air freight carriers and increased air freight usage to mitigate longer component lead times to meet our commitments to customers.
Services
Gross profit as a percentage of total services net revenues was materially unchanged during the third quarter of Fiscal Year 2022 compared to the third quarter of Fiscal Year 2021 and in the nine months ended January 1, 2022 compared to the nine months ended December 26, 2020.
Operating Expenses
Operating expenses for the three and nine months ended January 1, 2022 and December 26, 2020 were as follows:
| | | | | | | | | | | | | | | | | | | | | | | | | | | | | | | | | | | | | | | | | | | | | | | |
| | | Three Months Ended | | | Nine Months Ended | | |
| (in thousands, except percentages) | | January 1, 2022 | | December 26, 2020 | | Change | January 1, 2022 | | December 26, 2020 | | Change |
| Research, development, and engineering | | $ | 46,216 | | $ | 54,150 | | $ | (7,934) | | | (14.7) | % | $ | 136,090 | | | $ | 156,327 | | | $ | (20,237) | | | (12.9) | % |
| % of total net revenues | | 11.3 | % | | 11.2 | % | | | | | 10.8 | % | | 12.5 | % | | | | |
| Selling, general and administrative | | 121,387 | | 129,641 | | (8,254) | | | (6.4) | % | 364,417 | | | 361,892 | | | 2,525 | | | 0.7 | % |
| % of total net revenues | | 29.6 | % | | 26.7 | % | | | | | 28.9 | % | | 28.9 | % | | | | |
| Loss, net from litigation settlements | | — | | | — | | — | | | — | % | — | | | 17,561 | | | (17,561) | | | 100.0 | % |
| % of total net revenues | | — | % | | — | % | | | | | — | % | | 1.4 | % | | | | |
| Restructuring and other related charges | | 2,398 | | 13,977 | | (11,579) | | | (82.8) | % | 33,977 | | | 49,477 | | | (15,500) | | | (31.3) | % |
| % of total net revenues | | 0.6 | % | | 2.9 | % | | | | | 2.7 | % | | 4.0 | % | | | | |
| Total operating expenses | | $ | 170,001 | | $ | 197,768 | | $ | (27,767) | | | (14.0) | % | $ | 534,484 | | | $ | 585,257 | | | $ | (50,773) | | | (8.7) | % |
| % of total net revenues | | 41.5 | % | | 40.8 | % | | | | | 42.4 | % | | 46.8 | % | | | | |
Research, Development, and Engineering
Research, development, and engineering costs are expensed as incurred and consist primarily of compensation costs, outside services, expensed materials, and overhead expenses. Research, development, and engineering expenses decreased during the third quarter of Fiscal Year 2022 compared to the third quarter of Fiscal Year 2021 and in the nine months ended January 1, 2022 compared to the nine months ended December 26, 2020, primarily due to lower compensation expense due to reduction in headcount, cost control efforts, and lower incentive compensation.
Selling, General, and Administrative
Selling, general, and administrative costs are expensed as incurred and consist primarily of compensation costs, marketing costs, travel expenses, professional service fees, and overhead expenses. Selling, general and administrative expenses decreased during the third quarter of Fiscal Year 2022 compared to the third quarter of Fiscal Year 2021, primarily due to lower incentive compensation, partially offset by increased marketing and travel expense. Selling, general and administrative expenses increased during the nine months ended January 1, 2022 compared to the nine months ended December 26, 2020, primarily due to higher sales commissions, marketing, and travel expense, partially offset by lower facilities expenses.
Loss, net from Litigation Settlements
Loss, net from litigation settlements decreased during the nine months ended January 1, 2022 compared to the nine months ended December 26, 2020, due to the recording of one-time litigation charges for settlements during the prior period.
Restructuring and Other Related Charges
Restructuring and other related charges decreased during the third quarter of Fiscal Year 2022 compared to the third quarter of Fiscal Year 2021 and in the nine months ended January 1, 2022 compared to the nine months ended December 26, 2020. During the three and nine months ended January 1, 2022 and December 26, 2020 we recorded restructuring and other related charges to reduce expenses and optimize our cost structure. These actions consisted of headcount reductions and office closures.
Interest Expense
Interest expense for the three and nine months ended January 1, 2022 and December 26, 2020 was as follows:
| | | | | | | | | | | | | | | | | | | | | | | | | | | | | | | | | | | | | | | | | | | | | | | | | | |
| | | Three Months Ended | | | | Nine Months Ended | | | | |
| (in thousands, except percentages) | | January 1, 2022 | | December 26, 2020 | | Change | | January 1, 2022 | | December 26, 2020 | | Change |
| Interest expense | | $ | 15,948 | | $ | 18,417 | | $ | (2,469) | | | 13.4 | % | | $ | 53,871 | | | $ | 58,182 | | | $ | (4,311) | | | 7.4 | % |
| % of total net revenues | | 3.9 | % | | 3.8 | % | | | | | | 4.3 | % | | 4.6 | % | | | | |
Interest expense decreased during the third quarter of Fiscal Year 2022 compared to the third quarter of Fiscal Year 2021 and in the nine months ended January 1, 2022 compared to the nine months ended December 26, 2020, primarily due to lower interest expense related to the 2023 Senior Notes and lower outstanding principal balance on the term loan facility, partially offset by the amortization of the remaining debt issuance costs related to the 2023 Senior Notes, which were redeemed during the first quarter of Fiscal Year 2022, and interest expense related to the 2029 Senior Notes, which were issued in the fourth quarter of Fiscal Year 2021.
Other Non-Operating Income, Net
Other non-operating income, net for the three and nine months ended January 1, 2022 and December 26, 2020 was as follows:
| | | | | | | | | | | | | | | | | | | | | | | | | | | | | | | | | | | | | | | | | | | | | | | | | | |
| | | Three Months Ended | | | | Nine Months Ended | | | | |
| (in thousands, except percentages) | | January 1, 2022 | | December 26, 2020 | | Change | | January 1, 2022 | | December 26, 2020 | | Change |
| Other non-operating income, net | | $ | (995) | | $ | (2,596) | | $ | 1,601 | | | (61.7) | % | | $ | (1,664) | | | $ | (4,188) | | | $ | 2,524 | | | (60.3) | % |
| % of total net revenues | | (0.2) | % | | (0.5) | % | | | | | | (0.1) | % | | (0.3) | % | | | | |
Other non-operating income, net decreased during the third quarter of Fiscal Year 2022 compared to the third quarter of Fiscal Year 2021, primarily due to immaterial net foreign currency losses compared to immaterial net foreign currency gains in the prior period. Other non-operating income, net decreased in the nine months ended January 1, 2022 compared to the nine months ended December 26, 2020, primarily due to lower immaterial unrealized gains on the deferred compensation plan investments and immaterial net foreign currency losses during the current period compared to immaterial net foreign currency gains in the prior period.
Income Tax Benefit
| | | | | | | | | | | | | | | | | | | | | | | | | | | | | | | | | | | | | | | | | | | | | | | | | | |
| | | Three Months Ended | | | | | | Nine Months Ended | | | | |
| (in thousands except percentages) | | January 1, 2022 | | December 26, 2020 | | Change | | January 1, 2022 | | December 26, 2020 | | Change |
| (Loss) income before income taxes | | $ | (20,768) | | $ | 13,068 | | $ | (33,836) | | | 258.9 | % | | $ | (67,623) | | | $ | (75,515) | | | $ | 7,892 | | | 10.5 | % |
| Income tax benefit | | (9,604) | | (7,045) | | (2,559) | | | (36.3) | % | | (116,433) | | | (7,208) | | | (109,225) | | | (1,515.3) | % |
| Net (loss) income | | $ | (11,164) | | $ | 20,113 | | $ | (31,277) | | | 155.5 | % | | $ | 48,810 | | | $ | (68,307) | | | $ | 117,117 | | | 171.5 | % |
| Effective tax rate | | 46.2 | % | | (53.9) | % | | | | | | 172.2 | % | | 9.6 | % | | | | |
The Company and its subsidiaries are subject to taxation in the U.S. and in various foreign and state jurisdictions. The Company's income tax benefit is determined using an estimated annual effective tax rate, adjusted for discrete items arising during the period. The effective tax rates for the three and nine months ended January 1, 2022 were 46.2% and 172.2%, respectively. The effective tax rates for the three and nine months ended December 31, 2016. One customer, Ingram Micro Group, accounted26, 2020 were (53.9)% and 9.6%, respectively.
Income tax benefit for 10.7%the three and 11.6% of net revenuesnine months ended January 1, 2022 was $(9.6) million and $(116.4) million, respectively. Income tax benefit for the three and nine months ended December 31, 2017,26, 2020 was $(7.0) million and $(7.2) million, respectively.During the three months ended October 2, 2021, the Company transferred certain non-Americas intellectual property (“IP”) rights between our wholly-owned subsidiaries ("IP transfer") to align with our evolving business operations, resulting in the derecognition of a deferred tax asset of $91.1 million and the recognition of a new deferred tax asset of $204.3 million, which represents the book and tax basis difference in the IP and was based on the fair value of the IP, in the respective subsidiaries. This results in a net discrete deferred tax benefit of $113.2 million. The impact of the IP transfer to net cash flows on the condensed consolidated statements of cash flows during the nine months ended January 1, 2022 was not material.
One customer, Ingram Micro Group, accountedThe difference between the effective tax rate and the U.S. federal statutory rate primarily relates to the changes in uncertain tax positions, U.S. and foreign income mix, and the valuation allowance on the U.S. federal and state deferred tax assets (DTAs) that continues to be maintained as of January 1, 2022.
A significant portion of the Company's DTAs relate to the IP transfer between wholly-owned subsidiaries completed during the three months ended October 2, 2021. At this time, based on evidence currently available, the Company considers it more likely than not that it will have sufficient taxable income in the future that will allow the Company to realize the DTAs; however, failure to generate sufficient future taxable income could result in some or all DTAs not being utilized in the future. If the Company is unable to generate sufficient future taxable income, a substantial valuation allowance to reduce the Company's DTAs may be required.
The Company is subject to the examination of its income tax returns by the Internal Revenue Service and other tax authorities. Significant judgment is required in evaluating our uncertain tax positions and determining the Company's provision for 17.6%income taxes. During the three months ended January 1, 2022, the amount of totalgross unrecognized tax benefits decreased by $3.6 million. As of January 1, 2022, the Company has $17.9 million of unrecognized tax benefits, all of which could result in a reduction of the Company’s effective tax rate if recognized. The reduction in gross unrecognized tax benefits is primarily attributable to the lapse of applicable statutes of limitations.
FINANCIAL CONDITION
Liquidity and Capital Resources
The following tables present selected financial information and statistics as of January 1, 2022 and April 3, 2021 and for the nine months ended January 1, 2022 and December 26, 2020 (in thousands):
| | | | | | | | | | | | | | |
| | January 1, 2022 | | April 3, 2021 |
| Cash and cash equivalents and short-term investments | | $ | 199,717 | | | $ | 217,119 | |
| Property, plant, and equipment, net | | 126,973 | | | 140,875 | |
| Current portion of long-term debt | | — | | | 478,807 | |
| Long-term debt, net | | 1,499,228 | | | 1,496,064 | |
| Working capital | | 264,784 | | | 213,975 | |
| | | | | | | | | | | | | | |
| | Nine Months Ended |
| | January 1, 2022 | | December 26, 2020 |
| Cash (used in) provided by operating activities | | $ | (52) | | | $ | 71,149 | |
| Cash used in investing activities | | (25,178) | | | (14,580) | |
| Cash used in financing activities | | (487,002) | | | (44,442) | |
Our cash and cash equivalents as of January 1, 2022 consisted of bank deposits and money market funds with third-party financial institutions. As of January 1, 2022, of our $199.7 million of cash and cash equivalents and short-term investments, $104.7 million was held domestically while $95.0 million was held by foreign subsidiaries, and approximately 71% was based in USD-denominated instruments. As of January 1, 2022, our short-term investments were composed of mutual funds. An additional source of liquidity is $97.1 million of availability from our revolving credit facility, net of outstanding letters of credit.
Historically, we use cash provided by operating activities as our primary source of liquidity. We expect that cash provided by operating activities will fluctuate in future periods, including the current quarter as a result of a number of factors, including fluctuations in our revenues, the timing of compensation-related payments, such as our annual bonus/variable compensation plan, interest payments on our long-term debt, product shipments, accounts receivable at March 31, 2017. Two customers, Ingram Micro Groupcollections, inventory and D&H Distributors, accountedsupply chain management, and the timing and amount of tax and other payments.
During the nine months ended January 1, 2022, cash used in operating activities of $(52) thousand was a result of $(98.4) million of cash used in net working capital, partially offset by $48.8 million of net income and $49.5 million in net non-cash charges. Cash used in investing activities of $(25.2) million consisted primarily of capital expenditures of $(20.7) million and other investing activities of $(4.0) million. Cash used in financing activities of $(487.0) million consisted primarily of $(480.7) million of repayments of long-term debt and $(12.2) million of employees' tax withheld and paid for 13.5%restricted stock and 13.8%, respectively,restricted stock units, partially offset by $5.8 million of proceeds from stock compensation plans.
Capital Expenditures
We anticipate our capital expenditures in Fiscal Year 2022 will be approximately $25 million to $35 million, relating primarily to investments in our manufacturing capabilities, including tooling for new products, new information technology investments, and facilities upgrades. We will continue to evaluate new business opportunities and new markets. As a result, our future growth within the existing business or new opportunities and markets may dictate the need for additional facilities and capital expenditures to support that growth.
Debt
In July 2018, in connection with the Polycom acquisition, the Company entered into a Credit Agreement with Wells Fargo Bank, National Association, as administrative agent, and the lenders party thereto and borrowed the full amount available under the term loan facility of $1.245 billion, net of approximately $30 million of discounts and issuance costs. During the first nine months of Fiscal Year 2022, we did not repurchase any of our outstanding principal. As of January 1, 2022, we had $1.0 billion of principal outstanding.
On December 29, 2021, the Company entered into an Amendment to the Credit Agreement in order to relax certain financial covenants on the revolving line of credit. The financial covenants under the Credit Agreement are for the benefit of the revolving credit lenders only and do not apply to any other debt of the Company. As of January 1, 2022, the Company has five outstanding letters of credit on the revolving credit facility for a total net accounts receivable at December 31, 2017.of $2.9 million and had $97.1 million available under the revolving credit facility. As of January 1, 2022, the Company was in compliance with the financial covenants.
16. SUBSEQUENT EVENTS
On JanuaryJuly 30, 2018, the Company announced thatentered into a 4-year amortizing interest rate swap agreement with Bank of America, N.A. The swap has an initial notional amount of $831 million and matures on July 31, 2022. On June 15, 2021, the Company entered into a three-year amortizing interest rate swap agreement with Bank of America, N.A. The swap has an initial notional amount of $680 million and matures on July 31, 2024. During the nine months ended January 1, 2022, the Company reclassified into interest expense $7.6 million and recorded a $4.1 million unrealized gain on its Audit Committee had declaredinterest rate swaps derivatives designated as a cash flow hedge.
On March 4, 2021, the Company issued $500.0 million aggregate principal amount of 4.75% Senior Notes. The 4.75% Senior Notes mature on March 1, 2029 and approvedbear interest at a rate of 4.75% per annum, payable semi-annually on March 1 and September 1 of each year, commencing on September 1, 2021. A portion of the proceeds from the 4.75% Senior Notes was used to redeem the outstanding principal and accrued interest on the 5.50% Senior Notes of $493.9 million. As of January 1, 2022, $500 million of principal was outstanding.
During the first quarter of Fiscal Year 2022, we redeemed the outstanding principal and accrued interest on the 5.50% Senior Notes of $493.9 million.
We may at any time and from time to time, depending on market conditions and prices, continue to retire or purchase our outstanding debt through cash purchases and/or exchanges for equity or debt, in open-market purchases, privately negotiated transactions, or otherwise. Such repurchases or exchanges, if any, will be upon such terms and at such prices as we may determine, and will depend on prevailing market conditions, our liquidity requirements, contractual restrictions, and other factors. In addition, our liquidity, capital resources, and results of operations in any period could be affected by repurchases of our common stock, the payment in the future of cash dividends if the Board determines to reinstate the dividend program, the exercise of outstanding stock options, restricted stock grants under stock plans, and the issuance of common stock under the ESPP. The acquisition of Polycom affected our liquidity and leverage ratios and we are working to reduce our debt leverage
ratios by prioritizing the repayment of the debt obtained to finance such acquisition. We receive cash from the exercise of outstanding stock options under our stock plan and the issuance of shares under our Employee Stock Purchase Plan. However, the resulting increase in the number of outstanding shares from these equity grants and issuances could affect our earnings per share. We cannot predict the timing or amount of proceeds from the sale or exercise of these securities or whether they will be exercised, forfeited, canceled, or will expire.
Further information regarding the Company’s debt issuances and related hedging activity can be found in Note 7, Debt, and Note 10, Derivatives, of the accompanying notes to the condensed consolidated financial statements within “Part I. Item 1. Financial Statements” of this Quarterly Report on Form 10-Q.
Common Stock Repurchases
From time to time, our Board authorizes programs under which we may repurchase shares of our common stock in the open market or through privately negotiated transactions, including accelerated stock repurchase agreements. On November 28, 2018, the Board approved a dividend1.0 million share repurchase program expanding our capacity to repurchase shares to approximately 1.7 million shares. During the nine months ended January 1, 2022, we did not repurchase any shares of $0.15 per shareour common stock. As of January 1, 2022, there remained 1,369,014 shares authorized for repurchase under the existing stock repurchase program.
We believe that our current cash and cash equivalents, short-term investments, cash flow from operations, and availability of additional funds under the Credit Agreement, as amended from time to time, will be sufficient to fund our operations for one year from the date of issuance of these financial statements. However, any projections of future financial needs and sources of working capital are subject to uncertainty on March 9, 2018our financial results. Readers are cautioned to holdersreview the risks, uncertainties, and assumptions set forth in this Quarterly Report on Form 10-Q, including the section entitled "Certain Forward-Looking Information" and the risk factors set forth in our Annual Report on Form 10-K for the fiscal year ended April 3, 2021, filed with the SEC on May 18, 2021, and other periodic filings with the SEC, any of recordwhich could affect our estimates for future financial needs and sources of working capital.
OFF BALANCE SHEET ARRANGEMENTS AND CONTRACTUAL OBLIGATIONS
We have not entered into any transactions with unconsolidated entities whereby we have financial guarantees, subordinated retained interests, derivative instruments, or other contingent arrangements that expose us to material continuing risks, contingent liabilities, or any other obligation under a variable interest in an unconsolidated entity that provides us with financing and liquidity support, market risk, or credit risk support.
Unconditional Purchase Obligations
We use several contract manufacturers to manufacture raw materials, components, and subassemblies for our products through our supply and demand information that can cover periods up to 78 weeks. The contract manufacturers use this information to acquire components and build products. We also obtain individual components for our products from a wide variety of individual suppliers using a combination of purchase orders, supplier contracts, including annual minimum purchase obligations, and open orders based on February 20, 2018projected demand information. As of January 1, 2022, we had outstanding off-balance sheet third-party manufacturing, component purchase, and other general and administrative commitments of $615.5 million, including off-balance sheet consigned inventories of $65.3 million. A substantial portion of the raw materials, components, and subassemblies used in our products are provided by our suppliers on a consignment basis. These consigned inventories are not recorded on our condensed consolidated balance sheets until we take title to the raw materials, components, and subassemblies, which occurs when they are consumed in the production process. Prior to consumption in the production process, our suppliers bear the risk of loss and retain title to the consigned inventory. The agreements allow us to return parts in excess of maximum order quantities to the suppliers at the supplier’s expense. Returns for other reasons are negotiated with the suppliers on a case-by-case basis and to date have been immaterial. If our suppliers were to discontinue financing consigned inventory, it would require us to make cash outlays and we could incur expenses which, if material, could negatively affect our business and financial results. We expect to consume unconditional purchase obligations in the normal course of business, net of an immaterial purchase commitments reserve. In certain instances, these agreements allow us the option to cancel, reschedule, and adjust our requirements based on our business needs in partnering with our suppliers given the current environment.
Except as described above, there have been no material changes in our contractual obligations as described in our Annual Report on Form 10-K for the fiscal year ended April 3, 2021.
CRITICAL ACCOUNTING ESTIMATES
For a complete description of what we believe to be the critical accounting estimates used in the preparation of our condensed consolidated financial statements, refer to our Annual Report on Form 10-K for the fiscal year ended April 3, 2021. There have been no material changes to our critical accounting estimates during Fiscal Year 2022.
Recent Accounting Pronouncements
Recent accounting pronouncements issued by the Financial Accounting Standards Board ("FASB") did not and Qualitative Disclosures About Market Riskare not expected to have a material impact on the Company's financial position, results of operations, or cash flows.
ITEM 3. QUANTITATIVE AND QUALITATIVE DISCLOSURES ABOUT MARKET RISK
The discussion of our exposure to market risk related to changes in interest rates and foreign currency exchange rates contains forward-looking statements that are subject to risks and uncertainties. Actual results could vary materially as a result of a number of factors, including those discussed in Part I, "Item 1A. Risk Factors"Factors" in our Annual Report on Form 10-K for the fiscal year ended March 31, 2017, filed with the SEC on May 10, 2017.April 3, 2021, which could materially affect our business, financial position, or future results of operations.
INTEREST RATE RISK
We reported the following balances in cash and cash equivalents, short-term investments, and long-term investments as follows:
|
| | | | | | | | |
| (in millions) | | March 31, 2017 | | December 31, 2017 |
| Cash and cash equivalents | | $ | 302.0 |
| | $ | 280.3 |
|
| Short-term investments | | $ | 178.2 |
| | $ | 218.8 |
|
| Long-term investments | | $ | 127.2 |
| | $ | 118.9 |
|
As of December 31, 2017, our investments were composed of Mutual Funds, US Treasury Notes, Government Agency Securities, Commercial Paper, Corporate Bonds, and Certificates of Deposits ("CDs").
Our investment policy and strategy are focused on preservation of capital and supporting our liquidity requirements. Our exposure to market risk for changes in interest rates relates primarily to our investment portfolio. Our investment policy generally limitsfloating-rate interest payments under our $1.275 billion term loan facility. Borrowings under the amountCredit Agreement bear interest at a variable rate equal to (i) LIBOR plus a specified margin, or (ii) the base rate (which is the highest of credit(a) the prime rate publicly announced from time to time by Wells Fargo Bank, National Association, (b) the federal funds rate plus 0.50% or (c) the sum of 1% plus one-month LIBOR plus a specified margin.
On July 30, 2018, we entered into a four-year amortizing interest rate swap agreement, and on June 15, 2021, we entered into a three-year amortizing interest rate swap agreement, both with Bank of America, N.A., as part of our overall strategy to manage our exposure to any one issuermarket risks associated with fluctuations in interest rates on the $1.275 billion term loan facility. As a matter of policy, we only enter into transactions that we believe will be highly effective at offsetting the underlying risk and requires investments to be high credit quality, primarily rated A or A2 and above, with the objective of minimizing the potential risk of principal loss. All highly liquid investments with initial maturities of three months or less at the date of purchase are classified as cash equivalents. We classify our investments as either short-term or long-term based on each instrument's underlying effective maturity date. All short-term investments have effective maturities of less than 12 months, while all long-term investments have effective maturities greater than 12 months or we do not currentlyuse derivatives for trading or speculative purposes. Our objective is to mitigate the impact of interest expense fluctuations on our profitability related to interest rate changes by minimizing movements in future debt payments with these interest rate swaps.
The first swap has an initial notional amount of $831 million and matures on July 31, 2022. The second swap has an initial notional amount of $680 million and matures on July 31, 2024. The swaps involve the receipt of floating-rate interest payments for fixed interest rate payments over the life of the agreement. We have designated these interest rate swaps as cash flow hedges. Changes in the abilityfair value of the derivatives are recorded to liquidateother comprehensive income on the investment. We may sellcondensed consolidated statements of comprehensive (loss) income and are reclassified to interest expense over the life of the agreements. For additional details, refer to Note 10, Derivatives, of the accompanying notes to the condensed consolidated financial statements within “Part I. Item 1. Financial Statements” of this Quarterly Report on Form 10-Q. During the nine months ended January 1, 2022, we made payments of approximately $7.7 million on our investments priorinterest rate swaps and recognized $7.6 million within interest expense on the condensed consolidated statement of operations. As of January 1, 2022, we had an immaterial amount of interest accrued within accrued liabilities on the condensed consolidated balance sheet. A hypothetical 10% increase or decrease on market interest rates could result in a corresponding immaterial increase or decrease in annual interest expense due to their stated maturities for strategic purposes, in anticipation of credit deterioration, or for duration management. No material realized or unrealized gains or lossesthe two interest rate swaps.
Interest rates were recognized during lower in the three and nine months ended December 31, 2016 and 2017.
Interest rates were relatively unchanged in the three and nine months ended December 31, 2017January 1, 2022 compared to the same period in the prior year. In the three and nine months ended December 31, 2016 and 2017 we generated interestInterest income of $0.9 million and $2.6 million and $1.4 million and $3.4 million, respectively.. We incurred no significant interest expense from our revolving line of creditwas not material in the three and nine months ended January 1, 2022 and December 31, 2017. The 5.50% Senior Notes are at a fixed interest rate and we have not elected the fair value option for these instruments; accordingly we are not exposed to any economic interest rate risk related to this indebtedness; however, the fair value of this instrument fluctuates as market interest rates change. The increase in interest expense caused by a 10 basis point increase in the interest rates of our variable-rate revolving line of credit indebtedness would not be significant. A hypothetical 10 basis points increase or decrease on market interest rates related to our investment portfolio would have an immaterial impact on our results of operations.26, 2020.
FOREIGN CURRENCY EXCHANGE RATE RISK
We are a net receiver of currencies other than the United States Dollar ("USD.") Accordingly, changes in exchange rates, and in particular a strengthening of the USD, could negatively affect our total net revenues and gross margins, as expressed in USD. There is a risk that we will have to adjust local currency product pricing due to competitive pressures if there is significant volatility in foreign currency exchange rates.
The primary currency fluctuations to which we are exposed are the Euro ("EUR"), BritishGreat Britain Pound Sterling ("GBP"), Australian Dollar ("AUD"), Canadian Dollar ("CAD"),and Mexican Peso ("MXN"MXN."), and the Chinese Renminbi ("RMB"). We use a hedging strategy to diminish, and make more predictable, the effect of currency fluctuations. All of our hedging activities are entered into with large financial institutions, which we periodically evaluate for credit risks. We hedge our balance sheet exposure by hedging EUR GBP, AUD, and CADGBP denominated cash, accounts receivable, and accounts payable balances, and our economic exposure by hedging a portion of anticipated EUR and GBP denominated sales and our MXN denominated expenditures. We can provide no assurance that our strategy will be successful in the future orand that exchange rate fluctuations will not materially adversely affect our business. We do not hold or issue derivative financial instruments for speculative trading purposes. While our existing hedges cover a certain amount of exposure for the upcoming fiscal year, long-term strengthening of the USD relative to the currencies of other countries in which we sell may have a material adverse impact on our financial results. In addition, our results may be adversely impacted by future changes in foreign currency exchange rates relative to original hedging contracts.
The impact of changes in foreign currency rates recognized in other non-operating income, and (expense), net was immaterial in both the three and nine months ended December 31, 2016 and 2017.January 1, 2022. Although we hedge a portion of our foreign currency exchange exposure, the weakening of certain foreign currencies, particularly the EUR and GBP in comparison to the USD, could result in material foreign exchange losses in future periods.
Non-designatedNon-Designated Hedges
We hedge our EUR GBP, AUD, and CADGBP denominated cash, accounts receivable, and accounts payable balances by entering into foreign exchange forward contracts. The table below presents the impact on the foreign exchange gain (loss) of a hypothetical 10% appreciation and a 10% depreciation of the USD against the forward currency contracts as of December 31, 2017January 1, 2022 (in millions):
| | | | | | | | | | | | | | | | | | | | | | | |
| Currency - forward contracts | Position | | USD Notional Value of Net Foreign Exchange Contracts | | Foreign Exchange Gain From 10% Appreciation of USD | | Foreign Exchange (Loss) From 10% Depreciation of USD |
| EUR | Sell EUR | | $ | 28.3 | | | $ | 2.8 | | | $ | (2.8) | |
| GBP | Sell GBP | | 14.0 | | | 1.4 | | | (1.4) | |
| | | | | | | |
| | | | | | | |
|
| | | | | | | | | | | | | |
| Currency - forward contracts | Position | | USD Value of Net Foreign Exchange Contracts | | Foreign Exchange Gain From 10% Appreciation of USD | | Foreign Exchange Loss From 10% Depreciation of USD |
| EUR | Sell EUR | | $ | 46.6 |
| | $ | 4.7 |
| | $ | (4.7 | ) |
| GBP | Sell GBP | | $ | 6.9 |
| | $ | 0.7 |
| | $ | (0.7 | ) |
| AUD | Sell AUD | | $ | 11.1 |
| | $ | 1.1 |
| | $ | (1.1 | ) |
| CAD | Sell CAD | | $ | 2.3 |
| | $ | 0.2 |
| | $ | (0.2 | ) |
Cash Flow Hedges
In the nine months ended December 31, 2017, 49%January 1, 2022, approximately 53% of our total net revenues were derived from sales outside of the U.S. and were denominated primarily in EUR and GBP.
As of December 31, 2017,January 1, 2022, we had foreign currency put and call option contracts with notional amounts of approximately €75.8€77.4 million and £22.9£15.7 million denominated in EUR and GBP, respectively. Collectively,Collectively, our option contracts hedge against a portion of our forecasted foreign currency denominated sales. If the USD is subjected to either a 10% appreciation or 10% depreciation versus these net exposed currency positions, we could realize a gain of $7.7$8.7 million or incur a loss of $9.5$5.0 million,, respectively.
The table below presents the impact on the Black-Scholes valuation of our currency option contracts of a hypothetical 10% appreciation and a 10% depreciation of the USD against the indicated open option contract type for cash flow hedges as of December 31, 2017January 1, 2022 (in millions):
| | | | | | | | | | | | | | | | | | | | |
| Derivative | | USD Notional Value of Net Foreign Exchange Contracts | | Foreign Exchange Gain From 10% Appreciation of USD | | Foreign Exchange (Loss) From 10% Depreciation of USD |
| Call options | | $ | 116.3 | | | $ | 0.3 | | | $ | (4.7) | |
| Put options | | 107.5 | | | 7.6 | | | (1.1) | |
| Forwards | | 105.9 | | | (4.9) | | | (10.4) | |
|
| | | | | | | | | | | |
| Currency - option contracts | USD Value of Net Foreign Exchange Contracts | | Foreign Exchange Gain From 10% Appreciation of USD | | Foreign Exchange Loss From 10% Depreciation of USD |
| Call options | $ | 122.0 |
| | $ | 4.9 |
| | $ | (9.2 | ) |
| Put options | $ | 112.6 |
| | $ | 2.8 |
| | $ | (0.3 | ) |
| Forwards | $ | 21.0 |
| | $ | 2.1 |
| | $ | (2.1 | ) |
Collectively, our swap contracts hedge against a portion of our forecasted MXN denominated expenditures. As of December 31, 2017,January 1, 2022, we had cross-currency swap contracts with notional amounts of approximately MXN 76.3415.9 million.
The table below presents the impact on the valuation of our cross-currency swap contracts of a hypothetical 10% appreciation and a 10% depreciation of the USD as of December 31, 2017January 1, 2022 (in millions):
| | | | | | | | | | | | | | | | | | | | |
| Derivative | | USD Notional Value of Cross-Currency Swap Contracts | | Foreign Exchange (Loss) From 10% Appreciation of USD | | Foreign Exchange Gain From 10% Depreciation of USD |
| Position: Buy MXN | | $ | 19.9 | | | $ | (1.9) | | | $ | 1.9 | |
Except as described above, there have been no material changes in our market risk as described in our Annual Report on Form 10-K for the fiscal year ended April 3, 2021.
|
| | | | | | | | | | | | |
| Currency - cross-currency swap contracts | Position | USD Value of Net Foreign Exchange Contracts | | Foreign Exchange Loss From 10% Appreciation of USD | | Foreign Exchange Gain From 10% Depreciation of USD |
| MXN | Buy MXN | $ | 3.9 |
| | $ | (0.3 | ) | | $ | 0.4 |
|
ITEM 4. CONTROLS AND PROCEDURES
Controls(a)Evaluation of disclosure controls and Proceduresprocedures
| |
(a) | Evaluation of disclosure controls and procedures |
Our management evaluated, with the participation of our Chief Executive Officer and our Chief Financial Officer, the effectiveness of our disclosure controls and procedures as of the end of the period covered by this Quarterly Report on Form 10-Q. Based on this evaluation, our Chief Executive Officer and our Chief Financial Officer have concluded that our disclosure controls and procedures are effective as of the end of the period covered by this report to ensure that information we are required to disclose in reports that we file or submit under the Securities Exchange Act of 1934 (i) is recorded, processed, summarized and reported within the time periods specified in Securities and Exchange Commission rules and forms, and (ii) is accumulated and communicated to our management, including our Chief Executive Officer and our Chief Financial Officer, as appropriate to allow timely decisions regarding required disclosure.
| |
(b) | Changes in internal control over financial reporting |
(b)Changes in internal control over financial reporting
There have not been anyno changes in the Company’s internal control over financial reporting during the period covered by this Quarterly Report on Form 10-Q that have materially affected, or are reasonably likely to materially affect, its internal control over financial reporting.
PART II --– OTHER INFORMATION
ITEM 1. LEGAL PROCEEDINGS
We are presently engaged in various legal actions arising in the normal course of business. We believe that it is unlikely that any of these actions will have a material adverse impact on our operating results; however, because of the inherent uncertainties of litigation, the outcome of any of these actions could be unfavorable and could have a material adverse effect on our financial condition, results of operations or cash flows. For additional information about our material legal proceedings, please see Note 6, Commitments and Contingencies, of the accompanying notes to the condensed consolidated financial statements.statements within “Part I. Item 1. Financial Statements” of this Quarterly Report on Form 10-Q.
ITEM 1A. RISK FACTORS
You should carefully consider the risk factors discussed in Part I, "Item 1A. Risk Factors" in our Annual Report on Form 10-K for the fiscal year ended March 31, 2017, filed with the SEC on May 10, 2017 (the "Form 10-K"),April 3, 2021, each of which could materially affect our business, financial position, or future results of operations. Except as described below, there have been no material changes to the risk factors included in the Form 10-K.
Changes in applicable tax regulations and resolutions of tax disputes could negatively affect our financial results.
The Company is subject to taxation in the U.S. and numerous foreign jurisdictions. On December 22, 2017, the U.S. government enacted comprehensive tax legislation commonly referred to as the Tax Cuts and Jobs Act (the “Tax Act”). The changes included in the Tax Act are broad and complex. As rule making bodies and new legislation is enacted to interpret the Tax Act, these changes may adjust the estimates provided in this report. The changes may possibly be material, due to, among other things, the Treasury Department’s promulgation of regulations and guidance that interpret the Tax Act, corrective technical legislative amendments that may change the Tax Act, any changes in accounting standards for income taxes or related interpretations in response to the Tax Act, or any updates or changes to estimates the company has utilized to calculate the transition impacts, including impacts from changes to current year earnings estimates and foreign exchange rates of foreign subsidiaries.
In addition, it is uncertain how each country where we do business may react to the Tax Act. Moreover, the evolving global tax landscape accompanying the adoption and guidance associated with the Base Erosion and Profit Shifting reporting requirements (“BEPS") recommended by the G8, G20 and Organization for Economic Cooperation and Development ("OECD") may require us to make adjustments to our financial results. As these and other tax laws and related regulations change, our financial results could be materially impacted. Given the unpredictability of these possible changes, it is difficult to assess whether the overall effect of these potential tax changes would be positive or negative for our earnings and cash flow, but such changes could adversely impact our financial results.
We are also subject to examination by the Internal Revenue Service ("IRS") and other tax authorities, including state revenue agencies and foreign governments. While we regularly assess the likelihood of favorable or unfavorable outcomes resulting from examinations by the IRS and other tax authorities to determine the adequacy of our provision for income taxes, there can be no assurance that the actual outcome resulting from these examinations will not materially adversely affect our financial condition and results of operations.
The risks described herewithin this Quarterly Report on Form 10-Q and in the Annual Report on the Form 10-K for the fiscal year ended April 3, 2021 are not the only risks we face. Additional risks and uncertainties not currently known to us or that we currently deem to be immaterial also may materially adversely affect our business, financial position, or future results of operations.
ITEM 2. UNREGISTERED SALES OF EQUITY SECURITIES AND USE OF PROCEEDS
Share Repurchase Programs
During the three months ended January 1, 2022, we did not repurchase any shares of our common stock. As of January 1, 2022, there remained 1,369,014 shares authorized for repurchase under the existing stock repurchase program. The following table presents a month-to-month summaryinformation with respect to shares that were tendered to us in satisfaction of employee tax withholding obligations upon the vesting of restricted stock purchase activity ingrants under our stock plans during the third quarter of fiscal year 2018:three months ended January 1, 2022:
| | | | | | | | | | | | | | | | | | | | | | | |
| | Total Number of Shares Purchased (4) | | Average Price Paid per Share (2) | | Total Number of Shares Purchased as Part of Publicly Announced Plans or Programs (1) | | Maximum Number of Shares that May Yet Be Purchased Under the Plans or Programs (3) |
| October 3, 2021 to October 30, 2021 | 15,679 | | N/A | | — | | | 1,369,014 |
| October 31, 2021 to November 27, 2021 | 9,463 | | | N/A | | — | | | 1,369,014 |
| November 28, 2021 to January 1, 2022 | 5,665 | | | N/A | | — | | | 1,369,014 |
|
| | | | | | | | | | | | |
| | Total Number of Shares Purchased 1 | | Average Price Paid per Share 2 | | Total Number of Shares Purchased as Part of Publicly Announced Plans or Programs 1 | | Maximum Number of Shares that May Yet Be Purchased Under the Plans or Programs 6 |
| October 1, 2017 to October 28, 2017 | 212,580 |
| 3 | $ | 45.06 |
| | 210,370 |
| | 818,216 |
|
| October 29, 2017 to November 25, 2017 | 74,371 |
| 4 | $ | 47.82 |
| | 72,678 |
| | 745,538 |
|
| November 26, 2017 to December 30, 2017 | 18,821 |
| 5 | $ | 50.48 |
| | 14,606 |
| | 730,932 |
|
|
| | | | |
1 |
(1) | On July 27, 2017 theNovember 28, 2018, our Board of Directors authorizedapproved a 1.0 million shares repurchase program expanding our capacity to repurchase 1,000,000 shares of our common stockto approximately 1.7 million shares. We may repurchase shares from time to time in theopen market transactions or inthrough privately negotiated repurchases as determined by management.transactions. There is no expiration date associated with the repurchase activity. |
| (2) | |
2 |
| "Average Price Paid per Share" reflects open market repurchases of common stock only. |
| (3) | These shares reflect the available shares authorized for repurchase under the expanded repurchase program approved by the Board on November 28, 2018. |
3(4) |
| Includes 2,210 sharesRepresents only shares that were tendered to us in satisfaction of employee tax withholding obligations upon the vesting of restricted stock grantedgrants under our stock plans.
|
| |
4 |
| Includes 1,693 shares that were tendered to us in satisfaction of employee tax withholding obligations upon the vesting of restricted stock granted under our stock plans.
|
| |
5 |
| Includes 4,215 shares that were tendered to us in satisfaction of employee tax withholding obligations upon the vesting of restricted stock granted under our stock plans.
|
| |
6 |
| These shares reflect the available shares authorized for repurchase under the program approved by the Board on July 27, 2017. |
ITEM 6. EXHIBITS
We have filed the following documents as Exhibits to this Quarterly Report on Form 10-Q:
EXHIBITS INDEX
| | | | | | | | | | | | | | | | | | | | | | | | | | | | | | | | | | | | | | |
| Exhibit Number | | | | Incorporation by Reference | | Filed Herewith |
| Exhibit Description | | Form | | File No. | | Exhibit | | Filing Date | |
| 10.1 | | | | 8-K | | 001-12696 | | 10.1 | | 12/29/2021 | | |
| 10.2* | | | | | | | | | | | | X |
| 31.1 | | | | | | | | | | | | X |
| 31.2 | | | | | | | | | | | | X |
| 32.1 | | | | | | | | | | | | X |
| 101.INS | | XBRL Instance Document - the XBRL Instance Document does not appear in the Interactive Data File because its XBRL tags are embedded within the Inline XBRL document | | | | | | | | | | X |
| 101.SCH | | Inline XBRL Taxonomy Extension Schema Document | | | | | | | | | | X |
| 101.CAL | | Inline XBRL Taxonomy Extension Calculation Linkbase Document | | | | | | | | | | X |
| 101.LAB | | Inline XBRL Taxonomy Extension Label Linkbase Document | | | | | | | | | | X |
| 101.PRE | | Inline XBRL Taxonomy Extension Presentation Linkbase Document | | | | | | | | | | X |
| 101.DEF | | Inline XBRL Taxonomy Definition Linkbase Document | | | | | | | | | | X |
| 104 | | Cover Page Interactive Data File, (formatted as Inline XBRL and contained in Exhibit 101) | | | | | | | | | | X |
| |
| | | | | | | | | | |
| * | | Indicates a management contract or compensatory plan, contract or arrangement in which any Director or any Executive Officer participates. |
| | |
| | |
|
| | | | | | | | | | | | |
Exhibit Number | | | | Incorporation by Reference | | Filed Herewith |
| Exhibit Description | | Form | | File No. | | Exhibit | | Filing Date | |
| | | | | | | | | | | | |
| | | | | | | | | | | | X |
| | | | | | | | | | | | |
| | | | | | | | | | | | X |
| | | | | | | | | | | | |
| | | | | | | | | | | | X |
| | | | | | | | | | | | |
101.INS | | XBRL Instance Document | | | | | | | | | | X |
| | | | | | | | | | | | |
101.SCH | | XBRL Taxonomy Extension Schema Document | | | | | | | | | | X |
| | | | | | | | | | | | |
101.CAL | | XBRL Taxonomy Extension Calculation Linkbase Document | | | | | | | | | | X |
| | | | | | | | | | | | |
101.LAB | | XBRL Taxonomy Extension Label Linkbase Document | | | | | | | | | | X |
| | | | | | | | | | | | |
101.PRE | | XBRL Taxonomy Extension Presentation Linkbase Document | | | | | | | | | | X |
| | | | | | | | | | | | |
101.DEF | | XBRL Taxonomy Definition Linkbase Document | | | | | | | | | | X |
| | | | | | | | | | | | |
Plantronics, Inc.
FORM 10-Q
CROSS REFERENCE TABLE
|
| | | |
| Item Number | Page(s) |
| PART I. FINANCIAL INFORMATION | | | |
| | | | |
| | - | |
| | | | |
| | - | |
| | | | |
| | - | |
| | | | |
| | | |
| | | | |
| PART II. OTHER INFORMATION | | | |
| | | | |
| | | |
| | | | |
| | | |
| | | | |
| | | |
| | | | |
| | | |
| | | | |
| Signatures | | | |
SIGNATURES
Pursuant to the requirements of the Securities Exchange Act of 1934, the registrant has duly caused this report to be signed on its behalf by the undersigned thereunto duly authorized.
|
| | | | | | | | | | |
| | PLANTRONICS, INC. |
| | | |
| Date: | January 30, 2018February 8, 2022 | By: | /s/ Pamela StrayerCharles D. Boynton |
| | Name: | Pamela StrayerCharles D. Boynton |
| | Title: | SeniorExecutive Vice President and Chief Financial Officer
(on behalf of the Registrant and as principal financial officer and principal accounting officer) |