UNITED STATES
SECURITIES AND EXCHANGE COMMISSION
Washington, D.C. 20549
FORM 10-Q10-Q/A
(Amendment No. 1)
(Mark One)
|
| |
x☒ | QUARTERLY REPORT PURSUANT TO SECTION 13 OR 15(d) OF THE SECURITIES EXCHANGE ACT OF 1934 |
For the quarterly period ended SeptemberJune 29, 2018
2019
or
|
| |
o☐ | TRANSITION REPORT PURSUANT TO SECTION 13 OR 15(d) OF THE SECURITIES EXCHANGE ACT OF 1934 |
For the transition period from ________to _________
Commission File Number: 001-12696
Plantronics, Inc.
(Exact name of registrant as specified in its charter)
|
| |
| Delaware | 77-0207692 |
| (State or other jurisdiction of incorporation or organization) | (I.R.S. Employer Identification No.) |
345 Encinal Street
Santa Cruz, California95060
(Address of principal executive offices)
(Zip Code)
(831) (831) 426-5858
(Registrant's telephone number, including area code)
Securities registered pursuant to Section 12(b) of the Act
|
| | |
| Title of each class | Trading Symbol(s) | Name of each exchange on which registered |
| Common Stock, $0.01 par value | PLT | New York Stock Exchange |
Indicate by check mark whether the registrant (1) has filed all reports required to be filed by Section 13 or 15(d) of the Securities Exchange Act of 1934 during the preceding 12 months (or for such shorter period that the registrant was required to file such reports), and (2) has been subject to such filing requirements for the past 90 days. Yesx☒ No o☐
Indicate by check mark whether the registrant has submitted electronically and posted on its corporate Web site, if any, every Interactive Data File required to be submitted and posted pursuant to Rule 405 of Regulation S-T (§232.405 of this chapter) during the preceding 12 months (or for such shorter period that the registrant was required to submit and post such files). Yesx☒ No o☐
Indicate by check mark whether the registrant is a large accelerated filer, an accelerated filer, a non-accelerated filer, a smaller reporting company or an emerging growth company. See the definitions of “large accelerated filer,” “accelerated filer,” “smaller reporting company” and "emerging growth company" in Rule 12b-2 of the Exchange Act.
|
| | | | |
Large accelerated filerx | ☒ | Accelerated filero | ☐ |
Non-accelerated filero | ☐ | Smaller reporting companyo | Emerging growth company o
☐ |
| | | (Do not check if a smaller reporting company)Emerging growth company | | ☐ |
If an emerging growth company, indicate by check mark if the registrant has elected not to use the extended transition period for complying with any new or revised financial accounting standards provided pursuant to Section 13(a) of the Exchange Act. o☐
Indicate by check mark whether the registrant is a shell company (as defined in Rule 12b-2 of the Exchange Act). Yes o ☐No x☒
As of November 2, 2018, 39,803,774July 31, 2019, 39,575,910 shares of the registrant's common stock were outstanding.
EXPLANATORY NOTE
This Amendment No. 1 on Form 10-Q/A (the “Amendment”) of Plantronics, Inc. (the “Company”) amends the Company’s Quarterly Report on Form 10-Q for the quarter ended June 30, 2019, originally filed with the Securities and Exchange Commission on August 6, 2019 (the “Original Report”). The Original Report inadvertently excluded certain XBRL information in portions of the financial statements and accompanying notes to the condensed consolidated financial statements.
This Amendment No. 1 includes the XBRL information and does not reflect events that may have occurred subsequent to the original filing date, and does not modify or update in any way disclosures made in the Original Report. No other changes have been made to the Original Report.
As required by Rule 12b-15 of the Securities Exchange Act of 1934, as amended, this Amendment contains new certifications by the Company’s principal executive officer and principal financial officer, which are being filed as exhibits to the Amendment.
Plantronics, Inc.
FORM 10-Q
TABLE OF CONTENTS
|
| |
| PART I. FINANCIAL INFORMATION | Page No. |
| | |
| |
| | |
| |
| |
| |
| | |
| |
| | |
| |
| |
| |
| | |
| |
| |
| |
| | |
| |
| |
| |
| |
| |
| | |
| |
| |
| |
| | |
| |
| | |
| |
| | |
| |
| | |
| |
| |
| |
| | |
| PART II. OTHER INFORMATION | |
| | |
| |
| | |
| |
| | |
| |
| | |
| |
| | |
| |
| | |
| |
| | |
| |
Plantronics® and, Poly®, Simply Smarter Communications® , and the propeller design are trademarks or registered trademarks of Plantronics, Inc. All other trademarks are the property of their respective owners.
DECT™ is a trademark of ETSI registered for the benefit of its members in France and other jurisdictions.
The Bluetooth name and the Bluetooth® trademarks are owned by Bluetooth SIG, Inc. and are used by Plantronics, Inc. under license. All other trademarks are the property of their respective owners.
Part I -- FINANCIAL INFORMATION
Management’s Discussion and Analysis of Financial Condition and Results of Operations
CERTAIN FORWARD-LOOKING INFORMATION:
This Quarterly Report on Form 10-Q contains forward-looking statements within the meaning of Section 27A of the Securities Act of 1933 ("Securities Act") and Section 21E of the Securities Exchange Act of 1934 ("Exchange Act"). Forward-looking statements may generally be identified by the use of such words as "anticipate," "believe," “could,” "expect," "intend," “may,” "plan," "potential," "shall," "will," “would,” or variations of such words and similar expressions, or the negative of these terms. Specific forward-looking statements contained within this Form 10-Q include, but are not limited to, statements regarding (i) our beliefs regarding the EnterpriseUC&C market, market dynamics and opportunities, and customer and partner behavior as well as our position in the market, (ii) our expectations for the impact of the Acquisition as it relates to our strategic vision and additional market opportunities for our combined hardware and services offerings, as well as our plans and expectation for the integration of the operations of Polycom, (iii) our beliefs regarding the Consumer market, our new product introductions and the expected effect of such introductions, (iii) our belief that our "as-a-service" offerings will benefit ourfuture enterprise growth long-term but their contribution will not be material in the near term,drivers, (iv) our intention to provide customer data insight through softwareexpectations regarding the impact of UC&C on headset adoption and service solutions,how it may impact our investment and partnering activities, (v) the Unified Communications ("UC") market, including adoption of UC products, our position,expectations for new and timingnext generation product and growth expectations in this market,services offerings, (vi) our plans regarding our "as a service" offerings including sales and marketing efforts, (vii) our intentions regarding investments in long-term growth opportunities and our core research and development efforts, in particular in the UC market, (viii) our intentions regarding the focus of our sales, marketing and customer services and support teams, on UC, (ix) the future of UC technologies, including the transition of businesses to UC-supported systems and the effects on headset adoption and use, enterprises that adopt UC and our revenue opportunity and profit growth, (x)(vii) our expenses, including research, development and engineering expenses and selling, general and administrative expenses, (xi) fluctuations in our cash provided by operating activities as a result of various factors, including fluctuations in revenues and operating expenses, the timing of compensation-related payments including stock based compensation, timing of product shipments, accounts receivable collections, inventory and supply chain management, and the timing and amount of taxes and other payments, (xii) our future tax rate and payments related to unrecognized tax benefits, (xiii) our anticipated range of capital expenditures for the remainder of Fiscal Year 20182020 and the sufficiency of our cash, cash equivalents, and cash from operations to sustain future operations and discretionary cash requirements, (xiv) our ability to pay future stockholder dividends, (xv) our ability to draw funds on our credit facility as needed, (xvi) the sufficiency of our capital resources to fund operations, and other statements regarding our future operations, financial condition and prospects, and business strategies. Such forward-looking statements are based on current expectations and assumptions and are subject to risks and uncertainties that may cause actual results to differ materially from the forward-looking statements. Factors that could cause actual results and events to differ materially from such forward-looking statements are included, but not limited to, those discussed in this Quarterly Report on Form 10-Q; in Part I, "Item 1A. Risk Factors" of our Annual Report on Form 10-K for the fiscal year ended March 31, 2018,2019, filed with the Securities and Exchange Commission (“SEC”) on May 9, 2018;17, 2019; and other documents we have filed with the SEC. We undertake no obligation to update or revise publicly any forward-looking statements, whether as a result of new information, future events, or otherwise, except as required by applicable law. Given these risks and uncertainties, readers are cautioned not to place undue reliance on such forward-looking statements.
OVERVIEW
We are a leading global designer, manufacturer, and marketer of lightweightintegrated communications and collaboration solutions that span headsets, telephone headset systems, otheropen SIP desktop phones, audio and video conferencing, cloud management and analytics software solutions, and services. Our major product categories are Enterprise Headsets, which includes corded and cordless communication headsets; Consumer Headsets, which includes Bluetooth and corded products for mobile device applications, personal computer and gaming; Voice, Video, and Content Sharing Solutions, which includes open SIP desktop phones, conference room phones, and video endpoints, including cameras, speakers and accessories for the worldwide business and consumer markets under the Plantronics brand. After July 2, 2018, we also becamemicrophones. All of our solutions are designed to work in a leading global providerwide range of open, standards-based Unified Communications & Collaboration "UC("UC&C"), Unified Communication as a Service ("UCaaS"), and Video as a Service ("VaaS") environments. Our RealPresence collaboration solutions range from infrastructure to endpoints and allow people to connect and collaborate globally and naturally. In addition, we offer comprehensive support services including support for voice, video and content sharingour solutions and hardware devices, as well as professional, hosted, and managed services. We continue to operate under a comprehensive linesingle operating segment.
We sell our Enterprise products through a high-touch sales team and a well-developed global network of supportdistributors and channel partners including value-added resellers, integrators, direct marketing resellers, service atproviders, and resellers. We sell our Consumer products through both traditional and online consumer electronics retailers, consumer product retailers, office supply distributors, wireless carriers, catalog and mail order companies, and mass merchants. We have well-established distribution channels in the workplace underAmericas, Europe, Middle East, Africa, and Asia Pacific where use of our products is widespread.
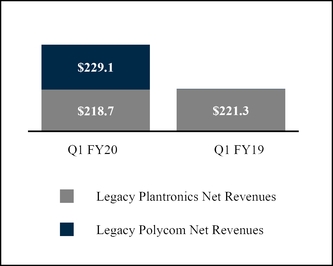
Total Net Revenues (in millions)
Compared to the Polycom brand.
On July 2, 2018, we completedfirst quarter of Fiscal Year 2019 total net revenues increased 102% to $447.8 million; the increase in total net revenues is primarily related to our acquisition (the “Acquisition”) of all of the issued and outstanding shares of capital stock of Polycom, Inc. (“Polycom”("the Acquisition") which was completed on July 2, 2018. As a result of purchase accounting, a total of $12.2 million of deferred revenue that otherwise would have been recognized in the first quarter of Fiscal Year 2020 was excluded from first quarter revenue of $447.8 million.
The table below summarizes net revenues for approximately $2.2 billionthe three months ended June 30, 2019 and 2018 by product categories:
|
| | | | | | | | | | | | | | | |
| (in thousands, except percentages) | | Three Months Ended | | | | |
| | June 30, | | Increase |
| | 2019 | | 2018 | | (Decrease) |
| Enterprise Headsets | | $ | 175,084 |
| | $ | 167,642 |
| | $ | 7,442 |
| | 4.4 | % |
| Consumer Headsets | | 43,566 |
| | 53,667 |
| | (10,101 | ) | | (18.8 | )% |
Voice 1 | | 103,847 |
| | — |
| | 103,847 |
| | 100.0 | % |
Video 1 | | 60,248 |
| | — |
| | 60,248 |
| | 100.0 | % |
Services 2 | | 65,022 |
| | — |
| | 65,022 |
| | 100.0 | % |
| Total | | $ | 447,767 |
| | $ | 221,309 |
| | $ | 226,458 |
| | 102.3 | % |
1 Voice and Video product net revenues presented net of fair value adjustments to deferred revenue of $0.6 million.
2 Services net revenues presented net of fair value adjustments to deferred revenue of $11.6 million.
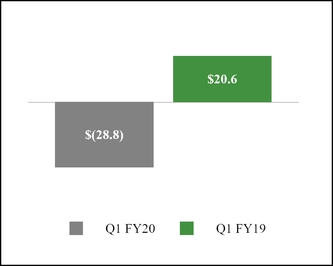
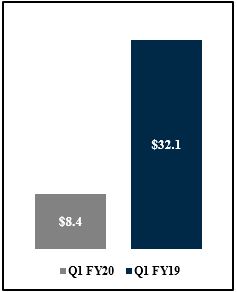
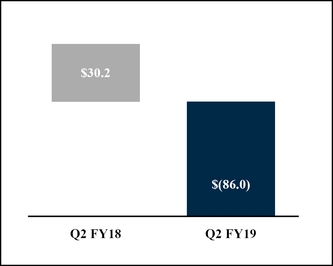
Operating Income (Loss) (in millions)
We reported a net loss of $44.9 million and an operating loss of $28.8 million for the first quarter of Fiscal Year 2020. We reported a net income of $14.5 million and an operating income of $20.6 million for the first quarter of Fiscal Year 2019. The decrease in stockour results from operations is primarily due to $45.3 million of amortization of purchased intangibles and cash.$20.4 million of post-Acquisition integration related expenses incurred during the first quarter of Fiscal Year 2020. We will continue to work on integrating Polycom into our business in order to streamline our operations and realize synergies from the combined companies.
Our strategic initiatives are primarily focused on driving long-term growth through our end-to-end portfolio of audio and video endpoints, including headsets, desktop phones, conference room phones, and video collaboration solutions. The Acquisition was consummated in accordance with the terms and conditions of the Stock Purchase Agreement (the “Purchase Agreement”), dated March 28, 2018, among the Company, Triangle Private Holdings II, LLC (“Triangle”), and Polycom. We believe this acquisition will better position Plantronics with our channel partners, customers, and strategic alliance partners by allowingpositions us to pursue additional opportunities across the UC&C market in both hardware end points and services. The addition of Polycom’s product and services portfolio is expected to enable us to accelerate our strategic vision of becomingas a global leader in communications and collaboration experiences. We believe this acquisition will positionendpoints, target the faster-growing market categories, such as the Huddle Room for video collaboration, allows us to capture additional opportunities through data analytics and insight services across a broad portfoliorange of communications endpoints. We continueendpoints, and better positions us with our channel partners, customers and strategic alliance partners to operate under a single operating segment.
Our major product categories are Enterprise headsets, which includes headsets optimized for UC&C, other corded and cordless communication headsets, audio processors and telephone systems; Consumer headsets, which includes Bluetooth and corded products for mobile device applications, personal computer ("PC"), and gaming headsets; Voice, Video, and content sharing UC&Cpursue comprehensive solutions which includes products designed to work with a wide range of Unified Communication (UC), Unified Communication as a Service (UCaaS), and VaaS environments, including our RealPresence collaboration solutions of infrastructure to endpoints which allows people all over the world to connect and collaborate naturally without beingcommunications challenges in the same physical location; and comprehensive support services including supportmarketplace, each of which we believe will drive long-term revenue growth.
During the quarter we focused on our solutions, hardware devices, professional, hosted, and managed services.
We sell our products through a high touch sales team and well developed global network of distributors and channel partners including Value-added Resellers (VARs), integrators, direct marketing resellers (DMRs), service providers, resellers, and retailers.
Our consolidated financial resultsintegration activities which included various systems integrations for the threecombined company. We also rationalized our sales channel and six months ended September 30, 2018 includesintroduced a new consolidated distribution agreement with our partners globally. These efforts are expected to decrease redundancies and leverage our competitive advantages for the financial resultsbenefit of Polycom from July 2, 2018,our partners and end customers. We believe the date of acquisition. For more information regarding the acquisition, refer to Note 3, Acquisition, Goodwill,changes have resulted in short-term disruptions in our operations which will be resolved as sales and Acquired Intangible Assets, of the accompanying notes to condensed consolidated financial statements.
|
| |
Total Net Revenues (in millions)
| Operating Income (Loss) (in millions)
|
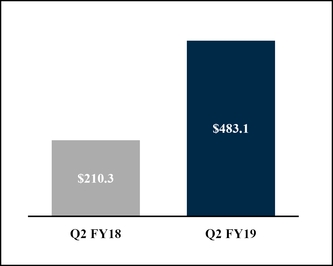
Comparedsupply partners adjust to the second quarter of Fiscal Year 2018 total net revenues increased 130% to $483.1 million; the increase in total net revenues is primarily related to the Acquisition.changes.
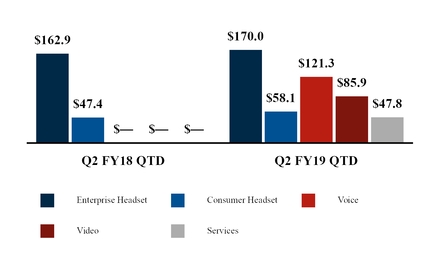
Voice and Video product net revenues were $207.2 million, net of fair value adjustments to deferred revenue of $3.4 million; Services net revenues were $47.8 million, net of fair value adjustments to deferred revenue of $33.1 million. Consumer headsets net revenues increased $10.7 million, or 22.5% from the year ago quarter and Enterprise headset net revenues increased $7.1 million, or 4.3%.
We reported a net loss of $(86.7) million and an operating loss of $(86.0) million for the second quarter of Fiscal Year 2019, representing a decrease of (535)% and (385)% respectively. The decrease is primarily due to the Acquisition and the related acquisition and integration costs incurred during the second quarter of Fiscal Year 2019. Refer to Note 3, Acquisition, Goodwill, and Acquired Intangible Assets, in the accompanying footnotes to the condensed consolidated financial statements.
Our primary focus for long-term growth opportunities, strategic initiatives, and the majority of our revenue and profits remains in our Enterprise headset and our new voice, video, and content sharing solution business. As we integrate Polycom, we will focus on accelerating our strategic vision of becoming a global leader in communications and collaboration experiences. Polycom is a leading provider of open, standards-based UC&C solutions for voice, video and content sharing, and has a comprehensive line of support and service solutions. As the market is rapidly changing with increasing adoption of hosted services and more influential players entering the market, users and user groups within customer organizations have more choices than ever before and they are taking advantage of those choices. It is becoming increasingly common place for the same customer organization to use multiple UC&C solutions, creating very diverse and heterogeneous environments. Polycom's approach of designing endpoint solutions that provide the highest flexibility in terms of interworking with these services provides the investment protections that customer organizations are looking for. Polycom solutions are also sold globally through a high-touch sales model that leverages a broad network of channel partners. Therefore, we believe this Acquisition will position us to capture additional opportunities through data analytics and insight services across a broad portfolio of communications endpoints.
Within the market for our Enterprise headset products,Headsets, we anticipate the key driver of growth over the next few years will be the continued adoption of UC&C audio solutions. We believe enterprises are increasing their adoption of UC&C systems to reduce costs, improve collaboration, and migrate technology from obsolete legacy systems.to more capable and flexible technology. We expect the growth of UC&C solutions will increase overall headset adoption in enterprise environments, and we believe most of the growth in our Enterprise Headsets product category over the next three years will come from headsets designed for UC&C. As such, UC&C remains the central focus of our sales, marketing, and support functions, and we will continue investing in key strategic alliances and integrations with major UC&C vendors. We continue to invest in new ideas and technology to create additional growth opportunities, such as Plantronics Manager Pro, our software-as-a-service ("SaaS") data insights offering, and Habitat Soundscaping, our intelligent acoustic management service. While we anticipate these investments will prove beneficial in the long term, we do not expect their contributions to be material in the near term.
Revenues from our Consumer headset products channelHeadsets are seasonal and typically strongest in our third fiscal quarter, which includes the majority of the holiday shopping season. Additionally, otherOther factors that directly impact our Consumerperformance in the product category performance, such asinclude product life cycles (including the introduction and pace of adoption of new technology), the market acceptance of new product introductions, consumer preferences and the competitive retail environment, changes in consumer confidence and other macroeconomic factors. While sales in the mobile headset market continues to decline, we believe future growth opportunities exist in gaming headsets primarily due to growth trends in the console gaming market. In addition, the timing or non-recurrence of retailer product placements can cause volatility in quarter-to-quarter results.
In an effort to align our strategy and focus on our core enterprise markets, we announced on May 7, 2019 that we intend to evaluate strategic alternatives for our Consumer Headset products. We have not yet determined the timing, structure, or financial impact of any potential transaction.
We remain cautious about the macroeconomic environment, based on uncertainty around trade and fiscal policy in the U.S. and internationally and broader economic uncertainty in many parts of Europe and Asia Pacific, which makes it difficult for us to gauge the economic impacts on our future business. We will continue to monitor our expenditures and prioritize expenditures that further our strategic long-term growth opportunities.
RESULTS OF OPERATIONS
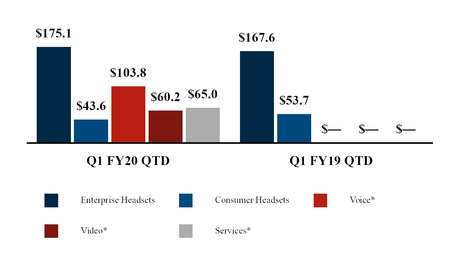
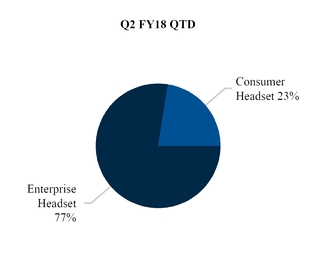
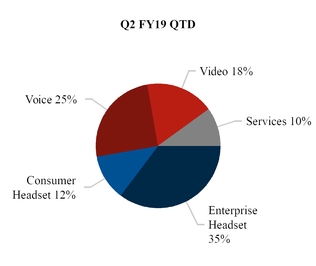
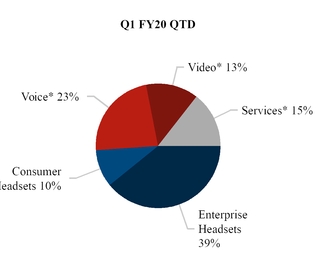
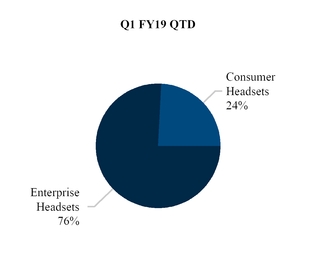
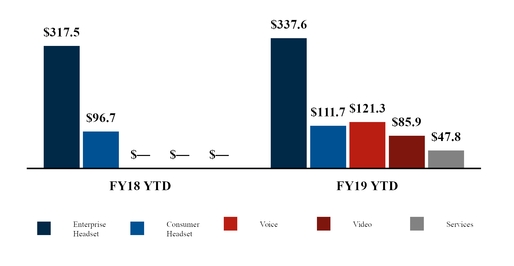
The following graphs display net revenues by product category for the three and six months ended SeptemberJune 30, 20172019 and 2018:
Net Revenues(in millions)
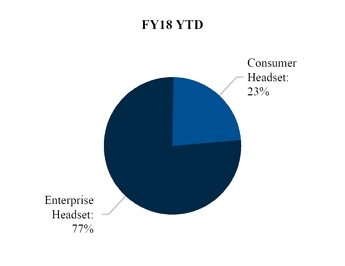
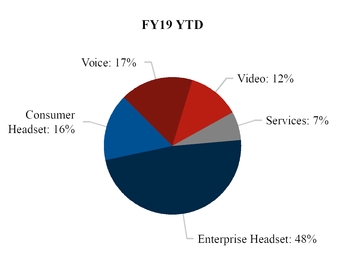
Revenue by Product Category (percent)
* These product categories were created as a result of the Acquisition, SeeNote 3, Acquisition, of the accompanying notes to condensed consolidated financial statements.
Total net revenues increased in the three and six months ended SeptemberJune 30, 20182019 compared to the prior year periods due primarily to the Acquisition as well as higher revenues within bothour Enterprise Headset product category partially offset by declines in our Consumer and Enterprise headsetHeadset product categories.category. The growth in our Consumer category was driven by Gaming product revenues while the growth in our Enterprise Headset category was driven by UC&C product revenues and the decline in our Consumer Headset category was driven by Gaming and Mono product revenues.
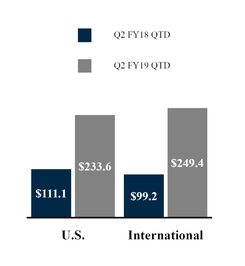
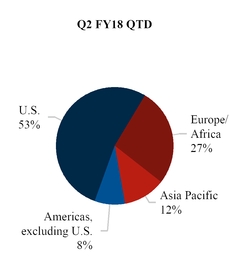
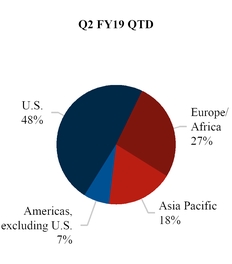
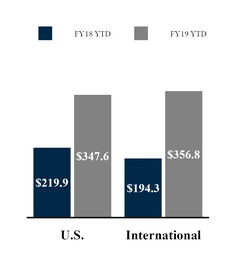
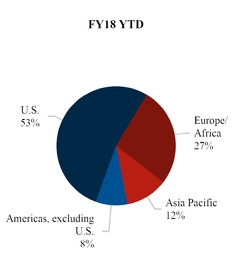
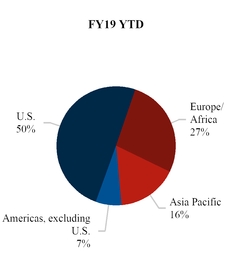
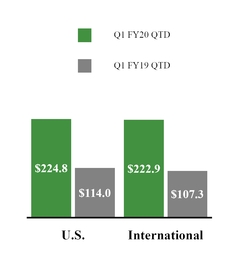
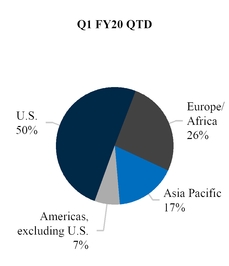
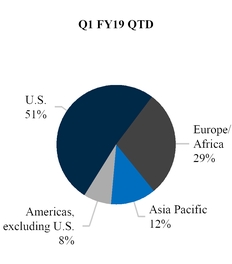
Geographic Information (in millions) Revenue by Region (percent)
Compared to the same prior year period, U.S. net revenues for the three months ended SeptemberJune 30, 20182019 increased due primarily to the Acquisition, as well as higher revenues within our ConsumerEnterprise Headsets product categoriescategory driven by our Gaming products.
Compared to the same prior year period, U.S. net revenues for the six months ended September 30, 2018 increased due primarily to the Acquisition. Consumer product revenues also grew, driven by our Gaming products and partially offset by the divestiture of our Clarity business in June 2017. Enterprise product revenues were up slightly with growth in UC&C revenues partially offset by continued declines in our non-UC&C product revenues. Consumer Headsets product revenues were down, driven by declines in sales of our Gaming products.
International net revenues for the three and six months ended SeptemberJune 30, 20182019 increased from the same prior year period due primarily to the Acquisition;Acquisition as well as growth in our Enterprise Headsets category driven by UC&C product sales. This growth was partially offset by declines in our Consumer Headset product revenues as a result of declines in sales also increased driven byof our Gaming and Mono products.
Changes in foreign exchange rates did not have a material impact on revenues forDuring the three months ended SeptemberJune 30, 2018 or 2017. During the six months ended September 30, 2018,2019, changes in foreign exchange rates positivelynegatively impacted net revenues by $5.6$3.9 million, net of the effects of hedging, compared to a $2.7$6 million favorable impact on revenuenet revenues in the prior year period.
COST OF REVENUES AND GROSS PROFIT
Cost of revenues consists primarily of direct and contract manufacturing costs, warranty, freight, depreciation, duties, charges for excess and obsolete inventory, royalties, and overhead expenses.
| | | | | Three Months Ended | | | | Six Months Ended | | | | Three Months Ended | | |
| | | September 30, | | Increase | | September 30, | | Increase | | June 30, | | Increase |
| (in thousands, except percentages) | | 2017 | | 2018 | | (Decrease) | | 2017 | | 2018 | | (Decrease) | | 2019 | | 2018 | | (Decrease) |
| Total net revenues | | $ | 210,300 |
| | $ | 483,069 |
| | $ | 272,769 |
| | 129.7 | % | | $ | 414,226 |
| | $ | 704,378 |
| | $ | 290,152 |
| | 70.0 | % | | $ | 447,767 |
| | $ | 221,309 |
| | $ | 226,458 |
| | 102.3 | % |
| Cost of revenues | | 102,668 |
| | 330,440 |
| | 227,772 |
| | 221.9 | % | | 203,311 |
| | 441,906 |
| | 238,595 |
| | 117.4 | % | | 235,121 |
| | 111,466 |
| | 123,655 |
| | 110.9 | % |
| Gross profit | | $ | 107,632 |
| | $ | 152,629 |
| | $ | 44,997 |
| | 41.8 | % | | $ | 210,915 |
| | $ | 262,472 |
| | $ | 51,557 |
| | 24.4 | % | | $ | 212,646 |
| | $ | 109,843 |
| | $ | 102,803 |
| | 93.6 | % |
| Gross profit % | | 51.2 | % | | 31.6 | % | |
|
| | | | 50.9 | % | | 37.3 | % | | | | | | 47.5 | % | | 49.6 | % | |
|
| | |
Compared to the same prior year periods,period, gross profit as a percentage of net revenues decreased in the three and six months ended SeptemberJune 30, 2018,2019, due primarily to $30.0 million of amortization of both purchased intangibles and $12.2 million of deferred revenue fair value adjustment, and the inventory step-up associated with the Acquisition; refer torespectively. See Note 3, Acquisition, Goodwill, and Acquired Intangible Assets. Other unfavorable items were cost increases on a commodity component driven by industry capacity shortages and a product mix with higher gaming revenues within our Consumer product category.accompanying notes to condensed consolidated financial statements. These increased costs were partially offset by material cost reductions and favorable currency movements.reductions.
There are significant variances in gross profit percentages between our higher and lower margin products;products including Polycom products acquired through the Acquisition; therefore, small variations in product mix, which can be difficult to predict, can have a significant impact on gross profit as a percentage of net revenues. Gross profit percentages may also vary based on distribution channel,channels, return rates, and other factors.
OPERATING EXPENSES
Operating expenses consists primarily of research, development and engineering; selling, general and administrative; gain, net of litigation settlements and restructuring and other related charges (credits) expenses which are summarized in the table below for the three and six months ended SeptemberJune 30, 20172019 and 2018:
| | | | | Three Months Ended | | | | Six Months Ended | | | | Three Months Ended | | | |
| | | September 30, | | Increase | | September 30, | | Increase | | June 30, | | Increase | |
| (in thousands, except percentages) | | 2017 | | 2018 | | (Decrease) | | 2017 | | 2018 | | (Decrease) | | 2019 | | 2018 | | (Decrease) | |
| Research, development, and engineering | | $ | 19,932 |
| | $ | 57,047 |
| | $ | 37,115 |
| | 186 | % | | $ | 41,145 |
| | $ | 80,748 |
| | $ | 39,603 |
| | 96 | % | | $ | 59,524 |
| | $ | 23,701 |
| | $ | 35,823 |
| | 151 | % | |
| Selling, general and administrative | | $ | 57,696 |
| | $ | 174,297 |
| | $ | 116,601 |
| | 202 | % | | $ | 113,929 |
| | $ | 238,500 |
| | $ | 124,571 |
| | 109 | % | | 163,608 |
| | 64,203 |
| | 99,405 |
| | 155 | % | |
| Gain, net of litigation settlements | | (104 | ) | | $ | — |
| | $ | 104 |
| | (100 | )% | | $ | (280 | ) | | $ | (30 | ) | | $ | 250 |
| | (89 | )% | | (1,162 | ) | | (30 | ) | | (1,132 | ) | | 3,773 | % | |
| Restructuring and other related charges (credits) | | (51 | ) | | $ | 7,261 |
| | $ | 7,312 |
| | (14,337 | )% | | $ | 2,522 |
| | $ | 8,581 |
| | $ | 6,059 |
| | 240 | % | |
| Restructuring and other related charges | | | 19,525 |
| | 1,320 |
| | 18,205 |
| | 1,379 | % | |
| Total Operating Expenses | | $ | 77,473 |
| | $ | 238,605 |
| | $ | 161,132 |
| | 208 | % | | $ | 157,316 |
| | $ | 327,799 |
| | $ | 170,483 |
| | 108 | % | | $ | 241,495 |
| | $ | 89,194 |
| | $ | 152,301 |
| | 171 | % | |
| % of net revenues | | 36.8 | % | | 49.4 | % | |
| | | | 38.0 | % | | 46.5 | % | | | | | | 53.9 | % | | 40.3 | % | |
| | | |
Our Research, development, and engineering expenses and selling, general and administrative expenses increased during the three and six months ended SeptemberJune 30, 2018,2019, primarily due to the impactinclusion of Polycom operating expenses after the Acquisition, and related acquisition andas well as $19.5 million of Acquisition-related integration costs and $15.3 million of amortization of purchased intangibles incurred during the periods; refer to Note 3, Acquisition, Goodwill, and Acquired Intangible Assets, of the accompanying notes to condensed consolidated financial statements. .period.
We recognized immaterial gains from litigation in the three and six months ended September 30, 2017 and 2018.
Compared to the prior year period, restructuring and other related charges (credits) increased in the three and six months ended SeptemberJune 30, 2018,2019, due primarily to restructuring actions initiated during the second quarter of Fiscal Year 2019 as a result ofperiod to streamline the Acquisition.global workforce and achieve planned synergies. For more information regarding restructuring activities, refer toactivities. See Note 9, 10, Restructuring and Other Related Charges, of the accompanying notes to condensed consolidated financial statements.
INTEREST EXPENSE
|
| | | | | | | | | | | | | | | | |
| | | Three Months Ended | | | |
| | | June 30, | | Increase | |
| (in thousands, except percentages) | | 2019 |
| 2018 | | (Decrease) | |
| Interest expense | | $ | (23,932 | ) | | $ | (7,327 | ) | | $ | 16,605 |
| | 226.6 | % | |
| % of net revenues | | (5.3 | )% | | (1.6 | )% | | | | | |
Interest expense increased for the three and six months ended SeptemberJune 30, 2017 and 2018 was $7.3 million, $14.6 million, $23.9 million, and $31.2 million, respectively and relates2019 primarily due to interest incurred on our 5.50% Senior Notes and the Credit Facility Agreement. Refer toAgreement entered into in connection with the Acquisition. See Note 8, 9, Debt, of the accompanying notes to condensed consolidated financial statementsstatements.
OTHER NON-OPERATING INCOME, NET
| | | | | Three Months Ended | | | | Six Months Ended | | | | Three Months Ended | | | |
| | | September 30, | | Increase | | September 30, | | Increase | | June 30, | | Increase | |
| (in thousands, except percentages) | | 2017 | | 2018 | | (Decrease) | | 2017 | | 2018 | | (Decrease) | | 2019 | | 2018 | | (Decrease) | |
Other non-operating income, net
| | $ | 1,826 |
| | $ | 1,610 |
| | $ | (216 | ) | | (11.8 | )% | | $ | 2,740 |
| | $ | 3,606 |
| | $ | 866 |
| | 31.6 | % | | $ | 333 |
| | $ | 1,996 |
| | $ | (1,663 | ) | | (83.3 | )% | |
| % of net revenues | | 0.9 | % | | 0.3 | % | | | | | | 0.7 | % | | 0.5 | % | | | | | | 0.1 | % | | 0.9 | % | | | | | |
Other non-operating income, net for the three months ended SeptemberJune 30, 20182019 decreased primarily due to lower interest income as theour investment portfolios were liquidated during the First Quarter of Fiscal Year 2019.2019 to facilitate the Acquisition.
Other non-operating income, net for the six months ended September 30, 2018 increased primarily due to immaterial net foreign currency gains compared to immaterial net foreign currency losses in the prior period.
INCOME TAX EXPENSE (BENEFIT)
| | | | | Three Months Ended | | | | | | Six Months Ended | | | | | | Three Months Ended | | | | | |
| | | September 30, | | Increase | | September 30, | | Increase | | June 30, | | Increase | |
| (in thousands except percentages) | | 2017 |
| 2018 | | (Decrease) | | 2017 |
| 2018 | | (Decrease) | | 2019 |
| 2018 | | (Decrease) | |
| Income (Loss) before income taxes | | $ | 24,725 |
| | $ | (108,259 | ) | | $ | (132,984 | ) | | (537.9 | )% | | $ | 41,776 |
| | $ | (92,941 | ) | | $ | (134,717 | ) | | (322.5 | )% | |
| Income (loss) before income taxes | | | $ | (52,448 | ) | | $ | 15,318 |
| | $ | (67,766 | ) | | (442.4 | )% | |
| Income tax expense (benefit) | | 4,772 |
| | (21,550 | ) | | (26,322 | ) | | (551.6 | )% | | 2,995 |
| | (20,703 | ) | | (23,698 | ) | | (791.3 | )% | | (7,577 | ) | | 847 |
| | (8,424 | ) | | (994.6 | )% | |
| Net income (loss) | | $ | 19,953 |
| | $ | (86,709 | ) | | $ | (106,662 | ) | | (534.6 | )% | | $ | 38,781 |
| | $ | (72,238 | ) | | $ | (111,019 | ) | | (286.3 | )% | | $ | (44,871 | ) | | $ | 14,471 |
| | $ | (59,342 | ) | | (410.1 | )% | |
| Effective tax rate | | 19.3 | % | | (19.9 | )% | |
|
| |
| | 7.2 | % | | (22.3 | )% | | | | | | 14.4 | % | | 5.5 | % | |
|
| |
| |
The Company and its subsidiaries are subject to taxation in the U.S. and in various foreign and state jurisdictions. Our tax provision or benefit is determined using an estimate of our annual effective tax rate and adjusted for discrete items that are taken into account in the relevant period. The effective tax rates for the three months ended SeptemberJune 30, 20172019 and 2018 were 19.3%14.4% and 19.9%5.5%, respectively.
The annual effective tax rates for the six months ended Septemberas of June 30, 20172019 and 2018 were 7.2% and 22.3%, respectively. The period over periodvaried from the statutory tax rate has beenof 21% primarily due to our jurisdictional mix of income, state taxes, U.S. taxation of foreign earnings, and may continueR&D credits.
During the quarter ended June 30, 2019, we recognized a discrete $11.6 million tax benefit related to be subjectan intra-entity transfer of an intangible asset that will have a deferred future benefit, for which we established a deferred tax asset.
On June 7, 2019, a Ninth Circuit panel reversed the United States Tax Court’s holding in Altera Corp. v. Commissioner and upheld the portion of the Treasury regulations issued under IRC Section 482 requiring related-party participants in a cost sharing arrangement to variations relatingshare stock-based compensation costs. At this time, the taxpayer is still eligible to several factors including but not limitedprotest the decision. We have considered the issue and have recorded a $8.6 million discrete tax charge resulting from the cost sharing of prior stock-based compensation, partially offset by a reduction to changes from IRS rule making and interpretation of US tax legislation, including the 2017 Tax Cuts and Jobs Act (H.R. 1) (the "Act"), statutory tax rates reduced from 35%toll charge accrued in prior periods. We will continue to 21%, adjustmentsmonitor developments related to foreign tax regimes, interest expense limitations, mix of jurisdictional incomethe case and expense, cost and deductibility of acquisitions expenses (including integration), foreign currency gains (losses) and changes in deferred tax assets and liabilities and their valuation or utilization.the potential impact on its consolidated financial statements.
As a result of a current period loss before income taxes during the three and six months ended September 30, 2018, recurring permanent tax benefits increased the effective tax rate, where discrete prior year benefits reduced the effective tax rate on profits before tax generated during the three and six months ended September 30, 2017. For the three and six months ended September 30, 2018 the effective tax rate changed through a release of a valuation allowance for California R&D credits. Prior to the acquisition of Polycom, the Company had limited utilization over future periods and recognized a valuation allowance. With the acquisition of Polycom the California R&D tax credits will decrease resulting in full utilization. Other increases to the effective tax rate for the six-month period ended September 30, 2018 are attributable to the Act and the new mandatory charge on global intangible low-taxed income on previously unremitted foreign subsidiary earnings.
Due to the timing of the enactment and the complexity involved in applying the provisions of the Act, we made reasonable estimates of the effects and recorded provisional amounts in our financial statements as of December 31, 2017. As we collect and prepare necessary data, and interpret the Act and any additional guidance issued by the U.S. Treasury Department, the Internal Revenue Service (IRS), and other standard-setting bodies, we may make adjustments to the provisional amounts. Those adjustments may materially affect our provision for income taxes and effective tax rate in the period in which the adjustments are made. The adjustments made in the second quarter of 2018 were not significant. The accounting for the tax effects of the Act will be completed in 2018.
Included in long-term income taxes payable in the condensed consolidated balance sheets as of March 31, 2018 and September 30, 2018 were unrecognized tax benefits of $12.6 million and $26.2 million, respectively, which would favorably impact the effective tax rate in future periods if recognized. The increase is predominantly due to acquired uncertain tax benefits of Polycom. The Company’s continuing practice is to recognize interest and/or penalties related to income tax matters in income tax expense in the condensed consolidated statements of operations. The accrued interest related to unrecognized tax benefits was immaterial as of March 31, 2018 and September 30, 2018, respectively. No penalties have been accrued.
The Company believes that an adequate provision has been made for any adjustments that may result from tax examinations; however, the outcome of such examinations cannot be predicted with certainty. If any issues addressed in the tax examinations are resolved in a manner inconsistent with the Company's expectations, the Company could be required to adjust its provision for income tax in the period such resolution occurs. The timing of any resolution and/or closure of tax examinations is not certain.
FINANCIAL CONDITION
|
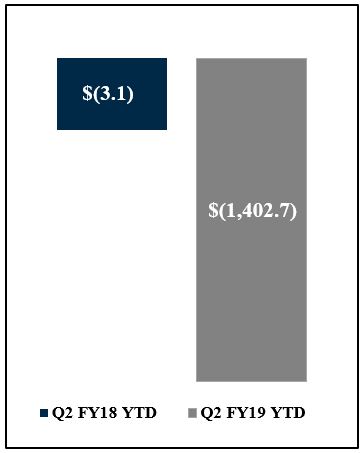
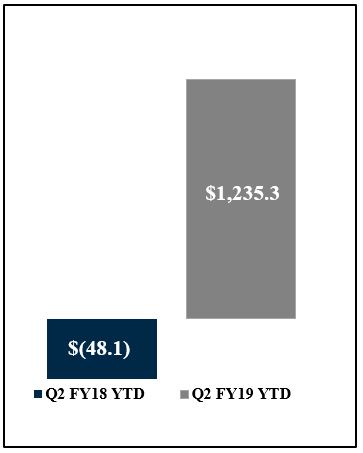
| | |
Operating Cash Flow (in millions) | Investing Cash Flow(in millions) | Financing Cash Flow (in millions) |
| | |
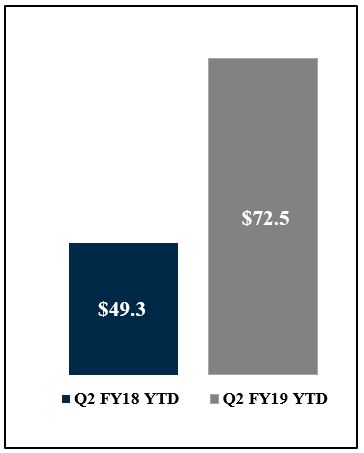
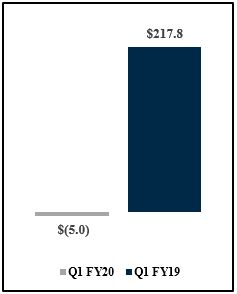
We use cash provided by operating activities as our primary source of liquidity. We expect that cash provided by operating activities will fluctuate in future periods as a result of a number of factors, including fluctuations in our revenues, the timing of compensation-related payments such as our annual bonus/variable compensation plan and Employee Stock Purchase Plan ("ESPP") plan,, integration costs related to the Acquisition, product shipments during the quarter, accounts receivable collections, inventory and supply chain management, and the timing and amount of tax and other payments.
Operating Activities
Compared to the same year ago period, net cash provided by operating activities during the sixthree months ended SeptemberJune 30, 2018 increased2019 decreased primarily due to increased salescash paid for interest payments on long-term debt, integration related expenses, and restructuring activities that did not occur in the comparative period. The decrease was partially offset by higher cash collections from customers as a result of the Acquisition which is partially offset by acquisition and integration related costs.increased revenue.
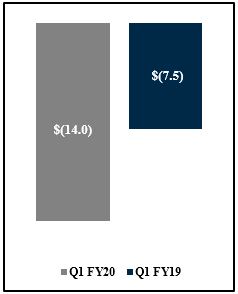
Investing Activities
Net cash used for investing activities during the sixthree months ended SeptemberJune 30, 20182019 was primarily used for the Acquisition which closed on July 2, 2018, refer to Note 3 Acquisition, Goodwill,purchase of personal property, plant and Acquired Intangible Assets. This decrease was partially offset by the proceeds from the sales of short term investments.equipment.
We estimate total capital expenditures for Fiscal Year 20192020 will be approximately $40 million to $50 million. We expect capital expenditures for the remainder of Fiscal Year 20192020 to consist primarily of ITnew information technology investments, capital investment in our manufacturing capabilities, including tooling for new products, and facilities upgrades.
Financing Activities
Net cash used for financing activities during the sixthree months ended SeptemberJune 30, 2018 increased from the prior year period as a result2019, consisted primarily of taxes paid on behalf of employees related to net share settlements of vested employee equity awards and payment of the proceeds received from the term loan facility which were partially offset by financing costs paid during the quarter.
On November 6, 2018, we announced that the Audit Committee of our Board ("the Audit Committee") had declared a cash dividend of $0.15 per share, payable on December 10, 2018 to stockholders of record at the close of business on November 20, 2018. We expect to continue paying a quarterly dividend of $0.15 per share; however, the actual declaration of dividends and the establishment of record and payment dates are subject to final determination by the Audit Committee each quarter after its review ofon our financial performance and financial position.common stock.
Liquidity and Capital Resources
Our primary discretionarysources of liquidity as of June 30, 2019, consisted of cash, requirements have historically been for repurchases of our common stockcash equivalents, and short-term investments, cash we expect to fund stockholder dividends.generate from operations, and a $100 million revolving credit facility. At SeptemberJune 30, 2018,2019, we had working capital of $316.7$214.2 million, including $305.8$206.1 million of cash, cash equivalents, and short-term investments, compared with working capital of $774.2$252.9 million, including $660.0$215.8 million of cash, cash equivalents, and short-term investments at March 31, 2018.2019. The decrease in working capital at SeptemberJune 30, 20182019 compared to March 31, 20182019 resulted from the impactnet decrease in cash and cash equivalents and a net increase in accounts payable due to payment timing.
Our cash and cash equivalents as of June 30, 2019 consisted of bank deposits with third party financial institutions. We monitor bank balances in our operating accounts and adjust the balances as appropriate. Cash balances are held throughout the world, including substantial amounts held outside of the U.S. As of June 30, 2019, of our $206.1 million of cash, cash equivalents, and short-term investments, $60.6 million was held domestically while $145.5 million was held by foreign subsidiaries, and approximately 61% was based in USD-denominated instruments. During the quarter ended June 30, 2018, we sold most of our short-term investments to generate cash to fund the Acquisition during the quarter.
Onon July 2, 2018, we completed the acquisition2018. As of allJune 30, 2019, our remaining investments were composed of the issued and outstanding shares of capital stock of Polycom. The Acquisition was consummatedMutual Funds.
During Fiscal Year 2019, in accordance with the terms and conditions of the previously announced Purchase Agreement, dated March 28, 2018, among the Company, Triangle and Polycom. At the closing of the Acquisition, Plantronics acquired Polycom for approximately $2.2 billion with the total consideration consisting of (1) 6.4 million shares of our common stock (the "Stock Consideration") and (2) $1.7 billion in cash (the "Cash Consideration"), resulting in Triangle, which was Polycom’s sole shareholder, owning approximately 16.0% of Plantronics following the acquisition. The consideration paid at closing is also subject to a working capital, tax and other adjustments. We financed the Cash Consideration by using available cash-on-hand and funds drawn from our new term loan facility which is described further below. Portions of the Stock Consideration and Cash Considerations were each deposited into separate escrow accounts to secure certain indemnification obligations of Triangle pursuant to the Purchase Agreement.
In connection with the Acquisition, we entered into a Credit Agreement with Wells Fargo Bank, National Association, as administrative agent, and the lenders party thereto (the “Credit Agreement”). The Credit Agreement replaced the Company’sour prior revolving credit facility in its entirety. The Credit Agreement provides for (i) a revolving credit facility with an initial maximum aggregate amount available of $100 million that matures in July 2023 and (ii) a $1.275 billion term loan facility due in quarterly principal installments commencing on December 28, 2018 for the aggregate principal amount funded on the Closing Date multiplied by 0.25% (subject to prepayments outlined in the Credit Agreement) and all remaining outstanding principal due at maturitythat matures in July 2025. The availability under the revolving credit facility is reduced by the amount necessary to meet our obligations under three outstanding letters of credit. We may increase the aggregate principal amount of any outstanding tranche of term loans, add one or more additional tranches of term loans and/or increase the aggregate principal amount of revolving commitments under the Credit Agreement by an aggregate amount of up to the sum of (1) $500 million, (2) an amount such that, after giving effect to the incurrence of such amount, the consolidated secured net leverage ratio (as defined in the Credit Agreement) is equal to or less than 2.75 to 1.00 and (3) the amount of certain prepayments made under the Credit Agreement from time to time. Any such increase would be subject to the satisfaction of certain conditions, including that no default or event of default be continuing under the Credit Agreement at the time of the increase and that we obtain the consent of each lender providing any such additional loans or commitments.
On July 2, 2018, the Company borrowed the full amount available under the term loan facility of $1.245 billion, net of approximately $30 million of discounts and issuance costs. Proceeds from the initial borrowing under the Credit Agreement were used to finance the acquisition of Polycom, to refinance certain debt of Polycom, to pay related fees, commissions and transaction costs. We have additional borrowing capacity under the Credit Agreement through the revolving credit facility which could be used to provide ongoing working capital and capital for other general corporate purposes of us and our subsidiaries. Our obligations under the Credit Agreement are currently guaranteed by Polycom and will from time to time be guaranteed by, subject to certain exceptions, any domestic subsidiaries that may become material in the future. Subject to certain exceptions, the Credit Agreement is secured by first-priority perfected liens and security interests in substantially all of our and each of our subsidiary guarantor personal property and will from time to time also be secured by certain material real property that we or any of our subsidiary guarantor may acquire. Borrowings under the Credit Agreement bear interest due on a monthly basis at a variable rate equal to (i) LIBOR plus a specified margin, or (ii) the base rate (which is the highest of (a) the prime rate publicly announced from time to time by Wells Fargo Bank, National Association, (b) the federal funds rate plus 0.50% or (c) the sum of 1% plus one-month LIBOR) plus a specified margin. We must also pay (i) an unused commitment fee ranging from 0.200% to 0.300% per annum ofSee Note 9, Debt, in the average daily unused portion of the aggregate revolving credit commitments under the Credit Agreement, and (ii) a per annum fee equal to (a) for each performance standby letter of credit outstanding under the Credit Agreement with respect to non-financial contractual obligations, 50% of the applicable margin over LIBOR under the revolving credit facility in effect from time to time multiplied by the daily amount available to be drawn under such letter of credit, and (b) for each other letter of credit outstanding under the Credit Agreement, the applicable margin over LIBOR under the revolving credit facility in effect from time to time multiplied by the daily amount available to be drawn for such letter of credit.
The Credit Agreement contains various restrictions and covenants, including requirements that we maintain certain financial ratios at prescribed levels for the revolving credit facility and restrictions on our ability and certain of our subsidiaries ability to consolidate or merge, create liens, incur additional indebtedness, dispose of assets, consummate acquisitions, make investments and pay dividends and other distributions. The Credit Agreement includes the following financial covenants applicableaccompanying notes to the revolving credit facility only: (i) a maximumcondensed consolidated secured net leverage ratio (defined as, with certain adjustments and exclusions, our ratio of consolidated secured indebtedness as of the end of the relevant fiscal quarter to consolidated net income before interest, taxes, depreciation, amortization, non-cash charges and certain other items (“EBITDA”) for the period of four fiscal quarters then ended) of 3.50 to 1.00 as of the last day of any fiscal quarter ending during the period from December 29, 2018 through June 29, 2019; 3.25 to 1.00 as of the last day of any fiscal quarter ending during the period from June 30, 2019 through March 28, 2020; 3.00 to 1.00 as of the last day of any fiscal quarter ending during the period from March 29, 2020 through April 3, 2021; and 2.75 to 1.00 as of the last day of any fiscal quarter ending on or after April 4, 2021; and (ii) a minimum interest coverage ratio (defined as, with certain adjustments, the ratio of our EBITDA to our consolidated interest expense to the extent paid or payable in cash) of 2.75 to 1.00 as of the last day of any fiscal quarter ending on or after December 29, 2018.The Credit Agreement also contains customary events of default. If an event of default under the Credit Agreement occurs and is continuing, then the lenders may declare any outstanding obligations under the Credit Agreement to be immediately due and payable; provided, however, that the occurrence of an event of default as a result of a breach of a financial covenant under the Credit Agreement does not constitute a default or event of default with respect to any term facility under the Credit Agreement unless and until the required revolving lenders shall have terminated their revolving commitments and declared all amounts outstanding under the revolving credit facility to be due and payable. In addition, if we or any of our subsidiary guarantor or, with certain exceptions, any other subsidiary becomes the subject of voluntary or involuntary proceedings under any bankruptcy, insolvency or similar law, then any outstanding obligations under the Credit Agreement will automatically become immediately due and payable. Loans outstanding under the Credit Agreement will bear interest at a rate of 2.00% per annum in excess of the otherwise applicable rate (i) while a payment or bankruptcy event of default exists or (ii) upon the lenders’ request, during the continuance of any other event of default.statements.
On July 30, 2018, we entered into a 4-year amortizing interest rate swap agreement with Bank of America, NA. The swap has an initial notional amount of $831 million and matures on July 31, 2022. The purpose of this swap is to hedge against changes in cash flows (interest payments) attributable to fluctuations in the contractually specified LIBOR interest rate associated with our new credit facility agreement. The swap involves the receipt of floating-rate amounts for fixed interest rate payments over the life of the agreement. We have designated this interest rate swap as a cash flow hedge. The derivative is valued based on prevailing LIBOR rate curves on the date of measurement. We also evaluate counterparty credit risk when we calculate the fair value of the swap. For additional details, refer tosee Note 13,14, Derivatives, of the accompanying notes to condensed consolidated financial statements.
The enactment of the Tax Cuts and Jobs Act (H.R. 1) (the "Act") in the U.S. on December 22, 2017, introduced, among other things, applying new taxes on certain foreign source earnings and imposed the toll charge. We have a $73.3 million toll charge liability recognized on our condensed consolidated balance sheet as of September 30, 2018, which we intend to pay over a seven-year period as permitted under the Act. With enactment of the Act, the Company is no longer asserting a position that its foreign earnings are indefinitely reinvested. In addition, we recorded a $5 million liability for state income taxes and foreign withholding taxes that will become due from the repatriation of foreign earnings. Polycom recorded a toll charge that was paid in October 2018 with the filing of its 2017 tax return. For additional details, refer to Note 14, Income Taxes, of the accompanying notes to condensed consolidated financial statements.
Our cash and cash equivalents as of September 30, 2018 consisted of bank deposits with third party financial institutions. We monitor bank balances in our operating accounts and adjust the balances as appropriate. Cash balances are held throughout the world, including substantial amounts held outside of the U.S. As of September 30, 2018, of our $305.8 million of cash, cash equivalents, and short-term investments, $138.3 million was held domestically while $167.5 million was held by foreign subsidiaries, approximately 77% of which was based in USD-denominated instruments. During the quarter ended June 30, 2018, we sold most of our short-term investments to generate cash used to fund the Acquisition which was finalized on July 2, 2018. As of September 30, 2018, our remaining investments were composed of Mutual Funds.
From time to time, our Board of Directors ("the Board") authorizes programs under which we may repurchase shares of our common stock in the open market or through privately negotiated transactions, including accelerated stock repurchase agreements. As of September 30, 2018, there remained 730,105 shares authorized for repurchase under the stock repurchase program approved by the Board on July 27, 2017. We have temporarily curtailed open market common stock repurchases to help us manage our liquidity and leverage ratios resulting from the Acquisition. We had no retirements of treasury stock in the first quarter of Fiscal Years 2018 and 2019. Refer to Note 11, Common Stock Repurchases, in the accompanying notes to the condensed consolidated financial statements.
During the year ended March 31,Year 2016, we obtained $488.4 million from debt financing, net of issuance costs. The debt matures on May 31, 2023 and bears interest at a rate of 5.50% per annum, payable semi-annually on May 15 and November 15 of each year. Refer toSee Note 8, 9, Debt, in the accompanying notes to the condensed consolidated financial statements.
From time to time, our Board of Directors ("the Board") authorizes programs under which we may repurchase shares of our common stock in the open market or through privately negotiated transactions, including accelerated stock repurchase agreements. On November 28, 2018, the Board approved a 1 million share repurchase program expanding our capacity to repurchase shares to approximately 1.7 million shares. During the first quarter of Fiscal Year 2020, we did not repurchase any shares of our common stock. As of June 30, 2019, there remained 1,369,014 shares authorized for repurchase under the existing stock repurchase program. See Note 12, Common Stock Repurchases, in the accompanying notes to the condensed consolidated financial statements.
Our liquidity, capital resources, and results of operations in any period could be affected by repurchases of our common stock, the payment of cash dividends, the exercise of outstanding stock options, restricted stock grants under stock plans, and the issuance of common stock under our ESPP. We expect theEmployee Stock Purchase Plan ("ESPP"). The Acquisition to affecthas negatively affected our liquidity and leverage ratios and we plan toratios. To reduce our debt leverage ratios, by prioritizingwe expect to prioritize the repayment of the debt obtained to financeunder the Acquisition andCredit Agreement.
Additionally, the temporary curtailment of open market common stock repurchases. The Acquisition impacted our cash conversion cycle due to Polycom's use of third-party partner financing and early payment discounts to drive down cash collection cycles.
We are still assessing these changes as we integrate Polycom into our business. Wealso receive cash from the exercise of outstanding stock options under our stock plan and the issuance of shares under our ESPP. However, the resulting increase in the number of outstanding shares from these equity grants and issuances could affect our earnings per share. We cannot predict the timing or amount of proceeds from the sale or exercise of these securities or whether they will be exercised, forfeited, canceled, or will expire.
On August 6, 2019, we announced that the Audit Committee of our Board declared a cash dividend of $0.15 per share, payable on September 10, 2019 to stockholders of record at the close of business on August 20, 2019.
We believe that our current cash and cash equivalents, cash provided by operations, and the availability of additional funds under the Credit Agreement will be sufficient to fund operations for at least the next 12 months; however, any projections of future financial needs and sources of working capital are subject to uncertainty. Readers are cautioned to review the risks, uncertainties, and assumptions set forth in this Quarterly Report on Form 10-Q, including the section entitled "Certain"Certain Forward-Looking Information"Information" and the risk factors set forth in our Annual Report on Form 10-K for the fiscal year ended March 31, 2018,2019, filed with the SEC on May 9, 2018,17, 2019, and other periodic filings with the SEC, any of which could affect our estimates for future financial needs and sources of working capital.
OFF BALANCE SHEET ARRANGEMENTS AND CONTRACTUAL OBLIGATIONS
We have not entered into any transactions with unconsolidated entities whereby we have financial guarantees, subordinated retained interests, derivative instruments, or other contingent arrangements that expose us to material continuing risks, contingent liabilities, or any other obligation under a variable interest in an unconsolidated entity that provides us with financing and liquidity support, market risk, or credit risk support.
A substantial portion of the raw materials, components, and subassemblies used in our products are provided by our suppliers on a consignment basis. These consigned inventories are not recorded on our consolidated balance sheet until we take title to the raw materials, components, and subassemblies, which occurs when they are consumed in the production process. Prior to consumption in the production process, our suppliers bear the risk of loss and retain title to the consigned inventory. The terms of the agreements allow the Companyus to return parts in excess of maximum order quantities to the suppliers at the supplier’s expense. Returns for other reasons are negotiated with the suppliers on a case-by-case basis and to date have been immaterial. If our suppliers were to discontinue financing consigned inventory, it would require us to make cash outlays and we could incur expenses which, if material, could negatively affect our business and financial results. As of June 30, 2019, and March 31, 2018 and September 30, 2018,2019, we had off-balance sheet consigned inventories of $48.8$48.2 million and $41.5$47.1 million, respectively.
Unconditional Purchase Obligations
We use several contract manufacturers to manufacture raw materials, components, and subassemblies for our products. We provide these contract manufacturers with demand information that typically covers periods up to 13 weeks, and they use this information to acquire components and build products. We also obtain individual components for our products from a wide variety of individual suppliers. Consistent with industry practice, we acquire components through a combination of purchase orders, supplier contracts, and open orders based on projected demand information. As of SeptemberJune 30, 2018,2019, we had outstanding off-balance sheet third-party manufacturing, component purchase, and other general and administrative commitments of $446.1$406.4 million, including the off-balance sheet consigned inventories of $41.5$48.2 million as discussed above.
Polycom Acquisition
On July 2, 2018,above, of which we completed the acquisition of Polycom, referexpect to Note 3, Acquisition, Goodwill, and Acquired Intangible Assets,consume in the accompanying footnotes to the condensed consolidated financial statements. As a resultnormal course of the Acquisition, in addition to the contractual obligation of Plantronics described in our Annual Report on Form 10-K for the fiscal year ended March 31, 2018, we became subject to the following future contractual obligations as of September 30, 2018:business.
|
| | | | | | | | | | | | | | | | | | | | |
| | | Payments Due by Period |
| (in thousands) | | Total | | Less than 1 year | | 1-3 years | | 4-5 years | | More than 5 years |
Operating leases (1) | | $ | 41,091 |
| | $ | 15,336 |
| | $ | 25,258 |
| | $ | 497 |
| | $ | — |
|
Unconditional purchase obligations (2) | | 252,446 |
| | 245,013 |
| | 7,433 |
| | — |
| | — |
|
Long term debt (Term Loan Facility) (3) | | 1,275,000 |
| | 9,563 |
| | 28,687 |
| | 25,500 |
| | 1,211,250 |
|
| Total contractual cash obligations | | $ | 1,568,537 |
| | $ | 269,912 |
| | $ | 61,378 |
| | $ | 25,997 |
| | $ | 1,211,250 |
|
(1) We acquired Polycom's lease obligations for certain office facilities and equipment under non-cancelable operating leases expiring through our Fiscal Year 2023. In addition to the net minimum lease payments noted above, we are contractually obligated to pay certain operating expenses during the term of the lease such as maintenance, taxes and insurance. Included in the lease obligations acquired are Polycom’s sublease receipts, which have been netted against the gross lease payments above to arrive at our net minimum lease payments.Certain of these leases provide for renewal options and we may exercise the renewal options.
(2) Refer to Unconditional Purchase Obligations note above.
(3) On July 2, 2018, the Company borrowed the full amount available under the term loan facility of $1.245 billion, net of approximately $30 million of discounts and issuance costs. Proceeds from the initial borrowing under the Credit Agreement were used to finance the acquisition of Polycom, to refinance certain debt of Polycom, to pay related fees, commissions and transaction costs. We owe quarterly principal installments commencing on December 28, 2018 for the aggregate principal amount funded on July 2, 2018 multiplied by 0.25% (subject to prepayments outlined in the Credit Agreement) and all remaining outstanding principal due at maturity in July 2025.
Except as described above, there have been no material changes in our contractual obligations as described in our Annual Report on Form 10-K for the fiscal year ended March 31, 2018.2019.
CRITICAL ACCOUNTING ESTIMATES
For a complete description of what we believe to be the critical accounting estimates used in the preparation of our condensed consolidated financial statements, refer to our Annual Report on Form 10-K for the fiscal year ended March 31, 2018,2019, filed with the SEC on May 9, 2018. 17, 2019.
Refer to Note 2, Recent Accounting Pronouncements, of the accompanying notes to the condensed consolidated financial statements for details regarding the adoption of the contracts with customers (Topic 606) accounting guidance in the first quarter of Fiscal Year 2019.
Refer to Note 3, Acquisition, Goodwill, and Acquired Intangible Assets, of the accompanying notes to the condensed consolidated financial statements for critical accounting estimates used in the acquisition of Polycom completed on July 2, 2018.
Income Taxes
Management assesses the available positive and negative evidence to estimate if sufficient future taxable income will be generated to use the existing deferred tax assets. The amount of the deferred tax asset considered realizable, however, could be adjusted if estimates of future taxable income during the carryforward period are reduced or increased.
Under the acquisition method of accounting for business combinations, if we identify changes to acquired deferred tax asset valuation allowances or liabilities related to uncertain tax positions during the measurement period and they relate to new information obtained about facts and circumstances that existed as of the acquisition date, those changes are considered a measurement period adjustment, and we record the offset to goodwill. We record all other changes to deferred tax asset valuation allowances and liabilities related to uncertain tax positions in current period income tax expense.
Except as described above, there have been no changes to our critical accounting estimates during the sixthree months ended SeptemberJune 30, 2018.2019.
Recent Accounting Pronouncements
For more information regarding the Recent Accounting Pronouncements that may impact us, refer tosee Note 2, Recent Accounting Pronouncements, of the accompanying notes to the condensed consolidated financial statements.
Financial Statements (Unaudited)
PLANTRONICS, INC.
CONDENSED CONSOLIDATED BALANCE SHEETS
(in thousands)
| | | | March 31,
2018 | | September 30,
2018 | June 30,
2019 | | March 31,
2019 |
| ASSETS | | | | | | |
| Current assets: | | | | | | |
| Cash and cash equivalents | $ | 390,661 |
| | $ | 291,086 |
| $ | 191,904 |
| | $ | 202,509 |
|
| Short-term investments | 269,313 |
| | 14,705 |
| 14,169 |
| | 13,332 |
|
| Accounts receivable, net | 152,888 |
| | 354,066 |
| 318,235 |
| | 337,671 |
|
| Inventory, net | 68,276 |
| | 156,908 |
| 217,424 |
| | 177,146 |
|
| Other current assets | 18,588 |
| | 57,584 |
| 47,430 |
| | 50,488 |
|
| Total current assets | 899,726 |
| | 874,349 |
| 789,162 |
| | 781,146 |
|
| Property, plant, and equipment, net | 142,129 |
| | 216,802 |
| 196,376 |
| | 204,826 |
|
| Goodwill | 15,498 |
| | 1,334,534 |
| 1,279,897 |
| | 1,278,380 |
|
| Purchased intangibles, net | — |
| | 914,455 |
| 780,348 |
| | 825,675 |
|
| Deferred tax assets | 17,950 |
| | 5,320 |
| 3,182 |
| | 5,567 |
|
| Other assets | 1,584 |
| | 24,647 |
| 73,066 |
| | 20,941 |
|
| Total assets | $ | 1,076,887 |
| | $ | 3,370,107 |
| $ | 3,122,031 |
| | $ | 3,116,535 |
|
| | | | | | | |
| LIABILITIES AND STOCKHOLDERS' EQUITY | |
| | |
| |
| | |
|
| Current liabilities: | |
| | |
| |
| | |
|
| Accounts payable | $ | 45,417 |
| | $ | 149,917 |
| $ | 166,618 |
| | $ | 129,514 |
|
| Accrued liabilities | 80,097 |
| | 407,777 |
| 408,306 |
| | 398,715 |
|
| Total current liabilities | 125,514 |
| | 557,694 |
| 574,924 |
| | 528,229 |
|
| Long term debt, net of issuance costs | 492,509 |
| | 1,726,241 |
| 1,642,163 |
| | 1,640,801 |
|
| Deferred tax liability | 1,976 |
| | 115,887 |
| |
| Long-term income taxes payable | 87,328 |
| | 95,228 |
| 95,573 |
| | 83,121 |
|
| Other long-term liabilities | 16,590 |
| | 84,997 |
| 139,873 |
| | 142,697 |
|
| Total liabilities | 723,917 |
| | 2,580,047 |
| 2,452,533 |
| | 2,394,848 |
|
| Commitments and contingencies (Note 7) |
|
| |
|
| |
| Commitments and contingencies (Note 8) | |
|
| |
|
|
| Stockholders' equity: | |
| | |
| |
| | |
|
| Common stock | 816 |
| | 884 |
| 887 |
| | 884 |
|
| Additional paid-in capital | 876,645 |
| | 1,404,713 |
| 1,445,097 |
| | 1,431,607 |
|
| Accumulated other comprehensive income | 2,870 |
| | 5,667 |
| |
| Accumulated other comprehensive loss | | (6,628 | ) | | (475 | ) |
| Retained earnings | 299,066 |
| | 218,565 |
| 92,437 |
| | 143,344 |
|
| Total stockholders' equity before treasury stock | 1,179,397 |
| | 1,629,829 |
| 1,531,793 |
| | 1,575,360 |
|
| Less: Treasury stock, at cost | (826,427 | ) | | (839,769 | ) | (862,295 | ) | | (853,673 | ) |
| Total stockholders' equity | 352,970 |
| | 790,060 |
| 669,498 |
| | 721,687 |
|
| Total liabilities and stockholders' equity | $ | 1,076,887 |
| | $ | 3,370,107 |
| $ | 3,122,031 |
| | $ | 3,116,535 |
|
The accompanying notes are an integral part of these condensed consolidated financial statements.
PLANTRONICS, INC.
CONDENSED CONSOLIDATED STATEMENTS OF OPERATIONS
(in thousands, except per share data)
(Unaudited)
| | | | Three Months Ended September 30, | | Six Months Ended September 30, | Three Months Ended June 30, |
| | 2017 | | 2018 | | 2017 | | 2018 | 2019 | | 2018 |
| Net revenues | | | | | | | | | | |
| Net product revenues | $ | 210,300 |
| | $ | 435,262 |
| | $ | 414,226 |
| | $ | 656,571 |
| $ | 382,745 |
| | $ | 221,309 |
|
| Net service revenues | — |
| | 47,807 |
| | — |
| | 47,807 |
| 65,022 |
| | — |
|
| Total net revenues | 210,300 |
| | 483,069 |
| | 414,226 |
| | 704,378 |
| 447,767 |
| | 221,309 |
|
| Cost of revenues | | | | | | | | | | |
| Cost of product revenues | 102,668 |
| | 305,477 |
| | 203,311 |
| | 416,943 |
| 208,616 |
| | 111,466 |
|
| Cost of service revenues | — |
| | 24,963 |
| | — |
| | 24,963 |
| 26,505 |
| | — |
|
| Total cost of revenues | 102,668 |
| | 330,440 |
| | 203,311 |
| | 441,906 |
| 235,121 |
| | 111,466 |
|
| Gross profit | 107,632 |
| | 152,629 |
| | 210,915 |
| | 262,472 |
| 212,646 |
| | 109,843 |
|
| Operating expenses: | | | | | | | | | | |
| Research, development, and engineering | 19,932 |
| | 57,047 |
| | 41,145 |
| | 80,748 |
| 59,524 |
| | 23,701 |
|
| Selling, general, and administrative | 57,696 |
| | 174,297 |
| | 113,929 |
| | 238,500 |
| 163,608 |
| | 64,203 |
|
| Gain, net from litigation settlements | (104 | ) | | — |
| | (280 | ) | | (30 | ) | (1,162 | ) | | (30 | ) |
| Restructuring and other related charges (credits) | (51 | ) | | 7,261 |
| | 2,522 |
| | 8,581 |
| |
| Restructuring and other related charges | | 19,525 |
| | 1,320 |
|
| Total operating expenses | 77,473 |
| | 238,605 |
| | 157,316 |
| | 327,799 |
| 241,495 |
| | 89,194 |
|
| Operating income (loss) | 30,159 |
| | (85,976 | ) | | 53,599 |
| | (65,327 | ) | (28,849 | ) | | 20,649 |
|
| Interest expense | (7,260 | ) | | (23,893 | ) | | (14,563 | ) | | (31,220 | ) | (23,932 | ) | | (7,327 | ) |
| Other non-operating income, net | 1,826 |
| | 1,610 |
| | 2,740 |
| | 3,606 |
| 333 |
| | 1,996 |
|
| Income (Loss) before income taxes | 24,725 |
| | (108,259 | ) | | 41,776 |
| | (92,941 | ) | |
| Income (loss) before income taxes | | (52,448 | ) | | 15,318 |
|
| Income tax expense (benefit) | 4,772 |
| | (21,550 | ) | | 2,995 |
| | (20,703 | ) | (7,577 | ) | | 847 |
|
| Net income (loss) | $ | 19,953 |
| | $ | (86,709 | ) | | $ | 38,781 |
| | $ | (72,238 | ) | $ | (44,871 | ) | | $ | 14,471 |
|
| | | | | | | | | | | |
| Earnings (Loss) per common share: | | | | | | | | |
| Income (loss) per common share: | | | | |
| Basic | $ | 0.59 |
| | $ | (2.21 | ) | | $ | 1.16 |
| | $ | (2.01 | ) | $ | (1.14 | ) | | $ | 0.43 |
|
| Diluted | $ | 0.59 |
| | $ | (2.21 | ) | | $ | 1.14 |
| | $ | (2.01 | ) | $ | (1.14 | ) | | $ | 0.42 |
|
| | | | | | | | | | | |
| Shares used in computing earnings (loss) per common share: | | | | | | | | |
| Shares used in computing loss per common share: | | | | |
| Basic | 32,570 |
| | 39,281 |
| | 32,538 |
| | 35,938 |
| 39,239 |
| | 32,594 |
|
| Diluted | 32,809 |
| | 39,281 |
| | 33,111 |
| | 35,938 |
| 39,239 |
| | 33,534 |
|
| | | | | | | | | | | |
| Cash dividends declared per common share | $ | 0.15 |
| | $ | 0.15 |
| | $ | 0.30 |
| | $ | 0.30 |
| |
The accompanying notes are an integral part of these condensed consolidated financial statements.
PLANTRONICS, INC.
CONDENSED CONSOLIDATED STATEMENTS OF COMPREHENSIVE INCOME (LOSS)
(in thousands)
(Unaudited)
| | | | Three Months Ended September 30, | | Six Months Ended September 30, | Three Months Ended June 30, |
| | 2017 | | 2018 | | 2017 | | 2018 | 2019 | | 2018 |
| Net income (loss) | $ | 19,953 |
| | $ | (86,709 | ) | | $ | 38,781 |
| | $ | (72,238 | ) | $ | (44,871 | ) | | $ | 14,471 |
|
| Other comprehensive income (loss): | | | | | | | | | | |
| Foreign currency translation adjustments | 57 |
| | (1,815 | ) | | 257 |
| | (1,815 | ) | (219 | ) | | — |
|
| Unrealized gains (losses) on cash flow hedges: | | | | | | | | | | |
| Unrealized cash flow hedge gains (losses) arising during the period | (2,302 | ) | | 813 |
| | (4,647 | ) | | 4,769 |
| (6,704 | ) | | 3,956 |
|
| Net (gains) losses reclassified into income for revenue hedges | 1,131 |
| | (900 | ) | | 1,149 |
| | (1,149 | ) | (1,359 | ) | | (249 | ) |
| Net (gains) losses reclassified into income for cost of revenue hedges | (174 | ) | | — |
| | (132 | ) | | (79 | ) | (104 | ) | | (79 | ) |
| Net (gains) losses reclassified into income for interest rate swaps | — |
| | 977 |
| | — |
| | 977 |
| 652 |
| | — |
|
| Net unrealized gains (losses) on cash flow hedges | (1,345 | ) | | 890 |
| | (3,630 | ) | | 4,518 |
| (7,515 | ) | | 3,628 |
|
| Unrealized gains (losses) on investments: | | | | | | | | | | |
| Unrealized holding gains (losses) during the period | 133 |
| | — |
| | 209 |
| | 198 |
| — |
| | 198 |
|
| | | | | | | | | | | |
| Aggregate income tax benefit (expense) of the above items | (19 | ) | | 8 |
| | 1 |
| | (102 | ) | 1,581 |
| | (110 | ) |
| Other comprehensive income (loss) | (1,174 | ) | | (917 | ) | | (3,163 | ) | | 2,799 |
| (6,153 | ) | | 3,716 |
|
| Comprehensive income (loss) | $ | 18,779 |
| | $ | (87,626 | ) | | $ | 35,618 |
| | $ | (69,439 | ) | $ | (51,024 | ) | | $ | 18,187 |
|
The accompanying notes are an integral part of these condensed consolidated financial statements.
PLANTRONICS, INC.
CONDENSED CONSOLIDATED STATEMENTS OF CASH FLOWS
(in thousands)
|
| | | | | | | |
| | Three Months Ended |
| | June 30, |
| | 2019 | | 2018 |
| CASH FLOWS FROM OPERATING ACTIVITIES | | | |
| Net income (loss) | $ | (44,871 | ) | | $ | 14,471 |
|
| Adjustments to reconcile net income (loss) to net cash provided by operating activities: | | | |
| Depreciation and amortization | 57,698 |
| | 5,248 |
|
| Amortization of debt issuance costs | 1,361 |
| | 362 |
|
| Stock-based compensation | 12,904 |
| | 8,150 |
|
| Deferred income taxes | (33,145 | ) | | 4,632 |
|
| Provision for excess and obsolete inventories | 1,760 |
| | 612 |
|
| Restructuring and related charges (credits) | 19,525 |
| | 1,320 |
|
| Cash payments for restructuring charges | (17,658 | ) | | (835 | ) |
| Other operating activities | 1,965 |
| | (274 | ) |
| Changes in assets and liabilities, net of acquisition: | | | |
|
| Accounts receivable, net | 21,445 |
| | 5,302 |
|
| Inventory, net | (42,309 | ) | | (400 | ) |
| Current and other assets | 15,498 |
| | 2,981 |
|
| Accounts payable | 36,392 |
| | 5,688 |
|
| Accrued liabilities | (43,784 | ) | | (7,300 | ) |
| Income taxes | 21,568 |
| | (7,875 | ) |
| Cash provided by operating activities | 8,349 |
| | 32,082 |
|
| CASH FLOWS FROM INVESTING ACTIVITIES | | | |
|
| Proceeds from sales of investments | 170 |
| | 124,640 |
|
| Proceeds from maturities of investments | — |
| | 131,017 |
|
| Purchase of investments | (651 | ) | | (394 | ) |
| Cash paid for acquisition, net of cash acquired | — |
| | (33,550 | ) |
| Capital expenditures | (4,507 | ) | | (3,868 | ) |
| Cash (used for) provided by investing activities | (4,988 | ) | | 217,845 |
|
| CASH FLOWS FROM FINANCING ACTIVITIES | | | |
|
| Employees' tax withheld and paid for restricted stock and restricted stock units | (8,621 | ) | | (13,035 | ) |
| Proceeds from issuances under stock-based compensation plans | 589 |
| | 10,558 |
|
| Payment of cash dividends | (5,940 | ) | | (5,014 | ) |
| Cash (used for) by financing activities | (13,972 | ) | | (7,491 | ) |
| Effect of exchange rate changes on cash and cash equivalents | 6 |
| | (2,055 | ) |
| Net increase (decrease) in cash and cash equivalents | (10,605 | ) | | 240,381 |
|
| Cash and cash equivalents at beginning of period | 202,509 |
| | 390,661 |
|
| Cash and cash equivalents at end of period | $ | 191,904 |
| | $ | 631,042 |
|
| SUPPLEMENTAL DISCLOSURES | | | |
| Cash paid for income taxes | $ | 2,755 |
| | $ | 30,902 |
|
| Cash paid for interest | $ | 29,203 |
| | $ | 54,386 |
|
The accompanying notes are an integral part of these condensed consolidated financial statements.
PLANTRONICS, INC.
CONDENSED CONSOLIDATED STATEMENTS OF CASH FLOWSSTOCKHOLDERS' EQUITY
(in thousands)
(Unaudited)
|
| | | | | | | |
| | Six Months Ended |
| | September 30, |
| | 2017 | | 2018 |
| CASH FLOWS FROM OPERATING ACTIVITIES | | | |
| Net income (loss) | $ | 38,781 |
| | $ | (72,238 | ) |
| Adjustments to reconcile net income (loss) to net cash provided by operating activities: | | | |
| Depreciation and amortization | 10,743 |
| | 87,646 |
|
| Amortization of debt issuance costs | 725 |
| | 1,769 |
|
| Stock-based compensation | 18,018 |
| | 18,990 |
|
| Deferred income taxes | 4,384 |
| | (18,056 | ) |
| Provision for excess and obsolete inventories | 900 |
| | 2,808 |
|
| Restructuring and related charges (credits) | 2,522 |
| | 8,581 |
|
| Cash payments for restructuring charges | (2,429 | ) | | (7,395 | ) |
| Other operating activities | (1,141 | ) | | 9,010 |
|
| Changes in assets and liabilities, net of acquisition: | | | |
|
| Accounts receivable, net | 1,246 |
| | (23,863 | ) |
| Inventory, net | (5,844 | ) | | 16,380 |
|
| Current and other assets | (4,539 | ) | | (2,693 | ) |
| Accounts payable | 3,205 |
| | 20,627 |
|
| Accrued liabilities | (9,388 | ) | | 39,505 |
|
| Income taxes | (7,890 | ) | | (8,521 | ) |
| Cash provided by operating activities | 49,293 |
| | 72,550 |
|
| CASH FLOWS FROM INVESTING ACTIVITIES | | | |
|
| Proceeds from sales of investments | 30,895 |
| | 124,640 |
|
| Proceeds from maturities of investments | 106,661 |
| | 131,017 |
|
| Purchase of investments | (133,949 | ) | | (536 | ) |
| Cash paid for acquisition, net of cash acquired | — |
| | (1,650,242 | ) |
| Capital expenditures | (6,752 | ) | | (7,535 | ) |
| Cash used for investing activities | (3,145 | ) | | (1,402,656 | ) |
| CASH FLOWS FROM FINANCING ACTIVITIES | | | |
|
| Repurchase of common stock | (39,222 | ) | | — |
|
| Employees' tax withheld and paid for restricted stock and restricted stock units | (10,789 | ) | | (13,342 | ) |
| Proceeds from issuances under stock-based compensation plans | 11,950 |
| | 14,872 |
|
| Proceeds from debt issuance, net | — |
| | 1,244,713 |
|
| Payment of cash dividends | (10,057 | ) | | (10,982 | ) |
| Cash (used for) provided by financing activities | (48,118 | ) | | 1,235,261 |
|
| Effect of exchange rate changes on cash and cash equivalents | 3,116 |
| | (4,730 | ) |
| Net increase (decrease) in cash and cash equivalents | 1,146 |
| | (99,575 | ) |
| Cash and cash equivalents at beginning of period | 301,970 |
| | 390,661 |
|
| Cash and cash equivalents at end of period | $ | 303,116 |
| | $ | 291,086 |
|
| SUPPLEMENTAL DISCLOSURES | | | |
| Cash paid for income taxes | $ | 6,816 |
| | $ | 14,047 |
|
| Cash paid for interest | $ | 13,936 |
| | $ | 29,244 |
|
|
| | | | | | | | | | | | | | | | | | | | | | | | | |
| | Common Stock | | Additional Paid-In | | Accumulated Other Comprehensive | | Retained | | Treasury | | Total Stockholders' |
| | Shares | | Amount | | Capital | | Income | | Earnings | | Stock | | Equity |
| Balances at March 31, 2018 | 33,251 |
| | 816 |
| | 876,645 |
| | 2,870 |
| | 299,066 |
| | (826,427 | ) | | 352,970 |
|
| Net income | — |
| | — |
| | — |
| | — |
| | 14,471 |
| | — |
| | 14,471 |
|
| Net unrealized gains (losses) on cash flow hedges, net of tax | — |
| | — |
| | — |
| | 3,839 |
| | — |
| | — |
| | 3,839 |
|
| Proceeds from issuances under stock-based compensation plans | 361 |
| | 3 |
| | 10,555 |
| | — |
| | — |
| | — |
| | 10,558 |
|
| Repurchase of restricted common stock | (53 | ) | | | | | | — |
| | — |
| | — |
| | — |
|
| Cash dividends | — |
| | — |
| | | | — |
| | (5,014 | ) | | — |
| | (5,014 | ) |
| Stock-based compensation | — |
| | — |
| | 8,150 |
| | | | — |
| | — |
| | 8,150 |
|
| Employees' tax withheld and paid for restricted stock and restricted stock units | (187 | ) | | — |
| | — |
| | — |
| | — |
| | (13,035 | ) | | (13,035 | ) |
| Impact of new accounting standards adoption | — |
| | — |
| | — |
| | (124 | ) | | 2,718 |
| | — |
| | 2,594 |
|
| Balances at June 30, 2018 | 33,372 |
| | $ | 819 |
| | $ | 895,350 |
| | $ | 6,585 |
| | $ | 311,241 |
| | $ | (839,462 | ) | | 374,533 |
|
|
| | | | | | | | | | | | | | | | | | | | | | | | | |
| | Common Stock | | Additional Paid-In | | Accumulated Other Comprehensive | | Retained | | Treasury | | Total Stockholders' |
| | Shares | | Amount | | Capital | | Income | | Earnings | | Stock | | Equity |
| Balances at March 31, 2019 | 39,518 |
| | 884 |
| | 1,431,608 |
| | (475 | ) | | 143,344 |
| | (853,674 | ) | | 721,687 |
|
| Net loss | — |
| | — |
| | — |
| | — |
| | (44,871 | ) | | — |
| | (44,871 | ) |
| Foreign currency translation adjustments | — |
| | — |
| | — |
| | (219 | ) | | — |
| | — |
| | (219 | ) |
| Net unrealized gains (losses) on cash flow hedges, net of tax | — |
| | — |
| | — |
| | (5,934 | ) | | — |
| | — |
| | (5,934 | ) |
| Proceeds from issuances under stock-based compensation plans | 271 |
| | 3 |
| | 586 |
| | — |
| | — |
| | — |
| | 589 |
|
| Repurchase of restricted common stock | (20 | ) | | — |
| | — |
| | — |
| | — |
| | — |
| | — |
|
| Cash dividends | — |
| | — |
| | — |
| | — |
| | (5,940 | ) | | — |
| | (5,940 | ) |
| Stock-based compensation | — |
| | — |
| | 12,904 |
| | — |
| | — |
| | — |
| | 12,904 |
|
| Employees' tax withheld and paid for restricted stock and restricted stock units | (191 | ) | | — |
| | — |
| | — |
| | — |
| | (8,622 | ) | | (8,622 | ) |
| Impact of new accounting standards adoption | — |
| | — |
| | — |
| | — |
| | (89 | ) | | — |
| | (89 | ) |
| Other equity changes | — |
| | — |
| | — |
| | — |
| | (7 | ) | | — |
| | (7 | ) |
| Balances at June 30, 2019 | 39,578 |
| | $ | 887 |
| | $ | 1,445,098 |
| | $ | (6,628 | ) | | $ | 92,437 |
| | $ | (862,296 | ) | | 669,498 |
|
The accompanying notes are an integral part of these condensed consolidated financial statements.
PLANTRONICS, INC.
NOTES TO CONDENSED CONSOLIDATED FINANCIAL STATEMENTS
(Unaudited)
1. BASIS OF PRESENTATION
In the opinion of management, with the exception of the adoption of ASC 842, Leases as discussed below, the accompanying unaudited condensed consolidated financial statements ("financial statements") of Plantronics, Inc. ("Plantronics" or "thethe Company") have been prepared on a basis materially consistent with the Company's March 31, 20182019 audited consolidated financial statements and include all adjustments, consisting of normal recurring adjustments, necessary to fairly state the information set forth herein. Certain information and footnote disclosures normally included in financial statements prepared pursuant to the rules and regulations of the Securities and Exchange Commission ("SEC") applicable to interim financial information and in accordance with accounting principles generally accepted in the United States of America ("U.S. GAAP") have been condensed or omitted pursuant to such rules and regulations. The financial statements should be read in conjunction with the audited consolidated financial statements and notes thereto included in the Company's Annual Report on Form 10-K for the fiscal year ended March 31, 2018,2019, which was filed with the SEC on May 9, 2018.17, 2019. The results of operations for the interim period ended SeptemberJune 30, 20182019 are not necessarily indicative of the results to be expected for the entire fiscal year or any future period.
The financial results of Polycom have been included in ourthe Company's consolidated financial statements from the date of acquisition on July 2, 2018, refer tosee Note 3, Acquisition Acquisition, Goodwill, and Acquired Intangible Assets for details.
The financial statements include the accounts of the Company and its wholly owned subsidiaries. All intercompany balances and transactions have been eliminated.
The Company’s fiscal year ends on the Saturday closest to the last day of March. The Company’s current and prior fiscal years end on March 30, 201928, 2020 and March 31, 2018,30, 2019, respectively, and both consist of 52 weeks. The Company’s results of operations for the three and six months ended SeptemberJune 29, 20182019 and SeptemberJune 30, 20172018 both contain 13 weeks and 26 weeks. For purposes of presentation, the Company has indicated its accounting year as ending on March 31 and its interim quarterly periods as ending on the applicable calendar month end.
Refer toSee Note 2, Recent Accounting Pronouncements, for details regarding reclassifications made inrecognition of a lease liability and corresponding right-of-use ("ROU") asset on the balance sheet of the Company's condensed consolidated financial statements pursuant to the adoption of the contracts with customers (Topic 606)Topic 842, Leases accounting guidance in the first quarter of Fiscal Year 2019.2020.
Foreign Operations and Currency Translation
AfterDuring the Polycom acquisition,quarter ended June 30, 2019, as a result of a change to the Company's operating structure, the Company determined the functional currency of its China subsidiary is now the U.S. Dollar (“USD") for all but one of its international subsidiaries located in China. The resulting cumulative translation adjustments related to this subsidiary are immaterial and are included as a component of stockholders' equity in accumulated other comprehensive income.. Assets and liabilities denominated in currencies other than the USD, or for China, the Chinese Yuan Renminbi (“CNY”), are re-measured at the period-end rates for monetary assets and liabilities and at historical rates for non-monetary assets and liabilities. Revenues and expenses are re-measured at average monthly rates, which approximate actual rates. Currency transaction gains and losses are recognized in other non-operating income and (expense), net.
Related Party
The Company's vendor, Digital River, Inc. ("Digital River"), with whom the Company had an existing relationship prior to the acquisition of Polycom, Inc. ("Polycom"), is a wholly owned subsidiary of Siris Capital Group, LLC ("Siris"). Triangle Private Holdings II, LLC ("Triangle") is also a wholly owned subsidiary of Siris. Immediately prior to the Company's acquisition of Polycom on July 2, 2018, Triangle was Polycom’s sole shareholder and, pursuant to the Company's stock purchase agreement with Triangle, currently owns approximately 16.0% of Plantronics' issued and outstanding stock. Additionally, in connection with the acquisition of Polycom, the Company entered into a Stockholder Agreement with Triangle pursuant to which it agreed to appoint two individuals to the Company's board of directors nominated by Triangle. As a consequence of these relationships, Digital River is considered a related party under Topic 850. The Company had immaterial transactions with Digital River during the six months ended September 30, 2018.
Accounts Receivable Financing
After the Polycom acquisition, the Company assumed a financing agreement with an unrelated third-party financing company (the "Financing Agreement") whereby the Company offers distributors and resellers direct or indirect financing on their purchases of Polycom's products and services. In return, the Company agrees to pay the financing company a fee based on a pre-defined percentage of the transaction amount financed. In certain instances, these financing arrangements result in a transfer of our receivables, without recourse, to the financing company. If the transaction meets the applicable criteria under Topic 860 and is accounted for as a sale of financial assets, the related accounts receivable is excluded from the balance sheet upon receipt of the third-party financing company's payment remittance. In certain legal jurisdictions, the arrangements that involve maintenance services or products bundled with maintenance at one price do not qualify as sale of financial assets in accordance with the authoritative guidance. Accordingly, accounts receivable related to these arrangements are accounted for as a secured borrowing in accordance with Topic 860, and the Company records a liability for any cash received, while maintaining the associated accounts receivable balance until the distributor or reseller remits payment to the third-party financing company.
During the quarter ended September 30, 2018, total transactions entered pursuant to the terms of the Financing Agreement were approximately $56.3 million of which $32.7 million was related to the transfer of the financial asset. The financing of these receivables accelerated the collection of cash and reduced the Company's credit exposure. Included in "Accounts receivables, net" in the Company's condensed consolidated balance sheet as of September 30, 2018 was approximately $41.0 million due from the financing company, of which $19.8 million was related to accounts receivable transferred. Total fees incurred pursuant to the Financing Agreement were immaterial for the quarter ended September 30, 2018. These fees are recorded as a reduction to revenue on the Company's condensed consolidated statement of operations.
2. RECENT ACCOUNTING PRONOUNCEMENTS
Recently Issued Pronouncements
In February 2016, the FASB issued guidance regarding both operating and financing leases, requiring lessees to recognize on their balance sheets "right-of-use assets" and corresponding lease liabilities, measured on a discounted basis over the lease term. Virtually all leases will be subject to this treatment except leases that meet the definition of a "short-term lease". For expense recognition, the dual model requiring leases to be classified as either operating or finance leases has been retained from the prior standard. Operating leases will result in straight-line expense while finance leases will result in a front-loaded expense pattern. Classification will use criteria very similar to those applied in current lease accounting, but without explicit bright lines. Extensive additional quantitative and qualitative disclosures, including significant judgments made by management, will be required to provide greater insight into the extent of expense recognized and expected to be recognized. The new lease guidance will essentially eliminate off-balance sheet financing. The guidance is effective for the Company's fiscal year ending March 31, 2020. The new standard must be adopted using a modified retrospective transition that provides for certain practical expedients and requires the new guidance to be applied at the beginning of the earliest comparative period presented. The Company expects adoption of this guidance will materially increase the assets and liabilities recorded on its consolidated balance sheets, but is still evaluating the impact on its consolidated financial statements and related disclosures.
In June 2016, the FASBFinancial Accounting Standards Board ("FASB") issued guidance regarding the measurement of credit losses on financial instruments, which changes the impairment model for most financial assets. The new model uses a forward-looking expected loss method, which will generally result in earlier recognition of allowances for losses. The guidance is effective for the Company's fiscal year ending March 31, 2021 with early adoption permitted beginning in the first quarter of Fiscal Year 2020. The Company is currently evaluating the impact the adoption of this standard will have on its consolidated financial statements and related disclosures.
In August 2018, the FASB issued guidance which amended the disclosure requirements on fair value measurements under Topic 820, Fair Value Measurement for recurring or nonrecurring fair value measurements. The guidance is effective for the Company's fiscal year ending March 31, 2020 and interim periods within that year, the Company is currently evaluating the impact on its consolidated financial statements and related disclosures.Recently Adopted Pronouncement
In August 2018,February 2016, the FASB issued guidance on the accountingrecognition and measurement of leases (“ASC 842”). Under the new guidance lessees are required to recognize a lease liability and a corresponding right-of-use (“ROU”) asset on the balance sheet for costs of implementation activities performed in a cloud computing arrangement that is a service contract. The guidance is effective for the Company's fiscal year endingvirtually all leases, essentially eliminating off-balance sheet financing. On March 31, 2021, and2019, the Company is currently evaluating the impact on its consolidated financial statements and related disclosures.
Recently Adopted Pronouncement
Except for the changes below, the Company has consistently applied the accounting policies to all periods presented in these consolidated financial statements. The Company adopted Topic 606 Revenue from Contracts with Customers to all contracts not completed as of the initial application date of April 1, 2018. Topic 606 also includes Subtopic 340-40, Other Assets and Deferred Costs - Contracts with Customers, which requires the deferral of incremental costs of obtaining a contract with a customer. As a result, the Company has changed its accounting policy for revenue recognition as detailed below. The Company applied Topic 606ASC 842 using the modified retrospective method - i.e. by recognizing the cumulative effectapproach and recognized $57.3 million in ROU assets within Other assets and $68.5 million in lease liabilities, of initially applying Topic 606 as an adjustment to the opening balance of retained earnings at April 1, 2018. Therefore, the comparative information has not been adjustedwhich $25.7 million and continues to be reported in accordance with$42.8 million were included within Accrued liabilities and Other long-term liabilities, respectively, on its historic accounting under Topic 605. The details of the notable changes and quantitative impact of the changes are set out below.
Software Revenue: The Company historically deferred revenue for the value of software where vendor specific objective evidence ("VSOE") of fair value had not been established for undelivered items. Under Topic 606, revenue for such licenses is recognized at the time of delivery, rather than ratably, as the VSOE requirement no longer applies and the value of the remaining services are not material in the context of the contract. All deferred revenue pertaining to such licenses was eliminated as a cumulative effect adjustment of implementing the new standard.
Marketing Development Funds: The Company frequently provides marketing development funds to its distributor and retail customers. Historically, its marketing development funds were recognized as a reduction of revenue at the later of when the related revenue is recognized or when the program is offered to the channel partner. Applying the criteria of Topic 606, these marketing development programs qualify as variable consideration, and are assigned as a reduction of the transaction price of the contract. This results in a timing difference such that all or some of the funds related to a program may be recognized in different periods than under Topic 605, depending on the circumstances.
Discount, Rebates and Pricing Reserves: The Company establishes reserves for Discounts and Rebates at the end of each fiscal period. These reserves are estimated based on current relevant and historical data, but there can be some variability associated with unforeseen changes in customer claim patterns. Under Topic 606, in cases where there is uncertainty around the variable consideration amount, a constraint on that consideration must be considered. The impact of this constraint may result in slightly higher reserves than were recorded under the legacy methodology.
The Company has historically recorded reserves for customer-related pricing protection which is based on contractual terms and the legal interpretation thereof. Topic 606 prescribes an “expected value” method to estimating variable consideration which involves the sum of probability-weighted amounts for a range of possible outcomes. Applying this method may result in a slightly lower reserve than the reserves under legacy methodology.
Additionally, the balance sheet presentation of certain reserve balances previously shown net within accounts receivable are now presented as refund liabilities within current liabilities.
On July 2, 2018 we acquired Polycom, a privately held Company who had not yet adopted Topic 606. In addition to increasing the magnitude of some items listed above, the acquisition introduced several additional areas of impact. The most notable areas of impact are:
Term Licenses: Legacy accounting standards required that revenue for term-based software licenses be recognized ratably when VSOE of fair value had not been established for undelivered items such as post-contract support. Under Topic 606, revenue for such licenses is recognized at the time of delivery, rather than ratably, as the VSOE requirement no longer applies.
Cost of Obtaining a Contract: Under legacy guidance, in certain circumstances an entity could have elected to capitalize direct and incremental contract acquisition costs, such as sales commissions. Under Topic 606 and related guidance, an entity is required to capitalize costs that are incremental to obtaining a contract if it expects to recover them, unless it elects the practical expedient for costs with amortization periods of one year or less. This new provision affects the Company as we will capitalize those costs if the anticipated amortization period is greater than one year and the criteria have been met.
The cumulative effect of the changes made to the Company's consolidated April 1, 2018 balance sheet for the adoption of Topic 606 was as follows (in thousands):
|
| | | | | | | | | | | |
| | March 31,
2018 | | Adjustments due to Topic 606 (increase/(decrease)) | | April 1,
2018 |
| ASSETS | | | | | |
| Current assets: | | | | | |
| Accounts receivable, net | $ | 152,888 |
| | $ | 14,221 |
| | $ | 167,109 |
|
| Total current assets | 899,726 |
| | 14,221 |
| | 913,947 |
|
| Deferred tax assets | 17,950 |
| | (493 | ) | | 17,457 |
|
| Total assets | $ | 1,076,887 |
| | $ | 13,728 |
| | $ | 1,090,615 |
|
| | | | | | |
| LIABILITIES AND STOCKHOLDERS' EQUITY | |
| | | | |
|
| Current liabilities: | |
| | | | |
|
| Accrued liabilities | $ | 80,097 |
| | $ | 11,133 |
| | $ | 91,230 |
|
| Total current liabilities | 125,514 |
| | 11,133 |
| | 136,647 |
|
| Total liabilities | 723,917 |
| | 11,133 |
| | 735,050 |
|
Commitments and contingencies (Note 7)
| | | | | |
| Stockholders' equity: | |
| | | | |
|
| Retained earnings | 299,066 |
| | 2,595 |
| | 301,661 |
|
| Total stockholders' equity before treasury stock | 1,179,397 |
| | 2,595 |
| | 1,181,992 |
|
| Total stockholders' equity | 352,970 |
| | 2,595 |
| | 355,565 |
|
| Total liabilities and stockholders' equity | $ | 1,076,887 |
| | $ | 13,728 |
| | $ | 1,090,615 |
|
The following tables summarize the impacts of adopting Topic 606 on the Company’s condensed consolidated balance sheetsheet. The initial ROU assets recognized were adjusted for accrued rent and facility-related restructuring liabilities as of September 30, 2018:
|
| | | | | | | | | | | |
| | September 30, 2018 As Reported | | Adjustments due to Topic 606 (increase/(decrease)) | | September 30, 2018 Without Adoption of Topic 606 |
| ASSETS | | | | | |
| Current assets: | | | | | |
| Accounts receivable, net | $ | 354,066 |
| | $ | (90,906 | ) | | $ | 263,160 |
|
| Other current assets | 57,584 |
| | (206 | ) | | 57,378 |
|
| Total current assets | 874,349 |
| | (91,112 | ) | | 783,237 |
|
| Other assets | 24,647 |
| | (747 | ) | | 23,900 |
|
| Total assets | $ | 3,370,107 |
| | $ | (91,859 | ) | | $ | 3,278,248 |
|
| | | | | | |
| LIABILITIES AND STOCKHOLDERS' EQUITY | |
| | | | |
|
| Current liabilities: | |
| | | | |
|
| Accrued liabilities | $ | 407,777 |
| | $ | (85,681 | ) | | $ | 322,096 |
|
| Total current liabilities | 557,694 |
| | (85,681 | ) | | 472,013 |
|
| Deferred tax liability | 115,887 |
| | (1,001 | ) | | 114,886 |
|
| Total liabilities | 2,580,047 |
| | (86,682 | ) | | 2,493,365 |
|
| Commitments and contingencies (Note 7) | | | | | |
| Stockholders' equity: | |
| | | | |
|
| Retained earnings | 218,565 |
| | (5,177 | ) | | 213,388 |
|
| Total stockholders' equity before treasury stock | 1,629,829 |
| | (5,177 | ) | | 1,624,652 |
|
| Total stockholders' equity | 790,060 |
| | (5,177 | ) | | 784,883 |
|
| Total liabilities and stockholders' equity | $ | 3,370,107 |
| | $ | (91,859 | ) | | $ | 3,278,248 |
|
the adoption date. The following tables summarize the impactsadoption of adopting Topic 606 on the Company’s condensed consolidated financial statements for the three months ended September 30, 2018:
|
| | | | | | | | | | | |
CONSOLIDATED STATEMENTS OF OPERATIONS
Selected Line Items
(in thousands)
(Unaudited)
|
| | September 30, 2018
as Reported | | Adjustments due to Topic 606
(increase/(decrease)) | | September 30, 2018
Without Adoption of Topic 606 |
| Net revenues | | | | |
|
|
| Net product revenues | $ | 435,262 |
| | $ | (2,431 | ) | | $ | 432,831 |
|
| Net service revenues | 47,807 |
| | 81 |
| | 47,888 |
|
| Total net revenues | 483,069 |
| | (2,350 | ) | | 480,719 |
|
| Gross profit | 152,629 |
| | (2,350 | ) | | 150,279 |
|
| Operating expenses: | | | | |
|
|
| Selling, general, and administrative | 174,297 |
| | 870 |
| | 175,167 |
|
| Total operating expenses | 238,605 |
| | 870 |
| | 239,475 |
|
| Operating loss | (85,976 | ) | | (3,220 | ) | | (89,196 | ) |
| Loss before income taxes | (108,259 | ) | | (3,220 | ) | | (111,479 | ) |
| Income tax expense (benefit) | (21,550 | ) | | (470 | ) | | (22,020 | ) |
| Net loss | $ | (86,709 | ) | | $ | (2,750 | ) | | $ | (89,459 | ) |
| | | | | |
|
|
| Loss per common share: | | | | |
|
|
| Basic | $ | (2.21 | ) | | $ | (0.07 | ) | | $ | (2.28 | ) |
| Diluted | $ | (2.21 | ) | | $ | (0.07 | ) | | $ | (2.28 | ) |
The following tables summarize the impacts of adopting Topic 606 on the Company’s condensed consolidated financial statements for the six months ended September 30, 2018:
|
| | | | | | | | | | | |
CONSOLIDATED STATEMENTS OF OPERATIONS
Selected Line Items
(in thousands)
(Unaudited)
|
| | September 30, 2018
as Reported | | Adjustments due to Topic 606
(increase/(decrease)) | | September 30, 2018
Without Adoption of Topic 606 |
| Net revenues | | | | |
|
|
| Net product revenues | $ | 656,571 |
| | $ | (2,583 | ) | | $ | 653,988 |
|
| Net service revenues | 47,807 |
| | 81 |
| | 47,888 |
|
| Total net revenues | 704,378 |
| | (2,502 | ) | | 701,876 |
|
| Gross profit | 262,472 |
| | (2,502 | ) | | 259,970 |
|
| Operating expenses | | | | |
|
|
| Selling, general, and administrative | 238,500 |
| | 870 |
| | 239,370 |
|
| Total operating expenses | 327,799 |
| | 870 |
| | 328,669 |
|
| Operating loss | (65,327 | ) | | (3,372 | ) | | (68,699 | ) |
| Loss before income taxes | (92,941 | ) | | (3,372 | ) | | (96,313 | ) |
| Income tax expense (benefit) | (20,703 | ) | | (508 | ) | | (21,211 | ) |
| Net loss | $ | (72,238 | ) | | $ | (2,864 | ) | | $ | (75,102 | ) |
| | | | | |
|
|
| Loss per common share: | | | | |
|
|
| Basic | $ | (2.01 | ) | | $ | (0.08 | ) | | $ | (2.09 | ) |
| Diluted | $ | (2.01 | ) | | $ | (0.08 | ) | | $ | (2.09 | ) |
The following tables summarize the impacts of adopting Topic 606 on the Company’s condensed consolidated statement of comprehensive loss for the three months ended September 30, 2018:
|
| | | | | | | | | | | |
CONSOLIDATED STATEMENTS OF COMPREHENSIVE LOSS Selected Line Items (in thousands) (Unaudited) |
| | September 30, 2018 as Reported | | Adjustments due to Topic 606
(increase/(decrease)) | | September 30, 2018 Without Adoption of Topic 606 |
| Net loss | $ | (86,709 | ) | | $ | (2,750 | ) | | $ | (89,459 | ) |
| Comprehensive loss | $ | (87,626 | ) | | $ | (2,750 | ) | | $ | (90,376 | ) |
The following tables summarize the impacts of adopting Topic 606 on the Company’s condensed consolidated statement of comprehensive loss for the six months ended September 30, 2018:
|
| | | | | | | | | | | |
CONSOLIDATED STATEMENTS OF COMPREHENSIVE LOSS Selected Line Items (in thousands) (Unaudited) |
| | September 30, 2018 as Reported | | Adjustments due to Topic 606
(increase/(decrease)) | | September 30, 2018 Without Adoption of Topic 606 |
| Net loss | $ | (72,238 | ) | | $ | (2,864 | ) | | $ | (75,102 | ) |
| Comprehensive loss | $ | (69,439 | ) | | $ | (2,864 | ) | | $ | (72,303 | ) |
Adoption of the standards related to revenue recognition had noASC 842 did not have a material impact to cash from or used in operating, financing, or investing on the Company's condensed consolidated cash flows statements.statement of operations.
In January 2016,Under the FASB issued guidance regardingmodified retrospective approach, prior comparative financial information was not retrospectively adjusted. The Company elected the recognitionpackage of practical expedients which allows it to carry forward its historical lease evaluation and measurement of financial assets and liabilities. Changes to the current U.S. GAAP model primarily affect the accounting for equity investments, financial liabilities under the fair value option, and the presentation and disclosure requirements for financial instruments.classification. In addition, the FASB clarified guidance relatedCompany elected to the valuation allowance assessment when recognizing deferred tax assets resultingexclude leases with terms of one year or less from unrealized losses on available-for-sale debt securities.its balance sheet and separately account for lease and non-lease components.
The Company’s lease portfolio consists primarily of real estate facilities under operating leases. The Company adopteddetermines if an arrangement is or contains a lease at inception. ROU assets and lease liabilities are recognized at commencement based on the standardpresent value of the future minimum lease payments over the lease term. The Company applies its incremental borrowing rate in determining the first quarterpresent value of the future minimum lease payments, as most of its fiscal year ending March 31, 2019. The adoptionleases do not provide an implicit rate. Certain of this standard had no material impactthe Company’s lease agreements include options to extend or renew the lease terms. Such options are excluded from the minimum lease obligation unless they are reasonably certain to be exercised. Operating lease expense is recognized on a straight-line basis over the Company's consolidated financial statements and related disclosures.lease term.
In May 2017, the FASB issued guidance that clarifies the scope of modification accounting with respect to changes to the terms or conditions of a share-based payment award. This guidance is effective for the Company's fiscal year ending March 31, 2019, including interim periods within that year. The Company adopted the standard in the first quarter of its fiscal year ending March 31, 2019. The adoption of this standard had no impact on the Company's consolidated financial statements and related disclosures.
3. ACQUISITION GOODWILL, AND ACQUIRED INTANGIBLE ASSETS
Polycom Acquisition
On July 2, 2018, the Company completed the acquisition of Polycom, Inc. ("Polycom") based upon the terms and conditions contained in the Purchase Agreement dated March 28, 2018 ("the Acquisition"). The Company believes the Acquisition will better position Plantronics with ourits channel partners, customers, and strategic alliance partners by allowing usthe Company to pursue additional opportunities across the Unified Communications & Collaboration "UC&C" marketUC&C category in both hardware end points and services.
At the closing of the Acquisition, Plantronics acquired Polycom for approximately $2.2 billion with the total consideration consisting of (1) 6.4 million shares of the Company's common stock (the "Stock Consideration") valued at approximately $0.5 billion and (2) approximately $1.7 billion in cash net of cash acquired (the "Cash Consideration"), resulting in Triangle which wasPrivate Holdings II, LLC ("Triangle"), Polycom’s sole shareholder, owning approximately 16.0% of Plantronicsthe Company's issued and outstanding common stock immediately following the acquisition.Acquisition. The consideration paid at closing is subject to a working capital, tax and other adjustments. This transactionThe Acquisition was accounted for as a business combination and we havethe Company has included the financial results of Polycom in ourits condensed consolidated financial statements since the date of acquisition.Acquisition.
During the quarter ended June 30, 2019, the Company finalized its allocation of the purchase price to the estimated fair value of the assets acquired and liabilities assumed. Since the Acquisition, the Company has recorded measurement period adjustments to reflect facts and circumstances in existence as of the acquisition date. These adjustments included deferred tax and tax liabilities of $45.2 million, a working capital adjustment of $8.0 million, and various other immaterial adjustments of $1.4 million, resulting in a decrease to goodwill of approximately $54.6 million.
The preliminary allocation of the purchase price to the estimated fair value of the assets acquired and liabilities assumed at the acquisitionAcquisition date is as follows:
|
| | | | |
| (in thousands) | | July 2, 2018 |
| ASSETS | | |
| Cash and cash equivalents | | $ | 80,139 |
|
| Trade receivables, net | | 165,798 |
|
| Inventories | | 109,074 |
|
| Prepaid expenses and other current assets | | 68,558 |
|
| Property and equipment, net | | 79,497 |
|
| Intangible assets | | 985,400 |
|
| Other assets | | 27,237 |
|
| Total assets acquired | | $ | 1,515,703 |
|
| | | |
| LIABILITIES | | |
| Accounts payable | | $ | 80,653 |
|
| Accrued payroll and related liabilities | | 44,538 |
|
| Accrued expenses | | 147,167 |
|
| Income tax payable | | 27,044 |
|
| Deferred revenue | | 115,061 |
|
| Deferred income taxes | | 94,618 |
|
| Other liabilities | | 54,394 |
|
| Total liabilities assumed | | $ | 563,475 |
|
| | | |
| Total identifiable net assets acquired | | 952,228 |
|
| Goodwill | | 1,264,417 |
|
| Total Purchase Price | | $ | 2,216,645 |
|
|
| | | | |
| (in thousands) | | July 2, 2018 |
| ASSETS | | |
| Cash and cash equivalents | | $ | 80,139 |
|
| Trade receivables, net | | 168,595 |
|
| Inventories | | 107,820 |
|
| Prepaid expenses and other current assets | | 32,551 |
|
| Property and equipment, net | | 80,310 |
|
| Intangible assets | | 985,400 |
|
| Other assets | | 28,572 |
|
| Total assets acquired | | $ | 1,483,387 |
|
| | | |
| LIABILITIES | | |
| Accounts payable | | $ | 81,854 |
|
| Accrued payroll and related liabilities | | 45,317 |
|
| Accrued expenses | | 120,167 |
|
| Income tax payable | | 30,153 |
|
| Deferred revenue | | 114,264 |
|
| Deferred income taxes | | 150,112 |
|
| Other liabilities | | 35,912 |
|
| Total liabilities assumed | | $ | 577,779 |
|
| | | |
| Total identifiable net assets acquired | | 905,608 |
|
| Goodwill | | 1,319,036 |
|
| Total Purchase Price | | $ | 2,224,644 |
|
The Company’s purchase price allocation is preliminary and subject to revision as additional information related to the fair value of assets and liabilities are finalized. The estimate of fair value and purchase price allocation were based on information available at the time of closing the Acquisition and the Company continues to evaluate the underlying inputs and assumptions that are being used in fair value estimates. The fair values for acquired inventory, property, plant and equipment, intangible assets, and deferred revenue were determined with the input from third–party valuation specialists. The fair values of certain other assets and certain other liabilities were determined internally using historical carrying values and estimates made by management In addition, the Company is in process of finalizing the net working capital adjustment. Accordingly, these preliminary estimates are subject to retrospective adjustments during the measurement period, not to exceed one year, based upon new information obtained about facts and circumstances that existed as of the date of closing the Acquisition. The acquisitionAcquisition has preliminarily resulted in $1,319$1,264 million of goodwill, which represents the excess of the purchase price over the fair value of identifiable assets acquired and liabilities assumed. Additionally, the purchase price is subject to change due to working capital adjustments, tax reimbursements, and other potential reimbursements from escrow.
The Company incurred approximately $26.3 million infollowing table shows the fair value of the separately identifiable intangible assets at the time of acquisition and integration related expensesthe period over which are recorded in selling, general, and administrative expenses in our condensed consolidated statement of operations for the quarter ended September 30, 2018.
The details of the acquiredeach intangible assets are as follows:asset will be amortized:
|
| | | | | | |
| (in thousands, except for remaining life) | | Fair Value | | Weighted Remaining Life of Intangibles |
| Existing technology | | $ | 538,600 |
| | 4.95 |
| Customer relationships | | 245,100 |
| | 5.46 |
| Trade name/Trademarks | | 115,600 |
| | 9.00 |
| Backlog | | 28,100 |
| | 0.25 |
| Total amortizable intangible assets acquired | | $ | 927,400 |
| | 5.45 |
| In-process technology | | 58,000 |
| | |
| Total acquired intangible assets | | $ | 985,400 |
| | |
|
| | | | | | | | | | | | | | |
| (in thousands, except for remaining life) | | Value as of July 2, 2018 | | Amortization for the Three Months Ended September 30, 2018 | | Value as of September 30, 2018 | | Weighted Remaining Life of Intangibles |
| Existing technology | | $ | 538,600 |
| | $ | 27,568 |
| | $ | 511,032 |
| | 4.71 |
| In-process technology | | 58,000 |
| | — |
| | 58,000 |
| | N/A |
| Customer relationships | | 245,100 |
| | 12,066 |
| | 233,034 |
| | 5.22 |
| Backlog | | 28,100 |
| | 28,100 |
| | — |
| | 0 |
| Trade name/Trademarks | | 115,600 |
| | 3,211 |
| | 112,389 |
| | 8.75 |
| Total acquired intangible assets | | $ | 985,400 |
| | $ | 70,945 |
| | $ | 914,455 |
| | |
Existing technology relates to products for voice, video and platform products. WeThe Company valued the developed technology using the discounted cash flow method under the income approach. This method reflects the present value of the projected cash flows that are expected to be generated by the developed technology less charges representing the contribution of other assets to those cash flows. The economic useful life was determined based on the technology cycle related to each developed technology, as well as the cash flows over the forecast period.
Customer relationships represent the fair value of future projected revenue that will be derived from sales of products to existing customers of Polycom.Polycom existing prior to the Acquisition. Customer relationships were valued using the discounted cash flow method as described above and the distributor method under the income approach. Under the distributor method, the economic profits generated by a distributor are deemed to be attributable to the customer relationships. The economic useful life was determined based on historical customer turnover rates.
Order backlog was valued separately from customer relationships using the discounted cash flow method under the income approach. This method reflects the present value of the projected cash flows that are expected to be generated by order backlog less costs to fulfill. The economic useful life was determined based on the period over which the order backlog is expected to be fulfilled.
Trade name/trademarks relate to the “Polycom” trade name and related trademarks. The fair value was determined by applying the profit allocation method under the income approach. This valuation method estimates the value of an asset by the profit saved because the company owns the asset. The economic useful life was determined based on the expected life of the trade name and trademarks and the cash flows anticipated over the forecasted periods.
The fair value of in-process technology was determined using the discounted cash flow method under the income approach. This method reflects the present value of the projected cash flows that are expected to be generated by thin-processin-process technology, less charges representing the contribution of other assets to those cash flows.
We believeThe Company believes the amounts of purchased intangible assets recorded above represent the fair values of and approximate the amounts a market participant would pay for, these intangible assets as of the Acquisition Date.date of the Acquisition.
For the three and six months ended SeptemberJune 30, 2018, we2019, the Company recognized $70.9$45.3 million in amortization of acquired intangibles related to this acquisition.the Acquisition. The remaining weighted-average useful life of intangible assets acquired is 5.384.67 years.
Goodwill is primarily attributable to the assembled workforce, market expansion, and anticipated synergies and economies of scale expected from the integration of the Polycom business. The synergies include certain cost savings, operating efficiencies, and other strategic benefits projected to be achieved. Goodwill is not expected to be deductible for tax purposes.
The following summarizes our goodwill activity for the six months ended September 30, 2018:
|
| | | | |
| (in thousands) | | Amount |
| Goodwill- March 31, 2018 | | $ | 15,498 |
|
| Polycom Acquisition | | 1,319,036 |
|
| Goodwill- September 30, 2018 | | $ | 1,334,534 |
|
The actual total net revenues and net loss of Polycom included in our condensed consolidated statement of operations for the period July 2, 2018 to September 30, 2018 are as follows:
|
| | | | |
| (in thousands) | | July 2, 2018 to September 30, 2018
|
| Total net revenues | | $ | 255,038 |
|
| Net loss | | $ | (96,469 | ) |
The following unaudited pro forma financial information presents combined results of operations for each of the periods presented, as if Polycom had been acquired as of the beginning of fiscal year 2018. The unaudited pro forma information includes adjustments to amortization for intangible assets acquired, the purchase accounting effect on deferred revenue assumed and inventory acquired, restructuring charges related to the acquisition, and transaction and integration costs. For the two fiscal quartersquarter ended SeptemberJune 30, 2017 and 2018, non-recurring pro forma adjustments directly attributable to the Polycom acquisitionAcquisition included (i) the purchase accounting effect of deferred revenue assumed of $36.6 million, (ii) the purchase accounting effect of inventory acquired of $30.4 million, and (iii) acquisitionAcquisition and Integration costs of $12.3$19.6 million.
The unaudited pro forma information presented below is for informational purposes only and is not necessarily indicative of ourthe Company's consolidated results of operations of the combined business had the acquisitionAcquisition actually occurred at the beginning of fiscal year 20182019 or of the results of ourits future operations of the combined business.
|
| | | | |
| | | Pro Forma (unaudited) |
| | | Three Months Ended June 30, |
| (in thousands) | | 2018 |
| Total net revenues | | $ | 463,837 |
|
| Operating loss | | (118,148 | ) |
| Net loss | | $ | (107,385 | ) |
|
| | | | | | | | | | | | | | | | |
| | | Pro Forma (unaudited) |
| | | Three Months Ended September 30, | | Six Months Ended September 30, |
| (in thousands) | | 2017 | | 2018 | | 2017 | | 2018 |
| Total net revenues | | $ | 483,233 |
| | $ | 511,639 |
| | $ | 920,404 |
| | $ | 1,002,524 |
|
| Operating income (loss) | | 3,270 |
| | 21,298 |
| | (117,252 | ) | | 2,468 |
|
| Net income (loss) | | $ | 250 |
| | $ | (1,026 | ) | | $ | (116,516 | ) | | $ | (30,209 | ) |
4. CASH, CASH EQUIVALENTS, AND INVESTMENTS
The following tables summarize the Company’s cash and available-for-sale securities’ amortized cost, gross unrealized gains, gross unrealized losses, and fair value by significant investment category recorded as cash and cash equivalents, short-term, or long-term investments as of SeptemberJune 30, 20182019 and March 31, 20182019 (in thousands):
| | | September 30, 2018 | | Amortized
Cost | | Gross
Unrealized
Gains | | Gross
Unrealized
Losses | | Fair
Value | | Cash & Cash Equivalents | | Short-term investments (due in 1 year or less) | |
| June 30, 2019 | | | Amortized
Cost | | Gross
Unrealized
Gains | | Gross
Unrealized
Losses | | Fair
Value | | Cash & Cash Equivalents | | Short-term investments (due in 1 year or less) |
| Cash | | $ | 291,086 |
| | $ | — |
| | $ | — |
| | $ | 291,086 |
| | $ | 291,086 |
| | $ | — |
| | $ | 191,904 |
| | $ | — |
| | $ | — |
| | $ | 191,904 |
| | $ | 191,904 |
| | $ | — |
|
| Level 1: | | | | | | | | | | | | | | | | | | | | | | | | |
| Mutual Funds | | 14,129 |
| | 635 |
| | (59 | ) | | 14,705 |
| | — |
| | 14,705 |
| | 13,950 |
| | 337 |
| | (118 | ) | | 14,169 |
| | — |
| | 14,169 |
|
| Subtotal | | 14,129 |
| | 635 |
| | (59 | ) | | 14,705 |
| | — |
| | 14,705 |
| |
| | | | | | | | | | | | | | | | | | | | | | | | | |
Total cash, cash equivalents
and investments measured at fair value | | $ | 305,215 |
| | $ | 635 |
| | $ | (59 | ) | | $ | 305,791 |
| | $ | 291,086 |
| | $ | 14,705 |
| | $ | 205,854 |
| | $ | 337 |
| | $ | (118 | ) | | $ | 206,073 |
| | $ | 191,904 |
| | $ | 14,169 |
|
|
| | | | | | | | | | | | | | | | | | | | | | | | |
| March 31, 2019 | | Amortized
Cost | | Gross
Unrealized
Gains | | Gross
Unrealized
Losses | | Fair
Value | | Cash & Cash Equivalents | | Short-term investments (due in 1 year or less) |
| Cash | | $ | 202,509 |
| | $ | — |
| | $ | — |
| | $ | 202,509 |
| | $ | 202,509 |
| | $ | — |
|
| Level 1: | | | | | | | | | | | | |
| Mutual Funds | | 13,420 |
| | 197 |
| | (285 | ) | | 13,332 |
| | — |
| | 13,332 |
|
| | | | | | | | | | | | | |
Total cash, cash equivalents
and investments measured at fair value | | $ | 215,929 |
| | $ | 197 |
| | $ | (285 | ) | | $ | 215,841 |
| | $ | 202,509 |
| | $ | 13,332 |
|
|
| | | | | | | | | | | | | | | | | | | | | | | | |
| March 31, 2018 | | Amortized
Cost | | Gross
Unrealized
Gains | | Gross
Unrealized
Losses | | Fair
Value | | Cash & Cash Equivalents | | Short-term investments (due in 1 year or less) |
| Cash | | $ | 308,734 |
| | $ | — |
| | $ | — |
| | $ | 308,734 |
| | $ | 308,734 |
| | $ | — |
|
| Level 1: | | | | | | | | | | | | |
| Mutual Funds | | 13,336 |
| | 186 |
| | (67 | ) | | 13,455 |
| | — |
| | 13,455 |
|
| US Treasury Notes | | 129,373 |
| | 7 |
| | (60 | ) | | 129,320 |
| | 30,178 |
| | 99,142 |
|
| Money Market Funds | | 344 |
| | — |
| | — |
| | 344 |
| | 344 |
| | — |
|
| Subtotal | | 143,053 |
| | 193 |
| | (127 | ) | | 143,119 |
| | 30,522 |
| | 112,597 |
|
| Level 2: | | | | | | | | | | | | |
| Government Agency Securities | | 46,354 |
| | — |
| | (56 | ) | | 46,298 |
| | 6,978 |
| | 39,320 |
|
| Municipal Bonds | | 3,591 |
| | — |
| | — |
| | 3,591 |
| | 3,591 |
| | — |
|
| Commercial Paper | | 84,512 |
| | — |
| | — |
| | 84,512 |
| | 40,836 |
| | 43,676 |
|
| Corporate Bonds | | 54,701 |
| | — |
| | (212 | ) | | 54,489 |
| | — |
| | 54,489 |
|
| Certificates of Deposits ("CDs") | | 19,231 |
| | — |
| | — |
| | 19,231 |
| | — |
| | 19,231 |
|
| Subtotal | | 208,389 |
| | — |
| | (268 | ) | | 208,121 |
| | 51,405 |
| | 156,716 |
|
| | | | | | | | | | | | | |
Total cash, cash equivalents
and investments measured at fair value | | $ | 660,176 |
| | $ | 193 |
| | $ | (395 | ) | | $ | 659,974 |
| | $ | 390,661 |
| | $ | 269,313 |
|
As of SeptemberJune 30, 20182019, and March 31, 2018, with the exception of assets related to the Company's deferred compensation plan,2019, all of the Company's investments are classified as available-for-sale securities. The carryingtrading securities and are reported at fair value, of available-for-sale securitieswith unrealized gains and losses included in cash equivalents approximates fair value because of the short maturity of those instruments.current period earnings. For more information regarding the Company's deferred compensation plan, refer tosee Note 5, Deferred Compensation.
The Company did not incur any material realized or unrealized gains or losses in the three and six months ended SeptemberJune 30, 20172019, and 2018.
There were no transfers between fair value measurement levels during the three and six months ended SeptemberJune 30, 20172019, and 2018.
All financial assets and liabilities are recognized or disclosed at fair value in the financial statements or the accompanying notes thereto. Fair value is estimated by applying the following hierarchy, which prioritizes the inputs used to measure fair value into three levels and bases the categorization within the hierarchy upon the lowest level of input that is available and significant to the fair value measurement:
Level 1
The Company's Level 1 financial assets consist of Mutual Funds and US Treasury Notes.Funds. The fair value of Level 1 financial instruments is measured based on the quoted market price of identical securities.
Level 2
The Company's Level 2 financial assets and liabilities consist of derivative foreign currency contracts, interest rate swap and 5.50% Senior Notes. The fair value of Level 2 derivative foreign currency contracts and interest rate swap is determined using pricing models that use observable market inputs. For more information regarding the Company's derivative assets and liabilities, refer tosee Note 13, Derivatives.14, Derivatives. The fair value of Level 2 long-term debt and term loan facility are determined based on inputs that were observable in the market, including the trading price of the notes when available. For more information regarding the Company's 5.50% Senior Notes and term loan facility, refer tosee Note 8, Debt.9, Debt.
Level 3
The Company's revolving credit facility falls under the Level 3 hierarchy. The fair value of Level 3 revolving credit facility is determined based on inputs that were unobservable in the market. For more information regarding the Company's debt, refer to Note 8, Debt.9, Debt.
5. DEFERRED COMPENSATION
As of SeptemberJune 30, 2018,2019, the Company held investments in mutual funds totaling $14.7$14.2 million, all of which related to debt and equity securities that are held in rabbi trusts under non-qualified deferred compensation plans. The total related deferred compensation liability was $15.8$14.7 million at SeptemberJune 30, 2018.2019. As of March 31, 2018 ,2019, the Company held investments in mutual funds totaling $13.5$13.3 million. The total related deferred compensation liability at March 31, 20182019 was $14.1$13.5 million.
The securities are classified as trading securities and are recorded on the condensed consolidated balance sheets under "short-term investments". The liability is recorded on the condensed consolidated balance sheets under "other long-term liabilities" and "accrued liabilities".
6. DETAILS OF CERTAIN BALANCE SHEET ACCOUNTS
Accounts receivable, net:
|
| | | | | | | | |
| | | June 30, | | March 31, |
| (in thousands) | | 2019 | | 2019 |
| Accounts receivable | | $ | 383,337 |
| | $ | 393,415 |
|
| Provisions for promotions, rebates, and other | | (61,857 | ) | | (50,789 | ) |
| Provisions for doubtful accounts and sales allowances | | (3,245 | ) | | (4,956 | ) |
| Accounts receivable, net | | $ | 318,235 |
| | $ | 337,671 |
|
|
| | | | | | | | | |
| | | March 31, | | September 30, | |
| (in thousands) | | 2018 | | 2018 | |
| Accounts receivable | | $ | 202,270 |
| | $ | 404,496 |
| |
| Provisions for returns | | (10,225 | ) | | — |
| 1 |
| Provisions for promotions, rebates, and other | | (38,284 | ) | | (46,025 | ) | 1 |
| Provisions for doubtful accounts and sales allowances | | (873 | ) | | (4,405 | ) | |
| Accounts receivable, net | | $ | 152,888 |
| | $ | 354,066 |
| |
(1)Upon adoptionAs a result of ASC 606, the provisionAcquisition, the Company assumed a financing agreement with an unrelated third-party financing company (the "Financing Agreement") whereby the Company offers distributors and resellers direct or indirect financing on their purchases of Polycom's products and services. In return, the Company agrees to pay the financing company a fee based on a pre-defined percentage of the transaction amount financed. In certain instances, these financing arrangements result in a transfer of the Company's receivables, without recourse, to the financing company. If the transaction meets the applicable criteria under Topic 860 and is accounted for returnsas a sale of financial assets, the related accounts receivable is excluded from the balance sheet upon receipt of the third-party financing company's payment remittance. In certain legal jurisdictions, the arrangements that involve maintenance services or products bundled with maintenance at one price do not qualify as sale of financial assets in accordance with the authoritative guidance. Accordingly, accounts receivable related to these arrangements are accounted for as a secured borrowing in accordance with Topic 860, and certain provisionsthe Company records a liability for promotions, rebatesany cash received, while maintaining the associated accounts receivable balance until the distributor or reseller remits payment to the third-party financing company.
During the quarter ended June 30, 2019, total transactions entered pursuant to the terms of the Financing Agreement were approximately $59.1 million, of which $27.3 million was related to the transfer of the financial asset. The financing of these receivables accelerated the collection of cash and otherreduced the Company's credit exposure. Included in "Accounts receivables, net" in the Company's condensed consolidated balance sheet as of June 30, 2019 was approximately $42.7 million due from the financing company, of which $22.3 million was related to accounts receivable transferred. Total fees incurred pursuant to the Financing Agreement were reclassifiedimmaterial for the quarter ended June 30, 2019. These fees are recorded as a reduction to accrued liabilities as these reserve balances are considered refund liabilities. Refer to Note 2, Recent Accounting Pronouncements, for additional informationrevenue on the adoption impact.Company's condensed consolidated statement of operations.
Inventory, net:
|
| | | | | | | | |
| | | June 30, |
| March 31, |
| (in thousands) | | 2019 |
| 2019 |
| Raw materials | | $ | 82,575 |
| | $ | 34,054 |
|
| Work in process | | 18,077 |
| | 274 |
|
| Finished goods | | 116,772 |
| | 142,818 |
|
| Inventory, net | | $ | 217,424 |
| | $ | 177,146 |
|
|
| | | | | | | | |
| | | March 31, |
| September 30, |
| (in thousands) | | 2018 |
| 2018 |
| Raw materials | | $ | 28,789 |
| | $ | 34,121 |
|
| Work in process | | 450 |
| | 134 |
|
| Finished goods | | 39,037 |
| | 122,653 |
|
| Inventory, net | | $ | 68,276 |
| | $ | 156,908 |
|
Accrued Liabilities:
|
| | | | | | | | |
| | | June 30, | | March 31, |
| (in thousands) | | 2019 | | 2019 |
| Short term deferred revenue | | $ | 140,186 |
| | $ | 133,200 |
|
| Employee compensation and benefits | | 61,795 |
| | 68,882 |
|
| Operating lease liabilities, current | | 22,101 |
| | — |
|
| Income tax payable | | 11,145 |
| | 5,692 |
|
| Provision for returns | | 28,238 |
| | 24,632 |
|
| Marketing incentives liabilities | | 23,093 |
| | 25,369 |
|
| Discounts reserve | | 36,712 |
| | 46,894 |
|
| Accrued interest | | 3,531 |
| | 10,425 |
|
| Warranty obligation | | 14,044 |
| | 15,736 |
|
| VAT/Sales tax payable | | 7,483 |
| | 11,804 |
|
| Derivative liabilities | | 7,152 |
| | 3,275 |
|
| Accrued other | | 52,826 |
| | 52,806 |
|
| Accrued liabilities | | $ | 408,306 |
| | $ | 398,715 |
|
|
| | | | | | | | | |
| | | March 31, | | September 30, | |
| (in thousands) | | 2018 | | 2018 | |
| Short term deferred revenue | | $ | 2,986 |
| | $ | 101,385 |
| |
| Employee compensation and benefits | | 28,655 |
| | 84,346 |
| |
| Income tax payable | | 5,583 |
| | 34,897 |
| |
| Provision for returns | | — |
| | 23,911 |
| 1 |
| Current portion long term debt | | — |
| | 12,750 |
| |
| Accrued interest | | 10,424 |
| | 10,589 |
| |
| Warranty obligation | | 7,550 |
| | 18,298 |
| |
| VAT/Sales tax payable | | 5,297 |
| | 10,418 |
| |
| Derivative liabilities | | 2,947 |
| | 1,718 |
| |
| Accrued other | | 16,655 |
| | 109,465 |
| |
| Accrued liabilities | | $ | 80,097 |
| | $ | 407,777 |
| |
(1) Upon adoption of ASC 606, the provision for returns and certain provisions for promotions, rebates and other were reclassified to accrued liabilities as these reserve balances are considered refund liabilities. Refer to Note 2, Recent Accounting Pronouncements, for additional information on the adoption impact.
The Company's warranty obligation is included as a component of accrued liabilities on the condensed consolidated balance sheets. Changes in the warranty obligation during the sixthree months ended SeptemberJune 30, 20172019 and 2018 were as follows:
|
| | | | | | | | |
| | | Three Months Ended
June 30, |
| (in thousands) | | 2019 | | 2018 |
| Warranty obligation at beginning of period | | $ | 17,984 |
| | $ | 9,604 |
|
| Warranty provision related to products shipped | | 4,837 |
| | 2,562 |
|
| Deductions for warranty claims processed | | (5,001 | ) | | (2,634 | ) |
| Adjustments related to preexisting warranties | | (1,036 | ) | | 200 |
|
Warranty obligation at end of period(1) | | $ | 16,784 |
| | $ | 9,732 |
|
|
| | | | | | | | |
| | | Six Months Ended September 30, |
| (in thousands) | | 2017 | | 2018 |
| Warranty obligation at beginning of period | | $ | 8,697 |
| | $ | 18,851 |
|
| Warranty provision related to products shipped | | 4,635 |
| | 7,000 |
|
| Deductions for warranty claims processed | | (5,080 | ) | | (124 | ) |
| Adjustments related to preexisting warranties | | 405 |
| | (5,403 | ) |
Warranty obligation at end of period(1) | | $ | 8,657 |
| | $ | 20,324 |
|
(1)Includes both short-term and long-term portion of warranty obligation; the prior table shows only the short-term portion included in accrued liabilities on ourthe Company's condensed consolidated balance sheet. The long-term portion is included in other long-term liabilities.
Operating Leases:
|
| | | | | | | | | | |
| | | Balance Sheet | | June 30, | | March 31, |
| (in thousands) | | Classification | | 2019 | | 2019 |
| ASSETS | | | | | | |
Operating right-of-use assets(1) | | Other assets | | $ | 51,447 |
| | $ | — |
|
| LIABILITIES | | | | | | |
Operating lease liabilities, current(2) | | Accrued liabilities | | 22,101 |
| | $ | — |
|
| Operating lease liabilities, long-term | | Other liabilities | | $ | 41,609 |
| | $ | — |
|
(1) During the three months ended June 30, 2019, the Company made $5.9 million in payments for operating leases included within cash provided by operating activities in its condensed consolidated statements of cash flows.
(2) During the three months ended June 30, 2019, the Company recognized $5.7 million in operating lease expense, net of $1.4 million in sublease income, within its condensed consolidated statement of operations.
| |
| 7. | GOODWILL AND PURCHASED INTANGIBLE ASSETS |
The carrying value of goodwill and other intangibles, excluding fully amortized intangible assets as of June 30, 2019, is set forth in the following table:
|
| | | | | | | | | | | | | | | | | | |
| As of | | June 30, 2019 | | March 31, 2019 | | |
| (in thousands) | | Gross Carrying Amount | | Accumulated Amortization | | Gross Carrying Amount | | Accumulated Amortization | | Weighted Average Remaining Useful Life |
| Amortizing Assets | | | | | | | | | | |
| Existing technology | | $ | 585,867 |
| | (116,295 | ) | | 566,881 |
| | (86,301 | ) | | 4.0 years |
| Customer relationships | | 245,437 |
| | (48,306 | ) | | 245,481 |
| | (36,245 | ) | | 4.6 years |
| Trade name | | 115,600 |
| | (12,845 | ) | | 115,600 |
| | (9,633 | ) | | 8.0 years |
| Non-amortizing assets | | | | | | | | | | |
| In-process R&D | | 10,890 |
| | — |
| | 29,892 |
| | — |
| | N/A |
| Total intangible assets | | $ | 957,794 |
| | $ | (177,446 | ) | | $ | 957,854 |
| | $ | (132,179 | ) | | 4.7 years |
| | | | | | | | | | | |
| Goodwill | | 1,279,897 |
| | $ | — |
| | 1,278,380 |
| | $ | — |
| | N/A |
In the three months ended June 30, 2019, the Company placed in service $19.0 million of in-process R&D which is being amortized on a straight-line basis.
As of June 30, 2019, expected amortization expense for other intangible assets for each of the next five years and thereafter is as follows:
|
| | | | |
| in thousands | | Amount |
| 2020 | | $ | 137,290 |
|
| 2021 | | 178,211 |
|
| 2022 | | 163,928 |
|
| 2023 | | 160,220 |
|
| 2024 | | 78,808 |
|
| Thereafter | | 61,891 |
|
| | | $ | 780,348 |
|
7.Note 8. COMMITMENTS AND CONTINGENCIES
Polycom NetFuture Minimum Future Rental Payments
On July 2, 2018, the Company completed the acquisition of Polycom, refer to Note 3, Acquisition, Goodwill, and Acquired Intangible Assets, in the accompanying footnotes to the condensed consolidated financial statements. As a result of the Acquisition, in addition to the netFuture minimum future rental payments described in the Company's Annual Report on Form 10-K for the fiscal year ended March 31, 2018, the Company became subject to the following minimum future rentallease payments under non-cancelable operating leases having remaining terms in excess of one year as of SeptemberJune 30, 2018:2019 were as follows:
|
| | | | |
| Fiscal Year Ending March 31, | | (in thousands) |
|
| 2019 | | $ | 15,336 |
|
| 2020 | | 11,815 |
|
| 2021 | | 9,045 |
|
| 2022 | | 4,398 |
|
| 2023 | | 497 |
|
Total minimum future rental payments (1) | | $ | 41,091 |
|
|
| | | |
| (in thousands) | | Operating Leases |
| 2020 (remaining nine months) | | 19,147 |
|
| 2021 | | 21,984 |
|
| 2022 | | 19,084 |
|
| 2023 | | 6,390 |
|
| 2024 | | 1,547 |
|
| Thereafter | | 619 |
|
| Total lease payments | | 68,771 |
|
Less: Imputed Interest(2) | | (5,061 | ) |
| Present value of lease liabilities | | 63,710 |
|
(1) Included in theThe weighted average remaining lease obligations acquired are Polycom’s sublease receipts, which have been netted against the gross lease payments above to arrive at our net minimum lease payments.term was 3.1 years as of June 30, 2019.
(2) The weighted average discount rate was 4.9% as of June 30, 2019.
Unconditional Purchase Obligations
The Company purchases materials and services from a variety of suppliers and manufacturers. During the normal course of business and to manage manufacturing operations and general and administrative activities, the Company may enter into firm, non-cancelable, and unconditional purchase obligations for which amounts are not recorded on the consolidated balance sheets. As of SeptemberJune 30, 2018,2019, the Company had outstanding off-balance sheet third-party manufacturing, component purchase, and other general and administrative commitments of $446.1$406.4 million.
Other Guarantees and Obligations
In the ordinary course of business, the Company may provide indemnifications of varying scope and terms to customers, vendors, lessors, business partners, purchasers of assets or subsidiaries and other parties with respect to certain matters, including, but not limited to, losses arising out of the Company's breach of agreements or representations and warranties made by the Company, services to be provided by the Company, intellectual property infringement claims made by third parties or, with respect to the sale of assets of a subsidiary, matters related to the Company's conduct of business and tax matters prior to the sale. From time to time, the Company indemnifies customers against combinations of loss, expense, or liability arising from various triggering events relating to the sale and use of its products and services.
In addition, the Company also provides indemnification to customers against claims related to undiscovered liabilities, additional product liability, or environmental obligations. The Company has also entered into indemnification agreements with its directors, officers and certain other personnel that will require the Company, among other things, to indemnify them against certain liabilities that may arise by reason of their status or service as directors or officers of the Company or certain of its affiliated entities. The Company maintains director and officer liability insurance, which may cover certain liabilities arising from its obligation to indemnify its directors, officers and certain other personnel in certain circumstances. It is not possible to determine the aggregate maximum potential loss under these agreements due to the limited history of prior claims and the unique facts and circumstances involved in each particular claim. Such indemnification obligations might not be subject to maximum loss clauses. Historically, the Company has not incurred material costs as a result of obligations under these agreements and it has not accrued any liabilities related to such indemnification obligations in the condensed consolidated financial statements.
Claims and Litigation
On October 12, 2012, GN Netcom, Inc. ("GN"(“GN”) filed a complaint against the Company in the United States District Court for the District of Delaware (“Court”), alleging violations of Sections 1 and 2 of the Sherman Act, Section 3 of the Clayton Act, and tortioustortuous interference with business relations in connection with the Company’s distribution of corded and wireless headsets. The case was assigned to Judge Leonard P. Stark. GN sought injunctive relief, total damages in an unspecified amount, plus attorneys’ fees and costs, as well as unspecified legal and equitable relief. GN generally alleged that the Company’s alleged exclusive dealing arrangements with certain distributors stifled competition in the relevant market. In July 2016, the Court issued a sanctions order against Plantronics in the amount of approximately $4.9 million for allegations of spoliation of evidence. The case was tried to a jury in October 2017, resulting in a verdict in favor of the Company. GN filed a motion for new trial in November 2017, and that motion was denied by the Court in January 2018. The Company filed a motion for attorneys’ fees in November 2017, and that motion was denied by the Court in January 2018. The Company also filed a motion for certain recoverable costs, and the parties stipulated to an amount of approximately $0.2 million which GN paid the Company. If the jury verdict were to be appealed and later overturned on appeal, the Company would have to repay that amount to GN. On February 12, 2018, GN filed a notice of intent to appeal both the denial of the new trial motion and the Court’s July 2016 spoliation order. The appellate court heard argument on the matter on December 11, 2018 and its decision was rendered on July 10, 2019. The Court denied GN’s request for default judgment, but granted a new trial to include certain excluded testimony of one witness. The Company has been fully briefed, and if the Court determines that an oral argument is necessary, that argument will occur during the week of December 10, 2018.
The U.S. Securities and Exchange Commission and the U.S. Department of Justice are conducting investigations into possible violations of the U.S. Foreign Corrupt Practices Act by Polycom, relating to conduct prior to its July 2, 2018 acquisition by Plantronics. Polycom is cooperating with these agencies regarding these matters. Plantronics is unable to estimate the duration, scope or outcome of these investigations or the probability or range of any potential loss. Any potential liability would be expected to be reimbursed through funds retained in escrow under the Stock Purchase Agreement between Plantronics, Polycom and Triangle Private Holdings II, LLP.
filed a motion for rehearing en banc.
On September 13, 2018, Mr. Phil Shin filed on behalf of himself and others similarly situated, a purported Class Action Complaint in the United States District Court of the Northern District of California alleging violations of various federal and state consumer protection laws in addition to unfair competition and fraud claims in connection with the Company’s BackBeat FIT headphones. The Company disputes the allegations.allegations and filed a motion to dismiss the Complaint in November 2018. Plaintiff filed a First Amended Complaint on December 14, 2018. The Company’s answer tomatter has now been resolved and the complaintsettlement is duepending court approval. On May 24, 2019, Plaintiff filed an unopposed Motion for Preliminary Approval of Class Action Settlement. On June 17, 2019, the Court denied preliminary approval on November 30, 2018.the basis that the scope of the release was overly broad. An amended unopposed Motion for Preliminary Approval has been agreed on by Parties and is pending filing.
On January 23, 2018, Fullview,FullView, Inc. ("FullView") filed a complaint in the United States District Court of the Northern District of California against Polycom, Inc. alleging infringement of two patents and thereafter filed a similar complaint in connection with the same patents in Canada. Polycom thereafter filed an inter partes reexamination of one of the patents, which is currentlywas then appealed to the Federal Circuit Court. Oral argument occurred on appeal.March 6, 2019. Litigation in both matters in the United States and Canada, respectively, has been stayed pending the results of that appeal. Fullview has furthermorePolycom also filed an inter partes review of the second patent on January 31, 2019, which is now pending institution. FullView had also initiated arbitration proceedings under a terminated license agreement with Polycom alleging that Polycom had failed to pay certain royalties due under that agreement. ArbitrationAn arbitration hearing occurred on December 10, 2018, and the matter is currently scheduledarbitration panel awarded $374,475 to be held in December 2018.
In February 2018, NetTalk.comFullView. On April 29, 2019 the Federal Circuit rendered its opinion affirming the Patent Trial and Appeal Board (“PTAB”) opinion regarding the inter partes reexamination. On May 8, 2019, Parties have filed a complaint injoint stipulated motion to extend the United States District CourtCase Management Conference to September 26, 2019 to request a stay the US litigation pending the IPR. On July 10, 2019, the PTAB denied institution of the Northern DistrictIPR of California against Polycom’s wholly-owned subsidiary, Obihai Technologies, alleging infringement of two of NetTalk’s patents.the second patent. The Company answered the complaint on June 11, 2018 disputing the allegations. Discovery in the matter is ongoing.
In June 2018, Ashton Bentley Technology Limited filed a complaint against Polycom, Inc. in the High Court of Justice, Business and Property Court, Commercial Court (QBD), London, United Kingdom, alleging breach of contract. The Company disputes the allegations and on October 5, 2018, Ashton Bentley filed its Reply and Defenceplans to Counterclaim to the Company’s September 6, 2018 Defence and Counterclaims. The Company’s response to Ashton Bentley’s Reply is due on November 16, 2018.
appeal that ruling.
On June 21, 2018, directPacket Research Inc. ("directPacket") filed a complaint alleging patent infringement by Polycom in the United States District Court for the Eastern District of Virginia, Norfolk Division. The Company disputes the allegations andallegations. Polycom filed a motion to change venue which was denied in October 2018. Polycom filed its Answer to the Complaint on October 18, 2018,2018. On February 15, 2019, Polycom filed a Motion to Transfer Venue Pursuant to a Valid and Enforceable Forum Selection Clause to change venue to the Northern District of California. directPacket filed is Opposition on March 1, 2019 with Polycom filing its Reply on March 7, 2019. Discovery was ongoing. On April 29, 2019, the Court ordered supplemental briefing on the Motion to Transfer Venue, which was filed on May 20, 2019. On July 3, 2019 the Court granted the Motion to Transfer Venue to Northern District of California. An initial case management conference has been scheduled for October 2019.
On March 21, 2019, Performance Design Products ("PDP") filed a complaint against the Company alleging trademark infringement. The Company filed a motion to dismiss the complaint on April 12, 2019. PDP filed its answeropposition and a request for a preliminary injunction on May 10, 2019. The Company filed its Reply in Support of its Motion to Dismiss on July 9, 2019 and its Opposition for Preliminary Injunction on July 12, 2019 with hearing set for August 2, 2019. The Court granted the Company's Motion to Dismiss on July 15, 2019 with leave to amend by July 19, 2019 and PDP filed an amended complaint.
On July 31, 2019, Valyrian IP LLC filed a patent infringement action against the Company.
In addition to the specific matters discussed above, the Company is involved in various legal proceedings and investigations arising in the normal course of conducting business. Where applicable, in relation to the matters described above, the Company has accrued an amount that reflects the aggregate liability deemed probable and estimable, but this amount is not material to the Company's financial condition, results of operations, or cash flows. The Company is not able to estimate an amount or range of any reasonably possible loss, including in excess of any amount accrued, because of the preliminary nature of many of these proceedings, the difficulty in ascertaining the applicable facts relating to many of these proceedings, the variable treatment of claims made in many of these proceedings, and the difficulty of predicting the settlement value of many of these proceedings. However, based upon the Company's historical experience, the resolution of these proceedings is not expected to have a material effect on the Company's financial condition, results of operations or cash flows. The Company may incur substantial legal fees, which are expensed as incurred, in defending against these legal proceedings.
8.9. DEBT
The estimated fair value and carrying value of the Company's outstanding debt as of June 30, 2019 and March 31, 2018 and September 30, 20182019 were as follows:
|
| | | | | | | | | | | | | | | |
| | June 30, 2019 | | March 31, 2019 |
| (in thousands) | Fair Value | | Carrying Value | | Fair Value | | Carrying Value |
| 5.50% Senior Notes | $ | 500,185 |
| | $ | 494,321 |
| | $ | 503,410 |
| | $ | 493,959 |
|
| Term loan facility | $ | 1,164,489 |
| | $ | 1,147,841 |
| | $ | 1,152,044 |
| | $ | 1,146,842 |
|
|
| | | | | | | | | | | | | | | |
| | March 31, 2018 | | September 30, 2018 |
| (in thousands) | Fair Value | | Carrying Value | | Fair Value | | Carrying Value |
| 5.50% Senior Notes | $ | 497,095 |
| | $ | 492,509 |
| | $ | 500,285 |
| | $ | 493,234 |
|
| Term loan facility | $ | — |
| | $ | — |
| | $ | 1,278,991 |
| | $ | 1,245,757 |
|
As of June 30, 2019, and March 31, 2018, and September 30, 2018,2019, the net unamortized discount, premium and debt issuance costs on ourthe Company's outstanding debt were $7.5$29.7 million and $36.0$31.0 million respectively.
5.50% Senior Notes
In May 2015, the Company issued $500.0 million aggregate principal amount of 5.50% senior notes (the “5.50% Senior Notes”). The 5.50% Senior Notes mature on May 31, 2023, and bear interest at a rate of 5.50% per annum, payable semi-annually on May 15 and November 15, commencing on November 15, 2015. The Company received net proceeds of $488.4 million from from the issuance of the 5.50% Senior Notes, net of issuance costs of $11.6 million which are being amortized to interest expense over the term of the 5.50% Senior Notes using the effective interest method. A portion of the proceeds was used to repay all then-outstanding amounts under ourthe Company's revolving line of credit agreement with Wells Fargo Bank and the remaining proceeds were used primarily for share repurchases.
The fair value of the 5.50% Senior Notes was determined based on inputs that were observable in the market, including the trading price of the 5.50% Senior Notes when available (Level 2).
The Company may redeem all or a part of the 5.50% Senior Notes, upon not less than 30 or more than a 60 day60-day notice; however, the applicable redemption price will be determined as follows:
|
| | | | | | | |
| | Redemption Period Requiring Payment of: | | Redemption Up To 35% Using Cash Proceeds From An Equity Offering(3): |
| | Make-Whole(1) | | Premium(2) | | Date | | Specified Price |
| 5.50% Senior Notes | Prior to May 15, 2018 | | On or after May 15, 2018 | | Prior to May 15, 2018 | | 105.500% |
(1) If the Company redeems the notes prior to the applicable date, the redemption price is principal plus a make-whole premium equal to the present value of the remaining scheduled interest payments as described in the applicable indenture, together with accrued and unpaid interest.
(2) If the Company redeems the notes on or after the applicable date, the price is principal plus a premium which declines over time as specified in the applicable indenture, together with accrued and unpaid interest.
(3) If the Company redeems the notes prior to the applicable date with net cash proceeds of one or more equity offerings, the price is equal to the amount specified above, together with accrued and unpaid interest, subject to a maximum redemption of 35% of the aggregate principal amount of the respective note being redeemed.
In addition, upon the occurrence of certain change of control triggering events, the Company may be required to repurchase the 5.50% Senior Notes, at a price equal to 101% of their principal amount, plus accrued and unpaid interest to the date of repurchase. The 5.50% Senior Notes contain restrictive covenants that, among other things, limit the Company's ability to create certain liens and enter into sale and leaseback transactions; create, assume, incur, or guarantee additional indebtedness of its subsidiaries without such subsidiary guaranteeing the 5.50% Senior Notes on an unsecured unsubordinated basis; and consolidate or merge with, or convey, transfer or lease all or substantially all of the assets of the Company and its subsidiaries to another person.
Credit Facility Agreement
In connection with the Polycom acquisition completedof Polycom on July 2, 2018, the Company entered into a Credit Agreement with Wells Fargo Bank, National Association, as administrative agent, and the lenders party thereto (the “Credit Agreement”). The Credit Agreement replaced the Company’s prior revolving credit facility in its entirety. The Credit Agreement provides for (i) a revolving credit facility with an initial maximum aggregate amount of availability of $100 million that matures in July 2023 and (ii) a $1.275 billion term loan facility priced at LIBOR plus 250bps due in quarterly principal installments commencing on the last business day of March, June, September and December 28, 2018beginning with the first full fiscal quarter ending after the Closing Date for the aggregate principal amount funded on the Closing Date multiplied by 0.25% (subject to prepayments outlined in the Credit Agreement) and all remaining outstanding principal due at maturity in July 2025. The Company borrowed the full amount available under the term loan facility of $1.245 billion, net of approximately $30 million of discounts and issuance costs which are being amortized to interest expense over the term of the agreement using the straight linestraight-line method which approximates the effective interest method for this debt. The proceeds from the initial borrowing under the Credit Agreement were used to finance the acquisition of Polycom,Acquisition, to refinance certain debt of Polycom, and to pay related fees, commissions and transaction costs. The Company has additional borrowing capacity under the Credit Agreement through the revolving credit facility which could be used to provide ongoing working capital and capital for other general corporate purposes of the Company and its subsidiaries. The Company’s obligations under the Credit Agreement are currently guaranteed by Polycom and will from time to time be guaranteed by, subject to certain exceptions, any domestic subsidiaries that may become material in the future. Subject to certain exceptions, the Credit Agreement is secured by first-priority perfected liens and security interests in substantially all of the personal property of the Company and each subsidiary guarantor and will from time to time also be secured by certain material real property that the Company or any subsidiary guarantor may acquire. Borrowings under the Credit Agreement bear interest due on a quarterly basis at a variable rate equal to (i) LIBOR plus a specified margin, or (ii) the base rate (which is the highest of (a) the prime rate publicly announced from time to time by Wells Fargo Bank, National Association, (b) the federal funds rate plus 0.50% or (c) the sum of 1% plus one-month LIBOR) plus a specified margin. The Company must also pay (i) an unused commitment fee ranging from 0.200% to 0.300% per annum of the average daily unused portion of the aggregate revolving credit commitments under the Credit Agreement, and (ii) a per annum fee equal to (a) for each performance standby letter of credit outstanding under the Credit Agreement with respect to non-financial contractual obligations, 50% of the applicable margin over LIBOR under the revolving credit facility in effect from time to time multiplied by the daily amount available to be drawn under such letter of credit, and (b) for each other letter of credit outstanding under the Credit Agreement, the applicable margin over LIBOR under the revolving credit facility in effect from time to time multiplied by the daily amount available to be drawn for such letter of credit.
The Credit Agreement contains various restrictions and covenants, including requirements that the Company maintain certain financial ratios at prescribed levels and restrictions on the ability of the Company and certain of its subsidiaries to consolidate or merge, create liens, incur additional indebtedness, dispose of assets, consummate acquisitions, make investments and pay dividends and other distributions. The Credit Agreement includes the following financial covenants applicable to the revolving credit facility only: (i) a maximum consolidated secured net leverage ratio (defined as, with certain adjustments and exclusions, the ratio of the Company’s consolidated secured indebtedness as of the end of the relevant fiscal quarter to consolidated net income before interest, taxes, depreciation, amortization, non-cash charges and certain other items (“EBITDA”) for the period of four fiscal quarters then ended) of 3.50 to 1.00 as of the last day of any fiscal quarter ending during the period from December 29, 2018 through June 29, 2019; 3.25 to 1.00 as of the last day of any fiscal quarter ending during the period from June 30, 2019 through March 28, 2020; 3.00 to 1.00 as of the last day of any fiscal quarter ending during the period from March 29, 2020 through April 3, 2021; and 2.75 to 1.00 as of the last day of any fiscal quarter ending on or after April 4, 2021; and (ii) a minimum interest coverage ratio (defined as, with certain adjustments, the ratio of the Company’s EBITDA to the Company’s consolidated interest expense to the extent paid or payable in cash) of 2.75 to 1.00 as of the last day of any fiscal quarter ending on or after December 29, 2018.The Credit Agreement also contains customary events of default. If an event of default under the Credit Agreement occurs and is continuing, then the lenders may declare any outstanding obligations under the Credit Agreement to be immediately due and payable; provided, however, that the occurrence of an event of default as a result of a breach of a financial covenant under the Credit Agreement does not constitute a default or event of default with respect to any term facility under the Credit Agreement unless and until the required revolving lenders shall have terminated their revolving commitments and declared all amounts outstanding under the revolving credit facility to be due and payable. In addition, if the Company, any subsidiary guarantor or, with certain exceptions, any other subsidiary becomes the subject of voluntary or involuntary proceedings under any bankruptcy, insolvency or similar law, then any outstanding obligations under the Credit Agreement will automatically become immediately due and payable. Loans outstanding under the Credit Agreement will bear interest at a rate of 2.00% per annum in excess of the otherwise applicable rate (i) while a payment or bankruptcy event of default exists or (ii) upon the lenders’ request, during the continuance of any other event of default.
The Company may prepay the loans and terminate the commitments under the Credit Facility Agreement at any time but will incur a 1% prepayment penalty if it prepaysrefinances within 6 months of entering into this credit agreement. As of SeptemberJune 30, 2018,2019, the Company has threefour outstanding letters of credit on the revolving credit facility for a total of $0.7$0.8 million. The fair value of the term loan facility was determined based on inputs that were unobservableobservable in the market (Level 3)2).
9.10. RESTRUCTURING AND OTHER RELATED CHARGES (CREDITS)
The Company's restructuring liabilities at the end of each period was as follows:
|
| | | | | | | | |
| | | As of September 30, |
| (in thousands) | | 2017 | | 2018 |
| Accrued expenses and other current liabilities | | $ | 438 |
| | $ | 4,843 |
|
| Other long-term liabilities | | — |
| | 5,790 |
|
| Total | | $ | 438 |
| | $ | 10,633 |
|
Summary of Restructuring Plans
Polycom post-acquisitionQ1 FY20 restructuring plan
During the quarter ended SeptemberJune 30, 2018,2019, the Company initiated a post-acquisitionpost-Acquisition restructuring plan to realignstreamline the Company's cost structure and resources to take advantageglobal workforce of operational efficiencies following the recent acquisition of Polycom.combined company. The costs incurred to date under this plan comprises of severance benefits from reduction in force actions initiated by management duringand legal entity rationalization.
Fiscal Year 2019 restructuring plans
During the period.
Polycom acquired restructuring liabilities
As a result of the acquisition of Polycom,Fiscal Year 2019, the Company assumed restructuring liabilities underinitiated post-Acquisition restructuring plans that were initiatedto realign the Company's cost structure, including streamlining the global workforce, consolidation of certain distribution centers in North America, and reduction of redundant legal entities, in order to take advantage of operational efficiencies following the Acquisition. The costs incurred to date under these plans approved by Polycom's management prior to the completion of our acquisition on July 2, 2018. As of September 30, 2018, the restructuring reserve was approximately $8.2 million andhave primarily comprised of severance benefits from reduction in force actions, facilities related actions initiated by management, and legal entity rationalization.
The Company's restructuring liabilities as of June 30, 2019 is as follows (amounts in thousands):
|
| | | | | | | | | | | | | | | | | | |
| | As of March 31, 2019 | Adoption of ASC 842 (1) | Accruals | Cash Payments | Adjustments | As of June 30, 2019 |
| FY 2019 Plans | | | | | | |
| Severance | $ | 5,889 |
| $ | — |
| — |
| $ | (3,115 | ) | $ | (119 | ) | $ | 2,655 |
|
| Facility | 7,376 |
| (7,376 | ) | — |
| — |
| — |
| — |
|
| Other | 10 |
| $ | — |
| — |
| — |
| 117 |
| $ | 127 |
|
| Total FY2019 Plans | $ | 13,275 |
| $ | (7,376 | ) | $ | — |
| $ | (3,115 | ) | $ | (2 | ) | $ | 2,782 |
|
| FY 2020 Plan | | | | | | |
| Severance | — |
| — |
| 14,755 |
| (8,830 | ) | (941 | ) | $ | 4,984 |
|
| Other | — |
| — |
| 5,713 |
| (5,713 | ) | — |
| — |
|
| Total FY2020 Plan | — |
| — |
| 20,468 |
| (14,543 | ) | (941 | ) | 4,984 |
|
| Severance | $ | 5,889 |
| $ | — |
| $ | 14,755 |
| $ | (11,945 | ) | $ | (1,060 | ) | $ | 7,639 |
|
| Facility | 7,376 |
| (7,376 | ) | — |
| — |
| — |
| — |
|
| Other | 10 |
| — |
| 5,713 |
| (5,713 | ) | 117 |
| 127 |
|
| Grand Total | $ | 13,275 |
| $ | (7,376 | ) | $ | 20,468 |
| $ | (17,658 | ) | $ | (943 | ) | $ | 7,766 |
|
(1) Includes adjustments to facilities-related liabilities which will continue to incur charges over the lifeupon adoption of the leases ranging from 2018 to 2023.ASC 842.
Plantronics legacy plan
During the quarter ended June 30, 2018, the Company executed a restructuring plan aimed at realigning its sales organization structure as part of a broader strategic objective to improve sales management and ensure proper investment across its geographic region.
During the first quarter of Fiscal Year 2018 and as part of its ongoing effort to reduce costs, improve profitability, and focus on its key strategic initiatives, the Company executed an asset sale agreement to dispose of substantially all assets of its Clarity division, primarily inventories and tooling fixed assets, for an immaterial sales price. The buyer in this arrangement was a former employee of the Company, who acted as Clarity's President but who was not an executive officer or director of the Company. As part of the buyer's separation from Plantronics, the Company accelerated vesting on his outstanding restricted stock, resulting in an immaterial stock-compensation modification charge.
In connection with the sale, the Company leased the facility it owns in Chattanooga, Tennessee, to the buyer. The Company also entered into a transition services agreement with the buyer to provide customer support services on a cost-recovery basis, which are not expected to be material. The Company also recorded immaterial impairment charges on assets previously used in Clarity operations that have no further value to the Company.
In addition to the sale of the Clarity division and the related restructuring actions, the Company reduced headcount in certain divisions and terminated a lease in the Netherlands before the end of its contractual term, resulting in a charge equal to the present value of the remaining future minimum lease payments. In connection with this exit, the Company wrote off certain fixed assets that will no longer be used. Finally, the Company reorganized its Brazilian operations and as a result, wrote off an unrecoverable indirect tax asset.
The associated charges for the six months ended September 30, 2018 and 2017 are recorded in restructuring and other related charges expense in the condensed consolidated statements of operations, as follows:
|
| | | | | | | | | | | | | | | | |
| | | Six Months Ended September 30, 2018 |
| (in millions) | | Total Charges | | Restructuring and Other Related Charges (Credits) | | Cost of Revenues | | Selling, General and Administrative |
| Polycom post-acquisition plan | | $ | 7.4 |
| | $ | 7.4 |
| | $ | — |
| | $ | — |
|
| Polycom acquired restructuring liability | | (0.3 | ) | | (0.3 | ) | | — |
| | — |
|
| Plantronics legacy plan | | 1.5 |
| | 1.5 |
| | — |
| | — |
|
| Totals | | $ | 8.6 |
| | $ | 8.6 |
| | $ | — |
| | $ | — |
|
|
| | | | | | | | | | | | | | | | |
| | | Six Months Ended September 30, 2017 |
| (in millions) | | Total Charges | | Restructuring and Other Related Charges (Credits) | | Cost of Revenues | | Selling, General and Administrative |
| Severance benefits from reduction in-force | | $ | 1.4 |
| | $ | 1.4 |
| | $ | — |
| | $ | — |
|
| Lease exit charge and impairments in Netherlands | | 0.7 |
| | 0.7 |
| | — |
| | — |
|
| Write-off of unrecoverable indirect tax asset in Brazil | | 0.7 |
| | — |
| | 0.7 |
| | — |
|
| Asset impairments related to previous Clarity operations | | 0.4 |
| | 0.4 |
| | — |
| | — |
|
| Loss on Clarity asset sale | | 0.9 |
| | — |
| | 0.9 |
| | — |
|
| Accelerated vesting of restricted stock | | 0.2 |
| | — |
| | — |
| | 0.2 |
|
| Totals | | $ | 4.3 |
| | $ | 2.5 |
| | $ | 1.6 |
| | $ | 0.2 |
|
10.11. COMPENSATION
Stock-based Compensation
The Company recognizes the grant-date fair value of stock-based compensation as compensation expense using the straight-line attribution approach over the service period for which the stock-based compensation is expected to vest. The following table summarizes the amount of stock-based compensation included in the condensed consolidated statements of operations:
|
| | | | | | | | | |
| | | Three Months Ended June 30, | |
| (in thousands) | | 2019 | | 2018 | |
| Cost of revenues | | $ | 978 |
| | $ | 963 |
| |
| | | | | | |
| Research, development, and engineering | | 3,719 |
| | 2,222 |
| |
| Selling, general, and administrative | | 8,207 |
| | 4,965 |
| |
| Stock-based compensation included in operating expenses | | 11,926 |
| | 7,187 |
| |
| Total stock-based compensation | | 12,904 |
| | 8,150 |
| |
| Income tax benefit | | 4 |
| | (3,754 | ) | |
| Total stock-based compensation, net of tax | | $ | 12,908 |
| | $ | 4,396 |
| |
|
| | | | | | | | | | | | | | | | |
| | | Three Months Ended September 30, | | Six Months Ended September 30, |
| (in thousands) | | 2017 | | 2018 | | 2017 | | 2018 |
| Cost of revenues | | $ | 890 |
| | $ | 1,073 |
| | $ | 1,792 |
| | $ | 2,036 |
|
| | | | | | | | | |
| Research, development, and engineering | | 2,008 |
| | 2,768 |
| | 4,109 |
| | 4,990 |
|
| Selling, general, and administrative | | 5,864 |
| | 6,999 |
| | 12,117 |
| | 11,964 |
|
| Stock-based compensation included in operating expenses | | 7,872 |
| | 9,767 |
| | 16,226 |
| | 16,954 |
|
| Total stock-based compensation | | 8,762 |
| | 10,840 |
| | 18,018 |
| | 18,990 |
|
| Income tax benefit | | (2,840 | ) | | (2,227 | ) | | (7,689 | ) | | (5,981 | ) |
| Total stock-based compensation, net of tax | | $ | 5,922 |
| | $ | 8,613 |
| | $ | 10,329 |
| | $ | 13,009 |
|
Long Term Incentive Plan (LTIP)
Prior to our acquisitionthe Acquisition of Polycom, certain Polycom employees were granted incentive rights under the Polycom, Inc. 2016 Long-Term Incentive Plan (“2016 LTIP”). As of the date of acquisition,Acquisition, Plantronics assumed the role of payer to participants of the plan2016 LTIP through its payroll but is indemnified by Triangle for obligations under the plan.2016 LTIP. The acquisitionAcquisition accelerated vesting under the 2016 LTIP at 75% of awards held by participants in service as of that date and triggered an initial amount due to such participants. The cash purchase price of the acquisitionAcquisition was reduced by this initial obligation. The remaining 25% of awards will vest upon one-year anniversary of the acquisition.Acquisition. Any future payments above the initial obligation under the plan,2016 LTIP, provided that the vesting requirements are satisfied, require Triangle to fund Plantronicsthe Company in order to pay participants for any amount in excess of the purchase price reduction.
At July 2, 2018, $7.9 million was recognized in Accrued liabilities assumed from Polycom and was paid in the second quarter of fiscal year 2019. The Company recognized an immaterial amount of compensation expense duringratably through the secondfirst quarter of fiscal 2019year 2020 in respect of the awards vesting on the one-year anniversary, which will be payable in the second quarter of fiscal year 2020. The amount due as of the acquisition date of the Acquisition is based on cash paid to Triangle that was distributed to its parents. Future distributions to its parents of cash made available to Triangle from the release of escrow accounts or the sale of shares issued in the transaction would trigger further compensation due to incentive rights holders under the plan. Since PlantronicsThe Company is indemnified for any obligations in excess of the reduction to purchase price, and because such amounts are not probable or estimable, no further amounts have been recognized.price.
11.12. COMMON STOCK REPURCHASES
From time to time, the Company's Board of Directors (the "Board") has authorized programs under which the Company may repurchase shares of its common stock, depending on market conditions, in the open market or through privately negotiated transactions. Repurchased shares are held as treasury stock until they are retired or re-issued. On November 28, 2018, the Board approved a 1 million share repurchase program expanding its capacity to repurchase shares to approximately 1.7 million shares. As of SeptemberJune 30, 20182019, there remained 730,1051,369,014 shares authorized for repurchase under the repurchase program approved byexisting stock repurchase.
For the Board on July 27, 2017. There were no remaining shares authorized under previously approved programs.
Repurchases byperiods ended June 30, 2019, and 2018, the Company pursuant to Board-authorized programs are showndid not repurchase any shares of its common stock.
The total value of shares withheld in satisfaction of employee tax obligations on the following table:
|
| | | | | | | | | |
| | | Six Months Ended September 30, | |
| (in thousands, except $ per share data) | | 2017 | | 2018 | |
| Shares of common stock repurchased in the open market | | 841,249 |
| | — |
| |
| Value of common stock repurchased in the open market | | $ | 39,222 |
| | $ | — |
| |
| Average price per share | | $ | 46.62 |
| | $ | — |
| |
| | | | | | |
| Value of shares withheld in satisfaction of employee tax obligations | | $ | 10,789 |
| | $ | 13,342 |
| |
vesting of equity awards for the three months ended June 30, 2019, and June 30, 2018 were $8.6 million and $13.0 million, respectively. The amounts withheld were equivalent to the employees' minimum statutory tax withholding requirements and are reflected as a financing activity within the Company's condensed consolidated statements of cash flows. These share withholdings have the same effect as share repurchases by the Company as they reduce the number of shares that would have otherwise been issued in connection with the vesting of shares subject to the restricted stock grants.
12.13. ACCUMULATED OTHER COMPREHENSIVE INCOMELOSS
The components of accumulated other comprehensive income ("AOCI"), net of immaterial tax effects, are as follows:
| | | (in thousands) | (in thousands) | | March 31, 2018 | | September 30, 2018 | (in thousands) | | June 30, 2019 | | March 31, 2019 |
Accumulated unrealized gain (loss) on cash flow hedges (1) | Accumulated unrealized gain (loss) on cash flow hedges (1) | | $ | (1,663 | ) | | $ | 2,798 |
| Accumulated unrealized gain (loss) on cash flow hedges (1) | | $ | (11,243 | ) | | $ | (5,310 | ) |
| Accumulated foreign currency translation adjustments | Accumulated foreign currency translation adjustments | | 4,685 |
| | 2,869 |
| Accumulated foreign currency translation adjustments | | 4,615 |
| | 4,835 |
|
| Accumulated unrealized loss on investments | Accumulated unrealized loss on investments | | (152 | ) | | — |
| Accumulated unrealized loss on investments | | — |
| | — |
|
| Accumulated other comprehensive income | | $ | 2,870 |
| | $ | 5,667 |
| |
| Accumulated other comprehensive income (loss) | | Accumulated other comprehensive income (loss) | | $ | (6,628 | ) | | $ | (475 | ) |
(1)Refer to Note 13,14, Derivatives, which discloses the nature of the Company's derivative assets and liabilities as of June 30, 2019and March 31, 2018and September 30, 2018.2019.
13.14. DERIVATIVES
Foreign Currency Derivatives
The Company's foreign currency derivatives consist primarily of foreign currency forward exchange contracts and option contracts. The Company does not purchase derivative financial instruments for speculative trading purposes. The derivatives expose the Company to credit risk to the extent the counterparties may be unable to meet the terms of the derivative instrument. The Company's maximum exposure to loss that it would incur due to credit risk if parties to derivative contracts failed completely to perform according to the terms of the contracts was equal to the carrying value of the Company's derivative assets as of SeptemberJune 30, 2018.2019. The Company seeks to mitigate such risk by limiting its counterparties to large financial institutions. In addition, the Company monitors the potential risk of loss with any one counterparty resulting from this type of credit risk on an ongoing basis.
The Company enters into master netting arrangements with counterparties when possible to mitigate credit risk in derivative transactions. A master netting arrangement may allow each counterparty to net settle amounts owed between the Company and the counterparty as a result of multiple, separate derivative transactions. As of SeptemberJune 30, 20182019, the Company had International Swaps and Derivatives Association (ISDA)("ISDA") agreements with four applicable banks and financial institutions which contained netting provisions. Plantronics has elected to present the fair value of derivative assets and liabilities on the Company's condensed consolidated balance sheet on a gross basis even when derivative transactions are subject to master netting arrangements and may otherwise qualify for net presentation. For each counterparty, if netted, the Company would offset the asset and liability balances of all derivatives at the end of the reporting period. Derivatives not subject to master netting agreements are not eligible for net presentation. As of June 30, 2019, and March 31, 2018 and September 30, 2018,2019, no cash collateral had been received or pledged related to these derivative instruments.
The gross fair value of the Company's outstanding derivative contracts at the end of each period was as follows:
|
| | | | | | | | |
| (in thousands) | | June 30, 2019 | | March 31, 2019 |
Derivative Assets(1) | | | | |
| Non-designated hedges | | $ | 86 |
| | $ | 327 |
|
| Cash flow hedges | | 1,189 |
| | 2,856 |
|
| Total derivative assets | | $ | 1,275 |
| | $ | 3,183 |
|
| | | | | |
Derivative Liabilities(2) | | | | |
| Non-designated hedges | | $ | 731 |
| | $ | 39 |
|
| Cash flow hedges | | 970 |
| | 843 |
|
| Interest rate swap | | 15,004 |
| | 8,594 |
|
| Accrued interest | | 9 |
| | 7 |
|
| Total derivative liabilities | | $ | 16,714 |
| | $ | 9,483 |
|
|
| | | | | | | | |
| (in thousands) | | March 31, 2018 | | September 30, 2018 |
Derivative Assets(1) | | | | |
| Non-designated hedges | | $ | 218 |
| | $ | 317 |
|
| Cash flow hedges | | 554 |
| | 2,496 |
|
| Interest rate swap | | — |
| | 2,691 |
|
| Total derivative assets | | $ | 772 |
| | $ | 5,504 |
|
| | | | | |
Derivative Liabilities(2) | | | | |
| Non-designated hedges | | $ | 34 |
| | $ | 143 |
|
| Cash flow hedges | | 3,003 |
| | 465 |
|
| Interest rate swap | | — |
| | 1,570 |
|
| Accrued interest | | — |
| | 13 |
|
| Total derivative liabilities | | $ | 3,037 |
| | $ | 2,191 |
|
(1) Short-term derivative assets are recorded in "other current assets" and long-term derivative assets are recorded in "deferred tax and other assets". As of SeptemberJune 30, 20182019, the portion of derivative assets classified as long-term was immaterial.
(2) Short-term derivative liabilities are recorded in "accrued liabilities" and long-term derivative liabilities are recorded in "other long-term liabilities". As of SeptemberJune 30, 20182019, the portion of derivative liabilities classified as long-term was immaterial.
Non-Designated Hedges
As of SeptemberJune 30, 2018,2019, the Company had foreign currency forward contracts denominated in Euros ("EUR"), British Pound Sterling ("GBP"), and Australian Dollars ("AUD"), and Canadian Dollars ("CAD"). The Company does not elect to obtain hedge accounting for these forward contracts. These forward contracts hedge against a portion of the Company’s foreign currency-denominated cash balances, receivables, and payables. The following table summarizes the notional value of the Company’s outstanding foreign exchange currency contracts and approximate U.S. Dollar ("USD") equivalent at SeptemberJune 30, 20182019:
|
| | | | | | | | | | | |
| (in thousands) | Local Currency | | USD Equivalent | | Position | | Maturity |
| EUR | € | 34,000 |
| | $ | 38,786 |
| | Sell EUR | | 1 month |
| GBP | £ | 10,500 |
| | $ | 13,363 |
| | Sell GBP | | 1 month |
| AUD | A$ | 9,640 |
| | $ | 6,765 |
| | Sell AUD | | 1 month |
|
| | | | | | | | | | | |
| (in thousands) | Local Currency | | USD Equivalent | | Position | | Maturity |
| EUR | € | 31,000 |
| | $ | 36,104 |
| | Sell EUR | | 1 month |
| GBP | £ | 8,400 |
| | $ | 10,968 |
| | Sell GBP | | 1 month |
| AUD | A$ | 18,000 |
| | $ | 13,026 |
| | Sell AUD | | 1 month |
| CAD | C$ | 2,000 |
| | $ | 1,549 |
| | Sell CAD | | 1 month |
Effect of Non-Designated Derivative Contracts on the Condensed Consolidated Statements of Operations
The effect of non-designated derivative contracts recognized in other non-operating income and (expense), net in the condensed consolidated statements of operations was as follows:
|
| | | | | | | | |
| | | Three Months Ended June 30, |
| (in thousands) | | 2019 | | 2018 |
| Gain (loss) on foreign exchange contracts | | $ | (289 | ) | | $ | 4,152 |
|
|
| | | | | | | | | | | | | | | | |
| | | Three Months Ended September 30, | | Six Months Ended September 30, |
| (in thousands) | | 2017 | | 2018 | | 2017 | | 2018 |
| Gain (loss) on foreign exchange contracts | | $ | (2,102 | ) | | $ | 890 |
| | $ | (5,235 | ) | | $ | 5,041 |
|
Cash Flow Hedges
Costless Collars
The Company hedges a portion of the forecasted EUR and GBP denominated revenues with costless collars. On a monthly basis, the Company enters into option contracts with a six to eleven montheleven-month term. Collar contracts are scheduled to mature at the beginning of each fiscal quarter, at which time the instruments convert to forward contracts. The Company also enters into cash flow forwards with a three monththree-month term. Once the hedged revenues are recognized, the forward contracts become non-designated hedges to protect the resulting foreign monetary asset position for the Company.
The notional value of the Company's outstanding EUR and GBP option and forward contracts at the end of each period was as follows:
|
| | | | | | | | |
| (in millions) | | June 30, 2019 | | March 31, 2018 | | September 30, 20182019 |
(in millions) | | EUR | | GBP | | EUR | | GBP |
| Option contracts | | €50.882.6 | | £15.627.4 | | €49.076.8 | | £16.725.8 |
| Forward contracts | | €35.057.9 | | £10.720.8 | | €36.455.4 | | £12.518.0 |
The Company will reclassify all amounts accumulated in other comprehensive income into earnings within the next twelve months.
Cross-currency Swaps
The Company hedges a portion of the forecasted Mexican Peso (“MXN”) denominated expenditures with a cross-currency swap. As of June 30, 2019, and March 31, 2018 and September 30, 2018,2019, the Company had foreign currency swap contracts of approximately MXN 31.893.2 million and MXN 0.0149.7 million, respectively.
The following table summarizes the notional value of the Company's outstanding MXN currency swaps and approximate USD Equivalent at June 30, 2019:
|
| | | | | | | | |
| | Local Currency | USD Equivalent | Position | Maturity |
| | (in thousands) | (in thousands) | | |
| MX$ | $ | 93,170 |
| $ | 4,691 |
| Buy MXN | Monthly over 6 months |
Interest Rate Swap
On July 30, 2018, the Company entered into a 4-year amortizing interest rate swap agreement with Bank of America, NA. The swap has an initial notional amount of $831 million and matures on July 31, 2022. The swap involves the receipt of floating-rate interest payments for fixed interest rate payments at a rate of 2.78% over the life of the agreement. We haveThe Company has designated this interest rate swap as a cash flow hedge. The purpose of this swap is to hedge against changes in cash flows (interest payments) attributable to fluctuations in ourthe Company's variable rate debt. The derivative is valued based on prevailing LIBOR rate curves on the date of measurement. The Company also evaluates counterparty credit risk when it calculates the fair value of the swap. The effective portion of changes in the fair value of the derivative is recorded to other comprehensive income (loss) on the accompanying balance sheets and reclassified into interest expense over the life of the underlying debt as interest on ourthe Company's floating rate debt is accrued. We reviewThe Company reviews the effectiveness of this instrument on a quarterly basis, recognize current period hedge ineffectiveness immediately in earnings and will discontinue hedge accounting if wethe Company no longer considerconsiders hedging to be highly effective. This hedge was fully effective at inception on July 30, 2018 and as of the sixthree months ended SeptemberJune 30, 2018.2019. During the sixthree months ended SeptemberJune 30, 2018, we2019, the Company recorded a loss of $0.98$0.7 million on ourits interest rate swap derivative designated as a cash flow hedge.
Effect of Designated Derivative Contracts on AOCI and Condensed Consolidated Statements of Operations
The following table presents the pre-tax effects of derivative instruments designated as cash flow hedges on accumulated other comprehensive income and the condensed consolidated statements of operations for the three and six months ended SeptemberJune 30, 20172019 and 2018:
|
| | | | | | | | |
| | | Three Months Ended June 30, |
| (in thousands) | | 2019 | | 2018 |
| Gain (loss) included in AOCI as of beginning of period | | $ | (7,480 | ) | | $ | (1,693 | ) |
| | | | | |
| Amount of gain (loss) recognized in other comprehensive income (“OCI”) (effective portion) | | (6,704 | ) | | 3,956 |
|
| | | | | |
| Amount of (gain) loss reclassified from OCI into net revenues (effective portion) | | (1,359 | ) | | (249 | ) |
| Amount of (gain) loss reclassified from OCI into cost of revenues (effective portion) | | (104 | ) | | (79 | ) |
| Amount of (gain) loss reclassified from OCI into interest expense (effective portion) | | 652 |
| | — |
|
| Total amount of (gain) loss reclassified from AOCI to income (loss) (effective portion) | | (811 | ) | | (328 | ) |
| | | | | |
| Gain (loss) included in AOCI as of end of period | | $ | (14,995 | ) | | $ | 1,935 |
|
|
| | | | | | | | | | | | | | | | |
| | | Three Months Ended September 30, | | Six Months Ended September 30, |
| (in thousands) | | 2017 | | 2018 | | 2017 | | 2018 |
| Gain (loss) included in AOCI as of beginning of period | | $ | (1,744 | ) | | $ | 1,935 |
| | $ | 541 |
| | $ | (1,693 | ) |
| | | | | | | | | |
Amount of gain (loss) recognized in other comprehensive income (“OCI”) (effective portion) | | (2,302 | ) | | 813 |
| | (4,647 | ) | | 4,769 |
|
| | | | | | | | | |
| Amount of (gain) loss reclassified from OCI into net revenues (effective portion) | | 1,131 |
| | (900 | ) | | 1,149 |
| | (1,149 | ) |
| Amount of (gain) loss reclassified from OCI into cost of revenues (effective portion) | | (174 | ) | | — |
| | (132 | ) | | (79 | ) |
| Amount of (gain) loss reclassified from OCI into interest expense (effective portion) | | — |
| | 977 |
| | — |
| | 977 |
|
| Total amount of (gain) loss reclassified from AOCI to income (loss) (effective portion) | | 957 |
| | 77 |
| | 1,017 |
| | (251 | ) |
| | | | | | | | | |
| Gain (loss) included in AOCI as of end of period | | $ | (3,089 | ) | | $ | 2,825 |
| | $ | (3,089 | ) | | $ | 2,825 |
|
For the period presented prior to the first quarter of fiscal year 2020, the ineffective and excluded portion of the realized and unrealized gain or loss was included in other non-operating income (expense). As a result of adopting ASU 2017-12, beginning in the first quarter of fiscal year 2020, the excluded portion of such amounts is included in the same line item in which the underlying transactions affect earnings and the ineffective portion of the realized and unrealized gains or losses on derivatives is included as a component of accumulated other comprehensive income. During the three and six months ended SeptemberJune 30, 2017 and2019, the Company did not have an ineffective portion of its cash flow hedges. During the three months ended June 30, 2018, the Company recognized an immaterial gain and immaterial loss on the ineffective portion of its cash flow hedges, respectively, which is reported in other non-operating income and (expense), net in the condensed consolidated statements of operations.hedges.
14.15. INCOME TAXES
The Company and its subsidiaries are subject to taxation in the U.S. and in various foreign and state jurisdictions. The Company's tax provision or benefit is determined using an estimate of ourits annual effective tax rate and adjusted for discrete items that are taken into account in the relevant period. The effective tax rates for the three months ended SeptemberJune 30, 20172019 and 2018 were 19.3%14.4% and 19.9%5.5%, respectively. The
For the three months ended June 30, 2019, the Company recognized a discrete $11.6 million net tax benefit related to an intra-entity transfer of an intangible asset that will have a deferred future benefit, which increased our effective tax rates forrate by 22.2%.
On June 7, 2019, a Ninth Circuit panel reversed the six months ended September 30,United States Tax Court’s holding in Altera Corp. v. Commissioner, and upheld the portion of the Treasury regulations issued under IRC Section 482 requiring related-party participants in a cost sharing arrangement to share stock-based compensation costs. As a result, the Company recorded a $8.6 million discrete tax charge resulting from the cost sharing of prior stock-based compensation, partially offset by a reduction to the 2017 and 2018 were 7.2% and 22.3%, respectively. Unlike previous years, the period over period tax rate has been and may continue to be subject to variations relating to several factors including but not limited to changes from U.S. Internal Revenue Service ("IRS") rule making and interpretation of US tax legislation, including the Tax Cuts and Jobs Act (H.R. 1) (the "Act") statutory tax ratestoll charge accrued in prior periods, which reduced 35% to 21%, adjustments to foreign tax regimes, interest expense limitations, mix of jurisdictional income and expense, cost and deductibility of acquisitions expenses (including integration), foreign currency gains (losses) and changes in deferred tax assets and liabilities and their valuation or utilization.
As a result, of the current period loss before income taxes during the three and six months ended September 30, 2018, recurring permanent tax benefits increased theour effective tax rate where discrete prior year benefits reduced the effective tax rate on profits before tax generated during the three and six months ended September 30, 2017. For the three and six months ended September 30, 2018 the effective tax rate changed through a release of a valuation allowance for California R&D credits. Prior to the acquisition of Polycom, the Company had limited utilization over future periods and recognized a valuation allowance. With the acquisition of Polycom the California R&D tax credits will decrease resulting in full utilization. Other increases to the effective tax rate for the six-month period ended September 30, 2018 are attributable to the Act and the new mandatory charge on global intangible low-taxed income on previously deferred overseas income.by 16.5%.
Due to the timing of the enactment and the complexity involved in applying the provisions of the the Act, we made reasonable estimates of the effects and recorded provisional amounts in our financial statements as of December 31, 2017. As we collect and prepare necessary data, and interpret the Act and any additional guidance issued by the U.S. Treasury Department, the IRS, and other standard-setting bodies, we may make adjustments to the provisional amounts. Those adjustments may materially affect ourThe Company's provision for income taxes also included excess tax benefits associated with employee equity plans of ($2.5) million and $2.8 million, which reduced our effective tax rate in the period in which the adjustments are made. The adjustments made in the second quarter of 2018 were not significant. The accountingby 4.7 percentage points and 18.0 percentage points, for the tax effects of the Act will be completed later in 2018.
For the global intangible low-taxed income provisions of the Act, the Company has not yet elected an accounting policy with respect to either recognize deferred taxes for basis differences expected to reverse as global intangible low-taxed income, or to record such as period costs if and when incurred. The Company will continue to assess forthcoming guidance and accounting interpretations on the effects of the Tax Act and expects to complete its analysis within the measurement period in accordance with the SEC guidance.
During the three months ended SeptemberJune 30, 2019, and 2018, respectively.
The Company is subject to the examination of its income tax returns by the Internal Revenue Service and other tax authorities. Significant judgment is required in evaluating our uncertain tax positions and determining the Company's provision for income taxes. As of June 30, 2019, the Company released its partial valuation allowance against California R&D credits. This release washad a direct result of the Polycom acquisition, as fewer credits are expected to be generated in California as a percentage of worldwide taxable income in future periods.
Included in long-term income taxes payable in the condensed consolidated balance sheets as of March 31, 2018 and September 30, 2018 weretotal gross unrecognized tax benefits of $12.6$36.9 million and $26.2compared with $12.8 million respectively, which would favorably impact the effective tax rate in future periods if recognized.as of June 30, 2018. The increase is predominantly due to acquired uncertain tax benefits of Polycom. The Company’s continuing practice is to recognize interest and/or penalties related to income tax matters in income tax expensePolycom, as well as a $9.2 million increase in the condensed consolidated statementscurrent quarter from the cost sharing of operations. The accrued interest related toprior stock-based compensation. If recognized, the gross unrecognized tax benefits was immaterial as of March 31, 2018 and September 30, 2018, respectively. No penalties have been accrued.
The Company believes that an adequate provision has been made for any adjustments that may result fromwould reduce the effective tax examinations; however, the outcome of such examinations cannot be predicted with certainty. If any issues addressed in the tax examinations are resolved in a manner inconsistent with the Company's expectations, the Company could be required to adjust its provision for income taxrate in the period such resolution occurs. The timing of any resolution and/or closure of tax examinations is not certain.recognition.
15.
16. COMPUTATION OF EARNINGS (LOSS) PER COMMON SHARE
Basic earnings (loss) per share is calculated by dividing net income (loss) associated with common shareholders by the weighted-average number of common shares outstanding during the period. Diluted earnings (loss) per share assumes the issuance of additional shares of common stock by the Company upon exercise of all outstanding stock options and vesting of restricted stock, if the effect is dilutive, in accordance with the treasury stock method or two-class method (whichever is more dilutive). Refer to Note 1, Basis of Presentation, for additional information regarding the Company's computation of earnings (loss) per common share.
The following table sets forth the computation of basic and diluted earnings (loss) per common share for the three and six months ended SeptemberJune 30, 20172019, and 2018:
|
| | | | | | | | |
| | | Three Months Ended June 30, |
| (in thousands, except per share data) | | 2019 | | 2018 |
| Basic earnings (loss) per common share: | | | | |
| Numerator: | | | | |
| Net income (loss) | | $ | (44,871 | ) | | $ | 14,471 |
|
| | | | | |
| Denominator: | | | | |
| Weighted average common shares, basic | | 39,239 |
| | 32,594 |
|
| Dilutive effect of employee equity incentive plans | | — |
| | 940 |
|
| Weighted average common shares-diluted | | 39,239 |
| | 33,534 |
|
| | | | | |
| Basic earnings (loss) per common share | | $ | (1.14 | ) | | $ | 0.43 |
|
| Diluted earnings (loss) per common share | | $ | (1.14 | ) | | $ | 0.42 |
|
| | | | | |
| Potentially dilutive securities excluded from diluted earnings (loss) per common share because their effect is anti-dilutive | | 706 |
| | 202 |
|
|
| | | | | | | | | | | | | | | | |
| | | Three Months Ended September 30, | | Six Months Ended September 30, |
| (in thousands, except per share data) | | 2017 | | 2018 | | 2017 | | 2018 |
| Basic earnings (loss) per common share: | | | | | | | | |
| Numerator: | | | | | | | | |
| Net income (loss) | | $ | 19,953 |
| | $ | (86,709 | ) | | $ | 38,781 |
| | $ | (72,238 | ) |
| | | | | | | | | |
| Denominator: | | | | | | | | |
| Weighted average common shares, basic | | 32,570 |
| | 39,281 |
| | 32,538 |
| | 35,938 |
|
| Dilutive effect of employee equity incentive plans | | 239 |
| | — |
| | 573 |
| | — |
|
| Weighted average common shares-diluted | | 32,809 |
| | 39,281 |
| | 33,111 |
| | 35,938 |
|
| | | | | | | | | |
| Basic earnings (loss) per common share | | $ | 0.59 |
| | $ | (2.21 | ) | | $ | 1.16 |
| | $ | (2.01 | ) |
| Diluted earnings (loss) per common share | | $ | 0.59 |
| | $ | (2.21 | ) | | $ | 1.14 |
| | $ | (2.01 | ) |
| | | | | | | | | |
| Potentially dilutive securities excluded from diluted earnings (loss) per common share because their effect is anti-dilutive | | 1,389 |
| | 567 |
| | 959 |
| | 385 |
|
16.17. REVENUE AND MAJOR CUSTOMERS
The Company designs, manufactures, markets, and sells headsets for business and consumer applications. As part of our recent acquisition of Polycom,After the CompanyAcquisition, it also markets and sells voice, video, and content sharing Unified Communications & Collaboration (“UC&C”)&C solutions.
With respect to headsets, the Company makes products for use in offices and contact centers, with mobile devices, cordless phones, and with computers and gaming consoles. Major headset product categories include Enterprise Headsets, which includes corded and cordless communication headsets, audio processors, and telephone systems; and Consumer Headsets, which includes Bluetooth and corded products for mobile device applications, personal computer, ("PC"), and gaming headsets. The voice, video,Voice, Video, and content sharing solutionsContent Sharing Solutions include products like group series video and immersive telepresence systems, desktop voice and video devices, and universal collaboration servers.
Product revenue is largely comprised of sales of hardware devices, peripherals, and platform software licenses used in communication and collaboration in offices and contact centers, with mobile devices, cordless phones, and with computers and gaming consoles. Services revenue primarily includes support on hardware devices, professional, hosted and managed services, and solutions to ourthe Company's customers.
The following table disaggregates revenues by major product category for the three and six months ended SeptemberJune 30, 20172019 and 2018:
| | | | | Three Months Ended September 30, | | Six Months Ended September 30, | | Three Months Ended June 30, |
| (in thousands) | | 2017 | | 2018 | | 2017 | | 2018 | | 2019 | | 2018 |
| Net revenues from unaffiliated customers: | | | | | | | | | | | | |
| Enterprise Headset | | $ | 162,907 |
| | $ | 169,978 |
| | $ | 317,512 |
| | $ | 337,620 |
| |
| Consumer Headset | | 47,393 |
| | 58,053 |
| | 96,714 |
| | 111,720 |
| |
| Enterprise Headsets | | | $ | 175,084 |
| | $ | 167,642 |
|
| Consumer Headsets | | | 43,566 |
| | 53,667 |
|
| Voice* | | — |
| | 121,309 |
| | — |
| | 121,309 |
| | 103,847 |
| | — |
|
| Video* | | — |
| | 85,922 |
| | — |
| | 85,922 |
| | 60,248 |
| | — |
|
| Services* | | — |
| | 47,807 |
| | — |
| | 47,807 |
| | 65,022 |
| | — |
|
| Total net revenues | | $ | 210,300 |
| | $ | 483,069 |
| | $ | 414,226 |
| | $ | 704,378 |
| | $ | 447,767 |
|
| $ | 221,309 |
|
*Categories were introduced with the acquisition of Polycom on July 2, 2018, and amounts are presented net of purchase accounting adjustments. Refer to Note 3, Acquisition, Goodwill, and Acquired Intangible Assets, of the Condensed Consolidated Financial Statements for additional information regarding this acquisition.
For reporting purposes, revenue is attributed to each geographic region based on the location of the customer. Other than the U.S., no country accounted for 10% or more of the Company's net revenues for the three and six months ended SeptemberJune 30, 20172019 and 2018. The following table presents net revenues by geography:
|
| | | | | | | | |
| | | Three Months Ended June 30, |
| (in thousands) | | 2019 | | 2018 |
| Net revenues from unaffiliated customers: | | | | |
| U.S. | | $ | 224,827 |
| | $ | 113,986 |
|
| | | | | |
| Europe and Africa | | 116,979 |
| | 63,590 |
|
| Asia Pacific | | 74,848 |
| | 26,871 |
|
| Americas, excluding U.S. | | 31,113 |
| | 16,862 |
|
| Total international net revenues | | 222,940 |
| | 107,323 |
|
| Total net revenues | | $ | 447,767 |
| | $ | 221,309 |
|
|
| | | | | | | | | | | | | | | | |
| | | Three Months Ended September 30, | | Six Months Ended September 30, |
| (in thousands) | | 2017 | | 2018 | | 2017 | | 2018 |
| Net revenues from unaffiliated customers: | | | | | | | | |
| U.S. | | $ | 111,095 |
| | $ | 233,629 |
| | $ | 219,905 |
| | $ | 347,615 |
|
| | | | | | | | | |
| Europe and Africa | | 56,325 |
| | 128,957 |
| | 111,141 |
| | 192,547 |
|
| Asia Pacific | | 24,227 |
| | 87,471 |
| | 48,111 |
| | 114,342 |
|
| Americas, excluding U.S. | | 18,653 |
| | 33,012 |
| | 35,069 |
| | 49,874 |
|
| Total international net revenues | | 99,205 |
| | 249,440 |
| | 194,321 |
| | 356,763 |
|
| Total net revenues | | $ | 210,300 |
| | $ | 483,069 |
| | $ | 414,226 |
| | $ | 704,378 |
|
One customer,Two customers, ScanSource and Ingram Micro Group, accounted for 12.4%17.4% and 12.2% for the three and six months ended September 30, 2017 respectively. One customer, ScanSource, accounted for 14.4% and 14.0%16.9%, respectively, of net revenues for the three and six months ended SeptemberJune 30, 2018 respectively.2019. No customer accounted for more than 10% of net revenues for the three months ended June 30, 2018.
Two customers, D&H Distributors and Ingram Micro Group and ScanSource accounted for 13.0%29.1% and 12.4%17.5% respectively, of total net accounts receivable at June 30, 2019. Three customers, Ingram Micro Group, ScanSource, and D&H Distributors, accounted for 21.3%, 19.2%, and 10.9% respectively, of total net accounts receivable at March 31, 2018. Two customers, Ingram Micro Group and ScanSource, accounted for 20% and 15% respectively, of total net accounts receivable at September 30, 2018.2019.
Revenue is recognized when obligations under the terms of a contract with the Company's customer are satisfied; generally, this occurs with the transfer of control of its products or services. Revenue is measured as the amount of consideration the Company expects to receive in exchange for transferring goods or providing services. The majority of ourthe Company's business relates to physical product shipments, for which revenue is generally recognized once title and risk of loss of the product are transferred to the customer. The Company believes that transfer of title and risk of loss best represent the moment at which the customer’s ability to direct the use of and obtain substantially all the benefits of an asset have been achieved. The Company has elected to recognize the cost for freight and shipping when control over products have transferred to the customer as an expense in Cost of Revenues.Revenues when freight costs are included as part of the selling price. For products where freight is charged separately, it is recognized as revenue since the service is provided after title has transferred to the customer.
The Company's service revenue areis recognized either over-time or at a point-in-time depending on the nature of the offering. Revenues associated with non-cancellablenon-cancelable maintenance and support contracts comprise approximately 90% of ourthe Company's overall service revenue and are recognized ratably over the contract term which typically ranges between one and three years. The Company believes this recognition period faithfully depicts the pattern of transfer of control for maintenance and support as the services are provided in relatively even incrementsa series of distinct services available and on adelivered daily basis.over the term. For certain products, support is provided free of charge without the purchase of a separate maintenance contract. If the support is determined to rise to the level of a performance obligation, we allocatethe Company allocates a portion of the transaction price to the implied support obligation and recognize service revenue over the estimated implied support period which can range between one month to several years, depending on the circumstances. Revenues associated with Professional Services are recognized when the Company has objectively determined that the obligation has been satisfied, which is usually upon customer acceptance.
OurThe Company's contracts with customers often include promises to transfer multiple products and services to a customer. Determining whether products and services are considered distinct performance obligations that should be accounted for separately versus together may require significant judgment. We allocateThe Company allocates the transaction price of a contract, to each identified performance obligation based on stand-alone selling price (“SSP”). A fixed discount is always subject to allocation in this manner. If the transaction price is considered variable, the Company determines if the consideration is associated with one or many, but not all of the performance obligations and allocates accordingly. Judgment is also required to determine the stand-alone selling price (“SSP") for each distinct performance obligation. We deriveThe Company derives SSP for ourits performance obligations through a stratification methodology and consider a few characteristics including consideration related to different service types, customer and geography characteristics. We useThe Company uses a single amount to estimate SSP for items that are not sold separately, such as maintenance on term-based licenses. In instances where SSP is not directly observable, such as when we dothe Company does not sell the product or service separately, we determinethe Company determines the SSP using information that may include market conditions and other observable inputs.
On occasion, the Company will fulfill only part of a purchase order due to lack of current availability for one or more items requested on an order. Its practice is to ship what is on hand, with the remaining goods shipped once the product is in stock which is generally less than one year from the date of the order. Depending on the terms of the contract or operationally, undelivered or backordered items may be canceled by either party at their discretion.
As of SeptemberJune 30, 2018, our2019, the Company's deferred revenue balance was $147.1$196.0 million. As of March 31, 2018, our2019, the Company's deferred revenue balance was immaterial. The change is explained by$193.9 million. During the acquisitionthree months ended June 30, 2019, the Company recognized $51.2 million in revenues that were reflected in deferred revenue at the beginning of Polycom on July 2, 2018 and the acquired deferred service revenue balances in addition to new service contracts entered into subsequent to the acquisition.period.
The table below represents aggregate amount of the transaction price allocated to the performance obligations that are unsatisfied (or partially unsatisfied) as of SeptemberJune 30, 2018:2019:
|
| | | | | | | | | | | | |
| | | June 30, 2019 |
| (in millions) | | Current | | Noncurrent | | Total |
| Performance obligations | | $ | 143.7 |
| | $ | 56.6 |
| | $ | 200.3 |
|
|
| | | | | | | | | | | | |
| | | September 30, 2018 |
| (in millions) | | Current | | Noncurrent | | Total |
| Polycom performance obligations | | $ | 136.2 |
| | $ | 45.8 |
| | $ | 182.0 |
|
Upon establishment of creditworthiness, the Company may extend credit terms to its customers which typically ranges between 30 and 90 days from the date of invoice depending on geographic region and type of customer. The Company typically bills upon product hardware shipment,at time of software activation or upon completion of services. Revenue is not generallymay be recognized in advance of billing,billings due to upfront payments for multiple year time-based software purchases, revenue allocations related to partial shipments, and any resultingthe reassessment of contracts previously treated as leases under ASC 840. The balance of contract asset balances at period end are not considered significant.assets as of March 31, 2019 was $2.4 million. None of ourthe Company's contracts are deemed to have significant financing components.
Sales, value add, and other taxes collected concurrent with revenue producing activities are excluded from revenue.
Commercial distributors and retailers represent the Company's largest sources of net revenues. Sales through its distribution and retail channels are made primarily under agreements allowing for rights of return and include various sales incentive programs, such as back end rebates, discounts, marketing development funds, price protection, and other sales incentives. The Company has an established sales history for these arrangements and we recordthe Company records the estimated reserves at the inception of the contract as a reflection of the reduced transaction price. Customer sales returns are estimated based on historical data, relevant current data, and the monitoring of inventory build-up in the distribution channel. Revenue reserves represent a reasonable estimation made by management and are subject to significant judgment. Estimated reserves may differ from actual returns or incentives provided, due to unforeseen customer return or claim patterns or changes in circumstances. For certain customer contracts which have historically demonstrated variability, we havethe Company has considered the likelihood of being under-reserved and have considered a constraint accordingly. Provisions for Sales Returns are presented within Accrued Liabilities in the Company's Consolidated Balance Sheets. Provisions for promotions, rebates, and other sales incentives are presented as a reduction of Accounts Receivable unless there is no identifiable right offset, in which case they are presented within Accrued Liabilities on its Consolidated Balance Sheets. Refer toSee Note 6, Details of Certain Balance Sheet Accounts above for additional details.
For certain arrangements, the Company pays commissions, bonuses and taxes associated with obtaining the contracts. The Company capitalizes such costs if they are deemed to be incremental and recoverable. We haveThe Company has elected to use the practical expedient to record the incremental costs of obtaining a contract as an expense when incurred if the amortization period of the asset that the entity otherwise would have recognized is one year or less. Determining the amortization period of costs related to obtaining a contract involves judgment. Capitalized commissions and related expenses, on hardware sales and services recognized at a point in time generally have an amortization period of less than one year. Maintenance-related performance obligations generally have an amortization period greater than one year when considering renewals. Capitalized commissions are amortized to Sales and Marketing Expense on a straight-line basis. The capitalized amount of incremental and recoverable costs of obtaining contracts with an amortization period of greater than one year are $0.9$3.1 million as of SeptemberJune 30, 2018.2019. Amortization of capitalized contract costs for the three and six months ended SeptemberJune 30, 20182019 was immaterial.
17.18. SUBSEQUENT EVENTS
Dividends
On NovemberAugust 6, 2018 ,2019, the Company announced that itsthe Audit Committee had declared and approved the payment of a dividend of $0.15 per share on DecemberSeptember 10, 20182019 to holders of record on NovemberAugust 20, 2018.
Restructuring
On November 2, 2018, the Company committed to a plan of restructuring to begin streamlining the global workforce of the combined company and to consolidate certain distribution activities in North America. These actions are expected to result in approximately $8 million of aggregate charges for employee termination costs and other costs associated with the restructuring, the majority of which will be recognized in the third quarter of fiscal 2019.
Quantitative and Qualitative Disclosures About Market Risk
The discussion of our exposure to market risk related to changes in interest rates and foreign currency exchange rates contains forward-looking statements that are subject to risks and uncertainties. Actual results could vary materially as a result of a number of factors including those discussed in Part I, "Item 1A. Risk Factors"Factors" in our Annual Report on Form 10-K for the fiscal year ended March 31, 20182019, filed with the SEC on May 9, 2018.17, 2019, which could materially affect our business, financial position, or future results of operations.
Except as described below, there have been no material changes in our market risk as described in our Annual Report on Form 10-K for the fiscal year ended March 31, 2018.2019.
INTEREST RATE RISK
Our exposure to market risk for changes in interest rates relates primarily to our floating-rate interest payments under our $1.275 billion term loan facility. In connection with the Acquisition, we entered into a Credit Agreement with Wells Fargo Bank, National Association, as administrative agent, and the lenders party thereto (the “Credit Agreement”). Borrowings under the Credit Agreement bear interest at a variable rate equal to (i) LIBOR plus a specified margin, or (ii) the base rate (which is the highest of (a) the prime rate publicly announced from time to time by Wells Fargo Bank, National Association, (b) the federal funds rate plus 0.50% or (c) the sum of 1% plus one-month LIBOR plus a specified margin.
On July 30, 2018, we entered into a 4-year amortizing interest rate swap agreement with Bank of America, NA as part of our overall strategy to manage our exposure to market risks associated with fluctuations in interest rates on the $1.275 billion term loan facility. As a matter of policy, we only enter into transactions that we believe will be highly effective at offsetting the underlying risk, and we do not use derivatives for trading or speculative purposes. Our objective is to mitigate the impact of interest expense fluctuations on our profitability related to interest rate changes by minimizing movements in future debt payments with this interest rate swap.
The swap has an initial notional amount of $831 million and matures on July 31, 2022. The swap involves the receipt of floating-rate interest payments for fixed interest rate payments over the life of the agreement. We have designated this interest rate swap as a cash flow hedge, the effective portion of changes in the fair value of the derivative is recorded to other comprehensive income (loss) on the accompanying balance sheets and reclassified into interest expense over the life of the agreement. We will review the effectiveness of this instrument on a quarterly basis, recognize current period hedge ineffectiveness immediately in earnings and will discontinue hedge accounting if we no longer consider hedging to be highly effective. For additional details, refer to Note 13, 14, Derivatives, of the accompanying notes to condensed consolidated financial statements. During the sixthree months ended SeptemberJune 30, 2018,2019, we made payments of approximately $1$0.7 million on our interest rate swap which wasand recognized $0.7 million within interest expense on the condensed consolidated statement of operations. As of June 30, 2019, we had an immaterial amount of interest accrued within accrued liabilities on the condensed consolidated balance sheet. We had an unrealized gainpre-tax loss of approximately $1.1$15.0 million recorded within accumulated other comprehensive income (loss) as of SeptemberJune 30, 2018.2019. A hypothetical 10% increase or decrease on market interest rates related to our outstanding term loan facility could result in a corresponding increase or decrease in annual interest expense of approximately $1.0$0.8 million.
Interest rates were relatively unchanged in the three and six months ended SeptemberJune 30, 20182019 compared to the same period in the prior year. In the three and six months ended SeptemberJune 30, 20172019 and 2018 we generated interest income of $1.0 million and $2.0 million and $0.3 million and $1.8$1.5 million, respectively.
FOREIGN CURRENCY EXCHANGE RATE RISK
We are a net receiver of currencies other than the USD. Accordingly, changes in exchange rates, and in particular a strengthening of the USD, could negatively affect our net revenues and gross margins as expressed in USD. There is a risk that we will have to adjust local currency product pricing due to competitive pressures if there is significant volatility in foreign currency exchange rates.
The primary currency fluctuations to which we are exposed are the Euro ("EUR"), British Pound Sterling ("GBP"), Australian Dollar ("AUD"), Canadian Dollar ("CAD"), Mexican Peso ("MXN"), and the Chinese Renminbi ("RMB"). We use a hedging strategy to diminish, and make more predictable, the effect of currency fluctuations. All of our hedging activities are entered into with large financial institutions, which we periodically evaluate for credit risks. We hedge our balance sheet exposure by hedging EUR, GBP, AUD, and CADAUD denominated cash, accounts receivable, and accounts payable balances, and our economic exposure by hedging a portion of anticipated EUR and GBP denominated sales and our MXN denominated expenditures. We can provide no assurance that our strategy will be successful in the future or that exchange rate fluctuations will not materially adversely affect our business. We do not hold or issue derivative financial instruments for speculative trading purposes.
The impact of changes in foreign currency rates recognized in other income and (expense), net was immaterial in both the three and six months ended SeptemberJune 30, 20172019 and 2018. Although we hedge a portion of our foreign currency exchange exposure, the weakening of certain foreign currencies, particularly the EUR and GBP in comparison to the USD, could result in material foreign exchange losses in future periods.
Non-designated Hedges
We hedge our EUR, GBP, AUD, and CADAUD denominated cash, accounts receivable, and accounts payable balances by entering into foreign exchange forward contracts. The table below presents the impact on the foreign exchange gain (loss) of a hypothetical 10% appreciation and a 10% depreciation of the USD against the forward currency contracts as of SeptemberJune 30, 20182019 (in millions):
| | | Currency - forward contracts | Position | | USD Value of Net Foreign Exchange Contracts | | Foreign Exchange Gain From 10% Appreciation of USD | | Foreign Exchange Loss From 10% Depreciation of USD | Position | | USD Value of Net Foreign Exchange Contracts | | Foreign Exchange Gain From 10% Appreciation of USD | | Foreign Exchange Loss From 10% Depreciation of USD |
| EUR | Sell EUR | | $ | 36.1 |
| | $ | 3.6 |
| | $ | (3.6 | ) | Sell EUR | | $ | 38.8 |
| | $ | 3.9 |
| | $ | (3.9 | ) |
| GBP | Sell GBP | | $ | 11.0 |
| | $ | 1.1 |
| | $ | (1.1 | ) | Sell GBP | | $ | 13.4 |
| | $ | 1.3 |
| | $ | (1.3 | ) |
| AUD | Sell AUD | | $ | 13.0 |
| | $ | 1.3 |
| | $ | (1.3 | ) | Sell AUD | | $ | 6.8 |
| | $ | 0.7 |
| | $ | (0.7 | ) |
| CAD | Sell CAD | | $ | 1.5 |
| | $ | 0.2 |
| | $ | (0.2 | ) | |
Cash Flow Hedges
In the sixthree months ended SeptemberJune 30, 2018,2019, approximately 50% of our net revenues were derived from sales outside of the U.S. and denominated primarily in EUR and GBP.
As of SeptemberJune 30, 20182019, we had foreign currency put and call option contracts with notional amounts of approximately €49.0€82.6 million and £16.7£27.4 million denominated in EUR and GBP, respectively. Collectively, our option contracts hedge against a portion of our forecasted foreign currency denominated sales. If the USD is subjected to either a 10% appreciation or 10% depreciation versus these net exposed currency positions, we could realize a gain of $5.78.3 million or incur a loss of $4.77.8 million, respectively.
The table below presents the impact on the Black-Scholes valuation of our currency option contracts of a hypothetical 10% appreciation and a 10% depreciation of the USD against the indicated open option contract type for cash flow hedges as of SeptemberJune 30, 20182019 (in millions):
| | | Currency - option contracts | | USD Value of Net Foreign Exchange Contracts | | Foreign Exchange Gain From 10% Appreciation of USD | | Foreign Exchange Loss From 10% Depreciation of USD | | USD Value of Net Foreign Exchange Contracts | | Foreign Exchange Gain From 10% Appreciation of USD | | Foreign Exchange Loss From 10% Depreciation of USD |
| Call options | | $ | 85.3 |
| | $ | 0.4 |
| | $ | (3.3 | ) | | $ | 135.9 |
| | $ | 0.7 |
| | $ | (7.2 | ) |
| Put options | | $ | 79.1 |
| | $ | 5.3 |
| | $ | (1.4 | ) | | $ | 126.1 |
| | $ | 7.6 |
| | $ | (0.6 | ) |
| Forwards | | $ | 59.7 |
| | $ | 5.8 |
| | $ | (5.8 | ) | | $ | 92.8 |
| | $ | 9.2 |
| | $ | (9.1 | ) |
Collectively, our swap contracts hedge against a portion of our forecasted MXN denominated expenditures. As of SeptemberJune 30, 20182019, we had no cross-currency swap contracts.contracts with notional amounts of approximately MXN $93.2 million.
The table below presents the impact on the valuation of our cross-currency swap contracts of a hypothetical 10% appreciation and a 10% depreciation of the USD as of June 30, 2019 (in millions):
|
| | | | | | | | | |
| Currency - cross-currency swap contracts | USD Value of Cross-Currency Swap Contracts | Foreign Exchange (Loss) From 10% Appreciation of USD | Foreign Exchange Gain From 10% Depreciation of USD |
| Position: Buy MXN | $ | 4.7 |
| $ | (0.4 | ) | $ | 0.5 |
|
Controls and Procedures
| |
| (a) | Evaluation of disclosure controls and procedures |
Our management evaluated, with the participation of our Chief Executive Officer and our Chief Financial Officer, the effectiveness of our disclosure controls and procedures as of the end of the period covered by this Quarterly Report on Form 10-Q. Based on this evaluation, our Chief Executive Officer and our Chief Financial Officer have concluded that our disclosure controls and procedures are effective as of the end of the period covered by this report to ensure that information we are required to disclose in reports that we file or submit under the Securities Exchange Act of 1934 (i) is recorded, processed, summarized and reported within the time periods specified in Securities and Exchange Commission rules and forms, and (ii) is accumulated and communicated to our management, including our Chief Executive Officer and our Chief Financial Officer, as appropriate to allow timely decisions regarding required disclosure.
| |
| (b) | Changes in internal control over financial reporting |
On July 2, 2018, the Company completed its acquisition of Polycom. The Company is in the process of integrating the historical control over financial reporting of Polycom with the consolidated Company. In addition, the Company implemented controls related to the adoption of ASU 2016-05, Leases (Topic 842) and the related financial statement reporting. There have been no other changes in the Company’s internal control over financial reporting during the period covered by this Quarterly Report on Form 10-Q that have materially affected, or are reasonably likely to materially affect, its internal control over financial reporting.
PART II -- OTHER INFORMATION
LEGAL PROCEEDINGS
We are presently engaged in various legal actions arising in the normal course of business. We believe that it is unlikely that any of these actions will have a material adverse impact on our operating results; however, because of the inherent uncertainties of litigation, the outcome of any of these actions could be unfavorable and could have a material adverse effect on our financial condition, results of operations or cash flows. For additional information about our material legal proceedings, please see Note 7, 8, Commitments and Contingencies, of the accompanying notes to the condensed consolidated financial statements.
RISK FACTORS
You should carefully consider the risk factors discussed in Part I, "Item 1A. Risk Factors" in our Annual Report on Form 10-K for the fiscal year ended March 31, 2018,2019, filed with the SEC on May 9, 201817, 2019 (the "Form 10-K"), and Part II, "Risk Factors" in our quarterly report on Form 10-Q for the first quarter of fiscal year 2019 ended June 30, 2018, filed with the SEC on August 7, 2018, each of which could materially affect our business, financial position, or future results of operations. Except as described below, there have been no material changes to the risk factors included in the Form 10-K.
IfThe risks described here and in the Form 10-K are not the only risks we determineface. Additional risks and uncertainties not currently known to us or that we currently deem to be immaterial also may materially adversely affect our goodwill has become impaired, we could incur significant charges that would have a material adverse effect on our consolidatedbusiness, financial position, or future results of operations.
As a result of our acquisition of Polycom on July 2, 2018, the amount of goodwill and purchased intangible assets on our consolidated balance sheet and subject to future impairment testing increased substantially from $15.5 million at the end of fiscal year 2018 to more than $2.2 billion as of the end of the second quarter of fiscal year 2019. Goodwill represents the excess of cost over the fair market value of assets acquired in business combinations. Goodwill impairment analysis and measurement requires significant judgment on the part of management and may be impacted by a wide variety of factors both within and beyond our control.
For instance, any integration process may require significant time and resources, which may disrupt our ongoing business and thereby divert management’s attention from other critical objectives, and we may be unable to successfully manage the integration. Additionally, we may not successfully evaluate or utilize the acquired technology or personnel, realize anticipated synergies from the acquisition, or accurately forecast the financial impact of the acquisition and integration, including accounting charges as well as any potential impairment of goodwill and intangible assets recognized in connection with any acquisition. Furthermore, fluctuations in the price of our stock, changes in applicable laws and regulations, including any that restrict the activities of the acquired business or increase costs, and deterioration of market conditions could unfavorably impact goodwill.
We are required to annually test goodwill to determine if impairment has occurred, either through a quantitative or qualitative analysis. Additionally, interim reviews must be performed whenever events or changes in circumstances indicate that impairment may have occurred. If the testing performed indicates that impairment has occurred, we are required to record a non-cash impairment charge for the difference between the carrying value of the goodwill and the implied fair value of the goodwill in the period the determination is made. We cannot accurately predict the amount or timing of any impairment of assets. Should the value of our goodwill become impaired, it could have a material adverse effect on our consolidated results of operations and could result in our incurring potentially significant net losses in future periods.
UNREGISTERED SALES OF EQUITY SECURITIES AND USE OF PROCEEDS
Share Repurchase Programs
The following table presents a month-to-month summary of the stock purchase activity in the secondfirst quarter of fiscal year 2019:2020:
|
| | | | | | | | | | | | |
| Total Number of Shares Purchased 1
| | Average Price Paid per Share 2
| | Total Number of Shares Purchased as Part of Publicly Announced Plans or Programs 1
| | Maximum Number of Shares that May Yet Be Purchased Under the Plans or Programs 3
|
July 1, 2018 to July 28, 2018 | — |
| | $ | — |
| | — |
| | 730,105 |
|
July 29, 2018 to August 25, 2018 | — |
| | $ | — |
| | — |
| | 730,105 |
|
August 26, 2018 to September, 2018 | — |
| | $ | — |
| | — |
| | 730,105 |
|
|
| | | | | | | | | | | |
| | Total Number of Shares Purchased 1 | | Average Price Paid per Share 2 | | Total Number of Shares Purchased as Part of Publicly Announced Plans or Programs 1 | | Maximum Number of Shares that May Yet Be Purchased Under the Plans or Programs 3 |
| April 1, 2019 to April 27, 2019 | 1,798 |
| 4 | N/A | | — |
| | 1,369,014 |
|
| April 28, 2019 to May 25, 2019 | 141,727 |
| 4 | N/A | | — |
| | 1,369,014 |
|
| May 26, 2019 to June 29, 2019 | 47,647 |
| 4 |
| N/A | | — |
| | 1,369,014 |
|
|
| | |
| 1 |
| On July 27, 2017 theNovember 28, 2018, our Board of Directors authorizedapproved a 1 million shares repurchase program expanding our capacity to repurchase 1,000,000 shares of our common stockto approximately 1.7 million shares. We may repurchase shares from time to time in theopen market transactions or inthrough privately negotiated repurchases as determined by management.transactions. There is no expiration date associated with the repurchase activity. |
| | |
| 2 |
| "Average Price Paid per Share" reflects open market repurchases of common stock only. |
| | |
| 3 |
| These shares reflect the available shares authorized for repurchase under the expanded program approved by the Board on July 27, 2017November 28, 2018. |
| |
| 4 |
| Represents only shares that were tendered to us in satisfaction of employee tax withholding obligations upon the vesting of restricted stock. |
| | |
OTHER INFORMATION
Departure of Directors or Certain Officers; Election of Directors; Appointment of Certain Officers; Compensatory Arrangements of Certain OfficersNone.
On November 2, 2018, the Company’s board of directors approved changes to the severance arrangements previously entered into between the Company and its executive officers (“Executive Officers”), including the named executive officers, Joe Burton, the Company’s President and Chief Executive Officer, Pam Strayer, the Company’s Executive Vice President and Chief Financial Officer, Mary Huser, the Company’s Executive Vice President, Chief Legal and Compliance Officer, Jeff Loebbaka, the Company’s Executive Vice President, Global Sales, and Shantanu Sarkar, the Company’s Executive Vice President, Headset Business Unit. Under the terms approved by the board of directors, immediately prior to a Change of Control (as defined in the existing Change of Control agreements currently in effect) all outstanding unvested shares under performance stock unit awards (“PSUs”) will vest at the greater of target performance or actual performance. The Company intends to enter into amended and restated agreements or amendments to existing agreements with each of the Executive Officers reflecting the approved changes.
EXHIBITS
We have filed the following documents as Exhibits to this Form 10-Q:10-Q/A:
|
| | | | | | | | | | | | |
| Exhibit Number | | | | Incorporation by Reference | | Filed Herewith |
| | Exhibit Description | | Form | | File No. | | Exhibit | | Filing Date | |
| | | | | | | | | | | | | |
| 2.1 | | Stock Purchase Agreement, dated March 28, 2018, among Plantronics, Inc., Triangle Private Holdings II, LLC and Polycom, Inc. | | 8-K | | 1-12696 | | 2.1 | | 7/2/2018 | | |
| | | | | | | | | | | | | |
| 3.1 | | Amended and Restated Bylaws of Plantronics, Inc., as amended through July 2, 2018 | | 8-K | | 1-12696 | | 3.2 | | 7/2/2018 | | |
| | | | | | | | | | | | | |
| 4.1 | | Credit Agreement dated as of July 2, 2018 among Plantronics, Inc. as borrower, Wells Fargo Bank, National Association, as administrative agent, and the lenders from time to time thereto | | 8-K | | 1-12696 | | 4.1 | | 7/2/2018 | | |
| | | | | | | | | | | | | |
| 10.1 | | Stockholder Agreement, dated July 2, 2018, between Plantronics, Inc. and Triangle Private Holdings II, LLC | | 8-K | | 1-12696 | | 10.1 | | 7/2/2018 | | |
| | | | | | | | | | | | | |
| 10.2 | | Plantronics, Inc. 2002 Employee Stock Purchase Plan, as amended and restated | | 8-K | | 1-12696 | | 10.1 | | 8/3/2018 | | |
| | | | | | | | | | | | | |
| 10.3 | | Plantronics, Inc. 2003 Stock Plan, as amended and restated | | 8-K | | 1-12696 | | 10.1 | | 8/3/2018 | | |
| | | | | | | | | | | | | |
| | | | | | | | | | | | X |
| | | | | | | | | | | | | |
| | | | | | | | | | | | X |
| | | | | | | | | | | | | |
| | | | | | | | | | | | X |
| | | | | | | | | | | | | |
| 101.INS | | XBRL Instance Document | | | | | | | | | | X |
| | | | | | | | | | | | | |
| 101.SCH | | XBRL Taxonomy Extension Schema Document | | | | | | | | | | X |
| | | | | | | | | | | | | |
| 101.CAL | | XBRL Taxonomy Extension Calculation Linkbase Document | | | | | | | | | | X |
| | | | | | | | | | | | | |
| 101.LAB | | XBRL Taxonomy Extension Label Linkbase Document | | | | | | | | | | X |
| | | | | | | | | | | | | |
| 101.PRE | | XBRL Taxonomy Extension Presentation Linkbase Document | | | | | | | | | | X |
| | | | | | | | | | | | | |
| 101.DEF | | XBRL Taxonomy Definition Linkbase Document | | | | | | | | | | X |
| | | | | | | | | | | | | |
|
| | | | | | | | | | | | |
| Exhibit Number | | | | Incorporation by Reference | | Filed Herewith |
| Exhibit Description | | Form | | File No. | | Exhibit | | Filing Date | |
| | | | | | | | | | | | |
| 31.1 | | | | | | | | | | | | X |
| | | | | | | | | | | | |
| 31.2 | | | | | | | | | | | | X |
| | | | | | | | | | | | |
| 32.1 | | | | | | | | | | | | X |
| | | | | | | | | | | | |
| 101.INS | | XBRL Instance Document - the XBRL Instance Document does not appear in the Interactive Data File because its XBRL tags are embedded within the Inline XBRL document | | | | | | | | | | X |
| | | | | | | | | | | | |
| 101.SCH | | Inline XBRL Taxonomy Extension Schema Document | | | | | | | | | | X |
| | | | | | | | | | | | |
| 101.CAL | | Inline XBRL Taxonomy Extension Calculation Linkbase Document | | | | | | | | | | X |
| | | | | | | | | | | | |
| 101.LAB | | Inline XBRL Taxonomy Extension Label Linkbase Document | | | | | | | | | | X |
| | | | | | | | | | | | |
| 101.PRE | | Inline XBRL Taxonomy Extension Presentation Linkbase Document | | | | | | | | | | X |
| | | | | | | | | | | | |
| 101.DEF | | Inline XBRL Taxonomy Definition Linkbase Document | | | | | | | | | | X |
| | | | | | | | | | | | |
| 104 | | Cover Page Interactive Data File, (formatted as Inline XBRL and contained in Exhibit 101) | | | | | | | | | | X |
Plantronics, Inc.
FORM 10-Q
CROSS REFERENCE TABLE
| | | Item Number | Page(s) | Page(s) |
| PART I. FINANCIAL INFORMATION | | |
| | | | | |
| | - | | | - | |
| | | |
| | - | | | - | |
| | | |
| | - | | | - | |
| | | |
| | | | |
| | | |
| PART II. OTHER INFORMATION | | |
| | | |
| | | | |
| | | |
| | | | |
| | | |
| | | | |
| | | |
| | | | |
| | | |
| | | | |
| | | |
| Signatures | | | | |
SIGNATURES
Pursuant to the requirements of the Securities Exchange Act of 1934, the registrant has duly caused this report to be signed on its behalf by the undersigned thereunto duly authorized.
|
| | | |
| | | PLANTRONICS, INC. |
| | | | |
| Date: | November 7, 2018August 13, 2019 | By: | /s/ Pamela StrayerCharles D. Boynton |
| | | Name: | Pamela StrayerCharles D. Boynton |
| | | Title: | Executive Vice President and Chief Financial Officer |