UNITED STATES
SECURITIES AND EXCHANGE COMMISSION
Washington, D.C. 20549
FORM 10-Q
x QUARTERLY REPORT PURSUANT TO SECTION 13 OR 15(d) OF THE SECURITIES EXCHANGE ACT OF 1934
For the quarterly period ended SeptemberJune 30, 2016
2017
o TRANSITION REPORT PURSUANT TO SECTION 13 OR 15(d) OF THE SECURITIES EXCHANGE ACT OF 1934
For the transition period from __________ to __________
Commission File Number: 0-24796
CENTRAL EUROPEAN MEDIA ENTERPRISES LTD.
(Exact name of registrant as specified in its charter)
|
| | |
| BERMUDA | | 98-0438382 |
| (State or other jurisdiction of incorporation or organization) | | (IRSI.R.S. Employer Identification No.) |
| | | |
| O'Hara House, 3 Bermudiana Road, Hamilton, Bermuda | | HM 08 |
| (Address of principal executive offices) | | (Zip Code) |
Registrant's telephone number, including area code: (441) 296-1431
Indicate by check mark whether registrant: (1) has filed all reports required to be filed by Section 13 or 15 (d) of the Securities Exchange Act of 1934 during the preceding 12 months (or for each shorter period that the registrant was required to file such reports), and (2) has been subject to such filing requirements for the past 90 days. Yes T No £
Indicate by check mark whether the registrant has submitted electronically and posted on its corporate Web site, if any, every Interactive Data File required to be submitted and posted pursuant to Rule 405 of Regulation S-T during the preceding 12 months (or for such shorter period that the registrant was required to submit and post such files). Yes T No £
Indicate by check mark whether the registrant is a large accelerated filer, an accelerated filer, a non-accelerated filer or a smaller reporting company. See definition of “accelerated filer”, “large accelerated filer” or “smaller reporting company” in Rule 12b-2 of the Exchange Act.
|
| | | |
Large accelerated filer £ | Accelerated filer T | Non-accelerated filer £ | Smaller reporting company £ |
| | | Emerging growth company £ |
If an emerging growth company, indicate by check mark if the registrant has elected not to use the extended transition period for complying with any new or revised financial accounting standards provided pursuant to Section 13(a) of the Exchange Act. £
Indicate by check mark whether the registrant is a shell company (as defined by Rule 12b-2 of the Exchange Act) Yes £ No T
Indicate the number of shares outstanding of each of the issuer's classes of common stock, as of the latest practicable date.
|
| |
| Class | Outstanding as of OctoberJuly 21, 20162017 |
| Class A Common Stock, par value $0.08 | 142,799,769 |
CENTRAL EUROPEAN MEDIA ENTERPRISES LTD.
FORM 10-Q
For the quarterly period ended SeptemberJune 30, 20162017
|
| | | |
| | Page |
| Part I Financial Information | |
| | | |
| | | | |
| | |
| |
| | |
| |
| | |
| |
| | | | |
| | | |
| | | |
| | | |
| Part II Other Information | |
| | | |
| | | |
| | | |
| |
| |
PART I. FINANCIAL INFORMATION
Item 1. Financial Statements
CENTRAL EUROPEAN MEDIA ENTERPRISES LTD.
CONDENSED CONSOLIDATED BALANCE SHEETS
(US$ 000’s, except share data)
(Unaudited)
| | | | September 30, 2016 |
| | December 31, 2015 |
| June 30, 2017 |
| | December 31, 2016 |
|
| ASSETS | | | | | | |
| Current assets | | | | | | |
| Cash and cash equivalents | $ | 64,229 |
| | $ | 61,679 |
| $ | 95,359 |
| | $ | 43,459 |
|
| Accounts receivable, net (Note 6) | 138,567 |
| | 167,427 |
| 186,458 |
| | 178,339 |
|
| Program rights, net (Note 5) | 98,604 |
| | 85,972 |
| 91,002 |
| | 86,151 |
|
| Other current assets (Note 7) | 31,327 |
| | 43,206 |
| 30,191 |
| | 32,471 |
|
| Total current assets | 332,727 |
| | 358,284 |
| 403,010 |
| | 340,420 |
|
| Non-current assets | |
| | |
| |
| | |
|
| Property, plant and equipment, net (Note 8) | 109,424 |
| | 108,522 |
| 115,982 |
| | 109,089 |
|
| Program rights, net (Note 5) | 193,678 |
| | 169,073 |
| 202,933 |
| | 179,356 |
|
| Goodwill (Note 3) | 639,073 |
| | 622,243 |
| 667,159 |
| | 602,069 |
|
| Broadcast licenses and other intangible assets, net (Note 3) | 148,989 |
| | 151,162 |
| |
| Other intangible assets, net (Note 3) | | 147,786 |
| | 138,340 |
|
| Other non-current assets (Note 7) | 20,345 |
| | 31,133 |
| 21,516 |
| | 21,443 |
|
| Total non-current assets | 1,111,509 |
| | 1,082,133 |
| 1,155,376 |
| | 1,050,297 |
|
| Total assets | $ | 1,444,236 |
| | $ | 1,440,417 |
| $ | 1,558,386 |
| | $ | 1,390,717 |
|
| | | LIABILITIES AND EQUITY | | | | | | |
| Current liabilities | | | | | | |
| Accounts payable and accrued liabilities (Note 9) | $ | 172,110 |
| | $ | 134,705 |
| $ | 150,669 |
| | $ | 160,981 |
|
| Current portion of long-term debt and other financing arrangements (Note 4) | 1,258 |
| | 1,155 |
| 2,386 |
| | 1,494 |
|
| Other current liabilities (Note 10) | 23,210 |
| | 10,448 |
| 29,117 |
| | 9,089 |
|
| Total current liabilities | 196,578 |
| | 146,308 |
| 182,172 |
| | 171,564 |
|
| Non-current liabilities | |
| | |
| |
| | |
|
| Long-term debt and other financing arrangements (Note 4) | 1,059,670 |
| | 908,521 |
| 1,087,992 |
| | 1,002,028 |
|
| Other non-current liabilities (Note 10) | 51,820 |
| | 65,749 |
| 87,103 |
| | 68,758 |
|
| Total non-current liabilities | 1,111,490 |
| | 974,270 |
| 1,175,095 |
| | 1,070,786 |
|
| Commitments and contingencies (Note 19) |
|
| |
|
|
|
| |
|
|
| TEMPORARY EQUITY | | | | | | |
| 200,000 shares of Series B Convertible Redeemable Preferred Stock of $0.08 each (December 31, 2015 - 200,000) (Note 12) | 252,512 |
| | 241,198 |
| |
| 200,000 shares of Series B Convertible Redeemable Preferred Stock of $0.08 each (December 31, 2016 - 200,000) (Note 12) | | 259,661 |
| | 254,899 |
|
| EQUITY | |
| | |
| |
| | |
| CME Ltd. shareholders’ equity (Note 13): | |
| | |
| |
| | |
| One share of Series A Convertible Preferred Stock of $0.08 each (December 31, 2015 – one) | — |
| | — |
| |
| 142,398,021 shares of Class A Common Stock of $0.08 each (December 31, 2015 – 135,804,221) | 11,392 |
| | 10,864 |
| |
| Nil shares of Class B Common Stock of $0.08 each (December 31, 2015 – nil) | — |
| | — |
| |
| One share of Series A Convertible Preferred Stock of $0.08 each (December 31, 2016 – one) | | — |
| | — |
|
| 144,789,334 shares of Class A Common Stock of $0.08 each (December 31, 2016 – 143,449,913) | | 11,583 |
| | 11,476 |
|
| Nil shares of Class B Common Stock of $0.08 each (December 31, 2016 – nil) | | — |
| | — |
|
| Additional paid-in capital | 1,910,620 |
| | 1,914,050 |
| 1,907,409 |
| | 1,910,244 |
|
| Accumulated deficit | (1,806,624 | ) | | (1,605,245 | ) | (1,768,666 | ) | | (1,785,536 | ) |
| Accumulated other comprehensive loss | (232,545 | ) | | (242,409 | ) | (209,249 | ) | | (243,988 | ) |
| Total CME Ltd. shareholders’ (deficit) / equity | (117,157 | ) | | 77,260 |
| |
| Total CME Ltd. shareholders’ deficit | | (58,923 | ) | | (107,804 | ) |
| Noncontrolling interests | 813 |
| | 1,381 |
| 381 |
| | 1,272 |
|
| Total (deficit) / equity | (116,344 | ) | | 78,641 |
| |
| Total deficit | | (58,542 | ) | | (106,532 | ) |
| Total liabilities and equity | $ | 1,444,236 |
| | $ | 1,440,417 |
| $ | 1,558,386 |
| | $ | 1,390,717 |
|
The accompanying notes are an integral part of these condensed consolidated financial statements.
CENTRAL EUROPEAN MEDIA ENTERPRISES LTD.
CONDENSED CONSOLIDATED STATEMENTS OF OPERATIONS AND COMPREHENSIVE INCOME / LOSS
(US$ 000’s, except per share data)
(Unaudited)
|
| | | | | | | | | | | | | | | |
| | For the Three Months Ended September 30, | | For the Nine Months Ended September 30, |
| | 2016 |
| | 2015 |
| | 2016 |
|
| 2015 |
|
| Net revenues | $ | 126,706 |
| | $ | 117,322 |
| | $ | 430,912 |
| | $ | 410,289 |
|
| Operating expenses: | | | | | | | |
| Content costs | 64,487 |
| | 58,983 |
| | 213,747 |
| | 203,710 |
|
| Other operating costs | 17,024 |
| | 17,180 |
| | 51,417 |
| | 51,640 |
|
| Depreciation of property, plant and equipment | 7,557 |
| | 6,974 |
| | 22,469 |
| | 20,911 |
|
| Amortization of broadcast licenses and other intangibles | 2,073 |
| | 2,695 |
| | 6,247 |
| | 9,628 |
|
| Cost of revenues | 91,141 |
| | 85,832 |
| | 293,880 |
| | 285,889 |
|
| Selling, general and administrative expenses | 27,181 |
| | 2,403 |
| | 76,994 |
| | 75,016 |
|
| Restructuring costs | — |
| | 234 |
| | — |
| | 1,329 |
|
| Operating income | 8,384 |
| | 28,853 |
| | 60,038 |
| | 48,055 |
|
| Interest expense (Note 14) | (27,636 | ) | | (43,998 | ) | | (106,335 | ) | | (125,862 | ) |
| Loss on extinguishment of debt (Note 4) | — |
| | — |
| | (150,158 | ) | | — |
|
| Non-operating income / (expense), net (Note 15) | 387 |
| | (6,477 | ) | | 1,636 |
| | (22,122 | ) |
| Loss before tax | (18,865 | ) | | (21,622 | ) | | (194,819 | ) | | (99,929 | ) |
| (Provision) / credit for income taxes | (958 | ) | | 112 |
| | (6,947 | ) | | (3,493 | ) |
| Loss from continuing operations | (19,823 | ) | | (21,510 | ) | | (201,766 | ) | | (103,422 | ) |
| Loss from discontinued operations, net of tax | — |
| | (265 | ) | | — |
| | (869 | ) |
| Net loss | (19,823 | ) | | (21,775 | ) | | (201,766 | ) | | (104,291 | ) |
| Net loss attributable to noncontrolling interests | 196 |
| | 253 |
| | 387 |
| | 817 |
|
| Net loss attributable to CME Ltd. | $ | (19,627 | ) | | $ | (21,522 | ) | | $ | (201,379 | ) | | $ | (103,474 | ) |
| | | | | | | | |
| Net loss | $ | (19,823 | ) | | $ | (21,775 | ) | | $ | (201,766 | ) | | $ | (104,291 | ) |
| Other comprehensive income / (loss): | | | | | | | |
| Currency translation adjustment | 7,262 |
| | 5,546 |
| | 15,264 |
| | (58,637 | ) |
| Unrealized loss on derivative instruments (Note 11) | (1,360 | ) | | (522 | ) | | (5,581 | ) | | (596 | ) |
| Total other comprehensive income / (loss) | 5,902 |
| | 5,024 |
| | 9,683 |
| | (59,233 | ) |
| Comprehensive loss | (13,921 | ) | | (16,751 | ) | | (192,083 | ) | | (163,524 | ) |
| Comprehensive loss attributable to noncontrolling interests | 232 |
| | 316 |
| | 568 |
| | 106 |
|
| Comprehensive loss attributable to CME Ltd. | $ | (13,689 | ) | | $ | (16,435 | ) | | $ | (191,515 | ) | | $ | (163,418 | ) |
|
| | | | | | | | | | | | | | | |
| | For the Three Months
Ended June 30, | | For the Six Months
Ended June 30, |
| | 2017 |
| | 2016 |
| | 2017 |
|
| 2016 |
|
| Net revenues | $ | 181,856 |
| | $ | 175,206 |
| | $ | 316,858 |
| | $ | 304,206 |
|
| Operating expenses: | | | | | | | |
| Content costs | 76,709 |
| | 77,282 |
| | 150,111 |
| | 149,260 |
|
| Other operating costs | 15,395 |
| | 17,939 |
| | 29,951 |
| | 34,393 |
|
| Depreciation of property, plant and equipment | 8,293 |
| | 7,627 |
| | 16,052 |
| | 14,912 |
|
| Amortization of broadcast licenses and other intangibles | 2,053 |
| | 2,114 |
| | 4,162 |
| | 4,174 |
|
| Cost of revenues | 102,450 |
| | 104,962 |
| | 200,276 |
| | 202,739 |
|
| Selling, general and administrative expenses | 28,583 |
| | 26,353 |
| | 53,491 |
| | 49,813 |
|
| Operating income | 50,823 |
| | 43,891 |
| | 63,091 |
| | 51,654 |
|
| Interest expense (Note 14) | (21,973 | ) | | (29,545 | ) | | (45,728 | ) | | (78,699 | ) |
| Loss on extinguishment of debt | — |
| | (150,158 | ) | | — |
| | (150,158 | ) |
| Non-operating income / (expense), net (Note 15) | 7,141 |
| | (167 | ) | | 9,466 |
| | 1,249 |
|
| Income / (loss) before tax | 35,991 |
| | (135,979 | ) | | 26,829 |
| | (175,954 | ) |
| Provision for income taxes | (8,193 | ) | | (5,270 | ) | | (10,305 | ) | | (5,989 | ) |
| Net income / (loss) | 27,798 |
| | (141,249 | ) | | 16,524 |
| | (181,943 | ) |
| Net loss / (income) attributable to noncontrolling interests | 137 |
| | (68 | ) | | 346 |
| | 191 |
|
| Net income / (loss) attributable to CME Ltd. | $ | 27,935 |
| | $ | (141,317 | ) | | $ | 16,870 |
| | $ | (181,752 | ) |
| | | | | | | | |
| Net income / (loss) | $ | 27,798 |
| | $ | (141,249 | ) | | $ | 16,524 |
| | $ | (181,943 | ) |
| Other comprehensive income / (loss) | | | | | | | |
| Currency translation adjustment | 30,904 |
| | (11,056 | ) | | 32,976 |
| | 8,002 |
|
| (Loss) / gain on derivative instruments (Note 11) | (40 | ) | | (2,973 | ) | | 1,218 |
| | (4,221 | ) |
| Total other comprehensive income / (loss) | 30,864 |
| | (14,029 | ) | | 34,194 |
| | 3,781 |
|
| Comprehensive income / (loss) | 58,662 |
| | (155,278 | ) | | 50,718 |
| | (178,162 | ) |
| Comprehensive loss / (income) attributable to noncontrolling interests | 590 |
| | (237 | ) | | 891 |
| | 336 |
|
| Comprehensive income / (loss) attributable to CME Ltd. | $ | 59,252 |
| | $ | (155,515 | ) | | $ | 51,609 |
| | $ | (177,826 | ) |
|
| | | | | | | | | | | | | | | |
| PER SHARE DATA (Note 17): | | | | | | | |
| Net loss per share: | | | | | | | |
| Continuing operations attributable to CME Ltd. - Basic and diluted | $ | (0.14 | ) | | $ | (0.17 | ) | | $ | (1.42 | ) | | $ | (0.79 | ) |
| Discontinued operations attributable to CME Ltd. - Basic and diluted | 0.00 |
| | (0.01 | ) | | 0.00 |
| | (0.00 | ) |
| Net loss attributable to CME Ltd. - Basic and diluted | (0.14 | ) | | (0.18 | ) | | (1.42 | ) | | (0.79 | ) |
| | | | | | | | |
| Weighted average common shares used in computing per share amounts (000’s): | | | | | | | |
| Basic and diluted | 153,494 |
| | 147,054 |
| | 149,898 |
| | 146,803 |
|
|
| | | | | | | | | | | | | | | |
| PER SHARE DATA (Note 17): | | | | | | | |
| Net income / (loss) per share: | | | | | | | |
| Net income / (loss) attributable to CME Ltd. — basic | $ | 0.10 |
| | $ | (0.98 | ) | | $ | 0.05 |
| | $ | (1.29 | ) |
| Net income / (loss) attributable to CME Ltd. — diluted | 0.07 |
| | (0.98 | ) | | 0.04 |
| | (1.29 | ) |
| | | | | | | | |
| Weighted average common shares used in computing per share amounts (000’s): | | | | | | | |
| Basic | 155,738 |
| | 149,083 |
| | 155,269 |
| | 148,080 |
|
| Diluted | 235,952 |
| | 149,083 |
| | 230,872 |
| | 148,080 |
|
The accompanying notes are an integral part of these condensed consolidated financial statements.
CENTRAL EUROPEAN MEDIA ENTERPRISES LTD.
CONDENSED CONSOLIDATED STATEMENT OF EQUITY
(US$ 000’s, except share data)
(Unaudited)
| | | | CME Ltd. | |
| |
| CME Ltd. | | |
| | |
|
| | Series A Convertible Preferred Stock | | Class A Common Stock | | Class B Common Stock | |
| |
| |
| |
| |
| Series A Convertible Preferred Stock | | Class A Common Stock | | Class B Common Stock | |
| |
| |
| | |
| | |
|
| | Number of shares | Par value | | Number of shares | Par value | | Number of shares | Par value | Additional Paid-In Capital |
| Accumulated Deficit |
| Accumulated Other Comprehensive Loss |
| Noncontrolling Interest |
| Total Equity / (Deficit) |
| Number of shares | Par value | | Number
of shares | Par value | | Number of shares | Par value | Additional Paid-In Capital |
| Accumulated Deficit |
| Accumulated Other Comprehensive Loss |
| | Noncontrolling Interest |
| | Total Deficit |
|
BALANCE December 31, 2015 | 1 |
| $ | — |
| | 135,804,221 |
| $ | 10,864 |
| | — |
| $ | — |
| $ | 1,914,050 |
| $ | (1,605,245 | ) | $ | (242,409 | ) | $ | 1,381 |
| $ | 78,641 |
| |
BALANCE December 31, 2016 | | 1 |
| $ | — |
| | 143,449,913 |
| $ | 11,476 |
| | — |
| $ | — |
| $ | 1,910,244 |
| $ | (1,785,536 | ) | $ | (243,988 | ) | | $ | 1,272 |
| | $ | (106,532 | ) |
| Stock-based compensation | — |
| — |
| | — |
| — |
| | — |
| — |
| 2,465 |
| — |
| — |
| — |
| 2,465 |
| — |
| — |
| | — |
| — |
| | — |
| — |
| 1,675 |
| — |
| — |
| | — |
| | 1,675 |
|
| Exercise of warrants (Note 13) | — |
| — |
| | 5,947,010 |
| 476 |
| | — |
| — |
| 5,471 |
| — |
| — |
| — |
| 5,947 |
| — |
| — |
| | 527,268 |
| 42 |
| | — |
| — |
| 485 |
| — |
| — |
| | — |
| | 527 |
|
| Share issuance, stock-based compensation | — |
| — |
| | 646,790 |
| 52 |
| | — |
| — |
| (52 | ) | — |
| — |
| — |
| — |
| — |
| — |
| | 812,153 |
| 65 |
| | — |
| — |
| (65 | ) | — |
| — |
| | — |
| | — |
|
| Withholding tax on net share settlement of stock-based compensation | | — |
| — |
| | — |
| — |
| | — |
| — |
| (168 | ) | — |
| — |
| | — |
| | (168 | ) |
| Preferred dividend paid in kind | — |
| — |
| | — |
| — |
| | — |
| — |
| (11,314 | ) | — |
| — |
| — |
| (11,314 | ) | — |
| — |
| | — |
| — |
| | — |
| — |
| (4,762 | ) | — |
| — |
| | — |
| | (4,762 | ) |
| Net loss | — |
| — |
| | — |
| — |
| | — |
| — |
| — |
| (201,379 | ) | — |
| (387 | ) | (201,766 | ) | |
| Unrealized loss on derivative instruments | — |
| — |
| | — |
| — |
| | — |
| — |
| — |
| — |
| (5,581 | ) | — |
| (5,581 | ) | |
| Net income | | — |
| — |
| | — |
| — |
| | — |
| — |
| — |
| 16,870 |
| — |
| | (346 | ) | | 16,524 |
|
| Gain on derivative instruments | | — |
| — |
| | — |
| — |
| | — |
| — |
| — |
| — |
| 1,218 |
| | — |
| | 1,218 |
|
| Currency translation adjustment | — |
| — |
| | — |
| — |
| | — |
| — |
| — |
| — |
| 15,445 |
| (181 | ) | 15,264 |
| — |
| — |
| | — |
| — |
| | — |
| — |
| — |
| — |
| 33,521 |
| | (545 | ) | | 32,976 |
|
BALANCE September 30, 2016 | 1 |
| $ | — |
| | 142,398,021 |
| $ | 11,392 |
| | — |
| $ | — |
| $ | 1,910,620 |
| $ | (1,806,624 | ) | $ | (232,545 | ) | $ | 813 |
| $ | (116,344 | ) | |
BALANCE June 30, 2017 | | 1 |
| $ | — |
| | 144,789,334 |
| $ | 11,583 |
| | — |
| $ | — |
| $ | 1,907,409 |
| $ | (1,768,666 | ) | $ | (209,249 | ) | | $ | 381 |
| | $ | (58,542 | ) |
The accompanying notes are an integral part of these condensed consolidated financial statements.
CENTRAL EUROPEAN MEDIA ENTERPRISES LTD.
CONDENSED CONSOLIDATED STATEMENTS OF CASH FLOWS
(US$ 000’s)
(Unaudited)
|
| | | | | | | |
| | For the Nine Months Ended September 30, |
| | 2016 |
| | 2015 |
|
| CASH FLOWS FROM OPERATING ACTIVITIES: | | | |
| Net loss | $ | (201,766 | ) | | $ | (104,291 | ) |
| Adjustments to reconcile net loss to net cash generated from continuing operating activities: | |
| | |
| Loss from discontinued operations, net of tax | — |
| | 869 |
|
| Amortization of program rights | 213,747 |
| | 203,710 |
|
| Depreciation and other amortization | 49,359 |
| | 72,150 |
|
| Interest and related Guarantee Fees paid in kind | 22,257 |
| | 43,681 |
|
| Loss on extinguishment of debt (Note 4) | 150,158 |
| | — |
|
| (Gain) / loss on disposal of fixed assets | (68 | ) | | 6,914 |
|
| Deferred income taxes | 6,859 |
| | 2,690 |
|
| Stock-based compensation (Note 16) | 2,465 |
| | 1,549 |
|
| Change in fair value of derivatives | 11,722 |
| | 3,571 |
|
| Foreign currency exchange gain, net | (13,774 | ) | | (717 | ) |
| Changes in assets and liabilities: | | | |
|
| Accounts receivable, net | 32,411 |
| | 39,347 |
|
| Accounts payable and accrued liabilities | (5,952 | ) | | (5,061 | ) |
| Program rights | (229,107 | ) | | (219,104 | ) |
| Other assets and liabilities | (1,075 | ) | | (8,478 | ) |
| Accrued interest | (5,507 | ) | | 29,455 |
|
| Income taxes payable | (257 | ) | | (304 | ) |
| Deferred revenue | 13,083 |
| | 15,688 |
|
| VAT and other taxes payable | (1,991 | ) | | (2,584 | ) |
| Net cash generated from continuing operating activities | $ | 42,564 |
| | $ | 79,085 |
|
| | | | |
| CASH FLOWS FROM INVESTING ACTIVITIES: | |
| | |
|
| Purchase of property, plant and equipment | $ | (19,847 | ) | | $ | (26,344 | ) |
| Disposal of property, plant and equipment | 113 |
| | 125 |
|
| Net cash used in continuing investing activities | $ | (19,734 | ) | | $ | (26,219 | ) |
| | | | |
| CASH FLOWS FROM FINANCING ACTIVITIES: | |
| | |
|
| Proceeds from debt | $ | 533,963 |
| | $ | — |
|
| Repayment of debt | (540,699 | ) | | — |
|
| Debt transaction costs | (9,541 | ) | | (627 | ) |
| Payment of credit facilities and capital leases | (959 | ) | | (27,037 | ) |
| Settlement of forward currency swaps | (12,106 | ) | | — |
|
| Proceeds from exercise of warrants | 5,947 |
| | — |
|
| Net cash used in continuing financing activities | $ | (23,395 | ) | | $ | (27,664 | ) |
| | | | |
| Net cash used in discontinued operations - operating activities | — |
| | (2,872 | ) |
| Net cash provided by discontinued operations - investing activities | 705 |
| | 6,959 |
|
| Net cash used in discontinued operations - financing activities | — |
| | (76 | ) |
| | | | |
| Impact of exchange rate fluctuations on cash and cash equivalents | 2,410 |
| | (1,730 | ) |
| Net increase in cash and cash equivalents | $ | 2,550 |
| | $ | 27,483 |
|
| CASH AND CASH EQUIVALENTS, beginning of period | 61,679 |
| | 34,298 |
|
| CASH AND CASH EQUIVALENTS, end of period | $ | 64,229 |
| | $ | 61,781 |
|
The accompanying notes are an integral part of these condensed consolidated financial statements. |
| | | | | | | |
| | For the Six Months Ended June 30, |
| | 2017 |
| | 2016 |
|
| CASH FLOWS FROM OPERATING ACTIVITIES: | | | |
| Net income / (loss) | $ | 16,524 |
| | $ | (181,943 | ) |
| Adjustments to reconcile net income / (loss) to net cash generated from continuing operating activities: | |
| | |
| Amortization of program rights | 150,111 |
| | 149,260 |
|
| Depreciation and other amortization | 23,137 |
| | 38,232 |
|
| Interest and related Guarantee Fees paid in kind | 15,606 |
| | 22,257 |
|
| Loss on extinguishment of debt | — |
| | 150,158 |
|
| (Gain) / loss on disposal of fixed assets | (46 | ) | | 17 |
|
| Deferred income taxes | (1,005 | ) | | 5,972 |
|
| Stock-based compensation (Note 16) | 1,675 |
| | 1,717 |
|
| Change in fair value of derivatives | 621 |
| | 11,219 |
|
| Foreign currency exchange gain, net | (9,541 | ) | | (13,177 | ) |
| Changes in assets and liabilities: | | | |
| Accounts receivable, net | 7,337 |
| | 1,499 |
|
| Accounts payable and accrued liabilities | (9,894 | ) | | (5,914 | ) |
| Program rights | (148,732 | ) | | (153,497 | ) |
| Other assets and liabilities | (1,873 | ) | | (326 | ) |
| Accrued interest | (2,041 | ) | | (18,713 | ) |
| Income taxes payable | 3,076 |
| | (225 | ) |
| Deferred revenue | 16,855 |
| | 14,407 |
|
| VAT and other taxes payable | (5,040 | ) | | (3,394 | ) |
| Net cash generated from continuing operating activities | $ | 56,770 |
| | $ | 17,549 |
|
| | | | |
| CASH FLOWS FROM INVESTING ACTIVITIES: | |
| | |
|
| Purchase of property, plant and equipment | $ | (14,698 | ) | | $ | (11,287 | ) |
| Disposal of property, plant and equipment | 117 |
| | 32 |
|
| Net cash used in continuing investing activities | $ | (14,581 | ) | | $ | (11,255 | ) |
| | | | |
| CASH FLOWS FROM FINANCING ACTIVITIES: | |
| | |
|
| Proceeds from debt | $ | — |
| | $ | 533,963 |
|
| Repayment of debt | — |
| | (540,699 | ) |
| Debt transaction costs | — |
| | (9,541 | ) |
| Payment of credit facilities and capital leases | (1,208 | ) | | (647 | ) |
| Settlement of forward currency swaps | — |
| | (12,106 | ) |
| Proceeds from exercise of warrants | 527 |
| | 5,060 |
|
| Proceeds from sale-leaseback transactions | 2,746 |
| | — |
|
| Payments of withholding tax on net share settlement of share-based compensation | (168 | ) | | — |
|
| Net cash provided by / (used in) continuing financing activities | $ | 1,897 |
| | $ | (23,970 | ) |
| | | | |
| Net cash provided by discontinued operations - investing activities | 1,045 |
| | 705 |
|
| Impact of exchange rate fluctuations on cash and cash equivalents | 6,769 |
| | 1,734 |
|
| Net increase / (decrease) in cash and cash equivalents | $ | 51,900 |
| | $ | (15,237 | ) |
| CASH AND CASH EQUIVALENTS, beginning of period | 43,459 |
| | 61,679 |
|
| CASH AND CASH EQUIVALENTS, end of period | $ | 95,359 |
| | $ | 46,442 |
|
CENTRAL EUROPEAN MEDIA ENTERPRISES LTD.
CONDENSED CONSOLIDATED STATEMENTS OF CASH FLOWS
(US$ 000’s)
(Unaudited)
| | | SUPPLEMENTAL DISCLOSURE OF CASH FLOW INFORMATION: | | | | | | |
| Cash paid for interest (including mandatory cash-pay Guarantee Fees) | $ | 40,877 |
| | $ | 10,712 |
| $ | 21,173 |
| | $ | 35,712 |
|
| Cash paid for Guarantee Fees previously paid in kind | 27,502 |
| | — |
| |
| Cash paid for Guarantee Fees that may be paid in kind | | 7,078 |
| | 20,000 |
|
| Cash paid for income taxes, net of refunds | | 7,512 |
| | 172 |
|
| | | | | | | |
| SUPPLEMENTAL DISCLOSURE OF NON-CASH FINANCING ACTIVITIES: | | | | | | |
| Accretion on Series B Convertible Redeemable Preferred Stock | $ | 11,314 |
| | $ | 12,796 |
| $ | 4,762 |
| | $ | 8,950 |
|
The accompanying notes are an integral part of these condensed consolidated financial statements.
CENTRAL EUROPEAN MEDIA ENTERPRISES LTD.
NOTES TO CONDENSED CONSOLIDATED FINANCIAL STATEMENTS
(Tabular amounts in US$ 000’s, except share and per share data)
(Unaudited)
1. ORGANIZATION AND BUSINESS
Central European Media Enterprises Ltd., a Bermuda company limited by shares, is a media and entertainment company operating in Central and Eastern Europe. Our assets are held through a series of Dutch and Curaçao holding companies. We manage our business on a geographical basis, with six operating segments,segments; Bulgaria, Croatia, the Czech Republic, Romania, the Slovak Republic and Slovenia, which are also our reportable segments and our main operating countries. See Note 18, "Segment Data" for financial information by segment. On July 9, 2017, we entered into a framework agreement with Slovenia Broadband S.à r.l., a wholly owned subsidiary of United Group B.V., relating to the sale of our Croatia and Slovenia operations. See Note 21, "Subsequent Events" for further information.
We have market leading broadcast operationsare the market-leading broadcasters in sixeach of our operating countries in Central and Eastern Europe broadcastingwith a totalcombined portfolio of 36 television channels. Each country alsoof our broadcast operations develops and produces content for their television channels. We generate advertising revenues in our country operations primarily through entering into agreements with advertisers, advertising agencies and sponsors to place advertising on the television channels that we operate. We generate additional revenues by collecting fees from cable and direct-to-home (“DTH”) and internet protocol television ("IPTV") operators for carriage of our channels. Unless otherwise indicated,With the exception of our Bulgarian operations, we own 100% of our broadcast operating and license companies in each country.
Bulgaria
We operate one general entertainment channel, BTV, and five other channels, BTV CINEMA, BTV COMEDY, RING, BTV ACTION and BTV LADY. We own 94.0% of CME Bulgaria B.V. ("CME Bulgaria"), the subsidiary that owns our Bulgaria operations.
Croatia
We operate one general entertainment channel, NOVA TV (Croatia), and three other channels, DOMA (Croatia), NOVA WORLD and MINI TV.
Czech Republic
We operate one general entertainment channel, TV NOVA (Czech Republic), and seven other channels, NOVA CINEMA, NOVA SPORT 1, NOVA SPORT 2, FANDA, SMICHOV, TELKANOVA ACTION, NOVA 2 , NOVA GOLD and NOVA INTERNATIONAL, a general entertainment channel broadcasting in the Slovak Republic launched on February 1, 2016.Republic.
Romania
We operate one general entertainment channel, PRO TV, and eight other channels, ACASA, ACASA GOLD, PRO CINEMA, SPORT.RO, MTV ROMANIA, PRO TV INTERNATIONAL, PRO TV CHISINAU, a general entertainment channel broadcasting in Moldova, and ACASA IN MOLDOVA.
Slovak Republic
We operate one general entertainment channel, TV MARKIZA, and three other channels, DOMA (Slovak Republic), DAJTO, and MARKIZA INTERNATIONAL, a general entertainment channel broadcasting in the Czech Republic launched on February 1, 2016.Republic.
Slovenia
We operate two general entertainment channels, POP TV and KANAL A, and three other channels, KINO, BRIO, and OTO.
2. BASIS OF PRESENTATION
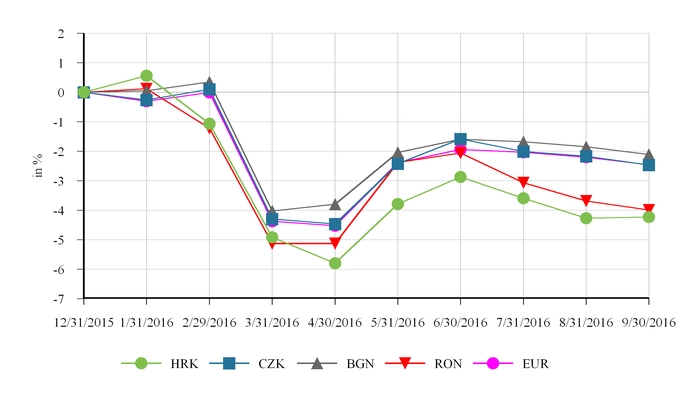
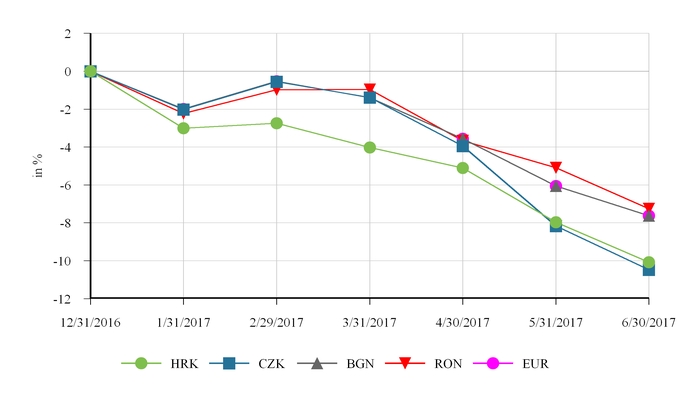
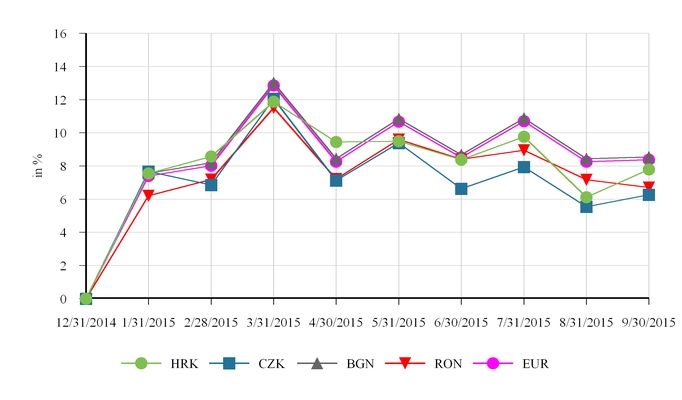
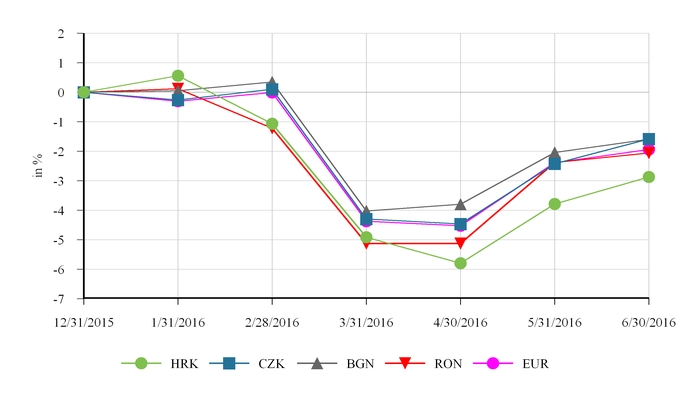
The terms the “Company”, “we”, “us”, and “our” are used in this Form 10-Q to refer collectively to the parent company, Central European Media Enterprises Ltd. (“CME Ltd.”), and the subsidiaries through which our various businesses are conducted.we operate. Unless otherwise noted, all statistical and financial information presented in this report has been converted into U.S. dollars using period-end exchange rates. All references to “US$”, “USD” or “dollars” are to U.S. dollars; all references to “BGN” are to Bulgarian leva; all references to “HRK” are to Croatian kuna; all references to “CZK” are to Czech koruna; all references to “RON” are to the New Romanian lei; and all references to “Euro” or “EUR” are to the European Union Euro.
Interim Financial Statements
The accompanying unaudited condensed consolidated financial statements have been prepared in accordance with the instructions to Quarterly Report on Form 10-Q and do not include all of the information and note disclosures required by generally accepted accounting principles in the United States of America (“US GAAP”). Amounts as of December 31, 20152016 included in the unaudited condensed consolidated financial statements have been derived from audited consolidated financial statements as of that date. The accompanying unaudited condensed consolidated financial statements should be read in conjunction with our Annual Report on Form 10-K for the year ended December 31, 20152016 filed with the Securities and Exchange Commission ("SEC") on February 22, 2016.9, 2017. Our significant accounting policies have not changed since December 31, 2015,2016, except as noted below.
In the opinion of management, the accompanying unaudited condensed consolidated financial statements reflect all adjustments, consisting only of normal recurring items, necessary for their fair presentation in conformity with US GAAP for complete financial statements. The results of operations for interim periods are not necessarily indicative of the results to be expected for a full year.
Functional Currency
Following the refinancing of the remaining outstanding dollar-denominated debt with Euro-denominated debt in April 2016, CME Ltd.'s income and expenses are primarily denominated in Euro. It is anticipated that CME Ltd.'s cash flows will primarily be in Euro. Accordingly, management has determined that CME Ltd.'s functional currency is the Euro with effect from April 1, 2016. As a result of this change, we recognized US$ 4.2 million of currency translation adjustment in the second quarter of 2016 due to the translation of non-monetary assets into Euro as of the date of the change. Our reporting currency continues to be the U.S. dollar.
CENTRAL EUROPEAN MEDIA ENTERPRISES LTD.
NOTES TO CONDENSED CONSOLIDATED FINANCIAL STATEMENTS
(Tabular amounts in US$ 000’s, except share and per share data)
(Unaudited)
Use of Estimates
The preparation of financial statements in conformity with US GAAP requires management to make estimates and assumptions that affect the reported amounts of assets and liabilities and disclosure of contingent assets and liabilities at the date of the financial statements and the reported amounts of revenues and expenses during the reporting periods. Actual results could differ from those estimates and assumptions.
CENTRAL EUROPEAN MEDIA ENTERPRISES LTD.
NOTES TO CONDENSED CONSOLIDATED FINANCIAL STATEMENTS
(Tabular amounts in US$ 000’s, except share and per share data)
(Unaudited)
Discontinued Operations and Assets Held for Sale
We present our results of operations, financial position and cash flows of operations that have either been sold or that meet the criteria for "held-for-sale accounting" as discontinued operations if the disposal represents a strategic shift that will have a major effect on our operations and financial results. At the time an operation qualifies for held-for-sale accounting, the operation is evaluated to determine whether or not the carrying amount exceeds its fair value less cost to sell. Any loss as a result of carrying amounts in excess of fair value less cost to sell is recorded in the period the operation qualifies for held-for-sale accounting. Management judgment is required to (1) assess the criteria required to qualify for held-for-sale accounting, and (2) estimate fair value. Changes to the operation could cause it to no longer qualify for held-for-sale accounting and changes to fair value could result in an increase or decrease to previously recognized losses.
Basis of Consolidation
The unaudited condensed consolidated financial statements include the accounts of CME Ltd. and our subsidiaries, after the elimination of intercompany accounts and transactions. Entities in which we hold less than a majority voting interest but over which we have the ability to exercise significant influence are accounted for using the equity method. Other investments are accounted for using the cost method.
Goodwill and IntangiblesSeasonality
Historically, we have assessed the carrying amount of our goodwill and other indefinite-lived intangibles for impairment annually as of December 31, or more frequently if events or changes in circumstances indicate that such carrying amount may notWe experience seasonality, with advertising sales tending to be recoverable. Duringlowest during the third quarter of 2016, we elected to change the date of our assessment for all of our reporting units from December 31 to October 1. We believe this change will more closely align the assessment with our long- and short-range business planning and forecasting process. The voluntary change in accounting principle relatedeach calendar year due to the annual testing date will not delay, accelerate or avoid an impairment charge. This change is not applied retrospectively as it is impracticablesummer holiday period (typically July and August), and highest during the fourth quarter of each calendar year due to do so because retrospective application would require application of significant estimates and assumptions with the use of hindsight. Accordingly, the change will be applied prospectively. We have not yet completed our assessment as of October 1, 2016.holiday season.
Recent Accounting Pronouncements
Accounting Pronouncements Adopted
On January 1, 20162017 we adopted the following guidance issued by the Financial Accounting Standards Board (the “FASB”):
In November 2014, the FASB issued guidance which standardizes the method used inis intended to improve the accounting for hybrid financial instruments issued in the formincome tax consequences of a share.intercompany transfers of assets other than inventory. The guidance requires an entity to consider all relevant termsrecognize the income tax consequences of such transfers in the period in which the transfer occurs, rather than defer recognition of current and features in evaluatingdeferred income taxes for the nature oftransfer until the host contract inasset is sold to a hybrid financial instrument, including the embedded derivative feature being evaluated for bifurcation.third party. The early adoption of this guidance did not have a material impact on our condensed consolidated financial statements.
In April 2015, the FASB issued guidance which simplifies the balance sheet presentation of debt issuance costs. The guidance requires that debt issuance costs related to a recognized debt liability be presented in the balance sheet as a direct reduction of the carrying amount of that liability. The retrospective adoption of this guidance decreased our other non-current assets as at December 31, 2015 by US$ 13.8 million, with a corresponding decrease in our long-term debt and other financing arrangements in our condensed consolidated balance sheet, with no impact to our condensed consolidated statements of operations and comprehensive income / loss or condensed consolidated statements of cash flows. Certain amounts in the prior year's condensed consolidated balance sheets have been reclassified to conform to the current year presentation.
In November 2015, the FASB issued guidance which requires that deferred tax balances be classified as non-current in our condensed consolidated balance sheet. The prospective adoption of this guidance did not have any effect on our net deferred income tax liability. Prior period amounts have not been adjusted.
In the third quarter of 2016, we adopted the FASB guidance issued in March 2016 intended to simplify accounting for share-based payment transactions, specifically with regard to accounting for forfeitures, income taxes, the classification as either equity or liabilities and the presentation in the statement of cash flows. We have made a policy election to account for forfeitures as they occur. The cumulative-effect adjustment to equity as a result of adopting this guidance was not material. The adoption of this guidance did not have any other material impacts on our condensed consolidated financial statements or disclosures.
Recent Accounting Pronouncements Issued
In May 2014, the FASB issued new guidance which is intended to improve the comparability of revenue recognition practices across entities, industries, jurisdictions, and capital markets. The guidance supersedes existing revenue recognition guidance and requires an entity to recognize revenue to depict the transfer of promised goods or services to customers in an amount that reflects the consideration to which the entity expects to be entitled in exchange for those goods or services. The guidance is effective for our fiscal year beginning January 1, 2018. We have substantially completed our evaluation of the contractual terms of our significant revenue streams in each or our operating segments. While we are currentlystill in the process of evaluating the impact of the adoption of this guidance on our condensed consolidated financial statements.statements, we currently do not expect the impact of this new guidance to be material.
In February 2016, the FASB issued new guidance to increase transparency and comparability among organizations by recognizing leasing assets and liabilities on the balance sheet and requiring additional disclosures about an entity's leasing arrangements. The guidance requires that a lessee recognize a liability to make lease payments and a right-of-use asset, with an available exception for leases shorter than twelve months. The guidance is effective for our fiscal year beginning January 1, 2019. We are currently in the process of evaluating the impact of the adoption of this guidance on our condensed consolidated financial statements.
In August 2016, the FASB issued guidance which is intended to reduce the existing diversity in practice related to specific cash flow issues. As applicable to us, the guidance requires that cash flows at the settlement of zero-coupon debt instruments or debt instruments with coupon interest rates that are insignificant in relation to the effective interest rate of the borrowing be bifurcated between cash outflows for operating activities for the portion attributable to accrued interest, and cash outflows for financing activities for the portion attributable to the principal. The guidance requires a retrospective transition method and is effective for our fiscal year beginning January 1, 2018, with early adoption permitted. We expect to adopt this guidance as of January 1, 2018. Upon adoption, our net cash flows generated from / used in continuing operating activities for the year ended December 31, 2016 will decrease by US$ 110.7 million with a corresponding increase in net cash used in / provided by continuing financing activities.
In January 2017, the FASB issued guidance which is intended to simplify goodwill impairment testing by eliminating Step 2, and instead recognize an impairment charge for the amount by which the carrying amount of the reporting unit exceeds the fair value of the reporting unit. The guidance also eliminates the requirement to perform a qualitative analysis for reporting units with a negative carrying value. The guidance is effective for annual and interim impairment tests after January 1, 2020, with early adoption permitted for interim and annual impairment tests performed from January 1, 2017. We expect to early adopt the guidance in the fourth quarter of 2017.
CENTRAL EUROPEAN MEDIA ENTERPRISES LTD.
NOTES TO CONDENSED CONSOLIDATED FINANCIAL STATEMENTS
(Tabular amounts in US$ 000’s, except share and per share data)
(Unaudited)
3. GOODWILL AND INTANGIBLE ASSETS
Goodwill:
Goodwill by reporting unit as at SeptemberJune 30, 20162017 and December 31, 20152016 was as follows:
|
| | | | | | | | | | | | | | | | | | | | | | | | | | | |
| | Bulgaria | | Croatia | | Czech Republic | | Romania | | Slovak Republic | | Slovenia | | Total |
| Gross Balance, December 31, 2015 | $ | 172,365 |
| | $ | 11,005 |
| | $ | 759,491 |
| | $ | 85,443 |
| | $ | 47,605 |
| | $ | 19,400 |
| | $ | 1,095,309 |
|
| Accumulated impairment losses | (144,639 | ) | | (10,454 | ) | | (287,545 | ) | | (11,028 | ) | | — |
| | (19,400 | ) | | (473,066 | ) |
| Balance, December 31, 2015 | 27,726 |
| | 551 |
| | 471,946 |
| | 74,415 |
| | 47,605 |
| | — |
| | 622,243 |
|
| Foreign currency | 596 |
| | 24 |
| | 11,961 |
| | 3,048 |
| | 1,201 |
| | — |
| | 16,830 |
|
| Balance, September 30, 2016 | 28,322 |
| | 575 |
| | 483,907 |
| | 77,463 |
| | 48,806 |
| | — |
| | 639,073 |
|
| Accumulated impairment losses | (144,639 | ) | | (10,454 | ) | | (287,545 | ) | | (11,028 | ) | | — |
| | (19,400 | ) | | (473,066 | ) |
| Gross Balance, September 30, 2016 | $ | 172,961 |
| | $ | 11,029 |
| | $ | 771,452 |
| | $ | 88,491 |
| | $ | 48,806 |
| | $ | 19,400 |
| | $ | 1,112,139 |
|
|
| | | | | | | | | | | | | | | | | | | | | | | | | | | |
| | Bulgaria | | Croatia | | Czech Republic | | Romania | | Slovak Republic | | Slovenia | | Total |
| Gross Balance, December 31, 2016 | $ | 171,389 |
| | $ | 10,988 |
| | $ | 744,483 |
| | $ | 82,786 |
| | $ | 46,089 |
| | $ | 19,400 |
| | $ | 1,075,135 |
|
| Accumulated impairment losses | (144,639 | ) | | (10,454 | ) | | (287,545 | ) | | (11,028 | ) | | — |
| | (19,400 | ) | | (473,066 | ) |
| Balance, December 31, 2016 | 26,750 |
| | 534 |
| | 456,938 |
| | 71,758 |
| | 46,089 |
| | — |
| | 602,069 |
|
| Foreign currency | 2,209 |
| | 60 |
| | 53,458 |
| | 5,540 |
| | 3,823 |
| | — |
| | 65,090 |
|
| Balance, June 30, 2017 | 28,959 |
| | 594 |
| | 510,396 |
| | 77,298 |
| | 49,912 |
| | — |
| | 667,159 |
|
| Accumulated impairment losses | (144,639 | ) | | (10,454 | ) | | (287,545 | ) | | (11,028 | ) | | — |
| | (19,400 | ) | | (473,066 | ) |
| Gross Balance, June 30, 2017 | $ | 173,598 |
| | $ | 11,048 |
| | $ | 797,941 |
| | $ | 88,326 |
| | $ | 49,912 |
| | $ | 19,400 |
| | $ | 1,140,225 |
|
Broadcast licenses and otherOther intangible assets:
The grossChanges in the net book value and accumulated amortization of broadcast licenses andour other intangible assets was as follows as at SeptemberJune 30, 20162017 and December 31, 20152016: is summarized as follows:
| | | | September 30, 2016 | | December 31, 2015 | June 30, 2017 | | December 31, 2016 |
| | Gross | | Accumulated Amortization | | Net | | Gross | | Accumulated Amortization | | Net | Gross | | Accumulated Amortization | | Net | | Gross | | Accumulated Amortization | | Net |
| Indefinite-lived: | | | | | | | | | | | | | | | | | | | | | | |
| Trademarks | $ | 85,439 |
| | $ | — |
| | $ | 85,439 |
| | $ | 83,188 |
| | $ | — |
| | $ | 83,188 |
| $ | 87,490 |
| | $ | — |
| | $ | 87,490 |
| | $ | 80,324 |
| | $ | — |
| | $ | 80,324 |
|
| Amortized: | | | | | | | | | | | | | | | | | | | | | | |
| Broadcast licenses | 196,641 |
| | (136,200 | ) | | 60,441 |
| | 191,860 |
| | (127,613 | ) | | 64,247 |
| 206,536 |
| | (148,517 | ) | | 58,019 |
| | 185,686 |
| | (130,325 | ) | | 55,361 |
|
| Trademarks | 636 |
| | (636 | ) | | — |
| | 614 |
| | (614 | ) | | — |
| 638 |
| | (638 | ) | | — |
| | 591 |
| | (591 | ) | | — |
|
| Customer relationships | 54,617 |
| | (51,856 | ) | | 2,761 |
| | 53,120 |
| | (49,672 | ) | | 3,448 |
| 55,909 |
| | (53,825 | ) | | 2,084 |
| | 51,338 |
| | (48,997 | ) | | 2,341 |
|
| Other | 1,612 |
| | (1,264 | ) | | 348 |
| | 2,138 |
| | (1,859 | ) | | 279 |
| 1,659 |
| | (1,466 | ) | | 193 |
| | 1,522 |
| | (1,208 | ) | | 314 |
|
| Total | $ | 338,945 |
| | $ | (189,956 | ) | | $ | 148,989 |
| | $ | 330,920 |
| | $ | (179,758 | ) | | $ | 151,162 |
| $ | 352,232 |
| | $ | (204,446 | ) | | $ | 147,786 |
| | $ | 319,461 |
| | $ | (181,121 | ) | | $ | 138,340 |
|
Broadcast licenses consist of our TV NOVA license in the Czech Republic, which is amortized on a straight-line basis through the expiration date of the license in 2025. CustomerOur customer relationships are deemed to have an economic useful life of, and are amortized on a straight-line basis over, five years to fifteen years.
4. LONG-TERM DEBT AND OTHER FINANCING ARRANGEMENTS
Summary
| | | | September 30, 2016 |
| | December 31, 2015 |
| June 30, 2017 |
| | December 31, 2016 |
|
| Long-term debt | $ | 1,057,442 |
| | $ | 906,028 |
| $ | 1,082,873 |
| | $ | 999,209 |
|
| Other credit facilities and capital leases | 3,486 |
| | 3,648 |
| 7,505 |
| | 4,313 |
|
| Total long-term debt and other financing arrangements | 1,060,928 |
| | 909,676 |
| 1,090,378 |
| | 1,003,522 |
|
| Less: current maturities | (1,258 | ) | | (1,155 | ) | (2,386 | ) | | (1,494 | ) |
| Total non-current long-term debt and other financing arrangements | $ | 1,059,670 |
| | $ | 908,521 |
| $ | 1,087,992 |
| | $ | 1,002,028 |
|
Financing Transactions
On April 7, 2016, we drewPursuant to an amendment in March 2017 to the EUR 468.8 million (approximately US$ 534.0 millionReimbursement Agreement (as defined below) with Time Warner Inc. ("Time Warner"), as atguarantor of our obligations under the transaction date)Euro Term Loans (as defined below), the grid pricing structure on the all-in rate that applied only to the 2021 Euro Term Loan (as defined below) was extended to the 2018 Euro Term Loan (as defined below) and the 2019 Euro Term Loan (as defined below), with a reduction in full, the proceeds of which, together with cash on hand, were applied towardpricing under the repaymentgrid for each of the outstanding US$ 38.2Euro Term Loans resulting in an all-in rate ranging from 8.5% if our net leverage is greater than or equal to seven times to 5.0% if our net leverage is less than five times. In addition, we can achieve a further 50 basis point reduction in the all-in rate if we reduce our long-term debt to less than EUR 815.0 million, subject to certain adjustments in respect of specified debt repayments, on or prior to September 30, 2018. We are now required to pay the first 5.0% of the 15.0% term loan facility due 2017 (the "2017all-in rate (including the base rate and the rate paid pursuant to customary hedging arrangements) on the Euro Term Loan"), plus US$ 1.5 millionLoans in cash and the remainder may be paid in cash or in kind, at our option. As a result of accruedthis amendment to the Reimbursement Agreement, we reduced our average borrowing costs across all of our long-term debt by 150 basis points in March 2017. Our cost of borrowing across all of our long-term debt will automatically decrease further upon the achievement of certain net leverage ratios. For details, see the table below under the heading "Reimbursement Agreement and unpaid interest thereon, and toward the redemption and discharge of the outstanding US$ 502.5 million of the 15.0% Senior Secured Notes due 2017 (the "2017 PIK Notes"), plus US$ 26.6 million of accrued and unpaid interest thereon.Guarantee Fees".
CENTRAL EUROPEAN MEDIA ENTERPRISES LTD.
NOTES TO CONDENSED CONSOLIDATED FINANCIAL STATEMENTS
(Tabular amounts in US$ 000’s, except share and per share data)
(Unaudited)
Also on April 7, 2016, we extended the maturity date of the 2018 Euro Term Loan by one year to November 1, 2018. In addition, we extended the maturity date of the 2021 Revolving Credit Facility to February 19, 2021, with a borrowing capacity of US$ 50.0 million with effect from January 1, 2018. We also amended the 2021 Revolving Credit Facility such that interest is determined on the basis of our net leverage ratio (as defined in the Reimbursement Agreement) and ranges from 10.0% (if our net leverage ratio is greater than or equal to seven times) to 7.0% per annum (if our net leverage ratio is less than five times). The modifications of the 2018 Euro Term Loan and the 2019 Euro Term Loan were accounted for in the same manner as a debt extinguishment.
As a result of the above transactions, we recognized a loss on extinguishment of debt of US$ 150.2 million in the second quarter of 2016.
During the nine months ended September 30, 2016 we paid US$ 27.5 million of accrued Guarantee Fees (as defined below) related to the 2018 Euro Term Loan for which we had previously made an election to pay in kind. The accrued Guarantee Fee payments are presented as cash outflows from operating activities in our condensed consolidated statements of cash flows.
Overview
Total long-term debt and credit facilities comprised the following at SeptemberJune 30, 2016:2017:
| | | | Principal Amount of Liability Component |
| | Debt Issuance Costs (1) |
| | Net Carrying Amount |
| Principal Amount of Liability Component |
| | Debt Issuance Costs (1) |
| | Net Carrying Amount |
|
| 2018 Euro Term Loan | $ | 279,918 |
| | $ | (764 | ) | | $ | 279,154 |
| $ | 286,213 |
| | $ | (500 | ) | | $ | 285,713 |
|
| 2019 Euro Term Loan | 262,658 |
| | (545 | ) | | 262,113 |
| 268,565 |
| | (422 | ) | | 268,143 |
|
| 2021 Euro Term Loan | 523,228 |
| | (7,053 | ) | | 516,175 |
| 534,995 |
| | (5,978 | ) | | 529,017 |
|
| 2021 Revolving Credit Facility | — |
| | — |
| | — |
| — |
| | — |
| | — |
|
| Total long-term debt and credit facilities | $ | 1,065,804 |
| | $ | (8,362 | ) | | $ | 1,057,442 |
| $ | 1,089,773 |
| | $ | (6,900 | ) | | $ | 1,082,873 |
|
| |
(1) | Debt issuance costs related to the 2018 Euro Term Loan, 2019 Euro Term Loan and 2021 Euro Term Loan (each as defined below and collectively, the “Euro Term Loans”) are being amortized on a straight-line basis, which approximates the effective interest method, over the life of the respective instruments. Debt issuance costs related to the 2021 Revolving Credit Facility are classified as non-current assets in our condensed consolidated balance sheet and are being amortized on a straight-line basis over the life of the 2021 Revolving Credit Facility. |
Long-term Debt
Our long-term debt comprised the following at SeptemberJune 30, 20162017 and December 31, 2015:2016:
| | | | Carrying Amount | Carrying Amount | | Fair Value |
| | September 30, 2016 |
| | December 31, 2015 |
| June 30, 2017 |
| | December 31, 2016 |
| | June 30, 2017 |
| | December 31, 2016 |
|
| 2017 PIK Notes | $ | — |
| | $ | 359,789 |
| |
| 2017 Term Loan | — |
| | 27,592 |
| |
| 2018 Euro Term Loan | 279,154 |
| | 272,189 |
| $ | 285,713 |
| | $ | 263,734 |
| | $ | 268,893 |
| | $ | 233,297 |
|
| 2019 Euro Term Loan | 262,113 |
| | 246,458 |
| 268,143 |
| | 247,594 |
| | 238,844 |
| | 203,314 |
|
| 2021 Euro Term Loan | 516,175 |
| | — |
| 529,017 |
| | 487,881 |
| | 440,187 |
| | 369,738 |
|
| | $ | 1,057,442 |
| | $ | 906,028 |
| $ | 1,082,873 |
| | $ | 999,209 |
| | $ | 947,924 |
| | $ | 806,349 |
|
2018 Euro Term Loan
As at SeptemberJune 30, 2016,2017, the principal amount of our floating rate senior unsecured term credit facility (as amended, the "2018 Euro Term Loan") outstanding was EUR 250.8 million (approximately US$ 279.9286.2 million). The 2018 Euro Term Loan bears interest at three-month EURIBOR (fixed pursuant to customary hedging arrangements (see Note 11, "Financial Instruments and Fair Value Measurements")) plus a margin of between 1.1% and 1.9% depending on the credit rating of Time Warner Inc. ("Time Warner"Warner. The all-in borrowing rate including the Guarantee Fee ranges from 8.5% to 5.0% per annum based on our net leverage (see the table below under the heading "Reimbursement Agreement and Guarantee Fees"). As at SeptemberJune 30, 2016,2017, the all-in borrowing rate on amounts outstanding under the 2018 Euro Term Loan was 8.5% (the7.25%, the components of which are shown in the table below under the heading "Interest Rate Summary").
Interest on the 2018 Euro Term Loan is payable quarterly in arrears on each March 12, June 12, September 12 and December 12. The 2018 Euro Term Loan matures on November 1, 2018 and may be prepaid at our option, in whole or in part, without premium or penalty upon the occurrence of certain events, including if our net leverage (as defined in the Reimbursement Agreement) decreases to below five times for two consecutive quarters, or at any time from NovemberAugust 1, 2017. The 2018 Euro Term Loan is a senior unsecured obligation of CME Ltd., and is unconditionally guaranteed by our 100% owned subsidiary CME Media Enterprises B.V. ("CME BV") and by Time Warner and certain of its subsidiaries.
The fair values of the 2018 Euro Term Loan of US$ 236.2 million and US$ 273.0 million as at SeptemberJune 30, 20162017 and December 31, 2015, respectively,2016 were determined based on comparable instruments that trade in active markets.markets, plus an applicable spread. This measurement of estimated fair value uses Level 2 inputs as described in Note 11, "Financial Instruments and Fair Value Measurements". Certain derivative instruments, including contingent event of default and change of control put options, have been identified as being embedded in the 2018 Euro Term Loan. The embedded derivatives are considered clearly and closely related to the 2018 Euro Term Loan, and as such are not required to be accounted for separately.
CENTRAL EUROPEAN MEDIA ENTERPRISES LTD.
NOTES TO CONDENSED CONSOLIDATED FINANCIAL STATEMENTS
(Tabular amounts in US$ 000’s, except share and per share data)
(Unaudited)
2019 Euro Term Loan
As at SeptemberJune 30, 2016,2017, the principal amount of our floating rate senior unsecured term credit facility (the "2019 Euro Term Loan") outstanding was EUR 235.3 million (approximately US$ 262.7268.6 million). The 2019 Euro Term Loan bears interest at three-month EURIBOR (fixed pursuant to customary hedging arrangements (see Note 11, "Financial Instruments and Fair Value Measurements")) plus a margin of between 1.1% and 1.9% depending on the credit rating of Time Warner. The all-in borrowing rate including the Guarantee Fee ranges from 8.5% to 5.0% per annum based on our net leverage (see the table below under the heading "Reimbursement Agreement and Guarantee Fees"). As at SeptemberJune 30, 2016,2017, the all-in borrowing rate on amounts outstanding under the 2019 Euro Term Loan was 8.5% (the7.25%, the components of which are shown in the table below under the heading "Interest Rate Summary").
Interest on the 2019 Euro Term Loan is payable quarterly in arrears on each February 13, May 13, August 13 and November 13. The 2019 Euro Term Loan matures on November 1, 2019 and may currently be prepaid at our option, in whole or in part, without premium or penalty. The 2019 Euro Term Loan is a senior unsecured obligation of CME Ltd., and is unconditionally guaranteed by CME BV and by Time Warner and certain of its subsidiaries.
The fair values of the 2019 Euro Term Loan of US$ 204.2 million and US$ 256.2 million as at SeptemberJune 30, 20162017 and December 31, 2015, respectively,2016 were determined based on comparable instruments that trade in active markets, plus an applicable spread. This measurement of estimated fair value uses Level 2 inputs as described in Note 11, "Financial Instruments and Fair Value Measurements". Certain derivative instruments, including contingent event of default and change of control put options, have been identified as being embedded in the 2019 Euro Term Loan. The embedded derivatives are considered clearly and closely related to the 2019 Euro Term Loan, and as such are not required to be accounted for separately.
CENTRAL EUROPEAN MEDIA ENTERPRISES LTD.
NOTES TO CONDENSED CONSOLIDATED FINANCIAL STATEMENTS
(Tabular amounts in US$ 000’s, except share and per share data)
(Unaudited)
2021 Euro Term Loan
As at SeptemberJune 30, 2016,2017, the principal amount of our floating rate senior unsecured term credit facility (the "2021 Euro Term Loan") outstanding was EUR 468.8 million (approximately US$ 523.2535.0 million). The 2021 Euro Term Loan bears interest at three-month EURIBOR (fixed pursuant to customary hedging arrangements (see Note 11, "Financial Instruments and Fair Value Measurements")) plus a margin of between 1.1% and 1.9% depending on the credit rating of Time Warner. The all-in borrowing rate including the Guarantee Fee ranges from 10.5% (if8.5% to 5.0% per annum based on our net leverage ratio is greater than or equal to eight times) to 7.0% per annum (if our net leverage ratio is less than five times)(see the table below under the heading "Reimbursement Agreement and Guarantee Fees"). As at SeptemberJune 30, 2016,2017, the all-in borrowing rate on amounts outstanding under the 2021 Euro Term Loan was 10.0% (the7.25%, the components of which are shown in the table below under the heading "Interest Rate Summary").
Interest on the 2021 Euro Term Loan is payable quarterly in arrears on each April 7, July 7, October 7 and January 7. The 2021 Euro Term Loan matures on February 19, 2021 and may be prepaid at our option, in whole or in part, without premium or penalty, upon the earlier of the occurrence of certain events, including if our net leverage (as defined in the Reimbursement Agreement) decreases to below five times for two consecutive quarters, or at any time from February 19, 2020. The 2021 Euro Term Loan is a senior unsecured obligation of CME BV, and is unconditionally guaranteed by CME Ltd. and by Time Warner and certain of its subsidiaries.
The fair valuevalues of the 2021 Euro Term Loan of US$ 366.1 million as at SeptemberJune 30, 2017 and December 31, 2016 waswere determined based on comparable instruments that trade in active markets, plus an applicable spread. This measurement of estimated fair value uses Level 2 inputs as described in Note 11, "Financial Instruments and Fair Value Measurements". Certain derivative instruments, including contingent event of default and change of control put options, have been identified as being embedded in the 2021 Euro Term Loan. The embedded derivatives are considered clearly and closely related to the 2021 Euro Term Loan, and as such are not required to be accounted for separately.
Reimbursement Agreement and Guarantee Fees
In connection with Time Warner’s guarantees of the 2018 Euro Term Loan, 2019 Euro Term Loan and 2021 Euro Term Loan (collectively, the “Euro Term Loans”),Loans, we entered into a reimbursement agreement (as amended, the “Reimbursement Agreement") with Time Warner whichWarner. The Reimbursement Agreement provides for the payment of guarantee fees (collectively, the "Guarantee Fees") to Time Warner as consideration for those guarantees, and that we will reimbursethe reimbursement to Time Warner forof any amounts paid by them under any guarantee or through any loan purchase right exercised by Time Warner.it. The loan purchase right allows Time Warner to purchase any amount outstanding under the Euro Term Loans from the lenders following an event of default under the Euro Term Loans or the Reimbursement Agreement. The Reimbursement Agreement is jointly and severally guaranteed by both our 100% owned subsidiary Central European Media Enterprises N.V. ("CME NV") and CME BV and is secured by a pledge over 100% of the outstanding shares of each of CME NV and CME BV. The covenants and events of default under the Reimbursement Agreement are substantially the same as under the 2021 Revolving Credit Facility.Facility (described below).
We pay Guarantee Fees to Time Warner based on the amounts outstanding on the Euro Term Loans calculated on a per annum basis and on our consolidated net leverage (as defined in the Reimbursement Agreement) as shown in the table below.below:
|
| | | | | | | | | | | | |
| Consolidated Net Leverage | Cash Rate (1) |
| | PIK Fee Rate |
| | Total Rate |
|
| ≥ | 7.0x | | | | 5.00 | % | | 3.50 | % | | 8.50 | % |
| < | 7.0x | - | 6.0x | | 5.00 | % | | 2.25 | % | | 7.25 | % |
| < | 6.0x | - | 5.0x | | 5.00 | % | | 1.00 | % | | 6.00 | % |
| < | 5.0x | | | | 5.00 | % | | — | % | | 5.00 | % |
| |
(1) | Includes cash paid for interest for the Euro Term Loans and the related customary hedging arrangements. |
Our consolidated net leverage as at June 30, 2017 and December 31, 2016 was 6.1x and 6.9x, respectively. For the three and ninesix months ended SeptemberJune 30, 20162017 and 2015,2016, we recognized US$ 20.414.6 million and US$ 49.331.0 million and US$ 4.819.8 million and US$ 14.428.9 million, respectively, of Guarantee Fees as interest expense in our condensed consolidated statements of operations and comprehensive income / loss.
The Guarantee Fees relating to the 2018 Euro Term Loan and the 2019 Euro Term Loan are payable semi-annually in arrears on each May 1 and November 1, in cash or in kind, (byby adding such semi-annual Guarantee Fees to any such amount then outstanding).outstanding. The Guarantee Fees relating to the 2021 Euro Term Loan are payable semi-annually in arrears on each June 1 and December 1 with1. The first 5.0% of the first 5.0%all-in rate for each facility (including the base rate and the rate paid pursuant to the hedging arrangements) must be paid in cash and the remainder is payable at our election in cash or in kind.
The Guarantee Fees paid in kind are presented as a component of other non-current liabilities (see Note 10, "Other Liabilities") and bear interest per annum at their respective Guarantee Fee rate (as set forth in the table below), payable semi-annually in arrears in cash or in kind (by adding such semi-annual Guarantee Fees to any such amount then outstanding) on each respective payment date.. Guarantee Fees paid in cash are included in cash flows from operating activities in our condensed consolidated statements of cash flows.
CENTRAL EUROPEAN MEDIA ENTERPRISES LTD.
NOTES TO CONDENSED CONSOLIDATED FINANCIAL STATEMENTS
(Tabular amounts in US$ 000’s, except share and per share data)
(Unaudited)
| | | | Base Rate |
| | Rate Fixed Pursuant to Interest Rate Hedges |
| | Guarantee Fee Rate |
| | All-in Borrowing Rate |
| | Base Rate |
| | Rate Fixed Pursuant to Interest Rate Hedges |
| | Guarantee Fee Rate |
| | All-in Borrowing Rate |
|
| 2018 Euro Term Loan | 1.50 | % | | 0.21 | % | (1) | 6.79 | % | | 8.50 | % | | 1.50 | % | | 0.21 | % | (1) | 5.54 | % | | 7.25 | % |
| 2019 Euro Term Loan | 1.50 | % | | 0.31 | % | | 6.69 | % | | 8.50 | % | | 1.50 | % | | 0.31 | % | | 5.44 | % | | 7.25 | % |
| 2021 Euro Term Loan | 1.50 | % | | 0.28 | % | | 8.22 | % | (2) | 10.00 | % | (2) | 1.50 | % | | 0.28 | % | | 5.47 | % | | 7.25 | % |
2021 Revolving Credit Facility (3)(2) | 10.00 | % | | — |
| | — |
| | 10.00 | % | | 9.30 | % | (3) | — | % | | — | % | | 9.30 | % |
| |
(1) | Effective until November 1, 2017. From November 1, 2017 through maturity on November 1, 2018, the rate fixed pursuant to interest rate hedges will decrease to 0.14%, with a corresponding increase in the guarantee feeGuarantee Fee rate, such that the all-in borrowing rate remains 8.50%.7.25% if our net leverage ratio remains unchanged. |
| |
(2) | As at SeptemberJune 30, 2016. With effect from October 27, 20162017, the guarantee fee rate and the all-in borrowing rate will decrease to 7.22% and 9.00%, respectively.2021 Revolving Credit Facility was undrawn. |
| |
(3) | AsBased on the three month LIBOR of 1.30% as at SeptemberJune 30, 2016, the aggregate principal amount available under the 2021 Revolving Credit Facility was undrawn.2017. |
2021 Revolving Credit Facility
WeAs at June 30, 2017, we had no balance outstanding under the US$ 115.0 million revolving credit facility (the “2021 Revolving Credit Facility”), all of which was available to be drawn, as at September 30, 2016.drawn. The aggregate principal amount available decreases to US$ 50.0 million with effect from January 1, 2018 or, if earlier, upon the repayment of the 2018 Euro Term Loan with the expected proceeds from the sale of our Croatia and Slovenia operations (see Note 21, "Subsequent Events").
The 2021 Revolving Credit Facility bears interest at a rate per annum based on, at our option, an alternative base rate plus 8.0%7.0% or an amount equal to the greater of (i) an adjusted LIBO rateLIBOR and (ii) 1.0%, plus, in each case, 9.0%8.0%, with the first 5.0% paidpayable in cash and the remainder payable at our election in cash or in kind by adding such accrued interest to the applicable principal amount outstanding under the 2021 Revolving Credit Facility. The interest rate on the 2021 Revolving Credit Facility is determined on the basis of our net leverage ratio (as defined in the Reimbursement Agreement) and ranges from 10.0%LIBOR (subject to a floor of 1.0%) plus 9.0% (if our net leverage is greater than or equal to seven times) to 7.0% per annum (if our net leverage ratio is less than five times). The maturity date of the 2021 Revolving Credit Facility is February 19, 2021 with the available amount decreasing to US$ 50.0 million with effect from January 1, 2018.2021. When drawn, the 2021 Revolving Credit Facility permits prepayment at our option in whole or in part without penalty.
The 2021 Revolving Credit Facility is jointly and severally guaranteed by CME NV and CME BV and is secured by a pledge over 100% of the outstanding shares of each of CME NV and CME BV. The 2021 Revolving Credit Facility agreement contains limitations on CME’sour ability to incur indebtedness, incur guarantees, grant liens, pay dividends or make other distributions, enter into certain affiliate transactions, consolidate, merge or effect a corporate reconstruction, make certain investments acquisitions and loans, and conduct certain asset sales. The agreement also contains maintenance covenants in respect of interest cover, cash flow cover and total leverage ratios, and has covenants in respect of incurring indebtedness, the provision of guarantees, making investments and disposals, granting security and certain events of defaults.
Other Credit Facilities and Capital Lease Obligations
Other credit facilities and capital lease obligations comprised the following at SeptemberJune 30, 20162017 and December 31, 20152016:
| | | | September 30, 2016 |
| | December 31, 2015 |
| June 30, 2017 |
| | December 31, 2016 |
|
Credit facilities (1) – (3) | $ | — |
| | $ | — |
| $ | — |
| | $ | — |
|
| Capital leases | 3,486 |
| | 3,648 |
| 7,505 |
| | 4,313 |
|
| Total credit facilities and capital leases | 3,486 |
| | 3,648 |
| 7,505 |
| | 4,313 |
|
| Less: current maturities | (1,258 | ) | | (1,155 | ) | (2,386 | ) | | (1,494 | ) |
| Total non-current credit facilities and capital leases | $ | 2,228 |
| | $ | 2,493 |
| $ | 5,119 |
| | $ | 2,819 |
|
| |
(1) | We have a cash pooling arrangement with Bank Mendes Gans (“BMG”), a subsidiary of ING Bank N.V. (“ING”), which enables us to receive credit across the group in respect of cash balances which our subsidiaries depositdeposited with BMG. Cash deposited by our subsidiaries with BMG is pledged as security against the drawings of other subsidiaries up to the amount deposited. |
As at SeptemberJune 30, 20162017, we had deposits of US$ 28.719.1 million in and no drawings on the BMG cash pool. Interest is earned on deposits at the relevant money market rate. As at December 31, 20152016, we had deposits of US$ 19.616.4 million in and no drawings on the BMG cash pool.
| |
(2) | As at SeptemberJune 30, 20162017 and December 31, 20152016, there were no drawings outstanding under a CZK 800.0675.0 million (approximately US$ 33.029.4 million) factoring framework agreement with Factoring Ceska Sporitelna (“FCS”).České spořitelny, a.s. Under this facility, up to CZK 800.0675.0 million (approximately US$ 33.029.4 million) of receivables from certain customers in the Czech Republic may be factored on a recourse or non-recourse basis. The facility has a factoring fee of 0.3% of any factored receivable and bears interest at one-month PRIBOR plus 2.5% per annum for the period that receivables are factored and outstanding. |
| |
(3) | As at SeptemberJune 30, 2017 and December 31, 2016, there were RON 83.831.8 million (approximately US$ 21.08.0 million) and RON 105.7 million (approximately US$ 24.6 million), respectively, of receivables factored under a factoring framework agreement with Global Funds IFN S.A. entered into in the first quarter of 2016. Under this facility, receivables from certain customers in Romania may be factored on a non-recourse basis. The facility has a factoring fee of 4.0% of any factored receivable and bears interest at 6.0% per annum from the date the receivables are factored to the due date of the factored receivable. |
CENTRAL EUROPEAN MEDIA ENTERPRISES LTD.
NOTES TO CONDENSED CONSOLIDATED FINANCIAL STATEMENTS
(Tabular amounts in US$ 000’s, except share and per share data)
(Unaudited)
As at September 30, 2016, there were no receivables factored under a RON 20.0 million (approximately US$ 5.0 million) factoring framework agreement with UniCredit Bank S.A. Under this facility, receivables from certain customers in Romania may be factored on a non-recourse basis. The facility has a factoring fee of 0.3% of any factored receivable and bears interest at 2.3% per annum from the date the receivables are factored to the earlier of the date the factored receivable is collected or 210 days from the factored receivable's due date.
Total Group
At SeptemberJune 30, 2016,2017, the maturity of our long-term debt and credit facilities, excluding any future elections to pay interest in kind, was as follows:
| | | 2016 | $ | — |
| |
| 2017 | — |
| $ | — |
|
| 2018 | 279,918 |
| 286,213 |
|
| 2019 | 262,658 |
| 268,565 |
|
| 2020 | — |
| — |
|
| 2021 and thereafter | 523,228 |
| |
| 2021 | | 534,995 |
|
| 2022 and thereafter | | — |
|
| Total long-term debt and credit facilities | 1,065,804 |
| 1,089,773 |
|
| Debt issuance costs | (8,362 | ) | (6,900 | ) |
| Carrying amount of long-term debt and credit facilities | $ | 1,057,442 |
| $ | 1,082,873 |
|
Capital Lease Commitments
We lease certain of our office and broadcast facilities as well as machinery and equipment under various leasing arrangements. The future minimum lease payments, by year and in the aggregate, under capital leases with initial or remaining non-cancellable lease terms in excess of one year, consisted of the following at SeptemberJune 30, 2017:
|
| | | |
| 2017 | $ | 1,296 |
|
| 2018 | 2,314 |
|
| 2019 | 1,980 |
|
| 2020 | 1,480 |
|
| 2021 | 590 |
|
| 2022 and thereafter | — |
|
| Total undiscounted payments | 7,660 |
|
| Less: amount representing interest | (155 | ) |
| Present value of net minimum lease payments | $ | 7,505 |
|
5. PROGRAM RIGHTS
Program rights comprised the following at June 30, 2017 and December 31, 2016:
|
| | | |
| 2016 | $ | 353 |
|
| 2017 | 1,304 |
|
| 2018 | 1,034 |
|
| 2019 | 699 |
|
| 2020 | 196 |
|
| 2021 and thereafter | 6 |
|
| Total undiscounted payments | 3,592 |
|
| Less: amount representing interest | (106 | ) |
| Present value of net minimum lease payments | $ | 3,486 |
|
|
| | | | | | | |
| | June 30, 2017 |
| | December 31, 2016 |
|
| Program rights: | | | |
| Acquired program rights, net of amortization | $ | 197,010 |
| | $ | 183,303 |
|
| Less: current portion of acquired program rights | (91,002 | ) | | (86,151 | ) |
| Total non-current acquired program rights | 106,008 |
| | 97,152 |
|
| Produced program rights – feature films: | | | |
|
| Released, net of amortization | 997 |
| | 1,039 |
|
| Produced program rights – television programs: | |
| | |
|
| Released, net of amortization | 59,603 |
| | 54,149 |
|
| Completed and not released | 4,636 |
| | 2,593 |
|
| In production | 30,365 |
| | 23,712 |
|
| Development and pre-production | 1,324 |
| | 711 |
|
| Total produced program rights | 96,925 |
| | 82,204 |
|
| Total non-current acquired program rights and produced program rights | $ | 202,933 |
| | $ | 179,356 |
|
CENTRAL EUROPEAN MEDIA ENTERPRISES LTD.
NOTES TO CONDENSED CONSOLIDATED FINANCIAL STATEMENTS
(Tabular amounts in US$ 000’s, except share and per share data)
(Unaudited)
5. PROGRAM RIGHTS
Program rights comprised the following at September 30, 2016 and December 31, 2015:
|
| | | | | | | |
| | September 30, 2016 |
| | December 31, 2015 |
|
| Program rights: | | | |
| Acquired program rights, net of amortization | $ | 200,464 |
| | $ | 179,632 |
|
| Less: current portion of acquired program rights | (98,604 | ) | | (85,972 | ) |
| Total non-current acquired program rights | 101,860 |
| | 93,660 |
|
| Produced program rights – Feature Films: | | | |
|
| Released, net of amortization | 1,152 |
| | 1,298 |
|
| Produced program rights – Television Programs: | |
| | |
|
| Released, net of amortization | 59,384 |
| | 56,125 |
|
| Completed and not released | 1,606 |
| | 3,500 |
|
| In production | 29,005 |
| | 13,783 |
|
| Development and pre-production | 671 |
| | 707 |
|
| Total produced program rights | 91,818 |
| | 75,413 |
|
| Total non-current acquired program rights and produced program rights | $ | 193,678 |
| | $ | 169,073 |
|
6. ACCOUNTS RECEIVABLE
Accounts receivable comprised the following at SeptemberJune 30, 20162017 and December 31, 20152016:
| | | | September 30, 2016 |
| | December 31, 2015 |
| June 30, 2017 |
| | December 31, 2016 |
|
| Unrelated customers | $ | 147,499 |
| | $ | 176,628 |
| $ | 197,631 |
| | $ | 187,937 |
|
| Less: allowance for bad debts and credit notes | (8,932 | ) | | (9,201 | ) | (11,173 | ) | | (9,598 | ) |
| Total accounts receivable | $ | 138,567 |
| | $ | 167,427 |
| $ | 186,458 |
| | $ | 178,339 |
|
CENTRAL EUROPEAN MEDIA ENTERPRISES LTD.
NOTES TO CONDENSED CONSOLIDATED FINANCIAL STATEMENTS
(Tabular amounts in US$ 000’s, except share and per share data)
(Unaudited)
7. OTHER ASSETS
Other current and non-current assets comprised the following at SeptemberJune 30, 20162017 and December 31, 20152016:
| | | | September 30, 2016 |
| | December 31, 2015 |
| June 30, 2017 |
| | December 31, 2016 |
|
Current: | | | | | | |
| Prepaid acquired programming | $ | 19,843 |
| | $ | 22,761 |
| $ | 17,574 |
| | $ | 22,511 |
|
| Other prepaid expenses | 7,993 |
| | 6,941 |
| 8,759 |
| | 5,270 |
|
| Deferred tax | — |
| | 10,425 |
| |
| VAT recoverable | 682 |
| | 733 |
| 679 |
| | 713 |
|
| Income taxes recoverable | 276 |
| | 249 |
| 320 |
| | 206 |
|
| Other | 2,533 |
| | 2,097 |
| 2,859 |
| | 3,771 |
|
| Total other current assets | $ | 31,327 |
| | $ | 43,206 |
| $ | 30,191 |
| | $ | 32,471 |
|
| | | | | | | |
| | September 30, 2016 |
| | December 31, 2015 |
| June 30, 2017 |
| | December 31, 2016 |
|
| Non-current: | |
| | |
| |
| | |
|
| Capitalized debt costs | $ | 16,866 |
| | $ | 27,060 |
| $ | 14,290 |
| | $ | 15,018 |
|
| Deferred tax | 224 |
| | 124 |
| 5,105 |
| | 4,570 |
|
| Other | 3,255 |
| | 3,949 |
| 2,121 |
| | 1,855 |
|
| Total other non-current assets | $ | 20,345 |
| | $ | 31,133 |
| $ | 21,516 |
| | $ | 21,443 |
|
Capitalized debt costs are being amortized over the term of the related debt instruments2021 Revolving Credit Facility using the straight-line method, which approximates the effective interest method.
8. PROPERTY, PLANT AND EQUIPMENT
Property, plant and equipment comprised the following at SeptemberJune 30, 20162017 and December 31, 20152016:
| | | | September 30, 2016 |
| | December 31, 2015 |
| June 30, 2017 |
| | December 31, 2016 |
|
| Land and buildings | $ | 95,153 |
| | $ | 92,237 |
| $ | 100,695 |
| | $ | 90,988 |
|
| Machinery, fixtures and equipment | 180,244 |
| | 164,503 |
| 226,736 |
| | 202,110 |
|
| Other equipment | 29,469 |
| | 32,314 |
| 36,407 |
| | 33,752 |
|
| Software licenses | 61,019 |
| | 55,656 |
| 64,181 |
| | 55,542 |
|
| Construction in progress | 1,525 |
| | 3,001 |
| 2,180 |
| | 5,316 |
|
| Total cost | 367,410 |
| | 347,711 |
| 430,199 |
| | 387,708 |
|
| Less: accumulated depreciation | (257,986 | ) | | (239,189 | ) | (314,217 | ) | | (278,619 | ) |
| Total net book value | $ | 109,424 |
| | $ | 108,522 |
| $ | 115,982 |
| | $ | 109,089 |
|
| | | | | | | |
| Assets held under capital leases (included in the above) | |
| | |
| |
| | |
|
| Land and buildings | $ | 3,901 |
| | $ | 3,805 |
| $ | 3,989 |
| | $ | 3,684 |
|
| Machinery, fixtures and equipment | 5,163 |
| | 4,646 |
| 11,034 |
| | 6,338 |
|
| Total cost | 9,064 |
| | 8,451 |
| 15,023 |
| | 10,022 |
|
| Less: accumulated depreciation | (4,220 | ) | | (3,556 | ) | (5,628 | ) | | (4,316 | ) |
| Total net book value | $ | 4,844 |
| | $ | 4,895 |
| $ | 9,395 |
| | $ | 5,706 |
|
CENTRAL EUROPEAN MEDIA ENTERPRISES LTD.
NOTES TO CONDENSED CONSOLIDATED FINANCIAL STATEMENTS
(Tabular amounts in US$ 000’s, except share and per share data)
(Unaudited)
The movement in the net book value of property, plant and equipment during the ninesix months ended SeptemberJune 30, 20162017 and 2015 is2016 was comprised of:
| | | | For the Nine Months Ended September 30, | For the Six Months Ended June 30, |
| | 2016 |
| | 2015 |
| 2017 |
| | 2016 |
|
| Opening balance | $ | 108,522 |
| | $ | 114,335 |
| $ | 109,089 |
| | $ | 108,522 |
|
| Additions | 20,266 |
| | 24,814 |
| 12,604 |
| | 10,043 |
|
| Disposals | (45 | ) | | (282 | ) | (71 | ) | | (49 | ) |
| Depreciation | (22,469 | ) | | (20,911 | ) | (16,052 | ) | | (14,912 | ) |
| Foreign currency movements | 3,150 |
| | (7,426 | ) | 10,412 |
| | 2,040 |
|
Other (1) | — |
| | (1,293 | ) | |
| Ending balance | $ | 109,424 |
| | $ | 109,237 |
| $ | 115,982 |
| | $ | 105,644 |
|
| |
(1)
| Other is comprised of property, plant and equipment which were classified as assets held for sale in the third quarter of 2015 and subsequently sold in the fourth quarter of 2015. |
9. ACCOUNTS PAYABLE AND ACCRUED LIABILITIES
Accounts payable and accrued liabilities comprised the following at SeptemberJune 30, 20162017 and December 31, 20152016:
| | | | September 30, 2016 |
| | December 31, 2015 |
| June 30, 2017 |
| | December 31, 2016 |
|
| Accounts payable and accrued expenses | $ | 54,413 |
| | $ | 57,042 |
| $ | 61,076 |
| | $ | 59,522 |
|
| Related party accounts payable | 30 |
| | 53 |
| 112 |
| | 192 |
|
| Programming liabilities | 30,811 |
| | 24,901 |
| 22,551 |
| | 29,249 |
|
| Related party programming liabilities | 18,673 |
| | 14,583 |
| 19,839 |
| | 18,959 |
|
| Duties and other taxes payable | 11,134 |
| | 12,856 |
| 9,244 |
| | 13,446 |
|
| Accrued staff costs | 19,987 |
| | 20,709 |
| 16,474 |
| | 20,565 |
|
| Accrued interest payable | 3,096 |
| | 914 |
| 3,131 |
| | 2,941 |
|
Related party accrued interest payable (1) | 31,118 |
| | 477 |
| |
| Other | 2,848 |
| | 3,170 |
| |
| Related party accrued interest payable (including Guarantee Fees) | | 7,935 |
| | 9,588 |
|
| Income taxes payable | | 9,394 |
| | 5,514 |
|
| Other accrued liabilities | | 913 |
| | 1,005 |
|
| Total accounts payable and accrued liabilities | $ | 172,110 |
| | $ | 134,705 |
| $ | 150,669 |
| | $ | 160,981 |
|
| |
(1)
| Amount represents accrued Guarantee Fees for which we have not yet paid in cash or made an election to pay in kind. See Note 4, "Long-term Debt and Other Financing Arrangements". |
CENTRAL EUROPEAN MEDIA ENTERPRISES LTD.
NOTES TO CONDENSED CONSOLIDATED FINANCIAL STATEMENTS
(Tabular amounts in US$ 000’s, except share and per share data)
(Unaudited)
10. OTHER LIABILITIES
Other current and non-current liabilities comprised the following at SeptemberJune 30, 20162017 and December 31, 20152016:
| | | | September 30, 2016 |
| | December 31, 2015 |
| June 30, 2017 |
| | December 31, 2016 |
|
| Current: | | | | | | |
| Deferred revenue | $ | 21,311 |
| | $ | 7,546 |
| $ | 24,413 |
| | $ | 5,333 |
|
| Derivative liabilities | 442 |
| | 650 |
| |
| Restructuring provision | — |
| | 458 |
| |
| Legal provision | 1,096 |
| | 1,520 |
| 3,050 |
| | 2,680 |
|
| Other | 361 |
| | 274 |
| 1,654 |
| | 1,076 |
|
| Total other current liabilities | $ | 23,210 |
| | $ | 10,448 |
| $ | 29,117 |
| | $ | 9,089 |
|
| | | | | | | |
| | September 30, 2016 |
| | December 31, 2015 |
| June 30, 2017 |
| | December 31, 2016 |
|
| Non-current: | |
| | |
| |
| | |
|
| Deferred tax | $ | 22,850 |
| | $ | 25,990 |
| $ | 21,616 |
| | $ | 20,335 |
|
Related party Commitment Fee payable (1) | 9,498 |
| | 9,240 |
| 10,322 |
| | 9,905 |
|
| Related party Guarantee Fee payable (Note 4) | 12,409 |
| | 22,655 |
| 49,682 |
| | 34,492 |
|
| Accrued interest | — |
| | 977 |
| |
| Related party accrued interest | — |
| | 5,304 |
| |
| Other | 7,063 |
| | 1,583 |
| 5,483 |
| | 4,026 |
|
| Total other non-current liabilities | $ | 51,820 |
| | $ | 65,749 |
| $ | 87,103 |
| | $ | 68,758 |
|
| |
(1) | Represents the commitment fee ("Commitment(the "Commitment Fee") payable to Time Warner, including accrued interest, in respect of its obligation under a commitment letter dated November 14, 2014 between Time Warner and us whereby Time Warner agreed to provide or assist with arranging a loan facility to repay our 5.0% senior convertible notes at maturity in November 2015. The Commitment Fee is payable by November 1, 2019, the maturity date of the 2019 Euro Term Loan, or earlier if the repayment of the 2019 Euro Term Loan is accelerated. The Commitment Fee bears interest at 8.5% per annum and such interest is payable in arrears on each May 1 and November 1, and may be paid in cash or in kind, at our election. |
CENTRAL EUROPEAN MEDIA ENTERPRISES LTD.
NOTES TO CONDENSED CONSOLIDATED FINANCIAL STATEMENTS
(Tabular amounts in US$ 000’s, except share and per share data)
(Unaudited)
11. FINANCIAL INSTRUMENTS AND FAIR VALUE MEASUREMENTS
ASC 820, “Fair Value Measurements and Disclosure”, establishes a hierarchy that prioritizes the inputs to those valuation techniques used to measure fair value. The hierarchy gives the highest priority to unadjusted quoted prices in active markets for identical assets or liabilities (Level 1 measurements) and the lowest priority to unobservable inputs (Level 3 measurements). The three levels of the fair value hierarchy are:
Basis of Fair Value Measurement
| |
| Level 1 | Unadjusted quoted prices in active markets that are accessible at the measurement date for identical, unrestricted instruments. |
| |
| Level 2 | Quoted prices in markets that are not considered to be active or financial instruments for which all significant inputs are observable, either directly or indirectly. |
| |
| Level 3 | Prices or valuations that require inputs that are both significant to the fair value measurement and unobservable. |
A financial instrument’s level within the fair value hierarchy is based on the lowest level of any input that is significant to the fair value measurement.
We evaluate the position of each financial instrument measured at fair value in the hierarchy individually based on the valuation methodology we apply. The carrying amount of financial instruments, including cash and cash equivalents, accounts receivable, and accounts payable and accrued liabilities, approximate their fair value due to the short-term nature of these items. The fair value of our long-term debt is included in Note 4, "Long-term Debt and Other Financing Arrangements".
Hedge Accounting Activities
Cash Flow Hedges of Interest Rate Risk
We are party to interest rate swap agreements to mitigate our exposure to interest rate fluctuations on the outstanding principal amount of ourthe Euro Term Loans. These interest rate swaps, designated as cash flow hedges, provide us with variable-rate cash receipts in exchange for fixed-rate payments over the lives of the agreements, with no exchange of the underlying notional amount. These instruments are carried at fair value on our condensed consolidated balance sheets as other current and other non-current liabilities based on their maturity, and the effective portion of the changes in the fair value is recorded in accumulated other comprehensive income / loss and subsequently reclassified to interest expense when the hedged item affects earnings. The ineffective portion of changes in the fair value is recognized immediately in the change in fair value of derivatives in our condensed consolidated statements of operations and comprehensive income / loss. For the three and ninesix months ended SeptemberJune 30, 20162017 and 2015,2016, we did not recognize any charges related to hedge ineffectiveness.
CENTRAL EUROPEAN MEDIA ENTERPRISES LTD.
NOTES TO CONDENSED CONSOLIDATED FINANCIAL STATEMENTS
(Tabular amounts in US$ 000’s, except share and per share data)
(Unaudited)
Information relating to financial instruments is as follows: | | | Trade Date | | Number of Contracts |
| | Description | | Aggregate Notional Amount |
| | Maturity Date | | Objective | | Fair Value as at September 30, 2016 |
| | Number of Contracts |
| | Description | | Aggregate Notional Amount |
| | Maturity Date | | Objective | | Fair Value as at June 30, 2017 |
|
| April 5, 2016 | | 5 |
| | Interest rate swap | | € | 468,800 |
| | February 21, 2021 | | Interest rate hedge underlying 2021 Euro Term Loan | | $ | (3,817 | ) | | 5 |
| | Interest rate swap | | EUR | 468,800 |
| | February 21, 2021 | | Interest rate hedge underlying 2021 Euro Term Loan | | $ | (1,098 | ) |
| April 5, 2016 | | 4 |
| | Interest rate swap | | € | 250,800 |
| | November 1, 2018 | | Interest rate hedge underlying 2018 Euro Term Loan, forward starting on November 1, 2017 | | $ | (308 | ) | | 4 |
| | Interest rate swap | | EUR | 250,800 |
| | November 1, 2018 | | Interest rate hedge underlying 2018 Euro Term Loan, forward starting on November 1, 2017 | | $ | (363 | ) |
| November 10, 2015 | | 3 |
| | Interest rate swap | | € | 235,335 |
| | November 1, 2019 | | Interest rate hedge underlying 2019 Euro Term Loan | | $ | (2,182 | ) | | 3 |
| | Interest rate swap | | EUR | 235,335 |
| | November 1, 2019 | | Interest rate hedge underlying 2019 Euro Term Loan | | $ | (1,504 | ) |
| November 14, 2014 | | 2 |
| | Interest rate swap | | € | 250,800 |
| | November 1, 2017 | | Interest rate hedge underlying 2018 Euro Term Loan | | $ | (646 | ) | | 2 |
| | Interest rate swap | | EUR | 250,800 |
| | November 1, 2017 | | Interest rate hedge underlying 2018 Euro Term Loan | | $ | (216 | ) |
We value the interest rate swap agreements using a valuation model which calculates the fair value on the basis of the net present value of the estimated future cash flows. The most significant input used in the valuation model is the expected EURIBOR-based yield curve. These instruments were allocated to Level 2 of the fair value hierarchy because the critical inputs to this model, including current interest rates, relevant yield curves and the known contractual terms of the instruments, were readily observable.
|
| | | |
| | Accumulated Other Comprehensive Loss |
|
| BALANCE December 31, 2015 | $ | (1,420 | ) |
| Loss on interest rate swaps | (7,302 | ) |
| Reclassified to interest expense | 1,721 |
|
| BALANCE September 30, 2016 | $ | (7,001 | ) |
Non-Hedge Accounting Activities
The change in fair value of derivatives not designated as hedging instruments comprised the following for the three and ninesix months ended SeptemberJune 30, 20162017 and 2015:2016: |
| | | | | | | | | | | | | | | |
| | For the Three Months Ended September 30, | | For the Nine Months Ended September 30, |
| | 2016 |
| | 2015 |
| | 2016 |
| | 2015 |
|
| Currency swaps | $ | (398 | ) | | $ | (2,443 | ) | | $ | (11,904 | ) | | $ | (5,673 | ) |
|
| | | | | | | | | | | | | | | |
| | For the Three Months
Ended June 30, | | For the Six Months
Ended June 30, |
| | 2017 |
| | 2016 |
| | 2017 |
| | 2016 |
|
| (Loss) / gain on currency swaps | $ | (1,100 | ) | | $ | 2,544 |
| | $ | (732 | ) |
| $ | (11,506 | ) |
CENTRAL EUROPEAN MEDIA ENTERPRISES LTD.
NOTES TO CONDENSED CONSOLIDATED FINANCIAL STATEMENTS
(Tabular amounts in US$ 000’s, except share and per share data)
(Unaudited)
Foreign Currency Risk
We have entered into a number ofthe below forward foreign exchange contractscontract to reduce our exposure to movements in foreign exchange rates related to contractual payments under certain dollar-denominated agreements and to the refinancing of certain long-term debt.agreements. Information relating to financial instruments as at June 30, 2017 is as follows:
|
| | | | | | | | | | | | | | | | | |
| Trade Date | | Number of Contracts |
| | Description | | Aggregate Notional Amount |
| | Maturity Date | | Objective | | Fair Value as at September 30, 2016 |
|
| February 11, 2016 | | 1 |
| | EUR / USD forward | | $ | 17,700 |
| | December 21, 2016 | | USD-denominated operating payments | | $ | 197 |
|
| December 3, 2015 | | 2 |
| | EUR / USD forward | | $ | 10,604 |
| | December 21, 2016 | | USD-denominated operating payments | | $ | (442 | ) |
|
| | | | | | | | | | | | | | | | |
| Trade Date | | Number of Contracts | | Description | | Aggregate Notional Amount |
| | Maturity Date | | Objective | | Fair Value as at June 30, 2017 |
|
| January 31, 2017 | | 1 | | EUR / USD forward | | $ | 11,260 |
| | December 21, 2017 | | USD-denominated operating payments | | $ | (638 | ) |
These forward foreign exchange contracts are considered economic hedges but were not designated as hedging instruments, so changes in the fair value of the derivatives were recorded as changes in fair value of derivatives in the condensed consolidated statements of operations and comprehensive income / loss and in the condensed consolidated balance sheet in other liabilities.current assets. We valued these contracts using an industry-standard pricing model which calculated the fair value on the basis of the net present value of the estimated future cash flows receivable or payable. These instruments were allocated to Level 2 of the fair value hierarchy because the critical inputs to this model, including foreign exchange forward rates and the known contractual terms of the instruments, were readily observable.
CENTRAL EUROPEAN MEDIA ENTERPRISES LTD.
NOTES TO CONDENSED CONSOLIDATED FINANCIAL STATEMENTS
(Tabular amounts in US$ 000’s, except share and per share data)
(Unaudited)
12. CONVERTIBLE REDEEMABLE PREFERRED SHARES
200,000 shares of our Series B Convertible Redeemable Preferred Stock, par value US$ 0.08 per share (the “Series B Preferred Shares”), were issued and outstanding as at SeptemberJune 30, 20162017 and December 31, 2015.2016. As at SeptemberJune 30, 20162017 and December 31, 2015,2016, the carrying value of the Series B Preferred Shares was US$ 252.5259.7 million and US$ 241.2254.9 million, respectively. The Series B Preferred Shares are held by Time Warner Media Holdings B.V. ("TW Investor"). As of SeptemberJune 30, 2016,2017, the 200,000 shares of Series B preferred stockPreferred Shares were convertible into approximately 104.2107.1 million shares of Class A common stock.
The initial stated value of the Series B Preferred Shares of US$ 1,000 per share accretes at an annual rate of 3.75%, compounded quarterly, from and including June 25, 2016 to but excluding the fifth anniversary of the date of issuance.June 24, 2018. We have the right to pay cash to the holder in lieu of any further accretion. Each Series B Preferred Share may, at the holder's option, be converted into the number of shares of our Class A common stock determined by dividing (i) the accreted stated value plus accrued but unpaid dividends, if any, in each case as of the conversion date, by (ii) the conversion price, which was approximately US$ 2.42 at SeptemberJune 30, 2016,2017, but is subject to adjustment from time to time pursuant to customary weighted-average anti-dilution provisions with respect to our issuances of equity or equity-linked securities at a price below the then-applicable conversion price (excluding any securities issued under our benefit plans at or above fair market value). We have the right to redeem the Series B Preferred Shares in whole or in part upon 30 days' written notice. The redemption price of each outstanding Series B Preferred Share is equal to its accreted stated value plus accrued but unpaid dividends, if any, in each case as of the redemption date specified in the redemption notice. After receipt of a redemption notice, each holder of Series B Preferred Shares will have the right to convert, prior to the date of redemption, all or part of such Series B Preferred Shares to be redeemed by us into shares of our Class A common stock in accordance with the terms of conversion described above.
Holders of the Series B Preferred Shares have no voting rights on any matter presented to holders of any class of our capital stock, with the exception that they may vote with holders of shares of our Class A common stock (i) with respect to a change of control event or (ii) as provided by our Bye-laws or applicable Bermuda law. Holders of Series B Preferred Shares will participate in any dividends declared or paid on our Class A common stock on an as-converted basis. The Series B Preferred Shares rank pari passu with our Series A Convertible Preferred Stock and senior to all other equity securities of the Company in respect of payment of dividends and distribution of assets upon liquidation. The Series B Preferred Shares have such other rights, powers and preferences as are set forth in the Certificate of Designation for the Series B Preferred Shares.
We concluded that the Series B Preferred Shares were not considered a liability and that the embedded conversion feature in the Series B Preferred Shares was clearly and closely related to the host contract and therefore did not need to be bifurcated. The Series B Preferred Shares are required to be classified outside of permanent equity because such shares can be redeemed for cash in certain circumstances. The Series B Preferred Shares are carried on the balance sheet at redemption value. As the Series B Preferred Shares are redeemable, we have accreted changes in the redemption value since issuance. For the three and ninesix months ended SeptemberJune 30, 20162017 and 2015,2016, we recognized accretion on the Series B Preferred Shares of US$ 2.4 million and US$ 11.34.8 million; and US$ 4.4 million and US$ 12.89.0 million, respectively, with corresponding decreases in additional paid-in capital, net of the effect of foreign exchange.capital.
13. EQUITY
Preferred Stock
5,000,000 shares of Preferred Stock were authorized as at SeptemberJune 30, 20162017 and December 31, 20152016.
One share of Series A Convertible Preferred Stock (the "Series A Preferred Share") was issued and outstanding as at SeptemberJune 30, 20162017 and December 31, 20152016. The Series A Preferred Share is convertible into 11,211,449 shares of Class A common stock on the date that is 61 days after the date on which the ownership of our outstanding shares of Class A common stock by a group that includes TW Investor and its affiliates would not be greater than 49.9%. The Series A Preferred Share is entitled to one vote per each share of Class A common stock into which it is convertible and has such other rights, powers and preferences, including potential adjustments to the number of shares of Class A common stock to be issued upon conversion, as are set forth in the Certificate of Designation for the Series A Preferred Share.
200,000 shares of Series B Preferred Shares were issued and outstanding as at SeptemberJune 30, 20162017 and December 31, 20152016 (see Note 12, "Convertible Redeemable Preferred Shares"). As of SeptemberJune 30, 2016,2017, the 200,000 Series B Preferred Shares were convertible into approximately 104.2107.1 million shares of Class A common stock.
CENTRAL EUROPEAN MEDIA ENTERPRISES LTD.
NOTES TO CONDENSED CONSOLIDATED FINANCIAL STATEMENTS
(Tabular amounts in US$ 000’s, except share and per share data)
(Unaudited)
Class A and Class B Common Stock
440,000,000 shares of Class A common stock and 15,000,000 shares of Class B common stock were authorized as at SeptemberJune 30, 20162017 and December 31, 20152016. The rights of the holders of Class A common stock and Class B common stock are identical except for voting rights. The shares of Class A common stock are entitled to one vote per share and the shares of Class B common stock are entitled to ten votes per share. Shares of Class B common stock are convertible into shares of Class A common stock on a one-for-one basis for no additional consideration. Holders of each class of shares are entitled to receive dividends and upon liquidation or dissolution are entitled to receive all assets available for distribution to holders of our common stock. Under our Bye-laws, the holders of each class have no preemptive or other subscription rights and there are no redemption or sinking fund provisions with respect to such shares.
There were 142.4144.8 million and 135.8143.4 million shares of Class A common stock outstanding at SeptemberJune 30, 20162017 and December 31, 20152016, respectively, and no shares of Class B common stock outstanding at SeptemberJune 30, 20162017 or December 31, 20152016.
As at SeptemberJune 30, 20162017, TW Investor owns 43.1%42.4% of the outstanding shares of Class A common stock and has a 47.3%46.6% voting interest in the Company due to its ownership of the Series A Preferred Share.
Warrants
On May 2, 2014, we issued 114,000,000 warrants in connection with a rights offering. Each warrant may be exercised from May 2, 2016 until May 2, 2018 and entitles the holder thereof to receive one share of our Class A common stock at an exercise price of US$ 1.00 per share in cash. During 2016, 5,947,010the six months ended June 30, 2017, 527,268 warrants were exercised resulting in net proceeds to us of approximately US$ 5.90.5 million. As at SeptemberJune 30, 2016, 108,052,9902017, 106,475,777 warrants remainremained outstanding. Time Warner and TW Investor collectively hold 100,926,996 of these warrants (approximately 93.4%).warrants. The warrants are classified in additional paid-in capital, a component of equity, and are not subject to subsequent revaluation.
Accumulated Other Comprehensive Loss
The movement in accumulated other comprehensive loss during the six months ended June 30, 2017 comprised the following:
|
| | | | | | | | | | | |
| | Currency translation adjustment, net |
| | (Loss) / Gain on derivative instruments designated as hedging instruments |
| | TOTAL Accumulated Other Comprehensive Loss |
|
| BALANCE December 31, 2016 | $ | (239,537 | ) | | $ | (4,451 | ) | | $ | (243,988 | ) |
| Other comprehensive income / (loss) before reclassifications: | | | | | |
Foreign exchange gain on intercompany transactions (1) | 6,682 |
| | — |
| | 6,682 |
|
| Foreign exchange gain on the Series B Preferred Shares | 20,451 |
| | — |
| | 20,451 |
|
| Currency translation adjustment | 6,388 |
| | — |
| | 6,388 |
|
| Change in the fair value of hedging instruments | — |
| | (178 | ) | | (178 | ) |
Amounts reclassified from accumulated other comprehensive loss (2) | — |
| | 1,396 |
| | 1,396 |
|
| Net other comprehensive income | 33,521 |
| | 1,218 |
| | 34,739 |
|
| BALANCE June 30, 2017 | $ | (206,016 | ) | | $ | (3,233 | ) | | $ | (209,249 | ) |
| |
(1) | Represents foreign exchange gains on intercompany loans that are of a long-term investment nature which are reported in the same manner as translation adjustments. |
| |
(2) | Amounts reclassified from accumulated other comprehensive loss during the six months ended June 30, 2017 were reclassified to interest expense. |
14. INTEREST EXPENSE
Interest expense comprised the following for the three and six months ended June 30, 2017 and 2016:
|
| | | | | | | | | | | | | | | |
| | For the Three Months
Ended June 30, | | For the Six Months
Ended June 30, |
| | 2017 |
| | 2016 |
| | 2017 |
| | 2016 |
|
| Interest on long-term debt and other financing arrangements | $ | 20,484 |
| | $ | 26,901 |
| | $ | 42,805 |
| | $ | 59,553 |
|
| Amortization of capitalized debt issuance costs | 1,489 |
| | 2,302 |
| | 2,923 |
| | 6,201 |
|
| Amortization of debt issuance discount | — |
| | 342 |
| | — |
| | 12,945 |
|
| Total interest expense | $ | 21,973 |
| | $ | 29,545 |
| | $ | 45,728 |
| | $ | 78,699 |
|
We paid cash interest (including mandatory cash-pay Guarantee Fees) of US$ 21.2 million and US$ 35.7 millionduring the six months ended June 30, 2017 and 2016, respectively. In addition, we paid US$ 7.1 million and US$ 20.0 million of Guarantee Fees in cash during the six months ended June 30, 2017 and 2016, respectively, for which we had the option to pay in kind.
CENTRAL EUROPEAN MEDIA ENTERPRISES LTD.
NOTES TO CONDENSED CONSOLIDATED FINANCIAL STATEMENTS
(Tabular amounts in US$ 000’s, except share and per share data)
(Unaudited)
14. INTEREST EXPENSE
Interest expense comprised the following for the three and nine months ended September 30, 2016 and 2015:
|
| | | | | | | | | | | | | | | |
| | For the Three Months Ended September 30, | | For the Nine Months Ended September 30, |
| | 2016 |
| | 2015 |
| | 2016 |
| | 2015 |
|
| Interest on long-term debt and other financing arrangements | $ | 26,139 |
| | $ | 28,561 |
| | $ | 85,692 |
| | $ | 84,251 |
|
| Amortization of capitalized debt issuance costs | 1,497 |
| | 3,902 |
| | 7,698 |
| | 11,603 |
|
| Amortization of debt issuance discount | — |
| | 11,535 |
| | 12,945 |
| | 30,008 |
|
| Total interest expense | $ | 27,636 |
| | $ | 43,998 |
| | $ | 106,335 |
| | $ | 125,862 |
|
We paid cash interest (including mandatory cash-pay Guarantee Fees) of US$ 40.9 million and US$ 10.7 millionduring the nine months ended September 30, 2016 and 2015, respectively. In addition, we paid US$ 27.5 million of accrued Guarantee Fees during the nine months ended September 30, 2016, for which we had previously made an election to pay in kind.
15. OTHER NON-OPERATING INCOME / EXPENSE
Other non-operating income / expense comprised the following for the three and ninesix months ended SeptemberJune 30, 20162017 and 2015:2016:
| | | | For the Three Months Ended September 30, | | For the Nine Months Ended September 30, | For the Three Months
Ended June 30, | | For the Six Months
Ended June 30, |
| | 2016 |
| | 2015 |
| | 2016 |
| | 2015 |
| 2017 |
| | 2016 |
| | 2017 |
| | 2016 |
|
| Interest income | $ | 90 |
| | $ | 109 |
| | $ | 483 |
| | $ | 339 |
| $ | 110 |
| | $ | 285 |
| | $ | 189 |
| | $ | 393 |
|
| Foreign currency exchange gain / (loss), net | 630 |
| | (568 | ) | | 13,050 |
| | (9,768 | ) | 8,086 |
| | (3,002 | ) | | 9,767 |
| | 12,420 |
|
| Change in fair value of derivatives (Note 11) | (398 | ) | | (2,443 | ) | | (11,904 | ) | | (5,673 | ) | (1,100 | ) | | 2,544 |
| | (732 | ) | | (11,506 | ) |
| Other income / (expense), net | 65 |
| | (3,575 | ) | | 7 |
| | (7,020 | ) | 45 |
| | 6 |
| | 242 |
| | (58 | ) |
| Total other non-operating income / (expense) | $ | 387 |
| | $ | (6,477 | ) | | $ | 1,636 |
| | $ | (22,122 | ) | $ | 7,141 |
| | $ | (167 | ) | | $ | 9,466 |
| | $ | 1,249 |
|
16. STOCK-BASED COMPENSATION
Under our 2015 Stock Incentive Plan (the "2015 Plan"), 6,000,000 shares of Class A common stock are authorized for grants of stock options, restricted stock units ("RSU"), restricted stock and stock appreciation rights to employees and non-employee directors. In addition, any shares available under our Amended and Restated Stock Incentive Plan (which expired on June 1, 2015), including in respect of any awards that expire, terminate or are forfeited, will be available for awards under the 2015 Plan. Under the 2015 Plan, awards are made to employees and directors at the discretion of the Compensation Committee. Any awards previously issued under the Amended and Restated Stock Incentive Plan will continue to be governed by the terms of that plan.
For the three and ninesix months ended SeptemberJune 30, 20162017 and 2015,2016, we recognized charges for stock-based compensation of US$ 0.70.9 million and US$ 2.51.7 million; and US$ 0.60.9 million and US$ 1.51.7 million, respectively, presented as a component of selling, general and administrative expenses in our condensed consolidated statements of operations and comprehensive income / loss.
CENTRAL EUROPEAN MEDIA ENTERPRISES LTD.
NOTES TO CONDENSED CONSOLIDATED FINANCIAL STATEMENTS
(Tabular amounts in US$ 000’s, except share and per share data)
(Unaudited)
Stock Options
AThere was no option activity during the six months ended June 30, 2017. The summary of option activity for the nine months ended Septemberstock options outstanding as at June 30, 2017 and December 31, 2016 is presented below:
|
| | | | | | | | | | | | |
| | Shares |
| | Weighted Average Exercise Price per Share |
| | Weighted Average Remaining Contractual Term (years) | | Aggregate Intrinsic Value |
|
| Outstanding at December 31, 2015 | 1,666,000 |
| | $ | 3.53 |
| | 9.07 | | $ | 640 |
|
| Granted | 411,392 |
| | 2.46 |
| | | | |
| Expired | (63,000 | ) | | 32.62 |
| | | | |
| Outstanding at September 30, 2016 | 2,014,392 |
| | $ | 2.40 |
| | 8.82 | | $ | 32 |
|
| Vested and expected to vest | 2,014,392 |
| | 2.40 |
| | 8.82 | | 32 |
|
| Exercisable at September 30, 2016 | 403,000 |
| | $ | 2.69 |
| | 8.61 | | $ | 8 |
|
|
| | | | | | | | | | | | |
| | Shares |
| | Weighted Average Exercise Price per Share |
| | Weighted Average Remaining Contractual Term (years) | | Aggregate Intrinsic Value |
|
| Outstanding at December 31, 2016 | 2,011,392 |
| | $ | 2.32 |
| | 8.58 | | $ | 453 |
|
| Outstanding at June 30, 2017 | 2,011,392 |
| | $ | 2.32 |
| | 8.08 | | $ | 3,370 |
|
| Vested and expected to vest | 2,011,392 |
| | 2.32 |
| | 8.08 | | 3,370 |
|
| Exercisable at June 30, 2017 | 902,848 |
| | $ | 2.31 |
| | 8.01 | | $ | 1,526 |
|
The fair value of stock options is estimated on the grant date using the Black-Scholes option-pricing model and recognized ratably over the requisite service period. The aggregate intrinsic value (the difference between the stock price on the last day of trading of the thirdsecond quarter of SeptemberJune 30, 20162017 and the exercise prices multiplied by the number of in-the-money options) represents the total intrinsic value that would have been received by the option holders had they exercised all in-the-money options as at SeptemberJune 30, 2016.2017. This amount changes based on the fair value of our Class A common stock. As at SeptemberJune 30, 2016,2017, there was US$ 2.21.6 million of unrecognized compensation expense related to stock options which is expected to be recognized over a weighted-average period of 2.92.1 years.
CENTRAL EUROPEAN MEDIA ENTERPRISES LTD.
NOTES TO CONDENSED CONSOLIDATED FINANCIAL STATEMENTS
(Tabular amounts in US$ 000’s, except share and per share data)
(Unaudited)
Restricted Stock Units
Each RSU represents a right to receive one share of Class A common stock according to its vesting conditions. The majority of RSU issued have time-based vesting conditions and vest ratably over one to four years from the date of grant. Vesting of RSU with performance-based vesting conditions ("PRSU") is contingent on the achievement of cumulative OIBDA and unlevered free cash flow targets over a multi-year period. Upon vesting, shares of Class A common stock are issued from authorized but unissued shares. Holders of RSU and PRSU awards are not entitled to receive cash dividend equivalents and are not entitled to vote. The grant date fair values of RSU and PRSU are calculated as the closing price of our Class A common sharesstock on the date of grant.
The following table summarizes information about unvested RSU and PRSU as at SeptemberJune 30, 20162017:
| | | | Number of Shares / Units |
| | Weighted Average Grant Date Fair Value |
| Number of Shares / Units |
| | Weighted Average Grant Date Fair Value |
|
| Unvested at December 31, 2015 | 2,554,597 |
| | $ | 2.72 |
| |
| Unvested at December 31, 2016 | | 2,542,625 |
| | $ | 2.61 |
|
| Granted | 705,166 |
| | 2.41 |
| 1,158,887 |
| | 3.62 |
|
| Vested | (626,126 | ) | | 2.83 |
| (912,246 | ) | | 2.65 |
|
| Unvested at September 30, 2016 | 2,633,637 |
| | $ | 2.61 |
| |
| Forfeited | | (75,582 | ) | | 1.53 |
|
| Unvested at June 30, 2017 | | 2,713,684 |
| | $ | 3.06 |
|
As at SeptemberJune 30, 20162017, the intrinsic value of unvested RSUs was US$ 6.110.9 million. Total unrecognized compensation cost related to unvested RSUs as at SeptemberJune 30, 20162017 was US$ 3.66.0 million and is expected to be recognized over a weighted-average period of 2.42.3 years.
17. EARNINGS PER SHARE
We determined that the Series B Preferred Shares are a participating security, and accordingly, our basic and diluted net income / loss per share is calculated using the two-class method. Under the two-class method, basic net income / loss per common share is computed by dividing the net income available to common shareholders after deducting contractual amounts of accretion on our Series B Preferred Shares by the weighted-average number of common shares outstanding during the period. Diluted net income / loss per share is computed by dividing the adjusted net income by the weighted-average number of dilutive shares outstanding during the period.
CENTRAL EUROPEAN MEDIA ENTERPRISES LTD.
NOTES TO CONDENSED CONSOLIDATED FINANCIAL STATEMENTS
(Tabular amounts in US$ 000’s, except share and per share data)
(Unaudited)
The components of basic and diluted earnings per share are as follows:
|
| | | | | | | | | | | | | | | |
| | For the Three Months Ended September 30, | | For the Nine Months Ended September 30, |
| | 2016 |
| | 2015 |
| | 2016 |
| | 2015 |
|
| Loss from continuing operations | $ | (19,823 | ) | | $ | (21,510 | ) | | $ | (201,766 | ) | | $ | (103,422 | ) |
| Net loss attributable to noncontrolling interests | 196 |
| | 253 |
| | 387 |
| | 817 |
|
| Less: preferred share accretion paid in kind (Note 12) | (2,364 | ) | | (4,391 | ) | | (11,314 | ) | | (12,796 | ) |
| Loss from continuing operations available to common shareholders, net of noncontrolling interest | (21,991 | ) | | (25,648 | ) | | (212,693 | ) | | (115,401 | ) |
| Loss from discontinued operations, net of tax | — |
| | (265 | ) | | — |
| | (869 | ) |
| Net loss attributable to CME Ltd. available to common shareholders - Basic | $ | (21,991 | ) | | $ | (25,913 | ) | | $ | (212,693 | ) | | $ | (116,270 | ) |
| | | | | | | | |
| Effect of dilutive securities | | | | | | | |
| Preferred share accretion paid in kind | — |
| | — |
| | — |
| | — |
|
| Net loss attributable to CME Ltd. available to common shareholders - Diluted | $ | (21,991 | ) | | $ | (25,913 | ) | | $ | (212,693 | ) | | $ | (116,270 | ) |
| | | | | | | | |
Weighted average outstanding shares of common stock - Basic (1) | 153,494 |
| | 147,054 |
| | 149,898 |
| | 146,803 |
|
| Dilutive effect of employee stock options and RSUs | — |
| | — |
| | — |
| | — |
|
| Weighted average outstanding shares of common stock - Diluted | 153,494 |
| | 147,054 |
| | 149,898 |
| | 146,803 |
|
| | | | | | | | |
| Net loss per share: | | | | | | | |
| Continuing operations attributable to CME Ltd. - Basic and diluted | $ | (0.14 | ) | | $ | (0.17 | ) | | $ | (1.42 | ) | | $ | (0.79 | ) |
| Discontinued operations attributable to CME Ltd. - Basic and diluted | 0.00 |
| | (0.01 | ) | | 0.00 |
| | (0.00 | ) |
| Net loss attributable to CME Ltd. - Basic and diluted | (0.14 | ) | | (0.18 | ) | | (1.42 | ) | | (0.79 | ) |
|
| | | | | | | | | | | | | | | |
| | For the Three Months
Ended June 30, | | For the Six Months
Ended June 30, |
| | 2017 |
| | 2016 |
| | 2017 |
| | 2016 |
|
| Income / (loss) from continuing operations | $ | 27,798 |
| | $ | (141,249 | ) | | $ | 16,524 |
| | $ | (181,943 | ) |
| Net loss / (income) attributable to noncontrolling interests | 137 |
| | (68 | ) | | 346 |
| | 191 |
|
| Less: preferred share accretion paid in kind (Note 12) | (2,405 | ) | | (4,440 | ) | | (4,762 | ) | | (8,950 | ) |
| Less: income allocated to Series B Preferred Shares | (10,376 | ) | | — |
| | (4,917 | ) | | — |
|
| Net income / (loss) attributable to CME Ltd. available to common shareholders — basic | 15,154 |
| | (145,757 | ) | | 7,191 |
| | (190,702 | ) |
| | | | | | | | |
| Effect of dilutive securities | | | | | | | |
| Dilutive effect of Series B Preferred Shares | 2,429 |
| | — |
| | 1,103 |
| | — |
|
| Net income / (loss) attributable to CME Ltd. available to common shareholders — diluted | $ | 17,583 |
| | $ | (145,757 | ) | | $ | 8,294 |
| | $ | (190,702 | ) |
| | | | | | | | |
Weighted average outstanding shares of common stock — basic (1) | 155,738 |
| | 149,083 |
| | 155,269 |
| | 148,080 |
|
| Dilutive effect of common stock warrants, employee stock options and RSUs | 80,214 |
| | — |
| | 75,603 |
| | — |
|
| Weighted average outstanding shares of common stock — diluted | 235,952 |
| | 149,083 |
| | 230,872 |
| | 148,080 |
|
| | | | | | | | |
| Net income / (loss) per share: | | | | | | | |
| Net income / (loss) attributable to CME Ltd. — basic | $ | 0.10 |
| | $ | (0.98 | ) | | $ | 0.05 |
| | $ | (1.29 | ) |
| Net income / (loss) attributable to CME Ltd. — diluted | 0.07 |
| | (0.98 | ) | | 0.04 |
| | (1.29 | ) |
| |
(1) | For the purpose of computing basic earnings per share, the 11,211,449 shares of Class A common stock underlying the Series A Preferred Share are included in the weighted average outstanding shares of common stock - basic, because the holder of the Series A Preferred Share is entitled to receive any dividends payable when dividends are declared by the Board of Directors with respect to any shares of common stock. |
CENTRAL EUROPEAN MEDIA ENTERPRISES LTD.
NOTES TO CONDENSED CONSOLIDATED FINANCIAL STATEMENTS
(Tabular amounts in US$ 000’s, except share and per share data)
(Unaudited)
At SeptemberJune 30, 20162017, 107,665,3481,109,222 (June 30, 2016: 106,510,057) warrants, stock options, RSUs and shares underlying the Series B Preferred Shares were antidilutive to income from continuing operations and excluded from the calculation of earnings per share. These instruments may become dilutive in the future. As set forth in the Certificate of Designation for the Series B Preferred Shares, the holders of our Series B Preferred Shares are not contractually obligated to share in our losses.
18. SEGMENT DATA
We manage our business on a geographical basis, with six operating segments: Bulgaria, Croatia, the Czech Republic, Romania, the Slovak Republic and Slovenia, which are also our reportable segments and our main operating countries. These segments reflect how CME Ltd.’s operating performance is evaluated by our chief operating decision makers, who we have identified as our co-Chief Executive Officers; how operations are managed by segment managers; and the structure of our internal financial reporting.
Our segments generate revenues primarily from the sale of advertising and sponsorship on our channels. This is supplemented by revenues from cable and satellite television service providers tothat carry our channels on their platforms and from revenues through the sale of distribution rights to third parties. Intersegment revenues and profits have been eliminated in consolidation.
We evaluate our consolidated results and the performance of our segments based on net revenues and OIBDA (as defined below). We believe OIBDA is useful to investors because it provides a meaningful representation of our performance as it excludes certain items that either do not impact our cash flows or the operating results of our operations. OIBDA is also used as a component in determining management bonuses.
OIBDA includes amortization and impairment of program rights and is calculated as operating income / loss before depreciation, amortization of intangible assets, impairments of assets and certain unusual or infrequent items that are not considered by our chief operating decision makers when evaluating our performance. Stock-based compensation and certain other items are not allocated to our segments for purposes of evaluating their performance and therefore are not included in their respective OIBDA.
CENTRAL EUROPEAN MEDIA ENTERPRISES LTD.
NOTES TO CONDENSED CONSOLIDATED FINANCIAL STATEMENTS
(Tabular amounts in US$ 000’s, except share and per share data)
(Unaudited)
Below are tables showing our net revenues, OIBDA, total assets, capital expenditures and long-lived assets for our continuing operations by segment for the three and ninesix months ended SeptemberJune 30, 20162017 and 20152016 for condensed consolidated statements of operations and comprehensive income / loss data and condensed consolidated statements of cash flow data; and as at SeptemberJune 30, 20162017 and December 31, 20152016 for condensed consolidated balance sheet data.
| | | Net revenues: | For the Three Months Ended September 30, | | For the Nine Months Ended September 30, | For the Three Months
Ended June 30, | | For the Six Months
Ended June 30, |
| 2016 |
| | 2015 |
| | 2016 |
| | 2015 |
| 2017 |
| | 2016 |
| | 2017 |
| | 2016 |
|
| Bulgaria | $ | 13,789 |
| | $ | 14,673 |
| | $ | 50,103 |
| | $ | 50,877 |
| $ | 20,774 |
| | $ | 20,455 |
| | $ | 36,079 |
| | $ | 36,314 |
|
| Croatia | 9,833 |
| | 9,949 |
| | 38,037 |
| | 38,184 |
| 16,521 |
| | 16,559 |
| | 27,589 |
| | 28,204 |
|
| Czech Republic | 39,031 |
| | 35,575 |
| | 128,558 |
| | 122,671 |
| 53,371 |
| | 50,919 |
| | 92,845 |
| | 89,527 |
|
| Romania | 36,970 |
| | 32,005 |
| | 118,269 |
| | 109,561 |
| 48,570 |
| | 48,929 |
| | 87,514 |
| | 81,299 |
|
| Slovak Republic | 17,864 |
| | 17,223 |
| | 59,466 |
| | 54,997 |
| 24,624 |
| | 22,540 |
| | 42,964 |
| | 41,602 |
|
| Slovenia | 9,555 |
| | 8,606 |
| | 37,324 |
| | 35,149 |
| 18,453 |
| | 16,116 |
| | 30,670 |
| | 27,769 |
|
Intersegment revenues (1) | (336 | ) | | (709 | ) | | (845 | ) | | (1,150 | ) | (457 | ) | | (312 | ) | | (803 | ) | | (509 | ) |
| Total net revenues | $ | 126,706 |
| | $ | 117,322 |
| | $ | 430,912 |
| | $ | 410,289 |
| $ | 181,856 |
| | $ | 175,206 |
| | $ | 316,858 |
| | $ | 304,206 |
|
| |
(1) | Reflects revenues earned from the sale of content to our other country segments in CME Ltd.segments. All other revenues are third party revenues. |
|
| | | | | | | | | | | | | | | |
| OIBDA and reconciliation of OIBDA to condensed consolidated statements of operations and comprehensive income / loss: | For the Three Months
Ended June 30, | | For the Six Months
Ended June 30, |
| 2017 |
| | 2016 |
| | 2017 |
| | 2016 |
|
| Bulgaria | $ | 3,079 |
| | $ | 5,954 |
| | $ | 4,436 |
| | $ | 7,023 |
|
| Croatia | 5,171 |
| | 4,501 |
| | 6,257 |
| | 5,902 |
|
| Czech Republic | 25,553 |
| | 23,099 |
| | 36,512 |
| | 33,173 |
|
| Romania | 22,268 |
| | 22,962 |
| | 36,954 |
| | 32,424 |
|
| Slovak Republic | 7,522 |
| | 3,158 |
| | 8,395 |
| | 5,551 |
|
| Slovenia | 4,386 |
| | 1,624 |
| | 4,389 |
| | 916 |
|
| Elimination | 39 |
| | (62 | ) | | 41 |
| | (68 | ) |
| Total operating segments | 68,018 |
| | 61,236 |
| | 96,984 |
| | 84,921 |
|
| Corporate | (6,849 | ) | | (7,604 | ) | | (13,679 | ) | | (14,181 | ) |
| Total OIBDA | 61,169 |
| | 53,632 |
| | 83,305 |
| | 70,740 |
|
| Depreciation of property, plant and equipment | (8,293 | ) | | (7,627 | ) | | (16,052 | ) | | (14,912 | ) |
| Amortization of broadcast licenses and other intangibles | (2,053 | ) | | (2,114 | ) | | (4,162 | ) | | (4,174 | ) |
| Operating income | 50,823 |
| | 43,891 |
| | 63,091 |
| | 51,654 |
|
| Interest expense (Note 14) | (21,973 | ) | | (29,545 | ) | | (45,728 | ) | | (78,699 | ) |
| Loss on extinguishment of debt | — |
| | (150,158 | ) | | — |
| | (150,158 | ) |
| Non-operating income / (expense), net (Note 15) | 7,141 |
| | (167 | ) | | 9,466 |
| | 1,249 |
|
| Income / (loss) before tax | $ | 35,991 |
| | $ | (135,979 | ) | | $ | 26,829 |
| | $ | (175,954 | ) |
|
| | | | | | | |
Total assets (1): | June 30, 2017 |
| | December 31, 2016 |
|
| Bulgaria | $ | 139,982 |
| | $ | 130,873 |
|
| Croatia | 60,255 |
| | 49,135 |
|
| Czech Republic | 801,045 |
| | 700,190 |
|
| Romania | 294,236 |
| | 266,132 |
|
| Slovak Republic | 146,492 |
| | 131,220 |
|
| Slovenia | 79,136 |
| | 72,381 |
|
| Total operating segments | 1,521,146 |
| | 1,349,931 |
|
| Corporate | 37,240 |
| | 40,786 |
|
| Total assets | $ | 1,558,386 |
| | $ | 1,390,717 |
|
| |
(1) | Segment assets exclude any intercompany balances. |
CENTRAL EUROPEAN MEDIA ENTERPRISES LTD.
NOTES TO CONDENSED CONSOLIDATED FINANCIAL STATEMENTS
(Tabular amounts in US$ 000’s, except share and per share data)
(Unaudited)
|
| | | | | | | | | | | | | | | |
| OIBDA and reconciliation of OIBDA to condensed consolidated statements of operations and comprehensive income / loss: | For the Three Months Ended September 30, | | For the Nine Months Ended September 30, |
| 2016 |
| | 2015 |
| | 2016 |
| | 2015 |
|
| Bulgaria | $ | 1,943 |
| | $ | 2,223 |
| | $ | 8,966 |
| | $ | 8,466 |
|
| Croatia | (516 | ) | | (909 | ) | | 5,386 |
| | 5,925 |
|
| Czech Republic | 13,180 |
| | 9,483 |
| | 46,353 |
| | 43,812 |
|
| Romania | 12,606 |
| | 6,953 |
| | 45,030 |
| | 25,733 |
|
| Slovak Republic | (383 | ) | | 358 |
| | 5,168 |
| | 3,840 |
|
| Slovenia | (746 | ) | | (1,556 | ) | | 170 |
| | (233 | ) |
| Elimination | 11 |
| | (225 | ) | | (57 | ) | | (260 | ) |
| Total operating segments | 26,095 |
| | 16,327 |
| | 111,016 |
| | 87,283 |
|
| Corporate | (8,081 | ) | | (7,974 | ) | | (22,262 | ) | | (20,671 | ) |
| Total OIBDA | 18,014 |
| | 8,353 |
| | 88,754 |
| | 66,612 |
|
| Depreciation of property, plant and equipment | (7,557 | ) | | (6,974 | ) | | (22,469 | ) | | (20,911 | ) |
| Amortization of broadcast licenses and other intangibles | (2,073 | ) | | (2,695 | ) | | (6,247 | ) | | (9,628 | ) |
Other items (1) | — |
| | 30,169 |
| | — |
| | 11,982 |
|
| Operating income | 8,384 |
| | 28,853 |
| | 60,038 |
| | 48,055 |
|
| Interest expense (Note 14) | (27,636 | ) | | (43,998 | ) | | (106,335 | ) | | (125,862 | ) |
| Loss on extinguishment of debt (Note 4) | — |
| | — |
| | (150,158 | ) | | — |
|
| Non-operating income / (expense), net (Note 15) | 387 |
| | (6,477 | ) | | 1,636 |
| | (22,122 | ) |
| Loss before tax | $ | (18,865 | ) | | $ | (21,622 | ) | | $ | (194,819 | ) | | $ | (99,929 | ) |
| |
(1)
| Other items for the three and nine months ended September 30, 2015 consists solely of the reversal of charges related to a tax audit of Pro TV in Romania, which were accrued in the fourth quarter of 2014 and in the first quarter of 2015 and fully released in the third quarter of 2015. |
|
| | | | | | | |
Total assets (1): | September 30, 2016 |
| | December 31, 2015 |
|
| Bulgaria | $ | 134,160 |
| | $ | 134,418 |
|
| Croatia | 52,248 |
| | 52,306 |
|
| Czech Republic | 724,669 |
| | 746,269 |
|
| Romania | 292,242 |
| | 261,984 |
|
| Slovak Republic | 125,566 |
| | 121,122 |
|
| Slovenia | 71,320 |
| | 70,911 |
|
| Total operating segments | 1,400,205 |
| | 1,387,010 |
|
| Corporate | 44,031 |
| | 53,407 |
|
| Total assets | $ | 1,444,236 |
| | $ | 1,440,417 |
|
| |
(1)
| Segment assets exclude any intercompany balances. |
|
| | | | | | | | | | | | | | | |
| Capital expenditures: | For the Three Months Ended September 30, | | For the Nine Months Ended September 30, |
| 2016 |
| | 2015 |
| | 2016 |
|
| 2015 |
|
| Bulgaria | $ | 1,840 |
| | $ | 1,614 |
| | $ | 2,828 |
| | $ | 3,077 |
|
| Croatia | 305 |
| | 1,273 |
| | 1,385 |
| | 2,208 |
|
| Czech Republic | 1,454 |
| | 4,415 |
| | 4,317 |
| | 8,991 |
|
| Romania | 2,693 |
| | 2,298 |
| | 5,027 |
| | 4,885 |
|
| Slovak Republic | 462 |
| | 460 |
| | 1,286 |
| | 2,207 |
|
| Slovenia | 1,523 |
| | 927 |
| | 3,238 |
| | 2,487 |
|
| Total operating segments | 8,277 |
| | 10,987 |
| | 18,081 |
| | 23,855 |
|
| Corporate | 283 |
| | 895 |
| | 1,766 |
| | 2,489 |
|
| Total capital expenditures | $ | 8,560 |
| | $ | 11,882 |
| | $ | 19,847 |
| | $ | 26,344 |
|
CENTRAL EUROPEAN MEDIA ENTERPRISES LTD.
NOTES TO CONDENSED CONSOLIDATED FINANCIAL STATEMENTS
(Tabular amounts in US$ 000’s, except share and per share data)
(Unaudited)
|
| | | | | | | |
| Capital expenditures: | For the Six Months Ended June 30, |
| 2017 |
|
| 2016 |
|
| Bulgaria | $ | 2,019 |
| | $ | 988 |
|
| Croatia | 862 |
| | 1,080 |
|
| Czech Republic | 5,088 |
| | 2,863 |
|
| Romania | 2,966 |
| | 2,334 |
|
| Slovak Republic | 900 |
| | 824 |
|
| Slovenia | 1,759 |
| | 1,715 |
|
| Total operating segments | 13,594 |
| | 9,804 |
|
| Corporate | 1,104 |
| | 1,483 |
|
| Total capital expenditures | $ | 14,698 |
| | $ | 11,287 |
|
| | Long-lived assets (1): | September 30, 2016 |
| | December 31, 2015 |
| June 30, 2017 |
| | December 31, 2016 |
|
| Bulgaria | $ | 6,368 |
| | $ | 5,602 |
| $ | 6,691 |
| | $ | 6,280 |
|
| Croatia | 5,946 |
| | 5,497 |
| 5,926 |
| | 5,832 |
|
| Czech Republic | 37,701 |
| | 39,907 |
| 42,199 |
| | 39,529 |
|
| Romania | 23,528 |
| | 20,873 |
| 25,114 |
| | 22,796 |
|
| Slovak Republic | 15,328 |
| | 15,606 |
| 16,967 |
| | 15,326 |
|
| Slovenia | 15,004 |
| | 15,082 |
| 14,397 |
| | 14,177 |
|
| Total operating segments | 103,875 |
| | 102,567 |
| 111,294 |
| | 103,940 |
|
| Corporate | 5,549 |
| | 5,955 |
| 4,688 |
| | 5,149 |
|
| Total long-lived assets | $ | 109,424 |
| | $ | 108,522 |
| $ | 115,982 |
| | $ | 109,089 |
|
| |
(1) | Reflects property, plant and equipment. |
| | | Consolidated revenue by type: | For the Three Months Ended September 30, | | For the Nine Months Ended September 30, | For the Three Months
Ended June 30, | | For the Six Months
Ended June 30, |
| | 2016 |
| | 2015 |
| | 2016 |
| | 2015 |
| 2017 |
| | 2016 |
| | 2017 |
| | 2016 |
|
| Television advertising | $ | 101,287 |
| | $ | 93,882 |
| | $ | 354,470 |
| | $ | 337,054 |
| $ | 149,521 |
| | $ | 149,012 |
| | $ | 258,035 |
| | $ | 253,183 |
|
| Carriage fees and subscriptions | 19,745 |
| | 17,731 |
| | 58,816 |
| | 54,936 |
| 25,356 |
| | 19,862 |
| | 46,739 |
| | 39,071 |
|
| Other | 5,674 |
| | 5,709 |
| | 17,626 |
| | 18,299 |
| 6,979 |
| | 6,332 |
| | 12,084 |
| | 11,952 |
|
| Total net revenues | $ | 126,706 |
| | $ | 117,322 |
| | $ | 430,912 |
| | $ | 410,289 |
| $ | 181,856 |
| | $ | 175,206 |
| | $ | 316,858 |
| | $ | 304,206 |
|
19. COMMITMENTS AND CONTINGENCIES
Commitments
a) Programming Rights Agreements and Other Commitments
At SeptemberJune 30, 20162017, we had total commitments of US$ 139.8129.2 million (December 31, 2015:2016: US$ 144.9128.2 million) in respect of future programming, including contracts signed with license periods starting after the balance sheet date. In addition, we have digital transmission obligations, future minimum operating lease payments for non-cancellable operating leases with remaining terms in excess of one year (net of amounts to be recharged to third parties) and other commitments as follows:
|
| | | | | | | | | | | | | | | |
| | Programming purchase obligations |
| | Other commitments |
| | Operating leases |
| | Capital expenditures |
|
| 2016 | $ | 26,796 |
| | $ | 9,199 |
| | $ | 930 |
| | $ | 910 |
|
| 2017 | 46,180 |
| | 14,289 |
| | 2,873 |
| | — |
|
| 2018 | 37,845 |
| | 5,736 |
| | 2,190 |
| | — |
|
| 2019 | 19,641 |
| | 11,338 |
| | 977 |
| | — |
|
| 2020 | 6,946 |
| | 384 |
| | 508 |
| | — |
|
| 2021 and thereafter | 2,425 |
| | 395 |
| | 1,789 |
| | — |
|
| Total | $ | 139,833 |
| | $ | 41,341 |
| | $ | 9,267 |
| | $ | 910 |
|
b) Call option
Top Tone Holdings has exercised its right to acquire additional equity in CME Bulgaria, however the closing of this transaction has not yet occurred because the purchaser financing is still pending. If consummated, we would own 90.0% of our Bulgaria operations. |
| | | | | | | | | | | | | | | |
| | Programming purchase obligations |
| | Other commitments |
| | Operating leases |
| | Capital expenditures |
|
| 2017 | $ | 34,824 |
| | $ | 12,336 |
| | $ | 1,892 |
| | $ | 1,735 |
|
| 2018 | 35,647 |
| | 6,414 |
| | 2,578 |
| | 31 |
|
| 2019 | 25,133 |
| | 11,509 |
| | 1,173 |
| | 13 |
|
| 2020 | 21,852 |
| | 3,241 |
| | 667 |
| | — |
|
| 2021 | 7,110 |
| | 353 |
| | 497 |
| | — |
|
| 2022 and thereafter | 4,598 |
| | 392 |
| | 1,811 |
| | — |
|
| Total | $ | 129,164 |
| | $ | 34,245 |
| | $ | 8,618 |
| | $ | 1,779 |
|
Contingencies
a) Litigation
We are from time to time party to legal proceedings, arbitrations and regulatory proceedings arising in the normal course of our business operations.operations, including the proceeding described below. We evaluate, on a quarterly basis, developments in such matters and provide accruals for such matters, as appropriate. In making such decisions, we consider the degree of probability of an unfavorable outcome and our ability to make a reasonable estimate of the amount of a loss. An unfavorable outcome in any such proceedings, if material, could have an adverse effect on our business or consolidated financial statements.
CENTRAL EUROPEAN MEDIA ENTERPRISES LTD.
NOTES TO CONDENSED CONSOLIDATED FINANCIAL STATEMENTS
(TabularIn the fourth quarter of 2016, our Slovak subsidiary MARKIZA-SLOVAKIA, spol. s.r.o. (“Markiza”) was notified of claims that were filed in June 2016 in a court of first instance in Bratislava, the Slovak Republic to collect amounts allegedly owing under four promissory notes. These four promissory notes were purportedly issued in US$ 000’s, except shareJune 2000 by Pavol Rusko in his personal capacity and per share data)
(Unaudited)
were purportedly guaranteed by Markiza under the signature of Mr. Rusko, who was an executive director of Markiza at that time as well as one of its shareholders. The notes purport to be issued in favor of Marian Kocner, a controversial Slovak businessman, and to a former associate of Mr. Kocner, and were supposedly assigned several times, ultimately to Sprava a inkaso zmeniek, s.r.o., a company owned by Mr. Kocner that is the plaintiff in these proceedings. The four notes purport to be in the aggregate amount of approximately EUR 69.0 million. A court of first instance in Bratislava has suspended proceedings in respect of one of the promissory notes (in the amount of approximately EUR 26.0 million) because the plaintiff failed to pay court fees. Two of the remaining notes allegedly matured in 2015 and the third in 2016. Despite a random case assignment system in Slovakia, the three cases dealing with the other notes were initially assigned to the same judge. We do not believe that any of the promissory notes are authentic and are vigorously defending the claims. We are currently unable to estimate for what amount, if any, we may be liable if the plaintiff is ultimately successful in pursuing their claims.
b) Restrictions on dividends from Consolidated SubsidiariesOther
In the second quarter of 2017, the largest private company and Unconsolidated Affiliates
Corporate lawadvertiser in Croatia, Agrokor d.d. ("Agrokor"), entered government administration facing significant liquidity issues. Agrokor has since obtained short-term financing and is in the Centralprocess of obtaining additional long-term liquidity while the Croatian government-appointed administrator determines Agrokor's restructuring plans, which may include asset disposals, pending an agreement being reached with its creditors. As at June 30, 2017, we had receivables, net of an allowance for doubtful accounts, related to Agrokor and Eastern European countries in which we have operations stipulates generally that dividends may be declared by shareholders, out of yearly profits, subject to the maintenance of registered capital and required reserves after the recovery of accumulated losses. The reserve requirement restriction generally provides that before dividends may be distributed, a portion of annual net profits (typically 5.0%) be allocated to a reserve, which reserve is capped at a proportion of the registered capital of a company (ranging from 5.0% to 25.0%). The restricted net assets of our consolidated subsidiaries and equity in earnings of investments accounted for under the equity method together are less than 25.0% of consolidated net assets.its group companies totaling US$ 2.6 million.
20. RELATED PARTY TRANSACTIONS
We consider our related parties to be our officers, directors and shareholders who have direct control and/or influence over the Company as well as other parties that can significantly influence management. We have identified transactions with individuals or entities associated with Time Warner, which is represented on our Board of Directors and holds a 47.3%46.6% voting interest in CME Ltd. as at SeptemberJune 30, 20162017, as material related party transactions.
Time Warner
| | | | For the Three Months Ended September 30, | | For the Nine Months Ended September 30, | For the Three Months
Ended June 30, | | For the Six Months
Ended June 30, |
| | 2016 |
| | 2015 |
| | 2016 |
| | 2015 |
| 2017 |
| | 2016 |
| | 2017 |
| | 2016 |
|
| Net revenues | $ | — |
| | $ | 67 |
| | $ | — |
| | $ | 89 |
| |
| Cost of revenues | 5,665 |
| | 3,968 |
| | 17,111 |
| | 15,832 |
| $ | 5,354 |
| | $ | 4,750 |
| | $ | 11,091 |
| | $ | 11,446 |
|
| Interest expense | 22,189 |
| | 32,238 |
| | 87,688 |
| | 91,823 |
| 16,497 |
| | 23,994 |
| | 34,751 |
| | 65,499 |
|
CENTRAL EUROPEAN MEDIA ENTERPRISES LTD.
NOTES TO CONDENSED CONSOLIDATED FINANCIAL STATEMENTS
(Tabular amounts in US$ 000’s, except share and per share data)
(Unaudited)
| | | | September 30, 2016 |
| | December 31, 2015 |
| June 30, 2017 |
| | December 31, 2016 |
|
| Programming liabilities | $ | 18,673 |
| | $ | 14,583 |
| $ | 19,839 |
| | $ | 18,959 |
|
| Other accounts payable and accrued liabilities | 30 |
| | 53 |
| 112 |
| | 192 |
|
| Long-term debt and other financing arrangements | — |
| | 324,979 |
| |
Accrued interest payable (1) | 31,118 |
| | 5,781 |
| 7,935 |
| | 9,588 |
|
Other non-current liabilities (2) | 21,907 |
| | 31,895 |
| 60,004 |
| | 44,397 |
|
| |
(1) | Amount represents accrued Guarantee Fees for which we have not yet paid in cash or made an election to pay in kind. See Note 4, "Long-term Debt and Other Financing Arrangements". |
| |
(2) | Amount represents the Commitment Fee, as well as the Guarantee Fees for which we have made an election to pay in kind. See Note 4, "Long-term Debt and Other Financing Arrangements". |
21. SUBSEQUENT EVENTS
On July 9, 2017, we entered into a framework agreement with Slovenia Broadband S.à r.l. (the "Purchaser"), a wholly owned subsidiary of United Group B.V., relating to the sale of our Croatia and Slovenia operations for cash consideration of EUR 230.0 million (approximately US$ 262.5 million), subject to customary working capital adjustments. We expect the transaction to close before the end of 2017, subject to obtaining regulatory approvals and other customary closing conditions being satisfied. If the transaction is terminated by either party because the transaction has not closed prior by December 31, 2017 (which date may be extended under certain circumstances to March 31, 2018), we would receive a termination fee of EUR 7.0 million (approximately US$ 8.0 million), subject to certain exceptions, including if the requisite regulatory approvals have not been obtained as a result of the Purchaser being required to make specified material divestitures as a condition to any requisite regulatory approvals.
Item 2. Management's Discussion and Analysis of Financial Condition and Results of Operations
The following defined terms are used in this Quarterly Report on Form 10-Q:
the term "2017 PIK Notes" refers to our 15.0% senior secured notes due 2017, redeemed in April 2016;
the term "2017 Term Loan" refers to our 15.0% term loan facility due 2017, dated as of February 28, 2014, as amended and restated on November 14, 2014, repaid in April 2016;
the term "2018 Euro Term Loan" refers to ourCME Ltd.'s floating rate senior unsecured term credit facility due 2018, guaranteed by CME BV and Time Warner, dated as of November 14, 2014 and amended on March 9, 2015, February 19, 2016 to, among other things, extend the maturity to 2018 with effect from the drawing of the 2021 Euro Term Loan;and June 22, 2017;
the term "2019 Euro Term Loan" refers to ourCME Ltd.'s floating rate senior unsecured term credit facility due 2019, guaranteed by CME BV and Time Warner, dated as of September 30, 2015 and amended on February 19, 2016;2016 and June 22, 2017;
the term "2021 Euro Term Loan" refers to ourCME BV's floating rate senior unsecured term credit facility due 2021, entered into by CME BV, guaranteed by Time Warner and CME Ltd., dated as of February 19, 2016;2016 and amended on June 22, 2017;
the term "Euro Term Loans" refers collectively to the 2018 Euro Term Loan, 2019 Euro Term Loan and 2021 Euro Term Loan;
the term "2021 Revolving Credit Facility" refers to our amended and restated revolving credit facility dated as of February 28, 2014, as amended and restated as of November 14, 2014, and further amended and restated on February 19, 2016 and amended on June 22, 2017;
"CME BV" refers to among other things, extendCME Media Enterprises B.V., our 100% owned subsidiary;
"CME NV" refers to Central European Media Enterprises N.V., our 100% owned subsidiary;
"Divestment Transaction" refers to the maturityframework agreement dated July 9, 2017 with Slovenia Broadband S.à r.l. for the sale of our Croatia and Slovenia operations (see Note 21, "Subsequent Events" for further information);
"Euro Term Loans" refers collectively to 2021 with effect from the drawing of the2018 Euro Term Loan, 2019 Euro Term Loan and 2021 Euro Term Loan;
the term "Guarantee Fees" refers to amounts accrued and payable to Time Warner as consideration for Time Warner's guarantees of the 2018 Euro Term Loan, 2019 Euro Term Loan and 2021 Euro Term Loan;Loans;
the term "Reimbursement Agreement" refers to an agreement with Time Warner which provides that we will reimburse Time Warner for any amounts paid by them under any guarantee or through any loan purchase right exercised by Time Warner, dated as of November 14, 2014, and amended and restated on February 19, 2016;2016 and amended on March 2, 2017 and June 22, 2017;
the term "CME BV" refers to CME Media Enterprises B.V., our 100% owned subsidiary;
the term "CME NV" refers to Central European Media Enterprises N.V., our 100% owned subsidiary;
the term "Time Warner" refers to Time Warner Inc.; and
the term "TW Investor" refers to Time Warner Media Holdings B.V.
The exchange rates used in this report are as at SeptemberJune 30, 2016,2017, unless otherwise indicated.
Please note that we may announce information using SEC filings, press releases, public conference calls, webcasts and posts to the "Investors" section of our website, www.cme.net. We intend to continue to use these channels to communicate important information about CME Ltd. and our operations. We encourage investors, the media, our customers and others interested in the Company to review the information we post at www.cme.net.
I. Forward-looking Statements
This report contains forward-looking statements within the meaning of Section 27A of the Securities Act of 1933 and Section 22E of the Securities Exchange Act of 1934 (the "Exchange Act"), including those relating to our capital needs, business strategy, expectations and intentions. Statements that use the terms “believe”, “anticipate”, “trend”, “expect”, “plan”, “estimate”, “forecast”, “should”, “intend”“intend” and similar expressions of a future or forward-looking nature identify forward-looking statements for purposes of the U.S. federal securities laws or otherwise. In particular, information appearing under the sections entitled "Business," "Risk Factors" and "Management's Discussion and Analysis of Financial Condition and Results of Operations" includes forward looking-statements. For these statements and all other forward-looking statements, we claim the protection of the safe harbor for forward-looking statements contained in the Private Securities Litigation Reform Act of 1995.
Forward-looking statements are inherently subject to risks and uncertainties, many of which cannot be predicted with accuracy or are otherwise beyond our control and some of which might not even be anticipated. Forward-looking statements reflect our current views with respect to future events and because our business is subject to such risks and uncertainties, actual results, our strategic plan, our financial position, results of operations and cash flows could differ materially from those described in or contemplated by the forward-looking statements contained in this report.
Important factors that contribute to such risks include, but are not limited to, those factors set forth under "Risk Factors” as well as the following: the expected timing of the closing of the sale of our operations in Croatia and Slovenia and the application of proceeds from it; the effect of global economic uncertainty and Eurozone instability in our markets and the extent, timing and duration of any recovery; levels of television advertising spending and the rate of development of the advertising markets in the countries in which we operate; the impact of global economic conditions on our markets; the extent to which our liquidity constraints and debt service obligations restrict our business; our exposure to additional tax liabilities as well as liabilities resulting from regulatory or legal proceedings initiated against us; our ability to refinance our existing indebtedness; our success in continuing our initiatives to diversify and enhance our revenue streams; our ability to make cost-effective investments in our television businesses, including investments in programming; our ability to develop and acquire necessary programming and attract audiences; our ability to refinance our existing indebtedness;and changes in the political and regulatory environments where we operate and in the application of relevant laws and regulations; our exposure to additional tax liabilities; and the timely renewal of broadcasting licenses and our ability to obtain additional frequencies and licenses.regulations. The foregoing review of important factors should not be construed as exhaustive and should be read in conjunction with other cautionary statements that are included in this report. All forward-looking statements speak only as of the date of this report. We undertake no obligation to publicly update or review any forward-looking statements, whether as a result of new information, future developments or otherwise, except as required by law.
II. Overview
Central European Media Enterprises Ltd. ("CME Ltd.") is a media and entertainment company operating mainly in six countries in Central and Eastern Europe. We manage our business on a geographical basis, with six operating segments: Bulgaria, Croatia, the Czech Republic, Romania, the Slovak Republic and Slovenia, which are also our reportable segments. These operating segments reflect how CME Ltd.’s operating performance is evaluated by our chief operating decision makers, who we have identified as our co-Chief Executive Officers, how our operations are managed by segment managers, and the structure of our internal financial reporting.
On July 9, 2017, we entered into a framework agreement with Slovenia Broadband S.à r.l., a wholly owned subsidiary of United Group B.V., relating to the sale of our Croatia and Slovenia operations.
Non-GAAP Financial Measures
In this report we refer to several non-GAAP financial measures, including OIBDA, OIBDA margin, free cash flow and unlevered free cash flow. We believe that each of these metrics is useful to investors for the reasons outlined below. Non-GAAP financial measures may not be comparable to similar measures reported by other companies. Non-GAAP financial measures should be evaluated in conjunction with, and are not a substitute for, US GAAP financial measures.
We evaluate our consolidated results and the performance of our segments based on net revenues and OIBDA. We believe OIBDA is useful to investors because it provides a meaningful representation of our performance, as it excludes certain items that do not impact either our cash flows or the operating results of our operations. OIBDA and unlevered free cash flow are also used as components in determining management bonuses.
OIBDA includes amortization and impairment of program rights and is calculated as operating income / loss before depreciation, amortization of intangible assets and impairments of assets and certain unusual or infrequent items that are not considered by our co-CEOsco-Chief Executive Officers when evaluating our performance. Stock-based compensation and certain other items are not allocated to our segments for purposes of evaluating their performance and therefore are not included in their respective OIBDA. Our key performance measure of the efficiency of our consolidated operations and our segments is OIBDA margin. We define OIBDA margin as the ratio of OIBDA to net revenues. Intersegment revenues
Following a refinancing transaction in March 2017, the amount of interest and profits have been eliminatedrelated Guarantee Fees on consolidation.
We have previously usedour outstanding indebtedness that must be paid in cash has increased. In addition to this obligation to pay more interest and related Guarantee Fees in cash, we expect to use cash generated by the business to pay certain Guarantee Fees that are payable in kind. These cash payments are all reflected in free cash flow; accordingly, we believe unlevered free cash flow, defined as a measure offree cash flow before cash payments for interest and Guarantee Fees, best illustrates the ability ofcash generated by our operations to generate cash.when comparing periods. We define free cash flow as net cash flowsgenerated from continuing operating activities less purchases of property, plant and equipment, net of disposals of property, plant and equipment and excluding the cash impact of certain unusual or infrequent items that are not included in costs charged in arriving at OIBDA because they are not considered by our co-CEOsco-Chief Executive Officers when evaluating performance. Following the refinancing transaction completed in April 2016, the amount of interest and related Guarantee Fees on our outstanding indebtedness that is paid in cash has increased. Since we expect to use cash generated by the business to pay more interest and related Guarantee Fees in cash, and these cash payments are reflected in free cash flow, we think unlevered free cash flow, defined as free cash flow before cash payments for interest and Guarantee Fees, better illustrates the cash generated by our operations when comparing periods.
For additional information regarding our business segments, including a reconciliation of OIBDA to US GAAP financial measures, see Item 1, Note 18, "Segment Data". For a reconciliation of free cash flow and unlevered free cash flow to a US GAAP financial measure, see "Free Cash Flow and Unlevered Free Cash Flow" below.
The following analysis contains references to like-for-like or constantWhile our reporting currency percentage movements (“% Lfl”). These references reflectis the impact of applying the current period average exchange rates to the prior perioddollar, our consolidated revenues and costs.costs are divided across a range of European currencies and CME Ltd.’s functional currency is the Euro. Given the significant movement of the currencies in the markets in which we operate against the dollar, we believe that it is useful to provide percentage movements based on like-for-likeactual percentage movements as well as actual (“% Act”) percentage movements (which, which includes the effect of foreign exchange)exchange, as well as like-for-like percentage movements (“% Lfl”). The like-for-like percentage movement references reflect the impact of applying the current period average exchange rates to the prior period revenues and costs. Since the difference between like-for-like and actual percentage movements is solely the impact of movements in foreign exchange rates, our discussion in the following analysis is focused on constant currency percentage movements in order to highlight those factors influencing operational performance. The incremental impact of foreign exchange rates is presented in the tables preceding such analysis. Unless otherwise stated, all percentage increases or decreases in the following analysis refer to year-on-year percentage changes between the three and ninesix months ended SeptemberJune 30, 20162017 and 2015.2016.
Executive Summary
The following table provides a summary of our consolidated results for the three and ninesix months ended SeptemberJune 30, 2017 and 2016:
|
| | | | | | | | | | | | | | | | | | | | | | | | | | | |
| | For the Three Months Ended September 30, (US$ 000's) | | For the Nine Months Ended September 30, (US$ 000's) |
| | | | | | Movement | | | | | | Movement |
| | 2016 |
| | 2015 |
| | % Act |
| | % Lfl |
| | 2016 |
| | 2015 |
| | % Act |
| | % Lfl |
|
| Net revenues | $ | 126,706 |
| | $ | 117,322 |
| | 8.0 | % | | 8.2 | % | | $ | 430,912 |
| | $ | 410,289 |
| | 5.0 | % | | 4.8 | % |
| Operating income | 8,384 |
| | 28,853 |
| | (70.9 | )% | | (70.5 | )% | | 60,038 |
| | 48,055 |
| | 24.9 | % | | 22.4 | % |
| Operating margin | 6.6 | % | | 24.6 | % | | (18.0) p.p. |
| | (17.7) p.p. |
| | 13.9 | % | | 11.7 | % | | 2.2 p.p. |
| | 2.0 p.p. |
|
| OIBDA | $ | 18,014 |
| | $ | 8,353 |
| | 115.7 | % | | 120.7 | % | | $ | 88,754 |
| | $ | 66,612 |
| | 33.2 | % | | 30.7 | % |
| OIBDA margin | 14.2 | % | | 7.1 | % | | 7.1 p.p. |
| | 7.2 p.p. |
| | 20.6 | % | | 16.2 | % | | 4.4 p.p. |
| | 4.1 p.p. |
|
(1) Number is not meaningful. |
| | | | | | | | | | | | | | | | | | | | | | | | | | | |
| | For the Three Months Ended June 30, (US$ 000's) | | For the Six Months Ended June 30, (US$ 000's) |
| | | | | | Movement | | | | | | Movement |
| | 2017 |
| | 2016 |
| | % Act |
| | % Lfl |
| | 2017 |
| | 2016 |
| | % Act |
| | % Lfl |
|
| Net revenues | $ | 181,856 |
| | $ | 175,206 |
| | 3.8 | % | | 5.5 | % | | $ | 316,858 |
| | $ | 304,206 |
| | 4.2 | % | | 6.6 | % |
| Operating income | 50,823 |
| | 43,891 |
| | 15.8 | % | | 17.2 | % | | 63,091 |
| | 51,654 |
| | 22.1 | % | | 24.5 | % |
| Operating margin | 27.9 | % | | 25.1 | % | | 2.8 p.p. |
| | 2.7 p.p. |
| | 19.9 | % | | 17.0 | % | | 2.9 p.p. |
| | 2.9 p.p. |
|
| OIBDA | $ | 61,169 |
| | $ | 53,632 |
| | 14.1 | % | | 15.4 | % | | $ | 83,305 |
| | $ | 70,740 |
| | 17.8 | % | | 20.1 | % |
| OIBDA margin | 33.6 | % | | 30.6 | % | | 3.0 p.p. |
| | 2.8 p.p. |
| | 26.3 | % | | 23.3 | % | | 3.0 p.p. |
| | 3.0 p.p. |
|
Our consolidated net revenues increased 8% and 5% at constant and actual exchange rates in the three and ninesix months ended SeptemberJune 30, 2016, respectively,2017 compared to the corresponding periodsperiod in 2015,2016 due to improvementgrowth in both television advertising revenues and carriage fees and subscription revenues. Television advertising spending in the markets of the countries in which we operate grew 5%6% overall at constant rates in the first nine monthshalf of 20162017 compared to 2015.2016. Our television advertising revenues grew 5%2% at actual rates and 4% at constant rates during thatthe same period due primarily to significant year-on-year growth in ourRomania in the first three largest markets,months of the year, as well as higher levels of spending in the Czech Republic, RomaniaSlovenia and Slovakia.Bulgaria in the first half of 2017. Carriage fees and subscription revenues increased 12% and 8% at constant rates duringsignificantly in the three and ninesix months ended SeptemberJune 30, 2016, respectively,2017 compared to the corresponding periodsperiod in 2015,2016 due primarily to additional carriage fees from contracts with cable, satellite and Internet protocol television ("IPTV") operators in the Slovak Republic and Slovenia since January of this year, and we continue to see overall growth in the number of subscribers to cable, satellite and IPTV platforms, better channel offerings and new channel launches.those platforms.
Costs charged in arriving at OIBDA were broadly flat at constant and actual exchange rates in both the three and ninesix months ended SeptemberJune 30, 20162017 compared to the corresponding periods in 2015. Our strict focus on2016. At constant rates, costs increased 1% and 3% in the profitability of our businesses enabled us to offsetrespective periods. Content cost inflation was minimal overall as we made targeted investments in our programming line-up when additional ratings could be monetized in certain countries. As a result, increases in overall content costs at constant ratesRomania and to support the transition to pay-TV in the respective three- and nine-month periods were compensated by savingsSlovak Republic, but offset some of this additional spending with fewer hours of local content in other costs.countries. Other operating costs decreased in the second quarter and first half of 2017 due to savings from transmission costs, which offset higher bad debt charges.
TheSince the growth in revenue combined with cost savings, resultedoutpaced the increase in an improvement incosts, our OIBDA margin increased in the three and ninesix months ended SeptemberJune 30, 2016 and we anticipate our full year OIBDA margin2017. This dynamic also drove an increase in 2016 will exceed our OIBDA margin of 20%operating income, with a similar improvement in 2015.the operating margin. We expect revenues to grow at a faster pace than costs overin 2017 and for the next severalfew years, leading to continued OIBDA margin expansion.expansion year on year although trends quarter to quarter may vary.
The spring season concluded successfully in June and our prime time and all day audience shares increased in five out of six countries during the first half of 2017 compared to the same period in 2016. We continue to leverage popular content we produce for our prime time schedules, and supplement that with both foreign and locally acquired content to ensure we continue to attract the largest audience in each of our countries in the most profitable manner.
Divestment Transaction to Accelerate Deleveraging
On July 9, 2017 we agreed to sell our operations in Croatia and Slovenia to Slovenia Broadband S.à r.l., a subsidiary of United Group B.V. (“United Group”), subject to certain closing conditions, including regulatory approvals. The transaction is expected to close by the end of 2017.
Total cash consideration for the transaction is EUR 230.0 million (approximately US$ 262.5 million), subject to customary working capital adjustments. Upon closing, the proceeds will be used to repay the remaining balance of the 2018 Euro Term Loan in full, with any excess proceeds applied to repay a portion of the 2019 Euro Term Loan, which will result in a significant decrease in operating income in the three months ended September 30, 2016 compared to 2015 resultedour net leverage ratio. Based on our results from the reversalperiod ended June 30, 2017, this would reduce CME’s net leverage ratio from 6.1x to 5.1x.
Once debt is repaid following closing of chargesthe transaction, our current average borrowing cost is expected to decrease 275 basis points to 4.5%. We estimate this will result in savings of at least US$ 30.0 million of interest costs annually, which exceeds both income and cash generated in 2016 by the prior year relatedcombined operations of Croatia and Slovenia. We expect to tax audits in Romania, which were accrued in the fourth quarter of 2014 and in the first quarter of 2015 and fully releasedpresent these businesses as discontinued operations starting in the third quarter of 2015. Excluding the reversal2017. Total net assets of these businesses as at June 30, 2017 were approximately US$ 30.2 million115.3 million.
Free Cash Flow and US$ 12.0 million in the three and nine months ended September 30, 2015, respectively, operating results for the three and nine months ended September 30, 2015 were a loss of US$ 1.3 million and income of US$ 36.1 million, respectively. Operating income in the nine months ended September 30, 2016 benefited from the increase in net revenues and a decrease in operating costs before considering the impact of the reversal.Unlevered Free Cash Flow
We believe we continue to provide the most efficient medium for advertisers to reach consumers in all countries in which we operate. Although our audience shares were negatively impacted by the summer Olympics in August 2016, the gap between us and our closest commercial competitor widened in five out of six markets during the third quarter. The fall season rolled out during the period, and our prime time audience shares in the month of September improved year-on-year in all six countries. We look to capitalize on the pillars of our programming strategy, which include news, local fiction, and local reality and entertainment, and we will continue to invest in programming on a targeted basis to improve our competitive position as we focus on improving profitability.We ended the quarter with US$ 64.2 million of cash. |
| | | | | | | | | | |
| | For the Six Months Ended June 30, (US$ 000's) |
| | 2017 |
| | 2016 |
| | Movement |
|
| Net cash generated from continuing operating activities | $ | 56,770 |
| | $ | 17,549 |
| | NM (1) |
|
| Capital expenditures, net | (14,581 | ) | | (11,255 | ) | | (29.6 | )% |
| Free cash flow | 42,189 |
| | 6,294 |
| | NM (1) |
|
| Cash paid for interest (including mandatory cash-pay Guarantee Fees) | 21,173 |
| | 35,712 |
| | (40.7 | )% |
| Cash paid for Guarantee Fees that may be paid in kind | 7,078 |
| | 20,000 |
| | (64.6 | )% |
| Unlevered free cash flow | $ | 70,440 |
| | $ | 62,006 |
| | 13.6 | % |
(1) Number is not meaningful.
|
| | | | | | | | | | |
| (US$ 000's) | June 30, 2017 |
| | December 31, 2016 |
| | Movement |
|
| Cash and cash equivalents | $ | 95,359 |
| | $ | 43,459 |
| | 119.4 | % |
Our unlevered free cash flow increased 44%during the first six months of 2017 compared to US$ 91.2 million in the nine months ended September 30, 2016, from US$ 63.6 million in the same period in 2015.2016 reflecting higher cash collections from revenue growth and lower cash spending on programming. This improvement during the first nine months of 2016 reflected the improvement in OIBDAwas partially offset by higher cash paid for income taxes and lower capital expenditures. Free cash flow decreased 57%increased significantly more than unlevered free cash flow due to a significant decrease in cash paid for interest and Guarantee Fees because last year we paid accrued interest related to the 2017 PIK Notes and 2017 Term Loan when they were refinanced in April 2016, and we also repaid US$ 22.820.0 million from US$ 52.9 millionof accrued Guarantee Fees previously paid in kind in the same periodfirst half of 2016.
Following the repricing of our Guarantee Fees completed in 2015 becauseMarch 2017, we are now required to pay a portion of the Guarantee Fees related to all of the Euro Term Loans in cash. However, the total amount of cash paid morefor interest and Guarantee Fees is expected to decrease significantly in cash2017 due to the lower all-in rate payable following that transaction, and additional non-repeating payments that were made in 2016 when we elected to repay in cash a total of US$ 27.5 million of accrued Guarantee Fees previously paid in kind during the first nine months of 2016. For the full year, we expect unlevered free cash flow to improve from US$ 73.9 million in 2015, primarily reflecting an increase in OIBDA, which will be partially offset by investments in new local productions for 2017. Cash paid for interest will be higher in 2016 than it was in 2015, and we also plan to use cash to pay the Guarantee Fee related to the 2018 Euro Term Loan payablethat were previously paid in November.kind. As a result, we anticipate thatexpect free cash flow for 2016 will decreaseto increase significantly fromin 2017 compared to 2016.
In August 2017 we anticipate repaying approximately EUR 50.0 million (approximately US$ 55.5 million in 2015.57.1 million) of the principal outstanding on the 2018 Euro Term Loan.
Market Information
The following table sets out our estimates of the year-on-year changes in real GDP, real private consumption and the television advertising market, net of discounts, in our countries for the ninesix months ended SeptemberJune 30, 20162017:
| | | | For the Nine Months Ended September 30, 2016 | For the Six Months Ended June 30, 2017 |
| Country | Real GDP Growth |
| | Real Private Consumption Growth |
| | Net TV Ad Market Growth |
| Real GDP Growth |
| | Real Private Consumption Growth |
| | Net TV Ad Market Growth |
|
| Bulgaria | 2.7 | % | | 2.4 | % | | (3 | )% | 3.5 | % | | 4.5 | % | | 7 | % |
| Croatia | 2.2 | % | | 2.7 | % | | 1 | % | 2.7 | % | | 3.3 | % | | (4 | )% |
| Czech Republic | 2.7 | % | | 2.7 | % | | 3 | % | 3.1 | % | | 3.1 | % | | 5 | % |
| Romania* | 4.7 | % | | 8.1 | % | | 10 | % | 4.6 | % | | 5.8 | % | | 14 | % |
| Slovak Republic | 3.4 | % | | 3.0 | % | | 13 | % | 3.1 | % | | 3.2 | % | | 0 | % |
| Slovenia | 2.3 | % | | 1.8 | % | | 6 | % | 4.2 | % | | 3.3 | % | | 4 | % |
| Total CME Ltd. Markets | 3.3 | % | | 4.1 | % | | 5 | % | 3.6 | % | | 4.0 | % | | 6 | % |
* Romanian market excludes Moldova.
Sources: Real GDP Growth and Real Private Consumption Growth, CME Ltd. estimates based on market consensus; TV Ad Market Growth, CME Ltd. estimates at constant exchange rates.
After adjusting for inflation, we estimate that during the first ninesix months of 2016 the rate of overall2017, GDP growthgrew in the countries in which we operate outpaced the average for Western Europe. The growth in our largest markets continues to be driven by domestic demand, which is evidenced by robust growth in real private consumption, in addition to growth in exports. Fiscal stimulus in Romania has contributed to significant growth in private consumption in that country. The overall macro-economic backdrop remains positive, and was reflected in recent International Monetary Fund forecasts that increased real GDP growth projections for 2016 and 2017 in Bulgaria and Romania, the latter being the highest in Europe. We believe that the growth in real GDP and private consumption that is forecast for 2016 across all sixeach of the countries in which we operate at a rate that exceeded the average growth rate for Western Europe. Romania continued to be one of the fastest growing economies in the European Union, and is forecast to be the leader for the remainder of 2017. Similar to the last few years, it has been reported that GDP growth in our markets has been less reliant on growth in exports, and domestic demand has played a larger role in economic expansion. In Romania, lower income tax rates and increases to the minimum wage have provided continued support for higher disposable income. Consumer confidence remains strong in the Czech and Slovak Republics, reflecting historically low rates of unemployment in those countries. We believe the growth in real private consumption forecast for 2017 will be supportive ofsupport overall growth in the television advertising markets across the six countries where we operate, although growth may not be realized in every market growth duringas financial difficulties with Agrokor, the full year.largest advertiser in Croatia, may result in lower spending there.
We continue to monitor the macro-economic environment in the region following the referendum that was held inOn March 29, 2017, the United Kingdom on June 23, 2016 wherebyformally initiated the UK electorate voted in favor of the United Kingdom leavingprocess to leave the European Union, commonly referred to as “Brexit”. The overall economic impact, which is expected to be completed within the next two years. While the negotiations over the exact terms of Brexit onmay negatively impact economic growth in the EUUK and Europe, the Euro is difficultcontribution of domestic demand as a component of GDP growth has reduced the sensitivity of our markets to estimate at present, butexternal shocks affecting exports. Additionally, we have not seen an appreciable impact on the behavior of advertisers in the countries in which we operate. There could be an indirect influence upon GDP growthoperate since the UK electorate voted in favor of Brexit in June 2016.
On April 6, 2017, the Czech National Bank determined that the recent increase in inflation in the countriescountry was sustainable and its mandate for price stability had been met. As a result, it ended its commitment to intervene in which we operate if it results in a decline in exports. However, current projections suggestcurrency markets and withdrew the potential reduction in exports would have limited impact on GDP growth, due in partfloor related to the improvement in private consumption in these economies since 2014.EUR/CZK exchange rate. The departure ofCzech Koruna strengthened modestly following the United Kingdom fromannouncement; however, the EUexchange rate may also adversely affect the budgetary contributions and allocations among the EU member states, including the countries in which we operate, which are generally net recipients of EU funding. However, existing commitments for budgetary contributions would not be affected, so there is not expected to be any impact on allocations to net recipient countriesvolatile in the next several years.
near term. If the currency continues to appreciate, this will improve the results of our largest operation in dollar terms.
We estimate that the TV advertising markets in the countries in which we operate increased by 5%6% on average at constant rates in the ninesix months ended SeptemberJune 30, 20162017 compared to the same period in 2015.2016. In Bulgaria, heavy competition for market share continued to negatively impactwe estimate that all commercial broadcasters increased their average market prices, leading to a decline in the market despite an increase in the volume ofwhich more than offset selling fewer gross ratings points ("GRPs") sold. Conversely, the. The market growth in Croatia was drivendecreased due to lower spending by an increaseAgrokor, which has entered government administration and is facing a potential restructuring. Spending from Agrokor in average market prices and GRPs soldCroatia is expected to be lower in the first nine months of the year.2017 than in 2016, which could cause total spending for advertising on television to decline overall. In the Czech Republic, sell-out rates have increased as advertisers place more advertising than in 2015, butwas sold and average prices were lower due to significant discounting by the competition to sell their incremental inventory.increased. In Romania, the market was largely sold-outgrew because the increase in bothdemand for advertising that started in the second and third quarters, so the combinationquarter of an increase2016 led to significant increases in both GRPs sold and higher average prices resulted in significant growth in the first nine monthshalf of 2016. The market continues to be largely sold-out, and given constraints in producing more GRPs, we expect lower market growth in Romania in the fourth quarter2017 compared to the third quarter ofsame period in 2016. In the Slovak Republic,second quarter of 2016 our main channel aired the European football championship, which increased inventory available and sold last year. Excluding the benefit of the tournament last year, we estimate the market grew significantly6% year-on-year in the second quarter of 2017 and 16% in the first nine monthshalf of 2016 due to higher prices. Demand2017. We expect market growth for 2017 will be lower than the growth rate in the first half of the year due to difficult comparatives for the remainder of the year, including the third quarter of 2016 when our main channel aired the remaining games of the European football championship. In the Slovak Republic, the market was also influenced by an increase inflat following the end of spending on informational and political campaigns butthat took place from the second half of 2015 through the first half of 2016. If this spending declined year-on-year in the third quarter andfirst half of 2016 is expected to decline significantly inexcluded, we estimate the fourth quarter resulting in a rate of market growth forgrew 10%, reflecting continued strong demand by the full year that is less than the nine months ended September 30, 2016.private sector. In Slovenia, a more positive macro-economic environment has encouraged advertisers to increase investments so more inventory was sold athigher spending reflected the anticipation of faster growth in private consumption during the year resulting in higher average prices.
Segment Performance
Our total Net Revenues and OIBDA by segment were as follows:
| | | | NET REVENUES | NET REVENUES |
| | For the Three Months Ended September 30, (US$ 000's) | For the Three Months Ended June 30, (US$ 000's) | | For the Six Months Ended June 30, (US$ 000's) |
| | | | | | Movement | | | | | Movement | | | | | | Movement |
| | 2016 |
|
| 2015 |
| | % Act |
| | % Lfl |
| 2017 |
| | 2016 |
| | % Act |
| | % Lfl |
| | 2017 |
|
| 2016 |
| | % Act |
| | % Lfl |
|
| Bulgaria | $ | 13,789 |
| | $ | 14,673 |
| | (6.0 | )% | | (6.0 | )% | $ | 20,774 |
| | $ | 20,455 |
| | 1.6 | % | | 3.5 | % | | $ | 36,079 |
| | $ | 36,314 |
| | (0.6 | )% | | 1.8 | % |
| Croatia | 9,833 |
| | 9,949 |
| | (1.2 | )% | | (2.2 | )% | 16,521 |
| | 16,559 |
| | (0.2 | )% | | 0.7 | % | | 27,589 |
| | 28,204 |
| | (2.2 | )% | | (1.0 | )% |
| Czech Republic | 39,031 |
| | 35,575 |
| | 9.7 | % | | 9.7 | % | 53,371 |
| | 50,919 |
| | 4.8 | % | | 5.0 | % | | 92,845 |
| | 89,527 |
| | 3.7 | % | | 5.2 | % |
| Romania | 36,970 |
| | 32,005 |
| | 15.5 | % | | 16.6 | % | 48,570 |
| | 48,929 |
| | (0.7 | )% | | 2.3 | % | | 87,514 |
| | 81,299 |
| | 7.6 | % | | 11.3 | % |
| Slovak Republic | 17,864 |
| | 17,223 |
| | 3.7 | % | | 3.9 | % | 24,624 |
| | 22,540 |
| | 9.2 | % | | 11.3 | % | | 42,964 |
| | 41,602 |
| | 3.3 | % | | 5.9 | % |
| Slovenia | 9,555 |
| | 8,606 |
| | 11.0 | % | | 11.2 | % | 18,453 |
| | 16,116 |
| | 14.5 | % | | 16.7 | % | | 30,670 |
| | 27,769 |
| | 10.4 | % | | 13.2 | % |
| Intersegment revenues | (336 | ) | | (709 | ) | | NM (1) |
| | NM (1) |
| (457 | ) | | (312 | ) | | NM (1) |
| | NM (1) |
| | (803 | ) | | (509 | ) | | NM (1) |
| | NM (1) |
|
| Total net revenues | $ | 126,706 |
| | $ | 117,322 |
| | 8.0 | % | | 8.2 | % | $ | 181,856 |
| | $ | 175,206 |
| | 3.8 | % | | 5.5 | % | | $ | 316,858 |
| | $ | 304,206 |
| | 4.2 | % | | 6.6 | % |
(1) Number is not meaningful.
|
| | | | | | | | | | | | | |
| | NET REVENUES |
| | For the Nine Months Ended September 30, (US$ 000's) |
| | | | | | Movement |
| | 2016 |
|
| 2015 |
| | % Act |
| | % Lfl |
|
| Bulgaria | $ | 50,103 |
| | $ | 50,877 |
| | (1.5 | )% | | (1.4 | )% |
| Croatia | 38,037 |
| | 38,184 |
| | (0.4 | )% | | (1.8 | )% |
| Czech Republic | 128,558 |
| | 122,671 |
| | 4.8 | % | | 3.4 | % |
| Romania | 118,269 |
| | 109,561 |
| | 7.9 | % | | 9.1 | % |
| Slovak Republic | 59,466 |
| | 54,997 |
| | 8.1 | % | | 8.2 | % |
| Slovenia | 37,324 |
| | 35,149 |
| | 6.2 | % | | 6.2 | % |
| Intersegment revenues | (845 | ) | | (1,150 | ) | | NM (1) |
| | NM (1) |
|
| Total net revenues | $ | 430,912 |
| | $ | 410,289 |
| | 5.0 | % | | 4.8 | % |
(1) Number is not meaningful.
|
| | | | | | | | | | | | | |
| | OIBDA |
| | For the Three Months Ended September 30, (US$ 000's) |
| | | | | | Movement |
| | 2016 |
| | 2015 |
| | % Act |
| | % Lfl |
|
| Bulgaria | $ | 1,943 |
|
| $ | 2,223 |
| | (12.6 | )% | | (12.4 | )% |
| Croatia | (516 | ) | | (909 | ) | | 43.2 | % | | 43.9 | % |
| Czech Republic | 13,180 |
| | 9,483 |
| | 39.0 | % | | 39.2 | % |
| Romania | 12,606 |
| | 6,953 |
| | 81.3 | % | | 83.3 | % |
| Slovak Republic | (383 | ) | | 358 |
| | NM (1) |
| | NM (1) |
|
| Slovenia | (746 | ) | | (1,556 | ) | | 52.1 | % | | 52.2 | % |
| Eliminations | 11 |
| | (225 | ) | | NM (1) |
| | NM (1) |
|
| Total operating segments | 26,095 |
| | 16,327 |
| | 59.8 | % | | 61.7 | % |
| Corporate | (8,081 | ) | | (7,974 | ) | | (1.3 | )% | | (1.4 | )% |
| Consolidated OIBDA | $ | 18,014 |
| | $ | 8,353 |
| | 115.7 | % | | 120.7 | % |
(1) Number is not meaningful.
| | | | OIBDA | OIBDA |
| | For the Nine Months Ended September 30, (US$ 000's) | For the Three Months Ended June 30, (US$ 000's) | | For the Six Months Ended June 30, (US$ 000's) |
| | | | | | Movement | | | | | Movement | | | | | | Movement |
| | 2016 |
| | 2015 |
| | % Act |
| | % Lfl |
| 2017 |
| | 2016 |
| | % Act |
| | % Lfl |
| | 2017 |
| | 2016 |
| | % Act |
| | % Lfl |
|
| Bulgaria | $ | 8,966 |
| | $ | 8,466 |
| | 5.9 | % | | 5.6 | % | $ | 3,079 |
| | $ | 5,954 |
| | (48.3 | )% | | (47.5 | )% | | $ | 4,436 |
| | $ | 7,023 |
| | (36.8 | )% | | (35.7 | )% |
| Croatia | 5,386 |
| | 5,925 |
| | (9.1 | )% | | (12.4 | )% | 5,171 |
| | 4,501 |
| | 14.9 | % | | 15.5 | % | | 6,257 |
| | 5,902 |
| | 6.0 | % | | 6.9 | % |
| Czech Republic | 46,353 |
| | 43,812 |
| | 5.8 | % | | 3.6 | % | 25,553 |
| | 23,099 |
| | 10.6 | % | | 10.1 | % | | 36,512 |
| | 33,173 |
| | 10.1 | % | | 10.9 | % |
| Romania | 45,030 |
| | 25,733 |
| | 75.0 | % | | 75.1 | % | 22,268 |
| | 22,962 |
| | (3.0 | )% | | (0.3 | )% | | 36,954 |
| | 32,424 |
| | 14.0 | % | | 17.7 | % |
| Slovak Republic | 5,168 |
| | 3,840 |
| | 34.6 | % | | 27.0 | % | 7,522 |
| | 3,158 |
| | 138.2 | % | | 140.9 | % | | 8,395 |
| | 5,551 |
| | 51.2 | % | | 54.7 | % |
| Slovenia | 170 |
| | (233 | ) | | NM (1) |
| | NM (1) |
| 4,386 |
| | 1,624 |
| | 170.1 | % | | 164.2 | % | | 4,389 |
| | 916 |
| | NM (1) |
| | NM (1) |
|
| Eliminations | (57 | ) | | (260 | ) | | NM (1) |
| | NM (1) |
| 39 |
| | (62 | ) | | NM (1) |
| | NM (1) |
| | 41 |
| | (68 | ) | | NM (1) |
| | NM (1) |
|
| Total operating segments | 111,016 |
| | 87,283 |
| | 27.2 | % | | 25.3 | % | 68,018 |
| | 61,236 |
| | 11.1 | % | | 12.3 | % | | 96,984 |
| | 84,921 |
| | 14.2 | % | | 16.4 | % |
| Corporate | (22,262 | ) | | (20,671 | ) | | (7.7 | )% | | (7.5 | )% | (6,849 | ) | | (7,604 | ) | | 9.9 | % | | 9.0 | % | | (13,679 | ) | | (14,181 | ) | | 3.5 | % | | 2.0 | % |
| Consolidated OIBDA | $ | 88,754 |
| | $ | 66,612 |
| | 33.2 | % | | 30.7 | % | $ | 61,169 |
| | $ | 53,632 |
| | 14.1 | % | | 15.4 | % | | $ | 83,305 |
| | $ | 70,740 |
| | 17.8 | % | | 20.1 | % |
(1) Number is not meaningful.
Bulgaria
| | | | For the Three Months Ended September 30, (US$ 000's) | For the Three Months Ended June 30, (US$ 000's) |
| | | | | | Movement | | | | | Movement |
| | 2016 |
| | 2015 |
| | % Act |
| | % Lfl |
| 2017 |
| | 2016 |
| | % Act |
| | % Lfl |
|
| Television advertising | $ | 8,192 |
| | $ | 9,305 |
| | (12.0 | )% | | (11.9 | )% | $ | 14,542 |
| | $ | 14,682 |
| | (1.0 | )% | | 1.0 | % |
| Carriage fees and subscriptions | 4,824 |
| | 4,427 |
| | 9.0 | % | | 8.9 | % | 4,782 |
| | 4,641 |
| | 3.0 | % | | 4.8 | % |
| Other | 773 |
| | 941 |
| | (17.9 | )% | | (17.7 | )% | 1,450 |
| | 1,132 |
| | 28.1 | % | | 30.3 | % |
| Net revenues | 13,789 |
| | 14,673 |
| | (6.0 | )% | | (6.0 | )% | 20,774 |
| | 20,455 |
| | 1.6 | % | | 3.5 | % |
| Costs charged in arriving at OIBDA | 11,846 |
| | 12,450 |
| | (4.9 | )% | | (4.8 | )% | 17,695 |
| | 14,501 |
| | 22.0 | % | | 24.5 | % |
| OIBDA | $ | 1,943 |
| | $ | 2,223 |
| | (12.6 | )% | | (12.4 | )% | $ | 3,079 |
| | $ | 5,954 |
| | (48.3 | )% | | (47.5 | )% |
| | | | | | | | | | | | | | | |
| OIBDA margin | 14.1 | % | | 15.2 | % | | (1.1) p.p. |
| | (1.0) p.p. |
| 14.8 | % | | 29.1 | % | | (14.3) p.p. |
| | (14.4) p.p. |
|
| | | | For the Nine Months Ended September 30, (US$ 000's) | For the Six Months Ended June 30, (US$ 000's) |
| | | | | | Movement | | | | | Movement |
| | 2016 |
| | 2015 |
| | % Act |
| | % Lfl |
| 2017 |
| | 2016 |
| | % Act |
| | % Lfl |
|
| Television advertising | $ | 32,838 |
| | $ | 34,430 |
| | (4.6 | )% | | (4.6 | )% | $ | 24,311 |
| | $ | 24,646 |
| | (1.4 | )% | | 1.1 | % |
| Carriage fees and subscriptions | 14,036 |
| | 13,400 |
| | 4.7 | % | | 5.2 | % | 9,455 |
| | 9,212 |
| | 2.6 | % | | 5.1 | % |
| Other | 3,229 |
| | 3,047 |
| | 6.0 | % | | 6.1 | % | 2,313 |
| | 2,456 |
| | (5.8 | )% | | (3.5 | )% |
| Net revenues | 50,103 |
| | 50,877 |
| | (1.5 | )% | | (1.4 | )% | 36,079 |
| | 36,314 |
| | (0.6 | )% | | 1.8 | % |
| Costs charged in arriving at OIBDA | 41,137 |
| | 42,411 |
| | (3.0 | )% | | (2.8 | )% | 31,643 |
| | 29,291 |
| | 8.0 | % | | 10.9 | % |
| OIBDA | $ | 8,966 |
| | $ | 8,466 |
| | 5.9 | % | | 5.6 | % | $ | 4,436 |
| | $ | 7,023 |
| | (36.8 | )% | | (35.7 | )% |
| | | | | | | | | | | | | | | |
| OIBDA margin | 17.9 | % | | 16.6 | % | | 1.3 p.p. |
| | 1.2 p.p. |
| 12.3 | % | | 19.3 | % | | (7.0) p.p. |
| | (7.2) p.p. |
|
The television advertising market in Bulgaria declinedincreased an estimated 3%7% at constant rates in the ninesix months ended SeptemberJune 30, 20162017 compared to the same period in 2015.2016.
Our television advertising revenues decreased by 12% and 5%increased at constant rates in the threesecond quarter and nine months ended September 30,first half of 2017 compared to the same periods in 2016 respectively. Sustained significant competitiondue to higher prices in our sales policy for market share continues to negatively impact our average prices and this hasthe year, which more than offset an increasea reduction in the volume of GRPs sold in each period. The year-to-date period was also negatively impacted by reduced budgets of certain advertising clients during the first quarter.sold. Carriage fees and subscription revenues increased on a constant currency basis in the threedue to continued efforts to secure new contracts with cable, satellite and nine months ended September 30, 2016 because a contract was renewed at higher prices during the third quarter and the number of subscribers has grown during the course of the year.IPTV operators with improved pricing.
On a constant currency basis, costs charged in arriving at OIBDA decreasedincreased in the thirdsecond quarter of 2017 compared to the same period of 2016 due primarily to higher bad debt charges, as content costs declined 5% driven primarily by more efficient productionwell as an increase of local programming. This, combined with a decrease10% in content costs, duringresulting from additional hours of local content in the second quarter,schedule and a format that was more expensive than the same time slot in the prior year. These increases more than offset an increasea decline in costs during the first three months of the year resulting in lowercontent costs in the first ninequarter, so costs charged in arriving at OIBDA increased in the first six months of 2017 compared to 2016.
Croatia
| | | | For the Three Months Ended September 30, (US$ 000's) | For the Three Months Ended June 30, (US$ 000's) |
| | | | | | Movement | | | | | Movement |
| | 2016 |
| | 2015 |
| | % Act |
| | % Lfl |
| 2017 |
| | 2016 |
| | % Act |
| | % Lfl |
|
| Television advertising | $ | 8,265 |
| | $ | 8,411 |
| | (1.7 | )% | | (2.8 | )% | $ | 14,574 |
| | $ | 14,707 |
| | (0.9 | )% | | 0.0 | % |
| Carriage fees and subscriptions | 646 |
| | 567 |
| | 13.9 | % | | 12.5 | % | 1,120 |
| | 643 |
| | 74.2 | % | | 75.5 | % |
| Other | 922 |
| | 971 |
| | (5.0 | )% | | (6.1 | )% | 827 |
| | 1,209 |
| | (31.6 | )% | | (31.1 | )% |
| Net revenues | 9,833 |
| | 9,949 |
| | (1.2 | )% | | (2.2 | )% | 16,521 |
| | 16,559 |
| | (0.2 | )% | | 0.7 | % |
| Costs charged in arriving at OIBDA | 10,349 |
| | 10,858 |
| | (4.7 | )% | | (5.7 | )% | 11,350 |
| | 12,058 |
| | (5.9 | )% | | (4.9 | )% |
| OIBDA | $ | (516 | ) | | $ | (909 | ) | | 43.2 | % | | 43.9 | % | $ | 5,171 |
| | $ | 4,501 |
| | 14.9 | % | | 15.5 | % |
| | | | | | | | | | | | | | | |
| OIBDA margin | (5.2 | )% | | (9.1 | )% | | 3.9 p.p. |
| | 3.9 p.p. |
| 31.3 | % | | 27.2 | % | | 4.1 p.p. |
| | 4.0 p.p. |
|
| | | | For the Nine Months Ended September 30, (US$ 000's) | For the Six Months Ended June 30, (US$ 000's) |
| | | | | | Movement | | | | | Movement |
| | 2016 |
| | 2015 |
| | % Act |
| | % Lfl |
| 2017 |
| | 2016 |
| | % Act |
| | % Lfl |
|
| Television advertising | $ | 33,044 |
| | $ | 33,432 |
| | (1.2 | )% | | (2.6 | )% | $ | 24,128 |
| | $ | 24,779 |
| | (2.6 | )% | | (1.4 | )% |
| Carriage fees and subscriptions | 1,913 |
| | 1,727 |
| | 10.8 | % | | 10.0 | % | 1,944 |
| | 1,267 |
| | 53.4 | % | | 55.3 | % |
| Other | 3,080 |
| | 3,025 |
| | 1.8 | % | | 1.2 | % | 1,517 |
| | 2,158 |
| | (29.7 | )% | | (28.8 | )% |
| Net revenues | 38,037 |
| | 38,184 |
| | (0.4 | )% | | (1.8 | )% | 27,589 |
| | 28,204 |
| | (2.2 | )% | | (1.0 | )% |
| Costs charged in arriving at OIBDA | 32,651 |
| | 32,259 |
| | 1.2 | % | | 0.2 | % | 21,332 |
| | 22,302 |
| | (4.3 | )% | | (3.0 | )% |
| OIBDA | $ | 5,386 |
| | $ | 5,925 |
| | (9.1 | )% | | (12.4 | )% | $ | 6,257 |
| | $ | 5,902 |
| | 6.0 | % | | 6.9 | % |
| | | | | | | | | | | | | | | |
| OIBDA margin | 14.2 | % | | 15.5 | % | | (1.3) p.p. |
| | (1.7) p.p. |
| 22.7 | % | | 20.9 | % | | 1.8 p.p. |
| | 1.7 p.p. |
|
The television advertising market in Croatia increaseddeclined an estimated 1%4% at constant rates in the ninesix months ended SeptemberJune 30, 20162017 compared to the same period in 2015.2016.
Our television advertising revenues decreasedwere flat at constant rates duringin the three and nine months ended SeptemberJune 30, 2017 compared to 2016 as an increase in average prices offset selling fewer GRPs, related primarily to lower spending by Agrokor, which entered government administration and is facing a potential restructuring. The reduced advertising budget from sellingAgrokor also negatively impacted the first quarter of 2017. As a lower volumeresult, our television advertising revenues declined in the first half of GRPs, albeit at a higher average price,2017 compared to the same periodsperiod in 2015.2016. Carriage fees and subscription revenues increased in the second quarter and first half of 2017 compared to 2016 due to new contracts with operators and an increase in average prices.
Costs charged in arriving at OIBDA decreased on a constant currency basis in the thirdsecond quarter and first half of 2017 compared to 2016 due to lower content costs, reflecting fewer hours of own-produced programming. The first half of 2017 also benefited from savings in foreign programming as well asprogramming. We recorded a later startbad debt charge related to certain programsreceivables from Agrokor in the fall season than in 2015. This savings insecond quarter of 2017. As at June 30, 2017, we had receivables, net of an allowance for doubtful accounts, related to Agrokor and its group companies totaling US$ 2.6 million. Agrokor has notified us it intends to renegotiate its commitments for television advertising spending for the third quarter offset an increase in content costs in the first halfremainder of the year as a result of launching an additional entertainment format when compared to the schedule in 2015, so costs were broadly flat in the first nine months of 2016.2017.
Czech Republic
| | | | For the Three Months Ended September 30, (US$ 000's) | For the Three Months Ended June 30, (US$ 000's) |
| | | | | | Movement | | | | | Movement |
| | 2016 |
| | 2015 |
| | % Act |
| | % Lfl |
| 2017 |
| | 2016 |
| | % Act |
| | % Lfl |
|
| Television advertising | $ | 34,518 |
| | $ | 32,037 |
| | 7.7 | % | | 7.7 | % | $ | 48,554 |
| | $ | 46,673 |
| | 4.0 | % | | 4.2 | % |
| Carriage fees and subscriptions | 2,612 |
| | 1,394 |
| | 87.4 | % | | 87.4 | % | 2,882 |
| | 2,604 |
| | 10.7 | % | | 10.9 | % |
| Other | 1,901 |
| | 2,144 |
| | (11.3 | )% | | (11.4 | )% | 1,935 |
| | 1,642 |
| | 17.8 | % | | 17.6 | % |
| Net revenues | 39,031 |
| | 35,575 |
| | 9.7 | % | | 9.7 | % | 53,371 |
| | 50,919 |
| | 4.8 | % | | 5.0 | % |
| Costs charged in arriving at OIBDA | 25,851 |
| | 26,092 |
| | (0.9 | )% | | (1.0 | )% | 27,818 |
| | 27,820 |
| | 0.0 | % | | 0.7 | % |
| OIBDA | $ | 13,180 |
| | $ | 9,483 |
| | 39.0 | % | | 39.2 | % | $ | 25,553 |
| | $ | 23,099 |
| | 10.6 | % | | 10.1 | % |
| | | | | | | | | | | | | | | |
| OIBDA margin | 33.8 | % | | 26.7 | % | | 7.1 p.p. |
| | 7.2 p.p. |
| 47.9 | % | | 45.4 | % | | 2.5 p.p. |
| | 2.2 p.p. |
|
| | | | For the Nine Months Ended September 30, (US$ 000's) | For the Six Months Ended June 30, (US$ 000's) |
| | | | | | Movement | | | | | Movement |
| | 2016 |
| | 2015 |
| | % Act |
| | % Lfl |
| 2017 |
| | 2016 |
| | % Act |
| | % Lfl |
|
| Television advertising | $ | 115,981 |
| | $ | 111,582 |
| | 3.9 | % | | 2.5 | % | $ | 83,661 |
| | $ | 81,463 |
| | 2.7 | % | | 4.2 | % |
| Carriage fees and subscriptions | 7,743 |
| | 5,418 |
| | 42.9 | % | | 41.6 | % | 5,521 |
| | 5,131 |
| | 7.6 | % | | 9.3 | % |
| Other | 4,834 |
| | 5,671 |
| | (14.8 | )% | | (15.7 | )% | 3,663 |
| | 2,933 |
| | 24.9 | % | | 26.4 | % |
| Net revenues | 128,558 |
| | 122,671 |
| | 4.8 | % | | 3.4 | % | 92,845 |
| | 89,527 |
| | 3.7 | % | | 5.2 | % |
| Costs charged in arriving at OIBDA | 82,205 |
| | 78,859 |
| | 4.2 | % | | 3.3 | % | 56,333 |
| | 56,354 |
| | 0.0 | % | | 1.8 | % |
| OIBDA | $ | 46,353 |
| | $ | 43,812 |
| | 5.8 | % | | 3.6 | % | $ | 36,512 |
| | $ | 33,173 |
| | 10.1 | % | | 10.9 | % |
| | | | | | | | | | | | | | | |
| OIBDA margin | 36.1 | % | | 35.7 | % | | 0.4 p.p. |
| | 0.1 p.p. |
| 39.3 | % | | 37.1 | % | | 2.2 p.p. |
| | 2.0 p.p. |
|
The television advertising market in the Czech Republic increased an estimated 3%5% at constant rates in the ninesix months ended SeptemberJune 30, 20162017 compared to the same period in 2015.2016.
On a constant currency basis, netTelevision advertising revenues increased at constant rates in the threesecond quarter and nine months ended September 30, 2016first half of 2017 compared to the corresponding periodssame period in 2015, due to increases in both television advertising revenues and carriage fees and subscription revenues. Advertisers bought2016 because we sold more GRPs in the third quarter resulting inat higher television advertising revenues for both the quarter and year-to-date periods. Our average price for advertising over these periods remains under pressure due to significant discounting by the competition to sell incremental inventory provided by channels they launched last year, which partially offset the additional volumes sold.prices. Carriage fees and subscription revenues increased on a constant currency basis in the thirdsecond quarter and first nine monthshalf of 20162017 due to agreementsnew contracts for Nova International and high definition versions of our channels in place during 2016, as well as the launch of Nova Sport 2 in September 2015 and the launch of Nova International duringthat became effective subsequent to the first quarterhalf of 2016.
Costs charged in arriving at OIBDA decreased 1%increased on a constant currency basis in the third quarter. Content costs increased slightly, which included spendingsecond quarter of 2017 compared to producethe same period in 2016 as a second season of our popular reality format, Your Face Sounds Familiar, for the fall season that was mostly offset by savings from broadcasting fewer hours of foreign fiction. There were also some incremental costs from operating additional channels, which together with the investment in local content was more than offset by savings in other costs. Total costs charged in arriving at OIBDA increased 3% at constant rates in the first nine months of 2016 because anslight increase in content costs, resulting from more local productions, foreign moviessports rights and sports programmingnews, was partially offset by lower transmission costs. The first half of 2017 was also impacted by higher content costs and marketing expenses related to the rebranding of our niche channels in the first quarterCzech Republic to align them under the umbrella of 2016 outweighed savings of other non-programming costs in the second and third quarters compared to the same periods of last year.our flagship brand, NOVA.
Romania
| | | | For the Three Months Ended September 30, (US$ 000's) | For the Three Months Ended June 30, (US$ 000's) |
| | | | | | Movement | | | | | Movement |
| | 2016 |
| | 2015 |
| | % Act |
| | % Lfl |
| 2017 |
| | 2016 |
| | % Act |
| | % Lfl |
|
| Television advertising | $ | 25,763 |
| | $ | 21,137 |
| | 21.9 | % | | 23.0 | % | $ | 36,213 |
| | $ | 37,797 |
| | (4.2 | )% | | (1.3 | )% |
| Carriage fees and subscriptions | 10,104 |
| | 10,003 |
| | 1.0 | % | | 1.9 | % | 11,458 |
| | 10,178 |
| | 12.6 | % | | 16.1 | % |
| Other | 1,103 |
| | 865 |
| | 27.5 | % | | 28.7 | % | 899 |
| | 954 |
| | (5.8 | )% | | (3.4 | )% |
| Net revenues | 36,970 |
| | 32,005 |
| | 15.5 | % | | 16.6 | % | 48,570 |
| | 48,929 |
| | (0.7 | )% | | 2.3 | % |
| Costs charged in arriving at OIBDA | 24,364 |
| | 25,052 |
| | (2.7 | )% | | (1.9 | )% | 26,302 |
| | 25,967 |
| | 1.3 | % | | 4.5 | % |
| OIBDA | $ | 12,606 |
| | $ | 6,953 |
| | 81.3 | % | | 83.3 | % | $ | 22,268 |
| | $ | 22,962 |
| | (3.0 | )% | | (0.3 | )% |
| | | | | | | | | | | | | | | |
| OIBDA margin | 34.1 | % | | 21.7 | % | | 12.4 p.p. |
| | 12.4 p.p. |
| 45.8 | % | | 46.9 | % | | (1.1) p.p. |
| | (1.2) p.p. |
|
| | | | For the Nine Months Ended September 30, (US$ 000's) | For the Six Months Ended June 30, (US$ 000's) |
| | | | | | Movement | | | | | Movement |
| | 2016 |
| | 2015 |
| | % Act |
| | % Lfl |
| 2017 |
| | 2016 |
| | % Act |
| | % Lfl |
|
| Television advertising | $ | 85,256 |
| | $ | 76,401 |
| | 11.6 | % | | 12.6 | % | $ | 64,337 |
| | $ | 59,493 |
| | 8.1 | % | | 11.8 | % |
| Carriage fees and subscriptions | 30,268 |
| | 30,377 |
| | (0.4 | )% | | 1.2 | % | 21,521 |
| | 20,164 |
| | 6.7 | % | | 10.4 | % |
| Other | 2,745 |
| | 2,783 |
| | (1.4 | )% | | (0.3 | )% | 1,656 |
| | 1,642 |
| | 0.9 | % | | 4.0 | % |
| Net revenues | 118,269 |
| | 109,561 |
| | 7.9 | % | | 9.1 | % | 87,514 |
| | 81,299 |
| | 7.6 | % | | 11.3 | % |
| Costs charged in arriving at OIBDA | 73,239 |
| | 83,828 |
| | (12.6 | )% | | (11.4 | )% | 50,560 |
| | 48,875 |
| | 3.4 | % | | 7.1 | % |
| OIBDA | $ | 45,030 |
| | $ | 25,733 |
| | 75.0 | % | | 75.1 | % | $ | 36,954 |
| | $ | 32,424 |
| | 14.0 | % | | 17.7 | % |
| | | | | | | | | | | | | | | |
| OIBDA margin | 38.1 | % | | 23.5 | % | | 14.6 p.p. |
| | 14.4 p.p. |
| 42.2 | % | | 39.9 | % | | 2.3 p.p. |
| | 2.3 p.p. |
|
The television advertising market in Romania increased an estimated 10%14% at constant rates in the ninesix months ended SeptemberJune 30, 20162017 compared to the same period in 2015.2016.
Demand forOur television advertising on television remained robust duringrevenues were broadly flat at constant rates in the thirdsecond quarter of 2017 compared to the same period last year, as higher prices mostly offset selling fewer GRPs. In the second quarter of 2016 and we fully monetized additional inventory generated by our main channel compared toaired the European football championship, which significantly increased the volume of inventory available and sold last year. This was due in part toExcluding the broadcastingbenefit of UEFA European Championship matches in the first half of July. Sincetournament last year, we sold more GRPs at higher prices,estimate our television advertising revenues increased 23% at constant rates duringapproximately 7% in the period. This growthquarter due to higher prices, as the market continues to be largely sold-out. The increase in television advertising revenues in the third quarter, combined with pricing drivenfirst half of 2017 reflected significant growth in the second quarter, resulted in an increase in net revenues in the first ninethree months of 2016 compared to the same periodyear driven by significant increases in 2015. Our channels continue to be largely sold-out,both the volume of GRPs sold and given constraints in producing more GRPs, weaverage prices. We expect lower television advertising revenue growth for 2017 will be lower than the growth rate in the fourth quarter comparedfirst half of the year due to difficult comparatives for the remainder of the year, including the third quarter of 2016.2016 when our main channel aired the remaining games of the European football championship. Carriage fees and subscription revenues grew slightly on a constant currency basis during the threesecond quarter and nine months ended September 30, 2016,first half of 2017 due to an increase in the number of reported subscribers.
Costs charged in arriving at OIBDA decreased 2%increased at constant rates during the thirdsecond quarter and first half of 2017 primarily due to a decrease in bad debt expense, lower personnel costs following restructuring efforts in 2015, lower professional fees for tax and legal advisors, and savings on satellite transmission costs. This more than offset an increase in content costs, which included the costas we invested more in local productions of broadcasting matches of the UEFA European Championship as well as increased investment in the prime time schedule. Content costs also increased in the first nine months of 2016, but this was offset by significant savings in other costs so overall costs charged in arriving at OIBDA decreased significantly.entertainment formats and aired more popular foreign programming to increase ratings.
Slovak Republic
| | | | For the Three Months Ended September 30, (US$ 000's) | For the Three Months Ended June 30, (US$ 000's) |
| | | | | | Movement | | | | | Movement |
| | 2016 |
| | 2015 |
| | % Act |
| | % Lfl |
| 2017 |
| | 2016 |
| | % Act |
| | % Lfl |
|
| Television advertising | $ | 16,809 |
| | $ | 16,030 |
| | 4.9 | % | | 5.0 | % | $ | 21,294 |
| | $ | 21,246 |
| | 0.2 | % | | 2.2 | % |
| Carriage fees and subscriptions | 400 |
| | 320 |
| | 25.0 | % | | 25.4 | % | 2,043 |
| | 559 |
| | NM(1) |
| | NM(1) |
|
| Other | 655 |
| | 873 |
| | (25.0 | )% | | (24.9 | )% | 1,287 |
| | 735 |
| | 75.1 | % | | 78.5 | % |
| Net revenues | 17,864 |
| | 17,223 |
| | 3.7 | % | | 3.9 | % | 24,624 |
| | 22,540 |
| | 9.2 | % | | 11.3 | % |
| Costs charged in arriving at OIBDA | 18,247 |
| | 16,865 |
| | 8.2 | % | | 8.3 | % | 17,102 |
| | 19,382 |
| | (11.8 | )% | | (10.0 | )% |
| OIBDA | $ | (383 | ) | | $ | 358 |
| | NM (1) |
| | NM (1) |
| $ | 7,522 |
| | $ | 3,158 |
| | 138.2 | % | | 140.9 | % |
| | | | | | | | | | | | | | | |
| OIBDA margin | (2.1 | )% | | 2.1 | % | | NM (1) |
| | NM (1) |
| 30.5 | % | | 14.0 | % | | 16.5 p.p. |
| | 16.4 p.p. |
|
|
| | | | | | | | | | | | | |
| | For the Six Months Ended June 30, (US$ 000's) |
| | | | | | Movement |
| | 2017 |
| | 2016 |
| | % Act |
| | % Lfl |
|
| Television advertising | $ | 37,347 |
| | $ | 39,091 |
| | (4.5 | )% | | (2.0 | )% |
| Carriage fees and subscriptions | 3,554 |
| | 876 |
| | NM(1) |
| | NM(1) |
|
| Other | 2,063 |
| | 1,635 |
| | 26.2 | % | | 29.4 | % |
| Net revenues | 42,964 |
| | 41,602 |
| | 3.3 | % | | 5.9 | % |
| Costs charged in arriving at OIBDA | 34,569 |
| | 36,051 |
| | (4.1 | )% | | (1.7 | )% |
| OIBDA | $ | 8,395 |
| | $ | 5,551 |
| | 51.2 | % | | 54.7 | % |
| | | | | | | | |
| OIBDA margin | 19.5 | % | | 13.3 | % | | 6.2 p.p. |
| | 6.1 p.p. |
|
(1) Number is not meaningful.
|
| | | | | | | | | | | | | |
| | For the Nine Months Ended September 30, (US$ 000's) |
| | | | | | Movement |
| | 2016 |
| | 2015 |
| | % Act |
| | % Lfl |
|
| Television advertising | $ | 55,900 |
| | $ | 51,129 |
| | 9.3 | % | | 9.4 | % |
| Carriage fees and subscriptions | 1,276 |
| | 980 |
| | 30.2 | % | | 30.3 | % |
| Other | 2,290 |
| | 2,888 |
| | (20.7 | )% | | (20.7 | )% |
| Net revenues | 59,466 |
| | 54,997 |
| | 8.1 | % | | 8.2 | % |
| Costs charged in arriving at OIBDA | 54,298 |
| | 51,157 |
| | 6.1 | % | | 6.7 | % |
| OIBDA | $ | 5,168 |
| | $ | 3,840 |
| | 34.6 | % | | 27.0 | % |
| | | | | | | | |
| OIBDA margin | 8.7 | % | | 7.0 | % | | 1.7 p.p. |
| | 1.3 p.p. |
|
The television advertising market in the Slovak Republic increased anwas estimated 13%to be flat at constant rates in the ninesix months ended SeptemberJune 30, 20162017 compared to the same period in 2015.2016.
Our television advertising revenues grewincreased on a constant currency basis during the second quarter of 2017 compared to the same period in the third quarter and first nine months of 2016 due primarily to higher prices. The year-to-date period also benefited from an increase inprices, which more than offset selling fewer GRPs following the end of spending on informational and political campaigns duringthat took place from the second half of 2015 through the first half of the year, which began to decline in the third quarter. Growth in2016. If this spending is excluded, our full year television advertising revenues is expected to be lower thanincreased 6% in the second quarter and 4% in the first nine monthshalf of 2016 as the campaign spending will be much lower2017. This was slower than market growth of 10% in the fourth quarterfirst half of 2016 and year-on-year comparisons will be impacted by the significant volume2017 as a result of such spending in the comparable period of 2015. Carriage fees and subscription revenues increased during the third quarter and first nine months of 2016 due to entering into new agreements with a number of carriers. Also during the third quarter, we did not renew our contractlower coverage for the terrestrial distribution of our channels, in the Slovak Republic effective January 1, 2017. After that date our channels in the country will bewhich have been distributed exclusively available on cable, satellite and IPTV platforms. This may resultplatforms in lower audience shares, which could negatively impactthe country since January of this year. However, this change in the way our television advertising revenues given our elevated sell-out rate. However, we expectchannels are distributed resulted in a significant increase in carriage fees and subscription revenues insubscriptions revenue and a cost reduction from significantly lower transmission costs. During the remainder of 2017 we anticipate slightly reduced pressure on our ratings as well as a significant decrease in transmission costs.additional households transition to cable, satellite and IPTV platforms and the measurement panel is updated to better reflect how viewers watch television.
On a constant currency basis, costs charged in arriving at OIBDA increaseddecreased during the thirdsecond quarter primarily due to an increase of 11% in contentlower transmission costs, from investments in local programming. Our investment in local productions in the third quarterwhich were partiallymostly offset by savings from foreign content in the first half of 2016, so2017 by an increase in content costs increased by 8%as we made targeted adjustments in the first nine months of 2016.programming line-up during the change in the way our channels are distributed. There were also additional expenses related to increased marketing activities during this transition.
Slovenia
| | | | For the Three Months Ended September 30, (US$ 000's) | For the Three Months Ended June 30, (US$ 000's) |
| | | | | | Movement | | | | | Movement |
| | 2016 |
| | 2015 |
| | % Act |
| | % Lfl |
| 2017 |
| | 2016 |
| | % Act |
| | % Lfl |
|
| Television advertising | $ | 7,740 |
| | $ | 6,962 |
| | 11.2 | % | | 11.3 | % | $ | 14,344 |
| | $ | 13,907 |
| | 3.1 | % | | 5.1 | % |
| Carriage fees and subscriptions | 1,159 |
| | 1,020 |
| | 13.6 | % | | 13.6 | % | 3,071 |
| | 1,237 |
| | 148.3 | % | | 152.8 | % |
| Other | 656 |
| | 624 |
| | 5.1 | % | | 5.3 | % | 1,038 |
| | 972 |
| | 6.8 | % | | 8.8 | % |
| Net revenues | 9,555 |
| | 8,606 |
| | 11.0 | % | | 11.2 | % | 18,453 |
| | 16,116 |
| | 14.5 | % | | 16.7 | % |
| Costs charged in arriving at OIBDA | 10,301 |
| | 10,162 |
| | 1.4 | % | | 1.4 | % | 14,067 |
| | 14,492 |
| | (2.9 | )% | | (0.6 | )% |
| OIBDA | $ | (746 | ) | | $ | (1,556 | ) | | 52.1 | % | | 52.2 | % | $ | 4,386 |
| | $ | 1,624 |
| | 170.1 | % | | 164.2 | % |
| | | | | | | | | | | | | | | |
| OIBDA margin | (7.8 | )% | | (18.1 | )% | | 10.3 p.p. |
| | 10.4 p.p. |
| 23.8 | % | | 10.1 | % | | 13.7 p.p. |
| | 13.3 p.p. |
|
| | | | For the Nine Months Ended September 30, (US$ 000's) | For the Six Months Ended June 30, (US$ 000's) |
| | | | | | Movement | | | | | Movement |
| | 2016 |
| | 2015 |
| | % Act |
| | % Lfl |
| 2017 |
| | 2016 |
| | % Act |
| | % Lfl |
|
| Television advertising | $ | 31,451 |
| | $ | 30,080 |
| | 4.6 | % | | 4.5 | % | $ | 24,251 |
| | $ | 23,711 |
| | 2.3 | % | | 4.8 | % |
| Carriage fees and subscriptions | 3,580 |
| | 3,034 |
| | 18.0 | % | | 18.4 | % | 4,744 |
| | 2,421 |
| | 96.0 | % | | 100.7 | % |
| Other | 2,293 |
| | 2,035 |
| | 12.7 | % | | 12.6 | % | 1,675 |
| | 1,637 |
| | 2.3 | % | | 4.9 | % |
| Net revenues | 37,324 |
| | 35,149 |
| | 6.2 | % | | 6.2 | % | 30,670 |
| | 27,769 |
| | 10.4 | % | | 13.2 | % |
| Costs charged in arriving at OIBDA | 37,154 |
| | 35,382 |
| | 5.0 | % | | 5.1 | % | 26,281 |
| | 26,853 |
| | (2.1 | )% | | 0.6 | % |
| OIBDA | $ | 170 |
| | $ | (233 | ) | | NM (1) |
| | NM (1) |
| $ | 4,389 |
| | $ | 916 |
| | NM (1) |
| | NM (1) |
|
| | | | | | | | | | | | | | | |
| OIBDA margin | 0.5 | % | | (0.7 | )% | | NM (1) |
| | NM (1) |
| 14.3 | % | | 3.3 | % | | 11.0 p.p. |
| | 10.7 p.p. |
|
(1) Number is not meaningful.
The television advertising market in Slovenia increased an estimated 6%4% at constant rates in the ninesix months ended SeptemberJune 30, 20162017 compared to the same period in 2015.2016.
TelevisionOur television advertising revenuerevenues increased at constant rates during the thirdsecond quarter due to sellingand first half of 2017 reflecting an increase in prices from strong demand, which more inventory at higher average prices. Certain advertisers continue to be encouraged by the macro-economic environmentthan offset a decline in the country and increased their spending with us in the third quarter. This increased spending also benefited the first nine monthsvolume of 2016 as the growth in our television advertising revenues has improved over the course of the year.GRPs sold. Carriage fees and subscription revenues increased in both periods primarily as a result of an increasesignificantly due to new agreements with cable, satellite and IPTV operators because our channels in the monthly price for our subscription videocountry have been distributed exclusively on demand product, Voyo.those platforms since January of this year.
On a constant currency basis, costs charged in arriving at OIBDA increaseddecreased during both periodsthe second quarter primarily due primarily to an increase inlower content costs from additionalshowing fewer hours of local own produced programming,productions on the secondary channel, which was partiallymore than offset by savingsin the first half of 2017 from more popular foreign programming. The higher cost of local programming, especiallytitles aired during the first nine months of 2016, has also been partially offset by savings from cost cutting measures, mainly due to lower personnel costs.
Free Cash Flow and Unlevered Free Cash Flow
|
| | | | | | | | | | |
| | For the Nine Months Ended September 30, (US$ 000's) |
| | 2016 |
| | 2015 |
| | Movement |
|
| Net cash generated from continuing operating activities | $ | 42,564 |
| | $ | 79,085 |
| | (46.2 | )% |
| Capital expenditures, net | (19,734 | ) | | (26,219 | ) | | 24.7 | % |
| Free cash flow | 22,830 |
| | 52,866 |
| | (56.8 | )% |
| Cash paid for interest (including mandatory cash-pay Guarantee Fees) | 40,877 |
| | 10,712 |
| | NM (1) |
|
| Cash paid for Guarantee Fees previously paid in kind | 27,502 |
| | — |
| | NM (1) |
|
| Unlevered free cash flow | $ | 91,209 |
| | $ | 63,578 |
| | 43.5 | % |
(1) Number is not meaningful. |
| | | | | | | | | | |
| (US$ 000's) | September 30, 2016 |
| | December 31, 2015 |
| | Movement |
|
| Cash and cash equivalents | $ | 64,229 |
| | $ | 61,679 |
| | 4.1 | % |
We ended the quarter with US$ 64.2 million of cash. Our unlevered free cash flow increased 44% to US$ 91.2 millionchange in the nine months ended September 30, 2016, from US$ 63.6 million in the same period in 2015. This improvement during the first nine months of 2016 reflected the improvement in OIBDA and lower capital expenditures. Free cash flow decreased 57% to US$ 22.8 million, from US$ 52.9 million in the same period in 2015 because we paid more interest in cash and elected to repay a total of US$ 27.5 million of accrued Guarantee Fees previously paid in kind during the first nine months of 2016.way our channels are distributed, as well as other costs associated with this transition.
For the full year, we expect unlevered free cash flow to improve from US$ 73.9 million in 2015, primarily reflecting an increase in OIBDA, which will be partially offset by investments in new local productions for 2017. Cash paid for interest will be higher in 2016 than it was in 2015, and we also plan to use cash to pay the Guarantee Fee related to the 2018 Euro Term Loan payable in November 2016 rather than electing to pay in kind. As a result, we anticipate that free cash flow for 2016 will decrease significantly from US$ 55.5 million in 2015.
III. Analysis of the Results of Operations and Financial Position
| | | | For the Three Months Ended September 30, (US$ 000's) | For the Three Months Ended June 30, (US$ 000's) |
| | | | | | Movement | | | | | Movement |
| | 2016 |
| | 2015 |
| | % Act |
| | % Lfl |
| 2017 |
| | 2016 |
| | % Act |
| | % Lfl |
|
| Revenue: | | | | | | | | | | | | | | |
| Television advertising | $ | 101,287 |
| | $ | 93,882 |
| | 7.9 | % | | 8.0 | % | $ | 149,521 |
| | $ | 149,012 |
| | 0.3 | % | | 1.9 | % |
| Carriage fees and subscriptions | 19,745 |
| | 17,731 |
| | 11.4 | % | | 11.9 | % | 25,356 |
| | 19,862 |
| | 27.7 | % | | 30.4 | % |
| Other revenue | 5,674 |
| | 5,709 |
| | (0.6 | )% | | (0.6 | )% | 6,979 |
| | 6,332 |
| | 10.2 | % | | 11.6 | % |
| Net Revenues | 126,706 |
| | 117,322 |
| | 8.0 | % | | 8.2 | % | 181,856 |
| | 175,206 |
| | 3.8 | % | | 5.5 | % |
| Operating expenses: | | | | | | | | | | | | | | |
| Content costs | 64,487 |
| | 58,983 |
| | 9.3 | % | | 9.4 | % | 76,709 |
| | 77,282 |
| | (0.7 | )% | | 1.4 | % |
| Other operating costs | 17,024 |
| | 17,180 |
| | (0.9 | )% | | (0.9 | )% | 15,395 |
| | 17,939 |
| | (14.2 | )% | | (13.1 | )% |
| Depreciation of property, plant and equipment | 7,557 |
| | 6,974 |
| | 8.4 | % | | 8.3 | % | 8,293 |
| | 7,627 |
| | 8.7 | % | | 10.1 | % |
| Amortization of broadcast licenses and other intangibles | 2,073 |
| | 2,695 |
| | (23.1 | )% | | (23.1 | )% | 2,053 |
| | 2,114 |
| | (2.9 | )% | | (2.5 | )% |
| Cost of revenues | 91,141 |
| | 85,832 |
| | 6.2 | % | | 6.2 | % | 102,450 |
| | 104,962 |
| | (2.4 | )% | | (0.5 | )% |
| Selling, general and administrative expenses | 27,181 |
| | 2,403 |
| | NM (1) |
| | NM (1) |
| 28,583 |
| | 26,353 |
| | 8.5 | % | | 9.7 | % |
| Restructuring costs | — |
| | 234 |
| | (100.0 | )% | | (100.0 | )% | |
| Operating income | $ | 8,384 |
| | $ | 28,853 |
| | (70.9 | )% | | (70.5 | )% | $ | 50,823 |
| | $ | 43,891 |
| | 15.8 | % | | 17.2 | % |
| |
(1)
| Number is not meaningful. |
| | | | For the Nine Months Ended September 30, (US$ 000's) | For the Six Months Ended June 30, (US$ 000's) |
| | | | | | Movement | | | | | Movement |
| | 2016 |
| | 2015 |
| | % Act |
| | % Lfl |
| 2017 |
| | 2016 |
| | % Act |
| | % Lfl |
|
| Revenue: | | | | | | | | | | | | | | |
| Television advertising | $ | 354,470 |
| | $ | 337,054 |
| | 5.2 | % | | 4.7 | % | $ | 258,035 |
| | $ | 253,183 |
| | 1.9 | % | | 4.2 | % |
| Carriage fees and subscriptions | 58,816 |
| | 54,936 |
| | 7.1 | % | | 8.0 | % | 46,739 |
| | 39,071 |
| | 19.6 | % | | 22.9 | % |
| Other revenue | 17,626 |
| | 18,299 |
| | (3.7 | )% | | (3.9 | )% | 12,084 |
| | 11,952 |
| | 1.1 | % | | 3.2 | % |
| Net Revenues | 430,912 |
| | 410,289 |
| | 5.0 | % | | 4.8 | % | 316,858 |
| | 304,206 |
| | 4.2 | % | | 6.6 | % |
| Operating expenses: | | | | | | | | | | | | | | |
| Content costs | 213,747 |
| | 203,710 |
| | 4.9 | % | | 5.1 | % | 150,111 |
| | 149,260 |
| | 0.6 | % | | 3.3 | % |
| Other operating costs | 51,417 |
| | 51,640 |
| | (0.4 | )% | | (0.4 | )% | 29,951 |
| | 34,393 |
| | (12.9 | )% | | (11.1 | )% |
| Depreciation of property, plant and equipment | 22,469 |
| | 20,911 |
| | 7.5 | % | | 7.4 | % | 16,052 |
| | 14,912 |
| | 7.6 | % | | 9.9 | % |
| Amortization of broadcast licenses and other intangibles | 6,247 |
| | 9,628 |
| | (35.1 | )% | | (35.2 | )% | 4,162 |
| | 4,174 |
| | (0.3 | )% | | 1.4 | % |
| Cost of revenues | 293,880 |
| | 285,889 |
| | 2.8 | % | | 2.9 | % | 200,276 |
| | 202,739 |
| | (1.2 | )% | | 1.3 | % |
| Selling, general and administrative expenses | 76,994 |
| | 75,016 |
| | 2.6 | % | | 2.4 | % | 53,491 |
| | 49,813 |
| | 7.4 | % | | 9.4 | % |
| Restructuring costs | — |
| | 1,329 |
| | (100.0 | )% | | (100.0 | )% | |
| Operating income | $ | 60,038 |
| | $ | 48,055 |
| | 24.9 | % | | 22.4 | % | $ | 63,091 |
| | $ | 51,654 |
| | 22.1 | % | | 24.5 | % |
Revenue:
Television advertising revenues: We estimate television advertising spending in our markets grew on average by 5%6% at constant rates in the ninesix months ended SeptemberJune 30, 20162017 as compared to the same period in 2015,2016, positively impacting our television advertising revenues. See "Overview - Segment Performance" above for additional information on television advertising revenues for each of our operating countries.
Carriage fees and subscriptions: Carriage fees and subscriptions revenue increased during the three and ninesix months ended SeptemberJune 30, 2016,2017 to 14% and 15% of total net revenues, respectively, as compared to 11% and 13% for the same periods in 2015,2016. The increases arose primarily in the CzechSlovak Republic and Slovenia as our channels in those countries are exclusively available on cable, satellite and IPTV platforms since January 2017 and in Romania due to the launch of additional channels in the second half of 2015 and first quarter of 2016, in addition to high definition versions of our channels that are now included in most cable and satellite platforms. Carriage fees revenues also benefited from higher subscriber counts in the current year in multiple segments.counts. See "Overview - Segment Performance" above for additional information on carriage fees and subscription revenues for each of our operating countries.
Other revenues: Other revenues include primarily internet advertising revenues and revenues generated through the licensing of our own productions. Other revenues was broadly flat inincreased during the three and six months ended SeptemberJune 30, 2016 compared to the same period in 2015, but decreased during the nine months ended September 30, 20162017 as compared to the same periodperiods in the prior year2016 primarily due to fewer licensing arrangements for our own productions and lower production services revenues.higher internet advertising.
Operating Expenses:
Content costs: Content costs (including production costs and amortization and impairment of program rights) increased at constant rates during the three and ninesix months ended SeptemberJune 30, 20162017 compared to the same periods in 2015.2016. The increase in the three months ended June 30, 2017 is primarily due to higher quality acquired programming in our schedules, while the increase in the six months ended June 30, 2017 is due to both higher quality acquired programming and more hours of local productions in our broadcast schedules in 2016 than in 2015 and the cost of broadcasting matches of the UEFA European Championship in 2016. These increases were partially offset by savings from foreign programming.schedules.
Other operating costs: Other operating costs (excluding content costs, depreciation of property, plant and equipment, amortization of broadcast licenses and other intangibles as well as selling, general and administrative expenses) decreased slightly during the three and ninesix months ended SeptemberJune 30, 20162017 compared to the same periods in 2015, as we continued2016, primarily due to focus oncost savings in Slovakia following our decision not to renew our contract for the efficiencyterrestrial distribution of our operations.channels there.
Depreciation of property, plant and equipment: Total depreciation of property, plant and equipment increased during the three and ninesix months ended SeptemberJune 30, 20162017 compared to the same periods in 20152016 primarily due to depreciation on production and technical equipment placed in service.service as we replaced fully depreciated assets.
Amortization of broadcast licenses and other intangibles: Total amortization of broadcast licenses and other intangibles decreased during the three and nine months ended SeptemberJune 30, 20162017 compared to the same periodsperiod in 2015.2016 as certain of our intangible assets in Romania were fully amortized. The decrease isincrease in the six months ended June 30, 2017 at constant rates was primarily due to higher amortization expense in 2015 for certain of our trademarks in Romania that we determined were no longer indefinite-lived and began amortizing from January 1, 2015the Czech Republic which were subsequently divested withpartly offset by the sale of our Romanian studios indecrease related to the fourth quarter of 2015. The lower amortization expense also reflects certain intangible assets in Bulgaria which were fully amortized intangibles in the fourth quarter of 2015.Romania.
Selling, general and administrative expenses: Selling, general and administrative expenses increased during the three and ninesix months ended SeptemberJune 30, 20162017 compared to the same periods in 20152016 primarily due to the reversal in the third quarter of 2015 of a charge related to certain tax audits in Romania. Excluding the impact of the reversal of this charge, selling, general and administrative expenses decreased during the three and nine months ended September 30, 2016 compared to the same periods in 2015 due to lower professional fees, and increased non-recourse factoring activities resulting in lower bad debt expense.charges in Bulgaria and Croatia. See Item 1, Note 19, "Commitments and Contingencies".
Selling, general and administrative expenses for three and ninesix months ended SeptemberJune 30, 20162017 and 20152016 also includes charges in respect of non-cash stock-based compensation (see Item 1, Note 16, "Stock-based Compensation"). The charge for stock-based compensation expense in 2016 increased compared to2017 was consistent with the prior periods reflecting the impact of stock options and performance-based RSUs grantedcharge in the first quarters of 2015 and 2016.
Operating income / (loss):income: The decreaseincrease in operating income during the three and six months ended SeptemberJune 30, 20162017 compared to 2015the same periods in 2016 resulted from increases in television advertising and carriage fee revenues, which outpaced the reversalincreases in cost of charges in the prior year related to tax audits in Romania, which were accrued in the fourth quarter of 2014 and in the first quarter of 2015 and fully released in the third quarter of 2015. Operating income in the nine months ended September 30, 2016 benefited from the increase in net revenues and decrease in operating expenses after excluding the impact of the reversal in the same period in 2015.
selling, general and administrative expenses. Our operating margin, which is determined as operating income / loss divided by net revenues, was 7%28% and 14%20% for the three and ninesix months ended SeptemberJune 30, 20162017 compared to 25% and 12%17% for the three and ninesix months ended SeptemberJune 30, 2015. Excluding the charges and subsequent reversal of the charges related to the Romanian tax audits, our operating margin for the three and nine months ended September 30, 2015 was negative 1% and 9%, respectively.2016.
Other income / expense:
| | | | For the Three Months Ended September 30, (US$ 000's) | | For the Nine Months Ended September 30, (US$ 000's) | For the Three Months Ended June 30, (US$ 000's) | | For the Six Months Ended June 30, (US$ 000's) |
| | 2016 |
| | 2015 |
| | % Act |
| | 2016 |
| | 2015 |
| | % Act |
| 2017 |
| | 2016 |
| | % Act |
| | 2017 |
| | 2016 |
| | % Act |
|
| Interest expense | $ | (27,636 | ) | | $ | (43,998 | ) | | 37.2 | % | | $ | (106,335 | ) | | $ | (125,862 | ) | | 15.5 | % | $ | (21,973 | ) | | $ | (29,545 | ) | | 25.6 | % | | $ | (45,728 | ) | | $ | (78,699 | ) | | 41.9 | % |
| Loss on extinguishment of debt | — |
| | — |
| | NM (1) |
| | (150,158 | ) | | — |
| | NM (1) |
| — |
| | (150,158 | ) | | 100.0 | % | | — |
| | (150,158 | ) | | 100.0 | % |
| Non-operating income / (expense): | | | | | | | | | | | | | | | | | | | | | | |
| Interest income | 90 |
| | 109 |
| | (17.4 | )% | | 483 |
| | 339 |
| | 42.5 | % | 110 |
| | 285 |
| | (61.4 | )% | | 189 |
| | 393 |
| | (51.9 | )% |
| Foreign currency exchange gain / (loss), net | 630 |
| | (568 | ) | | NM (1) |
| | 13,050 |
| | (9,768 | ) | | NM (1) |
| 8,086 |
| | (3,002 | ) | | NM (1) |
| | 9,767 |
| | 12,420 |
| | (21.4 | )% |
| Change in fair value of derivatives | (398 | ) | | (2,443 | ) | | 83.7 | % | | (11,904 | ) | | (5,673 | ) | | (109.8 | )% | (1,100 | ) | | 2,544 |
| | NM (1) |
| | (732 | ) | | (11,506 | ) | | 93.6 | % |
| Other income / (expense), net | 65 |
| | (3,575 | ) | | NM (1) |
| | 7 |
| | (7,020 | ) | | NM (1) |
| 45 |
| | 6 |
| | NM (1) |
| | 242 |
| | (58 | ) | | NM (1) |
|
| (Provision) / credit for income taxes | (958 | ) | | 112 |
| | NM (1) |
| | (6,947 | ) | | (3,493 | ) | | (98.9 | )% | |
| Loss from discontinued operations, net of tax | — |
| | (265 | ) | | 100.0 | % | | — |
| | (869 | ) | | 100.0 | % | |
| Net loss attributable to noncontrolling interests | 196 |
| | 253 |
| | (22.5 | )% | | 387 |
| | 817 |
| | (52.6 | )% | |
| Other comprehensive income / (loss): | | | | | | | | | | | | |
| Provision for income taxes | | (8,193 | ) | | (5,270 | ) | | (55.5 | )% | | (10,305 | ) | | (5,989 | ) | | (72.1 | )% |
| Net loss / (income) attributable to noncontrolling interests | | 137 |
| | (68 | ) | | NM (1) |
| | 346 |
| | 191 |
| | 81.2 | % |
| Other comprehensive income / (loss) | | | | | | | | | | | | |
| Currency translation adjustment, net | 7,262 |
| | 5,546 |
| | 30.9 | % | | 15,264 |
| | (58,637 | ) | | NM (1) |
| 30,904 |
| | (11,056 | ) | | NM (1) |
| | 32,976 |
| | 8,002 |
| | NM (1) |
|
| Unrealized loss on derivative instruments | (1,360 | ) | | (522 | ) | | (160.5 | )% | | (5,581 | ) | | (596 | ) | | NM (1) |
| |
| (Loss) / gain on derivative instruments | | (40 | ) | | (2,973 | ) | | 98.7 | % | | 1,218 |
| | (4,221 | ) | | NM (1) |
|
| |
(1) | Number is not meaningful. |
Interest expense: Interest expense during the three and ninesix months ended SeptemberJune 30, 20162017 decreased compared to the three and ninesix months ended SeptemberJune 30, 20152016 primarily due to lower amortization of debt discount and issuance costs following the extinguishment of the 2017 PIK Notes and 2017 Term Loan. Interest expense for the three months ended September 30,Loan in April 2016 also decreased as compared to the same period in 2015and due to a lower effective interest rate on the refinancingreplacement facility. We also realized interest expense savings as a result of the 2017 PIK Notestransaction entered into with Time Warner during the first quarter of 2017. See Item 1, Note 4, "Long-term Debt and the 2017 Term Loan (each 15% per annum) with the 2021 Euro Term Loan (all-in rate of 10.0% per annum as at September 30, 2016)Other Financing Arrangements".
Loss on extinguishment of debt:During the ninethree and six months ended SeptemberJune 30, 2016, we recognized a loss on extinguishment of debt related to the redemption and discharge of the 2017 PIK Notes, repayment of the 2017 Term Loan and modifications of the 2018 Euro Term Loan and the 2019 Euro Term Loan, which were accounted for in a similar manner asto a debt extinguishment.
Interest income: Interest income primarily reflects earnings on cash balances.balances and was not material.
Foreign currency exchange gain / (loss), net: We are exposed to fluctuations in foreign exchange rates on the revaluation of monetary assets and liabilities denominated in currencies other than the local functional currency of the relevant subsidiary. This includes third party receivables and payables, as well as certain of our intercompany loans which are not considered of a long-term investment nature. Our subsidiaries generally receive funding via loans that are denominated in currencies other than the dollar, and any change in the relevant exchange rate will require us to recognize a transaction gain or loss on revaluation. Certain of our intercompany loans are classified as long-term in nature, and therefore gains or losses on revaluation are not recorded through the statement of operations and comprehensive income / loss. See the discussion under "Currency translation adjustment, net" below.
During the ninesix months ended SeptemberJune 30, 20162017, we recognized a net gain of US$ 13.19.8 million comprised of transaction gains of US$ 38.11.9 million relating to the revaluation of intercompany loans, transaction lossesgains of approximately US$ 25.35.3 million on our long-term debt and other financing arrangements and transaction gains of US$ 0.32.6 million relating to the revaluation of monetary assets and liabilities denominated in currencies other than the local functional currency of the relevant subsidiary.
During the ninesix months ended SeptemberJune 30, 20152016, we recognized a net lossgain of US$ 12.4 million comprised of US$ 9.8 million transaction lossesgains of US$ 23.838.2 million relating to the revaluation of intercompany loans, transaction gainslosses of approximately US$ 23.525.5 million on our long-term debt and other financing arrangements and transaction losses of US$ 9.50.3 million relating to the revaluation of monetary assets and liabilities denominated in currencies other than the local functional currency of the relevant subsidiary.
Change in fair value of derivatives: During the three and ninesix months ended SeptemberJune 30, 20162017, we recognized losses as a result of the change in the fair value of our USD/EUR foreign currency forward contracts entered into on December 3, 2015, February 11, 2016January 31, 2017 and February 17, 2016.May 16, 2017. During the three and ninesix months ended SeptemberJune 30, 2015,2016, we recognized gains and losses, respectively, as a result of the change in the fair value of ourcertain USD/EUR and USD/CZK foreign currency forward contracts entered into on March 11, 2015 and the USD/EUR foreign currency forward contract entered into on July 2, 2015.which matured in 2016. See Item 1, Note 11, "Financial Instruments and Fair Value Measurements".
Other income / (expense), net: Our other income / expense, net during the three and ninesix months ended SeptemberJune 30, 2017 and 2016 was not material. During the three and nine months ended September 30, 2015, we recognized other expense primarily due to the estimated loss on sale of our Romanian production services business, which was not accounted for as a discontinued operation and the estimated loss on the sale of a building and related land in Bulgaria, both of which were subsequently disposed in the fourth quarter of 2015.
(Provision) / creditProvision for income taxes: The provision for income taxes for the three and ninesix months ended SeptemberJune 30, 2017 reflects losses on which no tax benefit has been received and an income tax charge on profits in the Czech Republic, Romania and Slovakia. The provision for income taxes for the three and six months ended June 30, 2016 reflects losses on which no tax benefit has been received as well asand tax charges on profits in the Czech Republic and Romania.
The credit for income taxes for the three months ended September 30, 2015 reflects a change in the mix of profits between tax jurisdictions. The provision for income taxes for the nine months ended September 30, 2015 reflects valuation allowances in respect of the tax benefit of losses and deferred tax charges on profits in the Czech Republic and Croatia.
Our subsidiaries are subject to income taxes at statutory rates ranging from 10.0% in Bulgaria to 22.0%21.0% in the Slovak Republic.
Net loss / (income) attributable to noncontrolling interests: The results attributable to noncontrolling interests for the three and ninesix months ended SeptemberJune 30, 20162017 and 2015 primarily2016 relates to the noncontrolling interest share of our Bulgaria operations.
Currency translation adjustment, net: The underlying equity value of our investments (which are denominated in the functional currency of the relevant entity) are converted into dollars at each balance sheet date, with any change in value of the underlying assets and liabilities being recorded as a currency translation adjustment to the balance sheet rather than net income / loss.
In Other comprehensive income / (loss) due to currency translation adjustment, net comprised the following for the three and ninesix months ended SeptemberJune 30, 2016, we recognized other comprehensive income of US$ 7.3 million2017 and US$ 15.3 million, respectively, compared to other comprehensive income of US$ 5.5 million and other comprehensive loss of US$ 58.6 million during the three and nine months ended September 30, 2015. Included in these amounts are foreign exchange gains and losses on the retranslation of certain2016:
|
| | | | | | | | | | | | | | | | | | | | |
| | For the Three Months Ended June 30, (US$ 000's) | | For the Six Months Ended June 30, (US$ 000's) |
| | 2017 |
| | 2016 |
| | % Act | | 2017 |
| | 2016 |
| | % Act |
|
| Foreign exchange gain / (loss) on intercompany transactions | $ | 5,896 |
| | $ | (965 | ) | | NM (1) | | $ | 6,682 |
| | $ | 8,494 |
| | (21.3 | )% |
| Foreign exchange gain / (loss) on the Series B Preferred Shares | 15,485 |
| | (6,253 | ) | | NM (1) | | 20,451 |
| | (6,253 | ) | | NM (1) |
|
| Currency translation adjustment | 9,523 |
| | (3,838 | ) | | NM (1) | | 5,843 |
| | 5,761 |
| | 1.4 | % |
| Currency translation adjustment, net | $ | 30,904 |
| | $ | (11,056 | ) | | NM (1) | | $ | 32,976 |
| | $ | 8,002 |
| | NM (1) |
|
| |
(1) | Number is not meaningful. |
Certain of our intercompany loans whichare denominated in currencies other than the functional currency of the lender and are considered to be of a long-term investment nature and as such, are included in accumulated other comprehensive incomethe repayment of these loans is neither planned nor anticipated for the foreseeable future. The foreign exchange gains / loss, a component(losses) on the remeasurement of shareholders' equity. Forthese intercompany loans to the three and nine months ended September 30, 2016 and 2015, we recognized a gain of US$ 3.6 million and a loss US$ 3.7 million, and a gain of US$ 3.5 million and a loss of US$ 63.1 million, respectively, in accumulated other comprehensive income / loss. In addition, management determined that CME Ltd.'slender's functional currency isare treated in the Euro with effect from April 1, 2016. As a result of this change, we recognized a charge of US$ 4.2 million ofsame manner as currency translation adjustment in the second quarter of 2016 due to the translation of non-monetary assets into Euro as of the date of the change.
The following table illustrates the amount by which the exchange rate of the dollar to the functional currencies of our operations moved between January 1 and September 30, 2016 and 2015, respectively:
|
| | | | | |
| | For the Nine Months Ended September 30, |
| | 2016 |
| | 2015 |
|
| Bulgarian Lev | (2 | )% | | 9 | % |
| Croatian Kuna | (4 | )% | | 8 | % |
| Czech Koruna | (2 | )% | | 6 | % |
| Euro | (2 | )% | | 8 | % |
| New Romanian Lei | (4 | )% | | 7 | % |
The dollar weakened slightly against the functional currencies of our operations between January 1 and September 30, 2016 compared to a significant strengthening for the same period in 2015. The following table illustrates the change in the average exchange rates of the dollar to the functional currencies of our operations between the nine months ended September 30, 2016 and 2015.
|
| | |
| Change in Average Rates |
Bulgarian Lev | 0 | % |
Croatian Kuna | (1 | )% |
Czech Koruna | (1 | )% |
Euro | 0 | % |
New Romanian Lei | 2 | % |
To the extent that our subsidiaries incur transaction losses in their local functional currency income statements on the revaluation of monetary assets and liabilities denominated in dollars, we recognize a gain of the same amount as a currency translation adjustment within equity when we retranslate our net investment in that subsidiary into dollars.adjustments.
The following charts depict the movement of the dollar versus the functional currencies of our operations, based on monthly closing rates, during the ninesix months ended SeptemberJune 30, 20162017 and SeptemberJune 30, 20152016.
Percent Change During the NineSix Months Ended SeptemberJune 30, 20162017
Percent Change During the NineSix Months Ended SeptemberJune 30, 20152016
Unrealized loss(Loss) / gain on derivative instruments: We recognized unrealized lossesThe gains / (losses) on derivatives classified as hedging instrumentscash flow hedges of the Euro Term Loans, which are recognized in accumulated other comprehensive income / loss, for the three and ninesix months ended SeptemberJune 30, 2017 and 2016 and 2015are due to the effective portion of the changes in the fair value of our interest rate swaps classified as cash flow hedges and recognized in accumulated other comprehensive income / loss.swaps. See Item 1, Note 11, "Financial Instruments and Fair Value Measurements".
Condensed consolidated balance sheets as at SeptemberJune 30, 20162017 and December 31, 2015:2016:
| | | | Condensed Consolidated Balance Sheet (US$ 000’s) | Condensed Consolidated Balance Sheet (US$ 000’s) |
| | September 30, 2016 |
| | December 31, 2015 |
| | % Act |
| June 30, 2017 |
| | December 31, 2016 |
| | % Act |
| | % Lfl |
|
| Current assets | $ | 332,727 |
| | $ | 358,284 |
| | (7.1 | )% | $ | 403,010 |
| | $ | 340,420 |
| | 18.4 | % | | 8.4 | % |
| Non-current assets | 1,111,509 |
| | 1,082,133 |
| | 2.7 | % | 1,155,376 |
| | 1,050,297 |
| | 10.0 | % | | (0.3 | )% |
| Current liabilities | 196,578 |
| | 146,308 |
| | 34.4 | % | 182,172 |
| | 171,564 |
| | 6.2 | % | | (2.9 | )% |
| Non-current liabilities | 1,111,490 |
| | 974,270 |
| | 14.1 | % | 1,175,095 |
| | 1,070,786 |
| | 9.7 | % | | 1.6 | % |
| Temporary equity | 252,512 |
| | 241,198 |
| | 4.7 | % | 259,661 |
| | 254,899 |
| | 1.9 | % | | 1.9 | % |
| CME Ltd. shareholders’ (deficit) / equity | (117,157 | ) | | 77,260 |
| | NM (1) |
| |
| CME Ltd. shareholders’ deficit | | (58,923 | ) | | (107,804 | ) | | 45.3 | % | | 42.5 | % |
| Noncontrolling interests in consolidated subsidiaries | 813 |
| | 1,381 |
| | (41.1 | )% | 381 |
| | 1,272 |
| | (70.0 | )% | | (49.1 | )% |
| |
(1)
| Number is not meaningful. |
Note: The analysis below is intended to highlight the key factors at constant rates that led to the movements from December 31, 2015,2016, excluding the impact of foreign currency translation.
Current assets: Current assets at SeptemberJune 30, 20162017 decreasedincreased compared to December 31, 20152016 primarily due to higher cash balances from the collection of receivables, which was partly offset by lower accounts receivables as a result of non-recourse factoring and lowerfrom the trailing quarter revenues due to seasonality. In addition, the prospective adoption of new accounting guidance which requires that deferred tax assetsseasonality and liabilities be classified as non-current in the condensed consolidated balance sheets decreased current assets.lower prepayments for programming.
Non-current assets: Non-current assets at SeptemberJune 30, 20162017 increaseddecreased slightly compared to December 31, 20152016 primarily due to an increase in the amountdepreciation of local productions ahead of the fall schedule. This increase was offset by depreciation on property, plant and equipment andas well as amortization of intangible assets as well asand debt issuance costs associated with our 2021 Revolving Credit Facility. These decreases were partly offset by higher program rights as our own-produced programs for the fall schedule are in production.
Current liabilities: Current liabilities at SeptemberJune 30, 20162017 increaseddecreased compared to December 31, 20152016. The increasedecrease is primarily due to lower payables for programming and lower accrued Guarantee Feesexpenses, which are not yet payable, whether in cash or in kind.was partly offset by increased deferred revenue due to customer prepayments for the fall schedules.
Non-current liabilities: Non-current liabilities at SeptemberJune 30, 20162017 increased compared to December 31, 20152016, primarily due to our election to pay Guarantee Fees on the refinancing of the 2017 PIK Notes and the 20172019 Euro Term Loan both of which had significant issuance discounts, with theand 2021 Euro Term Loan which had no such discount.in kind.
Temporary equity: Temporary equity at SeptemberJune 30, 20162017 increased compared to December 31, 20152016, due to the accretion on the Series B Preferred Shares.
CME Ltd. shareholders’ (deficit) / equity:deficit: CME Ltd. shareholders’ equitydeficit decreased compared to December 31, 2015.2016. This primarily reflects the net loss attributable to CME Ltd., a decrease in accumulated other comprehensive loss due to currency translation adjustments and the net income attributable to CME Ltd. during the ninesix months ended SeptemberJune 30, 2016 and2017, which was partly offset by accretion of the preferred dividend paid in kind on our Series B Preferred Shares.
Noncontrolling interests in consolidated subsidiaries: Noncontrolling interests in consolidated subsidiaries at SeptemberJune 30, 20162017 decreased compared to December 31, 20152016, due to the net loss attributable to the noncontrolling interest in Bulgaria.
IV. Liquidity and Capital Resources
IV (a) Summary of Cash Flows
Cash and cash equivalents increased by US$ 2.651.9 million during the ninesix months ended SeptemberJune 30, 20162017. The change in cash and cash equivalents for the periods presented below is summarized as follows:
| | | | For the Nine Months Ended September 30, (US$ 000's) | For the Six Months Ended June 30, (US$ 000's) |
| | 2016 |
| | 2015 |
| 2017 |
| | 2016 |
|
| Net cash generated from continuing operating activities | $ | 42,564 |
| | $ | 79,085 |
| $ | 56,770 |
| | $ | 17,549 |
|
| Net cash used in continuing investing activities | (19,734 | ) | | (26,219 | ) | (14,581 | ) | | (11,255 | ) |
| Net cash used in continuing financing activities | (23,395 | ) | | (27,664 | ) | |
| Net cash provided by / (used in) continuing financing activities | | 1,897 |
| | (23,970 | ) |
| Net cash provided by discontinued operations | 705 |
| | 4,011 |
| 1,045 |
| | 705 |
|
| Impact of exchange rate fluctuations on cash and cash equivalents | 2,410 |
| | (1,730 | ) | 6,769 |
| | 1,734 |
|
| Net increase in cash and cash equivalents | $ | 2,550 |
| | $ | 27,483 |
| |
| Net increase / (decrease) in cash and cash equivalents | | $ | 51,900 |
| | $ | (15,237 | ) |
Operating Activities
Cash generated from continuing operations during the ninesix months ended SeptemberJune 30, 20162017 was US$ 42.656.8 million compared to US$ 79.117.5 million for the ninesix months ended SeptemberJune 30, 2015.2016. The decreaseincrease compared to the prior period reflects higher paymentsa significant decrease in 2016cash paid for cash interest and Guarantee Fees because last year we paid accrued interest related to the 2017 PIK Notes and 2017 Term Loan when they were refinanced in April 2016 and we also repaid US$ 20.0 million of accrued Guarantee Fees in the first half of 2016 which more than offset increases in operating cash flows due to better OIBDA performance. In the nine months ended September 30, 2016, we made US$ 27.5 million of payments for accrued Guarantee Fees for which wewere previously made an election to paypaid in kind. The increase also reflects higher cash collections from revenue growth and lower spending on programming, which are partly offset by higher cash paid for taxes in 2017. We paid cash interest (including mandatory cash-pay Guarantee Fees) of US$ 40.921.2 million during the ninesix months ended SeptemberJune 30, 20162017 compared to US$ 10.735.7 million during the ninesix months ended SeptemberJune 30, 2015.2016.
Investing Activities
Our net cash used in continuing investing activities of US$ 19.714.6 million and US$ 26.211.3 million for the ninesix months ended SeptemberJune 30, 20162017 and 2015,2016, respectively, related to capital expenditures.
expenditures for property, plant and equipment.
Financing Activities
Cash used inprovided by continuing financing activities during the ninesix months ended SeptemberJune 30, 2016 was2017 of US$ 23.41.9 million compared to US$ 27.7 million during primarily reflected proceeds from a sale-leaseback transaction entered into in Romania and proceeds from the nine months ended September 30, 2015.exercise of stock warrants , partly offset by payments made under capital lease agreements. The amount of net cash used in continuing financing activities inof US$ 24.0 million during the ninesix months ended SeptemberJune 30, 2016 primarily reflected the refinancing of the 2017 PIK Notes and the 2017 Term Loan, withpartly offset by proceeds from the proceedsexercise of the 2021 Euro Term Loan and cash on hand. The net cash used in financing activities in the nine months ended September 30, 2015 primarily reflected the repayment of amounts drawn on the 2021 Revolving Credit Facility, including accrued interest which we had elected to pay in kind by adding it to the then-outstanding principal amount.stock warrants.
Discontinued Operations
The net cash provided by discontinued operations during the ninesix months ended SeptemberJune 30, 2017 and 2016 wasof US$ 1.0 million and US$ 0.7 million, compared US$ 4.0 million during the nine months ended September 30, 2015. The net cash provided by discontinued operations for the nine months ended September 30, 2016respectively, is due to the receipt of deferred proceeds from the divestiture of businesses in the prior year.periods.
IV (b) Sources and Uses of Cash
Our ongoing source of cash is primarily the receipt of payments from advertisers, advertising agencies and distributors of our television channels. We also have available the 2021 Revolving Credit Facility (see Item 1, Note 4, "Long-term Debt and Other Financing Arrangements"). As at SeptemberJune 30, 2016,2017, the undrawn aggregate principal amount available under the 2021 Revolving Credit Facility was US$ 115.0 million.million and was undrawn. The available amount decreases to US$ 50.0 million with effect from January 1, 2018 or, if earlier, upon the repayment of the 2018 Euro Term Loan with the expected proceeds from the Divestment Transaction. Surplus cash, after funding ongoing operations, may be remitted to us, where appropriate, by our subsidiaries in the form of debt interest payments and capital repayments, dividends, and other distributions and loans from our subsidiaries.
Corporate law in the Central and Eastern European countries in which we operate stipulates generally that dividends may be declared by the partners or shareholders out of yearly profits subject to the maintenance of registered capital, required reserves and after the recovery of accumulated losses. The reserve requirement restriction generally provides that before dividends may be distributed, a portion of annual net profits (typically 5.0%) be allocated to a reserve, which is capped at a proportion of the registered capital of a company (ranging from 5.0% to 25.0%20.0%). The restricted net assetsThere are no third-party restrictions that limit our subsidiaries' ability to transfer amounts to us in the form of our consolidated subsidiaries and equity in earnings of investments accounted for under the equity method together are less than 25.0% of consolidated net assets.loans or advances.
IV (c) Contractual Obligations, Commitments and Off-Balance Sheet Arrangements
Our future contractual obligations as at SeptemberJune 30, 20162017 arewere as follows:
| | | | Payments due by period (US$ 000’s) | Payments due by period (US$ 000’s) |
| | Total |
| | Less than 1 year |
| | 1-3 years |
| | 3-5 years |
| | More than 5 years |
| Total |
| | Less than 1 year |
| | 1-3 years |
| | 3-5 years |
| | More than 5 years |
|
| Long-term debt – principal | $ | 1,065,804 |
| | $ | — |
| | $ | 279,918 |
| | $ | 785,886 |
| | $ | — |
| $ | 1,089,773 |
| | $ | — |
| | $ | 554,778 |
| | $ | 534,995 |
| | $ | — |
|
| Long-term debt – interest | 440,307 |
| | 37,209 |
| | 124,379 |
| | 278,719 |
| | — |
| 294,937 |
| | 56,665 |
| | 140,647 |
| | 97,625 |
| | — |
|
| Unconditional purchase obligations | 140,743 |
| | 45,829 |
| | 72,347 |
| | 21,325 |
| | 1,242 |
| 130,943 |
| | 58,749 |
| | 52,532 |
| | 17,007 |
| | 2,655 |
|
| Operating leases | 9,267 |
| | 3,165 |
| | 3,601 |
| | 981 |
| | 1,520 |
| 8,618 |
| | 3,398 |
| | 2,634 |
| | 983 |
| | 1,603 |
|
| Capital lease obligations | 3,592 |
| | 1,320 |
| | 1,925 |
| | 347 |
| | — |
| 7,660 |
| | 2,470 |
| | 3,908 |
| | 1,282 |
| | — |
|
| Other long-term obligations | 41,341 |
| | 21,397 |
| | 9,466 |
| | 10,384 |
| | 94 |
| 34,245 |
| | 15,784 |
| | 15,129 |
| | 3,146 |
| | 186 |
|
| Total contractual obligations | $ | 1,701,054 |
| | $ | 108,920 |
| | $ | 491,636 |
| | $ | 1,097,642 |
| | $ | 2,856 |
| $ | 1,566,176 |
| | $ | 137,066 |
| | $ | 769,628 |
| | $ | 655,038 |
| | $ | 4,444 |
|
Long-Term Debt
For more information on our long-term debt, see Item 1, Note 4, "Long-term Debt and Other Financing Arrangements". Interest payable on our long-term debt is calculated using exchange rates and interest rates in effect as at SeptemberJune 30, 20162017. For the purposes of the above table, it is assumed that the Guarantee Fees will be paid in kind at each interest payment date through the maturity dates of the respective Euro Term Loan. However, we intend to allocate excess cash towards paying the Guarantee Fee related to the 2018 Euro Term Loan in cash rather than electing to pay any portion in kind.
Unconditional Purchase Obligations
Unconditional purchase obligations primarily comprise future programming commitments. At SeptemberJune 30, 2016,2017, we had commitments in respect of future programming of US$ 139.8$129.2 million. This includes contracts signed with license periods starting after SeptemberJune 30, 2016.2017.
Operating Leases
For more information on our operating lease commitments see Item 1, Note 19, "Commitments and Contingencies".
Other Long-Term Obligations
Other long-term obligations are primarily comprised of digital transmission commitments.
Other
Top Tone Holdings has exercised its right to acquire additional equity in CME Bulgaria. However, the closing of this transaction has not yet occurred because the purchaser financing is still pending. If consummated, we would own 90.0% of our Bulgaria broadcast operations. The option strike price is the fair value of the equity in CME Bulgaria, as determined by an independent valuation.
IV (d) Cash Outlook
Because cash flows from operating activities were negative infrom 2012 2013 andto 2014, we relied on equity and debt financings to ensure adequate funding for our operations. While cash flows from operating activities were positive in 2015 and are anticipated to be positive in 2016, our average cost of borrowing was high and our election to pay certain interest on the 2017 PIK Notes and the 2017 Term Loan and Guarantee Fees in kind increased our leverage. In response, we have sought other capital resources to fund our operations, our debt serviceOur financing transactions in 2016 and other obligations, including the refinancing transaction below.
On April 7, 2016, we drew on the EUR 468.8 million (approximately US$ 534.0 million as at the transaction date) 2021 Euro Term Loan, the proceeds of which, together with cash on hand, were applied toward the repayment of the 2017 Term Loan plus accrued interest and the redemption and discharge of the 2017 PIK Notes plus accrued interest thereon. We also extended the maturity date of the 2018 Euro Term Loan by one year to November 1, 2018. In addition, we amended the interest rate applicable to amounts drawn on the 2021 Revolving Credit Facility such that interest is determined on the basis of our net leverage ratio (as defined in the Reimbursement Agreement) and ranges from 10.0% (if our net leverage ratio is greater than or equal to seven times) to 7.0% per annum (if our net leverage ratio is less than five times); and extended the maturity date of the 2021 Revolving Credit Facility to February 19, 2021, with a borrowing capacity of US$ 50.0 million with effect from January 1, 2018. Following these transactions, our nearest debt maturity is November 1, 2018 andsignificantly lowered our cost of borrowing has decreased.borrowing.
WeFollowing the repricing transaction in March 2017, we are continuingnow required to take actionspay a portion of the Guarantee Fees related to conserve cash, including targeted reductions to our operating cost base through cost optimization programs, withall of the intention of allocating any excess cash, including in respect of common stock warrant exercises, towards substantially repaying the 2018 Euro Term Loan when it maturesLoans in November 2018. In this respect,cash. However, the total amount of cash paid for interest and Guarantee Fees will decrease significantly in the nine months ended September 30, 2016 we paid US$ 27.5 million of previously accrued Guarantee Fees. We plan to pay the Guarantee Fee related2017 due to the 2018 Euro Term Loanlower all-in rate following this repricing transaction and non-repeating payments that were made in 2016 when we elected to repay in cash when it is due in November 2016. Further, we intend to make all future payments of theaccrued Guarantee Fees related to the 2018 Euro Term Loan that were previously paid in kind as well as when we paid accrued interest on the 2017 PIK Notes and 2017 Term Loan when they were refinanced.
As at June 30, 2017, we have repaid in cash all previously accrued Guarantee Fees related to the 2018 Euro Term Loan and intend to continue to make payments of such Guarantee Fees in cash when due, rather than electing to pay in kind. However, we expect improvements in unlevered free cash flow to exceed the amount of these payments, and therefore expect free cash flow to increase in 2017 compared to 2016.
As at June 30, 2017, we have US$ 95.4 million in cash and cash equivalents. In August 2017, we expect to repay approximately EUR 50.0 million (approximately US$ 57.1 million at June 30, 2017 rates) of the outstanding principal balance of the 2018 Euro Term Loan with cash on hand. Following this repayment, we anticipate using excess cash, including free cash flow from the business, expected proceeds from the Divestment Transaction and warrant exercises, to repay the remainder of the 2018 Euro Term Loan in full before it matures in November 2018. Following the repayment in full of the 2018 Euro Term Loan, we expect to apply any excess cash towards repaying a portion of the principal and related Guarantee Fees and Commitments Fee outstanding on the 2019 Euro Term Loan. We believe we have adequate cash resources to continue operating as a going concern.
Credit ratings and future debt issuances
Our corporate credit is rated B2 by Moody's Investors Service with a positive outlook and B+ by Standard & Poor's both(currently on CreditWatch with stable outlook.developing implications due to the announced Divestment Transaction). Ratings agencies have indicated that retention of these ratings is dependent on maintaining an adequate liquidity profile. Ifprofile, leverage ratios and cash flow profile as well as track record of strong financial support from Time Warner. Among other parameters, if we fail to meet thisadequate liquidity, parameter, it is likely that the rating agencies will downgrade us. The availability of additional liquidity is dependent upon our continued operating performance, improved financial performance and credit ratings. We are currently able to raise only a limited amount of additional debt (other than refinancing indebtedness) or under the agreements foragreement governing the 2021 Revolving Credit Facility and the Reimbursement Agreement.
Credit risk of financial counterparties
We have entered into a number of significant contracts with financial counterparties as follows:
Interest Rate Swaps
We are party to interest rate swap agreements to mitigate our exposure to interest rate fluctuations on our Euro Term Loans. These interest rate swaps, designated as cash flow hedges, provide the Company with variable-rate cash receipts in exchange for fixed-rate payments over the lives of the agreements, with no exchange of the underlying notional amount.
Foreign Exchange Forwards
We are exposed to movements in the USD to EUR exchange rates related to contractual payments under dollar-denominated agreements. To reduce this exposure, from time to time we enter into pay-Euro receive-dollar forward foreign exchange contracts. As at SeptemberJune 30, 2016, we had outstanding three2017, one forward foreign exchange contractscontract with an aggregate notional amountsamount of approximately US$ 28.3$11.3 million related to contractual operating payments.payments was outstanding.
Cash Deposits
We deposit cash in the global money markets with a range of bank counterparties and review the counterparties we choose weekly. The maximum period of deposit is three months but we have more recently held amounts on deposit for shorter periods, from overnight to one month. The credit rating of a bank is a critical factor in determining the size of cash deposits and we will only deposit cash with banks of an investment rating of A or A3 or higher. In addition we also closely monitor the credit default swap spreads and other market information for each of the banks with which we consider depositing or have deposited funds.
IV (e) Off-Balance Sheet Arrangements
None.
V. Critical Accounting Policies and Estimates
Our accounting policies that have a material effect on our financial condition and results of operations are more fully described in Part II, Item 8 of our Annual Report on Form 10-K for the year ended December 31, 20152016 filed with the Securities and Exchange Commission ("SEC") on February 22, 2016.9, 2017. The preparation of these financial statements requires us to make judgments in selecting appropriate assumptions for calculating financial estimates, which inherently contain some degree of uncertainty. We base our estimates on historical experience and on various other assumptions that we believe to be reasonable. Using these estimates we make judgments about the carrying values of assets and liabilities and the reported amounts of revenues and expenses that are not readily apparent from other sources. Actual results may differ from these estimates under different assumptions or conditions.
We believe our critical accounting policies are as follows: program rights, goodwill and intangible assets, impairment or disposal of long-lived assets, revenue recognition, income taxes, foreign exchange, determination of the fair value of financial instruments, contingencies and discontinued operations. These critical accounting policies affect our more significant judgments and estimates used in the preparation of our condensed consolidated financial statements. See Item 1, Note 2, "Basis of Presentation" for a discussion of accounting standards adopted in the period, and recently issued accounting standards not yet adopted.
Item 3. Quantitative and Qualitative Disclosures about Market Risk
We engage in activities that expose us to various market risks, including the effect of changes in foreign currency exchange rates and interest rates. We do not engage in speculative transactions, nor do we hold or issue financial instruments for trading purposes. The table below sets forth our market risk sensitive instruments as at the following dates:
SeptemberJune 30, 2016:2017:
| | | Expected Maturity Dates | | 2016 |
| | 2017 |
| | 2018 | | 2019 |
| | 2020 |
| | Thereafter | | 2017 |
| | 2018 | | 2019 |
| | 2020 |
| | 2021 |
| | Thereafter |
| Long-term Debt (000's): | | | | | | | | | | | | | | | | | | | | | | | | |
Variable rate (EUR) | | — |
| | — |
| | 250,800 |
| | 235,335 |
| | — |
| | 468,800 |
| | — |
| | 250,800 |
| | 235,335 |
| | — |
| | 468,800 |
| | — |
|
Average interest rate (1) | | — |
| | — |
| | 1.50 | % | | 1.50 | % | | — |
| | 1.50 | % | | — |
| | 1.50 | % | | 1.50 | % | | — |
| | 1.50 | % | | — |
|
| | | | | | | | | | | | | | | | | | | | | | | | | |
| Interest Rate Swaps (000's): | | | | | | | | | | | | | | | | | | | | | | | | |
| Variable to fixed (EUR) | | — |
| | 250,800 |
| | 250,800 |
| (2) | | 235,335 |
| | — |
| | 468,800 |
| | 250,800 |
| | 250,800 |
| (2) | | 235,335 |
| | — |
| | 468,800 |
| | — |
|
| Average pay rate | | — |
| | 0.21 | % | | 0.14 | % | | 0.31 | % | | — |
| | 0.28 | % | | 0.21 | % | | 0.14 | % | | 0.31 | % | | — |
| | 0.28 | % | | — |
|
| Average receive rate | | — |
| | — | % | | — | % | | — | % | | — |
| | — | % | | — | % | | — | % | | — | % | | — |
| | — | % | | — |
|
| |
(1) | As discussed in Item 1, Note 4, "Long-term Debt and Other Financing Arrangements", as consideration for Time Warner's guarantee of the Euro Term Loans, we pay Guarantee Fees to Time Warner based on the amounts outstanding on the Euro Term Loans, each calculated such that the all-in borrowing rate on each of the 2018 Euro Term Loan and the 2019 Euro Term LoanLoans is 8.5% per annum and the all-in borrowing rate on the 2021 Euro Term Loan is 10.0%currently 7.25% per annum. |
| |
(2) | The interest rate swaps maturing in 2018 are forward starting to coincide with the maturity date of the interest rate swaps maturing in 2017. See Item 1, Note 11, "Financial Instruments and Fair Value Measurements". |
December 31, 2015:2016:
| | | Expected Maturity Dates | | 2016 |
| | 2017 |
| | 2018 |
| | 2019 |
| | 2020 |
| | Thereafter |
| | 2017 |
| | 2018 | | 2019 |
| | 2020 |
| | 2021 |
| | Thereafter |
|
| Long-term Debt (000's): | | | | | | | | | | | | | | | | | | | | | | | | |
Variable rate (EUR) 1 | | — |
| | 250,800 |
| | — |
| | 235,335 |
| | — |
| | — |
| |
| Average interest rate | | — |
| | 1.50 | % | | — |
| | 1.50 | % | | — |
| | — |
| |
| Fixed rate (US$) | | — |
| | 540,698 |
| | — |
| | — |
| | — |
| | — |
| |
| Average interest rate | | — |
| | 15.00 | % | | — |
| | — |
| | — |
| | — |
| |
| Variable rate (EUR) | | | — |
| | 250,800 |
| | 235,335 |
| | — |
| | 468,800 |
| | — |
|
Average interest rate (1) | | | — |
| | 1.50 | % | | 1.50 | % | | — |
| | 1.50 | % | | — |
|
| | | | | | | | | | | | | | | | | | | | | | | | | |
| Interest Rate Swaps (000's): | | | | | | | | | | | | | | | | | | | | | | | | |
| Variable to fixed (EUR) | | — |
| | 250,800 |
| | — |
| | 235,335 |
| | — |
| | — |
| | 250,800 |
| | 250,800 |
| (2) | | 235,335 |
| | — |
| | 468,800 |
| | — |
|
| Average pay rate | | — |
| | 0.21 | % | | — |
| | 0.31 | % | | — |
| | — |
| | 0.21 | % | | 0.14 | % | | 0.31 | % | | — |
| | 0.28 | % | | — |
|
| Average receive rate | | — |
| | — | % | | — |
| | — | % | | — |
| | — |
| | — | % | | — | % | | — | % | | — |
| | — | % | | — |
|
| |
(1) | As discussed in Item 1, Note 4, "Long-term Debt and Other Financing Arrangements", as consideration for Time Warner's guarantee of the Euro Term Loans, weWe pay Guarantee Fees to Time Warner based on the amounts outstanding on the Euro Term Loans, each calculated such that the all-in borrowing rate on each the 2018 Euro Term Loan and the 2019 Euro Term Loan each calculated such thatwas 8.5% per annum and the all-in borrowing rate on each is 8.5%the 2021 Euro Term Loan was 9.0% per annum. |
| |
(2) | The interest rate swaps maturing in 2018 are forward starting to coincide with the maturity date of the interest rate swaps maturing in 2017. See Item 1, Note 11, "Financial Instruments and Fair Value Measurements". |
Foreign Currency Exchange Risk Management
We conduct business in a number of currencies other than our functional currencies. As a result, we are subject to foreign currency exchange rate risk due to the effects that foreign exchange rate movements of these currencies have on our costs and on the cash flows we receive from our subsidiaries. In limited instances, including the transactions noted below, we enter into forward foreign exchange contracts to minimize foreign currency exchange rate risk.
On December 3, 2015, we entered into two forward foreign exchange contracts to reduce our exposure to movements in the USD to EUR exchange rates related to contractual payments under dollar-denominated agreements to be made during 2016. At September 30, 2016, forward foreign exchange contracts with aggregate notional amount of approximately US$ $10.6 million were outstanding.
On February 11, 2016, we enteredWe periodically enter into forward foreign exchange contracts to reduce our exposure to movements in the USD to EUR exchange rates related to contractual payments under dollar-denominated agreements to be made during 2016.agreements. At SeptemberJune 30, 2016,2017, one forward foreign exchange contractscontract with an aggregate notional amount of approximately US$ 17.7$11.3 million werewas outstanding.
On February 17, 2016,July 21, 2017, we entered into five USD to EURa forward foreign exchange contractscontract with an aggregate notional amount of approximately US$ 557.0 million, to reduce our exposure to USD to EUR exchange rate fluctuations in connection with the refinancing of the dollar-denominated 2017 PIK Notes and 2017 Term Loan with the 2021 Euro Term Loan. The forwards were settled on April 7, 2016.26.9 million.
Interest Rate Risk Management
The Euro Term Loans each bear interest at a variable rate based on EURIBOR plus an applicable margin. We are party to a number of interest rate swap agreements intended to reduce our exposure to interest rate movements (see Item 1, Note 11, "Financial Instruments and Fair Value Measurements").
Item 4. Controls and Procedures
We have established disclosure controls and procedures designed to ensure that information required to be disclosed in our Quarterly Report on Form 10-Q is recorded, processed, summarized and reported within the specified time periods and is designed to ensure that information required to be disclosed is accumulated and communicated to management, including the co-Principal Executive Officers and the Principal Financial Officer, to allow timely decisions regarding required disclosure.
Our co-Principal Executive Officers and our Principal Financial Officer evaluated the effectiveness of the design and operation of our disclosure controls and procedures as of SeptemberJune 30, 20162017 and concluded that our disclosure controls and procedures were effective as of that date. There has been no change in our internal control over financial reporting during the three months ended SeptemberJune 30, 20162017 that has materially affected, or is reasonably likely to materially affect, our internal control over financial reporting.
PART II. OTHER INFORMATION
Item 1. Legal Proceedings
General
We are from time to time party to legal proceedings, arbitrations and regulatory proceedings arising in the normal course of our business operations.operations, including the proceeding described below. We evaluate, on a quarterly basis, developments in such matters and provide accruals for such matters, as appropriate. In making such decisions, we consider the degree of probability of an unfavorable outcome and our ability to make a reasonable estimate of the amount of a loss. An unfavorable outcome in any such proceedings, if material, could have an adverse effect on our business or consolidated financial statements.
In the fourth quarter of 2016, our Slovak subsidiary MARKIZA-SLOVAKIA, spol. s.r.o. (“Markiza”) was notified of claims that were filed in June 2016 in a court of first instance in Bratislava, the Slovak Republic to collect amounts allegedly owing under four promissory notes. These four promissory notes were purportedly issued in June 2000 by Pavol Rusko in his personal capacity and were purportedly guaranteed by Markiza under the signature of Mr. Rusko, who was an executive director of Markiza at that time as well as one of its shareholders. The notes purport to be issued in favor of Marian Kocner, a controversial Slovak businessman, and to a former associate of Mr. Kocner, and were supposedly assigned several times, ultimately to Sprava a inkaso zmeniek, s.r.o., a company owned by Mr. Kocner that is the plaintiff in these proceedings. The four notes purport to be in the aggregate amount of approximately EUR 69 million. A court of first instance in Bratislava has suspended proceedings in respect of one of the promissory notes (in the amount of approximately EUR 26 million) because the plaintiff failed to pay court fees. Two of the remaining notes allegedly matured in 2015 and the third in 2016. Despite a random case assignment system in the Slovak Republic, the three cases dealing with the other notes were initially assigned to the same judge. We do not believe that any of the promissory notes are authentic and are vigorously defending the claims.
Item 1A. Risk Factors
This report and the following discussion of risk factors contain forward-looking statements as discussed in Part 1,I, Item 2, "Management's Discussion and Analysis of Financial Condition and Results of Operations". Our actual results may differ materially from those anticipated in these forward-looking statements as a result of certain factors, including the risks and uncertainties described below and elsewhere in this report. These risks and uncertainties are not the only ones we may face. Additional risks and uncertainties of which we are not aware, or that we currently deem immaterial, may also become important factors that affect our financial condition, results of operations and cash flows.
Risks Relating to Our Financial Position
Global or regional economic conditions and the credit crisis have adversely affected our financial position and results of operations. We cannot predict if the recovery in our operating countries will continue or how long it may last. A failure to achieve lasting recoveries will continue towould adversely affect our results of operations.
The results of our operations depend heavily on advertising revenue, and demand for advertising is affected by general economic conditions in the region and globally. The economic uncertainty affecting the global financial markets and banking system at the beginning of 2009 following the onset of the global financial crisis in 2009 and the sustained recessionary period that followed had a sustainedprolonged adverse impact on consumer and business spending, access to credit, liquidity, investment spending, asset values and employment rates. These adverse economic conditions had a material negative impact on advertising spending in our markets which negatively impactedand on our advertising revenues in the periods that followed.revenues. Since 2014, our markets have experienced overall growth in real GDP (as adjusted for inflation) and advertising spending; however we cannot predict if the recovery that has begun will continue or how long it will last. Any significant deterioration of general economic conditions in our markets would have an adverse economic impact on our advertising revenues. In addition, although we believe the economiesadvertising spend per capita of the countries in which we operate and advertising intensity (the ratio of total advertisingad spend per capita to nominal GDP per capita) will converge with developed nations,markets in Europe, such convergence may not occur in the time frame we expect, or at all. Moreover,
Recessions or periods of low or negative growth in the occurrencefuture may cause a deterioration of general economic conditions in one or more of our markets, which would have an adverse economic impact on our advertising revenues. Other factors that may affect general economic conditions in our markets include defaults by sovereigns or systemically important companies, austerity programs, natural disasters, acts of terrorism, civil or military conflicts or general political instability and responses to it, such as the impositionany of economic sanctions against Russia,which may also cause a deterioration in general economic conditions that may reduce advertising spending. For example, significant liquidity issues facing the largest private company and advertiser in Croatia, Agrokor d.d., contributed to the decline of the advertising market in Croatia for the quarter and could reduce Croatia’s economic growth for the year as well as television advertising spending in 2017. Furthermore, we may not be able to recover all receivables owed to us from Agrokor, which has entered government administration, in the event it is restructured. Any of these developments would have a significant negative effect on our financial position, results of operations and cash flows.
Concerns regarding the Eurozone and the impact on the region of the outcome of the United Kingdom’s referendum to exit from the European Union (“EU”) may adversely affect our financial position and results of operations.
Continued economic softness in the Eurozone, including a slowdown in the growth of consumer prices, prompted the European Central Bank to embark upon quantitative easing in 2015. Economic events related to the sovereign debt crisis in several EU countries have also highlighted issues relating to the strength of the banking sector in Europe and the Euro. ThoughAlthough the EU has created external funding and stability mechanisms to provide liquidity and financial assistance to Eurozone member states and financial institutions, there can be no assurance that the market disruptions in Europe related to sovereign debt and the banking sector or otherwise, including the increased cost of funding for certain governments and financial institutions, will not continue and there can be no assurance that funding and stability packages utilized previously will be available or, if provided, will be sufficient to stabilize affected economies or institutions.
EconomicOn March 29, 2017, the United Kingdom formally initiated the process to leave the EU, commonly referred to as "Brexit", which is expected to be completed within the next two years. It is expected that economic conditions in the EU will be further impacted by the results of the referendum held in the United Kingdom on June 23, 2016 whereby the United Kingdom electorate voted in favor of the United Kingdom leaving the EU, commonly referred to as “Brexit”.Brexit. While the overall economic impact of Brexit on the EU and the Euro is difficult to estimate at present, decisions to conserve cash and reduce spending by consumers and businesses in the United Kingdom would have a negative impact on economic growth rates in the United Kingdom and, to a lesser extent, in the EU, in particular those countries that are significant exporters to the United Kingdom. There is also significant uncertainty regarding the timing and terms on which the United Kingdom wouldwill leave the EU, and it is expected that a more protracted process to set those terms would have a more prolonged economic impact. In addition, there is concern thatif other countries may seek to leave the EU, following the Brexit decision, increasingthat would increase uncertainty in the region, which may have a further negative impact on investment and economic growth rates. Furthermore, the departure of the United Kingdom from the EU may affect the budgetary contributions and allocations among the EU member states in the medium term, including the countries in which we operate, which are net recipients of EU funding. Economic uncertainty caused by Brexit or other instability in the EU could cause significant volatility in EU markets and reduce economic growth rates in the countries in which we operate, which would negatively impact our business.
Our operating results will be adversely affected if we cannot generate strong advertising sales.
We generate the majority of our revenues from the sale of advertising airtime on our television channels. The reduction in advertising spending in our markets following the onset of the global financial crisis at the beginning of 2009 and the sustained recessionary period that followed had a negative effect on television advertising spending and prices. While we have attempted to combat this fall in prices by implementing new pricing strategies, the success of these strategies has varied from market to market and continues to be challenged by pressure from advertisers and discounting by competitors. In addition to advertising pricing, other factors that may affect our advertising sales include general economic conditions (described above), competition from other broadcasters and operators of other distribution platforms, changes in programming strategy, changes in distribution strategy, our channels’ technical reach, technological developments relating to media and broadcasting, seasonal trends in the advertising market, changing audience preferences and in how and when people view content and the accompanying advertising, increased competition for the leisure time of audiences and shifts in population and other demographics. Our advertising revenues also depend on our ability to maintain audience ratings and to generate GRPs. This requires us to have a distribution strategy that reaches a significant audience as well as maintainingto maintain investments in programming at a sufficient level to continue to attract audiences. Changes in the distribution of our channels, such as our decision not to broadcast incease broadcasting on DTT in the Slovak Republic and Slovenia, may reduce the number of people who can view our channels, which may negatively impact our audience share and GRPs generated. Furthermore, significant or sustained reductions in investments in programming or other operating costs in response to reduced advertising revenues had and, if continued or repeated, may have an adverse impact on our television viewing levels. Reductions in advertising spending in our markets and resistance to price increases and discounting of television advertising prices as well as competition for ratings from broadcasters seeking to attract similar audiences have had and may continue to have an adverse impact on our ability to maintain our advertising sales. A failure to maintain and increase advertising sales could have a material adverse effect on our financial position, results of operations and cash flows.
Fluctuations in exchange rates may continue to adversely affect our results of operations.Our reporting currency is the dollar and CME Ltd.'s functional currency is the Euro. Our consolidated revenues and costs are divided across a range of European currencies. The strengthening of the dollar had a negative impact on reported revenues in 2015 when translated from the functional currencies of our operations. While we expect our revenues will continue to increase in 2016 in our operating currencies, a strong dollar would have a negative impact on our reported revenues. Furthermore, fluctuations in exchange rates may negatively impact programming costs. While local programming is generally purchased in local currencies, a significant portion of our content costs relate to foreign programming purchased pursuant to dollar-denominated agreements. If the dollar appreciates against the functional currencies of our operating segments, the cost of acquiring such content would be adversely affected, which could have a material adverse effect on our results of operations and cash flows.
Our liquidity constraints and debt service obligations may restrict our ability to fund our operations.
We have significant debt service obligations under the Euro Term Loans as well as the 2021 Revolving Credit Facility (when drawn). Furthermore, we are paying Guarantee Fees to Time Warner as consideration for its guarantees of the Euro Term Loans (collectively, the "TW Guarantees"). Although the entire Guarantee Fee in respect of the 2018 Euro Term Loan and the 2019 Euro Term Loan are, and a portion of the Guarantee Fee in respect of each of the 2021 Euro Term LoanLoans can be non-cash pay at our option, accruing such fees will further increase the amounts to be repaid at the maturity of these facilities. Accordingly, the payment of Guarantee Fees in kind will increase our already significant leverage. In addition, if the Divestment Transaction does not close, the warrants are not exercised in full or cash flows from operations do not meet our forecasts, we would not be able to reduce our indebtedness as planned and would continue to bear higher average borrowing costs on our senior debt and pay more interest and Guarantee Fees. As a result of our debt service obligations and covenants contained in the related loan agreements, we are restricted under the Reimbursement Agreement and the 2021 Revolving Credit Facility (when drawn) in the manner in which our business is conducted, including but not limited to our ability to obtain additional debt financing to refinance existing indebtedness or to fund future working capital, capital expenditures, business opportunities or other corporate requirements. We may have a proportionally higher level of debt and debt service obligations than our competitors, which may put us at a competitive disadvantage by limiting our flexibility in planning for, or reacting to, changes in our business, economic conditions andor our industry. For additional information regarding the Reimbursement Agreement and the TW Guarantees, see Part I, Item I,1, Note 4, "Long-term Debt and Other Financing Arrangements".
We may be unable to refinance our existing indebtedness and may not be able to obtain favorable refinancing terms.
We have a substantial amount of indebtedness and we face the risk that we will not be able to renew, repay or refinance our indebtedness when due, or that the terms of any renewal or refinancing will not be on better terms than those of such indebtedness being refinanced.indebtedness. Under the Reimbursement Agreement and the 2021 Revolving Credit Facility (when drawn), we can incur only limited amounts of additional indebtedness, other than indebtedness incurred to refinance existing indebtedness. In addition, pursuant to the Reimbursement Agreement, the all-in rates on each of the 2021 Euro Term Loan and the 2018 Euro Term LoanLoans increase to 13% and 11%a maximum of 10.0% (or 3.5% above the then-current all-in rate, if lower), respectively, on the date that is 180 days following a change of control of CME Ltd. (as defined therein); and pursuant to the 2021 Revolving Credit Facility, all commitments terminate following a change of control (as defined therein) and the interest rate on amounts outstanding increases to 13% on the date that is 180 days following such change of control. We intend to repay the 2018 Euro Term Loan at or prior to maturity with cash flows from operations and the expected proceeds from the Divestment Transaction or if the Divestment Transaction does not close, the expected proceeds from warrant exercises. In the event the Divestment Transaction does not close, the warrants are not exercised in full or cash flows from operations do not meet our forecasts, we would be required to refinance the 2018 Euro Term Loan in whole or in part. Pursuant to the Reimbursement Agreement, all commitments under the 2021 Revolving Credit Facility terminate on the refinancing of any Euro Term Loan. We face the risk that we will not be able to renew, repay or refinance our indebtedness when due, or that the terms of any renewal or refinancing will not be on better terms than those of such indebtedness being refinanced. In the event we are not able to refinance our indebtedness, we might be forced to dispose of assets on disadvantageous terms or reduce or suspend operations, any of which would materially and adversely affect our financial condition, results of operations and cash flows.
We may be subject to changes in tax rates and exposure to additional tax liabilities.
We are subject to taxes in a number of foreign jurisdictions, including in respect of our operations as well as capital transactions undertaken by us. We are subject to regular review and audit by tax authorities, and in the ordinary course of our business there are many transactions and calculations where the ultimate tax determination is uncertain.unknown. Significant judgment is required in determining our provision for taxes. The final determination of our tax liabilities resulting from tax audits, related proceedings or otherwise could be materially different from our tax provisions. Economic and political pressures to increase receipts in various jurisdictions may make taxation and tax rates subject to significant change and the satisfactory resolution of any tax disputes more difficult. The occurrence of any of these events could have a material adverse effect on our financial position, results of operations and cash flows.
A default by us in connection with our obligations under our outstanding indebtedness could result in our inability to continue to conduct our business.
Pursuant to the terms of the agreements governing the Reimbursement Agreement and the 2021 Revolving Credit Facility, we pledged all of the shares of CME NV and of CME BV, which together own substantially all of the interests in our operating subsidiaries, in favor of Time Warner as security for this indebtedness. If we or these subsidiaries were to default under the terms of any of the relevant indentures or agreements, the secured parties under such indentures and agreementsTime Warner would have the ability to sell all or a portion of the assets pledged to themit in order to pay amounts outstanding under such debt instruments. This could result in our inability to conduct our business.
Fluctuations in exchange rates may continue to adversely affect our results of operations.
Our reporting currency is the dollar and CME Ltd.'s functional currency is the Euro. Our consolidated revenues and costs are divided across a range of European currencies. The strengthening of the dollar had a negative impact on reported revenues in 2016 when translated from the functional currencies of our operations. Continued strengthening of the dollar would have a negative impact on our reported revenues. Furthermore, fluctuations in exchange rates may negatively impact programming costs. While local programming is generally purchased in local currencies, a significant portion of our content costs relates to foreign programming purchased pursuant to dollar-denominated agreements. If the dollar appreciates against the functional currencies of our operating segments, the cost of acquiring such content would be adversely affected, which could have a material adverse effect on our results of operations and cash flows.
Our strategies to enhance our carriage fees and diversify our revenues may not be successful.
We are focused on creating additional revenue streams from our broadcast operations as well as increasing revenues generated from broadcast advertising, which is how we generate most of our revenues. Our main efforts with respect to this strategy are on increasing carriage fees from cable, satellite and satelliteIPTV operators for carriage of our channels as well as continuing to seek improvements in advertising pricing. Agreements with operators generally have a term of severalone or more years, at which time agreements must be renewed. There can be no assurance that we will be successful in renewing carriage fee agreements on similar or better terms. During prior negotiations to implement our carriage fees strategy in prior years, some cable and satellite operators suspended the broadcast of our channels, which negatively affected the reach and audience shares of those operations and, as a result, advertising revenues. There is a risk that operators may refuse to carry our channels while carriage fee negotiations are ongoing, which would temporarily reduce the reach of those channels and may result in clients withdrawing advertising from our channels. The occurrence of any of these events may have an adverse impact on our financial position, results of operations and cash flows. If we are ineffective in negotiations with carriers or in achieving further carriage fee increases, our profitability will continue to be dependent primarily on television advertising revenues, which increases the importance placed on our ability to improve advertising pricing and generate advertising revenues. In addition to carriage fees, we are also working to build-out our offerings of advertising video-on-demand products and other opportunities for advertising online. There can be no assurances that our revenue diversification initiatives will ultimately be successful, and if unsuccessful, this may have an adverse impact on our financial position, results of operations and cash flows.
A downgrading of our ratings may adversely affect our ability to raise additional financing.
Moody’s Investors Service rates our corporate credit as B2 with a stablepositive outlook. Standard & Poor’s rates our corporate credit B+ (currently on CreditWatch with a stable outlook. Thesedeveloping implications due to the announced Divestment Transaction). Our ratings reflectshow each agency’sagency's opinion of our financial strength, operating performance and ability to meet our debt obligations as they become due. Credit ratingThese ratings take into account the particular emphasis the ratings agencies viewplace on metrics such as leverage ratio and cash flow, which they use as measurements of a company's liquidity and financial strength. They also reflect an emphasis placed by the key ratios associated with it, such as gross leverage ratio, asratings agencies on a particular priority.track record of strong financial support from Time Warner. We may be subject to downgrades if our operating performance deteriorates or we fail to maintain adequate levels of liquidity. In addition, our ratings may be downgraded if the agencies form a view that material support from Time Warner is not as strong, or the strategic importance of CME Ltd. to Time Warner is not as significant as it has been in the past. In the event our debt or corporate credit ratings are lowered by the rating agencies, it will be more difficult for us to refinance our existing indebtedness or raise new indebtedness that may be permitted under the Reimbursement Agreement and the 2021 Revolving Credit Facility (when drawn) and the Reimbursement Agreement,, and we will have to pay higher interest rates, which would have an adverse effect on our financial position, results of operations and cash flows.
If our goodwill, other intangible assets and long-lived assets become impaired, we may be required to record significant charges to earnings.
We review our long-lived assets for impairment when events or changes in circumstances indicate the carrying amount may not be recoverable. Goodwill and indefinite-lived intangible assets are required to be assessed for impairment at least annually. Factors that may be considered a change in circumstances indicating that the carrying amount of our goodwill, indefinite-lived intangible assets or long-lived assets may not be recoverable include slower growth rates in our markets, reduced expected future cash flows, increased country risk premium as a result of political uncertainty and a decline in stock price and market capitalization. We consider available current information when calculating our impairment charge. If there are indicators of impairment, our long-term cash flow forecasts for our operations deteriorate or discount rates increase, we may be required to recognize additional impairment charges in later periods. See Part I, Item I,1, Note 3, "Goodwill and Intangible Assets" for the carrying amounts of goodwill in each of our reporting units.
Changes to our business could result in future costs or charges.
We periodically adjust our business strategy in response to particular events and circumstances, including economic conditions, industry changes and technological developments. In connection with the implementation of new strategies, we may decide to restructure certain of our operations, businesses or assets in order to optimize our cost structure and capture operating efficiencies. Such events in the future could result in restructuring and other charges and the incurrence of additional costs or may require significant management time to implement. If any such charges are material, they could have an adverse impact on our results of operations and cash flows.
Risks Relating to Our Operations
Content may become more expensive to produce or acquire or we may not be able to develop or acquire content that is attractive to our audiences.
Television programming is one of the most significant components of our operating costs. The ability of our programming to generate advertising revenues depends substantially on our ability to develop, produce or acquire programming that matches audience tastes and attracts high audience shares, which is difficult to predict. The commercial success of a program depends on several tangible and intangible factors, including the impact of competing programs, the availability of alternate forms of entertainment and leisure time activities, our ability to anticipate and adapt to changes in consumer tastes and behavior, and general economic conditions. While we have been successful in reducing content costs compared to prior periods, the cost of acquiring content attractive to our viewers, such as feature films and popular television series and formats, may increase in the future. Our expenditures in respect of locally produced programming may also increase due to competition for talent and other resources, changes in audience tastes in our markets or from the implementation of any new laws and regulations mandating the broadcast of a greater number of locally produced programs. In addition, we typically acquire syndicated programming rights under multi-year commitments before knowing how such programming will perform in our markets. In the event any such programming does not attract adequate audience share, it may be necessary to increase our expenditures by investing in additional programming, subject to the availability of adequate financial resources, as well as to write down the value of any underperforming programming. Any material increase in content costs could have a material adverse effect on our financial condition, results of operations or cash flows.
Our operations are vulnerable to significant changes in viewing habits and technology that could adversely affect us.
The television broadcasting industry is affected by rapid innovations in technology. The implementation of these new technologies and the introduction of non-traditional content distribution systems have increased competition for audiences and advertisers. Platforms such as direct-to-home cable and satellite distribution systems, the Internet, subscription and advertising video-on-demand, user-generated content sites and the availability of content on portable digital devices have changed consumer behavior by increasing the number of entertainment choices available to audiences and the methods for the distribution, storage and consumption of content. This development has fragmented television audiences in more developed markets and could adversely affect our ability to retain audience share and attract advertisers as such technologies penetrate our markets. As we adapt to changing viewing patterns, it may be necessary to expend substantial financial and managerial resources to ensure necessary access to new technologies or distribution systems. Such initiatives may not develop into profitable business models. Furthermore, technologies that enable viewers to choose when, how, where and what content to watch, as well as to fast-forward or skip advertisements, may cause changes in consumer behavior that could have a negative impact on our advertising revenues. In addition, compression techniques and other technological developments allow for an increase in the number of channels that may be broadcast in our markets and expanded programming offerings that may be offered to highly targeted audiences. Reductions in the cost of launching new channels could lower entry barriers and encourage the development of increasingly targeted niche programming on various distribution platforms. This could increase the competitive demand for popular programming, resulting in an increase in content costs as we compete for audiences and advertising revenues. A failure to successfully adapt to changes in our industry as a result of technological advances may have an adverse effect on our financial position, results of operations and cash flows.
Our operating results are dependent on the importance of television as an advertising medium.
We generate most of our revenues from the sale of our advertising airtime on television channels in our markets. Television competes with various other media, such as print, radio, the internet and outdoor advertising, for advertising spending. In all of the countries in which we operate, television constitutes the single largest component of all advertising spending. There can be no assurances that the television advertising market will maintain its current position among advertising media in our markets. Furthermore, there can be no assurances that changes in the regulatory environment or improvements in technology will not favor other advertising media or other television broadcasters. Increases in competition among advertising media arising from the development of new forms of advertising media and distribution could result in a decline in the appeal of television as an advertising medium generally or of our channels specifically. A decline in television advertising spending as a component of total advertising spending in any period or in specific markets would have an adverse effect on our financial position, results of operations and cash flows.
We are subject to legal compliance risks and the risk of legal or regulatory proceedings being initiated against us.
We are required to comply with a wide variety of laws and other regulatory obligations in the jurisdictions in which we operate and compliance by our businesses is subject to scrutiny by regulators and other government authorities in these jurisdictions. Compliance with foreign as well as applicable U.S. laws and regulations related to our businesses, such as broadcasting content and advertising regulations, competition regulations, tax laws, employment laws, data protection requirements, and anti-corruption laws, increases the costs and risks of doing business in these jurisdictions. We believe we have implemented appropriate risk management and compliance policies and procedures that are designed to ensure our employees, contractors and agents comply with these laws and regulations; however, a violation of such laws and regulations or the Company’s policies and procedures could occur. In addition, aA failure or alleged failure to comply with applicable laws and regulations, whether inadvertent or otherwise, may result in legal or regulatory proceedings. proceedings being initiated against us.
We have become aware of provisions in the tax regulations of one of our markets that shift the liability for taxes on gains resulting from certain capital transactions from the seller to the buyer. This provision may have been applicable to an acquisition made by us, although we do not believe we have any liability connected to this transaction. In addition, the prosecuting authorities in Romania have requested information in respect of an investigation into certain transactions entered into by Pro TV in 2014 primarily with certain related parties. We believe that the transactions under review are fully supported and are cooperating with the authorities in responding to the information request. However,In Slovenia, the competition authorities have launched an investigation into whether our Slovenian subsidiary is dominant and abused its dominant position when concluding carriage fee agreements with platform operators in connection with its decision to cease broadcasting on DTT there. The investigation is in an early stage and there has been no determination that a breach of competition law has occurred. If these or other contingencies may result in legal or regulatory proceedings being initiated against us. Any such legal and regulatory proceedingsus, or if developments occur in respect of our compliance with existing laws or regulations, or there are changes in the interpretation or application of existingsuch laws or regulations, we may require us to incur substantial costs, cause usbe required to change our business practices damage(including on what terms and conditions we offer our channels under carriage agreements), our reputation may be damaged or expose uswe may be exposed to unanticipated civil or criminal liability, including fines and other penalties that may be substantial. This could have a material adverse effect on our business, financial position, results of operations and cash flows.
Piracy of our content may decrease revenues we can earn from our content and adversely impact our business and profitability.
Piracy of our content poses significant challenges in our markets. Technological developments, including digital copying, file compressing, the use of international proxies and the growing penetration of high bandwidth internet connections, have made it easier to create, transmit and distribute high quality unauthorized copies of content in unprotected digital formats. Furthermore, there are a growing number of video streaming sites, increasing the risk of online transmission of our content without consent. The proliferation of such sites broadcasting content pirated from us could result in a reduction of revenues that we receive from the legitimate distribution of our content, including through video-on-demand and other services. Protection of our intellectual property is in large part dependent on the manner in which applicable intellectual property laws in the countries in which we operate are construed and enforced. We seek to limit the threat of content piracy. However, detecting and policing the unauthorized use of our intellectual property is often difficult and remedies may be limited under applicable law. Steps we take may not prevent the infringement by third parties. There can be no assurance that our efforts to enforce our rights and protect our intellectual property will be successful in preventing piracy, which limits our ability to generate revenues from our content.
Our operations are in developing markets where there are additional risks related to political and economic uncertainty, biased treatment and compliance with evolving legal and regulatory systems.
Our revenue-generating operations are located in Central and Eastern Europe and we may be significantly affected by risks that may be different to those posed by investments in more developed markets. These risks include, but are not limited to, social and political instability, inconsistent regulatory or judicial practice, and increased taxes and other costs. The economic and political systems, legal and tax regimes, regulatory practices, standards of corporate governance and business practices of countries in this region continue to develop. Policies and practices may be subject to significant adjustments, including following changes in political leadership. This may result in social or political instability or disruptions and the potential for political influence on the media as well as inconsistent application of tax and legal regulations, arbitrary treatment before regulatory or judicial authorities and other general business risks. Other potential risks inherent in markets with evolving economic and political environments include exchange controls, higher taxes, tariffs and other levies as well as longer payment cycles. The relative level of development of our markets and the influence of local politics also present a potential for biased treatment of us before regulators or courts in the event of disputes. If such a dispute occurs, those regulators or courts might favor local interests over our interests. Ultimately, this could have a material adverse impact on our business, financial position, results of operations and cash flows.
We may not be aware of all related party transactions, which may involve risks of conflicts of interest and result in transactions being concluded on less favorable terms than could be obtained in arm’s-length transactions.
In our markets, the officers, general directors, other members of management or employees of our operating companies may have other business interests, including interests in television and other media-related companies. We may not be aware of all business interests or relationships that exist with respect to entities with which our operating companies enter into transactions. Transactions with related parties, whether or not we are aware of any such relationships between our employees and third parties, may present conflicts of interest and may result in the conclusion of transactions on terms that are not arm’s-length. It is likely that we and our subsidiaries will continue to enter into related party transactions in the future. In the event there are transactions with persons who subsequently are determined to be related parties or affiliates, we may be required to make additional disclosure and, if such contracts are material, may not be in compliance with certain covenants under the 2021 Revolving Credit Facility (when drawn) or the Reimbursement Agreement. Any related party transaction that is entered into on terms that are not arm’s-length may result in a negative impact on our financial position, results of operations and cash flows.
We rely on network and information systems and other technology that may be subject to disruption or misuse, which could harm our business or our reputation.
We make extensive use of network and information systems and other technologies, including those related to our internal network management as well as our broadcasting operations. These systems are central to many of our business activities. Network and information systems-related events, such as computer hackings, computer viruses, worms or other destructive or disruptive software, process breakdowns, malicious activities or other security breaches could result in a disruption or degradation of our services, the loss of information or the improper disclosure of personal data. The occurrence of any of these events could negatively impact our business by requiring us to expend resources to remedy such a security breach or by harming our reputation. In addition, improper disclosure of personal data could subject us to liability under laws that protect personal data in the countries in which we operate. The development and maintenance of systems to prevent these events from occurring requires ongoing monitoring and updating as efforts to overcome security measures become more sophisticated. As technologies evolve, we will need to expend additional resources to protect our technology and information systems, which could have an adverse impact on our results of operations.
Our broadcasting licenses may not be renewed and may be subject to revocation.
We require broadcasting and, in some cases, other operating licenses as well as other authorizations from national regulatory authorities in our markets in order to conduct our broadcasting business. While our broadcasting licenses for our operations in Slovenia and the Slovak Republic are valid for indefinite time periods, our other broadcasting licenses expire at various times through 2028. While we expect that our material licenses and authorizations will be renewed or extended as required to continue to operate our business, we cannot guarantee that this will occur or that they will not be subject to revocation, particularly in markets where there is relatively greater political risk as a result of less developed political and legal institutions. The failure to comply in all material respects with the terms of broadcasting licenses or other authorizations or with applications filed in respect thereto may result in such licenses or other authorizations not being renewed or otherwise being terminated. Furthermore, no assurances can be given that renewals or extensions of existing licenses will be issued on the same terms as existing licenses or that further restrictions or conditions will not be imposed in the future. Any non-renewal or termination of any other broadcasting or operating licenses or other authorizations or material modification of the terms of any renewed licenses may have a material adverse effect on our financial position, results of operations and cash flows.
Our success depends on attracting and retaining key personnel.
Our success depends partly upon the efforts and abilities of our key personnel and our ability to attract and retain key personnel. Our management teams have significant experience in the media industry and have made important contributions to our growth and success. Although we have been successful in attracting and retaining such people in the past, competition for highly skilled individuals is intense. There can be no assurance that we will continue to be successful in attracting and retaining such individuals in the future. The loss of the services of any of these individuals could have an adverse effect on our businesses, results of operations and cash flows.
Risks Relating to Enforcement Rights
We are a Bermuda company and enforcement of civil liabilities and judgments may be difficult.
We are a Bermuda company. Substantially all of our assets and all of our operations are located, and all of our revenues are derived, outside the United States. In addition, several of our directors and officers are non-residents of the United States, and all or a substantial portion of the assets of such persons are or may be located outside the United States. As a result, investors may be unable to effect service of process within the United States upon such persons, or to enforce against them judgments obtained in the United States courts, including judgments predicated upon the civil liability provisions of the United States federal and state securities laws. There is uncertainty as to whether the courts of Bermuda and the countries in which we operate would enforce (a) judgments of United States courts obtained against us or such persons predicated upon the civil liability provisions of the United States federal and state securities laws or (b) in original actions brought in such countries, liabilities against us or such persons predicated upon the United States federal and state securities laws.
Our Bye-laws restrict shareholders from bringing legal action against our officers and directors.
Our Bye-laws contain a broad waiver by our shareholders of any claim or right of action in Bermuda, both individually and on our behalf, against any of our officers or directors. The waiver applies to any action taken or concurred in by an officer or director, or the failure of an officer or director to take any action, in the performance of his or her duties, except with respect to any matter involving any fraud or dishonesty on the part of the officer or director. This waiver limits the right of shareholders to assert claims against our officers and directors unless the act or failure to act involves fraud or dishonesty.
Risks Relating to our Common Stock
Our share price may be adversely affected by sales of unregistered shares or future issuances of our shares.
Time Warner is the largest holder of shares of our Class A common stock, holding 61,407,775 unregistered shares of Class A common stock, one share of Series A preferred stock ("Series A Preferred Share"), 200,000 shares of Series B preferred stock ("Series B Preferred Shares") and warrants to acquire 100,926,996 shares of our Class A common stock (the "TW Warrants"). The share of Series A preferred stockPreferred Shares is convertible into 11,211,449 shares of Class A common stock and the shares of Series B preferred stockPreferred Shares are convertible into shares of Class A common stock at the option of Time Warner (subject to certain exceptions). As of SeptemberJune 30, 2016,2017, the 200,000 shares of Series B preferred stockPreferred Shares were convertible into approximately 104.2107.1 million shares of Class A common stock. The TW Warrants are exercisable for shares of Class A common stock until May 2, 2018 at an exercise price of US$ 1.00 per share. Time Warner has registration rights with respect to all its shares of Class A common stock now held or hereafter acquired. Furthermore, there are additional unregistered shares of our Class A common stock outstanding that we may be obligated to register and shares of Class A common stock underlying other warrants that may enter into trading. For additional information on the Series A preferred stock,Preferred Shares, Series B preferred stockPreferred Shares and TW Warrants, see Part I, Item I, Note 12, "Convertible Redeemable Preferred Shares" and Note 13, "Equity". In October 2016, Time Warner announced it has entered into a definitive merger agreement with AT&T Inc. under which AT&T Inc. will acquire Time Warner. The merger is subject to regulatory approvals, including the U.S. Department of Justice. Following a successful completion of such merger, AT&T Inc. will become the beneficial owner of equity securities currently beneficially owned by Time Warner and the successor to rights related to such securities granted to Time Warner.
We cannot predict what effect, if any, the entry into trading of previously issued unregistered shares of Class A common stock will have on the market price of our shares. We may also issue additional shares of Class A common stock or securities convertible into our equity in the future. If more shares of our Class A common stock (or securities convertible into or exchangeable for shares of our Class A common stock) are issued to Time Warner, the economic interests of current shareholders may be diluted and the price of our shares may be adversely affected.
The interests of Time Warner may conflict with the interests of other investors.
Time Warner is able to exercise voting power in us with respect to 47.3%46.6% of our outstanding shares of Class A common stock. As such, Time Warner is in a position to exercise significant influence over the outcome of corporate actions requiring shareholder approval, such as the election of directors or certain transactions. Following the issuance of the TW Warrants, the aggregate economic interest of Time Warner in us is approximately 75.9% (without giving effect to the accretion of the Series B preferred stockPreferred Shares after SeptemberJune 30, 2016)2017). Furthermore, Time Warner has the right to appoint one less than the number required to constitute a majority of our board of directors, provided that Time Warner continues to own not less than 40% of the voting power of the Company. In addition, we
We are also party to an amended investor rights agreement with Time Warner and the other parties thereto under which, among other things, Time Warner was granted a contractual preemptive right (subject to certain exclusions) with respect to issuances of the Company’s equity securities, which permits it to maintain its pro rata economic interest as well as a right to top any offer that would result in a change of control of the Company. Under Bermuda law, there is no takeover code or similar legislation requiring an acquirer of a certain percentage of our Class A common stock to tender for the remaining publically held shares. In certain circumstances, the interests of Time Warner as our largest shareholder could be in conflict with the interests of minority shareholders.
Furthermore, in addition to being our largest shareholder, Time Warner is our largest secured creditor, as it guarantees 100% of our outstanding senior indebtedness and is the lender under the 2021 Revolving Credit Facility. The 2021 Revolving Credit Facility and the Reimbursement Agreement contain maintenance covenants in respect of interest cover, cash flow cover and total leverage ratios and includesinclude covenants in respect of the incurrence of indebtedness (including refinancing indebtedness), the provision of guarantees, the payment of dividends or making other distributions, acquisitions and disposaldisposals, and granting security. As such, Time Warner may be in a position to determine whether to permit transactions, waive defaults or accelerate such indebtedness or take other steps in its capacity as a secured creditor in a manner that might not be consistent with the interests of the holders of our Class A common stock. Furthermore, in certain circumstances, the interests of Time Warner as our largest shareholder could be in conflict with the interests of minority shareholders.
The price of our Class A common stock is likely to remainhas been volatile.
The market price of shares of our Class A common stock may be influenced by many factors, some of which are beyond our control, including but not limited to those described above under “Risks"Risks Relating to Our Operations”Operations","Risks Relating to Our Financial Position" as well as the following: general economic and business trends, variations in quarterly operating results, license renewals, regulatory developments in our operating countries and the European Union, the condition of the media industry in our operating countries, the volume of trading in shares of our Class A common stock, future issuances of shares of our Class A common stock and investors’ and securities analysts’ perception of us and other companies that investors or securities analysts deem comparable in the television broadcasting industry. In addition, stock markets in general have experienced extreme price and volume fluctuations that have often been unrelated to and disproportionate to the operating performance of broadcasting companies. These broad market and industry factors may materially reduce the market price of shares of our Class A common stock, regardless of our operating performance.
Our business could be negatively impacted as a result of shareholder activism.
On November 18, 2015,January 17, 2017, TCS Capital Management, LLC ("TCS Capital"), a beneficial owner of more than 10%9.8% of our shares, submitted a letterfiled an amendment to the Board of Directors and filed aits Schedule 13D disclosing its ownership interest.opinion that the Company should hire an investment bank to run a process to sell the Company as well as replace current members of the Company's Board of Directors with new directors recommended by TCS Capital. In recent years, shareholder activists, such as TCS Capital, have become involved in numerous public companies. Shareholder activists frequently propose to involve themselves in the governance, strategic direction and operations of the Company. Such proposals may disrupt our business and divert the attention of our management and employees, and any perceived uncertainties as to our future direction resulting from such a situation could result in the loss of potential business opportunities, be exploited by our competitors, cause concern to our current or potential customers, and make it more difficult to attract and retain qualified personnel and business partners, all of which could adversely affect our business. In addition, actions of activist shareholders may cause significant fluctuations in our stock price based on temporary or speculative market perceptions or other factors that do not necessarily reflect the underlying fundamentals and prospects of our business.
Item 6. Exhibits
|
| | |
| Exhibit Number | | Description |
| 10.01 | | Consent, Waiver and Third Amendment as of June 22, 2017 to the Credit Agreement dated as of November 14, 2014, as amended, among Central European Media Enterprises Ltd., as borrower, BNP Paribas, as administrative agent, Time Warner Inc., as guarantor, and the lenders party thereto. |
| | |
| 10.02 | | Consent, Waiver and Second Amendment as of June 22, 2017 to the Credit Agreement dated as of September 30, 2015, as amended, among Central European Media Enterprises Ltd., as borrower, BNP Paribas, as administrative agent, Time Warner Inc., as guarantor, and the lenders party thereto. |
| | |
| 10.03 | | Consent, Waiver and First Amendment as of June 22, 2017 to the Credit Agreement dated as of February 19, 2016 among CME Media Enterprises B.V., as borrower, Central European Media Enterprises Ltd., as guarantor, BNP Paribas, as administrative agent, Time Warner Inc., as guarantor, and the lenders party thereto. |
| | |
| 10.04 | | Second Amendment dated June 22, 2017, to the Amended and Restated Reimbursement Agreement dated as of November 14, 2014 as amended and restated as of February 19, 2016, as amended, among Central European Media Enterprises Ltd., CME Media Enterprises B.V., and Time Warner Inc., as credit guarantor. |
| | |
| 10.05 | | First Amendment dated June 22, 2017, to the Amended and Restated Revolving Loan Facility Credit Agreement dated as of May 2, 2014 as amended and restated as of November 14, 2014, and as further amended and restated as of February 19, 2016, among Central European Media Enterprises Ltd., as borrower, Time Warner Inc. as administrative agent, and the lenders party thereto. |
| | |
| 10.06* | | Framework Agreement dated July 9, 2017 between CME Media Enterprises B.V. and Slovenia Broadband S.à r.l. (incorporated by reference to Exhibit 10.1 to the Company's Current Report in Form 8-K filed on July 10, 2017). |
| | |
| 31.01 | |
|
| | | |
| 31.02 | | |
| | | |
| 31.03 | | |
| | | |
| 32.01 | | |
| | | |
| 101.INS | | XBRL Instance Document |
| | | |
| 101.SCH | | XBRL Taxonomy Schema Document |
| | | |
| 101.CAL | | XBRL Taxonomy Calculation Linkbase Document |
| | | |
| 101.DEF | | XBRL Taxonomy Definition Linkbase Document |
| | | |
| 101.LAB | | XBRL Taxonomy Label Linkbase Document |
| | | |
| 101.PRE | | XBRL Taxonomy Presentation Linkbase Document |
* Previously filed exhibits.
SIGNATURES
Pursuant to the requirements of Section 13 or 15(d) of the Securities Exchange Act of 1934, the Registrant has duly caused this report to be signed on its behalf by the undersigned, thereunto duly authorized.
|
| | |
| | | Central European Media Enterprises Ltd. |
| Date: | OctoberJuly 25, 20162017 | /s/ David Sturgeon David Sturgeon Executive Vice President and Chief Financial Officer Principal Financial Officer and Principal Accounting Officer |
EXHIBIT INDEX
|
| | |
| Exhibit Number | | Description |
| 10.01 | | Consent, Waiver and Third Amendment as of June 22, 2017 to the Credit Agreement dated as of November 14, 2014, as amended, among Central European Media Enterprises Ltd., as borrower, BNP Paribas, as administrative agent, Time Warner Inc., as guarantor, and the lenders party thereto. |
| | |
| 10.02 | | Consent, Waiver and Second Amendment as of June 22, 2017 to the Credit Agreement dated as of September 30, 2015, as amended, among Central European Media Enterprises Ltd., as borrower, BNP Paribas, as administrative agent, Time Warner Inc., as guarantor, and the lenders party thereto. |
| | |
| 10.03 | | Consent, Waiver and First Amendment as of June 22, 2017 to the Credit Agreement dated as of February 19, 2016 among CME Media Enterprises B.V., as borrower, Central European Media Enterprises Ltd., as guarantor, BNP Paribas, as administrative agent, Time Warner Inc., as guarantor, and the lenders party thereto. |
| | |
| 10.04 | | |
| | |
| 10.05 | | First Amendment dated June 22, 2017, to the Amended and Restated Revolving Loan Facility Credit Agreement dated as of May 2, 2014 as amended and restated as of November 14, 2014, and as further amended and restated as of February 19, 2016, among Central European Media Enterprises Ltd., as borrower, Time Warner Inc. as administrative agent, and the lenders party thereto. |
| | |
| 10.06* | | |
| | |
| 31.01 | |
|
| | | |
| 31.02 | | |
| | | |
| 31.03 | | |
| | | |
| 32.01 | | |
| | | |
| 101.INS | | XBRL Instance Document |
| | | |
| 101.SCH | | XBRL Taxonomy Schema Document |
| | | |
| 101.CAL | | XBRL Taxonomy Calculation Linkbase Document |
| | | |
| 101.DEF | | XBRL Taxonomy Definition Linkbase Document |
| | | |
| 101.LAB | | XBRL Taxonomy Label Linkbase Document |
| | | |
| 101.PRE | | XBRL Taxonomy Presentation Linkbase Document |
* Previously filed exhibits.