UNITED STATES
SECURITIES AND EXCHANGE COMMISSION
Washington, D.C. 20549
FORM 10-Q
x☒QUARTERLY REPORT PURSUANT TO SECTION 13 OR 15(d) OF THE SECURITIES EXCHANGE ACT OF 1934
For the quarterly period ended SeptemberJune 30, 20172020
o☐TRANSITION REPORT PURSUANT TO SECTION 13 OR 15(d) OF THE SECURITIES EXCHANGE ACT OF 1934
For the transition period from __________ to __________
Commission File Number: 0-24796
CENTRAL EUROPEAN MEDIA ENTERPRISES LTD.
(Exact name of registrant as specified in its charter)
|
| | | | |
BERMUDABermuda | | | 98-0438382 |
| (State or other jurisdiction of incorporation or organization) | | | (I.R.S. Employer Identification No.) |
| | | | | |
| O'Hara House, | | | |
3 Bermudiana Road, Hamilton, Bermuda | | | HM 08 |
| Hamilton, | Bermuda | | | (Zip Code) |
| (Address of principal executive offices) | | (Zip Code) | |
Registrant's telephone number, including area code: (441)296-1431
Securities registered pursuant to Section 12(b) of the Securities Exchange Act of 1934:
|
| | |
| Title of each class | Trading Symbol(s) | Name of each exchange on which registered |
| Class A Common Stock, par value $0.08 | CETV | Nasdaq Global Select Market |
Indicate by check mark whether registrant: (1) has filed all reports required to be filed by Section 13 or 15 (d) of the Securities Exchange Act of 1934 during the preceding 12 months (or for each shorter period that the registrant was required to file such reports), and (2) has been subject to such filing requirements for the past 90 days. YesT☒ No £☐
Indicate by check mark whether the registrant has submitted electronically and posted on its corporate Web site, if any, every Interactive Data File required to be submitted and posted pursuant to Rule 405 of Regulation S-T during the preceding 12 months (or for such shorter period that the registrant was required to submit and post such files). YesT☒ No £☐
Indicate by check mark whether the registrant is a large accelerated filer, an accelerated filer, a non-accelerated filer or a smaller reporting company. See definition of “accelerated filer”, “large accelerated filer” or “smaller reporting company” in Rule 12b-2 of the Exchange Act.
|
| | | | | |
Large accelerated filer £ Filer | ☐ | | | Accelerated filer TFiler | ☒ |
Non-accelerated filer £Filer | ☐ | | | Smaller reporting company£ | ☐ |
| | | | | Emerging growth company£ | ☐ |
If an emerging growth company, indicate by check mark if the registrant has elected not to use the extended transition period for complying with any new or revised financial accounting standards provided pursuant to Section 13(a) of the Exchange Act. £☐
Indicate by check mark whether the registrant is a shell company (as defined by Rule 12b-2 of the Exchange Act) Yes £☐ No T☒
Indicate the number of shares outstanding of each of the issuer's classes of common stock, as of the latest practicable date.
|
| |
| Class | Outstanding as of October 20, 2017July 17, 2020 |
| Class A Common Stock, par value $0.08 | 144,963,821254,598,523 |
| | |
| | |
CENTRAL EUROPEAN MEDIA ENTERPRISES LTD.
FORM 10-Q
For the quarterly period ended SeptemberQuarterly Period Ended June 30, 20172020
|
| | | |
| | Page |
| Part I Financial Information | |
| | | |
| | | | |
| | | | |
| | | | |
| | | | |
| | | | |
| | | |
| | | |
| | | |
| Part II Other Information | |
| | | |
| | | |
| | | |
| |
PART I. FINANCIAL INFORMATION
Item 1. Financial Statements
CENTRAL EUROPEAN MEDIA ENTERPRISES LTD.
CONDENSED CONSOLIDATED BALANCE SHEETS
(US$ 000’s, except share data)
(Unaudited)
|
| | | | | | | |
| | September 30, 2017 |
| | December 31, 2016 |
|
| ASSETS | | | |
| Current assets | | | |
| Cash and cash equivalents | $ | 67,034 |
| | $ | 40,606 |
|
| Accounts receivable, net (Note 7) | 122,406 |
| | 141,371 |
|
| Program rights, net (Note 6) | 70,510 |
| | 69,662 |
|
| Other current assets (Note 8) | 28,197 |
| | 27,541 |
|
| Current assets held for sale (Note 3) | 135,171 |
| | 61,242 |
|
| Total current assets | 423,318 |
| | 340,422 |
|
| Non-current assets | |
| | |
|
| Property, plant and equipment, net (Note 9) | 100,308 |
| | 89,080 |
|
| Program rights, net (Note 6) | 188,484 |
| | 143,428 |
|
| Goodwill (Note 4) | 693,142 |
| | 601,535 |
|
| Other intangible assets, net (Note 4) | 147,073 |
| | 134,705 |
|
| Other non-current assets (Note 8) | 20,365 |
| | 21,273 |
|
| Non-current assets held for sale (Note 3) | — |
| | 60,274 |
|
| Total non-current assets | 1,149,372 |
| | 1,050,295 |
|
| Total assets | $ | 1,572,690 |
| | $ | 1,390,717 |
|
|
| | | | | | | |
| | June 30, 2020 |
| | December 31, 2019 |
|
| ASSETS | | | |
| Current assets | | | |
| Cash and cash equivalents | $ | 176,094 |
| | $ | 36,621 |
|
| Accounts receivable, net of allowances for credit losses of $8,803 and $8,548 | 131,918 |
| | 188,618 |
|
| Program rights, net (Note 5) | — |
| | 75,909 |
|
| Other current assets (Note 6) | 32,883 |
| | 48,832 |
|
| Total current assets | 340,895 |
| | 349,980 |
|
| Non-current assets | |
| | |
|
| Property, plant and equipment, net (Note 7) | 102,378 |
| | 113,901 |
|
| Program rights, net (Note 5) | 238,096 |
| | 166,237 |
|
| Goodwill (Note 3) | 639,414 |
| | 667,988 |
|
| Other intangible assets, net (Note 3) | 120,838 |
| | 127,589 |
|
| Other non-current assets (Note 6) | 20,921 |
| | 22,167 |
|
| Total non-current assets | 1,121,647 |
| | 1,097,882 |
|
| Total assets | $ | 1,462,542 |
| | $ | 1,447,862 |
|
|
| | | | | | | |
| LIABILITIES AND EQUITY | | | |
| Current liabilities | | | |
| Accounts payable and accrued liabilities (Note 10) | $ | 157,322 |
| | $ | 134,378 |
|
| Current portion of long-term debt and other financing arrangements (Note 5) | 2,425 |
| | 1,228 |
|
| Other current liabilities (Note 11) | 23,535 |
| | 8,467 |
|
| Current liabilities held for sale (Note 3) | 32,246 |
| | 27,492 |
|
| Total current liabilities | 215,528 |
| | 171,565 |
|
| Non-current liabilities | |
| | |
|
| Long-term debt and other financing arrangements (Note 5) | 1,067,153 |
| | 1,001,408 |
|
| Other non-current liabilities (Note 11) | 87,230 |
| | 67,963 |
|
| Non-current liabilities held for sale (Note 3) | — |
| | 1,414 |
|
| Total non-current liabilities | 1,154,383 |
| | 1,070,785 |
|
| Commitments and contingencies (Note 20) |
|
| |
|
|
| TEMPORARY EQUITY | | | |
| 200,000 shares of Series B Convertible Redeemable Preferred Stock of $0.08 each (December 31, 2016 - 200,000) (Note 13) | 262,115 |
| | 254,899 |
|
| EQUITY | |
| | |
| CME Ltd. shareholders’ equity (Note 14): | |
| | |
| One share of Series A Convertible Preferred Stock of $0.08 each (December 31, 2016 – one) | — |
| | — |
|
| 144,881,732 shares of Class A Common Stock of $0.08 each (December 31, 2016 – 143,449,913) | 11,590 |
| | 11,476 |
|
| Nil shares of Class B Common Stock of $0.08 each (December 31, 2016 – nil) | — |
| | — |
|
| Additional paid-in capital | 1,905,449 |
| | 1,910,244 |
|
| Accumulated deficit | (1,776,411 | ) | | (1,785,536 | ) |
| Accumulated other comprehensive loss | (199,906 | ) | | (243,988 | ) |
| Total CME Ltd. shareholders’ deficit | (59,278 | ) | | (107,804 | ) |
| Noncontrolling interests | (58 | ) | | 1,272 |
|
| Total deficit | (59,336 | ) | | (106,532 | ) |
| Total liabilities and equity | $ | 1,572,690 |
| | $ | 1,390,717 |
|
|
| | | | | | | |
| LIABILITIES AND EQUITY | | | |
| Current liabilities | | | |
| Accounts payable and accrued liabilities (Note 8) | $ | 130,913 |
| | $ | 135,650 |
|
| Current portion of long-term debt and other financing arrangements (Note 4) | 6,952 |
| | 6,836 |
|
| Other current liabilities (Note 9) | 29,280 |
| | 13,515 |
|
| Total current liabilities | 167,145 |
| | 156,001 |
|
| Non-current liabilities | |
| | |
|
| Long-term debt and other financing arrangements (Note 4) | 597,124 |
| | 600,273 |
|
| Other non-current liabilities (Note 9) | 80,076 |
| | 80,000 |
|
| Total non-current liabilities | 677,200 |
| | 680,273 |
|
| Commitments and contingencies (Note 19) |
|
| |
|
|
| TEMPORARY EQUITY | | | |
| 200,000 shares of Series B Convertible Redeemable Preferred Stock of $0.08 each (December 31, 2019 - 200,000) (Note 12) | 269,370 |
| | 269,370 |
|
| EQUITY | |
| | |
| CME Ltd. shareholders’ equity (Note 13): | |
| | |
| One share of Series A Convertible Preferred Stock of $0.08 each (December 31, 2019 – one) | — |
| | — |
|
| 254,548,180 shares of Class A Common Stock of $0.08 each (December 31, 2019 – 253,607,026) | 20,364 |
| | 20,288 |
|
| Nil shares of Class B Common Stock of $0.08 each (December 31, 2019 – nil) | — |
| | — |
|
| Additional paid-in capital | 2,008,860 |
| | 2,007,275 |
|
| Accumulated deficit | (1,418,722 | ) | | (1,458,942 | ) |
| Accumulated other comprehensive loss | (262,061 | ) | | (226,916 | ) |
| Total CME Ltd. shareholders’ equity | 348,441 |
| | 341,705 |
|
| Noncontrolling interests | 386 |
| | 513 |
|
| Total equity | 348,827 |
| | 342,218 |
|
| Total liabilities and equity | $ | 1,462,542 |
| | $ | 1,447,862 |
|
The accompanying notes are an integral part of these condensed consolidated financial statements.
CENTRAL EUROPEAN MEDIA ENTERPRISES LTD.
CONDENSED CONSOLIDATED STATEMENTS OF OPERATIONS AND COMPREHENSIVE INCOME / LOSS
(US$ 000’s, except per share data)
(Unaudited)
|
| | | | | | | | | | | | | | | |
| | For the Three Months
Ended September 30, | | For the Nine Months
Ended September 30, |
| | 2017 |
| | 2016 |
| | 2017 |
|
| 2016 |
|
| Net revenues | $ | 119,431 |
| | $ | 107,527 |
| | $ | 378,058 |
| | $ | 356,147 |
|
| Operating expenses: | | | | | | | |
| Content costs | 55,871 |
| | 51,920 |
| | 174,214 |
| | 166,938 |
|
| Other operating costs | 12,612 |
| | 13,482 |
| | 35,747 |
| | 40,773 |
|
| Depreciation of property, plant and equipment | 6,936 |
| | 5,801 |
| | 19,345 |
| | 17,134 |
|
| Amortization of broadcast licenses and other intangibles | 2,187 |
| | 2,073 |
| | 6,349 |
| | 6,247 |
|
| Cost of revenues | 77,606 |
| | 73,276 |
| | 235,655 |
| | 231,092 |
|
| Selling, general and administrative expenses | 25,803 |
| | 22,801 |
| | 70,204 |
| | 64,984 |
|
| Operating income | 16,022 |
| | 11,450 |
| | 72,199 |
| | 60,071 |
|
| Interest expense (Note 15) | (18,352 | ) | | (22,424 | ) | | (54,773 | ) | | (90,640 | ) |
| Loss on extinguishment of debt (Note 5) | (101 | ) | | — |
| | (101 | ) | | (150,158 | ) |
| Other non-operating income, net (Note 16) | 3,643 |
| | 350 |
| | 12,783 |
| | 1,638 |
|
| Income / (loss) before tax | 1,212 |
| | (10,624 | ) | | 30,108 |
| | (179,089 | ) |
| Provision for income taxes | (3,157 | ) | | (1,145 | ) | | (12,770 | ) | | (6,706 | ) |
| (Loss) / income from continuing operations | (1,945 | ) | | (11,769 | ) | | 17,338 |
| | (185,795 | ) |
| Loss from discontinued operations, net of tax (Note 3) | (5,988 | ) | | (8,054 | ) | | (8,747 | ) | | (15,971 | ) |
| Net (loss) / income | (7,933 | ) | | (19,823 | ) | | 8,591 |
| | (201,766 | ) |
| Net loss attributable to noncontrolling interests | 188 |
| | 196 |
| | 534 |
| | 387 |
|
| Net (loss) / income attributable to CME Ltd. | $ | (7,745 | ) | | $ | (19,627 | ) | | $ | 9,125 |
| | $ | (201,379 | ) |
| | | | | | | | |
| Net (loss) / income | $ | (7,933 | ) | | $ | (19,823 | ) | | $ | 8,591 |
| | $ | (201,766 | ) |
| Other comprehensive income | | | | | | | |
| Currency translation adjustment | 9,227 |
| | 7,262 |
| | 42,203 |
| | 15,264 |
|
| (Loss) / gain on derivative instruments (Note 12) | (135 | ) | | (1,360 | ) | | 1,083 |
| | (5,581 | ) |
| Total other comprehensive income | 9,092 |
| | 5,902 |
| | 43,286 |
| | 9,683 |
|
| Comprehensive income / (loss) | 1,159 |
| | (13,921 | ) | | 51,877 |
| | (192,083 | ) |
| Comprehensive loss attributable to noncontrolling interests | 439 |
| | 232 |
| | 1,330 |
| | 568 |
|
| Comprehensive income / (loss) attributable to CME Ltd. | $ | 1,598 |
| | $ | (13,689 | ) | | $ | 53,207 |
| | $ | (191,515 | ) |
|
| | | | | | | | | | | | | | | |
| | For the Three Months Ended June 30, | | For the Six Months Ended June 30, |
| | 2020 |
| | 2019 |
| | 2020 |
|
| 2019 |
|
| Net revenues | $ | 135,545 |
| | $ | 183,599 |
| | $ | 279,361 |
| | $ | 330,158 |
|
| Operating expenses: | | | | | | | |
| Content costs | 43,693 |
| | 70,356 |
| | 108,725 |
| | 140,716 |
|
| Other operating costs | 12,549 |
| | 13,806 |
| | 26,196 |
| | 27,054 |
|
| Depreciation of property, plant and equipment | 7,972 |
| | 8,154 |
| | 15,899 |
| | 16,380 |
|
| Amortization of broadcast licenses and other intangibles | 2,110 |
| | 2,113 |
| | 4,277 |
| | 4,307 |
|
| Cost of revenues | 66,324 |
| | 94,429 |
| | 155,097 |
| | 188,457 |
|
| Selling, general and administrative expenses | 25,047 |
| | 28,708 |
| | 53,893 |
| | 53,602 |
|
| Operating income | 44,174 |
| | 60,462 |
| | 70,371 |
| | 88,099 |
|
| Interest expense (Note 14) | (5,754 | ) | | (7,735 | ) | | (12,349 | ) | | (15,977 | ) |
| Other non-operating income / (expense), net (Note 15) | 328 |
| | 2,237 |
| | (5,808 | ) | | (860 | ) |
| Income before tax | 38,748 |
| | 54,964 |
| | 52,214 |
| | 71,262 |
|
| Provision for income taxes | (7,646 | ) | | (10,886 | ) | | (12,142 | ) | | (15,433 | ) |
| Net income | 31,102 |
| | 44,078 |
| | 40,072 |
| | 55,829 |
|
| Net loss / (income) attributable to noncontrolling interests | 77 |
| | (119 | ) | | 148 |
| | (112 | ) |
| Net income attributable to CME Ltd. | $ | 31,179 |
| | $ | 43,959 |
| | $ | 40,220 |
| | $ | 55,717 |
|
| | | | | | | | |
| Net income | $ | 31,102 |
| | $ | 44,078 |
| | $ | 40,072 |
| | $ | 55,829 |
|
| Other comprehensive income / (loss): | | | | | | | |
| Currency translation adjustment | 25,583 |
| | 17,002 |
| | (35,466 | ) | | 1,159 |
|
| Unrealized gain / (loss) on derivative instruments (Note 13) | 122 |
| | (1,220 | ) | | 342 |
| | (4,551 | ) |
| Total other comprehensive income / (loss) | 25,705 |
| | 15,782 |
| | (35,124 | ) | | (3,392 | ) |
| Comprehensive income | 56,807 |
| | 59,860 |
| | 4,948 |
| | 52,437 |
|
| Comprehensive loss / (income) attributable to noncontrolling interests | 230 |
| | (28 | ) | | 127 |
| | (158 | ) |
| Comprehensive income attributable to CME Ltd. | $ | 57,037 |
| | $ | 59,832 |
| | $ | 5,075 |
| | $ | 52,279 |
|
|
| | | | | | | | | | | | | | | |
| PER SHARE DATA (Note 18): | | | | | | | |
| Net (loss) / income per share: | | | | | | | |
| Continuing operations — basic | $ | (0.03 | ) | | $ | (0.09 | ) | | $ | 0.04 |
| | $ | (1.31 | ) |
| Continuing operations — diluted | (0.03 | ) | | (0.09 | ) | | 0.03 |
| | (1.31 | ) |
| Discontinued operations — basic | (0.04 | ) | | (0.05 | ) | | (0.06 | ) | | (0.11 | ) |
| Discontinued operations — diluted | (0.04 | ) | | (0.05 | ) | | (0.06 | ) | | (0.11 | ) |
| Net loss attributable to CME Ltd. — basic | (0.07 | ) | | (0.14 | ) | | (0.02 | ) | | (1.42 | ) |
| Net loss attributable to CME Ltd. — diluted | (0.07 | ) | | (0.14 | ) | | (0.02 | ) | | (1.42 | ) |
| | | | | | | | |
| Weighted average common shares used in computing per share amounts (000’s): | | | | | | | |
| Basic | 156,189 |
| | 153,494 |
| | 155,579 |
| | 149,898 |
|
| Diluted | 156,189 |
| | 153,494 |
| | 233,761 |
| | 149,898 |
|
|
| | | | | | | | | | | | | | | |
| PER SHARE DATA (Note 17): | | | | | | | |
| Net income per share: | | | | | | | |
| Attributable to CME Ltd. — basic | $ | 0.08 |
| | $ | 0.12 |
| | $ | 0.11 |
| | $ | 0.15 |
|
| Attributable to CME Ltd. — diluted | 0.08 |
| | 0.12 |
| | 0.11 |
| | 0.15 |
|
| | | | | | | | |
| Weighted average common shares used in computing per share amounts (000’s): | | | | | | | |
| Basic | 265,649 |
| | 264,570 |
| | 265,342 |
| | 264,385 |
|
| Diluted | 266,776 |
| | 265,932 |
| | 266,790 |
| | 265,628 |
|
The accompanying notes are an integral part of these condensed consolidated financial statements.
CENTRAL EUROPEAN MEDIA ENTERPRISES LTD.
CONDENSED CONSOLIDATED STATEMENT OF EQUITY
(US$ 000’s, except share data)
(Unaudited)
| | | | CME Ltd. | | |
| | |
| CME Ltd. | | |
| | |
|
| | Series A Convertible Preferred Stock | | Class A Common Stock | | Class B Common Stock | |
| |
| |
| | |
| | |
| Series A Convertible Preferred Stock | | Class A Common Stock | | Class B Common Stock | |
| |
| |
| | |
| | |
|
| | Number of shares | Par value | | Number
of shares | Par value | | Number of shares | Par value | Additional Paid-In Capital |
| Accumulated Deficit |
| Accumulated Other Comprehensive Loss |
| | Noncontrolling Interest |
| | Total Deficit |
| Number of shares | Par value | | Number of shares | Par value | | Number of shares | Par value | Additional Paid-In Capital |
| Accumulated Deficit |
| Accumulated Other Comprehensive Loss |
| | Noncontrolling Interest |
| | Total Equity |
|
BALANCE December 31, 2016 | 1 |
| $ | — |
| | 143,449,913 |
| $ | 11,476 |
| | — |
| $ | — |
| $ | 1,910,244 |
| $ | (1,785,536 | ) | $ | (243,988 | ) | | $ | 1,272 |
| | $ | (106,532 | ) | |
BALANCE
March 31, 2020 | | 1 |
| $ | — |
| | 254,298,255 |
| $ | 20,343 |
| | — |
| $ | — |
| $ | 2,008,151 |
| $ | (1,449,901 | ) | $ | (287,919 | ) | | $ | 616 |
| | $ | 291,290 |
|
| Stock-based compensation | — |
| — |
| | — |
| — |
| | — |
| — |
| 2,140 |
| — |
| — |
| | — |
| | 2,140 |
| — |
| — |
| | — |
| — |
| | — |
| — |
| 733 |
| — |
| — |
| | — |
| | 733 |
|
| Exercise of warrants (Note 14) | — |
| — |
| | 563,325 |
| 45 |
| | — |
| — |
| 518 |
| — |
| — |
| | — |
| | 563 |
| |
| Share issuance, stock-based compensation | — |
| — |
| | 868,494 |
| 69 |
| | — |
| — |
| (69 | ) | — |
| — |
| | — |
| | — |
| — |
| — |
| | 249,925 |
| 21 |
| | — |
| — |
| (21 | ) | — |
| — |
| | — |
| | — |
|
| Withholding tax on net share settlement of stock-based compensation | — |
| — |
| | — |
| — |
| | — |
| — |
| (168 | ) | — |
| — |
| | — |
| | (168 | ) | — |
| — |
| | — |
| — |
| | — |
| — |
| (3 | ) | — |
| — |
| | — |
| | (3 | ) |
| Preferred dividend paid in kind | — |
| — |
| | — |
| — |
| | — |
| — |
| (7,216 | ) | — |
| — |
| | — |
| | (7,216 | ) | |
| Net income / (loss) | — |
| — |
| | — |
| — |
| | — |
| — |
| — |
| 9,125 |
| — |
| | (534 | ) | | 8,591 |
| — |
| — |
| | — |
| — |
| | — |
| — |
| — |
| 31,179 |
| — |
| | (77 | ) | | 31,102 |
|
| Gain on derivative instruments | — |
| — |
| | — |
| — |
| | — |
| — |
| — |
| — |
| 1,083 |
| | — |
| | 1,083 |
| |
| Unrealized gain on derivative instruments | | — |
| — |
| | — |
| — |
| | — |
| — |
| — |
| — |
| 122 |
| | — |
| | 122 |
|
| Currency translation adjustment | — |
| — |
| | — |
| — |
| | — |
| — |
| — |
| — |
| 42,999 |
| | (796 | ) | | 42,203 |
| — |
| — |
| | — |
| — |
| | — |
| — |
| — |
| — |
| 25,736 |
| | (153 | ) | | 25,583 |
|
BALANCE September 30, 2017 | 1 |
| $ | — |
| | 144,881,732 |
| $ | 11,590 |
| | — |
| $ | — |
| $ | 1,905,449 |
| $ | (1,776,411 | ) | $ | (199,906 | ) | | $ | (58 | ) | | $ | (59,336 | ) | |
BALANCE
June 30, 2020 | | 1 |
| $ | — |
| | 254,548,180 |
| $ | 20,364 |
| | — |
| $ | — |
| $ | 2,008,860 |
| $ | (1,418,722 | ) | $ | (262,061 | ) | | $ | 386 |
| | $ | 348,827 |
|
| | | | | | | | | | | | | | |
| | | CME Ltd. | | |
| | |
|
| | | Series A Convertible Preferred Stock | | Class A Common Stock | | Class B Common Stock | |
| |
| |
| | |
| | |
|
| | | Number of shares | Par value | | Number of shares | Par value | | Number of shares | Par value | Additional Paid-In Capital |
| Accumulated Deficit |
| Accumulated Other Comprehensive Loss |
| | Noncontrolling Interest |
| | Total Equity |
|
BALANCE
March 31, 2019 | | 1 |
| $ | — |
| | 253,279,975 |
| $ | 20,262 |
| | — |
| $ | — |
| $ | 2,004,188 |
| $ | (1,566,318 | ) | $ | (235,961 | ) | | $ | 431 |
| | $ | 222,602 |
|
| Stock-based compensation | | — |
| — |
| | — |
| — |
| | — |
| — |
| 1,124 |
| — |
| — |
| | — |
| | 1,124 |
|
| Share issuance, stock-based compensation | | — |
| — |
| | 279,323 |
| 23 |
| | — |
| — |
| (23 | ) | — |
| — |
| | — |
| | — |
|
| Withholding tax on net share settlement of stock-based compensation | | — |
| — |
| | — |
| — |
| | — |
| — |
| (74 | ) | — |
| — |
| | — |
| | (74 | ) |
| Net income | | — |
| — |
| | — |
| — |
| | — |
| — |
| — |
| 43,959 |
| — |
| | 119 |
| | 44,078 |
|
| Unrealized loss on derivative instruments | | — |
| — |
| | — |
| — |
| | — |
| — |
| — |
| — |
| (1,220 | ) | | — |
| | (1,220 | ) |
| Currency translation adjustment | | — |
| — |
| | — |
| — |
| | — |
| — |
| — |
| — |
| 17,093 |
| | (91 | ) | | 17,002 |
|
BALANCE
June 30, 2019 | | 1 |
| $ | — |
| | 253,559,298 |
| $ | 20,285 |
| | — |
| $ | — |
| $ | 2,005,215 |
| $ | (1,522,359 | ) | $ | (220,088 | ) | | $ | 459 |
| | $ | 283,512 |
|
CENTRAL EUROPEAN MEDIA ENTERPRISES LTD.
CONDENSED CONSOLIDATED STATEMENT OF EQUITY
(US$ 000’s, except share data)
(Unaudited)
|
| | | | | | | | | | | | | | | | | | | | | | | | | | | | | | | | | | |
| | CME Ltd. | | |
| | |
|
| | Series A Convertible Preferred Stock | | Class A
Common Stock | | Class B
Common Stock | |
| |
| |
| | |
| | |
|
| | Number of shares | Par value | | Number
of shares | Par value | | Number of shares | Par value | Additional Paid-In Capital |
| Accumulated Deficit |
| Accumulated Other Comprehensive Loss |
| | Noncontrolling Interest |
| | Total Equity |
|
BALANCE December 31, 2019 | 1 |
| $ | — |
| | 253,607,026 |
| $ | 20,288 |
| | — |
| $ | — |
| $ | 2,007,275 |
| $ | (1,458,942 | ) | $ | (226,916 | ) | | $ | 513 |
| | $ | 342,218 |
|
| Stock-based compensation | — |
| — |
| | — |
| — |
| | — |
| — |
| 1,672 |
| — |
| — |
| | — |
| | 1,672 |
|
| Share issuance, stock-based compensation | — |
| — |
| | 941,154 |
| 76 |
| | — |
| — |
| (76 | ) | — |
| — |
| | — |
| | — |
|
| Withholding tax on net share settlement of stock-based compensation | — |
| — |
| | — |
| — |
| | — |
| — |
| (11 | ) | — |
| — |
| | — |
| | (11 | ) |
| Net income / (loss) | — |
| — |
| | — |
| — |
| | — |
| — |
| — |
| 40,220 |
| — |
| | (148 | ) | | 40,072 |
|
| Unrealized gain on derivative instruments | — |
| — |
| | — |
| — |
| | — |
| — |
| — |
| — |
| 342 |
| | — |
| | 342 |
|
| Currency translation adjustment | — |
| — |
| | — |
| — |
| | — |
| — |
| — |
| — |
| (35,487 | ) | | 21 |
| | (35,466 | ) |
BALANCE
June 30, 2020 | 1 |
| $ | — |
| | 254,548,180 |
| $ | 20,364 |
| | — |
| $ | — |
| $ | 2,008,860 |
| $ | (1,418,722 | ) | $ | (262,061 | ) | | $ | 386 |
| | $ | 348,827 |
|
| | | | | | | | | | | | | | | | |
| | CME Ltd. | | |
| | |
|
| | Series A Convertible Preferred Stock | | Class A Common Stock | | Class B Common Stock | |
| |
| |
| | |
| | |
|
| | Number of shares | Par value | | Number of shares | Par value | | Number of shares | Par value | Additional Paid-In Capital |
| Accumulated Deficit |
| Accumulated Other Comprehensive Loss |
| | Noncontrolling Interest |
| | Total Equity |
|
BALANCE December 31, 2018 | 1 |
| $ | — |
| | 252,853,554 |
| $ | 20,228 |
| | — |
| $ | — |
| $ | 2,003,518 |
| $ | (1,578,076 | ) | $ | (216,650 | ) | | $ | 301 |
| | $ | 229,321 |
|
| Stock-based compensation | — |
| — |
| | — |
| — |
| | — |
| — |
| 2,127 |
| — |
| — |
| | — |
| | 2,127 |
|
| Share issuance, stock-based compensation | — |
| — |
| | 705,744 |
| 57 |
| | — |
| — |
| (57 | ) | — |
| — |
| | — |
| | — |
|
| Withholding tax on net share settlement of stock-based compensation | — |
| — |
| | — |
| — |
| | — |
| — |
| (373 | ) | — |
| — |
| | — |
| | (373 | ) |
| Net income | — |
| — |
| | — |
| — |
| | — |
| — |
| — |
| 55,717 |
| — |
| | 112 |
| | 55,829 |
|
| Unrealized loss on derivative instruments | — |
| — |
| | — |
| — |
| | — |
| — |
| — |
| — |
| (4,551 | ) | | — |
| | (4,551 | ) |
| Currency translation adjustment | — |
| — |
| | — |
| — |
| | — |
| — |
| — |
| — |
| 1,113 |
| | 46 |
| | 1,159 |
|
BALANCE
June 30, 2019 | 1 |
| $ | — |
|
| 253,559,298 |
| $ | 20,285 |
|
| — |
| $ | — |
| $ | 2,005,215 |
| $ | (1,522,359 | ) | $ | (220,088 | ) |
| $ | 459 |
|
| $ | 283,512 |
|
The accompanying notes are an integral part of these condensed consolidated financial statements.
CENTRAL EUROPEAN MEDIA ENTERPRISES LTD.
CONDENSED CONSOLIDATED STATEMENTS OF CASH FLOWS
(US$ 000’s)
(Unaudited)
|
| | | | | | | |
| | For the Six Months Ended June 30, |
| | 2020 |
| | 2019 |
|
| CASH FLOWS FROM OPERATING ACTIVITIES: | | | |
| Net income | $ | 40,072 |
| | $ | 55,829 |
|
| Adjustments to reconcile net income to net cash generated from operating activities: | |
| | |
| Amortization of program rights and other content costs | 108,725 |
| | 140,716 |
|
| Depreciation and other amortization | 21,817 |
| | 22,414 |
|
| Loss on extinguishment of debt | — |
| | 235 |
|
| Gain on disposal of fixed assets | (100 | ) | | (11 | ) |
| Deferred income taxes | 2,847 |
| | (46 | ) |
| Stock-based compensation (Note 16) | 1,672 |
| | 2,127 |
|
| Change in fair value of derivatives | — |
| | 36 |
|
| Foreign currency exchange loss, net | 5,218 |
| | (198 | ) |
| Changes in assets and liabilities: | | | |
| Accounts receivable, net | 53,463 |
| | 16,551 |
|
| Accounts payable and accrued liabilities | (1,693 | ) | | 1,349 |
|
| Program rights | (103,588 | ) | | (120,040 | ) |
| Other assets and liabilities | 1,070 |
| | (918 | ) |
| Accrued interest | (76 | ) | | (229 | ) |
| Income taxes payable | 839 |
| | 4,153 |
|
| Deferred revenue | 16,017 |
| | 18,508 |
|
| VAT and other taxes payable | 8,712 |
| | (196 | ) |
| Net cash generated from operating activities | $ | 154,995 |
| | $ | 140,280 |
|
| | | | |
| CASH FLOWS FROM INVESTING ACTIVITIES: | |
| | |
|
| Purchase of property, plant and equipment | $ | (8,759 | ) | | $ | (8,272 | ) |
| Disposal of property, plant and equipment | 101 |
| | 6 |
|
| Net cash used in investing activities | $ | (8,658 | ) | | $ | (8,266 | ) |
| | | | |
| CASH FLOWS FROM FINANCING ACTIVITIES: | |
| | |
|
| Repayment of debt | $ | — |
| | $ | (113,988 | ) |
| Settlement of derivative instruments | — |
| | (1,173 | ) |
| Payment of credit facilities and finance leases | (3,918 | ) | | (3,395 | ) |
| Payments of withholding tax on net share settlement of share-based compensation | (11 | ) | | (373 | ) |
| Net cash used in financing activities | $ | (3,929 | ) | | $ | (118,929 | ) |
| | | | |
| Impact of exchange rate fluctuations on cash and cash equivalents | (2,935 | ) | | (477 | ) |
| Net increase in cash and cash equivalents | $ | 139,473 |
| | $ | 12,608 |
|
| CASH AND CASH EQUIVALENTS, beginning of period | 36,621 |
| | 62,031 |
|
| CASH AND CASH EQUIVALENTS, end of period | $ | 176,094 |
| | $ | 74,639 |
|
|
| | | | | | | |
| | For the Nine Months Ended September 30, |
| | 2017 |
| | 2016 |
|
| CASH FLOWS FROM OPERATING ACTIVITIES: | | | |
| Net income / (loss) | $ | 8,591 |
| | $ | (201,766 | ) |
| Adjustments to reconcile net income / (loss) to net cash generated from continuing operating activities: | |
| | |
| Loss from discontinued operations, net of tax (Note 3) | 8,747 |
| | 15,971 |
|
| Amortization of program rights | 174,214 |
| | 166,938 |
|
| Depreciation and other amortization | 29,976 |
| | 43,785 |
|
| Interest and related Guarantee Fees paid in kind | 14,733 |
| | 14,300 |
|
| Loss on extinguishment of debt (Note 5) | 101 |
| | 150,158 |
|
| Gain on disposal of fixed assets | (68 | ) | | (45 | ) |
| Deferred income taxes | (1,300 | ) | | 6,783 |
|
| Stock-based compensation (Note 17) | 2,044 |
| | 2,364 |
|
| Change in fair value of derivatives | 1,204 |
| | 11,722 |
|
| Foreign currency exchange gain, net | (12,459 | ) | | (13,683 | ) |
| Changes in assets and liabilities: | | | |
| Accounts receivable, net | 35,280 |
| | 19,530 |
|
| Accounts payable and accrued liabilities | (5,435 | ) | | (5,986 | ) |
| Program rights | (183,625 | ) | | (174,346 | ) |
| Other assets and liabilities | (1,559 | ) | | (1,470 | ) |
| Accrued interest | 10,668 |
| | 11,665 |
|
| Income taxes payable | 991 |
| | (255 | ) |
| Deferred revenue | 11,645 |
| | 12,576 |
|
| VAT and other taxes payable | (3,110 | ) | | (1,269 | ) |
| Net cash generated from continuing operating activities | $ | 90,638 |
| | $ | 56,972 |
|
| | | | |
| CASH FLOWS FROM INVESTING ACTIVITIES: | |
| | |
|
| Purchase of property, plant and equipment | $ | (16,389 | ) | | $ | (14,850 | ) |
| Disposal of property, plant and equipment | 139 |
| | 88 |
|
| Net cash used in continuing investing activities | $ | (16,250 | ) | | $ | (14,762 | ) |
| | | | |
| CASH FLOWS FROM FINANCING ACTIVITIES: | |
| | |
|
| Proceeds from debt | $ | — |
| | $ | 533,963 |
|
| Repayment of debt | (59,060 | ) | | (540,699 | ) |
| Debt transaction costs | (106 | ) | | (9,541 | ) |
| Payment of credit facilities and capital leases | (1,757 | ) | | (755 | ) |
| Settlement of forward currency swaps | — |
| | (12,106 | ) |
| Proceeds from exercise of warrants | 563 |
| | 5,947 |
|
| Proceeds from sale-leaseback transactions | 2,746 |
| | — |
|
| Payments of withholding tax on net share settlement of share-based compensation | (168 | ) | | — |
|
| Net cash used in continuing financing activities | $ | (57,782 | ) | | $ | (23,191 | ) |
| | | | |
| Net cash provided by / (used in) discontinued operations - operating activities | 3,273 |
| | (17,308 | ) |
| Net cash used in discontinued operations - investing activities | (3,125 | ) | | (4,789 | ) |
| Net cash used in discontinued operations - financing activities | (210 | ) | | (181 | ) |
| | | | |
| Impact of exchange rate fluctuations on cash and cash equivalents | 9,884 |
| | 2,005 |
|
| Net increase / (decrease) in cash and cash equivalents | $ | 26,428 |
| | $ | (1,254 | ) |
| CASH AND CASH EQUIVALENTS, beginning of period | 40,606 |
| | 59,120 |
|
| CASH AND CASH EQUIVALENTS, end of period | $ | 67,034 |
| | $ | 57,866 |
|
|
| | | | | | | |
| SUPPLEMENTAL DISCLOSURE OF CASH FLOW INFORMATION: | | | |
| Cash paid for interest (including Guarantee Fees) | $ | 10,507 |
| | $ | 14,017 |
|
| Cash paid for income taxes, net of refunds | 8,427 |
| | 11,348 |
|
CENTRAL EUROPEAN MEDIA ENTERPRISES LTD.
CONDENSED CONSOLIDATED STATEMENTS OF CASH FLOWS
(US$ 000’s)
(Unaudited)
|
| | | | | | | |
| SUPPLEMENTAL DISCLOSURE OF CASH FLOW INFORMATION: | | | |
| Cash paid for interest (including mandatory cash-pay Guarantee Fees) | $ | 22,206 |
| | $ | 38,317 |
|
| Cash paid for Guarantee Fees that may be paid in kind | 1,411 |
| | 5,483 |
|
| Cash paid for income taxes, net of refunds | 12,380 |
| | 234 |
|
| | | | |
| SUPPLEMENTAL DISCLOSURE OF NON-CASH FINANCING ACTIVITIES: | | | |
| Accretion on Series B Convertible Redeemable Preferred Stock | $ | 7,216 |
| | $ | 11,314 |
|
The accompanying notes are an integral part of these condensed consolidated financial statements.
CENTRAL EUROPEAN MEDIA ENTERPRISES LTD.
NOTES TO CONDENSED CONSOLIDATED FINANCIAL STATEMENTS
(Tabular amounts in US$ 000’s, except share and per share data)
(Unaudited)
1. ORGANIZATION AND BUSINESS
Central European Media Enterprises Ltd., a Bermuda company limited by shares, is a media and entertainment company operating in Central and Eastern Europe. Our assets are held through a series of Dutch and Curaçao holding companies. We manage our business on a geographical basis, with four5 operating segments; Bulgaria, the Czech Republic, Romania, and the Slovak Republic and Slovenia, which are also our reportable segments and our main operating countries. See Note 19,18, "Segment Data" for financial information by segment. On July 9, 2017, we entered into a framework agreement with Slovenia Broadband S.à r.l., a wholly owned subsidiary of United Group B.V., relating to the sale of our Croatia and Slovenia operations. See Note 3, "Discontinued Operations and Assets Held for Sale" for further information.
We are the market-leading broadcasters in each of our 5 operating countries with a combined portfolio of 2730 television channels. Each of our broadcast operationscountry develops and produces content for their television channels. We generate advertising revenues in our country operations primarily through entering into agreements with advertisers, advertising agencies and sponsors to place advertising on the television channels that we operate. We generate additional revenues by collecting fees from cable, and direct-to-home (“DTH”) and internet protocol television ("IPTV") operators for carriage of our channels. With the exception ofchannels as well as from advertising related to our Bulgarian operations,digital initiatives. Unless otherwise indicated, we own 100% of our broadcast operating and license companies in each country.
Bulgaria
We operate one1 general entertainment channel, BTV, and five5 other channels, BTV CINEMA, BTV COMEDY, RING, BTV ACTION, BTV LADY and BTV LADY.RING. We own 94.0%94% of CME Bulgaria B.V. ("CME Bulgaria"), the subsidiary that owns our Bulgaria operations.
Czech Republic
We operate one1 general entertainment channel, TV NOVA, (Czech Republic), and seven7 other channels, NOVA 2, NOVA CINEMA, NOVA SPORT 1, NOVA SPORT 2, NOVA ACTION, NOVA 2, NOVA GOLD and NOVA INTERNATIONAL, a general entertainment channel broadcasting in the Slovak Republic.
Romania
We operate one1 general entertainment channel, PRO TV, and eight6 other channels, PRO 2, (formerly ACASA),PRO X, PRO GOLD, (formerly ACASA GOLD), PRO CINEMA, PRO X (formerly SPORT.RO), MTV ROMANIA, PRO TV INTERNATIONAL, as well as PRO TV CHISINAU, a general entertainment channel broadcasting in Moldova, and ACASA IN MOLDOVA.Moldova.
Slovak Republic
We operate one1 general entertainment channel, TV MARKIZA, and three3 other channels, DOMA, (Slovak Republic), DAJTO, and MARKIZA INTERNATIONAL, a general entertainment channel broadcasting in the Czech Republic.
Slovenia
We operate 2 general entertainment channels, POP TV and KANAL A, and 3 other channels, KINO, BRIO and OTO.
Merger
On October 27, 2019, the Company entered into an Agreement and Plan of Merger (the "Merger Agreement") with TV Bidco B.V. ("Parent") and TV Bermuda Ltd. ("Merger Sub"). Parent and Merger Sub are affiliates of PPF Group N.V. Pursuant to the Merger Agreement, Merger Sub will merge with and into the Company (the "Merger"), with the Company continuing as the surviving company in the proposed Merger as a wholly-owned subsidiary of Parent.
The closing of the proposed Merger is subject to several conditions, including, but not limited to, the requisite vote of the Company’s shareholders in favor of the Merger Agreement and the proposed Merger, the receipt of certain competition and other regulatory approvals, compliance with covenants and agreements in the Merger Agreement (subject to certain materiality qualifications), and the absence of any governmental order prohibiting completion of the proposed Merger.. A special general meeting of shareholders of the Company was held on February 27, 2020, where more than 99% of the votes cast by shareholders were in favor of approving the Merger Agreement, the related statutory merger agreement and the Merger. In addition, regulatory approvals required under the Merger Agreement in Romania and Slovenia have been obtained. For additional information on the Merger, please see the proxy statement of the Company related to the special general meeting of shareholders, filed with the SEC on January 10, 2020. Parent is currently expecting to file the required notification with the European Commission in the third quarter, and based on our anticipated timing of that, we expect the proposed Merger to be completed prior to October 27, 2020. If the receipt of certain competition and other regulatory approvals, including the approval of the European Commission, is not satisfied by October 27, 2020 but all other conditions to closing of the proposed Merger have been satisfied or waived by such date (other than those conditions that by their nature are to be satisfied at the closing of the Merger), either CME or Parent can elect to extend the closing date of the proposed Merger to January 27, 2021.
Under the Merger Agreement, at the effective time of the proposed Merger (the “Effective Time”), without any action required by the Company, Parent, Merger Sub or any shareholder of the Company or any other person, each Class A Share issued and outstanding immediately prior to the Effective Time will be canceled and cease to exist automatically and each such Class A Share (other than shares owned by the Company, Parent, Merger Sub or any of their respective direct or indirect wholly-owned subsidiaries, in each case not held on behalf of third parties) will be converted into the right to receive US$ 4.58 in cash.
Under the Merger Agreement, at the Effective Time, without any action required by the Company, Parent, Merger Sub or any shareholder of the Company or any other person, the Series A Preferred Share issued and outstanding immediately prior to the Effective Time will be canceled and cease to exist automatically and will be converted into the right to receive US$ 32,900,000 in cash, without interest, and each Series B Preferred Share issued and outstanding immediately prior to the Effective Time will be canceled and cease to exist automatically and will be converted into the right to receive US$ 1,630.875 in cash, without interest; provided that, among other things, any conversion of the Series A Preferred Share or any Series B Preferred Shares into Class A Shares on or after October 27, 2019 will be deemed to be null and void.
CENTRAL EUROPEAN MEDIA ENTERPRISES LTD.
NOTES TO CONDENSED CONSOLIDATED FINANCIAL STATEMENTS
(Tabular amounts in US$ 000’s, except share and per share data)
(Unaudited)
2. BASIS OF PRESENTATION
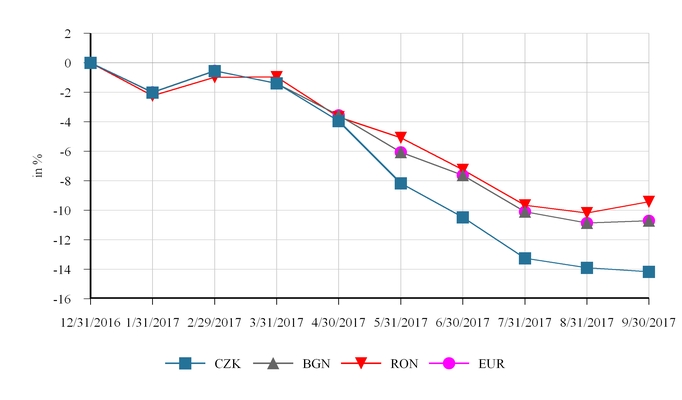
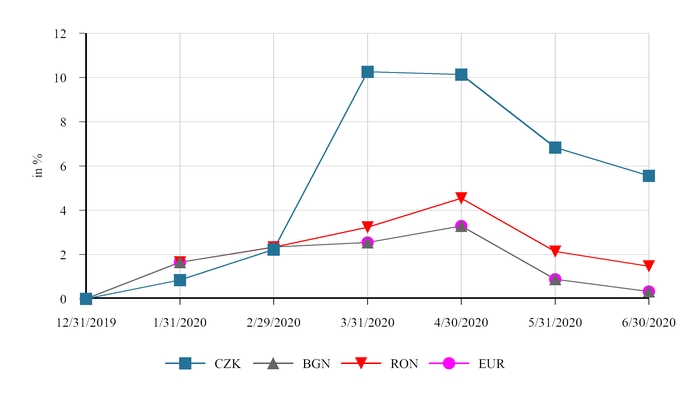
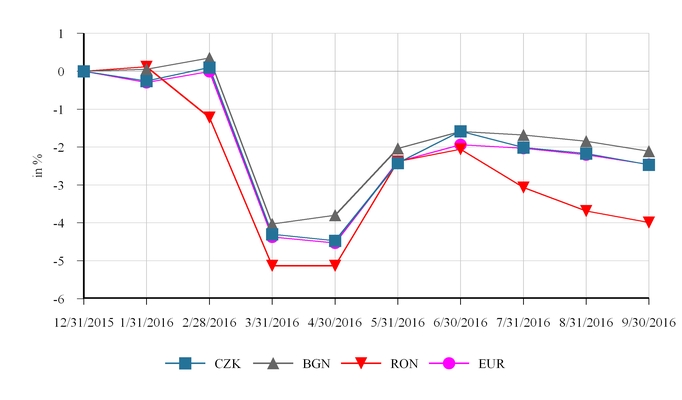
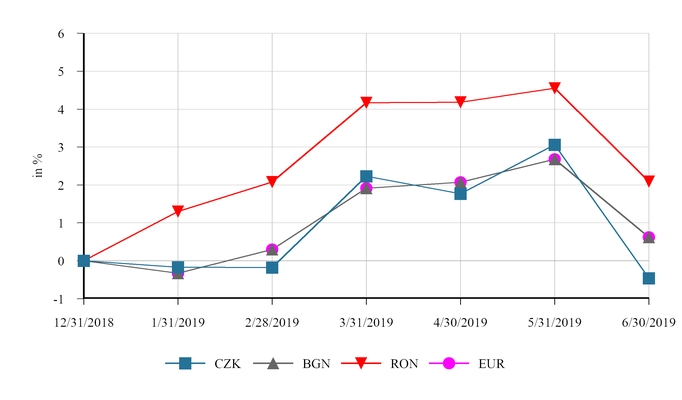
The terms the “Company”"Company", “we”"we", “us”"us", and “our”"our" are used in this Form 10-Q to refer collectively to the parent company, Central European Media Enterprises Ltd. (“CME Ltd.”), and the subsidiaries through which we operate.our various businesses are conducted. Unless otherwise noted, all statistical and financial information presented in this report has been converted into U.S. dollars using period-end exchange rates. All references to “US$”"US$", “USD”"USD" or “dollars”"dollars" are to U.S. dollars;dollars, all references to “BGN”"BGN" are to the Bulgarian leva;leva, all references to “CZK”"CZK" are to the Czech koruna;koruna, all references to “RON”"RON" are to the New Romanian lei;lei, and all references to “Euro”"Euro" or “EUR”"EUR" are to the European Union Euro. Where applicable, prior period presentation has been modified to conform to current year presentation.
Interim Financial Statements
The accompanying unaudited condensed consolidated financial statements have been prepared in accordance with the instructions to Quarterly Report on Form 10-Q and do not include all of the information and note disclosures required by generally accepted accounting principles in the United States of America (“US GAAP”). Amounts as of December 31, 20162019 included in the unaudited condensed consolidated financial statements have been derived from audited consolidated financial statements as of that date. The accompanying unaudited condensed consolidated financial statements should be read in conjunction with our Annual Report on Form 10-K for the year ended December 31, 20162019 filed with the Securities and Exchange Commission on February 9, 2017.6, 2020. Our significant accounting policies have not changed since December 31, 2016,2019, except as noted below.
In the opinion of management, the accompanying unaudited condensed consolidated financial statements reflect all adjustments, consisting only of normal recurring items and changes in US GAAP, necessary for their fair presentation in conformity with US GAAP for complete financial statements. The results of operations for interim periods are not necessarily indicative of the results to be expected for a full year.
Use of Estimates
The preparation of financial statements in conformity with US GAAP requires management to make estimates and assumptions that affect the reported amounts of assets and liabilities and disclosure of contingent assets and liabilities at the date of the financial statements and the reported amounts of revenues and expenses during the reporting periods. Actual results could differ from those estimates and assumptions.
Discontinued Operations and Assets Held for Sale
We present our results of operations, financial position and cash flows of operations that have either been sold or that meet the criteria for "held-for-sale accounting" as discontinued operations if the disposal represents a strategic shift that will have a major effect on our operations and financial results. At the time an operation qualifies for held-for-sale accounting, the operation is evaluated to determine whether or not the carrying amount exceeds its fair value less cost to sell. Any loss as a result of carrying amounts in excess of fair value less cost to sell is recorded in the period the operation qualifies for held-for-sale accounting. Management judgment is required to (1) assess the criteria required to qualify for held-for-sale accounting, and (2) estimate fair value. Our Croatia and Slovenia operations are classified as discontinued operations and assets held for sale for all periods presented. See Note 3, "Discontinued Operations and Assets Held for Sale".
CENTRAL EUROPEAN MEDIA ENTERPRISES LTD.
NOTES TO CONDENSED CONSOLIDATED FINANCIAL STATEMENTS
(Tabular amounts in US$ 000’s, except share and per share data)
(Unaudited)
Basis of Consolidation
The unaudited condensed consolidated financial statements include the accounts of CME Ltd. and our subsidiaries, after the elimination of intercompany accounts and transactions. Entities in which we hold less than a majority voting interest but over which we have the ability to exercise significant influence are accounted for using the equity method. Other investments are accounted for using the cost method.
Seasonality
We experience seasonality, with advertising sales tending to be lowest during the third quarter of each calendar year due to the summer holiday period (typically July and August), and highest during the fourth quarter of each calendar year due to the winter holiday season.
Recent Accounting Pronouncements
Accounting Pronouncements Adopted
On January 1, 2017 we adopted guidance issued by the Financial Accounting Standards Board (the “FASB”) which is intended to improve the accountingAllowance for the income tax consequences of intercompany transfers of assets other than inventory. The guidance requires an entity to recognize the income tax consequences of such transfers in the period in which the transfer occurs, rather than defer recognition of current and deferred income taxes for the transfer until the asset is sold to a third party. The early adoption of this guidance did not have a material impact on our condensed consolidated financial statements.
Recent Accounting Pronouncements IssuedCredit Losses
In May 2014, the FASB issued guidance which is intended to improve the comparability of revenue recognition practices across entities, industries, jurisdictions, and capital markets. The guidance supersedes existing revenue recognition guidance and requires an entity to recognize revenue to depict the transfer of promised goods or services to customers in an amount that reflects the consideration to which the entity expects to be entitled in exchange for those goods or services. The guidance is effective for our fiscal year beginning January 1, 2018. We have substantially completed our evaluation of the contractual terms of our significant revenue streams in each of our segments, we stratify our receivables by age within risk-based pools. We apply an allowance percentage to each aging bucket based on historical collection trends adjusted for anticipated changes in future collectibility, including the potential impact of the COVID-19 pandemic. Our risk pools are generally defined as TV Advertising, Carriage Fee and Subscription and Other, based on the revenue source of the related receivable.
We maintain a specific allowance for estimated losses resulting from the inability of certain customers to make required payments. If the financial condition of these customers were to deteriorate, additional allowances may be required in future periods. We review accounts receivable balances periodically to identify the need for specific provision.
We consider factors external to the specific customer, including current conditions and forecasts of economic conditions that are unique to each segment, including the potential impact of the COVID-19 pandemic. In the event we recover amounts previously written off, we release the specific allowance for credit loss.
Goodwill and Indefinite-Lived Intangible Assets
Goodwill is evaluated at the reporting unit level, which we have determined is each of our five operating segments. While weWe calculated the fair value of our reporting units as of October 1, 2019, based on the present value of expected future cash flows, including terminal value, discounted at appropriate rates, determined separately for each reporting unit, and on publicly available information, where appropriate. The determination of fair value involves the use of significant estimates and assumptions, including: revenue growth rates, operating margins, capital expenditures, working capital requirements, tax rates, terminal growth rates, management's long-term plan and a discount rate selected with reference to the relevant cost of capital. An impairment exists when the carrying amount of a reporting unit (including its goodwill), exceeds its fair value.
Indefinite-lived intangible assets are still inevaluated for impairment individually using the processrelief from royalty method to calculate fair value. An impairment loss is recognized if the carrying amount of evaluatingan indefinite-lived intangible asset exceeds its fair value.
We performed a qualitative assessment for all of our reporting units and indefinite-lived intangible assets as of June 30, 2020 to determine whether the impact of the adoption of this guidance on our condensed consolidated financial statements, we currently doCOVID-19 pandemic indicates that it is more likely than not expect the impact of this new guidance to be material. We expect to adopt the standard in 2018 using the modified retrospective transition method.
In February 2016, the FASB issued guidance to increase transparency and comparability among organizations by recognizing leasing assets and liabilities on the balance sheet and requiring additional disclosures about an entity's leasing arrangements. The guidance requires that a lessee recognize a liability to make lease payments and a right-of-use asset, with an available exception for leases shorter than twelve months. The guidance is effective for our fiscal year beginning January 1, 2019. We are currently in the process of evaluating the impact of the adoption of this guidance on our condensed consolidated financial statements.
In August 2016, the FASB issued guidance which is intended to reduce the existing diversity in practice related to specific cash flow issues. As applicable to us, the guidance requires that cash flows at the settlement of zero-coupon debt instruments or debt instruments with coupon interest rates that are insignificant in relation to the effective interest rate of the borrowing be bifurcated between cash outflows for operating activities for the portion attributable to accrued interest, and cash outflows for financing activities for the portion attributable to the principal. The guidance requires a retrospective transition method and is effective for our fiscal year beginning January 1, 2018, with early adoption permitted. We expect to adopt this guidance as of January 1, 2018. Upon adoption, our net cash flows generated from / used in continuing operating activities for the year ended December 31, 2016 will decrease by US$ 110.7 million with a corresponding increase in net cash used in / provided by continuing financing activities.
In January 2017, the FASB issued guidance which is intended to simplify goodwill impairment testing by eliminating Step 2, and instead recognize an impairment charge for the amount by which the carrying amount of the reporting unit exceeds the fair value of theany reporting unit. The guidance also eliminates the requirement to perform a qualitative analysis for reporting units with a negativeunit or indefinite-lived intangible asset is less than its carrying value. The guidanceresults of these procedures indicated that none of our reporting units or indefinite-lived intangible assets were more likely than not impaired.
Program Rights
Our predominant strategy in each segment is effectiveto generate television advertising revenues through airing a diversified library of complementary content across our portfolio of channels. Licensed and produced content are predominantly monetized as a group and reviewed for annual and interimpotential impairment tests after January 1, 2020, with early adoption permitted for interim and annual impairment tests performed from January 1, 2017. We expect to early adopt the guidanceas a film group in each segment when an event or change in circumstances indicates a change in the fourth quarterexpected usefulness of 2017.
In August 2017, the FASB issued guidance which is intended to simplifycontent or that the applicationfair value may be less than unamortized cost. Content assets within a film group are stated at the lower of hedge accountingunamortized cost or fair value. Our calculations of fair value include significant assumptions about the amounts and increase transparencytiming of information about an entity's risk management activities. The guidance changes both the designationcash inflows and measurement guidance for qualifying hedging relationshipsoutflows and the presentation of hedge results inrates by which these cash flows are discounted to the financial statements. The guidance is effectivepresent period. Unamortized costs for our fiscal year beginning January 1, 2019, with early adoption during interim periods permitted. All requirements and elections shouldassets that have been, or are expected to be applied to hedging relationships existing on the date of adoption and reflected as of the beginning of the fiscal year of adoption. Weabandoned, are currently in the process of evaluating the impact of the adoption of this guidance on our condensed consolidated financial statements.written off.
CENTRAL EUROPEAN MEDIA ENTERPRISES LTD.
NOTES TO CONDENSED CONSOLIDATED FINANCIAL STATEMENTS
(Tabular amounts in US$ 000’s, except share and per share data)
(Unaudited)
3. DISCONTINUED OPERATIONS AND ASSETS HELD FOR SALEWe performed qualitative impairment assessments of the film groups in each segment as of June 30, 2020, to determine whether the impact of the COVID-19 pandemic or other changes in circumstances indicate that the fair value of the film groups may be less than its unamortized cost. The results of these qualitative assessments did not indicate that the fair value of any film group was less than its unamortized cost.
On July 9, 2017, we entered into a framework agreement with Slovenia Broadband S.à r.l. (the "Purchaser"), a wholly owned subsidiaryIncome Taxes
We have historically calculated the provision for income taxes during interim reporting periods by applying an estimate of United Group B.V., relatingthe annual effective tax rate for the full fiscal year to “ordinary” income or loss (pretax income or loss excluding unusual or infrequently occurring discrete items) for the reporting period. However, due to the sale of our Croatia and Slovenia operations for cash consideration of EUR 230.0 million (approximately US$ 271.5 million) (the "Divestment Transaction"), subjectuncertainty related to customary working capital adjustments. We expect the transaction to close by the end of 2017 or early 2018, subject to obtaining regulatory approvals and other customary closing conditions being satisfied. If the transaction is terminated by either party because the transaction has not closed prior to December 31, 2017 (which date may be extended under certain circumstances by the Purchaser to March 31, 2018), we would receive a termination fee of EUR 7.0 million (approximately US$ 8.3 million), subject to certain exceptions, including if the requisite regulatory approvals have not been obtained as a resultimpact of the Purchaser being requiredCOVID-19 pandemic on our operations, we have used a discrete effective tax rate method to make specified material divestitures as a condition to any requisite regulatory approvals or if a notification has not been declared complete by a relevant regulatory authority.
The carrying amounts of the major classes of assets and liabilities of our discontinued operations that are classified as held for sale in the condensed consolidated balance sheets at September 30, 2017 and December 31, 2016 were:
|
| | | | | | | |
| | September 30, 2017 |
| | December 31, 2016 |
|
| Assets held for sale | | | |
| Current assets held for sale | | | |
| Cash and cash equivalents | $ | 7,061 |
| | $ | 2,853 |
|
| Accounts receivable, net | 29,064 |
| | 36,969 |
|
| Program rights, net | 66,449 |
| | 16,489 |
|
| Property, plant and equipment, net | 20,909 |
| | — |
|
| Other current assets | 11,688 |
| | 4,931 |
|
| Total current assets held for sale | $ | 135,171 |
| | $ | 61,242 |
|
| Non-current assets held for sale | | | |
| Program rights, net | $ | — |
| | $ | 35,927 |
|
| Property, plant and equipment, net | — |
| | 20,008 |
|
| Other non-current assets | — |
| | 4,339 |
|
| Total non-current assets held for sale | $ | — |
| | $ | 60,274 |
|
| | | | |
| Liabilities held for sale | | | |
| Current liabilities held for sale | | | |
| Accounts payable and accrued liabilities | $ | 27,922 |
| | $ | 26,603 |
|
| Other current liabilities | 4,324 |
| | 889 |
|
| Total current liabilities held for sale | $ | 32,246 |
| | $ | 27,492 |
|
| Non-current liabilities held for sale | | | |
| Other non-current liabilities | $ | — |
| | $ | 1,414 |
|
| Total non-current liabilities held for sale | $ | — |
| | $ | 1,414 |
|
Loss from discontinued operations, net of tax, comprised the followingcalculate taxes for the three and ninesix months ended SeptemberJune 30, 20172020.
Recent Accounting Pronouncements
Accounting Pronouncements Adopted
In June 2016, the Financial Accounting Standards Board ("FASB") issued guidance to provide financial statement users with more information about the expected credit losses on financial instruments and 2016:other commitments to extend credit held by a reporting entity at each reporting date. The amendments replaced the incurred loss impairment methodology in the legacy guidance with a methodology that reflects expected credit losses and requires consideration of a broader range of reasonable and supportable information to inform credit loss estimates. The guidance primarily applies to our accounts receivable and had no material impact upon adoption as of January 1, 2020.
In March 2019, the FASB issued guidance that aligns the accounting for production costs of an episodic television series with the accounting for production costs of films. The guidance further requires that an entity test a film or license agreement for program material for impairment at a film group level and under a fair value model when the film or license agreement is predominantly monetized with other films and/or license agreements. Further, content acquired under a license agreement is not required to be separately presented on the balance sheet based on the estimated time of usage. The guidance was adopted prospectively on January 1, 2020, at which time we reclassified US$ 75.9 million of our current content assets to non-current on our condensed consolidated Balance Sheets. There was no cumulative effect adjustment or impairment identified upon adoption. The change to a fair value model and the use of film groups in the assessment of impairment of our content is a significant change to the previously prescribed approach; however, the results of these procedures are not substantially different than the results under the previous approach. |
| | | | | | | | | | | | | | | |
| | For the Three Months
Ended September 30, | | For the Nine Months
Ended September 30, |
| | 2017 |
| | 2016 |
| | 2017 |
| | 2016 |
|
| Net revenues | $ | 22,742 |
| | $ | 19,179 |
| | $ | 80,973 |
| | $ | 74,765 |
|
| Cost of revenues | 18,893 |
| | 17,866 |
| | 61,120 |
| | 62,788 |
|
| Selling, general and administrative expenses | 5,394 |
| | 4,378 |
| | 14,484 |
| | 12,004 |
|
| Operating (loss) / income | (1,545 | ) | | (3,065 | ) | | 5,369 |
| | (27 | ) |
Interest expense (1) | (4,913 | ) | | (5,212 | ) | | (14,220 | ) | | (15,695 | ) |
| Other non-operating income / (expense), net | 294 |
| | 36 |
| | 621 |
| | (8 | ) |
| Loss from discontinued operations, before tax | (6,164 | ) | | (8,241 | ) | | (8,230 | ) | | (15,730 | ) |
| Credit / (provision) for income taxes | 176 |
| | 187 |
| | (517 | ) | | (241 | ) |
| Loss from discontinued operations, net of tax | $ | (5,988 | ) | | $ | (8,054 | ) | | $ | (8,747 | ) | | $ | (15,971 | ) |
| |
(1)Recent Accounting Pronouncements Issued In March 2020, the FASB issued guidance to provide optional expedients and exceptions for applying generally accepted accounting principles (GAAP) to contracts, hedging relationships, and other transactions affected by reference rate reform if certain criteria are met. The amendments apply only to contracts, hedging relationships, and other transactions that reference LIBOR or another reference rate expected to be discontinued because of reference rate reform. Interest charged on our Euro Loans (as defined in Note 4, "Long-term Debt and Other Financing Arrangements") and the related hedging instruments is based on three-month EURIBOR, which is not expected to be discontinued prior to the maturity of these instruments. Interest charged on our Revolving Credit Facility ("RCF"), when drawn, is based on three-month LIBOR through its maturity on April 26, 2023, however, we do not anticipate this guidance will significantly impact our accounting for this instrument. | For the nine months ended September 30, 2017 and 2016, we paid US$ 9.6 million and US$ 24.5 million, respectively, of interest and Guarantee Fees (as defined below) associated with the 2018 Euro Term Loan (as defined below). These payments were allocated to Net cash provided by / (used in) discontinued operations - operating activities in our Condensed Consolidated Statements of Cash Flows as we are required to apply the expected proceeds from the sale of our Croatia and Slovenia operations towards the repayment of the remaining principal amounts owing in respect of the 2018 Euro Term Loan. (see Note 5, "Long-term Debt and Other Financing Arrangements"). |
4. GOODWILL AND INTANGIBLE ASSETS
Goodwill:
Goodwill by reporting unit as at September 30, 2017 and December 31, 2016 was as follows:
|
| | | | | | | | | | | | | | | | | | | |
| | Bulgaria | | Czech Republic | | Romania | | Slovak Republic | | Total |
| Gross Balance, December 31, 2016 | $ | 171,389 |
| | $ | 744,483 |
| | $ | 82,786 |
| | $ | 46,089 |
| | $ | 1,044,747 |
|
| Accumulated impairment losses | (144,639 | ) | | (287,545 | ) | | (11,028 | ) | | — |
| | (443,212 | ) |
| Balance, December 31, 2016 | 26,750 |
| | 456,938 |
| | 71,758 |
| | 46,089 |
| | 601,535 |
|
| Foreign currency | 3,208 |
| | 75,461 |
| | 7,386 |
| | 5,552 |
| | 91,607 |
|
| Balance, September 30, 2017 | 29,958 |
| | 532,399 |
| | 79,144 |
| | 51,641 |
| | 693,142 |
|
| Accumulated impairment losses | (144,639 | ) | | (287,545 | ) | | (11,028 | ) | | — |
| | (443,212 | ) |
| Gross Balance, September 30, 2017 | $ | 174,597 |
| | $ | 819,944 |
| | $ | 90,172 |
| | $ | 51,641 |
| | $ | 1,136,354 |
|
Other intangible assets:
Changes in the net book value of our other intangible assets as at September 30, 2017 and December 31, 2016 are summarized as follows:
|
| | | | | | | | | | | | | | | | | | | | | | | |
| | September 30, 2017 | | December 31, 2016 |
| | Gross | | Accumulated Amortization | | Net | | Gross | | Accumulated Amortization | | Net |
| Indefinite-lived: | | | | | | | | | | | |
| Trademarks | $ | 86,448 |
| | $ | — |
| | $ | 86,448 |
| | $ | 76,731 |
| | $ | — |
| | $ | 76,731 |
|
| Amortized: | | | | | | | | | | | |
| Broadcast licenses | 213,532 |
| | (155,054 | ) | | 58,478 |
| | 184,195 |
| | (128,876 | ) | | 55,319 |
|
| Trademarks | 420 |
| | (420 | ) | | — |
| | 380 |
| | (380 | ) | | — |
|
| Customer relationships | 57,813 |
| | (55,863 | ) | | 1,950 |
| | 51,338 |
| | (48,997 | ) | | 2,341 |
|
| Other | 1,723 |
| | (1,526 | ) | | 197 |
| | 1,522 |
| | (1,208 | ) | | 314 |
|
| Total | $ | 359,936 |
| | $ | (212,863 | ) | | $ | 147,073 |
| | $ | 314,166 |
| | $ | (179,461 | ) | | $ | 134,705 |
|
Broadcast licenses consist of our TV NOVA license in the Czech Republic, which is amortized on a straight-line basis through the expiration date of the license in 2025. Our customer relationships are deemed to have an economic useful life of, and are amortized on a straight-line basis over, five years to fifteen years.
CENTRAL EUROPEAN MEDIA ENTERPRISES LTD.
NOTES TO CONDENSED CONSOLIDATED FINANCIAL STATEMENTS
(Tabular amounts in US$ 000’s, except share and per share data)
(Unaudited)
5.3. GOODWILL AND INTANGIBLE ASSETS
Goodwill:
Goodwill by reporting unit as at June 30, 2020 and December 31, 2019 was as follows:
|
| | | | | | | | | | | | | | | | | | | | | | | |
| | Bulgaria | | Czech Republic | | Romania | | Slovak Republic | | Slovenia | | Total |
| Gross Balance, December 31, 2019 | $ | 173,146 |
| | $ | 805,396 |
| | $ | 83,521 |
| | $ | 49,137 |
| | $ | 19,400 |
| | $ | 1,130,600 |
|
| Accumulated impairment losses | (144,639 | ) | | (287,545 | ) | | (11,028 | ) | | — |
| | (19,400 | ) | | (462,612 | ) |
| Balance, December 31, 2019 | 28,507 |
| | 517,851 |
| | 72,493 |
| | 49,137 |
| | — |
| | 667,988 |
|
| Foreign currency | (91 | ) | | (27,283 | ) | | (1,035 | ) | | (165 | ) | | — |
| | (28,574 | ) |
| Balance, June 30, 2020 | 28,416 |
| | 490,568 |
| | 71,458 |
| | 48,972 |
| | — |
| | 639,414 |
|
| Accumulated impairment losses | (144,639 | ) | | (287,545 | ) | | (11,028 | ) | | — |
| | (19,400 | ) | | (462,612 | ) |
| Gross Balance, June 30, 2020 | $ | 173,055 |
| | $ | 778,113 |
| | $ | 82,486 |
| | $ | 48,972 |
| | $ | 19,400 |
| | $ | 1,102,026 |
|
Other intangible assets:
The net book values of our other intangible assets as at June 30, 2020 and December 31, 2019 were as follows:
|
| | | | | | | | | | | | | | | | | | | | | | | |
| | June 30, 2020 | | December 31, 2019 |
| | Gross | | Accumulated Amortization | | Net | | Gross | | Accumulated Amortization | | Net |
| Indefinite-lived: | | | | | | | | | | | |
| Trademarks | $ | 84,036 |
| | $ | — |
| | $ | 84,036 |
| | $ | 85,484 |
| | $ | — |
| | $ | 85,484 |
|
| Amortized: | | | | | | | | | | | |
| Broadcast licenses | 199,035 |
| | (165,357 | ) | | 33,678 |
| | 208,669 |
| | (169,239 | ) | | 39,430 |
|
| Customer relationships | 53,875 |
| | (53,400 | ) | | 475 |
| | 54,807 |
| | (54,288 | ) | | 519 |
|
| Other | 5,678 |
| | (3,029 | ) | | 2,649 |
| | 4,642 |
| | (2,486 | ) | | 2,156 |
|
| Total | $ | 342,624 |
| | $ | (221,786 | ) | | $ | 120,838 |
| | $ | 353,602 |
| | $ | (226,013 | ) | | $ | 127,589 |
|
Net broadcast licenses consist solely of our TV Nova license in the Czech Republic, which is amortized on a straight-line basis through its expiration date in 2025. Our customer relationships are deemed to have an economic useful life of, and are amortized on a straight-line basis over, five years to fifteen years. Other intangibles primarily consist of software licenses which are typically amortized on a straight-line basis over three years to five years.
4. LONG-TERM DEBT AND OTHER FINANCING ARRANGEMENTS
Summary
|
| | | | | | | |
| | June 30, 2020 |
| | December 31, 2019 |
|
| Long-term debt | $ | 589,453 |
| | $ | 590,777 |
|
| Other credit facilities and finance leases | 14,623 |
| | 16,332 |
|
| Total long-term debt and other financing arrangements | 604,076 |
| | 607,109 |
|
| Less: current maturities | (6,952 | ) | | (6,836 | ) |
| Total non-current long-term debt and other financing arrangements | $ | 597,124 |
| | $ | 600,273 |
|
|
| | | | | | | |
| | September 30, 2017 |
| | December 31, 2016 |
|
| Long-term debt | $ | 1,061,800 |
| | $ | 999,209 |
|
| Other credit facilities and capital leases | 7,778 |
| | 3,427 |
|
| Total long-term debt and other financing arrangements | 1,069,578 |
| | 1,002,636 |
|
| Less: current maturities | (2,425 | ) | | (1,228 | ) |
| Total non-current long-term debt and other financing arrangements | $ | 1,067,153 |
| | $ | 1,001,408 |
|
Financing Transactions
Pursuant to an amendment in March 2017 to the Reimbursement Agreement (as defined below) with Time Warner Inc. ("Time Warner"), as guarantor of our obligations under the Euro Term Loans (as defined below), the grid pricing structure on the all-in rate that applied only to the 2021 Euro Term Loan (as defined below) was extended to the 2018 Euro Term Loan (as defined below) and the 2019 Euro Term Loan (as defined below), with a reduction in the pricing under the grid for each of the Euro Term Loans resulting in an all-in rate ranging from 8.5% (if our net leverage is greater than or equal to seven times) to 5.0% (if our net leverage is less than five times). As at September 30, 2017, we reduced our net leverage ratio to below six times and anticipate a reduction of our all-in rate to 6.0% from the end of October 2017. In addition, we can achieve a further 50 basis point reduction in the all-in rate if we reduce our long-term debt to less than EUR 815.0 million, subject to certain adjustments in respect of specified debt repayments, on or prior to September 30, 2018. We are required to pay the first 5.0% of the all-in rate (including the base rate and the rate paid pursuant to customary hedging arrangements) on the Euro Term Loans in cash and the remainder may be paid in cash or in kind, at our option. For details, see the table below under the heading "Reimbursement Agreement and Guarantee Fees".
On August 1, 2017, we elected to repay EUR 50.0 million (approximately US$ 59.1 million at August 1, 2017 rates) of the outstanding principal balance of the 2018 Euro Term Loan on which we recognized a loss on extinguishment of US$ 0.1 million.
We are required to apply the proceeds from the sale of our Croatia and Slovenia operations to the repayment of the remaining principal amounts owing in respect of the 2018 Euro Term Loan. Any excess amounts will then be applied to pay fees related to the 2019 Euro Term Loan, including Guarantee Fees and the Commitment Fee which we have previously paid in kind pursuant to the Reimbursement Agreement (see Note 3, "Discontinued Operations and Assets Held for Sale").
Overview
Total long-term debt and credit facilities comprised the following at SeptemberJune 30, 2017:2020:
|
| | | | | | | | | | | |
| | Principal Amount of Liability Component |
| | Debt Issuance Costs (1) |
| | Net Carrying Amount |
|
| 2021 Euro Loan | $ | 67,564 |
| | $ | (71 | ) | | $ | 67,493 |
|
| 2023 Euro Loan | 524,962 |
| | (3,002 | ) | | 521,960 |
|
| 2023 Revolving Credit Facility | — |
| | — |
| | — |
|
| Total long-term debt and credit facilities | $ | 592,526 |
| | $ | (3,073 | ) | | $ | 589,453 |
|
|
| | | | | | | | | | | |
| | Principal Amount of Liability Component |
| | Debt Issuance Costs (1) |
| | Net Carrying Amount |
|
| 2018 Euro Term Loan | $ | 237,064 |
| | $ | (351 | ) | | $ | 236,713 |
|
| 2019 Euro Term Loan | 277,837 |
| | (411 | ) | | 277,426 |
|
| 2021 Euro Term Loan | 553,465 |
| | (5,804 | ) | | 547,661 |
|
| 2021 Revolving Credit Facility | — |
| | — |
| | — |
|
| Total long-term debt and credit facilities | $ | 1,068,366 |
| | $ | (6,566 | ) | | $ | 1,061,800 |
|
| |
(1) | Debt issuance costs related to the 20182021 Euro Term Loan, 2019the 2023 Euro Term Loan and 2021 Euro Term Loanthe 2023 Revolving Credit Facility (each as defined below and collectively, the “Euro Term Loans”)below) are being amortized on a straight-line basis, which approximates the effective interest method, over the life of the respective instruments. Debt issuance costs related to the 20212023 Revolving Credit Facility are classified as non-current assets in our condensed consolidated balance sheet and are being amortized on a straight-line basis over the life of the 2021 Revolving Credit Facility.sheet. |
Long-term Debt
Our long-term debt comprised the following at September 30, 2017 and December 31, 2016:
|
| | | | | | | | | | | | | | | |
| | Carrying Amount | | Fair Value |
| | September 30, 2017 |
| | December 31, 2016 |
| | September 30, 2017 |
| | December 31, 2016 |
|
| 2018 Euro Term Loan | $ | 236,713 |
| | $ | 263,734 |
| | $ | 225,679 |
| | $ | 233,297 |
|
| 2019 Euro Term Loan | 277,426 |
| | 247,594 |
| | 251,012 |
| | 203,314 |
|
| 2021 Euro Term Loan | 547,661 |
| | 487,881 |
| | 464,212 |
| | 369,738 |
|
| | $ | 1,061,800 |
| | $ | 999,209 |
| | $ | 940,903 |
| | $ | 806,349 |
|
CENTRAL EUROPEAN MEDIA ENTERPRISES LTD.
NOTES TO CONDENSED CONSOLIDATED FINANCIAL STATEMENTS
(Tabular amounts in US$ 000’s, except share and per share data)
(Unaudited)
2018 Euro Term Loan
As at SeptemberAt June 30, 2017,2020, the principal amountmaturity of our floating rate senior unsecured termlong-term debt and credit facility (as amended,facilities was as follows:
|
| | | |
| 2020 | $ | — |
|
| 2021 | 67,564 |
|
| 2022 | — |
|
| 2023 | 524,962 |
|
| 2024 | — |
|
| 2025 and thereafter | — |
|
| Total long-term debt and credit facilities | 592,526 |
|
| Debt issuance costs | (3,073 | ) |
| Carrying amount of long-term debt and credit facilities | $ | 589,453 |
|
Long-term Debt
Our long-term debt comprised the "2018 Euro Term Loan") outstanding was EUR 200.8 million (approximately US$ 237.1 million). On August 1, 2017, we elected to repay EUR 50.0 million (approximately US$ 59.1 millionfollowing at August 1, 2017 rates) of the outstanding principal balance of that loan on which we recognized a loss on extinguishment of US$ 0.1 million.June 30, 2020 and December 31, 2019:
|
| | | | | | | | | | | | | | | |
| | Carrying Amount | | Fair Value |
| | June 30, 2020 |
| | December 31, 2019 |
| | June 30, 2020 |
| | December 31, 2019 |
|
| 2021 Euro Loan | $ | 67,493 |
| | $ | 67,683 |
| | $ | 66,817 |
| | $ | 68,120 |
|
| 2023 Euro Loan | 521,960 |
| | 523,094 |
| | 508,936 |
| | 529,303 |
|
| | $ | 589,453 |
| | $ | 590,777 |
| | $ | 575,753 |
| | $ | 597,423 |
|
The 2018 Euro Term Loan bears interest at three-month EURIBOR (fixed pursuant to customary hedging arrangements (see Note 12, "Financial Instruments and Fair Value Measurements") plus a margin of between 1.1% and 1.9% depending on the credit rating of Time Warner. The all-in borrowing rate including the Guarantee Fee ranges from 8.5% to 5.0% per annum based on our net leverage (see the table below under the heading "Reimbursement Agreement and Guarantee Fees"). As at September 30, 2017, the all-in borrowing rate on amounts outstanding under the 2018 Euro Term Loan was 7.25%, the components of which are shown in the table below under the heading "Interest Rate Summary".
Interest on the 2018 Euro Term Loan is payable quarterly in arrears on each March 12, June 12, September 12 and December 12. The 2018 Euro Term Loan matures on November 1, 2018 and may currently be prepaid at our option, in whole or in part, without premium or penalty at any time. The 2018 Euro Term Loan is a senior unsecured obligation of CME Ltd., and is unconditionally guaranteed by our 100% owned subsidiary CME Media Enterprises B.V. ("CME BV") and by Time Warner and certain of its subsidiaries.
Theestimated fair values of the 2018 Euro Term LoanLoans (as defined below) as at SeptemberJune 30, 20172020 and December 31, 20162019 were determined based onusing the average yield curve of comparable instruments that trade in active markets, plus an applicable spread. This measurement of estimated fair value usesbonds with equivalent credit ratings which is a Level 2 inputsinput as described in Note 12,11, "Financial Instruments and Fair Value Measurements". Certain derivative instruments, including contingent event of default and change of control put options, have been identified as being embedded in each of the 2018 Euro Term Loan.Loans. The embedded derivatives are considered clearly and closely related to the 2018their respective Euro Term Loan, and as such are not required to be accounted for separately.
20192021 Euro Term Loan
As at SeptemberJune 30, 2017,2020, the principal amount of our floating rate senior unsecured term credit facility (the "2019"2021 Euro Term Loan") outstanding was EUR 235.360.3 million (approximately US$ 277.867.6 million). The 20192021 Euro Term Loan bears interest at three-month EURIBOR (fixed pursuant to customary hedging arrangements (see Note 12,11, "Financial Instruments and Fair Value Measurements")) plus a margin of between 1.1% and 1.9% depending on the credit rating of Time Warner. The all-in borrowing rate including the Guarantee Fee ranges from 8.5% to 5.0% per annum based on our net leverage (see the table below under the heading "Reimbursement Agreement and Guarantee Fees").Warner Media. As at SeptemberJune 30, 2017, the all-in borrowing rate on amounts outstanding under the 2019 Euro Term Loan was 7.25%, the components of which are shown in the table below under the heading "Interest Rate Summary".
Interest on the 2019 Euro Term Loan is payable quarterly in arrears on each February 13, May 13, August 13 and November 13. The 2019 Euro Term Loan matures on November 1, 2019 and may currently be prepaid at our option, in whole or in part, without premium or penalty. The 2019 Euro Term Loan is a senior unsecured obligation of CME Ltd., and is unconditionally guaranteed by CME BV and by Time Warner and certain of its subsidiaries.
The fair values of the 2019 Euro Term Loan as at September 30, 2017 and December 31, 2016 were determined based on comparable instruments that trade in active markets, plus an applicable spread. This measurement of estimated fair value uses Level 2 inputs as described in Note 12, "Financial Instruments and Fair Value Measurements". Certain derivative instruments, including contingent event of default and change of control put options, have been identified as being embedded in the 2019 Euro Term Loan. The embedded derivatives are considered clearly and closely related to the 2019 Euro Term Loan, and as such are not required to be accounted for separately.
2021 Euro Term Loan
As at September 30, 2017, the principal amount of our floating rate senior unsecured term credit facility (the "2021 Euro Term Loan") outstanding was EUR 468.8 million (approximately US$ 553.5 million). The 2021 Euro Term Loan bears interest at three-month EURIBOR (fixed pursuant to customary hedging arrangements (see Note 12, "Financial Instruments and Fair Value Measurements")) plus a margin of between 1.1% and 1.9% depending on the credit rating of Time Warner. The all-in borrowing rate including the Guarantee Fee ranges from 8.5% to 5.0% per annum based on our net leverage (see the table below under the heading "Reimbursement Agreement and Guarantee Fees"). As at September 30, 2017,2020, the all-in borrowing rate on amounts outstanding under the 2021 Euro Term Loan was 7.25%3.25%, the components of which are shown in the table below under the heading "Interest Rate Summary".
Interest on the 2021 Euro TermLoan is payable quarterly in arrears on each February 13, May 13, August 13 and November 13. The 2021 Euro Loan matures on November 1, 2021 and may be prepaid at our option, in whole or in part, without premium or penalty from cash generated from our operations. The 2021 Euro Loan may be refinanced at our option at any time. The 2021 Euro Loan is a senior unsecured obligation of CME Ltd. and is unconditionally guaranteed by CME Media Enterprises B.V. ("CME BV") and by Warner Media, LLC ("Warner Media") and certain of its subsidiaries.
2023 Euro Loan
As at June 30, 2020, the principal amount of our floating rate senior unsecured term credit facility (the "2023 Euro Loan") outstanding was EUR 468.8 million (approximately US$ 525.0 million). The 2023 Euro Loan bears interest at three-month EURIBOR (fixed pursuant to customary hedging arrangements (see Note 11, "Financial Instruments and Fair Value Measurements")) plus a margin of between 1.1% and 1.9% depending on the credit rating of Warner Media. As at June 30, 2020, the all-in borrowing rate on amounts outstanding under the 2023 Euro Loan was 3.50%, the components of which are shown in the table below under the heading "Interest Rate Summary".
Interest on the 2023 Euro Loan is payable quarterly in arrears on each January 7, April 7, July 7 and October 7. The 20212023 Euro Term Loan matures on February 19, 2021April 26, 2023 and may be prepaid at our option, in whole or in part, without premium or penalty upon the earlier of the occurrence of certain events, including iffrom cash generated from our net leverage (as defined in the Reimbursement Agreement) decreases to below five times for two consecutive quarters, oroperations. The 2023 Euro Loan may be refinanced at our option at any time from February 19, 2020.time. The 20212023 Euro Term Loan is a senior unsecured obligation of CME BV and is unconditionally guaranteed by CME Ltd. and by Time Warner Media and certain of its subsidiaries.
The fair values of the 2021 Euro Term Loan as at September 30, 2017 and December 31, 2016 were determined based on comparable instruments that trade in active markets, plus an applicable spread. This measurement of estimated fair value uses Level 2 inputs as described in Note 12, "Financial Instruments and Fair Value Measurements". Certain derivative instruments, including contingent event of default and change of control put options, have been identified as being embedded in the 2021 Euro Term Loan. The embedded derivatives are considered clearly and closely related to the 2021 Euro Term Loan, and as such are not required to be accounted for separately.
Reimbursement Agreement and Guarantee Fees
In connection with Time Warner’sWarner Media’s guarantees of the 2021 Euro Term Loans,Loan and 2023 Euro Loan (collectively, the "Euro Loans"), we entered into a reimbursement agreement (as amended, the “Reimbursement Agreement") with Time Warner.Warner Media. The Reimbursement Agreement provides for the payment of guarantee fees (collectively, the "Guarantee Fees") to Time Warner Media as consideration for those guarantees, and the reimbursement to Time Warner Media of any amounts paid by them under any guarantee or through any loan purchase right exercised by it. The loan purchase right allows Time Warner Media to purchase any amount outstanding under the Euro Term Loans from the lenders following an event of default under the Euro Term Loans or the Reimbursement Agreement. The Reimbursement Agreement is jointly and severally guaranteed by both our 100% owned subsidiary Central European Media Enterprises N.V. ("CME NV") and CME BV and is secured by a pledge over 100% of the outstanding shares of each of CME NV and CME BV. The covenants and events of default under the Reimbursement Agreement are substantially the same as under the 20212023 Revolving Credit Facility (described below).
CENTRAL EUROPEAN MEDIA ENTERPRISES LTD.
NOTES TO CONDENSED CONSOLIDATED FINANCIAL STATEMENTS
(Tabular amounts in US$ 000’s, except share and per share data)
(Unaudited)
We pay Guarantee Fees to Time Warner Media based on the amounts outstanding on the Euro Term Loans calculated on a per annum basis andbased on our consolidated net leverage (asas defined in the Reimbursement Agreement) asAgreement, which among other adjustments, takes into consideration cash balances up to US$ 75.0 million for the purposes of the net leverage calculation. As at June 30, 2020, our available cash balance was US$ 176.1 million. The Guarantee Fee rates applicable to our Euro Loans are shown in the tabletables below:
All-in Rate
| | | Consolidated Net Leverage | Consolidated Net Leverage | Cash Rate (1) |
| | PIK Fee Rate |
| | Total Rate (2) |
| Consolidated Net Leverage | 2021 Euro Loan |
| | 2023 Euro Loan |
|
| ≥ | 7.0x | | 5.00 | % | | 3.50 | % | | 8.50 | % | 7.0x | | 6.00 | % | | 6.50 | % |
| < | 7.0x | - | 6.0x | | 5.00 | % | | 2.25 | % | | 7.25 | % | 7.0x | - | 6.0x | | 5.00 | % | | 5.50 | % |
| < | 6.0x | - | 5.0x | | 5.00 | % | | 1.00 | % | | 6.00 | % | 6.0x | - | 5.0x | | 4.25 | % | | 4.75 | % |
| < | 5.0x | | 5.00 | % | | — | % | | 5.00 | % | 5.0x | - | 4.0x | | 3.75 | % | | 4.25 | % |
| < | | 4.0x | - | 3.0x | | 3.25 | % | | 3.75 | % |
| < | | 3.0x | | 3.25 | % | | 3.50 | % |
| |
(1)
| Includes cash paid for interest for the Euro Term Loans and the related customary hedging arrangements. |
| |
(2)
| Subject to certain adjustments in respect of specified debt repayments, if we reduce our long-term debt to less than EUR 815.0 million prior to September 30, 2018, a 50 basis point reduction in the all-in rate would be applied. |
Our consolidated net leverage as at SeptemberJune 30, 20172020 and December 31, 20162019 was 5.8x and 6.9x, respectively.2.4x. For the three and ninesix months ended SeptemberJune 30, 20172020 and 2016,2019, we recognized US$ 11.82.8 million and US$ 36.35.6 million; and US$ 3.6 million and US$ 16.5 million and US$ 37.77.3 million, respectively, of Guarantee Fees as interest expense in our condensed consolidated statements of operations and comprehensive income / loss.
The Guarantee Fees relating to the 20182021 Euro Term Loan and the 2019 Euro Term Loan are payable semi-annually in arrears on each May 1 and November 1, in cash or in kind, by adding such semi-annual Guarantee Fees to any such amount then outstanding.1. The Guarantee Fees relating to the 20212023 Euro Term Loan are payable semi-annually in arrears on each June 1 and December 1. The first 5.0% of the all-in rate for each facility (including the base rate and the rate paid pursuant to the hedging arrangements) must be paid in cash and the remainder is payable at our election in cash or in kind.
The Guarantee Fees on the 2023 Euro Loan that were previously paid in kind are presented as a component of other non-current liabilities (see Note 11,9, "Other Liabilities") and bear interest per annum at their respectivethe applicable Guarantee Fee rate (as set forth in the table below). Guarantee Fees paid in cash are included in cash flows from operating activities in our condensed consolidated statements of cash flows.
Interest Rate Summary |
| | | | | | | | | | | |
| | Base Rate |
| | Rate Fixed Pursuant to Interest Rate Hedges |
| | Guarantee Fee Rate |
| | All-in Borrowing Rate |
|
| 2021 Euro Loan | 1.28 | % | | 0.47 | % | | 1.50 | % | | 3.25 | % |
| 2023 Euro Loan | 1.28 | % | | 0.28 | % | (1) | 1.94 | % | | 3.50 | % |
| 2023 Revolving Credit Facility (if drawn) | 4.25 | % | | — | % | | — | % | | 4.25 | % |
|
| | | | | | | | | | | |
| | Base Rate |
| | Rate Fixed Pursuant to Interest Rate Hedges |
| | Guarantee Fee Rate |
| | All-in Borrowing Rate |
|
| 2018 Euro Term Loan | 1.50 | % | | 0.21 | % | (1) | 5.54 | % | | 7.25 | % |
| 2019 Euro Term Loan | 1.50 | % | | 0.31 | % | | 5.44 | % | | 7.25 | % |
| 2021 Euro Term Loan | 1.50 | % | | 0.28 | % | | 5.47 | % | | 7.25 | % |
2021 Revolving Credit Facility (2) | 9.33 | % | (3) | — | % | | — | % | | 9.33 | % |
| |
(1) | Effective until November 1, 2017.February 19, 2021. From November 1, 2017February 19, 2021 through maturity on November 1, 2018,April 26, 2023, the rate fixed pursuant to interest rate hedges will decreaseincrease to 0.14%0.97%, with a corresponding increasedecrease in the Guarantee Fee rate, such that the all-in borrowing rate following an improvement ofremains 3.50% if our net leverage ratio will be 6.00% unless our net leverage ratio changes. |
| |
(2)
| As at September 30, 2017, the 2021 Revolving Credit Facility was undrawn. |
| |
(3)
| Based on the three month LIBOR of 1.33% as at September 30, 2017.remains unchanged. |
20212023 Revolving Credit Facility
As at September 30, 2017, weWe had no0 balance outstanding under the US$ 115.075.0 million revolving credit facility (the “2021"2023 Revolving Credit Facility”Facility"), all of which was available to be drawn. The aggregate principal amount available decreases to US$ 50.0 million with effect from January 1, 2018 or, if earlier, upon the repayment of amounts owing in respect of the 2018 Euro Term Loan with the expected proceeds from the sale of our Croatia and Slovenia operations (see Note 3, "Discontinued Operations and Assets Held for Sale"). as at June 30, 2020.
The 20212023 Revolving Credit Facility bears interest at a rate per annum based on, at our option, an alternativealternate base rate ("ABR Loans" as defined in the 2023 Revolving Credit Facility Agreement) plus 7.0%the spread applicable to ABR Loans based on our consolidated net leverage or an amount equal to the greater of (i) an adjusted LIBORLIBO rate and (ii) 1.0%, plus in each case, 8.0%, with the first 5.0% payable in cash and the remainder payable at our election in cash or in kind by adding such accrued interestspread applicable to the applicable principal amount outstanding underEurodollar Loans (as defined in the 2021 Revolving Credit Facility. The interest rate on the 20212023 Revolving Credit Facility is determinedAgreement) based on the basis of our consolidated net leverage ratio (as defined in the Reimbursement Agreement) and ranges from LIBOR (subject to a floor of 1.0%) plus 9.0% (if our net leverage is greater than or equal to seven times) to 7.0% per annum (if our net leverage ratio is less than five times)., with all amounts payable in cash. The maturity date of the 20212023 Revolving Credit Facility is February 19, 2021.April 26, 2023. When drawn, the 20212023 Revolving Credit Facility permits prepayment at our option in whole or in part without penalty.
As at June 30, 2020, the following spreads were applicable:
|
| | | | | | | | | |
| Consolidated Net Leverage | Alternate Base Rate Loans |
| | Eurodollar Loans |
|
| ≥ | 7.0x | | | | 5.25 | % | | 6.25 | % |
| < | 7.0x | - | 6.0x | | 4.25 | % | | 5.25 | % |
| < | 6.0x | - | 5.0x | | 3.50 | % | | 4.50 | % |
| < | 5.0x | - | 4.0x | | 3.00 | % | | 4.00 | % |
| < | 4.0x | - | 3.0x | | 2.50 | % | | 3.50 | % |
| < | 3.0x | | | | 2.25 | % | | 3.25 | % |
The 20212023 Revolving Credit Facility is jointly and severally guaranteed by CME NV and CME BV and is secured by a pledge over 100% of the outstanding shares of each of CME NV and CME BV. The 20212023 Revolving Credit Facility agreement contains limitations on ourCME’s ability to incur indebtedness, incur guarantees, grant liens, pay dividends or make other distributions, enter into certain affiliate transactions, consolidate, merge or effect a corporate reconstruction, make certain investments acquisitions and loans, and conduct certain asset sales. The agreement also contains maintenance covenants in respect of interest cover cash flow cover and total leverage ratios, and has covenants in respect of incurring indebtedness, the provision of guarantees, making investments and disposals, granting security and certain events of defaults.
CENTRAL EUROPEAN MEDIA ENTERPRISES LTD.
NOTES TO CONDENSED CONSOLIDATED FINANCIAL STATEMENTS
(Tabular amounts in US$ 000’s, except share and per share data)
(Unaudited)
Other Credit Facilities and CapitalFinance Lease Obligations
OtherCash Pooling
We have a cash pooling arrangement with Bank Mendes Gans (“BMG”), a subsidiary of ING Bank N.V., which enables us to receive credit facilities and capital lease obligations comprisedthroughout the following at September 30, 2017 and December 31, 2016:
|
| | | | | | | |
| | September 30, 2017 |
| | December 31, 2016 |
|
Credit facilities (1) – (3) | $ | — |
| | $ | — |
|
| Capital leases | 7,778 |
| | 3,427 |
|
| Total credit facilities and capital leases | 7,778 |
| | 3,427 |
|
| Less: current maturities | (2,425 | ) | | (1,228 | ) |
| Total non-current credit facilities and capital leases | $ | 5,353 |
| | $ | 2,199 |
|
| |
(1)
| We have a cash pooling arrangement with Bank Mendes Gans (“BMG”), a subsidiary of ING Bank N.V. (“ING”), which enables us to receive credit across the group in respect of cash balances deposited with BMG. Cash deposited by our subsidiaries with BMG is pledged as security against the drawings of other subsidiaries up to the amount deposited. |
group in respect of cash balances which our subsidiaries deposit with BMG. Cash deposited by our subsidiaries with BMG is pledged as security against the drawings of other subsidiaries up to the amount deposited. As at SeptemberJune 30, 2017,2020, we had deposits of US$ 26.280.1 million in and no drawings on the BMG cash pool. Interest is earned on deposits at the relevant money market rate. As at December 31, 2016,2019, we had deposits of US$ 16.411.6 million in and no0 drawings on the BMG cash pool.
| |
(2)
| As at September 30, 2017 and December 31, 2016, there were no drawings outstanding under a CZK 575.0 million (approximately US$ 26.1 million) factoring framework agreement with Factoring České spořitelny, a.s. Under this facility, up to CZK 575.0 million (approximately US$ 26.1 million) of receivables from certain customers in the Czech Republic may be factored on a recourse or non-recourse basis. The facility has a factoring fee of 0.19% of any factored receivable and bears interest at one-month PRIBOR plus 0.95% per annum for the period that receivables are factored and outstanding.
|
| |
(3)
| As at September 30, 2017 and December 31, 2016, there were RON 67.8 million (approximately US$ 17.4 million) and RON 105.7 million (approximately US$ 24.6 million), respectively, of receivables factored under a factoring framework agreement with Global Funds IFN S.A. Under this facility, receivables from certain customers in Romania may be factored on a non-recourse basis. The facility has a factoring fee of 4.0% of any factored receivable and bears interest at 6.0% per annum from the date the receivables are factored to the due date of the factored receivable. |
Total Group
At SeptemberFactoring Arrangements
Under a factoring framework agreement with Factoring Česka spořitelna a.s., up to CZK 475.0 million (approximately US$ 19.9 million) of receivables from certain customers in the Czech Republic may be factored on a recourse or non-recourse basis. The facility has a factoring fee of 0.19% of any factored receivable and bears interest at one-month PRIBOR plus 0.95% per annum for the period that receivables are factored and outstanding.
Under a factoring framework agreement with Factoring KB, a.s., certain receivables in the Czech Republic may be factored on a non-recourse basis. The facility has a factoring fee of 0.11% of any factored receivable and bears interest at one-month PRIBOR plus 0.95% per annum for the period that receivables are factored and outstanding up to a maximum of 60 days from the due date.
Under a factoring framework agreement with Global Funds IFN S.A., receivables from certain customers in Romania may be factored on a non-recourse basis. The facility has a factoring fee of 4.0% of any factored receivable and bears interest at 6.0% per annum from the date the receivables are factored to the due date of the factored receivable.
As at June 30, 2017, the maturity2020 and December 31, 2019, we had no outstanding liability balances on any of our long-term debtfactoring arrangements.
Finance Leases
For additional information on finance leases, see Note 10, "Leases".
5. PROGRAM RIGHTS
Program rights comprised the following at June 30, 2020 and credit facilities, excluding any future electionsDecember 31, 2019:
|
| | | | | | | |
| | | | December 31, 2019 |
|
| | June 30, 2020 |
| | (As Adjusted) |
|
| Program rights: | | | |
| Acquired program rights, net of amortization | $ | 127,025 |
| | $ | 135,352 |
|
| Less: current portion of acquired program rights | — |
| | (75,909 | ) |
| Total non-current acquired program rights | 127,025 |
| | 59,443 |
|
| Produced program rights – Feature Films: | | | |
|
| Released, net of amortization | 417 |
| | 504 |
|
| Produced program rights – Television Programs: | |
| | |
|
| Released, net of amortization | 71,878 |
| | 69,707 |
|
| Completed and not released | 13,389 |
| | 4,061 |
|
| In production | 24,980 |
| | 32,248 |
|
| Development and pre-production | 407 |
| | 274 |
|
| Total produced program rights | 111,071 |
| | 106,794 |
|
| Total non-current acquired program rights and produced program rights | $ | 238,096 |
| | $ | 166,237 |
|
The Company identified and corrected an error in the above disclosure as at December 31, 2019 relating to pay interest in kind, wasthe misclassification of certain completed and released content that had been disclosed as completed and not released (see Note 2, "Basis of Presentation").
As of June 30, 2020, expected amortization of our program rights is as follows:
|
| | | |
| 2017 | $ | — |
|
| 2018 | 237,064 |
|
| 2019 | 277,837 |
|
| 2020 | — |
|
| 2021 | 553,465 |
|
| 2022 and thereafter | — |
|
| Total long-term debt and credit facilities | 1,068,366 |
|
| Debt issuance costs | (6,566 | ) |
| Carrying amount of long-term debt and credit facilities | $ | 1,061,800 |
|
|
| | | | | | | | | | | | | | | |
| | June 30, 2020 |
| | First year |
| | Second year |
| | Third year |
| | Thereafter |
|
| Acquired program rights | $ | 64,901 |
| | $ | 43,679 |
| | $ | 16,836 |
| | $ | 1,609 |
|
| Produced and released program rights | 13,899 |
| | 11,281 |
| | 9,044 |
| | 38,071 |
|
Capital Lease Commitments
We lease certainAs of June 30, 2020, approximately US$ 8.6 million of the US$ 13.4 million of our officecompleted and broadcast facilities as well as machinery and equipment under various leasing arrangements. The future minimum lease payments, by year andunreleased produced content is expected to be amortized in the aggregate, under capital leases with initial or remaining non-cancellable lease terms in excess of one year, consisted of the following at September 30, 2017:next twelve months.
|
| | | |
| 2017 | $ | 696 |
|
| 2018 | 2,512 |
|
| 2019 | 2,153 |
|
| 2020 | 1,872 |
|
| 2021 | 708 |
|
| 2022 and thereafter | — |
|
| Total undiscounted payments | 7,941 |
|
| Less: amount representing interest | (163 | ) |
| Present value of net minimum lease payments | $ | 7,778 |
|
CENTRAL EUROPEAN MEDIA ENTERPRISES LTD.
NOTES TO CONDENSED CONSOLIDATED FINANCIAL STATEMENTS
(Tabular amounts in US$ 000’s, except share and per share data)
(Unaudited)
6. PROGRAM RIGHTS
Program rightsContent costs for the three and six months ended June 30, 2020 and 2019 is comprised the following at September 30, 2017 and December 31, 2016:of:
|
| | | | | | | | | | | | | | | |
| | For the Three Months Ended June 30, | | For the Six Months Ended June 30, |
| | 2020 |
| | 2019 |
| | 2020 |
| | 2019 |
|
| Purchased program rights amortization | $ | 19,013 |
| | $ | 21,472 |
| | $ | 43,765 |
| | $ | 47,984 |
|
| Produced program rights amortization | 23,844 |
| | 47,279 |
| | 62,918 |
| | 89,543 |
|
| Other content costs | 836 |
| | 1,605 |
| | 2,042 |
| | 3,189 |
|
| Total content costs | $ | 43,693 |
| | $ | 70,356 |
| | $ | 108,725 |
| | $ | 140,716 |
|
|
| | | | | | | |
| | September 30, 2017 |
| | December 31, 2016 |
|
| Program rights: | | | |
| Acquired program rights, net of amortization | $ | 165,283 |
| | $ | 146,070 |
|
| Less: current portion of acquired program rights | (70,510 | ) | | (69,662 | ) |
| Total non-current acquired program rights | 94,773 |
| | 76,408 |
|
| Produced program rights – feature films: | | | |
|
| Released, net of amortization | 983 |
| | 1,039 |
|
| Produced program rights – television programs: | |
| | |
|
| Released, net of amortization | 49,286 |
| | 43,970 |
|
| Completed and not released | 9,414 |
| | 2,592 |
|
| In production | 33,181 |
| | 19,109 |
|
| Development and pre-production | 847 |
| | 310 |
|
| Total produced program rights | 93,711 |
| | 67,020 |
|
| Total non-current acquired program rights and produced program rights | $ | 188,484 |
| | $ | 143,428 |
|
7. ACCOUNTS RECEIVABLE
Accounts receivable comprised the following at September 30, 2017 and December 31, 2016:
|
| | | | | | | |
| | September 30, 2017 |
| | December 31, 2016 |
|
| Unrelated customers | $ | 132,051 |
| | $ | 149,957 |
|
| Less: allowance for bad debts and credit notes | (9,645 | ) | | (8,586 | ) |
| Total accounts receivable | $ | 122,406 |
| | $ | 141,371 |
|
8.6. OTHER ASSETS
Other current and non-current assets comprised the following at SeptemberJune 30, 20172020 and December 31, 20162019:
|
| | | | | | | |
| | June 30, 2020 |
| | December 31, 2019 |
|
Current: | | | |
| Prepaid acquired programming | $ | 21,996 |
| | $ | 27,237 |
|
| Other prepaid expenses | 9,746 |
| | 12,775 |
|
| VAT recoverable | 719 |
| | 7,775 |
|
| Other | 422 |
| | 1,045 |
|
| Total other current assets | $ | 32,883 |
| | $ | 48,832 |
|
| | | | |
| | June 30, 2020 |
| | December 31, 2019 |
|
| Non-current: | |
| | |
|
| Capitalized debt costs (Note 4) | $ | 6,157 |
| | $ | 7,277 |
|
| Deferred tax | 1,883 |
| | 2,261 |
|
| Operating lease right-of-use assets (Note 10) | 11,940 |
| | 11,682 |
|
| Other | 941 |
| | 947 |
|
| Total other non-current assets | $ | 20,921 |
| | $ | 22,167 |
|
|
| | | | | | | |
| | September 30, 2017 |
| | December 31, 2016 |
|
Current: | | | |
| Prepaid acquired programming | $ | 18,089 |
| | $ | 19,123 |
|
| Other prepaid expenses | 6,657 |
| | 4,610 |
|
| VAT recoverable | 358 |
| | 635 |
|
| Income taxes recoverable | 321 |
| | 166 |
|
| Other | 2,772 |
| | 3,007 |
|
| Total other current assets | $ | 28,197 |
| | $ | 27,541 |
|
| | | | |
| | September 30, 2017 |
| | December 31, 2016 |
|
| Non-current: | |
| | |
|
| Capitalized debt costs | $ | 13,764 |
| | $ | 15,019 |
|
| Deferred tax | 5,282 |
| | 4,550 |
|
| Other | 1,319 |
| | 1,704 |
|
| Total other non-current assets | $ | 20,365 |
| | $ | 21,273 |
|
Capitalized debt costs are being amortized over7. PROPERTY, PLANT AND EQUIPMENT
Property, plant and equipment comprised the term of the 2021 Revolving Credit Facility using the straight-line method.following at June 30, 2020 and December 31, 2019:
|
| | | | | | | |
| | June 30, 2020 |
| | December 31, 2019 |
|
| Land and buildings | $ | 98,241 |
| | $ | 100,502 |
|
| Machinery, fixtures and equipment | 209,633 |
| | 212,810 |
|
| Other equipment | 34,668 |
| | 36,007 |
|
| Software | 68,902 |
| | 70,294 |
|
| Construction in progress | 1,560 |
| | 4,774 |
|
| Total cost | 413,004 |
| | 424,387 |
|
| Less: accumulated depreciation | (310,626 | ) | | (310,486 | ) |
| Total net book value | $ | 102,378 |
| | $ | 113,901 |
|
| | | | |
| Assets held under finance leases (included in the above) | |
| | |
|
| Land and buildings | $ | — |
| | $ | 3,914 |
|
| Machinery, fixtures and equipment | 33,345 |
| | 31,961 |
|
| Total cost | 33,345 |
| | 35,875 |
|
| Less: accumulated depreciation | (16,368 | ) | | (15,799 | ) |
| Total net book value | $ | 16,977 |
| | $ | 20,076 |
|
CENTRAL EUROPEAN MEDIA ENTERPRISES LTD.
NOTES TO CONDENSED CONSOLIDATED FINANCIAL STATEMENTS
(Tabular amounts in US$ 000’s, except share and per share data)
(Unaudited)
9. PROPERTY, PLANT AND EQUIPMENT
Property, plant and equipment comprised the following at September 30, 2017 and December 31, 2016:
|
| | | | | | | |
| | September 30, 2017 |
| | December 31, 2016 |
|
| Land and buildings | $ | 84,300 |
| | $ | 72,820 |
|
| Machinery, fixtures and equipment | 190,869 |
| | 160,097 |
|
| Other equipment | 15,689 |
| | 13,682 |
|
| Software licenses | 50,152 |
| | 40,627 |
|
| Construction in progress | 2,092 |
| | 5,311 |
|
| Total cost | 343,102 |
| | 292,537 |
|
| Less: accumulated depreciation | (242,794 | ) | | (203,457 | ) |
| Total net book value | $ | 100,308 |
| | $ | 89,080 |
|
| | | | |
| Assets held under capital leases (included in the above) | |
| | |
|
| Machinery, fixtures and equipment | $ | 12,875 |
| | $ | 6,338 |
|
| Total cost | 12,875 |
| | 6,338 |
|
| Less: accumulated depreciation | (4,382 | ) | | (2,579 | ) |
| Total net book value | $ | 8,493 |
| | $ | 3,759 |
|
The movement in the net book value of property, plant and equipment during the ninesix months ended SeptemberJune 30, 20172020 and 20162019 was comprised of:
|
| | | | | | | |
| | For the Six Months Ended June 30, |
| | 2020 |
| | 2019 |
|
| Opening balance | $ | 113,901 |
| | $ | 117,604 |
|
Additions (1) | 7,064 |
| | 10,200 |
|
| Disposals | (23 | ) | | (2 | ) |
| Depreciation | (15,899 | ) | | (16,380 | ) |
| Foreign currency movements | (2,665 | ) | | (795 | ) |
| Ending balance | $ | 102,378 |
| | $ | 110,627 |
|
|
| | | | | | | |
| | For the Nine Months Ended September 30, |
| | 2017 |
| | 2016 |
|
| Opening balance | $ | 89,080 |
| | $ | 87,943 |
|
| Additions | 18,547 |
| | 15,163 |
|
| Disposals | (71 | ) | | (43 | ) |
| Depreciation | (19,345 | ) | | (17,134 | ) |
| Foreign currency movements | 12,097 |
| | 2,545 |
|
| Ending balance | $ | 100,308 |
| | $ | 88,474 |
|
| |
(1) | Includes assets acquired under finance leases. For additional information see Note 10, "Leases". |
10.8. ACCOUNTS PAYABLE AND ACCRUED LIABILITIES
Accounts payable and accrued liabilities comprised the following at SeptemberJune 30, 20172020 and December 31, 20162019:
|
| | | | | | | |
| | June 30, 2020 |
| | December 31, 2019 |
|
| Accounts payable and accrued expenses | $ | 47,357 |
| | $ | 56,343 |
|
| Related party accounts payable | 128 |
| | 267 |
|
| Programming liabilities | 17,889 |
| | 17,293 |
|
| Related party programming liabilities | 11,714 |
| | 10,553 |
|
| Duties and other taxes payable | 11,102 |
| | 9,426 |
|
Accrued staff costs (1) | 23,141 |
| | 24,027 |
|
| Accrued interest payable | 2,075 |
| | 2,104 |
|
| Related party accrued interest payable (including Guarantee Fees) | 1,084 |
| | 1,103 |
|
| Income taxes payable | 11,094 |
| | 10,304 |
|
| Other accrued liabilities | 5,329 |
| | 4,230 |
|
| Total accounts payable and accrued liabilities | $ | 130,913 |
| | $ | 135,650 |
|
|
| | | | | | | |
| | September 30, 2017 |
| | December 31, 2016 |
|
| Accounts payable and accrued expenses | $ | 54,416 |
| | $ | 45,037 |
|
| Related party accounts payable | 69 |
| | 194 |
|
| Programming liabilities | 25,265 |
| | 26,603 |
|
| Related party programming liabilities | 17,065 |
| | 17,126 |
|
| Duties and other taxes payable | 7,797 |
| | 10,325 |
|
| Accrued staff costs | 17,439 |
| | 16,476 |
|
| Accrued interest payable | 3,228 |
| | 2,935 |
|
| Related party accrued interest payable (including Guarantee Fees) | 24,176 |
| | 9,588 |
|
| Income taxes payable | 7,159 |
| | 5,091 |
|
| Other accrued liabilities | 708 |
| | 1,003 |
|
| Total accounts payable and accrued liabilities | $ | 157,322 |
| | $ | 134,378 |
|
9. OTHER LIABILITIES
Other current and non-current liabilities comprised the following at June 30, 2020and December 31, 2019:
|
| | | | | | | |
| | June 30, 2020 |
| | December 31, 2019 |
|
| Current: | | | |
| Deferred revenue | $ | 24,114 |
| | $ | 9,451 |
|
| Legal provisions | 637 |
| | 635 |
|
| Derivative instruments (Note 11) | 949 |
| | — |
|
| Operating lease liabilities (Note 10) | 3,380 |
| | 3,203 |
|
| Other | 200 |
| | 226 |
|
| Total other current liabilities | $ | 29,280 |
| | $ | 13,515 |
|
| | | | |
| | June 30, 2020 |
| | December 31, 2019 |
|
| Non-current: | |
| | |
|
| Deferred tax liabilities | $ | 23,062 |
| | $ | 21,294 |
|
| Derivative instruments (Note 11) | 11,326 |
| | 12,670 |
|
| Operating lease liabilities (Note 10) | 8,503 |
| | 8,434 |
|
| Related party Guarantee Fee payable (Note 4) | 33,465 |
| | 33,465 |
|
| Other | 3,720 |
| | 4,137 |
|
| Total other non-current liabilities | $ | 80,076 |
| | $ | 80,000 |
|
During the three and six months ended June 30, 2020 and 2019, we recognized revenue of US$ 2.4 million and US$ 5.8 million, respectively; and US$ 2.8 million and US$ 5.6 million, respectively, which was deferred as at December 31, 2019 and 2018, respectively.
CENTRAL EUROPEAN MEDIA ENTERPRISES LTD.
NOTES TO CONDENSED CONSOLIDATED FINANCIAL STATEMENTS
(Tabular amounts in US$ 000’s, except share and per share data)
(Unaudited)
11. OTHER LIABILITIES10. LEASES
Other currentWe enter into operating and non-currentfinance leases for offices, production and related facilities, cars and certain other equipment. Our leases have remaining lease terms up to ten years.
The components of lease cost for the three and six months ended June 30, 2020 and 2019 were as follows:
|
| | | | | | | | | | | | | | | |
| | For the Three Months Ended June 30, | | For the Six Months Ended June 30, |
| | 2020 | | 2019 | | 2020 | | 2019 |
| Operating lease cost: | | | | | | | |
| Short-term operating lease cost | $ | 545 |
| | $ | 1,128 |
| | $ | 1,691 |
| | $ | 2,812 |
|
| Long-term operating lease cost | 1,193 |
| | 1,149 |
| | 2,430 |
| | 2,299 |
|
| Total operating lease cost | $ | 1,738 |
| | $ | 2,277 |
| | $ | 4,121 |
| | $ | 5,111 |
|
| | | | | | | | |
| Finance lease cost: | | | | | | | |
| Amortization of right-of-use asset | $ | 1,625 |
| | $ | 1,464 |
| | $ | 3,213 |
| | $ | 2,719 |
|
| Interest on lease liabilities | 84 |
| | 88 |
| | 167 |
| | 196 |
|
| Total finance lease cost | $ | 1,709 |
| | $ | 1,552 |
| | $ | 3,380 |
| | $ | 2,915 |
|
The classification of cash flows related to our leases for the six months ended June 30, 2020 and 2019 was as follows:
|
| | | | | | | |
| | For the Six Months Ended June 30, |
| | 2020 | | 2019 |
| Cash paid for amounts included in the measurement of lease liabilities: | | | |
| Operating cash flows from operating leases | $ | 2,322 |
| | $ | 2,749 |
|
| Operating cash flows from finance leases | 188 |
| | 186 |
|
| Financing cash flows from finance leases | 3,918 |
| | 3,395 |
|
| | | | |
| Right-of-use assets obtained in exchange for lease obligations: | | | |
| Operating leases | $ | 2,169 |
| | $ | 2,607 |
|
| Finance leases | 1,599 |
| | 2,746 |
|
CENTRAL EUROPEAN MEDIA ENTERPRISES LTD.
NOTES TO CONDENSED CONSOLIDATED FINANCIAL STATEMENTS
(Tabular amounts in US$ 000’s, except share and per share data)
(Unaudited)
Our assets and liabilities related to our leasing arrangements comprised the following at SeptemberJune 30, 20172020 and December 31, 20162019: |
| | | | | | | |
| | June 30, 2020 |
| | December 31, 2019 |
|
| Operating Leases | | | |
| Operating lease right-of-use-assets, gross | $ | 17,026 |
| | $ | 15,396 |
|
| Accumulated amortization | (5,086 | ) | | (3,714 | ) |
| Operating lease right-of-use-assets, net | $ | 11,940 |
| | $ | 11,682 |
|
| | | | |
| Other current liabilities | $ | 3,380 |
| | $ | 3,203 |
|
| Other non-current liabilities | 8,503 |
| | 8,434 |
|
| Total operating lease liabilities | $ | 11,883 |
| | $ | 11,637 |
|
| | | | |
| Finance Leases | | | |
| Property, plant and equipment, gross | $ | 33,345 |
| | $ | 35,875 |
|
| Accumulated depreciation | (16,368 | ) | | (15,799 | ) |
| Property, plant and equipment, net | $ | 16,977 |
| | $ | 20,076 |
|
| | | | |
| Current portion of long-term debt and other financing arrangements | $ | 6,952 |
| | $ | 6,836 |
|
| Long-term debt and other financing arrangements | 7,671 |
| | 9,496 |
|
| Total finance lease liabilities | $ | 14,623 |
| | $ | 16,332 |
|
| | | | |
| Weighted Average Remaining Lease Term in Years | | | |
| Operating leases | 4.8 |
| | 4.9 |
|
| Finance leases | 2.6 |
| | 2.7 |
|
| | | | |
| Weighted Average Discount Rate | | | |
| Operating leases | 4.8 | % | | 4.7 | % |
| Finance leases | 2.0 | % | | 2.1 | % |
Our lease liabilities had the following maturities at June 30, 2020: |
| | | | | | | |
| | Operating Leases |
| | Finance Leases |
|
| 2020 | $ | 2,849 |
| | $ | 3,739 |
|
| 2021 | 2,558 |
| | 6,107 |
|
| 2022 | 2,476 |
| | 3,392 |
|
| 2023 | 1,886 |
| | 1,614 |
|
| 2024 | 1,345 |
| | 160 |
|
| 2025 and thereafter | 2,307 |
| | — |
|
| Total undiscounted payments | 13,421 |
| | 15,012 |
|
| Less: amounts representing interest | (1,538 | ) | | (389 | ) |
| Present value of net minimum lease payments | $ | 11,883 |
| | $ | 14,623 |
|
|
| | | | | | | |
| | September 30, 2017 |
| | December 31, 2016 |
|
| Current: | | | |
| Deferred revenue | $ | 19,413 |
| | $ | 4,979 |
|
| Legal provision | 2,926 |
| | 2,412 |
|
| Other | 1,196 |
| | 1,076 |
|
| Total other current liabilities | $ | 23,535 |
| | $ | 8,467 |
|
| | | | |
| | September 30, 2017 |
| | December 31, 2016 |
|
| Non-current: | |
| | |
|
| Deferred tax | $ | 21,527 |
| | $ | 19,710 |
|
Related party Commitment Fee payable (1) | 10,322 |
| | 9,905 |
|
| Related party Guarantee Fee payable (Note 5) | 49,682 |
| | 34,492 |
|
| Other | 5,699 |
| | 3,856 |
|
| Total other non-current liabilities | $ | 87,230 |
| | $ | 67,963 |
|
| |
(1)
| Represents the commitment fee (the "Commitment Fee") payable to Time Warner, including accrued interest, in respect of its obligation under a commitment letter dated November 14, 2014 between Time Warner and us whereby Time Warner agreed to provide or assist with arranging a loan facility to repay our 5.0% senior convertible notes at maturity in November 2015. The Commitment Fee is payable by November 1, 2019, the maturity date of the 2019 Euro Term Loan, or earlier if the repayment of the 2019 Euro Term Loan is accelerated. The Commitment Fee bears interest at 8.5% per annum and such interest is payable in arrears on each May 1 and November 1, and may be paid in cash or in kind, at our election. |
12.11. FINANCIAL INSTRUMENTS AND FAIR VALUE MEASUREMENTS
ASC 820, “Fair"Fair Value Measurements and Disclosure”Disclosure", establishes a hierarchy that prioritizes the inputs to those valuation techniques used to measure fair value. The hierarchy gives the highest priority to unadjusted quoted prices in active markets for identical assets or liabilities (Level 1 measurements) and the lowest priority to unobservable inputs (Level 3 measurements). The three levels of the fair value hierarchy are:
Basis of Fair Value Measurement
| |
| Level 1 | Unadjusted quoted prices in active markets that are accessible at the measurement date for identical, unrestricted instruments. |
| |
| Level 2 | Quoted prices in markets that are not considered to be active or financial instruments for which all significant inputs are observable, either directly or indirectly. |
| |
| Level 3 | Prices or valuations that require inputs that are both significant to the fair value measurement and unobservable. |
A financial instrument’s level within the fair value hierarchy is based on the lowest level of any input that is significant to the fair value measurement.
CENTRAL EUROPEAN MEDIA ENTERPRISES LTD.
NOTES TO CONDENSED CONSOLIDATED FINANCIAL STATEMENTS
(Tabular amounts in US$ 000’s, except share and per share data)
(Unaudited)
We evaluate the position of each financial instrument measured at fair value in the hierarchy individually based on the valuation methodology we apply. The carrying amount of financial instruments, including cash and cash equivalents, accounts receivable, and accounts payable and accrued liabilities, approximate their fair value due to the short-term nature of these items. The fair value of our long-term debt is included in Note 5,4, "Long-term Debt and Other Financing Arrangements".
Hedging Activities
Cash Flow Hedges of Interest Rate Risk
We are party to interest rate swap agreements to mitigate our exposure to interest rate fluctuations on the outstanding principal amount of the Euro Term Loans. These interest rate swaps designated as cash flow hedges, provide us with variable-rate cash receipts in exchange for fixed-rate payments over the lives of the agreements, with no exchange of the underlying notional amount. These instruments are carried at fair value on our condensed consolidated balance sheets as other current and other non-current liabilities based on their maturity, and the effective portion of the changes in the fair value is recorded in accumulated other comprehensive income / loss and subsequently reclassified to interest expense when the hedged item affects earnings. The ineffective portion of changes in the fair value is recognized immediately in other non-operating income, net in our condensed consolidated statements of operations and comprehensive income / loss. For the three and nine months ended September 30, 2017 and 2016, we did not recognize any charges related to hedge ineffectiveness.
CENTRAL EUROPEAN MEDIA ENTERPRISES LTD.
NOTES TO CONDENSED CONSOLIDATED FINANCIAL STATEMENTS
(Tabular amounts in US$ 000’s, except share and per share data)
(Unaudited)
Information relating to financial instruments is as follows: |
| | | | | | | | | | | | | | | | | |
| Trade Date | | Number of Contracts |
| | Description | | Aggregate Notional Amount |
| | Maturity Date | | Objective | | Fair Value as at September 30, 2017 |
|
| April 5, 2016 | | 5 |
| | Interest rate swap | | EUR | 468,800 |
| | February 21, 2021 | | Interest rate hedge underlying 2021 Euro Term Loan | | $ | (1,798 | ) |
| April 5, 2016 | | 4 |
| | Interest rate swap | | EUR | 200,800 |
| | November 1, 2018 | | Interest rate hedge underlying 2018 Euro Term Loan, forward starting on November 1, 2017 | | $ | (338 | ) |
| November 10, 2015 | | 3 |
| | Interest rate swap | | EUR | 235,335 |
| | November 1, 2019 | | Interest rate hedge underlying 2019 Euro Term Loan | | $ | (1,587 | ) |
| November 14, 2014 | | 2 |
| | Interest rate swap | | EUR | 200,800 |
| | November 1, 2017 | | Interest rate hedge underlying 2018 Euro Term Loan | | $ | (52 | ) |
We value the interest rate swap agreements using a valuation model which calculates the fair value on the basis of the net present value of the estimated future cash flows. The most significant input used in the valuation model is the expected EURIBOR-based yield curve. These instruments were allocated to Level 2 of the fair value hierarchy because the critical inputs to this model, including current interest rates, relevant yield curves and the known contractual terms of the instruments, were readily observable.
In August we settledAs at June 30, 2020 each instrument is designated as a cash flow hedge. All changes in part the interest rate swaps underlying the 2018 Euro Term Loan to align with the EUR 50.0 million reduction of the principal balance of that loan following the repayment on August 1, 2017 (see Note 5, "Long-term Debt and Other Financing Arrangements"). Changes in fair value for the settled portion of these interest rate swaps is recognized within other non-operating income, net in our condensed consolidated statements of operations and comprehensive income / loss.
The expected proceeds from the sale of the Croatia and Slovenia segments will be used to satisfy amounts owing in respect of the 2018 Euro Term Loan (see Note 5, "Long-term Debt and Other Financing Arrangements"). It is probable the sale will complete prior to the initial interest payment on the interest rate swap maturing November 1, 2018 which precludes recognition of the effective portion of the changes in fair value within accumulated other comprehensive income / loss. All related fair value adjustments and those previously recognizedinstruments are recorded in accumulated other comprehensive income / loss are recognized in other non-operating income, net in our condensed consolidated statements of operations and comprehensive income / loss (see Note 14, "Equity").subsequently reclassified to interest expense when the hedged item affects earnings.
Foreign Currency Risk
We have entered into the below forward foreign exchange contracts to reduce our exposure to movements in foreign exchange rates related to contractual payments under certain dollar-denominated agreements. Information relating to financial instruments as at September 30, 2017 is as follows: |
| | | | | | | | | | | | | | | |
| Trade Date | | Number of Contracts |
| | Aggregate Notional Amount |
| | Maturity Date | | Objective | | Fair Value as at June 30, 2020 |
|
| April 5, 2016 | | 5 |
| | EUR | 468,800 |
| | February 19, 2021 | | Interest rate hedge underlying 2023 Euro Loan | | $ | (949 | ) |
| April 26, 2018 | | 3 |
| | EUR | 60,335 |
| | November 1, 2021 | | Interest rate hedge underlying 2021 Euro Loan | | $ | (427 | ) |
| April 26, 2018 | | 4 |
| | EUR | 468,800 |
| | April 26, 2023 | | Interest rate hedge underlying 2023 Euro Loan, forward starting on February 19, 2021 | | $ | (10,899 | ) |
|
| | | | | | | | | | | | | | | | | |
| Trade Date | | Number of Contracts |
| | Description | | Aggregate Notional Amount |
| | Maturity Date | | Objective | | Fair Value as at September 30, 2017 |
|
| January 31, 2017 | | 1 |
| | EUR / USD forward | | $ | 7,720 |
| | December 21, 2017 | | USD-denominated operating payments | | $ | (687 | ) |
| July 21, 2017 | | 1 |
| | EUR / USD forward | | $ | 18,530 |
| | December 20, 2017 | | USD-denominated operating payments | | $ | (228 | ) |
These forward foreign exchange contracts are considered economic hedges but were not designated as hedging instruments, so changes in the fair value of the derivatives were recorded in other non-operating income, net in the condensed consolidated statements of operations and comprehensive income / loss and in the condensed consolidated balance sheet in other current liabilities. We valued these contracts using an industry-standard pricing model which calculated the fair value on the basis of the net present value of the estimated future cash flows receivable or payable. These instruments were allocated to Level 2 of the fair value hierarchy because the critical inputs to this model, including foreign exchange forward rates and the known contractual terms of the instruments, were readily observable.
Fair Value of Derivatives
The change in fair value of derivatives not recognized within accumulated other comprehensive income / loss comprised the following for the three and nine months ended September 30, 2017 and 2016: |
| | | | | | | | | | | | | | | |
| | For the Three Months
Ended September 30, | | For the Nine Months
Ended September 30, |
| | 2017 |
| | 2016 |
| | 2017 |
| | 2016 |
|
| Loss on currency swaps | $ | (696 | ) | | $ | (398 | ) | | $ | (1,428 | ) | | $ | (11,904 | ) |
| Loss on interest rate swaps | (454 | ) | | — |
| | (454 | ) | | — |
|
| Change in fair value of derivatives | $ | (1,150 | ) | | $ | (398 | ) | | $ | (1,882 | ) | | $ | (11,904 | ) |
CENTRAL EUROPEAN MEDIA ENTERPRISES LTD.
NOTES TO CONDENSED CONSOLIDATED FINANCIAL STATEMENTS
(Tabular amounts in US$ 000’s, except share and per share data)
(Unaudited)
13.12. CONVERTIBLE REDEEMABLE PREFERRED SHARES
200,000 shares of our Series B Convertible Redeemable Preferred Stock, par value US$ 0.08 per share (the “Series B Preferred Shares”), were issued and outstanding as at SeptemberJune 30, 20172020 and December 31, 2016. As at September 30, 2017 and December 31, 2016, the carrying value of the Series B Preferred Shares was US$ 262.1 million and US$ 254.9 million, respectively.2019. The Series B Preferred Shares are held by Time Warner Media Holdings B.V. ("TW Investor")., a wholly owned subsidiary of AT&T. As at June 30, 2020 and December 31, 2019, the accreted value of September 30, 2017, the 200,000 Series B Preferred Shares was US$ 269.4 million. The Series B Preferred Shares have a stated value of US$ 1,000 per share and no longer accrete subsequent to June 24, 2018. As of June 30, 2020, the 200,000 shares of Series B preferred stock were convertible into approximately 108.1111.1 million shares of Class A common stock.
The initial stated valuePursuant to the Certificate of Designation of the Series B Preferred Shares, of US$ 1,000 per share accretes at an annual rate of 3.75%, compounded quarterly, from June 25, 2016 to June 24, 2018. We have the right to pay cash to the holder in lieu of any further accretion. Eacheach Series B Preferred Share may, at the holder's option, be converted into the number of shares of our Class A common stock determined by dividing (i) the accreted stated value plus accrued but unpaid dividends, if any, in each case as of the conversion date, by (ii) the conversion price, which was approximately US$ 2.42 at SeptemberJune 30, 2017,2020, but is subject to adjustment from time to time pursuant to customary weighted-average anti-dilution provisions with respect to our issuances of equity or equity-linked securities at a price below the then-applicable conversion price (excluding any securities issued under our benefit plans at or above fair market value). We have the right to redeem the Series B Preferred Shares in whole or in part upon 30 days'days' written notice. The redemption price of each outstanding Series B Preferred Share is equal to its accreted stated value plus accrued but unpaid dividends, if any, in each case as of the redemption date specified in the redemption notice. After receipt of a redemption notice, each holder of Series B Preferred Shares will have the right to convert, prior to the date of redemption, all or part of such Series B Preferred Shares to be redeemed by us into shares of our Class A common stock in accordance with the terms of conversion described above.
Holders of the Series B Preferred Shares have no voting rights on any matter presented to holders of any class of our capital stock, with the exception that they may vote with holders of shares of our Class A common stock (i) with respect to a change of control event or (ii) as provided by our Bye-laws or applicable Bermuda law. Holders of Series B Preferred Shares will participate in any dividends declared or paid on our Class A common stock on an as-converted basis. The Series B Preferred Shares will rank pari passu with our Series A Convertible Preferred Stock and senior to all other equity securities of the Company in respect of payment of dividends and distribution of assets upon liquidation. The Series B Preferred Shares have such other rights, powers and preferences as are set forth in the Certificate of Designation for the Series B Preferred Shares.
We concluded that the Series B Preferred Shares were not considered a liability and that the embedded conversion feature in the Series B Preferred Shares was clearly and closely related to the host contract and therefore did not need to be bifurcated. The Series B Preferred Shares are required to be classified outside of permanent equity because such shares can be redeemed for cash in certain circumstances.not considered a liability and the embedded conversion feature does not require bifurcation. The Series B Preferred Shares are carried on the balance sheetclassified outside of permanent equity at redemption value. As the Series B Preferred Shares are redeemable, we have accreted changes in the redemption value since issuance. For the three and nine months ended September 30, 2017 and 2016, we recognized accretion on the Series B Preferred Shares of US$ 2.5 million and US$ 7.2 million; and US$ 2.4 million and US$ 11.3 million, respectively, with corresponding decreases in additional paid-in capital.
14.
CENTRAL EUROPEAN MEDIA ENTERPRISES LTD.
NOTES TO CONDENSED CONSOLIDATED FINANCIAL STATEMENTS
(Tabular amounts in US$ 000’s, except share and per share data)
(Unaudited)
13. EQUITY
Preferred Stock
5,000,000 shares of Preferred Stock were authorized as at SeptemberJune 30, 20172020 and December 31, 20162019.
OneNaN share of Series A Convertible Preferred Stock (the "Series A Preferred Share") was issued and outstanding as at SeptemberJune 30, 20172020 and December 31, 20162019. ThePursuant to the Certificate of Designation of the Series A Preferred Share, the Series A Preferred Share is convertible into 11,211,449 shares of Class A common stock on the date that is 61 days after the date on which the ownership of our outstanding shares of Class A common stock by a group that includes TW Investor and its affiliates would not be greater than 49.9%. The Series A Preferred Share is entitled to one vote per each share of Class A common stock into which it is convertible and has such other rights, powers and preferences, including potential adjustments to the number of shares of Class A common stock to be issued upon conversion, as are set forth in the Certificate of Designation for the Series A Preferred Share.Designation.
200,000 shares of Series B Preferred Shares were issued and outstanding as at SeptemberJune 30, 20172020 and December 31, 20162019 (see Note 13,12, "Convertible Redeemable Preferred Shares"). As of SeptemberJune 30, 2017,2020, the 200,000 Series B Preferred Shares were convertible into approximately 108.1111.1 million shares of Class A common stock.
Class A and Class B Common Stock
440,000,000 shares of Class A common stock and 15,000,000 shares of Class B common stock were authorized as at SeptemberJune 30, 20172020 and December 31, 20162019. The rights of the holders of Class A common stock and Class B common stock are identical except for voting rights. The shares of Class A common stock are entitled to one vote per share and the shares of Class B common stock are entitled to ten votes per share. Shares of Class B common stock are convertible into shares of Class A common stock on a one1-for-one1 basis for no additional consideration.consideration and automatically convert into shares of Class A common stock on a one-for-one basis when the number of shares of Class B common stock is less than 10% of the total number of shares of common stock outstanding. Holders of each class of shares are entitled to receive dividends and upon liquidation or dissolution are entitled to receive all assets available for distribution to holders of our common stock. Under our Bye-laws, the holders of each class have no preemptivepre-emptive or other subscription rights and there are no redemption or sinking fund provisions with respect to such shares.
There were 144.9254.5 million and 143.4253.6 million shares of Class A common stock outstanding at SeptemberJune 30, 20172020 and December 31, 20162019, respectively, and no0 shares of Class B common stock outstanding at SeptemberJune 30, 20172020 or December 31, 20162019.
As at SeptemberJune 30, 20172020, TW Investor owns 42.4%63.8% of the outstanding shares of Class A common stockstock. In April 2018, Warner Media and has a 46.5% voting interest inTW Investor issued standing proxies to the independent directors of the Company, duepursuant to which they granted the right to vote approximately 100.9 million shares of Class A common stock (the “Warrant Shares”) on all matters other than at any meeting where the agenda includes a change in control transaction. In accordance with these proxies, the Warrant Shares will be voted in proportion to votes cast at a general meeting of the Company, excluding such Warrant Shares. This proxy arrangement will remain in effect until April 2021. As a result of the standing proxies, after giving effect to its ownership of the Series A Preferred Share.
Warrants
On May 2, 2014, we issued 114,000,000 warrants in connection with a rights offering. Each warrant may be exercised until May 2, 2018 and entitles the holder thereof to receive one share of our Class A common stock at an exercise price of US$ 1.00 per share in cash. During the nine months ended September 30, 2017, 563,325 warrants were exercised resulting in net proceeds to us of approximately US$ 0.6 million. As at September 30, 2017, 106,439,720 warrants remained outstanding. Time Warner andShare, TW Investor collectively hold 100,926,996 of these warrants. The warrants are classifiedhas a 44.1% voting interest in additional paid-in capital, a component of equity, and are not subject to subsequent revaluation.the Company.
Accumulated Other Comprehensive Loss
The movement in accumulated other comprehensive loss during the ninethree and six months ended SeptemberJune 30, 20172020 and 2019 comprised the following:
|
| | | | | | | | | | | | | | | |
| | For the Three Months Ended June 30, | | For the Six Months Ended June 30, |
| | 2020 |
| | 2019 |
| | 2020 |
| | 2019 |
|
| BALANCE, beginning of period | $ | (287,919 | ) | | $ | (235,961 | ) | | $ | (226,916 | ) | | $ | (216,650 | ) |
| | | | | | | | |
| Currency translation adjustment, net | | | | | | | |
| Balance, beginning of period | $ | (275,178 | ) | | $ | (223,648 | ) | | $ | (213,955 | ) | | $ | (207,668 | ) |
Foreign exchange gain / (loss) on intercompany loans (1) | 5,180 |
| | 2,868 |
| | (12,894 | ) | | 2,256 |
|
| Foreign exchange gain / (loss) on the Series B Preferred Shares | 5,884 |
| | 3,455 |
| | (866 | ) | | (1,651 | ) |
| Currency translation adjustments | 14,672 |
| | 10,770 |
| | (21,727 | ) | | 508 |
|
| Balance, end of period | $ | (249,442 | ) | | $ | (206,555 | ) | | $ | (249,442 | ) | | $ | (206,555 | ) |
| | | | | | | | |
| Unrealized loss on derivative instruments designated as hedging instruments | | | | | | | |
| Balance, beginning of period | $ | (12,741 | ) | | $ | (12,313 | ) | | $ | (12,961 | ) | | $ | (8,982 | ) |
| Change in the fair value of hedging instruments | (316 | ) | | (1,700 | ) | | (535 | ) | | (5,402 | ) |
| Amounts reclassified from accumulated other comprehensive loss: | | | | | | | |
| Changes in fair value of hedging instruments reclassified to interest expense | 438 |
| | 480 |
| | 877 |
| | 851 |
|
| Balance, end of period | $ | (12,619 | ) | | $ | (13,533 | ) | | $ | (12,619 | ) | | $ | (13,533 | ) |
| | | | | | | | |
| BALANCE, end of period | $ | (262,061 | ) | | $ | (220,088 | ) | | $ | (262,061 | ) | | $ | (220,088 | ) |
|
| | | | | | | | | | | |
| | Currency translation adjustment, net |
| | (Loss) / Gain on derivative instruments designated as hedging instruments |
| | TOTAL Accumulated Other Comprehensive Loss |
|
| BALANCE December 31, 2016 | $ | (239,537 | ) | | $ | (4,451 | ) | | $ | (243,988 | ) |
| Other comprehensive income / (loss) before reclassifications: | | | | | |
Foreign exchange gain on intercompany transactions (1) | 7,824 |
| | — |
| | 7,824 |
|
| Foreign exchange gain on the Series B Preferred Shares | 29,284 |
| | — |
| | 29,284 |
|
| Currency translation adjustment | 5,891 |
| | — |
| | 5,891 |
|
| Change in the fair value of hedging instruments | — |
| | (1,484 | ) | | (1,484 | ) |
| Amounts reclassified from accumulated other comprehensive loss: | | | | |
|
|
| Changes in fair value reclassified to interest expense | — |
| | 2,120 |
| | 2,120 |
|
Changes in fair value reclassified to other non-operating income, net (2) | — |
| | 447 |
| | 447 |
|
| Net other comprehensive income | 42,999 |
| | 1,083 |
| | 44,082 |
|
| BALANCE September 30, 2017 | $ | (196,538 | ) | | $ | (3,368 | ) | | $ | (199,906 | ) |
| |
(1) | Represents foreign exchange gains and losses on intercompany loans that are of a long-term investment nature and which are reported in the same manner as translation adjustments. |
| |
(2)
| We will repay the 2018 Euro Term Loan with the expected proceeds from the sale of the Croatia and Slovenia segments (see Note 5, "Long-term Debt and Other Financing Arrangements"). It is probable the sale will complete prior to the initial interest payment on the interest rate swap maturing on November 1, 2018 which precludes recognition of the effective portion of the changes in fair value within accumulated other comprehensive income / loss. All related changes in fair value and those previously recognized in accumulated other comprehensive income / loss are recognized in other non-operating income, net in our condensed consolidated statements of operations and comprehensive income / loss. See Note 12, "Financial Instruments and Fair Value Measurements". |
15. INTEREST EXPENSE
Interest expense comprised the following for the three and nine months ended September 30, 2017 and 2016:
|
| | | | | | | | | | | | | | | |
| | For the Three Months
Ended September 30, | | For the Nine Months
Ended September 30, |
| | 2017 |
| | 2016 |
| | 2017 |
| | 2016 |
|
| Interest on long-term debt and other financing arrangements | $ | 16,850 |
| | $ | 21,000 |
| | $ | 50,491 |
| | $ | 70,236 |
|
| Amortization of capitalized debt issuance costs | 1,502 |
| | 1,424 |
| | 4,282 |
| | 7,459 |
|
| Amortization of debt issuance discount | — |
| | — |
| | — |
| | 12,945 |
|
| Total interest expense | $ | 18,352 |
| | $ | 22,424 |
| | $ | 54,773 |
| | $ | 90,640 |
|
We paid cash interest (including mandatory cash-pay Guarantee Fees) of US$ 22.2 million and US$ 38.3 millionduring the nine months ended September 30, 2017 and 2016, respectively. In addition, we paid US$ 1.4 million and US$ 5.5 million of Guarantee Fees in cash during the nine months ended September 30, 2017 and 2016, respectively, for which we had the option to pay in kind. Interest expense related to the 2018 Euro Term Loan has been allocated to results from discontinued operations (see Note 3, "Discontinued Operations and Assets Held for Sale").
16. OTHER NON-OPERATING INCOME / EXPENSE
Other non-operating income / expense comprised the following for the three and nine months ended September 30, 2017 and 2016:
|
| | | | | | | | | | | | | | | |
| | For the Three Months
Ended September 30, | | For the Nine Months
Ended September 30, |
| | 2017 |
| | 2016 |
| | 2017 |
| | 2016 |
|
| Interest income | $ | 139 |
| | $ | 89 |
| | $ | 326 |
| | $ | 466 |
|
| Foreign currency exchange gain, net | 4,609 |
| | 602 |
| | 14,085 |
| | 13,099 |
|
| Change in fair value of derivatives (Note 12) | (1,150 | ) | | (398 | ) | | (1,882 | ) | | (11,904 | ) |
| Other income / (expense), net | 45 |
| | 57 |
| | 254 |
| | (23 | ) |
| Total other non-operating income | $ | 3,643 |
| | $ | 350 |
| | $ | 12,783 |
| | $ | 1,638 |
|
17. STOCK-BASED COMPENSATION
Under our 2015 Stock Incentive Plan (the "2015 Plan"), 6,000,000 shares of Class A common stock are authorized for grants of stock options, restricted stock units ("RSU"), restricted stock and stock appreciation rights to employees and non-employee directors. In addition, any shares available under our Amended and Restated Stock Incentive Plan (which expired on June 1, 2015), including in respect of any awards that expire, terminate or are forfeited, will be available for awards under the 2015 Plan. Under the 2015 Plan, awards are made to employees and directors at the discretion of the Compensation Committee. Any awards previously issued under the Amended and Restated Stock Incentive Plan will continue to be governed by the terms of that plan.
For the three and nine months ended September 30, 2017 and 2016, we recognized charges for stock-based compensation of US$ 0.5 million and US$ 2.1 million; and US$ 0.7 million and US$ 2.5 million, respectively, presented as a component of selling, general and administrative expenses in our condensed consolidated statements of operations and comprehensive income / loss.
The charge for stock-based compensation in our condensed consolidated statement of operations and comprehensive income / loss was as follows: |
| | | | | | | | | | | | | | | |
| | For the Three Months
Ended September 30, | | For the Nine Months
Ended September 30, |
| | 2017 |
| | 2016 |
| | 2017 |
| | 2016 |
|
| Stock-based compensation expense from continuing operations | $ | 431 |
| | $ | 722 |
| | $ | 2,044 |
| | $ | 2,364 |
|
| Stock-based compensation expense from discontinued operations | 34 |
| | 26 |
| | 96 |
| | 101 |
|
Stock Options
There was no option activity during the nine months ended September 30, 2017. The summary of stock options outstanding as at September 30, 2017 and December 31, 2016 is presented below:
|
| | | | | | | | | | | | |
| | Shares |
| | Weighted Average Exercise Price per Share |
| | Weighted Average Remaining Contractual Term (years) | | Aggregate Intrinsic Value |
|
| Outstanding at December 31, 2016 | 2,011,392 |
| | $ | 2.32 |
| | 8.58 | | $ | 453 |
|
| Outstanding at September 30, 2017 | 2,011,392 |
| | 2.32 |
| | 7.83 | | 3,470 |
|
| Vested and expected to vest | 2,011,392 |
| | 2.32 |
| | 7.83 | | 3,470 |
|
| Exercisable at September 30, 2017 | 902,848 |
| | $ | 2.31 |
| | 7.76 | | $ | 1,572 |
|
CENTRAL EUROPEAN MEDIA ENTERPRISES LTD.
NOTES TO CONDENSED CONSOLIDATED FINANCIAL STATEMENTS
(Tabular amounts in US$ 000’s, except share and per share data)
(Unaudited)
The fair value14. INTEREST EXPENSE
Interest expense comprised the following for the three and six months ended June 30, 2020 and 2019:
|
| | | | | | | | | | | | | | | |
| | For the Three Months Ended June 30, | | For the Six Months Ended June 30, |
| | 2020 |
| | 2019 |
| | 2020 |
| | 2019 |
|
| Interest on long-term debt and other financing arrangements | $ | 4,934 |
| | $ | 6,882 |
| | $ | 10,708 |
| | $ | 14,250 |
|
| Amortization of capitalized debt issuance costs | 820 |
| | 853 |
| | 1,641 |
| | 1,727 |
|
| Total interest expense | $ | 5,754 |
| | $ | 7,735 |
| | $ | 12,349 |
| | $ | 15,977 |
|
We paid cash interest (including Guarantee Fees) of US$ 10.5 million and US$ 14.0 millionduring the six months ended June 30, 2020 and 2019, respectively.
15. OTHER NON-OPERATING INCOME / EXPENSE, NET
Other non-operating income / expense, net comprised the following for the three and six months ended June 30, 2020 and 2019:
|
| | | | | | | | | | | | | | | |
| | For the Three Months Ended June 30, | | For the Six Months Ended June 30, |
| | 2020 |
| | 2019 |
| | 2020 |
| | 2019 |
|
| Interest income | $ | 151 |
| | $ | 115 |
| | $ | 293 |
| | $ | 267 |
|
| Foreign currency exchange gain / (loss), net | 7 |
| | 2,155 |
| | (6,335 | ) | | (922 | ) |
| Change in fair value of derivatives | — |
| | — |
| | — |
| | (36 | ) |
| Loss on extinguishment of debt | — |
| | (84 | ) | | — |
| | (235 | ) |
| Other income, net | 170 |
| | 51 |
| | 234 |
| | 66 |
|
| Total other non-operating income / (expense), net | $ | 328 |
| | $ | 2,237 |
| | $ | (5,808 | ) | | $ | (860 | ) |
16. STOCK-BASED COMPENSATION
Our 2015 Stock Incentive Plan (the "2015 Plan") has 16,000,000 shares of Class A common stock authorized for grants of stock options, restricted stock units ("RSU"), restricted stock and stock appreciation rights to employees and non-employee directors. Under the 2015 Plan, awards are made to employees and directors at the discretion of the Compensation Committee.
For the three and six months ended June 30, 2020 and 2019, we recognized charges for stock-based compensation of US$ 0.8 million and US$ 1.7 million; and US$ 1.1 million and US$ 2.1 million respectively, as a component of selling, general and administrative expenses in our condensed consolidated statements of operations and comprehensive income / loss.
Stock Options
Grants of options allow the holders to purchase shares of Class A common stock at an exercise price, which is estimated ongenerally the market price prevailing at the date of the grant, date usingwith vesting between one and four years after the Black-Scholes option-pricing modelawards are granted. There was no option activity during the six months ended June 30, 2020. The summary of stock options outstanding as at June 30, 2020 and recognized ratably overDecember 31, 2019 is presented below:
|
| | | | | | | | | | | | |
| | Shares |
| | Weighted Average Exercise Price per Share |
| | Weighted Average Remaining Contractual Term (years) | | Aggregate Intrinsic Value |
|
| Outstanding at December 31, 2019 | 2,011,392 |
| | $ | 2.32 |
| | 5.58 | | $ | 4,436 |
|
| Outstanding and Exercisable at June 30, 2020 | 2,011,392 |
| | $ | 2.32 |
| | 5.08 | | $ | 2,444 |
|
When options are vested, holders may exercise them at any time up to the requisite service period. maximum contractual life of the instrument which is specified in the option agreement. At June 30, 2020, the maximum life of options that were issued under the 2015 Plan was ten years. Upon providing the appropriate written notification, holders pay the exercise price and receive shares. Shares delivered in respect of stock option exercises are newly issued shares.
The aggregate intrinsic value (the difference between the stock price on the last day of trading of the thirdsecond quarter of September 30, 20172020 and the exercise prices multiplied by the number of in-the-money options) represents the total intrinsic value that would have been received by the option holders had they exercised all in-the-money options as at SeptemberJune 30, 2017.2020. This amount changes based on the fair value of our Class A common stock. As at September 30, 2017, there was US$ 1.4 million of unrecognized compensation expense related to stock options which is expected to be recognized over a weighted-average period of 1.9 years.
Restricted Stock Units with Time-Based Vesting
Each RSU represents a right to receive one1 share of Class A common stock according to its vesting conditions. The majority of the Company for each RSU issued havethat vests in accordance with a time-based vesting conditions and vest ratably overschedule, generally between one to four years from the date of grant. Vesting of RSU with performance-based vesting conditions ("PRSU") is contingent on the achievement of cumulative OIBDA and unlevered free cash flow targets over a multi-year period. Upon vesting, shares of Class A common stock are issued from authorized but unissued shares. Holders of RSU and PRSU awards are not entitled to receive cash dividend equivalents prior to the vesting of awards and are not entitled to vote. The grant date fair values of RSU and PRSU are calculated as the closing price of our Class A common stock on the date of grant.
The following table summarizes information about unvested RSU and PRSU as at September 30, 2017:vote shares underlying awards.
|
| | | | | | |
| | Number of Shares / Units |
| | Weighted Average Grant Date Fair Value |
|
| Unvested at December 31, 2016 | 2,542,625 |
| | $ | 2.61 |
|
| Granted | 1,158,887 |
| | 3.62 |
|
| Vested | (912,246 | ) | | 2.65 |
|
| Forfeited | (75,582 | ) | | 1.53 |
|
| Unvested at September 30, 2017 | 2,713,684 |
| | $ | 3.06 |
|
As at September 30, 2017, the intrinsic value of unvested RSUs was US$ 11.0 million. Total unrecognized compensation cost related to unvested RSUs as at September 30, 2017 was US$ 5.1 million and is expected to be recognized over a weighted-average period of 2.1 years.
CENTRAL EUROPEAN MEDIA ENTERPRISES LTD.
NOTES TO CONDENSED CONSOLIDATED FINANCIAL STATEMENTS
(Tabular amounts in US$ 000’s, except share and per share data)
(Unaudited)
18.The following table summarizes information about unvested RSUs as at June 30, 2020 and December 31, 2019:
|
| | | | | | |
| | Number of Shares / Units |
| | Weighted Average Grant Date Fair Value |
|
| Unvested at December 31, 2019 | 2,332,681 |
| | $ | 3.69 |
|
| Vested | (994,270 | ) | | 3.58 |
|
| Unvested at June 30, 2020 | 1,338,411 |
| | $ | 3.77 |
|
The intrinsic value of unvested RSUs was US$ 4.7 million as at June 30, 2020. Total unrecognized compensation cost related to unvested RSUs as at June 30, 2020 was US$ 4.3 million and is expected to be recognized over a weighted-average period of 2.07 years.
Restricted Stock Units with Performance Conditions
Each RSU with performance conditions (“PRSU”) represents a right to receive one share of Class A common stock of the Company for each PRSU that vests in accordance with a performance-based vesting schedule. The performance-based vesting schedule sets forth specified objectives for unlevered free cash flow and OIBDA over defined periods and by defined dates. Holders of PRSU awards are not entitled to receive cash dividend equivalents prior to the vesting of awards and are not entitled to vote shares underlying awards.
Vesting of the currently outstanding PRSUs is subject to the achievement of cumulative unlevered free cash flow and OIBDA targets corresponding to two, three or four-year performance periods ending December 31, 2020, 2021 and 2022, respectively. The maximum number of PRSUs that may be earned is 200% of the corresponding target. At June 30, 2020 and December 31, 2019 there were 501,572 unvested shares with a weighted-average grant date fair value of US$ 3.19. During the three and six months ended June 30, 2020 there were 0 new PRSU awards granted or vested.
The intrinsic value of unvested PRSUs was US$ 1.8 million as at June 30, 2020. Total unrecognized compensation cost related to unvested PRSUs as at June 30, 2020 was US$ 1.3 million of which US$ 0.1 million is related to performance targets currently considered probable of being achieved and will be recognized over a period of less than one year.
17. EARNINGS PER SHARE
We determined that the Series B Preferred Shares are a participating security, and accordingly, our basic and diluted net income / loss per share is calculated using the two-class method. Under the two-class method, basic net income / loss per common share is computed by dividing the net income available to common shareholders after deducting contractual amounts of accretion on our Series B Preferred Shares and the income allocated to these shares by the weighted-average number of common shares outstanding during the period. Diluted net income / loss per share is computed by dividing the adjusted net income by the weighted-average number of dilutive shares outstanding during the period.period after adjusting for the impact of those dilutive shares on the allocation of income to the Series B Preferred Shares.
The components of basic and diluted earnings per share are as follows:
|
| | | | | | | | | | | | | | | |
| | For the Three Months
Ended September 30, | | For the Nine Months
Ended September 30, |
| | 2017 |
| | 2016 |
| | 2017 |
| | 2016 |
|
| (Loss) / income from continuing operations | $ | (1,945 | ) | | $ | (11,769 | ) | | $ | 17,338 |
| | $ | (185,795 | ) |
| Net loss attributable to noncontrolling interests | 188 |
| | 196 |
| | 534 |
| | 387 |
|
| Less: preferred share accretion paid in kind (Note 13) | (2,454 | ) | | (2,364 | ) | | (7,216 | ) | | (11,314 | ) |
| Less: income allocated to Series B Preferred Shares | — |
| | — |
| | (4,334 | ) | | — |
|
| (Loss) / income from continuing operations available to common shareholders, net of noncontrolling interest | (4,211 | ) | | (13,937 | ) | | 6,322 |
| | (196,722 | ) |
| Loss from discontinued operations, net of tax (Note 3) | (5,988 | ) | | (8,054 | ) | | (8,747 | ) | | (15,971 | ) |
| Net loss attributable to CME Ltd. available to common shareholders — basic | (10,199 | ) | | (21,991 | ) | | (2,425 | ) | | (212,693 | ) |
| | | | | | | | |
| Effect of dilutive securities | | | | | | | |
| Dilutive effect of Series B Preferred Shares | — |
| | — |
| | — |
| | — |
|
| Net loss attributable to CME Ltd. available to common shareholders — diluted | $ | (10,199 | ) | | $ | (21,991 | ) | | $ | (2,425 | ) | | $ | (212,693 | ) |
| | | | | | | | |
Weighted average outstanding shares of common stock — basic (1) | 156,189 |
| | 153,494 |
| | 155,579 |
| | 149,898 |
|
| Dilutive effect of common stock warrants, employee stock options and RSUs | — |
| | — |
| | 78,182 |
| | — |
|
| Weighted average outstanding shares of common stock — diluted | 156,189 |
| | 153,494 |
| | 233,761 |
| | 149,898 |
|
| | | | | | | | |
| Net (loss) / income per share: | | | | | | | |
| Continuing operations — basic | $ | (0.03 | ) | | $ | (0.09 | ) | | $ | 0.04 |
| | $ | (1.31 | ) |
| Continuing operations — diluted | (0.03 | ) | | (0.09 | ) | | 0.03 |
| | (1.31 | ) |
| Discontinued operations — basic | (0.04 | ) | | (0.05 | ) | | (0.06 | ) | | (0.11 | ) |
| Discontinued operations — diluted | (0.04 | ) | | (0.05 | ) | | (0.06 | ) | | (0.11 | ) |
| Net loss attributable to CME Ltd. — basic | (0.07 | ) | | (0.14 | ) | | (0.02 | ) | | (1.42 | ) |
| Net loss attributable to CME Ltd. — diluted | (0.07 | ) | | (0.14 | ) | | (0.02 | ) | | (1.42 | ) |
|
| | | | | | | | | | | | | | | |
| | For the Three Months Ended June 30, | | For the Six Months Ended June 30, |
| | 2020 |
| | 2019 |
| | 2020 |
| | 2019 |
|
| Income from operations | $ | 31,102 |
| | $ | 44,078 |
| | $ | 40,072 |
| | $ | 55,829 |
|
| Net loss / (income) attributable to noncontrolling interests | 77 |
| | (119 | ) | | 148 |
| | (112 | ) |
| Less: income allocated to Series B Preferred Shares | (9,197 | ) | | (13,003 | ) | | (11,873 | ) | | (16,490 | ) |
| Net income attributable to CME Ltd. available to common shareholders — basic | 21,982 |
| | 30,956 |
| | 28,347 |
| | 39,227 |
|
| | | | | | | | |
| Effect of dilutive securities | | | | | | | |
| Dilutive effect of RSUs and employee stock options | 27 |
| | 47 |
| | 45 |
| | 54 |
|
| Net income attributable to CME Ltd. available to common shareholders — diluted | $ | 22,009 |
| | $ | 31,003 |
| | $ | 28,392 |
| | $ | 39,281 |
|
| | | | | | | | |
Weighted average outstanding shares of common stock — basic (1) | 265,649 |
| | 264,570 |
| | 265,342 |
| | 264,385 |
|
| Dilutive effect of employee stock options and RSUs | 1,127 |
| | 1,362 |
| | 1,448 |
| | 1,243 |
|
| Weighted average outstanding shares of common stock — diluted | 266,776 |
| | 265,932 |
| | 266,790 |
| | 265,628 |
|
| | | | | | | | |
| Net income per share: | | | | | | | |
| Attributable to CME Ltd. — basic | $ | 0.08 |
| | $ | 0.12 |
| | $ | 0.11 |
| | $ | 0.15 |
|
| Attributable to CME Ltd. — diluted | 0.08 |
| | 0.12 |
| | 0.11 |
| | 0.15 |
|
| |
(1) | For the purpose of computing basic earnings per share, the 11,211,449 shares of Class A common stock underlying the Series A Preferred Share are included in the weighted average outstanding shares of common stock - basic, because the holderrights of the Series A Preferred Share is entitledare considered substantially similar to receive any dividends payable when dividends are declared by the Boardthat of Directors with respect to any shares ofour Class A common stock. |
The following weighted-average, equity awards and convertible shares were excluded from the calculation of diluted earnings per share because their effect would have been anti-dilutive for the periods presented:
|
| | | | | | | | | | | |
| | For the Three Months
Ended September 30, | | For the Nine Months
Ended September 30, |
| | 2017 |
| | 2016 |
| | 2017 |
| | 2016 |
|
| Employee stock options | — |
| | 2,014 |
| | — |
| | 2,014 |
|
| RSUs | 719 |
| | 1,290 |
| | 719 |
| | 1,469 |
|
| Series B Preferred Shares | 107,643 |
| | 103,699 |
| | — |
| | 104,182 |
|
| Total | 108,362 |
| | 107,003 |
| | 719 |
| | 107,665 |
|
These instruments may become dilutive in the future. As set forth in the Certificate of Designation for the Series B Preferred Shares, the holders of our Series B Preferred Shares are not contractually obligated to share in our losses.
CENTRAL EUROPEAN MEDIA ENTERPRISES LTD.
NOTES TO CONDENSED CONSOLIDATED FINANCIAL STATEMENTS
(Tabular amounts in US$ 000’s, except share and per share data)
(Unaudited)
19.Weighted-average equity awards and convertible shares are excluded from the calculation of diluted earnings per share if their effect would be anti-dilutive. The following instruments were anti-dilutive for the periods presented but may be dilutive in future periods:
|
| | | | | | | | | | | |
| | For the Three Months Ended June 30, | | For the Six Months Ended June 30, |
| | 2020 |
| | 2019 |
| | 2020 |
| | 2019 |
|
| RSUs | 836 |
| | 1,233 |
| | 836 |
| | 1,233 |
|
| Total | 836 |
| | 1,233 |
| | 836 |
| | 1,233 |
|
18. SEGMENT DATA
We manage our business on a geographical basis, with four5 operating segments: Bulgaria, the Czech Republic, Romania, and the Slovak Republic and Slovenia, which are also our reportable segments and our main operating countries. These segments reflect how CME Ltd.’s operating performance is evaluated by our chief operating decision makers, who we have identified as our co-Chief Executive Officers; how operations are managed by segment managers; and the structure of our internal financial reporting.
Our segments generate revenues primarily from the sale of advertising and sponsorship on our channels.channels and digital properties. This is supplemented by revenues from cable and satellite television service providers that carry our channels on their platforms and from revenues through the sale of distribution rights to third parties. We do not rely on any single major customer or group of major customers. Intersegment revenues and profits have been eliminated in consolidation.
We evaluate our consolidated results and the performance of our segments based on net revenues and OIBDA (as defined below). We believe OIBDA is useful to investors because it provides a meaningful representation of our performance as it excludes certain items that either do not impact our cash flows or do not impact the operating results of our operations. OIBDA is also used as a component in determining management bonuses.
OIBDA includes amortization and impairment of program rights and is calculated as operating income / loss before depreciation, amortization of intangible assets, impairments of assets and certain unusual or infrequent items that are not considered by our chief operating decision makers when evaluating our performance. Stock-based compensation and certain other items are not allocated to our segments for purposes of evaluating their performance and therefore are not included in their respective OIBDA.
Below are tables showing our net revenues, OIBDA, total assets, capital expenditures and long-lived assets for our continuing operations by segment for the three and ninesix months ended SeptemberJune 30, 20172020 and 20162019 for condensed consolidated statements of operations and comprehensive income / loss data and condensed consolidated statements of cash flow data; and as at SeptemberJune 30, 20172020 and December 31, 20162019 for condensed consolidated balance sheet data.
| | | Net revenues: | For the Three Months
Ended September 30, | | For the Nine Months
Ended September 30, | For the Three Months Ended June 30, | | For the Six Months Ended June 30, |
| 2017 |
| | 2016 |
| | 2017 |
| | 2016 |
| 2020 |
| | 2019 |
| | 2020 |
| | 2019 |
|
| Bulgaria | $ | 16,039 |
| | $ | 13,789 |
| | $ | 52,118 |
| | $ | 50,103 |
| $ | 15,276 |
| | $ | 22,607 |
| | $ | 32,231 |
| | $ | 41,900 |
|
| Czech Republic | 42,681 |
| | 39,031 |
| | 135,526 |
| | 128,558 |
| 45,886 |
| | 64,379 |
| | 95,101 |
| | 114,695 |
|
| Romania | 40,469 |
| | 36,970 |
| | 127,983 |
| | 118,269 |
| 37,197 |
| | 48,362 |
| | 76,712 |
| | 87,172 |
|
| Slovak Republic | 20,384 |
| | 17,864 |
| | 63,348 |
| | 59,466 |
| 21,085 |
| | 27,313 |
| | 43,244 |
| | 48,645 |
|
| Slovenia | | 17,094 |
| | 22,276 |
| | 33,828 |
| | 40,126 |
|
Intersegment revenues (1) | (142 | ) | | (127 | ) | | (917 | ) | | (249 | ) | (993 | ) | | (1,338 | ) | | (1,755 | ) | | (2,380 | ) |
| Total net revenues | $ | 119,431 |
| | $ | 107,527 |
| | $ | 378,058 |
| | $ | 356,147 |
| $ | 135,545 |
| | $ | 183,599 |
| | $ | 279,361 |
| | $ | 330,158 |
|
| |
(1) | Reflects revenues earned from the sale of content to our other segments.country segments in CME Ltd. All other revenues are third party revenues. |
|
| | | | | | | | | | | | | | | |
| OIBDA and reconciliation of OIBDA to condensed consolidated statements of operations and comprehensive income / loss: | For the Three Months
Ended September 30, | | For the Nine Months
Ended September 30, |
| 2017 |
| | 2016 |
| | 2017 |
| | 2016 |
|
| Bulgaria | $ | 2,537 |
| | $ | 1,943 |
| | $ | 6,973 |
| | $ | 8,966 |
|
| Czech Republic | 12,618 |
| | 13,180 |
| | 49,130 |
| | 46,353 |
|
| Romania | 15,496 |
| | 12,606 |
| | 52,450 |
| | 45,030 |
|
| Slovak Republic | 2,944 |
| | (383 | ) | | 11,339 |
| | 5,168 |
|
| Elimination | 10 |
| | 6 |
| | 27 |
| | 9 |
|
| Total operating segments | 33,605 |
| | 27,352 |
| | 119,919 |
| | 105,526 |
|
| Corporate | (8,460 | ) | | (8,028 | ) | | (22,026 | ) | | (22,074 | ) |
| Total OIBDA | 25,145 |
| | 19,324 |
| | 97,893 |
| | 83,452 |
|
| Depreciation of property, plant and equipment | (6,936 | ) | | (5,801 | ) | | (19,345 | ) | | (17,134 | ) |
| Amortization of broadcast licenses and other intangibles | (2,187 | ) | | (2,073 | ) | | (6,349 | ) | | (6,247 | ) |
| Operating income | 16,022 |
| | 11,450 |
| | 72,199 |
| | 60,071 |
|
| Interest expense (Note 15) | (18,352 | ) | | (22,424 | ) | | (54,773 | ) | | (90,640 | ) |
| Loss on extinguishment of debt (Note 5) | (101 | ) | | — |
| | (101 | ) | | (150,158 | ) |
| Non-operating income, net (Note 16) | 3,643 |
| | 350 |
| | 12,783 |
| | 1,638 |
|
| Income / (loss) before tax | $ | 1,212 |
| | $ | (10,624 | ) | | $ | 30,108 |
| | $ | (179,089 | ) |
CENTRAL EUROPEAN MEDIA ENTERPRISES LTD.
NOTES TO CONDENSED CONSOLIDATED FINANCIAL STATEMENTS
(Tabular amounts in US$ 000’s, except share and per share data)
(Unaudited)
|
| | | | | | | | | | | | | | | |
| OIBDA: | For the Three Months Ended June 30, | | For the Six Months Ended June 30, |
| 2020 |
| | 2019 |
| | 2020 |
| | 2019 |
|
| Bulgaria | $ | 4,462 |
| | $ | 7,888 |
| | $ | 9,280 |
| | $ | 14,009 |
|
| Czech Republic | 20,870 |
| | 32,293 |
| | 36,820 |
| | 47,240 |
|
| Romania | 18,769 |
| | 25,243 |
| | 33,833 |
| | 42,776 |
|
| Slovak Republic | 8,836 |
| | 8,555 |
| | 12,781 |
| | 10,284 |
|
| Slovenia | 7,149 |
| | 6,213 |
| | 12,011 |
| | 11,144 |
|
| Elimination | 9 |
| | (24 | ) | | 6 |
| | 24 |
|
| Total operating segments | 60,095 |
| | 80,168 |
| | 104,731 |
| | 125,477 |
|
| Corporate | (5,586 | ) | | (6,826 | ) | | (13,051 | ) | | (14,078 | ) |
| Total OIBDA | 54,509 |
| | 73,342 |
| | 91,680 |
| | 111,399 |
|
| Depreciation of property, plant and equipment | (7,972 | ) | | (8,154 | ) | | (15,899 | ) | | (16,380 | ) |
| Amortization of broadcast licenses and other intangibles | (2,110 | ) | | (2,113 | ) | | (4,277 | ) | | (4,307 | ) |
Other items (1) | (253 | ) | | (2,613 | ) | | (1,133 | ) | | (2,613 | ) |
| Operating income | 44,174 |
| | 60,462 |
| | 70,371 |
| | 88,099 |
|
| Interest expense (Note 14) | (5,754 | ) | | (7,735 | ) | | (12,349 | ) | | (15,977 | ) |
| Other non-operating income / (expense), net (Note 15) | 328 |
| | 2,237 |
| | (5,808 | ) | | (860 | ) |
| Income before tax | $ | 38,748 |
| | $ | 54,964 |
| | $ | 52,214 |
| | $ | 71,262 |
|
|
| | | | | | | |
Total assets (1): | September 30, 2017 |
| | December 31, 2016 |
|
| Bulgaria | $ | 146,813 |
| | $ | 130,873 |
|
| Czech Republic | 801,791 |
| | 700,190 |
|
| Romania | 294,202 |
| | 266,132 |
|
| Slovak Republic | 156,006 |
| | 131,220 |
|
| Total operating segments | 1,398,812 |
| | 1,228,415 |
|
| Corporate | 38,707 |
| | 40,786 |
|
| Assets held for sale | 135,171 |
| | 121,516 |
|
| Total assets | $ | 1,572,690 |
| | $ | 1,390,717 |
|
| |
(1) | Other items during the three and six months ended June 30, 2020 reflects costs relating to the Merger, primarily legal and professional fees. |
|
| | | | | | | |
Total assets: (1) | June 30, 2020 |
| | December 31, 2019 |
|
| Bulgaria | $ | 139,415 |
| | $ | 135,593 |
|
| Czech Republic | 713,393 |
| | 758,479 |
|
| Romania | 263,696 |
| | 289,968 |
|
| Slovak Republic | 141,352 |
| | 150,806 |
|
| Slovenia | 81,702 |
| | 92,144 |
|
| Total operating segments | 1,339,558 |
| | 1,426,990 |
|
| Corporate | 122,984 |
| | 20,872 |
|
| Total assets | $ | 1,462,542 |
| | $ | 1,447,862 |
|
| |
(1) | Segment assets exclude any intercompany balances. |
|
| | | | | | | |
| Capital expenditures: | For the Six Months Ended June 30, |
| | 2020 |
|
| 2019 |
|
| Bulgaria | $ | 1,518 |
| | $ | 1,635 |
|
| Czech Republic | 3,608 |
| | 3,072 |
|
| Romania | 1,483 |
| | 1,033 |
|
| Slovak Republic | 720 |
| | 442 |
|
| Slovenia | 1,394 |
| | 1,912 |
|
| Total operating segments | 8,723 |
| | 8,094 |
|
| Corporate | 36 |
| | 178 |
|
| Total capital expenditures | $ | 8,759 |
| | $ | 8,272 |
|
|
| | | | | | | |
| Capital expenditures: | For the Nine Months Ended September 30, |
| 2017 |
|
| 2016 |
|
| Bulgaria | $ | 2,487 |
| | $ | 2,828 |
|
| Czech Republic | 6,768 |
| | 4,317 |
|
| Romania | 4,369 |
| | 5,027 |
|
| Slovak Republic | 1,520 |
| | 1,286 |
|
| Total operating segments | 15,144 |
| | 13,458 |
|
| Corporate | 1,245 |
| | 1,392 |
|
| Total capital expenditures | $ | 16,389 |
| | $ | 14,850 |
|
|
| | | | | | | |
Long-lived assets (1): | September 30, 2017 |
| | December 31, 2016 |
|
| Bulgaria | $ | 7,511 |
| | $ | 6,280 |
|
| Czech Republic | 43,867 |
| | 39,529 |
|
| Romania | 26,917 |
| | 22,796 |
|
| Slovak Republic | 17,956 |
| | 15,326 |
|
| Total operating segments | 96,251 |
| | 83,931 |
|
| Corporate | 4,057 |
| | 5,149 |
|
| Total long-lived assets | $ | 100,308 |
| | $ | 89,080 |
|
| |
(1)
| Reflects property, plant and equipment, net. |
|
| | | | | | | | | | | | | | | |
| Consolidated revenue by type: | For the Three Months
Ended September 30, | | For the Nine Months
Ended September 30, |
| | 2017 |
| | 2016 |
| | 2017 |
| | 2016 |
|
| Television advertising | $ | 93,830 |
| | $ | 85,282 |
| | $ | 303,486 |
| | $ | 289,975 |
|
| Carriage fees and subscriptions | 21,547 |
| | 17,940 |
| | 61,597 |
| | 53,323 |
|
| Other | 4,054 |
| | 4,305 |
| | 12,975 |
| | 12,849 |
|
| Total net revenues | $ | 119,431 |
| | $ | 107,527 |
| | $ | 378,058 |
| | $ | 356,147 |
|
CENTRAL EUROPEAN MEDIA ENTERPRISES LTD.
NOTES TO CONDENSED CONSOLIDATED FINANCIAL STATEMENTS
(Tabular amounts in US$ 000’s, except share and per share data)
(Unaudited)
|
| | | | | | | |
Long-lived assets: (1) | June 30, 2020 |
| | December 31, 2019 |
|
| Bulgaria | $ | 11,865 |
| | $ | 13,538 |
|
| Czech Republic | 32,142 |
| | 36,760 |
|
| Romania | 29,300 |
| | 31,115 |
|
| Slovak Republic | 14,819 |
| | 16,201 |
|
| Slovenia | 13,740 |
| | 15,207 |
|
| Total operating segments | 101,866 |
| | 112,821 |
|
| Corporate | 512 |
| | 1,080 |
|
| Total long-lived assets | $ | 102,378 |
| | $ | 113,901 |
|
| |
(1) | Reflects property, plant and equipment, net. |
Revenues from contracts with customers comprised the following for the three and six months ended June 30, 2020 and 2019:
|
| | | | | | | | | | | | | | | |
| Consolidated revenue by type: | For the Three Months Ended June 30, | | For the Six Months Ended June 30, |
| | 2020 |
| | 2019 |
| | 2020 |
| | 2019 |
|
| Television advertising | $ | 98,755 |
| | $ | 147,184 |
| | $ | 205,210 |
| | $ | 258,231 |
|
| Carriage fees and subscriptions | 31,510 |
| | 29,239 |
| | 63,094 |
| | 58,789 |
|
| Other | 5,280 |
| | 7,176 |
| | 11,057 |
| | 13,138 |
|
| Total net revenues | $ | 135,545 |
| | $ | 183,599 |
| | $ | 279,361 |
| | $ | 330,158 |
|
Management reviews the performance of our operations based on the above revenue types as well as on a geographic basis as described above. Management does not review other disaggregations of revenues from contracts with customers.
CENTRAL EUROPEAN MEDIA ENTERPRISES LTD.
NOTES TO CONDENSED CONSOLIDATED FINANCIAL STATEMENTS
(Tabular amounts in US$ 000’s, except share and per share data)
(Unaudited)
19. COMMITMENTS AND CONTINGENCIES
Commitments
a) Programming Rights Agreements and Other Commitments
At SeptemberJune 30, 20172020, we had total commitments of US$ 138.979.2 million (December 31, 2016:2019: US$ 128.2103.5 million) in respect of future programming, including contracts signed with license periods starting after the balance sheet date. In addition, we have digital transmission obligations future minimum operating lease payments for non-cancellable operating leases with remaining terms in excess of one year and other commitments as follows:
|
| | | | | | | | | | | |
| | Programming purchase obligations |
| | Other commitments |
| | Capital expenditures |
|
| 2020 | $ | 17,299 |
| | $ | 8,039 |
| | $ | 713 |
|
| 2021 | 20,494 |
| | 5,990 |
| | 32 |
|
| 2022 | 19,074 |
| | 5,748 |
| | 32 |
|
| 2023 | 13,293 |
| | 5,393 |
| | — |
|
| 2024 | 6,264 |
| | — |
| | — |
|
| 2025 and thereafter | 2,768 |
| | — |
| | — |
|
| Total | $ | 79,192 |
| | $ | 25,170 |
| | $ | 777 |
|
|
| | | | | | | | | | | | | | | |
| | Programming purchase obligations |
| | Other commitments |
| | Operating leases |
| | Capital expenditures |
|
| 2017 | $ | 20,465 |
| | $ | 6,802 |
| | $ | 1,029 |
| | $ | 2,055 |
|
| 2018 | 41,150 |
| | 10,334 |
| | 2,953 |
| | 32 |
|
| 2019 | 32,450 |
| | 11,733 |
| | 1,436 |
| | 13 |
|
| 2020 | 26,094 |
| | 1,410 |
| | 687 |
| | — |
|
| 2021 | 12,115 |
| | 429 |
| | 514 |
| | — |
|
| 2022 and thereafter | 6,612 |
| | 474 |
| | 1,971 |
| | — |
|
| Total | $ | 138,886 |
| | $ | 31,182 |
| | $ | 8,590 |
| | $ | 2,100 |
|
Contingencies
Litigation
We are from time to time party to legal proceedings, arbitrations and regulatory proceedings arising in the normal course of our business operations, including the proceeding described below. We evaluate, on a quarterly basis, developments in such matters and provide accruals for such matters, as appropriate. In making such decisions, we consider the degree of probability of an unfavorable outcome and our ability to make a reasonable estimate of the amount of a loss. An unfavorable outcome in any such proceedings, if material, could have an adverse effect on our business or condensed consolidated financial statements.
In the fourth quarter of 2016, our Slovak subsidiary MARKIZA-SLOVAKIA, spol. s.r.o. (“Markiza”("Markiza") was notified of claims that were filed in June 2016 in a court of first instance in Bratislava, the Slovak Republic to collect amounts allegedly owing under four4 promissory notes.notes that have a collective face value of approximately EUR 69.0 million. These four4 promissory notes were purportedly issued in June 2000 by Pavol Rusko in his personal capacity and were purportedly guaranteed by Markiza under the signature of Mr. Rusko, who was an executive director of Markiza at that time as well as one of its shareholders. TheNaN of the notes purport to be issued in favor of Marian Kocner, a controversial Slovak businessman, and the other two to a formerlong-time associate of Mr. Kocner, andKocner. All four notes were supposedly assigned several times, for no apparent consideration, to companies owned by or associated with Mr. Kocner and ultimately to Sprava a inkaso zmeniek, s.r.o., a company owned by Mr. Kocner that isinitiated the plaintiffclaims for payment in these proceedings. Two
NaN of the notes, each of which purportedly has a face value of approximately EUR 8.3 million, allegedly matured in 2015 and the2015. The other two2 notes, which were purportedly issued in 2016. The four notes purport to be in the aggregate amount of approximately EUR 69.0 million.
Despite a random case assignment system in the Slovak Republic, claims in respect of three of the notes were initially assigned to the same judge. The judge who was assigned the claim in respect of the fourth promissory note (inblank, had the amount of approximately EUR 26.0 million) terminated proceedings26.2 million inserted on each of them by Mr. Kocner or someone associated with him in January 2017 because the plaintiff failed to pay court fees.mid-2016, shortly before their alleged maturity. The plaintiff refiled this claim in June 2017; the judge who was assigned the refiled claim terminated proceedings in September after the plaintiff again failed to pay court fees. In responses to the claims in respect of the other three promissory4 notes that were filed in August 2017, Mr. Rusko asserted that he signed the three notes in June 2000.accrue interest from their purported maturity dates. We do not believe that the notes were signed in June 2000 or that any of the notes are authentic. We are vigorously defending
During the claims.first quarter of 2018, the court of first instance began to schedule hearings in respect of the first promissory note having a face value of approximately EUR 8.3 million (the "First PN Case"), the second promissory note having a face value of approximately EUR 8.3 million (the "Second PN Case") and 1 of the promissory notes having a face value of approximately EUR 26.2 million (the "Third PN Case"). Proceedings on the claim in respect of the other promissory note having a face value of approximately EUR 26.2 million (the "Fourth PN Case") were terminated on two separate occasions in 2017 because the plaintiff failed to pay the required court fees.
On April 26, 2018, the judge in the First PN Case ruled in favor of the plaintiff. Markiza appealed that decision.
On May 14, 2018, Markiza filed a criminal complaint with the Special Prosecutor's Office of the Slovak Republic (the "Special Prosecutor’s Office") alleging that Mr. Kocner and Mr. Rusko committed the offenses of (1) counterfeiting, falsification, and illegal production of money and securities and (2) obstruction or perversion of justice. Following the opening of criminal proceedings in the matter, the Special Prosecutor’s Office issued a decision on June 20, 2018 to formally charge Mr. Kocner and Mr. Rusko with counterfeiting, falsification and illegal production of securities and obstruction of justice and Mr. Kocner was taken into pre-trial custody by the Slovak authorities. Subsequently, the Special Prosecutor’s Office charged Mr. Kocner’s long-time associate, who received two of the alleged promissory notes as the original beneficial owner and purported to endorse those notes to a company controlled by Mr. Kocner, with counterfeiting, falsification, and illegal production of money and securities.
Proceedings were subsequently suspended in respect of the First PN Case by the appellate court and by the court of first instance in the remaining cases (including the Fourth PN Case which the plaintiff refiled in May 2019 and paid the required court fees) until a final and enforceable decision has been rendered in the criminal proceedings.
Following the conclusion of the pre-trial investigation, the Special Prosecutor’s Office formally indicted Mr. Kocner and Mr. Rusko on March 19, 2019 with counterfeiting, falsification, and illegal production of securities and obstruction of justice and filed the indictment with the Special Criminal Court of the Slovak Republic.
On February 27, 2020, following the conclusion of criminal proceedings, the Special Criminal Court found Mr. Kocner and Mr. Rusko guilty of the crimes charged and sentenced each of them to 19 years in prison. Both Mr. Kocner and Mr. Rusko have appealed the sentence to the Supreme Court of the Slovak Republic and the Special Prosecutor’s Office has filed an appeal in respect of the length of the sentence as well as the ruling on the forfeiture of property by Mr. Kocner.
CENTRAL EUROPEAN MEDIA ENTERPRISES LTD.
NOTES TO CONDENSED CONSOLIDATED FINANCIAL STATEMENTS
(Tabular amounts in US$ 000’s, except share and per share data)
(Unaudited)
21.Markiza will continue to vigorously defend the claims in the event any of the civil proceedings are not dismissed as a result of the successful conclusion of the criminal proceedings.
Based on the facts and circumstances of these cases, we have not accrued any amounts in respect of these claims.
20. RELATED PARTY TRANSACTIONS
We consider our related parties to be our officers, directors and shareholders who have direct control and/or influence over the Company as well as other parties that can significantly influence management. We have identified transactions with individuals or entities associated with Time Warner,AT&T, which is represented on our Board of Directors and holds a 46.5%44.1% voting interest in CME Ltd. (see Note 13, "Equity") as at SeptemberJune 30, 20172020, as material related party transactions.
Time WarnerAT&T
| | | | For the Three Months
Ended September 30, | | For the Nine Months
Ended September 30, | For the Three Months Ended June 30, | | For the Six Months Ended June 30, |
| | 2017 |
| | 2016 |
| | 2017 |
| | 2016 |
| 2020 |
| | 2019 |
| | 2020 |
| | 2019 |
|
| Cost of revenues | $ | 4,504 |
| | $ | 4,052 |
| | $ | 11,696 |
| | $ | 11,961 |
| $ | 4,697 |
| | $ | 4,659 |
| | $ | 10,330 |
| | $ | 9,635 |
|
| Interest expense | 14,170 |
| | 17,930 |
| | 41,423 |
| | 74,832 |
| 3,776 |
| | 4,615 |
| | 7,558 |
| | 9,369 |
|
|
| | | | | | | |
| | June 30, 2020 |
| | December 31, 2019 |
|
| Programming liabilities | $ | 11,714 |
| | $ | 10,553 |
|
| Other accounts payable and accrued liabilities | 128 |
| | 267 |
|
Accrued interest payable (1) | 1,084 |
| | 1,103 |
|
Other non-current liabilities (2) | 33,465 |
| | 33,465 |
|
|
| | | | | | | |
| | September 30, 2017 |
| | December 31, 2016 |
|
| Programming liabilities | $ | 17,065 |
| | $ | 17,126 |
|
| Other accounts payable and accrued liabilities | 69 |
| | 194 |
|
Accrued interest payable (1) | 24,176 |
| | 9,588 |
|
Other non-current liabilities (2) | 60,004 |
| | 44,397 |
|
| |
(1) | Amount represents accrued Guarantee Fees for which we haveare not yet paid in cash or made an election to pay in kind.due. See Note 5,4, "Long-term Debt and Other Financing Arrangements". |
| |
(2) | Amount represents Guarantee Fees related to the 2023 Euro Loan for which we havehad previously made an election to pay in kind and the Commitment Fee. See Note 5, "Long-term Debt and Other Financing Arrangements".kind. |
Item 2. Management's Discussion and Analysis of Financial Condition and Results of Operations
The following defined terms are used in this Quarterly Report on Form 10-Q:
"2017 PIK Notes" refers to our 15.0% senior secured notes due 2017, redeemed in April 2016;
"2017 Term Loan" refers to our 15.0% term loan facility due 2017, dated as of February 28, 2014, as amended and restated on November 14, 2014, repaid in April 2016;
"2018 Euro Term Loan" refers to CME Ltd.'s floating rate senior unsecured term credit facility due 2018, guaranteed by CME BV and Time Warner, dated as of November 14, 2014 and amended on March 9, 2015, February 19, 2016 and June 22, 2017;
"2019 Euro Term Loan" refers to CME Ltd.'s floating rate senior unsecured term credit facility due 2019, guaranteed by CME BV and Time Warner, dated as of September 30, 2015 and amended on February 19, 2016 and June 22, 2017;
"2021 Euro Term Loan" refers to CME BV's floating rate senior unsecured term credit facility due 2021, guaranteed by Time Warner and CME Ltd., dated as of February 19, 2016 and amended on June 22, 2017;
"2021 Revolving Credit Facility" refers to our amended and restated revolving credit facility dated as of February 28, 2014, as amended and restated as of November 14, 2014, further amended and restated on February 19, 2016 and amended on June 22, 2017;
"CME BV" refers to CME Media Enterprises B.V., our 100% owned subsidiary;
"CME NV" refers to Central European Media Enterprises N.V., our 100% owned subsidiary;
"Divestment Transaction" refers to the framework agreement dated July 9, 2017 with Slovenia Broadband S.à r.l. for the sale of our Croatia and Slovenia operations (see Note 3, "Discontinued Operations and Assets Held for Sale" for further information);
"Euro Term Loans" refers collectively to the 2018 Euro Term Loan, 2019 Euro Term Loan and 2021 Euro Term Loan;
"Guarantee Fees" refers to amounts accrued and payable to Time Warner as consideration for Time Warner's guarantees of the Euro Term Loans;
"Reimbursement Agreement" refers to an agreement with Time Warner which provides that we will reimburse Time Warner for any amounts paid by them under any guarantee or through any loan purchase right exercised by Time Warner, dated as of November 14, 2014, amended and restated on February 19, 2016 and amended on March 2, 2017 and June 22, 2017;
"Time Warner" refers to Time Warner Inc.; and
"TW Investor" refers to Time Warner Media Holdings B.V.
| |
| • | "2021 Euro Loan" refers to our floating rate senior unsecured term credit facility due November 1, 2021, guaranteed by Warner Media (as defined below), dated as of September 30, 2015, as amended on February 19, 2016, June 22, 2017 and April 25, 2018; |
| |
| • | "2023 Euro Loan" refers to our floating rate senior unsecured term credit facility due April 26, 2023, entered into by CME BV (as defined below), guaranteed by Warner Media and CME Ltd., dated as of February 19, 2016, as amended on June 22, 2017 and April 25, 2018; |
| |
| • | "Euro Loans" refers collectively to the 2021 Euro Loan and 2023 Euro Loan; |
| |
| • | "2023 Revolving Credit Facility" refers to our revolving credit facility due April 26, 2023, dated as of May 2, 2014, as amended and restated as of February 19, 2016, and as further amended and restated on April 25, 2018; |
| |
| • | "Guarantee Fees" refers to amounts accrued and payable to Warner Media as consideration for Warner Media's guarantees of the Euro Loans; |
| |
| • | "Reimbursement Agreement" refers to our reimbursement agreement with Warner Media which provides that we will reimburse Warner Media for any amounts paid by them under any guarantee or through any loan purchase right exercised by Warner Media, dated as of November 14, 2014, as amended and restated on February 19, 2016, and as further amended and restated on April 25, 2018; |
| |
| • | "CME BV" refers to CME Media Enterprises B.V., our 100% owned subsidiary; |
| |
| • | "AT&T" refers to AT&T, Inc.; |
| |
| • | "Warner Media" refers to Warner Media, LLC. (formerly Time Warner, Inc.), a wholly owned subsidiary of AT&T; |
| |
| • | "TW Investor" refers to Time Warner Media Holdings B.V., a wholly owned subsidiary of Warner Media; |
| |
| • | "Merger" refers to the merger of Merger Sub (as defined below) with and into the Company pursuant to the Merger Agreement (as defined below); |
| |
| • | "Merger Agreement" refers to the agreement and plan of merger dated October 27, 2019 by and among the Company, Parent (as defined below) and Merger Sub (as defined below); |
| |
| • | "Merger Sub" refers TV Bermuda Ltd., a Bermuda exempted company limited by shares and a wholly-owned subsidiary of Parent (as defined below); |
| |
| • | "Parent" refers TV Bidco B.V., a Netherlands private limited liability company; and |
| |
| • | "PPF" refers PPF Group N.V., a Netherlands public limited liability company. |
The exchange rates used in this report are as at SeptemberJune 30, 2017,2020, unless otherwise indicated.
Please note that we may announce information using SEC filings, press releases, public conference calls, webcasts and posts to the "Investors" section of our website, www.cme.net. We intend to continue to use these channels to communicate important information about CME Ltd. and our operations. We encourage investors, the media, our customers and others interested in the Company to review the information we post at www.cme.net.
I. Forward-looking Statements
This report contains forward-looking statements within the meaning of Section 27A of the Securities Act of 1933 and Section 22E of the Securities Exchange Act of 1934 (the "Exchange Act"), including those relating to our capital needs, business strategy, expectations and intentions. Statements that use the terms “believe”"believe", “anticipate”"anticipate", “trend”"trend", “expect”"expect", “plan”"plan", “estimate”"estimate", “forecast”"forecast", “should”"should",“intend” "intend" and similar expressions of a future or forward-looking nature identify forward-looking statements for purposes of the U.S. federal securities laws or otherwise. In particular, information appearing under the sections entitled "Business," "Risk Factors" and "Management's Discussion and Analysis of Financial Condition and Results of Operations" includes forward looking-statements. For these statements and all other forward-looking statements, we claim the protection of the safe harbor for forward-looking statements contained in the Private Securities Litigation Reform Act of 1995.
Forward-looking statements are inherently subject to risks and uncertainties, many of which cannot be predicted with accuracy or are otherwise beyond our control and some of which might not even be anticipated. Forward-looking statements reflect our current views with respect to future events and because our business is subject to such risks and uncertainties, actual results, our strategic plan, our financial position, results of operations and cash flows could differ materially from those described in or contemplated by the forward-looking statements contained in this report.
Important factors that contribute to such risks include, but are not limited to, those factors set forth under "Risk Factors” as well as the following: the expected timingeffect of the closingongoing COVID-19 pandemic and actions taken by governmental authorities in response to the pandemic; the effect of the saleproposed Merger on our business; the risks that the closing conditions to the proposed Merger may not be satisfied or that necessary governmental approvals are not obtained or are obtained with conditions; the impact of any failure to complete the proposed Merger on our operations in Croatia and Slovenia andbusiness; the applicationeffect of proceeds from it; changes in global orand regional economic conditionsconditions; the effect of the quantitative easing programs and Eurozone instability inthe stability mechanism implemented by the European Central Bank on our markets;business; the economic, political and monetary impacts of Brexit; levels of television advertising spending and the rate of development of the advertising markets in the countries in which we operate; our ability to refinance our existing indebtedness; the extent to which our liquidity constraints and debt service obligations and covenants may restrict our business; our exposure to additional tax liabilities as well as liabilities resulting from regulatory or legal proceedings initiated against us; our ability to refinance our existing indebtedness; our success in continuing our initiatives to diversify and enhance our revenue streams; our ability to make cost-effective investments in our television businesses, including investments in programming; our ability to develop and acquire necessary programming and attract audiences; and changes in the political and regulatory environments where we operate and in the application of relevant laws and regulations.
The foregoing review of important factors should not be construed as exhaustive and should be read in conjunction with other cautionary statements that are included in this report. All forward-looking statements speak only as of the date of this report. We undertake no obligation to publicly update or review any forward-looking statements, whether as a result of new information, future developments or otherwise, except as required by law.
II. Overview
Central European Media Enterprises Ltd. ("CME Ltd.") is a media and entertainment company operating mainly in fourfive countries in Central and Eastern Europe. We manage our business on a geographical basis, with fourfive operating segments: Bulgaria, the Czech Republic, Romania, and the Slovak Republic and Slovenia, which are also our reportable segments. These operating segments reflect how CME Ltd.’s operating performance is evaluated by our chief operating decision makers, who we have identified as our co-Chief Executive Officers, how our operations are managed by segment managers, and the structure of our internal financial reporting.
On July 9, 2017, weOctober 27, 2019, the Company entered into the Merger Agreement with Parent and Merger Sub, pursuant to which Merger Sub will merge with and into the Company, with the Company continuing as the surviving company in the proposed Merger as a framework agreement with Slovenia Broadband S.à r.l., a wholly ownedwholly-owned subsidiary of United Group B.V., relatingParent. The closing of the proposed Merger is subject to several conditions, including, but not limited to, the salerequisite vote of our Croatiathe Company’s shareholders in favor of the Merger Agreement and the proposed Merger, the receipt of certain competition and other regulatory approvals, compliance with covenants and agreements in the Merger Agreement (subject to certain materiality qualifications) and the absence of any governmental order prohibiting completion of the proposed Merger. A special general meeting of shareholders of the Company was held on February 27, 2020, where more than 99% of the votes cast by shareholders were in favor of approving the Merger Agreement, the related statutory merger agreement and the Merger. In addition, regulatory approvals required under the Merger Agreement in Romania and Slovenia operations. Accordingly, these operations are classified as held for sale and they are presented as discontinued operations for all periods in this report; andhave been obtained. For additional information on the discussion below relatesMerger, please see the proxy statement of the Company related to our continuing operationsthe special general meeting of shareholders, filed with the SEC on January 10, 2020. Parent is currently expecting to file the required notification with the European Commission in the four remaining operating segments.third quarter, and based on our expected timing of that, we expect the proposed Merger to be completed prior to October 27, 2020.
Non-GAAP Financial Measures
In this report we refer to several non-GAAP financial measures, including OIBDA, OIBDA margin, free cash flow and unlevered free cash flow. We believe that each of these metrics is useful to investors for the reasons outlined below. Non-GAAP financial measures may not be comparable to similar measures reported by other companies. Non-GAAP financial measures should be evaluated in conjunction with, and are not a substitute for, US GAAP financial measures.
We evaluate our consolidated results and the performance of our segments based on net revenues and OIBDA. We believe OIBDA is useful to investors because it provides a meaningful representation of our performance, as it excludes certain items that do not impact either our cash flows or the operating results of our operations. OIBDA and unlevered free cash flow are also used as components in determining management bonuses.
OIBDA includes amortization and impairment of program rights and is calculated as operating income / loss before depreciation, amortization of intangible assets and impairments of assets and certain unusual or infrequent items that are not considered by our co-Chief Executive Officers when evaluating our performance. Stock-based compensation and certain other items are not allocated to our segments for purposes of evaluating their performance and therefore are not included in their respective OIBDA. Our key performance measure of the efficiency of our consolidated operations and our segments is OIBDA margin. We define OIBDA margin as the ratio of OIBDA to net revenues.
Following a repricing of our Guarantee Fees completed in March 2017 the proportion ofand April 2018, we pay interest and related Guarantee Fees on our outstanding indebtedness that must be paid in cash has increased.cash. In addition to this obligation to pay more interest and related Guarantee Fees in cash, we expect to use cash generated by the business to pay certain Guarantee Fees that are payablewere previously paid in kind. These cash payments are all reflected in free cash flow; accordingly, we believe unlevered free cash flow, defined as free cash flow before cash payments for interest and Guarantee Fees, best illustrates the cash generated by our operations when comparing periods. We define free cash flow as net cash generated from continuing operating activities less purchases of property, plant and equipment, net of disposals of property, plant and equipment and excluding the cash impact of certain unusual or infrequent items that are not included in costs charged in arriving at OIBDA because they are not considered by our co-Chief Executive Officers when evaluating performance.
For additional information regarding our business segments, including a reconciliation of OIBDA to US GAAP financial measures, see Item 1, Note 19,18, "Segment Data". For a reconciliation of free cash flow and unlevered free cash flow to a US GAAP financial measure,measures, see "Free Cash Flow and Unlevered Free Cash Flow" below.
While our reporting currency is the dollar, our consolidated revenues and costs are divided across a range of European currencies and CME Ltd.’s functional currency is the Euro. Given the significant movement of the currencies in the markets in which we operate against the dollar, we believe that it is useful to provide percentage movements based on actual percentage movements (“% Act”), which includes the effect of foreign exchange, as well as like-for-like percentage movements (“% Lfl”). on a constant currency basis. The like-for-like percentage movement references reflect the impact of applying the current period average exchange rates to the prior period revenues and costs. Since the difference between like-for-like and actual percentage movements is solely the impact of movements in foreign exchange rates, our discussion in the following analysis is focused on constant currency percentage movements in order to highlight those factors influencing operational performance. The incremental impact of foreign exchange rates is presented in the tables preceding such analysis. Unless otherwise stated, all percentage increases or decreases in the following analysis refer to year-on-year percentage changes between the three and ninesix months ended SeptemberJune 30, 20172020 and 2016.2019.
Executive Summary
The following table provides a summary of our consolidated results of our continuing operations for the three and ninesix months ended SeptemberJune 30, 20172020 and 2016:2019:
| | | | For the Three Months Ended September 30, (US$ 000's) | | For the Nine Months Ended September 30, (US$ 000's) | For the Three Months Ended June 30, (US$ 000's) | | For the Six Months Ended June 30, (US$ 000's) |
| | | | | | Movement | | | | | | Movement | | | | | Movement | | | | | | Movement |
| | 2017 |
| | 2016 |
| | % Act |
| | % Lfl |
| | 2017 |
| | 2016 |
| | % Act |
| | % Lfl |
| 2020 |
| | 2019 |
| | % Act |
| | % Lfl |
| | 2020 |
| | 2019 |
| | % Act |
| | % Lfl |
|
| Net revenues | $ | 119,431 |
| | $ | 107,527 |
| | 11.1 | % | | 4.8 | % | | $ | 378,058 |
| | $ | 356,147 |
| | 6.2 | % | | 6.0 | % | $ | 135,545 |
| | $ | 183,599 |
| | (26.2 | )% | | (23.2 | )% | | $ | 279,361 |
| | $ | 330,158 |
| | (15.4 | )% | | (12.1 | )% |
| Operating income | 16,022 |
| | 11,450 |
| | 39.9 | % | | 34.8 | % | | 72,199 |
| | 60,071 |
| | 20.2 | % | | 21.4 | % | 44,174 |
| | 60,462 |
| | (26.9 | )% | | (23.8 | )% | | 70,371 |
| | 88,099 |
| | (20.1 | )% | | (16.5 | )% |
| Operating margin | 13.4 | % | | 10.6 | % | | 2.8 p.p. |
| | 3.0 p.p. |
| | 19.1 | % | | 16.9 | % | | 2.2 p.p. |
| | 2.4 p.p. |
| 32.6 | % | | 32.9 | % | | (0.3) p.p. |
| | (0.2) p.p. |
| | 25.2 | % | | 26.7 | % | | (1.5) p.p. |
| | (1.3) p.p. |
|
| OIBDA | $ | 25,145 |
| | $ | 19,324 |
| | 30.1 | % | | 23.6 | % | | $ | 97,893 |
| | $ | 83,452 |
| | 17.3 | % | | 17.8 | % | $ | 54,509 |
| | $ | 73,342 |
| | (25.7 | )% | | (22.5 | )% | | $ | 91,680 |
| | $ | 111,399 |
| | (17.7 | )% | | (14.1 | )% |
| OIBDA margin | 21.1 | % | | 18.0 | % | | 3.1 p.p. |
| | 3.2 p.p. |
| | 25.9 | % | | 23.4 | % | | 2.5 p.p. |
| | 2.6 p.p. |
| 40.2 | % | | 39.9 | % | | 0.3 p.p. |
| | 0.3 p.p. |
| | 32.8 | % | | 33.7 | % | | (0.9) p.p. |
| | (0.8) p.p. |
|
Our consolidated net revenues increased in the three and nine months ended September 30, 2017 compared to the corresponding periods in 2016 due to growth in both television advertising revenues and carriage fees and subscription revenues. Television advertising spending in the markets of the countries in which we operate grew an estimated 6% overall at constant rates in the first nine months of 2017 compared to 2016. Our television advertising revenues grew 5% at actual rates and 4% at constant rates during the same period due primarily to significant year-on-year growth in Romania, as well as higher levels of spending in Bulgaria and the Czech Republic. Carriage fees and subscription revenues increased 16%decreased at actual and constant rates in the ninethree and six months ended SeptemberJune 30, 20172020, compared to the corresponding periods in 2019. This was due to declines in television advertising revenues of 30% and 17% at constant rates in the three and six months ended June 30, 2020, respectively, which was partially offset by increases in carriage fees and subscription revenues of 11% at constant rates in both the quarter- and year-to-date periods. Television advertising spending overall in the markets in which we operate decreased an estimated 17% at constant rates in the first six months of 2020 compared to 2019 due to lower demand for advertising, as clients reduced, postponed, or canceled their advertising campaigns in response to restrictive measures imposed in March to address the COVID-19 pandemic and the resulting economic uncertainty. These declines were partially offset by higher demand for advertising in the first two months of 2020 compared to the same period in 2016 primarily2019 in our three largest markets. Across all markets, the decline in ad spending was more significant in the months of April and May, with spending beginning to recover in June in connection with the lifting of restrictive measures in our markets and the resumption of economic activity that had been suspended earlier in the quarter. Carriage fees and subscriptions revenue increased on a constant currency basis in the quarter- and year-to-date periods due to additional carriage fees from contracts with cable, satellitean increase in both overall prices and internet protocol television ("IPTV") operators in the Slovak Republic since Januarynumber of this year.
subscribers.
Costs charged in arriving at OIBDA increased 7% and 3%in the second quarter of 2020 decreased 27% at actual rates in the three and nine months ended September 30, 201724% at constant rates compared to the corresponding periodsperiod in 2016. At2019, due primarily to savings from content costs, which decreased 36% at constant rates, costsrates. The spring schedule in each of our country segments was adjusted in response to the COVID-19 pandemic to utilize more of our existing program library, as well as foreign acquired content and news programming that was more cost effective, which replaced premier episodes of local fiction and entertainment, including productions that we were broadly flatrequired to temporarily suspend. In addition, virtually all live sporting events in the third quarter were postponed, and increased 2%as a result there were fewer costs from sports rights in the period. Costs charged in arriving at OIBDA in the first nine monthshalf of 2017 compared to 2016. Content costs increased2020 decreased 11% at constant rates, as savings in the second quarter were partially offset by an increase of 2% and 5% at constant rates in the thirdfirst three months of the year, which was driven by the reversal of provisions in the comparative period and higher staff costs.
By making adjustments to the cost base in response to changes in television advertising spending patterns, our consolidated OIBDA margin of 40% in the three months ended June 30, 2020 remained consistent with the same period in 2019, and decreased by less than 100 basis points in the first half of 2020. The declines in operating income were consistent with the decreases in OIBDA in the quarter- and year-to-date periods, although operating income declined less than OIBDA due to fewer costs related to the proposed Merger, which are not included within OIBDA, being incurred in 2020 compared to 2019.
In March 2020, governments in our markets declared various forms of states of emergency in response to the COVID-19 pandemic, social distancing measures, including closures of schools and non-essential businesses, and restrictions around the free movement of people. At the end of April and the beginning of May, governmental authorities in our markets began to relax these measures and restrictions to varying degrees according to plans set by the respective governments reflecting their ability to manage the health effects of the COVID-19 pandemic, which has permitted the resumption of previously suspended economic activity. In certain limited instances where rates of COVID-19 infections have again increased, governmental authorities have re-imposed certain measures and restrictions, although both the geographical scope and duration have been more limited.
While the COVID-19 pandemic had a negative impact on advertising spending in the second quarter of 2020, the level of the declines in April and May were more significant than in June, as advertising spending began to recover in connection with the relaxation of measures and restrictions and the resumption, in large part, of previously suspended economic activity. Based on current bookings in July and August, overall advertising spending appears to be returning to comparable levels seen in the same periods in 2019, and it is possible that a portion of the advertising spending not placed in the six months ended June 30, 2020 could be deferred until the second half of this year. We anticipate the increase in carriage fees and subscription revenues realized in the first half of 2020 will continue for the remainder of the year and help mitigate the impact of lower advertising spending on net revenue. We also expect ongoing content cost saving measures will offset a portion of any shortfalls in television advertising revenue in the remainder of 2020.
In response to the COVID-19 pandemic, each of our operations adopted precautionary procedures in March designed to safeguard the health and wellbeing of our employees and business partners, including key personnel critical to the function of our television channels to ensure the ongoing broadcast of our networks. Personnel have been encouraged to work remotely whenever possible, and we do not believe there has been a significant adverse impact on either our operations or our internal control over financial reporting as a result of this remote work policy. Our businesses incurred costs in the second quarter and first nine monthshalf of 2017,2020 adjusting to these changes in the operating environment, although the amounts were not material.
As more restrictive social distancing measures, including limitations on the size of gatherings, were introduced in March, we were required to temporarily suspend all in-process production of own-produced titles. In addition to the associated changes in the program schedules to replace or reduce the number of premier episodes of local content broadcasted, our stations increased the amount of news and current affairs programming covering the COVID-19 pandemic. Following the relaxation of social distancing measures, we have resumed production of local titles in each of our country operations and adjusted our scheduling and procedures in order to do so in a safe manner. We believe this content, together with our existing extensive program library of already completed own-produced titles as well as acquired content, is more than sufficient to provide attractive programming line-ups for the fall season and maintain or increase audience leadership in our markets.
Our financial position and cash generation remains robust and we do not expect any near-term liquidity constraints. Net cash generated from operations and unlevered free cash flow during the first half of 2020 increased 11% and 8% at actual rates, respectively, reflecting a significant decline in payments for own-produced programming, including during the temporary suspension of productions between March and May 2020, as well as lower cash paid for taxes as we made targeted investments in our programming line-uputilized national stimulus plans, such as provisions relating to monetize additional ratings in Romania when available, to improve our competitive positioning in Bulgaria anddelaying the Czech Republic, and to support the changepayment of corporate income tax. While cash flow is normally lower in the waysecond half of the year and we expect cash collections will be lower compared to 2019 from the year-on-year decline in second quarter net revenues, we are able to take steps to bolster our channels are distributedcash position, including through changes in programming and production described above, as well as the deferral of all non-essential capital expenditures and reductions in discretionary spending.
As a result of significant debt repayments in the Slovak Republic. Other operating costs decreased in the third quarter and first nine months of 2017 due to savings from transmission costs, which offset higher bad debt charges.
Since the growth in revenue outpaced the increase in costs, our OIBDA margin increased in the three and nine months ended September 30, 2017. This dynamic also drove an increase in operating income, with a similar improvement in operating margin. We expect revenues to grow at a faster pace than costs in 2017 and for the nextlast few years, leading to continued OIBDA margin expansion year on year although trends may vary from quarter to quarter.
The improvement in our operations during the twelve month period ended Septembernearest long-term debt maturity is only EUR 60.3 million (approximately US$ 67.6 million at June 30, 2017 reduced our2020 rates) and is not due until November 2021. Our net leverage ratio to 5.8xwas 2.4x at the end of the second quarter, which will result in ouris unchanged from the start of 2020. Our cost of borrowing decreasing by 125 basis points to 6.0% from the end of October 2017.
We rolled-out the fall season in the third quarter, and its results contributed to our prime time and all day audience shares increasing in three out of four countries during the first nine months of 2017 compared to the same period in 2016. We continue to leverage popular content we produce for our prime time schedules, and supplement that with both foreign and locally acquired content to ensure we continue to attract the largest audience in each of our countries in the most profitable manner.
Divestment Transaction to Accelerate Deleveraging
On July 9, 2017, we agreed to sell our operations in Croatia and Slovenia to Slovenia Broadband S.à r.l., a subsidiary of United Group B.V. (“United Group”), subject to obtaining regulatory approvals and other customary closing conditions. The transaction is expected to close by the end of 2017 or early 2018.
Total cash consideration for the transaction is EUR 230.0 million (approximately US$ 271.5 million), subject to customary working capital adjustments. Upon closing, the proceeds will be used to repay the remaining balance of the 2018 Euro Term Loan in full, with any excess proceeds applied to repay the Commitment Fee and a portion of the 2019 Euro Term Loan and related Guarantee Fees, which will result in a significant decrease in our indebtedness and independs on our net leverage ratio. Based onratio; and if that increases above 3.0x in a future period then our results forinterest expense would increase (see Item 1, Note 4, "Long-term Debt and Other Financing Arrangements").
We ended the period ended September 30, 2017, this would reduce CME’s net leverage ratio from 5.8x to 4.8x.
Once debt is repaid following closingsecond quarter of the transaction, our current average borrowing cost is expected to decrease from 6.0% to 4.5%. We estimate the annual savings from interest and Guarantee Fees resulting from the transaction will exceed both income2020 with US$ 176.1 million of cash and cash generated byequivalents. Additionally, we have access to US$ 75.0 million under the combined operations2023 Revolving Credit Facility, which remained undrawn as of Croatia and Slovenia in 2016. The net assets of these businesses, which are presented as held for sale on the Condensed Consolidated Balance Sheet, were approximately US$ 102.9 million as at SeptemberJune 30, 2017.2020.
Free Cash Flow and Unlevered Free Cash Flow
| | | | For the Nine Months Ended September 30, (US$ 000's) | For the Six Months Ended June 30, (US$ 000's) |
| | 2017 |
| | 2016 |
| | Movement |
| 2020 |
| | 2019 |
| | Movement |
|
| Net cash generated from continuing operating activities | $ | 90,638 |
| | $ | 56,972 |
| | 59.1 | % | |
| Net cash generated from operating activities | | $ | 154,995 |
| | $ | 140,280 |
| | 10.5 | % |
| Capital expenditures, net | (16,250 | ) | | (14,762 | ) | | (10.1 | )% | (8,658 | ) | | (8,266 | ) | | 4.7 | % |
Other items (1) | | 291 |
| | — |
| | NM (2) |
|
| Free cash flow | 74,388 |
| | 42,210 |
| | 76.2 | % | 146,628 |
| | 132,014 |
| | 11.1 | % |
| Cash paid for interest (including mandatory cash-pay Guarantee Fees) | 22,206 |
| | 38,317 |
| | (42.0 | )% | |
| Cash paid for Guarantee Fees that may be paid in kind | 1,411 |
| | 5,483 |
| | (74.3 | )% | |
| Cash paid for interest (including Guarantee Fees) | | 10,507 |
| | 14,017 |
| | (25.0 | )% |
| Unlevered free cash flow | $ | 98,005 |
| | $ | 86,010 |
| | 13.9 | % | $ | 157,135 |
| | $ | 146,031 |
| | 7.6 | % |
| |
(1) | Reflects costs relating to the proposed Merger, primarily financial and professional fees. |
| |
(2) | Number is not meaningful. |
| | | (US$ 000's) | September 30, 2017 |
| | December 31, 2016 |
| | Movement |
| June 30, 2020 |
| | December 31, 2019 |
| | Movement |
|
| Cash and cash equivalents | $ | 67,034 |
| | $ | 40,606 |
| | 65.1 | % | $ | 176,094 |
| | $ | 36,621 |
| | 380.9 | % |
Our unleveredUnlevered free cash flow increased during the first ninesix months of 2017ended June 30, 2020 compared to the same period in 2016 reflecting higher cash collections from revenue growth, which was partially offset by higher cash spending on2019 due to lower payments for own-produced programming as well as higherand lower cash paid for taxes as we utilized national stimulus plans, such as provisions relating to delaying the payment of corporate income taxes and capital expenditures. Freetax. Net cash flow increased significantly more than unlevered free cash flow due to a significant decrease ingenerated from operating activities also benefited from lower cash paid for interest and Guarantee Fees because last year we paid accrued interest related to the 2017 PIK Notes and 2017 Term Loan when they were refinanced in April 2016, and we also repaid accrued Guarantee Fees previously paid in kind in the first nine months of 2016.
In August 2017 we repaid EUR 50.0 million (approximately US$ 59.1 million at August 1, 2017 rates) of the principal outstanding on the 2018 Euro Term Loan.
Following the repricing of our Guarantee Fees completed in March 2017, we are now required to pay a portion of the Guarantee Fees related to all of the Euro Term Loans in cash. However, the total amount of cash paid for interest and Guarantee Fees is expected to decrease significantly in 2017 due to the lower all-in rate payable following that transaction, the lower principal balance following the August repayment of debt and additional non-repeating payments that were made in 2016 when we elected to repay in cash a portion of the accrued Guarantee Fees related to the 2018 Euro Term Loan that were previously paid in kind. As a result, we expect free cash flow to increase significantly in 2017 compared to 2016.
Fees.
Market Information
The following table sets out our estimates of the year-on-year changes in real GDP, real private consumption and the television advertising market, net of discounts, in ourthe countries in which we operate for the ninesix months ended SeptemberJune 30, 20172020:
| | | | For the Nine Months Ended September 30, 2017 | For the Six Months Ended June 30, 2020 |
| Country | Real GDP Growth |
| | Real Private Consumption Growth |
| | Net TV Ad Market Growth |
| Real GDP Growth |
| | Real Private Consumption Growth |
| | Net TV Ad Market Growth |
|
| Bulgaria | 3.4 | % | | 4.1 | % | | 4.7 | % | (5.9 | )% | | (4.1 | )% | | (28.0 | )% |
| Czech Republic | 3.6 | % | | 3.5 | % | | 3.7 | % | (7.0 | )% | | (4.0 | )% | | (13.4 | )% |
| Romania* | 5.4 | % | | 6.6 | % | | 12.4 | % | (5.3 | )% | | (3.2 | )% | | (17.7 | )% |
| Slovak Republic | 3.2 | % | | 3.4 | % | | 2.6 | % | (9.8 | )% | | (6.8 | )% | | (12.9 | )% |
| Slovenia | | (8.1 | )% | | (8.0 | )% | | (19.6 | )% |
| Total CME Ltd. Markets | 4.1 | % | | 4.6 | % | | 6.1 | % | (6.8 | )% | | (4.5 | )% | | (16.8 | )% |
* Romanian market excludes Moldova.
Sources: Real GDP Growth and Real Private Consumption Growth, CME Ltd. estimates based on market consensus; TV Ad Market Growth, CME Ltd. estimates at constant exchange rates.
After adjusting for inflation, we estimate that duringin the first ninesix months of 2017,2020, it is estimated that GDP grewcontracted in each of the countries in which we operate at a rate that exceededoperate. A positive outlook in terms of growth in GDP and private consumption for 2020 changed in March with the average growth rate for Western Europe. Romania continued to be oneonset of the fastest growing economiesCOVID-19 pandemic. Since then, analyst expectations were revised downward, and now a contraction is forecast in all our markets in 2020 due to the severity of the contraction in the second quarter. Composite economic sentiment indicators, based on industrial, service, consumer, construction and retail trade confidence indicators, have risen in June as compared to May 2020, and the outlook for GDP recovery in all our markets is positive with growth forecast by the European Union, and is forecast to beCommission in the leader for the remaindersecond half of 2017. Similar2020 compared to the last few years, it has been reportedsecond quarter of 2020, and continuing with a strong rebound in 2021.
We estimate that GDP growth in our markets has been less reliant on growth in exports, and domestic demand has played a larger role in economic expansion. In Romania, increases to the minimum wage have provided support for higher disposable income. Consumer confidence remains strong in the Czech and Slovak Republics, reflecting historically low rates of unemployment in those countries. We believe the growth in real private consumption forecast for 2017 will support overall growth in the television advertising markets across the four countries where we continue to operate.
On March 29, 2017, the United Kingdom formally initiated the process to leave the European Union, commonly referred to as “Brexit”, triggering a two-year period to finalize the terms of that separation. While the negotiations over the exact terms of Brexit may negatively impact economic growth in the UK and Europe, the contribution of domestic demand as a component of GDP growth has reduced the sensitivity of our markets to external shocks affecting exports. Additionally, we have not seen an appreciable impact on the behavior of advertisersspending in the countries in which we operate since the UK electorate voted in favor of Brexit in June 2016.
On April 6, 2017, the Czech National Bank determined that the recent increase in inflation in the country was sustainable and its mandate for price stability had been met. As a result, it ended its commitment to intervene in currency markets and withdrew the floor related to the EUR/CZK exchange rate. Following the announcement, the Czech Koruna has since strengthened more than 10% against the dollar, also reflecting some appreciation of the Euro versus the dollar. If the currency continues to appreciate, this will improve the results of our largest operation in dollar terms.
We estimate that the TV advertising markets in the countries in which we operate increaseddeclined by 6%17% on average at constant rates in the ninesix months ended SeptemberJune 30, 20172020 compared to the same period in 2016.2019. The decline in television advertising markets in all countries has resulted from lower demand for advertising, as advertisers reduced spending in response to restrictive measures imposed to address the COVID-19 pandemic and the resulting economic uncertainty. In Bulgaria, we estimate that all broadcasters increased theirthis was reflected primarily in lower average market prices, which more than offset selling fewerdue to promotions offered to small and medium sized businesses with discounted gross ratingsrating points ("GRPs"). In the Czech Republic, market growth was driven primarily by higher average prices. In Romania, the market grew because the increase in demand for advertising that started in 2016 also led to significant increases in average pricesand Slovak Republics, in the first ninehalf of 2020 the reduced spending in the second quarter was partially offset by higher demand in the first two months of 20172020 compared to the same period in 2016. In2019. Similarly, in Romania, the decline in spending in the second and third quarters of 2016, our main channel aired the European football championship, which increased inventory available and sold last year. If the benefit of the tournament last yearquarter was excluded, we estimate the market grew 15% in the first nine months of 2017. In the Slovak Republic, the market grew due topartially offset by higher average prices while inventory sold in the year-to-date period was flat compared to last year following the end of spending on informational and political campaigns that took place during the first half of 2016. If this spending in the first halftwo months of 2016 is excluded, we estimate2020 from clients in certain sectors of the market grew 11%economy, including telecommunications and banking, which had reduced spending in the year-to-datesame period reflecting continued strong demand byin 2019 following the private sector.introduction of new incremental sector specific taxes in Romania in early 2019. In Slovenia, the change in advertiser behavior resulted in fewer GRPs sold, however higher television viewership increased the inventory available so average prices also decreased.
Segment Performance
Our total Net Revenues and OIBDA by segment were as follows:
| | | | NET REVENUES | NET REVENUES |
| | For the Three Months Ended September 30, (US$ 000's) | | For the Nine Months Ended September 30, (US$ 000's) | For the Three Months Ended June 30, (US$ 000's) | | For the Six Months Ended June 30, (US$ 000's) |
| | | | | | Movement | | | | | | Movement | | | | | Movement | | | | | | Movement |
| | 2017 |
| | 2016 |
| | % Act |
| | % Lfl |
| | 2017 |
|
| 2016 |
| | % Act |
| | % Lfl |
| 2020 |
| | 2019 |
| | % Act |
| | % Lfl |
| | 2020 |
|
| 2019 |
| | % Act |
| | % Lfl |
|
| Bulgaria | $ | 16,039 |
| | $ | 13,789 |
| | 16.3 | % | | 10.4 | % | | $ | 52,118 |
| | $ | 50,103 |
| | 4.0 | % | | 4.3 | % | $ | 15,276 |
| | $ | 22,607 |
| | (32.4 | )% | | (31.2 | )% | | $ | 32,231 |
| | $ | 41,900 |
| | (23.1 | )% | | (21.1 | )% |
| Czech Republic | 42,681 |
| | 39,031 |
| | 9.4 | % | | (0.1 | )% | | 135,526 |
| | 128,558 |
| | 5.4 | % | | 3.5 | % | 45,886 |
| | 64,379 |
| | (28.7 | )% | | (23.7 | )% | | 95,101 |
| | 114,695 |
| | (17.1 | )% | | (12.5 | )% |
| Romania | 40,469 |
| | 36,970 |
| | 9.5 | % | | 6.4 | % | | 127,983 |
| | 118,269 |
| | 8.2 | % | | 9.7 | % | 37,197 |
| | 48,362 |
| | (23.1 | )% | | (20.3 | )% | | 76,712 |
| | 87,172 |
| | (12.0 | )% | | (8.4 | )% |
| Slovak Republic | 20,384 |
| | 17,864 |
| | 14.1 | % | | 8.1 | % | | 63,348 |
| | 59,466 |
| | 6.5 | % | | 6.6 | % | 21,085 |
| | 27,313 |
| | (22.8 | )% | | (21.4 | )% | | 43,244 |
| | 48,645 |
| | (11.1 | )% | | (8.9 | )% |
| Slovenia | | 17,094 |
| | 22,276 |
| | (23.3 | )% | | (21.9 | )% | | 33,828 |
| | 40,126 |
| | (15.7 | )% | | (13.6 | )% |
| Intersegment revenues | (142 | ) | | (127 | ) | | NM (1) |
| | NM (1) |
| | (917 | ) | | (249 | ) | | NM (1) |
| | NM (1) |
| (993 | ) | | (1,338 | ) | | NM (1) |
| | NM (1) |
| | (1,755 | ) | | (2,380 | ) | | NM (1) |
| | NM (1) |
|
| Total net revenues | $ | 119,431 |
| | $ | 107,527 |
| | 11.1 | % | | 4.8 | % | | $ | 378,058 |
| | $ | 356,147 |
| | 6.2 | % | | 6.0 | % | $ | 135,545 |
| | $ | 183,599 |
| | (26.2 | )% | | (23.2 | )% | | $ | 279,361 |
| | $ | 330,158 |
| | (15.4 | )% | | (12.1 | )% |
(1) Number is not meaningful. | |
(1) | Number is not meaningful. |
| | | | OIBDA | OIBDA |
| | For the Three Months Ended September 30, (US$ 000's) | | For the Nine Months Ended September 30, (US$ 000's) | For the Three Months Ended June 30, (US$ 000's) | | For the Six Months Ended June 30, (US$ 000's) |
| | | | | | Movement | | | | | | Movement | | | | | Movement | | | | | | Movement |
| | 2017 |
| | 2016 |
| | % Act |
| | % Lfl |
| | 2017 |
| | 2016 |
| | % Act |
| | % Lfl |
| 2020 |
| | 2019 |
| | % Act |
| | % Lfl |
| | 2020 |
| | 2019 |
| | % Act |
| | % Lfl |
|
| Bulgaria | $ | 2,537 |
| | $ | 1,943 |
| | 30.6 | % | | 24.6 | % | | $ | 6,973 |
| | $ | 8,966 |
| | (22.2 | )% | | (22.0 | )% | $ | 4,462 |
| | $ | 7,888 |
| | (43.4 | )% | | (42.5 | )% | | $ | 9,280 |
| | $ | 14,009 |
| | (33.8 | )% | | (32.2 | )% |
| Czech Republic | 12,618 |
| | 13,180 |
| | (4.3 | )% | | (12.8 | )% | | 49,130 |
| | 46,353 |
| | 6.0 | % | | 3.7 | % | 20,870 |
| | 32,293 |
| | (35.4 | )% | | (30.9 | )% | | 36,820 |
| | 47,240 |
| | (22.1 | )% | | (17.3 | )% |
| Romania | 15,496 |
| | 12,606 |
| | 22.9 | % | | 19.6 | % | | 52,450 |
| | 45,030 |
| | 16.5 | % | | 18.3 | % | 18,769 |
| | 25,243 |
| | (25.6 | )% | | (22.9 | )% | | 33,833 |
| | 42,776 |
| | (20.9 | )% | | (17.7 | )% |
| Slovak Republic | 2,944 |
| | (383 | ) | | NM (1) |
| | NM (1) |
| | 11,339 |
| | 5,168 |
| | 119.4 | % | | 125.7 | % | 8,836 |
| | 8,555 |
| | 3.3 | % | | 5.1 | % | | 12,781 |
| | 10,284 |
| | 24.3 | % | | 26.8 | % |
| Slovenia | | 7,149 |
| | 6,213 |
| | 15.1 | % | | 17.2 | % | | 12,011 |
| | 11,144 |
| | 7.8 | % | | 10.5 | % |
| Eliminations | 10 |
| | 6 |
| | NM (1) |
| | NM (1) |
| | 27 |
| | 9 |
| | NM (1) |
| | NM (1) |
| 9 |
| | (24 | ) | | NM (1) |
| | NM (1) |
| | 6 |
| | 24 |
| | NM (1) |
| | NM (1) |
|
| Total operating segments | 33,605 |
| | 27,352 |
| | 22.9 | % | | 15.9 | % | | 119,919 |
| | 105,526 |
| | 13.6 | % | | 13.6 | % | 60,095 |
| | 80,168 |
| | (25.0 | )% | | (21.8 | )% | | 104,731 |
| | 125,477 |
| | (16.5 | )% | | (12.9 | )% |
| Corporate | (8,460 | ) | | (8,028 | ) | | (5.4 | )% | | 2.2 | % | | (22,026 | ) | | (22,074 | ) | | 0.2 | % | | 2.0 | % | (5,586 | ) | | (6,826 | ) | | 18.2 | % | | 13.6 | % | | (13,051 | ) | | (14,078 | ) | | 7.3 | % | | 3.3 | % |
| Consolidated OIBDA | $ | 25,145 |
| | $ | 19,324 |
| | 30.1 | % | | 23.6 | % | | $ | 97,893 |
| | $ | 83,452 |
| | 17.3 | % | | 17.8 | % | $ | 54,509 |
| | $ | 73,342 |
| | (25.7 | )% | | (22.5 | )% | | $ | 91,680 |
| | $ | 111,399 |
| | (17.7 | )% | | (14.1 | )% |
(1) Number is not meaningful. | |
(1) | Number is not meaningful. |
Bulgaria
| | | | Three Months Ended September 30, (US$ 000's) | | Nine Months Ended September 30, (US$ 000's) | For the Three Months Ended June 30, (US$ 000's) | | For the Six Months Ended June 30, (US$ 000's) |
| | | | | | Movement | | | | | | Movement | | | | | Movement | | | | | | Movement |
| | 2017 |
| | 2016 |
| | % Act |
| | % Lfl |
| | 2017 |
| | 2016 |
| | % Act |
| | % Lfl |
| 2020 |
| | 2019 |
| | % Act |
| | % Lfl |
| | 2020 |
| | 2019 |
| | % Act |
| | % Lfl |
|
| Television advertising | $ | 10,239 |
| | $ | 8,192 |
| | 25.0 | % | | 18.6 | % | | $ | 34,550 |
| | $ | 32,838 |
| | 5.2 | % | | 5.7 | % | $ | 9,197 |
| | $ | 15,951 |
| | (42.3 | )% | | (41.3 | )% | | $ | 19,372 |
| | $ | 28,541 |
| | (32.1 | )% | | (30.4 | )% |
| Carriage fees and subscriptions | 4,923 |
| | 4,824 |
| | 2.1 | % | | (3.1 | )% | | 14,378 |
| | 14,036 |
| | 2.4 | % | | 2.1 | % | 5,391 |
| | 5,283 |
| | 2.0 | % | | 3.9 | % | | 10,975 |
| | 10,604 |
| | 3.5 | % | | 6.2 | % |
| Other | 877 |
| | 773 |
| | 13.5 | % | | 7.6 | % | | 3,190 |
| | 3,229 |
| | (1.2 | )% | | (0.7 | )% | 688 |
| | 1,373 |
| | (49.9 | )% | | (49.0 | )% | | 1,884 |
| | 2,755 |
| | (31.6 | )% | | (29.9 | )% |
| Net revenues | 16,039 |
| | 13,789 |
| | 16.3 | % | | 10.4 | % | | 52,118 |
| | 50,103 |
| | 4.0 | % | | 4.3 | % | 15,276 |
| | 22,607 |
| | (32.4 | )% | | (31.2 | )% | | 32,231 |
| | 41,900 |
| | (23.1 | )% | | (21.1 | )% |
| Costs charged in arriving at OIBDA | 13,502 |
| | 11,846 |
| | 14.0 | % | | 8.1 | % | | 45,145 |
| | 41,137 |
| | 9.7 | % | | 10.0 | % | 10,814 |
| | 14,719 |
| | (26.5 | )% | | (25.1 | )% | | 22,951 |
| | 27,891 |
| | (17.7 | )% | | (15.6 | )% |
| OIBDA | $ | 2,537 |
| | $ | 1,943 |
| | 30.6 | % | | 24.6 | % | | $ | 6,973 |
| | $ | 8,966 |
| | (22.2 | )% | | (22.0 | )% | $ | 4,462 |
| | $ | 7,888 |
| | (43.4 | )% | | (42.5 | )% | | $ | 9,280 |
| | $ | 14,009 |
| | (33.8 | )% | | (32.2 | )% |
| | | | | | | | | | | | | | | | | | | | | | | | | | | | | | | |
| OIBDA margin | 15.8 | % | | 14.1 | % | | 1.7 p.p. |
| | 1.8 p.p. |
| | 13.4 | % | | 17.9 | % | | (4.5) p.p. |
| | (4.5) p.p. |
| 29.2 | % | | 34.9 | % | | (5.7) p.p. |
| | (5.8) p.p. |
| | 28.8 | % | | 33.4 | % | | (4.6) p.p. |
| | (4.7) p.p. |
|
The television advertising market in Bulgaria increaseddeclined an estimated 5%28% at constant rates in the ninesix months ended SeptemberJune 30, 20172020 compared to the same period in 2016.2019.
Our television advertising revenues increased atdecreased on a constant ratescurrency basis in the thirdsecond quarter and first nine monthshalf of 20172020 compared to the same periods in 20162019 due to higher prices in our sales policy for the year, which were particularly strong year-on-year in the third quarter. Carriage fees and subscription revenues decreased slightly at constant rates during the third quarter, but increased year to-date due to continued efforts to secure new contracts with cable, satellite and IPTV operators with improved pricing.
On a constant currency basis, costs charged in arriving at OIBDA increased in the third quarter and first nine months of 2017 compared to the same periods of 2016 due primarily to increases in content costs, resulting primarily from higher quality productions in certain time slots compared to the schedule in the prior year, as well as higher bad debt charges.
Czech Republic
|
| | | | | | | | | | | | | | | | | | | | | | | | | | | |
| | Three Months Ended September 30, (US$ 000's) | | Nine Months Ended September 30, (US$ 000's) |
| | | | | | Movement | | | | | | Movement |
| | 2017 |
| | 2016 |
| | % Act |
| | % Lfl |
| | 2017 |
| | 2016 |
| | % Act |
| | % Lfl |
|
| Television advertising | $ | 37,792 |
| | $ | 34,518 |
| | 9.5 | % | | 0.0 | % | | $ | 121,453 |
| | $ | 115,981 |
| | 4.7 | % | | 2.8 | % |
| Carriage fees and subscriptions | 3,269 |
| | 2,612 |
| | 25.2 | % | | 14.6 | % | | 8,790 |
| | 7,743 |
| | 13.5 | % | | 11.2 | % |
| Other | 1,620 |
| | 1,901 |
| | (14.8 | )% | | (22.3 | )% | | 5,283 |
| | 4,834 |
| | 9.3 | % | | 6.1 | % |
| Net revenues | 42,681 |
| | 39,031 |
| | 9.4 | % | | (0.1 | )% | | 135,526 |
| | 128,558 |
| | 5.4 | % | | 3.5 | % |
| Costs charged in arriving at OIBDA | 30,063 |
| | 25,851 |
| | 16.3 | % | | 6.4 | % | | 86,396 |
| | 82,205 |
| | 5.1 | % | | 3.4 | % |
| OIBDA | $ | 12,618 |
| | $ | 13,180 |
| | (4.3 | )% | | (12.8 | )% | | $ | 49,130 |
| | $ | 46,353 |
| | 6.0 | % | | 3.7 | % |
| | | | | | | | | | | | | | | | |
| OIBDA margin | 29.6 | % | | 33.8 | % | | (4.2) p.p. |
| | (4.3) p.p. |
| | 36.3 | % | | 36.1 | % | | 0.2 p.p. |
| | 0.1 p.p. |
|
The television advertising market in the Czech Republic increased an estimated 4% at constant rates in the nine months ended September 30, 2017 compared to the same period in 2016.
Television advertising revenues increased at constant rates in the first nine months of 2017 compared to the same period in 2016 due to higher average prices. Third quarter revenues were flat at constant rates, as higher average prices were offset by selling fewer GRPs, duringas advertisers reduced spending in response to restrictive measures imposed to address the period.COVID-19 pandemic and the resulting economic uncertainty. Carriage fees and subscription revenues increased on a constant currency basis in the third quarterquarter- and first nine months of 2017 dueyear-to-date periods primarily to contracts for Nova International that became effective late in 2016.
Costs charged in arriving at OIBDA increased on a constant currency basis in the third quarter and first nine months of 2017 compared to the same periods in 2016 due to an increase in content costs from higher quality productions this year compared to the schedule in 2016, an earlier start to certain key shows, and increased costs for sport rights and news, which was partially offset by lower transmission costs.
Romania
|
| | | | | | | | | | | | | | | | | | | | | | | | | | | |
| | Three Months Ended September 30, (US$ 000's) | | Nine Months Ended September 30, (US$ 000's) |
| | | | | | Movement | | | | | | Movement |
| | 2017 |
| | 2016 |
| | % Act |
| | % Lfl |
| | 2017 |
| | 2016 |
| | % Act |
| | % Lfl |
|
| Television advertising | $ | 28,445 |
| | $ | 25,763 |
| | 10.4 | % | | 7.3 | % | | $ | 92,782 |
| | $ | 85,256 |
| | 8.8 | % | | 10.4 | % |
| Carriage fees and subscriptions | 11,260 |
| | 10,104 |
| | 11.4 | % | | 8.3 | % | | 32,781 |
| | 30,268 |
| | 8.3 | % | | 9.7 | % |
| Other | 764 |
| | 1,103 |
| | (30.7 | )% | | (32.6 | )% | | 2,420 |
| | 2,745 |
| | (11.8 | )% | | (11.3 | )% |
| Net revenues | 40,469 |
| | 36,970 |
| | 9.5 | % | | 6.4 | % | | 127,983 |
| | 118,269 |
| | 8.2 | % | | 9.7 | % |
| Costs charged in arriving at OIBDA | 24,973 |
| | 24,364 |
| | 2.5 | % | | (0.4 | )% | | 75,533 |
| | 73,239 |
| | 3.1 | % | | 4.5 | % |
| OIBDA | $ | 15,496 |
| | $ | 12,606 |
| | 22.9 | % | | 19.6 | % | | $ | 52,450 |
| | $ | 45,030 |
| | 16.5 | % | | 18.3 | % |
| | | | | | | | | | | | | | | | |
| OIBDA margin | 38.3 | % | | 34.1 | % | | 4.2 p.p. |
| | 4.2 p.p. |
| | 41.0 | % | | 38.1 | % | | 2.9 p.p. |
| | 3.0 p.p. |
|
The television advertising market in Romania increased an estimated 12% at constant rates in the nine months ended September 30, 2017 compared to the same period in 2016.
Our television advertising revenues increased at constant rates in the third quarter of 2017 compared to the same period last year due to higher prices, and the year-to-date period in 2017 also benefited from selling more GRPs. The market continues to be largely sold-out in 2017 and we have increased our all-day audience share compared to 2016, and consequently our inventory available to sell. In addition, in the second and third quarters of 2016 our main channel aired the European football championship, which significantly increased the volume of inventory available and sold last year. If the benefit of the tournament last year was excluded, we estimate our television advertising revenues increased approximately 16% in the year-to-date period. Carriage fees and subscription revenues grew on a constant currency basis during the third quarter and first nine months of 2017 due to an increase in the number of reported subscribers.
Costs charged in arriving at OIBDA increased at constant rates during the first nine months of 2017 primarily due to a increase in content costs, as we invested more in local productions of entertainment formats and aired more popular foreign programming to increase ratings. In the third quarter of 2017, these costs were mostly offset by savings from the European football championship that was broadcast in 2016.
Slovak Republic
|
| | | | | | | | | | | | | | | | | | | | | | | | | | | |
| | Three Months Ended September 30, (US$ 000's) | | Nine Months Ended September 30, (US$ 000's) |
| | | | | | Movement | | | | | | Movement |
| | 2017 |
| | 2016 |
| | % Act |
| | % Lfl |
| | 2017 |
| | 2016 |
| | % Act |
| | % Lfl |
|
| Television advertising | $ | 17,354 |
| | $ | 16,809 |
| | 3.2 | % | | (2.0 | )% | | $ | 54,701 |
| | $ | 55,900 |
| | (2.1 | )% | | (2.0 | )% |
| Carriage fees and subscriptions | 2,095 |
| | 400 |
| | NM(1) |
| | NM(1) |
| | 5,649 |
| | 1,276 |
| | NM(1) |
| | NM(1) |
|
| Other | 935 |
| | 655 |
| | 42.7 | % | | 30.6 | % | | 2,998 |
| | 2,290 |
| | 30.9 | % | | 27.0 | % |
| Net revenues | 20,384 |
| | 17,864 |
| | 14.1 | % | | 8.1 | % | | 63,348 |
| | 59,466 |
| | 6.5 | % | | 6.6 | % |
| Costs charged in arriving at OIBDA | 17,440 |
| | 18,247 |
| | (4.4 | )% | | (9.4 | )% | | 52,009 |
| | 54,298 |
| | (4.2 | )% | | (4.4 | )% |
| OIBDA | $ | 2,944 |
| | $ | (383 | ) | | NM(1) |
| | NM(1) |
| | $ | 11,339 |
| | $ | 5,168 |
| | 119.4 | % | | 125.7 | % |
| | | | | | | | | | | | | | | | |
| OIBDA margin | 14.4 | % | | (2.1 | )% | | 16.5 p.p. |
| | 16.5 p.p. |
| | 17.9 | % | | 8.7 | % | | 9.2 p.p. |
| | 9.4 p.p. |
|
(1) Number is not meaningful.
The television advertising market in the Slovak Republic increased an estimated 3% at constant rates in the nine months ended September 30, 2017 compared to the same period in 2016.
Our television advertising revenues decreased on a constant currency basis during the third quarter of 2017 compared to the same period in 2016 from selling fewer GRPs due to lower coverage for our channels, which have been distributed exclusively on cable, satellite and IPTV platforms in the country since January of this year. Demand for GRPs was also lower in the first nine months of 2017 compared to 2016 due to informational and political campaigns that took place in the first half of 2016. If this spending is excluded, our television advertising revenues increased 3% at constant rates in the first nine months of 2017. The change in the way our channels are distributed resulted in a significant increase in carriage fees and subscriptions revenue, as well as a cost reduction from significantly lower transmission costs. During the remainder of 2017 we anticipate reduced pressure on our ratings as additional households transition to cable, satellite and IPTV platforms and the measurement panel is updated to better reflect how viewers watch television.prices.
On a constant currency basis, costs charged in arriving at OIBDA decreased duringin the thirdsecond quarter and first half of 2020 due primarily to a decline in content costs. The spring programming line-up was adjusted in response to the COVID-19 pandemic to utilize more of our existing program library. As a result, there were fewer broadcasts of new entertainment titles, as we reduced the frequency of new episodes of certain local titles, and the production of other projects was stopped. There were also savings from changes to our refreshed late night show, which was relaunched in January 2020 with a new host and updated format, and fewer costs from sports rights due to the postponement of virtually all live sporting events.
Czech Republic
|
| | | | | | | | | | | | | | | | | | | | | | | | | | | |
| | For the Three Months Ended June 30, (US$ 000's) | | For the Six Months Ended June 30, (US$ 000's) |
| | | | | | Movement | | | | | | Movement |
| | 2020 |
| | 2019 |
| | % Act |
| | % Lfl |
| | 2020 |
| | 2019 |
| | % Act |
| | % Lfl |
|
| Television advertising | $ | 38,601 |
| | $ | 56,586 |
| | (31.8 | )% | | (27.0 | )% | | $ | 79,970 |
| | $ | 99,750 |
| | (19.8 | )% | | (15.4 | )% |
| Carriage fees and subscriptions | 4,774 |
| | 4,333 |
| | 10.2 | % | | 17.8 | % | | 9,708 |
| | 8,601 |
| | 12.9 | % | | 18.6 | % |
| Other | 2,511 |
| | 3,460 |
| | (27.4 | )% | | (22.3 | )% | | 5,423 |
| | 6,344 |
| | (14.5 | )% | | (9.8 | )% |
| Net revenues | 45,886 |
| | 64,379 |
| | (28.7 | )% | | (23.7 | )% | | 95,101 |
| | 114,695 |
| | (17.1 | )% | | (12.5 | )% |
| Costs charged in arriving at OIBDA | 25,016 |
| | 32,086 |
| | (22.0 | )% | | (16.5 | )% | | 58,281 |
| | 67,455 |
| | (13.6 | )% | | (9.3 | )% |
| OIBDA | $ | 20,870 |
| | $ | 32,293 |
| | (35.4 | )% | | (30.9 | )% | | $ | 36,820 |
| | $ | 47,240 |
| | (22.1 | )% | | (17.3 | )% |
| | | | | | | | | | | | | | | | |
| OIBDA margin | 45.5 | % | | 50.2 | % | | (4.7) p.p. |
| | (4.7) p.p. |
| | 38.7 | % | | 41.2 | % | | (2.5) p.p. |
| | (2.2) p.p. |
|
The television advertising market in the Czech Republic declined an estimated 13% at constant rates in the six months ended June 30, 2020 compared to the same period in 2019.
Our television advertising revenues decreased on a constant currency basis in the second quarter and first half of 2020 compared to the same periods in 2019 due to selling fewer GRPs, as advertisers reduced spending in response to restrictive measures imposed to address the COVID-19 pandemic and the resulting economic uncertainty. In the first half of 2020 this was partially offset by higher demand for GRPs in the first two months of 2020 compared to the same period in 2019. Carriage fees and subscriptions revenue increased on a constant currency basis in the quarter- and year-to-date periods due to price increases in existing contracts as well as an increase in the number of subscribers.
Costs charged in arriving at OIBDA decreased at constant rates in the second quarter and first half of 2020 due primarily to savings from content costs. The spring programming line-up was adjusted in response to the COVID-19 pandemic to substitute existing library content for certain local fiction productions that were suspended due to social distancing measures implemented. There were also fewer entertainment formats than the schedule in 2019, as well as fewer costs from sports rights due to the postponement of virtually all live sporting events. These savings were partially offset by an increase in our allowances for credit losses due to the insolvency of a local advertising agency.
Romania
|
| | | | | | | | | | | | | | | | | | | | | | | | | | | |
| | For the Three Months Ended June 30, (US$ 000's) | | For the Six Months Ended June 30, (US$ 000's) |
| | | | | | Movement | | | | | | Movement |
| | 2020 |
| | 2019 |
| | % Act |
| | % Lfl |
| | 2020 |
| | 2019 |
| | % Act |
| | % Lfl |
|
| Television advertising | $ | 23,654 |
| | $ | 36,553 |
| | (35.3 | )% | | (32.9 | )% | | $ | 50,055 |
| | $ | 63,103 |
| | (20.7 | )% | | (17.5 | )% |
| Carriage fees and subscriptions | 12,475 |
| | 10,906 |
| | 14.4 | % | | 18.5 | % | | 24,602 |
| | 22,183 |
| | 10.9 | % | | 15.5 | % |
| Other | 1,068 |
| | 903 |
| | 18.3 | % | | 22.5 | % | | 2,055 |
| | 1,886 |
| | 9.0 | % | | 13.3 | % |
| Net revenues | 37,197 |
| | 48,362 |
| | (23.1 | )% | | (20.3 | )% | | 76,712 |
| | 87,172 |
| | (12.0 | )% | | (8.4 | )% |
| Costs charged in arriving at OIBDA | 18,428 |
| | 23,119 |
| | (20.3 | )% | | (17.4 | )% | | 42,879 |
| | 44,396 |
| | (3.4 | )% | | 0.6 | % |
| OIBDA | $ | 18,769 |
| | $ | 25,243 |
| | (25.6 | )% | | (22.9 | )% | | $ | 33,833 |
| | $ | 42,776 |
| | (20.9 | )% | | (17.7 | )% |
| | | | | | | | | | | | | | | | |
| OIBDA margin | 50.5 | % | | 52.2 | % | | (1.7) p.p. |
| | (1.7) p.p. |
| | 44.1 | % | | 49.1 | % | | (5.0) p.p. |
| | (5.0) p.p. |
|
The television advertising market in Romania declined an estimated 18% at constant rates in the six months ended June 30, 2020 compared to the same period in 2019.
Our television advertising revenues decreased on a constant currency basis in the second quarter and first half of 2020 compared to the same periods in 2019 due to selling fewer GRPs, as advertisers reduced spending in response to restrictive measures imposed to address the COVID-19 pandemic and the resulting economic uncertainty. The decline in the first half of 2020 was less than it was in the second quarter because the decline in spending in the second quarter was partially offset by higher spending in the first two months of 2020 from clients in certain sectors of the economy, including telecommunications and banking, who reduced spending in the same period in 2019 following the introduction of new incremental sector specific taxes in early 2019. Carriage fees and subscriptions revenue increased in the quarter- and year-to-date periods due to higher prices and an increase in the average number of subscribers.
On a constant currency basis, costs charged in arriving at OIBDA decreased in the second quarter primarily due to lower transmissiona decline in content costs whichcompared to 2019. The spring programming line-up was adjusted in response to the COVID-19 pandemic to utilize foreign fiction, as well as existing library content, to replace premier episodes of local fiction and entertainment. There were partiallyalso fewer costs from sports rights due to the postponement of virtually all live sporting events. In the first six months of 2020, costs were broadly flat at constant rates as the change in programming mix since March was offset by higher content costs overall in the first ninequarter compared to the same period in 2019, when we implemented cost saving measures in the schedule as a result of lower spending from the sectors impacted by incremental taxes early last year. Expenses were also lower in the first quarter of 2019 from the reversal of provisions that did not repeat in the first quarter of 2020.
Slovak Republic
|
| | | | | | | | | | | | | | | | | | | | | | | | | | | |
| | For the Three Months Ended June 30, (US$ 000's) | | For the Six Months Ended June 30, (US$ 000's) |
| | | | | | Movement | | | | | | Movement |
| | 2020 |
| | 2019 |
| | % Act |
| | % Lfl |
| | 2020 |
| | 2019 |
| | % Act |
| | % Lfl |
|
| Television advertising | $ | 17,390 |
| | $ | 23,516 |
| | (26.1 | )% | | (24.7 | )% | | $ | 36,228 |
| | $ | 41,449 |
| | (12.6 | )% | | (10.4 | )% |
| Carriage fees and subscriptions | 2,531 |
| | 2,291 |
| | 10.5 | % | | 12.4 | % | | 5,020 |
| | 4,563 |
| | 10.0 | % | | 12.9 | % |
| Other | 1,164 |
| | 1,506 |
| | (22.7 | )% | | (21.2 | )% | | 1,996 |
| | 2,633 |
| | (24.2 | )% | | (22.3 | )% |
| Net revenues | 21,085 |
| | 27,313 |
| | (22.8 | )% | | (21.4 | )% | | 43,244 |
| | 48,645 |
| | (11.1 | )% | | (8.9 | )% |
| Costs charged in arriving at OIBDA | 12,249 |
| | 18,758 |
| | (34.7 | )% | | (33.5 | )% | | 30,463 |
| | 38,361 |
| | (20.6 | )% | | (18.5 | )% |
| OIBDA | $ | 8,836 |
| | $ | 8,555 |
| | 3.3 | % | | 5.1 | % | | $ | 12,781 |
| | $ | 10,284 |
| | 24.3 | % | | 26.8 | % |
| | | | | | | | | | | | | | | | |
| OIBDA margin | 41.9 | % | | 31.3 | % | | 10.6 p.p. |
| | 10.6 p.p. |
| | 29.6 | % | | 21.1 | % | | 8.5 p.p. |
| | 8.4 p.p. |
|
The television advertising market in the Slovak Republic declined an estimated 13% at constant rates in the six months ended June 30, 2020 compared to the same period in 2019.
Our television advertising revenues decreased on a constant currency basis in the second quarter and first half of 2020 compared to the same periods in 2019 due to selling fewer GRPs, as advertisers reduced spending in response to restrictive measures imposed to address the COVID-19 pandemic and the resulting economic uncertainty. In the first half of 2020 this was partially offset by higher demand for GRPs in the first two months of 20172020 compared to the same period in 2019. Carriage fees and subscriptions revenue increased in the quarter- and year-to-date periods from higher prices in new and existing contracts.
On a constant currency basis, costs charged in arriving at OIBDA decreased in the second quarter and first half of 2020 due primarily to a decline in content costs. While we had to modify the format of our popular entertainment format in order to safely produce new episodes without an audience and finish the season, overall the spring programming line-up was adjusted in March in response to the COVID-19 pandemic. As a result, the number of premier episodes of local content in the second quarter declined significantly compared to the same period last year, which were replaced by existing library titles.
Slovenia
|
| | | | | | | | | | | | | | | | | | | | | | | | | | | |
| | For the Three Months Ended June 30, (US$ 000's) | | For the Six Months Ended June 30, (US$ 000's) |
| | | | | | Movement | | | | | | Movement |
| | 2020 |
| | 2019 |
| | % Act |
| | % Lfl |
| | 2020 |
| | 2019 |
| | % Act |
| | % Lfl |
|
| Television advertising | $ | 9,913 |
| | $ | 14,578 |
| | (32.0 | )% | | (30.8 | )% | | $ | 19,585 |
| | $ | 25,388 |
| | (22.9 | )% | | (20.9 | )% |
| Carriage fees and subscriptions | 6,339 |
| | 6,426 |
| | (1.4 | )% | | 0.4 | % | | 12,789 |
| | 12,838 |
| | (0.4 | )% | | 2.2 | % |
| Other | 842 |
| | 1,272 |
| | (33.8 | )% | | (32.6 | )% | | 1,454 |
| | 1,900 |
| | (23.5 | )% | | (21.7 | )% |
| Net revenues | 17,094 |
| | 22,276 |
| | (23.3 | )% | | (21.9 | )% | | 33,828 |
| | 40,126 |
| | (15.7 | )% | | (13.6 | )% |
| Costs charged in arriving at OIBDA | 9,945 |
| | 16,063 |
| | (38.1 | )% | | (37.0 | )% | | 21,817 |
| | 28,982 |
| | (24.7 | )% | | (22.8 | )% |
| OIBDA | $ | 7,149 |
| | $ | 6,213 |
| | 15.1 | % | | 17.2 | % | | $ | 12,011 |
| | $ | 11,144 |
| | 7.8 | % | | 10.5 | % |
| | | | | | | | | | | | | | | | |
| OIBDA margin | 41.8 | % | | 27.9 | % | | 13.9 p.p. |
| | 13.9 p.p. |
| | 35.5 | % | | 27.8 | % | | 7.7 p.p. |
| | 7.7 p.p. |
|
The television advertising market in Slovenia declined an estimated 20% at constant rates in the six months ended June 30, 2020 compared to the same period in 2019.
Our television advertising revenues decreased on a constant currency basis in the second quarter and first half of 2020 compared to the same periods in 2019 due to selling fewer GRPs, as advertisers reduced spending in response to restrictive measures imposed to address the COVID-19 pandemic and the resulting economic uncertainty. Carriage fees and subscription revenues were flat on a constant currency basis in the second quarter and increased in the first half of 2020 from an increase in contentthe overall number of subscribers.
On a constant currency basis, costs as we made targeted adjustmentscharged in arriving at OIBDA decreased in the second quarter and first half of 2020 due primarily to a decline in content costs. The spring programming line-up since we changedwas adjusted in response to the way our channels are distributed.COVID-19 pandemic to utilize more existing library titles. As a result, there were fewer broadcasts of premier local content. There were also fewer costs from sports rights due to the postponement of virtually all live sporting events.
III. Analysis of the Results of Operations and Financial Position
| | | | For the Three Months Ended September 30, (US$ 000's) | For the Three Months Ended June 30, (US$ 000's) |
| | | | | | Movement | | | | | Movement |
| | 2017 |
| | 2016 |
| | % Act |
| | % Lfl |
| 2020 |
| | 2019 |
| | % Act |
| | % Lfl |
|
| Revenue: | | | | | | | | | | | | | | |
| Television advertising | $ | 93,830 |
| | $ | 85,282 |
| | 10.0 | % | | 3.5 | % | $ | 98,755 |
| | $ | 147,184 |
| | (32.9 | )% | | (30.1 | )% |
| Carriage fees and subscriptions | 21,547 |
| | 17,940 |
| | 20.1 | % | | 14.9 | % | 31,510 |
| | 29,239 |
| | 7.8 | % | | 11.2 | % |
| Other revenue | 4,054 |
| | 4,305 |
| | (5.8 | )% | | (12.1 | )% | 5,280 |
| | 7,176 |
| | (26.4 | )% | | (23.6 | )% |
| Net Revenues | 119,431 |
| | 107,527 |
| | 11.1 | % | | 4.8 | % | 135,545 |
| | 183,599 |
| | (26.2 | )% | | (23.2 | )% |
| Operating expenses: | | | | | | | | | | | | | | |
| Content costs | 55,871 |
| | 51,920 |
| | 7.6 | % | | 1.8 | % | 43,693 |
| | 70,356 |
| | (37.9 | )% | | (35.6 | )% |
| Other operating costs | 12,612 |
| | 13,482 |
| | (6.5 | )% | | (12.3 | )% | 12,549 |
| | 13,806 |
| | (9.1 | )% | | (5.3 | )% |
| Depreciation of property, plant and equipment | 6,936 |
| | 5,801 |
| | 19.6 | % | | 11.8 | % | 7,972 |
| | 8,154 |
| | (2.2 | )% | | 1.7 | % |
| Amortization of broadcast licenses and other intangibles | 2,187 |
| | 2,073 |
| | 5.5 | % | | (3.1 | )% | 2,110 |
| | 2,113 |
| | (0.1 | )% | | 6.6 | % |
| Cost of revenues | 77,606 |
| | 73,276 |
| | 5.9 | % | | (0.1 | )% | 66,324 |
| | 94,429 |
| | (29.8 | )% | | (27.1 | )% |
| Selling, general and administrative expenses | 25,803 |
| | 22,801 |
| | 13.2 | % | | 5.8 | % | 25,047 |
| | 28,708 |
| | (12.8 | )% | | (9.1 | )% |
| Operating income | $ | 16,022 |
| | $ | 11,450 |
| | 39.9 | % | | 34.8 | % | $ | 44,174 |
| | $ | 60,462 |
| | (26.9 | )% | | (23.8 | )% |
| | | | For the Nine Months Ended September 30, (US$ 000's) | For the Six Months Ended June 30, (US$ 000's) |
| | | | | | Movement | | | | | Movement |
| | 2017 |
| | 2016 |
| | % Act |
| | % Lfl |
| 2020 |
| | 2019 |
| | % Act |
| | % Lfl |
|
| Revenue: | | | | | | | | | | | | | | |
| Television advertising | $ | 303,486 |
| | $ | 289,975 |
| | 4.7 | % | | 4.4 | % | $ | 205,210 |
| | $ | 258,231 |
| | (20.5 | )% | | (17.3 | )% |
| Carriage fees and subscriptions | 61,597 |
| | 53,323 |
| | 15.5 | % | | 15.9 | % | 63,094 |
| | 58,789 |
| | 7.3 | % | | 11.1 | % |
| Other revenue | 12,975 |
| | 12,849 |
| | 1.0 | % | | (0.4 | )% | 11,057 |
| | 13,138 |
| | (15.8 | )% | | (12.7 | )% |
| Net Revenues | 378,058 |
| | 356,147 |
| | 6.2 | % | | 6.0 | % | 279,361 |
| | 330,158 |
| | (15.4 | )% | | (12.1 | )% |
| Operating expenses: | | | | | | | | | | | | | | |
| Content costs | 174,214 |
| | 166,938 |
| | 4.4 | % | | 4.5 | % | 108,725 |
| | 140,716 |
| | (22.7 | )% | | (19.9 | )% |
| Other operating costs | 35,747 |
| | 40,773 |
| | (12.3 | )% | | (13.0 | )% | 26,196 |
| | 27,054 |
| | (3.2 | )% | | 0.5 | % |
| Depreciation of property, plant and equipment | 19,345 |
| | 17,134 |
| | 12.9 | % | | 11.8 | % | 15,899 |
| | 16,380 |
| | (2.9 | )% | | 0.7 | % |
| Amortization of broadcast licenses and other intangibles | 6,349 |
| | 6,247 |
| | 1.6 | % | | (0.2 | )% | 4,277 |
| | 4,307 |
| | (0.7 | )% | | 4.2 | % |
| Cost of revenues | 235,655 |
| | 231,092 |
| | 2.0 | % | | 1.8 | % | 155,097 |
| | 188,457 |
| | (17.7 | )% | | (14.7 | )% |
| Selling, general and administrative expenses | 70,204 |
| | 64,984 |
| | 8.0 | % | | 6.7 | % | 53,893 |
| | 53,602 |
| | 0.5 | % | | 4.4 | % |
| Operating income | $ | 72,199 |
| | $ | 60,071 |
| | 20.2 | % | | 21.4 | % | $ | 70,371 |
| | $ | 88,099 |
| | (20.1 | )% | | (16.5 | )% |
Revenue:
Television advertising revenues: We estimate television advertising spending in our markets grewdecreased on average by 6%17% at constant rates in the ninesix months ended SeptemberJune 30, 20172020 as compared to the same period in 2016, positively impacting our television2019. Television advertising revenues.revenues decreased during the three and six months ended June 30, 2020, as compared to the same periods in 2019 as many advertisers reduced, postponed, or canceled their advertising campaigns in response to the economic uncertainty caused by governmental responses to the COVID-19 pandemic. See "Overview - Segment Performance" above for additional information on television advertising revenues for each of our operating countries.segments.
Carriage fees and subscriptions: Carriage fees and subscriptions revenue increasedrevenues during the three and ninesix months ended SeptemberJune 30, 2017 to 18% and 16% of total net revenues, respectively,2020 grew approximately 11% at constant rates as compared to 17% and 15% for the same periods in 2016. The2019, primarily due to price increases arose primarilyin existing contracts as well as an increase in the Slovak Republic where our channels are exclusively available on cable, satellite and IPTV platforms since January 2017 and in Romania due to higher subscriber counts.number of subscribers. See "Overview - Segment Performance" above for additional information on carriage fees and subscription revenues for each of our operating countries.segments.
Other revenues: Other revenues include primarily internet advertising revenues and revenues generated through the licensing of our own productions. Other revenues decreased during the three and six months ended SeptemberJune 30, 20172020 as compared to the same periodperiods in 2016 primarily due2019, in connection with the economic uncertainty caused by the governmental responses to lower internet advertising in the Czech Republic and fewer special events in Romania, offset by increases in production services in the Slovak Republic. Other revenues for the nine months ended September 30, 2017 remained in line with those of the same period in 2016.COVID-19 pandemic.
Operating Expenses:
Content costs: Content costs (including production costs and amortization and impairment of program rights) increaseddecreased during the three and ninesix months ended SeptemberJune 30, 20172020, compared to the same periods in 20162019 primarily due to the inclusionuse of both higher quality acquiredlower cost programming and more hoursfollowing the postponement of localcertain productions in our broadcast schedules.due to measures imposed to address the COVID-19 pandemic.
Other operating costs: Other operating costs (excluding content costs, depreciation of property, plant and equipment, amortization of broadcast licenses and other intangibles as well as selling, general and administrative expenses) decreased during the three and nine months ended SeptemberJune 30, 20172020 as compared to the same periodsperiod in 2016,2019 primarily due to cost savingslower copyright fees in Romania and lower salaries and staff-related costs in the Czech Republic and the Slovak Republic following our decisionRepublic. This decrease was partially offset by operating lease expense for production facilities that remained idle due to the governmental restrictions related to the COVID-19 pandemic and therefore were not to renew our contract forcapitalized into the terrestrial distributioncost of our channels there.a program.
At constant rates, other operating costs during the six months ended June 30, 2020, was in line with the same period in 2019.
Depreciation of property, plant and equipment: Total At constant rates, total depreciation of property, plant and equipment increased during the three and ninesix months ended SeptemberJune 30, 2017 compared to2020 remained in line with the same periods in 2016 primarily due to depreciation on production and technical equipment placed in service as we replaced fully depreciated assets.2019.
Amortization of broadcast licenses and other intangibles: Total At constant rates, total amortization of broadcast licenses and other intangibles decreased duringfor the three and ninesix months ended SeptemberJune 30, 20172020 increased compared to the same periods in 2016 primarily2019 due to certain intangibles in Romania becoming fully amortized, partly offset by an increase inthe amortization of certain of our trademarkssoftware acquired in the Czech Republic.2020 and 2019.
Selling, general and administrative expenses: Selling, general and administrative expenses decreased during the three months ended June 30, 2020 as compared to the same period in 2019 primarily due to costs incurred in 2019 as a result of the proposed Merger and due to lower salaries and staff-related costs. These decreases were partially offset by increases in our allowance for credit losses in the Czech Republic and Bulgaria.
For the six months ended June 30, 2020 the selling, general and administrative expenses increased compared to the same period in 2019 primarily due to an increase in our allowances for credit losses in the Czech Republic, Romania and Bulgaria as well as due to the 2019 reversal of a legal accrual in Romania and the release of bad debt in Romania and Bulgaria in 2019. The increase was partially offset by costs incurred in 2019 as a result of the proposed Merger and due to reductions in advertising, marketing and corporate salary and staff-related costs in 2020.
Non-cash stock-based compensation charges for the three and ninesix months ended SeptemberJune 30, 20172020 and 2019 were US$ 0.8 million and US$ 1.7 million and US$ 1.1 million and US$ 2.1 million, respectively. See Item 1, Note 16, "Stock-based Compensation".
Operating income: Operating income decreased during the three and six months ended June 30, 2020 as compared to the same periods in 20162019 primarily due to increased bad debt charges in Bulgaria.
Operating income: Operating income during the three and nine months ended September 30, 2017 increased compared toimpact of the same periods in 2016 due to increases inCOVID-19 pandemic on our television advertising and carriage fee revenues, which outpaced the increases in content costs and selling, general and administrative expenses. revenues.
Our operating margin, which is determined as operating income / loss divided by net revenues, was 13%32.6% and 19%25.2% for the three and ninesix months ended SeptemberJune 30, 20172020, respectively, compared to 11%32.9% and 17%26.7% for the three and ninesix months ended SeptemberJune 30, 2016.2019 respectively.
Other income / expense:(expense):
| | | | For the Three Months Ended September 30, (US$ 000's) | | For the Nine Months Ended September 30, (US$ 000's) | For the Three Months Ended June 30, (US$ 000's) | | For the Six Months Ended June 30, (US$ 000's) |
| | 2017 |
| | 2016 |
| | % Act |
| | 2017 |
| | 2016 |
| | % Act |
| 2020 |
| | 2019 |
| | % Act |
| | 2020 |
| | 2019 |
| | % Act |
|
| Interest expense | $ | (18,352 | ) | | $ | (22,424 | ) | | 18.2 | % | | $ | (54,773 | ) | | $ | (90,640 | ) | | 39.6 | % | $ | (5,754 | ) | | $ | (7,735 | ) | | 25.6 | % | | $ | (12,349 | ) | | $ | (15,977 | ) | | 22.7 | % |
| Other non-operating income / (expense): | | | | | | | | | | | | |
| Interest income | | 151 |
| | 115 |
| | 31.3 | % | | 293 |
| | 267 |
| | 9.7 | % |
| Foreign currency exchange gain / (loss), net | | 7 |
| | 2,155 |
| | NM (1) |
| | (6,335 | ) | | (922 | ) | | NM (1) |
|
| Change in fair value of derivatives | | — |
| | — |
| | NM (1) |
| | — |
| | (36 | ) | | NM (1) |
|
| Loss on extinguishment of debt | (101 | ) | | — |
| | NM (1) |
| | (101 | ) | | (150,158 | ) | | 99.9 | % | — |
| | (84 | ) | | NM (1) |
| | — |
| | (235 | ) | | NM (1) |
|
| Non-operating income / (expense): | | | | | | | | | | | | |
| Interest income | 139 |
| | 89 |
| | 56.2 | % | | 326 |
| | 466 |
| | (30.0 | )% | |
| Foreign currency exchange gain, net | 4,609 |
| | 602 |
| | NM (1) |
| | 14,085 |
| | 13,099 |
| | 7.5 | % | |
| Change in fair value of derivatives | (1,150 | ) | | (398 | ) | | (188.9 | )% | | (1,882 | ) | | (11,904 | ) | | 84.2 | % | |
| Other income / (expense), net | 45 |
| | 57 |
| | (21.1 | )% | | 254 |
| | (23 | ) | | NM (1) |
| |
| Other income, net | | 170 |
| | 51 |
| | 233.3 | % | | 234 |
| | 66 |
| | 254.5 | % |
| Provision for income taxes | (3,157 | ) | | (1,145 | ) | | (175.7 | )% | | (12,770 | ) | | (6,706 | ) | | (90.4 | )% | (7,646 | ) | | (10,886 | ) | | 29.8 | % | | (12,142 | ) | | (15,433 | ) | | 21.3 | % |
| Loss from discontinued operations, net of tax | (5,988 | ) | | (8,054 | ) | | 25.7 | % | | (8,747 | ) | | (15,971 | ) | | 45.2 | % | |
| Net loss attributable to noncontrolling interests | 188 |
| | 196 |
| | (4.1 | )% | | 534 |
| | 387 |
| | 38.0 | % | |
| Net loss / (income) attributable to noncontrolling interests | | 77 |
| | (119 | ) | | NM (1) |
| | 148 |
| | (112 | ) | | NM (1) |
|
| |
(1) | Number is not meaningful. |
Interest expense: Interest expense during the three and ninesix months ended SeptemberJune 30, 20172020 decreased compared to the three and nine months ended September 30, 2016same periods in 2019, primarily due to lower amortizationthe partial repayment of debt discount and issuancethe 2021 Euro Loan in 2019 as well as reduced borrowing costs following a reduction in our net leverage ratio as defined within the extinguishment of the 2017 PIK Notes and 2017 Term Loan in April 2016 and due to a lower effective interest rate on the replacement facility. We also realized interest expense savings as a result of the repricing of our Guarantee Fees in March of 2017.Reimbursement Agreement. See Item 1, Note 5,4, "Long-term Debt and Other Financing Arrangements".
Loss on extinguishment of debt: During the nine months ended September 30, 2017, we recognized a loss on extinguishment of debt related to our repayment of EUR 50 million (approximately US$ 59.1 million at August 1, 2017 rates) of the 2018 Euro Term Loan. During the nine months ended September 30, 2016, we recognized a loss on extinguishment of debt related to the redemption and discharge of the 2017 PIK Notes, repayment of the 2017 Term Loan and modifications of the 2018 Euro Term Loan and the 2019 Euro Term Loan, which were accounted for in a similar manner to a debt extinguishment.
Interest income: Interest income primarily reflects earnings on cash balances and was not material.material in either period presented.
Foreign currency exchange gain / (loss), net: We are exposed to fluctuations in foreign exchange rates on the revaluation of monetary assets and liabilities denominated in currencies other than the local functional currency of the relevant subsidiary.subsidiaries. This includes third party receivables and payables, as well as certain of ourthose intercompany loans which are not considered to be of a long-term investment nature. Our subsidiaries generally receive funding via loans that are denominated in currencies other than the dollar, andfunctional currency of the lender, therefore any change in the relevant exchange rate will require us to recognize a transaction gain or loss on revaluation. Certain of our intercompany loans are classified as long-term in nature, and therefore gains or losses on revaluation are not recorded through the statement of operations and comprehensive income / loss. See the discussion under "Currency translation adjustment, net" below.
During the nine months ended September 30, 2017, we recognized a net gain of US$ 14.1 million comprised of transaction gains of US$ 7.7 million relating to the revaluation of intercompany loans, transaction gains of approximately US$ 2.4 million on our long-term debt and other financing arrangements and transaction gains of US$ 4.0 million relating to the revaluation of monetary assets and liabilities denominated in currencies other than the local functional currency of the relevant subsidiary.During the nine months ended September 30, 2016, we recognized a net gain of US$ 13.1 million comprised of transaction gains of US$ 38.1 million relating to the revaluation of intercompany loans, transaction losses of approximately US$ 25.3 million on our long-term debt and other financing arrangements and transaction gains of US$ 0.3 million relating to the revaluation of monetary assets and liabilities denominated in currencies other than the local functional currency of the relevant subsidiary. |
| | | | | | | | | | | | | | | |
| | For the Three Months Ended June 30, | | For the Six Months Ended June 30, |
| | 2020 |
| | 2019 |
| | 2020 |
| | 2019 |
|
| Revaluation of intercompany loans | $ | 338 |
| | $ | 939 |
| | $ | (284 | ) | | $ | 759 |
|
| Transaction gains / (losses) on long-term debt and other financing arrangements | 814 |
| | 422 |
| | (76 | ) | | (305 | ) |
| Transaction (losses) / gains on revaluation of monetary assets and liabilities | (1,145 | ) | | 794 |
| | (5,975 | ) | | (1,376 | ) |
| Foreign currency exchange gains / (losses), net | $ | 7 |
| | $ | 2,155 |
| | $ | (6,335 | ) | | $ | (922 | ) |
Change in fair value of derivatives: During For the three and ninesix months ended SeptemberJune 30, 2017,2019, we recognized losses as a result of the change in the fair valuepartial settlement of our USD/EUR foreign currency forward contracts entered into on January 31, 2017, May 16, 2017 and July 21, 2017 and the interest rate swaps we use as hedging instruments forin connection with the repayment of debt. We did not settle any portion of our interest paymentsrate swaps during the six months ended June 30, 2020.
Loss on the 2018 Euro Term Loan.extinguishment of debt: During the three and ninesix months ended SeptemberJune 30, 2016,2019, we recognized losses as a resulton extinguishment of debt related to partial repayments of the change in2021 Euro Loan. We did not prepay any principal amounts of our Euro Loans during the fair value of certain USD/EUR foreign currency forward contracts which matured in 2016. See Item 1, Note 12, "Financial Instrumentsthree and Fair Value Measurements".six months ended June 30, 2020.
Other income, / (expense), net: Our other income, / expense, net during the three and ninesix months ended SeptemberJune 30, 2017 and 2016 was not material.2020 increased compared with the same period in 2019 primarily due to the sale of used company vehicles in Bulgaria.
Provision for income taxes: The provision for income taxes for the three and ninesix months ended SeptemberJune 30, 20172020 was calculated using the discrete method and forreflects income tax charges on profits in each of our operating segments and the same periods in 2016 reflectsimpact of losses on which no tax benefit has been received and anreceived.
The provision for income tax chargetaxes for the three months ended June 30, 2019 reflects income taxes on profits in the Czech Republic, Romaniaeach of our segments and the Slovak Republic.impact of losses on which no tax benefit has been received.
Our operating subsidiaries are subject to income taxes at statutory rates ranging from 10.0%of 10% in Bulgaria, to 21.0%16% in Romania, 19% in the Czech Republic, 19% in Slovenia and 21% in the Slovak Republic.
Loss from discontinued operations, net of tax: Loss from discontinued operations, net of tax for the three and nine months ended September 30, 2017 and 2016 is comprised of the operational results of the Croatia and Slovenia segments including the allocation of interest expense and Guarantee Fees from the 2018 Euro Term Loan and transaction costs. See Item 1, Note 3, "Discontinued Operations and Assets Held for Sale" and Note 5, "Long-term Debt and Other Financing Arrangements".
Net loss / (income) attributable to noncontrolling interests: The results attributable to noncontrolling interests for the three and ninesix months ended SeptemberJune 30, 20172020 and 2016 relates2019 relate to the noncontrolling interest share of our Bulgaria operations.
Other comprehensive (loss) / income:
| | | | For the Three Months Ended September 30, (US$ 000's) | | For the Nine Months Ended September 30, (US$ 000's) | For the Three Months Ended June 30, (US$ 000's) | | For the Six Months Ended June 30, (US$ 000's) |
| | 2017 |
| | 2016 |
| | % Act |
| | 2017 |
| | 2016 |
| | % Act |
| 2020 |
| | 2019 |
| | % Act | | 2020 |
| | 2019 |
| | % Act |
| Currency translation adjustment, net | $ | 9,227 |
| | $ | 7,262 |
| | 27.1 | % | | $ | 42,203 |
| | $ | 15,264 |
|
| 176.5 | % | $ | 25,583 |
| | $ | 17,002 |
| | NM (1) | | $ | (35,466 | ) | | $ | 1,159 |
|
| NM (1) |
| (Loss) / gain on derivative instruments | (135 | ) | | (1,360 | ) | | 90.1 | % | | 1,083 |
| | (5,581 | ) | | NM (1) |
| |
| Unrealized gain / (loss) on derivative instruments | | 122 |
| | (1,220 | ) | | NM (1) | | 342 |
| | (4,551 | ) | | NM (1) |
| |
(1) | Number is not meaningful. |
Currency translation adjustment, net: The underlying equity value of our investments (which are denominated in the functional currency of the relevant entity) are converted into dollars at each balance sheet date, with any change in value of the underlying assets and liabilities being recorded as a currency translation adjustment to the balance sheet rather than net income / loss. Other comprehensive income / (loss) due to currency translation adjustment, net comprised the following for the three and nine months ended September 30, 2017 and 2016:
|
| | | | | | | | | | | | | | | | | | | | | |
| | For the Three Months Ended September 30, (US$ 000's) | | For the Nine Months Ended September 30, (US$ 000's) |
| | 2017 |
| | 2016 |
| | % Act |
| | 2017 |
| | 2016 |
| | % Act |
|
| Foreign exchange gain on intercompany transactions | $ | 1,142 |
| | $ | 2,263 |
| | (49.5 | )% | | $ | 7,824 |
| | $ | 10,757 |
| | (27.3 | )% |
| Foreign exchange gain / (loss) on the Series B Preferred Shares | 8,833 |
| | 1,334 |
| | NM (1) |
| | 29,284 |
| | (4,919 | ) | | NM (1) |
|
| Currency translation adjustment | (748 | ) | | 3,665 |
| | NM (1) |
| | 5,095 |
| | 9,426 |
| | (45.9 | )% |
| Currency translation adjustment, net | $ | 9,227 |
| | $ | 7,262 |
| | 27.1 | % | | $ | 42,203 |
| | $ | 15,264 |
| | 176.5 | % |
| |
(1)
| Number is not meaningful. |
Certain of our intercompany loans are denominated in currencies other than the functional currency of the lender and are considered to be of a long-term investment nature as the repayment of these loans is neither planned nor anticipated for the foreseeable future. The foreign exchange gains / (losses) on the remeasurement of these intercompany loans to the lender's functional currency are treated in the same manner as currency translation adjustments. Other comprehensive (loss) / income due to currency translation adjustment, net comprised the following for the three and six months ended June 30, 2020 and 2019:
|
| | | | | | | | | | | | | | | | | | | |
| | For the Three Months Ended June 30, (US$ 000's) | | For the Six Months Ended June 30, (US$ 000's) |
| | 2020 |
| | 2019 |
| | % Act | | 2020 |
| | 2019 |
| | % Act |
| Foreign exchange gain / (loss) on intercompany loans | $ | 5,180 |
| | $ | 2,868 |
| | NM (1) | | $ | (12,894 | ) | | $ | 2,256 |
| | NM (1) |
| Foreign exchange gain / (loss) on the Series B Preferred Shares | 5,884 |
| | 3,455 |
| | NM (1) | | (866 | ) | | (1,651 | ) | | NM (1) |
| Currency translation adjustment | 14,519 |
| | 10,679 |
| | NM (1) | | (21,706 | ) | | 554 |
| | NM (1) |
| Currency translation adjustment, net | $ | 25,583 |
| | $ | 17,002 |
| | NM (1) | | $ | (35,466 | ) | | $ | 1,159 |
| | NM (1) |
| |
(1) | Number is not meaningful. |
The following charts depict the movement of the dollar versus the functional currencies of our operations, based on monthly closing rates, during the ninesix months ended SeptemberJune 30, 20172020 and September 30, 20162019.
Percent Change During the NineSix Months Ended SeptemberJune 30, 20172020
Percent Change During the NineSix Months Ended SeptemberJune 30, 20162019
(Loss)Unrealized gain / gain(loss) on derivative instruments: instruments: The (losses)unrealized gain / gains(loss) on derivatives classified as cash flow hedges of the Euro Term Loans, which are recognized in accumulated other comprehensive income / loss, for the three and nine months ended September 30, 2017 and 2016 areis due to the effective portion of the changes in the fair value of our interest rate swap on the 2019swaps designated as cash flow hedges and 2021 Euro Term Loans.recognized in other comprehensive income/ (loss). See Item 1, Note 12,11, "Financial Instruments and Fair Value Measurements".
Condensed consolidated balance sheets as at SeptemberJune 30, 20172020 and December 31, 2016:2019:
| | | | Condensed Consolidated Balance Sheet (US$ 000’s) | Condensed Consolidated Balance Sheet (US$ 000’s) |
| | September 30, 2017 |
| | December 31, 2016 |
| | % Act |
| | % Lfl |
| June 30, 2020 |
| | December 31, 2019 |
| | % Act |
| | % Lfl |
|
| Current assets | $ | 423,318 |
| | $ | 340,422 |
| | 24.4 | % | | 10.6 | % | $ | 340,895 |
| | $ | 349,980 |
| | (2.6 | )% | | (0.6 | )% |
| Non-current assets | 1,149,372 |
| | 1,050,295 |
| | 9.4 | % | | (4.4 | )% | 1,121,647 |
| | 1,097,882 |
| | 2.2 | % | | 7.3 | % |
| Current liabilities | 215,528 |
| | 171,565 |
| | 25.6 | % | | 11.1 | % | 167,145 |
| | 156,001 |
| | 7.1 | % | | 12.3 | % |
| Non-current liabilities | 1,154,383 |
| | 1,070,785 |
| | 7.8 | % | | (3.4 | )% | 677,200 |
| | 680,273 |
| | (0.5 | )% | | 1.2 | % |
| Temporary equity | 262,115 |
| | 254,899 |
| | 2.8 | % | | 2.8 | % | 269,370 |
| | 269,370 |
| | — | % | | — | % |
| CME Ltd. shareholders’ deficit | (59,278 | ) | | (107,804 | ) | | 45.0 | % | | 43.1 | % | |
| CME Ltd. shareholders’ equity | | 348,441 |
| | 341,705 |
| | NM (1) |
| | NM (1) |
|
| Noncontrolling interests in consolidated subsidiaries | (58 | ) | | 1,272 |
| | NM (1) |
| | NM (1) |
| 386 |
| | 513 |
| | (24.8 | )% | | (27.9 | )% |
| |
(1) | Number is not meaningful. |
Note: The analysis below is intended to highlight the key factors at constant rates that led to the movements from December 31, 2016,2019 to June 30, 2020, excluding the impact of foreign currency translation.
Current assets: Excluding the impact of assets held for sale, currentCurrent assets at SeptemberJune 30, 20172020 decreased from December 31, 20162019 primarily due to lower trade receivables from increased collection and higher bad debt provisions. Further decreases are duethe adoption of new accounting guidance which no longer requires programming content to seasonality and lower prepayments for program rights.
Non-current assets: Excludingbe classified as current based on its expected timing of usage as well as the impact of assets held for sale, non-currentthe COVID-19 pandemic and seasonality on sales.
Non-current assets: Non-current assets at SeptemberJune 30, 20172020 increased from December 31, 20162019 primarily due to higher program rights from foreign acquired and own-produced content partlythe adoption of new accounting guidance as noted above, offset by increased depreciation of property, plant and equipment and amortization of intangible assets.assets purchased or leased in both 2020 and 2019.
Current liabilities: Excluding the impact of liabilities held for sale, current Current liabilities at SeptemberJune 30, 20172020 increased from December 31, 2016. The increase is2019 primarily due to higher deferred revenue from customer prepayments forand higher programming-related payables, offset by fewer production and fixed asset related payables and the fall season andpayment of accrued interest and Guarantee Fees.bonuses related to 2019 performance.
Non-current liabilities: Excluding the impact of liabilities held for sale, On a constant currency basis, non-current liabilities at SeptemberJune 30, 2017 decreased from 2020 remained in line with December 31, 2016 primarily due to our election to repay a portion of the 2018 Euro Term Loan in August 2017.2019. See Item 1, Note 5,4, "Long-term Debt and Other Financing Arrangements".
Temporary equity: Temporary equity at September 30, 2017 increased from December 31, 2016 due torepresents the accretion onaccreted value of the Series B Preferred Shares.
CME Ltd. shareholders’ deficit: CME Ltd. shareholders’ deficit decreased from December 31, 2016. Thisequity: The increase in shareholders' equity during the six months ended June 30, 2020 primarily reflects a decrease in accumulated other comprehensive loss due tothe impact of currency translation adjustments and theadjustment, offset by net income attributable to CME Ltd. during the nine months ended September 30, 2017, which was partly offset by accretion of the preferred dividend paid in kind on our Series B Preferred Shares.
Noncontrolling interests in consolidated subsidiaries: Noncontrolling interests in consolidated subsidiaries at September 30, 2017 decreased from December 31, 2016 due to the net loss attributable torepresents the noncontrolling interest in Bulgaria.
IV. Liquidity and Capital Resources
IV (a) Summary of Cash Flows
Cash and cash equivalents increased by US$ 26.4139.5 million during the ninesix months ended SeptemberJune 30, 20172020. The change in cash and cash equivalents for the periodsperiod presented below is summarized as follows:
|
| | | | | | | |
| | For the Nine Months Ended September 30, (US$ 000's) |
| | 2017 |
| | 2016 |
|
| Net cash generated from continuing operating activities | $ | 90,638 |
| | $ | 56,972 |
|
| Net cash used in continuing investing activities | (16,250 | ) | | (14,762 | ) |
| Net cash used in continuing financing activities | (57,782 | ) | | (23,191 | ) |
| Net cash used in discontinued operations | (62 | ) | | (22,278 | ) |
| Impact of exchange rate fluctuations on cash and cash equivalents | 9,884 |
| | 2,005 |
|
| Net increase / (decrease) in cash and cash equivalents | $ | 26,428 |
| | $ | (1,254 | ) |
|
| | | | | | | |
| | For the Six Months Ended June 30, (US$ 000's) |
| | 2020 |
| | 2019 |
|
| Net cash generated from operating activities | $ | 154,995 |
| | $ | 140,280 |
|
| Net cash used in investing activities | (8,658 | ) | | (8,266 | ) |
| Net cash used in financing activities | (3,929 | ) | | (118,929 | ) |
| Impact of exchange rate fluctuations on cash and cash equivalents | (2,935 | ) | | (477 | ) |
| Net increase in cash and cash equivalents | $ | 139,473 |
| | $ | 12,608 |
|
Operating Activities
The increase inNet cash generated from continuing operationsoperating activities increased during the ninesix months ended SeptemberJune 30, 2017 reflects a significant decrease in cash paid for interest and Guarantee Fees. In 2016, we paid accrued interest related2020 when compared to the 2017 PIK Notes and 2017 Term Loan when they were refinancedsame period in April 2016 and we also repaid US$ 5.5 million of accrued Guarantee Fees in the first half of 2016 which were previously paid in kind. The increase also reflects higher cash collections from revenue growth which are partly offset by higher cash paid2019 primarily due to lower payments for own-produced programming and taxes in 2017.taxes. We paid cash interest (including mandatory cash-pay Guarantee Fees) of US$ 22.210.5 million during the ninesix months ended SeptemberJune 30, 20172020 compared to US$ 38.314.0 million during the ninesix months ended SeptemberJune 30, 2016.2019.
Investing Activities
Our netNet cash used in continuing investing activities for the ninesix months ended SeptemberJune 30, 20172020 and 2016 relates to2019 primarily reflects capital expenditures for property, plantproduction-related facilities and equipment.equipment in Bulgaria, the Czech Republic and Romania.
Financing Activities
CashNet cash used in continuing financing activities during the ninesix months ended SeptemberJune 30, 20172020 primarily reflected principal repayments madereflects payments on our 2018 Euro Term Loan. The cashfinance leases. Cash used in continuing financing activities during the ninesix months ended SeptemberJune 30, 20162019 primarily reflectedreflects principal repayments on our obligations under the refinancing of the 2017 PIK Notes and the 2017 Term Loan, partly offset by proceeds from the exercise of stock warrants.
Discontinued Operations
The net cash used in discontinued operations during the nine months ended September 30, 2017 primarily reflected capital expenditures for property, plant and equipment. The net cash used in discontinued operations during the nine months ended September 30, 2016 primarily reflected the payment of Guarantee Fees related to the 20182021 Euro Term Loan.
IV (b) Sources and Uses of Cash
Our ongoing source of cash is primarily the receipt of payments from advertisers, advertising agencies and distributors of our television channels. WeAs at June 30, 2020, we also havehad available the 2021aggregate principal amount of US$ 75.0 million under the 2023 Revolving Credit Facility (see Item 1, Note 5,4, "Long-term Debt and Other Financing Arrangements"). As at September 30, 2017, the aggregate principal amount available under the 2021 Revolving Credit Facility was US$ 115.0 million and was undrawn. The available amount decreases to US$ 50.0 million with effect from January 1, 2018 or, if earlier, upon the repayment of the 2018 Euro Term Loan with the expected proceeds from the Divestment Transaction. Surplus cash, after funding ongoing operations, may be remitted to us, where appropriate, by our subsidiaries in the form of debt interest payments, and capitalprincipal repayments, dividends, and other distributions and loans from our subsidiaries.
Corporate law in the Central and Eastern European countries in which we operate stipulates generally that dividends may be declared by the partners or shareholders out of yearly profits subject to the maintenance of registered capital, required reserves (if applicable) and after the recovery of accumulated losses. The reserve requirement restriction generally provides that before dividends may be distributed, a portion of annual net profits (typically at least 5.0%) be allocated to a reserve, which is capped at a proportion of the registered capital of a company (ranging from 5.0% to 20.0%). There are no third-party restrictions that limit our subsidiaries' ability to transfer amounts to us in the form of loans or advances.
IV (c) Contractual Obligations, Commitments and Off-Balance Sheet Arrangements
Our future contractual obligations as at SeptemberJune 30, 20172020 were as follows:
| | | | Payments due by period (US$ 000’s) | Payments due by period (US$ 000’s) |
| | Total |
| | Less than 1 year |
| | 1-3 years |
| | 3-5 years |
| | More than 5 years |
| Total |
| | Less than 1 year |
| | 1-3 years |
| | 3-5 years |
| | More than 5 years |
|
| Long-term debt – principal | $ | 1,068,366 |
| | $ | — |
| | $ | 514,901 |
| | $ | 553,465 |
| | $ | — |
| $ | 592,526 |
| | $ | — |
| | $ | 592,526 |
| | $ | — |
| | $ | — |
|
| Long-term debt – interest | 253,560 |
| | 56,089 |
| | 127,104 |
| | 70,367 |
| | — |
| 94,647 |
| | 21,312 |
| | 73,335 |
| | — |
| | — |
|
| Unconditional purchase obligations | 140,986 |
| | 54,344 |
| | 62,223 |
| | 20,509 |
| | 3,910 |
| 79,969 |
| | 24,670 |
| | 38,016 |
| | 14,831 |
| | 2,452 |
|
| Operating leases | 8,590 |
| | 3,430 |
| | 2,530 |
| | 958 |
| | 1,672 |
| |
| Capital lease obligations | 7,941 |
| | 2,606 |
| | 4,172 |
| | 1,163 |
| | — |
| |
| Operating lease obligations | | 13,421 |
| | 3,831 |
| | 5,004 |
| | 2,823 |
| | 1,763 |
|
| Finance lease obligations | | 15,012 |
| | 7,185 |
| | 6,973 |
| | 854 |
| | — |
|
| Other long-term obligations | 31,182 |
| | 15,554 |
| | 14,376 |
| | 1,134 |
| | 118 |
| 25,170 |
| | 11,296 |
| | 11,202 |
| | 2,672 |
| | — |
|
| Total contractual obligations | $ | 1,510,625 |
| | $ | 132,023 |
| | $ | 725,306 |
| | $ | 647,596 |
| | $ | 5,700 |
| $ | 820,745 |
| | $ | 68,294 |
| | $ | 727,056 |
| | $ | 21,180 |
| | $ | 4,215 |
|
Long-Term Debt
For more information on our long-term debt, see Item 1, Note 5,4, "Long-term Debt and Other Financing Arrangements". Interest payable on our long-term debt is calculated using exchangeinterest rates and interestexchange rates in effect as at SeptemberJune 30, 20172020. For the purposes of the above table, it is assumed that the Guarantee Fees eligible to be paid in kind will be paid in kind at each interest payment date through the maturity dates of the respective Euro Term Loan. However, we intend to allocate excess cash towards paying the Guarantee Fees related to the 2018 Euro Term Loan in cash rather than electing to pay any portion in kind.
Unconditional Purchase Obligations
Unconditional purchase obligations primarily comprise future programming commitments. At SeptemberJune 30, 2017,2020, we had commitments in respect of future programming of US$ $138.979.2 million. This includes signed contracts signed with license periods starting after SeptemberJune 30, 2017.2020.
Operating and Finance Leases
For more information on our operating and finance lease commitments, see Item 1, Note 20, "Commitments and Contingencies"10, "Leases".
Other Long-Term Obligations
Other long-term obligations are primarily comprised of digital transmission commitments.
Other
Top Tone Media Holdings Limited has exercised its right to acquire additional equity in CME Bulgaria. However, the closing of this transaction has not yet occurred because the purchaser financing is still pending. If consummated, we would own 90.0% of our Bulgaria broadcast operations. The option strike price is the fair value of the equity in CME Bulgaria, as determined by an independent valuation.
IV (d) Cash Outlook
BecauseFor the six months ended June 30, 2020, net cash flowsgenerated from operating activities were negative from 2012and unlevered free cash flow was US$ 155.0 million and US$ 157.1 million, respectively, compared to 2014,US$ 140.3 million and US$ 146.0 million, respectively, for the six months ended June 30, 2019 (See Section II, Overview). As at June 30, 2020, we relied on equityhad US$ 176.1 million in cash and cash equivalents and US$ 75.0 million of available aggregate principal amount under the 2023 Revolving Credit Facility. Our nearest debt financingsmaturity of EUR 60.3 million (US$ 67.6 million) is in November 2021.
As at June 30, 2020, our net leverage ratio was 2.4x which resulted in a weighted average all-in rate applicable to ensure adequate funding for our operations. While cash flows from operating activities were positive in 2015 and 2016, our average cost of borrowing was high and our election to pay certain interestthe Euro Loans and Guarantee Fees previously paid in kind increased our leverage. Our financing transactions in 2016 and 2017 significantly lowered our cost of borrowing.
Following the repricingapproximately 3.4%. In 2019, we repaid US$ 168.9 million of our Guarantee Fees completed in March 2017,debt. As a result, we are now required to pay a portion of the Guarantee Fees related to all of the Euro Term Loans in cash. However, the total amount ofexpect cash paid for interest and Guarantee Fees will decrease significantlyto decline in 2017 due2020 compared to 2019.
Our financial position and cash generation remains robust and we do not expect any near-term liquidity constraints. Cash flows during the lower all-in rate following this repricing transactionfirst half of 2020 reflect a significant decline in payments for own-produced programming, including during the temporary suspension of productions between March and non-repeating payments that were made in 2016 when we elected to repay in cash accrued Guarantee Fees related to the 2018 Euro Term Loan that were previously paid in kindMay 2020, as well as whenlower cash paid for taxes as we paid accrued interest onutilized national stimulus plans, such as provisions relating to delaying the 2017 PIK Notespayment of corporate income tax. While cash flow is normally lower in the second half of the year and 2017 Term Loan when they were refinanced.
As at September 30, 2017, we have repaid in cash all previously accrued Guarantee Fees related to the 2018 Euro Term Loan and intend to continue to make payments of such Guarantee Fees in cash when due, rather than electing to pay in kind. However, we expect improvements in unlevered free cash flow to exceed the amount of these payments, and therefore expect free cash flow to increase in 2017collections will be lower compared to 2016.
As at September 30, 2017, we had US$ 67.0 million in cash and cash equivalents. In August 2017, we paid down EUR 50.0 million (approximately US$ 59.1 million at August 1, 2017 rates) of the outstanding principal balance of the 2018 Euro Term Loan with cash on hand. Following this repayment, we anticipate using excess cash, including free cash flow2019 from the business, expected proceeds from the Divestment Transaction and expected proceeds from warrant exercises,year-on-year decline in second quarter net revenues, we are able to repay the remainder of the 2018 Euro Term Loan in full before it matures in November 2018. In the event that the Divestment Transaction does not close or we do not receive the expected warrant proceeds, we will needtake steps to secure other external sources of capital to repay the 2018 Euro Term Loan and fundbolster our operations,cash position, including through public or private debt or equity financing transactions, which may not be available to us or may not be available on acceptable terms. If these actions are not successful, we will not have sufficient liquidity to repaychanges in programming and production, as well as the 2018 Euro Term Loan prior to its maturity on November 1, 2018.
deferral of all non-essential capital expenditures and reductions in discretionary spending.
Credit ratings and future debt issuances
Our corporate credit is rated B2B1 by Moody's Investors Service with a positivestable outlook and B+ by Standard & Poor's, (currently on CreditWatchwatch with developingnegative implications due to the announced Divestment Transaction). Ratingsproposed Merger. Our ratings show each agency's opinion of our financial strength, operating performance and ability to meet our debt obligations as they become due, as well as the proposed Merger and the uncertainty around the magnitude and timing of the disruptions caused by the COVID-19 outbreak. These ratings take into account the particular emphasis the ratings agencies have indicated that retention of these ratings is dependentplace on maintaining an adequate liquidity profile,metrics such as leverage ratiosratio and cash flow, profilewhich they use as well as track recordmeasurements of a company's liquidity and financial strength. They also reflect the consideration placed by the rating agencies on the historically strong financial support from Time Warner. Among other parameters,Warner Media. We may be subject to downgrades if our operating performance deteriorates or we fail to meetmaintain adequate liquidity, it is likely that the rating agencies will downgrade us. The availabilitylevels of additional liquidity is dependent upon our continued operating performance, improved financial performance and credit ratings. We are currently able to raise only a limited amount of additional debt (other than refinancing indebtedness) or under the agreement governing the 2021 Revolving Credit Facility and the Reimbursement Agreement.liquidity.
Credit risk of financial counterparties
We have entered into a number of significant contracts with financial counterparties as follows:
Interest Rate Swaps
We are party to interest rate swap agreements to mitigate our exposure to interest rate fluctuations on our Euro Term Loans. These interest rate swaps certain of which are designated as cash flow hedges and provide the Company with variable-rate cash receipts in exchange for fixed-rate payments over the lives of the agreements, with no exchange of the underlying notional amount.
Foreign Exchange Forwards
We are exposed to movements in the exchange rates of USD to EUR exchange ratesthe functional currencies of our operating segments related to contractual payments under dollar-denominated agreements. To reduce this exposure, from timewe may decide to time we enter into pay-Euro receive-dollar forward foreign exchange contracts. As at SeptemberWe had no such agreements outstanding during the period ending June 30, 2017, two forward foreign exchange contract with an aggregate notional amount of approximately US$ 26.3 million related to contractual operating payments were outstanding.2020.
Cash Deposits
We may deposit cash in the global money markets with a range of bank counterparties and review the counterparties we choose weekly.regularly. The maximum period of deposit is three months, but we have more recently held amounts on deposit for shorter periods, from overnightup to one month.week. The credit rating of a bank is a critical factor in determining the size of cash deposits and we will only deposit cash with banks of investment grade rating. In addition, we also closely monitor the credit default swap spreads and other market information for each of the banks with which we consider depositing or have deposited funds.
IV (e) Off-Balance Sheet Arrangements
None.
V. Critical Accounting Policies and Estimates
Our accounting policies that have a material effect on our financial condition and results of operations are more fully described in Part II, Item 8 of our Annual Report on Form 10-K for the year ended December 31, 20162019 filed with the Securities and Exchange Commission ("SEC") on February 9, 2017.6, 2020. The preparation of these financial statements requires us to make judgments in selecting appropriate assumptions for calculating financial estimates, which inherently contain some degree of uncertainty. We base our estimates on historical experience and on various other assumptions that we believe to be reasonable. Using these estimates, we make judgments about the carrying values of assets and liabilities and the reported amounts of revenues and expenses that are not readily apparent from other sources. Actual results may differ from these estimates under different assumptions or conditions.
We believe our critical accounting policies are as follows: program rights, goodwill and intangible assets, impairment or disposal of long-lived assets, revenue recognition, leases, income taxes, foreign exchange, determination of the fair value of financial instruments, contingencies and discontinued operations.contingencies. These critical accounting policies affect our more significant judgments and estimates used in the preparation of our condensed consolidated financial statements. See Item 1, Note 2, "Basis of Presentation" for a discussion of accounting standards adopted in the period, and recently issued accounting standards not yet adopted.
Item 3. Quantitative and Qualitative Disclosures about Market Risk
We engage in activities that expose us to various market risks, including the effect of changes in foreign currency exchange rates and interest rates. We do not engage in speculative transactions, nor do we hold or issue financial instruments for trading purposes. The table below sets forth our market risk sensitive instruments as at the following dates:
SeptemberJune 30, 2017:2020:
| | | Expected Maturity Dates | | 2017 |
| | 2018 | | 2019 |
| | 2020 |
| | 2021 |
| | Thereafter | | 2020 |
| | 2021 | | 2022 |
| | 2023 | | 2024 |
| | Thereafter |
|
| Long-term Debt (000's): | | | | | | | | | | | | | | |
| | |
| | | | | | | | |
Variable rate (EUR) | | — |
| | 200,800 |
| | 235,335 |
| | — |
| | 468,800 |
| | — |
| | — |
| | 60,335 |
| | — |
| | 468,800 |
| | — |
| | — |
|
Average interest rate (1) | | — |
| | 1.50 | % | | 1.50 | % | | — |
| | 1.50 | % | | — |
| | — |
| | 1.28 | % | | — |
| | 1.28 | % | | — |
| | — |
|
| | | | | | | | | | | | | | | | | | | | | | | | | |
| Interest Rate Swaps (000's): | | | | | | | | | | | | | | | | | | | | | | | | |
| Variable to fixed (EUR) | | 200,800 |
| | 200,800 |
| (2) | | 235,335 |
| | — |
| | 468,800 |
| | — |
| | — |
| | 529,135 |
| | — |
| | 468,800 |
| (2) | | — |
| | — |
|
| Average pay rate | | 0.21 | % | | 0.14 | % | | 0.31 | % | | — |
| | 0.28 | % | | — |
| | — |
| | 0.30 | % | | — |
| | 0.97 | % | | — |
| | — |
|
| Average receive rate | | — | % | | — | % | | — | % | | — |
| | — | % | | — |
| | — |
| | — | % | | — |
| | — | % | | — |
| | — |
|
| |
(1) | As discussed in Item 1, Note 5,4, "Long-term Debt and Other Financing Arrangements", as consideration for Time Warner'sWarner Media's guarantee of the Euro Term Loans, we pay Guarantee Fees to Time Warner Media based on the amounts outstanding on the Euro Term Loans, each calculated such that the all-in borrowing rate on eachthe 2021 Euro Loan was 3.25% per annum and the all-in borrowing rate on the 2023 Euro Loan was 3.50% per annum as of the Euro Term Loans will be 6.0% from the end of October 2017 due to the reduction of our net leverage ratio at SeptemberJune 30, 2017.2020. |
| |
(2) | The interest rate swaps related to the 2023 Euro Loan maturing in 20182023 are forward starting to coincide with the maturity date of the interest rate swaps maturing in 2017.2021. See Item 1, Note 12,11, "Financial Instruments and Fair Value Measurements". |
December 31, 2016:2019:
| | | Expected Maturity Dates | | 2017 |
| | 2018 | | 2019 |
| | 2020 |
| | 2021 |
| | Thereafter |
| | 2020 |
| | 2021 |
| | 2022 |
| | 2023 | | 2024 |
| | Thereafter |
|
| Long-term Debt (000's): | | | | | | | | | | | | | | | | | | | | | | | | |
| Variable rate (EUR) | | — |
| | 250,800 |
| | 235,335 |
| | — |
| | 468,800 |
| | — |
| | — |
| | 60,335 |
| | — |
| | 468,800 |
| | — |
| | — |
|
Average interest rate (1) | | — |
| | 1.50 | % | | 1.50 | % | | — |
| | 1.50 | % | | — |
| | — |
| | 1.28 | % | | — |
| | 1.28 | % | | — |
| | — |
|
| | | | | | | | | | | | | | | | | | | | | | | | | |
| Interest Rate Swaps (000's): | | | | | | | | | | | | | | | | | | | | | | | | |
| Variable to fixed (EUR) | | 250,800 |
| | 250,800 |
| (2) | | 235,335 |
| | — |
| | 468,800 |
| | — |
| | — |
| | 529,135 |
| | — |
| | 468,800 |
| (2) | | — |
| | — |
|
| Average pay rate | | 0.21 | % | | 0.14 | % | | 0.31 | % | | — |
| | 0.28 | % | | — |
| | — |
| | 0.30 | % | | — |
| | 0.97 | % | | — |
| | — |
|
| Average receive rate | | — | % | | — | % | | — | % | | — |
| | — | % | | — |
| | — |
| | — | % | | — |
| | — | % | | — |
| | — |
|
| |
(1) | WeAs discussed in Item 1, Note 4, "Long-term Debt and Other Financing Arrangements", as consideration for Warner Media's guarantee of the Euro Loans, we pay Guarantee Fees to Time Warner Media based on the amounts outstanding on the Euro Term Loans, each calculated such that the all-in borrowing rate on each the 20182021 Euro Term Loan and the 2019 Euro Term Loan was 8.5%3.25% per annum and the all-in borrowing rate on the 20212023 Euro Term Loan was 9.0%3.50% per annum.annum as of December 31, 2019. |
| |
(2) | The interest rate swaps related to the 2023 Euro Loan maturing in 20182023 are forward starting to coincide with the maturity date of the interest rate swaps maturing in 2017.2021. See Item 1, Note 12,11, "Financial Instruments and Fair Value Measurements". |
Foreign Currency Exchange Risk Management
We conduct business in a number of currencies other than our functional currencies. As a result, we are subject to foreign currency exchange rate risk due to the effects that foreign exchange rate movements of these currencies have on our costs and on the cash flows we receive from our subsidiaries. In limited instances including the transactions noted below, we enter into forward foreign exchange contracts to minimize foreign currency exchange rate risk.
We periodically enter into At June 30, 2020, no forward foreign exchange contracts to reduce our exposure to movements in the USD to EUR exchange rates related to contractual payments under dollar-denominated agreements. At September 30, 2017, two forward foreign exchange contracts with an aggregate notional amount of approximately US$ 26.3 million were outstanding.
Interest Rate Risk Management
The Euro Term Loans each bear interest at a variable rate based on EURIBOR plus an applicable margin. We are party to a number of interest rate swap agreements intended to reduce our exposure to interest rate movements (see Item 1, Note 12,11, "Financial Instruments and Fair Value Measurements").
Item 4. Controls and Procedures
We have established disclosure controls and procedures designed to ensure that information required to be disclosed in our Quarterly Report on Form 10-Q is recorded, processed, summarized and reported within the specified time periods and is designed to ensure that information required to be disclosed is accumulated and communicated to management, including the co-Principal Executive Officers and the Principal Financial Officer, to allow timely decisions regarding required disclosure.
Our co-Principal Executive Officers and our Principal Financial Officer evaluated the effectiveness of the design and operation of our disclosure controls and procedures as of SeptemberJune 30, 20172020 and concluded that our disclosure controls and procedures were effective as of that date. There has been no change in our internal control over financial reporting during the three months ended SeptemberJune 30, 20172020 that has materially affected, or is reasonably likely to materially affect, our internal control over financial reporting.
PART II. OTHER INFORMATION
Item 1. Legal Proceedings
General
We are from time to time party to legal proceedings, arbitrationsSee Part 1, Item 1, Note 19, "Commitments and regulatory proceedings arising in the normal courseContingencies" for a discussion of our business operations, including the proceeding described below. We evaluate, on a quarterly basis, developments in such matters and provide accruals for such matters, as appropriate. In making such decisions, we consider the degree of probability of an unfavorable outcome and our ability to make a reasonable estimate of the amount of a loss. An unfavorable outcome in any such proceedings, if material, could have an adverse effect on our business or consolidated financial statements.
In the fourth quarter of 2016, our Slovak subsidiary MARKIZA-SLOVAKIA, spol. s.r.o. (“Markiza”) was notified of claims that were filed in June 2016 in a court of first instance in Bratislava, the Slovak Republic to collect amounts allegedly owing under four promissory notes. These four promissory notes were purportedly issued in June 2000 by Pavol Rusko in his personal capacity and were purportedly guaranteed by Markiza under the signature of Mr. Rusko, who was an executive director of Markiza at that time as well as one of its shareholders. The notes purport to be issued in favor of Marian Kocner, a controversial Slovak businessman, and to a former associate of Mr. Kocner, and were supposedly assigned several times, ultimately to Sprava a inkaso zmeniek, s.r.o., a company owned by Mr. Kocner that is the plaintiff in these proceedings. Two of the notes allegedly matured in 2015 and the other two in 2016. The four notes purport to be in the aggregate amount of approximately EUR 69 million.
Despite a random case assignment system in the Slovak Republic, claims in respect of three of the notes were initially assigned to the same judge. The judge who was assigned the claim in respect of the fourth promissory note (in the amount of approximately EUR 26 million) terminated proceedings in January 2017 because the plaintiff failed to pay court fees. The plaintiff refiled this claim in June 2017; the judge who was assigned the refiled claim terminated proceedings in September after the plaintiff again failed to pay court fees. In responses to the claims in respect of the other three promissory notes that were filed in August 2017, Mr. Rusko asserted that he signed the three notes in June 2000. We do not believe that the notes were signed in June 2000 or that any of the notes are authentic. We are vigorously defending the claims.ongoing litigation.
Item 1A. Risk Factors
This report and the following discussion of risk factors contain forward-looking statements as discussed in Part I, Item 2, "Management's Discussion and Analysis of Financial Condition and Results of Operations". Our actual results may differ materially from those anticipated in these forward-looking statements as a result of certain factors, including the risks and uncertainties described below and elsewhere in this report. These risks and uncertainties are not the only ones we may face. Additional risks and uncertainties of which we are not aware, or that we currently deem immaterial, may also become important factors that affect our financial condition, results of operations and cash flows.
Risks Relating to Our Financial Position
Our business, results of operations and financial condition may be adversely affected by the ongoing COVID-19 pandemic and the actions taken by governmental authorities in response to the pandemic.
The ongoing COVID-19 pandemic and the measures taken to address the public health concerns associated with the pandemic have resulted in significant disruptions to business activity worldwide, volatility in the equity markets and credit markets, and uncertainty in the global economic outlook. Such measures have included travel restrictions and national border closings, restrictions on the conduct of non-essential business, closures of workplaces and schools, quarantines, shelter in place orders and social distancing orders. While governments in the countries in which we operate have taken steps to relax or lift a number of restrictions (including restrictions on the conduct of non-essential business, shelter in place orders, certain social distancing orders and certain travel restrictions and border controls), the imposition of these various measures has impacted our business and the continuation of such measures or the re-imposition of similar or stricter measures may further impact our business.
Restrictions implemented on business activity and uncertainty in the global economic outlook has caused advertisers to adjust their purchasing plans and reduce their spending on advertising and a deterioration in economic conditions globally or in the markets in which we operate may cause advertisers to further adjust purchases of advertising in the future. Risks related to changes in global or regional economic conditions are described in more detail below. Furthermore, uncertainty in the global or regional economic outlook may adversely affect our ability to develop information in order to prepare accurate financial forecasts.
In addition, restrictive measures imposed in the countries in which we operate as well as health-related concerns related to working conditions have had and may continue to have an impact on our day-to-day business operations, including the availability of people necessary to our operations, the deferral or suspension of certain productions, decisions regarding programming acquisitions and scheduling. While we are not anticipating any material impact to our internal ability to operate our business as a result of the COVID-19 pandemic, we may temporarily lose the services of employees or experience interruptions in the normal conduct of businesses or operation of our systems, which could lead to inefficiencies, interruptions in our regular operations and potential reputational harm.
Although we have undertaken a number of steps to mitigate the impact of the COVID-19 pandemic on our business, including a series of initiatives to control or reduce costs, such cost control measures are unlikely to completely offset declines in revenues. The extent to which COVID-19 impacts our business and financial position will depend on future developments, which are difficult to predict, including the ability of governmental authorities to contain the COVID-19 virus, the severity and scope of any future COVID-19 outbreaks as well as the types and scope of measures imposed by governmental authorities to contain future outbreaks of the virus or address its impact and the duration of those actions and measures. While governments in the countries in which we operate have relaxed or lifted a number of the restrictive measures, the measures that remain in place and the re-imposition of similar or more restrictive measures by governmental authorities to contain the COVID-19 virus or a prolonged period during which any such measures are kept in place would have an adverse impact on our business, financial position, results of operations and cash flows.
Changes in global or regional economic conditions may adversely affect our financial position and results of operations.
The results of our operations depend heavily on advertising revenue, and demand for advertising is affected by general economic conditions in the region and globally. OurWhile our markets have experienced overall growth in real GDP (as adjusted for inflation) and advertising spending since 2014; however, we cannot predict ifover the recovery that has begunlast several years, it is unlikely those growth trends will continue in the immediate future, given the uncertain economic outlook globally and increased volatility in the equity markets and credit markets caused by the COVID-19 pandemic. While a number of governments and central banks have introduced fiscal and monetary measures in an effort to mitigate the economic impact of the COVID-19 pandemic and the governments in our markets have taken steps to relax or how longlift several restrictive measures, it will last.is not yet possible to establish the impact of such steps. Recessions or periods of low or negative growth in the region or globally, inincluding as a result of the future mayCOVID-19 pandemic, would cause a deterioration of general economic conditions in one or more of our markets, which would have an adverse economic impact on our advertising revenues.revenues and our financial position (including our leverage levels), results of operations and cash flows. Other factors that may affect general economic conditions in our markets include defaults by sovereigns or systemically important companies, austerity programs, the widespread use of tariffs and other protectionist trade policies, natural disasters, public health pandemics, acts of terrorism, civil or military conflicts or general political instability and responses to it, any of which may also reduce advertising spending. In addition, although we believe the advertising spend per capita of the countries in which we operate and advertising intensity (the ratio of total ad spend per capita to nominal GDP per capita) will converge with developed markets in Europe, such convergence may not occur in the time frame we expect, or at all. Any of these developments would have a significant negative effect on our financial position, results of operations and cash flows.
The quantitative easing programs implemented by the EurozoneEuropean Central Bank ("ECB") and the impact on the region of the United Kingdom’s exit from the European Union (“EU”)stability mechanism may not provide adequate assistance to stabilize markets, which may adversely affect our financial position and results of operations.
Continued economic softness inIn 2015 the Eurozone, including a slowdown in the growth of consumer prices, prompted the European Central Bank to embark upon quantitative easing in 2015. Economic events related to the sovereign debt crisis in several EU countries have also highlighted issues relating to the strength of the banking sector in Europe and the Euro. Although the EU hasECB created external funding and stability mechanisms to provide liquidity and financial assistance to Eurozone member states and financial institutions, thereincluding embarking on quantitative easing to address economic softness and a slowdown in growth of consumer prices in the Eurozone. The ECB’s quantitative easing program, which assisted economic growth, was recalibrated in January 2018. Although the ECB ended its original quantitative easing program at the end of December 2018, it resumed quantitative easing in November 2019 and in March 2020 authorized a new quantitative easing program with fewer restrictions than prior programs in response to the COVID-19 pandemic. In addition, European Union ("EU") leaders have agreed on a COVID-19 recovery fund of EUR 750 billion; the recovery fund, which must be approved by the European parliament , is to be comprised of grants, particularly for EU member states most affected by the pandemic, and loans. There can be no assurance that the market disruptionsstability mechanism in Europe, relatedany quantitative easing program or the recovery fund, when adopted, will be sufficient to sovereign debt andsupport economies in the banking sectorEuropean Union affected by the COVID-19 pandemic or otherwise, including the increased cost of funding for certain governments andwill provide adequate liquidity or financial institutions, will not continue andassistance to any affected financial institution or country, nor can there can be noany assurance that funding and stabilityfuture assistance packages utilized previously will be available or, even if provided, will be sufficient to stabilizeaddress these concerns. The failure of these programs to mitigate the impact of the COVID-19 pandemic on the markets and economies of Europe may result in periods of low or negative growth in the markets in which we operate as well as further adverse events, including the dissolution of the Euro or the departure of a country from the Euro, any of which would negatively impact our business, financial position and results of operations.
Our financial position and results of operations may be adversely affected economies or institutions.
as a result of the United Kingdom’s decision to end its membership in the European Union.
On March 29, 2017,January 31, 2020, the United Kingdom formally initiated the process to leaveleft the EU commonly(generally referred to as "Brexit", triggering“Brexit”); however, it remains in the single market and is subject to the EU’s rules and regulations during a two-yeartransition period to finalize the terms for its leaving the EU. Itending December 31, 2020. While it is expected that economic conditions in the EU will be impacted by Brexit. WhileBrexit, the impact on our business will depend, in part, on the outcome of tariff, trade, regulatory and other negotiations during this transition period and on the ultimate manner and terms of the U.K.’s future relationship with the EU. Given the ongoing uncertainty over the final terms to be negotiated during the transition period, the overall economic impact of Brexit on the EU and the Euro iscontinues to be difficult to estimate at present, decisionsestimate. Decisions to conserve cash and reduce spending by consumers and businesses in the United Kingdom would have a negative impact on economic growth rates in the United Kingdom and, to a lesser extent, in the EU, in particular those countries that are significant exporters to the United Kingdom. There is also significant uncertainty regarding the terms on which the United Kingdom will leave the EU, and it is expected that a more protracted process to set those terms would have a more prolonged economic impact. In addition, if other countries seek to leave the EU, that would increase uncertainty in the region, which may have a further negative impact on investment and economic growth rates. Furthermore, the departure of the United Kingdom from the EU may further affect the budgetary contributions and allocations among the EU member states in the medium term, including the countries in which we operate, which arehave historically been net recipients of EU funding. Economic uncertainty caused by Brexit or other instability in the EU following the end of the transition period could cause significant volatility in EU markets and reduce economic growth rates in the countries in which we operate, which would negatively impact the demand for advertising and consequently our business.financial position, results of operations and cash flows.
Our operating results will be adversely affected if we cannot generate strong advertising sales.
We generate the majority of our revenues from the sale of advertising airtime on our television channels. While we have implemented new pricing strategies to increase sales and television advertising spending, the success of these strategies has varied from market to market and continues to be challenged by pressure from advertisers and discounting by competitors. In addition to advertising pricing, other factors that may affect our advertising sales include general economic conditions (described above), competition from other broadcasters and operators of other distribution platforms, changes in programming strategy, changes in distribution strategy, our ability to secure distribution on cable, satellite or IPTV operators, our channels’ technical reach, technological developments relating to media and broadcasting, seasonal trends in the advertising market, changing audience preferences and in how and when people view content and the accompanying advertising, increased competition for the leisure time of audiences and shifts in population and other demographics. Our advertising revenues also depend on our ability to maintain audience ratings and to generate GRPs. This requires us to have a distribution strategy that reaches a significant audience as well as to maintain investments in programming at a sufficient level to continue to attract audiences. Changes in the distribution of our channels, such as our decision to cease broadcasting on DTTdigital terrestrial television ("DTT") in the Slovak Republic and Slovenia in 2017, may reduce the number of people who can view our channels, which may negatively impact our audience share and GRPs generated. Furthermore, significant or sustained reductions in investments in programming or other operating costs in response to reduced advertising revenues had and, if repeated, may have an adverse impact on our television viewing levels. Reductions in advertising spending in our markets and resistance to price increases as well as competition for ratings from broadcasters seeking to attract similar audiences may have an adverse impact on our ability to maintain our advertising sales. A failure to maintain and increase advertising sales could have a material adverse effect on our financial position, results of operations and cash flows.
Our liquidity constraints and debt service obligations may restrict our ability to fund our operations.
We have significant debt service obligations under the Euro Term Loans as well as the 2021 Revolving Credit Facility (when drawn). Furthermore, we are paying Guarantee Fees to Time Warner as consideration for its guarantees of the Euro Term Loans (collectively, the "TW Guarantees"). Although a portion of the Guarantee Fees in respect of each of the Euro Term Loans can be non-cash pay at our option, accruing such fees will further increase the amounts to be repaid at the maturity of these facilities. Accordingly, the payment of Guarantee Fees in kind will increase our already significant leverage. In addition, if the Divestment Transaction does not close, the warrants are not exercised in full or cash flows from operations do not meet our forecasts, we would not be able to reduce our indebtedness as planned and would continue to bear higher average borrowing costs on our senior debt and pay more interest and Guarantee Fees. As a result of our debt service obligations and covenants contained in the related loan agreements, we are restricted under the Reimbursement Agreement and the 2021 Revolving Credit Facility (when drawn) in the manner in which our business is conducted, including but not limited to our ability to obtain additional debt financing to refinance existing indebtedness or to fund future working capital, capital expenditures, business opportunities or other corporate requirements. We may have a proportionally higher level of debt and debt service obligations than our competitors, which may put us at a competitive disadvantage by limiting our flexibility in planning for, or reacting to, changes in our business, economic conditions or our industry. For additional information regarding the Reimbursement Agreement the 2021 Revolving Credit Facility and the TW Guarantees, see Part I, Item 1, Note 5, "Long-term Debt and Other Financing Arrangements".
We may be unable to repay or refinance our existing indebtedness and may not be able to obtain favorable refinancing terms.
We have a substantial amount of indebtedness. Under the Reimbursement Agreement and the 2021 Revolving Credit Facility (when drawn), we can incur only limited amounts of additional indebtedness, other than indebtedness incurred to refinance existing indebtedness. In addition, pursuant to the Reimbursement Agreement, the all-in rates on each of the Euro Term Loans increase to a maximum of 10.0% (or 3.5% above the then-current all-in rate, if lower), on the date that is 180 days following a change of control of CME Ltd. (as defined therein); and pursuant to the 2021 Revolving Credit Facility, all commitments terminate following a change of control (as defined therein) and the interest rate on amounts outstanding increases to 13% on the date that is 180 days following such change of control. We intend to repay the 2018 Euro Term Loan at or prior to maturity with cash flows from operations and the expected proceeds from the Divestment Transaction or if the Divestment Transaction does not close, the expected proceeds from warrant exercises. In the event the Divestment Transaction doesproposed Merger is not close,completed and instability in global credit markets caused by the warrants are not exercised in full or cash flows from operations do not meet our forecasts,COVID-19 pandemic persists, we would be required to refinance the 2018 Euro Term Loan in whole or in part. Pursuant to the Reimbursement Agreement, all commitments under the 2021 Revolving Credit Facility terminate on the refinancing of any Euro Term Loan. We face the risk that we will not be able to renew, repay or refinance our indebtedness when due, or that the terms of any renewal or refinancing will not be on better terms than those of such indebtedness being refinanced. Furthermore, pursuant to the Reimbursement Agreement, the all-in rates on each of the Euro Loans increase to a maximum of 10.0% (or 3.5% above the then-current all-in rate, if lower), on the date that is 365 days following a change of control of CME Ltd. (as defined therein); and pursuant to the 2023 Revolving Credit Facility, all commitments terminate following a change of control (as defined therein) and the interest rate on amounts outstanding increases to 10% plus LIBOR or 9% plus the alternate base rate on the date that is 365 days following such change of control. In the event we are not able to refinance our indebtedness, we might be forced to dispose of assets on disadvantageous terms or reduce or suspend operations, any of which would materially and adversely affect our financial condition, results of operations and cash flows.
Our debt service obligations and covenants may restrict our ability to conduct our operations.
We have debt service obligations under the Euro Loans as well as the 2023 Revolving Credit Facility (when drawn), including the Guarantee Fees to Warner Media as consideration for its guarantees of the Euro Loans (collectively, the "WM Guarantees"). In addition, if our financial performance deteriorates, we may bear higher average borrowing costs on our senior debt and pay more interest and Guarantee Fees. As a result of our debt service obligations and covenants contained in the related loan agreements, we are restricted under the Reimbursement Agreement and the 2023 Revolving Credit Facility (when drawn) in the manner in which our business is conducted, including but not limited to our ability to obtain additional debt financing to refinance existing indebtedness or to fund future working capital, capital expenditures, business opportunities or other corporate requirements, which may limit our flexibility in planning for, or reacting to, changes in our business, economic conditions or our industry. For additional information regarding the Reimbursement Agreement, the 2023 Revolving Credit Facility and the WM Guarantees, see Part I, Item 1, Note 4, "Long-term Debt and Other Financing Arrangements".
We may be subject to changes in tax rates and exposure to additional tax liabilities.
We are subject to taxes in a number of foreign jurisdictions, including in respect of our operations as well as capital transactions undertaken by us. We are subject to regular review and audit by tax authorities, and in the ordinary course of our business there are transactions and calculations where the ultimate tax determination is unknown. Significant judgment is required in determining our provision for taxes. The final determination of our tax liabilities resulting from tax audits, related proceedings or otherwise could be materially different from our tax provisions. Economic and political pressures to increase receipts in various jurisdictions may make taxation and tax rates subject to significant change and the satisfactory resolution of any tax disputes more difficult. The occurrence of any of these events could have a material adverse effect on our financial position, results of operations and cash flows.
A default by us in connection with our obligations under our outstanding indebtedness could result in our inability to continue to conduct our business.
Pursuant to the Reimbursement Agreement and the 20212023 Revolving Credit Facility, we pledged all of the shares of CME NV and of CME BV, which together own substantiallyowns all of theour interests in our operating subsidiaries, in favor of Time Warner Media as security for this indebtedness. If we or these subsidiariesCME BV were to default under the terms of any of the relevant agreements, Time Warner Media would have the ability to sell all or a portion of the assets pledged to it in order to pay amounts outstanding under such debt instruments. This could result in our inability to conduct our business.
Fluctuations in exchange rates may continue to adversely affect our results of operations.
Our reporting currency is the dollar and CME Ltd.'s functional currency is the Euro. Our consolidated revenues and costs are divided across a range of European currencies. TheAny strengthening of the dollar had a negative impact on reported revenues in 2016 when translated from the functional currencies of our operations. Continued strengthening of the dollar wouldwill have a negative impact on our reported revenues. Furthermore, fluctuations in exchange rates, which may be more volatile as a result of the COVID-19 pandemic, may negatively impact programming costs. While local programming is generally purchased in local currencies, we purchase a significant portionamount of our content costs relates to foreign programming purchased pursuant to dollar-denominated agreements. If the dollar appreciates against the functional currencies of our operating segments, the cost of acquiring such content would be adversely affected, which could have a material adverse effect on our results of operations and cash flows.
Our strategies to enhance our carriage fees and diversify our revenues may not be successful.
We are focused on creating additional revenue streams from our broadcast operations as well as increasing revenues generated from broadcasttelevision advertising, which is how we generate most of our revenues. Our main efforts with respect to this strategy are on increasing carriage fees from cable, satellite and IPTV operators for carriage of our channels as well as continuing to seek improvements in advertising pricing. Agreements with operators generally have a term of one or more years, at which time agreements must be renewed. There can be no assurance that we will be successful in renewing carriage fee agreements on similar or better terms. During negotiations to implement our carriage fees strategy in prior years, some cable and satellite operators suspended the broadcast of our channels, which negatively affected the reach and audience shares of those operations and, as a result, advertising revenues. There is a risk that operators may refuse to carry our channels while carriage fee negotiations are ongoing, which would temporarily reduce the reach of those channels and may result in clients withdrawing advertising from our channels. The occurrence of any of these events may have an adverse impact on our financial position, results of operations and cash flows. If we are ineffective in negotiations with carriers or in achieving further carriage fee increases, our profitability will continue to be dependent primarily on television advertising revenues, which increases the importance placed on our ability to improve advertising pricing and generate advertising revenues. In addition to carriage fees, we are also working to build-out our offerings of advertising video-on-demand products and other opportunities for advertising online. There can be no assurances that our revenue diversification initiatives will ultimately be successful, and if unsuccessful, this may have an adverse impact on our financial position, results of operations and cash flows.
A downgrading of our corporate credit ratings may adversely affect our ability to raise additional financing.
Moody’s Investors Service rates our corporate credit as B2B1 with a positivestable outlook. Standard & Poor’s rates our corporate credit B+ (currently on CreditWatch(on watch with developingnegative implications due to the announced Divestment Transaction)proposed Merger). Our ratings show each agency's opinion of our financial strength, operating performance and ability to meet our debt obligations as they become due.due, as well as the proposed Merger. These ratings take into account the particular emphasis the ratings agencies place on metrics such as leverage ratio and cash flow, which they use as measurements of a company's liquidity and financial strength. They also reflect an emphasisthe consideration placed by the ratings agencies on a track record ofthe historically strong financial support from Time Warner.Warner Media. We may be subject to downgrades if our operating performance deteriorates or we fail to maintain adequate levels of liquidity. In addition, our ratings may be downgraded if the agencies form a view that material support from Time Warner is not as strong, or the strategic importance of CME Ltd. to Time Warner is not as significant as it has been in the past. In the event our corporate credit ratings are lowered by the rating agencies, it willwe may not be more difficult for usable to refinance our existing indebtedness or raise new indebtedness that may be permitted under the Reimbursement Agreement and the 20212023 Revolving Credit Facility (when drawn), and we will have to pay higher interest rates, all of which would have an adverse effect on our financial position, results of operations and cash flows.
If our goodwill, other intangible assets and long-lived assets become impaired, we may be required to record significant charges to earnings.
We review our long-lived assets for impairment when events or changes in circumstances indicate the carrying amount may not be recoverable. Goodwill and indefinite-lived intangible assets are required to be assessed for impairment at least annually. Factors that may be considered a change in circumstances indicating that the carrying amount of our goodwill, indefinite-lived intangible assets or long-lived assets may not be recoverable include slower growth rates in our markets, reduced expected future cash flows, increased country risk premium as a result of political uncertainty and a decline in stock price and market capitalization. We consider available current information when calculating our impairment charge. If there are indicators of impairment, our long-term cash flow forecasts for our operations deteriorate or discount rates increase, we may be required to recognize additional impairment charges in later periods. See Part I, Item 1, Note 4,3, "Goodwill and Intangible Assets" for the carrying amounts of goodwill in each of our reporting units.
Risks Relating to Our Operations
Content may become more expensive to produce or acquire or we may not be able to develop or acquire content that is attractive to our audiences.
Television programming is one of the most significant components of our operating costs. The ability of our programming to generate advertising revenues depends substantially on our ability to develop, produce or acquire programming that matches audience tastes and attracts high audience shares, which is difficult to predict. The commercial success of a program depends on several tangible and intangible factors, including the impact of competing programs, the availability of alternate forms of entertainment and leisure time activities, our ability to anticipate and adapt to changes in consumer tastes and behavior, and general economic conditions. While we have been successful in reducing content costs compared to prior periods, the cost of acquiring content attractive to our viewers, such as feature films and popular television series and formats, may increase in the future. Our expenditures in respect of locally produced programming may also increase due to competition for talent and other resources, changes in audience tastes in our markets or from the implementation of any new laws and regulations mandating the broadcast of a greater number of locally produced programs. In addition, we typically acquire syndicated programming rights under multi-year commitments before knowing how such programming will perform in our markets. In the event any such programming does not attract adequate audience share, it may be necessary to increase our expenditures by investing in additional programming, subject to the availability of adequate financial resources, as well as to write down the value of any underperforming programming. Any material increase in content costs could have a material adverse effect on our financial condition, results of operations or cash flows.
Our operations are vulnerable to significant changes in viewing habits and technology that could adversely affect us.
The television broadcasting industry is affected by rapid innovations in technology. The implementation of these new technologies and the introduction of non-traditional content distribution systems have increased competition for audiences and advertisers. Platforms such as direct-to-home cable and satellite distribution systems, the internet, subscription and advertising video-on-demand, user-generated content sites and the availability of content on portable digital devices have changed consumer behavior by increasing the number of entertainment choices available to audiences and the methods for the distribution, storage and consumption of content. This development has fragmented television audiences in more developed markets and could adversely affect our ability to retain audience share and attract advertisers as such technologies penetrate our markets. As we adapt to changing viewing patterns, it may be necessary to expend substantial financial and managerial resources to ensure necessary access to new technologies or distribution systems. Such initiatives may not develop into profitable business models. Furthermore, technologies that enable viewers to choose when, how, where and what content to watch, as well as to fast-forward or skip advertisements, may cause changes in consumer behavior that could have a negative impact on our advertising revenues. In addition, compression techniques and other technological developments allow for an increase in the number of channels that may be broadcast in our markets and expanded programming offerings that may be offered to highly targeted audiences. Reductions in the cost of launching new channels could lower entry barriers and encourage the development of increasingly targeted niche programming on various distribution platforms. This could increase the competitive demand for popular programming, resulting in an increase in content costs as we compete for audiences and advertising revenues. A failure to successfully adapt to changes in our industry as a result of technological advances may have an adverse effect on our financial position, results of operations and cash flows.
Content may become more expensive to produce or acquire or we may not be able to develop or acquire content that is attractive to our audiences.
Television programming is one of the most significant components of our operating costs. The ability of our programming to generate advertising revenues depends substantially on our ability to develop, produce or acquire programming that matches audience tastes and attracts high audience shares, which is difficult to predict. In that regard, we suspended all in-process productions of own-produced titles and deferred certain other productions in response to restrictive social distancing measures that were imposed earlier in the year in the countries in which we operate in response to the COVID-19 pandemic. Following the relaxation of social distancing measures, we have resumed production of local titles in each of our country operations and adjusted our procedures in order to do so in a safe manner. The resumption and continuation of all productions will depend on the timing and scope of the relaxation of these measures as well as the absence of a need to reimpose relevant restrictive measures in the future. The commercial success of a program depends on several tangible and intangible factors, including the impact of competing programs, the availability of alternate forms of entertainment and leisure time activities, our ability to anticipate and adapt to changes in consumer tastes and behavior, and general economic conditions. The cost of acquiring content attractive to our viewers, such as feature films and popular television series and formats, is likely to increase in the future. Our expenditures in respect of locally produced programming may also increase due to competition for talent and other resources, wage inflation, changes in audience tastes in our markets or from the implementation of any new laws and regulations mandating the broadcast of a greater number of locally produced programs. In addition, we typically acquire syndicated programming rights under multi-year commitments before knowing how such programming will perform in our markets. In the event any such programming does not attract adequate audience share, it may be necessary to increase our expenditures by investing in additional programming, subject to the availability of adequate financial resources, as well as to write down the value of any underperforming programming. Any material increase in content costs could have a material adverse effect on our financial condition, results of operations or cash flows.
Our operating results are dependent on the importance of television as an advertising medium.
We generate most of our revenues from the sale of our advertising airtime on television channels in our markets. Television competes with various other media, such as print, radio, the internet and outdoor advertising, for advertising spending. In all of the countries in which we operate, television constitutes the single largest component of all advertising spending. There can be no assurancesassurance that the television advertising market will maintain its current position among advertising media in our markets. Furthermore, there can be no assurances that changes in the regulatory environment or improvements in technology will not favor other advertising media or other television broadcasters. Increases in competition among advertising media arising from the development of new forms of advertising media and distribution could result in a decline in the appeal of television as an advertising medium generally or of our channels specifically. A decline in television advertising spending as a component of total advertising spending in any period or in specific markets would have an adverse effect on our financial position, results of operations and cash flows.
We are subject to legal compliance risks and the risk of legal or regulatory proceedings being initiated against us.
We are required to comply with a wide variety of laws and other regulatory obligations in the jurisdictions in which we operate and compliance by our businesses is subject to scrutiny by regulators and other government authorities in these jurisdictions. Compliance with foreign as well as applicable U.S. laws and regulations related to our businesses, such as broadcasting content and advertising regulations, competition regulations, tax laws (including the Economic Substance Act in Bermuda which came into force in July 2019), employment laws, data protection requirements including the EU General Data Protection Regulation, and anti-corruption laws, increases the costs and risks of doing business in these jurisdictions. We believe we have implemented appropriate risk management and compliance policies and procedures that are designed to ensure our employees, contractors and agents comply with these laws and regulations; however, a violation of such laws and regulations or the Company’s policies and procedures could occur. A failure or alleged failure to comply with applicable laws and regulations, whether inadvertent or otherwise, may result in legal or regulatory proceedings being initiated against us and fines or other penalties being levied against us.
We have become aware of provisions in the tax regulations of one of our markets that shift the liability for taxes on gains resulting from certain capital transactions from the seller to the buyer. This provision may have been applicable to an acquisition made by us, although we do not believe we have any liability connected to this transaction. In addition, in 2016 the prosecuting authorities in Romania requested information in respect of an investigation into certain transactions entered into by Pro TV in 2014 primarily with certain related parties. We believe that the transactions under review are fully supported and are cooperating with the authorities in responding to the information request. In Slovenia, the competition law authorities have launched an investigation in 2017 into whether our SlovenianSlovenia subsidiary is dominant and abused its dominant position when concluding carriage fee agreements with platform operators in connection with its decision to cease broadcasting on DTT there. To date there has been no determination that a breach of competition law has occurred. If these or other contingencies result in legal or regulatory proceedings being initiated against us, or if developments occur in respect of our compliance with existing laws or regulations, or there are changes in the interpretation or application of such laws or regulations, we may incur substantial costs, be required to change our business practices (including on what terms and conditions we offer our channels under carriage agreements), our reputation may be damaged or we may be exposed to unanticipated civil or criminal liability, including fines and other penalties that may be substantial. This could have a material adverse effect on our business, financial position, results of operations and cash flows.
Our operations are in developing markets where there are additional risks related to political and economic uncertainty, biased treatment and compliance with evolving legal and regulatory systems.
Our revenue-generating operations are located in Central and Eastern Europe and we may be significantly affected by risks that may be different to those posed by investments in more developed markets. These risks include, but are not limited to, social and political instability, changes in local regulatory requirements (including restrictions on foreign ownership), arbitrary or biased regulatory or judicial practice, corruption and increased taxes, fines and other costs. The economic and political systems, legal and tax regimes, regulatory practices, standards of corporate governance and business practices of countries in this region continue to develop. Policies and practices may be subject to significant adjustments, including following changes in political leadership, as well as to the influence of commercial and governmental actors. This may result in inconsistent application of tax and legal regulations, arbitrary or biased treatment, and other general business risks as well as social or political instability or disruptions and the potential for political influence on the media. The relative level of development of our markets, the risk of corruption, and the influence of local commercial and governmental actors also present a potential for biased or unfair treatment of us before regulators or courts in the event of disputes. If such a dispute occurs, those regulators or courts may not act with integrity or may favor local interests over our interests. Other potential risks inherent in markets with evolving economic and political environments include exchange controls, higher taxes, tariffs, fines, penalties and other costs as well as longer payment cycles. Ultimately, the occurrence of any of these could have a material adverse impact on our business, financial position, results of operations and cash flows.
We rely on network and information systems and other technology that may be subject to disruption, security breaches or misuse, which could harm our business or our reputation.
We make extensive use of network and information systems and other technologies, including those related to our internal network management as well as our broadcasting operations. These systems are central to many of our business activities. Network and information systems-related events, such as computer hackings, computer viruses, worms or other destructive or disruptive software, process breakdowns, malicious activities or other security breaches could result in a disruption or degradation of our services, the loss of information or the improper disclosure of personal data. The occurrence of any of these events could negatively impact our business if we are required to expend resources to remedy such a security breach or if they result in legal claims or proceedings or our reputation is harmed. In addition, improper disclosure of personal data could subject us to liability under laws, including the EU General Data Protection Regulation, that protect personal data in the countries in which we operate. The development and maintenance of systems to prevent these events from occurring requires ongoing monitoring and updating as efforts to overcome security measures become more sophisticated. As technologies evolve, we will need to expend additional resources to protect our technology and information systems, which could have an adverse impact on our results of operations and cash flows.
Piracy of our content may decrease revenues we can earn from our content and adversely impact our business and profitability.
Piracy of our content poses significant challenges in our markets. Technological developments, including digital copying, file compressing, the use of international proxies and the growing penetration of high bandwidth internet connections, have made it easier to create, transmit and distribute high quality unauthorized copies of content in unprotected digital formats. Furthermore, there are a growing number of video streamingvideo-streaming sites, increasing the risk of online transmission of our content without consent. The proliferation of such sites broadcasting content pirated from us could result in a reduction of revenues that we receive from the legitimate distribution of our content, including through video-on-demand and other services. Protection of our intellectual property is in large part dependent on the manner in which applicable intellectual property laws in the countries in which we operate are construed and enforced. We seek to limit the threat of content piracy. However, detecting and policing the unauthorized use of our intellectual property is often difficult and remedies may be limited under applicable law. Steps we take may not prevent the infringement by third parties. There can be no assurance that our efforts to enforce our rights and protect our intellectual property will be successful in preventing piracy, which limits our ability to generate revenues from our content.
Our operations are in developing markets where there are additional risks related to political and economic uncertainty, biased treatment and compliance with evolving legal and regulatory systems.
Our revenue-generating operations are located in Central and Eastern Europe and we may be significantly affected by risks that may be different to those posed by investments in more developed markets. These risks include, but are not limited to, social and political instability, changes in local regulatory requirements including restrictions on foreign ownership, inconsistent regulatory or judicial practice, and increased taxes and other costs. The economic and political systems, legal and tax regimes, regulatory practices, standards of corporate governance and business practices of countries in this region continue to develop. Policies and practices may be subject to significant adjustments, including following changes in political leadership. This may result in social or political instability or disruptions and the potential for political influence on the media as well as inconsistent application of tax and legal regulations, arbitrary treatment before regulatory or judicial authorities and other general business risks. Other potential risks inherent in markets with evolving economic and political environments include exchange controls, higher taxes, tariffs and other levies as well as longer payment cycles. The relative level of development of our markets and the influence of local politics also present a potential for biased treatment of us before regulators or courts in the event of disputes. If such a dispute occurs, those regulators or courts might favor local interests over our interests. Ultimately, this could have a material adverse impact on our business, financial position, results of operations and cash flows.
We rely on network and information systems and other technology that may be subject to disruption or misuse, which could harm our business or our reputation.
We make extensive use of network and information systems and other technologies, including those related to our internal network management as well as our broadcasting operations. These systems are central to many of our business activities. Network and information systems-related events, such as computer hackings, computer viruses, worms or other destructive or disruptive software, process breakdowns, malicious activities or other security breaches could result in a disruption or degradation of our services, the loss of information or the improper disclosure of personal data. The occurrence of any of these events could negatively impact our business by requiring us to expend resources to remedy such a security breach or by harming our reputation. In addition, improper disclosure of personal data could subject us to liability under laws that protect personal data in the countries in which we operate. The development and maintenance of systems to prevent these events from occurring requires ongoing monitoring and updating as efforts to overcome security measures become more sophisticated. As technologies evolve, we will need to expend additional resources to protect our technology and information systems, which could have an adverse impact on our results of operations.
Our broadcasting licenses may not be renewed and may be subject to revocation.
We require broadcasting and, in some cases, other operating licenses as well as other authorizations from national regulatory authorities in our markets in order to conduct our broadcasting business. While our broadcasting licenses for our operations in Slovenia and the Slovak Republic and Slovenia are valid for indefinite time periods, our other broadcasting licenses expire at various times from October 2020 through 2028. While we expect that our material licenses and authorizations will continue to be renewed or extended as required, to continue to operate our business, we cannot guarantee that this will occur or that they will not be subject to revocation, particularly in markets where there is relatively greater political risk as a result of less developed political and legal institutions. The failure to comply in all material respects with the terms of broadcasting licenses or other authorizations or with applications filed in respect thereto may result in such licenses or other authorizations not being renewed or otherwise being terminated. Furthermore, no assurances can be given that renewals or extensions of existing licenses will be issued on the same terms as existing licenses or that further restrictions or conditions will not be imposed in the future. Any non-renewal or termination of any other broadcasting or operating licenses or other authorizations or material modification of the terms of any renewed licenses may have a material adverse effect on our financial position, results of operations and cash flows.
Our success depends on attracting and retaining key personnel.
Our success depends partly upon the efforts and abilities of our key personnel and our ability to attract and retain key personnel. Our management teams have significant experience in the media industry and have made important contributions to our growth and success. Although we have been successful in attracting and retaining such people in the past, competition for highly skilled individuals is intense. There can be no assurance that we will continue to be successful in attracting and retaining such individuals in the future. In particular, the proposed Merger may adversely impact our ability to attract and retain such individuals. The loss of the services of any of these individuals could have an adverse effect on our businesses, results of operations and cash flows.
Risks Relating to Enforcement Rights
We are a Bermuda company and enforcement of civil liabilities and judgments may be difficult.
We are a Bermuda company. Substantially all of our assets and all of our operations are located, and all of our revenues are derived, outside the United States. In addition, several of our directors and officers are non-residents of the United States, and all or a substantial portion of the assets of such persons are or may be located outside the United States. As a result, investors may be unable to effect service of process within the United States upon such persons, or to enforce against them judgments obtained in the United States courts, including judgments predicated upon the civil liability provisions of the United States federal and state securities laws. There is uncertainty as to whether the courts of Bermuda and the countries in which we operate would enforce (a) judgments of United States courts obtained against us or such persons predicated upon the civil liability provisions of the United States federal and state securities laws or (b) in original actions brought in such countries, liabilities against us or such persons predicated upon the United States federal and state securities laws.
Our Bye-laws restrict shareholders from bringing legal action against our officers and directors.
Our Bye-laws contain a broad waiver by our shareholders of any claim or right of action in Bermuda, both individually and on our behalf, against any of our officers or directors. The waiver applies to any action taken or concurred in by an officer or director, or the failure of an officer or director to take any action, in the performance of his or her duties, except with respect to any matter involving any fraud or dishonesty on the part of the officer or director. This waiver limits the right of shareholders to assert claims against our officers and directors unless the act or failure to act involves fraud or dishonesty.
Risks Relating to our Common Stock
Our share price may be adversely affected by sales of unregistered shares or future issuances of our shares.
Time Warner is the largest holder of shares of our Class A common stock, holding 61,407,775 unregistered shares of Class A common stock, one share of Series A preferred stock ("Series A Preferred Share"), 200,000 shares of Series B preferred stock ("Series B Preferred Shares") and warrants to acquire 100,926,996 shares of our Class A common stock (the "TW Warrants"). The share of Series A Preferred Shares is convertible into 11,211,449 shares of Class A common stock and the Series B Preferred Shares are convertible into shares of Class A common stock at the option of Time Warner (subject to certain exceptions). As of September 30, 2017, the 200,000 Series B Preferred Shares were convertible into approximately 108.1 million shares of Class A common stock. The TW Warrants are exercisable for shares of Class A common stock until May 2, 2018 at an exercise price of US$ 1.00 per share. Time Warner has registration rights with respect to all its shares of Class A common stock now held or hereafter acquired. Furthermore, there are additional unregistered shares of our Class A common stock outstanding that we may be obligated to register and shares of Class A common stock underlying other warrants that may enter into trading. For additional information on the Series A Preferred Shares, Series B Preferred Shares and TW Warrants, see Part I, Item I, Note 13, "Convertible Redeemable Preferred Shares" and Note 14, "Equity". In October 2016, Time Warner announced it has entered into a definitive merger agreement with AT&T Inc. under which AT&T Inc. will acquire Time Warner. The merger is subject to regulatory approvals, including the U.S. Department of Justice. Following a successful completion of such merger, AT&T Inc. will become the beneficial owner of equity securities currently beneficially owned by Time Warner and the successor to rights related to such securities granted to Time Warner.
We cannot predict what effect, if any, the entry into trading of previously issued unregistered shares of Class A common stock will have on the market price of our shares. We may also issue additional shares of Class A common stock or securities convertible into our equity in the future. If more shares of our Class A common stock (or securities convertible into or exchangeable for shares of our Class A common stock) are issued to Time Warner, the economic interests of current shareholders may be diluted and the price of our shares may be adversely affected.
The interests of Time WarnerAT&T may conflict with the interests of other investors.
TimeThrough its wholly owned subsidiaries Warner Media and TW Investor, the aggregate beneficial ownership interest of AT&T in the Company is able toapproximately 75.5%. In connection with the exercise voting power in us with respect to 46.5% of our outstanding shares of Class A common stock. As such, Time Warner is in a position to exercise significant influence over the outcome of corporate actions requiring shareholder approval, such as the election of directors or certain transactions. Following the issuance of the warrants by Warner Media and TW Warrants,Investor in April 2018, each of them issued standing proxies to the aggregate economic interestindependent directors of Time Warnerthe Company, pursuant to which it granted the independent directors the right to vote the 100,926,996 shares received on the exercise of those warrants (the “Warrant Shares”) on all matters other than at any meeting where the agenda includes a change in us is approximately 76.0% (withoutcontrol transaction. In accordance with these proxies, the Warrant Shares will be voted in proportion to votes cast at such a meeting of the Company, excluding such Warrant Shares. This proxy arrangement will remain in effect until April 2021. After giving effect to the accretionits ownership of the Series BA Preferred Share, AT&T has a 44.1% voting interest in the Company at any meeting where the Warrant Shares after September 30, 2017).are voted pursuant to the standing proxies. Furthermore, Time WarnerAT&T has the right to appoint one less than the number required to constitute a majority of our board of directors, provided that Time WarnerAT&T continues to own not less than 40% of the voting power of the Company. As such, AT&T is in a position to exercise significant influence over the outcome of corporate actions requiring shareholder approval, such as the proposed Merger, the election of directors, amendments to our Bye-laws, or certain transactions, including transactions resulting in a change of control.
We are also party to an amended investor rights agreement with Time Warner Media and the other parties thereto under which, among other things, Time Warner Media was granted a contractual preemptivepre-emptive right (subject to certain exclusions) with respect to issuances of the Company’s equity securities, which permits it to maintain its pro rata economic interest as well as a right to top any offer that would result in a change of control of the Company. Under Bermuda law, there is no takeover code or similar legislation requiring an acquirer of a certain percentage of our Class A common stock to tender for the remaining publicallypublicly held shares. In addition to being our largest shareholder, Time Warner Media is also our largest secured creditor, as it guarantees 100% of our outstanding senior indebtedness and is the lender under the 20212023 Revolving Credit Facility. The 20212023 Revolving Credit Facility (when drawn) and the Reimbursement Agreement contain maintenance covenants in respect of interest cover cash flow cover and total leverage ratios and includeincludes covenants in respect of the incurrence of indebtedness (including refinancing indebtedness), the provision of guarantees, the payment of dividends or making other distributions, acquisitions and disposals,disposal and granting security. As such, Time Warner Media may be in a position to determine whether to permit transactions, waive defaults or accelerate such indebtedness or take other steps in its capacity as a secured creditor in a manner that might not be consistent with the interests of the holders of our Class A common stock. Furthermore, in certain circumstances, the interests of Time WarnerAT&T as our largest shareholderbeneficial owner could be in conflict with the interests of minority shareholders.
The price of our Class A common stock has beenmay be volatile.
The market price of shares of our Class A common stock may be influenced by many factors, some of which are beyond our control, including but not limited to those described above under "Risks Relating to Our Operations","Risks and “Risks Relating to Our Financial Position"the Proposed Merger - The failure to complete the proposed Merger within the expected time frame or at all could adversely affect our business, financial condition, results of operations, liquidity and the price of our Class A common stock” as well as the following: general economic and business trends, variations in quarterly operating results, license renewals, regulatory developments in our operating countries and the EU, the condition of the media industry in our operating countries, the volume of trading in shares of our Class A common stock, future issuances of shares of our Class A common stock and investors’ and securities analysts’ perception of us and other companies that investors or securities analysts deem comparable in the television broadcasting industry. In addition, stock markets in general have experienced extreme price and volume fluctuations that have often been unrelated to and disproportionate to the operating performance of broadcasting companies. These broad market and industry factors may materially reduceimpact the market price of shares of our Class A common stock, regardless of our operating performance.
OurRisks Relating to the Proposed Merger
The proposed Merger may cause disruption to our business.
The Merger Agreement generally requires CME to operate its business could be negatively impacted as a resultin the ordinary course during the pendency of shareholder activism.
On January 17, 2017, TCS Capital Management, LLC ("TCS Capital"), a beneficial owner of 7.0% of our shares, filed an amendmentthe proposed Merger and contains customary covenants which restrict CME, without Parent’s consent, from taking certain specified actions until the proposed Merger closes or the Merger Agreement terminates. These restrictions may prevent us from taking actions or making changes with respect to its Schedule 13D disclosing its opinion that the Company should hire an investment bankthat we may otherwise consider to run a process to sell the Company as well as replace current members of the Company's Board of Directors with new directors recommended by TCS Capital. In recent years, shareholder activists, such as TCS Capital, have become involved in numerous public companies. Shareholder activists frequently propose to involve themselves in the governance, strategic directionbe advantageous and operations of the Company. Such proposals may disrupt our business and divert the attention of our management and employees, and any perceived uncertainties as to our future direction resulting from such a situation could result in the lossour inability to respond effectively to competitive pressures, industry developments and future opportunities, which may adversely affect our business, financial condition, results of potential business opportunities, be exploited by our competitors,operations and cash flows.
The proposed Merger could cause concerndisruptions to our currentbusiness or potentialbusiness relationships. Uncertainty associated with the proposed Merger may cause business partners, customers and make it more difficultother counterparties to attract and retain qualified personnel anddelay or defer decisions concerning our business partners, allor seek alternative relationships with third parties. Any delay or deferral of whichthose decisions or changes to our business relationships could adversely affect our business.financial conditions, results of operations and cash flows, regardless of whether the proposed Merger is ultimately completed.
We have allocated, and expect to continue to allocate, significant management and financial resources towards the proposed Merger and its completion. The diversion of management’s attention away from day-to-day operations and other opportunities could adversely affect our business and results of operations. In addition, actionsemployee retention, recruitment and motivation may be challenging before the completion of activistthe proposed Merger, as employees may experience uncertainty about their future roles following the proposed Merger. If, despite our retention and recruiting efforts, key employees depart because of issues relating to the uncertainty and potential outcome of the proposed Merger or a desire not to remain following the proposed Merger, our business and results of operations could be adversely affected.
Completion of the proposed Merger is subject to conditions, including the receipt of certain competition and other regulatory approvals, and if these conditions are not satisfied or waived or if the required approvals are not granted or are subject to conditions, completion of the proposed Merger may not occur.
Completion of the proposed Merger is subject to several conditions, including, but not limited to, the requisite vote of the Company's shareholders, the receipt of certain competition and other regulatory approvals, compliance with covenants and agreements in the Merger Agreement (subject to certain materiality qualifications), and the absence of any governmental order prohibiting completion of the proposed Merger, some of which are beyond our control. At a special general meeting of shareholders of the Company on February 27, 2020, more than 99% of the votes cast by shareholders were in favor of approving the Merger. We cannot predict with certainty whether and when all of the other conditions will be satisfied or waived, which may cause significant fluctuationsprevent, delay or otherwise adversely affect the completion of the proposed Merger in a material way. In addition, Parent’s obligation to complete the proposed Merger is subject to the receipt of certain regulatory approvals without the requirement that Parent agree to take any action or commit to any condition or restriction necessary to secure such approval that would constitute a “burdensome condition” as defined in the Merger Agreement. There can be no assurance that regulators will not seek to impose conditions, terms, obligations or restrictions that would constitute burdensome conditions or that such conditions, terms, obligations or restrictions would not result in the termination of the Merger Agreement.
The failure to complete the proposed Merger within the expected time frame or at all could adversely affect our stockbusiness, financial condition, results of operations, liquidity and the price based on temporary or speculative market perceptions or other factors that do not necessarily reflect the underlying fundamentals and prospects of our business.Class A common stock.
If the proposed Merger is not completed by October 27, 2020, which date may be extended to January 27, 2021, by CME or Parent under certain circumstances if the receipt of certain competition and other regulatory approvals is not satisfied by October 27, 2020, CME or Parent may choose not to proceed with the proposed Merger. Each of CME and Parent may also elect to terminate the Merger Agreement in certain other circumstances. If the Merger Agreement is terminated, CME may be required to pay to Parent a termination fee of $50 million. The termination of the Merger Agreement may also result in the share price of our Class A common stock declining. Additionally, we have already incurred, and we expect to continue to incur, significant costs in connection with the proposed Merger for which we will receive little or no benefit if the completion of the proposed Merger does not occur. In the event the proposed Merger is not completed, CME could also be subject to litigation related to any failure to complete the proposed Merger.
Therefore, if the proposed Merger is not completed, our business, financial condition, results of operations and cash flows may be adversely affected, and the share price of our Class A common stock may decline. Moreover, if the Merger Agreement is terminated and we decide to seek another business combination, we may not be able to negotiate or consummate a transaction with another party on terms comparable to, or better than, the terms of the Merger Agreement.
The Merger Agreement contains provisions that could discourage a potential competing acquirer.
The Merger Agreement contains certain provisions that restrict our ability to, among other things, solicit, knowingly encourage, knowingly facilitate, knowingly induce or initiate the submission of, enter into, or participate in any discussions or any negotiations regarding any "competing proposal" as defined in the Merger Agreement or the announcement of a competing proposal. The Merger Agreement also provides that the Board of Directors (or any committee thereof, including the Special Committee) will not make a "change of recommendation" as defined in the Merger Agreement except as permitted by the terms of the Merger Agreement. In addition, CME may be required to pay a termination fee of $50 million to Parent if the proposed Merger is not consummated under specified circumstances.
CME believes these provisions are reasonable, customary and not preclusive of other offers. Nevertheless, these provisions might discourage a third party that has an interest in acquiring all or a significant part of CME from considering or proposing such acquisition, even if such party were prepared to pay consideration with a higher value than the currently proposed aggregate merger consideration. Furthermore, the requirement that CME pay a termination fee under certain circumstances may result in a third party proposing to pay a lower per-share price to acquire CME, than it might otherwise have proposed to pay because of the added expense of the termination fee that may become payable by CME in certain circumstances.
Item 6. Exhibits
EXHIBIT INDEX
|
| | |
| Exhibit Number | | Description |
| 31.01 | | |
| | | |
| 31.02 | | |
| | | |
| 31.03 | | |
| | | |
| 32.01 | | |
| | | |
| 101.INS | | XBRL Instance Document |
| | | |
| 101.SCH | | XBRL Taxonomy Schema Document |
| | | |
| 101.CAL | | XBRL Taxonomy Calculation Linkbase Document |
| | | |
| 101.DEF | | XBRL Taxonomy Definition Linkbase Document |
| | | |
| 101.LAB | | XBRL Taxonomy Label Linkbase Document |
| | | |
| 101.PRE | | XBRL Taxonomy Presentation Linkbase Document |
SIGNATURES
Pursuant to the requirements of Section 13 or 15(d) of the Securities Exchange Act of 1934, the Registrant has duly caused this report to be signed on its behalf by the undersigned, thereunto duly authorized.
|
| | |
| | | Central European Media Enterprises Ltd. |
| Date: | October 24, 2017July 21, 2020 | /s/ David Sturgeon David Sturgeon Executive Vice President and Chief Financial Officer Principal Financial Officer and Principal Accounting Officer |