UNITED STATES
SECURITIES AND EXCHANGE COMMISSION
WASHINGTON, DC 20549
FORM 10-Q
(Mark One)
x QUARTERLY REPORT PURSUANT TO SECTION 13 OR 15(d) OF THE SECURITIES EXCHANGE ACT OF 1934
For the quarterly period ended JuneSeptember 30, 2017
or
o TRANSITION REPORT PURSUANT TO SECTION 13 OR 15(d) OF THE SECURITIES EXCHANGE ACT OF 1934
For the transition period from to
Commission File Number: 001-36373
TRINET GROUP, INC.
(Exact Name of Registrant as Specified in its Charter)
|
| | |
| Delaware | | 95-3359658 |
(State or other jurisdiction of incorporation or organization) | | (I.R.S. Employer Identification No.) |
| 1100 San Leandro Blvd., Suite 400, San Leandro, CA | | 94577 |
| (Address of principal executive offices) | | (Zip Code) |
Registrant’s telephone number, including area code: (510) 352-5000
Indicate by check mark whether the registrant (1) has filed all reports required to be filed by Section 13 or 15(d) of the Securities Exchange Act of 1934 during the preceding 12 months (or for such shorter period that the registrant was required to file such reports), and (2) has been subject to such filing requirements for the past 90 days. Yes x No o
Indicate by check mark whether the registrant has submitted electronically and posted on its corporate Web site, if any, every Interactive Data File required to be submitted and posted pursuant to Rule 405 of Regulation S-T (§ 232.405 of this chapter) during the preceding 12 months (or for such shorter period that the registrant was required to submit and post such files). Yes x No o
Indicate by check mark whether the registrant is a large accelerated filer, an accelerated filer, a non-accelerated filer, smaller reporting company, or an emerging growth company. See the definitions of “large accelerated filer,” “accelerated filer”, “smaller reporting company”, and “emerging growth company” in Rule 12b-2 of the Exchange Act. (Check one):
|
| | | |
| Large accelerated filer | x | Accelerated filer | o |
| | | | |
| Non-accelerated filer | o (do not check if a smaller reporting company) | Smaller reporting company | o |
| | | | |
| Emerging growth company | o | | |
If an emerging growth company, indicate by check mark if the registrant has elected not to use the extended transition period for complying with any new or revised financial accounting standards provided pursuant to Section 13(a) of the Exchange Act. Yes o No o
Indicate by check mark whether the registrant is a shell company (as defined in Rule 12b-2 of the Exchange Act). Yes o No x
The number of shares of Registrant’s Common Stock outstanding as of JulyOctober 24, 2017 was 69,385,775.69,485,274.
TRINET GROUP, INC.
Form 10-Q - Quarterly Report
For the Quarterly Period Ended JuneSeptember 30, 2017
TABLE OF CONTENTS
|
| | |
| | Form 10-Q Cross Reference | Page |
| Part I, Item 1. | |
| | |
| | |
| | |
| | |
| Part I, Item 2. | |
| Part I, Item 3. | |
| Part I, Item 4. | |
| Part II, Item 1. | |
| Part II, Item 1A. | |
| Part II, Item 2. | |
| Part II, Item 3. | |
| Part II, Item 4. | |
| Part II, Item 5. | |
| Part II, Item 6. | |
| | | |
| | | |
|
| |
| FORWARD LOOKING STATEMENTS AND OTHER FINANCIAL INFORMATION | |
Cautionary Note Regarding Forward-Looking Statements and Other Financial Information
For purposes of this report the terms “TriNet," "the Company," “we,” “us” and “our" refer to TriNet Group, Inc., and its consolidated subsidiaries. This report contains statements that are not historical in nature, are predictive in nature, or that depend upon or refer to future events or conditions or otherwise contain forward-looking statements within the meaning of Section 21 of the Securities Exchange Act of 1934, as amended, and the Private Securities Litigation Reform Act of 1995. Forward-looking statements are often identified by the use of words such as, but not limited to, “anticipate,” “believe,” “can,” “continue,” “could,” “estimate,” “expect,” “intend,” “may,” “plan,” “project,” “seek,” “should,” “strategy,” “target,” “will,” “would” and similar expressions or variations intended to identify forward-looking statements.
Forward-looking statements are not guarantees of future performance, but are based on management’s expectations as of the date of this report and assumptions that are inherently subject to uncertainties, risks and changes in circumstances that are difficult to predict. Forward-looking statements involve known and unknown risks, uncertainties and other factors that may cause actual results, performance or achievements to be materially different from our current expectations and any past results, performance or achievements. Important factors that could cause actual results to differ materially from those expressed or implied by these forward-looking statements include, but are not limited to, those discussed in our Form 10-K for the year ended December 31, 2016 (2016 Form 10-K) and our Form 10-Q for the quarterquarters ended March 31, 2017 and June 30, 2017. The information provided in this Form 10-Q is based upon the facts and circumstances known at this time, and any forward-looking statements made by us in this Form 10-Q speak only as of the date on which they are made. All information provided in this report is as of the date of this report and we undertake no duty to update this information except as required by law.
Our Management's Discussion & Analysis of Financial Condition and Results of Operations (MD&A) includes references to our performance measures presented in accordanceconformity with U.S. Generally Accepted Accounting Principlesaccounting principles generally accepted in the United States of America (GAAP) and other non-GAAP financial measures that we use to manage our business, make planning decisions, allocate resources and as performance measures in our executive compensation plan. Refer to the Non-GAAP Financial Measures in our Key Financial and Operating Metrics section within our MD&A for definitions and reconciliations from GAAP measures.
|
| |
| MANAGEMENT'S DISCUSSION AND ANALYSIS | |
Management’s Discussion and Analysis of Financial Condition and Results of Operations
Executive Summary
Overview
We are a leading provider of human resources (HR) solutions for small to midsize businesses (SMBs). Under our co-employment model, we assume certain of the responsibilities of being an employer and help our clients mitigate employer-related risks and manage many of the complex and burdensome responsibilities of being an employer, helping our clients minimize employer-related risks and manage administrative and compliance responsibilities associated with employment.
We deliver a comprehensive suite of products and services, which allow our clients and their worksite employees (WSEs) to administer and manage HR-related functions, including compensation and benefits, payroll and other transactional HR needs, employee data, and health insurance and workers' compensation programs, using our technology platform and HR expertise.
We operate in one reportable segment. Less than 1% of revenue is generated outside of the U.S.
 Technology Platform
Our technology platform provides our clients and WSEs online and mobile tools to store, view, and manage core HR information and administer a variety of HR transactions, such as payroll processing, tax administration, employee onboarding and termination, compensation reporting, expense management, and benefits enrollment and administration.
 HR Expertise
We use the collective insights and experience of our teams of HR, benefits, risk management, and compliance professionals to help clients mitigatemanage many of the administrative, regulatory, and practical risks associated with their responsibilities as employers. Our teams provide HR expertisesexpertise to assist our clients in talent management, recruiting and training, performance management,running their business by providing a variety of HR services, including employee onboarding and terminations, benefits enrollment and support, claims administration and employment practices risk management. In addition, we have the ability to provide benchmarking datamanagement and relevant HR formadministration, talent management, recruiting and document templates to our clients to help them run their business.training, and performance management. Under our vertical strategy, we tailorseek to design our product and service offerings tofor specific industries by identifying common needs and leveraging scale and shared experience to provide more efficient and relevant offerings.
 Benefits
We offer our WSEs access to a broad range of TriNet-sponsored benefit and insurance programs that many of our clients may be unable to obtain for their WSEs on their own and that are compliant with state, local, and federal regulations. Our benefit and insurance service offerings include plan design and administration, enrollment management, and WSE and client communications relating to our sponsored benefits and insurance programs.
We pay premiums to third-party insurance carriers for WSE insurance benefits and reimburse the insurance carriers and third-party administrators for claims payments made on our behalf within our insurance deductible layer, where applicable.
 Compliance
Our products and services are designed to help our clients comply with local, state, and federal employment and benefit laws. We monitor employer-related legal and regulatory developments and assist clients in complying with changing regulations and requirements at all levels, from changes in local minimum wage and family leave ordinances to sweeping reforms such as the Patient Protection and Affordable Care Act (ACA). Often these changes are staggered and require additional guidance from a variety of local, state or federal agencies, making compliance a continuous challenge. Each component of our HR solutions is designed with compliance in mind, whether it is payroll processing and tax administration, HR services focused on creating a compliant workplace, or offering ACA-compliant benefit plans.
|
| |
| MANAGEMENT'S DISCUSSION AND ANALYSIS | |
and tax administration, HR services focused on creating a compliant workplace, or offering ACA-compliant benefit plans.
Significant Developments in 2017
Our consolidated results for the first sixnine months of 2017 reflect our continued progress with vertical productproducts and insurance service offerings combined with slower growth in insurance costs as a result of favorable experience in our health programs and cost management with our insurance providers.
We also experienced modest Average WSE growth as compared to the first six months of 2016 as we continued our migration from legacy platforms to our common TriNet platform. Furthermore, we moderated our new customer growth as we prepared for the launch of TriNet Main Street, our new industry vertical product.
Our other operating expenses reflect our continued focus on developing new vertical products and platform integrations, and additional costs associated with our internal control remediation efforts.
We began 2017 with significant operational initiatives to improve our products and platform for our clients. During the first halfnine months of 2017, we provided our users with improved online and mobile productivity tools and upgraded our architecture allowing our platform to integrate more effectively with third party products. In July 2017, we launched and started onboarding clients to TriNet Main Street, our solutionvertical offering designed for a variety of "main street" industries, includingclients in the hospitality, retail and manufacturing businesses,industries.
Over the last year, we have benefited from our scale as we decreased administrative costs associated with our insurance offerings and are bringing forward this benefit to our clients. In October 2017, we launched the 2017 Fee Credit initiative designed to reward a portion of our existing clients. This incentive will be based on our full-year 2017 results and we are currently onboardingexpect our clients to receive the incentives under the program in the first quarter of 2018. The credit will be treated as a reduction of revenues.
Additionally in October 2017, we changed the contract terms with one of our health insurers. Previously we contracted with this carrier on a fully insured, guaranteed-cost basis; under this new clientsarrangement we will be responsible for this product.reimbursement of claim payments within our deductible layer.
We experienced flat Average WSE growth compared to the first nine months of 2016 as we continued our migration from legacy platforms to our common TriNet platform and we moderated our new customer growth as we expanded the functionality of TriNet Main Street.
Our other operating expenses reflect our continued focus on developing new vertical products and platform integrations, and additional costs associated with our internal control remediation efforts.
Performance Highlights
Q2Q3 2017
During the secondthird quarter of 2017, we:
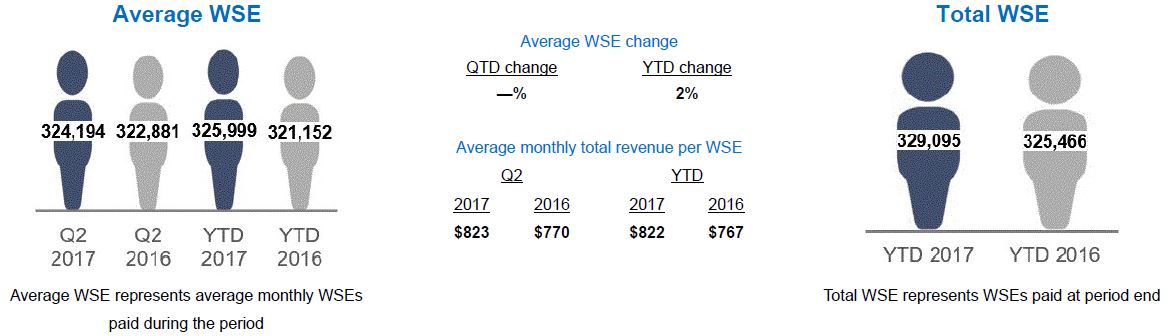
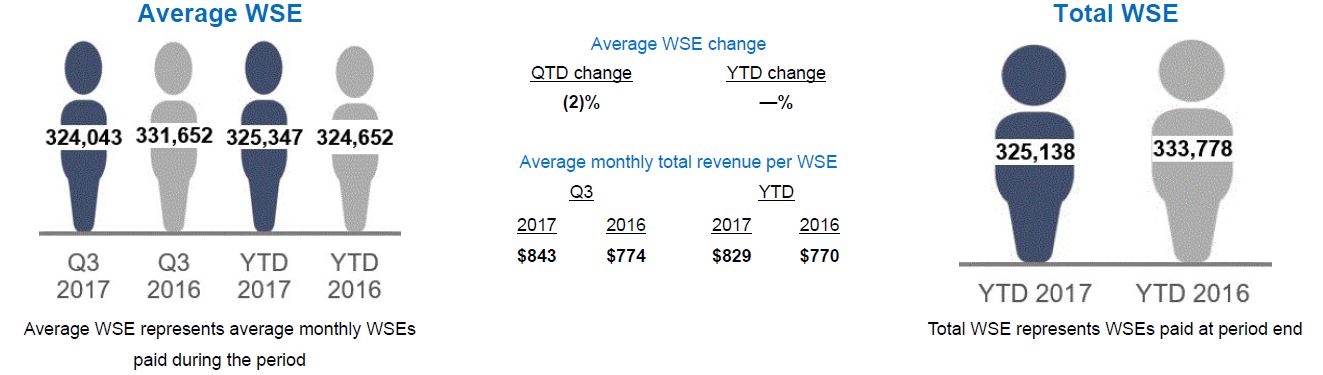
served over 14,000approximately 15,000 clients and co-employed Average WSEs of 324,000, consistent whena 2% decrease in Average WSEs compared to the same period in 2016, and
processed approximately $8.0$8.1 billion in payroll and payroll tax payments for our clients, an increase of 2%5% over the same period in 2016.
Our financial performance for the secondthird quarter of 2017, compared to the same period in 2016, included:
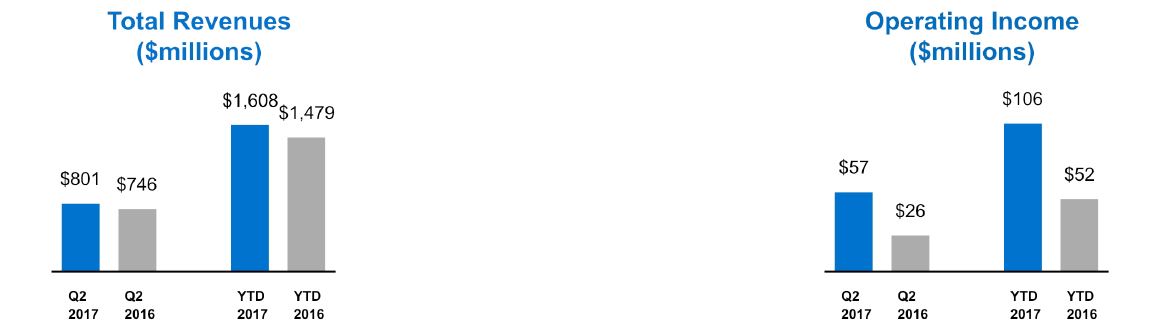
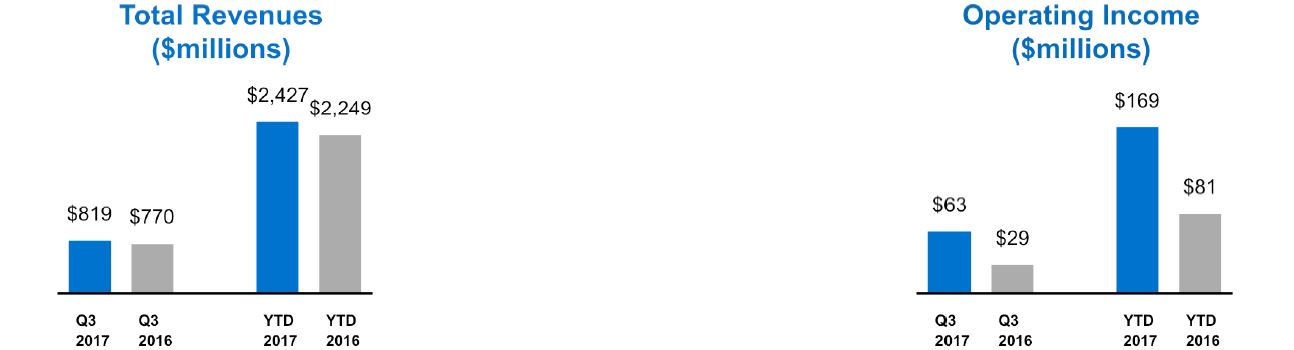
Total revenues increased 7%6% to $800.5$819.3 million, due to increased insurance service revenues from higher participation in our health coverage participation by our WSEsplans combined with an equal increase in health insurance services price increases,service fees per plan participant, while Net Service Revenues increased 35%28% to $201.0$205.9 million primarily due to thean increase in insurance service revenues increases noted above.
Operating income increased 116%117% to $56.8$62.8 million primarily due to improvement in our insurance service revenues,Net Service Revenues, partially offset by an increase in other operating expenses incurred to support our growth.initiatives.
Net income increased 225%194% to $40.0$42.8 million, or $0.56$0.60 per diluted share, Adjusted Net Income increased 88%94% to $36.7$40.3 million and Adjusted EBITDA increased 70%77% to $72.4$80.3 million primarily due to increased operating income as described above.
YTD 2017
During the first half of 2017, we:
co-employed Average WSEs of 326,000, a 2% increase over the same period in 2016,
processed approximately $17.8 billion in payroll and payroll tax payments for our clients, an increase of 3% over the same period in 2016, and
increased Cash and cash equivalents $49.9 million, or 27%, to $233.9 million.
Our financial performance for the first half of 2017, compared to the same period in 2016, included:
Total revenues increased 9% to $1.6 billion, while Net Service Revenues increased 28% to $400.0 million primarily due to higher health coverage participation by our WSEs and insurance services price increases as well as a 2% increase in Average WSEs. Net Service Revenues also benefited from slower growth in insurance costs as compared to growth in insurance service revenues primarily due to reductions in related premium and claim costs.
Operating income increased 103%to $106.3 million primarily due to increases in insurance service revenues and moderated growth in insurance costs described above, partially offset by an increase in other operating expenses to support our growth.
|
| |
| MANAGEMENT'S DISCUSSION AND ANALYSIS | |
YTD 2017
During the first nine months of 2017, we:
co-employed Average WSEs of 325,000, consistent with the same period in 2016,
processed approximately $25.8 billion in payroll and payroll tax payments for our clients, an increase of 4% over the same period in 2016, and
increased Cash and cash equivalents $79.5 million, or 43%, to $263.5 million.
Our financial performance for the first nine months of 2017, compared to the same period in 2016, included:
Total revenues increased 8% to $2.4 billion, while Net Service Revenues increased 28% to $605.9 million attributable primarily to increased participation in our health plans combined with an increase in health insurance fees per plan participant. Net Service Revenues also benefited from slower growth in insurance claims costs and reduced administrative costs.
Operating income increased 108%to $169.1 million primarily due to increases in Net Service Revenues, partially offset by an increase in other operating expenses to support our initiatives.
Net income increased 188%190% to $68.7$111.5 million, or $0.97$1.57 per diluted share, Adjusted Net Income increased 75%82% to $68.3$108.6 million and Adjusted EBITDA increased 60%66% to $135.7$216.0 million primarily due to increased operating income.income as described above.
Cash provided by operating activities increased 138%97% to $104.1$159.0 million primarily as a result of increased operating income reductionsas described above, decreased payments of our tax liabilities, and a decrease in paymentpayments of collateral to our workers' compensation collateral held by insurance carriers and reduction in cash taxes paid.carriers.
|
| |
| MANAGEMENT'S DISCUSSION AND ANALYSIS | |
Key Financial and Operating Metrics
The following key financial and operating metrics should be read in conjunction with our condensed consolidated financial statements and related notes included in this Form 10-Q.
| | | | Three Months Ended June 30, | | Six Months Ended June 30, | | Percent Change | Three Months Ended September 30, | | Nine Months Ended September 30, | | Percent Change |
(in thousands, except per share and operating metrics data) | 2017 | | 2016 | | 2017 | | 2016 | | Q2 2017 vs. 2016 | YTD 2017 vs. 2016 | 2017 | | 2016 | | 2017 | | 2016 | | Q3 2017 vs. 2016 | YTD 2017 vs. 2016 |
| Income Statement Data: | | | | | | | | | | | | | | | | | | |
| Total revenues | $ | 800,541 |
| | $ | 745,846 |
| | $ | 1,608,151 |
| | $ | 1,478,785 |
| | 7 | % | 9 | % | $ | 819,293 |
| | $ | 770,457 |
| | $ | 2,427,444 |
| | $ | 2,249,242 |
| | 6 |
| % | 8 | % |
| Operating income | 56,835 |
| | 26,367 |
| | 106,322 |
| | 52,269 |
| | 116 | | 103 | | 62,759 |
| | 28,972 |
| | 169,081 |
| | 81,241 |
| | 117 |
| | 108 | |
| Net income | 39,951 |
| | 12,282 |
| | 68,688 |
| | 23,859 |
| | 225 | | 188 | | 42,836 |
| | 14,581 |
| | 111,524 |
| | 38,440 |
| | 194 |
| | 190 | |
| Diluted net income per share of common stock | 0.56 |
| | 0.17 |
| | 0.97 |
| | 0.33 |
| | 229 | | 194 | | 0.60 |
| | 0.20 |
| | 1.57 |
| | 0.53 |
| | 200 |
| | 196 | |
Non-GAAP measures (1): | | | | | | | | | | | | | | | | | | |
Net Service Revenues (1) | 201,006 |
| | 149,173 |
| | 399,974 |
| | 312,423 |
| | 35 | | 28 | | 205,896 |
| | 161,035 |
| | 605,870 |
| | 473,458 |
| | 28 |
| | 28 | |
Net Insurance Service Revenues (1) | 92,364 |
| | 39,580 |
| | 171,211 |
| | 90,427 |
| | 133 | | 89 | | 93,366 |
| | 50,542 |
| | 264,577 |
| | 140,969 |
| | 85 |
| | 88 | |
Adjusted EBITDA (1) | 72,372 |
| | 42,602 |
| | 135,715 |
| | 84,755 |
| | 70 | | 60 | | 80,283 |
| | 45,399 |
| | 215,998 |
| | 130,154 |
| | 77 |
| | 66 | |
Adjusted Net Income (1) | 36,691 |
| | 19,466 |
| | 68,268 |
| | 38,999 |
| | 88 | | 75 | | 40,297 |
| | 20,800 |
| | 108,565 |
| | 59,798 |
| | 94 |
| | 82 | |
| | | | | | | | | | | | | | | | | | | |
| Operating Metrics: | | | | | | | | | | | | | | | | | | |
| Total WSEs payroll and payroll taxes processed (in millions) | $ | 7,958 |
| | $ | 7,811 |
| | $ | 17,774 |
| | $ | 17,213 |
| | 2 | % | 3 | % | $ | 8,061 |
| | $ | 7,703 |
| | $ | 25,835 |
| | $ | 24,916 |
| | 5 |
| % | 4 | % |
| Average WSEs | 324,194 |
| | 322,881 |
| | 325,999 |
| | 321,152 |
| | — | | 2 | | 324,043 |
| | 331,652 |
| | 325,347 |
| | 324,652 |
| | (2 | ) | | — | |
| |
| (1) | Refer to Non-GAAP Financial Measures section below for definitions and reconciliations from GAAP measures. |
| | | | Six Months Ended June 30, | | Percent | Nine Months Ended September 30, | | Percent |
| (in thousands, except operating metrics data) | 2017 | | 2016 | | Change | 2017 | | 2016 | | Change |
| Operating Metrics: | | | | | | | | | | | |
| Total WSEs at period end | 329,095 |
| | 325,466 |
| | 1 | % | 325,138 |
| | 333,778 |
| | (3 | ) | % |
| Cash Flow Data: | | | | | | | | | | |
| Net cash provided by operating activities | $ | 104,113 |
| | $ | 43,667 |
| | 138 | | $ | 158,951 |
| | $ | 80,699 |
| | 97 |
| |
| Net cash used in investing activities | (9,256 | ) | | (6,975 | ) | | 33 | | (14,763 | ) | | (17,411 | ) | | (15 | ) | |
| Net cash used in financing activities | (45,141 | ) | | (36,230 | ) | | 25 | | (65,063 | ) | | (68,998 | ) | | (6 | ) | |
| | | (in thousands) | June 30,
2017 | | December 31,
2016 | | Percent Change | | September 30,
2017 | | December 31,
2016 | | Percent Change | |
| Balance Sheet Data: | | | | | | | | | | | | |
| Cash and cash equivalents | $ | 233,883 |
| | $ | 184,004 |
| | 27 |
| % | $ | 263,527 |
| | $ | 184,004 |
| | 43 |
| % |
| Working capital | 168,681 |
| | 156,771 |
| | 8 |
| | 186,842 |
| | 156,771 |
| | 19 |
| |
| Total assets | 1,758,695 |
| | 2,095,143 |
| | (16 | ) | | 1,836,925 |
| | 2,095,143 |
| | (12 | ) | |
| Notes and capital leases payable | 440,805 |
| | 459,054 |
| | (4 | ) | | 431,690 |
| | 459,054 |
| | (6 | ) | |
| Total liabilities | 1,667,182 |
| | 2,060,553 |
| | (19 | ) | | 1,705,066 |
| | 2,060,553 |
| | (17 | ) | |
| Total stockholders’ equity | 91,513 |
| | 34,590 |
| | 165 |
| | 131,859 |
| | 34,590 |
| | 281 |
| |
Non-GAAP Financial Measures
In addition to financial measures presented in accordance with GAAP, we monitor other non-GAAP financial measures that we use to manage our business, make planning decisions, allocate resources and as performance measures in our executive compensation plan. These key financial measures provide an additional view of our operational performance over the long termlong-term and provide useful information that we use in order to maintain and grow our business.
The presentation of these non-GAAP financial measures is used to enhance the understanding of certain aspects of our financial performance. It is not meant to be considered in isolation, superior to, or as a substitute for the directly comparable financial measures prepared in accordance with GAAP.
|
| |
| MANAGEMENT'S DISCUSSION AND ANALYSIS | |
|
| | |
| Non-GAAP Measure | Definition | How We Use The Measure |
| Net Service Revenues | • Sum of professional service revenues and Net Insurance Service Revenues, or total revenues less insurance costs. | • Provides a comparable basis of revenues on a net basis. Professional service revenues are represented net of client payroll costs whereas insurance service revenues are presented gross of insurance costs for financial reporting purposes. • Acts as the basis to allocate resources to different functions and evaluates the effectiveness of our business strategies by each business function. • Provides a measure, among others, used in the determination of incentive compensation for management. |
| Net Insurance Service Revenues | • Insurance revenues less insurance costs. | • Is a component of Net Service Revenues. • Provides a comparable basis of revenues on a net basis. Professional service revenues are represented net of client payroll costs whereas insurance service revenues are presented gross of insurance costs for financial reporting purposes. Promotes an understanding of our insurance services business by evaluating insurance service revenues net of our WSE related costs which are substantially pass-through for the benefit of our WSEs. Under GAAP, insurance service revenues and costs are recorded gross as we have latitude in establishing the price, service and supplier specifications. |
| Adjusted EBITDA | • Net income, excluding the effects of: - income tax provision, - interest expense, - depreciation, - amortization of intangible assets, and - stock-based compensation expense.
| • Provides period-to-period comparisons on a consistent basis and an understanding as to how our management evaluates the effectiveness of our business strategies by excluding certain non-cash charges such as depreciation and amortization, and stock-based compensation recognized based on the estimated fair values. We believe these charges are not directly resulting from our core operations or indicative of our ongoing operations. • Enhances comparisons to prior periods and, accordingly, facilitates the development of future projections and earnings growth prospects. • Provides a measure, among others, used in the determination of incentive compensation for management. |
| Adjusted Net Income | • Net income, excluding the effects of: - effective income tax rate (1), - stock-based compensation, - amortization of intangible assets, - non-cash interest expense (2), and - the income tax effect (at our effective tax rate (1)) of these pre-tax adjustments. | • Provides information to our stockholders and board of directors to understand how our management evaluates our business, to monitor and evaluate our operating results, and analyze profitability of our ongoing operations and trends on a consistent basis by excluding certain non-cash charges.
|
| |
| (1) | We have adjusted the non-GAAP effective tax rate to 40.5% for 2017 from 42.5% for 2016 due to a decrease in state income taxes from an increase in excludable income for state income tax purposes. These non-GAAP effective tax rates exclude the income tax impact from stock-based compensation and changes in uncertain tax positions. |
| |
| (2) | Non-cash interest expense represents amortization and write-off of our debt issuance costs. |
|
| |
| MANAGEMENT'S DISCUSSION AND ANALYSIS | |
Reconciliation of GAAP to Non-GAAP Measures
The table below presents a reconciliation of Total revenues to Net Service Revenues: | | | | Three Months Ended
June 30, | | Six Months Ended June 30, | Three Months Ended
September 30, | | Nine Months Ended September 30, |
| (in thousands) | 2017 | 2016 | | 2017 | 2016 | 2017 | 2016 | | 2017 | 2016 |
| Total revenues | $ | 800,541 |
| $ | 745,846 |
| | $ | 1,608,151 |
| $ | 1,478,785 |
| $ | 819,293 |
| $ | 770,457 |
| | $ | 2,427,444 |
| $ | 2,249,242 |
|
| Less: Insurance costs | 599,535 |
| 596,673 |
| | 1,208,177 |
| 1,166,362 |
| 613,397 |
| 609,422 |
| | 1,821,574 |
| 1,775,784 |
|
| Net Service Revenues | $ | 201,006 |
| $ | 149,173 |
| | $ | 399,974 |
| $ | 312,423 |
| $ | 205,896 |
| $ | 161,035 |
| | $ | 605,870 |
| $ | 473,458 |
|
The table below presents a reconciliation of Insurance service revenues to Net Insurance Service Revenues:
| | | | Three Months Ended
June 30, | | Six Months Ended
June 30, | Three Months Ended
September 30, | | Nine Months Ended
September 30, |
| (in thousands) | 2017 | 2016 | | 2017 | 2016 | 2017 | 2016 | | 2017 | 2016 |
| Insurance service revenues | $ | 691,899 |
| $ | 636,253 |
| | $ | 1,379,388 |
| $ | 1,256,789 |
| $ | 706,763 |
| $ | 659,964 |
| | $ | 2,086,151 |
| $ | 1,916,753 |
|
| Less: Insurance costs | 599,535 |
| 596,673 |
| | 1,208,177 |
| 1,166,362 |
| 613,397 |
| 609,422 |
| | 1,821,574 |
| 1,775,784 |
|
| Net Insurance Service Revenues | $ | 92,364 |
| $ | 39,580 |
| | $ | 171,211 |
| $ | 90,427 |
| $ | 93,366 |
| $ | 50,542 |
| | $ | 264,577 |
| $ | 140,969 |
|
The table below presents a reconciliation of Net income to Adjusted EBITDA:
| | | | Three Months Ended
June 30, | | Six Months Ended
June 30, | Three Months Ended
September 30, | | Nine Months Ended
September 30, |
| (in thousands) | 2017 | 2016 | | 2017 | 2016 | 2017 | 2016 | | 2017 | 2016 |
| Net income | $ | 39,951 |
| $ | 12,282 |
| | $ | 68,688 |
| $ | 23,859 |
| $ | 42,836 |
| $ | 14,581 |
| | $ | 111,524 |
| $ | 38,440 |
|
| Provision for income taxes | 12,298 |
| 9,210 |
| | 28,451 |
| 18,451 |
| 15,268 |
| 9,107 |
| | 43,719 |
| 27,558 |
|
| Stock-based compensation | 7,499 |
| 6,508 |
| | 13,706 |
| 13,905 |
| 7,700 |
| 6,264 |
| | 21,406 |
| 20,169 |
|
| Interest expense and bank fees | 4,857 |
| 5,038 |
| | 9,605 |
| 10,080 |
| 5,425 |
| 5,597 |
| | 15,030 |
| 15,677 |
|
| Depreciation | 6,451 |
| 4,559 |
| | 12,599 |
| 8,475 |
| 7,754 |
| 5,188 |
| | 20,353 |
| 13,663 |
|
| Amortization of intangible assets | 1,316 |
| 5,005 |
| | 2,666 |
| 9,985 |
| 1,300 |
| 4,662 |
| | 3,966 |
| 14,647 |
|
| Adjusted EBITDA | $ | 72,372 |
| $ | 42,602 |
| | $ | 135,715 |
| $ | 84,755 |
| $ | 80,283 |
| $ | 45,399 |
| | $ | 215,998 |
| $ | 130,154 |
|
The table below presents a reconciliation of Net income to Adjusted Net Income:
| | | | Three Months Ended
June 30, | | Six Months Ended
June 30, | Three Months Ended
September 30, | | Nine Months Ended
September 30, |
| (in thousands) | 2017 | 2016 | | 2017 | 2016 | 2017 | 2016 | | 2017 | 2016 |
| Net income | $ | 39,951 |
| $ | 12,282 |
| | $ | 68,688 |
| $ | 23,859 |
| $ | 42,836 |
| $ | 14,581 |
| | $ | 111,524 |
| $ | 38,440 |
|
| Effective income tax rate adjustment | (8,863 | ) | 76 |
| | (10,890 | ) | 469 |
| (8,264 | ) | (960 | ) | | (19,154 | ) | (491 | ) |
| Stock-based compensation | 7,499 |
| 6,508 |
| | 13,706 |
| 13,905 |
| 7,700 |
| 6,264 |
| | 21,406 |
| 20,169 |
|
| Amortization of intangible assets | 1,316 |
| 5,005 |
| | 2,666 |
| 9,985 |
| 1,300 |
| 4,662 |
| | 3,966 |
| 14,647 |
|
| Non-cash interest expense | 602 |
| 849 |
| | 1,224 |
| 1,624 |
| 622 |
| 1,559 |
| | 1,846 |
| 3,183 |
|
| Income tax impact of pre-tax adjustments | (3,814 | ) | (5,254 | ) | | (7,126 | ) | (10,843 | ) | (3,897 | ) | (5,306 | ) | | (11,023 | ) | (16,150 | ) |
| Adjusted Net Income | $ | 36,691 |
| $ | 19,466 |
| | $ | 68,268 |
| $ | 38,999 |
| $ | 40,297 |
| $ | 20,800 |
| | $ | 108,565 |
| $ | 59,798 |
|
|
| |
| MANAGEMENT'S DISCUSSION AND ANALYSIS | |
Results of Operations
Revenues and Income
Q2Q3 2017 - Q2Q3 2016 Commentary
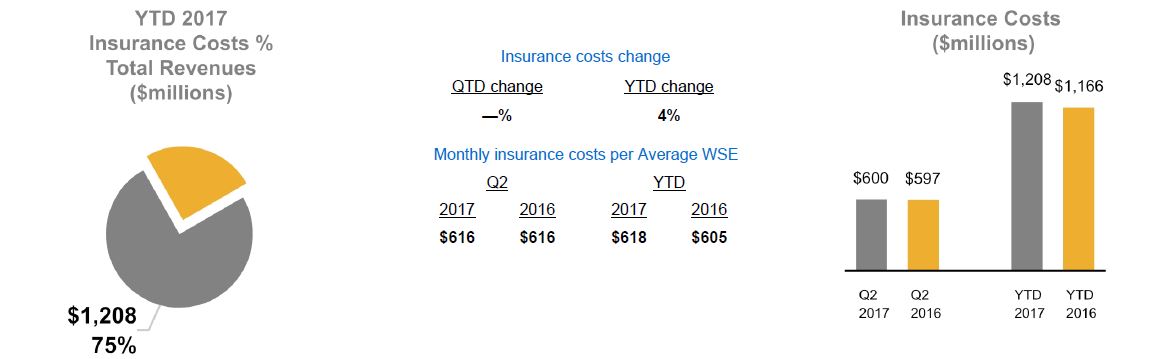
Total revenues were $800.5$819.3 million for the secondthird quarter of 2017, a 7%6% increase compared to the same period in 2016:2016.
Insurance service revenues grew 9%7% over the same quarter in 2016 to $691.9$706.8 million.
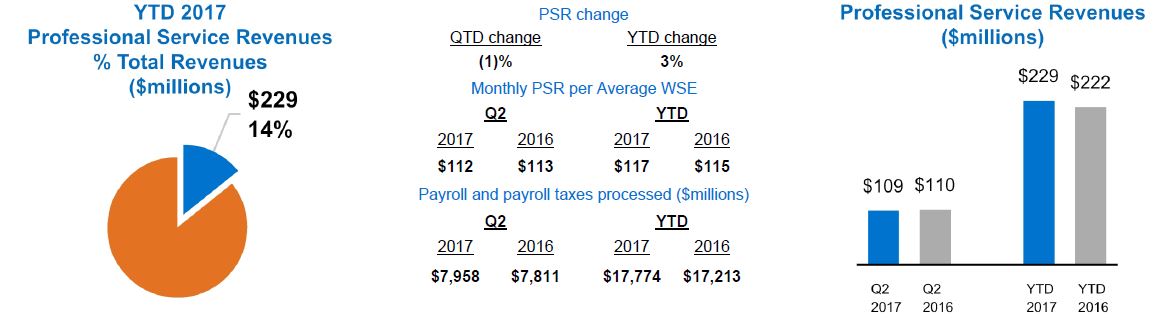
Professional service revenues decreased 1%increased 2% over the same quarter in 2016 to $108.6$112.5 million.
Net Service Revenues were $201.0$205.9 million for the secondthird quarter of 2017, representing a 35%28% increase from the same quarterperiod in 2016. This was driven by the increase in Net Insurance Service Revenues, which grew 133%85% over the same period in 2016.2016 due to increased participation in our health plans combined with an equal increase in health insurance service fees per plan participant. Insurance service revenues per Average WSE increased by 8%10% while insurance costs per Average WSE remained flat.increased 3%.
Operating income was $56.8$62.8 million, up 116%117% from the secondthird quarter of 2016, primarily due to improvement in our insurance service revenues as noted above, partially offset by a 20%10% increase in other operating expenses to support our growthinitiatives and additional costs associated with our internal control remediation efforts. Refer to the Other Operating Expenses section in this Results of Operations for further detail.
YTD 2017 - YTD 2016 Commentary
Total revenues were $1.6$2.4 billion for the first halfnine months of 2017, a 9%an 8% increase compared to the same period in 2016.
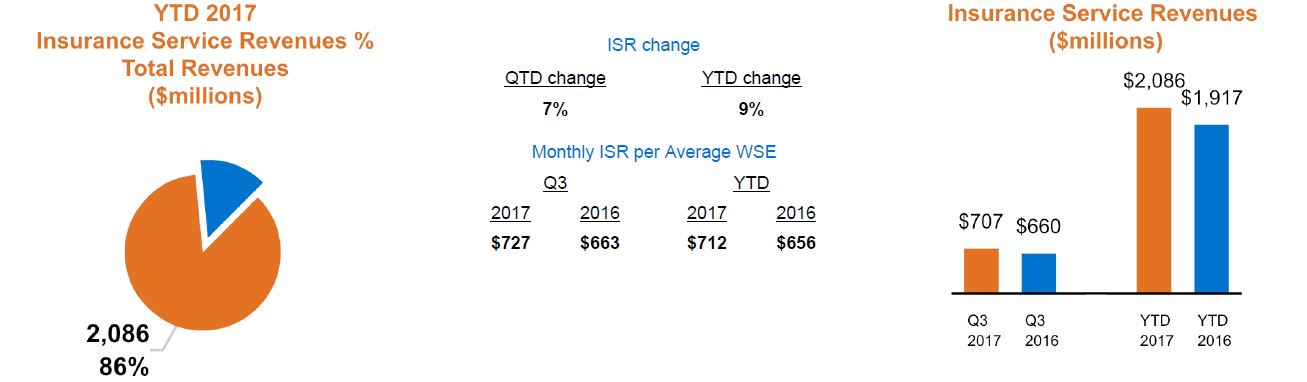
Insurance service revenues grew 10%9% over the same period in 2016 to $1.4 billion.$2,086.2 million.
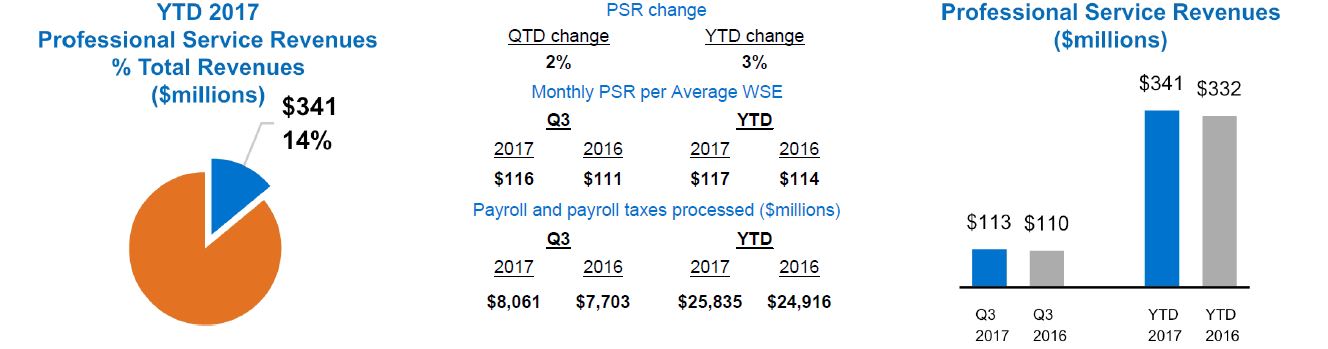
Professional service revenues increased 3% over the same period in 2016 to $228.8$341.3 million.
Net Service Revenues were $400.0$605.9 million for the first halfnine months of 2017, representing a 28% increase from the same period in 2016. This was driven by the increase in Net Insurance Service Revenues which grew 89%88% over the same period in 2016.2016 which was primarily attributable to increased participation in our health plans combined with an increase in health insurance service fees per plan participant. Insurance service revenues per Average WSE increased by 8%9%, while insurance costs per Average WSE increased 2%.
Operating income was $106.3$169.1 million, up 103%108% from the first halfnine months of 2016, primarily due to improvement in our insurance services revenues as noted above, partially offset by a 15%13% increase in other operating expenses to support our growthinitiatives and additional costs associated with our internal control remediation efforts. Refer to the Other Operating Expenses section in this Results of Operations for further detail.
|
| |
| MANAGEMENT'S DISCUSSION AND ANALYSIS | |
Worksite Employees (WSE)
Historically, Total WSE comparisons have served as an indicator of our success in growing our business and retaining clients. Average WSE growth is another volume measure we use to monitor the performance of our business.
Average WSEs was flatdecreased 2% in the secondthird quarter of 2017 compared to the same period in 2016 and increased 2%remained flat in the first halfnine months of 2017 compared to the same period in 2016. This 2% increase was driven byThe quarter and year to date changes in Average WSEs are a result of WSE growth in our established customer base, largely offset by higher attrition, resultingincluding attrition from migrating our disciplined approach of migrating clients to a common platform. Furthermore, we moderated our new customer growth as we prepared forexpanded the launchfunctionality of our new industry vertical, TriNet Main Street.
Anticipated revenues for future periods can diverge from Total WSEs due to pricing differences across our HR solutions and services and the degree to which clients and WSEs elect to participate in our solutions. In addition to driving the growth in WSE count, we also focus on pricing strategies and product differentiation to maximize our revenue opportunities. Average monthly total revenues per WSE, as a measure to monitor the success of such pricing strategies, have increased 7%9% and 8% in the secondthird quarter and first halfnine months of 2017, respectively, compared to the same periods in 2016.
Professional Service Revenues (PSR)
Professional service revenues represented 14% of total revenues in both the second quarter and first half of 2017. The slight decrease in professional service revenues during the second quarter of 2017 was primarily attributed to the timing of a payroll tax service fee adjustment.
The 3% increase in PSR during the first half of 2017 was primarily attributed to the 2% growth in Average WSEs when compared to the same period in 2016.
|
| |
| MANAGEMENT'S DISCUSSION AND ANALYSIS | |
Professional Service Revenues (PSR)
Professional service revenues represented 14% of total revenues in both the third quarter and first nine months of 2017. The slight increase in professional service revenues during the third quarter of 2017 was primarily attributed to a 5% increase in PSR per Average WSE when compared to the same period in 2016, partially offset by a decrease in Average WSEs when compared to the same period in 2016.
The increase in PSR during the first nine months of 2017 was attributed to the 3% increase in PSR per Average WSE when compared to the same period in 2016.
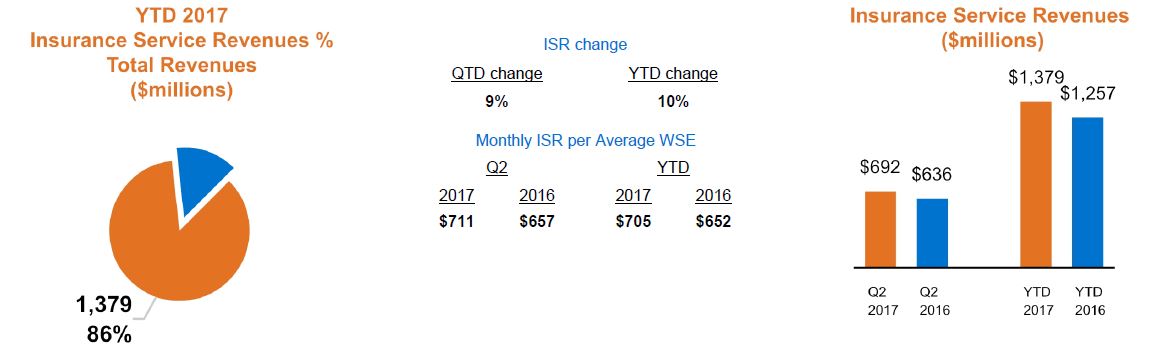
Insurance Service Revenues (ISR)
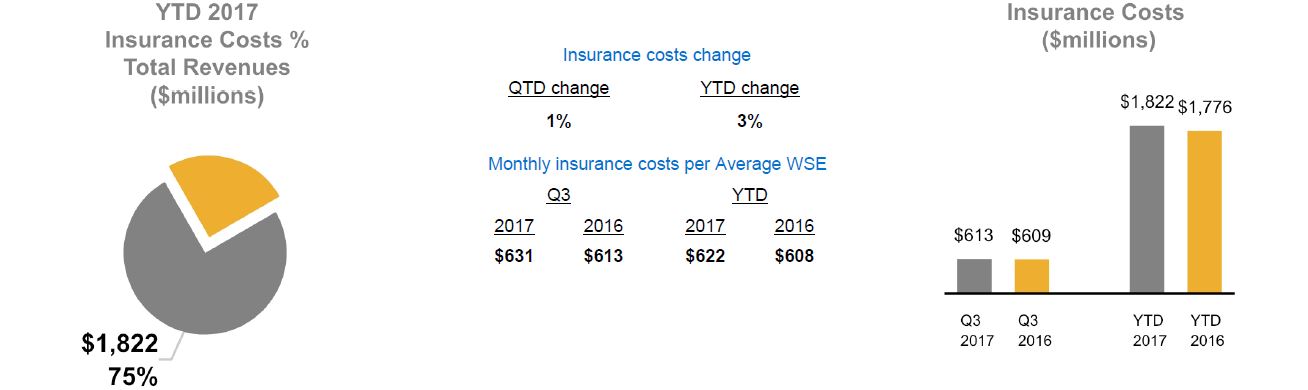
Insurance service revenues represented 86% of total revenue in the secondthird quarter and first halfnine months of 2017. Insurance service revenues increased 9%7% and 10%9% in the secondthird quarter and first halfnine months of 2017, respectively, when compared to the same periods in 2016. The growth in insurance service revenues for the secondthird quarter and first half of 2017 was equally attributable to increased participation in our health plans andcombined with an equal increase in health insurance service fees per plan participant. The growth in insurance service revenues for the first nine months of 2017 was primarily attributable to increased participation in our health plans combined with an increase in health insurance service fees per plan participant.
|
| |
| MANAGEMENT'S DISCUSSION AND ANALYSIS | |
Insurance Costs
Insurance costs remained consistentincreased 1% and 3% for the secondthird quarter and first nine months of 2017, when compared to the same period in 2016, with flat Average WSEs and costs per Average WSE.
Insurance costs increased 4% for the first half of 2017,respectively, compared to the same period in 2016, primarily as a result of an increase in health plan participants, and a 2% increase in Average WSEs, partially offset by a reductiondecrease in monthly insurance claims costs and premiumadministrative costs per average participant.
|
| |
| MANAGEMENT'S DISCUSSION AND ANALYSIS | |
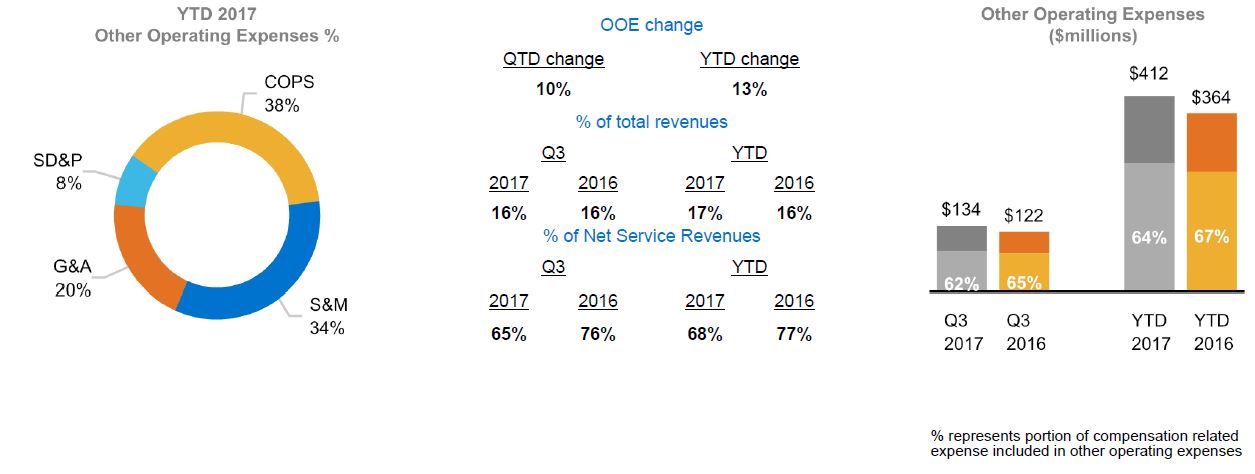
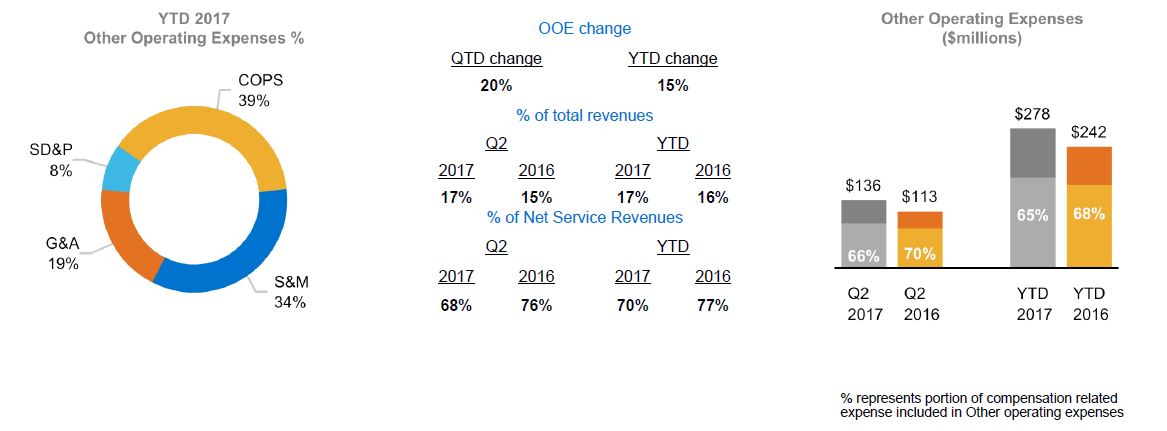
Other Operating Expenses (OOE)
Other operating expenses includes cost of providing services (COPS), sales and marketing (S&M), general and administrative (G&A), and systems development and programming (SD&P) expenses.
We manage other operating expenses and allocate resources across different business functions based on percentage of Net Service Revenues. This ratio has decreased to 68%65% from 76% in the secondthird quarter of 2017 and has decreased to 70%68% from 77% in the first halfnine months of 2017, when compared to the same periods in 2016. These decreases are due to our revenues increasing faster than other operating expenses.
We had approximately 2,700 corporate employees as of JuneSeptember 30, 2017 in 4847 offices across the U.S. Our corporate employees' compensation related expenses represent a majority of our operating expenses. Compensation costs for our corporate employees include payroll, payroll taxes, stock-based compensation, bonuses, commissions and other payroll and benefits related costs. The percentage of compensation related expense to other operating expense has decreased to 66%62% from 70%65% in the secondthird quarter of 2017, and has decreased to 65%64% from 68%67% in in the first halfnine months of 2017, when compared to the same periods in 2016. These decreases are primarily due to increased non-compensation related costs associated with our vertical product development, platform integrations, and internal control remediation efforts.
We expect our operating expenses to increase in the foreseeable future due to expected growth, our continued strategy to develop new vertical products, andcontinued platform integrations, and additional costs associated with our internal control remediation efforts. We will continue to improve our systems, processes, and internal controls to gain efficiencies.controls. These expenses may fluctuate as a percentage of our total revenues from period-to-period depending on the timing of when expenses are incurred.
|
| |
| MANAGEMENT'S DISCUSSION AND ANALYSIS | |
Q2Q3 2017 - Q2Q3 2016 Commentary
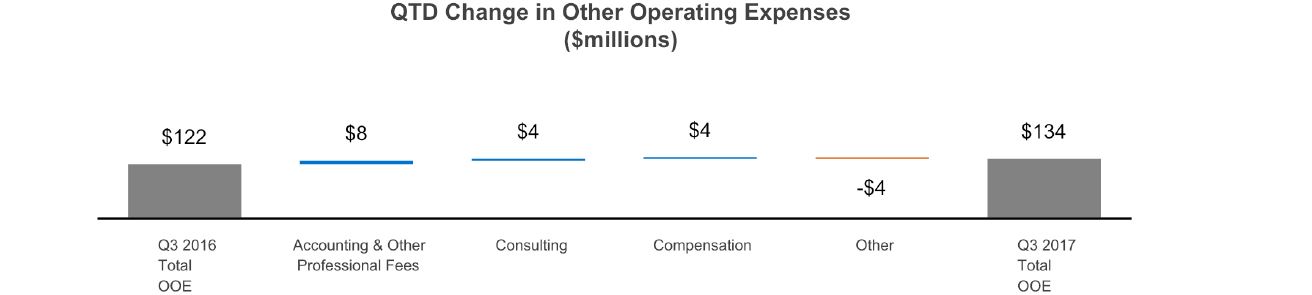
Other operating expenses increased $23.2$11.9 million or 20%10% in the secondthird quarter of 2017 compared to the same period in 2016 as part of our continued investment in supporting our infrastructure, and improving our technology platform user experience for our clients.clients, and our internal control remediation efforts. Significant drivers of our increased spending are as follows:
Compensation costs for our corporate employees including payroll, payroll taxes, stock-based compensation, bonuses, commissions and other payroll and benefits related costs, increased $10.6 million or 13% primarily due to increased headcount related to investments in client service and technology functions to support product delivery and platform integration.
Consulting expenses increased $4.8 million and included costs associated with enhancing our product offerings as well as payroll tax compliance initiatives.
Accounting and other professional fees increased $4.8$8.1 million in the second quarter of 2017 primarily as a result of increased professional fees to support our internal control remediation efforts.
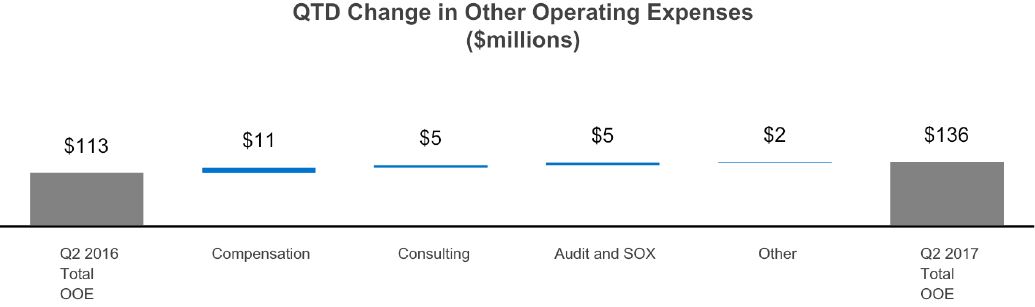
Compensation costs for our corporate employees increased $3.5 million primarily due to increased headcount related to investments in technology, sales and client services functions to support product delivery and platform integration.
Other expenses decreased $3.5 million primarily due to a reduction in local tax compliance costs.
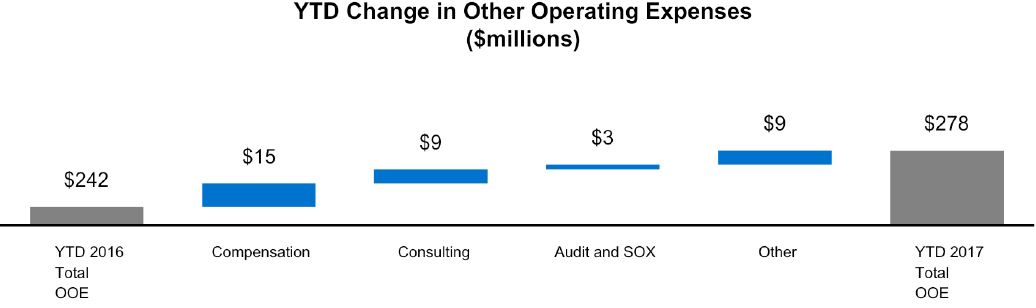
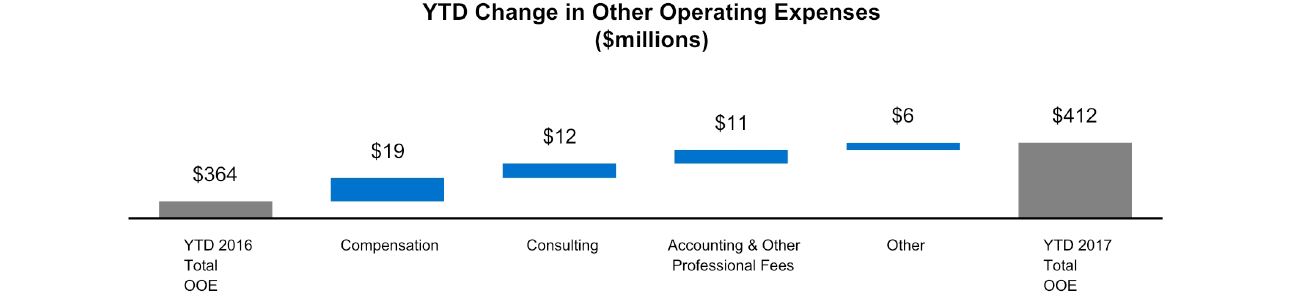
YTD 2017 - YTD 2016 Commentary
Other operating expenses increased $36.7$48.6 million, or 15%13%, in the first halfnine months of 2017 compared to the same period in 2016. Significant drivers of our increased spending are as follows:
Total compensation costs increased $15.1$18.9 million, or 9%8%, primarily due to increased headcount related to investments in technology and consultingclient services functions to support product delivery and platform integration as well as an increase in sales related compensation costs associated with a new sales performance incentive program.
Consulting expenses increased $8.8$11.9 million primarily due to the factors described above.above and also included costs associated with payroll tax compliance initiatives.
Accounting and other professional fees increased $2.6$11.4 million primarily as a result of the timing of professional fees to support our internal control remediation efforts.
Other expenses increased $10.2$6.4 million primarily due to additional compliance costs and external sales costs.
|
| |
| MANAGEMENT'S DISCUSSION AND ANALYSIS | |
Amortization of Intangible Assets
Amortization of intangible assets represents costs associated with acquired companies' developed technologies, client lists, trade names and contractual agreements. Amortization expenses decreased 74%72% and 73% in the secondthird quarter and first halfnine months of 2017, respectively, compared to the same periods in 2016, as a result of the revision to the expected useful life in October 2016 of certain client lists and trademarks primarily related to our previous acquisitions.
Depreciation
Depreciation expense increased 42% and 49% in the secondthird quarter and first halfnine months of 2017, respectively, compared to the same periods in 2016, as a result of our additional investment in technology products and platforms and the associated depreciation of those assets.
Other Income (Expense)
Other income (expense) consists primarily of interest expense under our credit facility whichand decreased 4%3% and 5%4% in the secondthird quarter and first halfnine months of 2017, respectively, compared to the same periods in 2016 due to a decreasing principal balance on our outstanding debt.
Provision for Income Taxes
Our effective income tax rate (ETR) was 23.5%26.3% and 38.4% for the second quarter ofthree months ended September 30, 2017 compared to an ETR of 42.9%and 2016, respectively, and 28.2% and 41.8% for the same period in 2016. The 19.4% decrease in ETR isnine months ended September 30, 2017 and 2016, respectively. These decreases are primarily due to the following:
a decrease of 12.0%, or $6.5 million, attributable todiscrete tax benefitsbenefit recognized from theupon adoption of Accounting Standards UpdateASU 2016-09, - Stock Compensation (ASU 2016-09) additionally described in Note 1 of our condensed consolidated financial statements and related notes,
a decrease of 4.3% in state income taxestax benefit resulting from qualified production activities deduction for certain software offerings, a tax benefit from an increase in excludable income for state income tax purposes andwhich is partially offset by a discrete charge due to changes in apportionmentuncertain tax positions, and statutorya tax rates,
a decrease of 2.3%benefit in non-deductible expenses due to the abatement of penalties previously assessed by the Internal Revenue Service (IRS), and
a. The remaining decrease of 0.8% resulting from an increase inis attributable to tax credits and decrease in non-deductible stock-baseddisqualifying dispositions of previously nondeductible stock based compensation.
Our ETR was 29.3% for the first half of 2017, compared to an ETR of 43.6% for the same period in 2016. The 14.3% decrease in ETR is primarily due to the following:
a decrease of 10.1%, or $10.1 million, attributable to tax benefits recognized from the adoption of ASU 2016-09,
a decrease of 3.8% in state income taxes from an increase in excludable income for state income tax purposes and changes in apportionment and statutory tax rates,
a decrease of 2.4% resulting from an increase in tax credits and decrease in both non-deductible stock-based compensation and non-deductible expenses, partially offset by a
an increase of 2.0% due to changes in uncertain tax positions where we may not prevail in our position associated with state income tax audits.
|
| |
MANAGEMENT'S DISCUSSION AND ANALYSIS | |
Liquidity and Capital Resources
Liquidity
We manage our liquidity separately between assets and liabilities that are WSE related from our corporate assets and liabilities.
WSE related assets and liabilities primarily consist of current assets and current liabilities resulting from transactions directly or indirectly associated with WSEs, including payroll and related taxes and withholdings, our sponsored workers' compensation and health insurance programs, and other benefit programs. Our cash flows related to WSE payroll and benefits is generally matched by advance collection from our clients which is reported as payroll funds collected within WSE related assets.
We report our corporate cash and cash equivalents on the condensed consolidated balance sheets separately from WSE related assets. We rely on our corporate cash and cash equivalents and cash from operations to satisfy our operational and regulatory requirements and to fund capital expenditures. We believe that we have sufficient corporate liquidity and capital resources to satisfy future requirements and meet our obligations to clients, creditors and debt holders. We believe that our existing corporate cash and cash equivalents, working capital and cash provided by operating activities will be sufficient to meet our working capital and capital expenditure needs for at least the next 12 months.
|
| |
| MANAGEMENT'S DISCUSSION AND ANALYSIS | |
Our liquid assets are as follows:
| | | (in thousands) | June 30,
2017 | December 31,
2016 | September 30,
2017 | December 31,
2016 |
| Cash and cash equivalents | $ | 233,883 |
| $ | 184,004 |
| $ | 263,527 |
| $ | 184,004 |
|
| Working capital: | | |
| Corporate working capital | 163,195 |
| 151,295 |
| 180,497 |
| 151,295 |
|
| WSE related assets, net of WSE related liabilities | 5,486 |
| 5,476 |
| 6,345 |
| 5,476 |
|
We manage our sponsored benefit and workers' compensation insurance obligations by maintaining funds in restricted cash, cash equivalents and investments as collateral. As of JuneSeptember 30, 2017, we had $155.3$157.0 million of restricted cash, cash equivalents and investments included in WSE related assets and $150.9$160.2 million of marketable securities designated as long-term restricted cash, cash equivalents and investments on the condensed consolidated balance sheets. These collateral amounts are generally determined at the beginning of each plan year and we may be required by our insurance carriers to adjust the balance when facts and circumstances change. We regularly review our collateral balances with our insurance carriers, and anticipate funding further collateral as needed based on program development.
Capital Resources
We believe that we can meet our present and reasonably foreseeable operating cash needs and future commitments through existing liquid assets, continuing cash flows from operations, our borrowing capacity under our revolving credit facility and the potential issuance of debt or equity securities.
We maintain a $75.0 million revolving credit facility. The total unused portion of our revolving credit facility was $59.5 million as of JuneSeptember 30, 2017.
|
| |
MANAGEMENT'S DISCUSSION AND ANALYSIS | |
Cash Flows
We generated positive cash flows from operating activities for the first halfnine months of 2017 and 2016. We also have borrowing capacity under our revolving credit facility and the potential to generate cash through the issuance of debt or equity securities, to meet short-term funding requirements. The following table presents our cash flow activities for the stated periods:
|
| | | | | | |
| | Six Months Ended
June 30, |
| (in thousands) | 2017 | 2016 |
| Net cash provided by (used in): | | |
| Operating activities | $ | 104,113 |
| $ | 43,667 |
|
| Investing activities | (9,256 | ) | (6,975 | ) |
| Financing activities | (45,141 | ) | (36,230 | ) |
| Effect of exchange rates on cash and cash equivalents | 163 |
| 24 |
|
| Net increase in cash and cash equivalents | $ | 49,879 |
| $ | 486 |
|
Operating Activities
Components of net cash provided by operating activities are as follows:
|
| | | | | | |
| | Six Months Ended
June 30, |
| (in thousands) | 2017 | 2016 |
| Net income | $ | 68,688 |
| $ | 23,859 |
|
| Depreciation and amortization | 16,496 |
| 17,919 |
|
| Stock-based compensation expense | 13,706 |
| 13,905 |
|
| Payment of interest | (8,006 | ) | (8,091 | ) |
| Income tax (payments) refunds, net | 169 |
| (21,374 | ) |
| Collateral (paid to) refunded from insurance carriers, net | 4,729 |
| (14,053 | ) |
| Changes in other operating assets and liabilities | 8,331 |
| 31,502 |
|
| Net cash provided by operating activities | $ | 104,113 |
| $ | 43,667 |
|
The period-to-period fluctuation in cash provided by operating activities is primarily driven by the 188% increase in our net income, changes in other operating assets and liabilities, which are primarily driven by timing of payments related to WSE related assets and liabilities and our accrued expenses related to corporate employee compensation related payables, reductions to our taxes paid, and decreases in collateral payments made to our insurance carriers. |
| | | | | | |
| | Nine Months Ended
September 30, |
| (in thousands) | 2017 | 2016 |
| Net cash provided by (used in): | | |
| Operating activities | $ | 158,951 |
| $ | 80,699 |
|
| Investing activities | (14,763 | ) | (17,411 | ) |
| Financing activities | (65,063 | ) | (68,998 | ) |
| Effect of exchange rates on cash and cash equivalents | 398 |
| 90 |
|
| Net increase in cash and cash equivalents | $ | 79,523 |
| $ | (5,620 | ) |
|
| |
| MANAGEMENT'S DISCUSSION AND ANALYSIS | |
Operating Activities
Components of net cash provided by operating activities are as follows:
|
| | | | | | |
| | Nine Months Ended
September 30, |
| (in thousands) | 2017 | 2016 |
| Net income | $ | 111,524 |
| $ | 38,440 |
|
| Depreciation and amortization | 26,177 |
| 27,810 |
|
| Stock-based compensation expense | 21,406 |
| 20,169 |
|
| Payment of interest | (12,186 | ) | (11,651 | ) |
| Income tax (payments) refunds, net | 138 |
| (27,650 | ) |
| Collateral (paid to) refunded from insurance carriers, net | (3,163 | ) | (22,911 | ) |
| Changes in other operating assets and liabilities | 15,055 |
| 56,492 |
|
| Net cash provided by operating activities | $ | 158,951 |
| $ | 80,699 |
|
The period-to-period fluctuation in cash provided by operating activities is primarily driven by the 190% increase in our net income, decrease in payments of our tax liabilities, decreases in collateral paid to our workers' compensation insurance carriers, changes in other operating assets and liabilities, which are primarily driven by the timing of payments related to WSE related assets and liabilities, and our accrued expenses related to corporate employee compensation related payables.
Investing Activities
Net cash used in investing activities in the first halfnine months of 2017 and 2016 primarily consisted of cash paid for capital expenditures, offset partially by proceeds from the maturity of investments.
| | | | Six Months Ended
June 30, | Nine Months Ended
September 30, |
| (in thousands) | 2017 | 2016 | 2017 | 2016 |
| Capital expenditures: | | |
| Software and hardware | $ | 13,279 |
| $ | 12,870 |
| $ | 22,816 |
| $ | 21,515 |
|
| Office furniture, equipment and leasehold improvements | 7,446 |
| 3,844 |
| 6,394 |
| 6,427 |
|
| Cash used in capital expenditures | $ | 20,725 |
| $ | 16,714 |
| $ | 29,210 |
| $ | 27,942 |
|
| | | |
| Investments: | | |
| Purchases of restricted investments | $ | — |
| $ | (14,959 | ) | $ | — |
| $ | (14,959 | ) |
| Proceeds from maturity of restricted investments | 11,469 |
| 24,998 |
| 14,447 |
| 25,790 |
|
| Cash provided by investments | $ | 11,469 |
| $ | 10,039 |
| $ | 14,447 |
| $ | 10,831 |
|
Capital expenditures increased in the first halfnine months of 2017 compared to the same period in 2016, primarily due to the build out of our technology and client service centers. We also increased our investments in software and hardware to introduce new products, enhance existing products and platforms, as well as complete platform integrations. We expect capital investments in our software and hardware to continue in the future.
We invest cash held as collateral to satisfy our long-term obligation towards the workers' compensation liabilities in U.S. long-term treasuries and mutual funds. We review the amount of investment and the anticipated holding period regularly, in conjunction with our estimated long-term workers' compensation liabilities and anticipated claims payment trend.
|
| |
| MANAGEMENT'S DISCUSSION AND ANALYSIS | |
Financing Activities
Net cash used in financing activities in the first halfnine months of 2017 and 2016 consisted primarily of repurchases of our common stock and repayment of debt.
The board of directors from time to time authorizes stock repurchases of our outstanding common stock primarily to offset dilution from the issuance of stock under our equity-based incentive plan and employee stock purchase plan. During the first halfnine months of 2017, we repurchased 1.11.4 million shares of common stock for $29.5$39.3 million. As of JuneSeptember 30, 2017, approximately $30.5$20.7 million remained available for repurchase. Our debt repayments were also $3.7 million lower in the first half of 2017 compared to the same periods in 2016.
Critical Accounting Policies, Estimates and Judgments
There have been no material changes to our critical accounting policies as discussed in our 2016 Form 10-K.
Recent Accounting Pronouncements
Refer to Note 1 in the condensed consolidated financial statements and related notes included in this Form 10-Q.
|
| |
QUANTITATIVE AND QUALITATIVE DISCLOSURES ABOUT MARKET RISK AND CONTROLS AND PROCEDURES | |
Quantitative and Qualitative Disclosures About Market Risk
There has been no material change in our exposure to market risks from that discussed in Item 7A of our 2016 Form 10-K.
Controls and Procedures
Evaluation of Disclosure Controls and Procedures
We have, with the participation of our Chief Executive Officer (CEO) and our Chief Financial Officer (CFO), evaluated the effectiveness of our disclosure controls and procedures as of JuneSeptember 30, 2017. The term “disclosure controls and procedures,” as defined in Rules 13a-15(e) and 15d-15(e) under the Securities Exchange Act of 1934, as amended, or the Exchange Act, means controls and other procedures of a company that are designed to ensure that information required to be disclosed by a company in the reports that it files or submits under the Exchange Act is recorded, processed, summarized and reported, within the time periods specified in the SEC’s rules and forms.
Disclosure controls and procedures include, without limitation, controls and procedures designed to ensure that information required to be disclosed by a company in the reports that it files or submits under the Exchange Act is accumulated and communicated to the company’s management, including its principal executive officer and principal financial officer, as appropriate to allow timely decisions regarding required disclosure. Based on the evaluation of our disclosure controls and procedures as of JuneSeptember 30, 2017, our Chief Executive OfficerCEO and Chief Financial OfficerCFO concluded that, as of such date, our disclosure controls and procedures were not effective as a result of the material weaknesses in our internal control over financial reporting. A material weakness is a deficiency, or a combination of deficiencies, in internal control over financial reporting such that there is a reasonable possibility that a material misstatement of our annual or interim financial statements will not be prevented or detected on a timely basis.
Notwithstanding the material weaknesses in our internal control over financial reporting, we have concluded that the condensed consolidated financial statements included in this Quarterly Report on Form 10-Q fairly present, in all material respects, our financial position, results of operations and cash flows for the periods presented in conformity with accounting principles generally accepted in the United States of America. Additionally, the material weaknesses did not result in any restatements of our condensed consolidated financial statements or disclosures for any prior period.
Additional Analyses and Procedures and Remediation Plan
We are taking specific steps to remediate the material weaknesses identified by management and described in greater detail in our 2016 Form 10-K. Although we intend to complete the remediation process with respect to these material weaknesses as quickly as possible, we cannot at this time estimate how long it will take, and our remediation plan may not prove to be successful.
Because the reliability of the internal control process requires repeatable execution, the successful remediation of these material weaknesses will require review and evidence of effectiveness prior to concluding that the controls are effective and there is no assurance that additional remediation steps will not be necessary. As such, as we continue to evaluate and work to improve our internal control over financial reporting, our management may decide to take additional measures to address the material weaknesses or modify the remediation steps already underway. As noted above, although we plan to complete the remediation process as quickly as possible, we cannot at this time estimate how long it will take, and our initiatives may not prove to be successful. Accordingly, until these weaknesses are remediated, we plan to perform additional analyses and other procedures to ensure that our condensed consolidated financial statements are prepared in accordance with GAAP.
Changes in Internal Control Over Financial Reporting
Other than the remediation efforts underway, there were no changes in our internal control over financial reporting identified in connection with the evaluation required by Rule 13a-15(d) and 15d-15(d) of the Exchange Act that occurred during the quarter ended JuneSeptember 30, 2017, that have materially affected, or are reasonably likely to materially affect, our internal control over financial reporting.
Limitations on Effectiveness of Controls and Procedures
In designing and evaluating the disclosure controls and procedures, management recognizes that any controls and procedures, no matter how well designed and operated, can provide only reasonable assurance of achieving the desired control objectives. In addition, the design of disclosure controls and procedures must reflect the fact that there are resource constraints and that management is required to apply judgment in evaluating the benefits of possible controls and procedures relative to their costs.
CONDENSED CONSOLIDATED BALANCE SHEETS
(Unaudited)
| | | (in thousands, except share and per share data) | June 30,
2017 | December 31,
2016 | September 30,
2017 | December 31,
2016 |
| Assets |
| | |
| Current assets: |
| | | |
| Cash and cash equivalents | $ | 233,883 |
| $ | 184,004 |
| $ | 263,527 |
| $ | 184,004 |
|
| Restricted cash and cash equivalents | 14,589 |
| 14,569 |
| 15,445 |
| 14,569 |
|
| Prepaid income taxes | 14,716 |
| 42,381 |
| — |
| 42,381 |
|
| Prepaid expenses | 13,013 |
| 10,784 |
| 11,013 |
| 10,784 |
|
| Other current assets | 2,172 |
| 2,145 |
| 2,360 |
| 2,145 |
|
| Worksite employee related assets | 898,596 |
| 1,281,471 |
| 941,213 |
| 1,281,471 |
|
| Total current assets | 1,176,969 |
| 1,535,354 |
| 1,233,558 |
| 1,535,354 |
|
| Workers' compensation collateral receivable | 27,063 |
| 31,883 |
| 39,931 |
| 31,883 |
|
| Restricted cash, cash equivalents and investments | 150,939 |
| 130,501 |
| 160,207 |
| 130,501 |
|
| Property and equipment, net | 66,827 |
| 58,622 |
| 68,470 |
| 58,622 |
|
| Goodwill | 289,207 |
| 289,207 |
| 289,207 |
| 289,207 |
|
| Other intangible assets, net | 28,408 |
| 31,074 |
| 27,108 |
| 31,074 |
|
| Other assets | 19,282 |
| 18,502 |
| 18,444 |
| 18,502 |
|
| Total assets | $ | 1,758,695 |
| $ | 2,095,143 |
| $ | 1,836,925 |
| $ | 2,095,143 |
|
| Liabilities and stockholders’ equity | |
| | |
| |
| Current liabilities: | |
| | |
| |
| Accounts payable | $ | 26,599 |
| $ | 22,541 |
| $ | 28,995 |
| $ | 22,541 |
|
| Accrued corporate wages | 38,196 |
| 30,937 |
| 31,814 |
| 30,937 |
|
| Notes and capital leases payable, net | 36,648 |
| 36,559 |
| 36,718 |
| 36,559 |
|
| Other current liabilities | 13,735 |
| 12,551 |
| 14,321 |
| 12,551 |
|
| Worksite employee related liabilities | 893,110 |
| 1,275,995 |
| 934,868 |
| 1,275,995 |
|
| Total current liabilities | 1,008,288 |
| 1,378,583 |
| 1,046,716 |
| 1,378,583 |
|
| Notes and capital leases payable, net, noncurrent | 404,157 |
| 422,495 |
| 394,972 |
| 422,495 |
|
Workers' compensation loss reserves
(net of collateral paid of $22,911 and $22,377 at June 30, 2017 and December 31, 2016, respectively) | 151,837 |
| 159,301 |
| |
Workers' compensation loss reserves
(net of collateral paid of $20,307 and $22,377 at September 30, 2017 and December 31, 2016, respectively) | | 157,999 |
| 159,301 |
|
| Deferred income taxes | 91,828 |
| 92,373 |
| 90,845 |
| 92,373 |
|
| Other liabilities | 11,072 |
| 7,801 |
| 14,534 |
| 7,801 |
|
| Total liabilities | 1,667,182 |
| 2,060,553 |
| 1,705,066 |
| 2,060,553 |
|
| Commitments and contingencies (see Note 9) |
|
|
|
|
|
|
|
|
| Stockholders’ equity: |
|
| |
|
| |
Preferred stock
($0.000025 par value per share; 20,000,000 shares authorized; no shares issued and outstanding at June 30, 2017 and December 31, 2016) | — |
| — |
| |
Common stock and additional paid-in capital
($0.000025 par value per share; 750,000,000 shares authorized; 69,429,088 and 69,015,690 shares issued and outstanding at June 30, 2017 and December 31, 2016, respectively) | 557,183 |
| 535,132 |
| |
Preferred stock
($0.000025 par value per share; 20,000,000 shares authorized; no shares issued and outstanding at September 30, 2017 and December 31, 2016) | | — |
| — |
|
Common stock and additional paid-in capital
($0.000025 par value per share; 750,000,000 shares authorized; 69,536,268 and 69,015,690 shares issued and outstanding at September 30, 2017 and December 31, 2016, respectively) | | 567,971 |
| 535,132 |
|
| Accumulated deficit | (465,146 | ) | (499,938 | ) | (435,739 | ) | (499,938 | ) |
| Accumulated other comprehensive loss | (524 | ) | (604 | ) | (373 | ) | (604 | ) |
| Total stockholders’ equity | 91,513 |
| 34,590 |
| 131,859 |
| 34,590 |
|
| Total liabilities and stockholders’ equity | $ | 1,758,695 |
| $ | 2,095,143 |
| $ | 1,836,925 |
| $ | 2,095,143 |
|
See accompanying notes.
CONDENSED CONSOLIDATED STATEMENTS OF INCOME AND COMPREHENSIVE INCOME
(Unaudited)
|
| | | | | | | | | | | | | |
| | Three Months Ended
June 30, | | Six Months Ended
June 30, |
| (in thousands, except share and per share data) | 2017 | 2016 | | 2017 | 2016 |
| Professional service revenues | $ | 108,642 |
| $ | 109,593 |
| | $ | 228,763 |
| $ | 221,996 |
|
| Insurance service revenues | 691,899 |
| 636,253 |
| | 1,379,388 |
| 1,256,789 |
|
| Total revenues | 800,541 |
| 745,846 |
| | 1,608,151 |
| 1,478,785 |
|
| Insurance costs | 599,535 |
| 596,673 |
| | 1,208,177 |
| 1,166,362 |
|
| Cost of providing services (exclusive of depreciation and amortization of intangible assets) | 50,825 |
| 44,034 |
| | 107,275 |
| 89,739 |
|
| Sales and marketing | 45,940 |
| 43,800 |
| | 95,131 |
| 92,508 |
|
| General and administrative | 28,224 |
| 18,951 |
| | 53,526 |
| 46,601 |
|
| Systems development and programming | 11,415 |
| 6,457 |
| | 22,455 |
| 12,846 |
|
| Amortization of intangible assets | 1,316 |
| 5,005 |
| | 2,666 |
| 9,985 |
|
| Depreciation | 6,451 |
| 4,559 |
| | 12,599 |
| 8,475 |
|
| Total costs and operating expenses | 743,706 |
| 719,479 |
| | 1,501,829 |
| 1,426,516 |
|
| Operating income | 56,835 |
| 26,367 |
| | 106,322 |
| 52,269 |
|
| Other income (expense): | | | | | |
| Interest expense and bank fees | (4,857 | ) | (5,038 | ) | | (9,605 | ) | (10,080 | ) |
| Other, net | 271 |
| 163 |
| | 422 |
| 121 |
|
| Income before provision for income taxes | 52,249 |
| 21,492 |
| | 97,139 |
| 42,310 |
|
| Income tax expense | 12,298 |
| 9,210 |
| | 28,451 |
| 18,451 |
|
| Net income | $ | 39,951 |
| $ | 12,282 |
| | $ | 68,688 |
| $ | 23,859 |
|
| Other comprehensive income, net of tax | 68 |
| 74 |
| | 80 |
| 425 |
|
| Comprehensive income | $ | 40,019 |
| $ | 12,356 |
| | $ | 68,768 |
| $ | 24,284 |
|
| | | | | | |
| Net income per share: | | | | | |
| Basic | $ | 0.58 |
| $ | 0.17 |
| | $ | 1.00 |
| $ | 0.34 |
|
| Diluted | $ | 0.56 |
| $ | 0.17 |
| | $ | 0.97 |
| $ | 0.33 |
|
| Weighted average shares: | | | | |
| |
| Basic | 69,029,749 |
| 70,728,934 |
| | 68,770,976 |
| 70,625,000 |
|
| Diluted | 71,167,177 |
| 72,319,992 |
| | 71,101,716 |
| 72,022,065 |
|
See accompanying notes.
CONDENSED CONSOLIDATED STATEMENTS OF CASH FLOWSINCOME AND COMPREHENSIVE INCOME
(Unaudited)
|
| | | | | | |
| | Six Months Ended
June 30, |
| (in thousands) | 2017 | 2016 |
| Operating activities | | |
| Net income | $ | 68,688 |
| $ | 23,859 |
|
| Adjustments to reconcile net income to net cash provided by operating activities: | | |
| Depreciation and amortization | 16,496 |
| 17,919 |
|
| Stock-based compensation | 13,706 |
| 13,905 |
|
| Changes in operating assets and liabilities: | | |
| Restricted cash and cash equivalents | (31,982 | ) | (21,041 | ) |
| Prepaid income taxes | 27,665 |
| (2,863 | ) |
| Prepaid expenses and other current assets | (2,601 | ) | (5,033 | ) |
| Workers' compensation collateral receivable | 4,820 |
| (10,599 | ) |
| Other assets | 91 |
| 238 |
|
| Accounts payable | 4,002 |
| 2,488 |
|
| Accrued corporate wages and other current liabilities | 8,299 |
| (719 | ) |
| Workers' compensation loss reserves and other non-current liabilities | (5,061 | ) | 25,792 |
|
| Worksite employee related assets | 382,875 |
| 425,815 |
|
| Worksite employee related liabilities | (382,885 | ) | (426,094 | ) |
| Net cash provided by operating activities | 104,113 |
| 43,667 |
|
| Investing activities | | |
| Acquisitions of businesses | — |
| (300 | ) |
| Purchases of marketable securities | — |
| (14,959 | ) |
| Proceeds from maturity of marketable securities | 11,469 |
| 24,998 |
|
| Acquisitions of property and equipment | (20,725 | ) | (16,714 | ) |
| Net cash used in investing activities | (9,256 | ) | (6,975 | ) |
| Financing activities | | |
| Repurchase of common stock | (29,510 | ) | (16,459 | ) |
| Proceeds from issuance of common stock on exercised options | 5,586 |
| 2,220 |
|
| Proceeds from issuance of common stock on employee stock purchase plan | 2,441 |
| 2,304 |
|
| Awards effectively repurchased for required employee withholding taxes | (4,507 | ) | (1,485 | ) |
| Repayment of notes and capital leases payable | (19,151 | ) | (22,810 | ) |
| Net cash used in financing activities | (45,141 | ) | (36,230 | ) |
| Effect of exchange rate changes on cash and cash equivalents | 163 |
| 24 |
|
| Net increase in cash and cash equivalents | 49,879 |
| 486 |
|
| Cash and cash equivalents at beginning of period | 184,004 |
| 166,178 |
|
| Cash and cash equivalents at end of period | $ | 233,883 |
| $ | 166,664 |
|
| | | |
| Supplemental disclosures of cash flow information | | |
| Interest paid | $ | 8,006 |
| $ | 8,091 |
|
| Income taxes paid (refunded), net | (169 | ) | 21,374 |
|
| Supplemental schedule of noncash investing and financing activities | | |
| Payable for purchase of property and equipment | $ | 1,580 |
| $ | 1,581 |
|
|
| | | | | | | | | | | | | |
| | Three Months Ended
September 30, | | Nine Months Ended
September 30, |
| (in thousands, except share and per share data) | 2017 | 2016 | | 2017 | 2016 |
| Professional service revenues | $ | 112,530 |
| $ | 110,493 |
| | $ | 341,293 |
| $ | 332,489 |
|
| Insurance service revenues | 706,763 |
| 659,964 |
| | 2,086,151 |
| 1,916,753 |
|
| Total revenues | 819,293 |
| 770,457 |
| | 2,427,444 |
| 2,249,242 |
|
| Insurance costs | 613,397 |
| 609,422 |
| | 1,821,574 |
| 1,775,784 |
|
| Cost of providing services (exclusive of depreciation and amortization of intangible assets) | 49,989 |
| 50,142 |
| | 157,264 |
| 139,881 |
|
| Sales and marketing | 44,407 |
| 41,470 |
| | 139,538 |
| 133,978 |
|
| General and administrative | 28,505 |
| 22,477 |
| | 82,031 |
| 69,078 |
|
| Systems development and programming | 11,182 |
| 8,124 |
| | 33,637 |
| 20,970 |
|
| Amortization of intangible assets | 1,300 |
| 4,662 |
| | 3,966 |
| 14,647 |
|
| Depreciation | 7,754 |
| 5,188 |
| | 20,353 |
| 13,663 |
|
| Total costs and operating expenses | 756,534 |
| 741,485 |
| | 2,258,363 |
| 2,168,001 |
|
| Operating income | 62,759 |
| 28,972 |
| | 169,081 |
| 81,241 |
|
| Other income (expense): | | | | | |
| Interest expense and bank fees | (5,425 | ) | (5,597 | ) | | (15,030 | ) | (15,677 | ) |
| Other, net | 770 |
| 313 |
| | 1,192 |
| 434 |
|
| Income before provision for income taxes | 58,104 |
| 23,688 |
| | 155,243 |
| 65,998 |
|
| Income tax expense | 15,268 |
| 9,107 |
| | 43,719 |
| 27,558 |
|
| Net income | $ | 42,836 |
| $ | 14,581 |
| | $ | 111,524 |
| $ | 38,440 |
|
| Other comprehensive income, net of tax | 151 |
| (125 | ) | | 231 |
| 300 |
|
| Comprehensive income | $ | 42,987 |
| $ | 14,456 |
| | $ | 111,755 |
| $ | 38,740 |
|
| | | | | | |
| Net income per share: | | | | | |
| Basic | $ | 0.62 |
| $ | 0.21 |
| | $ | 1.62 |
| $ | 0.55 |
|
| Diluted | $ | 0.60 |
| $ | 0.20 |
| | $ | 1.57 |
| $ | 0.53 |
|
| Weighted average shares: | | | | |
| |
| Basic | 69,498,218 |
| 70,187,989 |
| | 69,016,054 |
| 70,478,266 |
|
| Diluted | 71,499,591 |
| 71,964,603 |
| | 71,138,743 |
| 72,126,060 |
|
See accompanying notes.
CONDENSED CONSOLIDATED STATEMENTS OF CASH FLOWS
(Unaudited)
|
| | | | | | |
| | Nine Months Ended
September 30, |
| (in thousands) | 2017 | 2016 |
| Operating activities | | |
| Net income | $ | 111,524 |
| $ | 38,440 |
|
| Adjustments to reconcile net income to net cash provided by operating activities: | | |
| Depreciation and amortization | 26,177 |
| 27,810 |
|
| Stock-based compensation | 21,406 |
| 20,169 |
|
| Changes in operating assets and liabilities: | | |
| Restricted cash and cash equivalents | (45,570 | ) | (31,409 | ) |
| Prepaid income taxes | 42,448 |
| 386 |
|
| Prepaid expenses and other current assets | (961 | ) | (5,253 | ) |
| Workers' compensation collateral receivable | (8,048 | ) | (11,374 | ) |
| Other assets | 925 |
| 438 |
|
| Accounts payable | 5,505 |
| 4,538 |
|
| Accrued corporate wages and other current liabilities | 2,331 |
| 4,548 |
|
| Workers' compensation loss reserves and other non-current liabilities | 3,574 |
| 33,510 |
|
| Worksite employee related assets | 340,767 |
| 525,841 |
|
| Worksite employee related liabilities | (341,127 | ) | (526,945 | ) |
| Net cash provided by operating activities | 158,951 |
| 80,699 |
|
| Investing activities | | |
| Acquisitions of businesses | — |
| (300 | ) |
| Purchases of marketable securities | — |
| (14,959 | ) |
| Proceeds from maturity of marketable securities | 14,447 |
| 25,790 |
|
| Acquisitions of property and equipment | (29,210 | ) | (27,942 | ) |
| Net cash used in investing activities | (14,763 | ) | (17,411 | ) |
| Financing activities | | |
| Repurchase of common stock | (39,347 | ) | (43,747 | ) |
| Proceeds from issuance of common stock on exercised options | 8,678 |
| 3,584 |
|
| Proceeds from issuance of common stock on employee stock purchase plan | 2,441 |
| 2,304 |
|
| Awards effectively repurchased for required employee withholding taxes | (8,100 | ) | (2,672 | ) |
| Proceeds from issuance of notes payable | — |
| 57,978 |
|
| Payments for extinguishment of debt | — |
| (57,563 | ) |
| Repayment of notes and capital leases payable | (28,735 | ) | (27,506 | ) |
| Payment of debt issuance costs | — |
| (1,376 | ) |
| Net cash used in financing activities | (65,063 | ) | (68,998 | ) |
| Effect of exchange rate changes on cash and cash equivalents | 398 |
| 90 |
|
| Net increase in cash and cash equivalents | 79,523 |
| (5,620 | ) |
| Cash and cash equivalents at beginning of period | 184,004 |
| 166,178 |
|
| Cash and cash equivalents at end of period | $ | 263,527 |
| $ | 160,558 |
|
| | | |
| Supplemental disclosures of cash flow information | | |
| Interest paid | $ | 12,186 |
| $ | 11,651 |
|
| Income taxes paid (refunded), net | (138 | ) | 27,650 |
|
| Supplemental schedule of noncash investing and financing activities | | |
| Payable for purchase of property and equipment | $ | 2,450 |
| $ | 1,363 |
|
See accompanying notes.
NOTES TO CONDENSED CONSOLIDATED FINANCIAL STATEMENTS
(Unaudited)
NOTE 1. DESCRIPTION OF BUSINESS AND SIGNIFICANT ACCOUNTING POLICIES
Description of Business
TriNet Group Inc. (TriNet, or the Company, we, our and us), a professional employer organization (PEO) founded in 1988, provides comprehensive human resources (HR) solutions for small to midsize businesses (SMBs) under a co-employment model. These HR solutions include bundled services, such as multi-state payroll processing and tax administration, employee benefits programs, including health insurance and retirement plans, workers' compensation insurance and claims management, employment and benefit law compliance, and other services. Through the co-employment relationship, we are the employer of record for most administrative and regulatory purposes, including:
compensation through wages and salaries,
employer payroll-related taxes payment,
employee payroll-related taxes withholding and payment,
employee benefit programs including health and life insurance, and others, and
workers' compensation coverage.
Our clients are responsible for the day-to-day job responsibilities of the worksite employees (WSEs).
We operate in one reportable segment. All of our service revenues are generated from external clients. Less than 1% of revenue is generated outside of the U.S.
Basis of Presentation
These unaudited condensed consolidated financial statements (Financial Statements) and accompanying notes have been prepared in accordance with accounting principles generally accepted in the United States of America (GAAP) for interim financial reporting and the instructions to Form 10-Q and Rule 10-01 of Regulation S-X of the Rules and Regulations of the Securities and Exchange Commission (SEC). Certain information and note disclosures included in the annual financial statements prepared in accordance with GAAP have been condensed or omitted pursuant to such rules and regulations. In the opinion of management, the condensed consolidated financial statements reflect all adjustments, which are normal and recurring in nature, necessary for fair financial statement presentation. The results of operations for the secondthird quarter of 2017 are not necessarily indicative of the operating results anticipated for the full year. These Financial Statements should be read in conjunction with the audited Consolidated Financial Statements included in Part II, Item 8 of our Annual Report on Form 10-K for the year ended December 31, 2016 (2016 Form 10-K).
Use of Estimates
The preparation of financial statements in conformity with GAAP requires us to make estimates and assumptions that affect certain reported amounts and related disclosures. Significant estimates include:
liability for unpaid losses and loss adjustment expenses (loss reserves) related to workers' compensation and workers' compensation collateral receivable,
health insurance loss reserves,
liability for insurance premiums payable,
impairments of goodwill and other intangible assets,
income tax assets and liabilities, and
liability for legal contingencies.
These estimates are based on historical experience and on various other assumptions that we believe to be reasonable from the facts available to us. Some of the assumptions are highly uncertain at the time of estimation. To the extent actual experience differs from the assumptions used, our consolidated financial statements could be materially affected.
Recent Accounting Pronouncements
Recently adopted accounting guidance
Share-based payments - In March 2016, the FASB issued ASU 2016-09-Stock Compensation (Topic 718): Improvements to Employee Share-Based Payment Accounting, as part of the Simplification Initiative to simplify certain aspects of the accounting for share-based payment transactions to employees. The new standard requires excess tax benefits and tax deficiencies to be recorded in the statements of income as a component of the provision for income taxes when stock awards vest or are settled. In addition, it eliminates the requirement to reclassify cash flows related to excess tax benefits from operating activities to financing activities on the condensed consolidated statements of cash flows. The standard also provides an accounting policy election to account for forfeitures as they occur, allows us to withhold more of an employee’s vesting shares for tax withholding purposes without triggering liability accounting, and clarifies that all cash payments made to tax authorities on an employee’s behalf for withheld shares should be presented as a financing activity on our cash flows statement. The new standard was effective for us beginning January 1, 2017.
Upon adoption, excess tax benefits or deficiencies from share-based award activity were reflected in the condensed consolidated statements of income as a component of the provision for income taxes, whereas they previously were recognized in equity. We also elected to account for forfeitures as they occur, rather than estimate expected forfeitures. The adoption of ASU 2016-09 resulted in a net cumulative-effect adjustment of $0.3 million, reflected as an increase to retained earnings as of January 1, 2017, mostly related to the recognition of the previously unrecognized excess tax benefits using the modified retrospective method. The previously unrecognized excess tax effects were recorded as an increase to deferred tax assets.
We adopted the aspects of the standard affecting the cash flow presentation retrospectively, and accordingly, to conform to the current year presentation, we reclassified $0.72.6 million of tax deficiencies under financing activities to operating activities for the period ended JuneSeptember 30, 2016, on our condensed consolidated statements of cash flows. The presentation requirements for cash flows related to employee taxes paid for withheld shares had no impact to any of the periods presented on our condensed consolidated statements of cash flows since such cash flows have historically been presented as a financing activity.
Recently issued accounting pronouncements
Lease arrangements - In February 2016, the FASB issued ASU 2016-02-Leases. The amendment requires that lease arrangements longer than 12 months result in an entity recognizing lease assets and lease liabilities. Most significant impact is on those leases classified as operating leases under previous U.S. GAAP. Under the new standard, disclosures are required to meet the objective of enabling users of financial statements to assess the amount, timing, and uncertainty of cash flows arising from leases.
The amendment is effective for annual reporting periods, and interim periods within those years beginning after December 15, 2018. We currently anticipate adoption of the new standard effective January 1, 2019.
We anticipate this standard will have a material impact on our condensed consolidated financial statements. While we are continuing to assess all potential impacts of the standard, we currently believe the most significant impact relates to our accounting for equipment, office and data-center operating leases.
Financial Instruments - In January 2016, the FASB issued ASU 2016-01-Recognition and Measurement of Financial Assets and Financial Liabilities. The amendment addresses various aspects of the recognition, measurement, presentation, and disclosure for financial instruments. The amendment is effective for annual reporting periods, and interim periods within those years beginning after December 15, 2017. Early adoption by public entities is permitted only for certain provisions. We are currently in the process of evaluating the impact of the adoption of this standard on our condensed consolidated financial statements.
Revenue Recognition - In May 2014, the FASB issued ASU 2014-09-Revenue from Contracts with Customers, which will replace most existing revenue recognition guidance under GAAP. The core principle of the guidance is that an entity should recognize revenue for the transfer of promised goods or services to customers that reflects the consideration to which the entity expects to be entitled in exchange for those goods or services. The standard provides a five-step analysis of transactions to determine when and how revenue is recognized. In July 2015, the FASB deferred the effective date to annual reporting periods, and interim periods within those years, beginning after December 15, 2017. Early adoption at the original effective date of December 15, 2016 is permitted. The amendments may be applied retrospectively or as a cumulative-effect adjustment as of the date of adoption. In March, April and May 2016, the FASB issued ASU 2016-08 Principal versus Agent Considerations (Reporting Revenue Gross versus Net), ASU 2016-10 Identifying Performance Obligations and Licensing, ASU 2016-12 Narrow-Scope Improvements and Practical Expedients and ASU 2016-20 Technical Corrections and Improvements, respectively, providing further clarification to be considered when implementing ASU 2014-09. The guidance permits two methods of adoption: retrospectively to each prior reporting period presented (full retrospective method), or retrospectively with the cumulative effect of initially applying the guidance recognized at the date of initial application (the modified retrospective method). We currently anticipate adopting the new standard effective beginning January 1, 2018 using the modified retrospective method.
Under the modified retrospective method, the new standard will be applied to all contracts initiated on or after the effective date. For contracts with remaining obligations as of the effective date, opening retained earnings will be adjusted for the cumulative effect of the change to the new standard as of the effective date.
We anticipate this standard will have a material impact on our condensed consolidated financial statements. While we are continuingdo not anticipate this standard will result in a material adjustment to assess all potential impacts of thebeginning balance retained earnings, we do anticipate this standard will have a material impact on our condensed consolidated financial statements on a prospective basis. Specifically, we currently believe the adoption will have a material impact on our accounting for sales commission expense, deferred revenue, income tax provision and deferred taxes. We anticipate that certain client acquisition costs will be deferred over the expected client tenure. We expect our professional service revenues and insurance service revenues will remain substantially unchanged. The actual revenue recognition treatment required under the standard will be dependent on contract specific terms, and may vary in some instances from recognition at the time of billing.
At the date of adoption, we expect to record a net cumulative effect adjustment in retained earnings associated with unamortized deferred revenue and sales commission related to any open customer contracts as of adoption date.
Statement of Cash Flows - In November and August 2016, the FASB issued (ASU) 2016-18 - Statement of Cash Flows (Topic 230): Restricted Cash and 2016-15-Statement of Cash Flows (Topic 230): Classification of Certain Cash Receipts and Cash Payments. The new guidance is intended to reduce diversity in practice in how restricted cash and other certain transactions are classified in the statement of cash flows. The amendments are effective for annual reporting periods, and interim periods within those years, beginning after December 15, 2017. Early adoption is permitted, provided that all of the amendments are adopted in the same period. The guidance requires application using a retrospective transition method.
As of JuneSeptember 30, 2017 and December 31, 2016, we had total restricted cash, restricted cash equivalents and payroll funds collected of $741.1$748.5 million and $1.0 billion, respectively. Currently, changes in these balances are presented as operating cash activities in the condensed consolidated statements of cash flows. Under the new guidance, changes in these amounts will be included with cash and cash equivalents when reconciling the beginning-of-period and end-of-period total amounts shown on the condensed consolidated statements of cash flows.
Although there are several other new accounting pronouncements issued or proposed by the FASB, which we have adopted or will adopt, as applicable, we do not believe any of these other accounting pronouncements have had or will have a material impact on its consolidated financial position, operating results or statements of cash flows.
NOTE 2. CASH, CASH EQUIVALENTS AND INVESTMENTS
Under the terms of the agreements with certain of our workers' compensation and health benefit insurance carriers, we are required to maintain collateral in trust accounts for the benefit of specified insurance carriers and to reimburse the carriers’ claim payments within our deductible layer. We invest a portion of the collateral amounts in marketable securities. We report the current portion of these trust accounts as restricted cash and cash equivalents in WSE related assets, and the long termlong-term portion as restricted cash, cash equivalents and investments on the condensed consolidated balance sheets.
We require our clients to prefund their payroll and related taxes and other withholding liabilities before payroll is processed or due for payment. These amounts that are prefunded by clients are included in WSE related assets as payroll funds collected and are designated to pay pending payrolls and other WSE related liabilities.
Our total corporate and WSE related cash, cash equivalents and investments are summarized below:
| | | | June 30, 2017 | December 31, 2016 | September 30, 2017 | December 31, 2016 |
| (in thousands) | Cash and cash equivalents | Available for sale marketable securities | Certificate of deposits | Total | Cash and cash equivalents | Available for sale marketable securities | Certificate of deposits | Total | Cash and cash equivalents | Available for sale marketable securities | Certificate of deposits | Total | Cash and cash equivalents | Available for sale marketable securities | Certificate of deposits | Total |
| Cash and cash equivalents | $ | 233,883 |
| $ | — |
| $ | — |
| $ | 233,883 |
| $ | 184,004 |
| $ | — |
| $ | — |
| $ | 184,004 |
| $ | 263,527 |
| $ | — |
| $ | — |
| $ | 263,527 |
| $ | 184,004 |
| $ | — |
| $ | — |
| $ | 184,004 |
|
| Restricted cash and cash equivalents | 14,589 |
| — |
| — |
| 14,589 |
| 14,569 |
| — |
| — |
| 14,569 |
| 15,445 |
| — |
| — |
| 15,445 |
| 14,569 |
| — |
| — |
| 14,569 |
|
| Restricted cash, cash equivalents and investments, noncurrent | |
|
| |
|
|
| Collateral for workers' compensation claims | 111,141 |
| 39,798 |
| — |
| 150,939 |
| 78,672 |
| 51,829 |
| — |
| 130,501 |
| 123,366 |
| 36,841 |
| — |
| 160,207 |
| 78,672 |
| 51,829 |
| — |
| 130,501 |
|
| Worksite employee related assets | |
|
| |
|
| |
|
| |
|
|
| Restricted cash, cash equivalents and investments, current | |
|
| |
|
| |
|
| |
|
|
| Collateral for health benefits claims | 68,907 |
| — |
| — |
| 68,907 |
| 65,022 |
| — |
| — |
| 65,022 |
| 68,907 |
| — |
| — |
| 68,907 |
| 65,022 |
| — |
| — |
| 65,022 |
|
| Collateral for workers' compensation claims | 83,555 |
| 507 |
| — |
| 84,062 |
| 64,773 |
| — |
| — |
| 64,773 |
| 85,284 |
| 508 |
| — |
| 85,792 |
| 64,773 |
| — |
| — |
| 64,773 |
|
| Collateral to secure standby letter of credit | — |
| — |
| 2,322 |
| 2,322 |
| — |
| — |
| 2,320 |
| 2,320 |
| — |
| — |
| 2,324 |
| 2,324 |
| — |
| — |
| 2,320 |
| 2,320 |
|
| Total WSE related restricted cash, cash equivalents and investments, current | 152,462 |
| 507 |
| 2,322 |
| 155,291 |
| 129,795 |
| — |
| 2,320 |
| 132,115 |
| 154,191 |
| 508 |
| 2,324 |
| 157,023 |
| 129,795 |
| — |
| 2,320 |
| 132,115 |
|
| Payroll funds collected | 462,902 |
| — |
| — |
| 462,902 |
| 825,958 |
| — |
| — |
| 825,958 |
| 455,494 |
| — |
| — |
| 455,494 |
| 825,958 |
| — |
| — |
| 825,958 |
|
| Total | $ | 974,977 |
| $ | 40,305 |
| $ | 2,322 |
| $ | 1,017,604 |
| $ | 1,232,998 |
| $ | 51,829 |
| $ | 2,320 |
| $ | 1,287,147 |
| $ | 1,012,023 |
| $ | 37,349 |
| $ | 2,324 |
| $ | 1,051,696 |
| $ | 1,232,998 |
| $ | 51,829 |
| $ | 2,320 |
| $ | 1,287,147 |
|
NOTE 3. WORKSITE EMPLOYEE RELATED ASSETS AND LIABILITIES
WSE related assets and WSE related liabilities are intended to be reviewed together when considering the financial position of the Company. Our clients direct the price and service specifications for payroll and payroll taxes and as a result, we are not the primary obligor for payroll and payroll tax payments and therefore record these amounts net in our statements of income and comprehensive income. However, we record without offset, accrued wages and payroll tax liabilities for WSEs in WSE related liabilities with the related payroll funds collected and unbilled revenues in WSE related assets. We have classified these assets and liabilities and other service related amounts collectively as WSE related, to present a clearer picture of the inter-relationship of the balances and distinguish these from our other corporate assets and liabilities.
In addition to unbilled revenues, accrued wages and payroll tax liabilities, other significant balances included in the WSE related assets and liabilities include:
Payroll funds collected, which represents cash collected from clients in advance to fund payroll and payroll taxes, and other payroll related liabilities;
Other payroll assets, which primarily include payroll tax receivables;
Client deposits, which represents indemnity guarantee payments received from clients and collections from clients in excess of payroll and other payroll related liabilities;
Other payroll withholdings, which primarily includes withholdings under 401(k) plans and flexible benefit plans.
| | | (in thousands) | June 30,
2017 | December 31,
2016 | September 30,
2017 | December 31,
2016 |
| Worksite employee related assets: | | |
| Restricted cash, cash equivalents and investments | $ | 155,291 |
| $ | 132,115 |
| $ | 157,023 |
| $ | 132,115 |
|
| Payroll funds collected | 462,902 |
| 825,958 |
| 455,494 |
| 825,958 |
|
Unbilled revenue (net of advance collections of $17,420
and $8,602 at June 30, 2017 and December 31, 2016,
respectively) | 247,751 |
| 293,192 |
| |
Accounts receivable (net of allowance for doubtful accounts of
$160 and $292 at June 30, 2017 and December 31, 2016,
respectively) | 7,644 |
| 4,854 |
| |
Unbilled revenue (net of advance collections of $10,038
and $8,602 at September 30, 2017 and December 31, 2016,
respectively) | | 284,136 |
| 293,192 |
|
Accounts receivable (net of allowance for doubtful accounts of
$304 and $292 at September 30, 2017 and December 31, 2016,
respectively) | | 5,912 |
| 4,854 |
|
| Prepaid insurance premiums | 15,253 |
| 12,805 |
| 27,200 |
| 12,805 |
|
| Workers' compensation collateral receivable | 190 |
| 2,136 |
| 1,417 |
| 2,136 |
|
| Other payroll assets | 9,565 |
| 10,411 |
| 10,031 |
| 10,411 |
|
| Total worksite employee related assets | $ | 898,596 |
| $ | 1,281,471 |
| $ | 941,213 |
| $ | 1,281,471 |
|
| | | |
| Worksite employee related liabilities: | | |
| | |
|
| Accrued wages | $ | 246,802 |
| $ | 272,966 |
| $ | 274,123 |
| $ | 272,966 |
|
| Client deposits | 35,147 |
| 56,182 |
| 28,096 |
| 56,182 |
|
| Payroll tax liabilities | 352,184 |
| 692,460 |
| 368,207 |
| 692,460 |
|
| Unpaid losses and loss adjustment expenses (less than 1 year): | | |
| Health benefits loss reserves | 125,241 |
| 129,430 |
| 129,681 |
| 129,430 |
|
| Workers' compensation loss reserves (net of collateral paid of $9,124 and $9,234 at June 30, 2017 and December 31, 2016, respectively) | 70,812 |
| 63,702 |
| |
| Workers' compensation loss reserves (net of collateral paid of $7,105 and $9,234 at September 30, 2017 and December 31, 2016, respectively) | | 63,683 |
| 63,702 |
|
| Insurance premiums and other payables | 17,264 |
| 14,223 |
| 25,654 |
| 14,223 |
|
| Other payroll withholdings | 45,660 |
| 47,032 |
| 45,424 |
| 47,032 |
|
| Total worksite employee related liabilities | $ | 893,110 |
| $ | 1,275,995 |
| $ | 934,868 |
| $ | 1,275,995 |
|
Included in the payroll tax liabilities and insurance premiums and other payables were amounts relating to approximately 2,700 and 2,600 corporate employees at JuneSeptember 30, 2017 and December 31, 2016, respectively.
NOTE 4. WORKERS' COMPENSATION LOSS RESERVES
The following table summarizes the workers’ compensation loss reserve activity for the three and sixnine months ended JuneSeptember 30, 2017 and 2016:
| | | | Three Months Ended
June 30, | | Six Months Ended
June 30, | Three Months Ended
September 30, | | Nine Months Ended
September 30, |
| (in thousands) | 2017 | 2016 | | 2017 | 2016 | 2017 | 2016 | | 2017 | 2016 |
| Total loss reserves, beginning of period | $ | 260,308 |
| $ | 200,152 |
| | $ | 254,614 |
| $ | 190,102 |
| $ | 254,684 |
| $ | 214,711 |
| | $ | 254,614 |
| $ | 190,102 |
|
| Incurred | | | | | | |
| Current year | 20,191 |
| 28,572 |
| | 47,127 |
| 51,346 |
| 22,618 |
| 26,717 |
| | 69,745 |
| 78,063 |
|
| Prior years | 896 |
| 2,741 |
| | 1,497 |
| 8,004 |
| (4,294 | ) | 4,947 |
| | (2,797 | ) | 12,951 |
|
| Total incurred | 21,087 |
| 31,313 |
| | 48,624 |
| 59,350 |
| 18,324 |
| 31,664 |
| | 66,948 |
| 91,014 |
|
| Paid | | | | | | |
| Current year | (5,377 | ) | (1,567 | ) | | (5,637 | ) | (2,278 | ) | (3,464 | ) | (6,738 | ) | | (9,101 | ) | (9,016 | ) |
| Prior years | (21,334 | ) | (15,187 | ) | | (42,917 | ) | (32,463 | ) | (20,450 | ) | (17,130 | ) | | (63,367 | ) | (49,593 | ) |
| Total paid | (26,711 | ) | (16,754 | ) | | (48,554 | ) | (34,741 | ) | (23,914 | ) | (23,868 | ) | | (72,468 | ) | (58,609 | ) |
| Total loss reserves, end of period | $ | 254,684 |
| $ | 214,711 |
| | $ | 254,684 |
| $ | 214,711 |
| $ | 249,094 |
| $ | 222,507 |
| | $ | 249,094 |
| $ | 222,507 |
|
The following summarizes workers' compensation liabilities on the condensed consolidated balance sheets:
| | | (in thousands) | June 30,
2017 | December 31,
2016 | September 30,
2017 | December 31,
2016 |
| Total loss reserves, end of period | $ | 254,684 |
| $ | 254,614 |
| $ | 249,094 |
| $ | 254,614 |
|
| Collateral paid to carriers and offset against loss reserves | (32,035 | ) | (31,611 | ) | (27,412 | ) | (31,611 | ) |
| Total loss reserves, net of carrier collateral offset | $ | 222,649 |
| $ | 223,003 |
| $ | 221,682 |
| $ | 223,003 |
|
| | | |
Payable in less than 1 year (1)
(net of collateral paid to carriers of $9,124 and $9,234 at June 30, 2017 and December 31, 2016, respectively) | $ | 70,812 |
| $ | 63,702 |
| |
Payable in more than 1 year
(net of collateral paid to carriers of $22,911 and $22,377 at June 30, 2017 and December 31, 2016, respectively) | 151,837 |
| 159,301 |
| |
Payable in less than 1 year (1)
(net of collateral paid to carriers of $7,105 and $9,234 at September 30,
2017 and December 31, 2016, respectively) | | $ | 63,683 |
| $ | 63,702 |
|
Payable in more than 1 year
(net of collateral paid to carriers of $20,307 and $22,377 at September 30, 2017 and December 31, 2016, respectively) | | 157,999 |
| 159,301 |
|
Total loss reserves, net of carrier collateral offset
| $ | 222,649 |
| $ | 223,003 |
| $ | 221,682 |
| $ | 223,003 |
|
(1) Included in WSE related liabilities within Note 3 to these condensed consolidated financial statements.
Incurred claims related to prior years represent changes in estimates for ultimate losses on workers' compensation claims. For the three and the sixnine months ended JuneSeptember 30, 2017, the favorable developmentchange was primarily due to lower than expected frequency of reportedfavorable claims development associated with our office WSEs, partially offset by increased severity of reported claims with our non-office WSEs in recent accident years.
As of JuneSeptember 30, 2017 and December 31, 2016, we had $59.3$68.8 million and $65.6 million, respectively, of collateral held by insurance carriers of which $32.0$27.4 million and $31.6 million, respectively, was offset against workers' compensation loss reserves as the agreements permit and are net settled of insurance obligations against collateral held. Collateral paid to each carrier for a policy year in excess of our loss reserves areis recorded as workers' compensation collateral receivable.
NOTE 5. FINANCIAL INSTRUMENTS AND FAIR VALUE MEASUREMENTS
Cash, Cash equivalents and Restricted Investments
We classify our cash, cash equivalents and restricted investments in marketable securities within Level I in the fair value hierarchy because we use quoted market prices to determine the fair value. We classify our certificates of deposit within Level II in the fair value hierarchy as we use a market approach that compares fair values on certificates with similar maturities. We have no available for sale securities included in Level III as of JuneSeptember 30, 2017 and December 31, 2016. There was no transfer of any assets and liabilities between Levels during the threenine months ended JuneSeptember 30, 2017 or the year ended December 31, 2016.
The following table summarizes our investments by significant categories and fair value measurements on a recurring basis as of JuneSeptember 30, 2017 and December 31, 2016.
| | | (in thousands) | Maturity (in years) | Amortized Cost | Gross Unrealized Gains | Gross Unrealized Losses | Fair Value | Maturity (in years) | Amortized Cost | Gross Unrealized Gains | Gross Unrealized Losses | Fair Value |
| June 30, 2017 | | | |
| September 30, 2017 | | | |
| Level 1: | | | | |
| Investments: | | | | |
| U.S. treasuries | < 3 | $ | 39,900 |
| $ | 5 |
| $ | (107 | ) | $ | 39,798 |
| < 3 | $ | 36,916 |
| $ | — |
| $ | (75 | ) | $ | 36,841 |
|
| Mutual funds | N/A | 500 |
| 7 |
| — |
| 507 |
| N/A | 500 |
| 8 |
| — |
| 508 |
|
| Total investments | | $ | 40,400 |
| $ | 12 |
| $ | (107 | ) | $ | 40,305 |
| | $ | 37,416 |
| $ | 8 |
| $ | (75 | ) | $ | 37,349 |
|
| Level 2: | | | | |
| Certificates of deposit | < 1 | $ | 2,322 |
| $ | — |
| $ | — |
| $ | 2,322 |
| < 1 | $ | 2,324 |
| $ | — |
| $ | — |
| $ | 2,324 |
|
| Total | | $ | 42,722 |
| $ | 12 |
| $ | (107 | ) | $ | 42,627 |
| | $ | 39,740 |
| $ | 8 |
| $ | (75 | ) | $ | 39,673 |
|
| | | | | |
| December 31, 2016 | | | | |
| Level 1: | | | | |
| Investments: | | | | |
| U.S. treasuries | < 3 | $ | 51,376 |
| $ | 25 |
| $ | (77 | ) | $ | 51,324 |
| < 3 | $ | 51,376 |
| $ | 25 |
| $ | (77 | ) | $ | 51,324 |
|
| Mutual funds | N/A | 500 |
| 5 |
| — |
| 505 |
| N/A | 500 |
| 5 |
| — |
| 505 |
|
| Total investments | | $ | 51,876 |
| $ | 30 |
| $ | (77 | ) | $ | 51,829 |
| | $ | 51,876 |
| $ | 30 |
| $ | (77 | ) | $ | 51,829 |
|
| Level 2: | | | | |
| Certificates of deposit | < 1 | $ | 2,320 |
| $ | — |
| $ | — |
| $ | 2,320 |
| < 1 | $ | 2,320 |
| $ | — |
| $ | — |
| $ | 2,320 |
|
| Total | | $ | 54,196 |
| $ | 30 |
| $ | (77 | ) | $ | 54,149 |
| | $ | 54,196 |
| $ | 30 |
| $ | (77 | ) | $ | 54,149 |
|
There were no realized gains or losses for the sixnine months ended JuneSeptember 30, 2017 and 2016. We had $0.1 million gross unrealized losses in our U.S. Treasury securities as of JuneSeptember 30, 2017 and December 31, 2016, respectively.2016. The fair value of these securities in an unrealized loss position represented 87%100% and 58% of the total fair value of all U.S. Treasury securities as of JuneSeptember 30, 2017 and December 31, 2016, respectively.
Unrealized losses are principally caused by changes in interest rates. In analyzing an issuer's financial condition, we consider whether the securities are issued by the federal government or its agencies, whether downgrades by bond rating agencies have occurred, and industry analysts' reports. As we have the ability and intent to hold these available for sale marketable securities until maturity, or for the foreseeable future, no decline was deemed to be other-than-temporary.
Notes Payable
The carrying value of our notes payable at JuneSeptember 30, 2017 and December 31, 2016 was $443.8$434.3 million and $462.9 million, respectively. The estimated fair values of our notes payable at JuneSeptember 30, 2017 and December 31, 2016 were $446.0$437.7 million and $462.9 million, respectively. These valuations are considered Level II in the hierarchy for fair value measurement and are based on quoted market prices.
NOTE 6: STOCKHOLDERS’ EQUITY
Equity-Based Incentive Plans
Equity-based incentive plans include stock options, restricted stock units (time-based and performance-based) and other stock awards. The number of shares available for grant under these plans as of JuneSeptember 30, 2017 was 8.9 million.
The following table summarizes stock option activity under our equity-based plans for the sixnine months ended JuneSeptember 30, 2017:
|
| | |
| | Number
of Shares |
| Balance at December 31, 2016 | 2,815,224 |
|
| Granted | — |
|
| Exercised | (1,041,7201,280,726 | ) |
| Cancelled | (12,297 | ) |
| Forfeited | (53,41357,540 | ) |
| Expired | — |
|
Balance at JuneSeptember 30, 2017 | 1,720,0911,464,661 |
|
Exercisable at JuneSeptember 30, 2017 | 1,320,8661,192,694 |
|
The aggregate intrinsic value of stock options outstanding was $35.1$31.4 million and $46.2 million as of JuneSeptember 30, 2017 and December 31, 2016, respectively.
The following table summarizes restricted stock unit (RSU) and performance-based restricted stock unit (PSU) activity under our equity-based plans for the sixnine months ended JuneSeptember 30, 2017:
| | | | RSUs | PSUs | RSUs | PSUs |
| | Number of Units | Weighted-Average Grant Date Fair Value | Number of Units | Weighted-Average Grant Date Fair Value | Number of Units | Weighted-Average Grant Date Fair Value | Number of Units | Weighted-Average Grant Date Fair Value |
| Nonvested at December 31, 2016 | 2,323,051 |
| $ | 20.32 |
| 149,412 |
| $ | 33.51 |
| 2,323,051 |
| $ | 20.32 |
| 149,412 |
| $ | 33.51 |
|
| Granted | 966,329 |
| 27.88 |
| 239,792 |
| 28.43 |
| 1,119,525 |
| 28.68 |
| 330,674 |
| 29.69 |
|
| Vested | (549,248 | ) | 19.46 |
| (7,518 | ) | 33.51 |
| (795,856 | ) | 20.41 |
| (7,518 | ) | 33.51 |
|
| Forfeited | (147,674 | ) | 23.25 |
| (18,894 | ) | 33.51 |
| (232,727 | ) | 23.38 |
| (18,894 | ) | 33.51 |
|
| Nonvested at June 30, 2017 | 2,592,458 |
| $ | 23.15 |
| 362,792 |
| $ | 30.15 |
| |
| Nonvested at September 30, 2017 | | 2,413,993 |
| $ | 23.87 |
| 453,674 |
| $ | 30.72 |
|
Stock-Based Compensation
Stock-based compensation expense is measured based on the fair value of the stock option on the grant date and recognized over the requisite service period for each separately vesting portion of the stock option award. Stock-based compensation expense and other disclosures for stock-based awards made to our employees pursuant to the equity plans was as follows:
| | | | Three Months Ended
June 30, | | Six Months Ended
June 30, | Three Months Ended
September 30, | | Nine Months Ended
September 30, |
| (in thousands) | 2017 | 2016 | | 2017 | 2016 | 2017 | 2016 | | 2017 | 2016 |
| Cost of providing services | $ | 2,031 |
| $ | 1,624 |
| | $ | 3,643 |
| $ | 3,439 |
| $ | 1,845 |
| $ | 1,605 |
| | $ | 5,488 |
| $ | 5,044 |
|
| Sales and marketing | 1,621 |
| 1,643 |
| | 2,923 |
| 3,628 |
| 1,524 |
| 1,491 |
| | 4,447 |
| 5,119 |
|
| General and administrative | 2,744 |
| 2,644 |
| | 5,035 |
| 5,617 |
| 3,259 |
| 2,544 |
| | 8,294 |
| 8,161 |
|
| Systems development and programming costs | 1,103 |
| 597 |
| | 2,105 |
| 1,221 |
| 1,072 |
| 624 |
| | 3,177 |
| 1,845 |
|
| Total stock-based compensation expense | $ | 7,499 |
| $ | 6,508 |
| | $ | 13,706 |
| $ | 13,905 |
| $ | 7,700 |
| $ | 6,264 |
| | $ | 21,406 |
| $ | 20,169 |
|
| Income tax benefit related to stock-based compensation expense | $ | 2,682 |
| $ | 2,248 |
| | $ | 4,808 |
| $ | 4,828 |
| $ | 2,813 |
| $ | 2,267 |
| | $ | 7,621 |
| $ | 7,095 |
|
| Tax benefit realized from stock options exercised and similar awards | $ | 10,525 |
| $ | 427 |
| | $ | 16,034 |
| $ | 2,415 |
| $ | 5,942 |
| $ | 1,721 |
| | $ | 21,976 |
| $ | 4,136 |
|
Stock Repurchases
The board of directors authorizes repurchases through an ongoing program initiated in May 2014. During the sixnine months ended JuneSeptember 30, 2017, we repurchased 1.11.4 million shares of common stock for $29.5$39.3 million. As of JuneSeptember 30, 2017, $30.5$20.7 million remained available for further repurchases of our common stock under our ongoing stock repurchase program.
NOTE 7. EARNINGS PER SHARE (EPS)
The following table presents the computation of our basic and diluted EPS attributable to our common stock:
| | | | Three Months Ended
June 30, | | Six Months Ended
June 30, | Three Months Ended
September 30, | | Nine Months Ended
September 30, |
| (in thousands, except per share data) | 2017 | 2016 | | 2017 | 2016 | 2017 | 2016 | | 2017 | 2016 |
| Net income | $ | 39,951 |
| $ | 12,282 |
| | $ | 68,688 |
| $ | 23,859 |
| $ | 42,836 |
| $ | 14,581 |
| | $ | 111,524 |
| $ | 38,440 |
|
| Weighted average shares of common stock outstanding | 69,030 |
| 70,729 |
| | 68,771 |
| 70,625 |
| 69,498 |
| 70,188 |
| | 69,016 |
| 70,478 |
|
| Basic EPS | $ | 0.58 |
| $ | 0.17 |
| | $ | 1.00 |
| $ | 0.34 |
| $ | 0.62 |
| $ | 0.21 |
| | $ | 1.62 |
| $ | 0.55 |
|
| | | | | | | |
| Net income | $ | 39,951 |
| $ | 12,282 |
| | $ | 68,688 |
| $ | 23,859 |
| $ | 42,836 |
| $ | 14,581 |
| | $ | 111,524 |
| $ | 38,440 |
|
| Weighted average shares of common stock | 69,030 |
| 70,729 |
| | 68,771 |
| 70,625 |
| 69,498 |
| 70,188 |
| | 69,016 |
| 70,478 |
|
| Dilutive effect of stock options and restricted stock units | 2,137 |
| 1,591 |
| | 2,331 |
| 1,397 |
| 2,002 |
| 1,777 |
| | 2,123 |
| 1,648 |
|
| Weighted average shares of common stock outstanding | 71,167 |
| 72,320 |
| | 71,102 |
| 72,022 |
| 71,500 |
| 71,965 |
| | 71,139 |
| 72,126 |
|
| Diluted EPS | $ | 0.56 |
| $ | 0.17 |
| | $ | 0.97 |
| $ | 0.33 |
| $ | 0.60 |
| $ | 0.20 |
| | $ | 1.57 |
| $ | 0.53 |
|
| | | | | | | |
| Common stock equivalents excluded from income per diluted share because of their anti-dilutive effect | 279 |
| 949 |
| | 288 |
| 1,184 |
| 482 |
| 817 |
| | 1,856 |
| 912 |
|
NOTE 8. INCOME TAXES
Our effective income tax rate was 23.5%26.3% and 42.9%38.4% for the three months ended JuneSeptember 30, 2017 and 2016, respectively, and 29.3%28.2% and 43.6%41.8% for the sixnine months ended JuneSeptember 30, 2017 and 2016, respectively. The decrease isThese decreases are primarily due to a discrete tax benefit recognized upon adoption of ASU 2016-09, a tax benefit resulting from qualified production activities deduction for certain software offerings, a tax benefit from an increase in excludable income for state tax purposes which is partially offset by a discrete charge due to changes in uncertain tax positions, and a tax benefit in non-deductible expenses due to the abatement of penalties previously assessed by the Internal Revenue Service (IRS). The remaining decrease is attributable to tax credits and disqualifying dispositions of previously nondeductible stock based compensation.
During the sixnine months ended JuneSeptember 30, 2017, our unrecognized tax benefits increased from $0.9 million to $3.4$4.4 million. Of the $3.4$4.4 million, $2.0$2.5 million would affect our tax expense, if recognized. Included in the $2.0$2.5 million is $0.2 million for interest and $0.2 million for penalties. Our unrecognized tax benefits are not expected to change significantly during the next 12 months.
We are subject to tax in U.S. federal and various state and local jurisdictions, as well as Canada. We are not subject to any material income tax examinations in federal or state jurisdictions for tax years prior to January 1, 2011. We previously paid Notices of Proposed Assessments disallowing employment tax credits totaling $10.5 million, plus interest and penalties of $4.0 million in connection with an IRS examination of Gevity HR, Inc. and its subsidiaries, which were acquired by TriNet in June 2009. This issue is being resolved through litigation. With regard to these employment tax credits, we believe it is more likely than not that we will prevail and realize our receivable included in other noncurrent assets without a charge to our statement of income. Therefore, no reserve has been recognized related to this matter.
NOTE 9. COMMITMENTS AND CONTINGENCIES
Lease Commitments
We lease office facilities, including our headquarters and other facilities, and equipment under non-cancelable operating leases. For detail of these commitments refer to Note 13 in Part II, Item 8 in our 2016 Form 10-K.
In July 2017, we entered into an agreement to lease additional office space starting February 2018 for a total commitment of approximately $32.4 million over 10 years.
Credit Facilities
We maintain a $75.0 million revolving credit facility which includes capacity for a $40.0 million letter of credit facility and a $10.0 million swingline facility. Letters of credit issued pursuant to the revolving credit facility reduce the amount available for borrowing under the revolving credit facility. The total unused portion of the revolving credit facility was $59.5 million as of JuneSeptember 30, 2017.
The terms of the credit agreement governing the revolving credit facility require us to maintain certain financial ratios at each quarter end. We were in compliance with these financial covenants at JuneSeptember 30, 2017.
We also have a $5.0 million line of credit facility to secure standby letters of credit related to our workers' compensation obligations. At JuneSeptember 30, 2017, the total unused portion of the credit facility was $2.7 million.
Standby Letters of Credit
We have two unused standby letters of credit totaling $17.8 million provided as collateral for our workers’ compensation obligations. At JuneSeptember 30, 2017, the facilities were not drawn down.
Contingencies
In August 2015, Howard Welgus, a purported stockholder, filed a putative securities class action lawsuit, Welgus v. TriNet Group, Inc. et. al., under the Securities Exchange Act of 1934 in the United States District Court (the Court) for the Northern District of California. The complaint was later amended in April 2016. The amended complaint generally alleges that TriNet and the other defendants caused damage to purchasers of our stock by misrepresenting and/or failing to disclose facts generally pertaining to alleged trends affecting health insurance and workers' compensation claims. The other defendants include certain of our officers and directors, General Atlantic, LLC, a former significant shareholder, and the underwriters of our IPO. The court set September 2017 for a court hearingheard arguments on our motion to dismiss.dismiss in September 2017 and took the matter under submission. We are unable to reasonably estimate the possible loss or range of losses, if any, arising from this litigation.
We are and, from time to time, have been and may in the future become involved in various litigation matters, legal proceedings and claims arising in the ordinary course of our business, including disputes with our clients or various class action, collective action, representative action and other proceedings arising from the nature of our co-employment relationship with our clients and WSEs in which we are named as a defendant. In addition, due to the nature of our co-employment relationship with our clients and WSEs, we could be subject to liability for federal and state law violations, even if we do not participate in such violations. While our agreements with our clients contain indemnification provisions related to the conduct of our clients, we may not be able to avail ourselves of such provisions in every instance. We have accrued our current best estimates of probable losses with respect to these matters which are individually and in aggregate immaterial to our condensed consolidated financial statements.
While the outcome of the matters described above cannot be predicted with certainty, management currently does not believe that any such claims or proceedings or the above mentioned securities class action will have a materially adverse effect on our consolidated financial position, results of operations or cash flows. However, the unfavorable resolution of any particular matter or our reassessment of our exposure for any of the above matters based on additional information obtained in the future could have a material impact on our consolidated financial position, results of operations or cash flows.
Legal Proceedings
For the information required in this section, refer to Note 9 in the condensed consolidated financial statements and related notes included this Form 10-Q.
Risk Factors
There have been no material changes in our risk factors disclosed in Part 1, Item 1A, of our 2016 Form 10-K.
Unregistered Sales of Equity Securities and Use of Proceeds
(a) Sales of Unregistered Securities
Not applicable.
(b) Use of Proceeds from Sales of Unregistered Securities
Not applicable.
(c) Issuer Purchases of Equity Securities
The following table provides information about our purchases of TriNet common stock during the quarter ended JuneSeptember 30, 2017:
|
| | | | | | | | | | | | | |
| Period | Total Number of
Shares Purchased (1) | | Weighted Average Price
Paid Per Share | | Total Number of
Shares
Purchased as Part of Publicly
Announced Plans(2) | | Approximate Dollar Value
of Shares that May Yet be Purchased
Under the Plans(2) |
| April 1 - April 30, 2017 | 3,620 |
| | $ | 27.69 |
| | — |
| | $ | 32,428,386 |
|
| May 1 - May 31, 2017 | 77,421 |
| | $ | 30.83 |
| | — |
| | $ | 32,428,386 |
|
| June 1 - June 30, 2017 | 67,109 |
| | $ | 32.02 |
| | 59,709 |
| | $ | 30,512,973 |
|
| Total | 148,150 |
| | | | 59,709 |
| | |
|
| | | | | | | | | | | | | |
| Period | Total Number of
Shares Purchased (1) | | Weighted Average Price
Paid Per Share | | Total Number of
Shares
Purchased as Part of Publicly
Announced Plans(2) | | Approximate Dollar Value
of Shares that May Yet be Purchased
Under the Plans(2) |
| July 1 - July 31, 2017 | 110,375 |
| | $ | 33.11 |
| | 107,992 |
| | $ | 26,938,775 |
|
| August 1 - August 31, 2017 | 172,162 |
| | $ | 37.53 |
| | 85,066 |
| | $ | 23,819,702 |
|
| September 1 - September 30, 2017 | 95,897 |
| | $ | 34.55 |
| | 90,865 |
| | $ | 20,677,472 |
|
| Total | 378,434 |
| | | | 283,923 |
| | |
(1) Includes shares surrendered by employees to us to satisfy tax withholding obligations that arose upon vesting of restricted stock units granted pursuant to approved plans.
(2) We repurchased a total of approximately $1.9$9.8 million of our outstanding common stock during the three months ended JuneSeptember 30, 2017.
As of JuneSeptember 30, 2017 we had approximately $30.5$20.7 million remaining for repurchases under our stock repurchase program. Stock repurchases under the program are primarily intended to offset the dilutive effect of share-based employee incentive compensation. The purchases were funded from existing cash and cash equivalents balances.
Our stock repurchases and dividends are subject to certain restrictions under the terms of our credit facility. For more information about our credit facility and our stock repurchases, refer to Notes 8 and 9 in Part II, Item 8 of our 2016 Form 10-K.
Defaults Upon Senior Securities
Not applicable.
Mine Safety Disclosures
Not applicable.
Other Information
Not applicable.
Exhibits
AIncorporated herein by reference is a list of the exhibits is foundcontained in the Exhibit Index immediately following the signature page of this report.
SIGNATURES
Pursuant to the requirements of the Securities Exchange Act of 1934, as amended, the registrant has duly caused this report to be signed on its behalf by the undersigned thereunto duly authorized.
|
| | | |
| TRINET GROUP, INC. |
| |
Date: July 31, 2017 | | By: | /s/ Burton M. Goldfield |
| | | Burton M. Goldfield |
| | | Chief Executive Officer |
| | | |
Date: July 31, 2017 | | By: | /s/ Richard Beckert |
| | | Richard Beckert |
| | | Chief Financial Officer |
| | | |
Date: July 31, 2017 | | By: | /s/ Michael P. Murphy |
| | | Michael P. Murphy
|
| | | Chief Accounting Officer |
below.
EXHIBIT INDEX
|
| | | | | | | | | | | | |
| | | | | Incorporated by Reference | | |
| Exhibit No. | | Exhibit | | Form | | File No. | | Exhibit | | Filing Date | | Filed Herewith |
10.1**3.1 | | Employment Agreement, dated March 31, 2017, between Richard Beckert | | | | | | | | | | X |
10.2** | | Second Amended and Restated Employment Agreement, dated December 28, 2016, between Edward Griese and TriNet Group, Inc. | | | | | | | | | | X |
10.3** | | TriNet Group, Inc. Amended and Restated Executive Severance Benefit Plan | | 8-K | | 001-36373 | | 10.1 | | 5/23/2017 | | |
| 31.1 | | | | | | | | | | | | X |
| 31.2 | | | | | | | | | | | | X |
32.1* | | | | | | | | | | | | |
101.INS | | XBRL Instance Document | | | | | | | | | | |
101.SCH | | XBRL Taxonomy Extension Schema Linkbase Document | | | | | | | | | | |
101.CAL | | XBRL Taxonomy Extension Calculation Linkbase Document | | | | | | | | | | |
101.DEF | | XBRL Taxonomy Extension Definition Linkbase Document | | | | | | | | | | |
101.LAB | | XBRL Taxonomy Extension Label Linkbase Document | | | | | | | | | | |
101.PRE | | XBRL Taxonomy Extension Presentation Linkbase Document | | | | | | | | | | |
|
| | |
| | | |
| * | Document has been furnished, is deemed not filed and is not to be incorporated by reference into any of TriNet Group, Inc.’s filings under the Securities Act of 1933, as amended, or the Securities Exchange Act of 1934, as amended, irrespective of any general incorporation language contained in any such filing. |
** | Constitutes a management contract or compensatory plan or arrangement. |
SIGNATURES
Pursuant to the requirements of the Securities Exchange Act of 1934, as amended, the registrant has duly caused this report to be signed on its behalf by the undersigned thereunto duly authorized.
|
| | | |
| TRINET GROUP, INC. |
| |
| Date: November 2, 2017 | | By: | /s/ Burton M. Goldfield |
| | | Burton M. Goldfield |
| | | Chief Executive Officer |
| | | |
| Date: November 2, 2017 | | By: | /s/ Richard Beckert |
| | | Richard Beckert |
| | | Chief Financial Officer |
| | | |
| Date: November 2, 2017 | | By: | /s/ Michael P. Murphy |
| | | Michael P. Murphy |
| | | Chief Accounting Officer |