UNITED STATES
SECURITIES AND EXCHANGE COMMISSION
WASHINGTON, DC 20549
FORM 10-Q
(Mark One)
☒QUARTERLY REPORT PURSUANT TO SECTION 13 OR 15(d) OF THE SECURITIES EXCHANGE ACT OF 1934
For the quarterly period ended March 31, 20202021
or
☐ TRANSITION REPORT PURSUANT TO SECTION 13 OR 15(d) OF THE SECURITIES EXCHANGE ACT OF 1934
For the transition period from to
Commission File Number: 001-36373
TRINET GROUP, INC.
(Exact Name of Registrant as Specified in its Charter)
|
| | | | | | | | | | |
| Delaware | | 95-3359658 |
(State or other jurisdiction of incorporation or organization) | | (I.R.S. Employer Identification No.) |
| One Park Place, | Suite 600 | | |
| Dublin, | CA | | 94568 |
| (Address of principal executive offices) | | (Zip Code) |
Registrant’s telephone number, including area code: (510) (510) 352-5000
Securities registered pursuant to Section 12(b) of the Act: |
| | | | | | | |
| Title of each class | Trading Symbol(s) | Name of each exchange on which registered |
| Common stock par value $0.000025 per share | TNET | New York Stock Exchange |
Indicate by check mark whether the registrant (1) has filed all reports required to be filed by Section 13 or 15(d) of the Securities Exchange Act of 1934 during the preceding 12 months (or for such shorter period that the registrant was required to file such reports), and (2) has been subject to such filing requirements for the past 90 days. Yes x No o
Indicate by check mark whether the registrant has submitted electronically every Interactive Data File required to be submitted pursuant to Rule 405 of Regulation S-T (§ 232.405 of this chapter) during the preceding 12 months (or for such shorter period that the registrant was required to submit such files). Yes x No o
Indicate by check mark whether the registrant is a large accelerated filer, an accelerated filer, a non-accelerated filer, a smaller reporting company, or an emerging growth company. See the definitions of “large accelerated filer,” “accelerated filer,” “smaller reporting company,” and “emerging growth company” in Rule 12b-2 of the Exchange Act.
|
| | | | | | | | | | |
| Large accelerated filer | x | Accelerated filer | o |
| | | |
| Non-accelerated filer | o | Smaller reporting company | ☐ |
| | | |
| | Emerging growth company | ☐ |
If an emerging growth company, indicate by check mark if the registrant has elected not to use the extended transition period for complying with any new or revised financial accounting standards provided pursuant to Section 13(a) of the Exchange Act. Yes o No o
Indicate by check mark whether the registrant is a shell company (as defined in Rule 12b-2 of the Exchange Act). Yes ☐ No x
The number of shares of Registrant’s Common Stock outstanding as of April 21, 202019, 2021 was 67,290,388.
TRINET GROUP, INC.
Form 10-Q - Quarterly Report
For the Quarterly Period Ended March 31, 20202021
TABLE OF CONTENTS
|
| | | | | | | |
| Form 10-Q Cross Reference | Page |
| | |
| Part I, Item 1. | |
| | |
| | |
| | |
| | |
| | |
| | |
| | |
| | |
| | |
| | |
| | |
| | |
| | |
| | |
| | |
| | |
| | |
| | |
| Part I, Item 2. | |
| Part I, Item 3. | |
| Part I, Item 4. | |
| Part II, Item 1. | |
| Part II, Item 1A. | |
| Part II, Item 2. | |
| Part II, Item 3. | |
| Part II, Item 4. | |
| Part II, Item 5. | |
| Part II, Item 6. | |
Glossary of Acronyms and Abbreviations
Acronyms and abbreviations are used throughout this report, particularly in Part I, Item 1. Unaudited Condensed Consolidated Financial Statements and Part I, Item 2. Management's Discussion and Analysis of Financial Condition and Results of Operations.
| | | | | |
| |
AFS | Available-for-sale |
ASC2021 Credit Program | Accounting standards codificationA program that, subject to certain predefined conditions, is designed to take certain pandemic related excess health care cost savings and provide credits to certain 2021 customers. |
ASU2018 Term Loan | Accounting standards updateOur $425 million term loan A that we entered into in June 2018 |
CEOAFS | Available-for-sale |
| |
| |
| CARES Act | Coronavirus Aid Relief and Economic Security Act |
| |
| CEO | Chief Executive Officer |
| CFO | Chief Financial Officer |
COPSCOBRA | Consolidated Omnibus Budget Reconciliation Act |
| COPS | Cost of providing services |
COVID-19 | Novel coronavirus |
| COVID-19 | Novel coronavirus |
| |
| |
| D&A | Depreciation and Amortizationamortization expenses |
| EBITDA | Earnings before interest expense, taxes, depreciation and amortization of intangible assets |
EPS | |
| EPS | Earnings Per Share |
| ERISA | Employee Retirement Income Security Act of 1974 |
ETRESAC | Employer Services Assurance Corporation |
| |
| ETR | Effective tax rate |
FASB | Financial Accounting Standards Board |
| FFCRA | Families First Coronavirus Response Act |
| G&A | General and administrative |
| GAAP | Generally Accepted Accounting Principles in the United States |
HR | Human Resources |
IRS | |
| HR | Human Resources |
| |
| |
| |
| IRS | Internal Revenue Service |
| ISR | Insurance service revenues |
LIBOR | |
| |
| LIBOR | London Inter-bank Offered Rate |
MCT | Medical cost trend |
| MD&A | Management's Discussion and Analysis of Financial Condition and Results of Operations |
| NIM | Net Insurance Margin |
| NISR | Net Insurance Service Revenues |
| NSR | Net service revenues |
| OE | Operating expenses |
PFC | |
| PEO | Professional Employer Organization |
| PFC | Payroll funds collected |
PSR | |
| PPP | Paycheck Protection Program, a loan program administered by the U.S. Small Business Administration |
| PSR | Professional service revenues |
| Recovery Credit | Program to provide clients with one-time reductions against fees for future services |
| Reg FD | Regulation Fair Disclosure |
RSAROU | Right-of-use |
| RSA | Restricted Stock Award |
| RSU | Restricted Stock Unit |
| SBC | Stock Based Compensation |
| S&M | Sales and marketing |
| S&P | Standard & Poor's |
| SD&P | Systems development and programming |
| SEC | U.S. Securities and Exchange Commission |
| SMB | Small to midsizeand medium-size business |
U.S. | United States |
WSE | |
| U.S. | United States |
| |
| WSE | Worksite employee |
| YTD | Year to date |
| |
|
| | | | |
| FORWARD LOOKING STATEMENTS AND OTHER FINANCIAL INFORMATION | |
Cautionary Note Regarding Forward-Looking Statements and Other Financial Information
For purposes of this Quarterly Report on Form 10-Q (Form 10-Q), the terms “TriNet,” “the Company,” “we,” “us” and “our” refer to TriNet Group, Inc., and its subsidiaries. This Form 10-Q contains statements that are not historical in nature, are predictive in nature, or that depend upon or refer to future events or conditions or otherwise contain forward-looking statements within the meaning of Section 21 of the Securities Exchange Act of 1934, as amended, and the Private Securities Litigation Reform Act of 1995. Forward-looking statements are often identified by the use of words such as, but not limited to, "ability," “anticipate,” “believe,” “can,” “continue,” “could,” “design,” “estimate,” “expect,” “forecast,” “hope,” "impact," “intend,” “may,” “outlook,” “plan,” “potential,” “predict,” “project,” “seek,” “should,” “strategy,” “target,” "value," “will,” “would” and similar expressions or variations intended to identify forward-looking statements. Examples of forward-looking statements include, among others, TriNet’s expectations regarding: our ability to support the economic recovery of our clients and SMBs; our ability to respond appropriately to the impact of COVID-19 on our business and our clients' businesses; the impact of our Connect 360 service model; the effect that our offering of $500 million of our 3.50% senior notes and of our replacement of our existing revolving facility with our new $500 million revolving facility will have on our business; the timing and strategies we employ with respect to corporate investments and capital expenditures; expectations regarding medical utilization rates by our WSEs; the impact of the COVID-19 pandemic;pandemic on regulations and government programs; the impact of our Recovery Credit program and our 2021 Credit Program and their suitability for generating client loyalty and retention; our ability to modify product andor develop service offerings to assist clients affected by COVID-19; the impact of our vertical approach,approach; our ability to leverage our scale and industry HR experience to deliver vertical product and service offerings; the growth of our customerclient base; planned improvements to our technology platform; our ability to drive operating efficiencies and improve the customerclient experience; the impact of our customerclient service initiatives; the volume and severity of insurance claims and the impact of COVID-19;COVID-19 on those claims; metrics that may be indicators of future financial performance; the relative value of our benefit offerings versus those SMBs can independently obtain; the principal competitive drivers in our market; our plans to retain clients and manage client attrition; our investment strategy and its impact on our ability to generate future interest income, net income, and Adjusted EBITDA; seasonal trends and their impact on our business, and the impact ofincluding due to COVID-19; fluctuations in the period-to-period timing of when we incur certain operating expenses; the estimates and assumptions we use to prepare our financial statements; and other expectations, outlooks and forecasts on our future business, operational and financial performance.
Important factors that could cause actual results, level of activity, performance or achievements to differ materially from those expressed or implied by these forward-looking statements are discussed above and throughout our Annual Report on Form 10-K for the year ended December 31, 20192020 filed with the SEC on February 13,16, 2021 (our 2020 (2019 Form 10-K), including those appearing under the heading “Risk Factors” in Item 1A, and under the heading “Management’s Discussion and Analysis of Financial Condition and Results of Operations” in Item 7 of our 20192020 Form 10-K, the risks appearing under the heading “Risk Factors” in Item Part II, Item 1A of this Form 10-Q, as well as in our other periodic filings with the SEC, and including risk factors associated with: the economic, health and business disruption caused by the COVID-19 pandemic; the impact of the COVID-19 pandemic on our businessclients and prospects, insurance costs and operations; the businessimpact of the COVID-19 pandemic on the laws and regulations that impact our industry and clients; our ability to mitigate the business risks we face as a co-employer; our ability to manage unexpected changes in workers’ compensation and health insurance claims and costs by worksite employees; the effects of volatility in the financial and economic environment on the businesses that make up our client base; the impact ofbase and the concentration of our clients in certain geographies and industries; the impact of failures or limitations in the business systems we rely upon; the impact of our Recovery Credit program; adverse changes in our insurance coverage or our relationships with key insurance carriers; our ability to manage our client attrition; our ability to improve our technology to satisfy regulatory requirements and meet the expectations of our clients;clients and manage client attrition; our ability to effectively integrate businesses we have acquired or may acquire in the future; our ability to effectively manage and improve our operational processes; our ability to attract and retain qualified personnel; the effects of increased competition and our ability to compete effectively; the impact on our business of cyber-attacks and security breaches; our ability to secure our information technology infrastructure and our confidential, sensitive and personal information from cyber-attacks and security breaches;information; our ability to comply with constantly evolving data privacy and security laws; our ability to manage changes in, uncertainty regarding, or adverse application of the complex laws and regulations that govern our business; changing laws and regulations governing health insurance and employee benefits; our ability to be recognized as an employer of worksite employees under federal and state regulations; changes in the laws and regulations that govern what it means to be an employer, employee or independent contractor; our ability to comply with the laws and regulations that govern PEOs and other similar industries; the outcome of existing and future legal and tax proceedings; fluctuation in our results of operation and stock price due to factors outside of our control, such as the volume and severity of our workers’ compensation and health insurance claims and the amount and timing of our insurance costs, operating expenses and capital expenditure requirements; our ability to comply with the restrictions of our credit facility and meet our debt obligations; and the impact of concentrated ownership in our stock. Any of these factors could cause our actual results to differ materially from our anticipated results.
| | | | | |
| FORWARD LOOKING STATEMENTS AND OTHER FINANCIAL INFORMATION | |
Forward-looking statements are not guarantees of future performance, but are based on management’s expectations as of the date of this Form 10-Q and assumptions that are inherently subject to uncertainties, risks and changes in circumstances that are difficult to predict. Forward-looking statements involve known and unknown risks, uncertainties and other factors that may cause actual results, performance or achievements to be materially different from our current
|
| |
FORWARD LOOKING STATEMENTS AND OTHER FINANCIAL INFORMATION | |
expectations and any past results, performance or achievements. Given these risks and uncertainties, readers are cautioned not to place undue reliance on such forward-looking statements.
The information provided in this Form 10-Q is based upon the facts and circumstances known as of the date of this Form 10-Q, and any forward-looking statements made by us in this Form 10-Q speak only as of the date of this Form 10-Q. We undertake no obligation to revise or update any of the information provided in this Form 10-Q, except as required by law.
The MD&A of this Form 10-Q includes references to our performance measures presented in conformity with GAAP and other non-GAAP financial measures that we use to manage our business, to make planning decisions, to allocate resources and to use as performance measures in our executive compensation plans. Refer to the Non-GAAP Financial Measures in our Key Financial and Operating Metrics section within our MD&A for definitions and reconciliations from GAAP measures.
Website Disclosures
We use our website (www.trinet.com) to announce material non-public information to the public and to comply with our disclosure obligations under Regulation Fair Disclosure (Reg FD). We also use our website to communicate with the public about our Company, our services, and other issues.matters. Our SEC filings, press releases and recent public conference calls and webcasts can also be found on our website. The information we post on our website could be deemed to be material information under Reg FD. We encourage investors and others interested in our Company to review the information we post on our website. Information contained in or accessible through our website is not a part of this report.
Risk Factors
Other than the inclusion of the additional risk factor below, there have been no material changes in our risk factors disclosed in Part 1, Item 1A. of our 2019 Form 10-K.
The unprecedented economic, health and business disruption caused by the COVID-19 pandemic is impacting our business and could result in a material adverse effect on our business, results of operation and/or financial condition.
The outbreak of the novel coronavirus (COVID-19) pandemic and the measures being taken at every level of government to prevent its spread have resulted in an economic slowdown and an unprecedented disruption to our business and the businesses of our small and mid-size business clients. We cannot predict or control all of these disruptions, and any such disruptions may have a material adverse effect on our financial condition and results of operations.
Actual and potential impact on clients and prospects
This change in the economic environment is starting to have, and will continue to have, an adverse economic impact on our small and mid-size business clients and potential clients. We are seeing affected businesses freeze and furlough headcount, terminate employees, partially or completely shut down business operations, and business failures. Impacted businesses may also face liquidity issues, reduced budgets, and may otherwise be unable to pay for our services or the same level of our services. All of these issues have the potential to result in a material adverse effect on our revenues and margins, our financial condition and results of operations, and/or on our ability to attract and retain customers. See the risk factor titled “Our SMB clients are particularly affected by volatility in the financial and economic environment, which could harm our business” in our 2019 Form 10-K for more details.
Shelter-in-place, quarantine and other similar orders have been widely issued across the United States, including in all or nearly all of the locations where our clients and potential clients are located. We cannot predict the length of such measures in any given location. To the extent that these regions become hot spots for COVID-19 the length of these measures may be extended, which could have a further negative impact on the businesses of our clients and potential clients and result in a material adverse effect on our business.
Actual and potential impact on insurance costs
The spread of COVID-19 has changed how and when our WSEs incur group health insurance expenses. As a result, we are beginning to experience and expect to continue to experience higher than normal volatility and variability in the amounts that we pay for group health insurance expenses incurred by WSEs within our deductible layer under our risk-based health insurance policies, due to changing trends in the volume and severity of medical and pharmaceutical claims, including COVID-19 testing and treatment costs. This variability arises from changes to the timing and components of medical cost trend (MCT), defined as changes in participant use of services, the introduction of new treatment options, changes in treatment guidelines and mandates, and changes in the mix, unit cost and timing of services provided to plan participants. It is difficult for us to predict how this MCT and these aspects of our business will change as a result of the COVID-19 pandemic, and any such changes may have a material adverse effect on our business. COVID-19 stay-at-home orders and social distancing policies are decreasing, and we expect will continue to decrease, the near-term utilization of medical services as enrollees defer or cancel elective procedures and reduce outpatient medical, dental and vision services, however, we cannot predict the rate at which enrollees will increase utilization of medical services in subsequent quarters once COVID-19 stay-at-home order and social distancing policies are lifted. For details on how medical cost trend impacts our insurance costs, see Critical Accounting Judgments and Estimates in Part II, Item 7. MD&A, in our Form 10-K, and see the risk factor titled “Unexpected changes in workers’ compensation and health insurance costs and claims by worksite employees could harm our business” in our 2019 Form 10-K for more details. In addition, California and Illinois are contemplating proposals that could require employers to presumptively cover COVID-19 related workers’ compensation claims of employees working during stay-at-home orders. Our insurance costs are affected by our WSE’s workers’ compensation insurance claims experience, and any law that increases the number of workers’ compensation claims under our insurance policies could have a material adverse effect on our insurance costs and financial condition. See the risk factor titled “Unexpected changes in workers’ compensation and health insurance costs and claims by worksite employees could harm our business” in our 2019 Form 10-K for more details.
Actual and potential impact of the laws governing our industry
Every level of government is enacting new laws and programs to help the economy, employers and employees. For example, Congress recently enacted the Families First Coronavirus Relief Act and the Coronavirus Aid, Relief and Economic Security Act, which created numerous new programs, including new mandatory employee leave requirements, new payroll tax deferral and tax credit programs and other employment- and employment tax-related incentives. Additional federal laws may be passed and many states are following suit with similar sweeping legislation. We are spending, and will continue to spend, significant time and resources to comply with new laws and to provide the COVID-10 assistance programs created by these laws for our clients. Most of these laws and programs have not been, and we do not anticipate will be, enacted with the PEO industry in mind. As a result, we cannot guarantee we will be able to support all of these laws and programs in a timely and cost effective manner or at all, which could reduce or eliminate the attractiveness of our products and services and/or affect the ability of our clients to realize all the benefits of these laws and programs. In addition, since many of these laws do not specifically address the PEO industry and regulators are unfamiliar with the PEO industry, we expect to experience unpredictable and inconsistent application, interpretation and enforcement of these laws and regulations, which could have a material adverse effect on our business. See the risk factor titled “Our business is subject to numerous complex laws, and changes in, uncertainty regarding, or adverse application of these laws could negatively affect our business” in our 2019 Form 10-K for more details.
Actual and potential impact on human resources and cyber security
In response to local laws and guidance intended to reduce the spread of COVID-19, in mid-March we closed our offices across the country and implemented remote working. Remote work increases our risk of experiencing a material cyber-attack or other security-related incident. See the risk factor titled “Cyber-attacks or other security-related incidents could result in reduced revenue, increased costs, liability claims, regulatory penalties, and damage to our reputation” in our 2019 Form 10-K for more details. In addition, responding to the COVID-19 pandemic has diverted, and will continue to divert, the time and attention of our management and service teams. Certain of our employees and their immediate families have been and will likely become ill as a result of COVID-19, which may reduce the staff we have available. As a result, our ability to provide products and services in the same way and in the same timeframe that our clients have come to expect may be negatively impacted.
Actual and potential impact of the risks described above
Any of the risks above could have a material adverse effect on our business, results of operations or financial condition. However, the extent to which such COVID-19 related risks will impact our business remains uncertain and will depend on a variety of factors that are changing on a day-to-day basis and that we may not be able to accurately predict, such as the duration and scope of the pandemic, the disruption of the national and global economy caused by the pandemic, the length of the economic downturn, the laws, programs and actions that governments will take in response to the pandemic, the extent to which our clients businesses contract or fail during the pandemic, the extent to which new laws intended to help small and mid-size businesses can be supported by the PEO industry, the extent to which our own operations are impacted by office closures, remote work and/or infections. and how quickly and to what extent normal economic and operating conditions can resume. Any of these factors could exacerbate the risks and uncertainties identified above or that are set forth in our 2019 Form 10-K, and result in a material adverse effect on our business, financial condition and results of operations.
|
| |
| MANAGEMENT'S DISCUSSION AND ANALYSIS | |
Management’s Discussion and Analysis of Financial Condition and Results of Operations
Executive Summary
Overview
TriNet is a leading provider of HR expertise, payroll services, employee benefits and employment risk mitigation services for SMBs. We deliver a comprehensive suite of products and services that facilitates the administrationhelp our clients administer and management ofmanage various HR-related needs and functions, for our clients, includingsuch as compensation and benefits, payroll processing, employee data, health insurance and workers' compensation programs, and other transactional HR needs using our technology platform and HR, benefits and compliance expertise. We empower SMBs to focus on what matters most - growing their business.
We also leverage our scale and industry HR experience to deliver product andour service offerings for SMBs in specific industries.industry verticals. We believe our approach, which we call our vertical approach is a key differentiator for us and creates additional value for our clients driven by allowing our product and service offerings that are tailored to address industry-specific HR needs in different client industries.needs. We offer six industry-tailored vertical products,services: TriNet Financial Services, TriNet Life Sciences, TriNet Main Street, TriNet Nonprofit, TriNet Professional Services, and TriNet Technology.
Operational Highlights
Our consolidated results for the first quarter of 20202021 reflect growth, disciplined financial management, and our continuing focus on servingefforts to serve our customers and improving our brand awareness through our marketing campaign: People Matter.
Our customers are our focus, and we are investing in our processes to ensure a stronger customer experience. We expect this investment will further enhance our value to our customers, support retention and provide further efficiency and scale for our operations. We started this work in 2018 and expect this to continue inexisting clients throughout the near-term.
During the first quarter of 2020:
we continued to grow our revenues,
exercised discretion in our spending,
maintained our net insurance margin by pricing to risk and working with our carriers to manage costs, and
enhanced our short-term cash reserves by drawing down $234 million on our credit facility.
The outbreak of the novel coronavirus (“COVID-19”)COVID-19 pandemic and to support the measures being taken at every leveleconomic recovery of governmentSMBs. We will continue to prevent its spread have resulted in an economic slowdownmonitor and an unprecedented disruptionevaluate developments relating to our businessthe COVID-19 pandemic and the businesses of our small and mid-size business clients.
We are actively evaluating and respondingwill work to respond appropriately to the impact of the COVID-19 pandemic on our business and our clients' businesses.
Actions we have takenDuring the first quarter of 2021 we:
•delivered profitable growth as a result of revenue growth and lower insurance costs,
•launched 'Connect 360', an innovative service model intended to date include:better meet client needs,
providing ongoing and timely information, resources and offerings•continued to customers and other SMBs to help them navigate the rapidly changing and complicated COVID-19 business landscape,
facilitating access to alternative health plan options in addition to COBRA,
enacting new programs in response to the Families First Coronavirus Relief Act and the Coronavirus Aid, Relief and Economic Security Act to enable new payroll tax deferral and tax credit programs and other employment and non-employment tax-related incentivesgrow our revenues, while recognizing a $12 million revenue reduction for our customers,Recovery Credit program to support our eligible, renewing clients,
•established our 2021 Credit Program to benefit our eligible clients, resulting in a $25 million reduction in insurance service revenues recognized,
•completed a $500 million senior notes offering and repaid and terminated our outstanding term loan, and
helping•replaced our customers navigate the various small business relief loan programs,
We have delivered on these customer-focused initiatives and in March 2020, we have implemented remote working and office closures around the country for non-essential activities as the health and well-being of our employees is importantexisting revolving credit facility with a new $500 million revolving credit facility to us.
|
| | | | |
| MANAGEMENT'S DISCUSSION AND ANALYSIS | |
Performance Highlights
These operational achievements drove the financial performance improvements noted below inOur results for the first quarter of 20202021 when compared to the same period of 2019:2020 are noted below:
Q1 20202021
|
| | | | | | | | | | | |
| | $1.0B | | $120M | | $283M |
| | Total revenues | | Operating income | | Net Service Revenue * |
| | 12 | % | increase | | 46 | % | increase | | 13 | % | increase |
| | | | | | | | | |
| | $91M | | $1.31 | | $97M |
| | Net income | | Diluted EPS | | Adjusted Net income * |
| | 44 | % | increase | | 47 | % | increase | | 41 | % | increase |
| | | | | | | | | |
| * | Non-GAAP measure as defined in the section below.
| | | | |
| | | | | | | | | | | | | | | | | | | | | | | | | | |
| $1.1B | | $138M | | $309M |
| Total revenues | | Operating income | | Net Service Revenues * |
| 1 | % | increase | | 15 | % | increase | | 9 | % | increase |
| | | | | | | | |
| $101M | | $1.51 | | $111M |
| Net income | | Diluted EPS | | Adjusted Net income * |
| 11 | % | increase | | 15 | % | increase | | 14 | % | increase |
| | | | | | | | |
| * | Non-GAAP measure. See definitions below under the heading "Non-GAAP Financial Measures". |
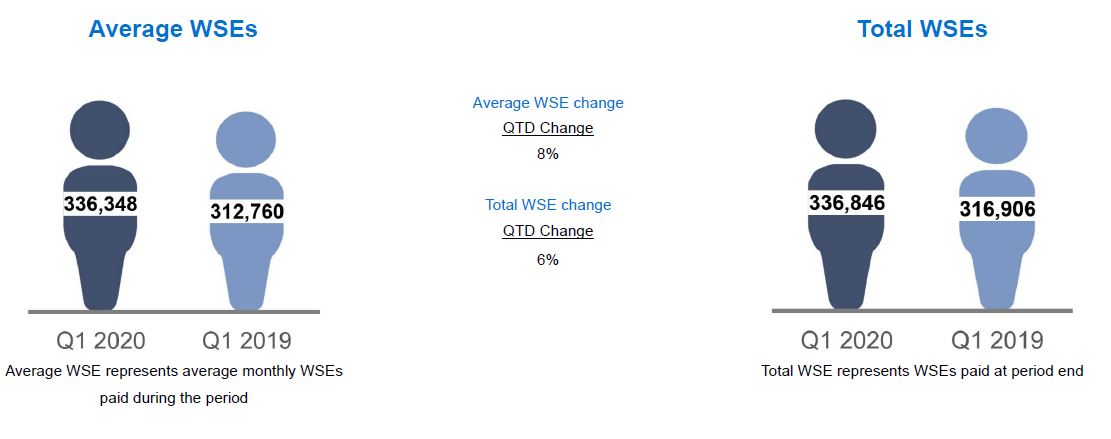
Our results for WSEs in the first quarter of 20202021 when compared to the same period of 20192020 were:
|
| | | | | | | |
| | 336,348 | | 336,846 |
| | Average WSEs | | Total WSEs |
| | 8 | % | increase | | 6 | % | increase |
| | | | | | |
| | | | | | | | | | | | | | | | | |
| 321,295 | | 326,216 |
| Average WSEs | | Total WSEs |
| (4) | % | decrease | | (3) | % | decrease |
| | | | | |
During the first quarter of 2020,2021, we continued to achieve year-over-year revenue growth, reflecting our rate increases and higher health plan enrollment. This was partially offset by lower Average WSEs and a $12 million reduction recognized under our Recovery Credit program.
We also recognized a $25 million reduction to revenue under our 2021 Credit Program initiated in the first quarter of 2021. This amount reflects estimated credits that will be paid to eligible clients under this program, based on the expected performance of our health insurance costs in 2021, and is currently limited to $25 million. To the extent we experience higher than expected health insurance costs during the remainder of 2021, this estimate may be reduced.
During the first quarter of 2021, our Average WSEs declined 4% and total revenues grew by 12% and NSR grew by 13%WSEs declined 3%, primarily as a result of the impact of COVID-19 on our Average WSE growth.clients in 2020 and seasonal attrition.
Decreases in medical services utilization, as a result of WSEs continuing to delay or avoid medical services during the COVID-19 pandemic, drove lower insurance costs, resulting in year-over-year increases in our net income, Net income increased 44%Service Revenue, and adjusted net income increased 41% due to continued expense discipline in the first quarter of 2020.
|
| | | | |
| MANAGEMENT'S DISCUSSION AND ANALYSIS | |
Key Financial MetricsResults of Operations
The following key financial metrics should be readtable summarizes our results of operations for the first quarter of 2021 when compared to the same period of 2020. For details of the critical accounting judgments and estimates that could affect the Results of Operations, see the Critical Accounting Judgments and Estimates section within the MD&A in conjunction withItem 7 of our condensed consolidated financial statements and related notes included in this2020 Form 10-Q.10-K.
| | | | | | | | | | | |
| | Three Months Ended March 31, |
| (in millions, except operating metrics data) | 2021 | 2020 | % Change |
| Income Statement Data: | | | |
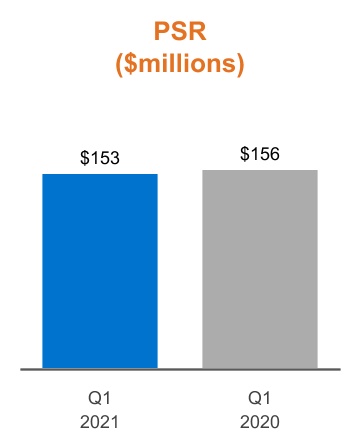
| Professional service revenues | $ | 153 | | $ | 156 | | (2) | % |
| Insurance service revenues | 907 | | 892 | | 2 | |
| Total revenues | 1,060 | | 1,048 | | 1 | |
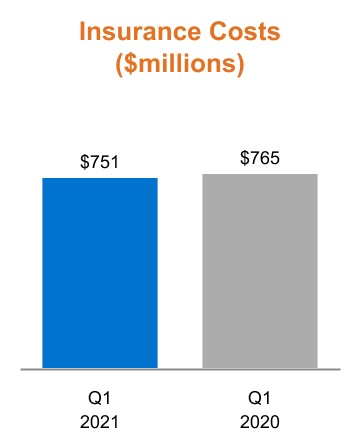
| Insurance costs | 751 | | 765 | | (2) | |
| Operating expenses | 171 | | 163 | | 5 | |
| Total costs and operating expenses | 922 | | 928 | | (1) | |
| Operating income | 138 | | 120 | | 15 | |
| Other income (expense): | | | |
| Interest expense, bank fees and other | (5) | | (4) | | 25 | |
| Interest income | 2 | | 5 | | (60) | |
| | | |
| | | |
| Income before provision for income taxes | 135 | | 121 | | 12 | |
| Income taxes | 34 | | 30 | | 13 | |
| Net income | $ | 101 | | $ | 91 | | 11 | % |
| | | |
| | | |
| Cash Flow Data: | | | |
| Net cash used in operating activities | (175) | | $ | (282) | | (38) | |
| Net cash used in investing activities | (3) | | (94) | | (97) | |
| Net cash provided by financing activities | 56 | | 185 | | (70) | |
| | | |
Non-GAAP measures (1): | | | |
| Net Service Revenues | $ | 309 | | $ | 283 | | 9 | % |
| Net Insurance Service Revenues | $ | 156 | | $ | 127 | | 23 | |
| Net Insurance Margin | 17 | % | 14 | % | 2 | |
| Adjusted EBITDA | 163 | | 145 | | 12 | |
| Adjusted Net income | 111 | | 97 | | 14 | |
| Corporate Operating Cash Flows | 131 | | 119 | | 10 | |
| | | |
| Operating Metrics: | | | |
| Average WSEs | 321,295 | | 336,348 | | (4) | % |
| Total WSEs | 326,216 | | 336,846 | | (3) | |
| | | |
| | | |
|
| | | | | | | | | | | |
| | Three Months Ended March 31, |
| (in millions, except per share and WSE data) | 2020 | | 2019 | | % Change |
| Income Statement Data: | | | | | | |
| Total revenues | $ | 1,048 |
| | $ | 934 |
| | 12 |
| % |
| Net income | 91 |
| | 63 |
| | 44 |
| |
| Diluted net income per share of common stock | 1.31 |
| | 0.89 |
| | 47 |
| |
Non-GAAP measures (1): | | | | |
|
| |
| Net Service Revenues | 283 |
| | 251 |
| | 13 |
| |
| Net Insurance Service Revenues | 127 |
| | 115 |
| | 10 |
| |
| Adjusted EBITDA | 145 |
| | 108 |
| | 34 |
| |
| Adjusted Net Income | 97 |
| | 69 |
| | 41 |
| |
(1) Refer to Non-GAAP Financial Measures section below formeasures definitions and reconciliations from GAAP measures.measures under the heading "Non-GAAP Financial Measures".
The following table summarizes our balance sheet data as of March 31, 2021 compared to December 31, 2020.
| | | | | | | | | | | | | | | | | | | | |
| (in millions) | March 31,
2021 | | December 31,
2020 | | % Change | |
| Balance Sheet Data: | | | | | | |
| Working capital | $ | 520 | | | $ | 290 | | | 79 | | % |
| Total assets | 3,005 | | | 3,043 | | | (1) | | |
| Debt | 494 | | | 370 | | | 34 | | |
| Total stockholders’ equity | 653 | | | 607 | | | 8 | | |
|
| | | | | | | | |
| (in millions) | March 31,
2020 | | December 31,
2019 | | % Change | |
| Balance Sheet Data: | | | | | | |
| Working capital | 284 |
| | 228 |
| | 25 | % |
| Total assets | 2,765 |
| | 2,748 |
| | 1 | |
| Debt | 620 |
| | 391 |
| | 59 | |
| Total stockholders’ equity | 533 |
| | 475 |
| | 12 | |
|
| | | | | | | | | | | | |
| | Three Months Ended March 31, |
| (in millions) | 2020 | | 2019 | | % Change |
| Cash Flow Data: | | | | | | |
| Net cash used in operating activities | $ | (282 | ) | | $ | (142 | ) | | 99 |
| % |
| Net cash used in investing activities | (94 | ) | | (11 | ) | | 755 |
| |
| Net cash provided by (used in) financing activities | 185 |
| | (47 | ) | | (494 | ) | |
Non-GAAP measure(1): | | | | |
|
| |
| Corporate operating cash flows | 119 |
| | 78 |
| 169 |
| 53 |
| |
(1) Refer to Non-GAAP Financial Measures section below for definitions and reconciliations from GAAP measures.
| | | | | |
| MANAGEMENT'S DISCUSSION AND ANALYSIS | |
Non-GAAP Financial Measures
In addition to financial measures presented in accordance with GAAP, we monitor other non-GAAP financial measures that we use to manage our business, to make planning decisions, to allocate resources and to use as performance measures in our executive compensation plan. These key financial measures provide an additional view of our operational performance over the long-term and provide information that we use to maintain and grow our business.
The presentation of these non-GAAP financial measures is used to enhance the understanding of certain aspects of our financial performance. It is not meant to be considered in isolation from, superior to, or as a substitute for the directly comparable financial measures prepared in accordance with GAAP.
|
| |
MANAGEMENT'S DISCUSSION AND ANALYSIS | |
|
| | |
| Non-GAAP Measure | Definition | How We Use The Measure |
| Net Service Revenues | • Sum of professional service revenues and Net Insurance Service Revenues,
or total revenues less insurance costs. | • Provides a comparable basis of revenues on a net basis. Professional service revenues are presented net of client payroll costs whereas insurance service revenues are presented gross of insurance costs for financial reporting purposes.
• Acts as the basis to allocate resources to different functions and evaluates the effectiveness of our business strategies by each business function.
• Provides a measure, among others, used in the determination of incentive compensation for management.
|
| Net Insurance Service Revenues | • Insurance service revenues less insurance costs. | • Is a component of Net Service Revenues. • Provides a comparable basis of revenues on a net basis. Professional service revenues are presented net of client payroll costs whereas insurance service revenues are presented gross of insurance costs for financial reporting purposes. Promotes an understanding of our insurance services business by evaluating insurance service revenues net of our WSE related costs which are substantially pass-through for the benefit of our WSEs. Under GAAP, insurance service revenues and costs are recorded gross as we have latitude in establishing the price, service and supplier specifications.
|
| Net Insurance Margin | • We also sometimes refer to Net Insurance Margin (NIM), which is the ratio of Net Insurance RevenueServices Revenues to insurance service revenues. | • Provides a comparable basis of Net Insurance Service Revenue.Revenues relative to insurance service revenues. Promotes an understanding of our pricing to risk performance. |
| Adjusted EBITDA | • Net income, excluding the effects of: - income tax provision, - interest expense, bank fees and other, - depreciation, - amortization of intangible assets, and - stock based compensation expense.
| • Provides period-to-period comparisons on a consistent basis and an understanding as to how our management evaluates the effectiveness of our business strategies by excluding certain non-cash charges such as depreciation and amortization, and stock-based compensation recognized based on the estimated fair values. We believe these charges are either not directly resulting from our core operations or not indicative of our ongoing operations. • Enhances comparisons to prior periods and, accordingly, facilitates the development of future projections and earnings growth prospects. • Provides a measure, among others, used in the determination of incentive compensation for management. • We also sometimes refer to Adjusted EBITDA margin, which is the ratio of Adjusted EBITDA to Net Service Revenue.
|
| | | | | |
| MANAGEMENT'S DISCUSSION AND ANALYSIS | |
| | | | | | | | |
| Adjusted Net Income | • Net income, excluding the effects of: - effective income tax rate (1), - stock based compensation, - amortization of intangible assets, - non-cash interest expense (2), and - the income tax effect (at our effective tax rate (1)) of these pre-tax adjustments. | • Provides information to our stockholders and board of directors to understand how our management evaluates our business, to monitor and evaluate our operating results, and analyze profitability of our ongoing operations and trends on a consistent basis by excluding certain non-cash charges.
|
|
| |
MANAGEMENT'S DISCUSSION AND ANALYSIS | |
|
| | |
| Corporate Operating Cash Flows | • Net cash provided by (used in) operating activities, excluding the effects of:
- Assets associated with WSEs (accounts receivable, unbilled revenue, prepaid expenses and other current assets) and
- Liabilities associated with WSEs (client deposits and other client liabilities, accrued wages, payroll tax liabilities and other payroll withholdings, accrued health benefit costs, accrued workers' compensation costs, insurance premiums and other payables, and other current liabilities).
| • Provides information that our stockholders and management can use to evaluate our cash flows from operations independent of the current assets and liabilities associated with our WSEs.
• Enhances comparisons to prior periods and, accordingly, used as a liquidity measure to manage liquidity between corporate and WSE related activities, and to help determine and plan our cash flow and capital strategies.
|
| |
(1) | Non-GAAP effective tax rate is 25.5% and 26% for first quarter of 2020 and 2019, respectively, which excludes the income tax impact from stock based compensation, changes in uncertain tax positions, and nonrecurring benefits or expenses from federal legislative changes. |
| |
(2) | Non-cash interest expense represents amortization and write-off of our debt issuance costs. |
(1) Non-GAAP effective tax rate is 25.5% for 2021 and 2020, which excludes the income tax impact from stock-based compensation, changes in uncertain tax positions and nonrecurring benefits or expenses from federal legislative changes.
(2) Non-cash interest expense represents amortization and write-off of our debt issuance costs and loss on derivative.
Reconciliation of GAAP to Non-GAAP Measures
The table below presents a reconciliation of Total revenues to Net Service Revenues: | | | | Three Months Ended March 31, | | Three Months Ended March 31, | |
| (in millions) | 2020 | 2019 | (in millions) | 2021 | 2020 | |
| Total revenues | $ | 1,048 |
| $ | 934 |
| Total revenues | $ | 1,060 | | $ | 1,048 | | |
| Less: Insurance costs | 765 |
| 683 |
| Less: Insurance costs | 751 | | 765 | | |
| Net Service Revenues | $ | 283 |
| $ | 251 |
| Net Service Revenues | $ | 309 | | $ | 283 | | |
The table below presents a reconciliation of Insurance service revenues to Net Insurance Service Revenues:
|
| | | | | | |
| | Three Months Ended March 31, |
| (in millions) | 2020 | 2019 |
| Insurance service revenues | $ | 892 |
| $ | 798 |
|
| Less: Insurance costs | 765 |
| 683 |
|
| Net Insurance Service Revenues | $ | 127 |
| $ | 115 |
|
| NIM | 14 | % | 14 | % |
| | | | | | | | | | | |
| Three Months Ended March 31, | | |
| (in millions) | 2021 | 2020 | | | |
| Insurance service revenues | $ | 907 | | $ | 892 | | | | |
| Less: Insurance costs | 751 | | 765 | | | | |
| Net Insurance Service Revenues | $ | 156 | | $ | 127 | | | | |
| Net Insurance Margin | 17 | % | 14 | % | | | |
|
| | | | |
| MANAGEMENT'S DISCUSSION AND ANALYSIS | |
The table below presents a reconciliation of Net income to Adjusted EBITDA:
| | | | Three Months Ended
March 31, | | Three Months Ended March 31, | |
| (in millions) | 2020 | 2019 | (in millions) | 2021 | 2020 | |
| Net income | $ | 91 |
| $ | 63 |
| Net income | $ | 101 | | $ | 91 | | |
| Provision for income taxes | 30 |
| 20 |
| Provision for income taxes | 34 | | 30 | | |
| Stock based compensation | 9 |
| 9 |
| Stock based compensation | 11 | | 9 | | |
| Interest expense and bank fees | 4 |
| 5 |
| |
| Interest expense, bank fees and other | | Interest expense, bank fees and other | 5 | | 4 | | |
| Depreciation and amortization of intangible assets | 11 |
| 11 |
| Depreciation and amortization of intangible assets | 12 | | 11 | | |
| Adjusted EBITDA | $ | 145 |
| $ | 108 |
| Adjusted EBITDA | $ | 163 | | $ | 145 | | |
| Adjusted EBITDA Margin | 51 | % | 43 | % | Adjusted EBITDA Margin | 53 | % | 51 | % | |
The table below presents a reconciliation of Net income to Adjusted Net Income:
| | | | | | | | | | | |
| Three Months Ended March 31, | | |
| (in millions) | 2021 | 2020 | | | |
| Net income | $ | 101 | | $ | 91 | | | | |
| Effective income tax rate adjustment | — | | (1) | | | | |
| Stock based compensation | 11 | | 9 | | | | |
| Amortization of intangible assets | 1 | | 1 | | | | |
| Non-cash interest expense | 2 | | — | | | | |
| Income tax impact of pre-tax adjustments | (4) | | (3) | | | | |
| Adjusted Net Income | $ | 111 | | $ | 97 | | | | |
|
| | | | | | |
| | Three Months Ended
March 31, |
| (in millions) | 2020 | 2019 |
| Net income | $ | 91 |
| $ | 63 |
|
| Effective income tax rate adjustment | (1 | ) | (1 | ) |
| Stock based compensation | 9 |
| 9 |
|
| Amortization of intangible assets | 1 |
| 1 |
|
| Income tax impact of pre-tax adjustments | (3 | ) | (3 | ) |
| Adjusted Net Income | $ | 97 |
| $ | 69 |
|
The table below presents a reconciliation of net cash used in(used in) provided by operating activities to corporate operating cash flows:Corporate Operating Cash Flows:
| | | | | | | | |
| Three Months Ended
March 31, |
| (in millions) | 2021 | 2020 |
| Net cash used in operating activities | $ | (175) | | $ | (282) | |
| Less: Change in WSE related other current assets | (85) | | (110) | |
| Less: Change in WSE related liabilities | (221) | | (291) | |
| Net cash used in operating activities - WSE | $ | (306) | | $ | (401) | |
| Net cash provided by operating activities - Corporate | $ | 131 | | $ | 119 | |
|
| | | | | | |
| | Three Months Ended
March 31, |
| (in millions) | 2020 | 2019 |
| Net cash used in operating activities | $ | (282 | ) | $ | (142 | ) |
| Change in WSE related other current assets | 110 |
| 45 |
|
| Change in WSE related liabilities | 291 |
| 175 |
|
Corporate Operating Cash Flows
| $ | 119 |
| $ | 78 |
|
|
| | | | |
| MANAGEMENT'S DISCUSSION AND ANALYSIS | |
Results of Operations
Operating Metrics
Worksite Employees (WSE)
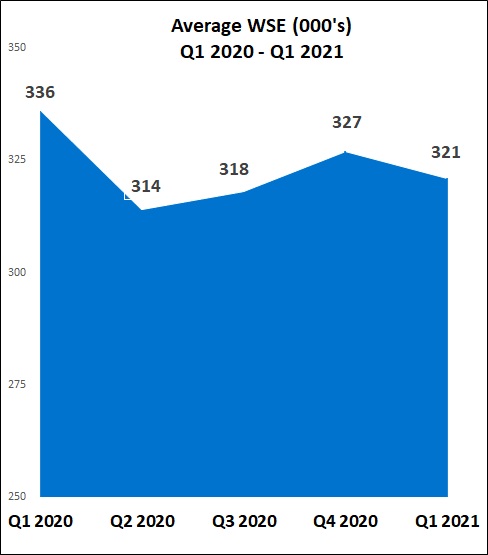
Average WSE growth is a volume measure we use to monitor the performance of our business. Average WSEs increased 8%We have historically experienced our highest volumes of changes in new and exiting clients during the first quarter of 2020, comparedthe year, as clients generally change their payroll service providers at the beginning of the payroll tax year. Average WSEs decreased 4% when comparing the first quarter of 2021 to the same period in 2019, primarily in our Technology and Professional Services verticals2020 due to reducedlower Total WSEs at the beginning of 2021 compared to 2020 due to COVID-19 impact, combined with seasonal attrition and continuedlower new sales. This was partially offset by increased hiring in all verticals of our installed base, especially in the final three quarters of 2019, offset by seasonal attrition in the current quarter.our technology, life sciences and financial services verticals.
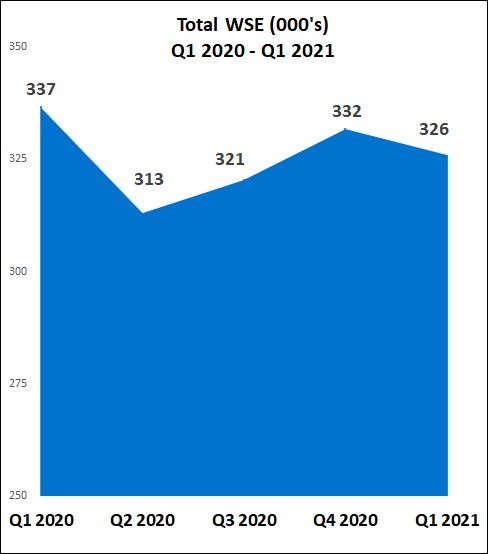
Total WSEs can generally be used to estimate our beginning WSEs for the next period and, as a result, can be used as an indicator of our potential future success in growing our business and retaining clients. Total WSEs decreased 1% compared to December 2019 due to seasonal attrition of clients, partially offset by new sales and WSE growth in our installed base. As a result of the COVID-19 pandemic, we believe that we will experience increased attrition and a reduction of WSEs in our installed base across all verticals in the coming quarters, particularly within our Main Street and Professional Services verticals.
Anticipated revenues for future periods can diverge from the revenue expectation derived from Average WSEs or Total WSEs due to pricing differences across our HR solutions and services and the degree to which clients and WSEs elect to participate in our solutions during future periods. In addition to focusing on growing our Average WSE and Total WSE counts, we also focus on pricing strategies, productbenefit participation and productservice differentiation to expand our revenue opportunities. We report the impact of client and WSE participation differences as a change in mix.
We are focusedIn addition to focusing on retaining and growing our WSE base, andwe continue to review acquisition opportunities that would add appropriately to our scale. We continue to invest in our efforts intended to enhance our customers'client experiences and WSEs' experiences,manage attrition, through operational and process improvements and manage attrition that we believe we will experience as a result of the COVID-19 pandemic.improvements.
|
| | | | |
| MANAGEMENT'S DISCUSSION AND ANALYSIS | |
Total Revenues
Our revenues consist of professional service revenues (PSR) and insurance service revenues (ISR). PSR represents fees charged to clients for processing payroll-related transactions on behalf of our clients, access to our HR expertise, employment and benefit law compliance services, and other HR-related services. ISR consists of insurance-related billings and administrative fees collected from clients and withheld from WSEs for workers' compensation insurance and health benefit insurance plans provided by third-party insurance carriers.
In April 2020, we created our Recovery Credit program to assist in the economic recovery of our existing SMB clients and enhance our ability to retain these clients. Eligible clients will receive one-time reductions against fees for future services, accounted for as a discount, to be received over the following 12 months. We recognized a reduction in total revenues of $12 million in the first quarter of 2021 for the Recovery Credit, allocated proportionally to PSR ($5 million) and ISR ($7 million).
The reduction in revenue is estimated each period based on the timing of when eligible clients will receive the Recovery Credit and the ultimate amount of the total Recovery Credit. We will recognize a further $5 million reduction to revenues in 2021 for the remaining Recovery Credit over the period that our clients will earn the right to receive credits.
We also recognized a $25 million reduction to revenue under our 2021 Credit Program. This amount reflects estimated credits that will be paid to eligible clients under this program, based on the expected performance of our health insurance costs in 2021, and is currently limited to $25 million. These credits are recorded as a reduction to ISR and are payable within 12 months to eligible clients as of March 31, 2021. To the extent we experience higher than expected health insurance costs during the remainder of 2021, this estimate may be reduced.
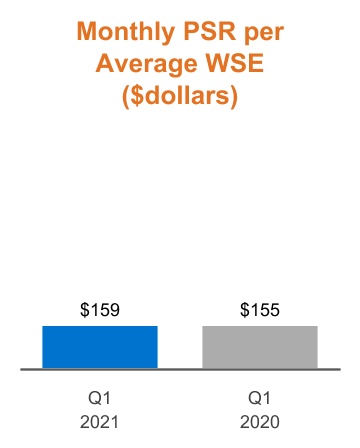
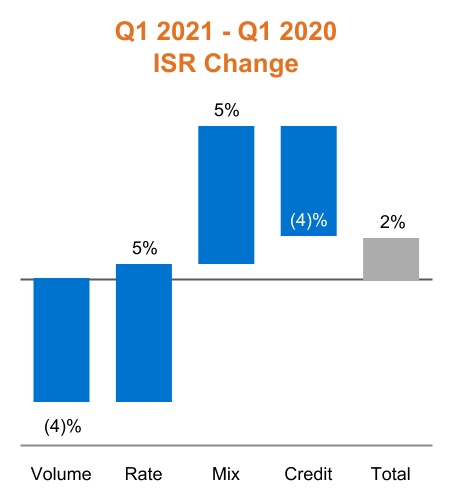
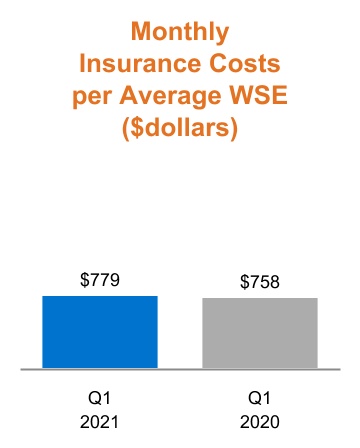
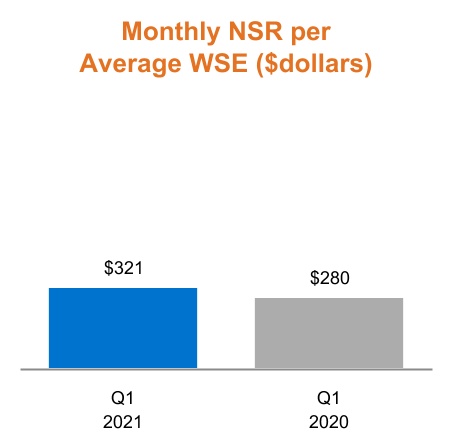
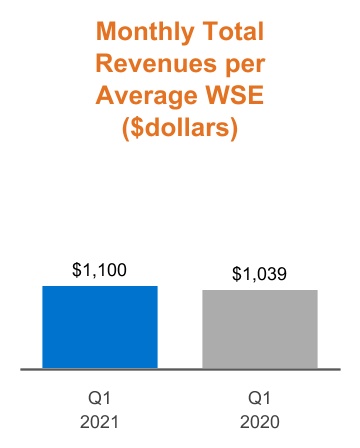
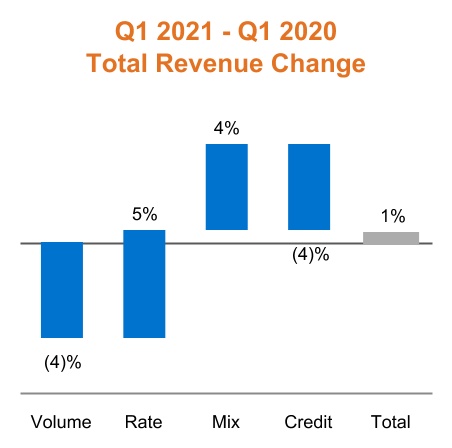
Monthly total revenues per Average WSE is a measure we use to monitor the success of our product and service pricing strategies. This measure increased 4%6% during the first quarter of 20202021 compared to the same period in 2019.2020.
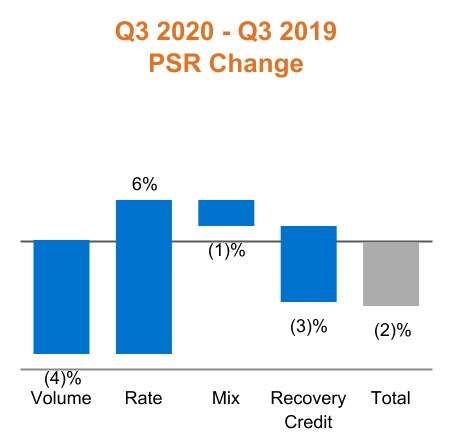
We also use the following measures to further analyze changes in total revenue:
•Volume - the percentage change in period over period Average WSEs,
•Rate - the combined weighted average percentage changes in service fees for each vertical productservice and changes in service fees associated with each insurance service offering, and
•Mix - the change in composition of Average WSEs within our verticals combined with the composition of our enrolled WSEs within our insurance service offerings.offerings, and
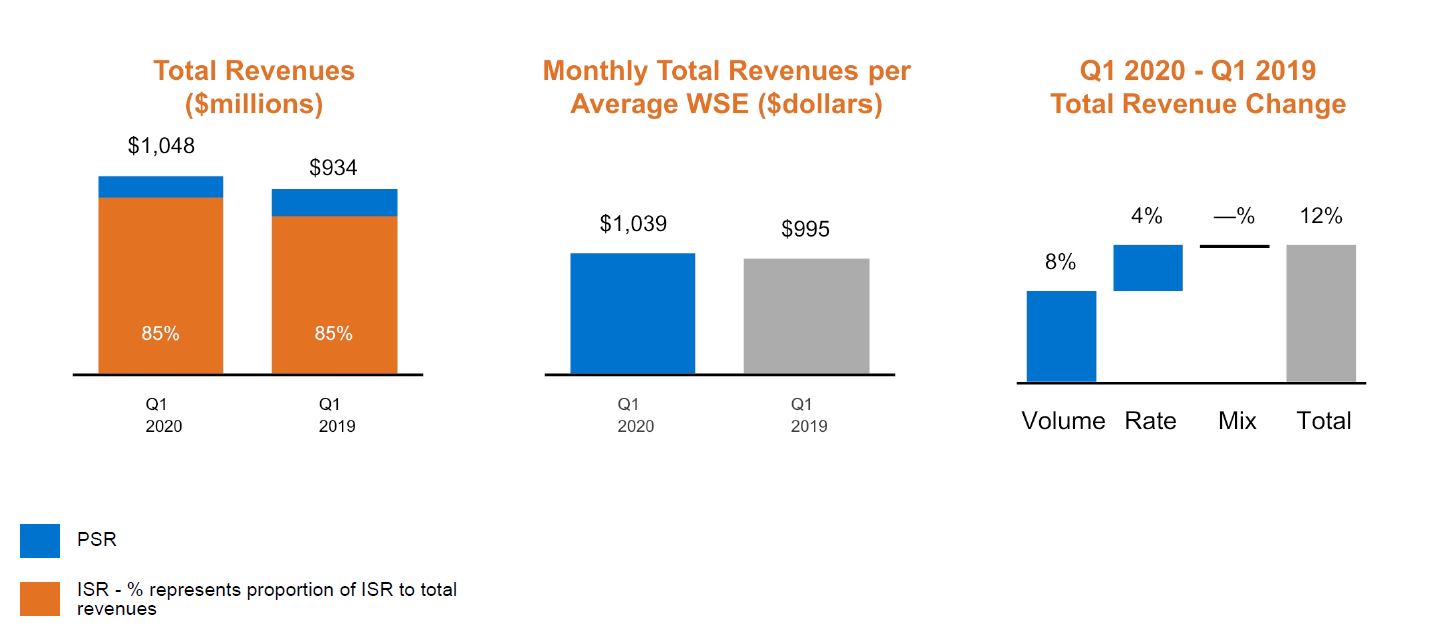
The changes in volume during the first quarter of 2020, when compared to the same period in 2019, were primarily driven by WSE growth, especially in our Technology and Professional Services verticals. We continued to price to the value of our services and, for our insurance offerings, to our expected risk, resulting in the change in rate during the first quarter of 2020, when compared to the same period in 2019.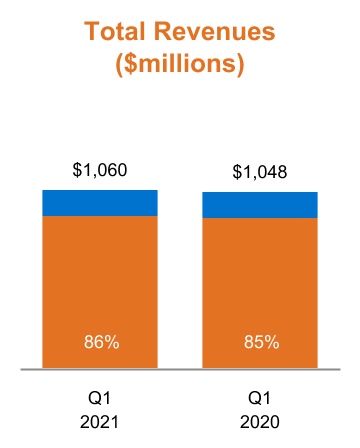
The change in the U.S. economy due to COVID-19 is having a negative impact on our SMB customers and prospects. Affected businesses, particularly in our Main Street and Professional Services verticals, are furloughing and terminating employees and reducing hiring. These actions by our customers, combined with business shutdowns and failures will negatively impact revenue volume growth in subsequent quarters. The adverse economic environment will also reduce our ability to achieve rate increases in subsequent quarters. As a result, we expect PSR, ISR and total revenues to decrease in subsequent quarters.
|
| | ISR - % represents proportion of ISR to total revenues | |
| | |
| | |
The growth in total revenues, was primarily driven by rate increases and higher health plan enrollment in our insurance service offerings. This was partially offset by lower Average WSEs, the $12 million reduction recognized for our Recovery Credit and the $25 million reduction under our 2021 Credit Program.
| | | | | |
| MANAGEMENT'S DISCUSSION AND ANALYSIS | |
Operating Income
Our operating income consists of total revenues less insurance costs and OE. Our insurance costs include insurance premiums for coverage provided by insurance carriers, reimbursement of claims payments made by insurance carriers or third-party administrators, and changes in accrued costs related to contractual obligations with our workers' compensation and health benefit carriers. Our OE consists primarily of our corporate employees' compensation related expenses, which includes payroll, payroll taxes, SBC, bonuses, commissions and other payroll-and benefits-related costs.
The table below provides a view of the changes in components of operating income for the first quarter of 2020,2021, as compared to the same period in 2019.
|
| | | | | | | | |
| (in millions) | |
$82120 | | | First Quarter 20192020 Operating Income |
| +11412 |
| | Higher total revenues, primarily as a result of WSE growth, especiallyincreased health plan enrollment in our Technologyinsurance service offerings, together with rate increases, partially offset by lower Average WSEs, the $12 million reduction recognized under our Recovery Credit and Professional Services verticals and increases in ISR fees.the $25 million reduction recognized under our 2021 Credit Program. |
| -82+14 |
| | HigherLower insurance costs primarily as a result of an increase in WSE growth.lower utilization of medical services and lower Average WSEs, partially offset by higher health plan enrollments. |
| +6-8 |
| | LowerHigher OE primarily as a result of reduction inincreased compensation related expenses.to support initiatives to improve client experience, enhance service offerings, and improve processes. |
$120138 | | | First Quarter 20202021 Operating Income |
| | | | | |
| MANAGEMENT'S DISCUSSION AND ANALYSIS | |
Professional Service Revenues
Our clients are billed either based on a fee per WSE per month per transaction or on a percentage of the WSEs’ payroll. For those clients (primarily Main Street clients) that are billed on a percentage of WSEs' payroll, as our clients' payrolls increase or decrease, our fees also increase or decrease, respectively.
transaction. Our vertical approach provides us the flexibility to offer our clients in different industries with varied services at different prices, which we believe potentially reduces the value of solely using Average WSE and Total WSE counts as indicators of future potential revenue performance.
We also analyze changes in PSR with the following measures:
•Volume - the percentage change in period over period Average WSEs,
•Rate - the weighted average percentage change in fees for each vertical, and
•Mix - the change in composition of Average WSEs across our verticals.verticals, and
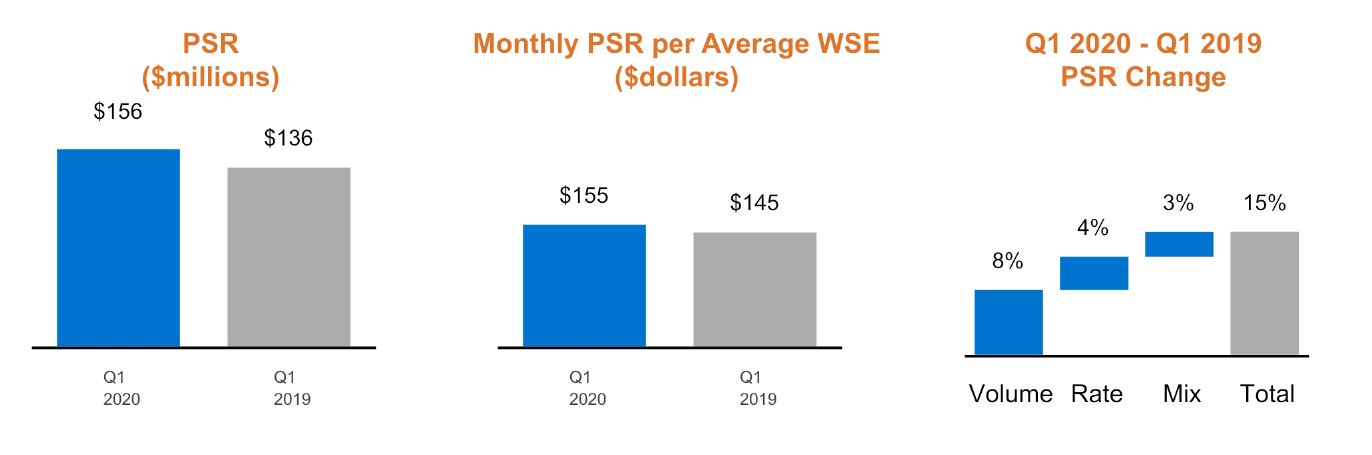
The increasedecrease in PSR for the first quarter of 2020, when compared to the same period in 2019, reflects the result of WSE growthdecrease in our TechnologyAverage WSEs and Professional Services verticals, the result of our vertical pricing strategy and ongoing change$5 million Recovery Credit recognized in mix of our WSEs.
|
| | | | |
| MANAGEMENT'S DISCUSSION AND ANALYSIS | |
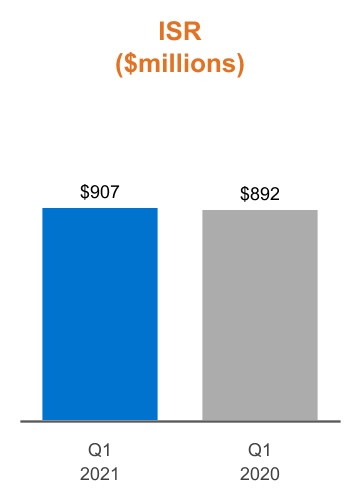
Insurance Service Revenues
ISR consists of insurance services-related billings and administrative fees collected from clients and withheld from WSE payroll for health benefits and workers' compensation insurance provided by third-party insurance carriers.
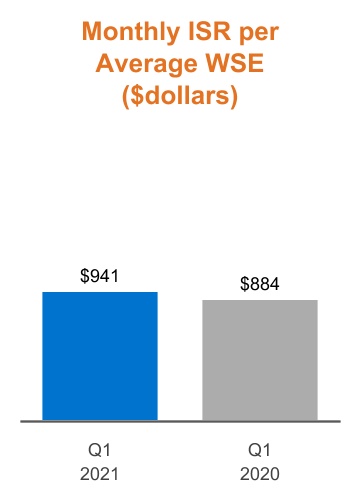
We use the following measures to analyze changes in ISR:
•Volume - the percentage change in period over period Average WSEs,
•Rate - the weighted average percentage change in fees associated with each of our insurance service offerings, and
•Mix - all other changes including the composition of our enrolled WSEs within our insurance service offerings (health plan enrollment)., and
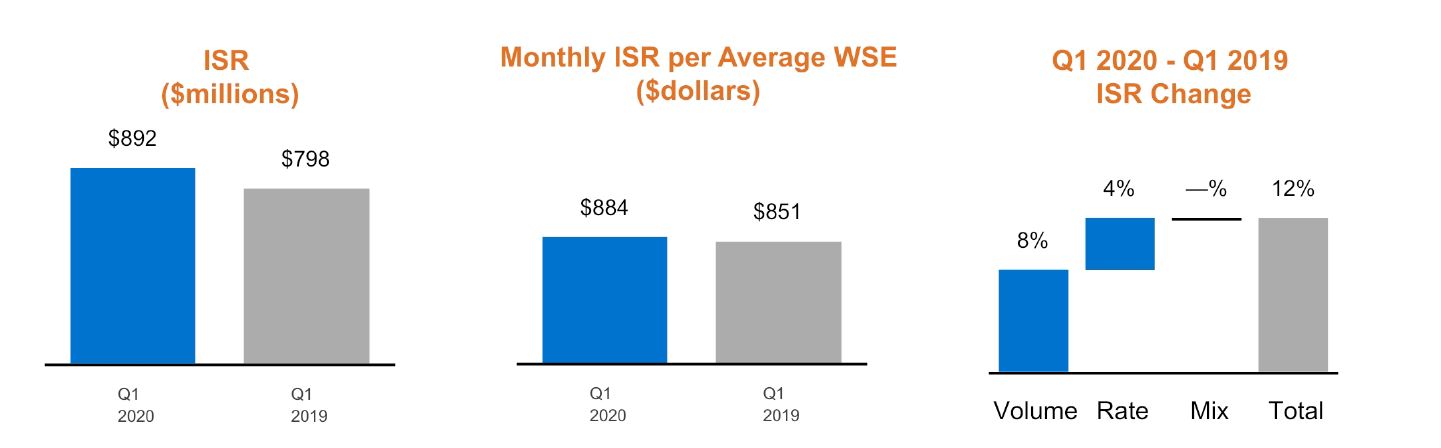
The growth in ISR for the first quarter of 2020, as compared to the same period in 2019, primarily resulted fromreflects rate increases inand higher health plan enrollment by clients. This was partially offset by lower Average WSEs and changesthe $7 million Recovery Credit and $25 million recognized under our 2021 Credit Program in rate due to higher insurance service fees per plan participant.2021.
|
| | | | |
| MANAGEMENT'S DISCUSSION AND ANALYSIS | |
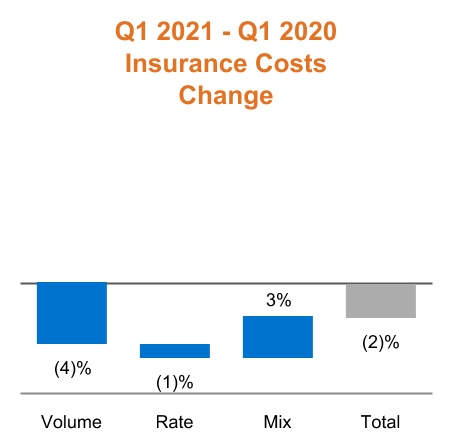
Insurance Costs
Insurance costs include insurance premiums for coverage provided by insurance carriers, payments for claims costs and other risk management services, reimbursement of claims payments made by insurance carriers or third-party administrators below a predefined deductible limit, and changes in accrued costs related to contractual obligations with our workers' compensation and health benefit carriers.
We use the following measures to analyze changes in insurance costs:
•Volume - the percentage change in period over period Average WSEs,
•Rate - the weighted average percentage change in cost trend associated with each of our insurance service offerings, and
•Mix - all other changes including the composition of our enrolled WSEs within our insurance service offerings (health plan enrollment).
The growth in insurance costs forDuring the first quarter of 2021, we continued to experience higher than normal volatility and variability in the amounts that we pay for group health insurance expenses incurred by WSEs within our deductible layer under our risk-based health insurance policies. Stay-at-home orders and social distancing practices impacted WSEs utilization of outpatient medical services from mid-December 2020 as compared tothrough January 2021, causing the same perioddecrease in 2019, primarily resulted from increases in Average WSEs. The increase in insurance cost rates duringrate for the first quarter of 2021. The decrease in utilization in December 2020 resulted in larger positive claims development as compared to the same period in 2019, was primarily driven by increased severity ofour accrued health costs per enrollee (medical cost trend)were paid during the first quarter of 2020.2021. This was partially offset by a return to more normal utilization by end of March 2021, combined with COVID-19 testing, treatment and vaccination costs in 2021.
We did not incur significant insurance costs related to COVID-19 duringThe decrease in volume in the first quarter of 2020. We expect2021, due to incur costslower Average WSEs for the testing and treatment of enrollees affectedquarter, was offset by COVID-19an increase in subsequent quarters.mix from higher health plan enrollments.
Historically, health claims costs have tended to increase throughout the year as the utilization of medical services above each WSE's deductible causes our insurance costs to increase. While medical services utilization did not vary significantly in the first quarter of 2020 due to the late emergence of COVID-19, we expect the utilization of medical services in subsequent quarters to decrease as enrollees defer or cancel non-essential elective procedures and reduce outpatient medical, dental and vision services.
|
| | | | |
| MANAGEMENT'S DISCUSSION AND ANALYSIS | |
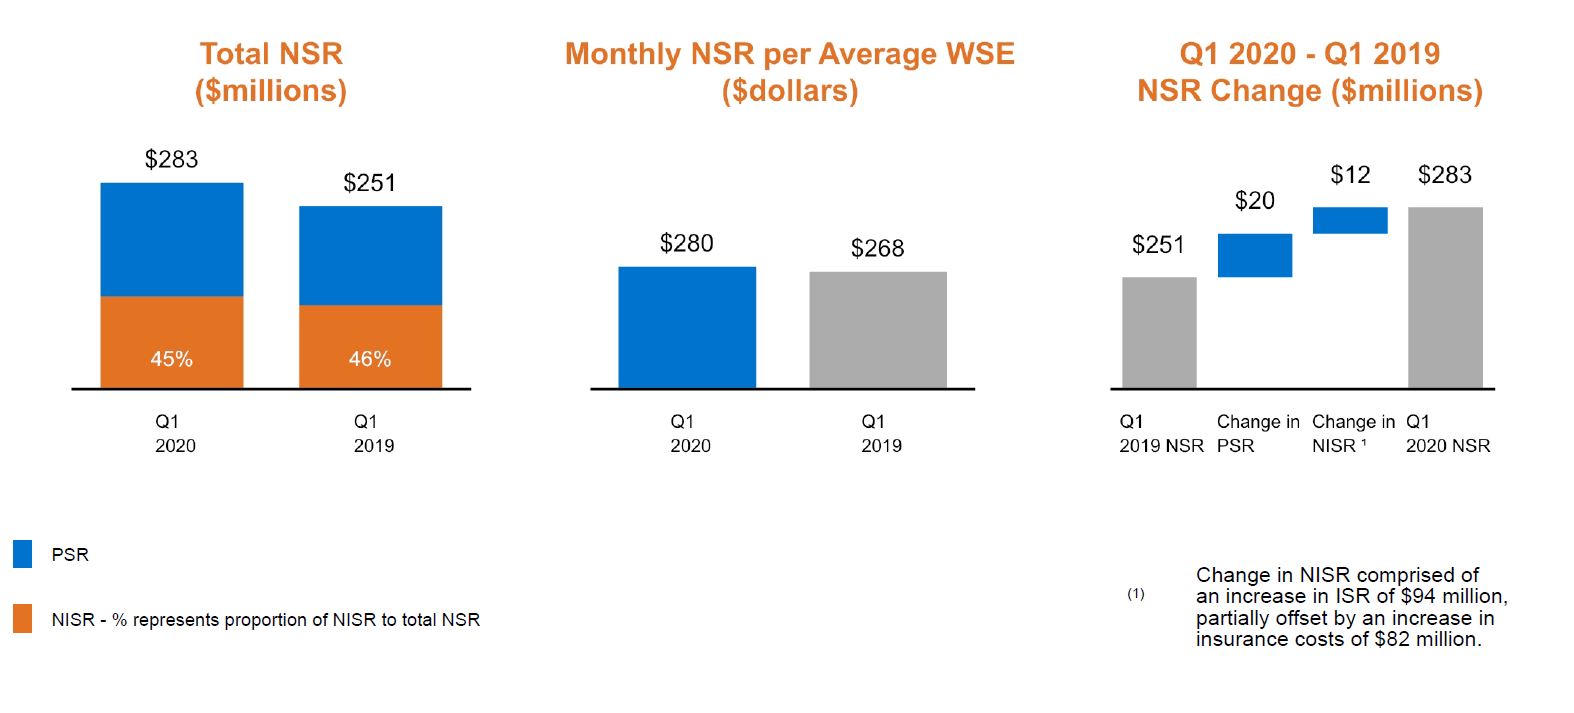
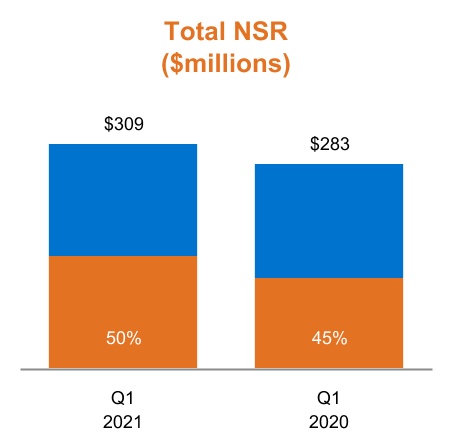
Net Service Revenues
NSR provides us with a comparable basis of revenues on a net basis, acts as the basis to allocate resources to different functions and helps us evaluate the effectiveness of our business strategies by each business function.
NIM remained consistent year-over-year.
| | | | | | | | |
| | PSR |
| | |
| | |
| | Net insurance service revenues - % represents proportion of Net Insurance Service Revenues to total Net Service Revenues |
| | |
The primary drivers to the changes in our NSR are presented below:
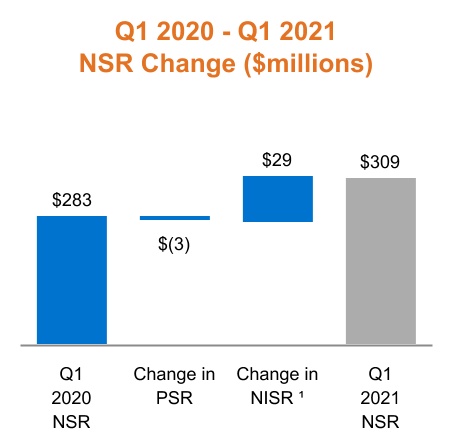
19(1) Change in NISR is comprised of an increase in ISR of $15 million, offset by an increase in insurance costs of $14 million.
NIM was 17% for the first quarter of 2021, representing an increase of 3% when compared to the same period in 2020, due to higher ISR and lower utilization of medical services, as discussed previously. 18
| | | | | |
| MANAGEMENT'S DISCUSSION AND ANALYSIS | |
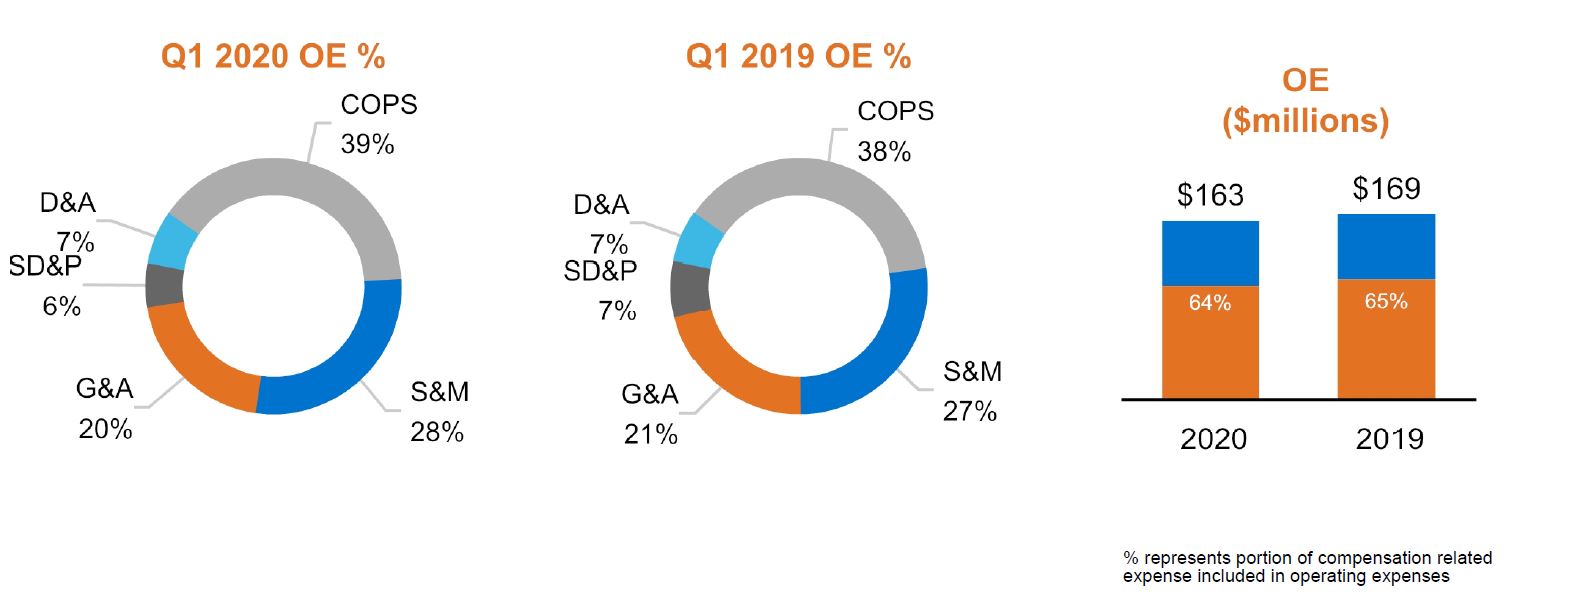
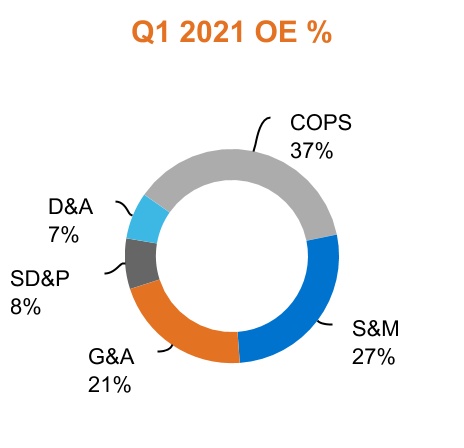
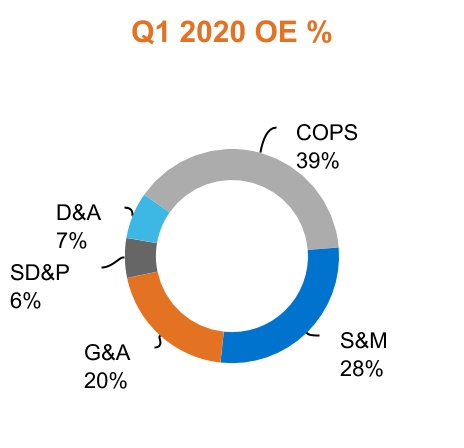
Operating Expenses
OE includes cost of providing services (COPS), sales and marketing (S&M), general and administrative (G&A), systems development and programming (SD&P), and depreciation and amortization expenses (D&A).
We manage our operating expensesOE and allocate resources across different business functions based on a percentage of NSR, which has decreased to 58%55% in the first quarter of 20202021 from 67% in58% when compared to the same period in 2019.2020. The lower percentage of OE to NSR in 2021 when compared to 2020 was primarily driven by the increase in NSR.
We had approximately 2,8002,600 corporate employees as of March 31, 20202021 in 4815 offices across the U.S. In the first quarter of 2021, we continued to exit expiring leases due to our evolving remote work practices and policies. Our corporate employees' compensation-related expenses represent a majority of our operating expenses. Compensation costs for our corporate employees include payroll, payroll taxes, SBC, bonuses, commissions and other payroll- and benefits-related costs. Compensation-related expense represented 65% and 64% of our OE in the first quarterquarters of 2021 and 2020, compared to 65% in the same period in 2019.respectively.
During the first quarter of 2020,2021, we experienced operating expense decreaseOE growth of 4%5% when compared to the same period in 2019. During the first quarter of 2020, the percent2020. The ratio of OE to total revenues was 16%, compared to 18% in the same period in 2019. While expense discipline initiatives will continue, we expect the ratiofirst quarter of OE to total revenues to increase in subsequent quarters as total revenues decrease2021 and we continue to invest in projects to improve our customer and WSE experience.2020.
| | | | | | | | | | | | | | | | | | | | | | | | | | | | | |
| | | | | | % represents portion of compensation related expense included in operating expenses |
| | | | | |
| MANAGEMENT'S DISCUSSION AND ANALYSIS | |
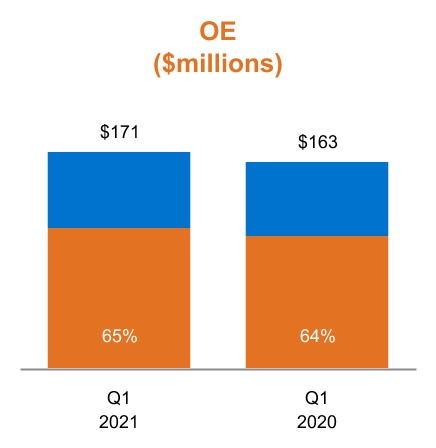
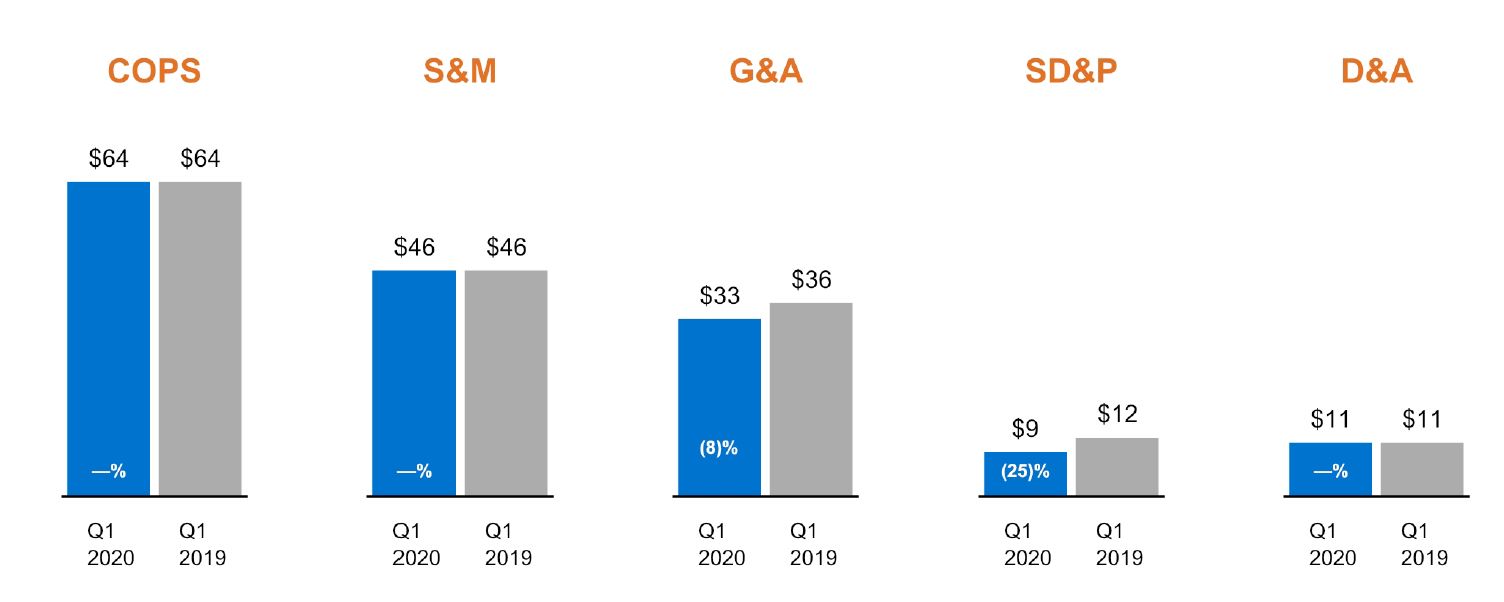
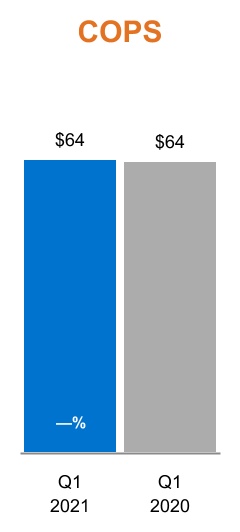
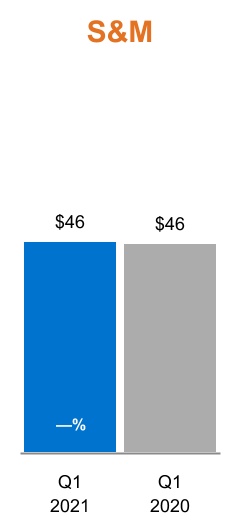
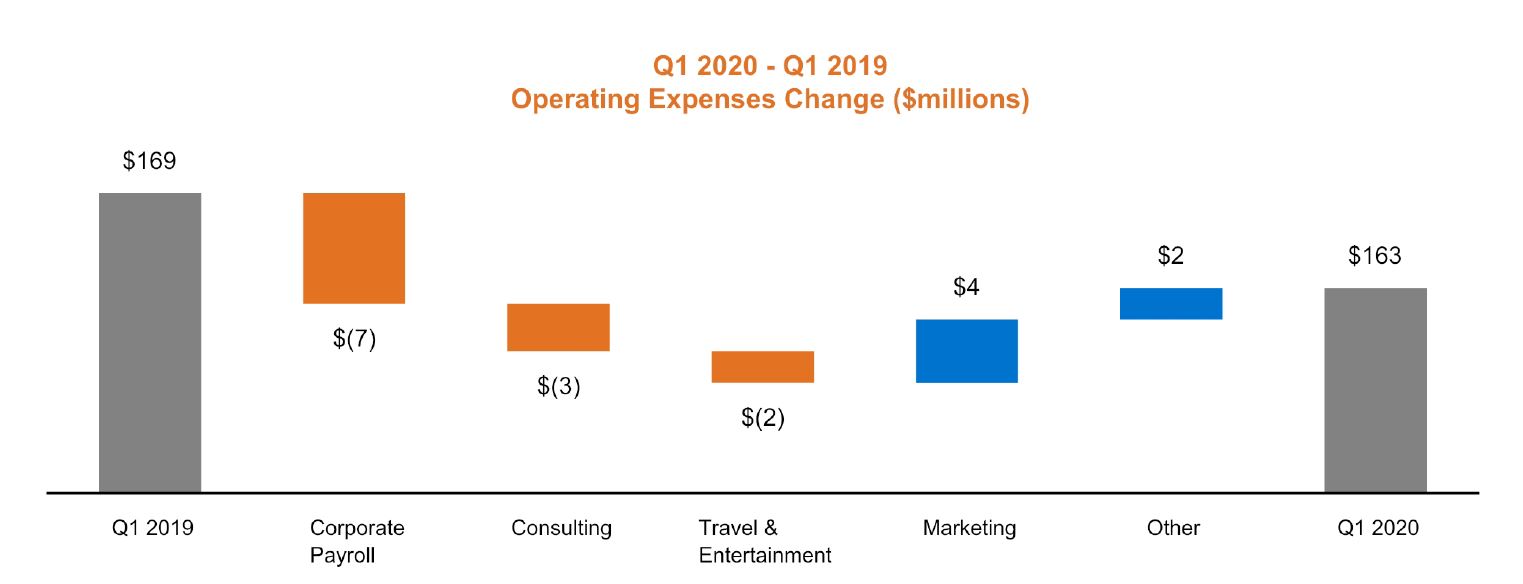
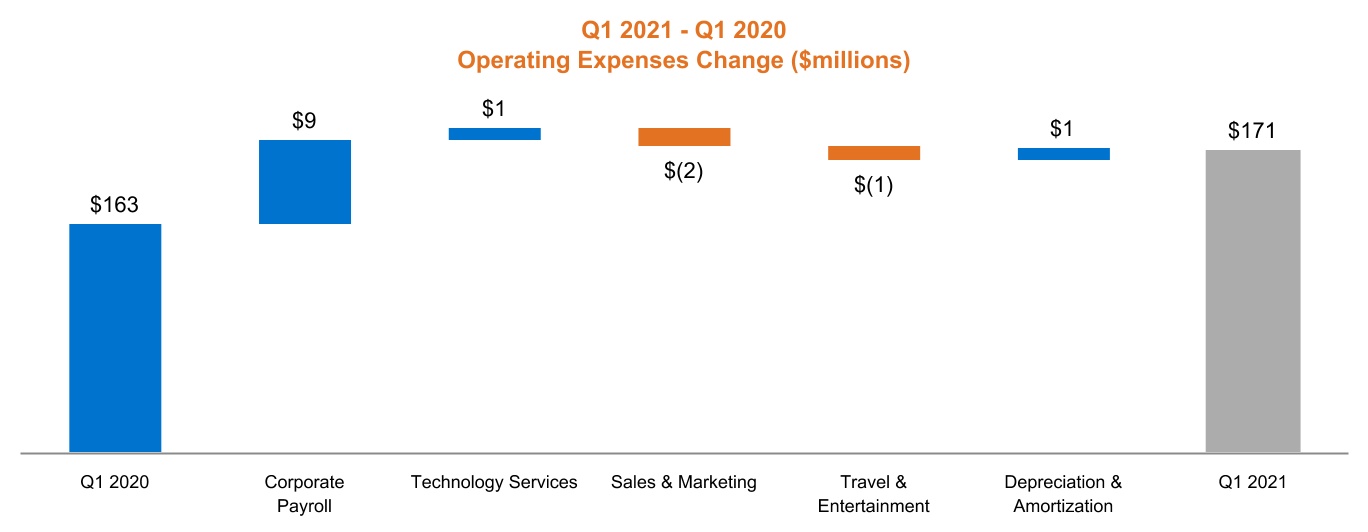
We analyze and present our OE based upon the business functions COPS, S&M, G&A and SD&P and depreciation and amortization.D&A. The charts below provide a view of the expenses of the business functions. Dollars are presented in millions and percentages represent year-over-year change.
|
| |
MANAGEMENT'S DISCUSSION AND ANALYSIS | |
|
| | | | |
| (in millions) | |
$169163 | | | Q1 20192020 Operating ExpenseExpenses |
| -3 |
| |
| | | |
| +3 | | | G&A decreasedincreased, driven primarily by increases in compensation related expenses. |
| +4 | | | SD&P increased, driven primarily by higher consulting expenses as we continue to work to improve our client experience and our systems and processes. |
| +1 | | | D&A remained consistent to the first quarter of 2020, driven by a decrease in compensation related expenses and professional fees such as consulting costs.2020. |
| $171 | -3 |
| | SD&P decreased in the first quarter of 2020, primarily due to a decrease in compensation related expenses. |
$163 | | | Q1 20202021 Operating Expenses |
We break outThe primary drivers to the changechanges in expenses that make up our OE in the chartare presented below:
| | | | | |
| MANAGEMENT'S DISCUSSION AND ANALYSIS | |
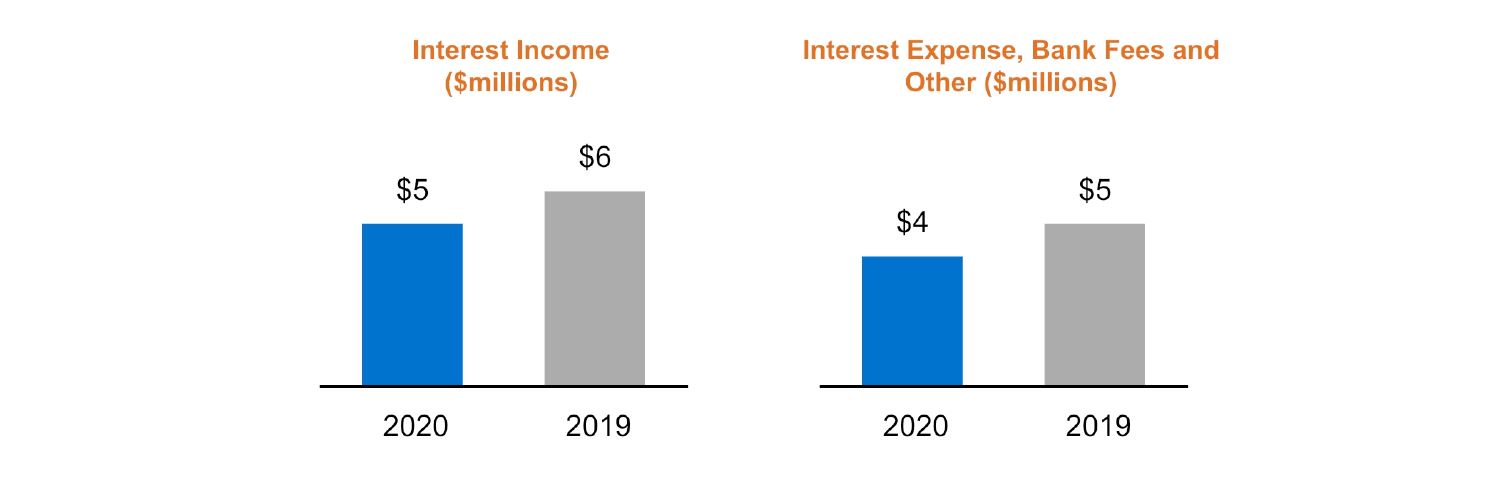
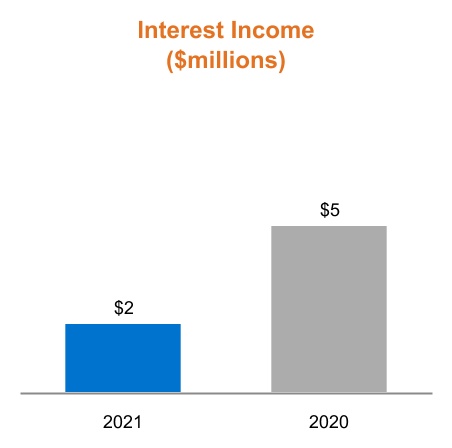
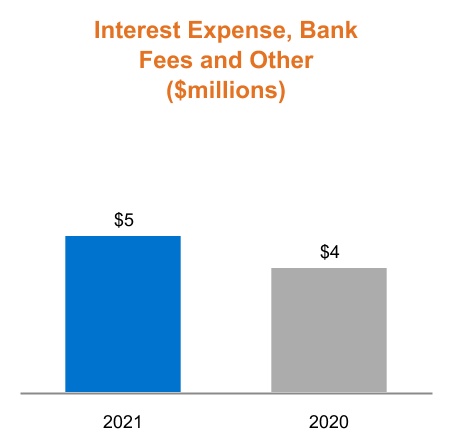
Other Income (Expense)
Other income (expense) consists primarily of interest and dividend income from investments, and interest expense under our previous credit facility.facility and interest on our 3.50% Senior Notes due 2029 (our 2029 Notes) issued in February 2021.
Interest income remained consistent year-over-year. Our investment strategy contributes decreased in the first quarter of 2021 primarily due to ourlower average market interest income, net income, Adjusted Net Income and Adjusted EBITDA.rates. Interest expense, bank fees and other decreased year-over-year due to the lower effective interest rateincreased in the first quarter of 2020 combined with the2021, as lower remaining balanceinterest rates on our long-term debt. Our2018 Term Loan for the two months outstanding was offset by higher interest expense is expected to increase in the future as a result of the $234 million draw down on our revolving credit facility in March 2020, which is intended2029 Notes and costs incurred due to enhancethe early repayment and termination of our short-term cash reserves.floating rate debt.
|
| |
MANAGEMENT'S DISCUSSION AND ANALYSIS | |
Provision for Income Taxes
Our effective tax rate (ETR) was 25% and 24% for the first quarter of 20202021 and 2019, respectively. The change in ETR was driven by a 2% increase primarily from a decrease in tax benefits recognized from excess tax benefits related to stock-based compensation offset by a 1% decrease from a benefit associated with prior year tax expense.
|
| | | | |
| MANAGEMENT'S DISCUSSION AND ANALYSIS | |
Liquidity and Capital Resources
Liquidity
Liquidity is a measure of our ability to access sufficient cash flows to meet the short-term and long-term cash requirements of our business operations. We believe that we have sufficient liquidity and capital resources to satisfy future requirements and meet our obligations to our clients, creditors and debt holders.
Included in our balance sheets are assets and liabilities resulting from transactions directly or indirectly associated with WSEs, including payroll and related taxes and withholdings, our sponsored workers' compensation and health insurance programs, and other benefit programs. Although we are not subject to regulatory restrictions that require us to do so, we distinguish and manage our corporate assets and liabilities separately from those current assets and liabilities held by us to satisfy our employer obligations associated with our WSEs as follows:
| | | | March 31, 2020 | | December 31, 2019 | | March 31, 2021 | | December 31, 2020 |
| (in millions) | Corporate | WSE | Total | | Corporate | WSE | Total | (in millions) | Corporate | WSE | Total | | Corporate | WSE | Total |
| Current assets: | | | | Current assets: | |
| Cash and cash equivalents | $ | 521 |
| $ | — |
| $ | 521 |
| | $ | 213 |
| $ | — |
| $ | 213 |
| Cash and cash equivalents | $ | 500 | | $ | — | | $ | 500 | | | $ | 301 | | $ | — | | $ | 301 | |
| Investments | 65 |
| — |
| 65 |
| | 68 |
| — |
| 68 |
| Investments | 71 | | — | | 71 | | | 57 | | — | | 57 | |
| Restricted cash, cash equivalents and investments | 15 |
| 764 |
| 779 |
| | 15 |
| 1,165 |
| 1,180 |
| Restricted cash, cash equivalents and investments | 15 | | 1,066 | | 1,081 | | | 15 | | 1,373 | | 1,388 | |
| Other current assets | 52 |
| 475 |
| 527 |
| | 45 |
| 365 |
| 410 |
| Other current assets | 68 | | 440 | | 508 | | | 59 | | 355 | | 414 | |
| Total current assets | $ | 653 |
| $ | 1,239 |
| $ | 1,892 |
| | $ | 341 |
| $ | 1,530 |
| $ | 1,871 |
| Total current assets | $ | 654 | | $ | 1,506 | | $ | 2,160 | | | $ | 432 | | $ | 1,728 | | $ | 2,160 | |
| | | | | |
| | Total current liabilities | $ | 369 |
| $ | 1,239 |
| $ | 1,608 |
| | $ | 113 |
| $ | 1,530 |
| $ | 1,643 |
| Total current liabilities | $ | 134 | | $ | 1,506 | | $ | 1,640 | | | $ | 142 | | $ | 1,728 | | $ | 1,870 | |
| | | | | |
| Working capital | $ | 284 |
| $ | — |
| $ | 284 |
| | $ | 228 |
| $ | — |
| $ | 228 |
| Working capital | $ | 520 | | $ | — | | $ | 520 | | | $ | 290 | | $ | — | | $ | 290 | |
|
Working capital for WSEs related activities
We designate funds to ensure that we have adequate current assets to satisfy our current obligations associated with WSEs.WSEs, the Recovery Credit liability and 2021 Credit Program liability. We expect the Recovery Credit and 2021 Credit Program liability of $102 million as of March 31, 2021 to be settled over the following 12 months. We manage our WSE payroll and benefits obligations through collections of payments from our clients which generally occurs two to three days in advance of client payroll dates. We regularly review our short-term obligations associated with our WSEs (such as payroll and related taxes, insurance premium and claim payments) and designate funds required to fulfill these short-term obligations, which we refer to as PFC. PFC is included in current assets as restricted cash, cash equivalents and investments.
We manage our sponsored benefit and workers' compensation insurance obligations by maintaining collateral funds in restricted cash, cash equivalents and investments. These collateral amounts are generally determined at the beginning of each plan year and we may be required by our insurance carriers to adjust our collateral balances when facts and circumstances change. We regularly review our collateral balances with our insurance carriers and anticipate funding further collateral in the future based upon our capital requirements. We classify our restricted cash, cash equivalents and investments as current and noncurrent assets to match against the anticipated timing of payments to carriers.
Working capital for corporate purposes
Corporate working capital as of March 31, 20202021 increased $56$230 million from December 31, 2019,2020, primarily driven by positive operating cashflow offset by stock repurchasesa $199 million increase in corporate unrestricted cash and investments in available for sales marketable securities. cash equivalents.
We use our available cash and cash equivalents to satisfy our operational and regulatory requirements and to fund capital expenditures. We believe that we can meet our present and reasonably foreseeable operating cash needs and future commitments through existing liquid assets, continuing cash flows from corporate operating activities and the potential issuance of debt or equity securities. We believe that our existing corporate cash and cash equivalents and positive working capital will be sufficient to meet our working capital and capital expenditure needs for at least the next twelve months.
|
| | | | |
| MANAGEMENT'S DISCUSSION AND ANALYSIS | |
Cash Flows
The following table presents our cash flow activities for the stated periods:
| | | | Three Months Ended March 31, | | Three Months Ended March 31, |
| (in millions) | 2020 | | 2019 | (in millions) | 2021 | | 2020 |
| | Corporate | WSE | Total | | Corporate | WSE | Total | | Corporate | WSE | Total | | Corporate | WSE | Total |
| Net cash provided by (used in): | | | | | | Net cash provided by (used in): | | | |
| Operating activities | $ | 119 |
| $ | (401 | ) | $ | (282 | ) | | $ | 78 |
| $ | (220 | ) | $ | (142 | ) | Operating activities | $ | 131 | | $ | (306) | | $ | (175) | | | $ | 119 | | $ | (401) | | $ | (282) | |
| Investing activities | (19 | ) | (75 | ) | (94 | ) | | (11 | ) | — |
| (11 | ) | Investing activities | 6 | | (9) | | (3) | | | (19) | | (75) | | (94) | |
| Financing activities | 185 |
| — |
| 185 |
| | (47 | ) | — |
| (47 | ) | Financing activities | 56 | | — | | 56 | | | 185 | | — | | 185 | |
| Net increase (decrease) in cash and cash equivalents, unrestricted and restricted | $ | 285 |
| $ | (476 | ) | $ | (191 | ) | | $ | 20 |
| $ | (220 | ) | $ | (200 | ) | Net increase (decrease) in cash and cash equivalents, unrestricted and restricted | $ | 193 | | $ | (315) | | $ | (122) | | | $ | 285 | | $ | (476) | | $ | (191) | |
| Cash and cash equivalents, unrestricted and restricted: | | | | Cash and cash equivalents, unrestricted and restricted: | |
| Beginning of period | 291 |
| 1,165 |
| 1,456 |
| | 425 |
| 924 |
| 1,349 |
| Beginning of period | 352 | | 1,291 | | 1,643 | | | 291 | | 1,165 | | 1,456 | |
| End of period | $ | 576 |
| $ | 689 |
| $ | 1,265 |
| | $ | 445 |
| $ | 704 |
| $ | 1,149 |
| End of period | $ | 545 | | $ | 976 | | $ | 1,521 | | | $ | 576 | | $ | 689 | | $ | 1,265 | |
| | | | | |
| Net increase (decrease) in cash and cash equivalents: | | | | Net increase (decrease) in cash and cash equivalents: | |
| Unrestricted | $ | 308 |
| $ | — |
| $ | 308 |
| | $ | 23 |
| $ | — |
| $ | 23 |
| Unrestricted | $ | 199 | | $ | — | | $ | 199 | | | $ | 308 | | $ | — | | $ | 308 | |
| Restricted | (23 | ) | (476 | ) | (499 | ) | | (3 | ) | (220 | ) | (223 | ) | Restricted | (6) | | (315) | | (321) | | | (23) | | (476) | | (499) | |
Operating Activities
Components of net cash provided by (used in) operating activities are as follows:
| | | | | | | | |
| | Three Months Ended March 31, |
| (in millions) | 2021 | 2020 |
| Net cash used in operating activities | $ | (175) | | $ | (282) | |
| Net cash used in operating activities - WSE | (306) | | $ | (401) | |
| Net cash provided by operating activities - Corporate | 131 | | 119 | |
|
| | | | | | |
| | Three Months Ended March 31, |
| (in millions) | 2020 | 2019 |
| Net income | $ | 91 |
| $ | 63 |
|
| Depreciation and amortization | 15 |
| 18 |
|
| Noncash lease expense | 4 |
| — |
|
| Stock based compensation expense | 9 |
| 9 |
|
| Payment of interest | (3 | ) | (4 | ) |
| Income tax payments, net | (1 | ) | (1 | ) |
| Changes in other operating assets | (16 | ) | (4 | ) |
| Changes in other operating liabilities | 20 |
| (3 | ) |
| Net cash provided by operating activities - Corporate | $ | 119 |
| $ | 78 |
|
| Collateral (paid to) refunded from insurance carriers, net | 1 |
| — |
|
| Changes in other operating assets | (110 | ) | (45 | ) |
| Changes in other operating liabilities | (292 | ) | (175 | ) |
| Net cash used in operating activities - WSE | $ | (401 | ) | $ | (220 | ) |
| Net cash used in operating activities | $ | (282 | ) | $ | (142 | ) |
Year-over-yearThe year-over-year change in net cash used in operating activities for WSE purposes was primarily driven by timing of client payments, payments of payroll and payroll taxes, and collateral fundingsettlement of the Recovery Credit, and insurance claim activities. We expect the changes in restricted cash and cash equivalents to correspond to WSE cash provided by (or used in) operations as we manage our obligations associated with WSEs through restricted cash.
Our corporate operating cash flows in the first quarter of 2020three months ended March 31, 2021 increased, when compared to the same period in 2019,2020, due to the increase in our net income and the timing of vendorour payments and liabilities associated with ourof corporate activities.
|
| | | | |
| MANAGEMENT'S DISCUSSION AND ANALYSIS | |
Investing Activities
Cash used in investing activities for the periods presented below primarily consisted of purchases of investments and capital expenditures, partially offset by proceeds from the sale and maturity of investments.
| | | | Three Months Ended March 31, | | Three Months Ended March 31, |
| (in millions) | 2020 | 2019 | (in millions) | 2021 | 2020 |
| Investments: | | Investments: | |
| Purchases of investments | (155 | ) | (30 | ) | Purchases of investments | (82) | | (155) | |
| Proceeds from sale and maturity of investments | 67 |
| 31 |
| Proceeds from sale and maturity of investments | 84 | | 67 | |
| | Cash provided by (used in) investments | $ | (88 | ) | $ | 1 |
| Cash provided by (used in) investments | $ | 2 | | $ | (88) | |
| | | |
| Capital expenditures: | | Capital expenditures: | |
| Software and hardware | $ | (6 | ) | $ | (7 | ) | Software and hardware | $ | (4) | | $ | (6) | |
| Office furniture, equipment and leasehold improvements | — |
| (5 | ) | Office furniture, equipment and leasehold improvements | (1) | | — | |
| Cash used in capital expenditures | $ | (6 | ) | $ | (12 | ) | Cash used in capital expenditures | $ | (5) | | $ | (6) | |
| Cash used in investing activities | $ | (94 | ) | $ | (11 | ) | Cash used in investing activities | $ | (3) | | $ | (94) | |
Investments
We invest a portion of available cash in investment-grade securities with effective maturities less than five years that are classified on our balance sheets as investments (unrestricted). investments.
We also invest funds held as collateral to satisfy our long-term obligation towards workers' compensation liabilities. These investments are classified on our balance sheets as restricted cash, cash equivalents and investments. We review the amount and the anticipated holding period of these investments regularly in conjunction with our estimated long-term workers' compensation liabilities and anticipated claims payment trend. At March 31, 2020,2021, our investments had a weighted average duration of 1.09less than 2 years and an average S&P credit rating of AA+.AA.
As of March 31, 2020,2021, we held approximately $1.7$2.0 billion in restricted and unrestricted cash, cash equivalents and investments, of which $521$500 million was unrestricted cash and cash equivalents and $195$201 million was unrestricted investments. Refer to Note 2 in the condensed consolidated financial statements and related notes included in this Form 10-Q for a summary of these funds.10-Q. Capital Expenditures
During the first quarter ofthree months ended March 31, 2021 and 2020, and 2019, we continued to make investments in software and hardware and we enhanced our existing productsservice offerings and technology platform. We expect capital investments in our software and hardware to continue in the future.
Financing Activities
Net cash provided by (used in) financing activities in the first quarter ofthree months ended March 31, 2021 and 2020 and 2019 consisted of our debt and equity-related activities.
|
| | | | | | |
| | Three Months Ended March 31, |
| (in millions) | 2020 | 2019 |
| Financing activities | | |
| Repurchase of common stock, net of issuance | $ | (43 | ) | $ | (41 | ) |
Draw down from revolving credit facility
| 234 |
| — |
|
| Repayment of borrowings | (6 | ) | (6 | ) |
| Cash provided by (used in) financing activities | $ | 185 |
| $ | (47 | ) |
In February 2020, our board of directors authorized a $300 million incremental increase to our ongoing stock repurchase program initiated in May 2014. We use this program to return value to our stockholders and to offset dilution from the issuance of stock under our equity-based incentive plan and employee purchase plan.
| | | | | | | | |
| | Three Months Ended March 31, |
| (in millions) | 2021 | 2020 |
| Financing activities | | |
| Repurchase of common stock, net of issuance | $ | (65) | | $ | (43) | |
Draw down from revolving credit facility
| — | | 234 | |
| Payment of long-term financing fees | (2) | | — | |
| Payment of debt issuance costs | (7) | | — | |
| Proceeds from issuance of 2029 Notes | 500 | | — | |
| Repayment of borrowings | (370) | | (6) | |
| Cash provided by financing activities | $ | 56 | | $ | 185 | |
|
| | | | |
| MANAGEMENT'S DISCUSSION AND ANALYSIS | |
During the first quarter of 2020,three months ended March 31, 2021, we repurchased 747,417744,001 shares of our common stock for approximately $40$60 million through our stock repurchase program. As of March 31, 2020,2021, approximately $495$298 million remained available for repurchase under all authorizations by our board of directors. We plan to use current cash and cash generated from ongoing operating activities to fund this sharestock repurchase program.
In responseFebruary 2021, we issued $500 million aggregate principal amount of our 2029 Notes. $370 million of the proceeds was used to economic uncertainties resulting from COVID-19, in March 2020 we drew down $234 million from our revolving credit facility to enhance our short-term cash reserves.repay and terminate the 2018 Term Loan A. The revolving credit facility is payable by June 2023 or earlier at our discretion.remaining funds will be used for general corporate purposes. Refer to Note 6 in the condensed consolidated financial statements and related notes included in this Form 10-Q for further information. In February 2021, concurrently with the closing of the 2029 Notes offering, we entered into a new $500 million revolving credit facility under a new credit agreement (our 2021 Credit Agreement). The 2021 Credit Agreement includes a $100 million letter of credit sub-facility and a $40 million swingline sub-facility. We also have the option to incur incremental credit facilities of up to the greater of $450 million and 100% of EBITDA for the most recent period of four fiscal quarters for which financial statements have been delivered. Such incremental facilities are subject to obtaining additional commitments from lenders.
Capital Resources
Sources of Funds
Our principal source of liquidity for operations is derived from cash provided by operating activities. We rely on cash provided by operating activities to meet our short-term liquidity requirements, which primarily relate to the payment of corporate payroll and other operating costs, and capital expenditures. Our cash flow related to WSE payroll and benefits is generally matched by advance collection from our clients. To minimize the credit risk associated with remitting the payroll and associated taxes and benefits costs, we require clients to prefund the payroll and related payroll taxes and benefits costs.
We believe that we can meet our present and reasonably foreseeable operating cash needs and future commitments through existing liquid assets and continuing cash flows from corporate operating activities.
Covenants
The Indenture governing the 2029 Notes includes restrictive covenants limiting our ability to: (i) create liens on certain assets to secure debt; (ii) grant a subsidiary guarantee of certain debt without also providing a guarantee of the 2029 Notes; and (iii) consolidate or merge with or into, or sell or otherwise dispose of all or substantially all of our assets to, another person, subject, in each case, to certain customary exceptions.
The 2021 Credit Agreement includes negative covenants that limit our ability to incur indebtedness and liens, sell assets and make restricted payments, including dividends and investments, subject to certain exceptions. In addition, the 2021 Credit Agreement also contains other customary affirmative and negative covenants and customary events of default. The 2021 Credit Agreement also contains a financial covenant that requires the Company to maintain certain maximum total net leverage ratios.
We were in compliance with theall financial covenants under our credit facilities2021 Credit Agreement at March 31, 2020. For information on the covenants under our 2018 credit facility, refer to Note 9 in Part II, Item 8. Financial Statements and Supplementary Data, of our Form 10-K.2021.
Off-Balance Sheet Arrangements
There have been no additional material changes in our off-balance sheet arrangements discussed in Part II, Item 7. Management's Discussion and Analysis of our 2019 Form 10-K.
Critical Accounting Policies, Estimates and Judgments
There have been no material changes to our critical accounting policies as discussed in our 20192020 Form 10-K.
Recent Accounting Pronouncements
ReferThere have been no material changes to Note 1our recent accounting pronouncements as discussed in Item 1 of thisour 2020 Form 10-Q.
|
| | | | |
QUANTITATIVE AND QUALITATIVE DISCLOSURES ABOUT MARKET RISK AND CONTROLS AND PROCEDURES | |
Quantitative and Qualitative Disclosures About Market Risk
Our exposure to changes in interest rates relates primarily to our investment portfolio and outstanding floating rate debt.portfolio. Changes in U.S. interest rates affect the interest earned on the Company’sCompany's cash, cash equivalents and investments and the fair value of the investments, as well as interest costs associated with our debt.
In June 2019, we entered into an interest rate collar derivative transaction with no upfront premium. We use this derivative to hedge against interest rate risk on a portion of our outstanding floating rate debt. We have designated this derivative as a cash flow hedge. Our primary objective in purchasing and holding this derivative is to reduce our volatility of net earnings and cash flows associated with changes in the benchmark interest rate in our interest rate payments. We do not enter into any derivatives for trading or other speculative purposes.
We performed a sensitivity analysis to determine the impact a change in interest rates would have on the cash flows of the collar assuming a 100 basis point parallel shift in the current LIBOR rate. Based on the terms and remaining settlements as of March 31, 2020, a hypothetical 100 basis point increase in one-month LIBOR across all maturities would not result in any cash receipts by the Company, while a hypothetical 100 basis point decrease in one-month LIBOR across all maturities would result in cash payments of $2 million.investments.
Our cash equivalents consist primarily of money market mutual funds, which are not significantly exposed to interest rate risk. Our AFS marketable securitiesinvestments are subject to interest rate risk because these securities generally include a fixed interest rate. As a result, the market values of these securities are affected by changes in prevailing interest rates. We attempt to limit our exposure to interest rate risk and credit risk by investing our investment portfolio in instruments that meet the minimum credit quality, liquidity, diversification and other requirements of our investment policy. Our AFS marketable securitiesinvestments consist of highly liquid, investment-grade securities. The risk of rate changes on investment balances was not significantmaterial at March 31, 20202021 and December 31, 2019.2020.
At March 31, 2020, we had total long-term debt and revolving credit agreement borrowings (total debt) of $620 million. A 100 basis point increase or decrease in market interest rates would cause interest expense on our debt as of March 31, 2020 to increase by $6 million or decrease by $5 million over the next twelve months of the aggregate long-term debt and revolving credit agreement borrowings, respectively.At December 31, 2019, we had total outstanding long-term debt of $391 million. A 100 basis point increase or decrease in market interest rates would cause interest expense on our debt as of December 31, 2019 to increase by $3 million or to decrease by $4 million over the next twelve months of the loan, respectively.26
| | | | | |
QUANTITATIVE AND QUALITATIVE DISCLOSURES ABOUT MARKET RISK AND CONTROLS AND PROCEDURES | |
Controls and Procedures
Evaluation of Disclosure Controls and Procedures
We have, with the participation of our Chief Executive Officer (CEO) and our Chief Financial Officer (CFO), evaluated the effectiveness of our disclosure controls and procedures as of March 31, 2020,2021, as defined in Rules 13a-15(e) and 15d-15(e) under the Securities Exchange Act of 1934, as amended, or the Exchange Act.
Based on the evaluation of our disclosure controls and procedures as of March 31, 2020,2021, our CEO and CFO have concluded that the Company’s disclosure controls and procedures were effective as of such date in ensuring that (i) information required to be disclosed by the Company in reports that it files or submits under the Exchange Act is accumulated and communicated to the Company’s management, including the CEO and CFO, to allow timely decisions regarding required disclosure and (ii) such information is recorded, processed, summarized and reported within the time periods specified in the SEC rules and forms.
We have concluded that the condensed consolidated financial statements included in this Quarterly Report on Form 10-Q fairly present, in all material respects, our financial position, results of operations and cash flows for the periods presented in conformity with GAAP.
Changes in Internal Control Over Financial Reporting
There were no changes in our internal control over financial reporting identified in connection with the evaluation required by Rule 13a-15(d) and 15d-15(d) of the Exchange Act that occurred during the quarter ended March 31, 2020,2021, that have materially affected, or are reasonably likely to materially affect, our internal control over financial reporting.
Limitations on Effectiveness of Controls and Procedures
In designing and evaluating the disclosure controls and procedures, management recognizes that any controls and procedures, no matter how well designed and operated, can provide only reasonable assurance of achieving the desired control objectives. In addition, the design of disclosure controls and procedures must reflect the fact that there are resource constraints and that management is required to apply judgment in evaluating the benefits of possible controls and procedures relative to their costs.
TRINET GROUP, INC.
CONDENSED CONSOLIDATED STATEMENTS OF INCOME AND COMPREHENSIVE INCOME (Unaudited)
| | | | Three Months Ended March 31, | | | Three Months Ended March 31, |
| (in millions except per share data) | 2020 | 2019 | (in millions except per share data) | | 2021 | 2020 |
| Professional service revenues | $ | 156 |
| $ | 136 |
| Professional service revenues | | $ | 153 | | $ | 156 | |
| Insurance service revenues | 892 |
| 798 |
| Insurance service revenues | | 907 | | 892 | |
| Total revenues | 1,048 |
| 934 |
| Total revenues | | 1,060 | | 1,048 | |
| Insurance costs | 765 |
| 683 |
| Insurance costs | | 751 | | 765 | |
| Cost of providing services | 64 |
| 64 |
| Cost of providing services | | 64 | | 64 | |
| Sales and marketing | 46 |
| 46 |
| Sales and marketing | | 46 | | 46 | |
| General and administrative | 33 |
| 36 |
| General and administrative | | 36 | | 33 | |
| Systems development and programming | 9 |
| 12 |
| Systems development and programming | | 13 | | 9 | |
| Depreciation and amortization of intangible assets | 11 |
| 11 |
| Depreciation and amortization of intangible assets | | 12 | | 11 | |
| Total costs and operating expenses | 928 |
| 852 |
| Total costs and operating expenses | | 922 | | 928 | |
| Operating income | 120 |
| 82 |
| Operating income | | 138 | | 120 | |
| Other income (expense): | | Other income (expense): | | |
| Interest expense, bank fees and other | (4 | ) | (5 | ) | Interest expense, bank fees and other | | (5) | | (4) | |
| Interest income | 5 |
| 6 |
| Interest income | | 2 | | 5 | |
| Income before provision for income taxes | 121 |
| 83 |
| Income before provision for income taxes | | 135 | | 121 | |
| Income taxes | 30 |
| 20 |
| Income taxes | | 34 | | 30 | |
| Net income | $ | 91 |
| $ | 63 |
| Net income | | $ | 101 | | $ | 91 | |
| Other comprehensive income, net of income taxes | 2 |
| — |
| |
| Other comprehensive (loss) income, net of income taxes | | Other comprehensive (loss) income, net of income taxes | | (1) | | 2 | |
| Comprehensive income | $ | 93 |
| $ | 63 |
| Comprehensive income | | $ | 100 | | $ | 93 | |
| | | | | |
| Net income per share: | | Net income per share: | | |
| Basic | $ | 1.32 |
| $ | 0.91 |
| Basic | | $ | 1.53 | | $ | 1.32 | |
| Diluted | $ | 1.31 |
| $ | 0.89 |
| Diluted | | $ | 1.51 | | $ | 1.31 | |
| Weighted average shares: | | Weighted average shares: | | |
| Basic | 68 |
| 70 |
| Basic | | 66 | | 68 | |
| Diluted | 69 |
| 71 |
| Diluted | | 67 | | 69 | |
See accompanying notes.
TRINET GROUP, INC.
CONDENSED CONSOLIDATED BALANCE SHEETS (Unaudited)
| | | | | March 31, | | December 31, | | March 31, | | December 31, |
| (in millions, except share and per share data) | | 2020 | | 2019 | (in millions, except share and per share data) | | 2021 | | 2020 |
| ASSETS | | | | | ASSETS | |
| Current assets: | | | | | Current assets: | |
| Cash and cash equivalents | | $ | 521 |
| | $ | 213 |
| Cash and cash equivalents | | $ | 500 | | | $ | 301 | |
| Investments | | 65 |
| | 68 |
| Investments | | 71 | | | 57 | |
| Restricted cash, cash equivalents and investments | | 779 |
| | 1,180 |
| Restricted cash, cash equivalents and investments | | 1,081 | | | 1,388 | |
| Accounts receivable, net | | 9 |
| | 9 |
| Accounts receivable, net | | 5 | | | 18 | |
| Unbilled revenue, net | | 380 |
| | 285 |
| Unbilled revenue, net | | 340 | | | 246 | |
| Prepaid expenses, net | | 55 |
| | 52 |
| Prepaid expenses, net | | 58 | | | 63 | |
| Other current assets | | 83 |
| | 64 |
| Other current assets | | 105 | | | 87 | |
| Total current assets | | 1,892 |
| | 1,871 |
| Total current assets | | 2,160 | | | 2,160 | |
| Restricted cash, cash equivalents and investments, noncurrent | | 204 |
| | 212 |
| Restricted cash, cash equivalents and investments, noncurrent | | 184 | | | 210 | |
| Investments, noncurrent | | 130 |
| | 125 |
| Investments, noncurrent | | 130 | | | 138 | |
| Property, equipment and software, net | | 82 |
| | 85 |
| Property, equipment and software, net | | 75 | | | 79 | |
| Operating lease right-of-use asset | | 52 |
| | 55 |
| Operating lease right-of-use asset | | 51 | | | 51 | |
| Goodwill | | 289 |
| | 289 |
| Goodwill | | 294 | | | 294 | |
| Other intangible assets, net | | 14 |
| | 15 |
| Other intangible assets, net | | 17 | | | 18 | |
| Other assets | | 102 |
| | 96 |
| Other assets | | 94 | | | 93 | |
| Total assets | | $ | 2,765 |
| | $ | 2,748 |
| Total assets | | $ | 3,005 | | | $ | 3,043 | |
| Liabilities and stockholders' equity | | | | | Liabilities and stockholders' equity | |
| Current liabilities: | | | | | Current liabilities: | |
| Accounts payable and other current liabilities | | $ | 63 |
| | $ | 31 |
| Accounts payable and other current liabilities | | $ | 84 | | | $ | 50 | |
| Revolving credit agreement borrowings | | 234 |
| | — |
| |
| | Long-term debt | | 22 |
| | 22 |
| Long-term debt | | 0 | | | 22 | |
| Client deposits | | 38 |
| | 44 |
| |
| Client deposits and other client liabilities | | Client deposits and other client liabilities | | 151 | | | 134 | |
| Accrued wages | | 429 |
| | 391 |
| Accrued wages | | 488 | | | 309 | |
| Accrued health insurance costs, net | | 165 |
| | 167 |
| Accrued health insurance costs, net | | 165 | | | 172 | |
| Accrued workers' compensation costs, net | | 63 |
| | 61 |
| Accrued workers' compensation costs, net | | 59 | | | 59 | |
| Payroll tax liabilities and other payroll withholdings | | 567 |
| | 901 |
| Payroll tax liabilities and other payroll withholdings | | 668 | | | 1,095 | |
| Operating lease liabilities | | 16 |
| | 17 |
| Operating lease liabilities | | 12 | | | 11 | |
| Insurance premiums and other payables | | 11 |
| | 9 |
| Insurance premiums and other payables | | 13 | | | 18 | |
| Total current liabilities | | 1,608 |
| | 1,643 |
| Total current liabilities | | 1,640 | | | 1,870 | |
| Long-term debt, noncurrent | | 364 |
| | 369 |
| Long-term debt, noncurrent | | 494 | | | 348 | |
| Accrued workers' compensation costs, noncurrent, net | | 145 |
| | 144 |
| Accrued workers' compensation costs, noncurrent, net | | 138 | | | 138 | |
| Deferred taxes | | 62 |
| | 61 |
| Deferred taxes | | 21 | | | 22 | |
| Operating lease liabilities, noncurrent | | 45 |
| | 48 |
| Operating lease liabilities, noncurrent | | 49 | | | 49 | |
| Other non-current liabilities | | 8 |
| | 8 |
| Other non-current liabilities | | 10 | | | 9 | |
| Total liabilities | | 2,232 |
| | 2,273 |
| Total liabilities | | 2,352 | | | 2,436 | |
| Commitments and contingencies (see Note 7) | |
| |
| Commitments and contingencies (see Note 7) | | 0 | | 0 |
| Stockholders' equity: | | | | | Stockholders' equity: | |
| Preferred stock | | — |
| | — |
| Preferred stock | | 0 | | | 0 | |
| ($0.000025 par value per share; 20,000,000 shares authorized; no shares issued or outstanding at March 31, 2020 and December 31, 2019) | | | | | |
| ($0.000025 par value per share; 20,000,000 shares authorized; 0 shares issued or outstanding at March 31, 2021 and December 31, 2020) | | ($0.000025 par value per share; 20,000,000 shares authorized; 0 shares issued or outstanding at March 31, 2021 and December 31, 2020) | |
| Common stock and additional paid-in capital | | 703 |
| | 694 |
| Common stock and additional paid-in capital | | 758 | | | 747 | |
| ($0.000025 par value per share; 750,000,000 shares authorized; 68,470,050 and 69,065,491 shares issued and outstanding at March 31, 2020 and December 31, 2019, respectively) | | | | | |
($0.000025 par value per share; 750,000,000 shares authorized; 65,881,233 and 66,456,663 shares issued and outstanding at March 31, 2021 and December 31, 2020, respectively) | | ($0.000025 par value per share; 750,000,000 shares authorized; 65,881,233 and 66,456,663 shares issued and outstanding at March 31, 2021 and December 31, 2020, respectively) | |
| Accumulated deficit | | (172 | ) | | (219 | ) | Accumulated deficit | | (108) | | | (144) | |
| Accumulated other comprehensive income | | 2 |
| | — |
| Accumulated other comprehensive income | | 3 | | | 4 | |
| Total stockholders' equity | | 533 |
| | 475 |
| Total stockholders' equity | | 653 | | | 607 | |
| Total liabilities & stockholders' equity | | $ | 2,765 |
| | $ | 2,748 |
| Total liabilities & stockholders' equity | | $ | 3,005 | | | $ | 3,043 | |
See accompanying notes.
TRINET GROUP, INC.
CONDENSED CONSOLIDATED STATEMENTS OF STOCKHOLDERS' EQUITY (Unaudited)
| | | | Three Months Ended March 31, | | | Three Months Ended March 31, |
(in millions)
| 2020 | 2019 | (in millions)
| | 2021 | 2020 |
| Total Stockholders' Equity, beginning balance | $ | 475 |
| $ | 375 |
| Total Stockholders' Equity, beginning balance | | $ | 607 | | $ | 475 | |
| Common Stock and Additional Paid-In Capital | | Common Stock and Additional Paid-In Capital | | |
| Beginning balance | 694 |
| 641 |
| Beginning balance | | 747 | | 694 | |
| Issuance of common stock from exercise of stock options | — |
| 1 |
| |
| | Stock based compensation expense | 9 |
| 9 |
| Stock based compensation expense | | 11 | | 9 | |
| | Ending balance | 703 |
| 651 |
| Ending balance | | 758 | | 703 | |
| | | | | |
| Accumulated Deficit | | Accumulated Deficit | | |
| Beginning balance | (219 | ) | (266 | ) | Beginning balance | | (144) | | (219) | |
| Net income | 91 |
| 63 |
| Net income | | 101 | | 91 | |
| | Repurchase of common stock | (40 | ) | (38 | ) | Repurchase of common stock | | (60) | | (40) | |
| Awards effectively repurchased for required employee withholding taxes | (4 | ) | (4 | ) | Awards effectively repurchased for required employee withholding taxes | | (5) | | (4) | |
| Ending balance | (172 | ) | (245 | ) | Ending balance | | (108) | | (172) | |
| | | | | |
| Accumulated Other Comprehensive Loss | | |
| Accumulated Other Comprehensive Income | | Accumulated Other Comprehensive Income | | |
| Beginning balance | — |
| — |
| Beginning balance | | 4 | | 0 | |
| Other comprehensive income | 2 |
| — |
| |
| Other comprehensive (loss) income | | Other comprehensive (loss) income | | (1) | | 2 | |
| Ending balance | 2 |
| — |
| Ending balance | | 3 | | 2 | |
| Total Stockholders' Equity, ending balance | $ | 533 |
| $ | 406 |
| Total Stockholders' Equity, ending balance | | $ | 653 | | $ | 533 | |
|
See accompanying notes.
TRINET GROUP, INC.
CONDENSED CONSOLIDATED STATEMENTS OF CASH FLOWS (Unaudited)
| | | | Three Months Ended March 31, | | Three Months Ended March 31, |
| (in millions) | 2020 | 2019 | (in millions) | 2021 | 2020 |
| Operating activities | | Operating activities | |
| Net income | 91 |
| 63 |
| Net income | $ | 101 | | $ | 91 | |
| Adjustments to reconcile net income to net cash provided by operating activities: | | Adjustments to reconcile net income to net cash provided by operating activities: | | |
| Depreciation and amortization | 15 |
| 18 |
| Depreciation and amortization | 19 | | 15 | |
| Noncash lease expense | 4 |
| — |
| |
| Amortization of ROU | | Amortization of ROU | 3 | | 4 | |
| Accretion of discount rate on lease liabilities | | Accretion of discount rate on lease liabilities | 1 | | 0 | |
| Amortization of premium of investments | | Amortization of premium of investments | 1 | | 0 | |
| Stock based compensation | 9 |
| 9 |
| Stock based compensation | 11 | | 9 | |
| | Changes in operating assets and liabilities: | | Changes in operating assets and liabilities: | | |
| Accounts receivable, net | — |
| 1 |
| Accounts receivable, net | 13 | | 0 | |
| Unbilled revenue, net | (95 | ) | (9 | ) | Unbilled revenue, net | (94) | | (95) | |
| Prepaid expenses, net | (3 | ) | (12 | ) | Prepaid expenses, net | 5 | | (3) | |
| | Accounts payable and other current liabilities | 29 |
| 9 |
| Accounts payable and other current liabilities | 33 | | 29 | |
| Client deposits | (6 | ) | (19 | ) | |
| Client deposits and other client liabilities | | Client deposits and other client liabilities | 17 | | (6) | |
| Accrued wages | 38 |
| 17 |
| Accrued wages | 179 | | 38 | |
| Accrued health insurance costs, net | (2 | ) | — |
| Accrued health insurance costs, net | (7) | | (2) | |
| Accrued workers' compensation costs, net | 3 |
| (2 | ) | Accrued workers' compensation costs, net | 0 | | 3 | |
| Payroll taxes payable and other payroll withholdings | (334 | ) | (180 | ) | Payroll taxes payable and other payroll withholdings | (426) | | (334) | |
| Operating lease liabilities | (5 | ) | (4 | ) | Operating lease liabilities | (3) | | (5) | |
| Other assets | (28 | ) | (30 | ) | Other assets | (24) | | (28) | |
| Other liabilities | 2 |
| (3 | ) | Other liabilities | (4) | | 2 | |
| Net cash used in operating activities | (282 | ) | (142 | ) | Net cash used in operating activities | (175) | | (282) | |
| Investing activities | | Investing activities | | |
| Purchases of marketable securities | (155 | ) | (30 | ) | Purchases of marketable securities | (82) | | (155) | |
| Proceeds from sales and maturities of marketable securities | 67 |
| 31 |
| |
| Proceeds from sale and maturity of marketable securities | | Proceeds from sale and maturity of marketable securities | 84 | | 67 | |
| Acquisitions of property and equipment | (6 | ) | (12 | ) | Acquisitions of property and equipment | (5) | | (6) | |
| | Net cash used in investing activities | (94 | ) | (11 | ) | Net cash used in investing activities | (3) | | (94) | |
| Financing activities | | Financing activities | | |
| Repurchase of common stock | (40 | ) | (38 | ) | Repurchase of common stock | (60) | | (40) | |
| Proceeds from issuance of common stock | — |
| 1 |
| |
| | Awards effectively repurchased for required employee withholding taxes | (3 | ) | (4 | ) | Awards effectively repurchased for required employee withholding taxes | (5) | | (3) | |
| Proceeds from revolving credit agreement borrowings | 234 |
| — |
| Proceeds from revolving credit agreement borrowings | 0 | | 234 | |
| Payment of long-term financing fees | | Payment of long-term financing fees | (2) | | 0 | |
| Payment of debt issuance costs | | Payment of debt issuance costs | (7) | | 0 | |
| Proceeds from issuance of 2029 Notes | | Proceeds from issuance of 2029 Notes | 500 | | 0 | |
| Repayment of debt | (6 | ) | (6 | ) | Repayment of debt | (370) | | (6) | |
| Net cash provided by (used in) financing activities | 185 |
| (47 | ) | |
| Net cash provided by financing activities | | Net cash provided by financing activities | 56 | | 185 | |
| Net decrease in cash and cash equivalents, unrestricted and restricted | (191 | ) | (200 | ) | Net decrease in cash and cash equivalents, unrestricted and restricted | (122) | | (191) | |
| Cash and cash equivalents, unrestricted and restricted: | | Cash and cash equivalents, unrestricted and restricted: | | |
| Beginning of period | 1,456 |
| 1,349 |
| Beginning of period | 1,643 | | 1,456 | |
| End of period | 1,265 |
| 1,149 |
| End of period | $ | 1,521 | | $ | 1,265 | |
| | | | | |
| Supplemental disclosures of cash flow information | | Supplemental disclosures of cash flow information | | |
| Interest paid | 3 |
| 4 |
| Interest paid | $ | 2 | | $ | 3 | |
| Income taxes paid, net | 1 |
| 1 |
| Income taxes paid, net | 2 | | 1 | |
| Supplemental schedule of noncash investing and financing activities | | Supplemental schedule of noncash investing and financing activities | | |
| Payable for purchase of property and equipment | 1 |
| 5 |
| Payable for purchase of property and equipment | $ | 3 | | $ | 1 | |
See accompanying notes.
NOTES TO CONDENSED CONSOLIDATED FINANCIAL STATEMENTS
(Unaudited)
NOTE 1. DESCRIPTION OF BUSINESS AND SIGNIFICANT ACCOUNTING POLICIES
Description of Business
TriNet Group, Inc. (TriNet, or the Company, we, our and us), a professional employer organization, provides comprehensive human resources solutions for small to midsizeand medium-size businesses under a co-employment model. These HR solutions include multi-state payroll processing and tax administration, employee benefits programs, including health insurance and retirement plans, workers' compensation insurance and claims management, employment and benefit law compliance, and other HR-related services. Through the co-employment relationship, we are the employer of record for certain employment-related administrative and regulatory purposes for the worksite employees (WSEs), including:
•compensation through wages and salaries,
•certain employer payroll-related tax payments,
•employee payroll-related tax withholdings and payments,
•employee benefit programs, including health and life insurance, and others, and
•workers' compensation coverage.
Our clients are responsible for the day-to-day job responsibilities of the WSEs.
We operate in 1 reportable segment. All of our service revenues are generated from external clients. Less than 1% of our revenue is generated outside of the U.S.
Basis of Presentation
These unaudited condensed consolidated financial statements and accompanying notes have been prepared in accordance with accounting principles generally accepted in the United States of America for interim financial reporting and the instructions to Form 10-Q and Rule 10-01 of Regulation S-X of the Rules and Regulations of the Securities and Exchange Commission. Certain information and note disclosures included in our annual financial statements prepared in accordance with GAAP have been condensed or omitted pursuant to such rules and regulations. In the opinion of management, the condensed consolidated financial statements reflect all adjustments, that are normal and recurring in nature, necessary for fair financial statement presentation. The results of operations for the three months ended March 31, 20202021 are not necessarily indicative of the operating results anticipated for the full year. These Financial Statementsfinancial statements should be read in conjunction with the audited Consolidated Financial Statements included in Part II, Item 8. Financial Statements and Supplementary Data of our Annual Report on Form 10-K for the year ended December 31, 2019 (20192020 (2020 Form 10-K).
Use of Estimates
The preparation of financial statements in conformity with GAAP requires us to make estimates and assumptions that affect certain reported amounts and related disclosures.
These estimates are based on historical experience and on various other assumptions that we believe to be reasonable from the facts available to us. Some of the assumptions are highly uncertain at the time of estimation. To the extent actual experience differs from the assumptions used, our consolidated financial statements could be materially affected.
Revenue Recognition
Performance Obligations
In April 2020, we created our Recovery Credit program to assist in the economic recovery of our existing SMB clients and enhance our ability to retain these clients. Under this one-time program eligible clients will receive reductions against fees for future services, accounted for as a discount, over the following 12 months. This option to renew future services at a discount represents a material right and is accounted for as a performance obligation (Recovery Credit). This performance obligation will be satisfied when the clients have successfully renewed the services contracts and the future services are transferred.
The consideration we receive that is allocated to this performance obligation is deferred as an unsatisfied performance obligation and is included in client deposits and other client liabilities on the balance sheet. The amount of consideration we defer each period is dependent on the timing of when eligible clients will receive the Recovery Credit, which is subject to a limit on the total amount of $145 million.
The change in the balance of the Recovery Credit unsatisfied performance obligation was as follows:
| | | | | | |
| Three Months Ended March 31, |
| (in millions) | 2021 | |
| | |
| Balance at beginning of period | $ | 92 |
32
|
| |
FINANCIAL STATEMENTS(+) Accruals | 12 | | |
| (-) Distributions to clients | (27) | | |
| Balance at end of period | $ | 77 | | |
Revenue Recognition
Unbilled Revenue
We recognize WSE payroll and payroll tax liabilities in the period in which the WSEs perform work. When clients' pay periods cross reporting periods,Our contracts with clients generally do not include any variable consideration. However, from time to time, we accrue the portion of the unpaid WSE payroll where we assume, under state regulations, the obligation for the payment of wages and the corresponding payroll tax liabilities associated with the work performed priormay offer credits to period-end. These estimated payroll and payroll tax liabilities are recorded in accrued wages. The associated receivables, including estimated revenues, offset by advance collections fromour clients and an allowance for credit losses,considered to be variable consideration. Incentive credits related to contract renewals are recorded as unbilled revenue. Asa reduction to revenue as part of the transaction price at contract inception and are allocated among the performance obligations based on their relative standalone selling prices. Credits based on the performance of our insurance costs are recorded as a reduction to insurance services revenues and included in client deposits and other client liabilities on the balance sheet. In the three months ended March 31, 2021, we accrued $25 million under our 2021 Credit Program, payable within 12 months to eligible clients as of March 31, 2020, advance collections included in unbilled revenue were $47 million.
Investments
Our investments are primarily classified as available-for-sale and are carried at estimated fair value.
Unrealized gains and losses are reported as a component of accumulated other comprehensive income, net of deferred income taxes. The amortized cost of debt investments is adjusted for amortization of premiums and accretion of discounts from the date of purchase2021, related to the earliest call date for premiums or the maturity date for discounts. Such amortization is included in interest income as an addition to or deduction from the coupon interest earned on the investments. We use the specific identification method to determine realized gains and losses on the sale of available-for-sale securities. Realized gains and losses are included in interest income in the accompanying consolidated statements of income and comprehensive income.
We assess our investments for credit impairment. We review several factors to determine whether an unrealized loss is credit related, such as the financial condition and future prospects of the issuer. To the extent that a security’s amortized cost basis exceeds the present value of the cash flows expected to be collected from the security, an allowance for credit losses will be recognized. If management intends to sell or will more likely than not be required to sell the security before any anticipated recovery, a write down will be recognized in earnings measured as the entire difference between the amortized cost and the then-current fair value.
We have investments within our unrestricted and our restricted accounts. Unrestricted investments are recorded on the balance sheet as current or noncurrent based upon the remaining time to maturity, and investments subject to restrictions are classified as current or noncurrent based on the expected payout of the related liability.
Accounts Receivable
Our accounts receivable represents outstanding gross billings to clients, net of an allowance for estimated credit losses. We require our clients to prefund payroll and related liabilities before payroll is processed or due for payment. If a client fails to fund payroll or misses the funding cut-off, at our sole discretion, we may pay the payroll and the resulting amounts due to us are recognized as accounts receivable. When client payment is received in advanceperformance of our performance underhealth insurance costs for the contract, such amount is recorded as client deposits. We establish an allowance for credit losses based on the credit quality of clients, current economic conditions, the age of the accounts receivable balances, historical experience, and other factors that may affect clients’ ability to pay, and charge-off amounts against the allowance when they are deemed uncollectible. The allowance was immaterial at March 31, 2020 and December 31, 2019.year.
Accrued Health Insurance Costs
We sponsor and administer a number of fully insured, risk-based employee benefit plans, including group health, dental, and vision as an employer plan sponsor under section 3(5) of the ERISA. In the three months ended March 31, 2020,2021, a majority of our group health insurance costs related to risk-based plans. Our remaining group health insurance costs were for guaranteed-cost policies.
Accrued health insurance costs are established to provide for the estimated unpaid costs of reimbursing the carriers for paying claims within the deductible layer in accordance with risk-based health insurance policies. These accrued costs include estimates for reported losses, plus estimates for claims incurred but not paid. We assess accrued health insurance costs regularly based upon external actuarial studies that include other relevant factors such as current and historical claims payment patterns, plan enrollment and medical trend rates.
In certain carrier contracts we are required to prepay the expected claims activity for subsequent periods. These prepaid balances by agreement permit net settlement of obligations and offset the accrued health insurance costs. As of March 31, 20202021 and December 31, 2019,2020, prepayments and miscellaneous receivables offsetting accrued health insurance costs were $40$52 million and $39$49 million, respectively. When the prepaid amount is in excess of our recorded liability the net asset position is included in prepaid expenses. As of March 31, 20202021 and December 31, 2019,2020, accrued health insurance costs offsetting prepaid expenses were $58$70 million and $52$58 million, respectively.
Recent Accounting Pronouncements
Recently adopted accounting guidanceWe adopted ASU 2016-13 - Financial Instruments - Credit Losses (ASC Topic 326) effective January 1, 2020 using a modified retrospective approach, under which we recognized the cumulative effects of initially applying the Standard as an adjustment to the opening balance of retained earnings on January 1, 2020 with unchanged comparative periods. We are required to use forward-looking information when evaluating an allowance for our accounts receivable, unbilled revenue and other financial assets measured at amortized cost. ASC Topic 326 also modified the impairment guidance for available-for-sale debt securities to require an allowance for credit losses. The adoption of ASC Topic 326 did not have a material effect on our financial statements.33
NOTE 2. CASH, CASH EQUIVALENTS AND INVESTMENTS - UNRESTRICTED AND RESTRICTED
Under the terms of the agreements with certain of our workers' compensation and health benefit insurance carriers, we are required to maintain collateral in trust accounts for the benefit of specified insurance carriers and to reimburse the carriers’ claim payments within our deductible layer. We invest a portion of the collateral amounts in marketable securities. We report the current and noncurrent portions of these trust accounts as restricted cash, cash equivalents and investments on the consolidated balance sheets.
We require our clients to prefund their payroll and related taxes and other withholding liabilities before payroll is processed or due for payment. This prefund is included in restricted cash, cash equivalents and investments as payroll funds collected, which is designated to pay pending payrolls, payroll tax liabilities and other payroll withholdings.
We also invest available corporate funds, primarily in fixed income securities which meet the requirements of our corporate investment policy and are classified as available for sale (AFS).
Our total cash, cash equivalents and investments are summarized below:
|
| | | | | | | | | | | | | | | | | | | | | | | | | |
| | March 31, 2020 | | December 31, 2019 |
| (in millions) | Cash and cash equivalents | Available-for-sale marketable securities | Certificate of deposits | Total | | Cash and cash equivalents | Available-for-sale marketable securities | Certificate of deposits | Total |
| Cash and cash equivalents | $ | 521 |
| $ | — |
| $ | — |
| $ | 521 |
| | $ | 213 |
| $ | — |
| $ | — |
| $ | 213 |
|
| Investments | — |
| 65 |
| — |
| 65 |
| | — |
| 68 |
| — |
| 68 |
|
| Restricted cash, cash equivalents and investments: | | | |
|
| | | | |
|
|
| Payroll funds collected | 611 |
| — |
| — |
| 611 |
| | 1,018 |
| — |
| — |
| 1,018 |
|
| Collateral for health benefits claims | 27 |
| 76 |
| — |
| 103 |
| | 98 |
| — |
| — |
| 98 |
|
| Collateral for workers' compensation claims | 63 |
| — |
| — |
| 63 |
| | 62 |
| — |
| — |
| 62 |
|
| Other security deposits | 2 |
| — |
| — |
| 2 |
| | 2 |
| — |
| — |
| 2 |
|
| Total restricted cash, cash equivalents and investments | 703 |
| 76 |
| — |
| 779 |
| | 1,180 |
| — |
| — |
| 1,180 |
|
| Investments, noncurrent | — |
| 130 |
| — |
| 130 |
| | — |
| 125 |
| — |
| 125 |
|
| Restricted cash, cash equivalents and investments, noncurrent | | | |
|
| | | | |
|
|
| Collateral for workers' compensation claims | 41 |
| 162 |
| 1 |
| 204 |
| | 63 |
| 148 |
| 1 |
| 212 |
|
| Total | $ | 1,265 |
| $ | 433 |
| $ | 1 |
| $ | 1,699 |
| | $ | 1,456 |
| $ | 341 |
| $ | 1 |
| $ | 1,798 |
|
| | | | | | | | | | | | | | | | | | | | | | | | | |
| March 31, 2021 | | December 31, 2020 |
| (in millions) | Cash and cash equivalents | Available-for-sale marketable securities | | Total | | Cash and cash equivalents | Available-for-sale marketable securities | | Total |
| Cash and cash equivalents | $ | 500 | | $ | 0 | | | $ | 500 | | | $ | 301 | | $ | 0 | | | $ | 301 | |
| Investments | 0 | | 71 | | | 71 | | | 0 | | 57 | | | 57 | |
| Restricted cash, cash equivalents and investments: | | | | | | | | | |
| Payroll funds collected | 906 | | 0 | | | 906 | | | 1,228 | | 0 | | | 1,228 | |
| Collateral for health benefits claims | 22 | | 90 | | | 112 | | | 16 | | 82 | | | 98 | |
| Collateral for workers' compensation claims | 61 | | 0 | | | 61 | | | 60 | | 0 | | | 60 | |
| | | | | | | | | |
| Other security deposits | 2 | | 0 | | | 2 | | | 2 | | 0 | | | 2 | |
| Total restricted cash, cash equivalents and investments | 991 | | 90 | | | 1,081 | | | 1,306 | | 82 | | | 1,388 | |
| Investments, noncurrent | 0 | | 130 | | | 130 | | | 0 | | 138 | | | 138 | |
| Restricted cash, cash equivalents and investments, noncurrent | | | | | | | | | |
| Collateral for workers' compensation claims | 30 | | 154 | | | 184 | | | 36 | | 174 | | | 210 | |
| Total | $ | 1,521 | | $ | 445 | | | $ | 1,966 | | | $ | 1,643 | | $ | 451 | | | $ | 2,094 | |
NOTE 3. INVESTMENTS
The amortized cost, gross unrealized gains, gross unrealized losses, and fair values of our AFS investments as of March 31, 20202021 and December 31, 20192020 are presented below.below:
|
| | | | | | | | | | | | | | | | | | | | | | | | | |
| | March 31, 2020 | | December 31, 2019 |
| (in millions) | Amortized Cost | Gross Unrealized Gains | Gross Unrealized Losses | Fair Value | | Amortized Cost | Gross Unrealized Gains | Gross Unrealized Losses | Fair Value |
| Asset-backed securities | $ | 30 |
| $ | — |
| $ | — |
| $ | 30 |
| | $ | 30 |
| $ | — |
| $ | — |
| $ | 30 |
|
| Corporate bonds | 126 |
| 1 |
| (1 | ) | 126 |
| | 123 |
| 1 |
| — |
| 124 |
|
U.S. government agencies and government- sponsored agencies | 24 |
| 1 |
| — |
| 25 |
| | 14 |
| — |
| — |
| 14 |
|
| U.S. treasuries | 239 |
| 5 |
| — |
| 244 |
| | 163 |
| — |
| — |
| 163 |
|
| Certificate of deposit | 1 |
| — |
| — |
| 1 |
| | 1 |
| — |
| — |
| 1 |
|
| Other debt securities | 8 |
| — |
| — |
| 8 |
| | 10 |
| — |
| — |
| 10 |
|
| Total | $ | 428 |
| $ | 7 |
| $ | (1 | ) | $ | 434 |
| | $ | 341 |
| $ | 1 |
| $ | — |
| $ | 342 |
|
| | | | | | | | | | | | | | | | | | | | | | | | | | | | | |
| March 31, 2021 | | December 31, 2020 |
| (in millions) | Amortized Cost | Gross Unrealized Gains | Gross Unrealized Losses | Fair Value | | Amortized Cost | Gross Unrealized Gains | Gross Unrealized Losses | Fair Value |
| Asset-backed securities | $ | 25 | | $ | 0 | | $ | 0 | | $ | 25 | | | $ | 24 | | $ | 0 | | $ | 0 | | $ | 24 | |
| Corporate bonds | 121 | | 2 | | 0 | | 123 | | | 126 | | 2 | | 0 | | 128 | |
U.S. government agencies and government- sponsored agencies | 23 | | 0 | | 0 | | 23 | | | 27 | | 1 | | 0 | | 28 | |
| U.S. treasuries | 256 | | 3 | | 0 | | 259 | | | 261 | | 4 | | 0 | | 265 | |
| | | | | | | | | |
| Certificate of deposit | 9 | | 0 | | 0 | | 9 | | | 0 | | 0 | | 0 | | 0 | |
| Other debt securities | 6 | | 0 | | 0 | | 6 | | | 6 | | 0 | | 0 | | 6 | |
| Total | $ | 440 | | $ | 5 | | $ | 0 | | $ | 445 | | | $ | 444 | | $ | 7 | | $ | 0 | | $ | 451 | |
Gross unrealized losses were immaterial at March 31, 20202021 and December 31, 2019.2020.
Unrealized losses on fixed income securities are principally caused by changes in interest rates and the financial condition of the issuer. In analyzing an issuer's financial condition, we consider whether the securities are issued by the federal government or its agencies, whether downgrades by credit rating agencies have occurred, and industry analysts' reports. As we have the ability to hold these investments until maturity, or for the foreseeable future, no decline was deemed to be other-than-temporary. Actual maturities may differ from contractual maturities because borrowers may have the right to prepay obligations with or without prepayment penalties.
The fair value of debt investments by contractual maturity are shown below:
|
| | | |
| (in millions) | March 31, 2020 |
| One year or less | $ | 94 |
|
| Over one year through five years | 310 |
|
| Over five years through ten years | 9 |
|
| Over ten years | 21 |
|
| Total fair value | $ | 434 |
|
| | | | | | | |
| (in millions) | | March 31, 2021 | |
| One year or less | | $ | 135 | | |
| Over one year through five years | | 281 | | |
| Over five years through ten years | | 5 | | |
| Over ten years | | 24 | | |
| Total fair value | | $ | 445 | | |
The gross proceeds from sales and maturities of AFS securities for the three months ended March 31, 20202021 and March 31, 20192020 are presented below. We had immaterial gross realized gains and losses from sales of investments for the three months ended March 31, 20202021 and March 31, 2019.2020.
|
| | | | | | |
| | Three Months Ended
March 31, |
| (in millions) | 2020 | 2019 |
| Gross proceeds from sales | $ | 40 |
| $ | 14 |
|
| Gross proceeds from maturities | 27 |
| 17 |
|
| Total | $ | 67 |
| $ | 31 |
|
| | | | | | | | | | | |
| Three Months Ended March 31, | | |
| (in millions) | 2021 | 2020 | | | |
| | | | | |
| | | | | |
| Gross proceeds from sales | $ | 41 | | $ | 40 | | | | |
| Gross proceeds from maturities | 43 | | 27 | | | | |
| Total | $ | 84 | | $ | 67 | | | | |
NOTE 4. FINANCIAL INSTRUMENTS AND FAIR VALUE MEASUREMENTS
Fair Value of Financial Instruments
We use an independent pricing source to determine the fair value of our securities. The independent pricing source utilizes various pricing models for each asset class;class, including the market approach. The inputs and assumptions for the pricing models are market observable inputs including trades of comparable securities, dealer quotes, credit spreads, yield curves and other market-related data.
We have not adjusted the prices obtained from the independent pricing service and we believe the prices received from the independent pricing service are representative of the prices that would be received to sell the assets at the measurement date (exit price).
The carrying value of the Company's cash equivalents and restricted cash equivalents approximate their fair values due to their short-term maturities.
We did not have any Level 3 financial instruments recognized in our balance sheet as of March 31, 20202021 and December 31, 2019.2020. There were no transfers between levels as of March 31, 20202021 and December 31, 2019.2020.
Fair Value Measurements on a Recurring Basis
The following table summarizestables summarize our financial instruments by significant categories and fair value measurement on a recurring basis as of March 31, 20202021 and December 31, 2019.
|
| | | | | | | | | |
| (in millions) | Level 1 | Level 2 | Total |
| March 31, 2020 | | | |
| Cash equivalents: | | | |
| Money market mutual funds | $ | 328 |
| $ | — |
| 328 |
|
| Total cash equivalents | 328 |
| — |
| 328 |
|
| Investments: | | | |
| Asset-backed securities | — |
| 30 |
| 30 |
|
| Corporate bonds | — |
| 95 |
| 95 |
|
| U.S. government agencies and government-sponsored agencies | — |
| 7 |
| 7 |
|
| U.S. treasuries | — |
| 55 |
| 55 |
|
| Other debt securities | — |
| 8 |
| 8 |
|
| Total investments | — |
| 195 |
| 195 |
|
| Restricted cash equivalents: | | | |
| Money market mutual funds | 90 |
| — |
| 90 |
|
| Certificate of deposit | — |
| 1 |
| 1 |
|
| Commercial paper | 14 |
| — |
| 14 |
|
| Total restricted cash equivalents | 104 |
| 1 |
| 105 |
|
| Restricted investments: | | | |
| Corporate bonds | — |
| 31 |
| 31 |
|
| U.S. government agencies and government-sponsored agencies | — |
| 18 |
| 18 |
|
| U.S. treasuries | — |
| 189 |
| 189 |
|
| Certificate of deposit | — |
| 1 |
| 1 |
|
| Total restricted investments | — |
| 239 |
| 239 |
|
Total cash equivalents and investments and restricted cash equivalents and investments
| $ | 432 |
| $ | 435 |
| $ | 867 |
|
| | | | | | | | | | | |
| (in millions) | Level 1 | Level 2 | Total |
| March 31, 2021 | | | |
| Cash equivalents: | | | |
| Money market mutual funds | $ | 127 | | $ | 0 | | 127 | |
| | | |
| Total cash equivalents | 127 | | 0 | | 127 | |
| Investments: | | | |
| Asset-backed securities | 0 | | 25 | | 25 | |
| Corporate bonds | 0 | | 89 | | 89 | |
| U.S. government agencies and government-sponsored agencies | 0 | | 5 | | 5 | |
| U.S. treasuries | — | | 77 | | 77 | |
| Other debt securities | 0 | | 6 | | 6 | |
| Total investments | 0 | | 202 | | 202 | |
| Restricted cash equivalents: | | | |
| Money market mutual funds | 95 | | 0 | | 95 | |
| Certificate of deposit | 0 | | 1 | | 1 | |
| Commercial paper | 0 | | 0 | | 0 | |
| Total restricted cash equivalents | 95 | | 1 | | 96 | |
| Restricted investments: | | | |
| Corporate bonds | 0 | | 34 | | 34 | |
| U.S. government agencies and government-sponsored agencies | 0 | | 18 | | 18 | |
| | | |
| U.S. treasuries | 0 | | 182 | | 182 | |
| Certificate of deposit | 0 | | 9 | | 9 | |
| Total restricted investments | 0 | | 243 | | 243 | |
| Total cash equivalents and investments and restricted cash equivalents and investments | $ | 222 | | $ | 446 | | $ | 668 | |
| | | | | | | | | | | |
| (in millions) | Level 1 | Level 2 | Total |
| December 31, 2020 | | | |
| Cash equivalents | | | |
| Money market mutual funds | $ | 2 | | $ | 0 | | $ | 2 | |
| U.S. treasuries | 0 | | 11 | | 11 | |
| Total cash equivalents | 2 | | 11 | | 13 | |
| Investments | | | |
| Asset-backed securities | 0 | | 24 | | 24 | |
| Corporate bonds | 0 | | 93 | | 93 | |
| U.S. government agencies and government-sponsored agencies | 0 | | 5 | | 5 | |
| U.S. treasuries | 0 | | 67 | | 67 | |
| Other debt securities | 0 | | 6 | | 6 | |
| Total investments | 0 | | 195 | | 195 | |
| Restricted cash equivalents: | | | |
| Money market mutual funds | 99 | | 0 | | 99 | |
| | | |
| | | |
| | | |
| Total restricted cash equivalents | 99 | | 0 | | 99 | |
| Restricted investments: | | | |
| Corporate bonds | 0 | | 35 | | 35 | |
| U.S. government agencies and government-sponsored agencies | 0 | | 23 | | 23 | |
| U.S. treasuries | 0 | | 198 | | 198 | |
| | | |
| Total restricted investments | 0 | | 256 | | 256 | |
| Total investments and restricted cash equivalents and investments | $ | 101 | | $ | 462 | | $ | 563 | |
|
| | | | | | | | | |
| (in millions) | Level 1 | Level 2 | Total |
| December 31, 2019 | | | |
| Cash equivalents | | | |
| Money market mutual funds | $ | 89 |
| $ | — |
| $ | 89 |
|
| U.S. treasuries | — |
| 3 |
| 3 |
|
| Total cash equivalents | 89 |
| 3 |
| 92 |
|
| Investments | | |
|
| Asset-backed securities | — |
| 30 |
| 30 |
|
| Corporate bonds | — |
| 96 |
| 96 |
|
| U.S. government agencies and government-sponsored agencies | — |
| 5 |
| 5 |
|
| U.S. treasuries | — |
| 53 |
| 53 |
|
| Other debt securities | — |
| 10 |
| 10 |
|
| Total investments | — |
| 194 |
| 194 |
|
| Restricted cash equivalents: | | |
|
| Money market mutual funds | 42 |
| — |
| 42 |
|
| U.S. treasuries | — |
| 12 |
| 12 |
|
| Certificate of deposit | — |
| 2 |
| 2 |
|
| Commercial paper | 14 |
| — |
| 14 |
|
| Total restricted cash equivalents | 56 |
| 14 |
| 70 |
|
| Restricted investments: | | |
|
| Corporate bonds | — |
| 28 |
| 28 |
|
| U.S. government agencies and government-sponsored agencies | — |
| 9 |
| 9 |
|
| U.S. treasuries | — |
| 110 |
| 110 |
|
| Certificate of deposit | — |
| 1 |
| 1 |
|
| Total restricted investments | — |
| 148 |
| 148 |
|
Total investments and restricted cash equivalents and investments
| $ | 145 |
| $ | 359 |
| $ | 504 |
|
Fair Value of Financial Instruments Disclosure
Long-Term Debt and Revolving Credit Agreement Borrowings
Our long-term debt and revolving credit agreement borrowings are floating rate debt. At MarchAs of December 31, 2020, our totallong-term debt was carried at cost of $620 million, net of issuance costs,floating rate debt and had a fair value of $607 million, due to credit spread widening in the quarter. At December 31, 2019, the fair value of our floating rate long-term debt approximated its carrying value (exclusive of issuance costs). The fair value of our floating rate debt iswas estimated based on a discounted cash flow, which incorporatesincorporated credit spreads and market interest rates and contractual maturities to estimate the fair value and iswas considered Level 3 in the hierarchy for fair value measurement.
The fair value of our 2029 Notes was obtained from a third-party pricing service and is based on observable market inputs. As such, the fair value of the senior notes is considered Level 2 in the hierarchy for fair value measurement. As of March 31, 2021, our 2029 Notes were carried at their cost, net of issuance costs, and had a fair value of $491 million.
Derivative Instruments
In June 2019, we entered into anAs of December 31, 2020, the fair value of the interest rate collar derivative, transaction with no upfront premium to mitigate the risk of changes in interest rates on the interest payments on a portion of our floating rate debt. If short-term interest rates increase, we will incur higher interest expense on any future outstanding balances of floating rate debt. We use this derivative as part of our interest rate risk management strategy and designated it as a cash flow hedge. If interest rates rise above the cap strike rate on the contract, we will receive variable-rate amounts and if interest rates fall below the floor strike rate on the contract, we will pay variable-rate amounts.
The following table summarizes the fair value of our derivative instruments at March 31, 2020:
|
| | | | | | | | | | | | | | | | | | |
| | | | | Fair Market Value |
| | | | | March 31, 2020 | | December 31, 2019 |
| (in millions) | Hedge type | Final settlement date | Notional amount | Other current assets | Accounts payable and other current liabilities | | Other current assets | Accounts payable and other current liabilities |
| Derivatives designated as hedging instruments | | | | | | | | |
| Collar - LIBOR | Cash flow | May 2022 | $ | 213 |
| $ | — |
| $ | 1 |
| | $ | — |
| $ | — |
|
| | | | | | | | | |
The pre-tax effect of derivative instruments for the three months ended March 31, 2020 is insignificant and we estimate that an insignificant amount of net derivative gains or losses included in accounts payable and other comprehensive income will be reclassified into earnings within the following 12 months. There were no cash flows associated with the derivative for the three months ended March 31, 2020current liabilities, was $1 million and for the year ended December 31, 2019.
As of March 31, 2020 and December 31, 2019, we do not hold, nor have we posted, any collateral related to the above derivative instrument.
The interest rate collar derivative iswas classified as Level 2 in the fair value hierarchy as its value is determined using observable inputs such as forward LIBOR curves.hierarchy. In conjunction with the repayment and termination of our 2018 Term Loan, the interest rate collar derivative was terminated and settled and a realized loss of $1 million was recognized in net income for the three months ended March 31, 2021.
NOTE 5. ACCRUED WORKERS' COMPENSATION COSTS
The following table summarizes the accrued workers’ compensation cost activity for the three months ended March 31, 20202021 and 2019:2020:
|
| | | | | | |
| | Three Months Ended
March 31, |
| (in millions) | 2020 | 2019 |
| Total accrued costs, beginning of period | $ | 214 |
| $ | 238 |
|
| Incurred | | |
| Current year | 20 |
| 19 |
|
| Prior years | (3 | ) | (5 | ) |
| Total incurred | 17 |
| 14 |
|
| Paid | | |
| Current year | (1 | ) | (1 | ) |
| Prior years | (13 | ) | (15 | ) |
| Total paid | (14 | ) | (16 | ) |
| Total accrued costs, end of period | $ | 217 |
| $ | 236 |
|
| | | | | | | | | | | |
| | | Three Months Ended
March 31, |
| (in millions) | | | | 2021 | 2020 |
| Total accrued costs, beginning of period | | | | $ | 205 | | $ | 214 | |
| Incurred | | | | | |
| Current year | | | | 16 | | 20 | |
| Prior years | | | | (4) | | (3) | |
| Total incurred | | | | 12 | | 17 | |
| Paid | | | | | |
| Current year | | | | (1) | | (1) | |
| Prior years | | | | (11) | | (13) | |
| Total paid | | | | (12) | | (14) | |
| Total accrued costs, end of period | | | | $ | 205 | | $ | 217 | |
The following summarizes workers' compensation liabilities on the condensed consolidated balance sheets:
|
| | | | | | |
| (in millions) | March 31, 2020 | December 31, 2019 |
| Total accrued costs, end of period | $ | 217 |
| $ | 214 |
|
| Collateral paid to carriers and offset against accrued costs | (9 | ) | (9 | ) |
| Total accrued costs, net of carrier collateral offset | $ | 208 |
| $ | 205 |
|
Payable in less than 1 year
(net of collateral paid to carriers of $3 at March 31, 2020 and December 31, 2019) | $ | 63 |
| $ | 61 |
|
Payable in more than 1 year
(net of collateral paid to carriers of $6 at March 31, 2020 and December 31, 2019) | 145 |
| 144 |
|
| Total accrued costs, net of carrier collateral offset | $ | 208 |
| $ | 205 |
|
| | | | | | | | |
| (in millions) | March 31, 2021 | December 31, 2020 |
| Total accrued costs, end of period | $ | 205 | | $ | 205 | |
| Collateral paid to carriers and offset against accrued costs | (8) | | (8) | |
| Total accrued costs, net of carrier collateral offset | $ | 197 | | $ | 197 | |
| | |
Payable in less than 1 year
(net of collateral paid to carriers of $2 and $3 at March 31, 2021 and December 31, 2020, respectively) | $ | 59 | | $ | 59 | |
Payable in more than 1 year
(net of collateral paid to carriers of $6 and $5 at March 31, 2021 and December 31, 2020, respectively) | 138 | | 138 | |
| Total accrued costs, net of carrier collateral offset | $ | 197 | | $ | 197 | |
| | |
Incurred claims related to prior years represent changes in estimates for ultimate losses on workers' compensation claims. For the three months ended March 31, 2020, the change was primarily due to lower than expected loss emergence for more recent plan years.
As of March 31, 20202021 and December 31, 2019,2020, we had $45$44 million and $46$45 million, respectively, of collateral held by insurance carriers of which $9$8 million and $9 million, respectively,for both periods was offset against accrued workers' compensation costs as
the agreements permit and are net settled of insurance obligations against collateral held.
NOTE 6. LONG-TERM DEBT AND REVOLVING CREDIT AGREEMENT BORROWINGSAGREEMENTS
As of March 31, 2021 and December 31, 2020, our revolving credit agreement borrowingslong-term debt consisted of the following:
|
| | | |
| (in millions) | March 31,
2020 |
| Current Liabilities: | |
| Revolving credit facility | $ | 234 |
|
| | |
| Annual contractual interest rate | 2.48 | % |
| Effective interest rate | 2.85 | % |
| | | | | | | | |
| (in millions) | March 31, 2021 | December 31, 2020 |
| 2018 Term Loan A | $ | 0 | | $ | 370 | |
| 2029 Notes | 500 | | 0 | |
| Principal amount | 500 | | 370 | |
| Deferred issuance costs | (6) | | 0 | |
| Less: current portion | 0 | | (22) | |
| Long-term debt, noncurrent | $ | 494 | | $ | 348 | |
| | |
| Annual contractual interest rate | 3.50 | % | 1.77 | % |
| Effective interest rate | 3.67 | % | 1.87 | % |
OurIn June 2018 we entered into a $425 million term loan A (our 2018 Term Loan) under our 2018 credit agreement entered in June(our 2018 (2018 Credit Agreement) includes. The 2018 Credit Agreement included a $250 million revolving credit facility (2018(our 2018 Revolver), which could be. The 2018 Credit Agreement was terminated in February 2021.
In February 2021, we issued $500 million aggregate principal of 3.50% senior unsecured notes maturing in March 2029 (our 2029 Notes). The 2029 Notes are a senior unsecured obligation of TriNet Group, Inc. and rank equally with all of its existing and future senior unsecured indebtedness. Interest payments on the 2029 Notes are due semi-annually in arrears on March 1 and September 1, beginning on September 1, 2021. The net proceeds were used solelyto repay and terminate our 2018 Term Loan and for working capital and other general corporate purposes.
We may voluntarily redeem the 2029 Notes, in whole or in part, 1) at any time prior to March 1, 2024 at (a) 100% of their principal amount, plus a “make whole” premium or (b) with the net cash proceeds received from an equity offering at a redemption price equal to 103.50% of the principal amount, provided the aggregate principal amount of all such redemptions does not exceed 40% of the original aggregate principal amount of the 2029 Notes; 2) at any time on or after March 1, 2024 at a prepayment price equal to 101.75% of the principal amount; 3) at any time on or after March 1, 2025 at a prepayment price equal to 100.875%of the principal amount; and 4) at any time on or after March 1, 2026 at a prepayment price equal to 100% of the principal amount; in each case, plus accrued and unpaid interest, if any, to but excluding, the date of redemption.
In February 2021, concurrently with the closing of the 2029 Notes offering, we entered into a new $500 million revolving facility (our 2021 Revolver) under a new credit agreement (our 2021 Credit Agreement) and the 2018 Credit Agreement was terminated. Letters of credit issued pursuant to the revolving credit facility reduce the amount available for borrowing under the 20182021 Revolver. As of March 31, 2020,2021, we had $16 millionremaining capacity of letters of credit outstanding under the 2018 Revolver. In March 2020, we drew down the remaining $234$491 million under this facility.our 2021 Revolver.
InterestThe annual interest rate for borrowings under our 2021 Revolver is calculated based on an applicable London Interbank Offered Rate (LIBOR) tenor of our choosing, plus a margin of 1.25% to 2.00%, or, at our option, the alternative base rate (ABR), plus a margin of 0.25% to 1.00%. The applicable LIBOR or ABR margin is based on our 2018 RevolverTotal Leverage Ratio, as defined in the 2021 Credit Agreement. The ABR is payable quarterly and is variable based on LIBORthe highest of (a) the applicable Federal Reserve Bank of New York rate, as defined in our 2021 Credit Agreement plus 1.625% or0.50% (b) the prime rate, and (c) one month LIBOR adjusted daily plus 0.625%,1.00%.
In the event TriNet Group, Inc. receives a Corporate Issuer Credit Rating that is one level below investment grade rating or higher from at our option, subject to certain rate adjustmentsleast two Nationally Recognized Statistical Rating Organizations, then rating based upon our total leverage ratio. As of March 31, 2020, the interest rate waspricing applies and, for so long as rating based on LIBOR plus 1.625%. We are required to pay a quarterly commitment fee on the daily unused amountpricing applies, irrespective of the commitments underTotal Leverage Ratio, the LIBOR margin will be 1.125% and the ABR margin will be 0.125%.
The indenture governing our 2018 Revolver, as well as fronting fees2029 Notes includes restrictive covenants limiting our ability to: (i) create liens on certain assets to secure debt; (ii) grant a subsidiary guarantee of certain debt without also providing a guarantee of the 2029 Notes; and other customary fees for letters(iii) consolidate or merge with or into, or sell or otherwise dispose of credit issued under our 2018 Revolver, which is subject to adjustments based on our total leverage ratio.
Borrowings under our 2018 Revolver are secured byall or substantially all of our assets other than excluded assets as definedto, another person, subject, in our 2018 Credit Agreement, which includeseach case, to certain customary assets, assets held in trusts as collateral and WSE related assets.
The outstanding balance on the 2018 Revolver is payable by June 2023. We are permitted to make voluntary prepayments at any time without payment of a premium. We are required to make mandatory prepayments of term loans (without payment of a premium) with (i) net cash proceeds from issuances of debt (other than certain permitted debt), and (ii) net cash proceeds from certain non-ordinary course asset sales and casualty and condemnation proceeds (subject to reinvestment rights and other exceptions).
The 20182021 Credit Agreement includes negative covenants that limit our ability to incur indebtedness and liens, sell assets and make restricted payments, including dividends and investments, subject to certain exceptions. In addition, the 2021 Credit Agreement also contains certain financialother customary affirmative and negative covenants and restrictive covenants customary for facilitiesevents of this type, including restrictions on indebtedness, liens, investments, mergers, dispositions, prepayment of indebtedness (other than our 2018 Term Loan and our 2018 Revolver), dividends, distributions and transactions with affiliates, as well as minimum interest coverage anddefault. The 2021 Credit Agreement also contains a financial covenant that requires the Company to maintain certain maximum total net leverage ratio requirements.ratios. We were in compliance with all financial covenants under the credit facilities2021 Credit Agreement at March 31, 2020.2021.
NOTE 7. COMMITMENTS AND CONTINGENCIES
Contingencies
On September 29, 2020, a class action was filed in the United States District Court for the Middle District of Florida against the directors of certain TriNet subsidiaries and other TriNet employees on behalf of participants in 2 retirement plans available to TriNet’s eligible worksite employees, the TriNet 401(k) Plan and the TriNet Select 401(k) Plan. The complaint is similar to claims recently brought against a number of employers including PEOs and generally alleges that the defendants violated certain fiduciary obligations to Plan participants under the Employee Retirement Income Security Act of 1974 with respect to overseeing plan investment and recordkeeping fees. These claims are in the early stages, and we are unable to reasonably estimate any possible loss, or range of loss, with respect to this matter. We believe the claims are without merit.
We are and, from time to time, have been and may in the future become involved in various litigation matters, legal proceedings, and claims arising in the ordinary course of our business, including disputes with our clients or various class action, collective action, representative action, and other proceedings arising from the nature of our co-employment relationship with our clients and WSEs in which we are named as a defendant. In addition, due to the nature of our co-employment relationship with our clients and WSEs, we could be subject to liability for federal and state law violations, even if we do not participate in such violations. While our agreements with our clients contain indemnification provisions related to the conduct of our clients, we may not be able to avail ourselves of such provisions in every instance. We have accrued our current best estimates of probable losses with respect to these matters, which are individually and in aggregate immaterial to our consolidated financial statements.
While the outcome of the matters described above cannot be predicted with certainty, management currently does not believe that any such claims or proceedings will have a materially adverse effect on our consolidated financial position, results of operations, or cash flows. However, the unfavorable resolution of any particular matter or our reassessment of our exposure for any of the above matters based on additional information obtained in the future could have a material impact on our consolidated financial position, results of operations, or cash flows.
NOTE 8. STOCK BASED COMPENSATION
Equity-Based Incentive Plans
Our 2019 Equity Incentive Plan (the 2019 Plan), approved in May 2019, provides for the grant of stock-based and cash-based awards, including stock options, RSUs, and RSAs. Shares available for grant as of March 31, 2020 was approximately 2 million.
The 2009 Equity Incentive Plan (the 2009 Plan), was replaced by the 2019 Plan, except that any outstanding awards granted under the 2009 Plan remain in effect pursuant to their terms.
Restricted Stock Units (RSUs) and Restricted Stock Awards (RSAs)
Time-based RSUs and RSAs generally vest over a four-year term. Performance-based RSUs and RSAs are subject to vesting requirements and are earned, in part, based on certain financial performance metrics as defined in the grant notice. Actual number of shares earned may range from 0% to 200% of the target award. Performance-based awards granted in 2021 and 2020 and 2018 are earned based on a single-year performance period subject to subsequent multi-year time-based vesting with 50% of the shares earned vesting in one year after the performance period and the remaining shares in the year after. The performance-based awards granted in 2019 were previously cancelled. RSUs and RSAs are generally forfeited if the participant terminates service prior to vesting.
The following tables summarize RSU and RSA activity under our equity-based plans for the three months ended March 31, 2020:2021:
Time-based RSUs and RSAs
| | | | | | | | | | | | | | |
| |
| Total Number of RSUs | Total Number of RSAs | Total Number of Shares | Weighted-Average Grant Date Fair Value |
| Nonvested at December 31, 2020 | 1,230,071 | | 30,026 | | 1,260,097 | | $ | 54.04 | |
| Granted | 456,421 | | 0 | | 456,421 | | 83.11 | |
| Vested | (212,948) | | (7,055) | | (220,003) | | 45.14 | |
| Forfeited | (47,908) | | 0 | | (47,908) | | 56.14 | |
| Nonvested at March 31, 2021 | 1,425,636 | | 22,971 | | 1,448,607 | | $ | 64.48 | |
|
| | | | | | | | | |
| | Time-based RSUs and RSAs |
| | Total Number of RSUs | Total Number of RSAs | Total Number of Shares | Weighted-Average Grant Date Fair Value |
| Nonvested at December 31, 2019 | 1,104,729 |
| 61,136 |
| 1,165,865 |
| $ | 48.47 |
|
| Granted | 759,856 |
| — |
| 759,856 |
| 51.32 |
|
| Vested | (180,422 | ) | — |
| (180,422 | ) | 40.25 |
|
| Forfeited | (28,943 | ) | — |
| (28,943 | ) | 50.10 |
|
| Nonvested at March 31, 2020 | 1,655,220 |
| 61,136 |
| 1,716,356 |
| $ | 50.57 |
|
Performance-based RSUs and RSAs
|
| | | | | | | | | |
| | Performance-based RSUs and RSAs |
| | Total Number of RSUs | Total Number of RSAs | Total Number of Shares | Weighted-Average Grant Date Fair Value |
| Nonvested at December 31, 2019 | 15,752 |
| 114,857 |
| 130,609 |
| $ | 49.70 |
|
| Granted | 183,981 |
| — |
| 183,981 |
| 52.86 |
|
| Nonvested at March 31, 2020 | 199,733 |
| 114,857 |
| 314,590 |
| $ | 51.55 |
|
| | | | | | | | | | | | | | |
| Total Number of RSUs | Total Number of RSAs | Total Number of Shares | Weighted-Average Grant Date Fair Value |
| Nonvested at December 31, 2020 | 167,127 | | 16,052 | | 183,179 | | $ | 52.89 | |
| Granted | 232,815 | | 0 | | 232,815 | | 68.27 | |
| Vested | (3,010) | | (16,052) | | (19,062) | | 47.61 | |
| | | | |
| Forfeited | (9,459) | | 0 | | (9,459) | | 52.86 | |
Nonvested at March 31, 2021
| 387,473 | | 0 | | 387,473 | | $ | 62.39 | |
Stock Based Compensation
Stock based compensation expense is measured based on the fair value of the stock award on the grant date and recognized over the requisite service period for each separately vesting portion of the stock award. Stock based compensation expense and other disclosures for stock based awards made to our employees pursuant to theour equity plans waswere as follows:
|
| | | | | | |
| | Three Months Ended March 31, |
| (in millions) | 2020 | 2019 |
| Cost of providing services | $ | 2 |
| $ | 2 |
|
| Sales and marketing | 2 |
| 1 |
|
| General and administrative | 5 |
| 5 |
|
| Systems development and programming costs | — |
| 1 |
|
| Total stock based compensation expense | $ | 9 |
| $ | 9 |
|
| | | | | | | | | | | |
| | | | Three Months Ended March 31, |
| (in millions) | | | | 2021 | 2020 |
| Cost of providing services | | | | $ | 3 | | $ | 2 | |
| Sales and marketing | | | | 1 | | 2 | |
| General and administrative | | | | 6 | | 5 | |
| Systems development and programming costs | | | | 1 | | 0 | |
| Total stock based compensation expense | | | | $ | 11 | | $ | 9 | |
| | | | | |
| | | | | |
| | | | | |
NOTE 9. STOCKHOLDERS’ EQUITY
Common Stock
The following table presents a rollforwardshows the beginning and ending balances of our issued and outstanding common stock for the three months ended March 31, 20202021 and 2019:2020:
|
| | | | |
| | Three Months Ended
March 31, |
| | 2020 | 2019 |
| Shares issued and outstanding, beginning balance | 69,065,491 |
| 70,596,559 |
|
| Issuance of common stock from vested restricted stock units | 173,629 |
| 286,719 |
|
| Issuance of common stock from exercise of stock options | 29,473 |
| 81,282 |
|
| Repurchase of common stock | (747,417 | ) | (782,909 | ) |
| Awards effectively repurchased for required employee withholding taxes | (51,126 | ) | (101,904 | ) |
| Shares issued and outstanding, ending balance | 68,470,050 |
| 70,079,747 |
|
| | | | | | | | | | | |
| | | Three Months Ended
March 31, |
| | | 2021 | 2020 |
| Shares issued and outstanding, beginning balance | | | | 66,456,663 | | 69,065,491 | |
| Issuance of common stock from vested restricted stock units | | | | 215,958 | | 173,629 | |
| Issuance of common stock from exercise of stock options | | | | 20,841 | | 29,473 | |
| | | | | |
| Repurchase of common stock | | | | (744,001) | | (747,417) | |
| Awards effectively repurchased for required employee withholding taxes | | | | (68,228) | | (51,126) | |
| Shares issued and outstanding, ending balance | | | | 65,881,233 | | 68,470,050 | |
Stock Repurchases
In February 2020, our boardDuring the three months ended March 31, 2021, we repurchased 744,001 shares of directors authorized a $300 million incremental increase to our ongoingcommon stock repurchase program. This repurchase authorization has no expiration.for approximately $60 million. We retire shares in the period they are acquired and account for the payment as a reduction to stockholders' equity.
During the three months ended March 31, 2020, we repurchased 747,417 shares of common stock for approximately $40 million. As of March 31, 2020,2021, approximately $495$298 million remained available for further repurchases of our common stock under all authorizations from our board of directors under this program. This repurchase authorization has no expiration.
NOTE 10. INCOME TAXES
Our effective income tax rateETR was 25% and 24% for the three months ended March 31, 20202021 and 2019, respectively. The increase was primarily from a decrease in excess tax benefits related to stock-based compensation.2020.
During the three months ended March 31, 2020,2021, there was a de minimis change in our unrecognized tax benefits. The total amount of gross interest and penalties accrued was immaterial. It is reasonably possible the amount of the unrecognized benefit could increase or decrease within the next twelve months for which an estimate of the impact on net income cannot be made.
We are subject to tax in U.S. federal and various state and local jurisdictions, as well as Canada. We are open to federal and significant state income tax examinations for tax years 20152016 and subsequent years.
We previously paid Notices of Proposed Assessments disallowing employment tax credits totaling $11 million, plus interest of $4 million in connection with the IRS examination of Gevity HR, Inc. and its subsidiaries, which was acquired by TriNet in June 2009. TriNet filed suit in June 2016 to recover the disallowed credits, and the issue is being resolved through the litigation process. TriNet and the U.S. filed cross motions for summary judgment in federal district court. On September 17, 2018, the district court granted our motion for summary judgment and denied the U.S.'s motion. On January 18, 2019, the district court entered judgment in favor of TriNet in the amount of $15 million, plus interest. The U.S. filed a notice of appeal of the federal district court's decision on March 18, 2019. The U.S. filed its opening brief in the court of appeals on June 10, 2019 and we filed our answering brief on July 24, 2019 to which the government filed its reply brief on September 6, 2019. Oral arguments occurred on March 11, 2020. WeOn November 5, 2020, the court of appeals affirmed the district court’s judgement in favor of TriNet. The April 5, 2021 deadline for the IRS to petition the Supreme Court for review passed without a petition. TriNet will continue to vigorously defend our position through the litigation process. Given the uncertainty of the outcome of any appeal, it remains possible that ourpursue recovery of the refund will be less than the total amount in dispute.judgment.
NOTE 11. EARNINGS PER SHARESHARE (EPS)
The following table presents the computation of our basic and diluted EPS attributable to our common stock:
|
| | | | | | |
| | Three Months Ended
March 31, |
| (in millions, except per share data) | 2020 | 2019 |
| Net income | $ | 91 |
| $ | 63 |
|
| Weighted average shares of common stock outstanding | 68 |
| 70 |
|
| Basic EPS | $ | 1.32 |
| $ | 0.91 |
|
| Net income | $ | 91 |
| $ | 63 |
|
| Weighted average shares of common stock outstanding | 68 |
| 70 |
|
| Dilutive effect of stock options and restricted stock units | 1 |
| 1 |
|
| Weighted average shares of common stock outstanding - diluted | 69 |
| 71 |
|
| Diluted EPS | $ | 1.31 |
| $ | 0.89 |
|
| | | |
| Common stock equivalents excluded from income per diluted share because of their anti-dilutive effect | 1 |
| 1 |
|
| | | | | | | | | | | |
| | Three Months Ended
March 31, | | |
| (in millions, except per share data) | 2021 | 2020 | | | |
| Net income | $ | 101 | | $ | 91 | | | | |
| Weighted average shares of common stock outstanding | 66 | | 68 | | | | |
| Basic EPS | $ | 1.53 | | $ | 1.32 | | | | |
| Net income | $ | 101 | | $ | 91 | | | | |
| Weighted average shares of common stock outstanding | 66 | | 68 | | | | |
| Dilutive effect of stock options and restricted stock units | 1 | | 1 | | | | |
| Weighted average shares of common stock outstanding | 67 | | 69 | | | | |
| Diluted EPS | $ | 1.51 | | $ | 1.31 | | | | |
| | | | | |
| Common stock equivalents excluded from income per diluted share because of their anti-dilutive effect | 1 | | 1 | | | | |
Legal Proceedings
For the information required in this section, refer to Note 67 in the condensed consolidated financial statements and related notes included in this Form 10-Q. Risk Factors
There have been no material changes in our risk factors disclosed in Part 1, Item 1A, of our 2020 Form 10-K.
Unregistered Sales of Equity Securities and Use of Proceeds
(a) Sales of Unregistered Securities
Not applicable.
(b) Use of Proceeds from Sales of Unregistered Securities
Not applicable.
(c) Issuer Purchases of Equity Securities
The following table provides information about our purchases of TriNet common stock during the quarter ended March 31, 2020:2021:
|
| | | | | | | | | | | | | |
| Period | Total Number of
Shares Purchased (1) | | Weighted Average Price
Paid Per Share | | Total Number of
Shares
Purchased as Part of Publicly
Announced Plans (2) | | Approximate Dollar Value ($ millions)
of Shares that May Yet be Purchased
Under the Plans (2) |
| January 1- January 31, 2020 | 303,925 |
| | $ | 56.68 |
| | 303,925 |
| | $ | 219 |
|
| February 1 - February 29, 2020 | 354,722 |
| | $ | 56.84 |
| | 303,638 |
| | $ | 501 |
|
| March 1 - March 31, 2020 | 139,896 |
| | $ | 42.78 |
| | 139,854 |
| | $ | 495 |
|
| Total | 798,543 |
| |
|
| | 747,417 |
| |
|
| | | | | | | | | | | | | | | | | | | | | | | | | |
| Period | Total Number of
Shares Purchased (1) | | Weighted Average Price
Paid Per Share | | Total Number of
Shares
Purchased as Part of Publicly
Announced Plans (2) | | | | Approximate Dollar Value ($ millions)
of Shares that May Yet be Purchased
Under the Plans (3) |
| January 1- January 31, 2021 | 349,764 | | | $ | 80.78 | | | 335,791 | | | | | $ | 331 | |
| February 1 - February 28, 2021 | 390,545 | | | $ | 80.97 | | | 338,735 | | | | | $ | 303 | |
| March 1 - March 31, 2021 | 71,920 | | | $ | 81.59 | | | 69,475 | | | | | $ | 298 | |
| Total | 812,229 | | | | | 744,001 | | | | | |
(1) In May 2014, our board of directors approved a stock repurchase program pursuant to which we are authorized to repurchase our common stock in privately negotiated and/or open market transactions, including under plans complying with Rule 10b5-1 under the Securities Exchange Act of 1934. From time to time, our board of directors authorizes increases to our stock repurchase program and approved an aggregate total of $951 million as of March 31, 2021. The total remaining authorization for future stock repurchases under our stock repurchase program was $298 million as of March 31, 2021. The program does not have an expiration date.
(2) Includes shares surrendered by employees to us to satisfy tax withholding obligations that arose upon vesting of RSUsrestricted stock units granted pursuant to approved plans.
(2)(3) We repurchased a total of approximately $40$60 million of our outstanding common stock during the periodthree months ended March 31, 2020.2021.
AsWe use our stock repurchase program to return value to our stockholders and to offset dilution from the issuance of March 31, 2020, we had approximately $495 million remaining for repurchasesstock under our equity-based incentive plans and employee purchase plan. We plan to use current cash and cash generated from ongoing operating activities to fund our stock repurchase program. Stock repurchases under the program are primarily intended to offset the dilutive effect of share-based employee incentive compensation. The purchases were funded from existing cash and cash equivalents balances.
Our stock repurchases are subject to certain restrictions under the terms of our 2018 credit facility. For more information about our 2018 credit facility and our stock repurchases, refer to Notes 9 and 10 in Part II, Item 8. Financial Statements and Supplementary Data of our 2019 Form 10-K.
Defaults Upon Senior Securities
Not applicable.
Mine Safety Disclosures
Not applicable.
Other Information
Not applicable.
|
| | | | |
OTHER INFORMATIONEXHIBITS | |
Exhibits
Incorporated herein by reference is a list of the exhibits contained in the Exhibit Index below.
EXHIBIT INDEX
|
| | | | | | | | | | | | |
| | | | | Incorporated by Reference | | |
| Exhibit No. | | Exhibit | | Form | | File No. | | Exhibit | | Filing Date | | Filed Herewith |
| 3.1 | | Amended and Restated Certificate of Incorporation of TriNet Group, Inc. | | 8-K | | 001-36373 | | 3.1 | | 4/1/2014 | | |
| 3.2 | | Certificate of Correction of Amended and Restated Certificate of Incorporation of TriNet Group, Inc. | | 10-Q | | 001-36373 | | 3.1 | | 11/2/2017 | | |
| 3.2 | | Amended and Restated Bylaws of TriNet Group, Inc. | | S-1/A | | 333-192465 | | 3.4 | | 3/4/2014 | | |
| 4.1 | | Registration Rights Agreement, by and between TriNet Group, Inc. and AGI-T, L.P., dated as of February 1, 2017. | | 8-K | | 001-36373 | | 4.1 | | 2/2/2017 | | |
| 10.1 | |
| | | | | | | | | | X |
| 10.2 | |
| | | | | | | | | | X |
| 10.3 | |
| | | | | | | | | | X |
| 10.4 | | | | | | | | | | | | X |
| 31.1 | | | | | | | | | | | | X |
| 31.2 | | | | | | | | | | | | X |
32.1* | | | | | | | | | | | | X |
101.INS | | XBRL Instance Document - the instance document does not appear in the Interactive Data File because its XBRL tags are embedded within the Inline XBRL document | | | | | | | | | | |
101.SCH | | XBRL Taxonomy Extension Schema Linkbase Document | | | | | | | | | | |
| | | | | | | | | | | | | | | | | | | | | | | | | | | | | | | | | | | | | | |
| | | | Incorporated by Reference | | |
| Exhibit No. | | Exhibit | | Form | | File No. | | Exhibit | | Filing Date | | Filed Herewith |
| 3.1 | | Amended and Restated Certificate of Incorporation of TriNet Group, Inc. | | 8-K | | 001-36373 | | 3.1 | | 4/1/2014 | | |
| 3.2 | | Certificate of Correction of Amended and Restated Certificate of Incorporation of TriNet Group, Inc. | | 10-Q | | 001-36373 | | 3.1 | | 11/2/2017 | | |
| 3.2 | | Amended and Restated Bylaws of TriNet Group, Inc. | | S-1/A | | 333-192465 | | 3.4 | | 3/4/2014 | | |
| 4.1 | | Registration Rights Agreement, by and between TriNet Group, Inc. and AGI-T, L.P., dated as of February 1, 2017. | | 8-K | | 001-36373 | | 4.1 | | 2/2/2017 | | |
| | | | | | | | | | | | |
| | | | | | | | | | | | |
| | | | | | | | | | | | |
| | | | | | | | | | | | |
| | | | | | | | | | | | |
| | | | | | | | | | | | |
| 10.1 | | Indenture dated February 26, 2021, among the Company, the guarantors listed therein and U.S. Bank National Association, as trustees | | 8-K | | 001-36373 | | 4.1 | | 2/26/2021 | | |
| 10.2 | | Form of 3.500% Senior Notes due 2029 (Included in Indenture, dated February 26, 2021) | | 8-K | | 001-36373 | | 4.2 | | 2/26/2021 | | |
| 10.3 | | Credit Agreement, dated as of February 26, 2021, among TriNet USA, Inc. as borrower, TriNet Group, Inc. as Holdings, the lenders from time-to-time party thereto and JP Morgan Chase Bank N.A., as Administrative Agent | | 8-K | | 001-36373 | | 10.1 | | 2/26/2021 | | |
| 10.4 | | | | | | | | | | | | X |
| 10.5 | | | | | | | | | | | | X |
| 31.1 | | | | | | | | | | | | X |
| 31.2 | | | | | | | | | | | | X |
32.1* | | | | | | | | | | | | X |
101.INS | | XBRL Instance Document - the instance document does not appear in the Interactive Data File because its XBRL tags are embedded within the Inline XBRL document | | | | | | | | | | |
|
| | | | | | | | | | | | | | | | | | | | | | | | | | | | | | | | | | | | | |
101.SCH | | XBRL Taxonomy Extension Schema Linkbase Document | | | | | | | | | | |
101.CAL | | XBRL Taxonomy Extension Calculation Linkbase Document | | | | | | | | | | |
101.DEF | | XBRL Taxonomy Extension Definition Linkbase Document | | | | | | | | | | |
101.LAB | | XBRL Taxonomy Extension Label Linkbase Document | | | | | | | | | | |
101.PRE | | XBRL Taxonomy Extension Presentation Linkbase Document | | | | | | | | | | |
| 104 | | Cover Page Interactive Data File (embedded with the Inline XBRL document) | | | | | | | | | | |
| | | | | | | | |
| | |
| * | | |
* | Document has been furnished, is deemed not filed and is not to be incorporated by reference into any of TriNet Group, Inc.’s filings under the Securities Act of 1933, as amended, or the Securities Exchange Act of 1934, as amended, irrespective of any general incorporation language contained in any such filing. |
SIGNATURES
Pursuant to the requirements of the Securities Exchange Act of 1934, as amended, the registrant has duly caused this report to be signed on its behalf by the undersigned thereunto duly authorized.
| | | | | | | | | | | |
| TRINET GROUP, INC. |
| |
| Date: April 26, 2021 | | By: | /s/ Burton M. Goldfield |
| | | Burton M. Goldfield |
| | | Chief Executive Officer |
| | | |
| Date: April 26, 2021 | | By: | /s/ Kelly Tuminelli |
| | | Kelly Tuminelli |
| | | |
| | | Chief Financial Officer |
| | | |
| | | |
| TRINET GROUP, INC. |
| |
Date: April 28, 2020 | | By: | /s/ Burton M. Goldfield |
| | | Burton M. Goldfield |
| | | Chief Executive Officer |
| | | |
Date: April 28, 2020 | | By: | /s/ Richard Beckert |
| | | Richard Beckert |
| | | Chief Financial Officer |
| | | |
Date: April 28, 2020 | | By: | /s/ Michael P. Murphy |
| | | Michael P. Murphy |
| | | Chief Accounting Officer |