0001099219us-gaap:EquityContractMembersrt:MaximumMembermet:MeasurementInputCorrelationMember2020-12-31 UNITED STATES SECURITIES AND EXCHANGE COMMISSION
Washington, D.C. 20549
______________________________________
Form 10-Q
(Mark One)
|
| | | | |
þ☑ | QUARTERLY REPORT PURSUANT TO SECTION 13 OR 15(d) OF THE SECURITIES EXCHANGE ACT OF 1934 |
FOR THE QUARTERLY PERIOD ENDED SEPTEMBERJUNE 30, 20172021
or
|
| | | | |
¨☐ | TRANSITION REPORT PURSUANT TO SECTION 13 OR 15(d) OF THE SECURITIES EXCHANGE ACT OF 1934 |
FOR THE TRANSITION PERIOD FROM TO
Commission file number: 001-15787
_____________________________________________________________________________
MetLife, Inc.
(Exact name of registrant as specified in its charter)
|
| | | | | | | | | | | | | |
| Delaware | | 13-4075851 |
(State or other jurisdiction of
incorporation or organization)
| | (I.R.S. Employer
Identification No.)
|
| | | |
| 200 Park Avenue, | New York, N.Y. | NY | | 10166-0188 |
| (Address of principal executive offices) | | (Zip Code) |
(212) 578-9500
(Registrant’s telephone number, including area code)
Securities registered pursuant to Section 12(b) of the Act:
| | | | | | | | |
| Title of each class | Trading Symbol(s) | Name of each exchange on which registered |
| Common Stock, par value $0.01 | MET | New York Stock Exchange |
| Floating Rate Non-Cumulative Preferred Stock, Series A, par value $0.01 | MET PRA | New York Stock Exchange |
| Depositary Shares, each representing a 1/1,000th interest in a share of 5.625% Non-Cumulative Preferred Stock, Series E | MET PRE | New York Stock Exchange |
Depositary Shares, each representing a 1/1,000th interest in
a share of 4.75% Non-Cumulative Preferred Stock, Series F | MET PRF | New York Stock Exchange |
Indicate by check mark whether the registrant: (1) has filed all reports required to be filed by Section 13 or 15(d) of the Securities Exchange Act of 1934 during the preceding 12 months (or for such shorter period that the registrant was required to file such reports), and (2) has been subject to such filing requirements for the past 90 days. Yes þ ☑No ¨
Indicate by check mark whether the registrant has submitted electronically and posted on its corporate Web site, if any, every Interactive Data File required to be submitted and posted pursuant to Rule 405 of Regulation S-T (§ 232.405 of this chapter) during the preceding 12 months (or for such shorter period that the registrant was required to submit and post such files). Yes þ ☑No ¨
Indicate by check mark whether the registrant is a large accelerated filer, an accelerated filer, a non-accelerated filer, a smaller reporting company, or an emerging growth company. See the definitions of “large accelerated filer,” “accelerated filer,” “smaller reporting company,” and “emerging growth company” in Rule 12b-2 of the Exchange Act.
|
| | | | | | | | | | |
| Large accelerated filer | þ☑ | Accelerated filer | ¨☐ |
Non-accelerated filer (Do not check if a smaller reporting company) | ¨
☐ | Smaller reporting company | ¨
☐ |
| | Emerging growth company | ¨
☐ |
If an emerging growth company, indicate by check mark if the registrant has elected not to use the extended transition period for complying with any new or revised financial accounting standards provided pursuant to Section 13(a) of the Exchange Act. ¨☐
Indicate by check mark whether the registrant is a shell company (as defined in Rule 12b-2 of the Exchange Act). Yes ¨☐No þ☑
At October 25, 2017, 1,052,299,271July 30 2021, 856,897,461 shares of the registrant’s common stock $0.01 par value per share, were outstanding.
Table of Contents
| | | | | | | | |
| | Page |
| |
| Item 1. | Financial Statements (Unaudited) (at SeptemberJune 30, 2017 (Unaudited)2021 and December 31, 20162020 and for the Three Months and NineSix Months Ended SeptemberJune 30, 20172021 and 2016 (Unaudited))2020) | |
| | |
| | |
| | |
| | |
| | |
| | |
| | |
| | |
| | |
| | |
| | |
| | |
| | |
| | |
| | |
| | |
| | |
| | |
| | |
| | |
| | |
| Item 2. | | |
| Item 3. | | |
| Item 4. | | |
| | |
| |
| Item 1. | | |
| Item 1A. | | |
| Item 2. | | |
| Item 6. | | |
| | |
| |
| |
| |
| |
As used in this Form 10‑Q, “MetLife,” the “Company,” “we,” “our” and “us” refer to MetLife, Inc., a Delaware corporation incorporated in 1999, its subsidiaries and affiliates.
Note Regarding Forward-Looking Statements
This Quarterly Report on Form 10‑Q, including Management’s Discussion and Analysis of Financial Condition and Results of Operations, may contain or incorporate by reference information that includes or is based upon forward-looking statements within the meaning of the Private Securities Litigation Reform Act of 1995. Forward-looking statements give expectations or forecasts of future events. These statements can be identified by the fact that theyevents and do not relate strictly to historical or current facts. They use words and terms such as “anticipate,” “estimate,“assume,” “become,” “believe,” “continue,” “could,” “expect,” “project,“forecast,” “future,” “if,” “intend,” “likely,” “may,” “permit,” “plan,” “believe”“possible,” “potential,” “probable,” “project,” “propose,” “prospect,” “remain,” “renew,” “risk,” “should,” “target,” “ultimate,” “unlikely,” “well positioned,” “when,” “will,” “would” and other words and terms of similar meaning or that are otherwise tied to future periods or future performance, in connection with a discussion of future operating or financial performance. In particular, theseeach case in all derivative forms. They include statements relating to future actions, prospective services or products, future performance or results of current and anticipated services or products, future sales efforts, future expenses, the outcome of contingencies such as legal proceedings, and future trends in operations and financial results.
Any or all forward-looking statements may turn out to be wrong. They can be affected by inaccurate assumptions or by known or unknownMany factors determine Company results, and they involve unpredictable risks and uncertainties. Many such factors will be important in determining the actual future results of MetLife, Inc., its subsidiaries and affiliates. TheseOur forward-looking statements are baseddepend on currentour assumptions, our expectations, and our understanding of the current economic environment. They involve a number of risksenvironment, but they may be inaccurate and uncertainties that are difficult to predict. These statements aremay change. We do not guarantees ofguarantee any future performance. ActualOur results could differ materially from those expressedwe express or impliedimply in the forward-looking statements. Risks, uncertainties, and other factors that might cause such differences include theThe risks, uncertainties and other factors identified in MetLife, Inc.’s filings with the U.S. Securities and Exchange Commission.Commission, and others, may cause such differences. These factors include:
(1) difficult conditions in the global capital markets; (2) increased volatilityeconomic condition difficulties, including risks relating to public health, interest rates, credit spreads, equity, real estate, obligors and disruption of thecounterparties, currency exchange rates, derivatives, and terrorism and security;
(2) global capital and credit markets, which may affect our abilitymarket adversity;
(3) credit facility inaccessibility;
(4) financial strength or credit ratings downgrades;
(5) unavailability, unaffordability, or inadequate reinsurance;
(6) statutory life insurance reserve financing costs or limited market capacity;
(7) legal, regulatory, and supervisory and enforcement policy changes;
(8) changes in tax rates, tax laws or interpretations;
(9) litigation and regulatory investigations;
(10) London Interbank Offered Rate termination and transition to alternative reference rates;
(11) unsuccessful efforts to meet liquidity needsall environmental, social, and access capital, including throughgovernance standards or to enhance our credit facilities, generate fee incomesustainability;
(12) MetLife, Inc.’s inability to pay dividends and market-related revenue and finance statutory reserve requirements and may require usrepurchase common stock;
(13) MetLife, Inc.’s subsidiaries’ inability to pledgepay it dividends;
(14) investment defaults, downgrades, or volatility;
(15) investment sales or lending difficulties;
(16) collateral or make payments related to declines in value of specified assets, including assets supporting risks ceded to certain of our captive reinsurersderivative-related payments;
(17) investment valuations, allowances, or hedging arrangements associated with those risks; (3) exposure to global financial and capital market risks, including as a result of the United Kingdom’s notice of withdrawal from the European Union, other disruption in Europe and possible withdrawal of one or more countries from the Euro zone; (4) impact on us of comprehensive financial services regulation reform, including potential regulation of MetLife, Inc. as a non-bank systemically important financial institution, or otherwise; (5) numerous rulemaking initiatives required or permitted by the Dodd-Frank Wall Street Reform and Consumer Protection Act which may impact how we conduct our business, including those compelling the liquidation of certain financial institutions; (6) regulatory, legislative or tax changes relating to our insurance, international,impairments changes;
(18) claims or other operationsresults that may affect the cost of,differ from our estimates, assumptions, or demand for,models;
(19) global political, legal, or operational risks;
(20) business competition;
(21) technological change;
(22) catastrophes;
(23) climate changes or responses to it;
(24) deficiencies in our products or services, or increase the cost or administrative burdens of providing benefits to employees; (7) adverse resultsclosed block;
(25) goodwill or other consequences from litigation, arbitrationasset impairment, or regulatory investigations; (8) unanticipated or adverse developments that could adversely affect our achieving expected operational or other benefits from the separationdeferred income tax asset allowance;
(26) acceleration of Brighthouse Financial, Inc. and it subsidiaries (“Brighthouse”); (9) our equity market exposure to Brighthouse Financial, Inc. following the separationamortization of Brighthouse; (10) liabilities, losses or indemnification obligations arising from our transitional services, investment management or tax arrangements or other agreements with Brighthouse; (11) failure of the separation of Brighthouse to qualify for intended tax-free treatment; (12) our ability to address difficulties, unforeseen liabilities, asset impairments, or rating agency actions arising from (a) business acquisitions and integrating and managing the growth of such acquired businesses, (b) dispositions of businesses via sale, initial public offering, spin-off or otherwise, including failure to achieve projected operational benefit from such transactions and any restrictions, liabilities, losses or indemnification obligations arising from any transitional services or tax arrangements related to the separation of any business, or from the failure of such a separation to qualify for any intended tax-free treatment, (c) entry into joint ventures, or (d) legal entity reorganizations; (13) potential liquidity and other risks resulting from our participation in a securities lending program and other transactions; (14) investment losses and defaults, and changes to investment valuations; (15) changes in assumptions related to investment valuations, deferred policy acquisition costs, deferred sales inducements, value of business acquired, or goodwill; (16) impairmentsvalue of goodwillcustomer relationships acquired;
(27) product guarantee volatility, costs, and realized lossescounterparty risks;
(28) risk management failures;
(29) insufficient protection from operational risks;
(30) confidential information protection or market value impairments to illiquid assets; (17) defaults on our mortgage loans; (18) the defaultsother cybersecurity or deteriorating credit of other financial institutions that could adversely affect us; (19) economic, political, legal, currencydisaster recovery failures;
(31) accounting standards changes;
(32) excessive risk-taking;
(33) marketing and distribution difficulties;
(34) pension and other risks relatingpostretirement benefit assumption changes;
(35) inability to protect our international operations, including with respect to fluctuations of exchange rates; (20) downgrades in our claims paying ability, financial strengthintellectual property or credit ratings; (21) a deterioration in the experience of the closed block established in connection with theavoid infringement claims;
(36) acquisition, integration, growth, disposition, or reorganization of Metropolitan Life Insurance Company; (22) availability and effectiveness of reinsurance, hedging or indemnification arrangements, as well as any default or failure of counterparties to perform; (23) differences between actual claims experience and underwriting and reserving assumptions; (24) ineffectiveness of risk management policies and procedures; (25) catastrophe losses; (26) increasing cost and limited market capacity for statutory life insurance reserve financings; (27) heightened competition, including with respect to pricing, entry of new competitors, consolidation of distributors, the development of new products by new and existing competitors, and for personnel; (28) exposure to losses related to variable annuity guarantee benefits, including from significant and sustained downturns or extreme volatility in equity markets, reduced interest rates, unanticipated policyholder behavior, mortality or longevity, and any adjustment for nonperformance risk; (29) legal, regulatory and other restrictions affecting MetLife, Inc.’s ability to pay dividends and repurchase common stock; (30) MetLife, Inc.’s and its subsidiary holding companies’ primary reliance, as holding companies, on dividends from subsidiaries to meet free cash flow targets and debt payment obligations and the applicable regulatory restrictions on the ability of the subsidiaries to pay such dividends; (31) the possibility thatdifficulties;
(37) Brighthouse separation risks;
(38) MetLife, Inc.’s Board of Directors may influence over the outcome of stockholder votes through the voting provisions of the MetLife Policyholder Trust; (32) changes in accounting standards, practices and/or policies; (33) increased expenses relating to pension and postretirement benefit plans, as well as health care and other employee benefits; (34) inability to protect our intellectual property rights or claims of infringement of the intellectual property rights of others; (35) difficulties in marketing and distributing products through our distribution channels; (36) provisions of laws and our incorporation documents may delay, deter or prevent takeovers
(39) legal- and corporate combinations involving MetLife; (37) thegovernance-related effects ofon business disruption or economic contraction due to disasters such as terrorist attacks, cyberattacks, other hostilities, or natural catastrophes, including any related impact on the value of our investment portfolio, our disaster recovery systems, cyber- or other information security systems and management continuity planning; (38) any failure to protect the confidentiality of client information; (39) the effectiveness of our programs and practices in avoiding giving our associates incentives to take excessive risks; and (40) other risks and uncertainties described from time to time in MetLife, Inc.’s filings with the U.S. Securities and Exchange Commission.combinations.
MetLife, Inc. doesThe Company will not undertake any obligation to publicly correct or update any forward-looking statementstatements if MetLife, Inc. later becomes aware that such statement iswe believe we are not likely to be achieved.achieve them or for any other reasons. Please consult any further disclosures MetLife, Inc. makes on related subjects in subsequent reports to the U.S. Securities and Exchange Commission.
Corporate Information
We announce financial and other information about MetLife to our investors on our website (www.metlife.com) through the MetLife Investor Relations web page at www.metlife.com,(https://investor.metlife.com), as well as in U.S. Securities and Exchange Commission filings, news releases, public conference calls and webcasts. MetLife encourages investors to visit the Investor Relations web page from time to time, as information is updated and new information is posted. The information found on our website is not incorporated by reference into this Quarterly Report on Form 10-Q or in any other report or document we file with the U.S. Securities and Exchange Commission, and any references to our website are intended to be inactive textual references only.
Note Regarding Reliance on Statements in Our Contracts
See “Item 6. Exhibits“Exhibits — Note Regarding Reliance on Statements in Our Contracts” for information regarding agreements included as exhibits to this Quarterly Report on Form 10-Q.
Part I — Financial Information
Item 1. Financial Statements
MetLife, Inc.
Interim Condensed Consolidated Balance Sheets
SeptemberJune 30, 2017 (Unaudited)2021 and December 31, 20162020 (Unaudited)
(In millions, except share and per share data)
| | | | | | | | | | | | | | |
| | June 30, 2021 | | December 31, 2020 |
| Assets | | | | |
| Investments: | | | | |
| Fixed maturity securities available-for-sale, at estimated fair value (amortized cost: $307,102 and $310,811, respectively; allowance for credit loss of $99 and $81, respectively) | | $ | 340,695 | | | $ | 354,809 | |
| Equity securities, at estimated fair value | | 1,001 | | | 1,079 | |
| Contractholder-directed equity securities and fair value option securities, at estimated fair value | | 12,177 | | | 13,319 | |
| Mortgage loans (net of allowance for credit loss of $570 and $590, respectively; includes $140 and $165, respectively, under the fair value option) | | 81,497 | | | 83,919 | |
| Policy loans | | 9,256 | | | 9,493 | |
| Real estate and real estate joint ventures (includes $191 and $169, respectively, under the fair value option and $78 and $128, respectively, of real estate held-for-sale) | | 11,901 | | | 11,933 | |
| Other limited partnership interests | | 11,980 | | | 9,470 | |
| Short-term investments, principally at estimated fair value | | 3,759 | | | 3,904 | |
| Other invested assets (includes $2,132 and $2,156, respectively, of leveraged and direct financing leases and $391 and $332, respectively, relating to variable interest entities) | | 18,977 | | | 20,593 | |
| Total investments | | 491,243 | | | 508,519 | |
| Cash and cash equivalents, principally at estimated fair value (includes $5 and $12, respectively, relating to variable interest entities) | | 25,037 | | | 19,795 | |
| Accrued investment income | | 3,202 | | | 3,388 | |
| Premiums, reinsurance and other receivables (includes $5 and $4, respectively, relating to variable interest entities) | | 18,236 | | | 17,870 | |
| Deferred policy acquisition costs and value of business acquired | | 16,527 | | | 16,389 | |
| Current income tax recoverable | | 52 | | | 0 | |
| Goodwill | | 9,768 | | | 10,112 | |
| | | | |
| Assets held-for-sale | | 7,590 | | | 7,418 | |
| Other assets (includes $2 and $1, respectively, relating to variable interest entities) | | 11,651 | | | 11,685 | |
| Separate account assets | | 189,947 | | | 199,970 | |
| Total assets | | $ | 773,253 | | | $ | 795,146 | |
| Liabilities and Equity | | | | |
| Liabilities | | | | |
| Future policy benefits | | $ | 199,376 | | | $ | 206,656 | |
| Policyholder account balances | | 204,948 | | | 205,176 | |
| Other policy-related balances | | 17,527 | | | 17,101 | |
| Policyholder dividends payable | | 572 | | | 587 | |
| Policyholder dividend obligation | | 2,115 | | | 2,969 | |
| Payables for collateral under securities loaned and other transactions | | 30,620 | | | 29,475 | |
| Short-term debt | | 393 | | | 393 | |
| Long-term debt (includes $0 and $5, respectively, relating to variable interest entities) | | 14,518 | | | 14,603 | |
| Collateral financing arrangement | | 818 | | | 845 | |
| Junior subordinated debt securities | | 3,154 | | | 3,153 | |
| | | | |
| Current income tax payable | | 0 | | | 129 | |
| Deferred income tax liability | | 9,748 | | | 11,008 | |
| Liabilities held-for-sale | | 6,844 | | | 4,650 | |
| Other liabilities (includes $10 and $1, respectively, relating to variable interest entities) | | 23,250 | | | 23,614 | |
| Separate account liabilities | | 189,947 | | | 199,970 | |
| Total liabilities | | 703,830 | | | 720,329 | |
| Contingencies, Commitments and Guarantees (Note 15) | | 0 | | 0 |
| Equity | | | | |
| MetLife, Inc.’s stockholders’ equity: | | | | |
| Preferred stock, par value $0.01 per share; $3,905 and $4,405 aggregate liquidation preference | | 0 | | | 0 | |
| Common stock, par value $0.01 per share; 3,000,000,000 shares authorized; 1,185,931,582 and 1,181,614,288 shares issued, respectively; 861,057,466 and 892,910,600 shares outstanding, respectively | | 12 | | | 12 | |
| Additional paid-in capital | | 33,440 | | | 33,812 | |
| Retained earnings | | 39,318 | | | 36,491 | |
| Treasury stock, at cost; 324,874,116 and 288,703,688 shares, respectively | | (15,941) | | | (13,829) | |
| Accumulated other comprehensive income (loss) ("AOCI") | | 12,309 | | | 18,072 | |
| Total MetLife, Inc.’s stockholders’ equity | | 69,138 | | | 74,558 | |
| Noncontrolling interests | | 285 | | | 259 | |
| Total equity | | 69,423 | | | 74,817 | |
| Total liabilities and equity | | $ | 773,253 | | | $ | 795,146 | |
|
| | | | | | | | |
| | | September 30, 2017 | | December 31, 2016 |
| Assets | | | | |
| Investments: | | | | |
| Fixed maturity securities available-for-sale, at estimated fair value (amortized cost: $286,684 and $271,701, respectively) | | $ | 308,894 |
| | $ | 289,563 |
|
| Equity securities available-for-sale, at estimated fair value (cost: $2,386 and $2,464, respectively) | | 2,776 |
| | 2,894 |
|
| Fair value option securities, at estimated fair value (includes $7 and $8, respectively, relating to variable interest entities) | | 16,538 |
| | 13,923 |
|
| Mortgage loans (net of valuation allowances of $316 and $304, respectively; includes $564 and $566, respectively, under the fair value option) | | 68,057 |
| | 65,167 |
|
| Policy loans | | 9,585 |
| | 9,511 |
|
| Real estate and real estate joint ventures (includes $61 and $59, respectively, of real estate held-for-sale) | | 9,486 |
| | 8,891 |
|
| Other limited partnership interests (includes $0 and $14, respectively, relating to variable interest entities) | | 5,501 |
| | 5,136 |
|
| Short-term investments, principally at estimated fair value | | 7,217 |
| | 6,523 |
|
| Other invested assets (includes $133 and $31, respectively, relating to variable interest entities) | | 17,652 |
| | 19,303 |
|
| Total investments | | 445,706 |
| | 420,911 |
|
| Cash and cash equivalents, principally at estimated fair value (includes $9 and $1, respectively, relating to variable interest entities) | | 13,023 |
| | 12,651 |
|
| Accrued investment income | | 3,692 |
| | 3,308 |
|
| Premiums, reinsurance and other receivables (includes $3 and $2, respectively, relating to variable interest entities) | | 18,588 |
| | 15,445 |
|
| Deferred policy acquisition costs and value of business acquired | | 18,399 |
| | 17,590 |
|
| Current income tax recoverable | | 3 |
| | 20 |
|
| Goodwill | | 9,556 |
| | 9,220 |
|
| Assets of disposed subsidiary | | — |
| | 216,983 |
|
| Other assets (includes $3 and $3, respectively, relating to variable interest entities) | | 8,149 |
| | 7,058 |
|
| Separate account assets | | 203,399 |
| | 195,578 |
|
| Total assets | | $ | 720,515 |
| | $ | 898,764 |
|
| Liabilities and Equity | | | | |
| Liabilities | | | | |
| Future policy benefits | | $ | 176,005 |
| | $ | 166,701 |
|
| Policyholder account balances | | 182,513 |
| | 173,168 |
|
| Other policy-related balances | | 15,026 |
| | 13,030 |
|
| Policyholder dividends payable | | 730 |
| | 696 |
|
| Policyholder dividend obligation | | 2,201 |
| | 1,931 |
|
| Payables for collateral under securities loaned and other transactions | | 27,132 |
| | 25,873 |
|
| Short-term debt | | 214 |
| | 242 |
|
| Long-term debt (includes $6 and $12, respectively, at estimated fair value, relating to variable interest entities) | | 16,688 |
| | 16,441 |
|
| Collateral financing arrangement | | 1,220 |
| | 1,274 |
|
| Junior subordinated debt securities | | 3,144 |
| | 3,169 |
|
| Liabilities of disposed subsidiary | | — |
| | 202,707 |
|
| Deferred income tax liability | | 8,554 |
| | 6,774 |
|
| Other liabilities | | 26,745 |
| | 23,700 |
|
| Separate account liabilities | | 203,399 |
| | 195,578 |
|
| Total liabilities | | 663,571 |
| | 831,284 |
|
| Contingencies, Commitments and Guarantees (Note 14) | |
| |
|
| Equity | | | | |
| MetLife, Inc.’s stockholders’ equity: | | | | |
| Preferred stock, par value $0.01 per share; $2,100 aggregate liquidation preference | | — |
| | — |
|
| Common stock, par value $0.01 per share; 3,000,000,000 shares authorized; 1,167,535,225 and 1,164,029,985 shares issued, respectively; 1,054,286,620 and 1,095,519,005 shares outstanding, respectively | | 12 |
| | 12 |
|
| Additional paid-in capital | | 31,066 |
| | 30,944 |
|
| Retained earnings | | 24,410 |
| | 34,480 |
|
| Treasury stock, at cost; 113,248,605 and 68,510,980 shares, respectively | | (5,779 | ) | | (3,474 | ) |
| Accumulated other comprehensive income (loss) | | 7,005 |
| | 5,347 |
|
| Total MetLife, Inc.’s stockholders’ equity | | 56,714 |
| | 67,309 |
|
| Noncontrolling interests | | 230 |
| | 171 |
|
| Total equity | | 56,944 |
| | 67,480 |
|
| Total liabilities and equity | | $ | 720,515 |
| | $ | 898,764 |
|
MetLife, Inc.
Interim Condensed Consolidated Statements of Operations and Comprehensive Income (Loss)
For the Three Months and NineSix Months Ended SeptemberJune 30, 20172021 and 20162020 (Unaudited)
(In millions, except per share data)
| | | | | | | | | | | | | | | | | | | | | | | | | | |
| | Three Months
Ended
June 30, | | Six Months
Ended
June 30, |
| | 2021 | | 2020 | | 2021 | | 2020 |
| Revenues | | | | | | | | |
| Premiums | | $ | 9,132 | | | $ | 8,736 | | | $ | 19,459 | | | $ | 18,202 | |
| Universal life and investment-type product policy fees | | 1,422 | | | 1,299 | | | 2,813 | | | 2,730 | |
| Net investment income | | 5,280 | | | 4,087 | | | 10,594 | | | 7,148 | |
| Other revenues | | 664 | | | 456 | | | 1,295 | | | 895 | |
| Net investment gains (losses) | | 1,605 | | | 231 | | | 1,739 | | | (57) | |
| Net derivative gains (losses) | | 421 | | | (710) | | | (1,814) | | | 3,491 | |
| Total revenues | | 18,524 | | | 14,099 | | | 34,086 | | | 32,409 | |
| Expenses | | | | | | | | |
| Policyholder benefits and claims | | 9,405 | | | 8,667 | | | 19,928 | | | 17,689 | |
| Interest credited to policyholder account balances | | 1,515 | | | 1,962 | | | 2,866 | | | 2,042 | |
| Policyholder dividends | | 236 | | | 290 | | | 483 | | | 582 | |
| Other expenses | | 2,881 | | | 2,983 | | | 6,031 | | | 6,256 | |
| Total expenses | | 14,037 | | | 13,902 | | | 29,308 | | | 26,569 | |
| Income (loss) before provision for income tax | | 4,487 | | | 197 | | | 4,778 | | | 5,840 | |
| Provision for income tax expense (benefit) | | 1,075 | | | 47 | | | 1,003 | | | 1,289 | |
| Net income (loss) | | 3,412 | | | 150 | | | 3,775 | | | 4,551 | |
| Less: Net income (loss) attributable to noncontrolling interests | | 5 | | | 5 | | | 10 | | | 8 | |
| Net income (loss) attributable to MetLife, Inc. | | 3,407 | | | 145 | | | 3,765 | | | 4,543 | |
| Less: Preferred stock dividends | | 35 | | | 77 | | | 103 | | | 109 | |
| Preferred stock redemption premium | | 6 | | | 0 | | | 6 | | | 0 | |
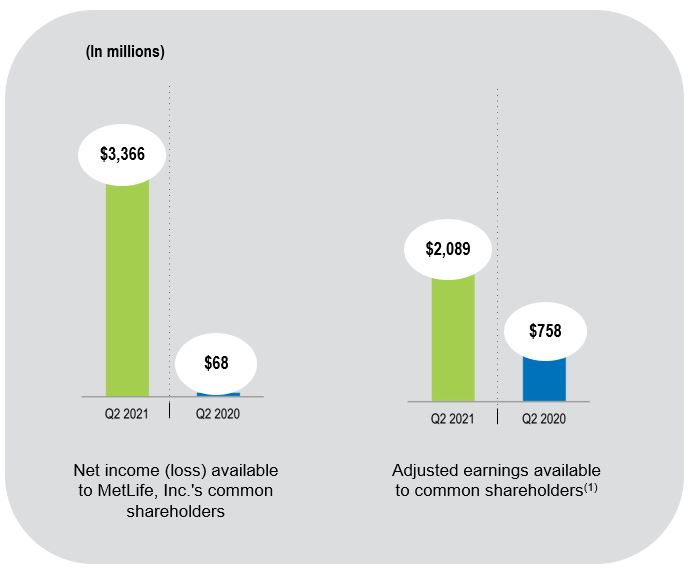
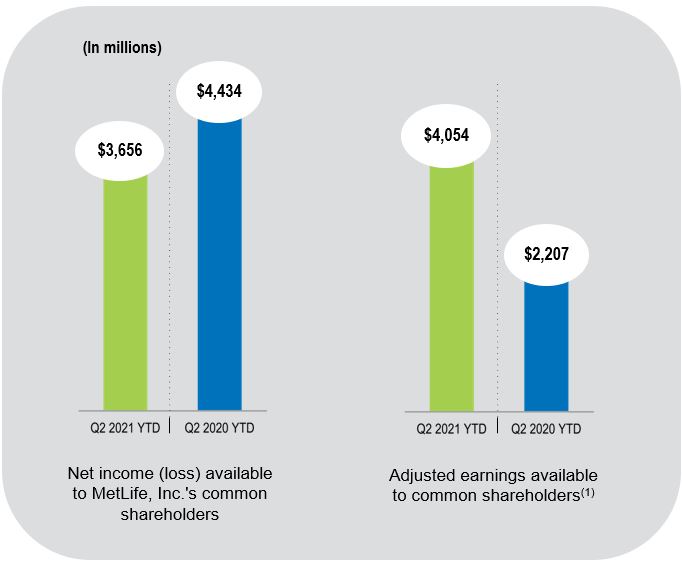
| Net income (loss) available to MetLife, Inc.’s common shareholders | | $ | 3,366 | | | $ | 68 | | | $ | 3,656 | | | $ | 4,434 | |
| Comprehensive income (loss) | | $ | 5,325 | | | $ | 5,957 | | | $ | (1,987) | | | $ | 10,064 | |
| Less: Comprehensive income (loss) attributable to noncontrolling interests, net of income tax | | 6 | | | 6 | | | 11 | | | 10 | |
| Comprehensive income (loss) attributable to MetLife, Inc. | | $ | 5,319 | | | $ | 5,951 | | | $ | (1,998) | | | $ | 10,054 | |
|
| | | | | | | | | | | | | | | |
| | Three Months
Ended
September 30, | | Nine Months
Ended
September 30, |
| | 2017 | | 2016 | | 2017 | | 2016 |
| Revenues | | | | | | | |
| Premiums | $ | 10,876 |
| | $ | 9,839 |
| | $ | 29,421 |
| | $ | 27,956 |
|
| Universal life and investment-type product policy fees | 1,428 |
| | 1,341 |
| | 4,152 |
| | 4,127 |
|
| Net investment income | 4,295 |
| | 4,609 |
| | 12,909 |
| | 12,527 |
|
| Other revenues | 301 |
| | 356 |
| | 935 |
| | 1,309 |
|
| Net investment gains (losses): | | | | | | | |
| Other-than-temporary impairments on fixed maturity securities | (6 | ) | | (4 | ) | | (8 | ) | | (74 | ) |
| Other-than-temporary impairments on fixed maturity securities transferred to other comprehensive income (loss) | 1 |
| | (5 | ) | | 1 |
| | (9 | ) |
| Other net investment gains (losses) | (601 | ) | | 240 |
| | (432 | ) | | 681 |
|
| Total net investment gains (losses) | (606 | ) | | 231 |
| | (439 | ) | | 598 |
|
| Net derivative gains (losses) | (190 | ) | | (543 | ) | | (663 | ) | | 1,438 |
|
| Total revenues | 16,104 |
| | 15,833 |
| | 46,315 |
| | 47,955 |
|
| Expenses | | | | | | | |
| Policyholder benefits and claims | 10,645 |
| | 9,612 |
| | 28,923 |
| | 27,394 |
|
| Interest credited to policyholder account balances | 1,338 |
| | 1,544 |
| | 4,081 |
| | 3,819 |
|
| Policyholder dividends | 302 |
| | 302 |
| | 925 |
| | 924 |
|
| Other expenses | 3,318 |
| | 3,216 |
| | 9,904 |
| | 10,296 |
|
| Total expenses | 15,603 |
| | 14,674 |
| | 43,833 |
| | 42,433 |
|
| Income (loss) from continuing operations before provision for income tax | 501 |
| | 1,159 |
| | 2,482 |
| | 5,522 |
|
| Provision for income tax expense (benefit) | (392 | ) | | 135 |
| | (148 | ) | | 1,253 |
|
| Income (loss) from continuing operations, net of income tax | 893 |
| | 1,024 |
| | 2,630 |
| | 4,269 |
|
| Income (loss) from discontinued operations, net of income tax | (968 | ) | | (451 | ) | | (989 | ) | | (1,379 | ) |
| Net income (loss) | (75 | ) | | 573 |
| | 1,641 |
| | 2,890 |
|
| Less: Net income (loss) attributable to noncontrolling interests | 6 |
| | (4 | ) | | 12 |
| | 2 |
|
| Net income (loss) attributable to MetLife, Inc. | (81 | ) | | 577 |
| | 1,629 |
| | 2,888 |
|
| Less: Preferred stock dividends | 6 |
| | 6 |
| | 58 |
| | 58 |
|
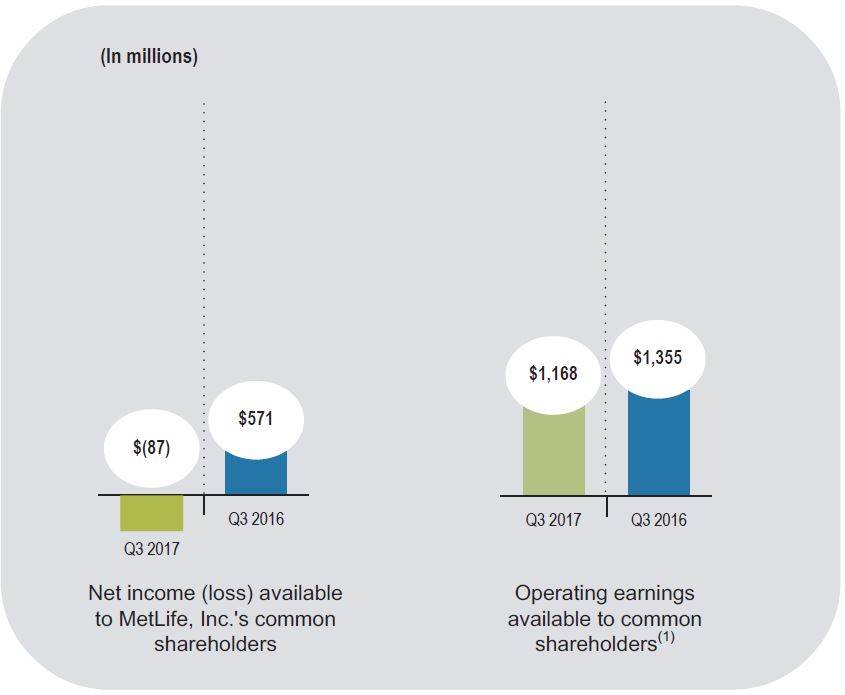
| Net income (loss) available to MetLife, Inc.’s common shareholders | $ | (87 | ) | | $ | 571 |
| | $ | 1,571 |
| | $ | 2,830 |
|
| Comprehensive income (loss) | $ | (182 | ) | | $ | (463 | ) | | $ | 4,623 |
| | $ | 11,809 |
|
| Less: Comprehensive income (loss) attributable to noncontrolling interests, net of income tax | 10 |
| | (3 | ) | | 16 |
| | 97 |
|
| Comprehensive income (loss) attributable to MetLife, Inc. | $ | (192 | ) | | $ | (460 | ) | | $ | 4,607 |
| | $ | 11,712 |
|
| | | | | | | | | | | | | | | | | | | | | | | | | | |
| | | | | | | | |
| | | | | | | | |
| | | | | | | | |
| Net income (loss) available to MetLife, Inc.’s common shareholders per common share: | | | | | | | | |
| Basic | | $ | 3.85 | | | $ | 0.07 | | | $ | 4.16 | | | $ | 4.86 | |
| Diluted | | $ | 3.83 | | | $ | 0.07 | | | $ | 4.13 | | | $ | 4.84 | |
| | | | | | | | |
|
| | | | | | | | | | | | | | | |
| Income (Loss) from Continuing Operations: | | | | | | | |
| Basic | $ | 0.83 |
| | $ | 0.93 |
| | $ | 2.38 |
| | $ | 3.82 |
|
| Diluted | $ | 0.82 |
| | $ | 0.92 |
| | $ | 2.36 |
| | $ | 3.80 |
|
| Net income (loss) available to MetLife, Inc.’s common shareholders per common share: | | | | | | | |
| Basic | $ | (0.08 | ) | | $ | 0.52 |
| | $ | 1.46 |
| | $ | 2.57 |
|
| Diluted | $ | (0.08 | ) | | $ | 0.51 |
| | $ | 1.45 |
| | $ | 2.55 |
|
| Cash dividends declared per common share | $ | 0.400 |
| | $ | 0.400 |
| | $ | 1.200 |
| | $ | 1.175 |
|
See accompanying notes to the interim condensed consolidated financial statements.
MetLife, Inc.
Interim Condensed Consolidated Statements of Equity
For the NineSix Months Ended SeptemberJune 30, 20172021 and 20162020 (Unaudited)
| | | | | | | | | | | | | | | | | | | | | | Preferred
Stock | | Common
Stock | | Additional
Paid-in
Capital | | Retained
Earnings | | Treasury
Stock
at Cost | | Accumulated
Other
Comprehensive
Income (Loss) | | Total
MetLife, Inc.’s
Stockholders’
Equity | | Noncontrolling
Interests | | Total
Equity |
| | | Preferred Stock | | Common Stock | | Additional Paid-in Capital | | Retained Earnings | | Treasury Stock at Cost | | Accumulated Other Comprehensive Income (Loss) | | Total MetLife, Inc.’s Stockholders’ Equity | | Noncontrolling Interests | | Total Equity | |
| Balance at December 31, 2016 | | $ | — |
| | $ | 12 |
| | $ | 30,944 |
| | $ | 34,480 |
| | $ | (3,474 | ) | | $ | 5,347 |
| | $ | 67,309 |
| | $ | 171 |
| | $ | 67,480 |
| |
| Balance at December 31, 2020 | | Balance at December 31, 2020 | | $ | 0 | | | $ | 12 | | | $ | 33,812 | | | $ | 36,491 | | | $ | (13,829) | | | $ | 18,072 | | | $ | 74,558 | | | $ | 259 | | | $ | 74,817 | |
| Treasury stock acquired in connection with share repurchases | | | |
| |
|
| | | | (2,305 | ) | | | | (2,305 | ) | | | | (2,305 | ) | Treasury stock acquired in connection with share repurchases | | (999) | | | (999) | | | (999) | |
| Stock-based compensation | | | | | | 122 |
| | | | | | | | 122 |
| | | | 122 |
| Stock-based compensation | | 98 | | | 98 | | | 98 | |
| Dividends on preferred stock | | | | | | | | (58 | ) | | | | | | (58 | ) | | | | (58 | ) | Dividends on preferred stock | | (68) | | | (68) | | | (68) | |
| Dividends on common stock | | | | | | | | (1,295 | ) | | | | | | (1,295 | ) | | | | (1,295 | ) | |
| Distribution of Brighthouse (Note 3) | | | | | | | | (10,346 | ) | | | | (1,320 | ) | | (11,666 | ) | | | | (11,666 | ) | |
| Dividends on common stock (declared per share of $0.460) | | Dividends on common stock (declared per share of $0.460) | | (408) | | | (408) | | | (408) | |
| Change in equity of noncontrolling interests | | | | | | | | | | | | | | — |
| | 43 |
| | 43 |
| Change in equity of noncontrolling interests | | 0 | | | 9 | | | 9 | |
| Net income (loss) | | | | | | | | 1,629 |
| | | | | | 1,629 |
| | 12 |
| | 1,641 |
| Net income (loss) | | 358 | | | 358 | | | 5 | | | 363 | |
| Other comprehensive income (loss), net of income tax | | | | | | | | | | | | 2,978 |
| | 2,978 |
| | 4 |
| | 2,982 |
| Other comprehensive income (loss), net of income tax | | (7,675) | | | (7,675) | | | 0 | | | (7,675) | |
| Balance at September 30, 2017 | | $ | — |
| | $ | 12 |
| | $ | 31,066 |
| | $ | 24,410 |
| | $ | (5,779 | ) | | $ | 7,005 |
| | $ | 56,714 |
| | $ | 230 |
| | $ | 56,944 |
| |
| Balance at March 31, 2021 | | Balance at March 31, 2021 | | 0 | | | 12 | | | 33,910 | | | 36,373 | | | (14,828) | | | 10,397 | | | 65,864 | | | 273 | | | 66,137 | |
| Redemption of preferred stock | | Redemption of preferred stock | | (494) | | | (494) | | | (494) | |
| Preferred stock redemption premium | | Preferred stock redemption premium | | (6) | | | (6) | | | (6) | |
| Treasury stock acquired in connection with share repurchases | | Treasury stock acquired in connection with share repurchases | | (1,113) | | | (1,113) | | | (1,113) | |
| Stock-based compensation | | Stock-based compensation | | 24 | | | 24 | | | 24 | |
| Dividends on preferred stock | | Dividends on preferred stock | | (35) | | | (35) | | | (35) | |
| Dividends on common stock (declared per share of $0.480) | | Dividends on common stock (declared per share of $0.480) | | (421) | | | (421) | | | (421) | |
| Change in equity of noncontrolling interests | | Change in equity of noncontrolling interests | | 0 | | | 6 | | | 6 | |
| Net income (loss) | | Net income (loss) | | 3,407 | | | 3,407 | | | 5 | | | 3,412 | |
| Other comprehensive income (loss), net of income tax | | Other comprehensive income (loss), net of income tax | | 1,912 | | | 1,912 | | | 1 | | | 1,913 | |
| Balance at June 30, 2021 | | Balance at June 30, 2021 | | $ | 0 | | | $ | 12 | | | $ | 33,440 | | | $ | 39,318 | | | $ | (15,941) | | | $ | 12,309 | | | $ | 69,138 | | | $ | 285 | | | $ | 69,423 | |
| | | | | | | | | | | | | | | | | | | | | | Preferred
Stock | | Common
Stock | | Additional
Paid-in
Capital | | Retained
Earnings | | Treasury
Stock
at Cost | | Accumulated
Other
Comprehensive
Income (Loss) | | Total
MetLife, Inc.’s
Stockholders’
Equity | | Noncontrolling
Interests | | Total
Equity |
| | | Preferred Stock | | Common Stock | | Additional Paid-in Capital | | Retained Earnings | | Treasury Stock at Cost | | Accumulated Other Comprehensive Income (Loss) | | Total MetLife, Inc.’s Stockholders’ Equity | | Noncontrolling Interests | | Total Equity | |
| Balance at December 31, 2015 | | $ | — |
| | $ | 12 |
| | $ | 30,749 |
| | $ | 35,519 |
| | $ | (3,102 | ) | | $ | 4,771 |
| | $ | 67,949 |
| | $ | 470 |
| | $ | 68,419 |
| |
| Balance at December 31, 2019 | | Balance at December 31, 2019 | | $ | 0 | | | $ | 12 | | | $ | 32,680 | | | $ | 33,078 | | | $ | (12,678) | | | $ | 13,052 | | | $ | 66,144 | | | $ | 238 | | | $ | 66,382 | |
| Cumulative effects of changes in accounting principles, net of income tax | | Cumulative effects of changes in accounting principles, net of income tax | | (121) | | | (121) | | | (121) | |
| Preferred stock issuance | | Preferred stock issuance | | 972 | | 972 | | | 972 | |
| Treasury stock acquired in connection with share repurchases | | | | | | | | | | (70 | ) | | | | (70 | ) | | | | (70 | ) | Treasury stock acquired in connection with share repurchases | | (500) | | | (500) | | | (500) | |
| Stock-based compensation | | | | | | 48 |
| | | | | | | | 48 |
| | | | 48 |
| Stock-based compensation | | 59 | | | 59 | | | 59 | |
| Dividends on preferred stock | | | | | | | | (58 | ) | | | | | | (58 | ) | | | | (58 | ) | Dividends on preferred stock | | (32) | | | (32) | | | (32) | |
| Dividends on common stock | | | | | | | | (1,295 | ) | | | | | | (1,295 | ) | | | | (1,295 | ) | |
| Dividends on common stock (declared per share of $0.440) | | Dividends on common stock (declared per share of $0.440) | | (404) | | | (404) | | | (404) | |
| Net income (loss) | | Net income (loss) | | 4,398 | | | 4,398 | | | 3 | | | 4,401 | |
| Other comprehensive income (loss), net of income tax | | Other comprehensive income (loss), net of income tax | | (295) | | | (295) | | | 1 | | | (294) | |
| Balance at March 31, 2020 | | Balance at March 31, 2020 | | 0 | | | 12 | | | 33,711 | | | 36,919 | | | (13,178) | | | 12,757 | | | 70,221 | | | 242 | | | 70,463 | |
| Stock-based compensation | | Stock-based compensation | | 17 | | | 17 | | | 17 | |
| Dividends on preferred stock | | Dividends on preferred stock | | (77) | | | (77) | | | (77) | |
| Dividends on common stock (declared per share of $0.460) | | Dividends on common stock (declared per share of $0.460) | | (419) | | | (419) | | | (419) | |
| Change in equity of noncontrolling interests | | | | | | | | | | | | | | — |
| | (387 | ) | | (387 | ) | Change in equity of noncontrolling interests | | 0 | | | (1) | | | (1) | |
| Net income (loss) | | | | | | | | 2,888 |
| | | | | | 2,888 |
| | 2 |
| | 2,890 |
| Net income (loss) | | 145 | | | 145 | | | 5 | | | 150 | |
| Other comprehensive income (loss), net of income tax | | | | | | | | | | | | 8,824 |
| | 8,824 |
| | 95 |
| | 8,919 |
| Other comprehensive income (loss), net of income tax | | 5,806 | | | 5,806 | | | 1 | | | 5,807 | |
| Balance at September 30, 2016 | | $ | — |
| | $ | 12 |
| | $ | 30,797 |
| | $ | 37,054 |
| | $ | (3,172 | ) | | $ | 13,595 |
| | $ | 78,286 |
| | $ | 180 |
| | $ | 78,466 |
| |
| Balance at June 30, 2020 | | Balance at June 30, 2020 | | $ | 0 | | | $ | 12 | | | $ | 33,728 | | | $ | 36,568 | | | $ | (13,178) | | | $ | 18,563 | | | $ | 75,693 | | | $ | 247 | | | $ | 75,940 | |
See accompanying notes to the interim condensed consolidated financial statements.
MetLife, Inc.
Interim Condensed Consolidated Statements of Cash Flows
For the NineSix Months Ended SeptemberJune 30, 20172021 and 20162020 (Unaudited)
(In millions)
| | | | | | | | | | | |
| Six Months
Ended
June 30, |
| 2021 | | 2020 |
| Net cash provided by (used in) operating activities | $ | 3,750 | | | $ | 2,693 | |
| Cash flows from investing activities | | | |
| Sales, maturities and repayments of: | | | |
| Fixed maturity securities available-for-sale | 44,199 | | | 40,034 | |
| Equity securities | 335 | | | 125 | |
| Mortgage loans | 8,626 | | | 5,057 | |
| Real estate and real estate joint ventures | 736 | | | 103 | |
| Other limited partnership interests | 332 | | | 160 | |
| Purchases and originations of: | | | |
| Fixed maturity securities available-for-sale | (46,011) | | | (47,511) | |
| Equity securities | (34) | | | (49) | |
| Mortgage loans | (6,235) | | | (7,740) | |
| Real estate and real estate joint ventures | (429) | | | (942) | |
| Other limited partnership interests | (1,347) | | | (874) | |
| Cash received in connection with freestanding derivatives | 1,769 | | | 5,256 | |
| Cash paid in connection with freestanding derivatives | (5,602) | | | (2,017) | |
| | | |
| Sales of businesses, net of cash and cash equivalents disposed of $611 and $0, respectively | 3,329 | | | 0 | |
| | | |
| | | |
| Net change in policy loans | 137 | | | 12 | |
| Net change in short-term investments | 116 | | | (1,572) | |
| Net change in other invested assets | 40 | | | 65 | |
| Other, net | (6) | | | 165 | |
| Net cash provided by (used in) investing activities | (45) | | | (9,728) | |
| Cash flows from financing activities | | | |
| Policyholder account balances: | | | |
| Deposits | 50,865 | | | 50,120 | |
| Withdrawals | (46,995) | | | (43,109) | |
| Payables for collateral under securities loaned and other transactions: | | | |
| Net change in payables for collateral under securities loaned and other transactions | 506 | | | 7,401 | |
| Cash received for other transactions with tenors greater than three months | 0 | | | 50 | |
| Cash paid for other transactions with tenors greater than three months | (100) | | | (50) | |
| Long-term debt issued | 15 | | | 1,074 | |
| Long-term debt repaid | (28) | | | (13) | |
| Collateral financing arrangement repaid | (27) | | | (25) | |
| | | |
| Financing element on certain derivative instruments and other derivative related transactions, net | 318 | | | (242) | |
| Treasury stock acquired in connection with share repurchases | (2,112) | | | (500) | |
| Preferred stock issued, net of issuance costs | 0 | | | 972 | |
| Redemption of preferred stock | (494) | | | 0 | |
| Preferred stock redemption premium | (6) | | | 0 | |
| Dividends on preferred stock | (103) | | | (109) | |
| Dividends on common stock | (829) | | | (823) | |
| Other, net | 58 | | | 91 | |
| Net cash provided by (used in) financing activities | 1,068 | | | 14,837 | |
| Effect of change in foreign currency exchange rates on cash and cash equivalents balances | (192) | | | (111) | |
| Change in cash and cash equivalents | 4,581 | | | 7,691 | |
| Cash and cash equivalents, including subsidiary held-for-sale, beginning of period | 20,560 | | | 16,598 | |
| Cash and cash equivalents, including subsidiary held-for-sale, end of period | $ | 25,141 | | | $ | 24,289 | |
| Cash and cash equivalents, subsidiary held-for-sale, beginning of period | $ | 765 | | | $ | 0 | |
| Cash and cash equivalents, subsidiary held-for-sale, end of period | $ | 104 | | | $ | 0 | |
| Cash and cash equivalents, beginning of period | $ | 19,795 | | | $ | 16,598 | |
| Cash and cash equivalents, end of period | $ | 25,037 | | | $ | 24,289 | |
| | | | | | | | | | | |
| Supplemental disclosures of cash flow information | | | |
| Net cash paid (received) for: | | | |
| Interest | $ | 440 | | | $ | 426 | |
| Income tax | $ | 748 | | | $ | 130 | |
| Subsidiaries held-for-sale (Note 3): | | | |
| Assets held-for-sale | $ | 7,590 | | | $ | 0 | |
| Liabilities held-for-sale | 6,844 | | | 0 | |
| Net assets held-for-sale | $ | 746 | | | $ | 0 | |
| Non-cash transactions: | | | |
| | | |
| Operating lease liability associated with the recognition of right-of-use assets | $ | 179 | | | $ | 52 | |
| | | |
| Real estate and real estate joint ventures acquired in satisfaction of debt | $ | 171 | | | $ | 0 | |
| Increase in equity securities due to in-kind distributions received from other limited partnership interests | $ | 151 | | | $ | 40 | |
| Increase in policyholder account balances associated with funding agreement backed notes issued but not settled | $ | 0 | | | $ | 750 | |
| | | |
| | | |
| | | |
| | | |
| | | |
| | | |
| | | |
| | | |
| | | |
| | | |
| | | |
| | | |
| | | |
| | | |
| | | |
| | | |
| | | |
| | | |
| | | |
| | | |
| | | |
|
| | | | | | | |
| | Nine Months
Ended
September 30, |
| | 2017 | | 2016 |
| Net cash provided by (used in) operating activities | $ | 10,233 |
| | $ | 9,131 |
|
| Cash flows from investing activities | | | |
| Sales, maturities and repayments of: | | | |
| Fixed maturity securities | 66,544 |
| | 101,614 |
|
| Equity securities | 904 |
| | 1,019 |
|
| Mortgage loans | 6,721 |
| | 10,518 |
|
| Real estate and real estate joint ventures | 689 |
| | 323 |
|
| Other limited partnership interests | 882 |
| | 1,025 |
|
| Purchases of: | | | |
| Fixed maturity securities | (76,010 | ) | | (108,418 | ) |
| Equity securities | (705 | ) | | (802 | ) |
| Mortgage loans | (9,988 | ) | | (14,686 | ) |
| Real estate and real estate joint ventures | (1,078 | ) | | (958 | ) |
| Other limited partnership interests | (1,064 | ) | | (806 | ) |
| Cash received in connection with freestanding derivatives | 4,890 |
| | 3,258 |
|
| Cash paid in connection with freestanding derivatives | (7,404 | ) | | (4,317 | ) |
| Cash disposed due to distribution of Brighthouse | (663 | ) | | — |
|
| Sales of businesses, net of cash and cash equivalents disposed of $0 and $135, respectively | — |
| | 156 |
|
| Purchases of businesses | (211 | ) | | — |
|
Purchases of investments in operating joint ventures
| — |
| | (39 | ) |
| Net change in policy loans | (16 | ) | | 201 |
|
| Net change in short-term investments | (209 | ) | | (2,232 | ) |
| Net change in other invested assets | (184 | ) | | (58 | ) |
| Other, net | (256 | ) | | (384 | ) |
| Net cash provided by (used in) investing activities | (17,158 | ) | | (14,586 | ) |
| Cash flows from financing activities | | | |
| Policyholder account balances: | | | |
| Deposits | 67,565 |
| | 65,225 |
|
| Withdrawals | (62,233 | ) | | (61,145 | ) |
| Net change in payables for collateral under securities loaned and other transactions | 2,316 |
| | 7,227 |
|
| Long-term debt issued | 3,657 |
| | — |
|
| Long-term debt repaid | (60 | ) | | (1,273 | ) |
| Collateral financing arrangements repaid | (2,852 | ) | | (55 | ) |
| Distribution of Brighthouse | (2,793 | ) | | — |
|
| Financing element on certain derivative instruments and other derivative related transactions, net | (109 | ) | | (336 | ) |
| Treasury stock acquired in connection with share repurchases | (2,305 | ) | | (70 | ) |
| Dividends on preferred stock | (58 | ) | | (58 | ) |
| Dividends on common stock | (1,295 | ) | | (1,295 | ) |
| Other, net | (144 | ) | | 60 |
|
| Net cash provided by (used in) financing activities | 1,689 |
| | 8,280 |
|
| Effect of change in foreign currency exchange rates on cash and cash equivalents balances | 382 |
| | 306 |
|
| Change in cash and cash equivalents | (4,854 | ) | | 3,131 |
|
| Cash and cash equivalents, beginning of period | 17,877 |
| | 12,752 |
|
| Cash and cash equivalents, end of period | $ | 13,023 |
| | $ | 15,883 |
|
| Cash and cash equivalents, of disposed subsidiary, beginning of period | $ | 5,226 |
| | $ | 1,570 |
|
| Cash and cash equivalents, of disposed subsidiary, end of period | $ | — |
| | $ | 2,825 |
|
| Cash and cash equivalents, from continuing operations, beginning of period | $ | 12,651 |
| | $ | 11,182 |
|
| Cash and cash equivalents, from continuing operations, end of period | $ | 13,023 |
| | $ | 13,058 |
|
|
| | | | | | | |
| | Nine Months
Ended
September 30, |
| | 2017 | | 2016 |
| Supplemental disclosures of cash flow information | | | |
| Net cash paid (received) for: | | | |
| Interest | $ | 806 |
| | $ | 875 |
|
| Income tax | $ | 633 |
| | $ | 464 |
|
| Non-cash transactions: | | | |
Disposal of Brighthouse (See Note 3):
| | | |
Assets disposed
| $ | 225,502 |
| | $ | — |
|
Liabilities disposed
| (210,999 | ) | | — |
|
Net assets disposed
| $ | 14,503 |
| | $ | — |
|
Cash disposed
| (3,456 | ) | | — |
|
Net non-cash disposed
| $ | 11,047 |
| | $ | — |
|
Fixed maturity securities received in connection with pension risk transfer transactions
| $ | — |
| | $ | 985 |
|
| Reduction of fixed maturity securities in connection with a reinsurance transaction | $ | — |
| | $ | 224 |
|
| Deconsolidation of operating joint venture: | | | |
| Reduction of fixed maturity securities | $ | — |
| | $ | 917 |
|
| Reduction of noncontrolling interests | $ | — |
| | $ | 373 |
|
See accompanying notes to the interim condensed consolidated financial statements.
statements.
MetLife, Inc.
Notes to the Interim Condensed Consolidated Financial Statements (Unaudited)
1. Business, Basis of Presentation and Summary of Significant Accounting Policies
Business
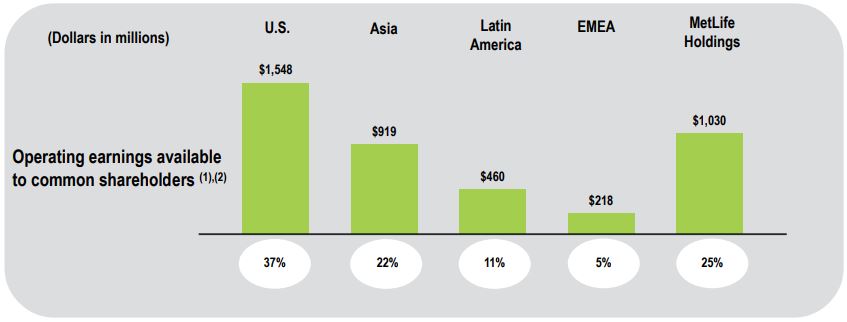
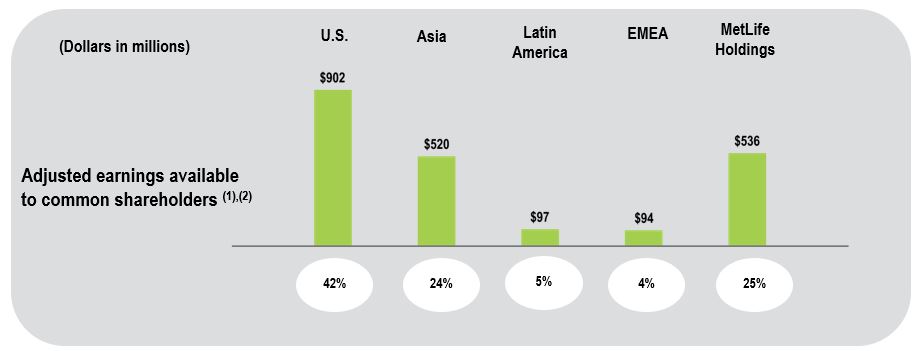
“MetLife” and the “Company” refer to MetLife, Inc., a Delaware corporation incorporated in 1999, its subsidiaries and affiliates. MetLife is one of the world’s leading financial services companies, providing insurance, annuities, employee benefits and asset management. MetLife is organized into five5 segments: U.S.; Asia; Latin America; Europe, the Middle East and Africa (“EMEA”); and MetLife Holdings.
On August 4, 2017, MetLife, Inc. completed the separation of Brighthouse Financial, Inc. and its subsidiaries (“Brighthouse”) through a distribution of 96,776,670 shares of Brighthouse Financial, Inc. common stock to the MetLife, Inc. common shareholders (the “Separation”). See Note 3 for additional information on the Separation.
Basis of Presentation
The preparation of financial statements in conformity with accounting principles generally accepted in the United States of America (“GAAP”) requires management to adopt accounting policies and make estimates and assumptions that affect amounts reported on the interim condensed consolidated financial statements. In applying these policies and estimates, management makes subjective and complex judgments that frequently require assumptions about matters that are inherently uncertain.uncertain, including uncertainties associated with the novel coronavirus COVID-19 pandemic (the “COVID-19 Pandemic”). Many of these policies, estimates and related judgments are common in the insurance and financial services industries; others are specific to the Company’s business and operations. Actual results could differ from these estimates.
The accompanying interim condensed consolidated financial statements are unaudited and reflect all adjustments (including normal recurring adjustments) necessary to present fairly the financial position, results of operations and cash flows for the interim periods presented in conformity with GAAP. Interim results are not necessarily indicative of full year performance. The December 31, 2020 consolidated balance sheet data was derived from audited consolidated financial statements included in MetLife, Inc.’s Annual Report on Form 10-K for the year ended December 31, 2020 (the “2020 Annual Report”), which include all disclosures required by GAAP. Therefore, these interim condensed consolidated financial statements should be read in conjunction with the consolidated financial statements of the Company included in the 2020 Annual Report.
Consolidation
The accompanying interim condensed consolidated financial statements include the accounts of MetLife, Inc. and its subsidiaries, as well as partnerships and joint ventures in which the Company has control, and variable interest entities (“VIEs”) for which the Company is the primary beneficiary. Intercompany accounts and transactions have been eliminated.
The Company uses the equity method of accounting for equity securities when it has significant influence or at least 20% interest andthe fair value option (“FVO”) for real estate joint ventures and other limited partnership interests (“investees”investee”) when it has more than a minor ownership interest or more than a minor influence over the investee’s operations. The Company generally recognizes its share of the investee’s earnings in net investment income on a three-month lag in instances where the investee’s financial information is not sufficiently timely or when the investee’s reporting period differs from the Company’s reporting period.
Held-for-Sale
The Company usesclassifies a business as held-for-sale when management has approved or received approval to sell the business, the sale is probable to occur during the next 12 months at a price that is reasonable in relation to its current estimated fair value and certain other specified criteria are met. The business classified as held-for-sale is recorded at the lower of the carrying value and estimated fair value, less cost methodto sell. If the carrying value of accounting for investmentsthe business exceeds its estimated fair value, less cost to sell, a loss is recognized and reported in net investment gains (losses). Assets and liabilities related to the business classified as held-for-sale are separately reported in the Company's consolidated balance sheets in the period in which it has virtually no influence over the investee’s operations.
Discontinued Operations
The results of operations ofbusiness is classified as held-for-sale. See Note 3. If a component of the Company that has either been disposed of or is classified as held-for-sale are reported in discontinued operations if certain criteria are met. A disposal of a component is reported as discontinued operations if the disposaland represents a strategic shift that has or will have a major effect on the Company’s operations and financials. Thefinancial results, the results of Brighthousethe component are reflectedreported in the Company’s interim condensed consolidated financial statements as discontinued operations. Prior period results have been revised to reflect discontinued operations. Intercompany transactions between the Company and Brighthouse prior to the Separation have been eliminated. Transactions between the Company and Brighthouse after the Separation are reflected in continuing operations for the Company. See Note 3 for information on discontinued operations and transactions with Brighthouse.
Reclassifications
Certain amounts in the prior year periods’ interim condensed consolidated financial statements and related footnotes thereto have been reclassified to conform to the 20172021 presentation as discussed throughout the Notes to the Interim Condensed Consolidated Financial Statements.
The accompanying interim condensed consolidated financial statements are unaudited and reflect all adjustments (including normal recurring adjustments) necessary to present fairly the financial position, results of operations and cash flows for the interim periods presented in conformity with GAAP. Interim results are not necessarily indicative of full year performance. The December 31, 2016 consolidated balance sheet data was derived from audited consolidated financial statements included in MetLife, Inc.’s Annual Report on Form 10‑K for the year ended December 31, 2016 (the “2016 Annual Report”), which include all disclosures required by GAAP. Therefore, these interim condensed consolidated financial statements should be read in conjunction with the consolidated financial statements of the Company included in the 2016 Annual Report.
MetLife, Inc.
Notes to the Interim Condensed Consolidated Financial Statements (Unaudited) — (continued)
1. Business, Basis of Presentation and Summary of Significant Accounting Policies (continued)
Adoption of NewRecent Accounting Pronouncements
Effective January 1, 2017, the Company early adopted guidance relatingChanges to business combinations. The new guidance clarifies the definition of a business and requires that an entity apply certain criteria in order to determine when a set of assets and activities qualifies as a business. The adoption of this standard will result in fewer acquisitions qualifying as businesses and, accordingly, acquisition costs for those acquisitions that do not qualify as businesses will be capitalized rather than expensed. The adoption did not have a material impact on the Company’s consolidated financial statements.
Effective January 1, 2017, the Company retrospectively adopted guidance relating to consolidation. The new guidance does not change the characteristics of a primary beneficiary under current GAAP. It changes how a reporting entity evaluates whether it is the primary beneficiary of a VIEGAAP are established by changing how a reporting entity that is a single decisionmaker of a VIE handles indirect interests in the entity held through related parties that are under common control with the reporting entity. The adoption of this new guidance did not have a material impact on the Company’s consolidated financial statements.
Effective January 1, 2017, the Company adopted guidance related to stock-based compensation. The new guidance changes several aspects of the accounting for share-based payment and award transactions, including (i) income tax consequences when awards vest or are settled; (ii) classification as either equity or liability due to statutory tax withholding requirements; and (iii) classification on the statement of cash flows. In addition, the new guidance provides an accounting policy election to account for forfeitures as they occur, rather than to account for them based on an estimate of expected forfeitures. The Company has elected to continue to account for forfeitures based on an estimate of expected forfeitures. In addition, the Company elected to apply the change in presentation in the statement of cash flows related to excess tax benefits prospectively and prior periods have not been adjusted. The change in presentation for cash paid to a taxing authority when directly withholding equivalent shares has been classified as a financing activity in the statement of cash flows. The change was applied retrospectively and thus the directly withheld share equivalent amount was reclassified from an operating activity to a financing activity in the consolidated statements of cash flows. The adoption of this new guidance did not have a material impact on the Company’s consolidated financial statements.
Other
Effective January 3, 2017, the Chicago Mercantile Exchange (“CME”) amended its rulebook, resulting in the characterization of variation margin transfers as settlement payments, as opposed to adjustments to collateral. These amendments impacted the accounting treatment of the Company’s centrally cleared derivatives for which the CME serves as the central clearing party. As of the effective date, the application of the amended rulebook reduced gross derivative assets by $1.8 billion, gross derivative liabilities by $2.0 billion, accrued investment income by $101 million, accrued investment expense recorded within other liabilities by $14 million, collateral receivables recorded within premiums, reinsurance and other receivables of $991 million, and collateral payables recorded within payables for collateral under securities loaned and other transactions of $816 million.
Future Adoption of New Accounting Pronouncements
In August 2017, the Financial Accounting Standards Board (“FASB”) issued new guidance on hedging activities (Accounting Standards Update (“ASU”) 2017-12,Derivatives and Hedging (Topic 815): Targeted Improvements to Accounting for Hedging Activities). The new guidance is effective for fiscal years beginning after December 15, 2018 and interim periods within those fiscal years and should be applied on a modified retrospective basis through a cumulative-effect adjustment directly to retained earnings. Early adoption is permitted. The new guidance simplifies the application of hedge accounting in certain situations and amends the hedge accounting model to enable entities to better portray the economics of their risk management activities in the financial statements.form of accounting standards updates (“ASUs”) to the FASB Accounting Standards Codification. The Company is currently evaluatingconsiders the applicability and impact of all ASUs. The following tables provide a description of new ASUs issued by the FASB and the impact of this guidancethe adoption on itsthe Company’s interim condensed consolidated financial statements.
In May 2017,Adoption of New Accounting Pronouncements
The table below describes the FASB issued new guidance on share-based payment awards (ASU 2017-09, Compensation - Stock Compensation (Topic 718) - Scopeimpacts of Modification Accounting).The new guidance is effective for fiscal years beginning after December 15, 2017 and interim periods within those fiscal years. The new guidance should be applied prospectively to an award modified on or after the adoption date. Early adoption is permitted. The ASU includes guidance on determining which changes toASUs recently adopted by the terms and conditions of share-based payment awards require an entity to apply modification accounting under Topic 718. The Company is currently evaluating the impact of this guidance on its consolidated financial statements.Company.
| | | | | | | | | | | |
| Standard | Description | Effective Date and
Method of Adoption | Impact on Financial Statements |
ASU 2020-04, Reference Rate Reform (Topic 848): Facilitation of the Effects of Reference Rate Reform on Financial Reporting; as clarified and amended by ASU 2021-01, Reference Rate Reform (Topic 848): Scope | The new guidance provides optional expedients and exceptions for applying GAAP to contracts, hedging relationships and other transactions affected by reference rate reform if certain criteria are met. The expedients and exceptions provided by the amendments do not apply to contract modifications made and hedging relationships entered into or evaluated after December 31, 2022, with certain exceptions. ASU 2021-01 amends the scope of the recent reference rate reform guidance. New optional expedients allow derivative instruments impacted by changes in the interest rate used for margining, discounting, or contract price alignment to qualify for certain optional relief. | Effective for contract modifications made between March 12, 2020 and December 31, 2022.
| The new guidance reduces the operational and financial impacts of contract modifications that replace a reference rate, such as London Interbank Offered Rate (“LIBOR”), affected by reference rate reform. The adoption of the new guidance provides relief from current GAAP and is not expected to have a material impact on the Company’s interim condensed consolidated financial statements. The Company will continue to evaluate the impacts of reference rate reform on contract modifications and hedging relationships through December 31, 2022. |
ASU 2019-12, Income Taxes (Topic 740): Simplifying the Accounting for Income Taxes
| The new guidance simplifies the accounting for income taxes by removing certain exceptions to the tax accounting guidance and providing clarification to other specific tax accounting guidance to eliminate variations in practice. Specifically, it removes the exceptions related to the a) incremental approach for intraperiod tax allocation when there is a loss from continuing operations and income or a gain from other items, b) recognition of a deferred tax liability when foreign investment ownership changes from equity method investment to consolidated subsidiary and vice versa and c) use of interim period tax accounting for year-to-date losses that exceed anticipated losses. The guidance also simplifies the application of the income tax guidance for franchise taxes that are partially based on income and the accounting for tax law changes during interim periods, clarifies the accounting for transactions that result in a step-up in tax basis of goodwill, provides for the option to elect allocation of consolidated income taxes to entities disregarded by taxing authorities for their stand-alone reporting, and requires that an entity reflect the effect of an enacted change in tax laws or rates in the annual effective tax rate computation in the interim period that includes the enactment date. | January 1, 2021. The Company adopted, using a prospective approach. | The adoption of the new guidance did not have a material impact on the Company’s interim condensed consolidated financial statements. |
MetLife, Inc.
Notes to the Interim Condensed Consolidated Financial Statements (Unaudited) — (continued)
1. Business, Basis of Presentation and Summary of Significant Accounting Policies (continued)
Future Adoption of New Accounting Pronouncements
In March 2017, the FASB issued new guidance on purchased callable debt securities (ASU 2017-08, Receivables -Nonrefundable FeesASUs not listed below were assessed and Other Costs (Subtopic 310-20), Premium Amortization on Purchased Callable Debt Securities). The new guidance is effective for fiscal years beginning after December 15, 2018 and interim periods within those fiscal years and should be applied on a modified retrospective basis through a cumulative-effect adjustment directly to retained earnings. Early adoption is permitted. The ASU shortens the amortization period for certain callable debt securities held at a premium and requires the premiumeither determined to be amortized to the earliest call date. However, the new guidance does not require an accounting change for securities held at a discount whose discount continues to be amortized to maturity. The Company is currently evaluating the impact of this guidance on its consolidated financial statements.
In March 2017, the FASB issued new guidance on the presentation of net periodic pension cost and net periodic postretirement benefit cost (ASU 2017-07,Compensation - Retirement Benefits (Topic 715): Improving the Presentation of Net Periodic Pension Cost and Net Periodic Postretirement Benefit Cost). The new guidance is effective for annual periods beginning after December 15, 2017 and interim periods within those annual periods. Early adoption is permitted as of the beginning of an annual period for which financial statements (interimapplicable or annual) haveare not been issued or made available for issuance. The guidance requires that an employer that offers to its employees defined benefit pension or other postretirement benefit plans report the service cost component in the same line item or items as other compensation costs arising from services rendered by the pertinent employees during the period. The other components of net benefit cost are required to be presented in the income statement separately from the service cost component and outside a subtotal of income from operations, if one is presented. The guidance should be applied retrospectively for the presentation of the service cost component in the income statement and allows a practical expedient for the estimation basis for applying the retrospective presentation requirements. The Company is currently evaluating the impact of this guidance on its consolidated financial statements.
In February 2017, the FASB issued new guidance on derecognition of nonfinancial assets (ASU 2017-05,Other Income-Gains and Losses from the Derecognition of Nonfinancial Assets (Subtopic 610-20): Clarifying the Scope of Asset Derecognition Guidance and Accounting for Partial Sales of Nonfinancial Assets). The new guidance is effective for fiscal years beginning after December 15, 2017 and interim periods within those fiscal years. Early adoption was permitted for interim or annual reporting periods beginning after December 15, 2016. The guidance may be applied retrospectively for all periods presented or retrospectively with a cumulative-effect adjustment at the date of adoption. The new guidance clarifies the scope and accounting of a financial asset that meets the definition of an “in-substance nonfinancial asset” and defines the term, “in-substance nonfinancial asset.” The ASU also adds guidance for partial sales of nonfinancial assets. The Company is currently evaluating the impact of this guidance on its consolidated financial statements.
In January 2017, the FASB issued new guidance on goodwill impairment (ASU 2017-04, Intangibles - Goodwill and Other (Topic 350): Simplifying the Test for Goodwill Impairment). The new guidance is effective for fiscal years beginning after December 15, 2019 and interim periods within those fiscal years, and should be applied on a prospective basis. Early adoption is permitted for interim or annual goodwill impairment tests performed on testing dates after January 1, 2017. The new guidance simplifies the current two-step goodwill impairment test by eliminating Step 2 of the test. The new guidance requires a one-step impairment test in which an entity compares the fair value of a reporting unit with its carrying amount and recognizes an impairment charge for the amount by which the carrying amount exceeds the reporting unit’s fair value, if any. The Company is currently evaluating the impact of this guidance on its consolidated financial statements.
In November 2016, the FASB issued new guidance on restricted cash (ASU 2016-18,Statement of Cash Flows (Topic 230): a consensus of the FASB Emerging Issues Task Force). The new guidance is effective for fiscal years beginning after December 15, 2017 and interim periods within those fiscal years, and should be applied on a retrospective basis. Early adoption is permitted. The new guidance requires that a statement of cash flows explain the change during the period in the total of cash, cash equivalents, and amounts generally described as restricted cash or restricted cash equivalents. As a result, the new guidance requires that amounts generally described as restricted cash and restricted cash equivalents should be included with cash and cash equivalents when reconciling the beginning-of-period and end-of-period total amounts shown on the statement of cash flows. The new guidance does not provide a definition of restricted cash or restricted cash equivalents. The Company is currently evaluating the impact of this guidance on its consolidated financial statements.
MetLife, Inc.
Notes to the Interim Condensed Consolidated Financial Statements (Unaudited) — (continued)
1. Business, Basis of Presentation and Summary of Significant Accounting Policies (continued)
In October 2016, the FASB issued new guidance on tax accounting for intra-entity transfers of assets (ASU 2016-16,Income Taxes (Topic 740): Intra-Entity Transfers of Assets Other Than Inventory). The new guidance is effective for fiscal years beginning after December 15, 2017 and interim periods within those fiscal years, and should be applied on a modified retrospective basis. Early adoption is permitted in the first interim or annual reporting period. Current guidance prohibits the recognition of current and deferred income taxes for an intra-entity asset transfer until the asset has been sold to an outside party. The new guidance requires an entity to recognize the income tax consequences of an intra-entity transfer of an asset other than inventory when the transfer occurs. Also, the guidance eliminates the exception for an intra-entity transfer of an asset other than inventory. The Company is currently evaluating the impact of this guidance on its consolidated financial statements.
In August 2016, the FASB issued new guidance on cash flow statement presentation (ASU 2016-15,Statement of Cash Flows (Topic 230): Classification of Certain Cash Receipts and Cash Payments). The new guidance is effective for fiscal years beginning after December 15, 2017 and interim periods within those fiscal years, and should be applied retrospectively to all periods presented. Early adoption is permitted in any interim or annual period. This ASU addresses diversity in how certain cash receipts and cash payments are presented and classified in the statement of cash flows. The Company is currently evaluating the impact of this guidance on its consolidated financial statements.
In June 2016, the FASB issued new guidance on measurement of credit losses on financial instruments (ASU 2016-13,Financial Instruments - Credit Losses (Topic 326): Measurement of Credit Losses on Financial Instruments). The new guidance is effective for fiscal years beginning after December 15, 2019, including interim periods within those fiscal years. Early adoption is permitted for fiscal years, and interim periods within those fiscal years, beginning after December 15, 2018. This ASU replaces the incurred loss impairment methodology with one that reflects expected credit losses. The measurement of expected credit losses should be based on historical loss information, current conditions, and reasonable and supportable forecasts. The new guidance requires that an other-than-temporary impairment (“OTTI”) on a debt security will be recognized as an allowance going forward, such that improvements in expected future cash flows after an impairment will no longer be reflected as a prospective yield adjustment through net investment income, but rather a reversal of the previous impairment and recognized through realized investment gains and losses. The guidance also requires enhanced disclosures. The Company has assessed the asset classes impacted by the new guidance and is currently assessing the accounting and reporting system changes that will be required to comply with the new guidance. The Company believes that the most significant impact upon adoption will be to its mortgage loan investments. The Company is continuing to evaluate the overall impact of the new guidance on its consolidated financial statements.
In February 2016, the FASB issued new guidance on leasing transactions (ASU 2016-02,Leases - Topic 842). The new guidance is effective for the fiscal years beginning after December 15, 2018, including interim periods within those fiscal years, and requires a modified retrospective transition approach. Early adoption is permitted. The new guidance requires a lessee to recognize assets and liabilities for leases with lease terms of more than 12 months. Leases would be classified as finance or operating leases and both types of leases will be recognized on the balance sheet. Lessor accounting will remain largely unchanged from current guidance except for certain targeted changes. The new guidance will also require new qualitative and quantitative disclosures. The Company’s implementation efforts are primarily focused on the review of its existing lease contracts, as well as identification of other contracts that may fall under the scope of the new guidance. The Company is currently evaluating the impact of this guidance on its consolidated financial statements.
MetLife, Inc.
Notes to the Interim Condensed Consolidated Financial Statements (Unaudited) — (continued)
1. Business, Basis of Presentation and Summary of Significant Accounting Policies (continued)
In January 2016, the FASB issued new guidance (ASU 2016-01,Financial Instruments-Overall: Recognition and Measurement of Financial Assets and Financial Liabilities) on the recognition and measurement of financial instruments. The new guidance is effective for fiscal years beginning after December 15, 2017, including interim periods within those fiscal years. Early adoption is permitted for the instrument-specific credit risk provision. The new guidance changes the current accounting guidance related to (i) the classification and measurement of certain equity investments, (ii) the presentation of changes in the fair value of financial liabilities measured under the fair value option (“FVO”) that are due to instrument-specific credit risk, and (iii) certain disclosures associated with the fair value of financial instruments. Additionally, there will no longer be a requirement to assess equity securities for impairment since such securities will be measured at fair value through net income. The Company has assessed the population of financial instruments that are subject to the new guidance and has determined that the most significant impact will be the requirement to report changes in fair value in net income each reporting period for all equity securities currently classified as available-for-sale (“AFS”) and to a lesser extent, other limited partnership interests and real estate joint ventures that are currently accounted for under the cost method. The estimated impact, using values as of September 30, 2017, related to the change in accounting for equity securities AFS, was $250 million of net unrealized investment gains, net of income tax, which would be reclassified from accumulated other comprehensive income (“AOCI”) to retained earnings. The estimated financial statement impact related to cost method other limited partnership interests and real estate joint ventures was not material.
In May 2014, the FASB issued a comprehensive new revenue recognition standard (ASU 2014-09,Revenue from Contracts with Customers (Topic 606)), effective for fiscal years beginning after December 15, 2017 and interim periods within those fiscal years. The Company will apply this guidance retrospectively with a cumulative-effect adjustment as of January 1, 2018. The new guidance will supersede nearly all existing revenue recognition guidance under U.S. GAAP. However, it will not impact the accounting for insurance and investment contracts within the scope of Accounting Standards Codification Topic 944,Financial Services - Insurance, leases, financial instruments and certain guarantees. For those contracts that are impacted, the new guidance will require an entity to recognize revenue upon the transfer of promised goods or services to customers in an amount that reflects the consideration to which the entity expects to be entitled, in exchange for those goods or services. Given the scope of the new revenue recognition guidance, the Company does not expect the adoption to have a material impact on its consolidated revenues or statements of operations, with the Company’s implementation efforts primarily focused on other revenuesinterim condensed consolidated financial statements or disclosures. ASUs issued but not yet adopted as of June 30, 2021 that are currently being assessed and may or may not have a material impact on the Company’s interim condensed consolidated financial statements of operations. Other revenues on the consolidated statements of operations represents less than 3% of consolidated total revenues for the nine months ended September 30, 2017. Based on implementation efforts completed to date, the Company has identified revenue streams within the scope of the guidance and is evaluating the related contracts, primarily consisting of prepaid legal plans and administrative-only contractsor disclosures are summarized in the U.S. segment, advisory fees in the MetLife Holdings segment, and fee-based investment management services in Corporate & Other. While the Company has not yet identified any material changes in the recognition and measurement of other revenue, the Company’s assessment is ongoing, including the consideration of the new disclosure requirements.table below.
| | | | | | | | | | | |
| Standard | Description | Effective Date and
Method of Adoption | Impact on Financial Statements |
ASU 2018-12, Financial Services—Insurance (Topic 944): Targeted Improvements to the Accounting for Long-Duration Contracts, as amended by ASU 2019-09, Financial Services—Insurance (Topic 944): Effective Date, as amended by ASU 2020-11, Financial Services—Insurance (Topic 944): Effective Date and Early Application | The new guidance (i) prescribes the discount rate to be used in measuring the liability for future policy benefits for traditional and limited payment long-duration contracts, and requires assumptions for those liability valuations to be updated after contract inception, (ii) requires more market-based product guarantees on certain separate account and other account balance long-duration contracts to be accounted for at fair value, (iii) simplifies the amortization of deferred policy acquisition costs (“DAC”) for virtually all long-duration contracts, and (iv) introduces certain financial statement presentation requirements, as well as significant additional quantitative and qualitative disclosures. The amendments in ASU 2019-09 defer the effective date of ASU 2018-12 to January 1, 2022 for all entities, and the amendments in ASU 2020-11 further defer the effective date of ASU 2018-12 for an additional year to January 1, 2023 for all entities. | January 1, 2023, to be applied retrospectively to January 1, 2021 (with early adoption permitted). | The implementation efforts of the Company and the evaluation of the impact of the new guidance are in progress. Given the nature and extent of the required changes to a significant portion of the Company’s operations, the adoption of this guidance is expected to have a material impact on its interim condensed consolidated financial statements. |
MetLife, Inc.
Notes to the Interim Condensed Consolidated Financial Statements (Unaudited) — (continued)
2. Segment Information
Following the Separation and the elimination of the Brighthouse Financial segment, as described in Note 3, MetLife is organized into five5 segments: U.S.; Asia; Latin America; EMEA; and MetLife Holdings. In addition, the Company reports certain of its results of operations in Corporate & Other.
U.S.
The U.S. segment offers a broad range of protection products and services aimed at serving the financial needs of customers throughout their lives. These products are sold to corporations and their respective employees, other institutions and their respective members, as well as individuals. The U.S. segment is organized into threetwo businesses: Group Benefits and Retirement and Income Solutions and(“RIS”). Prior to its disposition, the Property & Casualty.Casualty business was included in the U.S. segment. See Note 3.
•The Group Benefits business offers insurance products such as term, variable and services which includeuniversal life insurance, dental, group short- and long-term disability, individual disability, accidental death and dismemberment, critical illness, vision and accident & health coverages, as well as prepaid legal plans. This business also sells administrative services-only arrangements to some employers.insurance.
•The Retirement and Income SolutionsRIS business offers a broad range of annuitylife and annuity-based insurance and investment products, including guaranteed interest contractsstable value and other stable valuepension risk transfer products, institutional income annuities, and separate account contracts for the investment management of defined benefit and defined contribution plan assets. This business also includes structured settlements, and certaincapital markets investment products, to fundas well as solutions for funding postretirement benefits and company-, bank- orand trust-owned life insurance used to finance nonqualified benefit programs for executives.insurance.
•The Property & Casualty business offersoffered personal and commercial lines of property and casualty insurance, including private passenger automobile and homeowners’ and personal excess liability insurance. In addition, Property & Casualty offers small business owners property, liability and business interruption insurance.
Asia
The Asia segment offers a broad range of products to both individuals and corporations, as well as to other institutions, and their respective employees, which include whole life term life, variable life, universal life,insurance, accident & health insurance fixed and variable annuities, credit insuranceretirement and endowment products.savings.
Latin America
The Latin America segment offers a broad range of products to both individuals and corporations, as well as to other institutions, and their respective employees, which include life insurance, retirement and savings, accident & health insurance and credit insurance.
EMEA
The EMEA segment offers products to individuals, corporations, other institutions, and their respective employees, which include life insurance, accident & health insurance, group medical, dental, credit insurance, endowment and retirement and savings products.
EMEA
The EMEA segment offers a broad range of products to both individuals and corporations, as well as other institutions and their respective employees, which include life insurance, accident & health insurance, credit insurance, annuities, endowment and retirement and savings products.insurance.
MetLife Holdings
The MetLife Holdings segment consists of operations relating to products and businesses that the Company no longer actively marketed by the Companymarkets in the United States. These products and businesses include variable, universal, term and whole life as well asinsurance, variable, fixed and index-linked annuities. The MetLife Holdings segment also includesannuities and long-term care insurance.
Corporate & Other
Corporate & Other contains various start-up, developing and run-off businesses. Also included in Corporate & Other are: the excess capital, as well as certain charges and activities, not allocated to the segments (including external integration and disposition costs, internal resource costs for associates committed to acquisitions and dispositions and enterprise-wide strategic initiative restructuring charges), interest expense related to the majority of the Company’s discontinued long-term care businessoutstanding debt, expenses associated with certain legal proceedings and income tax audit issues, the elimination of intersegment amounts (which generally relate to affiliated reinsurance, investment expenses and intersegment loans, bearing interest rates commensurate with related borrowings), and the assumed reinsurance of certain variable annuity products fromCompany’s investment management business (through which the Company’s former operating joint venture in Japan.
Company provides public fixed income, private capital and real estate investment solutions to institutional investors worldwide).
MetLife, Inc.
Notes to the Interim Condensed Consolidated Financial Statements (Unaudited) — (continued)
2. Segment Information (continued)
Corporate & Other
Corporate & Other contains the excess capital, as well as certain charges and activities, not allocated to the segments, including external integration and disposition costs, internal resource costs for associates committed to acquisitions and dispositions, enterprise-wide strategic initiative restructuring charges and various start-up businesses (including expatriate benefits insurance and the investment management business through which the Company offers fee-based investment management services to institutional clients, as well as the direct to consumer portion of the U.S. Direct business). Corporate & Other also includes interest expense related to the majority of the Company’s outstanding debt, as well as expenses associated with certain legal proceedings and income tax audit issues. In addition, Corporate & Other includes the elimination of intersegment amounts, which generally relate to affiliated reinsurance and intersegment loans, which bear interest rates commensurate with related borrowings. As a result of the Separation, Corporate & Other includes corporate overhead costs previously allocated to the former Brighthouse Financial segment.
Financial Measures and Segment Accounting Policies
OperatingAdjusted earnings is used by management to evaluate performance and allocate resources. Consistent with GAAP guidance for segment reporting, operatingadjusted earnings is also the Company’s GAAP measure of segment performance and is reported below. OperatingAdjusted earnings should not be viewed as a substitute for net income (loss) from continuing operations, net of income tax.. The Company believes the presentation of operatingadjusted earnings, as the Company measures it for management purposes, enhances the understanding of its performance by highlighting the results of operations and the underlying profitability drivers of the business. Operating earnings allows analysis of the Company’s performance relative to the Company’s business plan and facilitates comparisons to industry results.
OperatingAdjusted earnings is defined as operatingadjusted revenues less operatingadjusted expenses, both net of income tax.
The financial measures of operatingadjusted revenues and operatingadjusted expenses focus on the Company’s primary businesses principally by excluding the impact of market volatility, which could distort trends, and revenues and costs related to non-core products and certain entities required to be consolidated under GAAP. Also, these measures exclude results of discontinued operations under GAAP and other businesses that have been or will be sold or exited by MetLife but do not meet the discontinued operations criteria under GAAP and are referred to as divested businesses. Divested businesses also includesinclude the net impact of transactions with exited businesses that have been eliminated in consolidation under GAAP and costs relating to businesses that have been or will be sold or exited by MetLife that do not meet the criteria to be included in results of discontinued operations under GAAP. In addition, for the three months ended March 31, 2016 and the nine months ended September 30, 2016, operating revenues and operating expenses exclude the financial impact of converting the Company’s Japan operations to calendar year-end reporting without retrospective application of this change to prior periods and is referred to as lag elimination. OperatingAdjusted revenues also excludes net investment gains (losses) and net derivative gains (losses). OperatingAdjusted expenses also excludes goodwill impairments.
The following additional adjustments are made to revenues, in the line items indicated, in calculating operatingadjusted revenues:
•Universal life and investment-type product policy fees excludes the amortization of unearned revenue related to net investment gains (losses) and net derivative gains (losses) and certain variable annuityguaranteed minimum income benefits (“GMIBs”) fees (“GMIB Fees”fees”); and
•Net investment income: (i) includes adjustments for earned income on derivatives and amortization of premium on derivatives that are hedges of investments or that are used to replicate certain investments, but do not qualify for hedge accounting treatment,(ii) excludes post-tax operatingadjusted earnings adjustments relating to insurance joint ventures accounted for under the equity method, (iii) excludes certain amounts related to contractholder-directed unit-linked investments andequity securities, (iv) excludes certain amounts related to securitization entities that are VIEs consolidated under GAAP and (v) includes distributions of profits from certain other limited partnership interests that were previously accounted for under the cost method, but are now accounted for at estimated fair value, where the change in estimated fair value is recognized in net investment gains (losses) under GAAP; and
•Other revenues areis adjusted for settlements of foreign currency earnings hedges.
hedges and excludes fees received in association with services provided under transition service agreements (“TSA fees”).
MetLife, Inc.
Notes to the Interim Condensed Consolidated Financial Statements (Unaudited) — (continued)
2. Segment Information (continued)
The following additional adjustments are made to expenses, in the line items indicated, in calculating operatingadjusted expenses:
•Policyholder benefits and claims and policyholder dividends excludes: (i) amortization of basis adjustments associated with de-designated fair value hedges of future policy benefits, (ii) changes in the policyholder dividend obligation related to net investment gains (losses) and net derivative gains (losses), (ii)(iii) inflation-indexed benefit adjustments associated with contracts backed by inflation-indexed investments and amounts associated with periodic crediting rate adjustments based on the total return of a contractually referenced pool of assets and other pass through adjustments, (iii)(iv) benefits and hedging costs related to GMIBs (“GMIB Costs”costs”) and (iv)(v) market value adjustments associated with surrenders or terminations of contracts (“Market Value Adjustments”value adjustments”);
•Interest credited to policyholder account balances includes adjustments for earned income on derivatives and amortization of premium on derivatives that are hedges of policyholder account balances but do not qualify for hedge accounting treatment and excludes certain amounts related to net investment income earned on contractholder-directed unit-linked investments;equity securities;
•Amortization of deferred policy acquisition costs (“DAC”)DAC andvalue of business acquired (“VOBA”)excludes amounts related to: (i) net investment gains (losses) and net derivative gains (losses), (ii) GMIB Feesfees and GMIB Costscosts and (iii) Market Value Adjustments;
value adjustments;•Amortization of negative VOBA excludes amounts related to Market Value Adjustments;value adjustments;
•Interest expense on debt excludes certain amounts related to securitization entities that are VIEs consolidated under GAAP; and
•Other expenses excludes costs related to:excludes: (i) noncontrolling interests, (ii) implementation of new insurance regulatory requirements costs, and (iii) acquisition, integration and other costs. Other expenses includes TSA fees.
OperatingAdjusted earnings also excludes the recognition of certain contingent assets and liabilities that could not be recognized at acquisition or adjusted for during the measurement period under GAAP business combination accounting guidance.
The tax impact of the adjustments mentioned above are calculated net of the U.S. or foreign statutory tax rate, which could differ from the Company’s effective tax rate. Additionally, the provision for income tax (expense) benefit also includes the impact related to the timing of certain tax credits, as well as certain tax reforms.
Set forth in the tables below is certain financial information with respect to the Company’s segments, as well as Corporate & Other, for thethree monthsand ninesix months endedSeptember June 30, 20172021 and 2016.2020. The segment accounting policies are the same as those used to prepare the Company’s interim condensed consolidated financial statements, except for operatingadjusted earnings adjustments as defined above. In addition, segment accounting policies include the method of capital allocation described below.
Economic capital is an internally developed risk capital model, the purpose of which is to measure the risk in the business and to provide a basis upon which capital is deployed. The economic capital model accounts for the unique and specific nature of the risks inherent in the Company’s business.
The Company’s economic capital model, coupled with considerations of local capital requirements, aligns segment allocated equity with emerging standards and consistent risk principles. The model applies statistics-based risk evaluation principles to the material risks to which the Company is exposed. These consistent risk principles include calibrating required economic capital shock factors to a specific confidence level and time horizon while applying an industry standard method for the inclusion of diversification benefits among risk types.The Company’s management is responsible for the ongoing production and enhancement of the economic capital model and reviews its approach periodically to ensure that it remains consistent with emerging industry practice standards.
Segment net investment income is credited or charged based on the level of allocated equity; however, changes in allocated equity do not impact the Company’s consolidated net investment income, net income (loss) from continuing operations, net of income tax or operatingadjusted earnings.
Net investment income is based upon the actual results of each segment’s specifically identifiable investment portfolios adjusted for allocated equity. Other costs are allocated to each of the segments based upon: (i) a review of the nature of such costs; (ii) time studies analyzing the amount of employee compensation costs incurred by each segment; and (iii) cost estimates included in the Company’s product pricing.
MetLife, Inc.
Notes to the Interim Condensed Consolidated Financial Statements (Unaudited) — (continued)
2. Segment Information (continued)
| | | | | | | | | | | | | | | | | | | | | | | | | | | | | | | | | | | | | | | | | | | | | | | | | | | | | | | | |
| | | | | | |
| Three Months Ended June 30, 2021 | | U.S. | | Asia | | Latin
America | | EMEA | | MetLife
Holdings | | Corporate
& Other | | Total | | Adjustments | | Total
Consolidated |
| | (In millions) |
| Revenues | | | | | | | | | | | | | | | | | | |
| Premiums | | $ | 5,474 | | | $ | 1,582 | | | $ | 636 | | | $ | 621 | | | $ | 839 | | | $ | (20) | | | $ | 9,132 | | | $ | 0 | | | $ | 9,132 | |
| Universal life and investment-type product policy fees | | 282 | | | 436 | | | 287 | | | 107 | | | 273 | | | 1 | | | 1,386 | | | 36 | | | 1,422 | |
| Net investment income | | 1,998 | | | 1,158 | | | 308 | | | 62 | | | 1,543 | | | 48 | | | 5,117 | | | 163 | | | 5,280 | |
| Other revenues | | 380 | | | 19 | | | 11 | | | 16 | | | 69 | | | 109 | | | 604 | | | 60 | | | 664 | |
| Net investment gains (losses) | | 0 | | | 0 | | | 0 | | | 0 | | | 0 | | | 0 | | | 0 | | | 1,605 | | | 1,605 | |
| Net derivative gains (losses) | | 0 | | | 0 | | | 0 | | | 0 | | | 0 | | | 0 | | | 0 | | | 421 | | | 421 | |
| Total revenues | | 8,134 | | | 3,195 | | | 1,242 | | | 806 | | | 2,724 | | | 138 | | | 16,239 | | | 2,285 | | | 18,524 | |
| Expenses | | | | | | | | | | | | | | | | | | |
| Policyholder benefits and claims and policyholder dividends | | 5,739 | | | 1,233 | | | 724 | | | 333 | | | 1,549 | | | (13) | | | 9,565 | | | 76 | | | 9,641 | |
| Interest credited to policyholder account balances | | 359 | | | 496 | | | 60 | | | 25 | | | 210 | | | 0 | | | 1,150 | | | 365 | | | 1,515 | |
| Capitalization of DAC | | (13) | | | (395) | | | (100) | | | (122) | | | (9) | | | (3) | | | (642) | | | 0 | | | (642) | |
| Amortization of DAC and VOBA | | 8 | | | 296 | | | 83 | | | 94 | | | 56 | | | 3 | | | 540 | | | (3) | | | 537 | |
| Amortization of negative VOBA | | 0 | | | (8) | | | 0 | | | (2) | | | 0 | | | 0 | | | (10) | | | 0 | | | (10) | |
| Interest expense on debt | | 2 | | | 0 | | | 1 | | | 0 | | | 2 | | | 223 | | | 228 | | | 0 | | | 228 | |
| Other expenses | | 898 | | | 832 | | | 343 | | | 349 | | | 244 | | | 34 | | | 2,700 | | | 68 | | | 2,768 | |
| Total expenses | | 6,993 | | | 2,454 | | | 1,111 | | | 677 | | | 2,052 | | | 244 | | | 13,531 | | | 506 | | | 14,037 | |
| Provision for income tax expense (benefit) | | 239 | | | 221 | | | 34 | | | 35 | | | 136 | | | (81) | | | 584 | | | 491 | | | 1,075 | |
| Adjusted earnings | | $ | 902 | | | $ | 520 | | | $ | 97 | | | $ | 94 | | | $ | 536 | | | $ | (25) | | | 2,124 | | | | | |
| Adjustments to: | | | | | | | | | | | | | | | | | | |
| Total revenues | | | | | | | | | | | | | | 2,285 | | | | | |
| Total expenses | | | | | | | | | | | | | | (506) | | | | | |
| Provision for income tax (expense) benefit | | | | | | | | | | | | | | (491) | | | | | |
| Net income (loss) | | | | | | | | | | | | | | $ | 3,412 | | | | | $ | 3,412 | |
|
| | | | | | | | | | | | | | | | | | | | | | | | | | | | | | | | | | | | |
| | | Operating Results | | | | |
| Three Months Ended September 30, 2017 | | U.S. | | Asia | | Latin
America | | EMEA | | MetLife
Holdings | | Corporate
& Other | | Total | | Adjustments | | Total Consolidated |
| | | (In millions) |
| Revenues | | | | | | | | | | | | | | | | | | |
| Premiums | | $ | 6,987 |
| | $ | 1,696 |
| | $ | 701 |
| | $ | 527 |
| | $ | 989 |
| | $ | 13 |
| | $ | 10,913 |
| | $ | (37 | ) | | $ | 10,876 |
|
| Universal life and investment-type product policy fees | | 247 |
| | 458 |
| | 229 |
| | 109 |
| | 349 |
| | — |
| | 1,392 |
| | 36 |
| | 1,428 |
|
| Net investment income | | 1,602 |
| | 762 |
| | 299 |
| | 77 |
| | 1,390 |
| | 26 |
| | 4,156 |
| | 139 |
| | 4,295 |
|
| Other revenues | | 197 |
| | 11 |
| | 7 |
| | (2 | ) | | 37 |
| | 65 |
| | 315 |
| | (14 | ) | | 301 |
|
| Net investment gains (losses) | | — |
| | — |
| | — |
| | — |
| | — |
| | — |
| | — |
| | (606 | ) | | (606 | ) |
| Net derivative gains (losses) | | — |
| | — |
| | — |
| | — |
| | — |
| | — |
| | — |
| | (190 | ) | | (190 | ) |
| Total revenues | | 9,033 |
| | 2,927 |
| | 1,236 |
| | 711 |
| | 2,765 |
| | 104 |
| | 16,776 |
| | (672 | ) | | 16,104 |
|
| Expenses | | | | | | | | | | | | | | | | | | |
| Policyholder benefits and claims and policyholder dividends | | 6,904 |
| | 1,223 |
| | 640 |
| | 282 |
| | 1,661 |
| | 7 |
| | 10,717 |
| | 230 |
| | 10,947 |
|
| Interest credited to policyholder account balances | | 376 |
| | 349 |
| | 99 |
| | 26 |
| | 255 |
| | — |
| | 1,105 |
| | 233 |
| | 1,338 |
|
| Capitalization of DAC | | (126 | ) | | (420 | ) | | (94 | ) | | (109 | ) | | (14 | ) | | (2 | ) | | (765 | ) | | 4 |
| | (761 | ) |
| Amortization of DAC and VOBA | | 118 |
| | 424 |
| | — |
| | 78 |
| | (70 | ) | | 3 |
| | 553 |
| | 73 |
| | 626 |
|
| Amortization of negative VOBA | | — |
| | (24 | ) | | (1 | ) | | (5 | ) | | — |
| | — |
| | (30 | ) | | (2 | ) | | (32 | ) |
| Interest expense on debt | | 2 |
| | — |
| | 1 |
| | — |
| | 2 |
| | 279 |
| | 284 |
| | — |
| | 284 |
|
| Other expenses | | 933 |
| | 905 |
| | 377 |
| | 347 |
| | 322 |
| | 237 |
| | 3,121 |
| | 80 |
| | 3,201 |
|
| Total expenses | | 8,207 |
| | 2,457 |
| | 1,022 |
| | 619 |
| | 2,156 |
| | 524 |
| | 14,985 |
| | 618 |
| | 15,603 |
|
| Provision for income tax expense (benefit) | | 280 |
| | 156 |
| | 51 |
| | 21 |
| | 199 |
| | (90 | ) | | 617 |
| | (1,009 | ) | | (392 | ) |
| Operating earnings | | $ | 546 |
| | $ | 314 |
| | $ | 163 |
| | $ | 71 |
| | $ | 410 |
| | $ | (330 | ) | | 1,174 |
| | | | |
| Adjustments to: | | | | | | | | | | | | | | | | | | |
| Total revenues | | | | | | | | | | | | | | (672 | ) | | | | |
| Total expenses | | | | | | | | | | | | | | (618 | ) | | | | |
| Provision for income tax (expense) benefit | | | | | | | | | | | | | | 1,009 |
| | | | |
| Income (loss) from continuing operations, net of income tax | | | | | | | | | | | | | | $ | 893 |
| | | | $ | 893 |
|
MetLife, Inc.
Notes to the Interim Condensed Consolidated Financial Statements (Unaudited) — (continued)
2. Segment Information (continued)
| | | | | | | | | | | | | | | | | | | | | | | | | | | | | | | | | | | | | | | | | | | | | | | | | | | | | | | | |
| | | | | | |
| Three Months Ended June 30, 2020 | | U.S. | | Asia | | Latin
America | | EMEA | | MetLife
Holdings | | Corporate
& Other | | Total | | Adjustments | | Total
Consolidated |
| | (In millions) |
| Revenues | | | | | | | | | | | | | | | | | | |
| Premiums | | $ | 5,184 | | | $ | 1,584 | | | $ | 489 | | | $ | 557 | | | $ | 889 | | | $ | 13 | | | $ | 8,716 | | | $ | 20 | | | $ | 8,736 | |
| Universal life and investment-type product policy fees | | 268 | | | 420 | | | 238 | | | 92 | | | 249 | | | 1 | | | 1,268 | | | 31 | | | 1,299 | |
| Net investment income | | 1,425 | | | 767 | | | 260 | | | 63 | | | 981 | | | (52) | | | 3,444 | | | 643 | | | 4,087 | |
| Other revenues | | 240 | | | 14 | | | 10 | | | 11 | | | 70 | | | 72 | | | 417 | | | 39 | | | 456 | |
| Net investment gains (losses) | | 0 | | | 0 | | | 0 | | | 0 | | | 0 | | | 0 | | | 0 | | | 231 | | | 231 | |
| Net derivative gains (losses) | | 0 | | | 0 | | | 0 | | | 0 | | | 0 | | | 0 | | | 0 | | | (710) | | | (710) | |
| Total revenues | | 7,117 | | | 2,785 | | | 997 | | | 723 | | | 2,189 | | | 34 | | | 13,845 | | | 254 | | | 14,099 | |
| Expenses | | | | | | | | | | | | | | | | | | |
| Policyholder benefits and claims and policyholder dividends | | 5,038 | | | 1,255 | | | 449 | | | 263 | | | 1,705 | | | 3 | | | 8,713 | | | 244 | | | 8,957 | |
| Interest credited to policyholder account balances | | 412 | | | 447 | | | 56 | | | 27 | | | 219 | | | 0 | | | 1,161 | | | 801 | | | 1,962 | |
| Capitalization of DAC | | (122) | | | (351) | | | (74) | | | (115) | | | (5) | | | (2) | | | (669) | | | (2) | | | (671) | |
| Amortization of DAC and VOBA | | 115 | | | 284 | | | 70 | | | 85 | | | 11 | | | 3 | | | 568 | | | (8) | | | 560 | |
| Amortization of negative VOBA | | 0 | | | (8) | | | 0 | | | (2) | | | 0 | | | 0 | | | (10) | | | 0 | | | (10) | |
| Interest expense on debt | | 2 | | | 0 | | | 1 | | | 0 | | | 1 | | | 228 | | | 232 | | | 0 | | | 232 | |
| Other expenses | | 1,012 | | | 797 | | | 307 | | | 328 | | | 239 | | | 134 | | | 2,817 | | | 55 | | | 2,872 | |
| Total expenses | | 6,457 | | | 2,424 | | | 809 | | | 586 | | | 2,170 | | | 366 | | | 12,812 | | | 1,090 | | | 13,902 | |
| Provision for income tax expense (benefit) | | 137 | | | 105 | | | 56 | | | 21 | | | (1) | | | (120) | | | 198 | | | (151) | | | 47 | |
| Adjusted earnings | | $ | 523 | | | $ | 256 | | | $ | 132 | | | $ | 116 | | | $ | 20 | | | $ | (212) | | | 835 | | | | | |
| Adjustments to: | | | | | | | | | | | | | | | | | | |
| Total revenues | | | | | | | | | | | | | | 254 | | | | | |
| Total expenses | | | | | | | | | | | | | | (1,090) | | | | | |
| Provision for income tax (expense) benefit | | | | | | | | | | | | | | 151 | | | | | |
| Net income (loss) | | | | | | | | | | | | | | $ | 150 | | | | | $ | 150 | |
|
| | | | | | | | | | | | | | | | | | | | | | | | | | | | | | | | | | | | |
| | | Operating Results | | | | |
| Three Months Ended September 30, 2016 | | U.S. | | Asia | | Latin
America | | EMEA | | MetLife
Holdings | | Corporate
& Other | | Total | | Adjustments | | Total Consolidated |
| | | (In millions) |
| Revenues | | | | | | | | | | | | | | | | | | |
| Premiums | | $ | 5,936 |
| | $ | 1,822 |
| | $ | 653 |
| | $ | 500 |
| | $ | 1,093 |
| | $ | 41 |
| | $ | 10,045 |
| | $ | (206 | ) | | $ | 9,839 |
|
| Universal life and investment-type product policy fees | | 245 |
| | 394 |
| | 227 |
| | 104 |
| | 357 |
| | — |
| | 1,327 |
| | 14 |
| | 1,341 |
|
| Net investment income | | 1,590 |
| | 707 |
| | 311 |
| | 81 |
| | 1,537 |
| | 53 |
| | 4,279 |
| | 330 |
| | 4,609 |
|
| Other revenues | | 192 |
| | 12 |
| | 11 |
| | 17 |
| | 105 |
| | 22 |
| | 359 |
| | (3 | ) | | 356 |
|
| Net investment gains (losses) | | — |
| | — |
| | — |
| | — |
| | — |
| | — |
| | — |
| | 231 |
| | 231 |
|
| Net derivative gains (losses) | | — |
| | — |
| | — |
| | — |
| | — |
| | — |
| | — |
| | (543 | ) | | (543 | ) |
| Total revenues | | 7,963 |
| | 2,935 |
| | 1,202 |
| | 702 |
| | 3,092 |
| | 116 |
| | 16,010 |
| | (177 | ) | | 15,833 |
|
| Expenses | | | | | | | | | | | | | | | | | | |
| Policyholder benefits and claims and policyholder dividends | | 5,894 |
| | 1,363 |
| | 681 |
| | 257 |
| | 1,853 |
| | 31 |
| | 10,079 |
| | (165 | ) | | 9,914 |
|
| Interest credited to policyholder account balances | | 322 |
| | 331 |
| | 85 |
| | 28 |
| | 261 |
| | (1 | ) | | 1,026 |
| | 518 |
| | 1,544 |
|
| Capitalization of DAC | | (124 | ) | | (440 | ) | | (83 | ) | | (103 | ) | | (44 | ) | | 1 |
| | (793 | ) | | 23 |
| | (770 | ) |
| Amortization of DAC and VOBA | | 117 |
| | 331 |
| | (2 | ) | | 106 |
| | 219 |
| | 1 |
| | 772 |
| | (112 | ) | | 660 |
|
| Amortization of negative VOBA | | — |
| | (46 | ) | | (1 | ) | | (3 | ) | | — |
| | — |
| | (50 | ) | | (5 | ) | | (55 | ) |
| Interest expense on debt | | 2 |
| | — |
| | 1 |
| | — |
| | 15 |
| | 275 |
| | 293 |
| | (13 | ) | | 280 |
|
| Other expenses | | 912 |
| | 930 |
| | 335 |
| | 332 |
| | 401 |
| | 85 |
| | 2,995 |
| | 106 |
| | 3,101 |
|
| Total expenses | | 7,123 |
| | 2,469 |
| | 1,016 |
| | 617 |
| | 2,705 |
| | 392 |
| | 14,322 |
| | 352 |
| | 14,674 |
|
| Provision for income tax expense (benefit) | | 288 |
| | 142 |
| | 53 |
| | 11 |
| | 121 |
| | (288 | ) | | 327 |
| | (192 | ) | | 135 |
|
| Operating earnings | | $ | 552 |
| | $ | 324 |
| | $ | 133 |
| | $ | 74 |
| | $ | 266 |
| | $ | 12 |
| | 1,361 |
| | | | |
| Adjustments to: | | | | | | | | | | | | | | | | | | |
| Total revenues | | | | | | | | | | | | | | (177 | ) | | | | |
| Total expenses | | | | | | | | | | | | | | (352 | ) | | | | |
| Provision for income tax (expense) benefit | | | | | | | | | | | | | | 192 |
| | | | |
Income (loss) from continuing operations, net of income tax
| | | | | | | | | | | | | | $ | 1,024 |
| | | | $ | 1,024 |
|
MetLife, Inc.
Notes to the Interim Condensed Consolidated Financial Statements (Unaudited) — (continued)
2. Segment Information (continued)
| | | | | | | | | | | | | | | | | | | | | | | | | | | | | | | | | | | | | | | | | | | | | | | | | | | | | | | | |
| | | | | | |
| Six Months Ended June 30, 2021 | | U.S. | | Asia | | Latin
America | | EMEA | | MetLife
Holdings | | Corporate
& Other | | Total | | Adjustments | | Total
Consolidated |
| | (In millions) |
| Revenues | | | | | | | | | | | | | | | | | | |
| Premiums | | $ | 11,173 | | | $ | 3,267 | | | $ | 1,231 | | | $ | 1,219 | | | $ | 1,666 | | | $ | 38 | | | $ | 18,594 | | | $ | 865 | | | $ | 19,459 | |
| Universal life and investment-type product policy fees | | 579 | | | 894 | | | 557 | | | 174 | | | 547 | | | 1 | | | 2,752 | | | 61 | | | 2,813 | |
| Net investment income | | 4,008 | | | 2,422 | | | 607 | | | 125 | | | 3,189 | | | 60 | | | 10,411 | | | 183 | | | 10,594 | |
| Other revenues | | 776 | | | 37 | | | 21 | | | 29 | | | 131 | | | 195 | | | 1,189 | | | 106 | | | 1,295 | |
| Net investment gains (losses) | | 0 | | | 0 | | | 0 | | | 0 | | | 0 | | | 0 | | | 0 | | | 1,739 | | | 1,739 | |
| Net derivative gains (losses) | | 0 | | | 0 | | | 0 | | | 0 | | | 0 | | | 0 | | | 0 | | | (1,814) | | | (1,814) | |
| Total revenues | | 16,536 | | | 6,620 | | | 2,416 | | | 1,547 | | | 5,533 | | | 294 | | | 32,946 | | | 1,140 | | | 34,086 | |
| Expenses | | | | | | | | | | | | | | | | | | |
| Policyholder benefits and claims and policyholder dividends | | 11,881 | | | 2,530 | | | 1,485 | | | 676 | | | 3,072 | | | 27 | | | 19,671 | | | 740 | | | 20,411 | |
| Interest credited to policyholder account balances | | 718 | | | 985 | | | 119 | | | 49 | | | 420 | | | 0 | | | 2,291 | | | 575 | | | 2,866 | |
| Capitalization of DAC | | (31) | | | (830) | | | (195) | | | (249) | | | (17) | | | (6) | | | (1,328) | | | (89) | | | (1,417) | |
| Amortization of DAC and VOBA | | 24 | | | 610 | | | 143 | | | 156 | | | 110 | | | 5 | | | 1,048 | | | 79 | | | 1,127 | |
| Amortization of negative VOBA | | 0 | | | (15) | | | 0 | | | (4) | | | 0 | | | 0 | | | (19) | | | 0 | | | (19) | |
| Interest expense on debt | | 3 | | | 0 | | | 2 | | | 0 | | | 3 | | | 447 | | | 455 | | | 1 | | | 456 | |
| Other expenses | | 1,809 | | | 1,731 | | | 678 | | | 698 | | | 497 | | | 141 | | | 5,554 | | | 330 | | | 5,884 | |
| Total expenses | | 14,404 | | | 5,011 | | | 2,232 | | | 1,326 | | | 4,085 | | | 614 | | | 27,672 | | | 1,636 | | | 29,308 | |
| Provision for income tax expense (benefit) | | 446 | | | 466 | | | 47 | | | 56 | | | 294 | | | (192) | | | 1,117 | | | (114) | | | 1,003 | |
| Adjusted earnings | | $ | 1,686 | | | $ | 1,143 | | | $ | 137 | | | $ | 165 | | | $ | 1,154 | | | $ | (128) | | | 4,157 | | | | | |
| Adjustments to: | | | | | | | | | | | | | | | | | | |
| Total revenues | | | | | | | | | | | | | | 1,140 | | | | | |
| Total expenses | | | | | | | | | | | | | | (1,636) | | | | | |
| Provision for income tax (expense) benefit | | | | | | | | | | | | | | 114 | | | | | |
| Net income (loss) | | | | | | | | | | | | | | $ | 3,775 | | | | | $ | 3,775 | |
|
| | | | | | | | | | | | | | | | | | | | | | | | | | | | | | | | | | | | |
|
| Operating Results |
|
|
|
|
| Nine Months Ended September 30, 2017 |
| U.S. | | Asia | | Latin
America | | EMEA | | MetLife Holdings | | Corporate & Other | | Total | | Adjustments | | Total
Consolidated |
|
| (In millions) |
| Revenues |
|
|
|
|
|
|
|
|
|
|
|
|
|
|
|
|
|
|
| Premiums |
| $ | 18,049 |
|
| $ | 5,063 |
|
| $ | 1,993 |
|
| $ | 1,534 |
|
| $ | 3,070 |
|
| $ | 59 |
|
| $ | 29,768 |
|
| $ | (347 | ) |
| $ | 29,421 |
|
| Universal life and investment-type product policy fees |
| 763 |
|
| 1,199 |
|
| 764 |
|
| 296 |
|
| 1,056 |
|
| — |
|
| 4,078 |
|
| 74 |
|
| 4,152 |
|
| Net investment income |
| 4,789 |
|
| 2,193 |
|
| 891 |
|
| 229 |
|
| 4,232 |
|
| 107 |
|
| 12,441 |
|
| 468 |
|
| 12,909 |
|
| Other revenues |
| 600 |
|
| 32 |
|
| 24 |
|
| 43 |
|
| 170 |
|
| 185 |
|
| 1,054 |
|
| (119 | ) |
| 935 |
|
| Net investment gains (losses) |
| — |
|
| — |
|
| — |
|
| — |
|
| — |
|
| — |
|
| — |
|
| (439 | ) |
| (439 | ) |
| Net derivative gains (losses) |
| — |
|
| — |
|
| — |
|
| — |
|
| — |
|
| — |
|
| — |
|
| (663 | ) |
| (663 | ) |
| Total revenues |
| 24,201 |
| | 8,487 |
| | 3,672 |
| | 2,102 |
| | 8,528 |
| | 351 |
| | 47,341 |
| | (1,026 | ) | | 46,315 |
|
| Expenses |
|
|
|
|
|
|
|
|
| |
|
|
| |
|
|
| |
| Policyholder benefits and claims and policyholder dividends |
| 18,017 |
|
| 3,785 |
|
| 1,869 |
|
| 821 |
|
| 5,117 |
|
| 33 |
|
| 29,642 |
|
| 206 |
|
| 29,848 |
|
| Interest credited to policyholder account balances |
| 1,086 |
|
| 1,003 |
|
| 275 |
|
| 75 |
|
| 767 |
|
| 1 |
|
| 3,207 |
|
| 874 |
|
| 4,081 |
|
| Capitalization of DAC |
| (342 | ) |
| (1,268 | ) |
| (264 | ) |
| (301 | ) |
| (71 | ) |
| (6 | ) |
| (2,252 | ) |
| 34 |
|
| (2,218 | ) |
| Amortization of DAC and VOBA |
| 346 |
|
| 1,005 |
|
| 146 |
|
| 260 |
|
| 143 |
|
| 5 |
|
| 1,905 |
|
| 40 |
|
| 1,945 |
|
| Amortization of negative VOBA |
| — |
|
| (91 | ) |
| (1 | ) |
| (13 | ) |
| — |
|
| — |
|
| (105 | ) |
| (8 | ) |
| (113 | ) |
| Interest expense on debt |
| 8 |
|
| — |
|
| 4 |
|
| — |
|
| 22 |
|
| 833 |
|
| 867 |
|
| (16 | ) |
| 851 |
|
| Other expenses |
| 2,756 |
|
| 2,675 |
|
| 1,060 |
|
| 995 |
|
| 1,032 |
|
| 649 |
|
| 9,167 |
|
| 272 |
|
| 9,439 |
|
| Total expenses |
| 21,871 |
| | 7,109 |
| | 3,089 |
| | 1,837 |
| | 7,010 |
| | 1,515 |
| | 42,431 |
| | 1,402 |
| | 43,833 |
|
| Provision for income tax expense (benefit) |
| 782 |
|
| 459 |
|
| 123 |
|
| 47 |
|
| 488 |
|
| (642 | ) |
| 1,257 |
|
| (1,405 | ) |
| (148 | ) |
| Operating earnings |
| $ | 1,548 |
| | $ | 919 |
| | $ | 460 |
| | $ | 218 |
| | $ | 1,030 |
| | $ | (522 | ) |
| 3,653 |
|
|
|
|
|
| Adjustments to: |
|
|
|
|
|
|
|
|
|
|
|
|
| |
|
|
| |
| Total revenues |
|
|
|
|
|
|
|
|
|
|
|
|
| (1,026 | ) |
|
|
| |
| Total expenses |
|
|
|
|
|
|
|
|
|
|
|
|
| (1,402 | ) |
|
|
| |
| Provision for income tax (expense) benefit | | | | | | | | | | | | |
| 1,405 |
|
|
|
| |
Income (loss) from continuing operations, net of income tax
| | | | | | | | | | | | |
| $ | 2,630 |
|
|
|
| $ | 2,630 |
|
MetLife, Inc.
Notes to the Interim Condensed Consolidated Financial Statements (Unaudited) — (continued)
2. Segment Information (continued)
| | | | | | | | | | | | | | | | | | | | | | | | | | | | | | | | | | | | | | | | | | | | | | | | | | | | | | | | |
| | | | | | |
| Six Months Ended June 30, 2020 | | U.S. | | Asia | | Latin
America | | EMEA | | MetLife
Holdings | | Corporate
& Other | | Total | | Adjustments | | Total Consolidated |
| | (In millions) |
| Revenues | | | | | | | | | | | | | | | | | | |
| Premiums | | $ | 10,858 | | | $ | 3,220 | | | $ | 1,129 | | | $ | 1,125 | | | $ | 1,793 | | | $ | 25 | | | $ | 18,150 | | | $ | 52 | | | $ | 18,202 | |
| Universal life and investment-type product policy fees | | 543 | | | 850 | | | 508 | | | 208 | | | 543 | | | 1 | | | 2,653 | | | 77 | | | 2,730 | |
| Net investment income | | 3,191 | | | 1,704 | | | 478 | | | 132 | | | 2,296 | | | (36) | | | 7,765 | | | (617) | | | 7,148 | |
| Other revenues | | 480 | | | 28 | | | 21 | | | 24 | | | 105 | | | 156 | | | 814 | | | 81 | | | 895 | |
| Net investment gains (losses) | | 0 | | | 0 | | | 0 | | | 0 | | | 0 | | | 0 | | | 0 | | | (57) | | | (57) | |
| Net derivative gains (losses) | | 0 | | | 0 | | | 0 | | | 0 | | | 0 | | | 0 | | | 0 | | | 3,491 | | | 3,491 | |
| Total revenues | | 15,072 | | | 5,802 | | | 2,136 | | | 1,489 | | | 4,737 | | | 146 | | | 29,382 | | | 3,027 | | | 32,409 | |
| Expenses | | | | | | | | | | | | | | | | | | |
| Policyholder benefits and claims and policyholder dividends | | 10,473 | | | 2,576 | | | 1,059 | | | 573 | | | 3,366 | | | 29 | | | 18,076 | | | 195 | | | 18,271 | |
| Interest credited to policyholder account balances | | 870 | | | 892 | | | 126 | | | 54 | | | 437 | | | 0 | | | 2,379 | | | (337) | | | 2,042 | |
| Capitalization of DAC | | (234) | | | (772) | | | (174) | | | (245) | | | (10) | | | (5) | | | (1,440) | | | (5) | | | (1,445) | |
| Amortization of DAC and VOBA | | 234 | | | 599 | | | 144 | | | 215 | | | 111 | | | 4 | | | 1,307 | | | 41 | | | 1,348 | |
| Amortization of negative VOBA | | 0 | | | (16) | | | 0 | | | (4) | | | 0 | | | 0 | | | (20) | | | 0 | | | (20) | |
| Interest expense on debt | | 4 | | | 0 | | | 2 | | | 0 | | | 3 | | | 445 | | | 454 | | | 0 | | | 454 | |
| Other expenses | | 2,078 | | | 1,671 | | | 652 | | | 660 | | | 467 | | | 270 | | | 5,798 | | | 121 | | | 5,919 | |
| Total expenses | | 13,425 | | | 4,950 | | | 1,809 | | | 1,253 | | | 4,374 | | | 743 | | | 26,554 | | | 15 | | | 26,569 | |
| Provision for income tax expense (benefit) | | 344 | | | 246 | | | 100 | | | 42 | | | 66 | | | (286) | | | 512 | | | 777 | | | 1,289 | |
| Adjusted earnings | | $ | 1,303 | | | $ | 606 | | | $ | 227 | | | $ | 194 | | | $ | 297 | | | $ | (311) | | | 2,316 | | | | | |
| Adjustments to: | | | | | | | | | | | | | | | | | | |
| Total revenues | | | | | | | | | | | | | | 3,027 | | | | | |
| Total expenses | | | | | | | | | | | | | | (15) | | | | | |
| Provision for income tax (expense) benefit | | | | | | | | | | | | | | (777) | | | | | |
| Net income (loss) | | | | | | | | | | | | | | $ | 4,551 | | | | | $ | 4,551 | |
|
| | | | | | | | | | | | | | | | | | | | | | | | | | | | | | | | | | | | |
| | | Operating Results | | | | |
| Nine Months Ended September 30, 2016 | | U.S. | | Asia | | Latin America | | EMEA | | MetLife Holdings | | Corporate & Other | | Total | | Adjustments | | Total
Consolidated |
| | | (In millions) |
| Revenues | | | | | | | | | | | | | | | | | | |
| Premiums | | $ | 16,127 |
| | $ | 5,161 |
| | $ | 1,885 |
| | $ | 1,519 |
| | $ | 3,312 |
| | $ | 50 |
| | $ | 28,054 |
| | $ | (98 | ) | | $ | 27,956 |
|
| Universal life and investment-type product policy fees | | 743 |
| | 1,114 |
| | 764 |
| | 294 |
| | 1,073 |
| | 2 |
| | 3,990 |
| | 137 |
| | 4,127 |
|
| Net investment income | | 4,615 |
| | 2,003 |
| | 809 |
| | 244 |
| | 4,489 |
| | 141 |
| | 12,301 |
| | 226 |
| | 12,527 |
|
| Other revenues | | 589 |
| | 45 |
| | 26 |
| | 56 |
| | 512 |
| | 70 |
| | 1,298 |
| | 11 |
| | 1,309 |
|
| Net investment gains (losses) | | — |
| | — |
| | — |
| | — |
| | — |
| | — |
| | — |
| | 598 |
| | 598 |
|
| Net derivative gains (losses) | | — |
| | — |
| | — |
| | — |
| | — |
| | — |
| | — |
| | 1,438 |
| | 1,438 |
|
| Total revenues | | 22,074 |
| | 8,323 |
| | 3,484 |
| | 2,113 |
| | 9,386 |
| | 263 |
| | 45,643 |
| | 2,312 |
| | 47,955 |
|
| Expenses | | | | | | | | | | | | | | | | | | |
| Policyholder benefits and claims and policyholder dividends | | 16,210 |
| | 3,923 |
| | 1,814 |
| | 801 |
| | 5,603 |
| | 23 |
| | 28,374 |
| | (56 | ) | | 28,318 |
|
| Interest credited to policyholder account balances | | 967 |
| | 974 |
| | 249 |
| | 87 |
| | 780 |
| | 5 |
| | 3,062 |
| | 757 |
| | 3,819 |
|
| Capitalization of DAC | | (356 | ) | | (1,251 | ) | | (236 | ) | | (310 | ) | | (240 | ) | | (7 | ) | | (2,400 | ) | | (22 | ) | | (2,422 | ) |
| Amortization of DAC and VOBA | | 353 |
| | 921 |
| | 127 |
| | 311 |
| | 636 |
| | 7 |
| | 2,355 |
| | (303 | ) | | 2,052 |
|
| Amortization of negative VOBA | | — |
| | (167 | ) | | (1 | ) | | (10 | ) | | — |
| | — |
| | (178 | ) | | (43 | ) | | (221 | ) |
| Interest expense on debt | | 7 |
| | — |
| | 1 |
| | — |
| | 43 |
| | 862 |
| | 913 |
| | (38 | ) | | 875 |
|
| Other expenses | | 2,772 |
| | 2,658 |
| | 968 |
| | 1,001 |
| | 1,861 |
| | 401 |
| | 9,661 |
| | 351 |
| | 10,012 |
|
| Total expenses | | 19,953 |
| | 7,058 |
| | 2,922 |
| | 1,880 |
| | 8,683 |
| | 1,291 |
| | 41,787 |
| | 646 |
| | 42,433 |
|
| Provision for income tax expense (benefit) | | 720 |
| | 377 |
| | 141 |
| | 32 |
| | 203 |
| | (658 | ) | | 815 |
| | 438 |
| | 1,253 |
|
| Operating earnings | | $ | 1,401 |
| | $ | 888 |
| | $ | 421 |
| | $ | 201 |
| | $ | 500 |
| | $ | (370 | ) | | 3,041 |
| | | | |
| Adjustments to: | | | | | | | | | | | | | | | | | | |
| Total revenues | | | | | | | | | | | | | | 2,312 |
| | | | |
| Total expenses | | | | | | | | | | | | | | (646 | ) | | | | |
| Provision for income tax (expense) benefit | | | | | | | | | | | | | | (438 | ) | | | | |
Income (loss) from continuing operations, net of income tax
| | | | | | | | | | | | | | $ | 4,269 |
| | | | $ | 4,269 |
|
MetLife, Inc.
Notes to the Interim Condensed Consolidated Financial Statements (Unaudited) — (continued)
2. Segment Information (continued)
The following table presents total assets with respect to the Company’s segments, as well as Corporate & Other, at:
| | | | | | | | | | | | | | |
| | June 30, 2021 | | December 31, 2020 |
| | (In millions) |
| U.S. | | $ | 283,698 | | | $ | 291,483 | |
| Asia | | 170,851 | | | 173,884 | |
| Latin America | | 66,728 | | | 75,047 | |
| EMEA | | 28,084 | | | 28,372 | |
| MetLife Holdings | | 181,609 | | | 184,566 | |
| Corporate & Other | | 42,283 | | | 41,794 | |
| Total | | $ | 773,253 | | | $ | 795,146 | |
|
| | | | | | | | |
| | | September 30, 2017 | | December 31, 2016 |
| | | (In millions) |
| U.S. | | $ | 258,651 |
| | $ | 253,683 |
|
| Asia | | 134,070 |
| | 120,656 |
|
| Latin America | | 77,617 |
| | 67,233 |
|
| EMEA | | 30,244 |
| | 25,596 |
|
| MetLife Holdings | | 185,054 |
| | 184,276 |
|
| Corporate & Other (1) | | 34,879 |
| | 247,320 |
|
| Total | | $ | 720,515 |
| | $ | 898,764 |
|
__________________
| |
(1) | Includes assets of disposed subsidiary of $216,983 million at December 31, 2016. |
3. SeparationDispositions
Separation of Brighthouse
In January 2016, MetLife, Inc. announced its plan to separate a substantial portion of its former Retail segment, as well as certain portions of its former Corporate Benefit Funding segment and Corporate & Other. MetLife, Inc. subsequently re-segmented the business to be separated and rebranded it as “Brighthouse Financial.” On July 6, 2017, MetLife, Inc. announced that theU.S. Securities and Exchange Commission (“SEC”)declared Brighthouse Financial, Inc.’s registration statement on Form 10 effective. Additionally, all required state regulatory approvals were granted.
On August 4, 2017, MetLife, Inc. completed the separation of Brighthouse. MetLife, Inc. common shareholders received a distribution of one share of Brighthouse Financial, Inc. common stock for every 11 sharesPending Disposition of MetLife Inc. common stock they owned asPoland and Greece
In July 2021, the Company entered into definitive agreements to sell its wholly-owned subsidiaries in Poland and Greece (collectively, “MetLife Poland and Greece”) to NN Group N.V. for $738 million in total consideration, including an expected pre-closing dividend of 5:00 p.m., New York City time, on the July 19, 2017 record date. Shareholders of MetLife, Inc. who owned less than 11 shares of common stock, or others who would have otherwise received fractional shares, received cash. MetLife, Inc. distributed 96,776,670 of the 119,773,106 shares of Brighthouse Financial, Inc. common stock outstanding, representing approximately 80.8% of those shares. Certain MetLife affiliates hold MetLife, Inc. common stock and, as a result, participated in the distribution.
The loss recognized in the third quarter of 2017 in$43 million. In connection with the Separation was $1,084pending sale, an expected loss of $190 million, net of income tax, was recorded for the three months and six months ended June 30, 2021, which includes: (i) a $1,061 million loss on MetLife's retained investmentis reflected in Brighthouse Financial, Inc., (ii) a $42 million net tax charge and (iii) a $42 million charge, net of income tax, for transaction costs, partially offset by a $61 million gain, net of income tax, for previously deferred intercompany gains realized upon Separation. The $42 million net tax charge is comprised of a $1,093 million tax separation agreement charge offset by $1,051 million of Separation tax benefits. Of the $1,084 million total loss, net of income tax, a $104 million loss, net of income tax, was reported within continuing operations as (i) a $738 million net investment loss, (ii)gains (losses). MetLife Poland and Greece results of operations are reported in the EMEA segment adjusted earnings through June 30, 2021. The transaction is expected to close in the first half of 2022 and is subject to regulatory approvals and satisfaction of other customary closing conditions.
The pending disposition meets the criteria for held-for-sale accounting but does not meet the criteria to be classified as discontinued operations. As a $147 million charge within policyholder benefitsresult, the related assets and claims, (iii) a $107 million charge within other expenses,liabilities are included in the separate held-for-sale line items of the asset and (iv) an $888 million income tax benefit. liability sections of the interim condensed consolidated balance sheet.
The remaining $980 million loss was reported within discontinued operations, which primarily includes a tax-related charge.following table summarizes the assets and liabilities held-for-sale:
For the nine months ended September 30, 2017, the loss recognized in connection with the Separation was $1,347 million, net of income tax, which included additional transaction costs. Of the $1,347 million total loss, net of income tax, a $176 million loss, net of income tax, was reported within continuing operations as (i) a $738 million net investment loss, (ii) a $147 million charge within policyholder benefits and claims, (iii) a $218 million charge within other expenses, and (iv) a $927 million income tax benefit. The remaining $1,171 million loss was reported within discontinued operations, which primarily includes a tax-related charge.
| | | | | | | | |
| | June 30, 2021 |
| | (In millions) |
| Assets: | | |
| Fixed maturity securities available-for-sale | | $ | 2,235 | |
| Contractholder-directed equity securities | | 1,125 | |
| Other investments | | 139 | |
| Total investments | | 3,499 | |
| Cash and cash equivalents | | 104 | |
| Deferred policy acquisition costs and value of business acquired | | 144 | |
| Other | | 309 | |
| Separate accounts assets | | 3,534 | |
| Total assets held-for-sale | | $ | 7,590 | |
| | |
| Liabilities: | | |
| Future policy benefits | | $ | 975 | |
| Policyholder account balances | | 2,080 | |
| Other policy-related balances | | 110 | |
| Other | | 145 | |
| Separate account liabilities | | 3,534 | |
| Total liabilities held-for-sale | | $ | 6,844 | |
MetLife, Inc.
Notes to the Interim Condensed Consolidated Financial Statements (Unaudited) — (continued)
3. SeparationDispositions (continued)
MetLife Poland and Greece income (loss) before provision for income tax as reflected in the interim condensed consolidated statements of operations was $13 million and $28 million for the three months and six months ended June 30, 2021, respectively, and $15 million and $34 million for the three months and six months ended June 30, 2020, respectively.
Disposition of Metropolitan Property and Casualty Insurance Company
In December 2020, the Company entered into a definitive agreement to sell its wholly-owned subsidiary, Metropolitan Property and Casualty Insurance Company and certain of its wholly-owned subsidiaries (collectively, “MetLife P&C”) to Farmers Group, Inc. retainedfor $3.9 billion in cash. In addition, the remaining ownership interestCompany and the Farmers Exchanges agreed to establish a 10-year strategic partnership through which the Farmers Insurance Group will offer its personal line products on MetLife’s U.S. Group Benefits platform which commenced when the transaction closed. MetLife P&C results of 22,996,436 shares, or 19.2%,operations are reported in the U.S. segment adjusted earnings through December 31, 2020. See Note 2 for more information on divested businesses. In April 2021, the Company completed the sale of Brighthouse Financial, Inc. common stock and recognized its investment in Brighthouse Financial, Inc. common stock based on the NASDAQ reported market price. The Company elected to record the investment under the FVO as an observable measure of estimated fair value that is aligned with the Company’s intent to divestMetLife P&C. As a result of the retained shares as soon as practicable. Subsequent changes in estimated fair value of the investment are recorded to net investment gains (losses). The estimated fair value of the Brighthouse Financial, Inc. common stock held bysale, the Company (“FVO Brighthouse Common Stock”) asrecognized a gain of September 30, 2017 was $1.4 billion reported within fair value option securities. In the third quarter($1.1 billion, net of 2017, the Company recorded a $1,016 million mark-to-market loss on its retained investmentincome tax) in Brighthouse Financial, Inc. to net investment gains (losses) at Separation and an additional $45 million loss to net investment gains (losses) for the changethree months and six months ended June 30, 2021.
The disposition met the criteria for held-for-sale accounting but did not meet the criteria to be classified as discontinued operations. As a result, the related assets and liabilities were included in Brighthouse Financial, Inc.’s common stock share price from the Separation date to September 30, 2017. Asseparate held-for-sale line items of the Separation date,asset and liability sections of the Company evaluatedinterim condensed consolidated balance sheets at December 31, 2020.
The following table summarizes the assets and liabilities held-for-sale:
| | | | | | | | |
| | December 31, 2020 |
| | (In millions) |
| Assets: | | |
| Fixed maturity securities available-for-sale | | $ | 4,096 | |
| Equity securities | | 57 | |
| Mortgage loans | | 355 | |
| Other invested assets | | 29 | |
| Total investments | | 4,537 | |
| Cash and cash equivalents | | 765 | |
| Accrued investment income | | 38 | |
| Premiums, reinsurance and other receivables | | 1,411 | |
| Deferred policy acquisition costs | | 196 | |
| Goodwill | | 328 | |
| Other assets | | 143 | |
| Total assets held-for-sale | | $ | 7,418 | |
| | |
| Liabilities: | | |
| Future policy benefits | | $ | 3,506 | |
| Other policy-related balances | | 33 | |
| Payables for collateral under securities loaned and other transactions | | 862 | |
| Other liabilities | | 249 | |
| Total liabilities held-for-sale | | $ | 4,650 | |
MetLife P&C income (loss) before provision for income tax as reflected in the interim condensed consolidated statements of Brighthouseoperations was $121 million for potential impairment,the six months ended June 30, 2021, and determined that no impairment charge was required.
The Company incurred pre-tax Separation-related transaction costs of $64$119 million and $470$234 million for the three months and ninesix months ended SeptemberJune 30, 2017, respectively, primarily related to fees for the terminations of financing arrangements and professional services. The Company incurred pre-tax Separation-related transaction costs of $51 million and $108 million for the three months and nine months ended September 30, 2016, respectively, primarily related to professional services. For the three months and nine months ended September 30, 2017, the Company reported $39 million and $333 million, respectively, within discontinued operations for fees for the terminations of financing arrangements and costs required to complete the Separation. All other Separation-related transaction costs are recorded in other expenses and reported within continuing operations.
Upon Separation, MetLife, Inc. terminated a net worth maintenance agreement with Brighthouse Life Insurance Company of NY (formerly, First MetLife Investors Insurance Company) in accordance with its terms. See Schedule II included in the 2016 Annual Report for further information.
Agreements
In connection with the Separation, MetLife and Brighthouse entered into various agreements. The significant agreements were as follows:
Master Separation Agreement
MetLife entered into a master separation agreement with Brighthouse prior to the completion of the distribution. The master separation agreement sets forth agreements with Brighthouse relating to the ownership of certain assets and the allocation of certain liabilities in connection with the separation of Brighthouse from MetLife. It also sets forth other agreements governing the relationship with Brighthouse after the distribution, including certain payment obligations between the parties.
Tax Agreements
Immediately prior to the Separation, MetLife entered into a tax separation agreement with Brighthouse. Among other things, the tax separation agreement governs the allocation between MetLife and Brighthouse of the responsibility for the taxes of the MetLife group. The tax separation agreement also allocates rights, obligations and responsibilities in connection with certain administrative matters relating to the preparation of tax returns and control of tax audits and other proceedings relating to taxes. For the taxable periods prior to Separation, MetLife and Brighthouse have joint and several liability for the MetLife consolidated U.S. federal income tax returns’ current taxes (and the benefits of tax attributes such as losses) allocated to Brighthouse. The tax separation agreement provides that the Brighthouse allocation of taxes could vary depending upon the outcome of Internal Revenue Service examinations. Upon Separation, the Company recorded a current income tax receivable of $1.4 billion and a corresponding payable to Brighthouse reported in other liabilities. On October 2, 2017, in accordance with the tax separation agreement, $729 million of this amount was paid by MetLife to Brighthouse.
2020, respectively.
MetLife, Inc.
Notes to the Interim Condensed Consolidated Financial Statements (Unaudited) — (continued)
3. SeparationDispositions (continued)
Disposition of Joint-stock Company MetLife Insurance Company
As part of the tax separation agreement, MetLife is liable for the U.S. federal income tax cost of a discrete Separation‑related tax charge incurred by Brighthouse. The income tax charge arises from the recapture of certain tax benefits incurred prior to Separation, and is caused by the deconsolidation of Brighthouse from the MetLife tax group at Separation. As a result, during the three months ended September 30, 2017, the Company recorded a decrease to current income tax recoverable and a charge to provision for income tax expense (benefit) of $1,093 million, which was reported in discontinued operations.
Additionally, MetLife has the right to receive future payments from Brighthouse for a tax asset that Brighthouse received as a result of restructuring prior to the Separation. Included in other assets at September 30, 2017, is a receivable from Brighthouse of $555 million related to these future payments.
Transactions Prior to the Separation
Prior to the Separation,In January 2021, the Company completed the following transactions in 2017.sale of its wholly-owned Russian subsidiary, the Joint-stock Company MetLife Insurance Company. See “— Discontinued Operations” for additional information.
Contributions of Entities, Mergers and Dividend
In April 2017, following receipt of applicable regulatory approvals, MetLife contributed certain captive reinsurance companies to Brighthouse Life Insurance Company (“Brighthouse Insurance”), which were merged into Brighthouse Reinsurance Company of Delaware (“BRCD”), a newly-formed captive reinsurance company that is wholly-owned by Brighthouse Insurance.
In July 2017, MetLife, Inc. contributed the voting common interests of Brighthouse Holdings, LLC, a subsidiary of MetLife, Inc., to Brighthouse Financial, Inc. Brighthouse Holdings, LLC is an intermediate holding company, which owns allNote 3 of the subsidiaries within Brighthouse.
On August 3, 2017, Brighthouse Financial, Inc. paid a cash dividend to MetLife, Inc. of $1.8 billion in connection with the Separation.
Termination of Financing Arrangements
In April 2017, MetLife, Inc. and MetLife Reinsurance Company of South Carolina (“MRSC”) terminated the MRSC collateral financing arrangement associated with secondary guarantees. As a result, the $2.8 billion collateral financing arrangement liability outstanding was extinguished utilizing $2.8 billion of assets held in trust with the remaining $590 million of assets held in trust returned to MetLife, Inc. as a cash return of capital from a subsidiary. Total fees associated with the termination were $37 million and were reported in discontinued operations.
In April 2017, MetLife, Inc. and MetLife Reinsurance Company of Vermont (“MRV”) terminated the $4.3 billion committed facility, and MetLife, Inc. and MRSC terminated the $3.5 billion committed facility. Total fees associated with the terminations were $257 million and were reported in discontinued operations.
See Note 9 for discussion of impacts to the junior subordinated debentures as a result of the Separation.
New Financing Arrangements
In April 2017, BRCD entered into a new financing arrangement with a pool of highly rated third-party reinsurers with a total capacity of $10.0 billion. This financing arrangement consists of credit-linked notes that each has a term of 20 years.
In June 2017, Brighthouse Holdings, LLC issued 50,000 units of 6.50% fixed rate cumulative preferred units to MetLife, Inc. and in turn MetLife, Inc. sold the preferred units to third-party investors, for net proceeds of $49 million.
In June 2017, Brighthouse Financial, Inc. issued $1.5 billion of senior notes due in June 2027 (the “2027 Senior Notes”) which bear interest at a fixed rate of 3.70%, payable semi-annually. Also in June 2017, Brighthouse Financial, Inc. issued $1.5 billion of senior notes due in June 2047 (the “2047 Senior Notes,” and together with the 2027 Senior Notes, the “Senior Notes”) which bear interest at a fixed rate of 4.70%, payable semi-annually. In connection with the issuance of the Senior Notes, MetLife, Inc. had initially guaranteed the Senior Notes on a senior unsecured basis. The guarantee was released, in accordance with its terms, in connection with consummation of the Separation.
MetLife, Inc.
Notes to the Interim Condensed Consolidated Financial Statements (Unaudited) — (continued)
3. Separation (continued)
In June 2017, subsequent to the issuance of the Senior Notes, the borrowing capacity under Brighthouse Financial, Inc.’s three-year senior unsecured delayed draw term loan agreement (the “2016 Term Loan Agreement”) was decreased from $3.0 billion to $536 million. On July 21, 2017, concurrently with entering into a new term loan agreement described below, Brighthouse Financial, Inc. terminated the 2016 Term Loan Agreement without penalty.
In July 2017, Brighthouse Financial, Inc. entered into a new $600 million senior unsecured delayed draw term loan agreement (the “2017 Term Loan Agreement”). Under the 2017 Term Loan Agreement, Brighthouse Financial, Inc. may borrow up to a maximum of $600 million which may be used for general corporate purposes, including in connection with the Separation, of which $500 million was available prior to the Separation. The 2017 Term Loan Agreement contains certain covenants that could restrict the operations and use of funds of Brighthouse. On August 2, 2017, Brighthouse Financial, Inc. borrowed $500 million under the 2017 Term Loan Agreement in connection with the Separation.
Termination of Support Agreements
In April 2017, in connection with the contribution of entities, mergers and financing transactions discussed above, MetLife, Inc. terminated various support agreements with the captive reinsurance companies merged into BRCD. See Schedule II included in the 20162020 Annual Report for information on the support agreements that were terminated.further information.
Ongoing Transactions with Brighthouse
The Company considered all of its continuing involvement with Brighthouse in determining to deconsolidate and present Brighthouse results as discontinued operations, including the agreements described above and the ongoing transactions described below.
The Company entered into reinsurance, committed facility, structured settlement, and contract administrative services transactions with Brighthouse in the normal course of business and such transactions will continue based upon business needs. In addition, prior to and in connection with the Separation, the Company entered into various other agreements with Brighthouse for services necessary for both the Company and Brighthouse to conduct their activities. Intercompany transactions prior to the Separation between the Company and Brighthouse are eliminated and excluded from the interim condensed consolidated statements of operations and comprehensive income (loss) and interim condensed consolidated balance sheets. Transactions between the Company and Brighthouse that continue after the Separation are included on the Company’s interim condensed consolidated statements of operations and comprehensive income (loss) and interim condensed consolidated balance sheets.
MetLife, Inc.
Notes to the Interim Condensed Consolidated Financial Statements (Unaudited) — (continued)
3. Separation (continued)
Reinsurance
The Company entered into reinsurance transactions with Brighthouse in the normal course of business and such transactions will continue based upon business needs. Information regarding the significant effects of reinsurance transactions with Brighthouse was as follows:
|
| | | | | | | | | | | | | | | | | | | |
| | Included on Interim Condensed Consolidated Statements of Operations and Comprehensive Income (Loss) | | Excluded from Interim Condensed Consolidated Statements of Operations and Comprehensive Income (Loss) |
| | Three and Nine Months Ended September 30, | | Three Months
Ended
September 30, | | Nine Months
Ended
September 30, |
| | 2017 (1) | | 2017 (2) | | 2016 | | 2017 (2) | | 2016 |
| | (In millions) |
| Premiums | | | | | | | | | |
| Reinsurance assumed | $ | 70 |
| | $ | 36 |
|
| $ | 111 |
|
| $ | 248 |
|
| $ | 338 |
|
| Reinsurance ceded | (2 | ) | | 1 |
|
| (3 | ) |
| (7 | ) |
| (10 | ) |
| Net premiums | $ | 68 |
| | $ | 37 |
| | $ | 108 |
| | $ | 241 |
| | $ | 328 |
|
| Universal life and investment-type product policy fees | | | | | | | | | |
| Reinsurance assumed | $ | (1 | ) | | $ | (1 | ) |
| $ | (2 | ) |
| $ | (6 | ) |
| $ | (2 | ) |
| Reinsurance ceded | (22 | ) | | (8 | ) |
| (30 | ) |
| (55 | ) |
| (76 | ) |
| Net universal life and investment-type product policy fees | $ | (23 | ) | | $ | (9 | ) | | $ | (32 | ) | | $ | (61 | ) | | $ | (78 | ) |
| Policyholder benefits and claims | | | | | | | | | |
| Reinsurance assumed | $ | 55 |
| | $ | 30 |
|
| $ | 103 |
|
| $ | 196 |
|
| $ | 286 |
|
| Reinsurance ceded | (6 | ) | | (3 | ) |
| (14 | ) |
| (16 | ) |
| (9 | ) |
| Net policyholder benefits and claims | $ | 49 |
| | $ | 27 |
| | $ | 89 |
| | $ | 180 |
| | $ | 277 |
|
| Interest credited to policyholder account balances | | | | | | | | | |
| Reinsurance assumed | $ | 3 |
| | $ | 1 |
|
| $ | 4 |
|
| $ | 10 |
|
| $ | 12 |
|
| Reinsurance ceded | (12 | ) | | (6 | ) |
| (18 | ) |
| (42 | ) |
| (56 | ) |
| Net interest credited to policyholder account balances | $ | (9 | ) | | $ | (5 | ) | | $ | (14 | ) | | $ | (32 | ) | | $ | (44 | ) |
| Other expenses | | | | | | | | | |
| Reinsurance assumed | $ | 6 |
| | $ | 4 |
|
| $ | 18 |
|
| $ | 10 |
|
| $ | 63 |
|
| Reinsurance ceded | (7 | ) | | (3 | ) |
| (8 | ) |
| (28 | ) |
| (24 | ) |
| Net other expenses | $ | (1 | ) | | $ | 1 |
| | $ | 10 |
| | $ | (18 | ) | | $ | 39 |
|
__________________
| |
(1) | Includes transactions after the Separation. |
| |
(2) | Includes transactions prior to the Separation. |
MetLife, Inc.
Notes to the Interim Condensed Consolidated Financial Statements (Unaudited) — (continued)
3. Separation (continued)
Information regarding the significant effects of reinsurance transactions with Brighthouse included on the interim condensed consolidated balance sheets was as follows at:
|
| | | | | | | |
| | September 30, 2017 |
| | Assumed | | Ceded |
| | (In millions) |
| Assets | | | |
| Premiums, reinsurance and other receivables | $ | 162 |
| | $ | 1,786 |
|
| Deferred policy acquisition costs and value of business acquired | 393 |
| | (22 | ) |
| Total assets | $ | 555 |
| | $ | 1,764 |
|
| Liabilities | | | |
| Future policy benefits | $ | 1,666 |
| | $ | — |
|
| Other policy-related balances | 121 |
| | 29 |
|
| Other liabilities | 1,460 |
| | 22 |
|
| Total liabilities | $ | 3,247 |
| | $ | 51 |
|
Investment Management
In connection with the Separation, the Company entered into investment management services agreements with Brighthouse. Each agreement has an initial term of 18 months after the date of Separation, after which period either party to the agreement is permitted to terminate upon notice to the other party. After the Separation, during both the three months and nine months ended September 30, 2017, the Company recognized $18 million in other revenues for services provided under the agreements. Prior to the Separation, during the three months and nine months ended September 30, 2017, the Company charged Brighthouse $8 million and $57 million, respectively, for services provided under the agreements, which were intercompany transactions and eliminated and excluded from the interim condensed consolidated statement of operations and comprehensive income (loss).
Debt
MRV and MetLife, Inc. have a $2.9 billion committed facility which is used as collateral for certain affiliated reinsurance liabilities. As of September 30, 2017, Brighthouse is a beneficiary of $2.3 billion of letters of credit issued under this committed facility and in consideration Brighthouse reimburses MetLife, Inc. a portion of the letter of credit fees. The Company entered into the committed facility with Brighthouse in the normal course of business and such transactions will continue based upon business needs.
See “— Transactions Prior to the Separation — Termination of Financing Arrangements” for additional transactions with Brighthouse.
Transition Services
In connection with the Separation, the Company entered into a transition services agreement with Brighthouse for services necessary for Brighthouse to conduct their activities. The services are expected to continue up to 36 months, with certain services potentially to be made available for several years thereafter. After the Separation, during the three months ended September 30, 2017, the Company recognized $60 million as a reduction to other expenses for transitional services provided under the agreement. Prior to the Separation, during the three months and nine months ended September 30, 2017, the Company charged Brighthouse $27 million and $191 million, respectively, for services provided under the agreement, which were intercompany transactions and eliminated and excluded from the interim condensed consolidated statement of operations and comprehensive income (loss).
MetLife, Inc.
Notes to the Interim Condensed Consolidated Financial Statements (Unaudited) — (continued)
3. Separation (continued)
Other
The Company has existing assumed structured settlement claim obligations as an assignment company for Brighthouse. These liabilities are measured at the present value of the periodic claims to be provided and reported as other policy-related balances. The Company receives a fee for assuming these claim obligations and, as the assignee of the claim, is legally obligated to ensure periodic payments are made to the claimant. The Company purchased annuities from Brighthouse to fund these obligations and designates payments to be made directly to the claimant by Brighthouse as the annuity writer. The aggregate contract values of annuities funding structured settlement claims are recorded as an asset for which the Company has also recorded an unpaid claim obligation reported in other policy-related balances. Such aggregated contract values were $1.3 billion at September 30, 2017. The Company entered into these transactions with Brighthouse in the normal course of business and such transactions will continue based upon business needs.
The Company provides services necessary for Brighthouse to conduct its business, which primarily include contract administrative services for certain Brighthouse investment-type products. After the Separation, during both the three months and nine months ended September 30, 2017, the Company recognized $21 million in universal life and investment-type product policy fees for administrative services provided to Brighthouse. Prior to the Separation, during the three months and nine months ended September 30, 2017, the Company provided administrative services to Brighthouse for $10 million and $73 million, respectively, which were intercompany transactions and eliminated and excluded from the interim condensed consolidated statement of operations and comprehensive income (loss). The Company entered into these transactions with Brighthouse in the normal course of business and such transactions will continue based upon business needs.
In connection with the Separation, the Company entered into an employee matters agreement with Brighthouse to allocate obligations and responsibilities relating to employee compensation and benefit plans and other related matters. The employee matters agreement provides that MetLife will reimburse Brighthouse for certain pension benefit payments, retiree health and life benefit payments and deferred compensation payments. Included in other liabilities at September 30, 2017, is a payable to Brighthouse of $186 million related to these future payments.
At September 30, 2017, the Company had a net receivable from Brighthouse of $40 million related to services provided and received.
MetLife, Inc.
Notes to the Interim Condensed Consolidated Financial Statements (Unaudited) — (continued)
3. Separation (continued)
Discontinued Operations
The following table presents the amounts related to the operations and loss on disposal of Brighthouse that have been reflected in discontinued operations:
|
| | | | | | | | | | | | | | | |
| | Three Months
Ended September 30, | | Nine Months Ended September 30, |
| | 2017 (1) | | 2016 | | 2017 (1) | | 2016 |
| | (In millions) |
| Revenues | | | | | | | |
| Premiums | $ | 116 |
| | $ | 552 |
| | $ | 820 |
| | $ | 1,544 |
|
| Universal life and investment-type product policy fees | 320 |
| | 955 |
| | 2,201 |
| | 2,799 |
|
| Net investment income | 243 |
| | 857 |
| | 1,783 |
| | 2,384 |
|
| Other revenues | 27 |
| | 8 |
| | 150 |
| | 31 |
|
| Total net investment gains (losses) | 1 |
| | 26 |
| | (53 | ) | | (60 | ) |
| Net derivative gains (losses) | (171 | ) | | (509 | ) | | (1,061 | ) | | (3,254 | ) |
| Total revenues | 536 |
| | 1,889 |
| | 3,840 |
| | 3,444 |
|
| Expenses | | | | | | | |
| Policyholder benefits and claims | 335 |
| | 1,244 |
| | 2,217 |
| | 3,414 |
|
| Interest credited to policyholder account balances | 89 |
| | 276 |
| | 620 |
| | 827 |
|
| Policyholder dividends | 2 |
| | 10 |
| | 16 |
| | 27 |
|
| Goodwill impairment | — |
| | 260 |
| | — |
| | 260 |
|
| Other expenses | 108 |
| | 710 |
| | 853 |
| | 1,068 |
|
| Total expenses | 534 |
| | 2,500 |
| | 3,706 |
| | 5,596 |
|
| Income (loss) from discontinued operations before provision for income tax and loss on disposal of discontinued operations | 2 |
| | (611 | ) | | 134 |
| | (2,152 | ) |
| Provision for income tax expense (benefit) | (10 | ) | | (160 | ) | | (48 | ) | | (773 | ) |
| Income (loss) from discontinued operations before loss on disposal of discontinued operations, net of income tax | 12 |
| | (451 | ) | | 182 |
| | (1,379 | ) |
| Transaction costs associated with the Separation, net of income tax | (25 | ) | | — |
| | (216 | ) | | — |
|
| Tax charges associated with the Separation | (955 | ) | | — |
| | (955 | ) | | — |
|
| Income (loss) on disposal of discontinued operations, net of income tax | (980 | ) | | — |
| | (1,171 | ) | | — |
|
| Income (loss) from discontinued operations, net of income tax | $ | (968 | ) | | $ | (451 | ) | | $ | (989 | ) | | $ | (1,379 | ) |
__________________
| |
(1) | Includes transactions prior to the Separation. |
MetLife, Inc.
Notes to the Interim Condensed Consolidated Financial Statements (Unaudited) — (continued)
3. Separation (continued)
The following table presents the amounts related to the financial position of Brighthouse that have been reflected in the assets and liabilities of disposed subsidiary:
|
| | | | |
| | | December 31, 2016 |
| | | (In millions) |
| Assets | | |
| Investments: | | |
| Fixed maturity securities available-for-sale | | $ | 61,326 |
|
| Equity securities available-for-sale | | 300 |
|
| Mortgage loans | | 9,378 |
|
| Policy loans | | 1,517 |
|
| Real estate and real estate joint ventures | | 150 |
|
| Other limited partnership interests | | 1,642 |
|
| Short-term investments | | 1,288 |
|
| Other invested assets | | 3,881 |
|
| Total investments | | 79,482 |
|
| Cash and cash equivalents | | 5,226 |
|
| Accrued investment income | | 680 |
|
| Premiums, reinsurance and other receivables | | 10,636 |
|
| Deferred policy acquisition costs and value of business acquired | | 7,207 |
|
| Other assets | | 709 |
|
| Separate account assets | | 113,043 |
|
| Total assets of disposed subsidiary | | $ | 216,983 |
|
| Liabilities | | |
| Future policy benefits | | $ | 33,270 |
|
| Policyholder account balances | | 37,066 |
|
| Other policy-related balances | | 1,356 |
|
| Policyholder dividends payable | | 12 |
|
| Payables for collateral under securities loaned and other transactions | | 7,390 |
|
| Long-term debt | | 60 |
|
| Collateral financing arrangements | | 2,797 |
|
| Deferred income tax liability | | 2,594 |
|
| Other liabilities | | 5,119 |
|
| Separate account liabilities | | 113,043 |
|
| Total liabilities of disposed subsidiary | | $ | 202,707 |
|
MetLife, Inc.
Notes to the Interim Condensed Consolidated Financial Statements (Unaudited) — (continued)
3. Separation (continued)
In the consolidated statements of cash flows, the cash flows from discontinued operations are not separately classified. As such, the following table presents selected financial information regarding cash flows of the discontinued operation.
|
| | | | | | | |
| Nine Months
Ended
September 30, |
| 2017 |
| 2016 |
| | (In millions) |
| Net cash provided by (used in): | | | |
| Operating activities | $ | 1,329 |
|
| $ | 2,590 |
|
| Investing activities | $ | (2,732 | ) |
| $ | (5,074 | ) |
| Financing activities | $ | (367 | ) | | $ | 3,739 |
|
4. Insurance
Guarantees
As discussed in Notes 1 and 4 of the Notes to the Consolidated Financial Statements included in the 20162020 Annual Report, the Company issues directly and assumes through reinsurance variable annuity products with guaranteed minimum benefits. Guaranteed minimum accumulation benefits (“GMABs”) and, the portionsnon-life contingent portion of both non-life-contingent guaranteed minimum withdrawal benefits (“GMWBs”) and thecertain non-life contingent portions of GMIBs that do not require annuitization are accounted for as embedded derivatives in policyholder account balances and are further discussed in Note 7.
The Company also issues other annuity contracts that apply a lower rate on funds deposited if the contractholder elects to surrender the contract for cash and a higher rate if the contractholder elects to annuitize. These guarantees include benefits that are payable in the event of death, maturity or at annuitization. Certain other annuity contracts contain guaranteed annuitization benefits that may be above what would be provided by the current account value of the contract. Additionally, the Company issues universal and variable life contracts where the Company contractually guarantees to the contractholder a secondary guarantee or a guaranteed paid-up benefit.
Information regarding the Company’s guarantee exposure, which includes direct and assumed business, but excludes offsets from hedging or ceded reinsurance, if any, was as follows at:
| | | | | | | | | | | | | | | | | | | | | | | | | | | | | | | | | | | | | | |
| | June 30, 2021 | | December 31, 2020 |
| | In the
Event of Death | | At
Annuitization | | In the Event of Death | | At Annuitization |
| | (Dollars in millions) | |
| Annuity Contracts: | | | | | | | | | | | | |
| Variable Annuity Guarantees: | | | | | | | | | | | | |
| Total account value (1), (2), (3) | | $ | 64,788 | | | | $ | 24,095 | | | | $ | 65,044 | | | | $ | 24,170 | | |
| Separate account value (1) | | $ | 43,396 | | | | $ | 22,393 | | | | $ | 42,585 | | | | $ | 22,370 | | |
| Net amount at risk (2) | | $ | 1,462 | | (4) | | | $ | 451 | | (5) | | | $ | 1,579 | | (4) | | | $ | 614 | | (5) | |
| Average attained age of contractholders | | 68 years | | | 67 years | | | 68 years | | | 66 years | |
| Other Annuity Guarantees: | | | | | | | | | | | | |
| Total account value (1), (3) | | N/A | | | $ | 5,349 | | | | N/A | | | $ | 6,030 | | |
| Net amount at risk | | N/A | | | $ | 195 | | (6) | | | N/A | | | $ | 459 | | (6) | |
| Average attained age of contractholders | | N/A | | | 56 years | | | N/A | | | 50 years | |
|
| | | | | | | | | | | | | | | | | | | | | | | | |
| | | September 30, 2017 | | | December 31, 2016 | |
| | | In the
Event of Death | | At
Annuitization | | In the
Event of Death | | At
Annuitization |
| | | (Dollars in millions) | |
| Annuity Contracts (1): | | | | | | | | | | | | |
| Variable Annuity Guarantees: | | | | | | | | | | | | |
| Total account value (2), (3) | | $ | 66,814 |
| | | $ | 26,098 |
| | | $ | 66,176 |
| | | $ | 25,335 |
| |
| Separate account value | | $ | 45,046 |
| | | $ | 24,179 |
| | | $ | 43,359 |
| | | $ | 23,330 |
| |
| Net amount at risk (2) | | $ | 1,401 |
| (4 | ) | | $ | 568 |
| (5 | ) | | $ | 1,842 |
| (4 | ) | | $ | 521 |
| (5 | ) |
| Average attained age of contractholders | | 65 years |
| | | 65 years |
| | | 64 years |
| | | 65 years |
| |
| Other Annuity Guarantees: | | | | | | | | | | | | |
| Total account value (3) | | N/A |
| | | $ | 1,432 |
| | | N/A |
| | | $ | 1,393 |
| |
| Net amount at risk | | N/A |
| | | $ | 580 |
| (6 | ) | | N/A |
| | | $ | 490 |
| (6 | ) |
| Average attained age of contractholders | | N/A |
| | | 50 years |
| | | N/A |
| | | 50 years |
| |
| | | | | | | | | | | | | | | | | | | | | | | | | | |
| | June 30, 2021 | | December 31, 2020 |
| | Secondary
Guarantees | | Paid-Up
Guarantees | | Secondary Guarantees | | Paid-Up
Guarantees |
| | (Dollars in millions) |
| Universal and Variable Life Contracts: | | | | | | | | |
| Total account value (1), (3) | | $ | 13,830 | | | $ | 2,743 | | | $ | 13,426 | | | $ | 2,808 | |
| Net amount at risk (7) | | $ | 79,880 | | | $ | 13,102 | | | $ | 82,940 | | | $ | 13,557 | |
| Average attained age of policyholders | | 55 years | | 66 years | | 54 years | | 65 years |
__________________
(1)The Company’s annuity and life contracts with guarantees may offer more than one type of guarantee in each contract. Therefore, the amounts listed above may not be mutually exclusive.
MetLife, Inc.
Notes to the Interim Condensed Consolidated Financial Statements (Unaudited) — (continued)
4. Insurance (continued)
(2)Includes amounts, which are not reported on the interim condensed consolidated balance sheets, from assumed variable annuity guarantees from the Company’s former operating joint venture in Japan.
(3)Includes the contractholder’s investments in the general account and separate account, if applicable. |
| | | | | | | | | | | | | | | | |
| | | September 30, 2017 | | December 31, 2016 |
| | | Secondary
Guarantees | | Paid-Up
Guarantees | | Secondary
Guarantees | | Paid-Up
Guarantees |
| | | (Dollars in millions) |
| Universal and Variable Life Contracts (1): | | | | | | | | |
| Total account value (3) | | $ | 8,796 |
| | $ | 3,238 |
| | $ | 8,363 |
| | $ | 3,337 |
|
| Net amount at risk (7) | | $ | 67,950 |
| | $ | 16,905 |
| | $ | 70,225 |
| | $ | 17,785 |
|
| Average attained age of policyholders | | 56 years |
| | 63 years |
| | 55 years |
| | 62 years |
|
__________________
| |
(1) | The Company’s annuity and life contracts with guarantees may offer more than one type of guarantee in each contract. Therefore, the amounts listed above may not be mutually exclusive. |
| |
(2) | Includes amounts, which are not reported on the consolidated balance sheets, from assumed reinsurance of certain variable annuity products from the Company’s former operating joint venture in Japan. |
| |
(3) | Includes the contractholder’s investments in the general account and separate account, if applicable. |
| |
(4) | Defined as the death benefit less the total account value, as of the balance sheet date. It represents the amount of the claim that the Company would incur if death claims were filed on all contracts on the balance sheet date and includes any additional contractual claims associated with riders purchased to assist with covering income taxes payable upon death. |
| |
(5) | (5)Defined as the amount (if any) that would be required to be added to the total account value to purchase a lifetime income stream, based on current annuity rates, equal to the minimum amount provided under the guaranteed benefit. This amount represents the Company’s potential economic exposure to such guarantees in the event all contractholders were to annuitize on the balance sheet date, even though the contracts contain terms that allow annuitization of the guaranteed amount only after the 10th anniversary of the contract, which not all contractholders have achieved. |
| |
(6) | Defined as either the excess of the upper tier, adjusted for a profit margin, less the lower tier, as of the balance sheet date or the amount (if any) that would be required to be added to the total account value to purchase a lifetime income stream, based on current annuity rates, equal to the minimum amount provided under the guaranteed benefit. These amounts represent the Company’s potential economic exposure to such guarantees in the event all contractholders were to annuitize on the balance sheet date. |
| |
(7) | Defined as the guarantee amount less the account value, as of the balance sheet date. It represents the amount of the claim that the Company would incur if death claims were filed on all contracts on the balance sheet date. |
MetLife, Inc.
Notes to the Interim Condensed Consolidated Financial Statements (Unaudited) — (continued)total account value to purchase a lifetime income stream, based on current annuity rates, equal to the minimum amount provided under the guaranteed benefit. This amount represents the Company’s potential economic exposure to such guarantees in the event all contractholders were to annuitize on the balance sheet date, even though the contracts contain terms that allow annuitization of the guaranteed amount only after the 10th anniversary of the contract, which not all contractholders have achieved.
4. Insurance (continued)
(6)Defined as either the excess of the upper tier, adjusted for a profit margin, less the lower tier, as of the balance sheet date or the amount (if any) that would be required to be added to the total account value to purchase a lifetime income stream, based on current annuity rates, equal to the minimum amount provided under the guaranteed benefit. These amounts represent the Company’s potential economic exposure to such guarantees in the event all contractholders were to annuitize on the balance sheet date.
(7)Defined as the guarantee amount less the account value, as of the balance sheet date. It represents the amount of the claim that the Company would incur if death claims were filed on all contracts on the balance sheet date.
Liabilities for Unpaid Claims and Claim Expenses
Rollforward of Claims and Claim Adjustment Expenses
Information regarding the liabilities for unpaid claims and claim adjustment expenses was as follows:
| | | | | | | | Six Months
Ended
June 30, |
| | | Nine Months
Ended
September 30, | | 2021 | | 2020 |
| | | 2017 | | 2016 | | (In millions) |
| | | (In millions) | |
| Balance at December 31 of prior period | | $ | 16,151 |
| | $ | 9,669 |
| |
| Balance, beginning of period | | Balance, beginning of period | | $ | 18,591 | | | $ | 19,216 | |
| Less: Reinsurance recoverables | | 1,226 |
| | 476 |
| Less: Reinsurance recoverables | | 2,417 | | | 2,377 | |
| Net Balance at December 31 of prior period | | 14,925 |
| | 9,193 |
| |
| Cumulative adjustment (1) | | — |
| | 4,897 |
| |
| Net balance, beginning of period | | 14,925 |
| | 14,090 |
| Net balance, beginning of period | | 16,174 | | | 16,839 | |
| Incurred related to: | | | | | Incurred related to: | |
| Current period | | 18,028 |
| | 18,157 |
| Current period | | 13,640 | | | 12,751 | |
| Prior periods (2) | | 156 |
| | 147 |
| |
| Prior periods (1) | | Prior periods (1) | | 802 | | | 170 | |
| Total incurred | | 18,184 |
| | 18,304 |
| Total incurred | | 14,442 | | | 12,921 | |
| Paid related to: | | | | | Paid related to: | | | | |
| Current period | | (13,880 | ) | | (12,818 | ) | Current period | | (8,806) | | | (8,214) | |
| Prior periods | | (4,213 | ) | | (4,620 | ) | Prior periods | | (5,408) | | | (4,375) | |
| Total paid | | (18,093 | ) | | (17,438 | ) | Total paid | | (14,214) | | | (12,589) | |
| Reclassified to liabilities held-for-sale (2) | | Reclassified to liabilities held-for-sale (2) | | (59) | | | 0 | |
| Dispositions (3) | | Dispositions (3) | | (53) | | | 0 | |
| Net balance, end of period | | 15,016 |
| | 14,956 |
| Net balance, end of period | | 16,290 | | | 17,171 | |
| Add: Reinsurance recoverables | | 2,205 |
| | 2,052 |
| Add: Reinsurance recoverables | | 2,883 | | | 2,519 | |
| Balance, end of period (included in future policy benefits and other policy-related balances) | | $ | 17,221 |
| | $ | 17,008 |
| Balance, end of period (included in future policy benefits and other policy-related balances) | | $ | 19,173 | | | $ | 19,690 | |
__________________
| |
(1) | Reflects the accumulated adjustment, net of reinsurance, upon implementation of the new short-duration contracts guidance which clarified the requirement to include claim information for long-duration contracts. The accumulated adjustment primarily reflects unpaid claim liabilities, net of reinsurance, for long-duration contracts as of the beginning of the period presented. |
| |
(2) | During both the nine months ended September 30, 2017 and 2016, as a result of changes in estimates of insured events in the respective prior periods, the claims and claim adjustment expenses associated with prior periods increased due to unfavorable claims experience. |
MetLife, Inc.
Notes to the Interim Condensed Consolidated Financial Statements (Unaudited) — (continued)
4. Insurance (continued)
(1)For both the six months ended June 30, 2021 and 2020, incurred claim activity and claim adjustment expenses associated with prior periods increased due to events incurred in prior periods but reported in the current period.
(2)See Note 3 for information on the pending disposition of MetLife Poland and Greece.
(3)See Note 3 for information on the Company’s business dispositions.
5. Closed Block
On April 7, 2000 (the “Demutualization Date”), Metropolitan Life Insurance Company (“MLIC”) converted from a mutual life insurance company to a stock life insurance company and became a wholly-owned subsidiary of MetLife, Inc. The conversion was pursuant to an order by the New York Superintendent of Insurance approving MLIC’s plan of reorganization, as amended (the “Plan of Reorganization”). On the Demutualization Date, MLIC established a closed block for the benefit of holders of certain individual life insurance policies of MLIC.
Experience within the closed block, in particular mortality and investment yields, as well as realized and unrealized gains and losses, directly impact the policyholder dividend obligation. Amortization of the closed block DAC, which resides outside of the closed block, is based upon cumulative actual and expected earnings within the closed block. Accordingly, the Company’s net income continues to be sensitive to the actual performance of the closed block.
Closed block assets, liabilities, revenues and expenses are combined on a line-by-line basis with the assets, liabilities, revenues and expenses outside the closed block based on the nature of the particular item.
MetLife, Inc.
Notes to the Interim Condensed Consolidated Financial Statements (Unaudited) — (continued)
5. Closed Block (continued)
Information regarding the closed block liabilities and assets designated to the closed block was as follows at:
| | | | | September 30, 2017 | | December 31, 2016 | | June 30, 2021 | | December 31, 2020 |
| | | (In millions) | | (In millions) |
| Closed Block Liabilities | | | | | Closed Block Liabilities | |
| Future policy benefits | | $ | 40,489 |
| | $ | 40,834 |
| Future policy benefits | | $ | 38,373 | | | $ | 38,758 | |
| Other policy-related balances | | 193 |
| | 257 |
| Other policy-related balances | | 271 | | | 321 | |
| Policyholder dividends payable | | 483 |
| | 443 |
| Policyholder dividends payable | | 340 | | | 337 | |
| Policyholder dividend obligation | | 2,201 |
| | 1,931 |
| Policyholder dividend obligation | | 2,115 | | | 2,969 | |
| Current income tax payable | | — |
| | 4 |
| |
| Deferred income tax liability | | Deferred income tax liability | | 161 | | | 130 | |
| Other liabilities | | 277 |
| | 196 |
| Other liabilities | | 276 | | | 172 | |
| Total closed block liabilities | | 43,643 |
| | 43,665 |
| Total closed block liabilities | | 41,536 | | | 42,687 | |
| Assets Designated to the Closed Block | | | | | Assets Designated to the Closed Block | | | | |
| Investments: | | | | | Investments: | |
| Fixed maturity securities available-for-sale, at estimated fair value | | 27,541 |
| | 27,220 |
| Fixed maturity securities available-for-sale, at estimated fair value | | 26,320 | | | 27,186 | |
| Equity securities available-for-sale, at estimated fair value | | 71 |
| | 100 |
| |
| Equity securities, at estimated fair value | | Equity securities, at estimated fair value | | 22 | | | 24 | |
| Mortgage loans | | 5,904 |
| | 5,935 |
| Mortgage loans | | 6,447 | | | 6,807 | |
| Policy loans | | 4,542 |
| | 4,553 |
| Policy loans | | 4,272 | | | 4,355 | |
| Real estate and real estate joint ventures | | 628 |
| | 655 |
| Real estate and real estate joint ventures | | 551 | | | 559 | |
| Other invested assets | | 1,053 |
| | 1,246 |
| Other invested assets | | 484 | | | 468 | |
| Total investments | | 39,739 |
| | 39,709 |
| Total investments | | 38,096 | | | 39,399 | |
| Cash and cash equivalents | | 60 |
| | 18 |
| Cash and cash equivalents | | 199 | | | 0 | |
| Accrued investment income | | 487 |
| | 467 |
| Accrued investment income | | 386 | | | 402 | |
| Premiums, reinsurance and other receivables | | 68 |
| | 68 |
| Premiums, reinsurance and other receivables | | 52 | | | 50 | |
| Current income tax recoverable | | 30 |
| | — |
| Current income tax recoverable | | 46 | | | 28 | |
| Deferred income tax assets | | 109 |
| | 177 |
| |
| Total assets designated to the closed block | | 40,493 |
| | 40,439 |
| Total assets designated to the closed block | | 38,779 | | | 39,879 | |
| Excess of closed block liabilities over assets designated to the closed block | | 3,150 |
| | 3,226 |
| Excess of closed block liabilities over assets designated to the closed block | | 2,757 | | | 2,808 | |
| Amounts included in accumulated other comprehensive income (loss): | | | | | |
| AOCI: | | AOCI: | | | | |
| Unrealized investment gains (losses), net of income tax | | 1,851 |
| | 1,517 |
| Unrealized investment gains (losses), net of income tax | | 2,911 | | | 3,524 | |
| Unrealized gains (losses) on derivatives, net of income tax | | 23 |
| | 95 |
| Unrealized gains (losses) on derivatives, net of income tax | | 47 | | | 23 | |
| Allocated to policyholder dividend obligation, net of income tax | | (1,431 | ) | | (1,255 | ) | Allocated to policyholder dividend obligation, net of income tax | | (1,671) | | | (2,346) | |
| Total amounts included in AOCI | | 443 |
| | 357 |
| Total amounts included in AOCI | | 1,287 | | | 1,201 | |
| Maximum future earnings to be recognized from closed block assets and liabilities | | $ | 3,593 |
| | $ | 3,583 |
| Maximum future earnings to be recognized from closed block assets and liabilities | | $ | 4,044 | | | $ | 4,009 | |
Information regarding the closed block policyholder dividend obligation was as follows:
| | | | | Nine Months
Ended
September 30, 2017 | | Year
Ended
December 31, 2016 | | Six Months
Ended
June 30, 2021 | | Year
Ended
December 31, 2020 |
| | | (In millions) | | (In millions) |
| Balance, beginning of period | | $ | 1,931 |
| | $ | 1,783 |
| Balance, beginning of period | | $ | 2,969 | | | $ | 2,020 | |
| Change in unrealized investment and derivative gains (losses) | | 270 |
| | 148 |
| Change in unrealized investment and derivative gains (losses) | | (854) | | | 949 | |
| Balance, end of period | | $ | 2,201 |
| | $ | 1,931 |
| Balance, end of period | | $ | 2,115 | | | $ | 2,969 | |
MetLife, Inc.
Notes to the Interim Condensed Consolidated Financial Statements (Unaudited) — (continued)
5. Closed Block (continued)
Information regarding the closed block revenues and expenses was as follows:
| | | | | Three Months
Ended
September 30, | | Nine Months
Ended
September 30, | | Three Months
Ended
June 30, | | Six Months
Ended
June 30, |
| | | 2017 | | 2016 | | 2017 | | 2016 | | 2021 | | 2020 | | 2021 | | 2020 |
| | | (In millions) | | (In millions) |
| Revenues | | | | | | | | | Revenues | |
| Premiums | | $ | 413 |
| | $ | 436 |
| | $ | 1,247 |
| | $ | 1,297 |
| Premiums | | $ | 325 | | | $ | 371 | | | $ | 645 | | | $ | 738 | |
| Net investment income | | 450 |
| | 486 |
| | 1,368 |
| | 1,435 |
| Net investment income | | 382 | | | 371 | | | 775 | | | 778 | |
| Net investment gains (losses) | | — |
| | (3 | ) | | (10 | ) | | (19 | ) | Net investment gains (losses) | | (11) | | | 10 | | | (5) | | | (9) | |
| Net derivative gains (losses) | | (6 | ) | | 4 |
| | (24 | ) | | (3 | ) | Net derivative gains (losses) | | 6 | | | (3) | | | 7 | | | 23 | |
| Total revenues | | 857 |
| | 923 |
| | 2,581 |
| | 2,710 |
| Total revenues | | 702 | | | 749 | | | 1,422 | | | 1,530 | |
| Expenses | | | | | | | | | Expenses | | | | | | | | |
| Policyholder benefits and claims | | 591 |
| | 619 |
| | 1,773 |
| | 1,861 |
| Policyholder benefits and claims | | 520 | | | 589 | | | 1,066 | | | 1,139 | |
| Policyholder dividends | | 235 |
| | 232 |
| | 732 |
| | 723 |
| Policyholder dividends | | 173 | | | 217 | | | 351 | | | 436 | |
| Other expenses | | 30 |
| | 33 |
| | 94 |
| | 100 |
| Other expenses | | 24 | | | 25 | | | 49 | | | 52 | |
| Total expenses | | 856 |
| | 884 |
| | 2,599 |
| | 2,684 |
| Total expenses | | 717 | | | 831 | | | 1,466 | | | 1,627 | |
| Revenues, net of expenses before provision for income tax expense (benefit) | | 1 |
| | 39 |
| | (18 | ) | | 26 |
| Revenues, net of expenses before provision for income tax expense (benefit) | | (15) | | | (82) | | | (44) | | | (97) | |
| Provision for income tax expense (benefit) | | — |
| | 13 |
| | (8 | ) | | 8 |
| Provision for income tax expense (benefit) | | (3) | | | (17) | | | (9) | | | (20) | |
| Revenues, net of expenses and provision for income tax expense (benefit) | | $ | 1 |
| | $ | 26 |
| | $ | (10 | ) | | $ | 18 |
| Revenues, net of expenses and provision for income tax expense (benefit) | | $ | (12) | | | $ | (65) | | | $ | (35) | | | $ | (77) | |
MLIC charges the closed block with federal income taxes, state and local premium taxes and other state or local taxes, as well as investment management expenses relating to the closed block as provided in the Plan of Reorganization. MLIC also charges the closed block for expenses of maintaining the policies included in the closed block.
MetLife, Inc.
Notes to the Interim Condensed Consolidated Financial Statements (Unaudited) — (continued)
6. Investments
Fixed Maturity and Equity Securities Available-for-Sale
Fixed Maturity and Equity Securities Available-for-Sale by Sector
The following table presents the fixed maturity and equity securities AFSavailable-for-sale (“AFS”) by sector. Redeemable preferred stock is reported within U.S. corporate and foreign corporate fixed maturity securities and non-redeemablesectors include redeemable preferred stock is reported within equity securities. Included within fixed maturity securities are structured securities including residentialstock. Residential mortgage-backed securities (“RMBS”), asset-backed includes agency, prime, alternative and sub-prime mortgage-backed securities. Asset-backed securities (“ABS”) includes securities collateralized by corporate loans and commercialconsumer loans. Municipals includes taxable and tax-exempt revenue bonds and, to a much lesser extent, general obligations of states, municipalities and political subdivisions. Commercial mortgage-backed securities (“CMBS”) (collectively,primarily includes securities collateralized by multiple commercial mortgage loans. RMBS, ABS and CMBS are, collectively, “Structured Securities”).Products.”
| | | | | | | | | | | | | | | | | | | | | | | | | | | | | | | | | | | | | | | | | | | | | | | | | | | | | | | | | | | | | | |
| | June 30, 2021 | | December 31, 2020 |
| | Amortized
Cost | | | | Gross Unrealized (1) | Estimated
Fair
Value | | Amortized
Cost | | | | Gross Unrealized (1) | Estimated
Fair
Value |
| Sector | | Allowance for
Credit Loss | | Gains | | Losses | | Allowance for
Credit Loss | | Gains | |
Losses | |
| | (In millions) |
| U.S. corporate | | $ | 80,103 | | | $ | (39) | | | $ | 11,557 | | | $ | 250 | | | $ | 91,371 | | | $ | 79,788 | | | $ | (44) | | | $ | 13,924 | | | $ | 252 | | | $ | 93,416 | |
| Foreign government | | 58,674 | | | (21) | | | 6,728 | | | 751 | | | 64,630 | | | 63,243 | | | (21) | | | 8,883 | | | 406 | | | 71,699 | |
| Foreign corporate | | 59,400 | | | (32) | | | 6,690 | | | 453 | | | 65,605 | | | 60,995 | | | (16) | | | 8,897 | | | 468 | | | 69,408 | |
| U.S. government and agency | | 41,292 | | | 0 | | | 5,599 | | | 335 | | | 46,556 | | | 39,094 | | | 0 | | | 8,095 | | | 89 | | | 47,100 | |
| RMBS | | 28,211 | | | 0 | | | 1,753 | | | 116 | | | 29,848 | | | 28,415 | | | 0 | | | 2,062 | | | 42 | | | 30,435 | |
| ABS | | 16,519 | | | 0 | | | 224 | | | 30 | | | 16,713 | | | 16,963 | | | 0 | | | 231 | | | 75 | | | 17,119 | |
| Municipals | | 11,439 | | | 0 | | | 2,497 | | | 13 | | | 13,923 | | | 10,982 | | | 0 | | | 2,746 | | | 6 | | | 13,722 | |
| CMBS | | 11,464 | | | (7) | | | 633 | | | 41 | | | 12,049 | | | 11,331 | | | 0 | | | 681 | | | 102 | | | 11,910 | |
| Total fixed maturity securities AFS | | $ | 307,102 | | | $ | (99) | | | $ | 35,681 | | | $ | 1,989 | | | $ | 340,695 | | | $ | 310,811 | | | $ | (81) | | | $ | 45,519 | | | $ | 1,440 | | | $ | 354,809 | |
|
| | | | | | | | | | | | | | | | | | | | | | | | | | | | | | | | | | | | | | | |
| | September 30, 2017 | | December 31, 2016 |
| | Cost or Amortized Cost | | Gross Unrealized | | Estimated Fair Value | | Cost or Amortized Cost | | Gross Unrealized | | Estimated Fair Value |
| |
Gains | | Temporary Losses | | OTTI
Losses (1) | |
Gains | | Temporary Losses | | OTTI
Losses (1) | |
| | (In millions) |
| Fixed maturity securities: | | | | | | | | | | | | | | | | | | | |
| U.S. corporate | $ | 75,221 |
| | $ | 6,827 |
| | $ | 393 |
| | $ | — |
| | $ | 81,655 |
| | $ | 73,280 |
| | $ | 6,027 |
| | $ | 764 |
| | $ | — |
| | $ | 78,543 |
|
| Foreign government | 54,618 |
| | 6,486 |
| | 315 |
| | — |
| | 60,789 |
| | 49,864 |
| | 6,485 |
| | 373 |
| | — |
| | 55,976 |
|
| Foreign corporate | 52,185 |
| | 3,705 |
| | 750 |
| | — |
| | 55,140 |
| | 49,333 |
| | 2,901 |
| | 1,572 |
| | (1 | ) | | 50,663 |
|
| U.S. government and agency | 43,911 |
| | 4,056 |
| | 303 |
| | — |
| | 47,664 |
| | 41,294 |
| | 3,682 |
| | 543 |
| | — |
| | 44,433 |
|
| RMBS | 30,368 |
| | 1,222 |
| | 232 |
| | (40 | ) | | 31,398 |
| | 28,393 |
| | 1,039 |
| | 410 |
| | (10 | ) | | 29,032 |
|
| State and political subdivision | 10,754 |
| | 1,615 |
| | 24 |
| | — |
| | 12,345 |
| | 10,977 |
| | 1,340 |
| | 85 |
| | 1 |
| | 12,231 |
|
| ABS | 11,702 |
| | 114 |
| | 42 |
| | 3 |
| | 11,771 |
| | 11,266 |
| | 90 |
| | 128 |
| | 3 |
| | 11,225 |
|
| CMBS | 7,925 |
| | 251 |
| | 44 |
| | — |
| | 8,132 |
| | 7,294 |
| | 237 |
| | 71 |
| | — |
| | 7,460 |
|
| Total fixed maturity securities | $ | 286,684 |
|
| $ | 24,276 |
|
| $ | 2,103 |
|
| $ | (37 | ) |
| $ | 308,894 |
|
| $ | 271,701 |
|
| $ | 21,801 |
|
| $ | 3,946 |
|
| $ | (7 | ) |
| $ | 289,563 |
|
| Equity securities: | | | | | | | | | | | | | | | | | | | |
| Common stock | $ | 1,883 |
| | $ | 379 |
| | $ | 20 |
| | $ | — |
| | $ | 2,242 |
| | $ | 1,827 |
| | $ | 464 |
| | $ | 13 |
| | $ | — |
| | $ | 2,278 |
|
| Non-redeemable preferred stock | 503 |
| | 36 |
| | 5 |
| | — |
| | 534 |
| | 637 |
| | 19 |
| | 40 |
| | — |
| | 616 |
|
| Total equity securities | $ | 2,386 |
|
| $ | 415 |
|
| $ | 25 |
|
| $ | — |
|
| $ | 2,776 |
|
| $ | 2,464 |
|
| $ | 483 |
|
| $ | 53 |
|
| $ | — |
|
| $ | 2,894 |
|
__________________
| |
(1) | Noncredit OTTI losses included in AOCI in an unrealized gain position are due to increases in estimated fair value subsequent to initial recognition of noncredit losses on such securities. See also “— Net Unrealized Investment Gains (Losses).” |
The Company held non-income producing fixed maturity securities with an estimated fair value of $4 million and $1 million, and(1)Excludes gross unrealized gains (losses) related to assets held-for-sale; these unrealized gains (losses) are included in AOCI as no component of ($3) million and ($3) million, at September 30, 2017 and December 31, 2016, respectively.equity is held-for-sale. See Note 3 for information on the Company’s business dispositions.
Maturities of Fixed Maturity Securities AFS
The amortized cost, net of allowance for credit loss (“ACL”), and estimated fair value of fixed maturity securities AFS, by contractual maturity date, were as follows at SeptemberJune 30, 2017:2021:
| | | | | | | | | | | | | | | | | | | | | | | | | | | | | | | | | | | | | | |
| | Due in One
Year or Less | | Due After
One Year
Through
Five Years | | Due After
Five Years
Through
Ten Years | | Due After
Ten Years | | Structured
Products | | Total Fixed
Maturity
Securities AFS |
| | (In millions) |
| Amortized cost, net of ACL | | $ | 10,526 | | | $ | 52,424 | | | $ | 57,986 | | | $ | 129,880 | | | $ | 56,187 | | | $ | 307,003 | |
| Estimated fair value | | $ | 10,670 | | | $ | 55,246 | | | $ | 64,867 | | | $ | 151,302 | | | $ | 58,610 | | | $ | 340,695 | |
|
| | | | | | | | | | | | | | | | | | | | | | | | |
| | | Due in One
Year or Less | | Due After
One Year
Through
Five Years | | Due After Five Years Through Ten Years | | Due After Ten Years | | Structured Securities | | Total Fixed Maturity Securities |
| | | (In millions) |
| Amortized cost | | $ | 12,720 |
| | $ | 63,453 |
| | $ | 60,957 |
| | $ | 99,559 |
| | $ | 49,995 |
| | $ | 286,684 |
|
| Estimated fair value | | $ | 12,827 |
| | $ | 66,568 |
| | $ | 64,549 |
| | $ | 113,649 |
| | $ | 51,301 |
| | $ | 308,894 |
|
MetLife, Inc.
Notes to the Interim Condensed Consolidated Financial Statements (Unaudited) — (continued)
6. Investments (continued)
Actual maturities may differ from contractual maturities due to the exercise of call or prepayment options. Fixed maturity securities AFS not due at a single maturity date have been presented in the year of final contractual maturity. Structured SecuritiesProducts are shown separately, as they are not due at a single maturity.
MetLife, Inc.
Notes to the Interim Condensed Consolidated Financial Statements (Unaudited) — (continued)
6. Investments (continued)
Continuous Gross Unrealized Losses for Fixed Maturity and Equity Securities AFS by Sector
The following table presents the estimated fair value and gross unrealized losses of fixed maturity and equity securities AFS in an unrealized loss position aggregatedwithout an ACL by sector and aggregated by length of time that the securities have been in a continuous unrealized loss position at:position.
| | | | | | | | | | | | | | | | | | | | | | | | | | | | | | | | | | | | | | | | | | | | | | | | | | |
| | June 30, 2021 | | December 31, 2020 |
| | Less than 12 Months | | Equal to or Greater
than 12 Months | | Less than 12 Months | | Equal to or Greater
than 12 Months |
| Sector & Credit Quality | | Estimated
Fair
Value | | Gross
Unrealized
Losses (1) | | Estimated
Fair
Value | | Gross
Unrealized
Losses (1) | | Estimated
Fair
Value | | Gross
Unrealized
Losses (1) | | Estimated
Fair
Value | | Gross
Unrealized
Losses (1) |
| | (Dollars in millions) |
| U.S. corporate | | $ | 5,081 | | | $ | 169 | | | $ | 1,278 | | | $ | 77 | | | $ | 4,338 | | | $ | 196 | | | $ | 506 | | | $ | 50 | |
| Foreign government | | 8,679 | | | 409 | | | 2,751 | | | 338 | | | 6,795 | | | 305 | | | 836 | | | 100 | |
| Foreign corporate | | 5,915 | | | 275 | | | 1,991 | | | 178 | | | 4,856 | | | 321 | | | 1,255 | | | 147 | |
| U.S. government and agency | | 10,982 | | | 318 | | | 144 | | | 17 | | | 4,619 | | | 87 | | | 33 | | | 2 | |
| RMBS | | 5,353 | | | 98 | | | 442 | | | 18 | | | 1,531 | | | 27 | | | 152 | | | 14 | |
| ABS | | 3,105 | | | 13 | | | 1,078 | | | 16 | | | 3,428 | | | 26 | | | 2,842 | | | 49 | |
| Municipals | | 554 | | | 13 | | | 6 | | | 0 | | | 273 | | | 6 | | | 0 | | | 0 | |
| CMBS | | 815 | | | 14 | | | 763 | | | 27 | | | 1,887 | | | 63 | | | 612 | | | 39 | |
| Total fixed maturity securities AFS | | $ | 40,484 | | | $ | 1,309 | | | $ | 8,453 | | | $ | 671 | | | $ | 27,727 | | | $ | 1,031 | | | $ | 6,236 | | | $ | 401 | |
| Investment grade | | $ | 38,324 | | | $ | 1,225 | | | $ | 7,132 | | | $ | 548 | | | $ | 24,572 | | | $ | 829 | | | $ | 5,841 | | | $ | 350 | |
| Below investment grade | | 2,160 | | | 84 | | | 1,321 | | | 123 | | | 3,155 | | | 202 | | | 395 | | | 51 | |
| Total fixed maturity securities AFS | | $ | 40,484 | | | $ | 1,309 | | | $ | 8,453 | | | $ | 671 | | | $ | 27,727 | | | $ | 1,031 | | | $ | 6,236 | | | $ | 401 | |
| Total number of securities in an unrealized loss position | | 2,939 | | | | | 827 | | | | | 2,177 | | | | | 690 | | | |
|
| | | | | | | | | | | | | | | | | | | | | | | | | | | | | | | | |
| | | September 30, 2017 | | December 31, 2016 |
| | | Less than 12 Months | | Equal to or Greater than 12 Months | | Less than 12 Months | | Equal to or Greater than 12 Months |
| | | Estimated Fair Value | | Gross Unrealized Losses | | Estimated Fair Value | | Gross Unrealized Losses | | Estimated Fair Value | | Gross Unrealized Losses | | Estimated Fair Value | | Gross Unrealized Losses |
| | | (Dollars in millions) |
| Fixed maturity securities: | | | | | | | | | | | | | | | | |
| U.S. corporate | | $ | 6,647 |
| | $ | 161 |
| | $ | 3,015 |
| | $ | 232 |
| | $ | 11,471 |
| | $ | 466 |
| | $ | 2,938 |
| | $ | 298 |
|
| Foreign government | | 6,856 |
| | 202 |
| | 1,669 |
| | 113 |
| | 5,955 |
| | 260 |
| | 918 |
| | 113 |
|
| Foreign corporate | | 5,856 |
| | 149 |
| | 6,137 |
| | 601 |
| | 10,147 |
| | 573 |
| | 5,493 |
| | 998 |
|
| U.S. government and agency | | 19,305 |
| | 275 |
| | 362 |
| | 28 |
| | 9,104 |
| | 523 |
| | 141 |
| | 20 |
|
| RMBS | | 7,731 |
| | 106 |
| | 2,025 |
| | 86 |
| | 9,449 |
| | 291 |
| | 1,800 |
| | 109 |
|
| State and political subdivision | | 560 |
| | 13 |
| | 165 |
| | 11 |
| | 1,747 |
| | 80 |
| | 56 |
| | 6 |
|
| ABS | | 1,976 |
| | 5 |
| | 921 |
| | 40 |
| | 2,224 |
| | 28 |
| | 2,328 |
| | 103 |
|
| CMBS | | 1,555 |
| | 12 |
| | 337 |
| | 32 |
| | 998 |
| | 22 |
| | 564 |
| | 49 |
|
| Total fixed maturity securities | | $ | 50,486 |
| | $ | 923 |
| | $ | 14,631 |
| | $ | 1,143 |
| | $ | 51,095 |
| | $ | 2,243 |
| | $ | 14,238 |
| | $ | 1,696 |
|
| Equity securities: | |
| |
| |
| |
| |
| |
| |
| |
|
| Common stock | | $ | 133 |
| | $ | 20 |
| | $ | 4 |
| | $ | — |
| | $ | 105 |
| | $ | 13 |
| | $ | 11 |
| | $ | — |
|
| Non-redeemable preferred stock | | — |
| | — |
| | 82 |
| | 5 |
| | 139 |
| | 7 |
| | 125 |
| | 33 |
|
| Total equity securities | | $ | 133 |
| | $ | 20 |
| | $ | 86 |
| | $ | 5 |
| | $ | 244 |
| | $ | 20 |
| | $ | 136 |
| | $ | 33 |
|
| Total number of securities in an unrealized loss position | | 3,249 |
| |
| | 1,638 |
| |
| | 3,580 |
| |
| | 1,307 |
| |
|
(1)Excludes gross unrealized losses related to assets held-for-sale; these unrealized losses are included in AOCI as no component of equity is held-for-sale. See Note 3 for information on the Company’s business dispositions.
Evaluation of Fixed Maturity Securities AFS Securities for OTTICredit Loss
Evaluation and Evaluating Temporarily Impaired AFS SecuritiesMeasurement Methodologies
As described more fullyManagement considers a wide range of factors about the security issuer and uses its best judgment in Notes 1 and 8evaluating the cause of the decline in the estimated fair value of the security and in assessing the prospects for near-term recovery. Inherent in management’s evaluation of the security are assumptions and estimates about the operations of the issuer and its future earnings potential. Considerations used in the credit loss evaluation process include, but are not limited to: (i) the extent to which the estimated fair value has been below amortized cost, (ii) adverse conditions specifically related to a security, an industry sector or sub-sector, or an economically depressed geographic area, adverse change in the financial condition of the issuer of the security, changes in technology, discontinuance of a segment of the business that may affect future earnings, and changes in the quality of credit enhancement, (iii) payment structure of the security and likelihood of the issuer being able to make payments, (iv) failure of the issuer to make scheduled interest and principal payments, (v) whether the issuer, or series of issuers or an industry has suffered a catastrophic loss or has exhausted natural resources, (vi) whether the Company has the intent to sell or will more likely than not be required to sell a particular security before the decline in estimated fair value below amortized cost recovers, (vii) with respect to Structured Products, changes in forecasted cash flows after considering the changes in the financial condition of the underlying loan obligors and quality of underlying collateral, expected prepayment speeds, current and forecasted loss severity, consideration of the payment terms of the underlying assets backing a particular security, and the payment priority within the tranche structure of the security, (viii) changes in the rating of the security by a rating agency, and (ix) other subjective factors, including concentrations and information obtained from regulators.
MetLife, Inc.
Notes to the Interim Condensed Consolidated Financial Statements included(Unaudited) — (continued)
6. Investments (continued)
The methodology and significant inputs used to determine the amount of credit loss are as follows:
•The Company calculates the recovery value by performing a discounted cash flow analysis based on the present value of future cash flows. The discount rate is generally the effective interest rate of the security at the time of purchase for fixed-rate securities and the spot rate at the date of evaluation of credit loss for floating-rate securities.
•When determining collectability and the period over which value is expected to recover, the Company applies considerations utilized in its overall credit loss evaluation process which incorporates information regarding the specific security, fundamentals of the industry and geographic area in which the security issuer operates, and overall macroeconomic conditions. Projected future cash flows are estimated using assumptions derived from management’s single best estimate, the most likely outcome in a range of possible outcomes, after giving consideration to a variety of variables that include, but are not limited to: payment terms of the security; the likelihood that the issuer can service the interest and principal payments; the quality and amount of any credit enhancements; the security’s position within the capital structure of the issuer; possible corporate restructurings or asset sales by the issuer; any private and public sector programs to restructure foreign government securities and municipals; and changes to the rating of the security or the issuer by rating agencies.
•Additional considerations are made when assessing the unique features that apply to certain Structured Products including, but not limited to: the quality of underlying collateral, historical performance of the underlying loan obligors, historical rent and vacancy levels, changes in the 2016 Annual Report,financial condition of the Company performsunderlying loan obligors, expected prepayment speeds, current and forecasted loss severity, consideration of the payment terms of the underlying loans or assets backing a regular evaluationparticular security, changes in the quality of all investment classes for impairment, including fixed maturitycredit enhancement and the payment priority within the tranche structure of the security.
With respect to securities that have attributes of debt and equity (“perpetual hybrid securities”), consideration is given in the credit loss analysis as to whether there has been any deterioration in the credit of the issuer and the likelihood of recovery in value of the securities andthat are in a severe unrealized loss position. Consideration is also given as to whether any perpetual hybrid securities with an unrealized loss, regardless of credit rating, have deferred any dividend payments.
In periods subsequent to the recognition of an initial ACL on a security, the Company reassesses credit loss quarterly. Subsequent increases or decreases in accordancethe expected cash flow from the security result in corresponding decreases or increases in the ACL which are recorded within net investment gains (losses); however, the previously recorded ACL is not reduced to an amount below zero. Full or partial write-offs are deducted from the ACL in the period the security, or a portion thereof, is considered uncollectible. Recoveries of amounts previously written off are recorded to the ACL in the period received. When the Company has the intent to sell the security or it is more likely than not that the Company will be required to sell the security before recovery of its amortized cost, any ACL is written off and the amortized cost is written down to estimated fair value through a charge within net investment gains (losses), which becomes the new amortized cost of the security.
Evaluation of Fixed Maturity Securities AFS in an Unrealized Loss Position
Gross unrealized losses on securities without an ACL increased $548 million for the six months ended June 30, 2021 to $2.0 billion primarily due to increases in interest rates, partially offset by narrowing credit spreads.
Gross unrealized losses on securities without an ACL that have been in a continuous gross unrealized loss position for 12 months or greater were $671 million at June 30, 2021, or 34% of the total gross unrealized losses on securities without an ACL.
Investment Grade Fixed Maturity Securities AFS
Of the $671 million of gross unrealized losses on securities without an ACL that have been in a continuous gross unrealized loss position for 12 months or greater, $548 million, or 82%, were related to 641 investment grade securities. Unrealized losses on investment grade securities are principally related to widening credit spreads since purchase and, with its impairment policy,respect to fixed-rate securities, rising interest rates since purchase.
MetLife, Inc.
Notes to the Interim Condensed Consolidated Financial Statements (Unaudited) — (continued)
6. Investments (continued)
Below Investment Grade Fixed Maturity Securities AFS
Of the $671 million of gross unrealized losses on securities without an ACL that have been in ordera continuous gross unrealized loss position for 12 months or greater, $123 million, or 18%, were related to evaluate whether186 below investment grade securities. Unrealized losses on below investment grade securities are principally related to U.S. and foreign corporate securities (primarily industrial and consumer), foreign government securities and CMBS and are the result of significantly wider credit spreads resulting from higher risk premiums since purchase, largely due to economic and market uncertainty, as well as, with respect to fixed-rate securities, rising interest rates since purchase. Management evaluates U.S. corporate and foreign corporate securities based on factors such investments are other-than-temporarily impaired.as expected cash flows, financial condition and near-term and long-term prospects of the issuers. Management evaluates CMBS based on actual and projected cash flows after considering the quality of underlying collateral, credit enhancements, expected prepayment speeds, current and forecasted loss severity, the payment terms of the underlying assets backing a particular security and the payment priority within the tranche structure of the security. Management evaluates foreign government securities based on factors impacting the issuers such as expected cash flows, financial condition of the issuers and any country specific economic conditions or public sector programs to restructure foreign government securities.
Current Period Evaluation
At June 30, 2021, with respect to securities in an unrealized loss position without an ACL, the Company did not intend to sell these securities, and it was not more likely than not that the Company would be required to sell these securities before the anticipated recovery of the remaining amortized cost. Based on the Company’s current evaluation of its AFS securities in an unrealized loss position in accordance with its impairment policy, and the Company’s current intentions and assessments (as applicable to the type of security) about holding, selling and any requirements to sell these securities,without an ACL, the Company concluded that these securities werehad not other-than-temporarily impairedincurred a credit loss and should not have an ACL at SeptemberJune 30, 2017. 2021.
Future OTTIprovisions for credit loss will depend primarily on economic fundamentals, issuer performance (including changes in the present value of future cash flows expected to be collected), changes in credit ratings and collateral valuation, interest rates and credit spreads, as well as a change in the Company’s intention to hold or sell a security that is in an unrealized loss position. If economic fundamentals deteriorate or if there are adverse changes in the above factors, OTTI may be incurred in upcoming periods.valuation.
Gross unrealized losses onRollforward of Allowance for Credit Loss for Fixed Maturity Securities AFS By Sector
The rollforward of ACL for fixed maturity securities decreased $1.9 billion during the nine months endedSeptember 30, 2017to$2.1 billion. The decrease in gross unrealized losses for the nine months ended September 30, 2017 was primarily attributable to decreasing longer-term interest rates and narrowing credit spreads, and to a lesser extent the impact of strengthening foreign currencies on non-functional currency denominated fixed maturity securities.AFS by sector is as follows:
| | | | | | | | | | | | | | | | | | | | | | | | | | | | | | | | | | | | | | | | | |
| U.S.
Corporate | | Foreign
Government | | Foreign
Corporate | | | | RMBS | | | | | | CMBS | | Total |
| Three Months Ended June 30, 2021 | (In millions) |
| | | | | | | | | | | | | | | | | |
| Balance, at beginning of period | $ | 43 | | | $ | 21 | | | $ | 33 | | | | | $ | 0 | | | | | | | $ | 7 | | | $ | 104 | |
| Additions: | | | | | | | | | | | | | | | | | |
| ACL not previously recorded | 0 | | | 0 | | | 4 | | | | | 0 | | | | | | | 4 | | | 8 | |
| | | | | | | | | | | | | | | | | |
| Changes for securities with previously recorded ACL | 4 | | | 0 | | | (1) | | | | | 0 | | | | | | | (4) | | | (1) | |
| | | | | | | | | | | | | | | | | |
| Securities sold or exchanged | (8) | | | 0 | | | (4) | | | | | 0 | | | | | | | 0 | | | (12) | |
| Securities intended/required to be sold prior to recovery of amortized cost basis | 0 | | | 0 | | | 0 | | | | | 0 | | | | | | | 0 | | | 0 | |
| | | | | | | | | | | | | | | | | |
| | | | | | | | | | | | | | | | | |
| | | | | | | | | | | | | | | | | |
| Balance, at end of period | $ | 39 | | | $ | 21 | | | $ | 32 | | | | | $ | 0 | | | | | | | $ | 7 | | | $ | 99 | |
| Three Months Ended June 30, 2020 | | | | | | | | | | | | | | | | | |
| Balance, at beginning of period | $ | 51 | | | $ | 136 | | | $ | 0 | | | | | $ | 0 | | | | | | | $ | 0 | | | $ | 187 | |
| Additions: | | | | | | | | | | | | | | | | | |
| ACL not previously recorded | 7 | | | 3 | | | 16 | | | | | 2 | | | | | | | 0 | | | 28 | |
| | | | | | | | | | | | | | | | | |
| Changes for securities with previously recorded ACL | (7) | | | (4) | | | 0 | | | | | 0 | | | | | | | 0 | | | (11) | |
| | | | | | | | | | | | | | | | | |
| Securities sold or exchanged | (20) | | | (6) | | | 0 | | | | | 0 | | | | | | | 0 | | | (26) | |
| Securities intended/required to be sold prior to recovery of amortized cost basis | (1) | | | 0 | | | 0 | | | | | 0 | | | | | | | 0 | | | (1) | |
| | | | | | | | | | | | | | | | | |
| | | | | | | | | | | | | | | | | |
| | | | | | | | | | | | | | | | | |
| Balance, at end of period | $ | 30 | | | $ | 129 | | | $ | 16 | | | | | $ | 2 | | | | | | | $ | 0 | | | $ | 177 | |
MetLife, Inc.
Notes to the Interim Condensed Consolidated Financial Statements (Unaudited) — (continued)
6. Investments (continued)
| | | | | | | | | | | | | | | | | | | | | | | | | | | | | | | | | | | | | | | | | |
| U.S.
Corporate | | Foreign
Government | | Foreign
Corporate | | | | RMBS | | | | | | CMBS | | Total |
| Six Months Ended June 30, 2021 | (In millions) |
| Balance, at beginning of period | $ | 44 | | | $ | 21 | | | $ | 16 | | | | | $ | 0 | | | | | | | $ | 0 | | | $ | 81 | |
| Additions: | | | | | | | | | | | | | | | | | |
| ACL not previously recorded | 0 | | | 0 | | | 25 | | | | | 0 | | | | | | | 11 | | | 36 | |
| | | | | | | | | | | | | | | | | |
| Changes for securities with previously recorded ACL | 3 | | | 0 | | | (5) | | | | | 0 | | | | | | | (4) | | | (6) | |
| | | | | | | | | | | | | | | | | |
| Securities sold or exchanged | (8) | | | 0 | | | (4) | | | | | 0 | | | | | | | 0 | | | (12) | |
| Securities intended/required to be sold prior to recovery of amortized cost basis | 0 | | | 0 | | | 0 | | | | | 0 | | | | | | | 0 | | | 0 | |
| | | | | | | | | | | | | | | | | |
| | | | | | | | | | | | | | | | | |
| | | | | | | | | | | | | | | | | |
| Balance, at end of period | $ | 39 | | | $ | 21 | | | $ | 32 | | | | | $ | 0 | | | | | | | $ | 7 | | | $ | 99 | |
| Six Months Ended June 30, 2020 | | | | | | | | | | | | | | | | | |
| Balance, at beginning of period | $ | 0 | | | $ | 0 | | | $ | 0 | | | | | $ | 0 | | | | | | | $ | 0 | | | $ | 0 | |
| Additions: | | | | | | | | | | | | | | | | | |
| ACL not previously recorded | 58 | | | 139 | | | 16 | | | | | 2 | | | | | | | 0 | | | 215 | |
| | | | | | | | | | | | | | | | | |
| Changes for securities with previously recorded ACL | (7) | | | (4) | | | 0 | | | | | 0 | | | | | | | 0 | | | (11) | |
| | | | | | | | | | | | | | | | | |
| Securities sold or exchanged | (20) | | | (6) | | | 0 | | | | | 0 | | | | | | | 0 | | | (26) | |
| Securities intended/required to be sold prior to recovery of amortized cost basis | (1) | | | 0 | | | 0 | | | | | 0 | | | | | | | 0 | | | (1) | |
| | | | | | | | | | | | | | | | | |
| | | | | | | | | | | | | | | | | |
| Balance, at end of period | $ | 30 | | | $ | 129 | | | $ | 16 | | | | | $ | 2 | | | | | | | $ | 0 | | | $ | 177 | |
At September 30, 2017, $117 million of the total $2.1 billion of gross unrealized losses were from 46 fixed maturityEquity Securities
Equity securities include common and preferred stock which are reported at estimated fair value, with an unrealized loss position of 20% or more of amortized costchanges in estimated fair value included in net investment gains (losses). See Note 8 for six months or greater.further information.
Gross unrealized losses onContractholder-Directed Equity Securities and Fair Value Option Securities
Contractholder-directed equity securities decreased $28 million duringand FVO securities (“FVO Securities”) (collectively, “Unit-linked and FVO Securities”) include three categories of investments for which the nine months ended September 30, 2017FVO has been elected, or are otherwise required to $25 million.be carried at estimated fair value, with changes in estimated fair value included in net income. See Note 8 for further information.
Investment Grade Fixed Maturity Securities
Of the $117 million of gross unrealized losses on fixed maturity securities with an unrealized loss of 20% or more of amortized cost for six months or greater, $75 million, or 64%, were related to gross unrealized losses on 19 investment grade fixed maturity securities. Unrealized losses on investment grade fixed maturity securities are principally related to widening credit spreads since purchase and, with respect to fixed-rate fixed maturity securities, rising interest rates since purchase.
Below Investment Grade Fixed Maturity Securities
Of the $117 million of gross unrealized losses on fixed maturity securities with an unrealized loss of 20% or more of amortized cost for six months or greater, $42 million, or 36%, were related to gross unrealized losses on 27 below investment grade fixed maturity securities. Unrealized losses on below investment grade fixed maturity securities are principally related to U.S. and foreign corporate securities (primarily industrial and utility securities) and are the result of significantly wider credit spreads resulting from higher risk premiums since purchase, largely due to economic and market uncertainty including concerns over lower oil prices in the energy sector. Management evaluates U.S. and foreign corporate securities based on factors such as expected cash flows and the financial condition and near-term and long-term prospects of the issuers.
Mortgage Loans
Mortgage Loans by Portfolio Segment
Mortgage loans are summarized as follows at:
| | | | | | | | | | | | | | | | | | | | | | | | | | |
| | | June 30, 2021 | | December 31, 2020 |
| Portfolio Segment | | Carrying
Value | | % of
Total | | Carrying
Value | | % of
Total |
| | (Dollars in millions) |
| Commercial | | $ | 51,602 | | | 63.3 | % | | $ | 52,434 | | | 62.5 | % |
| Agricultural | | 18,044 | | | 22.1 | | | 18,128 | | | 21.6 | |
| Residential | | 12,281 | | | 15.1 | | | 13,782 | | | 16.4 | |
| Total amortized cost | | 81,927 | | | 100.5 | | | 84,344 | | | 100.5 | |
| Allowance for credit loss | | (570) | | | (0.7) | | | (590) | | | (0.7) | |
| Subtotal mortgage loans, net | | 81,357 | | | 99.8 | | | 83,754 | | | 99.8 | |
| Residential — FVO | | 140 | | | 0.2 | | | 165 | | | 0.2 | |
| | | | | | | | |
| | | | | | | | |
| Total mortgage loans, net | | $ | 81,497 | | | 100.0 | % | | $ | 83,919 | | | 100.0 | % |
|
| | | | | | | | | | | | | |
| | September 30, 2017 | | December 31, 2016 |
| | Carrying Value | | % of
Total | | Carrying Value | | % of
Total |
| | (Dollars in millions) |
| Mortgage loans: | | | | | | | |
| Commercial | $ | 43,243 |
| | 63.6 | % | | $ | 41,512 |
| | 63.7 | % |
| Agricultural | 12,967 |
| | 19.1 |
| | 12,564 |
| | 19.3 |
|
| Residential | 11,599 |
| | 17.0 |
| | 10,829 |
| | 16.6 |
|
| Subtotal (1) | 67,809 |
| | 99.7 |
| | 64,905 |
| | 99.6 |
|
| Valuation allowances | (316 | ) | | (0.5 | ) | | (304 | ) | | (0.5 | ) |
| Subtotal mortgage loans, net | 67,493 |
| | 99.2 |
| | 64,601 |
| | 99.1 |
|
| Residential — FVO | 564 |
| | 0.8 |
| | 566 |
| | 0.9 |
|
| Total mortgage loans, net | $ | 68,057 |
| | 100.0 | % | | $ | 65,167 |
| | 100.0 | % |
__________________
| |
(1) | Purchases of mortgage loans, primarily residential, were $411 million and $1.9 billionfor the three monthsand nine months endedSeptember 30, 2017, respectively, and $733 millionand$1.9 billionfor thethree monthsand nine months endedSeptember 30, 2016, respectively.
|
The Company elects the FVO for certain residential mortgage loans that are managed on a total return basis. See Note 8 for further information.
MetLife, Inc.
Notes to the Interim Condensed Consolidated Financial Statements (Unaudited) — (continued)
6. Investments (continued)
Mortgage Loans, Valuation Allowance and Impaired Loans by Portfolio Segment
Mortgage loans by portfolio segment, by methodThe amount of evaluation of credit loss, impairednet discounts, included within total amortized cost, primarily attributable to residential mortgage loans including those modified in a troubled debt restructuring,was $843 million and the related valuation allowances, were as follows at:
|
| | | | | | | | | | | | | | | | | | | | | | | | | | | | | | | | |
| | | Evaluated Individually for Credit Losses | | Evaluated Collectively for Credit Losses | | Impaired Loans |
| | | Impaired Loans with a Valuation Allowance | | Impaired Loans without a Valuation Allowance | | | | | | |
| | | Unpaid Principal Balance | | Recorded Investment | | Valuation
Allowances | | Unpaid Principal Balance | | Recorded
Investment | | Recorded
Investment | | Valuation
Allowances | | Carrying
Value |
| | | (In millions) |
| September 30, 2017 | | | | | | | | | | | | | | | | |
| Commercial | | $ | — |
| | $ | — |
| | $ | — |
| | $ | — |
| | $ | — |
| | $ | 43,243 |
| | $ | 213 |
| | $ | — |
|
| Agricultural | | 22 |
| | 21 |
| | 2 |
| | 28 |
| | 28 |
| | 12,918 |
| | 39 |
| | 47 |
|
| Residential | | — |
| | — |
| | — |
| | 335 |
| | 304 |
| | 11,295 |
| | 62 |
| | 304 |
|
| Total | | $ | 22 |
|
| $ | 21 |
|
| $ | 2 |
|
| $ | 363 |
|
| $ | 332 |
|
| $ | 67,456 |
|
| $ | 314 |
|
| $ | 351 |
|
| December 31, 2016 | | | | | | | | | | | | | | | | |
| Commercial | | $ | — |
| | $ | — |
| | $ | — |
| | $ | 12 |
| | $ | 12 |
| | $ | 41,500 |
| | $ | 202 |
| | $ | 12 |
|
| Agricultural | | 11 |
| | 10 |
| | 1 |
| | 27 |
| | 27 |
| | 12,527 |
| | 38 |
| | 36 |
|
| Residential | | — |
| | — |
| | — |
| | 265 |
| | 241 |
| | 10,588 |
| | 63 |
| | 241 |
|
| Total | | $ | 11 |
|
| $ | 10 |
|
| $ | 1 |
|
| $ | 304 |
|
| $ | 280 |
|
| $ | 64,615 |
|
| $ | 303 |
|
| $ | 289 |
|
$944 million at June 30, 2021 and December 31, 2020, respectively. The average recorded investmentaccrued interest income excluded from total amortized cost for impaired commercial, agricultural and residential mortgage loans at June 30, 2021 and December 31, 2020 was $0, $31$193 million and $297$209 million; $156 million respectively,and $174 million; and $100 million and $108 million, respectively.
Purchases of mortgage loans, consisting primarily of residential mortgage loans, were $532 million and $986 million for the three months and six months ended SeptemberJune 30, 2017;2021, respectively, and $6 million, $28$417 million and $275 million, respectively, for the nine months ended September 30, 2017.
The average recorded investment for impaired commercial, agricultural and residential mortgage loans was $90 million, $49 million and $202 million, respectively,$1.7 billion for the three months ended September 30, 2016; and $109 million, $53 million and $174 million, respectively, for the ninesix months ended SeptemberJune 30, 2016.2020, respectively.
Valuation Allowance for Credit Loss Rollforward by Portfolio Segment
The changes in the valuation allowance,ACL, by portfolio segment, were as follows:
| | | | | | | | | | | | | | | | | | | | | | | | | | | | | | | | | | | | | | | | | | | | | | | |
| Six Months
Ended
June 30, |
| 2021 | | 2020 |
| Commercial | | Agricultural | | Residential | | Total | | Commercial | | Agricultural | | Residential | | Total |
| (In millions) |
| Balance, beginning of period | $ | 252 | | | $ | 106 | | | $ | 232 | | | $ | 590 | | | $ | 246 | | | $ | 52 | | | $ | 55 | | | $ | 353 | |
| Provision (release) | 22 | | | (7) | | | (23) | | | (8) | | | 47 | | | 6 | | | 62 | | | 115 | |
| Adoption of credit loss guidance | 0 | | | 0 | | | 0 | | | 0 | | | (118) | | | 35 | | | 161 | | | 78 | |
| Initial credit losses on PCD loans (1) | 0 | | | 0 | | | 2 | | | 2 | | | 0 | | | 0 | | | 16 | | | 16 | |
| Charge-offs, net of recoveries | 0 | | | (13) | | | (1) | | | (14) | | | 0 | | | (2) | | | (5) | | | (7) | |
| | | | | | | | | | | | | | | |
| Balance, end of period | $ | 274 | | | $ | 86 | | | $ | 210 | | | $ | 570 | | | $ | 175 | | | $ | 91 | | | $ | 289 | | | $ | 555 | |
_________________ |
| | | | | | | | | | | | | | | | | | | | | | | | | | | | | | | |
| | Nine Months
Ended
September 30, |
| | 2017 | | 2016 |
| | Commercial | | Agricultural | | Residential | | Total | | Commercial | | Agricultural | | Residential | | Total |
| | (In millions) |
| Balance, beginning of period | $ | 202 |
| | $ | 39 |
| | $ | 63 |
| | $ | 304 |
| | $ | 188 |
| | $ | 37 |
| | $ | 56 |
| | $ | 281 |
|
| Provision (release) (1) | 11 |
| | 4 |
| | 10 |
| | 25 |
| | 149 |
| | 3 |
| | 11 |
| | 163 |
|
| Charge-offs, net of recoveries (1) | — |
| | (2 | ) | | (11 | ) | | (13 | ) | | (143 | ) | | (2 | ) | | (12 | ) | | (157 | ) |
| Balance, end of period | $ | 213 |
|
| $ | 41 |
|
| $ | 62 |
|
| $ | 316 |
|
| $ | 194 |
|
| $ | 38 |
|
| $ | 55 |
|
| $ | 287 |
|
__________________Allowance for Credit Loss Methodology
| |
(1) | In connection with an acquisition in 2010, certain impaired commercial mortgage loans were acquired and, accordingly, were not originated by the Company. Such commercial mortgage loans have been accounted for as purchased credit impaired (“PCI”) commercial mortgage loans. Decreases in cash flows expected to be collected on PCI commercial mortgage loans can result in provisions for losses on mortgage loans. For the nine months ended September 30, 2016, in connection with the maturity of an acquired PCI commercial mortgage loan, an increase to the commercial mortgage loan valuation allowance of $143 million was recorded and charged-off upon maturity. The Company has recovered a substantial portion of the loss on the loan incurred through an indemnification agreement entered into in connection with the acquisition in 2010. |
The Company records an allowance for expected lifetime credit loss in an amount that represents the portion of the amortized cost basis of mortgage loans that the Company does not expect to collect, resulting in mortgage loans being presented at the net amount expected to be collected. In determining the Company’s ACL, management: (i) pools mortgage loans that share similar risk characteristics, (ii) considers expected lifetime credit loss over the contractual term of its mortgage loans adjusted for expected prepayments and any extensions, and (iii) considers past events and current and forecasted economic conditions. Each of the Company’s commercial, agricultural and residential mortgage loan portfolio segments are evaluated separately. The ACL is calculated for each mortgage loan portfolio segment based on inputs unique to each loan portfolio segment. On a quarterly basis, mortgage loans within a portfolio segment that share similar risk characteristics, such as internal risk ratings or consumer credit scores, are pooled for calculation of ACL. On an ongoing basis, mortgage loans with dissimilar risk characteristics (i.e., loans with significant declines in credit quality), collateral dependent mortgage loans (i.e., when the borrower is experiencing financial difficulty, including when foreclosure is reasonably possible or probable) and reasonably expected troubled debt restructurings (“TDRs”) (i.e., the Company grants concessions to borrower that is experiencing financial difficulties) are evaluated individually for credit loss. The ACL for loans evaluated individually are established using the same methodologies for all three portfolio segments. For example, the ACL for a collateral dependent loan is established as the excess of amortized cost over the estimated fair value of the loan’s underlying collateral, less selling cost when foreclosure is probable. Accordingly, the change in the estimated fair value of collateral dependent loans, which are evaluated individually for credit loss, is recorded as a change in the ACL which is recorded on a quarterly basis as a charge or credit to earnings in net investment gains (losses).
MetLife, Inc.
Notes to the Interim Condensed Consolidated Financial Statements (Unaudited) — (continued)
6. Investments (continued)
Commercial and Agricultural Mortgage Loan Portfolio Segments
Credit QualityCommercial and agricultural mortgage loan ACL are calculated in a similar manner. Within each loan portfolio segment, commercial and agricultural, loans are pooled by internal risk rating. Estimated lifetime loss rates, which vary by internal risk rating, are applied to the amortized cost of Commercial Mortgage Loans
Theeach loan, excluding accrued investment income, on a quarterly basis to develop the ACL. Internal risk ratings are based on an assessment of the loan’s credit quality, which can change over time. The estimated lifetime loss rates are based on several loan portfolio segment-specific factors, including (i) the Company’s experience with defaults and loss severity, (ii) expected default and loss severity over the forecast period, (iii) current and forecasted economic conditions including growth, inflation, interest rates and unemployment levels, (iv) loan specific characteristics including loan-to-value (“LTV”) ratios, and (v) internal risk ratings. These evaluations are revised as conditions change and new information becomes available. The Company uses its several decades of historical default and loss severity experience which capture multiple economic cycles. The Company uses a forecast of economic assumptions for a two-year period for most of its commercial and agricultural mortgage loans, while a one-year period is used for loans originated in certain markets. After the applicable forecast period, the Company reverts to its historical loss experience using a straight-line basis over two years. For evaluations of commercial mortgage loans, wasin addition to historical experience, management considers factors that include the impact of a rapid change to the economy, which may not be reflected in the loan portfolio, recent loss and recovery trend experience as follows at:
|
| | | | | | | | | | | | | | | | | | | | | | | | | | |
| | | Recorded Investment | | Estimated
Fair
Value | | % of Total |
| | | Debt Service Coverage Ratios | | | | % of Total | |
| | | > 1.20x | | 1.00x - 1.20x | | < 1.00x | | Total | |
| | | (Dollars in millions) |
| September 30, 2017 | | | | | | | | | | | | | | |
| Loan-to-value ratios: | | | | | | | | | | | | | | |
| Less than 65% | | $ | 37,404 |
| | $ | 1,488 |
| | $ | 222 |
| | $ | 39,114 |
| | 90.5 | % | | $ | 39,904 |
| | 90.7 | % |
| 65% to 75% | | 3,367 |
| | 168 |
| | 173 |
| | 3,708 |
| | 8.6 |
| | 3,705 |
| | 8.4 |
|
| 76% to 80% | | 217 |
| | — |
| | 57 |
| | 274 |
| | 0.6 |
| | 262 |
| | 0.6 |
|
| Greater than 80% | | — |
| | — |
| | 147 |
| | 147 |
| | 0.3 |
| | 143 |
| | 0.3 |
|
| Total | | $ | 40,988 |
|
| $ | 1,656 |
|
| $ | 599 |
|
| $ | 43,243 |
|
| 100 | % |
| $ | 44,014 |
|
| 100 | % |
| December 31, 2016 | | | | | | | | | | | | | | |
| Loan-to-value ratios: | | | | | | | | | | | | | | |
| Less than 65% | | $ | 36,067 |
| | $ | 1,077 |
| | $ | 707 |
| | $ | 37,851 |
| | 91.2 | % | | $ | 38,237 |
| | 91.5 | % |
| 65% to 75% | | 3,044 |
| | — |
| | 202 |
| | 3,246 |
| | 7.8 |
| | 3,185 |
| | 7.6 |
|
| 76% to 80% | | 195 |
| | — |
| | — |
| | 195 |
| | 0.5 |
| | 182 |
| | 0.4 |
|
| Greater than 80% | | 118 |
| | 27 |
| | 75 |
| | 220 |
| | 0.5 |
| | 213 |
| | 0.5 |
|
| Total | | $ | 39,424 |
|
| $ | 1,104 |
|
| $ | 984 |
|
| $ | 41,512 |
| | 100.0 | % | | $ | 41,817 |
| | 100.0 | % |
Credit Qualitycompared to historical loss and recovery experience, and loan specific characteristics including debt service coverage ratios (“DSCR”). In estimating expected lifetime credit loss over the term of Agricultural Mortgage Loans
The credit qualityits commercial mortgage loans, the Company adjusts for expected prepayment and extension experience during the forecast period using historical prepayment and extension experience considering the expected position in the economic cycle and the loan profile (i.e., floating rate, shorter-term fixed rate and longer-term fixed rate) and after the forecast period using long-term historical prepayment experience. For evaluations of agricultural mortgage loans, wasin addition to historical experience, management considers factors that include increased stress in certain sectors, which may be evidenced by higher delinquency rates, or a change in the number of higher risk loans. In estimating expected lifetime credit loss over the term of its agricultural mortgage loans, the Company’s experience is much less sensitive to the position in the economic cycle and by loan profile; accordingly, historical prepayment experience is used, while extension terms are not prevalent with the Company’s agricultural mortgage loans.
Commercial mortgage loans are reviewed on an ongoing basis, which review includes, but is not limited to, an analysis of the property financial statements and rent roll, lease rollover analysis, property inspections, market analysis, estimated valuations of the underlying collateral, LTV ratios, DSCR and tenant creditworthiness. The monitoring process focuses on higher risk loans, which include those that are classified as follows at:restructured, delinquent or in foreclosure, as well as loans with higher LTV ratios and lower DSCR. Agricultural mortgage loans are reviewed on an ongoing basis, which review includes, but is not limited to, property inspections, market analysis, estimated valuations of the underlying collateral, LTV ratios and borrower creditworthiness, as well as reviews on a geographic and property-type basis. The monitoring process for agricultural mortgage loans also focuses on higher risk loans.
|
| | | | | | | | | | | | | | |
| | | September 30, 2017 | | December 31, 2016 |
| | | Recorded Investment | | % of Total | | Recorded Investment | | % of Total |
| | | (Dollars in millions) |
| Loan-to-value ratios: | | | | | | | | |
| Less than 65% | | $ | 12,403 |
| | 95.6 | % | | $ | 12,023 |
| | 95.7 | % |
| 65% to 75% | | 546 |
| | 4.2 |
| | 436 |
| | 3.5 |
|
| 76% to 80% | | 9 |
| | 0.1 |
| | 17 |
| | 0.1 |
|
| Greater than 80% | | 9 |
| | 0.1 |
| | 88 |
| | 0.7 |
|
| Total | | $ | 12,967 |
| | 100.0 | % | | $ | 12,564 |
| | 100.0 | % |
For commercial mortgage loans, the primary credit quality indicator is the DSCR, which compares a property’s net operating income to amounts needed to service the principal and interest due under the loan. Generally, the lower the DSCR, the higher the risk of experiencing a credit loss. The Company also reviews the LTV ratio of its commercial mortgage loan portfolio. LTV ratios compare the unpaid principal balance of the loan to the estimated fair value of the underlying collateral. Generally, the higher the LTV ratio, the higher the risk of experiencing a credit loss. The DSCR and the values utilized in calculating the ratio are updated routinely. In addition, the LTV ratio is routinely updated for all but the lowest risk loans as part of the Company’s ongoing review of its commercial mortgage loan portfolio.
For agricultural mortgage loans, was $13.1 billion and $12.7 billion at September 30, 2017 and December 31, 2016, respectively.
Credit Quality of Residential Mortgage Loans
Thethe Company’s primary credit quality indicator is the LTV ratio. The values utilized in calculating this ratio are developed in connection with the ongoing review of residentialthe agricultural mortgage loan portfolio and are routinely updated.
Commitments to lend: After loans wasare approved, the Company makes commitments to lend and, typically, borrowers draw down on some or all of the commitments. The timing of mortgage loan funding is based on the commitment expiration dates. A liability for credit loss for unfunded commercial and agricultural mortgage loan commitments is recorded within net investment gains (losses). The liability is based on estimated lifetime loss rates as follows at:described above and the amount of the outstanding commitments, which for lines of credit, considers estimated utilization rates. When the commitment is funded or expires, the liability is adjusted accordingly.
|
| | | | | | | | | | | | | | |
| | | September 30, 2017 | | December 31, 2016 |
| | | Recorded Investment | | % of Total | | Recorded Investment | | % of Total |
| | | (Dollars in millions) |
| Performance indicators: | | | | | | | | |
| Performing | | $ | 11,169 |
| | 96.3 | % | | $ | 10,448 |
| | 96.5 | % |
| Nonperforming | | 430 |
| | 3.7 |
| | 381 |
| | 3.5 |
|
| Total | | $ | 11,599 |
| | 100.0 | % | | $ | 10,829 |
| | 100.0 | % |
MetLife, Inc.
Notes to the Interim Condensed Consolidated Financial Statements (Unaudited) — (continued)
6. Investments (continued)
Residential Mortgage Loan Portfolio Segment
The Company’s residential mortgage loan portfolio is comprised primarily of purchased closed end, amortizing residential mortgage loans, including both performing loans purchased within 12 months of origination and reperforming loans purchased after they have been performing for at least 12 months post-modification. Residential mortgage loans are pooled by loan type (i.e., new origination and reperforming) and pooled by similar risk profiles (including consumer credit score and LTV ratios). Estimated lifetime loss rates, which vary by loan type and risk profile, are applied to the amortized cost of each loan excluding accrued investment income on a quarterly basis to develop the ACL. The estimated lifetime loss rates are based on several factors, including (i) industry historical experience and expected results over the forecast period for defaults, (ii) loss severity, (iii) prepayment rates, (iv) current and forecasted economic conditions including growth, inflation, interest rates and unemployment levels, and (v) loan pool specific characteristics including consumer credit scores, LTV ratios, payment history and home prices. These evaluations are revised as conditions change and new information becomes available. The Company uses industry historical experience which captures multiple economic cycles as the Company has purchased most of its residential mortgage loans in the last five years. The Company uses a forecast of economic assumptions for a two-year period for most of its residential mortgage loans. After the applicable forecast period, the Company immediately reverts to industry historical loss experience.
For residential mortgage loans, the Company’s primary credit quality indicator is whether the loan is performing or nonperforming. The Company generally defines nonperforming residential mortgage loans as those that are 60 or more days past due and/or in nonaccrual status which is assessed monthly. Generally, nonperforming residential mortgage loans have a higher risk of experiencing a credit loss.
Mortgage Loan Concessions
In response to the adverse economic impact of the COVID-19 Pandemic, in 2021 and 2020, the Company granted concessions to certain of its commercial, agricultural and residential mortgage loan borrowers, including payment deferrals and other loan modifications. The Company has elected the option under the Coronavirus Aid, Relief, and Economic Security Act, the Consolidated Appropriations Act, 2021 and the Interagency Statement on Loan Modifications and Reporting for Financial Institutions Working with Customers Affected by the Coronavirus (Revised) issued by bank regulatory agencies, not to account for or report qualifying concessions as TDRs and not to classify such loans as either past due or nonaccrual during the payment deferral period. Additionally, in accordance with the FASB’s published response to a COVID-19 Pandemic technical inquiry, the Company continues to accrue interest income on such loans that have deferred payment. The Company records an ACL on this accrued interest income.
Commercial
For some commercial mortgage loan borrowers (principally in the retail and hotel sectors), the Company granted concessions which were primarily interest and principal payment deferrals generally ranging from three to four months and, to a much lesser extent, maturity date extensions. Deferred commercial mortgage loan interest and principal payments were $30 million at June 30, 2021.
Agricultural
For some agricultural mortgage loan borrowers (principally in the annual crops and agribusiness sectors), the Company granted concessions which were primarily principal payment deferrals generally ranging from three to 12 months, and covenant changes and, to a much lesser extent, maturity date extensions. Deferred agricultural mortgage loan interest and principal payments were $4 million at June 30, 2021.
Residential
For some residential mortgage loan borrowers, the Company granted concessions which were primarily three-month interest and principal payment deferrals. Deferred residential mortgage loan interest and principal payments were $34 million at June 30, 2021.
MetLife, Inc.
Notes to the Interim Condensed Consolidated Financial Statements (Unaudited) — (continued)
6. Investments (continued)
Credit Quality of Mortgage Loans by Portfolio Segment
The amortized cost of commercial mortgage loans by credit quality indicator and vintage year was as follows at June 30, 2021:
| | | | | | | | | | | | | | | | | | | | | | | | | | | | | | | | | | | | | | | | | | | | | | | | | | | | | | | | |
| Credit Quality Indicator | | 2021 | | 2020 | | 2019 | | 2018 | | 2017 | | Prior | | Revolving
Loans | | Total | | % of
Total |
| | (Dollars in millions) |
| LTV ratios: | | | | | | | | | | | | | | | | | | |
| Less than 65% | | $ | 2,289 | | | $ | 5,108 | | | $ | 4,305 | | | $ | 5,301 | | | $ | 4,069 | | | $ | 12,943 | | | $ | 1,980 | | | $ | 35,995 | | | 69.8 | % |
| 65% to 75% | | 747 | | | 1,262 | | | 4,003 | | | 2,458 | | | 1,465 | | | 2,673 | | | 0 | | | 12,608 | | | 24.4 | |
| 76% to 80% | | 66 | | | 40 | | | 340 | | | 66 | | | 404 | | | 503 | | | 0 | | | 1,419 | | | 2.7 | |
| Greater than 80% | | 8 | | | 0 | | | 4 | | | 80 | | | 249 | | | 1,239 | | | 0 | | | 1,580 | | | 3.1 | |
| Total | | $ | 3,110 | | | $ | 6,410 | | | $ | 8,652 | | | $ | 7,905 | | | $ | 6,187 | | | $ | 17,358 | | | $ | 1,980 | | | $ | 51,602 | | | 100.0 | % |
| DSCR: | | | | | | | | | | | | | | | | | | |
| > 1.20x | | $ | 2,937 | | | $ | 5,671 | | | $ | 8,214 | | | $ | 7,880 | | | $ | 5,667 | | | $ | 15,787 | | | $ | 1,980 | | | $ | 48,136 | | | 93.3 | % |
| 1.00x - 1.20x | | 86 | | | 450 | | | 65 | | | 25 | | | 135 | | | 787 | | | 0 | | | 1,548 | | | 3.0 | |
| <1.00x | | 87 | | | 289 | | | 373 | | | 0 | | | 385 | | | 784 | | | 0 | | | 1,918 | | | 3.7 | |
| Total | | $ | 3,110 | | | $ | 6,410 | | | $ | 8,652 | | | $ | 7,905 | | | $ | 6,187 | | | $ | 17,358 | | | $ | 1,980 | | | $ | 51,602 | | | 100.0 | % |
The amortized cost of agricultural mortgage loans by credit quality indicator and vintage year was as follows at June 30, 2021:
| | | | | | | | | | | | | | | | | | | | | | | | | | | | | | | | | | | | | | | | | | | | | | | | | | | | | | | | |
| Credit Quality Indicator | | 2021 | | 2020 | | 2019 | | 2018 | | 2017 | | Prior | | Revolving
Loans | | Total | | % of
Total |
| | (Dollars in millions) |
| LTV ratios: | | | | | | | | | | | | | | | | | | |
| Less than 65% | | $ | 994 | | | $ | 3,079 | | | $ | 1,951 | | | $ | 2,833 | | | $ | 973 | | | $ | 5,518 | | | $ | 860 | | | $ | 16,208 | | | 89.8 | % |
| 65% to 75% | | 234 | | | 405 | | | 175 | | | 101 | | | 52 | | | 582 | | | 100 | | | 1,649 | | | 9.1 | |
| 76% to 80% | | 0 | | | 0 | | | 0 | | | 0 | | | 0 | | | 11 | | | 0 | | | 11 | | | 0.1 | |
| Greater than 80% | | 0 | | | 0 | | | 134 | | | 0 | | | 0 | | | 42 | | | 0 | | | 176 | | | 1.0 | |
| Total | | $ | 1,228 | | | $ | 3,484 | | | $ | 2,260 | | | $ | 2,934 | | | $ | 1,025 | | | $ | 6,153 | | | $ | 960 | | | $ | 18,044 | | | 100.0 | % |
The amortized cost of residential mortgage loans by credit quality indicator and vintage year was as follows at June 30, 2021:
| | | | | | | | | | | | | | | | | | | | | | | | | | | | | | | | | | | | | | | | | | | | | | | | | | | | | | | | |
| Credit Quality Indicator | | 2021 | | 2020 | | 2019 | | 2018 | | 2017 | | Prior | | Revolving
Loans | | Total | | % of
Total |
| | (Dollars in millions) |
| Performance indicators: | | | | | | | | | | | | | | | | | | |
| Performing | | $ | 103 | | | $ | 526 | | | $ | 1,783 | | | $ | 840 | | | $ | 378 | | | $ | 8,177 | | | $ | 0 | | | $ | 11,807 | | | 96.1 | % |
| Nonperforming (1) | | 0 | | | 4 | | | 56 | | | 17 | | | 6 | | | 391 | | | 0 | | | 474 | | | 3.9 | |
| Total | | $ | 103 | | | $ | 530 | | | $ | 1,839 | | | $ | 857 | | | $ | 384 | | | $ | 8,568 | | | $ | 0 | | | $ | 12,281 | | | 100.0 | % |
__________________
(1)Includes residential mortgage loans in process of foreclosure of $83 million and $103 million at June 30, 2021 and December 31, 2020, respectively.
LTV ratios compare the unpaid principal balance of the loan to the estimated fair value of residentialthe underlying collateral. At June 30, 2021, the amortized cost of commercial and agricultural mortgage loans with an LTV ratio in excess of 100% was $12.1 billion$668 million, or less than 1% of total commercial and $11.2 billion at September 30, 2017 and December 31, 2016, respectively.agricultural mortgage loans.
Past Due and Nonaccrual Mortgage Loans
The Company has a high quality, well performing mortgage loan portfolio, with 99% of all mortgage loans classified as performing at both SeptemberJune 30, 20172021 and December 31, 2016.2020. The Company defines delinquency consistent with industry
MetLife, Inc.
Notes to the Interim Condensed Consolidated Financial Statements (Unaudited) — (continued)
6. Investments (continued)
practice, when mortgage loans are past due more than two or more months, as follows: commercial and residential mortgage loans — 60 days and agricultural mortgage loans — 90 days.applicable, by portfolio segment. The past due and nonaccrual mortgage loans at recorded investment,amortized cost, prior to valuation allowances,ACL, by portfolio segment, were as follows:
| | | | | | | | | | | | | | | | | | | | | | | | | | | | | | | | | | | | | | |
| | Past Due | | Greater than 90 Days Past Due
and Still Accruing Interest | | Nonaccrual |
| Portfolio Segment | | June 30, 2021 | | December 31, 2020 | | June 30, 2021 | | December 31, 2020 | | June 30, 2021 | | December 31, 2020 |
| | (In millions) |
| Commercial | | $ | 0 | | | $ | 10 | | | $ | 0 | | | $ | 7 | | | $ | 163 | | | $ | 317 | |
| Agricultural | | 227 | | | 252 | | | 3 | | | 20 | | | 259 | | | 266 | |
| Residential | | 474 | | | 556 | | | 8 | | | 64 | | | 466 | | | 534 | |
| Total | | $ | 701 | | | $ | 818 | | | $ | 11 | | | $ | 91 | | | $ | 888 | | | $ | 1,117 | |
The amortized cost for nonaccrual commercial, agricultural and residential mortgage loans at beginning of year 2020 was $176 million, $137 million and $418 million, respectively. The amortized cost for nonaccrual commercial mortgage loans with no ACL was $0 and $168 million at June 30, 2021 and December 31, 2020, respectively. The amortized cost for nonaccrual agricultural mortgage loans with no ACL was $192 million and $178 million at June 30, 2021 and December 31, 2020, respectively. There were 0 nonaccrual residential mortgage loans without an ACL at either June 30, 2021 or December 31, 2020.
Real Estate and Real Estate Joint Ventures
The Company’s real estate investment portfolio is diversified by property type, geography and income stream, including income from operating leases, operating income and equity in earnings from equity method real estate joint ventures. Real estate investments, by income type, as well as income earned, were as follows at:at and for the periods indicated:
| | | | | | | | | | | | | | | | | | | | | | | | | | | | | | | | | | | | | | |
| | | June 30, 2021 | | December 31, 2020 | | Three Months
Ended
June 30, | | Six Months
Ended
June 30, |
| | | | | 2021 | | 2020 | | 2021 | | 2020 |
| Income Type | | Carrying Value | | Income |
| | (In millions) |
| Leased real estate investments | | $ | 5,245 | | | $ | 5,450 | | | $ | 108 | | | $ | 101 | | | $ | 219 | | | $ | 207 | |
| Other real estate investments | | 440 | | | 419 | | | 44 | | | 24 | | | 86 | | | 59 | |
| Real estate joint ventures | | 6,216 | | | 6,064 | | | 53 | | | (23) | | | 76 | | | 1 | |
| Total real estate and real estate joint ventures | | $ | 11,901 | | | $ | 11,933 | | | $ | 205 | | | $ | 102 | | | $ | 381 | | | $ | 267 | |
|
| | | | | | | | | | | | | | | | | | | | | | | | |
| | | Past Due | | Greater than 90 Days Past Due and Still Accruing Interest | | Nonaccrual |
| | | September 30, 2017 | | December 31, 2016 | | September 30, 2017 | | December 31, 2016 | | September 30, 2017 | | December 31, 2016 |
| | | (In millions) |
| Commercial | | $ | 1 |
| | $ | 3 |
| | $ | — |
| | $ | 3 |
| | $ | 1 |
| | $ | — |
|
| Agricultural | | 134 |
| | 127 |
| | 125 |
| | 104 |
| | 36 |
| | 23 |
|
| Residential | | 430 |
| | 381 |
| | 30 |
| | 37 |
| | 400 |
| | 344 |
|
| Total | | $ | 565 |
| | $ | 511 |
| | $ | 155 |
| | $ | 144 |
| | $ | 437 |
| | $ | 367 |
|
Mortgage Loans Modified in a Troubled Debt Restructuring
During bothThe carrying value of real estate investments acquired through foreclosure was $185 million and $20 million at June 30, 2021 and December 31, 2020, respectively. Depreciation expense on real estate investments was $31 million and $61 million for the three months and ninesix months ended SeptemberJune 30, 20172021, respectively, and 2016,$31 million and $59 million for the three months and six months ended June 30, 2020, respectively. Real estate investments were net of accumulated depreciation of $917 million and $1.1 billion at June 30, 2021 and December 31, 2020, respectively.
Leases
Leased Real Estate Investments - Operating Leases
The Company, as lessor, leases investment real estate, principally commercial real estate for office and retail use, through a variety of operating lease arrangements, which typically include tenant reimbursement for property operating costs and options to renew or extend the lease. In some circumstances, leases may include an option for the lessee to purchase the property. In addition, certain leases of retail space may stipulate that a portion of the income earned is contingent upon the level of the tenants’ revenues. The Company has elected a practical expedient of not separating non-lease components related to reimbursement of property operating costs from associated lease components. These property operating costs have the same timing and pattern of transfer as the related lease component, because they are incurred over the same period of time as the operating lease. Therefore, the combined component is accounted for as a single operating lease. Risk is managed through lessee credit analysis, property type diversification, and geographic diversification.
MetLife, Inc.
Notes to the Interim Condensed Consolidated Financial Statements (Unaudited) — (continued)
6. Investments (continued)
See Note 8 of the Notes to the Consolidated Financial Statements included in the 2020 Annual Report for a summary of leased real estate investments and income earned, by property type.
Leveraged and Direct Financing Leases
The Company has diversified leveraged lease and direct financing lease portfolios. Its leveraged leases principally include renewable energy generation facilities, rail cars, commercial real estate and commercial aircraft, and its direct financing leases principally include commercial real estate. These assets are leased through a variety of lease arrangements, which may include options to renew or extend the lease and options for the lessee to purchase the property. Residual values are estimated using available third-party data at inception of the lease. Risk is managed through lessee credit analysis, asset allocation, geographic diversification, and ongoing reviews of estimated residual values, using available third-party data and, in certain leases, linking the amount of future rental receipts to changes in inflation rates. Generally, estimated residual values are not guaranteed by the lessee or a third-party.
Lease receivables are generally due in periodic installments. The payment periods for leveraged leases generally range from one to 11 years, but in certain circumstances can be over 11 years, while the payment periods for direct financing leases generally range from one to 25 years but in certain circumstances can be over 25 years.
The Company records an allowance for expected lifetime credit loss in an amount that represents the portion of the investment in leases that the Company diddoes not haveexpect to collect, resulting in the investment in leases being presented at the net amount expected to be collected. In determining the ACL, management: (i) pools leases that share similar risk characteristics, (ii) considers expected lifetime credit loss over the contractual term of the lease, and (iii) considers past events and current and forecasted economic conditions. Leases with dissimilar risk characteristics are evaluated individually for credit loss. Expected lifetime credit loss on leveraged lease receivables is estimated using a significant amountprobability of default and loss given default model, where the probability of default incorporates third-party credit ratings of the lessee and the related historical default data. Direct financing leases principally relate to leases of commercial real estate; accordingly, expected lifetime credit loss is estimated on such lease receivables consistent with the methodology for commercial mortgage loans modified(see “— Mortgage Loans — Allowance for Credit Loss Methodology”). The Company also assesses the non-guaranteed residual values for recoverability by comparison to the current estimated fair value of the leased asset and considers other relevant market information such as independent third-party forecasts, consulting, asset brokerage and investment banking reports and data, comparable market transactions, and factors such as the competitive dynamics impacting specific industries, technological change and obsolescence, government and regulatory rules, tax policy, potential environmental liabilities and litigation.
The investment in a troubled debt restructuring.leveraged and direct financing leases, net of ACL, was $796 million and $1.3 billion, respectively, at June 30, 2021 and $816 million and $1.3 billion, respectively, at December 31, 2020. The ACL for leveraged and direct financing leases was $42 million and $44 million at June 30, 2021 and December 31, 2020, respectively.
Cash Equivalents
The carrying value of cash equivalents, which includes securities and other investments with an original or remaining maturity of three months or less at the time of purchase, was $7.3$13.4 billion and $7.4$9.7 billion at SeptemberJune 30, 20172021 and December 31, 2016,2020, respectively.
Net Unrealized Investment Gains (Losses)
Unrealized investment gains (losses) on fixed maturity and equity securities AFS and derivatives and the effect on policyholder liabilities, DAC, VOBA and deferred sales inducements (“DSI”), future policy benefits and the policyholder dividend obligation, that would result from the realization of the unrealized gains (losses), are included in net unrealized investment gains (losses) in AOCI.
The components of net unrealized investment gains (losses), included in AOCI, were as follows:
| | | | | | | | | | | | | | |
| | June 30, 2021 | | December 31, 2020 |
| | (In millions) |
| Fixed maturity securities AFS | | $ | 33,813 | | | $ | 44,415 | |
| Derivatives | | 1,353 | | | 1,924 | |
| Other | | 233 | | | 267 | |
| Subtotal | | 35,399 | | | 46,606 | |
| Amounts allocated from: | | | | |
| Policyholder liabilities | | (6,862) | | | (10,797) | |
| DAC, VOBA and DSI | | (3,451) | | | (4,050) | |
| Subtotal | | (10,313) | | | (14,847) | |
| Deferred income tax benefit (expense) | | (6,456) | | | (8,009) | |
| Net unrealized investment gains (losses) | | 18,630 | | | 23,750 | |
| Net unrealized investment gains (losses) attributable to noncontrolling interests | | (22) | | | (20) | |
| Net unrealized investment gains (losses) attributable to MetLife, Inc. | | $ | 18,608 | | | $ | 23,730 | |
|
| | | | | | | | |
| | | September 30, 2017 | | December 31, 2016 |
| | | (In millions) |
| Fixed maturity securities | | $ | 21,979 |
| | $ | 20,300 |
|
| Fixed maturity securities with noncredit OTTI losses included in AOCI | | 37 |
| | 8 |
|
| Total fixed maturity securities | | 22,016 |
| | 20,308 |
|
| Equity securities | | 444 |
| | 485 |
|
| Derivatives | | 1,690 |
| | 2,923 |
|
| Other | | 121 |
| | 23 |
|
| Subtotal | | 24,271 |
| | 23,739 |
|
| Amounts allocated from: | | | | |
| Future policy benefits | | (63 | ) | | (1,114 | ) |
| DAC and VOBA related to noncredit OTTI losses recognized in AOCI | | (1 | ) | | (3 | ) |
| DAC, VOBA and DSI | | (1,647 | ) | | (1,430 | ) |
| Policyholder dividend obligation | | (2,201 | ) | | (1,931 | ) |
| Subtotal | | (3,912 | ) | | (4,478 | ) |
| Deferred income tax benefit (expense) related to noncredit OTTI losses recognized in AOCI | | (11 | ) | | (1 | ) |
| Deferred income tax benefit (expense) | | (6,997 | ) | | (6,623 | ) |
| Net unrealized investment gains (losses) | | 13,351 |
| | 12,637 |
|
| Net unrealized investment gains (losses) attributable to noncontrolling interests | | (8 | ) | | (6 | ) |
| Net unrealized investment gains (losses) attributable to MetLife, Inc. | | $ | 13,343 |
| | $ | 12,631 |
|
The changes in net unrealized investment gains (losses) were as follows:
| | | | | |
| Six Months
Ended
June 30, 2021 |
| (In millions) |
| Balance, beginning of period | $ | 23,730 | |
| Unrealized investment gains (losses) during the period | (11,207) | |
| Unrealized investment gains (losses) relating to: | |
| Policyholder liabilities | 3,935 | |
| DAC, VOBA and DSI | 599 | |
| Deferred income tax benefit (expense) | 1,553 | |
| Net unrealized investment gains (losses) | 18,610 | |
| Net unrealized investment gains (losses) attributable to noncontrolling interests | (2) | |
| Balance, end of period | $ | 18,608 | |
| Change in net unrealized investment gains (losses) | $ | (5,120) | |
| Change in net unrealized investment gains (losses) attributable to noncontrolling interests | (2) | |
| Change in net unrealized investment gains (losses) attributable to MetLife, Inc. | $ | (5,122) | |
|
| | | |
| | Nine Months
Ended
September 30, 2017 |
| | (In millions) |
| Balance, beginning of period | $ | 12,631 |
|
| Fixed maturity securities on which noncredit OTTI losses have been recognized | 29 |
|
| Unrealized investment gains (losses) during the period | 503 |
|
| Unrealized investment gains (losses) relating to: | |
| Future policy benefits | 1,051 |
|
| DAC and VOBA related to noncredit OTTI losses recognized in AOCI | 2 |
|
| DAC, VOBA and DSI | (217 | ) |
| Policyholder dividend obligation | (270 | ) |
| Deferred income tax benefit (expense) related to noncredit OTTI losses recognized in AOCI | (10 | ) |
| Deferred income tax benefit (expense) | (374 | ) |
| Net unrealized investment gains (losses) | 13,345 |
|
| Net unrealized investment gains (losses) attributable to noncontrolling interests | (2 | ) |
| Balance, end of period | $ | 13,343 |
|
| Change in net unrealized investment gains (losses) | $ | 714 |
|
| Change in net unrealized investment gains (losses) attributable to noncontrolling interests | (2 | ) |
| Change in net unrealized investment gains (losses) attributable to MetLife, Inc. | $ | 712 |
|
MetLife, Inc.
Notes to the Interim Condensed Consolidated Financial Statements (Unaudited) — (continued)
6. Investments (continued)
Concentrations of Credit Risk
Investments in any counterparty that were greater than 10% of the Company’s equity, other than the U.S. government and its agencies, at estimated fair value at June 30, 2021 and December 31, 2020, were in fixed income securities of the Japanese government and its agencies with an estimated fair value of $26.9$33.8 billion and $24.7$35.8 billion, at September 30, 2017 and December 31, 2016, respectively, and in fixed income securities of the South Korean government and its agencies of $7.4 billion and $8.0 billion, respectively.
MetLife, Inc.
Notes to the Interim Condensed Consolidated Financial Statements (Unaudited) — (continued)
6. Investments (continued)
Securities Lending and Repurchase Agreements
Securities, Collateral and Reinvestment Portfolio
A summary of the outstanding securities lending and repurchase agreements is as follows:
| | | | | | | | | | | | | | | | | | | | | | | | | | | | | | | | | | | | | | | | | |
| | | June 30, 2021 | | | | December 31, 2020 |
| | | Securities (1) | | | | | | | | Securities (1) | | | | |
| Agreement Type | | | Estimated
Fair Value | | Cash Collateral
Received from
Counterparties
(2), (3) | | Reinvestment
Portfolio at
Estimated Fair
Value | | | | Estimated
Fair Value | | Cash Collateral
Received from
Counterparties
(2), (3) | | Reinvestment
Portfolio at
Estimated Fair
Value |
| | (In millions) |
| Securities lending | | | $ | 20,110 | | | $ | 20,480 | | | $ | 20,573 | | | | | $ | 18,262 | | | $ | 18,628 | | | $ | 18,884 | |
| Repurchase agreements | | | $ | 3,551 | | | $ | 3,460 | | | $ | 3,497 | | | | | $ | 3,276 | | | $ | 3,210 | | | $ | 3,251 | |
| | | | | | | | | | | | | | | |
__________________
(1)Securities on loan in connection with an estimated fair valuethese programs are included within fixed maturity securities AFS and short-term investments.
(2)In connection with securities lending and repurchase agreements, in addition to cash collateral received, the Company received from counterparties non-cash security collateral of $6.1 billion$31 million and $1 million at SeptemberJune 30, 2017. At2021 and December 31, 2016,2020, respectively, which is not reflected on the investments in Korean government fixed incomeinterim condensed consolidated financial statements.
(3)The liability for cash collateral for these programs is included within payables for collateral under securities were less than 10%loaned and other transactions and other liabilities.
Contractual Maturities
A summary of the Company’s equity.
Securities Lending
Elementsremaining contractual maturities of the securities lending program are presented below at:and repurchase agreements is as follows:
|
| | | | | | | |
| | September 30, 2017 | | December 31, 2016 |
| | (In millions) |
| Securities on loan: (1) | | | |
| Amortized cost | $ | 18,219 |
| | $ | 18,798 |
|
| Estimated fair value | $ | 19,542 |
| | $ | 19,753 |
|
| Cash collateral received from counterparties (2) | $ | 19,996 |
| | $ | 20,114 |
|
| Security collateral received from counterparties (3) | $ | — |
| | $ | 20 |
|
| Reinvestment portfolio — estimated fair value | $ | 20,155 |
| | $ | 20,133 |
|
| | | | | | | | | | | | | | | | | | | | | | | | | | | | | | | | | | | | | | | | | | | | | | | | | | | | | | | | | | | | | | | | | | |
| | June 30, 2021 | | | | December 31, 2020 | | |
| | Remaining Maturities | | | | | | Remaining Maturities | | | | |
| Security Type | | Open (1) | | 1 Month
or Less | | Over 1 Month
to 6
Months | | Over 6
Months
to 1 Year | | Total | | | | Open (1) | | 1 Month
or Less | | Over 1 Month
to 6
Months | | Over 6
Months
to 1 Year | | Total | | |
| | (In millions) |
| Cash collateral liability by loaned security type: | | | | | | | | | | | | | | | | | | | | | | | | |
| Securities lending: | | | | | | | | | | | | | | | | | | | | | | | | |
| U.S. government and agency | | $ | 5,063 | | | $ | 7,818 | | | $ | 6,446 | | | $ | 0 | | | $ | 19,327 | | | | | $ | 2,946 | | | $ | 10,553 | | | $ | 4,009 | | | $ | 0 | | | $ | 17,508 | | | |
| Foreign government | | 0 | | | 296 | | | 731 | | | 0 | | | 1,027 | | | | | 0 | | | 291 | | | 826 | | | 0 | | | 1,117 | | | |
| Agency RMBS | | 0 | | | 0 | | | 124 | | | 0 | | | 124 | | | | | 0 | | | 0 | | | 0 | | | 0 | | | 0 | | | |
| U.S. corporate | | 1 | | | 0 | | | 0 | | | 0 | | | 1 | | | | | 3 | | | 0 | | | 0 | | | 0 | | | 3 | | | |
| Municipals | | 1 | | | 0 | | | 0 | | | 0 | | | 1 | | | | | 0 | | | 0 | | | 0 | | | 0 | | | 0 | | | |
| Total | | $ | 5,065 | | | $ | 8,114 | | | $ | 7,301 | | | $ | 0 | | | $ | 20,480 | | | | | $ | 2,949 | | | $ | 10,844 | | | $ | 4,835 | | | $ | 0 | | | $ | 18,628 | | | |
| | | | | | | | | | | | | | | | | | | | | | | | |
| Repurchase agreements: | | | | | | | | | | | | | | | | | | | | | | | | |
| U.S. government and agency | | $ | 0 | | | $ | 3,460 | | | $ | 0 | | | $ | 0 | | | $ | 3,460 | | | | | $ | 0 | | | $ | 3,210 | | | $ | 0 | | | $ | 0 | | | $ | 3,210 | | | |
| | | | | | | | | | | | | | | | | | | | | | | | |
| | | | | | | | | | | | | | | | | | | | | | | | |
| | | | | | | | | | | | | | | | | | | | | | | | |
| | | | | | | | | | | | | | | | | | | | | | | | |
| | | | | | | | | | | | | | | | | | | | | | | | |
__________________
| |
(1) | Included within fixed maturity securities. |
| |
(2) | Included within payables for collateral under securities loaned and other transactions. |
| |
(3) | Security collateral received from counterparties may not be sold or re-pledged, unless the counterparty is in default, and is not reflected on the consolidated financial statements. |
(1)The cash collateral liability byrelated loaned security type and remaining tenor ofcould be returned to the agreements was as follows at:Company on the next business day, which would require the Company to immediately return the cash collateral.
|
| | | | | | | | | | | | | | | | | | | | | | | | | | | | | | | | |
| | | September 30, 2017 | | December 31, 2016 |
| | | Remaining Tenor of Securities Lending Agreements | | | | Remaining Tenor of Securities Lending Agreements | | |
| | | Open (1) | | 1 Month or Less | | 1 to 6 Months | | Total | | Open (1) | | 1 Month or Less | | 1 to 6 Months | | Total |
| | | (In millions) |
| Cash collateral liability by loaned security type: | | | | | | | | | | | | | | | | |
| U.S. government and agency | | $ | 4,362 |
| | $ | 7,952 |
| | $ | 6,694 |
| | $ | 19,008 |
| | $ | 4,480 |
| | $ | 6,496 |
| | $ | 8,383 |
| | $ | 19,359 |
|
| Foreign government | | — |
| | 507 |
| | 481 |
| | 988 |
| | — |
| | 569 |
| | 143 |
| | 712 |
|
| U.S. corporate | | — |
| | — |
| | — |
| | — |
| | — |
| | 43 |
| | — |
| | 43 |
|
| Total | | $ | 4,362 |
|
| $ | 8,459 |
|
| $ | 7,175 |
|
| $ | 19,996 |
| | $ | 4,480 |
| | $ | 7,108 |
| | $ | 8,526 |
| | $ | 20,114 |
|
__________________
| |
(1) | The related loaned security could be returned to the Company on the next business day which would require the Company to immediately return the cash collateral. |
If the Company is required to return significant amounts of cash collateral on short notice and is forced to sell securities to meet the return obligation, it may have difficulty selling such collateral that is invested in securities in a timely manner, be forced to sell securities in a volatile or illiquid market for less than what otherwise would have been realized under normal market conditions, or both. The estimated fair value of the securities on loan related to the cash collateral on open at September 30, 2017 was $4.3 billion, all of which were U.S. government and agency securities which, if put back to the Company, could be immediately sold to satisfy the cash requirement.
MetLife, Inc.
Notes to the Interim Condensed Consolidated Financial Statements (Unaudited) — (continued)
6. Investments (continued)
The securities lending and repurchase agreements reinvestment portfolio acquired with the cash collateral consistedportfolios consist principally of high quality, liquid, publicly-traded fixed maturity securities (including agency RMBS, U.S. government and agency securities and ABS),AFS, short-term investments, and cash equivalents, with 64% invested in agency RMBS, short-term investments, U.S. government and agency securities, cash equivalents or held in cash. If the securities on loan or the reinvestment portfolio become less liquid, the Company has the liquidity resources of most of itswithin the general account are available to meet any potential cash demands when securities on loan are put back toby the Company.counterparty.
Repurchase Agreements
Elements of the short-term repurchase agreements are presented below at:
|
| | | | | | | | |
| | | September 30, 2017 | | December 31, 2016 |
| | | (In millions) |
| Securities on loan: (1) | | | | |
| Amortized cost | | $ | 1,972 |
| | $ | 98 |
|
| Estimated fair value | | $ | 2,108 |
| | $ | 113 |
|
| Cash collateral received from counterparties (2) | | $ | 2,062 |
| | $ | 102 |
|
| Reinvestment portfolio — estimated fair value | | $ | 2,072 |
| | $ | 100 |
|
__________________
| |
(1) | Included within fixed maturity securities. |
| |
(2) | Included within payables for collateral under securities loaned and other transactions and other liabilities. |
The cash collateral liability by loaned security type and remaining tenor of the agreements was as follows at:
|
| | | | | | | | | | | | | | | | | | | | | | | | |
| | | September 30, 2017 | | December 31, 2016 |
| | | Remaining Tenor of Repurchase Agreements | | | | Remaining Tenor of Repurchase Agreements | | |
| | | 1 Month or Less | | 1 to 6 Months | | Total | | 1 Month or Less | | 1 to 6 Months | | Total |
| | | (In millions) |
| Cash collateral liability by loaned security type: | | | | | | | | | | | | |
| U.S. government and agency | | $ | 1,960 |
| | $ | 5 |
| | $ | 1,965 |
| | $ | 5 |
| | $ | — |
| | $ | 5 |
|
| All other corporate and government | | — |
| | 97 |
| | 97 |
| | 46 |
| | 51 |
| | 97 |
|
| Total | | $ | 1,960 |
| | $ | 102 |
| | $ | 2,062 |
| | $ | 51 |
| | $ | 51 |
| | $ | 102 |
|
The reinvestment portfolio acquired with the cash collateral consisted principally of fixed maturity securities (including agency RMBS, U.S. government and agency securities and ABS), short-term investments and cash equivalents, with 67% invested in agency RMBS, U.S. government and agency securities, short-term investments, cash equivalents or held in cash. If the securities on loan or the reinvestment portfolio become less liquid, the Company has the liquidity resources of most of its general account available to meet any potential cash demands when securities on loan are put back to the Company.
Invested Assets on Deposit, Held in Trust and Pledged as Collateral
Invested assets on deposit, held in trust and pledged as collateral are presented below at estimated fair value for all asset classes, except mortgage loans, which are presented at carrying value at:
| | | | | | | | | | | | | | |
| | June 30, 2021 | | December 31, 2020 |
| | (In millions) |
| Invested assets on deposit (regulatory deposits) | | $ | 1,892 | | | $ | 1,933 | |
| Invested assets held in trust (external reinsurance agreements) (1) | | 1,107 | | | 1,124 | |
| Invested assets pledged as collateral (2) | | 25,752 | | | 25,884 | |
| Total invested assets on deposit, held in trust and pledged as collateral | | $ | 28,751 | | | $ | 28,941 | |
|
| | | | | | | | |
| | | September 30, 2017 | | December 31, 2016 |
| | | (In millions) |
| Invested assets on deposit (regulatory deposits) | | $ | 1,944 |
| | $ | 1,925 |
|
| Invested assets held in trust (collateral financing arrangement and reinsurance agreements) | | 2,655 |
| | 2,057 |
|
| Invested assets pledged as collateral | | 23,817 |
| | 23,882 |
|
| Total invested assets on deposit, held in trust and pledged as collateral | | $ | 28,416 |
|
| $ | 27,864 |
|
MetLife, Inc.
Notes to the Interim Condensed Consolidated Financial Statements (Unaudited) — (continued)
6. Investments (continued)
The Company has(1) Represents assets held in trust related to third-party reinsurance agreements. Excludes assets held in trust of $2.1 billion and $2.4 billion related to reinsurance agreements between wholly-owned subsidiaries as of June 30, 2021 and December 31, 2020, respectively.
(2) The Company has pledged invested assets in connection with various agreements and transactions, including funding agreements, secured debt, a collateral financing arrangement (see Notes 4, 13 and 1214 of the Notes to the Consolidated Financial Statements included in the 2016 Annual Report), a collateral financing arrangement (see Note 13 of the Notes to the Consolidated Financial Statements included in the 20162020 Annual Report) and derivative transactions (see Note 7).
See “— Securities Lending”Lending and “— Repurchase Agreements” for information regarding securities on loansupporting securities lending and repurchase agreement transactions and Note 5 for information regarding investments designated to the closed block. In addition, the Company’s investment in Federal Home Loan Bank common stock, which is considered restricted until redeemed by the issuers, was $791 million and $814 million, at redemption value, at June 30, 2021 and December 31, 2020, respectively.
Variable Interest Entities
The Company has invested in legal entities that are VIEs. In certain instances, the Company holds both the power to direct the most significant activities of the entity, as well as an economic interest in the entity and, as such, is deemed to be the primary beneficiary or consolidator of the entity. The determination of the VIE’s primary beneficiary requires an evaluation of the contractual and implied rights and obligations associated with each party’s relationship with or involvement in the entity, an estimate of the entity’s expected losses and expected residual returns and the allocation of such estimates to each party involved in the entity.
Consolidated VIEs
Creditors or beneficial interest holders of VIEs where the Company is the primary beneficiary have no recourse to the general credit of the Company, as the Company’s obligation to the VIEs is limited to the amount of its committed investment.
MetLife, Inc.
Notes to the Interim Condensed Consolidated Financial Statements (Unaudited) — (continued)
6. Investments (continued)
The following table presents the total assets and total liabilities relating to investment-related VIEs for which the Company has concluded that it is the primary beneficiary and which are consolidated at:
| | | | | | | | | | | | June 30, 2021 | | December 31, 2020 |
| Asset Type | | Asset Type | | Total
Assets | | Total
Liabilities | | Total
Assets | | Total
Liabilities |
| | | September 30, 2017 | | December 31, 2016 | | | (In millions) |
| | | Total
Assets | | Total
Liabilities | | Total
Assets | | Total
Liabilities | |
| | | (In millions) | |
| Investment funds (1) | | Investment funds (1) | | $ | 319 | | | $ | 10 | | | $ | 258 | | | $ | 1 | |
| Renewable energy partnership (1) | | $ | 114 |
| | $ | — |
| | $ | — |
| | $ | — |
| Renewable energy partnership (1) | | 82 | | | 0 | | | 87 | | | 0 | |
| CSEs (assets (primarily FVO securities) and liabilities (primarily debt)) (2) | | 7 |
| | 6 |
| | 9 |
| | 12 |
| |
| Other investments (3) | | 34 |
| | — |
| | 50 |
| | — |
| |
| Other investments (2) | | Other investments (2) | | 2 | | | 0 | | | 4 | | | 5 | |
| Total | | $ | 155 |
|
| $ | 6 |
|
| $ | 59 |
|
| $ | 12 |
| Total | | $ | 403 | | | $ | 10 | | | $ | 349 | | | $ | 6 | |
__________________
| |
(1) | Assets of the renewable energy partnership, primarily consisting of other invested assets, were consolidated in earlier periods as the two investors are subsidiaries of MLIC and Brighthouse. As a result of the Separation and a reassessment in the third quarter of 2017, the renewable energy partnership was determined to be a consolidated VIE. |
| |
(2) | The Company consolidates entities that are structured as collateralized debt obligations. The assets of these entities can only be used to settle their respective liabilities, and under no circumstances is the Company liable for any principal or interest shortfalls should any arise. |
| |
(3) | Other investments is primarily comprised of other invested assets and other limited partnership interests. |
(1)Assets of the investment funds and renewable energy partnership primarily consisted of other invested assets.
MetLife, Inc.
Notes to the Interim Condensed Consolidated Financial Statements (Unaudited) — (continued)
6. Investments (continued)
other investments primarily consisted of other assets at June 30, 2021, and cash and cash equivalents at December 31, 2020.
Unconsolidated VIEs
The carrying amount and maximum exposure to loss relating to VIEs in which the Company holds a significant variable interest but is not the primary beneficiary and which have not been consolidated were as follows at:
|
| | | | | | | | | | | | | | | | |
| | | September 30, 2017 | | December 31, 2016 |
| | | Carrying
Amount | | Maximum
Exposure
to Loss (1) | | Carrying
Amount | | Maximum
Exposure
to Loss (1) |
| | | (In millions) |
| Fixed maturity securities AFS: | | | | | | | | |
| Structured Securities (2) | | $ | 49,663 |
| | $ | 49,663 |
| | $ | 46,773 |
| | $ | 46,773 |
|
| U.S. and foreign corporate | | 1,605 |
| | 1,605 |
| | 1,940 |
| | 1,940 |
|
| Other limited partnership interests | | 4,657 |
| | 8,417 |
| | 4,714 |
| | 8,990 |
|
| Other invested assets | | 2,286 |
| | 2,697 |
| | 2,206 |
| | 2,777 |
|
| Other (3) | | 114 |
| | 128 |
| | 199 |
| | 215 |
|
| Total | | $ | 58,325 |
|
| $ | 62,510 |
|
| $ | 55,832 |
|
| $ | 60,695 |
|
| | | | | | | | | | | | | | | | | | | | | | | | | | |
| | June 30, 2021 | | December 31, 2020 |
| Asset Type | | Carrying
Amount | | Maximum
Exposure
to Loss (1) | | Carrying
Amount | | Maximum
Exposure
to Loss (1) |
| | (In millions) |
| Fixed maturity securities AFS (2) | | $ | 60,152 | | | $ | 60,152 | | | $ | 60,115 | | | $ | 60,115 | |
| | | | | | | | |
| | | | | | | | |
| | | | | | | | |
| Other limited partnership interests | | 10,766 | | | 17,029 | | | 8,355 | | | 14,911 | |
| Other invested assets | | 1,217 | | | 1,293 | | | 1,320 | | | 1,404 | |
| Other investments | | 660 | | | 663 | | | 619 | | | 639 | |
| Total | | $ | 72,795 | | | $ | 79,137 | | | $ | 70,409 | | | $ | 77,069 | |
__________________
| |
(1) | The maximum exposure to loss relating to fixed maturity securities AFS and equity securities AFS is equal to their carrying amounts or the carrying amounts of retained interests. The maximum exposure to loss relating to other limited partnership interests and real estate joint ventures is equal to the carrying amounts plus any unfunded commitments. For certain of its investments in other invested assets, the Company’s return is in the form of income tax credits which are guaranteed by creditworthy third parties. For such investments, the maximum exposure to loss is equal to the carrying amounts plus any unfunded commitments, reduced by income tax credits guaranteed by third parties of $123 million and $150 million at September 30, 2017 and December 31, 2016, respectively. Such a maximum loss would be expected to occur only upon bankruptcy of the issuer or investee. |
| |
(2) | For these variable interests, the Company’s involvement is limited to that of a passive investor in mortgage-backed or asset-backed securities issued by trusts that do not have substantial equity. |
| |
(3) | Other is primarily comprised of real estate joint ventures and common stock. |
(1)The maximum exposure to loss relating to fixed maturity securities AFS is equal to their carrying amounts or the carrying amounts of retained interests. The maximum exposure to loss relating to other limited partnership interests is equal to the carrying amounts plus any unfunded commitments. For certain of its investments in other invested assets, the Company’s return is in the form of income tax credits which are guaranteed by creditworthy third-parties. For such investments, the maximum exposure to loss is equal to the carrying amounts plus any unfunded commitments, reduced by income tax credits guaranteed by third parties of $3 million at both June 30, 2021 and December 31, 2020. Such a maximum loss would be expected to occur only upon bankruptcy of the issuer or investee.
(2)For variable interests in Structured Products included within fixed maturity securities AFS, the Company’s involvement is limited to that of a passive investor in mortgage-backed or asset-backed securities issued by trusts that do not have substantial equity.
As described in Note 15, the Company makes commitments to fund partnership investments in the normal course of business. Excluding these commitments, the Company did not provide financial or other support to investees designated as VIEs during bothfor either the ninesix months ended SeptemberJune 30, 2017 and 2016.
2021 or 2020.
MetLife, Inc.
Notes to the Interim Condensed Consolidated Financial Statements (Unaudited) — (continued)
6. Investments (continued)
Net Investment Income
The components of net investment income were as follows:
| | | | | | | | | | | | Three Months
Ended
June 30, | | Six Months
Ended
June 30, |
| Asset Type | | Asset Type | | 2021 | | 2020 | | 2021 | | 2020 |
| | Three Months
Ended
September 30, | | Nine Months
Ended
September 30, | | | (In millions) |
| | 2017 | | 2016 | | 2017 | | 2016 | |
| | (In millions) | |
| Investment income: | | | | | | | | |
| Fixed maturity securities | $ | 2,869 |
| | $ | 2,906 |
| | $ | 8,528 |
| | $ | 8,838 |
| |
| Fixed maturity securities AFS | | Fixed maturity securities AFS | | $ | 2,739 | | | $ | 2,787 | | | $ | 5,492 | | | $ | 5,662 | |
| Equity securities | 31 |
| | 29 |
| | 93 |
| | 90 |
| Equity securities | | 9 | | | 11 | | | 20 | | | 25 | |
| FVO securities — FVO general account securities (1) | 16 |
| | 25 |
| | 61 |
| | 41 |
| |
| FVO Securities (1) | | FVO Securities (1) | | 50 | | | 114 | | | 86 | | | 36 | |
| Mortgage loans | 809 |
| | 710 |
| | 2,303 |
| | 2,165 |
| Mortgage loans | | 885 | | | 862 | | | 1,748 | | | 1,746 | |
| Policy loans | 130 |
| | 129 |
| | 386 |
| | 385 |
| Policy loans | | 120 | | | 124 | | | 241 | | | 250 | |
| Real estate and real estate joint ventures | 156 |
| | 199 |
| | 478 |
| | 490 |
| Real estate and real estate joint ventures | | 205 | | | 102 | | | 381 | | | 267 | |
| Other limited partnership interests | 214 |
| | 184 |
| | 648 |
| | 309 |
| Other limited partnership interests | | 1,047 | | | (607) | | | 2,329 | | | (287) | |
| Cash, cash equivalents and short-term investments | 52 |
| | 38 |
| | 159 |
| | 112 |
| Cash, cash equivalents and short-term investments | | 24 | | | 52 | | | 49 | | | 144 | |
| Operating joint ventures | 6 |
| | 5 |
| | 13 |
| | 28 |
| Operating joint ventures | | 15 | | | 31 | | | 38 | | | 56 | |
| Other | 71 |
| | 90 |
| | 196 |
| | 178 |
| Other | | 40 | | | 29 | | | 94 | | | 131 | |
| Subtotal | 4,354 |
| | 4,315 |
|
| 12,865 |
| | 12,636 |
| |
| Subtotal investment income | | Subtotal investment income | | 5,134 | | | 3,505 | | | 10,478 | | | 8,030 | |
| Less: Investment expenses | 293 |
| | 235 |
| | 820 |
| | 732 |
| Less: Investment expenses | | 232 | | | 236 | | | 469 | | | 560 | |
| Subtotal, net | 4,061 |
| | 4,080 |
|
| 12,045 |
| | 11,904 |
| Subtotal, net | | 4,902 | | | 3,269 | | | 10,009 | | | 7,470 | |
| FVO securities — FVO contractholder-directed unit-linked investments (1) | 234 |
| | 529 |
| | 864 |
| | 623 |
| |
| Unit-linked investments (1) | | Unit-linked investments (1) | | 378 | | | 818 | | | 585 | | | (322) | |
| | Net investment income | $ | 4,295 |
| | $ | 4,609 |
|
| $ | 12,909 |
| | $ | 12,527 |
| Net investment income | | $ | 5,280 | | | $ | 4,087 | | | $ | 10,594 | | | $ | 7,148 | |
__________________
| |
(1) | Changes in estimated fair value subsequent to purchase for(1)Changes in estimated fair value subsequent to purchase of FVO Securities and contractholder-directed equity securities still held as of the end of the respective periods included in net investment income were $154 million and $540 million for the three months and nine months ended September 30, 2017, respectively, and $407 million and $283 million for the three months and nine months ended September 30, 2016, respectively. |
FVO securities are primarily comprised of securities for which the FVO has been elected. FVO securities are primarily comprised of contractholder-directed investments supporting unit-linked variable annuity type liabilities which do not qualify(“Unit-linked investments”) still held as separate accounts. The remainder isof the end of the respective periods and included in net investment income were $347 million and $549 million for the three months and six months ended June 30, 2021, respectively, and $766 million and ($322) million for the three months and six months ended June 30, 2020, respectively.
Net investment income from equity method investments, comprised of FVO Brighthouse Common Stock (see Note 3), FVO general account securitiesreal estate joint ventures, other limited partnership interests, tax credit and FVO securities held by consolidated securitization entities (“CSEs”). The Company previously maintained a trading securities portfolio, principally invested in fixed maturity securities. Inrenewable energy partnerships and operating joint ventures, totaled $1.0 billion and $2.3 billion for the three months and six months ended June 2016,30, 2021, respectively, and ($688) million and ($365) million for the Company commenced a reinvestment of this portfolio into other asset classesthree months and at Septembersix months ended June 30, 2016 the Company no longer held any actively traded securities.
See “— Variable Interest Entities” for discussion of CSEs.
2020, respectively.
MetLife, Inc.
Notes to the Interim Condensed Consolidated Financial Statements (Unaudited) — (continued)
6. Investments (continued)
Net Investment Gains (Losses)
Components of Net Investment Gains (Losses)
The components of net investment gains (losses) were as follows:
|
| | | | | | | | | | | | | | | |
| | Three Months
Ended
September 30, | | Nine Months
Ended
September 30, |
| | 2017 | | 2016 | | 2017 | | 2016 |
| | (In millions) |
| Total gains (losses) on fixed maturity securities: | | | | | | | |
| Total OTTI losses recognized — by sector and industry: | | | | | | | |
| U.S. and foreign corporate securities — by industry: | | | | | | | |
| Consumer | $ | (4 | ) | | $ | — |
| | $ | (4 | ) | | $ | — |
|
| Industrial | — |
| | — |
| | — |
| | (63 | ) |
| Communications | — |
| | — |
| | — |
| | (3 | ) |
| Total U.S. and foreign corporate securities | (4 | ) |
| — |
| | (4 | ) | | (66 | ) |
| RMBS | (1 | ) | | (9 | ) | | (1 | ) | | (15 | ) |
| ABS | — |
| | — |
| | — |
| | (2 | ) |
| State and political subdivision | — |
| | — |
| | (2 | ) | | — |
|
| OTTI losses on fixed maturity securities recognized in earnings | (5 | ) |
| (9 | ) | | (7 | ) | | (83 | ) |
| Fixed maturity securities — net gains (losses) on sales and disposals (1) | 284 |
| | 129 |
| | 325 |
| | 455 |
|
| Total gains (losses) on fixed maturity securities | 279 |
|
| 120 |
| | 318 |
| | 372 |
|
| Total gains (losses) on equity securities: | | | | | | | |
| Total OTTI losses recognized — by sector: | | | | | | | |
| Common stock | (4 | ) | | (5 | ) | | (16 | ) | | (71 | ) |
| Non-redeemable preferred stock | — |
| | — |
| | (1 | ) | | — |
|
| OTTI losses on equity securities recognized in earnings | (4 | ) |
| (5 | ) | | (17 | ) | | (71 | ) |
| Equity securities — net gains (losses) on sales and disposals | 6 |
| | 9 |
| | 55 |
| | 24 |
|
| Total gains (losses) on equity securities | 2 |
| | 4 |
| | 38 |
| | (47 | ) |
| Mortgage loans (2) | 29 |
| | (41 | ) | | 3 |
| | (197 | ) |
| Real estate and real estate joint ventures | 169 |
| | 19 |
| | 436 |
| | 67 |
|
| Other limited partnership interests | (33 | ) | | (9 | ) | | (51 | ) | | (43 | ) |
| Other | 29 |
| | (24 | ) | | (92 | ) | | (105 | ) |
| Subtotal | 475 |
|
| 69 |
| | 652 |
| | 47 |
|
| FVO CSEs: | | | | | | | |
| Securities | — |
| | 1 |
| | — |
| | 2 |
|
| Non-investment portfolio gains (losses) (3)(4)(5) | (1,081 | ) | | 161 |
| | (1,091 | ) | | 549 |
|
| Subtotal | (1,081 | ) | | 162 |
| | (1,091 | ) | | 551 |
|
| Total net investment gains (losses) | $ | (606 | ) |
| $ | 231 |
| | $ | (439 | ) | | $ | 598 |
|
| | | | | | | | | | | | | | | | | | | | | | | | | | | | |
| | Three Months
Ended
June 30, | | Six Months
Ended
June 30, | | |
| Asset Type | | 2021 | | 2020 | | 2021 | | 2020 | | |
| | (In millions) | | |
| Fixed maturity securities AFS | | $ | 5 | | | $ | 150 | | | $ | (62) | | | $ | 154 | | | |
| | | | | | | | | | |
| | | | | | | | | | |
| | | | | | | | | | |
| Equity securities (1) | | 55 | | | 72 | | | 130 | | | (212) | | | |
| | | | | | | | | | |
| | | | | | | | | | |
| | | | | | | | | | |
| FVO Securities | | 1 | | | (4) | | | 4 | | | (3) | | | |
| Mortgage loans | | (2) | | | (80) | | | 58 | | | (143) | | | |
| Real estate and real estate joint ventures | | 368 | | | 2 | | | 416 | | | 3 | | | |
| Other limited partnership interests | | (8) | | | 1 | | | (13) | | | 5 | | | |
| Other (2), (3) | | 22 | | | 101 | | | 42 | | | 125 | | | |
| Subtotal | | 441 | | | 242 | | | 575 | | | (71) | | | |
| | | | | | | | | | |
| | | | | | | | | | |
| | | | | | | | | | |
| | | | | | | | | | |
| Change in estimated fair value of other limited partnership interests and real estate joint ventures | | 5 | | | (13) | | | 14 | | | (12) | | | |
| Non-investment portfolio gains (losses) (4) | | 1,159 | | | 2 | | | 1,150 | | | 26 | | | |
| Subtotal | | 1,164 | | | (11) | | | 1,164 | | | 14 | | | |
| Total net investment gains (losses) | | $ | 1,605 | | | $ | 231 | | | $ | 1,739 | | | $ | (57) | | | |
__________________
| |
(1) | Fixed maturity securities net gains (losses) on sales and disposals for both thethree monthsand nine months endedSeptember 30, 2017 includes $276 million in previously deferred gains on prior period transfers of securities to Brighthouse, as such gains are no longer eliminated in consolidation after the Separation. See Note 3.
|
| |
(2) | Mortgage loans gains (losses) for both thethree monthsand nine months endedSeptember 30, 2017 includes $47 million of previously deferred gains on prior period transfers of mortgage loans to Brighthouse as such gains are no longer eliminated in consolidation after the Separation. See Note 3.
|
(1)Changes in estimated fair value subsequent to purchase for equity securities still held as of the end of the periods included in net investment gains (losses) were $50 million and $113 million for the three months and six months ended June 30, 2021, respectively, and $63 million and ($193) million for the three months and six months ended June 30, 2020, respectively.
(2)Other gains (losses) included de-designated cash flow hedge gains of $19 million and $48 million for the three months and six months ended June 30, 2021, respectively, and $43 million and $55 million for the three months and six months ended June 30, 2020, respectively.
(3)Other gains (losses) included a leveraged lease gain of $81 million for both the three months and six months ended June 30, 2020.
(4)See Note 3 for information on the Company’s business dispositions.
Gains (losses) from foreign currency transactions included within net investment gains (losses) were $10 million and $19 million for the three months and six months ended June 30, 2021, respectively, and $19 million and $70 million for the three months and six months ended June 30, 2020, respectively.
MetLife, Inc.
Notes to the Interim Condensed Consolidated Financial Statements (Unaudited) — (continued)
6. Investments (continued)
| |
(3) | Non-investment portfolio gains (losses) for both thethree monthsand nine months endedSeptember 30, 2017 includes a loss of $1,016 million which represents a mark-to-market loss attributable to the FVO Brighthouse Common Stock held by the Company at Separation. See Note 3.
|
| |
(4) | Non-investment portfolio gains (losses) for both the three months and nine months ended September 30, 2017 includes a loss of $45 million which represents the change in estimated fair value of FVO Brighthouse Common Stock held by the Company from the date of Separation to September 30, 2017. See Note 3. |
| |
(5) | Non-investment portfolio gains (losses) for both the three months and nine months ended September 30, 2016 includes a gain of $103 millionin connection with the sale to Massachusetts Mutual Life Insurance Company (“MassMutual”).See Note 3 of the Notes to the Consolidated Financial Statements included in the 2016 Annual Report.
|
See “— Variable Interest Entities” for discussion of CSEs.
Gains (losses) from foreign currency transactions included within net investment gains (losses) were ($14) million and ($77) million for thethree monthsand nine months endedSeptember 30, 2017, respectively, and $40 million and $398 million for the three monthsand nine months ended September 30, 2016, respectively.
Fixed Maturity Securities AFS - Sales orand Disposals and Impairments of Fixed Maturity and Equity SecuritiesCredit Loss
Investment gains and losses on salesSales of securities are determined on a specific identification basis. Proceeds from sales or disposals of fixed maturity and equity securities and the components of fixed maturity and equity securities net investment gains (losses) were as shown in the table below.below:
| | | | | | | | | | | | | | | | | | | | | | | | | | |
| | Three Months
Ended
June 30, | | Six Months
Ended
June 30, |
| | 2021 | | 2020 | | 2021 | | 2020 |
| | (In millions) |
| Proceeds | | $ | 10,923 | | | $ | 9,981 | | | $ | 26,563 | | | $ | 22,070 | |
| Gross investment gains | | $ | 145 | | | $ | 424 | | | $ | 363 | | | $ | 761 | |
| Gross investment (losses) | | (132) | | | (266) | | | (391) | | | (384) | |
| Net credit loss (provision) release | | (8) | | | (8) | | | (34) | | | (223) | |
| Net investment gains (losses) | | $ | 5 | | | $ | 150 | | | $ | (62) | | | $ | 154 | |
|
| | | | | | | | | | | | | | | |
| | Three Months
Ended
September 30, |
| | 2017 | | 2016 | | 2017 | | 2016 |
| | Fixed Maturity Securities | | Equity Securities |
| | (In millions) |
| Proceeds | $ | 8,586 |
| | $ | 16,634 |
| | $ | 316 |
| | $ | 35 |
|
| Gross investment gains | $ | 364 |
| | $ | 232 |
| | $ | 11 |
| | $ | 11 |
|
| Gross investment losses | (80 | ) | | (103 | ) | | (5 | ) | | (2 | ) |
| OTTI losses | (5 | ) | | (9 | ) | | (4 | ) | | (5 | ) |
| Net investment gains (losses) | $ | 279 |
| | $ | 120 |
| | $ | 2 |
| | $ | 4 |
|
|
| | | | | | | | | | | | | | | |
| | Nine Months
Ended
September 30, |
| | 2017 |
| 2016 |
| 2017 |
| 2016 |
| | Fixed Maturity Securities | | Equity Securities |
| | (In millions) |
| Proceeds | $ | 35,742 |
| | $ | 60,006 |
| | $ | 702 |
| | $ | 109 |
|
| Gross investment gains | $ | 623 |
| | $ | 921 |
| | $ | 66 |
| | $ | 34 |
|
| Gross investment losses | (298 | ) | | (466 | ) | | (11 | ) | | (10 | ) |
| OTTI losses | (7 | ) | | (83 | ) | | (17 | ) | | (71 | ) |
| Net investment gains (losses) | $ | 318 |
|
| $ | 372 |
|
| $ | 38 |
|
| $ | (47 | ) |
MetLife, Inc.
Notes to the Interim Condensed Consolidated Financial Statements (Unaudited) — (continued)
6. Investments (continued)
Credit Loss Rollforward
The table below presents a rollforward of the cumulative credit loss component of OTTI loss recognized in earnings on fixed maturity securities still held for which a portion of the OTTI loss was recognized in other comprehensive income (loss) (“OCI”):
|
| | | | | | | | | | | | | | | |
| | Three Months
Ended
September 30, | | Nine Months
Ended
September 30, |
| | 2017 | | 2016 | | 2017 | | 2016 |
| | (In millions) |
| Balance, beginning of period | $ | 170 |
| | $ | 198 |
| | $ | 192 |
| | $ | 211 |
|
| Addition: | | | | | | | |
| Additional impairments — credit loss OTTI on securities previously impaired | — |
| | 9 |
| | — |
| | 14 |
|
| Reduction: | | | | | | | |
| Sales (maturities, pay downs or prepayments) of securities previously impaired as credit loss OTTI | (5 | ) | | (10 | ) | | (27 | ) | | (28 | ) |
| Balance, end of period | $ | 165 |
| | $ | 197 |
| | $ | 165 |
|
| $ | 197 |
|
MetLife, Inc.
Notes to the Interim Condensed Consolidated Financial Statements (Unaudited) — (continued)
7. Derivatives
Accounting for Derivatives
Freestanding Derivatives
Freestanding derivatives are carried on the Company’s balance sheet either as assets within other invested assets or as liabilities within other liabilities at estimated fair value. The Company does not offset the estimated fair value amounts recognized for derivatives executed with the same counterparty under the same master netting agreement.
Accruals on derivatives are generally recorded in accrued investment income or within other liabilities. However, accruals that are not scheduled to settle within one year are included with the derivatives carrying value in other invested assets or other liabilities.
If a derivative is not designated as an accounting hedge or its use in managing risk does not qualify for hedge accounting, changes in the estimated fair valueSee Note 1 of the derivative are reported in net derivative gains (losses) except as follows:
|
| | |
Statement of Operations Presentation: | Derivative: |
Policyholder benefits and claims | • | Economic hedges of variable annuity guarantees included in future policy benefits |
Net investment income | • | Economic hedges of equity method investments in joint ventures |
| • | All derivatives held in relation to trading portfolios |
| • | Derivatives held within contractholder-directed unit-linked investments |
Hedge Accounting
To qualify for hedge accounting, at the inception of the hedging relationship, the Company formally documents its risk management objective and strategy for undertaking the hedging transaction, as well as its designation of the hedge. Hedge designation and financial statement presentation of changes in estimated fair value of the hedging derivatives are as follows:
Fair value hedge (a hedge of the estimated fair value of a recognized asset or liability) - in net derivative gains (losses), consistent with the change in estimated fair value of the hedged item attributable to the designated risk being hedged.
Cash flow hedge (a hedge of a forecasted transaction or of the variability of cash flows to be received or paid related to a recognized asset or liability) - effectiveness in OCI (deferred gains or losses on the derivative are reclassified into the statement of operations when the Company’s earnings are affected by the variability in cash flows of the hedged item); ineffectiveness in net derivative gains (losses).
Net investment in a foreign operation hedge - effectiveness in OCI, consistent with the translation adjustment for the hedged net investment in the foreign operation; ineffectiveness in net derivative gains (losses).
The changes in estimated fair values of the hedging derivatives are exclusive of any accruals that are separately reported on the statement of operations within interest income or interest expense to match the location of the hedged item. Accruals on derivatives in net investment hedges are recognized in OCI.
In its hedge documentation, the Company sets forth how the hedging instrument is expected to hedge the designated risks related to the hedged item and sets forth the method that will be used to retrospectively and prospectively assess the hedging instrument’s effectiveness and the method that will be used to measure ineffectiveness. A derivative designated as a hedging instrument must be assessed as being highly effective in offsetting the designated risk of the hedged item. Hedge effectiveness is formally assessed at inception and at least quarterly throughout the life of the designated hedging relationship. Assessments of hedge effectiveness and measurements of ineffectiveness are also subject to interpretation and estimation and different interpretations or estimates may have a material effect on the amount reported in net income.
The Company discontinues hedge accounting prospectively when: (i) it is determined that the derivative is no longer highly effective in offsetting changes in the estimated fair value or cash flows of a hedged item; (ii) the derivative expires, is sold, terminated, or exercised; (iii) it is no longer probable that the hedged forecasted transaction will occur; or (iv) the derivative is de-designated as a hedging instrument.
MetLife, Inc.
Notes to the Interim Condensed Consolidated Financial Statements (Unaudited) — (continued)
7. Derivatives (continued)
When hedge accounting is discontinued because it is determined that the derivative is not highly effective in offsetting changesincluded in the estimated fair value or cash flows of2020 Annual Report for a hedged item, the derivative continues to be carried on the balance sheet at its estimated fair value, with changes in estimated fair value recognized in net derivative gains (losses). The carrying valuedescription of the hedged recognized asset or liability under a fair value hedge is no longer adjustedCompany’s accounting policies for changes in its estimated fair value due to the hedged risk,derivatives and the cumulative adjustment to its carrying value is amortized into income over the remaining life of the hedged item. Provided the hedged forecasted transaction is still probable of occurrence, the changes in estimated fair value of derivatives recorded in OCI related to discontinued cash flow hedges are released into the statement of operations when the Company’s earnings are affected by the variability in cash flows of the hedged item.
When hedge accounting is discontinued because it is no longer probable that the forecasted transactions will occur on the anticipated date or within two months of that date, the derivative continues to be carried on the balance sheet at its estimated fair value, with changes in estimated fair value recognized currently in net derivative gains (losses). Deferred gains and losses of a derivative recorded in OCI pursuant to the discontinued cash flow hedge of a forecasted transaction that is no longer probable are recognized immediately in net derivative gains (losses).
In all other situations in which hedge accounting is discontinued, the derivative is carried at its estimated fair value on the balance sheet, with changes in its estimated fair value recognized in the current period as net derivative gains (losses).
Embedded Derivatives
The Company sells variable annuities and issues certain insurance products and investment contracts and is a party to certain reinsurance agreements that have embedded derivatives. The Company assesses each identified embedded derivative to determine whether it is required to be bifurcated. The embedded derivative is bifurcated from the host contract and accounted for as a freestanding derivative if:
the combined instrument is not accounted for in its entirety at estimated fair value with changes in estimated fair value recorded in earnings;
the terms of the embedded derivative are not clearly and closely related to the economic characteristics of the host contract; and
a separate instrument with the same terms as the embedded derivative would qualify as a derivative instrument.
Such embedded derivatives are carried on the balance sheet at estimated fair value with the host contract and changes in their estimated fair value are generally reported in net derivative gains (losses), except for those in policyholder benefits and claims related to ceded reinsurance of GMIB. If the Company is unable to properly identify and measure an embedded derivative for separation from its host contract, the entire contract is carried on the balance sheet at estimated fair value, with changes in estimated fair value recognized in the current period in net investment gains (losses) or net investment income. Additionally, the Company may elect to carry an entire contract on the balance sheet at estimated fair value, with changes in estimated fair value recognized in the current period in net investment gains (losses) or net investment income if that contract contains an embedded derivative that requires bifurcation. At inception, the Company attributes to the embedded derivative a portion of the projected future guarantee fees to be collected from the policyholder equal to the present value of projected future guaranteed benefits. Any additional fees represent “excess” fees and are reported in universal life and investment-type product policy fees.
See Note 8 for information about the fair value hierarchy for derivatives.
Derivative Strategies
Types of Derivative Instruments and Derivative Strategies
The Company is exposed to various risks relating to its ongoing business operations, including interest rate, foreign currency exchange rate, credit and equity market. The Company uses a variety of strategies to manage these risks, including the use of derivatives. Commonly used derivative instruments include, but are not limited to:
Derivatives are financial instruments with values derived from•Interest rate derivatives: swaps, total return swaps, caps, floors, futures, swaptions, forwards and synthetic guaranteed interest rates, foreigncontracts (“GICs”);
•Foreign currency exchange rates, credit spreads and/or other financial indices. Derivatives may be exchange-traded or contracted in the over-the-counter (“OTC”) market. Certain of the Company’s OTC derivatives are cleared and settled through central clearing counterparties (“OTC-cleared”), while others are bilateral contracts between two counterparties (“OTC-bilateral”). The types of derivatives the Company uses includerate derivatives: swaps, forwards, futuresoptions and option contracts. To a lesser extent, the Company usesexchange-traded futures;
•Credit derivatives: purchased or written single name or index credit default swaps, and structured interest rateforwards; and
•Equity derivatives: index options, variance swaps, exchange-traded futures and total return swaps.
For detailed information on these contracts and the related strategies, see Note 9 of the Notes to synthetically replicate investment risks and returns which are not readily availablethe Consolidated Financial Statements included in the cash markets.
2020 Annual Report.
MetLife, Inc.
Notes to the Interim Condensed Consolidated Financial Statements (Unaudited) — (continued)
7. DerivativesDerivatives (continued)
Interest Rate Derivatives
The Company uses a variety of interest rate derivatives to reduce its exposure to changes in interest rates, including interest rate swaps, interest rate total return swaps, caps, floors, swaptions, futures and forwards.
Interest rate swaps are used by the Company primarily to reduce market risks from changes in interest rates and to alter interest rate exposure arising from mismatches between assets and liabilities (duration mismatches). In an interest rate swap, the Company agrees with another party to exchange, at specified intervals, the difference between fixed rate and floating rate interest amounts as calculated by reference to an agreed notional amount. The Company utilizes interest rate swaps in fair value, cash flow and nonqualifying hedging relationships.
The Company uses structured interest rate swaps to synthetically create investments that are either more expensive to acquire or otherwise unavailable in the cash markets. These transactions are a combination of a derivative and a cash instrument such as a U.S. government and agency, or other fixed maturity security. Structured interest rate swaps are included in interest rate swaps and are not designated as hedging instruments.
Interest rate total return swaps are swaps whereby the Company agrees with another party to exchange, at specified intervals, the difference between the economic risk and reward of an asset or a market index and the London Interbank Offered Rate (“LIBOR”), calculated by reference to an agreed notional amount. No cash is exchanged at the outset of the contract. Cash is paid and received over the life of the contract based on the terms of the swap. These transactions are entered into pursuant to master agreements that provide for a single net payment to be made by the counterparty at each due date. Interest rate total return swaps are used by the Company to reduce market risks from changes in interest rates and to alter interest rate exposure arising from mismatches between assets and liabilities (duration mismatches). The Company utilizes interest rate total return swaps in nonqualifying hedging relationships.
The Company purchases interest rate caps and floors primarily to protect its floating rate liabilities against rises in interest rates above a specified level, and against interest rate exposure arising from mismatches between assets and liabilities, as well as to protect its minimum rate guarantee liabilities against declines in interest rates below a specified level, respectively. In certain instances, the Company locks in the economic impact of existing purchased caps and floors by entering into offsetting written caps and floors. The Company utilizes interest rate caps and floors in nonqualifying hedging relationships.
In exchange-traded interest rate (Treasury and swap) futures transactions, the Company agrees to purchase or sell a specified number of contracts, the value of which is determined by the different classes of interest rate securities, and to post variation margin on a daily basis in an amount equal to the difference in the daily market values of those contracts. The Company enters into exchange-traded futures with regulated futures commission merchants that are members of the exchange. Exchange-traded interest rate (Treasury and swap) futures are used primarily to hedge mismatches between the duration of assets in a portfolio and the duration of liabilities supported by those assets, to hedge against changes in value of securities the Company owns or anticipates acquiring, to hedge against changes in interest rates on anticipated liability issuances by replicating Treasury or swap curve performance, and to hedge minimum guarantees embedded in certain variable annuity products offered by the Company. The Company utilizes exchange-traded interest rate futures in nonqualifying hedging relationships.
Swaptions are used by the Company to hedge interest rate risk associated with the Company’s long-term liabilities and invested assets. A swaption is an option to enter into a swap with a forward starting effective date. In certain instances, the Company locks in the economic impact of existing purchased swaptions by entering into offsetting written swaptions. The Company pays a premium for purchased swaptions and receives a premium for written swaptions. The Company utilizes swaptions in nonqualifying hedging relationships. Swaptions are included in interest rate options.
The Company enters into interest rate forwards to buy and sell securities. The price is agreed upon at the time of the contract and payment for such a contract is made at a specified future date. The Company utilizes interest rate forwards in cash flow and nonqualifying hedging relationships.
Foreign Currency Exchange Rate Derivatives
The Company uses foreign currency exchange rate derivatives, including foreign currency swaps, foreign currency forwards, currency options and exchange-traded currency futures, to reduce the risk from fluctuations in foreign currency exchange rates associated with its assets and liabilities denominated in foreign currencies. The Company also uses foreign currency derivatives to hedge the foreign currency exchange rate risk associated with certain of its net investments in foreign operations.
MetLife, Inc.
Notes to the Interim Condensed Consolidated Financial Statements (Unaudited) — (continued)
7. Derivatives (continued)
In a foreign currency swap transaction, the Company agrees with another party to exchange, at specified intervals, the difference between one currency and another at a fixed exchange rate, generally set at inception, calculated by reference to an agreed upon notional amount. The notional amount of each currency is exchanged at the inception and termination of the currency swap by each party. The Company utilizes foreign currency swaps in fair value, cash flow and nonqualifying hedging relationships.
In a foreign currency forward transaction, the Company agrees with another party to deliver a specified amount of an identified currency at a specified future date. The price is agreed upon at the time of the contract and payment for such a contract is made at the specified future date. The Company utilizes foreign currency forwards in fair value, net investment in foreign operations and nonqualifying hedging relationships.
The Company enters into currency options that give it the right, but not the obligation, to sell the foreign currency amount in exchange for a functional currency amount within a limited time at a contracted price. The contracts may also be net settled in cash, based on differentials in the foreign currency exchange rate and the strike price. The Company uses currency options to hedge against the foreign currency exposure inherent in certain of its variable annuity products. The Company also uses currency options as an economic hedge of foreign currency exposure related to the Company’s international subsidiaries. The Company utilizes currency options in net investment in foreign operations and nonqualifying hedging relationships.
To a lesser extent, the Company uses exchange-traded currency futures to hedge currency mismatches between assets and liabilities, and to hedge minimum guarantees embedded in certain variable annuity products offered by the Company. The Company utilizes exchange-traded currency futures in nonqualifying hedging relationships.
Credit Derivatives
The Company enters into purchased credit default swaps to hedge against credit-related changes in the value of its investments. In a credit default swap transaction, the Company agrees with another party to pay, at specified intervals, a premium to hedge credit risk. If a credit event occurs, as defined by the contract, the contract may be cash settled or it may be settled gross by the delivery of par quantities of the referenced investment equal to the specified swap notional amount in exchange for the payment of cash amounts by the counterparty equal to the par value of the investment surrendered. Credit events vary by type of issuer but typically include bankruptcy, failure to pay debt obligations, repudiation, moratorium, involuntary restructuring or governmental intervention. In each case, payout on a credit default swap is triggered only after the Credit Derivatives Determinations Committee of the International Swaps and Derivatives Association, Inc. (“ISDA”) deems that a credit event has occurred. The Company utilizes credit default swaps in nonqualifying hedging relationships.
The Company enters into written credit default swaps to synthetically create credit investments that are either more expensive to acquire or otherwise unavailable in the cash markets. These transactions are a combination of a derivative and one or more cash instruments, such as U.S. government and agency securities, or other fixed maturity securities. These credit default swaps are not designated as hedging instruments.
The Company enters into forwards to lock in the price to be paid for forward purchases of certain securities. The price is agreed upon at the time of the contract and payment for the contract is made at a specified future date. When the primary purpose of entering into these transactions is to hedge against the risk of changes in purchase price due to changes in credit spreads, the Company designates these transactions as credit forwards. The Company utilizes credit forwards in cash flow hedging relationships.
Equity Derivatives
The Company uses a variety of equity derivatives to reduce its exposure to equity market risk, including equity index options, equity variance swaps, exchange-traded equity futures and equity total return swaps.
Equity index options are used by the Company primarily to hedge minimum guarantees embedded in certain variable annuity products offered by the Company. To hedge against adverse changes in equity indices, the Company enters into contracts to sell the equity index within a limited time at a contracted price. The contracts will be net settled in cash based on differentials in the indices at the time of exercise and the strike price. Certain of these contracts may also contain settlement provisions linked to interest rates. In certain instances, the Company may enter into a combination of transactions to hedge adverse changes in equity indices within a pre-determined range through the purchase and sale of options. The Company utilizes equity index options in nonqualifying hedging relationships.
MetLife, Inc.
Notes to the Interim Condensed Consolidated Financial Statements (Unaudited) — (continued)
7. Derivatives (continued)
Equity variance swaps are used by the Company primarily to hedge minimum guarantees embedded in certain variable annuity products offered by the Company. In an equity variance swap, the Company agrees with another party to exchange amounts in the future, based on changes in equity volatility over a defined period. The Company utilizes equity variance swaps in nonqualifying hedging relationships.
In exchange-traded equity futures transactions, the Company agrees to purchase or sell a specified number of contracts, the value of which is determined by the different classes of equity securities, and to post variation margin on a daily basis in an amount equal to the difference in the daily market values of those contracts. The Company enters into exchange-traded futures with regulated futures commission merchants that are members of the exchange. Exchange-traded equity futures are used primarily to hedge minimum guarantees embedded in certain variable annuity products offered by the Company. The Company utilizes exchange-traded equity futures in nonqualifying hedging relationships.
In an equity total return swap, the Company agrees with another party to exchange, at specified intervals, the difference between the economic risk and reward of an asset or a market index and LIBOR, calculated by reference to an agreed notional amount. No cash is exchanged at the outset of the contract. Cash is paid and received over the life of the contract based on the terms of the swap. The Company uses equity total return swaps to hedge its equity market guarantees in certain of its insurance products. Equity total return swaps can be used as hedges or to synthetically create investments. The Company utilizes equity total return swaps in nonqualifying hedging relationships.
MetLife, Inc.
Notes to the Interim Condensed Consolidated Financial Statements (Unaudited) — (continued)
7. Derivatives (continued)
Primary Risks Managed by Derivatives
The following table presents the primary underlying risk exposure, gross notional amount and estimated fair value of the Company’s derivatives, excluding embedded derivatives, held at:
| | | | | September 30, 2017 | | December 31, 2016 | | June 30, 2021 | | December 31, 2020 |
| | | Primary Underlying Risk Exposure | | Gross
Notional
Amount | | Estimated Fair Value | | Gross
Notional
Amount | | Estimated Fair Value | | Primary Underlying Risk Exposure | | Gross
Notional
Amount | | Estimated Fair Value | | Gross
Notional
Amount | | Estimated Fair Value |
| | | Assets | | Liabilities | | Assets | | Liabilities | | Assets | | Liabilities | | Assets | | Liabilities |
| | | (In millions) | | | | (In millions) |
| Derivatives Designated as Hedging Instruments: | Derivatives Designated as Hedging Instruments: | | | | | | | | | | | | | Derivatives Designated as Hedging Instruments: | |
| Fair value hedges: | | | | | | | | | | | | | Fair value hedges: | |
| Interest rate swaps | | Interest rate | | $ | 3,959 |
| | $ | 2,305 |
| | $ | 3 |
| | $ | 5,021 |
| | $ | 2,221 |
| | $ | 6 |
| Interest rate swaps | | Interest rate | | $ | 3,581 | | | $ | 2,165 | | | $ | 3 | | | $ | 3,186 | | | $ | 3,224 | | | $ | 4 | |
| Foreign currency swaps | | Foreign currency exchange rate | | 658 |
| | 47 |
| | 5 |
| | 1,221 |
| | 34 |
| | 224 |
| Foreign currency swaps | | Foreign currency exchange rate | | 908 | | | 6 | | | 59 | | | 1,106 | | | 8 | | | 78 | |
| Foreign currency forwards | | Foreign currency exchange rate | | 2,624 |
| | — |
| | 65 |
| | 1,085 |
| | — |
| | 54 |
| Foreign currency forwards | | Foreign currency exchange rate | | 1,736 | | | 0 | | | 77 | | | 1,936 | | | 24 | | | 0 | |
| Subtotal | | 7,241 |
| | 2,352 |
| | 73 |
| | 7,327 |
| | 2,255 |
| | 284 |
| Subtotal | | 6,225 | | | 2,171 | | | 139 | | | 6,228 | | | 3,256 | | | 82 | |
| Cash flow hedges: | | | | | | | | | | | | | Cash flow hedges: | | | | | | | | | | | | |
| Interest rate swaps | | Interest rate | | 3,781 |
| | 308 |
| | 8 |
| | 2,040 |
| | 325 |
| | 34 |
| Interest rate swaps | | Interest rate | | 4,480 | | | 25 | | | 0 | | | 4,750 | | | 44 | | | 0 | |
| Interest rate forwards | | Interest rate | | 3,412 |
| | — |
| | 203 |
| | 4,032 |
| | — |
| | 370 |
| Interest rate forwards | | Interest rate | | 7,234 | | | 75 | | | 183 | | | 7,377 | | | 513 | | | 120 | |
| Foreign currency swaps | | Foreign currency exchange rate | | 30,751 |
| | 1,304 |
| | 1,563 |
| | 26,680 |
| | 1,877 |
| | 2,054 |
| Foreign currency swaps | | Foreign currency exchange rate | | 40,972 | | | 1,358 | | | 1,712 | | | 38,604 | | | 1,549 | | | 2,017 | |
| Subtotal | | 37,944 |
| | 1,612 |
| | 1,774 |
| | 32,752 |
| | 2,202 |
| | 2,458 |
| Subtotal | | 52,686 | | | 1,458 | | | 1,895 | | | 50,731 | | | 2,106 | | | 2,137 | |
| Foreign operations hedges: | | | | | | | | | | | | | |
| Net investment in a foreign operation (“NIFO”) hedges: | | Net investment in a foreign operation (“NIFO”) hedges: | | | | | | | | | | | | |
| Foreign currency forwards | | Foreign currency exchange rate | | 975 |
| | 10 |
| | 24 |
| | 1,394 |
| | 47 |
| | 5 |
| Foreign currency forwards | | Foreign currency exchange rate | | 341 | | | 8 | | | 0 | | | 164 | | | 0 | | | 3 | |
| Currency options | | Foreign currency exchange rate | | 8,259 |
| | 28 |
| | 111 |
| | 8,878 |
| | 148 |
| | 45 |
| Currency options | | Foreign currency exchange rate | | 3,000 | | | 113 | | | 0 | | | 3,600 | | | 70 | | | 0 | |
| Subtotal | | 9,234 |
| | 38 |
| | 135 |
| | 10,272 |
| | 195 |
| | 50 |
| Subtotal | | 3,341 | | | 121 | | | 0 | | | 3,764 | | | 70 | | | 3 | |
| Total qualifying hedges | Total qualifying hedges | | 54,419 |
| | 4,002 |
| | 1,982 |
| | 50,351 |
| | 4,652 |
| | 2,792 |
| Total qualifying hedges | | 62,252 | | | 3,750 | | | 2,034 | | | 60,723 | | | 5,432 | | | 2,222 | |
| Derivatives Not Designated or Not Qualifying as Hedging Instruments: | Derivatives Not Designated or Not Qualifying as Hedging Instruments: | | | | | | | | | | | | | Derivatives Not Designated or Not Qualifying as Hedging Instruments: | | | | | | | | | | | | |
| Interest rate swaps | | Interest rate | | 59,494 |
| | 2,246 |
| | 570 |
| | 53,349 |
| | 4,089 |
| | 1,641 |
| Interest rate swaps | | Interest rate | | 43,920 | | | 3,923 | | | 64 | | | 49,561 | | | 3,683 | | | 38 | |
| Interest rate floors | | Interest rate | | 7,201 |
| | 128 |
| | — |
| | 12,101 |
| | 181 |
| | 7 |
| Interest rate floors | | Interest rate | | 12,201 | | | 241 | | | 0 | | | 12,701 | | | 350 | | | 0 | |
| Interest rate caps | | Interest rate | | 73,018 |
| | 54 |
| | 2 |
| | 78,358 |
| | 112 |
| | 2 |
| Interest rate caps | | Interest rate | | 76,614 | | | 63 | | | 0 | | | 40,730 | | | 13 | | | 0 | |
| Interest rate futures | | Interest rate | | 4,256 |
| | 13 |
| | — |
| | 4,793 |
| | 3 |
| | 12 |
| Interest rate futures | | Interest rate | | 2,427 | | | 0 | | | 4 | | | 1,498 | | | 0 | | | 2 | |
| Interest rate options | | Interest rate | | 12,009 |
| | 657 |
| | 35 |
| | 5,334 |
| | 628 |
| | 1 |
| Interest rate options | | Interest rate | | 13,342 | | | 541 | | | 25 | | | 17,746 | | | 502 | | | 5 | |
| Interest rate forwards | | Interest rate | | 217 |
| | — |
| | 37 |
| | 613 |
| | — |
| | 25 |
| Interest rate forwards | | Interest rate | | 309 | | | 0 | | | 37 | | | 351 | | | 0 | | | 10 | |
| Interest rate total return swaps | | Interest rate | | 1,048 |
| | 3 |
| | 9 |
| | 1,549 |
| | 2 |
| | 127 |
| Interest rate total return swaps | | Interest rate | | 1,048 | | | 15 | | | 22 | | | 1,048 | | | 0 | | | 59 | |
| Synthetic GICs | | Interest rate | | 11,254 |
| | — |
| | — |
| | 5,566 |
| | — |
| | — |
| Synthetic GICs | | Interest rate | | 37,773 | | | 0 | | | 0 | | | 38,646 | | | 0 | | | 0 | |
| Foreign currency swaps | | Foreign currency exchange rate | | 10,509 |
| | 796 |
| | 426 |
| | 11,651 |
| | 1,445 |
| | 462 |
| Foreign currency swaps | | Foreign currency exchange rate | | 12,667 | | | 624 | | | 591 | | | 13,265 | | | 603 | | | 693 | |
| Foreign currency forwards | | Foreign currency exchange rate | | 16,502 |
| | 95 |
| | 527 |
| | 15,422 |
| | 117 |
| | 977 |
| Foreign currency forwards | | Foreign currency exchange rate | | 14,810 | | | 119 | | | 569 | | | 15,643 | | | 209 | | | 310 | |
| Currency futures | | Foreign currency exchange rate | | 874 |
| | — |
| | 3 |
| | 915 |
| | — |
| | — |
| Currency futures | | Foreign currency exchange rate | | 869 | | | 0 | | | 4 | | | 914 | | | 3 | | | 0 | |
| Currency options | | Foreign currency exchange rate | | 2,929 |
| | 42 |
| | 3 |
| | 3,615 |
| | 195 |
| | 17 |
| Currency options | | Foreign currency exchange rate | | 900 | | | 0 | | | 0 | | | 1,350 | | | 0 | | | 0 | |
| Credit default swaps — purchased | | Credit | | 2,329 |
| | 11 |
| | 46 |
| | 2,001 |
| | 14 |
| | 40 |
| Credit default swaps — purchased | | Credit | | 2,999 | | | 12 | | | 115 | | | 2,978 | | | 9 | | | 121 | |
| Credit default swaps — written | | Credit | | 11,946 |
| | 256 |
| | 1 |
| | 10,732 |
| | 161 |
| | 9 |
| Credit default swaps — written | | Credit | | 9,216 | | | 192 | | | 6 | | | 9,609 | | | 196 | | | 0 | |
| Equity futures | | Equity market | | 4,309 |
| | 4 |
| | 28 |
| | 4,457 |
| | 30 |
| | 3 |
| Equity futures | | Equity market | | 4,227 | | | 9 | | | 9 | | | 5,427 | | | 14 | | | 38 | |
| Equity index options | | Equity market | | 12,371 |
| | 382 |
| | 679 |
| | 16,527 |
| | 426 |
| | 523 |
| Equity index options | | Equity market | | 30,947 | | | 853 | | | 478 | | | 22,954 | | | 834 | | | 437 | |
| Equity variance swaps | | Equity market | | 8,337 |
| | 103 |
| | 285 |
| | 8,263 |
| | 83 |
| | 240 |
| Equity variance swaps | | Equity market | | 716 | | | 17 | | | 15 | | | 716 | | | 15 | | | 12 | |
| Equity total return swaps | | Equity market | | 1,103 |
| | — |
| | 35 |
| | 1,046 |
| | 1 |
| | 43 |
| Equity total return swaps | | Equity market | | 2,554 | | | 2 | | | 55 | | | 3,294 | | | 3 | | | 282 | |
| Total non-designated or nonqualifying derivatives | Total non-designated or nonqualifying derivatives | | 239,706 |
| | 4,790 |
| | 2,686 |
| | 236,292 |
| | 7,487 |
| | 4,129 |
| Total non-designated or nonqualifying derivatives | | 267,539 | | | 6,611 | | | 1,994 | | | 238,431 | | | 6,434 | | | 2,007 | |
| Total | | $ | 294,125 |
| | $ | 8,792 |
| | $ | 4,668 |
| | $ | 286,643 |
| | $ | 12,139 |
| | $ | 6,921 |
| Total | | $ | 329,791 | | | $ | 10,361 | | | $ | 4,028 | | | $ | 299,154 | | | $ | 11,866 | | | $ | 4,229 | |
MetLife, Inc.
Notes to the Interim Condensed Consolidated Financial Statements (Unaudited) — (continued)
7. DerivativesDerivatives (continued)
Based on gross notional amounts, a substantial portion of the Company’s derivatives was not designated or did not qualify as part of a hedging relationship atat both SeptemberJune 30, 20172021 and December 31, 2016.2020. The Company’s use of derivatives includes (i) derivatives that serve as macro hedges of the Company’s exposure to various risks and that generally do not qualify for hedge accounting due to the criteria required under the portfolio hedging rules;rules, (ii) derivatives that economically hedge insurance liabilities that contain mortality or morbidity risk and that generally do not qualify for hedge accounting because the lack of these risks in the derivatives cannot support an expectation of a highly effective hedging relationship;relationship, (iii) derivatives that economically hedge embedded derivatives that do not qualify for hedge accounting because the changes in estimated fair value of the embedded derivatives are already recorded in net income;income, and (iv) written credit default swaps and interest rate swaps that are used to synthetically create investments and that do not qualify for hedge accounting because they do not involve a hedging relationship. For these nonqualified derivatives, changes in market factors can lead to the recognition of fair value changes on the statement of operations without an offsetting gain or loss recognized in earnings for the item being hedged.
Net Derivative Gains (Losses)
The components of net derivative gains (losses) were as follows:
|
| | | | | | | | | | | | | | | |
| | Three Months
Ended
September 30, | | Nine Months
Ended
September 30, |
| | 2017 | | 2016 | | 2017 | | 2016 |
| | (In millions) |
| Freestanding derivatives and hedging gains (losses) (1) | $ | (424 | ) | | $ | (820 | ) | | $ | (1,084 | ) | | $ | 2,918 |
|
| Embedded derivatives gains (losses) | 234 |
| | 277 |
| | 421 |
| | (1,480 | ) |
| Total net derivative gains (losses) | $ | (190 | ) | | $ | (543 | ) | | $ | (663 | ) | | $ | 1,438 |
|
__________________
| |
(1) | Includes foreign currency transaction gains (losses) on hedged items in cash flow and nonqualifying hedging relationships, which are not presented elsewhere in this note. |
The following table presents earned income on derivatives:
|
| | | | | | | | | | | | | | | |
| | Three Months
Ended
September 30, | | Nine Months
Ended
September 30, |
| | 2017 | | 2016 | | 2017 | | 2016 |
| | (In millions) |
| Qualifying hedges: | | | | | | | |
| Net investment income | $ | 72 |
| | $ | 71 |
| | $ | 217 |
| | $ | 192 |
|
| Interest credited to policyholder account balances | (19 | ) | | — |
| | (40 | ) | | 7 |
|
| Other expenses | (2 | ) | | (3 | ) | | (7 | ) | | (9 | ) |
| Nonqualifying hedges: | | | | | | | |
| Net investment income | — |
| | — |
| | — |
| | (1 | ) |
| Net derivative gains (losses) | 126 |
| | 187 |
| | 440 |
| | 522 |
|
| Policyholder benefits and claims | 2 |
| | 2 |
| | 6 |
| | 6 |
|
| Total | $ | 179 |
| | $ | 257 |
| | $ | 616 |
| | $ | 717 |
|
MetLife, Inc.
Notes to the Interim Condensed Consolidated Financial Statements (Unaudited) — (continued)
7. DerivativesDerivatives (continued)
NonqualifyingThe Effects of Derivatives on the Interim Condensed Consolidated Statements of Operations and Derivatives for Purposes Other Than HedgingComprehensive Income (Loss)
The following table presents the interim condensed consolidated financial statement location and amount of gain (loss) recognized on fair value, cash flow, NIFO, nonqualifying hedging relationships and location of gains (losses) recognized in income for derivatives that were not designated or not qualifying as hedging instruments:embedded derivatives:
| | | | | | | | | | | | | | | | | | | | | | | | | | | | | | | | | | | | | | | | | | | | |
| | Three Months Ended June 30, 2021 |
| | Net Investment Income | | Net Investment Gains (Losses) | | Net Derivative Gains (Losses) | | Policyholder Benefits and Claims | | Interest Credited to Policyholder Account Balances | | Other Expenses | | OCI |
| | (In millions) |
| Gain (Loss) on Fair Value Hedges: | | | | | | | | | | | | | | |
| Interest rate derivatives: | | | | | | | | | | | | | | |
| Derivatives designated as hedging instruments (1) | | $ | 0 | | | $ | 0 | | | $ | 0 | | | $ | 237 | | | $ | 0 | | | $ | 0 | | | N/A |
| Hedged items | | 1 | | | 0 | | | 0 | | | (242) | | | 0 | | | 0 | | | N/A |
| Foreign currency exchange rate derivatives: | | | | | | | | | | | | | | |
| Derivatives designated as hedging instruments (1) | | (1) | | | (7) | | | 0 | | | 0 | | | 0 | | | 0 | | | N/A |
| Hedged items | | 1 | | | 7 | | | 0 | | | 0 | | | 0 | | | 0 | | | N/A |
| Amount excluded from the assessment of hedge effectiveness | | 0 | | | (2) | | | 0 | | | 0 | | | 0 | | | 0 | | | N/A |
| Subtotal | | 1 | | | (2) | | | 0 | | | (5) | | | 0 | | | 0 | | | N/A |
| Gain (Loss) on Cash Flow Hedges: | | | | | | | | | | | | | | |
| Interest rate derivatives: (1) | | | | | | | | | | | | | | |
| Amount of gains (losses) deferred in AOCI | | N/A | | N/A | | N/A | | N/A | | N/A | | N/A | | $ | 510 | |
| Amount of gains (losses) reclassified from AOCI into income | | 15 | | | 19 | | | 0 | | | 0 | | | 0 | | | 0 | | | (34) | |
| Foreign currency exchange rate derivatives: (1) | | | | | | | | | | | | | | |
| Amount of gains (losses) deferred in AOCI | | N/A | | N/A | | N/A | | N/A | | N/A | | N/A | | 322 | |
| Amount of gains (losses) reclassified from AOCI into income | | 1 | | | 95 | | | 0 | | | 0 | | | 0 | | | 1 | | | (97) | |
| Foreign currency transaction gains (losses) on hedged items | | 0 | | | (95) | | | 0 | | | 0 | | | 0 | | | 0 | | | 0 | |
| Credit derivatives: (1) | | | | | | | | | | | | | | |
| Amount of gains (losses) deferred in AOCI | | N/A | | N/A | | N/A | | N/A | | N/A | | N/A | | (4) | |
| Amount of gains (losses) reclassified from AOCI into income | | 0 | | | 0 | | | 0 | | | 0 | | | 0 | | | 0 | | | 0 | |
| Subtotal | | 16 | | | 19 | | | 0 | | | 0 | | | 0 | | | 1 | | | 697 | |
| Gain (Loss) on NIFO Hedges: | | | | | | | | | | | | | | |
| Foreign currency exchange rate derivatives (1) | | N/A | | N/A | | N/A | | N/A | | N/A | | N/A | | 17 | |
| Non-derivative hedging instruments | | N/A | | N/A | | N/A | | N/A | | N/A | | N/A | | 2 | |
| Subtotal | | N/A | | N/A | | N/A | | N/A | | N/A | | N/A | | 19 | |
| Gain (Loss) on Derivatives Not Designated or Not Qualifying as Hedging Instruments: | | | | | | | | | | | | | | |
| Interest rate derivatives (1) | | 0 | | | 0 | | | 636 | | | 8 | | | 0 | | | 0 | | | N/A |
| Foreign currency exchange rate derivatives (1) | | 0 | | | 0 | | | (123) | | | 0 | | | 0 | | | 0 | | | N/A |
| Credit derivatives — purchased (1) | | 0 | | | 0 | | | (7) | | | 0 | | | 0 | | | 0 | | | N/A |
| Credit derivatives — written (1) | | 0 | | | 0 | | | 30 | | | 0 | | | 0 | | | 0 | | | N/A |
| Equity derivatives (1) | | (15) | | | 0 | | | (363) | | | (103) | | | 0 | | | 0 | | | N/A |
| Foreign currency transaction gains (losses) on hedged items | | 0 | | | 0 | | | 7 | | | 0 | | | 0 | | | 0 | | | N/A |
| Subtotal | | (15) | | | 0 | | | 180 | | | (95) | | | 0 | | | 0 | | | N/A |
| Earned income on derivatives | | 27 | | | 0 | | | 245 | | | 52 | | | (38) | | | 0 | | | 0 | |
| Embedded derivatives (2) | | N/A | | N/A | | (4) | | | 0 | | | N/A | | N/A | | N/A |
| Total | | $ | 29 | | | $ | 17 | | | $ | 421 | | | $ | (48) | | | $ | (38) | | | $ | 1 | | | $ | 716 | |
|
| | | | | | | | | | | | |
| | | Net
Derivative
Gains (Losses) | | Net
Investment
Income (1) | | Policyholder
Benefits and
Claims (2) |
| | | (In millions) |
| Three Months Ended September 30, 2017 | | | | | | |
| Interest rate derivatives | | $ | (148 | ) | | $ | (2 | ) | | $ | (3 | ) |
| Foreign currency exchange rate derivatives | | (346 | ) | | — |
| | 2 |
|
| Credit derivatives — purchased | | (2 | ) | | — |
| | — |
|
| Credit derivatives — written | | 35 |
| | — |
| | — |
|
| Equity derivatives | | (238 | ) | | (3 | ) | | (61 | ) |
| Total | | $ | (699 | ) | | $ | (5 | ) | | $ | (62 | ) |
| | | | | | | |
| Three Months Ended September 30, 2016 | | | | | | |
| Interest rate derivatives | | $ | (710 | ) | | $ | — |
| | $ | 22 |
|
| Foreign currency exchange rate derivatives | | 154 |
| | — |
| | (5 | ) |
| Credit derivatives — purchased | | (21 | ) | | — |
| | — |
|
| Credit derivatives — written |
| 51 |
| | — |
| | — |
|
| Equity derivatives | | (418 | ) | | (3 | ) | | (72 | ) |
| Total | | $ | (944 | ) | | $ | (3 | ) | | $ | (55 | ) |
| | | | | | | |
| Nine Months Ended September 30, 2017 | | | | | | |
| Interest rate derivatives | | $ | (466 | ) | | $ | (2 | ) | | $ | (16 | ) |
| Foreign currency exchange rate derivatives | | (527 | ) | | — |
| | 4 |
|
| Credit derivatives — purchased | | (17 | ) | | — |
| | — |
|
| Credit derivatives — written | | 111 |
| | — |
| | — |
|
| Equity derivatives | | (824 | ) | | (7 | ) | | (176 | ) |
| Total | | $ | (1,723 | ) | | $ | (9 | ) | | $ | (188 | ) |
| Nine Months Ended September 30, 2016 | | | | | | |
| Interest rate derivatives | | $ | 1,503 |
| | $ | — |
| | $ | 90 |
|
| Foreign currency exchange rate derivatives | | 1,841 |
| | — |
| | (17 | ) |
| Credit derivatives — purchased | | (48 | ) | | — |
| | — |
|
| Credit derivatives — written | | 49 |
| | — |
| | — |
|
| Equity derivatives | | (327 | ) | | (13 | ) | | (88 | ) |
| Total | | $ | 3,018 |
| | $ | (13 | ) | | $ | (15 | ) |
__________________
| |
(1) | Changes in estimated fair value related to economic hedges of equity method investments in joint ventures, derivatives held in relation to trading portfolios and derivatives held within contractholder-directed unit-linked investments. |
| |
(2) | Changes in estimated fair value related to economic hedges of variable annuity guarantees included in future policy benefits. |
MetLife, Inc.
Notes to the Interim Condensed Consolidated Financial Statements (Unaudited) — (continued)
7. DerivativesDerivatives (continued)
| | | | | | | | | | | | | | | | | | | | | | | | | | | | | | | | | | | | | | | | | | | | |
| | Three Months Ended June 30, 2020 |
| | Net Investment Income | | Net Investment Gains (Losses) | | Net Derivative Gains (Losses) | | Policyholder Benefits and Claims | | Interest Credited to Policyholder Account Balances | | Other Expenses | | OCI |
| | (In millions) |
| Gain (Loss) on Fair Value Hedges: | | | | | | | | | | | | | | |
| Interest rate derivatives: | | | | | | | | | | | | | | |
| Derivatives designated as hedging instruments (1) | | $ | (1) | | | $ | 0 | | | $ | 0 | | | $ | (31) | | | $ | 0 | | | $ | 0 | | | N/A |
| Hedged items | | 4 | | | 0 | | | 0 | | | 17 | | | 0 | | | 0 | | | N/A |
| Foreign currency exchange rate derivatives: | | | | | | | | | | | | | | |
| Derivatives designated as hedging instruments (1) | | (5) | | | 2 | | | 0 | | | 0 | | | 0 | | | 0 | | | N/A |
| Hedged items | | 5 | | | (3) | | | 0 | | | 0 | | | 0 | | | 0 | | | N/A |
| Amount excluded from the assessment of hedge effectiveness | | 0 | | | (14) | | | 0 | | | 0 | | | 0 | | | 0 | | | N/A |
| Subtotal | | 3 | | | (15) | | | 0 | | | (14) | | | 0 | | | 0 | | | N/A |
| Gain (Loss) on Cash Flow Hedges: | | | | | | | | | | | | | | |
| Interest rate derivatives: (1) | | | | | | | | | | | | | | |
| Amount of gains (losses) deferred in AOCI | | N/A | | N/A | | N/A | | N/A | | N/A | | N/A | | $ | (108) | |
| Amount of gains (losses) reclassified from AOCI into income | | 9 | | | 42 | | | 0 | | | 0 | | | 0 | | | 0 | | | (51) | |
| Foreign currency exchange rate derivatives: (1) | | | | | | | | | | | | | | |
| Amount of gains (losses) deferred in AOCI | | N/A | | N/A | | N/A | | N/A | | N/A | | N/A | | (445) | |
| Amount of gains (losses) reclassified from AOCI into income | | 1 | | | 287 | | | 0 | | | 0 | | | 0 | | | 1 | | | (289) | |
| Foreign currency transaction gains (losses) on hedged items | | 0 | | | (250) | | | 0 | | | 0 | | | 0 | | | 0 | | | 0 | |
| Credit derivatives: (1) | | | | | | | | | | | | | | |
| Amount of gains (losses) deferred in AOCI | | N/A | | N/A | | N/A | | N/A | | N/A | | N/A | | (86) | |
| Amount of gains (losses) reclassified from AOCI into income | | 0 | | | 0 | | | 0 | | | 0 | | | 0 | | | 0 | | | 0 | |
| Subtotal | | 10 | | | 79 | | | 0 | | | 0 | | | 0 | | | 1 | | | (979) | |
| Gain (Loss) on NIFO Hedges: | | | | | | | | | | | | | | |
| Foreign currency exchange rate derivatives (1) | | N/A | | N/A | | N/A | | N/A | | N/A | | N/A | | (11) | |
| Non-derivative hedging instruments | | N/A | | N/A | | N/A | | N/A | | N/A | | N/A | | (1) | |
| Subtotal | | N/A | | N/A | | N/A | | N/A | | N/A | | N/A | | (12) | |
| Gain (Loss) on Derivatives Not Designated or Not Qualifying as Hedging Instruments: | | | | | | | | | | | | | | |
| Interest rate derivatives (1) | | (2) | | | 0 | | | (212) | | | 19 | | | 0 | | | 0 | | | N/A |
| Foreign currency exchange rate derivatives (1) | | 0 | | | 0 | | | (132) | | | (1) | | | 0 | | | 0 | | | N/A |
| Credit derivatives — purchased (1) | | 0 | | | 0 | | | (61) | | | 0 | | | 0 | | | 0 | | | N/A |
| Credit derivatives — written (1) | | 0 | | | 0 | | | 162 | | | 0 | | | 0 | | | 0 | | | N/A |
| Equity derivatives (1) | | 0 | | | 0 | | | (1,043) | | | (99) | | | 0 | | | 0 | | | N/A |
| Foreign currency transaction gains (losses) on hedged items | | 0 | | | 0 | | | (3) | | | 0 | | | 0 | | | 0 | | | N/A |
| Subtotal | | (2) | | | 0 | | | (1,289) | | | (81) | | | 0 | | | 0 | | | N/A |
| Earned income on derivatives | | 69 | | | 0 | | | 208 | | | 44 | | | (38) | | | 0 | | | 0 | |
| Embedded derivatives (2) | | N/A | | N/A | | 371 | | | 0 | | | N/A | | N/A | | N/A |
| Total | | $ | 80 | | | $ | 64 | | | $ | (710) | | | $ | (51) | | | $ | (38) | | | $ | 1 | | | $ | (991) | |
MetLife, Inc.
Notes to the Interim Condensed Consolidated Financial Statements (Unaudited) — (continued)
7. Derivatives (continued)
| | | | | | | | | | | | | | | | | | | | | | | | | | | | | | | | | | | | | | | | | | | | |
| | Six Months Ended June 30, 2021 |
| | Net
Investment
Income | | Net
Investment
Gains
(Losses) | | Net
Derivative
Gains
(Losses) | | Policyholder
Benefits and
Claims | | Interest
Credited to
Policyholder
Account
Balances | | Other
Expenses | | OCI |
| | (In millions) |
| Gain (Loss) on Fair Value Hedges: | | | | | | | | | | | | | | |
| Interest rate derivatives: | | | | | | | | | | | | | | |
| Derivatives designated as hedging instruments (1) | | $ | 3 | | | $ | 0 | | | $ | 0 | | | $ | (365) | | | $ | 0 | | | $ | 0 | | | N/A |
| Hedged items | | (2) | | | 0 | | | 0 | | | 331 | | | 0 | | | 0 | | | N/A |
| Foreign currency exchange rate derivatives: | | | | | | | | | | | | | | |
| Derivatives designated as hedging instruments (1) | | 12 | | | (135) | | | 0 | | | 0 | | | 0 | | | 0 | | | N/A |
| Hedged items | | (11) | | | 130 | | | 0 | | | 0 | | | 0 | | | 0 | | | N/A |
| Amount excluded from the assessment of hedge effectiveness | | 0 | | | (4) | | | 0 | | | 0 | | | 0 | | | 0 | | | N/A |
| Subtotal | | 2 | | | (9) | | | 0 | | | (34) | | | 0 | | | 0 | | | N/A |
| Gain (Loss) on Cash Flow Hedges: | | | | | | | | | | | | | | |
| Interest rate derivatives: (1) | | | | | | | | | | | | | | |
| Amount of gains (losses) deferred in AOCI | | N/A | | N/A | | N/A | | N/A | | N/A | | N/A | | $ | (711) | |
| Amount of gains (losses) reclassified from AOCI into income | | 27 | | | 48 | | | 0 | | | 0 | | | 0 | | | 1 | | | (76) | |
| Foreign currency exchange rate derivatives: (1) | | | | | | | | | | | | | | |
| Amount of gains (losses) deferred in AOCI | | N/A | | N/A | | N/A | | N/A | | N/A | | N/A | | 169 | |
| Amount of gains (losses) reclassified from AOCI into income | | 4 | | | (124) | | | 0 | | | 0 | | | 0 | | | 1 | | | 119 | |
| Foreign currency transaction gains (losses) on hedged items | | 0 | | | 116 | | | 0 | | | 0 | | | 0 | | | 0 | | | 0 | |
| Credit derivatives: (1) | | | | | | | | | | | | | | |
| Amount of gains (losses) deferred in AOCI | | N/A | | N/A | | N/A | | N/A | | N/A | | N/A | | (72) | |
| Amount of gains (losses) reclassified from AOCI into income | | 0 | | | 0 | | | 0 | | | 0 | | | 0 | | | 0 | | | 0 | |
| Subtotal | | 31 | | | 40 | | | 0 | | | 0 | | | 0 | | | 2 | | | (571) | |
| Gain (Loss) on NIFO Hedges: | | | | | | | | | | | | | | |
| Foreign currency exchange rate derivatives (1) | | N/A | | N/A | | N/A | | N/A | | N/A | | N/A | | 46 | |
| Non-derivative hedging instruments | | N/A | | N/A | | N/A | | N/A | | N/A | | N/A | | 29 | |
| Subtotal | | N/A | | N/A | | N/A | | N/A | | N/A | | N/A | | 75 | |
| Gain (Loss) on Derivatives Not Designated or Not Qualifying as Hedging Instruments: | | | | | | | | | | | | | | |
| Interest rate derivatives (1) | | 2 | | | 0 | | | (1,614) | | | (39) | | | 0 | | | 0 | | | N/A |
| Foreign currency exchange rate derivatives (1) | | 0 | | | 0 | | | (606) | | | 3 | | | 0 | | | 0 | | | N/A |
| Credit derivatives — purchased (1) | | 0 | | | 0 | | | 12 | | | 0 | | | 0 | | | 0 | | | N/A |
| Credit derivatives — written (1) | | 0 | | | 0 | | | 35 | | | 0 | | | 0 | | | 0 | | | N/A |
| Equity derivatives (1) | | (32) | | | 0 | | | (1,039) | | | (207) | | | 0 | | | 0 | | | N/A |
| Foreign currency transaction gains (losses) on hedged items | | 0 | | | 0 | | | 232 | | | 0 | | | 0 | | | 0 | | | N/A |
| Subtotal | | (30) | | | 0 | | | (2,980) | | | (243) | | | 0 | | | 0 | | | N/A |
| Earned income on derivatives | | 66 | | | 0 | | | 497 | | | 105 | | | (77) | | | 0 | | | 0 | |
| Embedded derivatives (2) | | N/A | | N/A | | 669 | | | 0 | | | N/A | | N/A | | N/A |
| Total | | $ | 69 | | | $ | 31 | | | $ | (1,814) | | | $ | (172) | | | $ | (77) | | | $ | 2 | | | $ | (496) | |
MetLife, Inc.
Notes to the Interim Condensed Consolidated Financial Statements (Unaudited) — (continued)
7. Derivatives (continued)
| | | | | | | | | | | | | | | | | | | | | | | | | | | | | | | | | | | | | | | | | | | | |
| | Six Months Ended June 30, 2020 |
| | Net Investment Income | | Net Investment Gains (Losses) | | Net Derivative Gains (Losses) | | Policyholder Benefits and Claims | | Interest Credited to Policyholder Account Balances | | Other Expenses | | OCI |
| | (In millions) |
| Gain (Loss) on Fair Value Hedges: | | | | | | | | | | | | | | |
| Interest rate derivatives: | | | | | | | | | | | | | | |
| Derivatives designated as hedging instruments (1) | | $ | (12) | | | $ | 0 | | | $ | 0 | | | $ | 743 | | | $ | 0 | | | $ | 0 | | | N/A |
| Hedged items | | 9 | | | 0 | | | 0 | | | (752) | | | 0 | | | 0 | | | N/A |
| Foreign currency exchange rate derivatives: | | | | | | | | | | | | | | |
| Derivatives designated as hedging instruments (1) | | 67 | | | 14 | | | 0 | | | 0 | | | 0 | | | 0 | | | N/A |
| Hedged items | | (60) | | | (13) | | | 0 | | | 0 | | | 0 | | | 0 | | | N/A |
| Amount excluded from the assessment of hedge effectiveness | | 0 | | | (34) | | | 0 | | | 0 | | | 0 | | | 0 | | | N/A |
| Subtotal | | 4 | | | (33) | | | 0 | | | (9) | | | 0 | | | 0 | | | N/A |
| Gain (Loss) on Cash Flow Hedges: | | | | | | | | | | | | | | |
| Interest rate derivatives: (1) | | | | | | | | | | | | | | |
| Amount of gains (losses) deferred in AOCI | | N/A | | N/A | | N/A | | N/A | | N/A | | N/A | | $ | 1,903 | |
| Amount of gains (losses) reclassified from AOCI into income | | 15 | | | 48 | | | 0 | | | 0 | | | 0 | | | 1 | | | (64) | |
| Foreign currency exchange rate derivatives: (1) | | | | | | | | | | | | | | |
| Amount of gains (losses) deferred in AOCI | | N/A | | N/A | | N/A | | N/A | | N/A | | N/A | | 1,169 | |
| Amount of gains (losses) reclassified from AOCI into income | | 1 | | | (164) | | | 0 | | | 0 | | | 0 | | | 1 | | | 162 | |
| Foreign currency transaction gains (losses) on hedged items | | 0 | | | 203 | | | 0 | | | 0 | | | 0 | | | 0 | | | 0 | |
| Credit derivatives: (1) | | | | | | | | | | | | | | |
| Amount of gains (losses) deferred in AOCI | | N/A | | N/A | | N/A | | N/A | | N/A | | N/A | | (24) | |
| Amount of gains (losses) reclassified from AOCI into income | | 0 | | | 0 | | | 0 | | | 0 | | | 0 | | | 0 | | | 0 | |
| Subtotal | | 16 | | | 87 | | | 0 | | | 0 | | | 0 | | | 2 | | | 3,146 | |
| Gain (Loss) on NIFO Hedges: | | | | | | | | | | | | | | |
| Foreign currency exchange rate derivatives (1) | | N/A | | N/A | | N/A | | N/A | | N/A | | N/A | | 99 | |
| Non-derivative hedging instruments | | N/A | | N/A | | N/A | | N/A | | N/A | | N/A | | (3) | |
| Subtotal | | N/A | | N/A | | N/A | | N/A | | N/A | | N/A | | 96 | |
| Gain (Loss) on Derivatives Not Designated or Not Qualifying as Hedging Instruments: | | | | | | | | | | | | | | |
| Interest rate derivatives (1) | | (6) | | | 0 | | | 3,965 | | | 67 | | | 0 | | | 0 | | | N/A |
| Foreign currency exchange rate derivatives (1) | | 0 | | | 0 | | | 3 | | | (9) | | | 0 | | | 0 | | | N/A |
| Credit derivatives — purchased (1) | | 0 | | | 0 | | | 12 | | | 0 | | | 0 | | | 0 | | | N/A |
| Credit derivatives — written (1) | | 0 | | | 0 | | | (149) | | | 0 | | | 0 | | | 0 | | | N/A |
| Equity derivatives (1) | | 0 | | | 0 | | | 516 | | | 109 | | | 0 | | | 0 | | | N/A |
| Foreign currency transaction gains (losses) on hedged items | | 0 | | | 0 | | | (160) | | | 0 | | | 0 | | | 0 | | | N/A |
| Subtotal | | (6) | | | 0 | | | 4,187 | | | 167 | | | 0 | | | 0 | | | N/A |
| Earned income on derivatives | | 146 | | | 0 | | | 355 | | | 83 | | | (82) | | | 0 | | | 0 | |
| Embedded derivatives (2) | | N/A | | N/A | | (1,051) | | | 0 | | | N/A | | N/A | | N/A |
| Total | | $ | 160 | | | $ | 54 | | | $ | 3,491 | | | $ | 241 | | | $ | (82) | | | $ | 2 | | | $ | 3,242 | |
__________________
(1)Excludes earned income on derivatives.
(2)The valuation of guaranteed minimum benefits includes a nonperformance risk adjustment. The amounts included in net derivative gains (losses) in connection with this adjustment were ($8) million and ($51) million for the three months and six months endedJune 30, 2021, respectively, and ($110) million and $75 million for the three months and six months ended June 30, 2020, respectively.
MetLife, Inc.
Notes to the Interim Condensed Consolidated Financial Statements (Unaudited) — (continued)
7. Derivatives (continued)
Fair Value Hedges
The Company designates and accounts for the following as fair value hedges when they have met the requirements of fair value hedging: (i) interest rate swaps to convert fixed rate assets and liabilities to floating rate assets and liabilities;liabilities, (ii) foreign currency swaps to hedge the foreign currency fair value exposure of foreign currency denominated assets and liabilities;liabilities, and (iii) foreign currency forwards to hedge the foreign currency fair value exposure of foreign currency denominated investments.
The Company recognizes gainsfollowing table presents the balance sheet classification, carrying amount and losses on derivativescumulative fair value hedging adjustments for items designated and the relatedqualifying as hedged items in fair value hedges within net derivative gains (losses). The following table presents the amount of such net derivative gains (losses):hedges:
|
| | | | | | | | | | | | | | |
Derivatives in Fair Value Hedging Relationships | | Hedged Items in Fair Value Hedging Relationships | | Net Derivative Gains (Losses) Recognized for Derivatives | | Net Derivative Gains (Losses) Recognized for Hedged Items | | Ineffectiveness Recognized in Net Derivative Gains (Losses) |
| | | | | (In millions) |
| Three Months Ended September 30, 2017 | | |
| Interest rate swaps: | | Fixed maturity securities | | $ | 1 |
| | $ | — |
| | $ | 1 |
|
| | | Policyholder liabilities (1) | | (14 | ) | | 13 |
| | (1 | ) |
| Foreign currency swaps: | | Foreign-denominated fixed maturity securities | | (10 | ) | | 10 |
| | — |
|
| | | Foreign-denominated policyholder account balances (2) | | 15 |
| | (16 | ) | | (1 | ) |
| Foreign currency forwards: | | Foreign-denominated fixed maturity securities | | (4 | ) | | 4 |
| | — |
|
| Total | | $ | (12 | ) | | $ | 11 |
| | $ | (1 | ) |
| Three Months Ended September 30, 2016 | | |
| Interest rate swaps: | | Fixed maturity securities | | $ | 5 |
| | $ | (4 | ) | | $ | 1 |
|
| | | Policyholder liabilities (1) | | (47 | ) | | 42 |
| | (5 | ) |
| Foreign currency swaps: | | Foreign-denominated fixed maturity securities | | 1 |
| | (1 | ) | | — |
|
| | | Foreign-denominated policyholder account balances (2) | | (1 | ) | | 1 |
| | — |
|
| Foreign currency forwards: | | Foreign-denominated fixed maturity securities | | 19 |
| | (18 | ) | | 1 |
|
| Total | | $ | (23 | ) | | $ | 20 |
| | $ | (3 | ) |
| Nine Months Ended September 30, 2017 | | |
| Interest rate swaps: | | Fixed maturity securities | | $ | 2 |
| | $ | (2 | ) | | $ | — |
|
| | | Policyholder liabilities (1) | | (16 | ) | | 84 |
| | 68 |
|
| Foreign currency swaps: | | Foreign-denominated fixed maturity securities | | (15 | ) | | 16 |
| | 1 |
|
| | | Foreign-denominated policyholder account balances (2) | | 61 |
| | (40 | ) | | 21 |
|
| Foreign currency forwards: | | Foreign-denominated fixed maturity securities | | 20 |
| | (18 | ) | | 2 |
|
| Total | | $ | 52 |
| | $ | 40 |
| | $ | 92 |
|
| Nine Months Ended September 30, 2016 | | | | | | |
| Interest rate swaps: | | Fixed maturity securities | | $ | (3 | ) | | $ | 1 |
| | $ | (2 | ) |
| | | Policyholder liabilities (1) | | 472 |
| | (482 | ) | | (10 | ) |
| Foreign currency swaps: | | Foreign-denominated fixed maturity securities | | 7 |
| | (7 | ) | | — |
|
| | | Foreign-denominated policyholder account balances (2) | | (27 | ) | | 24 |
| | (3 | ) |
| Foreign currency forwards: | | Foreign-denominated fixed maturity securities | | 295 |
| | (272 | ) | | 23 |
|
| Total | | $ | 744 |
| | $ | (736 | ) | | $ | 8 |
|
| | | | | | | | | | | | | | | | | | | | | | | | | | | | | | |
| Balance Sheet Line Item | | Carrying Amount
of the Hedged
Assets/(Liabilities) | | | | Cumulative Amount
of Fair Value Hedging Adjustments
Included in the Carrying Amount of Hedged
Assets/(Liabilities) (1) | | |
| | June 30, 2021 | | December 31, 2020 | | | | June 30, 2021 | | December 31, 2020 | | |
| | (In millions) | | |
| Fixed maturity securities AFS | | $ | 2,368 | | | $ | 2,699 | | | | | $ | (1) | | | $ | (1) | | | |
| Mortgage loans | | $ | 785 | | | $ | 952 | | | | | $ | (2) | | | $ | 20 | | | |
| Future policy benefits | | $ | (4,715) | | | $ | (5,512) | | | | | $ | (969) | | | $ | (1,307) | | | |
__________________
| |
(1) | Fixed rate liabilities reported in policyholder account balances or future policy benefits. |
| |
(2) | Fixed rate or floating rate liabilities. |
MetLife, Inc.
Notes to the Interim Condensed Consolidated Financial Statements (Unaudited) — (continued)
7. Derivatives (continued)
hedging adjustments on discontinued hedging relationships at June 30, 2021 and December 31, 2020, respectively.
For the Company’s foreign currency forwards, the change in the estimated fair value of the derivative related to the changes in the difference between the spot price and the forward price is excluded from the assessment of hedge effectiveness. The Company has elected to record changes in estimated fair value of excluded components in earnings. For all other derivatives, all components of each derivative’s gain or loss were included in the assessment of hedge effectiveness. For the three months and nine months ended September 30, 2017, the component of the change in estimated fair value of derivatives that was excluded from the assessment of hedge effectiveness was ($6) million and ($30) million, respectively. For the three months and nine months ended September 30, 2016, the component of the change in estimated fair value of derivatives that was excluded from the assessment of hedge effectiveness was ($6) million and ($16) million, respectively.
Cash Flow Hedges
The Company designates and accounts for the following as cash flow hedges when they have met the requirements of cash flow hedging: (i) interest rate swaps to convert floating rate assets and liabilities to fixed rate assets and liabilities;liabilities, (ii) foreign currency swaps to hedge the foreign currency cash flow exposure of foreign currency denominated assets and liabilities;liabilities, (iii) interest rate forwards and credit forwards to lock in the price to be paid for forward purchases of investments;investments, (iv) interest rate swaps and interest rate forwards to hedge the forecasted purchases of fixed-rate investments;investments, and (v) interest rate swaps and interest rate forwards to hedge forecasted fixed-rate borrowings.
In certain instances, the Company discontinued cash flow hedge accounting because the forecasted transactions were no longer probable of occurring. Because certain of the forecasted transactions also were not probable of occurring within two months of the anticipated date, the Company reclassified amounts from AOCI into net derivative gains (losses).income. These amounts were ($4)$1 million and $16($1) million for the three months and ninesix months ended SeptemberJune 30, 2017,2021, respectively, and $11$32 million and $6$27 million for the three months and ninesix months ended SeptemberJune 30, 2016,2020, respectively.
At both SeptemberJune 30, 20172021 and December 31, 2016,2020, the maximum length of time over which the Company was hedging its exposure to variability in future cash flows for forecasted transactions did not exceed fiveeight years.
At SeptemberJune 30, 20172021 and December 31, 2016,2020, the balance in AOCI associated with cash flow hedges was $1.7$1.4 billion and $2.9$1.9 billion, respectively. As a result of the Separation, the Company recorded a reduction of $414 million of deferred gains within AOCI during the three months ended September 30, 2017. For the three months and nine months ended September 30, 2016, there were ($16) million and $75 million, respectively, of deferred gains (losses) from Brighthouse.
The amount of income reclassified from AOCI into income (loss) from discontinued operations for the three months ended September 30, 2017 was not significant. The amount of income reclassified from AOCI into income (loss) from discontinued operations for the nine months ended September 30, 2017 was $16 million. For the three months and nine months ended September 30, 2016, the amount of income reclassified from AOCI into income (loss) from discontinued operations was $8 million and $24 million, respectively.
MetLife, Inc.
Notes to the Interim Condensed Consolidated Financial Statements (Unaudited) — (continued)
7. Derivatives (continued)
The following table presents the effects of derivatives in cash flow hedging relationships on the consolidated statements of operations and comprehensive income (loss) and the consolidated statements of equity. The table excludes the effects of Brighthouse derivatives prior to the Separation.
|
| | | | | | | | | | | | | | | | | | | | |
Derivatives in Cash Flow
Hedging Relationships | | Amount of Gains
(Losses) Deferred in
AOCI on Derivatives | | Amount and Location
of Gains (Losses)
Reclassified from
AOCI into Income (Loss) | | Amount and Location
of Gains (Losses)
Recognized in Income
(Loss) on Derivatives |
| | | (Effective Portion) | | (Effective Portion) | | (Ineffective Portion) |
| | | | | Net Derivative
Gains (Losses) | | Net Investment
Income | | Other
Expenses | | Net Derivative
Gains (Losses) |
| | | (In millions) |
| Three Months Ended September 30, 2017 | | | | | | | | | | |
| Interest rate swaps | | $ | 14 |
| | $ | 9 |
| | $ | 5 |
| | $ | — |
| | $ | (2 | ) |
| Interest rate forwards | | 1 |
| | (1 | ) | | — |
| | — |
| | — |
|
| Foreign currency swaps | | (140 | ) | | 294 |
| | — |
| | — |
| | (3 | ) |
| Credit forwards | | — |
| | — |
| | — |
| | — |
| | — |
|
| Total | | $ | (125 | ) | | $ | 302 |
| | $ | 5 |
| | $ | — |
| | $ | (5 | ) |
| Three Months Ended September 30, 2016 | | | | | | | | | | |
| Interest rate swaps | | $ | 22 |
| | $ | 28 |
| | $ | 3 |
| | $ | — |
| | $ | — |
|
| Interest rate forwards | | (7 | ) | | — |
| | — |
| | — |
| | — |
|
| Foreign currency swaps | | (23 | ) | | 54 |
| | — |
| | — |
| | (3 | ) |
| Credit forwards | | — |
| | — |
| | 1 |
| | — |
| | — |
|
| Total | | $ | (8 | ) | | $ | 82 |
| | $ | 4 |
| | $ | — |
| | $ | (3 | ) |
| Nine Months Ended September 30, 2017 | | | | | | | | | | |
| Interest rate swaps | | $ | 91 |
| | $ | 23 |
| | $ | 12 |
| | $ | — |
| | $ | 5 |
|
| Interest rate forwards | | 138 |
| | (5 | ) | | 2 |
| | 1 |
| | (1 | ) |
| Foreign currency swaps | | (99 | ) | | 915 |
| | (1 | ) | | 1 |
| | (2 | ) |
| Credit forwards | | — |
| | 1 |
| | — |
| | — |
| | — |
|
| Total | | $ | 130 |
| | $ | 934 |
| | $ | 13 |
| | $ | 2 |
| | $ | 2 |
|
| Nine Months Ended September 30, 2016 | | | | | | | | | | |
| Interest rate swaps | | $ | 339 |
| | $ | 44 |
| | $ | 9 |
| | $ | — |
| | $ | — |
|
| Interest rate forwards | | 33 |
| | — |
| | 2 |
| | 1 |
| | — |
|
| Foreign currency swaps | | 1,025 |
| | 90 |
| | (1 | ) | | 1 |
| | (1 | ) |
| Credit forwards | | — |
| | 3 |
| | 1 |
| | — |
| | — |
|
| Total | | $ | 1,397 |
| | $ | 137 |
| | $ | 11 |
| | $ | 2 |
| | $ | (1 | ) |
All components of eacheach derivative’s gain or loss were included in the assessment of hedge effectiveness.
AtSeptember June 30, 2017,2021, the Company expected to reclassify ($81)86) millionof deferred net gains (losses) on derivatives in AOCI to earnings within the next 12 months.
Hedges
MetLife, Inc.
Notes to the Interim Condensed Consolidated Financial Statements (Unaudited) — (continued)
7. Derivatives (continued)
NIFO Hedges
The Company uses foreign currency exchange rate derivatives, which may include foreign currency forwards and currency options, to hedge portions of its net investments in foreign operations against adverse movements in exchange rates. The Company measures ineffectiveness on thesealso designates a portion of its foreign-denominated debt as a non-derivative hedging instrument of its net investments in foreign operations. The Company assesses hedge effectiveness of its derivatives based upon the change in forward rates and assesses its non-derivative hedging instruments based upon the change in spot rates. All components of each derivative’s gain or loss were included in the assessment of hedge effectiveness.
When net investments in foreign operations are sold or substantially liquidated, the amounts in AOCI are reclassified to the statement of operations.
MetLife, Inc.
Notes to the Interim Condensed Consolidated Financial Statements (Unaudited) — (continued)
7. Derivatives (continued)
The following table presents the effects of derivatives in net investment hedging relationships on the consolidated statements of operationsAt June 30, 2021 and comprehensive income (loss) and the consolidated statements of equity:
|
| | | | |
| Derivatives in Net Investment Hedging Relationships (1), (2) | | Amount of Gains (Losses) Deferred in AOCI
(Effective Portion) |
| | | (In millions) |
| Three Months Ended September 30, 2017 | | |
| Foreign currency forwards | | $ | (35 | ) |
| Currency options | | (1 | ) |
| Total | | $ | (36 | ) |
| Three Months Ended September 30, 2016 | | |
| Foreign currency forwards | | $ | (23 | ) |
| Currency options | | (37 | ) |
| Total | | $ | (60 | ) |
| Nine Months Ended September 30, 2017 | | |
| Foreign currency forwards | | $ | (161 | ) |
| Currency options | | (234 | ) |
| Total | | $ | (395 | ) |
| Nine Months Ended September 30, 2016 | | |
| Foreign currency forwards | | $ | (358 | ) |
| Currency options | | (351 | ) |
| Total | | $ | (709 | ) |
__________________
| |
(1) | During both the three months and nine months endedSeptember 30, 2017and2016, there were no sales or substantial liquidations of net investments in foreign operations that would have required the reclassification of gains or losses from AOCI into earnings.
|
| |
(2) | There was no ineffectiveness recognized for the Company’s hedges of net investments in foreign operations. All components of each derivative’s gain or loss were included in the assessment of hedge effectiveness. |
At September 30, 2017 and December 31, 2016,2020, the cumulative foreign currency translation gain (loss) recorded in AOCI related to NIFO hedges of net investments in foreign operations was $359$239 million and $754$164 million, respectively. At June 30, 2021 and December 31, 2020, the carrying amount of debt designated as a non-derivative hedging instrument was $378 million and $407 million, respectively.
Credit Derivatives
In connection with synthetically created credit investment transactions, the Company writes credit default swaps for which it receives a premium to insure credit risk. Such credit derivatives are included within the nonqualifyingeffects of derivatives on the interim condensed consolidated statements of operations and derivatives for purposes other than hedgingcomprehensive income (loss) table. If a credit event occurs, as defined by the contract, the contract may be cash settled or it may be settled gross by the Company paying the counterparty the specified swap notional amount in exchange for the delivery of par quantities of the referenced credit obligation. The Company’s maximum amount at risk, assuming the value of all referenced credit obligations is zero, was $11.9$9.2 billion and $10.7$9.6 billion at SeptemberJune 30, 20172021 and December 31, 2016,2020, respectively. The Company can terminate these contracts at any time through cash settlement with the counterparty at an amount equal to the then current estimated fair value of the credit default swaps. At SeptemberJune 30, 20172021 and December 31, 2016,2020, the Company would have received $255$186 million and $152$196 million, respectively, to terminate all of these contracts.
MetLife, Inc.
Notes to the Interim Condensed Consolidated Financial Statements (Unaudited) — (continued)
7. DerivativesDerivatives (continued)
The following table presents the estimated fair value, maximum amount of future payments and weighted average years to maturity of written credit default swaps at:
| | | | | September 30, 2017 | | December 31, 2016 | | June 30, 2021 | | December 31, 2020 |
Rating Agency Designation of Referenced Credit Obligations (1) | | Estimated Fair Value of Credit Default Swaps | | Maximum
Amount of Future
Payments under
Credit Default
Swaps | | Weighted
Average
Years to
Maturity (2) | | Estimated Fair Value of Credit Default Swaps | | Maximum
Amount of Future
Payments under
Credit Default
Swaps | | Weighted
Average
Years to
Maturity (2) | Rating Agency Designation of Referenced
Credit Obligations (1) | | Estimated
Fair Value
of Credit
Default
Swaps | | Maximum
Amount of Future
Payments under
Credit Default
Swaps | | Weighted
Average
Years to
Maturity (2) | | Estimated
Fair Value
of Credit
Default
Swaps | | Maximum
Amount of Future
Payments under
Credit Default
Swaps | | Weighted
Average
Years to
Maturity (2) |
| | | (Dollars in millions) | | | (Dollars in millions) |
| Aaa/Aa/A | | | | | | | | | | | | | Aaa/Aa/A | |
| Single name credit default swaps (3) | | $ | 8 |
| | $ | 445 |
| | 2.5 |
| | $ | 6 |
| | $ | 449 |
| | 3.1 |
| Single name credit default swaps (3) | | $ | 5 | | | $ | 169 | | | 3.5 | | $ | 5 | | | $ | 208 | | | 2.7 |
| Credit default swaps referencing indices | | 43 |
| | 2,268 |
| | 3.0 |
| | 34 |
| | 2,335 |
| | 3.6 |
| Credit default swaps referencing indices | | 24 | | | 1,779 | | | 2.0 | | 27 | | | 1,779 | | | 2.5 |
| Subtotal | | 51 |
| | 2,713 |
| | 2.9 |
| | 40 |
| | 2,784 |
| | 3.5 |
| Subtotal | | 29 | | | 1,948 | | | 2.1 | | 32 | | | 1,987 | | | 2.5 |
| Baa | | | | | | | | | | | | | Baa | | | | | | | | | |
| Single name credit default swaps (3) | | 8 |
| | 685 |
| | 1.9 |
| | 5 |
| | 751 |
| | 2.5 |
| Single name credit default swaps (3) | | 2 | | | 139 | | | 2.6 | | 3 | | | 249 | | | 2.5 |
| Credit default swaps referencing indices | | 168 |
| | 8,073 |
| | 5.3 |
| | 88 |
| | 6,711 |
| | 5.0 |
| Credit default swaps referencing indices | | 155 | | | 7,027 | | | 5.1 | | 156 | | | 7,318 | | | 5.5 |
| Subtotal | | 176 |
| | 8,758 |
| | 5.0 |
| | 93 |
| | 7,462 |
| | 4.8 |
| Subtotal | | 157 | | | 7,166 | | | 5.1 | | 159 | | | 7,567 | | | 5.4 |
| Ba | | | | | | | | | | | | | Ba | | | | | | | | | |
| Single name credit default swaps (3) | | — |
| | 115 |
| | 3.6 |
| | (2 | ) | | 135 |
| | 4.1 |
| Single name credit default swaps (3) | | 0 | | | 12 | | | 4.5 | | 0 | | | 0 | | | — |
| Credit default swaps referencing indices | | — |
| | — |
| | — |
| | — |
| | — |
| | — |
| Credit default swaps referencing indices | | (1) | | | 20 | | | 4.5 | | 0 | | | 0 | | | — |
| Subtotal | | — |
| | 115 |
| | 3.6 |
| | (2 | ) | | 135 |
| | 4.1 |
| Subtotal | | (1) | | | 32 | | | 4.5 | | 0 | | | 0 | | | — |
| B | | | | | | | | | | | | | B | | | | | | | | | |
| Single name credit default swaps (3) | | 2 |
| | 30 |
| | 2.6 |
| | 1 |
| | 70 |
| | 1.8 |
| |
| | Credit default swaps referencing indices | | Credit default swaps referencing indices | | 5 | | | 55 | | | 4.5 | | 5 | | | 55 | | | 5.0 |
| Subtotal | | Subtotal | | 5 | | | 55 | | | 4.5 | | 5 | | | 55 | | | 5.0 |
| Caa3 | | Caa3 | | | | | | | | | |
| | Credit default swaps referencing indices | | 26 |
| | 330 |
| | 5.2 |
| | 20 |
| | 281 |
| | 5.0 |
| Credit default swaps referencing indices | | (4) | | | 15 | | | 4.5 | | 0 | | | 0 | | | — |
| Subtotal | | 28 |
| | 360 |
| | 5.0 |
| | 21 |
| | 351 |
| | 4.3 |
| Subtotal | | (4) | | | 15 | | | 4.5 | | 0 | | | 0 | | | — |
| Total | | $ | 255 |
| | $ | 11,946 |
| | 4.5 |
| | $ | 152 |
| | $ | 10,732 |
| | 4.4 |
| Total | | $ | 186 | | | $ | 9,216 | | | 4.5 | | $ | 196 | | | $ | 9,609 | | | 4.8 |
__________________
| |
(1) | The rating agency designations are based on availability and the midpoint of the applicable ratings among Moody’s Investors Service (“Moody’s”), Standard & Poor’s Global Ratings (“S&P”) and Fitch Ratings. If no rating is available from a rating agency, then an internally developed rating is used. |
| |
(2) | (1)The rating agency designations are based on availability and the midpoint of the applicable ratings among Moody’s Investors Service (“Moody’s”), S&P Global Ratings (“S&P”) and Fitch Ratings. If no rating is available from a rating agency, then an internally developed rating is used. (2)The weighted average years to maturity of the credit default swaps is calculated based on weighted average gross notional amounts. |
| |
(3) | Single name credit default swaps may be referenced to the credit of corporations, foreign governments, or state and political subdivisions. |
The Company has also entered into credit default swaps to purchaseis calculated based on weighted average gross notional amounts.
(3)Single name credit protection on certain of thedefault swaps may be referenced credit obligations in the table above. As a result, the maximum amount of potential future recoveries available to offset the $11.9 billion and $10.7 billion from the table above were $441 million and $30 million at September 30, 2017 and December 31, 2016, respectively.
MetLife, Inc.
Notes to the Interim Condensed Consolidated Financial Statements (Unaudited) — (continued)credit of corporations, foreign governments, or municipals.
7. Derivatives (continued)
Credit Risk on Freestanding Derivatives
The Company may be exposed to credit-related losses in the event of nonperformance by its counterparties to derivatives. Generally, the current credit exposure of the Company’s derivatives is limited to the net positive estimated fair value of derivatives at the reporting date after taking into consideration the existence of master netting or similar agreements and any collateral received pursuant to such agreements.
Derivatives may be exchange-traded or contracted in the over-the-counter (“OTC”) market. Certain of the Company’s OTC derivatives are cleared and settled through central clearinghouses (“OTC-cleared”), while others are bilateral contracts between two counterparties (“OTC-bilateral”).
MetLife, Inc.
Notes to the Interim Condensed Consolidated Financial Statements (Unaudited) — (continued)
7. Derivatives (continued)
The Company manages its credit risk related to derivatives by entering into transactions with creditworthy counterparties and establishing and monitoring exposure limits. The Company enters into contracts with counterparties in jurisdictions which it understands that close-out netting should be enforceable. The Company’s OTC-bilateral derivative transactions are generally governed by ISDAthe International Swaps and Derivatives Association, Inc. (“ISDA”) Master Agreements which provide for legally enforceable set-off and close-out netting of exposures to specific counterparties in the event of early termination of a transaction, which includes, but is not limited to, events of default and bankruptcy. In the event of an early termination, close-out netting permits the Company is permitted(subject to financial regulations such as the Orderly Liquidation Authority under Title II of Dodd-Frank) to set off receivables from the counterparty against payables to the same counterparty arising out of all included transactions. Substantially alltransactions and to apply collateral to the obligations, without application of the automatic stay, upon the counterparty’s bankruptcy. All of the Company’s ISDA Master Agreements also include Credit Support Annex provisions which require both the pledging and accepting of collateral in connection with its OTC-bilateral derivatives.derivatives as required by applicable law.
The Company’s OTC-cleared derivatives are effected through central clearing counterparties and its exchange-traded derivatives are effected through regulated exchanges. Such positions are marked to market and margined on a daily basis (both initial margin and variation margin), and the Company has minimal exposure to credit-related losses in the event of nonperformance by counterpartiesbrokers and central clearinghouses to such derivatives.
SeeSee Note 8 for a description of the impact of credit risk on the valuation of derivatives.
The estimated fair values of the Company’s net derivative assets and net derivative liabilities after the application of master netting agreements and collateral were as follows at:
| | | | | | | | | | | | | | | | | | | | | | | | | | |
| | June 30, 2021 | | December 31, 2020 |
| Derivatives Subject to a Master Netting Arrangement or a Similar Arrangement | | Assets | | Liabilities | | Assets | | Liabilities |
| | (In millions) |
| Gross estimated fair value of derivatives: | | | | | | | | |
| OTC-bilateral (1) | | $ | 9,971 | | | $ | 3,955 | | | $ | 11,348 | | | $ | 4,111 | |
| OTC-cleared (1) | | 495 | | | 30 | | | 593 | | | 20 | |
| Exchange-traded | | 9 | | | 17 | | | 17 | | | 40 | |
| Total gross estimated fair value of derivatives presented on the interim condensed consolidated balance sheets (1) | | 10,475 | | | 4,002 | | | 11,958 | | | 4,171 | |
| Gross amounts not offset on the interim condensed consolidated balance sheets: | | | | | | | | |
| Gross estimated fair value of derivatives: (2) | | | | | | | | |
| OTC-bilateral | | (2,453) | | | (2,453) | | | (2,926) | | | (2,926) | |
| OTC-cleared | | (10) | | | (10) | | | (7) | | | (7) | |
| Exchange-traded | | (1) | | | (1) | | | 0 | | | 0 | |
| Cash collateral: (3), (4) | | | | | | | | |
| OTC-bilateral | | (6,110) | | | 0 | | | (6,842) | | | 0 | |
| OTC-cleared | | (464) | | | (16) | | | (530) | | | (5) | |
| Exchange-traded | | 0 | | | (6) | | | 0 | | | (23) | |
| Securities collateral: (5) | | | | | | | | |
| OTC-bilateral | | (1,284) | | | (1,477) | | | (1,453) | | | (1,100) | |
| OTC-cleared | | 0 | | | (4) | | | 0 | | | (1) | |
| Exchange-traded | | 0 | | | (10) | | | 0 | | | (1) | |
| Net amount after application of master netting agreements and collateral | | $ | 153 | | | $ | 25 | | | $ | 200 | | | $ | 108 | |
|
| | | | | | | | | | | | | | | | |
| | | September 30, 2017 | | December 31, 2016 |
| Derivatives Subject to a Master Netting Arrangement or a Similar Arrangement (1) | | Assets | | Liabilities | | Assets | | Liabilities |
| | | (In millions) |
| Gross estimated fair value of derivatives: | | | | | | | | |
| OTC-bilateral (1) | | $ | 8,227 |
| | $ | 4,346 |
| | $ | 9,976 |
| | $ | 5,721 |
|
| OTC-cleared (1), (6) | | 621 |
| | 248 |
| | 2,275 |
| | 1,142 |
|
| Exchange-traded | | 17 |
| | 31 |
| | 33 |
| | 15 |
|
| Total gross estimated fair value of derivatives (1) | | 8,865 |
| | 4,625 |
| | 12,284 |
| | 6,878 |
|
| Amounts offset on the consolidated balance sheets | | — |
| | — |
| | — |
| | — |
|
| Estimated fair value of derivatives presented on the consolidated balance sheets (1), (6) | | 8,865 |
| | 4,625 |
| | 12,284 |
| | 6,878 |
|
| Gross amounts not offset on the consolidated balance sheets: | | | | | | | | |
| Gross estimated fair value of derivatives: (2) | | | | | | | | |
| OTC-bilateral | | (2,654 | ) | | (2,654 | ) | | (3,787 | ) | | (3,787 | ) |
| OTC-cleared | | (60 | ) | | (60 | ) | | (903 | ) | | (903 | ) |
| Exchange-traded | | (10 | ) | | (10 | ) | | (5 | ) | | (5 | ) |
| Cash collateral: (3), (4) | | | | | | | | |
| OTC-bilateral | | (4,351 | ) | | — |
| | (4,244 | ) | | (84 | ) |
| OTC-cleared | | (541 | ) | | (183 | ) | | (1,335 | ) | | (234 | ) |
| Exchange-traded | | — |
| | (13 | ) | | — |
| | (9 | ) |
| Securities collateral: (5) | | | | | | | | |
| OTC-bilateral | | (1,129 | ) | | (1,583 | ) | | (1,640 | ) | | (1,818 | ) |
| OTC-cleared | | — |
| | (5 | ) | | — |
| | — |
|
| Exchange-traded | | — |
| | (8 | ) | | — |
| | — |
|
| Net amount after application of master netting agreements and collateral | | $ | 120 |
| | $ | 109 |
| | $ | 370 |
| | $ | 38 |
|
__________________(1)At June 30, 2021 and December 31, 2020, derivative assets included income (expense) accruals reported in accrued investment income or in other liabilities of $114 million and $92 million, respectively, and derivative liabilities included (income) expense accruals reported in accrued investment income or in other liabilities of ($26) million and ($58) million, respectively.
(2)Estimated fair value of derivatives is limited to the amount that is subject to set-off and includes income or expense accruals.
MetLife, Inc.
Notes to the Interim Condensed Consolidated Financial Statements (Unaudited) — (continued)
7. DerivativesDerivatives (continued)
(3)Cash collateral received by the Company for OTC-bilateral and OTC-cleared derivatives, where the centralized clearinghouse treats variation margin as collateral, is included in cash and cash equivalents, short-term investments or in fixed maturity securities AFS, and the obligation to return it is included in payables for collateral under securities loaned and other transactions on the balance sheet. For certain collateral agreements, cash collateral is pledged to the Company as initial margin on its OTC-bilateral derivatives.
| |
(1) | At September 30, 2017 and December 31, 2016, derivative assets included income or (expense) accruals reported in accrued investment income or in other liabilities of $73 million and $145 million, respectively, and derivative liabilities included (income) or expense accruals reported in accrued investment income or in other liabilities of ($43) million and ($43) million, respectively. |
| |
(2) | Estimated fair value of derivatives is limited to the amount that is subject to set-off and includes income or expense accruals. |
| |
(3) | Cash collateral received by the Company for OTC-bilateral and OTC-cleared derivatives is included in cash and cash equivalents, short-term investments or in fixed maturity securities, and the obligation to return it is included in payables for collateral under securities loaned and other transactions on the balance sheet. |
| |
(4) | The receivable for the return of cash collateral provided by the Company is inclusive of initial margin on exchange-traded and OTC-cleared derivatives and is included in premiums, reinsurance and other receivables on the balance sheet. The amount of cash collateral offset in the table above is limited to the net estimated fair value of derivatives after application of netting agreements. At September 30, 2017 and December 31, 2016, the Company received excess cash collateral of $284 million and $164 million, respectively, and provided excess cash collateral of $281 million and $461 million, respectively, which is not included in the table above due to the foregoing limitation. |
| |
(5) | Securities collateral received by the Company is held in separate custodial accounts and is not recorded on the balance sheet. Subject to certain constraints, the Company is permitted by contract to sell or re-pledge this collateral, but at September 30, 2017, none of the collateral had been sold or re-pledged. Securities collateral pledged by the Company is reported in fixed maturity securities on the balance sheet. Subject to certain constraints, the counterparties are permitted by contract to sell or re-pledge this collateral. The amount of securities collateral offset in the table above is limited to the net estimated fair value of derivatives after application of netting agreements and cash collateral. At September 30, 2017 and December 31, 2016, the Company received excess securities collateral with an estimated fair value of $148 million and $82 million, respectively, for its OTC-bilateral derivatives, which are not included in the table above due to the foregoing limitation. At September 30, 2017 and December 31, 2016, the Company provided excess securities collateral with an estimated fair value of $364 million and $189 million, respectively, for its OTC-bilateral derivatives, and $440 million and $544 million, respectively, for its OTC-cleared derivatives, and $101 million and $116 million, respectively, for its exchange-traded derivatives, which are not included in the table above due to the foregoing limitation. |
| |
(6) | Effective January 3, 2017, the CME amended its rulebook, resulting in the characterization of variation margin transfers as settlement payments, as opposed to adjustments to collateral. See Note 1 for further information on the CME amendments. |
(4)The receivable for the return of cash collateral provided by the Company is inclusive of initial margin on exchange-traded and OTC-cleared derivatives and is included in premiums, reinsurance and other receivables on the balance sheet. The amount of cash collateral offset in the table above is limited to the net estimated fair value of derivatives after application of netting agreements. At June 30, 2021 and December 31, 2020, the Company received excess cash collateral of $106 million and $265 million, respectively, and provided excess cash collateral of $229 million and $238 million, respectively, which is not included in the table above due to the foregoing limitation.
(5)Securities collateral received by the Company is held in separate custodial accounts and is not recorded on the balance sheet. Subject to certain constraints, the Company is permitted by contract to sell or re-pledge this collateral, but at June 30, 2021, NaN of the collateral had been sold or re-pledged. Securities collateral pledged by the Company is reported in fixed maturity securities AFS on the balance sheet. Subject to certain constraints, the counterparties are permitted by contract to sell or re-pledge this collateral. The amount of securities collateral offset in the table above is limited to the net estimated fair value of derivatives after application of netting agreements and cash collateral. At June 30, 2021 and December 31,2020, the Company received excess securities collateral with an estimated fair value of $57 million and $231 million, respectively, for its OTC-bilateral derivatives, which are not included in the table above due to the foregoing limitation. At June 30, 2021 and December 31, 2020, the Company provided excess securities collateral with an estimated fair value of $173 million and $269 million, respectively, for its OTC-bilateral derivatives, $1.3 billion and $2.1 billion, respectively, for its OTC-cleared derivatives, and $233 million and $318 million, respectively, for its exchange-traded derivatives, which are not included in the table above due to the foregoing limitation.
The Company’s collateral arrangements for its OTC-bilateral derivatives generally require the counterparty in a net liability position, after considering the effect of netting agreements, to pledge collateral when the collateral amount owed by that counterparty reaches a minimum transfer amount. A small number of these arrangements also include credit-contingent provisions that include a threshold above which collateral must be posted. Such agreements provide for a reduction of these thresholds (on a sliding scale that converges toward zero) in the event of downgrades in the credit ratings of MetLife, Inc. and/or the counterparty. In addition, substantially allAll of the Company’s netting agreements for derivatives contain provisions that require both the Company and the counterparty to maintain a specific investment grade credit rating from each of Moody’s and S&P. If a party’s credit or financial strength rating, as applicable, were to fall below that specific investment grade credit rating, that party would be in violation of these provisions, and the other party to the derivatives could terminate the transactions and demand immediate settlement and payment based on such party’s reasonable valuation of the derivatives. A small number of these arrangements also include credit-contingent provisions that include a threshold above which collateral must be posted. Such agreements provide for a reduction of these thresholds (on a sliding scale that converges toward zero) in the event of downgrades in the credit ratings of MetLife, Inc. and/or the counterparty. At June 30, 2021, the amount of collateral not provided by the Company due to the existence of these thresholds was $15 million.
The following table presents the estimated fair value of the Company’s OTC-bilateral derivatives that arewere in a net liability position after considering the effect of netting agreements, together with the estimated fair value and balance sheet location of the collateral pledged. The table also presents
| | | | | | | | | | | | | | | | | | | | | | | | | | | | | | | | | | | | | | |
| | June 30, 2021 | | December 31, 2020 |
| | Derivatives
Subject to
Credit-
Contingent
Provisions | | Derivatives
Not Subject
to Credit-
Contingent
Provisions | | Total | | Derivatives
Subject to
Credit-
Contingent
Provisions | | Derivatives
Not Subject
to Credit-
Contingent
Provisions | | Total |
| | (In millions) |
| Estimated fair value of derivatives in a net liability position (1) | | $ | 1,479 | | | $ | 23 | | | $ | 1,502 | | | $ | 1,182 | | | $ | 3 | | | $ | 1,185 | |
| Estimated fair value of collateral provided: | | | | | | | | | | | | |
| Fixed maturity securities AFS | | $ | 1,584 | | | $ | 20 | | | $ | 1,604 | | | $ | 1,222 | | | $ | 2 | | | $ | 1,224 | |
__________________
(1)After taking into consideration the incremental collateral that MetLife, Inc. would be required to provide if there was a one-notch downgrade in MetLife, Inc.’s senior unsecured debt rating at the reporting date or if the Company’s credit or financial strength rating, as applicable, sustained a downgrade to a level that triggered full overnight collateralization or terminationexistence of the derivative position at the reporting date. OTC-bilateral derivatives that are not subject to collateral agreements are excluded from this table.
netting agreements.
MetLife, Inc.
Notes to the Interim Condensed Consolidated Financial Statements (Unaudited) — (continued)
7. DerivativesDerivatives (continued)
|
| | | | | | | | | | | | | | | | | | | | | | | | |
| | | September 30, 2017 | | December 31, 2016 |
| | | Derivatives
Subject to
Credit-
Contingent
Provisions | | Derivatives
Not Subject
to Credit-
Contingent
Provisions | | Total | | Derivatives Subject to Credit- Contingent Provisions | | Derivatives
Not Subject
to Credit-
Contingent
Provisions | | Total |
| | | (In millions) |
| Estimated Fair Value of Derivatives in a Net Liability Position (1) | | $ | 1,665 |
| | $ | 27 |
| | $ | 1,692 |
| | $ | 1,909 |
| | $ | 25 |
| | $ | 1,934 |
|
| Estimated Fair Value of Collateral Provided: | | | | | | | | | | | | |
| Fixed maturity securities | | $ | 1,829 |
| | $ | 24 |
| | $ | 1,853 |
| | $ | 1,965 |
| | $ | 31 |
| | $ | 1,996 |
|
| Cash | | $ | — |
| | $ | — |
| | $ | — |
| | $ | 91 |
| | $ | — |
| | $ | 91 |
|
| Estimated Fair Value of Incremental Collateral Provided Upon: | | | | | |
| | | | | |
|
| One-notch downgrade in the Company’s credit or financial strength rating, as applicable | | $ | 7 |
| | $ | — |
| | $ | 7 |
| | $ | 6 |
| | $ | — |
| | $ | 6 |
|
| Downgrade in the Company’s credit or financial strength rating, as applicable, to a level that triggers full overnight collateralization or termination of the derivative position | | $ | 12 |
| | $ | — |
| | $ | 12 |
| | $ | 9 |
| | $ | — |
| | $ | 9 |
|
__________________
| |
(1) | After taking into consideration the existence of netting agreements. |
Embedded Derivatives
The Company issues certain products or purchases certain investments that contain embedded derivatives that are required to be separated from their host contracts and accounted for as freestanding derivatives. These host contracts principally include: variable annuities with guaranteed minimum benefits, including GMWBs, GMABs and certain GMIBs; ceded reinsurance of guaranteed minimum benefits related to certain GMIBs; assumed reinsurance of guaranteed minimum benefits related to GMWBs and GMABs; funding agreements with equity or bond indexed crediting rates; funds withheld on ceded reinsurance; fixed annuities with equity-indexed returns; and certain debt and equity securities.
The following table presents the estimated fair value and balance sheet location of the Company’s embedded derivatives that have been separated from their host contracts at:
| | | | | | | | | | | | | | | | | | | | |
| | Balance Sheet Location | | June 30, 2021 | | December 31, 2020 |
| | | | (In millions) |
| Embedded derivatives within asset host contracts: | | | | | | |
| Ceded guaranteed minimum benefits | | Premiums, reinsurance and other receivables | | $ | 48 | | | $ | 55 | |
| Embedded derivatives within liability host contracts: | | | | | | |
| Direct guaranteed minimum benefits | | Policyholder account balances | | $ | 230 | | | $ | 651 | |
| Assumed guaranteed minimum benefits | | Policyholder account balances | | 146 | | | 283 | |
| Funds withheld on ceded reinsurance | | Other liabilities | | 71 | | | 100 | |
| Fixed annuities with equity indexed returns | | Policyholder account balances | | 162 | | | 138 | |
| Other guarantees | | Policyholder account balances | | 13 | | | 24 | |
| Embedded derivatives within liability host contracts | | $ | 622 | | | $ | 1,196 | |
|
| | | | | | | | | | |
| | | Balance Sheet Location | | September 30, 2017 | | December 31, 2016 |
| | | | | (In millions) |
| Embedded derivatives within asset host contracts: | | | | | | |
| Ceded guaranteed minimum benefits | | Premiums, reinsurance and other receivables | | $ | 145 |
| | $ | 143 |
|
| Options embedded in debt or equity securities | | Investments | | (140 | ) | | (88 | ) |
| Embedded derivatives within asset host contracts | | $ | 5 |
| | $ | 55 |
|
| Embedded derivatives within liability host contracts: | | | | | | |
| Direct guaranteed minimum benefits | | Policyholder account balances | | $ | 99 |
| | $ | 361 |
|
| Assumed guaranteed minimum benefits | | Policyholder account balances | | 1,240 |
| | 1,205 |
|
| Funds withheld on ceded reinsurance | | Other liabilities | | 6 |
| | (30 | ) |
| Fixed annuities with equity indexed returns | | Policyholder account balances | | 54 |
| | 18 |
|
| Embedded derivatives within liability host contracts | | $ | 1,399 |
| | $ | 1,554 |
|
MetLife, Inc.
Notes to the Interim Condensed Consolidated Financial Statements (Unaudited) — (continued)
7. Derivatives (continued)
The following table presents changes in estimated fair value related to embedded derivatives:
|
| | | | | | | | | | | | | | | | |
| | | Three Months
Ended
September 30, | | Nine Months
Ended
September 30, |
| | | 2017 | | 2016 | | 2017 | | 2016 |
| | | (In millions) |
| Net derivative gains (losses) (1) | | $ | 234 |
| | $ | 277 |
| | $ | 421 |
| | $ | (1,480 | ) |
__________________
| |
(1) | The valuation of guaranteed minimum benefits includes a nonperformance risk adjustment. The amounts included in net derivative gains (losses) in connection with this adjustment were ($52) million and ($161) million for the three months and nine months ended September 30, 2017, respectively, and ($154) million and $738 million for the three months and nine months ended September 30, 2016, respectively. |
8. Fair Value
Considerable judgment is often required in interpreting the market data used to develop estimates of fair value, and the use of different assumptions or valuation methodologies may have a material effect on the estimated fair value amounts.
MetLife, Inc.
Notes to the Interim Condensed Consolidated Financial Statements (Unaudited) — (continued)
8. Fair Value (continued)
Recurring Fair Value Measurements
The assets and liabilities measured at estimated fair value on a recurring basis and their corresponding placement in the fair value hierarchy, including those items for which the Company has elected the FVO, are presented below at:
| | | | | | | | | | | | | | | | | | | | | | | | | | |
| | June 30, 2021 (1) |
| | Fair Value Hierarchy | | |
| | Level 1 | | Level 2 | | Level 3 | | Total Estimated Fair Value |
| | (In millions) |
| Assets | | | | | | | | |
| Fixed maturity securities AFS: | | | | | | | | |
| U.S. corporate | | $ | 0 | | | $ | 81,143 | | | $ | 10,228 | | | $ | 91,371 | |
| Foreign government | | 0 | | | 64,485 | | | 145 | | | 64,630 | |
| Foreign corporate | | 0 | | | 52,060 | | | 13,545 | | | 65,605 | |
| U.S. government and agency | | 25,709 | | | 20,847 | | | 0 | | | 46,556 | |
| RMBS | | 111 | | | 26,150 | | | 3,587 | | | 29,848 | |
| ABS | | 0 | | | 15,087 | | | 1,626 | | | 16,713 | |
| Municipals | | 0 | | | 13,923 | | | 0 | | | 13,923 | |
| CMBS | | 0 | | | 11,259 | | | 790 | | | 12,049 | |
| Total fixed maturity securities AFS | | 25,820 | | | 284,954 | | | 29,921 | | | 340,695 | |
| Equity securities | | 662 | | | 196 | | | 143 | | | 1,001 | |
| Unit-linked and FVO Securities (2) | | 9,573 | | | 1,755 | | | 849 | | | 12,177 | |
| Short-term investments (3) | | 2,683 | | | 400 | | | 113 | | | 3,196 | |
| Residential mortgage loans — FVO | | 0 | | | 0 | | | 140 | | | 140 | |
| Other investments | | 0 | | | 320 | | | 781 | | | 1,101 | |
| Derivative assets: (4) | | | | | | | | |
| Interest rate | | 0 | | | 6,974 | | | 74 | | | 7,048 | |
| Foreign currency exchange rate | | 0 | | | 2,138 | | | 90 | | | 2,228 | |
| Credit | | 0 | | | 181 | | | 23 | | | 204 | |
| Equity market | | 9 | | | 872 | | | 0 | | | 881 | |
| Total derivative assets | | 9 | | | 10,165 | | | 187 | | | 10,361 | |
| Embedded derivatives within asset host contracts (5) | | 0 | | | 0 | | | 48 | | | 48 | |
| Separate account assets (6) | | 84,137 | | | 104,556 | | | 1,254 | | | 189,947 | |
| Total assets (7) | | $ | 122,884 | | | $ | 402,346 | | | $ | 33,436 | | | $ | 558,666 | |
| Liabilities | | | | | | | | |
| Derivative liabilities: (4) | | | | | | | | |
| Interest rate | | $ | 4 | | | $ | 283 | | | $ | 51 | | | $ | 338 | |
| Foreign currency exchange rate | | 4 | | | 2,935 | | | 73 | | | 3,012 | |
| Credit | | 0 | | | 115 | | | 6 | | | 121 | |
| Equity market | | 9 | | | 548 | | | 0 | | | 557 | |
| Total derivative liabilities | | 17 | | | 3,881 | | | 130 | | | 4,028 | |
| Embedded derivatives within liability host contracts (5) | | 0 | | | 0 | | | 622 | | | 622 | |
| Separate account liabilities (6) | | 5 | | | 10 | | | 5 | | | 20 | |
| Total liabilities | | $ | 22 | | | $ | 3,891 | | | $ | 757 | | | $ | 4,670 | |
MetLife, Inc.
Notes to the Interim Condensed Consolidated Financial Statements (Unaudited) — (continued)
8. Fair Value (continued)
| | | | | | | | | | | | | | | | | | | | | | | | | | |
| | December 31, 2020 (1) |
| | Fair Value Hierarchy | | |
| | Level 1 | | Level 2 | | Level 3 | | Total Estimated Fair Value |
| | (In millions) |
| Assets | | | | | | | | |
| Fixed maturity securities AFS: | | | | | | | | |
| U.S. corporate | | $ | 0 | | | $ | 83,214 | | | $ | 10,202 | | | $ | 93,416 | |
| Foreign government | | 0 | | | 71,582 | | | 117 | | | 71,699 | |
| Foreign corporate | | 0 | | | 55,509 | | | 13,899 | | | 69,408 | |
| U.S. government and agency | | 23,180 | | | 23,920 | | | 0 | | | 47,100 | |
| RMBS | | 0 | | | 27,133 | | | 3,302 | | | 30,435 | |
| ABS | | 0 | | | 15,734 | | | 1,385 | | | 17,119 | |
| Municipals | | 0 | | | 13,722 | | | 0 | | | 13,722 | |
| CMBS | | 0 | | | 11,308 | | | 602 | | | 11,910 | |
| Total fixed maturity securities AFS | | 23,180 | | | 302,122 | | | 29,507 | | | 354,809 | |
| Equity securities | | 636 | | | 293 | | | 150 | | | 1,079 | |
| Unit-linked and FVO Securities (2) | | 10,559 | | | 2,059 | | | 701 | | | 13,319 | |
| Short-term investments (3) | | 2,762 | | | 568 | | | 43 | | | 3,373 | |
| | | | | | | | |
| Residential mortgage loans — FVO | | 0 | | | 0 | | | 165 | | | 165 | |
| | | | | | | | |
| | | | | | | | |
| Other investments | | 83 | | | 229 | | | 573 | | | 885 | |
| Derivative assets: (4) | | | | | | | | |
| Interest rate | | 0 | | | 7,840 | | | 489 | | | 8,329 | |
| Foreign currency exchange rate | | 3 | | | 2,287 | | | 176 | | | 2,466 | |
| Credit | | 0 | | | 180 | | | 25 | | | 205 | |
| Equity market | | 14 | | | 830 | | | 22 | | | 866 | |
| Total derivative assets | | 17 | | | 11,137 | | | 712 | | | 11,866 | |
| Embedded derivatives within asset host contracts (5) | | 0 | | | 0 | | | 55 | | | 55 | |
| Separate account assets (6) | | 91,850 | | | 107,035 | | | 1,085 | | | 199,970 | |
| Total assets (7) | | $ | 129,087 | | | $ | 423,443 | | | $ | 32,991 | | | $ | 585,521 | |
| Liabilities | | | | | | | | |
| Derivative liabilities: (4) | | | | | | | | |
| Interest rate | | $ | 2 | | | $ | 168 | | | $ | 68 | | | $ | 238 | |
| Foreign currency exchange rate | | 0 | | | 3,063 | | | 38 | | | 3,101 | |
| Credit | | 0 | | | 121 | | | 0 | | | 121 | |
| Equity market | | 38 | | | 719 | | | 12 | | | 769 | |
| Total derivative liabilities | | 40 | | | 4,071 | | | 118 | | | 4,229 | |
| Embedded derivatives within liability host contracts (5) | | 0 | | | 0 | | | 1,196 | | | 1,196 | |
| Separate account liabilities (6) | | 12 | | | 8 | | | 6 | | | 26 | |
| Total liabilities | | $ | 52 | | | $ | 4,079 | | | $ | 1,320 | | | $ | 5,451 | |
__________________
(1)Excludes amounts for financial instruments reclassified to assets held-for-sale or liabilities held-for-sale. Assets held-for-sale and liabilities held-for-sale are valued on a basis consistent with similar instruments described herein. See Note 3 for information on the Company’s business dispositions.
(2)Unit-linked and FVO Securities were primarily comprised of Unit-linked investments at both June 30, 2021 and December 31, 2020.
|
| | | | | | | | | | | | | | | | |
| | | September 30, 2017 |
| | | Fair Value Hierarchy | | |
| | | Level 1 | | Level 2 | | Level 3 | | Total
Estimated
Fair Value |
| | | (In millions) |
| Assets | | | | | | | | |
| Fixed maturity securities: | | | | | | | | |
| U.S. corporate | | $ | — |
| | $ | 75,807 |
| | $ | 5,848 |
| | $ | 81,655 |
|
| Foreign government | | — |
| | 60,591 |
| | 198 |
| | 60,789 |
|
| Foreign corporate | | — |
| | 48,870 |
| | 6,270 |
| | 55,140 |
|
| U.S. government and agency | | 26,275 |
| | 21,389 |
| | — |
| | 47,664 |
|
| RMBS | | 513 |
| | 27,233 |
| | 3,652 |
| | 31,398 |
|
| State and political subdivision | | — |
| | 12,284 |
| | 61 |
| | 12,345 |
|
| ABS | | — |
| | 11,199 |
| | 572 |
| | 11,771 |
|
| CMBS | | — |
| | 7,823 |
| | 309 |
| | 8,132 |
|
| Total fixed maturity securities | | 26,788 |
| | 265,196 |
| | 16,910 |
| | 308,894 |
|
| Equity securities | | 1,332 |
| | 1,020 |
| | 424 |
| | 2,776 |
|
| FVO securities (1) | | 13,906 |
| | 2,328 |
| | 304 |
| | 16,538 |
|
| Short-term investments (2) | | 3,925 |
| | 2,310 |
| | 403 |
| | 6,638 |
|
| Residential mortgage loans — FVO | | — |
| | — |
| | 564 |
| | 564 |
|
| Other investments | | 80 |
| | 114 |
| | — |
| | 194 |
|
| Derivative assets: (3) | | | | | | | | |
| Interest rate | | 13 |
| | 5,698 |
| | 3 |
| | 5,714 |
|
| Foreign currency exchange rate | | — |
| | 2,218 |
| | 104 |
| | 2,322 |
|
| Credit | | — |
| | 229 |
| | 38 |
| | 267 |
|
| Equity market | | 4 |
| | 358 |
| | 127 |
| | 489 |
|
| Total derivative assets | | 17 |
| | 8,503 |
| | 272 |
| | 8,792 |
|
| Embedded derivatives within asset host contracts (4) | | — |
| | — |
| | 145 |
| | 145 |
|
| Separate account assets (5) | | 87,151 |
| | 115,207 |
| | 1,041 |
| | 203,399 |
|
| Total assets | | $ | 133,199 |
| | $ | 394,678 |
| | $ | 20,063 |
| | $ | 547,940 |
|
| Liabilities | | | | | | | | |
| Derivative liabilities: (3) | | | | | | | | |
| Interest rate | | $ | — |
| | $ | 655 |
| | $ | 212 |
| | $ | 867 |
|
| Foreign currency exchange rate | | 3 |
| | 2,686 |
| | 38 |
| | 2,727 |
|
| Credit | | — |
| | 47 |
| | — |
| | 47 |
|
| Equity market | | 28 |
| | 714 |
| | 285 |
| | 1,027 |
|
| Total derivative liabilities | | 31 |
| | 4,102 |
| | 535 |
| | 4,668 |
|
| Embedded derivatives within liability host contracts (4) | | — |
| | — |
| | 1,399 |
| | 1,399 |
|
| Separate account liabilities (5) | | 1 |
| | 6 |
| | 2 |
| | 9 |
|
| Total liabilities | | $ | 32 |
| | $ | 4,108 |
| | $ | 1,936 |
| | $ | 6,076 |
|
MetLife, Inc.
Notes to the Interim Condensed Consolidated Financial Statements (Unaudited) — (continued)
8. Fair Value (continued)
(3)Short-term investments as presented in the tables above differ from the amounts presented on the interim condensed consolidated balance sheets because certain short-term investments are not measured at estimated fair value on a recurring basis.
(4)Derivative assets are presented within other invested assets on the interim condensed consolidated balance sheets and derivative liabilities are presented within other liabilities on the interim condensed consolidated balance sheets. The amounts are presented gross in the tables above to reflect the presentation on the interim condensed consolidated balance sheets, but are presented net for purposes of the rollforward in the Fair Value Measurements Using Significant Unobservable Inputs (Level 3) tables. |
| | | | | | | | | | | | | | | | |
| | | December 31, 2016 |
| | | Fair Value Hierarchy | | |
| | | Level 1 | | Level 2 | | Level 3 | | Total
Estimated
Fair Value |
| | | (In millions) |
| Assets | | | | | | | | |
| Fixed maturity securities: | | | | | | | | |
| U.S. corporate | | $ | — |
| | $ | 72,811 |
| | $ | 5,732 |
| | $ | 78,543 |
|
| Foreign government | | — |
| | 55,687 |
| | 289 |
| | 55,976 |
|
| Foreign corporate | | — |
| | 44,858 |
| | 5,805 |
| | 50,663 |
|
| U.S. government and agency | | 24,943 |
| | 19,490 |
| | — |
| | 44,433 |
|
| RMBS | | — |
| | 25,194 |
| | 3,838 |
| | 29,032 |
|
| State and political subdivision | | — |
| | 12,221 |
| | 10 |
| | 12,231 |
|
| ABS | | — |
| | 10,196 |
| | 1,029 |
| | 11,225 |
|
| CMBS | | — |
| | 7,112 |
| | 348 |
| | 7,460 |
|
| Total fixed maturity securities | | 24,943 |
| | 247,569 |
| | 17,051 |
| | 289,563 |
|
| Equity securities | | 1,334 |
| | 1,092 |
| | 468 |
| | 2,894 |
|
| FVO securities (1) | | 11,123 |
| | 2,513 |
| | 287 |
| | 13,923 |
|
| Short-term investments (2) | | 4,091 |
| | 1,868 |
| | 46 |
| | 6,005 |
|
| Residential mortgage loans — FVO | | — |
| | — |
| | 566 |
| | 566 |
|
| Other investments | | 86 |
| | 71 |
| | — |
| | 157 |
|
| Derivative assets: (3) | | | | | | | | |
| Interest rate | | 3 |
| | 7,556 |
| | 2 |
| | 7,561 |
|
| Foreign currency exchange rate | | — |
| | 3,783 |
| | 80 |
| | 3,863 |
|
| Credit | | — |
| | 145 |
| | 30 |
| | 175 |
|
| Equity market | | 30 |
| | 390 |
| | 120 |
| | 540 |
|
| Total derivative assets | | 33 |
| | 11,874 |
| | 232 |
| | 12,139 |
|
| Embedded derivatives within asset host contracts (4) | | — |
| | — |
| | 143 |
| | 143 |
|
| Separate account assets (5) | | 82,818 |
| | 111,612 |
| | 1,148 |
| | 195,578 |
|
| Total assets | | $ | 124,428 |
| | $ | 376,599 |
| | $ | 19,941 |
| | $ | 520,968 |
|
| Liabilities | | | | | | | | |
| Derivative liabilities: (3) | | | | | | | | |
| Interest rate | | $ | 12 |
| | $ | 1,713 |
| | $ | 500 |
| | $ | 2,225 |
|
| Foreign currency exchange rate | | — |
| | 3,784 |
| | 54 |
| | 3,838 |
|
| Credit | | — |
| | 49 |
| | — |
| | 49 |
|
| Equity market | | 3 |
| | 566 |
| | 240 |
| | 809 |
|
| Total derivative liabilities | | 15 |
| | 6,112 |
| | 794 |
| | 6,921 |
|
| Embedded derivatives within liability host contracts (4) | | — |
| | — |
| | 1,554 |
| | 1,554 |
|
| Separate account liabilities (5) | | — |
| | 16 |
| | 7 |
| | 23 |
|
| Total liabilities | | $ | 15 |
| | $ | 6,128 |
| | $ | 2,355 |
| | $ | 8,498 |
|
__________________
| |
(1) | FVO securities were comprised of over 85% FVO contractholder-directed unit-linked investments at both September 30, 2017 and December 31, 2016. |
| |
(2) | Short-term investments as presented in the tables above differ from the amounts presented on the consolidated balance sheets because certain short-term investments are not measured at estimated fair value on a recurring basis. |
MetLife, Inc.
Notes(6)Investment performance related to separate account assets is fully offset by corresponding amounts credited to contractholders whose liability is reflected within separate account liabilities. Separate account liabilities are set equal to the Interim Condensed Consolidated Financial Statements (Unaudited) — (continued)estimated fair value of separate account assets. Separate account liabilities presented in the tables above represent derivative liabilities.
8. Fair Value (continued)
(7)Total assets included in the fair value hierarchy exclude other limited partnership interests that are measured at estimated fair value using the net asset value (“NAV”) per share (or its equivalent) practical expedient. At both, June 30, 2021 and December 31, 2020, the estimated fair value of such investments was $75 million.
| |
(3) | Derivative assets are presented within other invested assets on the consolidated balance sheets and derivative liabilities are presented within other liabilities on the consolidated balance sheets. The amounts are presented gross in the tables above to reflect the presentation on the consolidated balance sheets, but are presented net for purposes of the rollforward in the Fair Value Measurements Using Significant Unobservable Inputs (Level 3) tables. |
| |
(4) | Embedded derivatives within asset host contracts are presented within premiums, reinsurance and other receivables and other invested assets on the consolidated balance sheets. Embedded derivatives within liability host contracts are presented within policyholder account balances, future policy benefits and other liabilities on the consolidated balance sheets. At September 30, 2017 and December 31, 2016, debt and equity securities also included embedded derivatives of ($140) million and ($88) million, respectively. |
| |
(5) | Investment performance related to separate account assets is fully offset by corresponding amounts credited to contractholders whose liability is reflected within separate account liabilities. Separate account liabilities are set equal to the estimated fair value of separate account assets. Separate account liabilities presented in the tables above represent derivative liabilities. |
The following describes the valuation methodologies used to measure assets and liabilities at fair value. The description includes the valuation techniques and key inputs for each category of assets or liabilities that are classified within Level 2 and Level 3 of the fair value hierarchy.
Investments
Valuation Controls and Procedures
On behalf of the Company’s Chief Investment Officer and Chief Financial Officer, a pricing and valuation committee that is independent of the trading and investing functions and comprised of senior management, provides oversight of control systems and valuation policies for securities, mortgage loans and derivatives. On a quarterly basis, this committee reviews and approves new transaction types and markets, ensures that observable market prices and market-based parameters are used for valuation, wherever possible, and determines that judgmental valuation adjustments, when applied, are based upon established policies and are applied consistently over time. This committee also provides oversight of the selection of independent third-party pricing providers and the controls and procedures to evaluate third-party pricing. Periodically, the Chief Accounting Officer reports to the Audit Committee of MetLife, Inc.’s Board of Directors regarding compliance with fair value accounting standards.
The Company reviews its valuation methodologies on an ongoing basis and revises those methodologies when necessary based on changing market conditions. Assurance is gained on the overall reasonableness and consistent application of input assumptions, valuation methodologies and compliance with fair value accounting standards through controls designed to ensure valuations represent an exit price. Several controls are utilized, including certain monthly controls, which include, but are not limited to, analysis of portfolio returns to corresponding benchmark returns, comparing a sample of executed prices of securities sold to the fair value estimates, comparing fair value estimates to management’s knowledge of the current market, reviewing the bid/ask spreads to assess activity, comparing prices from multiple independent pricing services and ongoing due diligence to confirm that independent pricing services use market-based parameters. The process includes a determination of the observability of inputs used in estimated fair values received from independent pricing services or brokers by assessing whether these inputs can be corroborated by observable market data. The Company ensures that prices received from independent brokers, also referred to herein as “consensus pricing,” represent a reasonable estimate of fair value by considering such pricing relative to the Company’s knowledge of the current market dynamics and current pricing for similar financial instruments. While independent non-binding broker quotations are utilized, they are not used for a significant portion of the portfolio. For example, fixed maturity securities priced using independent non-binding broker quotations represent less than 1% of the total estimated fair value of fixed maturity securities and 2% of the total estimated fair value of Level 3 fixed maturity securities at September 30, 2017.
MetLife, Inc.
Notes to the Interim Condensed Consolidated Financial Statements (Unaudited) — (continued)
8. Fair Value (continued)
The Company also applies a formal process to challenge any prices received from independent pricing services that are not considered representative of estimated fair value. If prices received from independent pricing services are not considered reflective of market activity or representative of estimated fair value, independent non-binding broker quotations are obtained, or an internally developed valuation is prepared. Internally developed valuations of current estimated fair value, which reflect internal estimates of liquidity and nonperformance risks, compared with pricing received from the independent pricing services, did not produce material differences in the estimated fair values for the majority of the portfolio; accordingly, overrides were not material. This is, in part, because internal estimates of liquidity and nonperformance risks are generally based on available market evidence and estimates used by other market participants. In the absence of such market-based evidence, management’s best estimate is used.
Securities, Short-term Investments and Other Investments
When available, the estimated fair value of these financial instruments is based on quoted prices in active markets that are readily and regularly obtainable. Generally, these are the most liquid of the Company’s securities holdings and valuation of these securities does not involve management’s judgment.
When quoted prices in active markets are not available, the determination of estimated fair value of securities is based on market standard valuation methodologies, giving priority to observable inputs. The significant inputs to the market standard valuation methodologies for certain types of securities with reasonable levels of price transparency are inputs that are observable in the market or can be derived principally from, or corroborated by, observable market data. When observable inputs are not available, the market standard valuation methodologies rely on inputs that are significant to the estimated fair value that are not observable in the market or cannot be derived principally from, or corroborated by, observable market data. These unobservable inputs can be based in large part on management’s judgment or estimation and cannot be supported by reference to market activity. Even though these inputs are unobservable, management believes they are consistent with what other market participants would use when pricing such securities and are considered appropriate given the circumstances.
The estimated fair value of short-term investments in certain separate accounts included in FVO contractholder-directed unit-linked investments, FVO securities and other investments is determined on a basis consistent with the methodologies described hereinherein.
The valuation approaches and key inputs for securities.
each category of assets or liabilities that are classified within Level 2 and Level 3 of the fair value hierarchy are presented below. The primary valuation approaches are the market approach, which considers recent prices from market transactions involving identical or similar assets or liabilities, and the income approach, which converts expected future amounts (e.g. cash flows) to a single current, discounted amount. The valuation of most instruments listed below is determined using independent pricing sources, matrix pricing, discounted cash flow methodologies or other similar techniques that use either observable market inputs or unobservable inputs.
MetLife, Inc.
Notes to the Interim Condensed Consolidated Financial Statements (Unaudited) — (continued)
8. Fair Value (continued)
|
| | | | | | | | | | | | | | | | |
| Instrument | Level 2 Observable Inputs | Level 3 Unobservable Inputs |
Fixed Maturity Securitiesmaturity securities AFS |
| U.S. corporate and Foreign corporate securities |
| Valuation Approaches: Principally the market and income approaches. | Valuation Approaches: Principally the market approach. |
| Key Inputs: | Key Inputs: |
| • | quoted prices in markets that are not active | • | illiquidity premium |
| • | benchmark yields; spreads off benchmark yields; new issuances; issuer ratingratings | • | delta spread adjustments to reflect specific credit-related issues |
| • | trades of identical or comparable securities; duration | • | credit spreads |
| • | Privately-placedprivately-placed securities are valued using the additional key inputs: | • | quoted prices in markets that are not active for identical or similar securities that are less liquid and based on lower levels of trading activity than securities classified in Level 2 |
| | • | market yield curve; call provisions | |
| | • | observable prices and spreads for similar public or private securities that incorporate the credit quality and industry sector of the issuer | • | independent non-binding broker quotations |
| | • | delta spread adjustments to reflect specific credit-related issues | | |
Foreign government securities, U.S. government and agency securities and State and political subdivision securitiesMunicipals |
| Valuation Approaches: Principally the market approach. | Valuation Approaches: Principally the market approach. |
| Key Inputs: | Key Inputs: |
| • | quoted prices in markets that are not active | • | independent non-binding broker quotations |
| • | benchmark U.S. Treasury yield or other yields | • | quoted prices in markets that are not active for identical or similar securities that are less liquid and based on lower levels of trading activity than securities classified in Level 2 |
| • | the spread off the U.S. Treasury yield curve for the identical security | |
| • | issuer ratings and issuer spreads; broker-dealer quotesquotations | • | credit spreads |
| • | comparable securities that are actively traded | | |
Structured SecuritiesProducts |
| Valuation Approaches: Principally the market and income approaches. | Valuation Approaches: Principally the market and income approaches. |
| Key Inputs: | Key Inputs: |
| • | quoted prices in markets that are not active | • | credit spreads |
| • | spreads for actively traded securities; spreads off benchmark yields | • | quoted prices in markets that are not active for identical or similar securities that are less liquid and based on lower levels of trading activity than securities classified in Level 2 |
| • | expected prepayment speeds and volumes | |
| • | current and forecasted loss severity; ratings; geographic region | • | independent non-binding broker quotations |
| • | weighted average coupon and weighted average maturity | • | credit ratings |
| • | average delinquency rates; debt-service coverage ratios | | |
| • | credit ratings | | |
| • | issuance-specific information, including, but not limited to: | | |
| | • | collateral type; structure of the security; vintage of the loans | | |
| | • | payment terms of the underlying assets | | |
| | • | payment priority within the tranche; deal performance | | |
MetLife, Inc.
Notes to the Interim Condensed Consolidated Financial Statements (Unaudited) — (continued)
8. Fair Value (continued)
|
| | | | | | | | | | | | | | | | |
| Instrument | Level 2 Observable Inputs | Level 3 Unobservable Inputs |
Equity Securitiessecurities |
| Valuation Approaches: Principally the market approach. | Valuation Approaches: Principally the market and income approaches. |
| Key Input: | Key Inputs: |
| • | quoted prices in markets that are not considered active | • | credit ratings; issuance structures |
| | | • | quoted prices in markets that are not active for identical or similar securities that are less liquid and based on lower levels of trading activity than securities classified in Level 2 |
| | | • | independent non-binding broker quotations |
Unit-linked and FVO securities,Securities, Short-term investments and Other investments |
| • | Contractholder-directed unit-linked investmentsUnit-linked and FVO Securities include mutual fund interests without readily determinable fair values given prices are not published publicly. Valuation of these mutual funds is based upon quoted prices or reported net asset value (“NAV”)NAV provided by the fund managers, which were based on observable inputs. | • | Unit-linked and FVO securitiesSecurities, short-term investments and short-termother investments are of a similar nature and class to the fixed maturity securities AFS and equity securities described above; accordingly, the valuation approaches and unobservable inputs used in their valuation are also similar to those described above. Other investments include certain real estate joint ventures and use the valuation approach and key inputs as described for other limited partnership interests below. |
| • | AllShort-term investments and other investments are of a similar nature and class to the fixed maturity securities AFS and equity securities described above; accordingly, the valuation approaches and observable inputs used in their valuation are also similar to those described above. | | |
|
| Residential mortgage loans — FVO |
| • | N/A | Valuation Approaches: Principally the market approach. |
| | | Valuation Techniques and Key Inputs: These investments are based primarily on matrix pricing or other similar techniques that utilize inputs from mortgage servicers that are unobservable or cannot be derived principally from, or corroborated by, observable market data. |
|
| | | |
| | | |
| | | | |
Separate Account Assetsaccount assets and Separate Account Liabilitiesaccount liabilities (1) |
| Mutual funds and hedge funds without readily determinable fair values as prices are not published publicly |
| Key Input: | • | N/A |
| • | quoted prices or reported NAV provided by the fund managers | | |
| Other limited partnership interests |
| •
| N/A | • | Valued giving consideration to the underlying holdings of the partnerships and by applying a premium or discount,adjusting, if appropriate. |
| | | Key Inputs: |
| | | • | liquidity; bid/ask spreads; performance record of the fund manager |
| | | • | other relevant variables that may impact the exit value of the particular partnership interest |
__________________
| |
(1) | Estimated fair value equals carrying value, based on the value of the underlying assets, including: mutual fund interests, fixed maturity securities, equity securities, derivatives, hedge funds, other limited partnership interests, short-term investments and cash and cash equivalents. Fixed maturity securities, equity securities, derivatives, short-term investments and cash and cash equivalents are similar in nature to the instruments described under “— Securities, Short-term Investments and Other Investments” and “— Derivatives — Freestanding Derivatives.” |
(1)Estimated fair value equals carrying value, based on the value of the underlying assets, including: mutual fund interests, fixed maturity securities, equity securities, derivatives, hedge funds, other limited partnership interests, short-term investments and cash and cash equivalents. Fixed maturity securities, equity securities, derivatives, short-term investments and cash and cash equivalents are similar in nature to the instruments described under “— Securities, Short-term Investments and Other Investments” and “— Derivatives — Freestanding Derivatives.”
MetLife, Inc.
Notes to the Interim Condensed Consolidated Financial Statements (Unaudited) — (continued)
8. Fair Value (continued)
Derivatives
The estimated fair value of derivatives is determined through the use of quoted market prices for exchange-traded derivatives, or through the use of pricing models for OTC-bilateral and OTC-cleared derivatives. The determination of estimated fair value, when quoted market values are not available, is based on market standard valuation methodologies and inputs that management believes are consistent with what other market participants would use when pricing such instruments. Derivative valuations can be affected by changes in interest rates, foreign currency exchange rates, financial indices, credit spreads, default risk, nonperformance risk, volatility, liquidity and changes in estimates and assumptions used in the pricing models. The valuation controls and procedures for derivatives are described in “— Investments.”
The significant inputs to the pricing models for most OTC-bilateral and OTC-cleared derivatives are inputs that are observable in the market or can be derived principally from, or corroborated by, observable market data. Certain OTC-bilateral and OTC-cleared derivatives may rely on inputs that are significant to the estimated fair value that are not observable in the market or cannot be derived principally from, or corroborated by, observable market data. These unobservable inputs may involve significant management judgment or estimation. Even though unobservable, these inputs are based on assumptions deemed appropriate given the circumstances and management believes they are consistent with what other market participants would use when pricing such instruments.
Most inputs for OTC-bilateral and OTC-cleared derivatives are mid-market inputs but, in certain cases, liquidity adjustments are made when they are deemed more representative of exit value. Market liquidity, as well as the use of different methodologies, assumptions and inputs, may have a material effect on the estimated fair values of the Company’s derivatives and could materially affect net income.
The credit risk of both the counterparty and the Company are considered in determining the estimated fair value for all OTC-bilateral and OTC-cleared derivatives, and any potential credit adjustment is based on the net exposure by counterparty after taking into account the effects of netting agreements and collateral arrangements. The Company values its OTC-bilateral and OTC-cleared derivatives using standard swap curves which may include a spread to the risk-free rate, depending upon specific collateral arrangements. This credit spread is appropriate for those parties that execute trades at pricing levels consistent with similar collateral arrangements. As the Company and its significant derivative counterparties generally execute trades at such pricing levels and hold sufficient collateral, additional credit risk adjustments are not currently required in the valuation process. The Company’s ability to consistently execute at such pricing levels is, in part, due to the netting agreements and collateral arrangements that are in place with all of its significant derivative counterparties. An evaluation of the requirement to make additional credit risk adjustments is performed by the Company each reporting period.
Freestanding Derivatives
Level 2 Valuation Approaches and Key Inputs:
This level includes all types of derivatives utilized by the Company with the exception of exchange-traded derivatives included within Level 1 and those derivatives with unobservable inputs as described in Level 3.
Level 3 Valuation Approaches and Key Inputs:
These valuation methodologies generally use the same inputs as described in the corresponding sections for Level 2 measurements of derivatives. However, these derivatives result in Level 3 classification because one or more of the significant inputs are not observable in the market or cannot be derived principally from, or corroborated by, observable market data.
MetLife, Inc.
Notes to the Interim Condensed Consolidated Financial Statements (Unaudited) — (continued)
8. Fair Value (continued)
Freestanding derivatives are principally valued using the income approach. Valuations of non-option-based derivatives utilize present value techniques, whereas valuations of option-based derivatives utilize option pricing models. Key inputs are as follows:
|
| | | | | | | | | | | | | | | | | | | | | | | | | |
| Instrument | | Interest Rate | | Foreign Currency
Exchange Rate
| | Credit | | Equity Market |
| Inputs common to Level 2 and Level 3 by instrument type | • | swap yield curves | • | swap yield curves | • | swap yield curves | • | swap yield curves |
| • | basis curves | • | basis curves | • | credit curves | • | spot equity index levels |
| • | interest rate volatility (1) | • | currency spot rates | • | recovery rates | • | dividend yield curves |
| | | • | cross currency basis curves | | | • | equity volatility (1) |
| | | • | currency volatility (1) | | | | |
| Level 3 | • | swap yield curves (2) | • | swap yield curves (2) | • | swap yield curves (2) | • | dividend yield curves (2) |
| • | basis curves (2) | • | basis curves (2) | • | credit curves (2) | • | equity volatility (1), (2) |
| • | interest rate volatility (1), (2)repurchase rates | • | cross currency basis curves (2) | •
| credit spreads | • | correlation between model inputs (1) |
| • | repurchase ratesinterest rate volatility (1), (2) | • | currency correlation | • | repurchase rates | | |
| | | • | currency volatility (1) | •
| independent non-binding broker quotations | | |
__________________
| |
(2) | Extrapolation beyond the observable limits of the curve(s). |
(1)Option-based only.
(2)Extrapolation beyond the observable limits of the curve(s).
Embedded Derivatives
Embedded derivatives principally include certain direct, assumed and ceded variable annuity guarantees, equity or bond indexed crediting rates within certain funding agreements and annuity contracts, and thoseinvestment risk within funds withheld related to funds withheld on cededcertain reinsurance agreements. Embedded derivatives are recorded at estimated fair value with changes in estimated fair value reported in net income.
The Company issues certain variable annuity products with guaranteed minimum benefits. GMWBs, GMABs and certain GMIBs contain embedded derivatives, which are measured at estimated fair value separately from the host variable annuity contract, with changes in estimated fair value reported in net derivative gains (losses). These embedded derivatives are classified within policyholder account balances on the interim condensed consolidated balance sheets.
The Company’s actuarial departmentCompany calculates the fair value of these embedded derivatives, which areis estimated as the present value of projected future benefits minus the present value of projected future fees using actuarial and capital market assumptions including expectations concerning policyholder behavior. The calculation is based on in-force business, and is performed using standard actuarial valuation software which projectsprojecting future cash flows from the embedded derivative over multiple risk neutral stochastic scenarios using observable risk-free rates.
Capital market assumptions, such as risk-free rates and implied volatilities, are based on market prices for publicly traded instruments to the extent that prices for such instruments are observable. Implied volatilities beyond the observable period are extrapolated based on observable implied volatilities and historical volatilities. Actuarial assumptions, including mortality, lapse, withdrawal and utilization, are unobservable and are reviewed at least annually based on actuarial studies of historical experience.
The valuation of these guarantee liabilities includes nonperformance risk adjustments and adjustments for a risk margin related to non-capital market inputs. The nonperformance adjustment is determined by taking into consideration publicly available information relating to spreads in the secondary market for MetLife, Inc.’s debt, including related credit default swaps. These observable spreads are then adjusted, as necessary, to reflect the priority of these liabilities and the claims paying ability of the issuing insurance subsidiaries as compared to MetLife, Inc.
MetLife, Inc.
Notes to the Interim Condensed Consolidated Financial Statements (Unaudited) — (continued)
8. Fair Value (continued)
Risk margins are established to capture the non-capital market risks of the instrument which represent the additional compensation a market participant would require to assume the risks related to the uncertainties of such actuarial assumptions as annuitization, premium persistency, partial withdrawal and surrenders. The establishment of risk margins requires the use of significant management judgment, including assumptions of the amount and cost of capital needed to cover the guarantees. These guarantees may be more costly than expected in volatile or declining equity markets. Market conditions including, but not limited to, changes in interest rates, equity indices, market volatility and foreign currency exchange rates; changes in nonperformance risk; and variations in actuarial assumptions regarding policyholder behavior, mortality and risk margins related to non-capital market inputs, may result in significant fluctuations in the estimated fair value of the guarantees that could materially affect net income.
The Company ceded the risk associated with certain of the GMIBs previously described. These reinsurance agreements contain embedded derivatives which are included within premiums, reinsurance and other receivables on the consolidated balance sheets with changes in estimated fair value reported in net derivative gains (losses) or policyholder benefits and claims depending on the statement of operations classification of the direct risk. The value of the embedded derivatives on the ceded risk is determined using a methodology consistent with that described previously for the guarantees directly written by the Company with the exception of the input for nonperformance risk that reflects the credit of the reinsurer.
The estimated fair value of the embedded derivatives within funds withheld related to certain ceded reinsurance is determined based on the change in estimated fair value of the underlying assets held by the Company in a reference portfolio backing the funds withheld liability. The estimated fair value of the underlying assets is determined as described in “— Investments — Securities, Short-term Investments and Other Investments.” The estimated fair value of these embedded derivatives is included, along with their funds withheld hosts, in other liabilities on the interim condensed consolidated balance sheets with changes in estimated fair value recorded in net derivative gains (losses). Changes in the credit spreads on the underlying assets, interest rates and market volatility may result in significant fluctuations in the estimated fair value of these embedded derivatives that could materially affect net income.
The estimated fair value of the embedded equity and bond indexed derivatives contained in certain funding agreements is determined using market standard swap valuation models and observable market inputs, including a nonperformance risk adjustment. The estimated fair value of these embedded derivatives are included, along with their funding agreements host, within policyholder account balances with changes in estimated fair value recorded in net derivative gains (losses). Changes in equity and bond indices, interest rates and the Company’s credit standing may result in significant fluctuations in the estimated fair value of these embedded derivatives that could materially affect net income.
The Company issues certain annuity contracts which allow the policyholder to participate in returns from equity indices. These equity indexed features are embedded derivatives which are measured at estimated fair value separately from the host fixed annuity contract, with changes in estimated fair value reported in net derivative gains (losses). These embedded derivatives are classified within policyholder account balances on the interim condensed consolidated balance sheets.
The estimated fair value of the embedded equity indexed derivatives, based on the present value of future equity returns to the policyholder using actuarial and present value assumptions including expectations concerning policyholder behavior, is calculated by the Company’s actuarial department. The calculation is based on in-force business and uses standard capital market techniques, such as Black-Scholes, to calculate the value of the portion of the embedded derivative for which the terms are set. The portion of the embedded derivative covering the period beyond where terms are set is calculated as the present value of amounts expected to be spent to provide equity indexed returns in those periods. The valuation of these embedded derivatives also includes the establishment of a risk margin, as well as changes in nonperformance risk.
MetLife, Inc.
Notes to the Interim Condensed Consolidated Financial Statements (Unaudited) — (continued)
8. Fair Value (continued)
Embedded Derivatives Within Asset and Liability Host Contracts
Level 3 Valuation Approaches and Key Inputs:
Direct and assumed guaranteed minimum benefits
These embedded derivatives are principally valued using the income approach. Valuations are based on option pricing techniques, which utilize significant inputs that may include swap yield curves, currency exchange rates and implied volatilities. These embedded derivatives result in Level 3 classification because one or more of the significant inputs are not observable in the market or cannot be derived principally from, or corroborated by, observable market data. Significant unobservable inputs generally include: the extrapolation beyond observable limits of the swap yield curves and implied volatilities, actuarial assumptions for policyholder behavior and mortality and the potential variability in policyholder behavior and mortality, nonperformance risk and cost of capital for purposes of calculating the risk margin.
MetLife, Inc.
Notes to the Interim Condensed Consolidated Financial Statements (Unaudited) — (continued)
8. Fair Value (continued)
Reinsurance ceded on certain guaranteed minimum benefits
These embedded derivatives are principally valued using the income approach. The valuation techniques and significant market standard unobservable inputs used in their valuation are similar to those described above in “— Direct and assumed guaranteed minimum benefits” and also include counterparty credit spreads.
Transfers between Levels
Overall, transfers between levels occur when there are changes in the observability of inputs and market activity. Transfers into or out of any level are assumed to occur at the beginning of the period.
Transfers between Levels 1 and 2:
There were no transfers between Levels 1 and 2 for assets and liabilities measured at estimated fair value and still held at September 30, 2017. Transfers between Levels 1 and 2 for assets and liabilities measured at estimated fair value and still held at December 31, 2016 were not significant.
Transfers into or out of Level 3:
Assets and liabilities are transferred into Level 3 when a significant input cannot be corroborated with market observable data. This occurs when market activity decreases significantly and underlying inputs cannot be observed, current prices are not available, and/or when there are significant variances in quoted prices, thereby affecting transparency. Assets and liabilities are transferred out of Level 3 when circumstances change such that a significant input can be corroborated with market observable data. This may be due to a significant increase in market activity, a specific event, or one or more significant input(s) becoming observable.
MetLife, Inc.
Notes to the Interim Condensed Consolidated Financial Statements (Unaudited) — (continued)
8. Fair Value (continued)
Assets and Liabilities Measured at Fair Value Using Significant Unobservable Inputs (Level 3)
The following table presents certain quantitative information about the significant unobservable inputs used in the fair value measurement, and the sensitivity of the estimated fair value to changes in those inputs, for the more significant asset and liability classes measured at fair value on a recurring basis using significant unobservable inputs (Level 3) at:
| | | | | | | | | | | | | | | | | | | | | June 30, 2021 | | December 31, 2020 | | Impact of
Increase in Input
on Estimated
Fair Value (2) |
| | | September 30, 2017 | | December 31, 2016 | | Impact of
Increase in Input
on Estimated
Fair Value (2) | | Valuation
Techniques | | Significant
Unobservable Inputs | | Range | | Weighted
Average (1) | | Range | | Weighted
Average (1) | |
| | Valuation
Techniques | | Significant
Unobservable Inputs | | Range | | Weighted
Average (1) | | Range | | Weighted
Average (1) | | |
| Fixed maturity securities (3) | | |
| Fixed maturity securities AFS (3) | | Fixed maturity securities AFS (3) | | | | | | | | | | | | |
| U.S. corporate and foreign corporate | • | Matrix pricing | | • | Offered quotes (4) | | 21 | - | 140 | | 107 | | 18 | - | 138 | | 106 | | Increase | U.S. corporate and foreign corporate | • | Matrix pricing | | • | Offered quotes (4) | | 1 | - | 172 | | 112 | | 0 | - | 186 | | 117 | | Increase |
| | • | Market pricing | | • | Quoted prices (4) | | 25 | - | 498 | | 120 | | 6 | - | 700 | | 116 | | Increase | | • | Market pricing | | • | Quoted prices (4) | | 0 | - | 123 | | 98 | | 0 | - | 116 | | 98 | | Increase |
| | • | Consensus pricing | | • | Offered quotes (4) | | 40 | - | 112 | | 103 | | 37 | - | 120 | | 102 | | Increase | | • | Consensus pricing | | • | Offered quotes (4) | | 99 | - | 106 | | 101 | | 54 | - | 104 | | 101 | | Increase |
| RMBS | • | Market pricing | | • | Quoted prices (4) | | 5 | - | 173 | | 94 | | 19 | - | 137 | | 91 | | Increase (5) | RMBS | • | Market pricing | | • | Quoted prices (4) | | 0 | - | 147 | | 99 | | 0 | - | 159 | | 98 | | Increase (5) |
| ABS | • | Market pricing | | • | Quoted prices (4) | | 5 | - | 118 | | 100 | | 5 | - | 106 | | 99 | | Increase (5) | ABS | • | Market pricing | | • | Quoted prices (4) | | 3 | - | 110 | | 100 | | 1 | - | 112 | | 100 | | Increase (5) |
| | • | Consensus pricing | | • | Offered quotes (4) | | 99 | - | 102 | | 100 | | 96 | - | 102 | | 100 | | Increase (5) | | • | Consensus pricing | | • | Offered quotes (4) | | 101 | - | 101 | | 101 | | 100 | - | 100 | | 100 | | Increase (5) |
| Derivatives | |
| | Derivatives | |
| Interest rate | • | Present value techniques | | • | Swap yield (6) | | 200 | - | 300 | | 200 | - | 300 | | Increase (7) | Interest rate | • | Present value techniques | | • | Swap yield (6) | | 148 | - | 228 | | 199 | | 92 | - | 184 | | 149 | | Increase (7) |
| | | • | Repurchase rates (8) | | 0 | - | 0 | | 0 | | (12) | - | 1 | | (6) | | Decrease (7) |
| | | • | Repurchase rates (8) | | — | - | 8 | | | (44) | | 18 | | Decrease (7) | | • | Volatility (9) | | 0% | - | 1% | | 0% | | 0 | - | 0 | | 0 | | Increase (7) |
| Foreign currency exchange rate | • | Present value techniques | | • | Swap yield (6) | | (24) | - | 328 | | | 50 | - | 328 | | Increase (7) | Foreign currency exchange rate | • | Present value techniques | | • | Swap yield (6) | | (170) | - | 1,938 | | 50 | | (309) | - | 248 | | (144) | | Increase (7) |
| Credit | • | Present value techniques | | • | Credit spreads (9) | | 97 | - | 100 | | 97 | - | 98 | | Decrease (7) | Credit | • | Present value techniques | | • | Credit spreads (10) | | 96 | - | 128 | | 103 | | 96 | - | 99 | | 98 | | Decrease (7) |
| | • | Consensus pricing | | • | Offered quotes (10) | |
| | | • | Consensus pricing | | • | Offered quotes (11) | |
| Equity market | • | Present value techniques or option pricing models | | • | Volatility (11) | | 8% | - | 30% | | 12% | - | 32% | | Increase (7) | Equity market | • | Present value techniques or option pricing models | | • | Volatility (12) | | 0 | - | 0 | | 0 | | 21% | - | 29% | | 28% | | Increase (7) |
| | | • | Correlation (12) | | 10% | - | 30% | | 40% | - | 40% | | | | | • | Correlation (13) | | 10% | - | 10% | | 10% | | 10% | - | 30% | | 10% | |
| Embedded derivatives | Embedded derivatives | | Embedded derivatives | |
| Direct, assumed and ceded guaranteed minimum benefits | • | Option pricing techniques | | • | Mortality rates: | | Direct, assumed and ceded guaranteed minimum benefits | • | Option pricing techniques | | • | Mortality rates: | |
| | | Ages 0 - 40 | | 0% | - | 0.21% | | 0% | - | 0.21% | | Decrease (13) | | Ages 0 - 40 | | 0% | - | 0.17% | | 0.06% | | 0% | - | 0.17% | | 0.06% | | Decrease (14) |
| | | Ages 41 - 60 | | 0.03% | - | 0.75% | | 0.01% | - | 0.78% | | Decrease (13) | | Ages 41 - 60 | | 0.03% | - | 0.75% | | 0.30% | | 0.03% | - | 0.75% | | 0.30% | | Decrease (14) |
| | | Ages 61 - 115 | | 0.16% | - | 100% | | 0.04% | - | 100% | | Decrease (13) | | Ages 61 - 115 | | 0.12% | - | 100% | | 1.90% | | 0.12% | - | 100% | | 1.90% | | Decrease (14) |
| | | • | Lapse rates: | | | • | Lapse rates: | |
| | | Durations 1 - 10 | | 0.25% | - | 100% | | 0.25% | - | 100% | | Decrease (14) | | Durations 1 - 10 | | 0.25% | - | 100% | | 6.86% | | 0.25% | - | 100% | | 6.86% | | Decrease (15) |
| | | Durations 11 - 20 | | 2% | - | 100% | | 2% | - | 100% | | Decrease (14) | | Durations 11 - 20 | | 0.50% | - | 100% | | 5.18% | | 0.50% | - | 100% | | 5.18% | | Decrease (15) |
| | | Durations 21 - 116 | | 1.25% | - | 100% | | 1.25% | - | 100% | | Decrease (14) | | Durations 21 - 116 | | 0.50% | - | 100% | | 5.18% | | 0.50% | - | 100% | | 5.18% | | Decrease (15) |
| | | • | Utilization rates | | 0% | - | 25% | | 0% | - | 25% | | Increase (15) | | • | Utilization rates | | 0% | - | 22% | | 0.17% | | 0% | - | 22% | | 0.17% | | Increase (16) |
| | | • | Withdrawal rates | | 0% | - | 20% | | 0% | - | 20% | | (16) | | • | Withdrawal rates | | 0% | - | 20% | | 3.98% | | 0% | - | 20% | | 3.98% | | (17) |
| | | • | Long-term equity volatilities | | 8.76% | - | 33% | | 9.95% | - | 33% | | Increase (17) | | • | Long-term equity volatilities | | 7.14% | - | 27% | | 18.70% | | 8.33% | - | 27% | | 18.70% | | Increase (18) |
| | | • | Nonperformance risk spread | | 0.03% | - | 1.38% | | 0.04% | - | 1.70% | | Decrease (18) | | • | Nonperformance risk spread | | 0.04% | - | 1.14% | | 0.40% | | 0.04% | - | 1.18% | | 0.40% | | Decrease (19) |
__________________
| |
(1) | The weighted average for fixed maturity securities is determined based on the estimated fair value of the securities. |
| |
(2) | The impact of a decrease in input would have the opposite impact on estimated fair value. For embedded derivatives, changes to direct and assumed guaranteed minimum benefits are based on liability positions; changes to ceded guaranteed minimum benefits are based on asset positions. |
| |
(3) | Significant increases (decreases) in expected default rates in isolation would result in substantially lower (higher) valuations. |
| |
(4) | Range and weighted average are presented in accordance with the market convention for fixed maturity securities of dollars per hundred dollars of par. |
| |
(5) | Changes in the assumptions used for the probability of default are accompanied by a directionally similar change in the assumption used for the loss severity and a directionally opposite change in the assumptions used for prepayment rates. |
(1)The weighted average for fixed maturity securities AFS and derivatives is determined based on the estimated fair value of the securities and derivatives. The weighted average for embedded derivatives is determined based on a combination of account values and experience data.
(2)The impact of a decrease in input would have resulted in the opposite impact on estimated fair value. For embedded derivatives, changes to direct and assumed guaranteed minimum benefits are based on liability positions; changes to ceded guaranteed minimum benefits are based on asset positions.
(3)Significant increases (decreases) in expected default rates in isolation would have resulted in substantially lower (higher) valuations.
(4)Range and weighted average are presented in accordance with the market convention for fixed maturity securities AFS of dollars per hundred dollars of par.
MetLife, Inc.
Notes to the Interim Condensed Consolidated Financial Statements (Unaudited) — (continued)
8. Fair Value (continued)
(5)Changes in the assumptions used for the probability of default would have been accompanied by a directionally similar change in the assumption used for the loss severity and a directionally opposite change in the assumptions used for prepayment rates.
| |
(6) | Ranges represent the rates across different yield curves and are presented in basis points. The swap yield curves are utilized among different types of derivatives to project cash flows, as well as to discount future cash flows to present value. Since this valuation methodology uses a range of inputs across a yield curve to value the derivative, presenting a range is more representative of the unobservable input used in the valuation. |
| |
(7) | Changes in estimated fair value are based on long U.S. dollar net asset positions and will be inversely impacted for short U.S. dollar net asset positions. |
| |
(8) | Ranges represent different repurchase rates utilized as components within the valuation methodology and are presented in basis points. |
| |
(9) | Represents the risk quoted in basis points of a credit default event on the underlying instrument. Credit derivatives with significant unobservable inputs are primarily comprised of written credit default swaps. |
| |
(10) | At both September 30, 2017 and December 31, 2016, independent non-binding broker quotations were used in the determination of less than 1% of the total net derivative estimated fair value. |
| |
(11) | Ranges represent the underlying equity volatility quoted in percentage points. Since this valuation methodology uses a range of inputs across multiple volatility surfaces to value the derivative, presenting a range is more representative of the unobservable input used in the valuation. |
| |
(12) | Ranges represent the different correlation factors utilized as components within the valuation methodology. Presenting a range of correlation factors is more representative of the unobservable input used in the valuation. Increases (decreases) in correlation in isolation will increase (decrease) the significance of the change in valuations. |
| |
(13) | Mortality rates vary by age and by demographic characteristics such as gender. Mortality rate assumptions are based on company experience. A mortality improvement assumption is also applied. For any given contract, mortality rates vary throughout the period over which cash flows are projected for purposes of valuing the embedded derivative. |
| |
(14) | Base lapse rates are adjusted at the contract level based on a comparison of the actuarially calculated guaranteed values and the current policyholder account value, as well as other factors, such as the applicability of any surrender charges. A dynamic lapse function reduces the base lapse rate when the guaranteed amount is greater than the account value as in the money contracts are less likely to lapse. Lapse rates are also generally assumed to be lower in periods when a surrender charge applies. For any given contract, lapse rates vary throughout the period over which cash flows are projected for purposes of valuing the embedded derivative. |
| |
(15) | The utilization rate assumption estimates the percentage of contractholders with a GMIB or lifetime withdrawal benefit who will elect to utilize the benefit upon becoming eligible. The rates may vary by the type of guarantee, the amount by which the guaranteed amount is greater than the account value, the contract’s withdrawal history and by the age of the policyholder. For any given contract, utilization rates vary throughout the period over which cash flows are projected for purposes of valuing the embedded derivative. |
| |
(16) | The withdrawal rate represents the percentage of account balance that any given policyholder will elect to withdraw from the contract each year. The withdrawal rate assumption varies by age and duration of the contract, and also by other factors such as benefit type. For any given contract, withdrawal rates vary throughout the period over which cash flows are projected for purposes of valuing the embedded derivative. For GMWBs, any increase (decrease) in withdrawal rates results in an increase (decrease) in the estimated fair value of the guarantees. For GMABs and GMIBs, any increase (decrease) in withdrawal rates results in a decrease (increase) in the estimated fair value. |
| |
(17) | Long-term equity volatilities represent equity volatility beyond the period for which observable equity volatilities are available. For any given contract, long-term equity volatility rates vary throughout the period over which cash flows are projected for purposes of valuing the embedded derivative. |
| |
(18) | Nonperformance risk spread varies by duration and by currency. For any given contract, multiple nonperformance risk spreads will apply, depending on the duration of the cash flow being discounted for purposes of valuing the embedded derivative. |
(6)Ranges represent the rates across different yield curves and are presented in basis points. The swap yield curves are utilized among different types of derivatives to project cash flows, as well as to discount future cash flows to present value. Since this valuation methodology uses a range of inputs across a yield curve to value the derivative, presenting a range is more representative of the unobservable input used in the valuation.
(7)Changes in estimated fair value are based on long U.S. dollar net asset positions and will be inversely impacted for short U.S. dollar net asset positions.
(8)Ranges represent different repurchase rates utilized as components within the valuation methodology and are presented in basis points.
(9)Ranges represent the underlying interest rate volatility quoted in percentage points. Since this valuation methodology uses an equivalent of LIBOR for secured overnight financing rate volatility, presenting a range is more representative of the unobservable input used in the valuation.
(10)Represents the risk quoted in basis points of a credit default event on the underlying instrument. Credit derivatives with significant unobservable inputs are primarily comprised of written credit default swaps.
(11)At both June 30, 2021 and December 31, 2020, independent non-binding broker quotations were used in the determination of less than 1% of the total net derivative estimated fair value.
(12)Ranges represent the underlying equity volatility quoted in percentage points. Since this valuation methodology uses a range of inputs across multiple volatility surfaces to value the derivative, presenting a range is more representative of the unobservable input used in the valuation.
(13)Ranges represent the different correlation factors utilized as components within the valuation methodology. Presenting a range of correlation factors is more representative of the unobservable input used in the valuation. Increases (decreases) in correlation in isolation will increase (decrease) the significance of the change in valuations.
(14)Mortality rates vary by age and by demographic characteristics such as gender. Mortality rate assumptions are based on company experience. A mortality improvement assumption is also applied. For any given contract, mortality rates vary throughout the period over which cash flows are projected for purposes of valuing the embedded derivative.
(15)Base lapse rates are adjusted at the contract level based on a comparison of the actuarially calculated guaranteed values and the current policyholder account value, as well as other factors, such as the applicability of any surrender charges. A dynamic lapse function reduces the base lapse rate when the guaranteed amount is greater than the account value as in the money contracts are less likely to lapse. Lapse rates are also generally assumed to be lower in periods when a surrender charge applies. For any given contract, lapse rates vary throughout the period over which cash flows are projected for purposes of valuing the embedded derivative.
(16)The utilization rate assumption estimates the percentage of contractholders with GMIBs or a lifetime withdrawal benefit who will elect to utilize the benefit upon becoming eligible. The rates may vary by the type of guarantee, the amount by which the guaranteed amount is greater than the account value, the contract’s withdrawal history and by the age of the policyholder. For any given contract, utilization rates vary throughout the period over which cash flows are projected for purposes of valuing the embedded derivative.
(17)The withdrawal rate represents the percentage of account balance that any given policyholder will elect to withdraw from the contract each year. The withdrawal rate assumption varies by age and duration of the contract, and also by other factors such as benefit type. For any given contract, withdrawal rates vary throughout the period over which cash flows are projected for purposes of valuing the embedded derivative. For GMWBs, any increase (decrease) in withdrawal rates results in an increase (decrease) in the estimated fair value of the guarantees. For GMABs and GMIBs, any increase (decrease) in withdrawal rates results in a decrease (increase) in the estimated fair value.
(18)Long-term equity volatilities represent equity volatility beyond the period for which observable equity volatilities are available. For any given contract, long-term equity volatility rates vary throughout the period over which cash flows are projected for purposes of valuing the embedded derivative.
MetLife, Inc.
Notes to the Interim Condensed Consolidated Financial Statements (Unaudited) — (continued)
8. Fair Value (continued)
The following is a summary(19)Nonperformance risk spread varies by duration and by currency. For any given contract, multiple nonperformance risk spreads will apply, depending on the duration of the valuation techniques and significant unobservable inputs used incash flow being discounted for purposes of valuing the fair value measurementembedded derivative.
Generally, all other classes of assets and liabilities classified within Level 3 that are not included in the preceding table. Generally, all other classes of securities classified within Level 3, including those within separate account assets, and embedded derivatives within funds withheld related to certain ceded reinsurance,table use the same valuation techniques and significant unobservable inputs as previously described for Level 3 securities. This includes matrix pricing and discounted cash flow methodologies, inputs such as quoted prices for identical or similar securities that are less liquid and based on lower levels of trading activity than securities classified in Level 2, as well as independent non-binding broker quotations. The residential mortgage loans — FVO are valued using independent non-binding broker quotations and internal models including matrix pricing and discounted cash flow methodologies using current interest rates.3. The sensitivity of the estimated fair value to changes in the significant unobservable inputs for these other assets and liabilities is similar in nature to that described in the preceding table. The valuation techniques and significant unobservable inputs used in the fair value measurement for the more significant assets measured at estimated fair value on a nonrecurring basis and determined using significant unobservable inputs (Level 3) are summarized in “— Nonrecurring Fair Value Measurements.”
The following tables summarize the change of all assets and (liabilities) measured at estimated fair value on a recurring basis using significant unobservable inputs (Level 3):
| | | | | | | | | | | | | | | | | | | | | | | | | | | | | | | | | | | | | | | | |
| | Fair Value Measurements Using Significant Unobservable Inputs (Level 3) |
| | Fixed Maturity Securities AFS | | | | |
| | Corporate (7) | | Foreign
Government | | | | Structured Products | | Municipals | | Equity Securities | | Unit-linked
and FVO
Securities |
| | (In millions) |
| Three Months Ended June 30, 2021 | | | | | | | | | | | | | | |
| Balance, beginning of period | | $ | 23,419 | | | $ | 132 | | | | | $ | 5,507 | | | $ | 5 | | | $ | 154 | | | $ | 812 | |
| Total realized/unrealized gains (losses) included in net income (loss) (1), (2) | | (8) | | | 0 | | | | | 16 | | | 0 | | | 6 | | | 45 | |
| Total realized/unrealized gains (losses) included in AOCI | | 415 | | | 0 | | | | | 19 | | | 0 | | | 0 | | | 0 | |
| Purchases (3) | | 868 | | | 46 | | | | | 823 | | | 0 | | | 3 | | | 12 | |
| Sales (3) | | (286) | | | (3) | | | | | (332) | | | 0 | | | (15) | | | (16) | |
| Issuances (3) | | 0 | | | 0 | | | | | 0 | | | 0 | | | 0 | | | 0 | |
| Settlements (3) | | 0 | | | 0 | | | | | 0 | | | 0 | | | 0 | | | 0 | |
| Transfers into Level 3 (4) | | 48 | | | 10 | | | | | 345 | | | 0 | | | 0 | | | 10 | |
| Transfers out of Level 3 (4), (5) | | (683) | | | (40) | | | | | (375) | | | (5) | | | (5) | | | (14) | |
| Balance, end of period | | $ | 23,773 | | | $ | 145 | | | | | $ | 6,003 | | | $ | 0 | | | $ | 143 | | | $ | 849 | |
| Three Months Ended June 30, 2020 | | | | | | | | | | | | | | |
| Balance, beginning of period | | $ | 19,809 | | | $ | 104 | | | | | $ | 4,014 | | | $ | 0 | | | $ | 372 | | | $ | 517 | |
| Total realized/unrealized gains (losses) included in net income (loss) (1), (2) | | (21) | | | (1) | | | | | 4 | | | 0 | | | 14 | | | 56 | |
| Total realized/unrealized gains (losses) included in AOCI | | 1,321 | | | 2 | | | | | 206 | | | 0 | | | 0 | | | 0 | |
| Purchases (3) | | 1,158 | | | 9 | | | | | 1,307 | | | 0 | | | 7 | | | 14 | |
| Sales (3) | | (437) | | | (3) | | | | | (219) | | | 0 | | | (2) | | | (4) | |
| Issuances (3) | | 0 | | | 0 | | | | | 0 | | | 0 | | | 0 | | | 0 | |
| Settlements (3) | | 0 | | | 0 | | | | | 0 | | | 0 | | | 0 | | | 0 | |
| Transfers into Level 3 (4) | | 149 | | | 1 | | | | | 143 | | | 0 | | | 0 | | | 17 | |
| Transfers out of Level 3 (4) | | (1,247) | | | (55) | | | | | (78) | | | 0 | | | (18) | | | (11) | |
| Balance, end of period | | $ | 20,732 | | | $ | 57 | | | | | $ | 5,377 | | | $ | 0 | | | $ | 373 | | | $ | 589 | |
| Changes in unrealized gains (losses) included in net income (loss) for the instruments still held at June 30, 2021 (6) | | $ | (8) | | | $ | 0 | | | | | $ | 15 | | | $ | 0 | | | $ | 3 | | | $ | 44 | |
| Changes in unrealized gains (losses) included in net income (loss) for the instruments still held at June 30, 2020 (6) | | $ | (13) | | | $ | 1 | | | | | $ | 13 | | | $ | 0 | | | $ | 12 | | | $ | 56 | |
| Changes in unrealized gains (losses) included in AOCI for the instruments still held at June 30, 2021 (6) | | $ | 416 | | | $ | 0 | | | | | $ | 19 | | | $ | 0 | | | $ | 0 | | | $ | 0 | |
| Changes in unrealized gains (losses) included in AOCI for the instruments still held at June 30, 2020 (6) | | $ | 1,313 | | | $ | 2 | | | | | $ | 200 | | | $ | 0 | | | $ | 0 | | | $ | 0 | |
|
| | | | | | | | | | | | | | | | | | | | | | | | | | | | |
| | | Fair Value Measurements Using Significant Unobservable Inputs (Level 3) |
| | | Fixed Maturity Securities | | | | |
| | | Corporate (1) | | Foreign
Government | | U.S. Government and Agency | | Structured Securities | | State and
Political
Subdivision | | Equity Securities | | FVO Securities (2) |
| | | (In millions) |
| Three Months Ended September 30, 2017 | | | | | | | | | | | | | | |
| Balance, beginning of period | | $ | 11,632 |
| | $ | 208 |
| | $ | — |
| | $ | 4,939 |
| | $ | — |
| | $ | 468 |
| | $ | 312 |
|
| Total realized/unrealized gains (losses) included in net income (loss) (3) (4) | | (3 | ) | | 1 |
| | — |
| | 13 |
| | — |
| | (1 | ) | | 7 |
|
| Total realized/unrealized gains (losses) included in AOCI | | 164 |
| | (2 | ) | | — |
| | 31 |
| | — |
| | (4 | ) | | — |
|
| Purchases (5) | | 713 |
| | — |
| | — |
| | 468 |
| | — |
| | 13 |
| | 73 |
|
| Sales (5) | | (285 | ) | | — |
| | — |
| | (478 | ) | | (1 | ) | | (52 | ) | | (70 | ) |
| Issuances (5) | | — |
| | — |
| | — |
| | — |
| | — |
| | — |
| | — |
|
| Settlements (5) | | — |
| | — |
| | — |
| | — |
| | — |
| | — |
| | — |
|
| Transfers into Level 3 (6) | | 123 |
| | — |
| | — |
| | — |
| | 62 |
| | — |
| | 3 |
|
| Transfers out of Level 3 (6) | | (226 | ) | | (9 | ) | | — |
| | (440 | ) | | — |
| | — |
| | (21 | ) |
| Balance, end of period | | $ | 12,118 |
| | $ | 198 |
| | $ | — |
| | $ | 4,533 |
| | $ | 61 |
| | $ | 424 |
| | $ | 304 |
|
| Three Months Ended September 30, 2016 | | | | | | | | | | | | | | |
| Balance, beginning of period | | $ | 10,938 |
| | $ | 367 |
| | $ | 297 |
| | $ | 4,862 |
| | $ | 45 |
| | $ | 509 |
| | $ | 231 |
|
| Total realized/unrealized gains (losses) included in net income (loss) (3) (4) | | 8 |
| | 2 |
| | — |
| | 26 |
| | — |
| | 4 |
| | 4 |
|
| Total realized/unrealized gains (losses) included in AOCI | | 96 |
| | 2 |
| | (1 | ) | | 25 |
| | 3 |
| | (12 | ) | | — |
|
| Purchases (5) | | 588 |
| | 21 |
| | 100 |
| | 918 |
| | — |
| | 4 |
| | 18 |
|
| Sales (5) | | (414 | ) | | (7 | ) | | — |
| | (367 | ) | | — |
| | (11 | ) | | (6 | ) |
| Issuances (5) | | — |
| | — |
| | — |
| | — |
| | — |
| | — |
| | — |
|
| Settlements (5) | | — |
| | — |
| | — |
| | — |
| | — |
| | — |
| | — |
|
| Transfers into Level 3 (6) | | 373 |
| | — |
| | — |
| | 44 |
| | 7 |
| | 1 |
| | — |
|
| Transfers out of Level 3 (6) | | (202 | ) | | (62 | ) | | (101 | ) | | (236 | ) | | (17 | ) | | (6 | ) | | (4 | ) |
| Balance, end of period | | $ | 11,387 |
| | $ | 323 |
| | $ | 295 |
| | $ | 5,272 |
| | $ | 38 |
| | $ | 489 |
| | $ | 243 |
|
| Changes in unrealized gains (losses) included in net income (loss) for the instruments still held at September 30, 2017: (7) | | $ | (2 | ) | | $ | 1 |
| | $ | — |
| | $ | 22 |
| | $ | — |
| | $ | (2 | ) | | $ | 7 |
|
| Changes in unrealized gains (losses) included in net income (loss) for the instruments still held at September 30, 2016: (7) | | $ | — |
| | $ | 2 |
| | $ | — |
| | $ | 26 |
| | $ | — |
| | $ | — |
| | $ | 4 |
|
MetLife, Inc.
Notes to the Interim Condensed Consolidated Financial Statements (Unaudited) — (continued)
8. Fair Value (continued)
| | | | | | | | | | | | | | | | | | | | | | | | | | | | | | | | | | | | | | | | | |
| | Fair Value Measurements Using Significant Unobservable Inputs (Level 3) | | | |
| | Short-term
Investments | | Residential Mortgage
Loans — FVO | | Other
Investments | | Net
Derivatives (8) | | Net Embedded
Derivatives (9) | | Separate
Accounts (10) | | | |
| | (In millions) |
| Three Months Ended June 30, 2021 | | | | | | | | | | | | | | | |
| Balance, beginning of period | | $ | 102 | | | $ | 149 | | | $ | 656 | | | $ | (162) | | | $ | (508) | | | $ | 1,133 | | | | |
| Total realized/unrealized gains (losses) included in net income (loss) (1), (2) | | 0 | | | (1) | | | 12 | | | (49) | | | (4) | | | 12 | | | | |
| Total realized/unrealized gains (losses) included in AOCI | | 1 | | | 0 | | | 0 | | | 205 | | | 1 | | | 0 | | | | |
| Purchases (3) | | 35 | | | 0 | | | 113 | | | 4 | | | 0 | | | 118 | | | | |
| Sales (3) | | (46) | | | (2) | | | 0 | | | 0 | | | 0 | | | (27) | | | | |
| Issuances (3) | | 0 | | | 0 | | | 0 | | | (5) | | | 0 | | | 1 | | | | |
| Settlements (3) | | 0 | | | (6) | | | 0 | | | 0 | | | (63) | | | 3 | | | | |
| Transfers into Level 3 (4) | | 50 | | | 0 | | | 0 | | | 0 | | | 0 | | | 9 | | | | |
| Transfers out of Level 3 (4), (5) | | (29) | | | 0 | | | 0 | | | 64 | | | 0 | | | 0 | | | | |
| Balance, end of period | | $ | 113 | | | $ | 140 | | | $ | 781 | | | $ | 57 | | | $ | (574) | | | $ | 1,249 | | | | |
| Three Months Ended June 30, 2020 | | | | | | | | | | | | | | | |
| Balance, beginning of period | | $ | 368 | | | $ | 180 | | | $ | 475 | | | $ | 1,039 | | | $ | (2,232) | | | $ | 1,046 | | | | |
| Total realized/unrealized gains (losses) included in net income (loss) (1), (2) | | 0 | | | 1 | | | (7) | | | 38 | | | 371 | | | 9 | | | | |
| Total realized/unrealized gains (losses) included in AOCI | | 2 | | | 0 | | | 0 | | | (166) | | | (1) | | | 0 | | | | |
| Purchases (3) | | 1 | | | 0 | | | 23 | | | 0 | | | 0 | | | 83 | | | | |
| Sales (3) | | (17) | | | (2) | | | 0 | | | 0 | | | 0 | | | (93) | | | | |
| Issuances (3) | | 0 | | | 0 | | | 0 | | | 0 | | | 0 | | | (2) | | | | |
| Settlements (3) | | 0 | | | (4) | | | 0 | | | (113) | | | (63) | | | 1 | | | | |
| Transfers into Level 3 (4) | | 4 | | | 0 | | | 0 | | | 0 | | | 0 | | | 13 | | | | |
| Transfers out of Level 3 (4) | | (351) | | | 0 | | | 0 | | | 0 | | | 0 | | | (1) | | | | |
| Balance, end of period | | $ | 7 | | | $ | 175 | | | $ | 491 | | | $ | 798 | | | $ | (1,925) | | | $ | 1,056 | | | | |
| Changes in unrealized gains (losses) included in net income (loss) for the instruments still held at June 30, 2021 (6) | | $ | 0 | | | $ | (2) | | | $ | 12 | | | $ | (69) | | | $ | (3) | | | $ | 0 | | | | |
| Changes in unrealized gains (losses) included in net income (loss) for the instruments still held at June 30, 2020 (6) | | $ | 0 | | | $ | 0 | | | $ | (5) | | | $ | 46 | | | $ | 366 | | | $ | 0 | | | | |
| Changes in unrealized gains (losses) included in AOCI for the instruments still held at June 30, 2021 (6) | | $ | (1) | | | $ | 0 | | | $ | 0 | | | $ | 200 | | | $ | 1 | | | $ | 0 | | | | |
| Changes in unrealized gains (losses) included in AOCI for the instruments still held at June 30, 2020 (6) | | $ | 1 | | | $ | 0 | | | $ | 0 | | | $ | (154) | | | $ | (2) | | | $ | 0 | | | | |
|
| | | | | | | | | | | | | | | | | | | | |
| | | Fair Value Measurements Using Significant Unobservable Inputs (Level 3) |
| | | Short-term Investments | | Residential Mortgage
Loans — FVO | | Net Derivatives (8) | | Net Embedded Derivatives (9) | | Separate
Accounts (10) |
| | | (In millions) |
| Three Months Ended September 30, 2017 | | | | | | | | | | |
| Balance, beginning of period | | $ | 822 |
| | $ | 615 |
| | $ | (288 | ) | | $ | (1,388 | ) | | $ | 959 |
|
| Total realized/unrealized gains (losses) included in net income (loss) (3) (4) | | — |
| | 32 |
| | 33 |
| | 222 |
| | 7 |
|
| Total realized/unrealized gains (losses) included in AOCI | | — |
| | — |
| | 4 |
| | 4 |
| | — |
|
| Purchases (5) | | 1 |
| | 10 |
| | — |
| | — |
| | 136 |
|
| Sales (5) | | (247 | ) | | (72 | ) | | — |
| | — |
| | (18 | ) |
| Issuances (5) | | — |
| | — |
| | — |
| | — |
| | 1 |
|
| Settlements (5) | | — |
| | (21 | ) | | (12 | ) | | (92 | ) | | (1 | ) |
| Transfers into Level 3 (6) | | 2 |
| | — |
| | — |
| | — |
| | 56 |
|
| Transfers out of Level 3 (6) | | (175 | ) | | — |
| | — |
| | — |
| | (101 | ) |
| Balance, end of period | | $ | 403 |
| | $ | 564 |
| | $ | (263 | ) | | $ | (1,254 | ) | | $ | 1,039 |
|
| Three Months Ended September 30, 2016 | | | | | | | | | | |
| Balance, beginning of period | | $ | 64 |
| | $ | 449 |
| | $ | 51 |
| | $ | (2,751 | ) | | $ | 1,485 |
|
| Total realized/unrealized gains (losses) included in net income (loss) (3) (4) | | 1 |
| | 10 |
| | (3 | ) | | 262 |
| | (26 | ) |
| Total realized/unrealized gains (losses) included in AOCI | | (1 | ) | | — |
| | (8 | ) | | (27 | ) | | — |
|
| Purchases (5) | | 222 |
| | 42 |
| | — |
| | — |
| | 4 |
|
| Sales (5) | | (55 | ) | | (5 | ) | | — |
| | — |
| | (24 | ) |
| Issuances (5) | | — |
| | — |
| | (1 | ) | | — |
| | 30 |
|
| Settlements (5) | | — |
| | (15 | ) | | (21 | ) | | (84 | ) | | (45 | ) |
| Transfers into Level 3 (6) | | — |
| | — |
| | — |
| | — |
| | 8 |
|
| Transfers out of Level 3 (6) | | — |
| | — |
| | — |
| | — |
| | (178 | ) |
| Balance, end of period | | $ | 231 |
| | $ | 481 |
| | $ | 18 |
| | $ | (2,600 | ) | | $ | 1,254 |
|
| Changes in unrealized gains (losses) included in net income (loss) for the instruments still held at September 30, 2017: (7) | | $ | — |
| | $ | 32 |
| | $ | 27 |
| | $ | 204 |
| | $ | — |
|
| Changes in unrealized gains (losses) included in net income (loss) for the instruments still held at September 30, 2016: (7) | | $ | 1 |
| | $ | 10 |
| | $ | 7 |
| | $ | 227 |
| | $ | — |
|
MetLife, Inc.
Notes to the Interim Condensed Consolidated Financial Statements (Unaudited) — (continued)
8. Fair Value (continued)
| | | | | | | | | | | | | | | | | | | | | | | | | | | | | | | | | | | | | | |
| | Fair Value Measurements Using Significant Unobservable Inputs (Level 3) |
| | Fixed Maturity Securities AFS | | | | |
| | Corporate (7) | | Foreign
Government | | Structured
Products | | Municipals | | Equity
Securities | | Unit-linked
and FVO
Securities |
| | (In millions) |
| Six Months Ended June 30, 2021 | | | | | | | | | | | | |
| Balance, beginning of period | | $ | 24,101 | | | $ | 117 | | | $ | 5,289 | | | $ | 0 | | | $ | 150 | | | $ | 701 | |
| Total realized/unrealized gains (losses) included in net income (loss) (1), (2) | | (5) | | | 1 | | | 24 | | | 0 | | | 10 | | | 62 | |
| Total realized/unrealized gains (losses) included in AOCI | | (776) | | | (1) | | | (28) | | | 0 | | | 0 | | | 0 | |
| Purchases (3) | | 1,722 | | | 46 | | | 1,380 | | | 0 | | | 3 | | | 21 | |
| Sales (3) | | (507) | | | (5) | | | (685) | | | 0 | | | (16) | | | (15) | |
| Issuances (3) | | 0 | | | 0 | | | 0 | | | 0 | | | 0 | | | 0 | |
| Settlements (3) | | 0 | | | 0 | | | 0 | | | 0 | | | 0 | | | 0 | |
| Transfers into Level 3 (4) | | 101 | | | 13 | | | 270 | | | 0 | | | 0 | | | 95 | |
| Transfers out of Level 3 (4) | | (863) | | | (26) | | | (247) | | | 0 | | | (4) | | | (15) | |
| Balance, end of period | | $ | 23,773 | | | $ | 145 | | | $ | 6,003 | | | $ | 0 | | | $ | 143 | | | $ | 849 | |
| Six Months Ended June 30, 2020 | | | | | | | | | | | | |
| Balance, beginning of period | | $ | 14,229 | | | $ | 117 | | | $ | 4,458 | | | $ | 7 | | | $ | 430 | | | $ | 625 | |
| Total realized/unrealized gains (losses) included in net income (loss) (1), (2) | | (68) | | | (6) | | | 14 | | | 0 | | | (13) | | | (24) | |
| Total realized/unrealized gains (losses) included in AOCI | | (266) | | | 0 | | | (109) | | | 0 | | | 0 | | | 0 | |
| Purchases (3) | | 2,809 | | | 10 | | | 1,691 | | | 0 | | | 9 | | | 25 | |
| Sales (3) | | (562) | | | (4) | | | (433) | | | 0 | | | (34) | | | (101) | |
| Issuances (3) | | 0 | | | 0 | | | 0 | | | 0 | | | 0 | | | 0 | |
| Settlements (3) | | 0 | | | 0 | | | 0 | | | 0 | | | 0 | | | 0 | |
| Transfers into Level 3 (4) | | 5,101 | | | 1 | | | 156 | | | 0 | | | 0 | | | 155 | |
| Transfers out of Level 3 (4) | | (511) | | | (61) | | | (400) | | | (7) | | | (19) | | | (91) | |
| Balance, end of period | | $ | 20,732 | | | $ | 57 | | | $ | 5,377 | | | $ | 0 | | | $ | 373 | | | $ | 589 | |
| Changes in unrealized gains (losses) included in net income (loss) for the instruments still held at June 30, 2021 (6) | | $ | (8) | | | $ | 1 | | | $ | 22 | | | $ | 0 | | | $ | 5 | | | $ | 61 | |
| Changes in unrealized gains (losses) included in net income (loss) for the instruments still held at June 30, 2020 (6) | | $ | (36) | | | $ | (1) | | | $ | 23 | | | $ | 0 | | | $ | (12) | | | $ | (25) | |
| Changes in unrealized gains (losses) included in AOCI for the instruments still held at June 30, 2021 (6) | | $ | (767) | | | $ | (1) | | | $ | (26) | | | $ | 0 | | | $ | 0 | | | $ | 0 | |
| Changes in unrealized gains (losses) included in AOCI for the instruments still held at June 30, 2020 (6) | | $ | (290) | | | $ | 0 | | | $ | (106) | | | $ | 0 | | | $ | 0 | | | $ | 0 | |
|
| | | | | | | | | | | | | | | | | | | | | | | | | | | | |
| | | Fair Value Measurements Using Significant Unobservable Inputs (Level 3) |
| | | Fixed Maturity Securities | | | | |
| | | Corporate (1) | | Foreign
Government | | U.S. Government and Agency | | Structured Securities | | State and
Political
Subdivision | | Equity Securities | | FVO Securities (2) |
| | | (In millions) |
| Nine Months Ended September 30, 2017 | | | | | | | | | | | | | | |
| Balance, beginning of period | | $ | 11,537 |
| | $ | 289 |
| | $ | — |
| | $ | 5,215 |
| | $ | 10 |
| | $ | 468 |
| | $ | 287 |
|
| Total realized/unrealized gains (losses) included in net income (loss) (3), (4) | | 6 |
| | 3 |
| | — |
| | 80 |
| | — |
| | (14 | ) | | 20 |
|
| Total realized/unrealized gains (losses) included in AOCI | | 612 |
| | 4 |
| | — |
| | 118 |
| | 2 |
| | 30 |
| | — |
|
| Purchases (5) | | 2,802 |
| | 7 |
| | — |
| | 867 |
| | — |
| | 18 |
| | 209 |
|
| Sales (5) | | (1,487 | ) | | (97 | ) | | — |
| | (1,329 | ) | | — |
| | (74 | ) | | (115 | ) |
| Issuances (5) | | — |
| | — |
| | — |
| | — |
| | — |
| | — |
| | — |
|
| Settlements (5) | | — |
| | — |
| | — |
| | — |
| | — |
| | — |
| | — |
|
| Transfers into Level 3 (6) | | 83 |
| | — |
| | — |
| | 10 |
| | 59 |
| | — |
| | 3 |
|
| Transfers out of Level 3 (6) | | (1,435 | ) | | (8 | ) | | — |
| | (428 | ) | | (10 | ) | | (4 | ) | | (100 | ) |
| Balance, end of period | | $ | 12,118 |
| | $ | 198 |
| | $ | — |
| | $ | 4,533 |
| | $ | 61 |
| | $ | 424 |
| | $ | 304 |
|
| Nine Months Ended September 30, 2016 | | | | | | | | | | | | | | |
| Balance, beginning of period | | $ | 10,311 |
| | $ | 829 |
| | $ | — |
| | $ | 5,121 |
| | $ | 34 |
| | $ | 334 |
| | $ | 270 |
|
| Total realized/unrealized gains (losses) included in net income (loss) (3), (4) | | (4 | ) | | 10 |
| | — |
| | 74 |
| | 1 |
| | (22 | ) | | 9 |
|
| Total realized/unrealized gains (losses) included in AOCI | | 846 |
| | (2 | ) | | 14 |
| | 33 |
| | 1 |
| | 41 |
| | — |
|
| Purchases (5) | | 1,650 |
| | 58 |
| | 111 |
| | 2,004 |
| | — |
| | 20 |
| | 43 |
|
| Sales (5) | | (811 | ) | | (36 | ) | | — |
| | (1,182 | ) | | — |
| | (16 | ) | | (29 | ) |
| Issuances (5) | | — |
| | — |
| | — |
| | — |
| | — |
| | — |
| | — |
|
| Settlements (5) | | — |
| | — |
| | — |
| | — |
| | — |
| | — |
| | — |
|
| Transfers into Level 3 (6) | | 473 |
| | 41 |
| | 181 |
| | 26 |
| | 7 |
| | 327 |
| | 18 |
|
| Transfers out of Level 3 (6) | | (1,078 | ) | | (577 | ) | | (11 | ) | | (804 | ) | | (5 | ) | | (195 | ) | | (68 | ) |
| Balance, end of period | | $ | 11,387 |
| | $ | 323 |
| | $ | 295 |
| | $ | 5,272 |
| | $ | 38 |
| | $ | 489 |
| | $ | 243 |
|
| Changes in unrealized gains (losses) included in net income (loss) for the instruments still held at September 30, 2017 (7) | | $ | 6 |
| | $ | 3 |
| | $ | — |
| | $ | 68 |
| | $ | — |
| | $ | (12 | ) | | $ | 16 |
|
| Changes in unrealized gains (losses) included in net income (loss) for the instruments still held at September 30, 2016 (7) | | $ | — |
| | $ | 9 |
| | $ | — |
| | $ | 75 |
| | $ | 1 |
| | $ | (26 | ) | | $ | 9 |
|
MetLife, Inc.
Notes to the Interim Condensed Consolidated Financial Statements (Unaudited) — (continued)
8. Fair Value (continued)
|
| | | | | | | | | | | | | | | | | | | | |
| | | Fair Value Measurements Using Significant Unobservable Inputs (Level 3) |
| | | Short-term Investments | | Residential Mortgage
Loans — FVO | | Net Derivatives (8) | | Net Embedded Derivatives (9) | | Separate
Accounts (10) |
| | | (In millions) |
| Nine Months Ended September 30, 2017 | | | | | | | | | | |
| Balance, beginning of period | | $ | 46 |
| | $ | 566 |
| | $ | (562 | ) | | $ | (1,411 | ) | | $ | 1,141 |
|
| Total realized/unrealized gains (losses) included in net income (loss) (3), (4) | | — |
| | 38 |
| | 47 |
| | 444 |
| | (22 | ) |
| Total realized/unrealized gains (losses) included in AOCI | | — |
| | — |
| | 144 |
| | (42 | ) | | — |
|
| Purchases (5) | | 401 |
| | 184 |
| | — |
| | — |
| | 271 |
|
| Sales (5) | | (2 | ) | | (155 | ) | | — |
| | — |
| | (78 | ) |
| Issuances (5) | | — |
| | — |
| | (7 | ) | | — |
| | 1 |
|
| Settlements (5) | | — |
| | (69 | ) | | 115 |
| | (245 | ) | | (62 | ) |
| Transfers into Level 3 (6) | | 2 |
| | — |
| | — |
| | — |
| | 21 |
|
| Transfers out of Level 3 (6) | | (44 | ) | | — |
| | — |
| | — |
| | (233 | ) |
| Balance, end of period | | $ | 403 |
| | $ | 564 |
| | $ | (263 | ) | | $ | (1,254 | ) | | $ | 1,039 |
|
| Nine Months Ended September 30, 2016 | | | | | | | | | | |
| Balance, beginning of period | | $ | 244 |
| | $ | 314 |
| | $ | (179 | ) | | $ | (675 | ) | | $ | 1,558 |
|
| Total realized/unrealized gains (losses) included in net income (loss) (3), (4) | | 1 |
| | 22 |
| | 185 |
| | (1,450 | ) | | 7 |
|
| Total realized/unrealized gains (losses) included in AOCI | | 4 |
| | — |
| | 28 |
| | (239 | ) | | — |
|
| Purchases (5) | | 231 |
| | 187 |
| | 6 |
| | — |
| | 107 |
|
| Sales (5) | | (247 | ) | | (12 | ) | | — |
| | — |
| | (102 | ) |
| Issuances (5) | | — |
| | — |
| | (1 | ) | | — |
| | 28 |
|
| Settlements (5) | | — |
| | (30 | ) | | (19 | ) | | (236 | ) | | (57 | ) |
| Transfers into Level 3 (6) | | 1 |
| | — |
| | — |
| | — |
| | 9 |
|
| Transfers out of Level 3 (6) | | (3 | ) | | — |
| | (2 | ) | | — |
| | (296 | ) |
| Balance, end of period | | $ | 231 |
| | $ | 481 |
| | $ | 18 |
| | $ | (2,600 | ) | | $ | 1,254 |
|
| Changes in unrealized gains (losses) included in net income (loss) for the instruments still held at September 30, 2017 (7) | | $ | — |
| | $ | 38 |
| | $ | 27 |
| | $ | 422 |
| | $ | — |
|
| Changes in unrealized gains (losses) included in net income (loss) for the instruments still held at September 30, 2016 (7) | | $ | 1 |
| | $ | 22 |
| | $ | 157 |
| | $ | (1,469 | ) | | $ | — |
|
| | | | | | | | | | | | | | | | | | | | | | | | | | | | | | | | | | | | | | |
| | Fair Value Measurements Using Significant Unobservable Inputs (Level 3) |
| | Short-term
Investments | | Residential
Mortgage
Loans — FVO | | Other
Investments | | Net
Derivatives (8) | | Net Embedded
Derivatives (9) | | Separate
Accounts (10) |
| | (In millions) |
| Six Months Ended June 30, 2021 | | | | | | | | | | | | |
| Balance, beginning of period | | $ | 43 | | | $ | 165 | | | $ | 573 | | | $ | 594 | | | $ | (1,141) | | | $ | 1,079 | |
| Total realized/unrealized gains (losses) included in net income (loss) (1), (2) | | 0 | | | (3) | | | 25 | | | (217) | | | 669 | | | 2 | |
| Total realized/unrealized gains (losses) included in AOCI | | (1) | | | 0 | | | 0 | | | (412) | | | 22 | | | 0 | |
| Purchases (3) | | 84 | | | 0 | | | 183 | | | 4 | | | 0 | | | 188 | |
| Sales (3) | | (10) | | | (11) | | | 0 | | | 0 | | | 0 | | | (32) | |
| Issuances (3) | | 0 | | | 0 | | | 0 | | | (6) | | | 0 | | | 0 | |
| Settlements (3) | | 0 | | | (11) | | | 0 | | | 94 | | | (124) | | | 5 | |
| Transfers into Level 3 (4) | | 0 | | | 0 | | | 0 | | | 1 | | | 0 | | | 10 | |
| Transfers out of Level 3 (4) | | (3) | | | 0 | | | 0 | | | (1) | | | 0 | | | (3) | |
| Balance, end of period | | $ | 113 | | | $ | 140 | | | $ | 781 | | | $ | 57 | | | $ | (574) | | | $ | 1,249 | |
| Six Months Ended June 30, 2020 | | | | | | | | | | | | |
| Balance, beginning of period | | $ | 32 | | | $ | 188 | | | $ | 455 | | | $ | (146) | | | $ | (742) | | | $ | 980 | |
| Total realized/unrealized gains (losses) included in net income (loss) (1), (2) | | 0 | | | 3 | | | (3) | | | 112 | | | (1,051) | | | 2 | |
| Total realized/unrealized gains (losses) included in AOCI | | (3) | | | 0 | | | 0 | | | 991 | | | (6) | | | 0 | |
| Purchases (3) | | 2 | | | 0 | | | 39 | | | 0 | | | 0 | | | 178 | |
| Sales (3) | | (16) | | | (7) | | | 0 | | | 0 | | | 0 | | | (107) | |
| Issuances (3) | | 0 | | | 0 | | | 0 | | | 0 | | | 0 | | | (3) | |
| Settlements (3) | | 0 | | | (9) | | | 0 | | | (159) | | | (126) | | | 1 | |
| Transfers into Level 3 (4) | | 9 | | | 0 | | | 0 | | | 0 | | | 0 | | | 10 | |
| Transfers out of Level 3 (4) | | (17) | | | 0 | | | 0 | | | 0 | | | 0 | | | (5) | |
| Balance, end of period | | $ | 7 | | | $ | 175 | | | $ | 491 | | | $ | 798 | | | $ | (1,925) | | | $ | 1,056 | |
| Changes in unrealized gains (losses) included in net income (loss) for the instruments still held at June 30, 2021 (6) | | $ | 0 | | | $ | (7) | | | $ | 26 | | | $ | (132) | | | $ | 668 | | | $ | 0 | |
| Changes in unrealized gains (losses) included in net income (loss) for the instruments still held at June 30, 2020 (6) | | $ | 0 | | | $ | 0 | | | $ | 0 | | | $ | (12) | | | $ | (1,056) | | | $ | 0 | |
| Changes in unrealized gains (losses) included in AOCI for the instruments still held at June 30, 2021 (6) | | $ | (1) | | | $ | 0 | | | $ | 0 | | | $ | (274) | | | $ | 22 | | | $ | 0 | |
| Changes in unrealized gains (losses) included in AOCI for the instruments still held at June 30, 2020 (6) | | $ | (3) | | | $ | 0 | | | $ | 0 | | | $ | 899 | | | $ | (6) | | | $ | 0 | |
__________________
| |
(1) | Comprised of U.S. and foreign corporate securities. |
| |
(2) | Comprised of FVO contractholder-directed unit-linked investments, FVO general account securities and FVO general account securities held by CSEs. |
| |
(3) | Amortization of premium/accretion of discount is included within net investment income. Impairments charged to net income (loss) on securities are included in net investment gains (losses), while changes in estimated fair value of residential mortgage loans — FVO are included in net investment income. Lapses associated with net embedded derivatives are included in net derivative gains (losses). Substantially all realized/unrealized gains (losses) included in net income (loss) for net derivatives and net embedded derivatives are reported in net derivatives gains (losses). |
| |
(4) | Interest and dividend accruals, as well as cash interest coupons and dividends received, are excluded from the rollforward. |
| |
(5) | Items purchased/issued and then sold/settled in the same period are excluded from the rollforward. Fees attributed to embedded derivatives are included in settlements. |
| |
(6) | Gains and losses, in net income (loss) and OCI, are calculated assuming transfers into and/or out of Level 3 occurred at the beginning of the period. Items transferred into and then out of Level 3 in the same period are excluded from the rollforward. |
(1)Amortization of premium/accretion of discount is included within net investment income. Impairments charged to net income (loss) on securities are included in net investment gains (losses), while changes in estimated fair value of residential mortgage loans — FVO are included in net investment income. Lapses associated with net embedded derivatives are included in net derivative gains (losses). Substantially all realized/unrealized gains (losses) included in net income (loss) for net derivatives and net embedded derivatives are reported in net derivative gains (losses).
(2)Interest and dividend accruals, as well as cash interest coupons and dividends received, are excluded from the rollforward.
(3)Items purchased/issued and then sold/settled in the same period are excluded from the rollforward. Fees attributed to embedded derivatives are included in settlements.
(4)Items transferred into and then out of Level 3 in the same period are excluded from the rollforward.
MetLife, Inc.
Notes to the Interim Condensed Consolidated Financial Statements (Unaudited) — (continued)
8. Fair Value (continued)
(5)Transfers out of Level 3 for the three months ended June 30, 2021 included $28 million of short-term investments reclassified to assets held-for-sale. See Note 3 for information on the Company’s business dispositions.
| |
(7) | Changes in unrealized gains (losses) included in net income (loss) relate to assets and liabilities still held at the end of the respective periods. Substantially all changes in unrealized gains (losses) included in net income (loss) for net derivatives and net embedded derivatives are reported in net derivative gains (losses). |
| |
(8) | Freestanding derivative assets and liabilities are presented net for purposes of the rollforward. |
| |
(9) | Embedded derivative assets and liabilities are presented net for purposes of the rollforward. |
| |
(10) | Investment performance related to separate account assets is fully offset by corresponding amounts credited to contractholders within separate account liabilities. Therefore, such changes in estimated fair value are not recorded in net income (loss). For the purpose of this disclosure, these changes are presented within net investment gains (losses). Separate account assets and liabilities are presented net for the purposes of the rollforward. |
(6)Changes in unrealized gains (losses) included in net income (loss) and included in AOCI relate to assets and liabilities still held at the end of the respective periods. Substantially all changes in unrealized gains (losses) included in net income (loss) for net derivatives and net embedded derivatives are reported in net derivative gains (losses). (7)Comprised of U.S. and foreign corporate securities.
(8)Freestanding derivative assets and liabilities are presented net for purposes of the rollforward.
(9)Embedded derivative assets and liabilities are presented net for purposes of the rollforward.
(10)Investment performance related to separate account assets is fully offset by corresponding amounts credited to contractholders within separate account liabilities. Therefore, such changes in estimated fair value are not recorded in net income (loss). For the purpose of this disclosure, these changes are presented within net investment gains (losses). Separate account assets and liabilities are presented net for the purposes of the rollforward.
Fair Value Option
The Company elects the FVO for certain residential mortgage loans that are managed on a total return basis. The following table presents information for residential mortgage loans which are accounted for under the FVO and were initially measured at fair value.
| | | | | | | | | | | | | | |
| | June 30, 2021 | | December 31, 2020 |
| | (In millions) |
| Unpaid principal balance | | $ | 141 | | | $ | 172 | |
| Difference between estimated fair value and unpaid principal balance | | (1) | | | (7) | |
| Carrying value at estimated fair value | | $ | 140 | | | $ | 165 | |
| Loans in nonaccrual status | | $ | 35 | | | $ | 45 | |
| Loans more than 90 days past due | | $ | 18 | | | $ | 27 | |
| Loans in nonaccrual status or more than 90 days past due, or both — difference between aggregate estimated fair value and unpaid principal balance | | $ | (6) | | | $ | (13) | |
|
| | | | | | | | |
| | | Residential Mortgage
Loans — FVO |
| | | September 30, 2017 | | December 31, 2016 |
| | | (In millions) |
| Assets | | | | |
| Unpaid principal balance | | $ | 711 |
| | $ | 794 |
|
| Difference between estimated fair value and unpaid principal balance | | (147 | ) | | (228 | ) |
| Carrying value at estimated fair value | | $ | 564 |
| | $ | 566 |
|
| Loans in nonaccrual status | | $ | 213 |
| | $ | 214 |
|
| Loans more than 90 days past due | | $ | 106 |
| | $ | 137 |
|
| Loans in nonaccrual status or more than 90 days past due, or both — difference between aggregate estimated fair value and unpaid principal balance | | $ | (121 | ) | | $ | (150 | ) |
MetLife, Inc.
Notes to the Interim Condensed Consolidated Financial Statements (Unaudited) — (continued)
8. Fair Value (continued)
Nonrecurring Fair Value Measurements
The following table presents information for assets measured at estimated fair value on a nonrecurring basis during the periods and still held at the reporting dates (for example, when there is evidence of impairment). The estimated fair values for these assets were determined, using significant unobservable inputs (Level 3).
|
| | | | | | | | | | | | | | | | | | | | | | | | |
| | | At September 30, | | Three Months
Ended
September 30, | | Nine Months
Ended
September 30, |
| | | 2017 | | 2016 | | 2017 | | 2016 | | 2017 | | 2016 |
| | | Carrying Value After Measurement | | Gains (Losses) |
| | | (In millions) |
| Mortgage loans (1) | | $ | 19 |
| | $ | 9 |
| | $ | (1 | ) | | $ | — |
| | $ | (1 | ) | | $ | — |
|
| Other limited partnership interests (2) | | $ | 85 |
| | $ | 75 |
| | $ | (30 | ) | | $ | (9 | ) | | $ | (54 | ) | | $ | (43 | ) |
| Other assets (3) | | $ | — |
| | $ | — |
| | $ | — |
| | $ | — |
| | $ | (5 | ) | | $ | (30 | ) |
| | | | | | | | | | | | | | | | | | | | | | | | | | | | | | | | | | | | | | |
| | June 30, | | December 31, | | Three Months
Ended
June 30, | Six Months
Ended
June 30, |
| | 2021 | | 2020 | | 2021 | | 2020 | | 2021 | | 2020 |
| | Carrying Value After Measurement | | Gains (Losses) |
| | (In millions) |
| Mortgage loans, net (1) | | $ | 406 | | | $ | 408 | | | $ | (37) | | | $ | (9) | | | $ | (33) | | | $ | (9) | |
__________________
| |
(1) | Estimated fair values for impaired mortgage loans are based on independent broker quotations or valuation models using unobservable inputs or, if the loans are in foreclosure or are otherwise determined to be collateral dependent, are based on the estimated fair value of the underlying collateral or the present value of the expected future cash flows. |
| |
(2) | For these cost method investments, estimated fair value is determined from information provided on the financial statements of the underlying entities including NAV data. These investments include private equity and debt funds that typically invest primarily in various strategies including domestic and international leveraged buyout funds; power, energy, timber and infrastructure development funds; venture capital funds; and below investment grade debt and mezzanine debt funds. Distributions will be generated from investment gains, from operating income from the underlying investments of the funds and from liquidation of the underlying assets of the funds. The Company estimates that the underlying assets of the funds will be liquidated over the next two to 10 years. Unfunded commitments for these investments at both September 30, 2017 and 2016 were not significant. |
| |
(3) | During the nine months ended September 30, 2016, the Company recognized an impairment of computer software in connection with the sale to MassMutual. See Note 3 of the Notes to the Consolidated Financial Statements included in the 2016 Annual Report.(1)Estimated fair values for impaired mortgage loans are based on estimated fair value of the underlying collateral.
MetLife, Inc. Notes to the Interim Condensed Consolidated Financial Statements (Unaudited) — (continued) 8. Fair Value (continued) |
Fair Value of Financial Instruments Carried at Other Than Fair Value
The following tables provide fair value information for financial instruments that are carried on the balance sheet at amounts other than fair value. These tables exclude the following financial instruments: cash and cash equivalents, accrued investment income, payables for collateral under securities loaned and other transactions, short-term debt and those short-term investments that are not securities, such as time deposits, and therefore are not included in the three levelthree-level hierarchy table disclosed in the “— Recurring Fair Value Measurements” section. The estimated fair valueCompany believes that due to the short-term nature of thethese excluded financial instruments,assets, which are primarily classified in Level 2, the estimated fair value approximates carrying value as they are short-term in nature such that the Company believes there is minimal risk of material changes in interest rates or credit quality.value. All remaining balance sheet amounts excluded from the tables below are not considered financial instruments subject to this disclosure.
MetLife, Inc.
Notes to the Interim Condensed Consolidated Financial Statements (Unaudited) — (continued)
8. Fair Value (continued)
The carrying values and estimated fair values for such financial instruments, and their corresponding placement in the fair value hierarchy, are summarized as follows at:
| | | | | | | | | | | | | | | | | | | | | | | | | | | | | | | | |
| | June 30, 2021 (1) |
| | | | Fair Value Hierarchy | | |
| | Carrying Value | | Level 1 | | Level 2 | | Level 3 | | Total Estimated Fair Value |
| | (In millions) |
| Assets | | | | | | | | | | |
| Mortgage loans (2) | | $ | 81,357 | | | $ | 0 | | | $ | 0 | | | $ | 85,617 | | | $ | 85,617 | |
| Policy loans | | $ | 9,256 | | | $ | 0 | | | $ | 0 | | | $ | 11,085 | | | $ | 11,085 | |
| | | | | | | | | | |
| Other invested assets | | $ | 1,066 | | | $ | 0 | | | $ | 791 | | | $ | 275 | | | $ | 1,066 | |
| Premiums, reinsurance and other receivables | | $ | 3,137 | | | $ | 0 | | | $ | 1,344 | | | $ | 1,989 | | | $ | 3,333 | |
| Other assets | | $ | 296 | | | $ | 0 | | | $ | 103 | | | $ | 189 | | | $ | 292 | |
| Liabilities | | | | | | | | | | |
| Policyholder account balances | | $ | 126,996 | | | $ | 0 | | | $ | 0 | | | $ | 132,641 | | | $ | 132,641 | |
| Long-term debt | | $ | 14,424 | | | $ | 0 | | | $ | 17,509 | | | $ | 0 | | | $ | 17,509 | |
| Collateral financing arrangement | | $ | 818 | | | $ | 0 | | | $ | 0 | | | $ | 684 | | | $ | 684 | |
| Junior subordinated debt securities | | $ | 3,154 | | | $ | 0 | | | $ | 4,582 | | | $ | 0 | | | $ | 4,582 | |
| Other liabilities | | $ | 2,858 | | | $ | 0 | | | $ | 1,293 | | | $ | 2,261 | | | $ | 3,554 | |
| Separate account liabilities | | $ | 104,855 | | | $ | 0 | | | $ | 104,855 | | | $ | 0 | | | $ | 104,855 | |
|
| | | | | | | | | | | | | | | | | | | | |
| | | September 30, 2017 |
| | | | | Fair Value Hierarchy | | |
| | | Carrying
Value | | Level 1 | | Level 2 | | Level 3 | | Total
Estimated
Fair Value |
| | | (In millions) |
| Assets | | | | | | | | | | |
| Mortgage loans | | $ | 67,493 |
| | $ | — |
| | $ | — |
| | $ | 69,218 |
| | $ | 69,218 |
|
| Policy loans | | $ | 9,585 |
| | $ | — |
| | $ | 335 |
| | $ | 11,092 |
| | $ | 11,427 |
|
| Real estate joint ventures | | $ | 2 |
| | $ | — |
| | $ | — |
| | $ | 11 |
| | $ | 11 |
|
| Other limited partnership interests | | $ | 239 |
| | $ | — |
| | $ | — |
| | $ | 243 |
| | $ | 243 |
|
| Other invested assets | | $ | 553 |
| | $ | 159 |
| | $ | — |
| | $ | 394 |
| | $ | 553 |
|
| Premiums, reinsurance and other receivables | | $ | 4,140 |
| | $ | — |
| | $ | 1,244 |
| | $ | 3,089 |
| | $ | 4,333 |
|
| Other assets | | $ | 272 |
| | $ | — |
| | $ | 191 |
| | $ | 113 |
| | $ | 304 |
|
| Liabilities | | | | | | | | | | |
| Policyholder account balances | | $ | 114,100 |
| | $ | — |
| | $ | — |
| | $ | 116,637 |
| | $ | 116,637 |
|
| Long-term debt | | $ | 16,676 |
| | $ | — |
| | $ | 18,596 |
| | $ | — |
| | $ | 18,596 |
|
| Collateral financing arrangement | | $ | 1,220 |
| | $ | — |
| | $ | — |
| | $ | 945 |
| | $ | 945 |
|
| Junior subordinated debt securities | | $ | 3,144 |
| | $ | — |
| | $ | 4,337 |
| | $ | — |
| | $ | 4,337 |
|
| Other liabilities | | $ | 5,122 |
| | $ | — |
| | $ | 3,466 |
| | $ | 2,293 |
| | $ | 5,759 |
|
| Separate account liabilities | | $ | 123,586 |
| | $ | — |
| | $ | 123,586 |
| | $ | — |
| | $ | 123,586 |
|
|
| | | | | | | | | | | | | | | | | | | | |
| | | December 31, 2016 |
| | | | | Fair Value Hierarchy | | |
| | | Carrying
Value | | Level 1 | | Level 2 | | Level 3 | | Total
Estimated
Fair Value |
| | | (In millions) |
| Assets | | | | | | | | | | |
| Mortgage loans | | $ | 64,601 |
| | $ | — |
| | $ | — |
| | $ | 65,742 |
| | $ | 65,742 |
|
| Policy loans | | $ | 9,511 |
| | $ | — |
| | $ | 335 |
| | $ | 10,921 |
| | $ | 11,256 |
|
| Real estate joint ventures | | $ | 4 |
| | $ | — |
| | $ | — |
| | $ | 26 |
| | $ | 26 |
|
| Other limited partnership interests | | $ | 340 |
| | $ | — |
| | $ | — |
| | $ | 371 |
| | $ | 371 |
|
| Other invested assets | | $ | 497 |
| | $ | 145 |
| | $ | — |
| | $ | 352 |
| | $ | 497 |
|
| Premiums, reinsurance and other receivables | | $ | 4,088 |
| | $ | — |
| | $ | 1,152 |
| | $ | 3,127 |
| | $ | 4,279 |
|
| Other assets | | $ | 237 |
| | $ | — |
| | $ | 198 |
| | $ | 71 |
| | $ | 269 |
|
| Liabilities | | | | | | | | | | |
| Policyholder account balances | | $ | 108,255 |
| | $ | — |
| | $ | — |
| | $ | 110,359 |
| | $ | 110,359 |
|
| Long-term debt | | $ | 16,422 |
| | $ | — |
| | $ | 17,972 |
| | $ | — |
| | $ | 17,972 |
|
| Collateral financing arrangement | | $ | 1,274 |
| | $ | — |
| | $ | — |
| | $ | 978 |
| | $ | 978 |
|
| Junior subordinated debt securities | | $ | 3,169 |
| | $ | — |
| | $ | 3,982 |
| | $ | — |
| | $ | 3,982 |
|
| Other liabilities | | $ | 1,767 |
| | $ | — |
| | $ | 1,493 |
| | $ | 275 |
| | $ | 1,768 |
|
| Separate account liabilities | | $ | 118,385 |
| | $ | — |
| | $ | 118,385 |
| | $ | — |
| | $ | 118,385 |
|
MetLife, Inc.
Notes to the Interim Condensed Consolidated Financial Statements (Unaudited) — (continued)
8. Fair Value (continued)
| | | | | | | | | | | | | | | | | | | | | | | | | | | | | | | | |
| | December 31, 2020 (1) |
| | | | Fair Value Hierarchy | | |
| | Carrying
Value | | Level 1 | | Level 2 | | Level 3 | | Total
Estimated
Fair Value |
| | (In millions) |
| Assets | | | | | | | | | | |
| Mortgage loans (2) | | $ | 83,754 | | | $ | 0 | | | $ | 0 | | | $ | 88,675 | | | $ | 88,675 | |
| Policy loans | | $ | 9,493 | | | $ | 0 | | | $ | 0 | | | $ | 11,598 | | | $ | 11,598 | |
| | | | | | | | | | |
| Other invested assets | | $ | 1,188 | | | $ | 0 | | | $ | 814 | | | $ | 374 | | | $ | 1,188 | |
| Premiums, reinsurance and other receivables | | $ | 2,729 | | | $ | 0 | | | $ | 908 | | | $ | 2,070 | | | $ | 2,978 | |
| Other assets | | $ | 300 | | | $ | 0 | | | $ | 111 | | | $ | 190 | | | $ | 301 | |
| Liabilities | | | | | | | | | | |
| Policyholder account balances | | $ | 126,458 | | | $ | 0 | | | $ | 0 | | | $ | 134,569 | | | $ | 134,569 | |
| Long-term debt | | $ | 14,492 | | | $ | 0 | | | $ | 18,332 | | | $ | 0 | | | $ | 18,332 | |
| Collateral financing arrangement | | $ | 845 | | | $ | 0 | | | $ | 0 | | | $ | 710 | | | $ | 710 | |
| Junior subordinated debt securities | | $ | 3,153 | | | $ | 0 | | | $ | 4,604 | | | $ | 0 | | | $ | 4,604 | |
| Other liabilities | | $ | 2,113 | | | $ | 0 | | | $ | 527 | | | $ | 2,606 | | | $ | 3,133 | |
| Separate account liabilities | | $ | 115,682 | | | $ | 0 | | | $ | 115,682 | | | $ | 0 | | | $ | 115,682 | |
The methods, assumptions and significant valuation techniques and inputs used to estimate the fair value of_________________
(1)Excludes amounts for financial instruments are summarized as follows:
Mortgage Loans
The estimated fair value of mortgage loans is primarily determined by estimating expected future cash flows and discounting them using current interest ratesreclassified to assets held-for-sale or liabilities held-for-sale. See Note 3 for similar mortgage loans with similar credit risk, or is determined from pricing for similar loans.
Policy Loans
Policy loans with fixed interest rates are classified within Level 3. The estimated fair values for these loans are determined using a discounted cash flow model applied to groups of similar policy loans determined by the nature of the underlying insurance liabilities. Cash flow estimates are developed by applying a weighted-average interest rate to the outstanding principal balance of the respective group of policy loans and an estimated average maturity determined through experience studies of the past performance of policyholder repayment behavior for similar loans. These cash flows are discounted using current risk-free interest rates with no adjustment for borrower credit risk, as these loans are fully collateralized by the cash surrender value of the underlying insurance policy. Policy loans with variable interest rates are classified within Level 2 and the estimated fair value approximates carrying value due to the absence of borrower credit risk and the short time period between interest rate resets, which presents minimal risk of a material change in estimated fair value due to changes in market interest rates.
Real Estate Joint Ventures and Other Limited Partnership Interests
The estimated fair values of these cost method investments are generally basedinformation on the Company’s share of the NAV as provided on the financial statements of the investees. In certain circumstances, management may adjust the NAV by a premium or discount when it has sufficient evidence to support applying such adjustments.business dispositions.
Other Invested Assets
These other invested assets are principally comprised of various interest-bearing assets held in foreign subsidiaries and certain amounts due under contractual indemnifications. For the various interest-bearing assets held in foreign subsidiaries, the Company evaluates the specific facts and circumstances of each instrument to determine the appropriate estimated fair values. These estimated fair values were not materially different from the recognized carrying values.
Premiums, Reinsurance and Other Receivables
Premiums, reinsurance and other receivables are principally comprised of certain amounts recoverable under reinsurance agreements, amounts on deposit with financial institutions to facilitate daily settlements related to certain derivatives and amounts receivable for securities sold but not yet settled.
Amounts recoverable under ceded reinsurance agreements, which the Company has determined do not transfer significant risk such that they are accounted for using the deposit method of accounting, have been classified as Level 3. The valuation is based on discounted cash flow methodologies using significant unobservable inputs. The estimated fair value is determined using interest rates determined to reflect the appropriate credit standing of the assuming counterparty.
The amounts on deposit for derivative settlements, classified within Level 2, essentially represent the equivalent of demand deposit balances and amounts due for securities sold are generally received over short periods such that the estimated fair value approximates carrying value.
Other Assets
These other assets are principally comprised of both a receivable for funds due but not yet settled and a receivable for cash paid to an unaffiliated financial institution under the MetLife Reinsurance Company of Charleston (“MRC”) collateral financing arrangement described in Note 13 of the Notes to the Consolidated Financial Statements included in the 2016 Annual Report. The estimated fair value of the receivable for the cash paid to the unaffiliated financial institution under the MRC collateral financing arrangement is determined by discounting the expected future cash flows using a discount rate that reflects the credit rating of the unaffiliated financial institution.
MetLife, Inc.
Notes to the Interim Condensed Consolidated Financial Statements (Unaudited) — (continued)
8. Fair Value (continued)
Policyholder Account Balances
These policyholder account balances include investment contracts which primarily include certain funding agreements, fixed deferred annuities, modified guaranteed annuities, fixed term payout annuities and total control accounts (“TCA”). The valuation of these investment contracts is based on discounted cash flow methodologies using significant unobservable inputs. The estimated fair value is determined using current market risk-free interest rates adding a spread to reflect the nonperformance risk in the liability.
Long-term Debt, Collateral Financing Arrangement and Junior Subordinated Debt Securities
The estimated fair values of long-term debt, a collateral financing arrangement and junior subordinated debt securities are principally determined using market standard valuation methodologies.
Valuations of instruments classified as Level 2 are based primarily on quoted prices in markets that are not active or using matrix pricing that use standard market observable inputs such as quoted prices in markets that are not active and observable yields and spreads in the market. Instruments valued using discounted cash flow methodologies use standard market observable inputs including market yield curve, duration, call provisions, observable prices and spreads for similar publicly traded or privately traded issues.
Valuations of instruments classified as Level 3 are based primarily on discounted cash flow methodologies that utilize unobservable discount rates that can vary significantly based upon the specific terms of each individual arrangement. The determination of estimated fair values of a collateral financing arrangement incorporates valuations obtained from the counterparties to the arrangement as part of the collateral management process.
Other Liabilities
Other liabilities consist primarily of interest payable, amounts due for securities purchased but not yet settled, and funds withheld amounts payable, which are contractually withheld by the Company in accordance with the terms of the reinsurance agreements. The Company evaluates the specific terms, facts and circumstances of each instrument to determine the appropriate estimated fair values, which are not materially different from the carrying values, with the exception of certain deposit type reinsurance payables. For such payables, the estimated fair value is determined as the present value of expected future cash flows, which are discounted using an interest rate determined to reflect the appropriate credit standing of the assuming counterparty.
Separate Account Liabilities
Separate account liabilities represent those balances due to policyholders under contracts that are classified as investment contracts.
Separate account liabilities classified as investment contracts primarily represent variable annuities with no significant mortality risk to the Company such that the death benefit is equal to the account balance, funding agreements related to group life contracts and certain contracts that provide for benefit funding.
Since separate account liabilities are fully funded by cash flows from the separate account assets which are recognized(2)Includes mortgage loans measured at estimated fair value as described in the section “— Recurring Fair Value Measurements,” the value of those assets approximates theon a nonrecurring basis and excludes mortgage loans measured at estimated fair value on a recurring basis.
9. Long Term Debt
Credit Facility
In February 2021, MetLife, Inc. and MetLife Funding, Inc. amended and restated their five-year $3.0 billion unsecured credit agreement (as amended and restated, the “2021 Five-Year Credit Agreement”). The facility may be used for general corporate purposes (including in the case of loans, to back up commercial paper and, in the case of letters of credit, to support variable annuity policy and reinsurance reserve requirements). All borrowings under the 2021 Five-Year Credit Agreement must be repaid by February 26, 2026, except that letters of credit outstanding on that date may remain outstanding until no later than February 26, 2027. MetLife, Inc. incurred costs of $6 million related to the 2021 Five-Year Credit Agreement, which were capitalized and included in other assets. These costs are being amortized over the remaining term of the related separate account liabilities. The valuation techniques and inputs for separate account liabilities are similar to those described for separate account assets.2021 Five-Year Credit Agreement.
MetLife, Inc.
Notes to the Interim Condensed Consolidated Financial Statements (Unaudited) — (continued)
9. Junior Subordinated Debt Securities
On February 10, 2017, MetLife, Inc. exchanged $750 million aggregate principal amount of its 9.250% Fixed-to-Floating Rate Junior Subordinated Debentures due 2068 for $750 million aggregate liquidation preference of the 9.250% Fixed-to-Floating Rate Exchangeable Surplus Trust Securities of MetLife Capital Trust X (the “Trust”). As a result of the exchange, MetLife, Inc. became the sole beneficial owner of the Trust, a special purpose entity which issued the exchangeable surplus trust securities to third-party investors. On March 23, 2017, MetLife, Inc. dissolved the Trust.
10. Equity
Preferred Stock
Preferred stock authorized, issued and outstanding was as followsfollows:
| | | | | | | | | | | | | | | | | | | | | | | | | | |
| | June 30, 2021 | December 31, 2020 |
| Series | | Shares
Authorized | | Shares Issued and Outstanding | | Shares
Authorized | | Shares Issued and Outstanding |
| Floating Rate Non-Cumulative Preferred Stock, Series A | | 27,600,000 | | | 24,000,000 | | | 27,600,000 | | | 24,000,000 | |
| 5.25% Fixed-to-Floating Rate Non-Cumulative Preferred Stock, Series C (1) | | 0 | | | 0 | | | 1,500,000 | | | 500,000 | |
| 5.875% Fixed-to-Floating Rate Non-Cumulative Preferred Stock, Series D | | 500,000 | | | 500,000 | | | 500,000 | | | 500,000 | |
| 5.625% Non-Cumulative Preferred Stock, Series E | | 32,200 | | | 32,200 | | | 32,200 | | | 32,200 | |
| 4.75% Non-Cumulative Preferred Stock, Series F | | 40,000 | | | 40,000 | | | 40,000 | | | 40,000 | |
| 3.85% Fixed Rate Reset Non-Cumulative Preferred Stock, Series G | | 1,000,000 | | | 1,000,000 | | | 1,000,000 | | | 1,000,000 | |
| Series A Junior Participating Preferred Stock | | 10,000,000 | | | 0 | | | 10,000,000 | | | 0 | |
| Not designated | | 160,827,800 | | | 0 | | | 159,327,800 | | | 0 | |
| Total | | 200,000,000 | | | 25,572,200 | | | 200,000,000 | | | 26,072,200 | |
__________________
(1)On May 17, 2021, the outstanding 500,000 shares of MetLife, Inc.’s 5.25% Fixed-to-Floating Rate Non-Cumulative Preferred Stock, Series C (the “Series C preferred stock”) were irrevocably called for redemption, and on June 15, 2021, MetLife, Inc. redeemed and canceled the shares.
In May 2021, MetLife, Inc. delivered a notice of redemption to the holders of the Series C preferred stock pursuant to which it would redeem the remaining 500,000 shares of Series C preferred stock at both Septembera redemption price of $1,000 per share. In connection with the redemption, MetLife, Inc. recognized a preferred stock redemption premium of $6 million (calculated as the difference between the carrying value of the Series C preferred stock and the total amount paid by MetLife, Inc. to the holders of the Series C preferred stock in connection with the redemption), which was recorded as a reduction of retained earnings at June 30, 20172021. All outstanding shares of Series C preferred stock were redeemed on the dividend payment date of June 15, 2021 for an aggregate redemption price of $500 million in cash.
In June 2021, MetLife, Inc. filed a Certificate of Elimination (the “Certificate of Elimination”) of Series C preferred stock with the Secretary of State of the State of Delaware to eliminate all references to the Series C preferred stock in MetLife, Inc.’s Amended and December 31, 2016:Restated Certificate of Incorporation (the “Certificate of Incorporation”), including the related Certificate of Designations. As a result of the filing of the Certificate of Elimination, MetLife, Inc.’s Certificate of Incorporation was amended to eliminate all references therein to the Series C preferred stock, and the shares that were designated to such series were returned to the status of authorized but unissued shares of preferred stock, par value $0.01 per share, of MetLife, Inc., without designation as to series. The Certificate of Elimination does not affect the total number of authorized shares of capital stock of MetLife, Inc. or the total number of authorized shares of preferred stock.
The per share and aggregate dividends declared for MetLife, Inc.’s preferred stock were as follows:
| | | | | | | | | | | | | | | | | | | | | | | | | | | | | | | | | | | | | | | | | | | | | | | | | | |
| | Three Month Ended June 30, | | Six Months Ended June 30, |
| | 2021 | | 2020 | | 2021 | | 2020 |
| Series | | Per Share | | Aggregate | | Per Share | | Aggregate | | Per Share | | Aggregate | | Per Share | | Aggregate |
| | (In million, except per share data) |
| A | | $ | 0.256 | | | $ | 6 | | | $ | 0.253 | | | $ | 6 | | | $ | 0.506 | | | $ | 12 | | | $ | 0.506 | | | $ | 12 | |
| C | | $ | 9.606 | | | 5 | | | $ | 26.250 | | | 39 | | | $ | 19.085 | | | 10 | | | $ | 26.250 | | | 39 | |
| D | | $ | 0 | | | 0 | | | $ | 0 | | | 0 | | | $ | 29.375 | | | 15 | | | $ | 29.375 | | | 15 | |
| E | | $ | 351.563 | | | 12 | | | $ | 351.563 | | | 12 | | | $ | 703.126 | | | 23 | | | $ | 703.126 | | | 23 | |
| F | | $ | 296.875 | | | 12 | | | $ | 494.792 | | | 20 | | | $ | 593.750 | | | 24 | | | $ | 494.792 | | | 20 | |
| G | | $ | 0 | | | 0 | | | $ | 0 | | | 0 | | | $ | 19.785 | | | 19 | | | $ | 0 | | | 0 | |
| Total | | | | $ | 35 | | | | | $ | 77 | | | | | $ | 103 | | | | | $ | 109 | |
|
| | | | | | | | | |
| Series | | Shares Authorized | | Shares Issued | | Shares Outstanding |
| Floating Rate Non-Cumulative Preferred Stock, Series A | | 27,600,000 |
| | 24,000,000 |
| | 24,000,000 |
|
| 5.25% Fixed-to-Floating Rate Non-Cumulative Preferred Stock, Series C | | 1,500,000 |
| | 1,500,000 |
| | 1,500,000 |
|
| Series A Junior Participating Preferred Stock | | 10,000,000 |
| | — |
| | — |
|
| Not designated | | 160,900,000 |
| | — |
| | — |
|
| Total | | 200,000,000 |
| | 25,500,000 |
| | 25,500,000 |
|
Notes to the Interim Condensed Consolidated Financial Statements (Unaudited) — (continued)
10. Equity (continued)
Common Stock
During thenine months endedSeptember 30, 2017and2016, MetLife, Inc. repurchased 44,737,625 shares and 1,445,864 shares throughannounced that its Board of Directors authorized common stock repurchases as follows:
| | | | | | | | | | | | | | |
| | | | Authorization Remaining at |
| Announcement Date | | Authorization Amount | | June 30, 2021 |
| | (In millions) |
| December 11, 2020 | | $ | 3,000 | | | $ | 723 | |
| July 31, 2019 | | $ | 2,000 | | | $ | 0 | |
Under these authorizations, MetLife, Inc. may purchase its common stock from the MetLife Policyholder Trust, in the open market purchases for $2.3 billion and $70 million, respectively.
At September 30, 2017, MetLife, Inc. had $383 million remaining(including pursuant to the terms of a pre-set trading plan meeting the requirements of Rule 10b5-1 under the common stock repurchase authorization.Securities Exchange Act of 1934 (“Exchange Act”)), and in privately negotiated transactions. Common stock repurchases are dependentsubject to the discretion of MetLife, Inc.’s Board of Directors and will depend upon several factors, including the Company’s capital position, liquidity, financial strength and credit ratings, general market conditions, the market price of MetLife, Inc.’s common stock compared to management’s assessment of the stock’s underlying value, and applicable regulatory approvals, as well asand other legal and accounting factors.
See Note 16 for information on a subsequent common stock repurchasesrepurchase authorization.
For the six months ended June 30, 2021 and authorizations.2020, MetLife, Inc. repurchased 36,170,428 shares and 10,664,608 shares of its common stock, respectively, through open market purchases for $2.1 billion and $500 million, respectively.
Stock-Based Compensation Plans
Performance Shares and Performance Units
Final Performance Shares are paid in shares of MetLife, Inc. common stock. Final Performance Units are payable in cash equal to the closing price of MetLife, Inc. common stock on a date following the last day of the three-year performance period. The performance factor for the January 1, 20142018 – December 31, 20162020 performance period was 44.4%110.8%, which was determined within a possible range from 0% to 175%. This factor has been applied to the 1,066,0761,266,651 Performance Shares and 165,587170,214 Performance Units associated with that performance period that vested on December 31, 2016.2020. As a result, in the first quarter of 2017,2021, MetLife, Inc. issued 473,3381,403,449 shares of its common stock (less withholding for taxes and other items, as applicable), excluding shares that payees choose to defer, and MetLife, Inc. or its affiliates paid the cash value of 73,521188,597 Performance Units (less withholding for taxes and other items, as applicable).
Dividend Restrictions
Insurance Operations
For the six months ended June 30, 2021, American Life Insurance Company paid a dividend of $600 million to MetLife, Inc., for which regulatory approval was obtained as required.
Additionally, for the six months ended June 30, 2021, Metropolitan Property and Casualty Insurance Company paid a non-cash dividend of $35 million consisting of the stock of a subsidiary to MetLife, Inc., for which regulatory approval was obtained as required. See Note 3 on the disposition of MetLife P&C.
See Note 16 of the Notes to Consolidated Financial Statements included in the 2020 Annual Report for additional information on dividend restrictions.
MetLife, Inc.
Notes to the Interim Condensed Consolidated Financial Statements (Unaudited) — (continued)
10. Equity (continued)
Dividend Restrictions
The declaration and payment of dividends is subject to the discretion of MetLife, Inc.’s Board of Directors, and will depend on its financial condition, results of operations, cash requirements, future prospects and other factors deemed relevant by the Board. The payment of dividends on MetLife, Inc.’s common stock, and MetLife, Inc.’s ability to repurchase its common stock, may also be subject to restrictions under potential regulation by the Board of Governors of the Federal Reserve System (the “Federal Reserve Board”) and the Federal Reserve Bank of New York (collectively, with the Federal Reserve Board, the “Federal Reserve”) if MetLife, Inc. were re-designated by the Financial Stability Oversight Council (“FSOC”) as a non-bank systemically important financial institution (“non-bank SIFI”).
MetLife, Inc.’s preferred stock and junior subordinated debentures contain provisions that would automatically suspend the payment of preferred stock dividends and interest on junior subordinated debentures if MetLife, Inc. fails to meet certain risk based capital ratio, net income and stockholders’ equity tests at specified times, except to the extent of the net proceeds from the issuance of certain securities during specified periods. If preferred stock dividends or interest on junior subordinated debentures are not paid, certain provisions in those instruments (sometimes referred to as “dividend stoppers”) may restrict MetLife, Inc. from repurchasing its common or preferred stock or paying dividends on its common or preferred stock and interest on its junior subordinated debentures. If MetLife, Inc. has not paid the full dividends on its preferred stock for the latest completed dividend period, MetLife, Inc. may not repurchase or pay dividends on its common stock during a dividend period. Under the junior subordinated debentures, if MetLife, Inc. has not paid in full the accrued interest on its junior subordinated debentures through the most recent interest payment date, it may not repurchase or pay dividends on its common stock or other capital stock (including the preferred stock), subject to certain exceptions. After obtaining the approval of the holders of a majority of MetLife, Inc.’s outstanding common stock on October 19, 2017, MetLife, Inc. amended the stockholders’ equity test applicable to the preferred stock to reflect the Separation of Brighthouse, so that prospectively the test will reflect the decrease in MetLife’s shareholders’ equity as a result of the Separation. On August 28, 2017, with the consent of holders of each series of junior subordinated debentures (or securities exchangeable for junior subordinated debentures), MetLife amended the stockholders’ equity test in the junior subordinated debentures to the same effect.
The junior subordinated debentures further provide that MetLife may, at its option and provided that certain conditions are met, defer payment of interest without giving rise to an event of default for periods of up to 10 years. In that case, after five years MetLife, Inc. would be obligated to use commercially reasonable efforts to sell equity securities to raise proceeds to pay the interest. MetLife, Inc. would not be subject to limitations on the number of deferral periods that MetLife, Inc. could begin, so long as all accrued and unpaid interest is paid with respect to prior deferral periods. If MetLife, Inc. were to defer payments of interest, the “dividend stopper” provisions in the junior subordinated debentures would thus prevent MetLife, Inc. from repurchasing or paying dividends on its common stock or other capital stock (including the preferred stock) during the period of deferral, subject to exceptions.
MetLife, Inc.
Notes to the Interim Condensed Consolidated Financial Statements (Unaudited) — (continued)
10. Equity (continued)
Accumulated Other Comprehensive Income (Loss)
Information regarding changes in the balances of each component of AOCI attributable to MetLife, Inc., was as follows:
| | | | | | | | | | | | | | | | | | | | | | | | | | | | | | | | |
| | Three Months
Ended
June 30, 2021 |
| | Unrealized
Investment Gains
(Losses), Net of
Related Offsets (1) | | Unrealized
Gains (Losses)
on Derivatives | | Foreign
Currency
Translation
Adjustments | | Defined
Benefit
Plans
Adjustment | | Total |
| | (In millions) |
| Balance, beginning of period | | $ | 16,194 | | | $ | 518 | | | $ | (4,467) | | | $ | (1,848) | | | $ | 10,397 | |
| Other comprehensive income (loss) (“OCI”) before reclassifications | | 2,099 | | | 828 | | | 6 | | | 1 | | | 2,934 | |
| Deferred income tax benefit (expense) | | (570) | | | (169) | | | (2) | | | (1) | | | (742) | |
| AOCI before reclassifications, net of income tax | | 17,723 | | | 1,177 | | | (4,463) | | | (1,848) | | | 12,589 | |
| Amounts reclassified from AOCI | | (15) | | | (131) | | | 0 | | | 17 | | | (129) | |
| Deferred income tax benefit (expense) | | 3 | | | 27 | | | 0 | | | (5) | | | 25 | |
| Amounts reclassified from AOCI, net of income tax | | (12) | | | (104) | | | 0 | | | 12 | | | (104) | |
| | | | | | | | | | |
| | | | | | | | | | |
| | | | | | | | | | |
| Sale of subsidiary, net of income tax (2) | | (176) | | | 0 | | | 0 | | | 0 | | | (176) | |
| Balance, end of period | | $ | 17,535 | | | $ | 1,073 | | | $ | (4,463) | | | $ | (1,836) | | | $ | 12,309 | |
|
| | Three Months
Ended
June 30, 2020 |
| | Unrealized
Investment Gains
(Losses), Net of
Related Offsets (1) | | Unrealized
Gains (Losses)
on Derivatives | | Foreign
Currency
Translation
Adjustments | | Defined
Benefit
Plans
Adjustment | | Total |
| | (In millions) |
| Balance, beginning of period | | $ | 15,452 | | | $ | 4,917 | | | $ | (5,627) | | | $ | (1,985) | | | $ | 12,757 | |
| OCI before reclassifications | | 8,505 | | | (639) | | | 243 | | | 0 | | | 8,109 | |
| Deferred income tax benefit (expense) | | (1,902) | | | 142 | | | 2 | | | 0 | | | (1,758) | |
| AOCI before reclassifications, net of income tax | | 22,055 | | | 4,420 | | | (5,382) | | | (1,985) | | | 19,108 | |
| Amounts reclassified from AOCI | | (46) | | | (340) | | | 0 | | | 22 | | | (364) | |
| Deferred income tax benefit (expense) | | (2) | | | 74 | | | 0 | | | (5) | | | 67 | |
| Amounts reclassified from AOCI, net of income tax | | (48) | | | (266) | | | 0 | | | 17 | | | (297) | |
| | | | | | | | | | |
| | | | | | | | | | |
| Sale of subsidiary, net of income tax | | (248) | | | 0 | | | 0 | | | 0 | | | (248) | |
| Balance, end of period | | $ | 21,759 | | | $ | 4,154 | | | $ | (5,382) | | | $ | (1,968) | | | $ | 18,563 | |
| | | | | | | | | | |
|
| | | | | | | | | | | | | | | | | | | | |
| | | Three Months
Ended
September 30, 2017 |
| | | Unrealized Investment Gains (Losses), Net of Related Offsets (1) | | Unrealized Gains (Losses) on Derivatives | | Foreign Currency Translation Adjustments | | Defined Benefit Plans Adjustment | | Total |
| | | (In millions) |
| Balance, beginning of period | | $ | 13,469 |
| | $ | 1,569 |
| | $ | (4,679 | ) | | $ | (1,923 | ) | | $ | 8,436 |
|
| OCI before reclassifications | | 803 |
| | (166 | ) | | 193 |
| | 2 |
| | 832 |
|
| Deferred income tax benefit (expense) | | (270 | ) | | 56 |
| | (6 | ) | | 2 |
| | (218 | ) |
| AOCI before reclassifications, net of income tax | | 14,002 |
| | 1,459 |
| | (4,492 | ) | | (1,919 | ) | | 9,050 |
|
| Amounts reclassified from AOCI | | (360 | ) | | (307 | ) | | — |
| | 40 |
| | (627 | ) |
| Deferred income tax benefit (expense) | | 126 |
| | 107 |
| | — |
| | (17 | ) | | 216 |
|
| Amounts reclassified from AOCI, net of income tax | | (234 | ) | | (200 | ) | | — |
| | 23 |
| | (411 | ) |
| Disposal of subsidiary (2) | | (2,286 | ) | | (305 | ) | | 51 |
| | 28 |
| | (2,512 | ) |
| Deferred income tax benefit (expense) | | 800 |
| | 107 |
| | (19 | ) | | (10 | ) | | 878 |
|
| Disposal of subsidiary, net of income tax | | (1,486 | ) | | (198 | ) | | 32 |
| | 18 |
| | (1,634 | ) |
| Balance, end of period | | $ | 12,282 |
| | $ | 1,061 |
| | $ | (4,460 | ) | | $ | (1,878 | ) | | $ | 7,005 |
|
| |
| | | Three Months
Ended
September 30, 2016 |
| | | Unrealized Investment Gains (Losses), Net of Related Offsets (1) | | Unrealized Gains (Losses) on Derivatives | | Foreign Currency Translation Adjustments | | Defined Benefit Plans Adjustment | | Total |
| | | (In millions) |
| Balance, beginning of period | | $ | 18,204 |
| | $ | 2,431 |
| | $ | (4,020 | ) | | $ | (1,983 | ) | | $ | 14,632 |
|
| OCI before reclassifications | | (1,066 | ) | | (24 | ) | | 49 |
| | (259 | ) | | (1,300 | ) |
| Deferred income tax benefit (expense) | | 281 |
| | 8 |
| | 30 |
| | 85 |
| | 404 |
|
| AOCI before reclassifications, net of income tax | | 17,419 |
| | 2,415 |
| | (3,941 | ) | | (2,157 | ) | | 13,736 |
|
| Amounts reclassified from AOCI | | (173 | ) | | (94 | ) | | — |
| | 46 |
| | (221 | ) |
| Deferred income tax benefit (expense) | | 60 |
| | 30 |
| | — |
| | (10 | ) | | 80 |
|
| Amounts reclassified from AOCI, net of income tax | | (113 | ) | | (64 | ) | | — |
| | 36 |
| | (141 | ) |
| Disposal of subsidiary (2) | | — |
| | — |
| | — |
| | — |
| | — |
|
| Deferred income tax benefit (expense) | | — |
| | — |
| | — |
| | — |
| | — |
|
| Disposal of subsidiary, net of income tax | | — |
| | — |
| | — |
| | — |
| | — |
|
| Balance, end of period | | $ | 17,306 |
| | $ | 2,351 |
| | $ | (3,941 | ) | | $ | (2,121 | ) | | $ | 13,595 |
|
MetLife, Inc.
Notes to the Interim Condensed Consolidated Financial Statements (Unaudited) — (continued)
10. Equity (continued)
| | | | | Nine Months
Ended
September 30, 2017 | | Six Months
Ended
June 30, 2021 |
| | | Unrealized Investment Gains (Losses), Net of Related Offsets (1) | | Unrealized Gains (Losses) on Derivatives | | Foreign Currency Translation Adjustments | | Defined Benefit Plans Adjustment | | Total | | Unrealized
Investment Gains
(Losses), Net of
Related Offsets (1) | | Unrealized
Gains (Losses)
on Derivatives | | Foreign
Currency
Translation
Adjustments | | Defined
Benefit
Plans
Adjustment | | Total |
| | | (In millions) | | (In millions) |
| Balance, beginning of period | | $ | 10,766 |
| | $ | 1,865 |
| | $ | (5,312 | ) | | $ | (1,972 | ) | | $ | 5,347 |
| Balance, beginning of period | | $ | 22,217 | | | $ | 1,513 | | | $ | (3,795) | | | $ | (1,863) | | | $ | 18,072 | |
| OCI before reclassifications | | 4,826 |
| | 37 |
| | 710 |
| | (17 | ) | | 5,556 |
| OCI before reclassifications | | (5,879) | | | (614) | | | (747) | | | 4 | | | (7,236) | |
| Deferred income tax benefit (expense) | | (1,686 | ) | | (14 | ) | | 110 |
| | 7 |
| | (1,583 | ) | Deferred income tax benefit (expense) | | 1,376 | | | 141 | | | (36) | | | (1) | | | 1,480 | |
| AOCI before reclassifications, net of income tax | | 13,906 |
| | 1,888 |
| | (4,492 | ) | | (1,982 | ) | | 9,320 |
| AOCI before reclassifications, net of income tax | | 17,714 | | | 1,040 | | | (4,578) | | | (1,860) | | | 12,316 | |
| Amounts reclassified from AOCI | | (211 | ) | | (965 | ) | | — |
| | 125 |
| | (1,051 | ) | Amounts reclassified from AOCI | | 15 | | | 43 | | | 0 | | | 31 | | | 89 | |
| Deferred income tax benefit (expense) | | 73 |
| | 336 |
| | — |
| | (39 | ) | | 370 |
| Deferred income tax benefit (expense) | | (4) | | | (10) | | | 0 | | | (7) | | | (21) | |
| Amounts reclassified from AOCI, net of income tax | | (138 | ) | | (629 | ) | | — |
| | 86 |
| | (681 | ) | Amounts reclassified from AOCI, net of income tax | | 11 | | | 33 | | | 0 | | | 24 | | | 68 | |
| Disposal of subsidiary (2) | | (2,286 | ) | | (305 | ) | | 51 |
| | 28 |
| | (2,512 | ) | |
| Deferred income tax benefit (expense) | | 800 |
| | 107 |
| | (19 | ) | | (10 | ) | | 878 |
| |
| Disposal of subsidiary, net of income tax | | (1,486 | ) | | (198 | ) | | 32 |
| | 18 |
| | (1,634 | ) | |
| Sale of subsidiaries, net of income tax (2) | | Sale of subsidiaries, net of income tax (2) | | (190) | | | 0 | | | 115 | | | 0 | | | (75) | |
| Balance, end of period | | $ | 12,282 |
| | $ | 1,061 |
| | $ | (4,460 | ) | | $ | (1,878 | ) | | $ | 7,005 |
| Balance, end of period | | $ | 17,535 | | | $ | 1,073 | | | $ | (4,463) | | | $ | (1,836) | | | $ | 12,309 | |
| | | | | | | | | | | | | | | | | | | | | |
| | | Nine Months
Ended
September 30, 2016 | | Six Months
Ended
June 30, 2020 |
| | | Unrealized Investment Gains (Losses), Net of Related Offsets (1) | | Unrealized Gains (Losses) on Derivatives | | Foreign Currency Translation Adjustments | | Defined Benefit Plans Adjustment | | Total | | Unrealized
Investment Gains
(Losses), Net of
Related Offsets (1) | | Unrealized
Gains (Losses)
on Derivatives | | Foreign
Currency
Translation
Adjustments | | Defined
Benefit
Plans
Adjustment | | Total |
| | | (In millions) | | (In millions) |
| Balance, beginning of period | | $ | 10,315 |
| | $ | 1,458 |
| | $ | (4,950 | ) | | $ | (2,052 | ) | | $ | 4,771 |
| Balance, beginning of period | | $ | 18,283 | | | $ | 1,698 | | | $ | (4,927) | | | $ | (2,002) | | | $ | 13,052 | |
| OCI before reclassifications | | 10,872 |
| | 1,472 |
| | 809 |
| | (248 | ) | | 12,905 |
| OCI before reclassifications | | 4,886 | | | 3,048 | | | (431) | | | 0 | | | 7,503 | |
| Deferred income tax benefit (expense) | | (3,656 | ) | | (460 | ) | | 200 |
| | 81 |
| | (3,835 | ) | Deferred income tax benefit (expense) | | (975) | | | (668) | | | (24) | | | 0 | | | (1,667) | |
| AOCI before reclassifications, net of income tax | | 17,531 |
| | 2,470 |
| | (3,941 | ) | | (2,219 | ) | | 13,841 |
| AOCI before reclassifications, net of income tax | | 22,194 | | | 4,078 | | | (5,382) | | | (2,002) | | | 18,888 | |
| Amounts reclassified from AOCI | | (339 | ) | | (174 | ) | | — |
| | 145 |
| | (368 | ) | Amounts reclassified from AOCI | | (233) | | | 98 | | | 0 | | | 43 | | | (92) | |
| Deferred income tax benefit (expense) | | 114 |
| | 55 |
| | — |
| | (47 | ) | | 122 |
| Deferred income tax benefit (expense) | | 46 | | | (22) | | | 0 | | | (9) | | | 15 | |
| Amounts reclassified from AOCI, net of income tax | | (225 | ) | | (119 | ) | | — |
| | 98 |
| | (246 | ) | Amounts reclassified from AOCI, net of income tax | | (187) | | | 76 | | | 0 | | | 34 | | | (77) | |
| Disposal of subsidiary (2) | | — |
| | — |
| | — |
| | — |
| | — |
| |
| Deferred income tax benefit (expense) | | — |
| | — |
| | — |
| | — |
| | — |
| |
| Disposal of subsidiary, net of income tax | | — |
| | — |
| | — |
| | — |
| | — |
| |
| Sale of subsidiary, net of income tax | | Sale of subsidiary, net of income tax | | (248) | | | 0 | | | 0 | | | 0 | | | (248) | |
| Balance, end of period | | $ | 17,306 |
| | $ | 2,351 |
| | $ | (3,941 | ) | | $ | (2,121 | ) | | $ | 13,595 |
| Balance, end of period | | $ | 21,759 | | | $ | 4,154 | | | $ | (5,382) | | | $ | (1,968) | | | $ | 18,563 | |
__________________
| |
(1) | See Note 6 for information on offsets to investments related to future policy benefits, DAC, VOBA and DSI, and the policyholder dividend obligation. |
(1)See Note 6 for information on offsets to investments related to policyholder liabilities, DAC, VOBA and DSI.
(2)See Note 3 for information on the Company’s business dispositions.
MetLife, Inc.
Notes to the Interim Condensed Consolidated Financial Statements (Unaudited) — (continued)
10. Equity (continued)
Information regarding amounts reclassified out of each component of AOCI was as follows:
| | | | Three Months
Ended
June 30, | | Six Months
Ended
June 30, | |
| | | | | | | | | | | | 2021 | | 2020 | | 2021 | | 2020 | |
| AOCI Components | | Amounts Reclassified from AOCI | | Consolidated Statements of Operations and Comprehensive Income (Loss) Locations | AOCI Components | | Amounts Reclassified from AOCI | | Consolidated Statements of
Operations and
Comprehensive Income (Loss)
Locations |
| | | Three Months
Ended
September 30, | | Nine Months
Ended
September 30, | | | | | (In millions) | | |
| | | 2017 | | 2016 | | 2017 | | 2016 | | |
| | | (In millions) | | |
| Net unrealized investment gains (losses): | | | | | | | | | | Net unrealized investment gains (losses): | |
| Net unrealized investment gains (losses) | | $ | 303 |
| | $ | 113 |
| | $ | 386 |
| | $ | 317 |
| | Net investment gains (losses) | |
| Net unrealized investment gains (losses) | | (1 | ) | | 4 |
| | — |
| | 23 |
| | Net investment income | Net unrealized investment gains (losses) | | $ | (6) | | | $ | 51 | | | $ | (55) | | | $ | 255 | | | Net investment gains (losses) |
| Net unrealized investment gains (losses) | | 55 |
| | (1 | ) | | (89 | ) | | 21 |
| | Net derivative gains (losses) | Net unrealized investment gains (losses) | | (4) | | | 1 | | | (9) | | | (10) | | | Net investment income |
| Net unrealized investment gains (losses) | | 3 |
| | 57 |
| | (86 | ) | | (22 | ) | | Discontinued operations | Net unrealized investment gains (losses) | | 25 | | | (6) | | | 49 | | | (12) | | | Net derivative gains (losses) |
| Net unrealized investment gains (losses), before income tax | | 360 |
| | 173 |
| | 211 |
| | 339 |
| | Net unrealized investment gains (losses), before income tax | | 15 | | | 46 | | | (15) | | | 233 | | |
| Income tax (expense) benefit | | (126 | ) | | (60 | ) | | (73 | ) | | (114 | ) | | Income tax (expense) benefit | | (3) | | | 2 | | | 4 | | | (46) | | |
| Net unrealized investment gains (losses), net of income tax | | 234 |
| | 113 |
| | 138 |
| | 225 |
| | Net unrealized investment gains (losses), net of income tax | | 12 | | | 48 | | | (11) | | | 187 | | |
| Unrealized gains (losses) on derivatives - cash flow hedges: | | | | | | | | | | Unrealized gains (losses) on derivatives - cash flow hedges: | | | | | | | | | |
| Interest rate swaps | | 9 |
| | 28 |
| | 23 |
| | 44 |
| | Net derivative gains (losses) | |
| Interest rate swaps | | 5 |
| | 3 |
| | 12 |
| | 9 |
| | Net investment income | |
| Interest rate swaps | | — |
| | 1 |
| | 2 |
| | 14 |
| | Discontinued operations | |
| Interest rate forwards | | (1 | ) | | — |
| | (5 | ) | | — |
| | Net derivative gains (losses) | |
| Interest rate forwards | | — |
| | — |
| | 2 |
| | 2 |
| | Net investment income | |
| Interest rate forwards | | — |
| | — |
| | 1 |
| | 1 |
| | Other expenses | |
| Interest rate forwards | | — |
| | 2 |
| | 3 |
| | 4 |
| | Discontinued operations | |
| Foreign currency swaps | | 294 |
| | 54 |
| | 915 |
| | 90 |
| | Net derivative gains (losses) | |
| Foreign currency swaps | | — |
| | — |
| | (1 | ) | | (1 | ) | | Net investment income | |
| Foreign currency swaps | | — |
| | — |
| | 1 |
| | 1 |
| | Other expenses | |
| Foreign currency swaps | | — |
| | 5 |
| | 11 |
| | 6 |
| | Discontinued operations | |
| Credit forwards | | — |
| | — |
| | 1 |
| | 3 |
| | Net derivative gains (losses) | |
| Credit forwards | | — |
| | 1 |
| | — |
| | 1 |
| | Net investment income | |
| Interest rate derivatives | | Interest rate derivatives | | 15 | | | 9 | | | 27 | | | 15 | | | Net investment income |
| Interest rate derivatives | | Interest rate derivatives | | 19 | | | 42 | | | 48 | | | 48 | | | Net investment gains (losses) |
| Interest rate derivatives | | Interest rate derivatives | | 0 | | | 0 | | | 1 | | | 1 | | | Other expenses |
| Foreign currency exchange rate derivatives | | Foreign currency exchange rate derivatives | | 1 | | | 1 | | | 4 | | | 1 | | | Net investment income |
| Foreign currency exchange rate derivatives | | Foreign currency exchange rate derivatives | | 95 | | | 287 | | | (124) | | | (164) | | | Net investment gains (losses) |
| Foreign currency exchange rate derivatives | | Foreign currency exchange rate derivatives | | 1 | | | 1 | | | 1 | | | 1 | | | Other expenses |
| | Gains (losses) on cash flow hedges, before income tax | | 307 |
| | 94 |
| | 965 |
| | 174 |
| | Gains (losses) on cash flow hedges, before income tax | | 131 | | | 340 | | | (43) | | | (98) | | |
| Income tax (expense) benefit | | (107 | ) | | (30 | ) | | (336 | ) | | (55 | ) | | Income tax (expense) benefit | | (27) | | | (74) | | | 10 | | | 22 | | |
| Gains (losses) on cash flow hedges, net of income tax | | 200 |
| | 64 |
| | 629 |
| | 119 |
| | Gains (losses) on cash flow hedges, net of income tax | | 104 | | | 266 | | | (33) | | | (76) | | |
| Defined benefit plans adjustment: (1) | | | | | | | | | | Defined benefit plans adjustment: (1) | | | | | | | | | |
| Amortization of net actuarial gains (losses) | | (46 | ) | | (47 | ) | | (143 | ) | | (150 | ) | | Amortization of net actuarial gains (losses) | | (35) | | | (26) | | | (53) | | | (52) | | |
| Amortization of prior service (costs) credit | | 6 |
| | 1 |
| | 18 |
| | 5 |
| | Amortization of prior service (costs) credit | | 18 | | | 4 | | | 22 | | | 9 | | |
| Amortization of defined benefit plan items, before income tax | | (40 | ) | | (46 | ) | | (125 | ) | | (145 | ) | | Amortization of defined benefit plan items, before income tax | | (17) | | | (22) | | | (31) | | | (43) | | |
| Income tax (expense) benefit | | 17 |
| | 10 |
| | 39 |
| | 47 |
| | Income tax (expense) benefit | | 5 | | | 5 | | | 7 | | | 9 | | |
| Amortization of defined benefit plan items, net of income tax | | (23 | ) | | (36 | ) | | (86 | ) | | (98 | ) | | Amortization of defined benefit plan items, net of income tax | | (12) | | | (17) | | | (24) | | | (34) | | |
| Total reclassifications, net of income tax | | $ | 411 |
| | $ | 141 |
| | $ | 681 |
| | $ | 246 |
| | Total reclassifications, net of income tax | | $ | 104 | | | $ | 297 | | | $ | (68) | | | $ | 77 | | |
__________________
| |
(1) | These AOCI components are included in the computation of net periodic benefit costs. See Note 12. |
(1)These AOCI components are included in the computation of net periodic benefit costs. See Note 12.
MetLife, Inc.
Notes to the Interim Condensed Consolidated Financial Statements (Unaudited) — (continued)
11. Other Revenues and Other Expenses
Other Revenues
Information on other revenues, which primarily includes fees related to service contracts from customers, was as follows:
| | | | | | | | | | | | | | | | | | | | | | | | | | |
| | Three Months
Ended
June 30, | | Six Months
Ended
June 30, |
| | 2021 | | 2020 | | 2021 | | 2020 |
| | (In millions) |
| Vision fee for service arrangements (1) | | $ | 135 | | | $ | 0 | | | $ | 275 | | | $ | 0 | |
| Prepaid legal plans | | 108 | | | 99 | | | 217 | | | 200 | |
| Fee-based investment management | | 86 | | | 71 | | | 171 | | | 150 | |
| Recordkeeping and administrative services (2) | | 53 | | | 46 | | | 106 | | | 95 | |
| Administrative services-only contracts | | 58 | | | 54 | | | 119 | | | 110 | |
| Other revenue from service contracts from customers | | 74 | | | 54 | | | 141 | | | 114 | |
| Total revenues from service contracts from customers | | 514 | | | 324 | | | 1,029 | | | 669 | |
| Other | | 150 | | | 132 | | | 266 | | | 226 | |
| Total other revenues | | $ | 664 | | | $ | 456 | | | $ | 1,295 | | | $ | 895 | |
__________________
(1)For information regarding the Company’s acquisition of Versant Health, Inc., see Note 3 of the Notes to the Consolidated Financial Statements included in the 2020 Annual Report.
(2)Related to products and businesses no longer actively marketed by the Company.
Other Expenses
Information on other expenses was as follows:
| | | | | | | | | | | | | | | | | | | | | | | | | | |
| | Three Months
Ended
June 30, | | Six Months
Ended
June 30, |
| | 2021 | | 2020 | | 2021 | | 2020 |
| | (In millions) |
| Employee-related costs (1) | | $ | 808 | | | $ | 842 | | | $ | 1,782 | | | $ | 1,711 | |
| Third party staffing costs | | 336 | | | 311 | | | 648 | | | 659 | |
| General and administrative expenses | | 135 | | | 191 | | | 243 | | | 381 | |
| Pension, postretirement and postemployment benefit costs | | 26 | | | 37 | | | 51 | | | 76 | |
| Premium taxes, other taxes, and licenses & fees | | 169 | | | 176 | | | 336 | | | 369 | |
| Commissions and other variable expenses | | 1,294 | | | 1,315 | | | 2,824 | | | 2,723 | |
| Capitalization of DAC | | (642) | | | (671) | | | (1,417) | | | (1,445) | |
| Amortization of DAC and VOBA | | 537 | | | 560 | | | 1,127 | | | 1,348 | |
| Amortization of negative VOBA | | (10) | | | (10) | | | (19) | | | (20) | |
| Interest expense on debt | | 228 | | | 232 | | | 456 | | | 454 | |
| Total other expenses | | $ | 2,881 | | | $ | 2,983 | | | $ | 6,031 | | | $ | 6,256 | |
__________________
(1)Includes ($58) million and ($74) million for the three months and six months ended June 30, 2021, respectively, and ($80) million and ($40) million for the three months and six months ended June 30, 2020, respectively, for the net change in cash surrender value of investments in certain life insurance policies, net of premiums paid.
|
| | | | | | | | | | | | | | | |
| | Three Months
Ended
September 30, | | Nine Months
Ended
September 30, |
| | 2017 | | 2016 | | 2017 | | 2016 |
| | (In millions) |
| Compensation | $ | 1,107 |
| | $ | 1,100 |
| | $ | 3,302 |
| | $ | 3,602 |
|
| Pension, postretirement and postemployment benefit costs | 86 |
| | 78 |
| | 242 |
| | 308 |
|
| Commissions | 888 |
| | 859 |
| | 2,544 |
| | 2,700 |
|
| Volume-related costs | 113 |
| | 91 |
| | 285 |
| | 384 |
|
| Capitalization of DAC | (761 | ) | | (770 | ) | | (2,218 | ) | | (2,422 | ) |
| Amortization of DAC and VOBA | 626 |
| | 660 |
| | 1,945 |
| | 2,052 |
|
| Amortization of negative VOBA | (32 | ) | | (55 | ) | | (113 | ) | | (221 | ) |
| Interest expense on debt | 284 |
| | 280 |
| | 851 |
| | 875 |
|
| Premium taxes, licenses and fees | 145 |
| | 174 |
| | 467 |
| | 544 |
|
| Professional services | 389 |
| | 372 |
| | 1,119 |
| | 1,099 |
|
| Rent and related expenses, net of sublease income | 121 |
| | 91 |
| | 265 |
| | 285 |
|
| Other | 352 |
| | 336 |
| | 1,215 |
| | 1,090 |
|
| Total other expenses | $ | 3,318 |
| | $ | 3,216 |
| | $ | 9,904 |
| | $ | 10,296 |
|
See Note 3 for further information on Separation-related transaction costs.
Restructuring Charges
The Company commenced in 2016 a unit cost improvement program related to the Company’s refreshed enterprise strategy. This global strategy focuses on transforming the Company to become more digital, driving efficiencies and innovation to achieve competitive advantage, and simplified, decreasing the costs and risks associated with the Company’s highly complex industry to customers and shareholders. Restructuring charges related to this program are included in other expenses. As the expenses relate to an enterprise-wide initiative, they are reported in Corporate & Other. Such restructuring charges were as follows:
|
| | | | | | | |
| | Three Months
Ended
September 30, 2017 | | Nine Months
Ended
September 30, 2017 |
| | Severance |
| | (In millions) |
| Balance, beginning of period | $ | 17 |
| | $ | 35 |
|
| Restructuring charges | 3 |
| | 25 |
|
| Cash payments | (3 | ) | | (43 | ) |
| Balance, end of period | $ | 17 |
| | $ | 17 |
|
| Total restructuring charges incurred since inception of initiative | $ | 60 |
| | $ | 60 |
|
Management anticipates further restructuring charges through the year ending December 31, 2019. However, such restructuring plans were not sufficiently developed to enable management to make an estimate of such restructuring charges at September 30, 2017.
MetLife, Inc.
Notes to the Interim Condensed Consolidated Financial Statements (Unaudited) — (continued)
12. Employee Benefit Plans
Pension and Other Postretirement Benefit Plans
Certain subsidiaries of MetLife, Inc. sponsor and/or administera U.S. qualified and various U.S. qualified and non-U.S. nonqualified defined benefit pension plans and other postretirement employee benefit plans covering employees and sales representatives who meet specified eligibility requirements. These subsidiaries also provide certain postemployment benefits and certain postretirement medical and life insurance benefits for U.S. and non-U.S. retired employees.
The components of net periodic benefit costs, reported in other expenses, were as follows:
| | | | | Three Months
Ended
September 30, | | Three Months
Ended
June 30, |
| | | 2017 | | 2016 | | 2021 | | 2020 |
| | | Pension Benefits | | Other Postretirement Benefits | | Pension Benefits | | Other Postretirement Benefits | | Pension
Benefits | | Other
Postretirement
Benefits | | Pension
Benefits | | Other
Postretirement
Benefits |
| | | (In millions) | | (In millions) |
| Service costs | | $ | 62 |
| | $ | 1 |
| | $ | 67 |
| | $ | 4 |
| Service costs | | $ | 56 | | | $ | 1 | | | $ | 61 | | | $ | 1 | |
| Interest costs | | 106 |
| | 19 |
| | 101 |
| | 20 |
| Interest costs | | 83 | | | 10 | | | 89 | | | 11 | |
| Divestitures and curtailment costs (1) | | 3 |
| | 2 |
| | (1 | ) | | (1 | ) | |
| Curtailment (gains) losses (1) | | Curtailment (gains) losses (1) | | (17) | | | 0 | | | 0 | | | 0 | |
| Expected return on plan assets | | (129 | ) | | (18 | ) | | (138 | ) | | (19 | ) | Expected return on plan assets | | (125) | | | (14) | | | (132) | | | (16) | |
| Amortization of net actuarial (gains) losses | | 46 |
| | — |
| | 45 |
| | 2 |
| Amortization of net actuarial (gains) losses | | 39 | | | (7) | | | 44 | | | (18) | |
| Amortization of prior service costs (credit) | | — |
| | (6 | ) | | — |
| | (1 | ) | Amortization of prior service costs (credit) | | (1) | | | 0 | | | (4) | | | 0 | |
| Net periodic benefit costs (credit) | | $ | 88 |
| | $ | (2 | ) | | $ | 74 |
| | $ | 5 |
| Net periodic benefit costs (credit) | | $ | 35 | | | $ | (10) | | | $ | 58 | | | $ | (22) | |
| | | | | | | | | | | | | | | | | |
| | | Nine Months
Ended
September 30, | | Six Months
Ended
June 30, |
| | | 2017 | | 2016 | | 2021 | | 2020 |
| | | Pension Benefits | | Other Postretirement Benefits | | Pension Benefits | | Other Postretirement Benefits | | Pension
Benefits | | Other
Postretirement
Benefits | | Pension
Benefits | | Other
Postretirement
Benefits |
| | | (In millions) | | (In millions) |
| Service costs | | $ | 184 |
| | $ | 4 |
| | $ | 212 |
| | $ | 8 |
| Service costs | | $ | 119 | | | $ | 2 | | | $ | 123 | | | $ | 2 | |
| Interest costs | | 318 |
| | 57 |
| | 316 |
| | 62 |
| Interest costs | | 161 | | | 18 | | | 178 | | | 21 | |
| Divestitures and curtailment costs (1) | | 3 |
| | 2 |
| | (1 | ) | | 15 |
| |
| Curtailment (gains) losses (1) | | Curtailment (gains) losses (1) | | (17) | | | 0 | | | 0 | | | 0 | |
| Expected return on plan assets | | (387 | ) | | (54 | ) | | (388 | ) | | (56 | ) | Expected return on plan assets | | (257) | | | (28) | | | (264) | | | (31) | |
| Amortization of net actuarial (gains) losses | | 143 |
| | — |
| | 143 |
| | 7 |
| Amortization of net actuarial (gains) losses | | 77 | | | (27) | | | 89 | | | (37) | |
| Amortization of prior service costs (credit) | | (1 | ) | | (17 | ) | | — |
| | (5 | ) | Amortization of prior service costs (credit) | | (5) | | | 0 | | | (8) | | | (1) | |
| Net periodic benefit costs (credit) | | $ | 260 |
| | $ | (8 | ) | | $ | 282 |
| | $ | 31 |
| Net periodic benefit costs (credit) | | $ | 78 | | | $ | (35) | | | $ | 118 | | | $ | (46) | |
__________________
| |
(1) | For the nine months ended September 30, 2016, the Company recognized curtailment charges on certain postretirement benefit plans in connection with the sale to MassMutual. See Note 3 of the Notes to the Consolidated Financial Statements included in the 2016 Annual Report. |
(1)See Note 3 for information on the Company’s business dispositions.
13. Income Tax
For the three months and six months ended June 30, 2021, the effective tax rate on income (loss) before provision for income tax was 24% and 21%, respectively. The Company’s effective tax rate for the three months ended June 30, 2021 differed from the U.S. statutory rate primarily due to tax charges from foreign earnings taxed at different rates than the U.S. statutory rate, the completed sale of MetLife P&C and the pending disposition of MetLife Poland and Greece, partially offset by tax benefits related to tax credits and non-taxable investment income. The Company’s effective tax rate for the six months ended June 30, 2021 was equal to the statutory rate of 21%, primarily due to tax charges from foreign earnings taxed at different rates than the U.S. statutory rate, the completed sale of MetLife P&C and the pending disposition of MetLife Poland
MetLife, Inc.
Notes to the Interim Condensed Consolidated Financial Statements (Unaudited) — (continued)
13. Income Tax (continued)
The Company has not provided U.S. deferred taxes on the cumulative earnings of certain non-U.S. affiliates that have been reinvested indefinitely. These earnings relate to ongoing operations and have been reinvested in active non-U.S. business operations. In the third quarter of 2017, the Company recorded a $444 millionGreece, offset by tax chargebenefits related to tax credits, non-taxable investment income and the future repatriation of approximately $3.0 billion of pre-2017corporate tax deduction for stock compensation.
For the three months and six months ended June 30, 2020, the effective tax rate on income (loss) before provision for income tax was 24% and 22%, respectively. The Company’s effective tax rate for the three months ended June 30, 2020 differed from the U.S. statutory rate primarily due to tax charges from foreign earnings followingtaxed at different rates than the post-Separation review of its capital needs. The Company will continue to assert that earnings of these non-U.S. operations will be reinvested indefinitely for amounts earned in 2017 and subsequent years, as the Company expects to continue to invest in such operations. This charge wasU.S. statutory rate, partially offset by tax benefits related to non-taxable investment income and tax credits. The Company’s effective tax rate for the six months ended June 30, 2020 differed from the U.S. statutory rate primarily due to tax charges from foreign earnings taxed at different rates than the U.S. statutory rate, partially offset by tax benefits related to non-taxable investment income, tax credits and the finalization of bankruptcy proceedings for a $264 million tax benefit associated with dividends from other non-U.S. operations. As a result, the Company recognized a $180 million net deferred tax liability.leveraged lease investment.
14. Earnings Per Common Share
The following table presents the weighted average shares, basic earnings per common share and diluted earnings per common share for each income category presented:share:
| | | | | | | | | | | | | | | | | | | | | | | | | | |
| | Three Months
Ended
June 30, | | Six Months
Ended
June 30, |
| | 2021 | | 2020 | | 2021 | | 2020 |
| | (In millions, except per share data) |
| Weighted Average Shares: | | | | | | | | |
| Weighted average common stock outstanding - basic | | 873.3 | | | 908.8 | | | 879.3 | | | 911.5 | |
| Incremental common shares from assumed exercise or issuance of stock-based awards | | 6.4 | | | 4.3 | | | 6.5 | | | 5.0 | |
| Weighted average common stock outstanding - diluted | | 879.7 | | | 913.1 | | | 885.8 | | | 916.5 | |
| Net Income (Loss): | | | | | | | | |
| Net income (loss) | | $ | 3,412 | | | $ | 150 | | | $ | 3,775 | | | $ | 4,551 | |
| Less: Net income (loss) attributable to noncontrolling interests | | 5 | | | 5 | | | 10 | | | 8 | |
| Less: Preferred stock dividends | | 35 | | | 77 | | | 103 | | | 109 | |
| Preferred stock redemption premium | | 6 | | | 0 | | | 6 | | | 0 | |
| Net income (loss) available to MetLife, Inc.’s common shareholders | | $ | 3,366 | | | $ | 68 | | | $ | 3,656 | | | $ | 4,434 | |
| Basic | | $ | 3.85 | | | $ | 0.07 | | | $ | 4.16 | | | $ | 4.86 | |
| Diluted | | $ | 3.83 | | | $ | 0.07 | | | $ | 4.13 | | | $ | 4.84 | |
|
| | | | | | | | | | | | | | | | |
| | | Three Months
Ended
September 30, | | Nine Months
Ended
September 30, |
| | | 2017 | | 2016 | | 2017 | | 2016 |
| | | (In millions, except per share data) |
| Weighted Average Shares: | | | | | | | | |
| Weighted average common stock outstanding for basic earnings per common share | | 1,062.3 |
| | 1,100.5 |
| | 1,075.5 |
| | 1,100.6 |
|
| Incremental common shares from assumed exercise or issuance of stock-based awards | | 9.2 |
| | 8.8 |
| | 8.5 |
| | 8.4 |
|
| Weighted average common stock outstanding for diluted earnings per common share | | 1,071.5 |
| | 1,109.3 |
| | 1,084.0 |
| | 1,109.0 |
|
| Income (Loss) from Continuing Operations: | | | | | | | | |
| Income (loss) from continuing operations, net of income tax | | $ | 893 |
| | $ | 1,024 |
| | $ | 2,630 |
| | $ | 4,269 |
|
| Less: Income (loss) from continuing operations, net of income tax, attributable to noncontrolling interests | | 6 |
| | (4 | ) | | 12 |
| | 2 |
|
| Less: Preferred stock dividends | | 6 |
| | 6 |
| | 58 |
| | 58 |
|
| Income (loss) from continuing operations, net of income tax, available to MetLife, Inc.’s common shareholders | | $ | 881 |
| | $ | 1,022 |
| | $ | 2,560 |
| | $ | 4,209 |
|
| Basic | | $ | 0.83 |
| | $ | 0.93 |
| | $ | 2.38 |
| | $ | 3.82 |
|
| Diluted | | $ | 0.82 |
| | $ | 0.92 |
| | $ | 2.36 |
| | $ | 3.80 |
|
| Income (Loss) from Discontinued Operations: | | | | | | | | |
| Income (loss) from discontinued operations, net of income tax | | $ | (968 | ) | | $ | (451 | ) | | $ | (989 | ) | | $ | (1,379 | ) |
| Less: Income (loss) from discontinued operations, net of income tax, attributable to noncontrolling interests | | — |
| | — |
| | — |
| | — |
|
| Income (loss) from discontinued operations, net of income tax, available to MetLife, Inc.’s common shareholders | | $ | (968 | ) | | $ | (451 | ) | | $ | (989 | ) | | $ | (1,379 | ) |
| Basic | | $ | (0.91 | ) | | $ | (0.41 | ) | | $ | (0.92 | ) | | $ | (1.25 | ) |
| Diluted | | $ | (0.90 | ) | | $ | (0.41 | ) | | $ | (0.91 | ) | | $ | (1.25 | ) |
| Net Income (Loss): | | | | | | | | |
| Net income (loss) | | $ | (75 | ) | | $ | 573 |
| | $ | 1,641 |
| | $ | 2,890 |
|
| Less: Net income (loss) attributable to noncontrolling interests | | 6 |
| | (4 | ) | | 12 |
| | 2 |
|
| Less: Preferred stock dividends | | 6 |
| | 6 |
| | 58 |
| | 58 |
|
| Net income (loss) available to MetLife, Inc.’s common shareholders | | $ | (87 | ) | | $ | 571 |
| | $ | 1,571 |
| | $ | 2,830 |
|
| Basic | | $ | (0.08 | ) | | $ | 0.52 |
| | $ | 1.46 |
| | $ | 2.57 |
|
| Diluted | | $ | (0.08 | ) | | $ | 0.51 |
| | $ | 1.45 |
| | $ | 2.55 |
|
MetLife, Inc.
Notes to the Interim Condensed Consolidated Financial Statements (Unaudited) — (continued)
15. Contingencies, Commitments and Guarantees
Contingencies
Litigation
The Company is a defendant in a large number of litigation matters. Putative or certified class action litigation and other litigation and claims and assessments against the Company, in addition to those discussed below and those otherwise provided for in the Company’s interim condensed consolidated financial statements, have arisen in the course of the Company’s business, including, but not limited to, in connection with its activities as an insurer, mortgage lending bank, employer, investor, investment advisor, broker-dealer, and taxpayer.
The Company also receives and responds to subpoenas or other inquiries seeking a broad range of information from state regulators, including state insurance commissioners; state attorneys general or other state governmental authorities; federal regulators, including the U.S. Securities and Exchange Commission; federal governmental authorities, including congressional committees; and the Financial Industry Regulatory Authority, as well as from local and national regulators and government authorities in jurisdictions outside the United States where the Company conducts business. The issues involved in information requests and regulatory matters vary widely, but can include inquiries or investigations concerning the Company’s compliance with applicable insurance and other laws and regulations. The Company cooperates in these inquiries.
MetLife, Inc.
Notes to the Interim Condensed Consolidated Financial Statements (Unaudited) — (continued)
15. Contingencies, Commitments and Guarantees (continued)
In some of the matters, very large and/or indeterminate amounts, including punitive and treble damages, are sought. Modern pleading practice in the U.S.United States permits considerable variation in the assertion of monetary damages or other relief. Jurisdictions may permit claimants not to specify the monetary damages sought or may permit claimants to state only that the amount sought is sufficient to invoke the jurisdiction of the trial court. In addition, jurisdictions may permit plaintiffs to allege monetary damages in amounts well exceeding reasonably possible verdicts in the jurisdiction for similar matters. This variability in pleadings, together with the Company’s actual experience of the Company in litigating or resolving through settlement numerous claims over an extended period of time, demonstrates to management that the monetary relief which may be specified in a lawsuit or claim bears little relevance to its merits or disposition value.
DueIt is not possible to predict the vagaries of litigation, theultimate outcome of a litigation matterall pending investigations and the amount or range of potential loss at particular points in time may normally be difficult to ascertain. Uncertainties can include how fact finders will evaluate documentary evidence and the credibility and effectiveness of witness testimony, and how trial and appellate courts will apply the law in the context of the pleadings or evidence presented, whether by motion practice, at trial or on appeal. Disposition valuations are also subject to the uncertainty of how opposing parties and their counsel will view the relevant evidence and applicable law.
legal proceedings. The Company establishes liabilities for litigation and regulatory loss contingencies when it is probable that a loss has been incurred and the amount of the loss can be reasonably estimated. Liabilities have been established for a number of the matters noted below. In certain circumstances where liabilities have been established there may be coverage under one or more corporate insurance policies, pursuant to which there may be an insurance recovery. Insurance recoveries are recognized as gains when any contingencies relating to the insurance claim have been resolved, which is the earlier of when the gains are realized or realizable. It is possible that some of the matters could require the Company to pay damages or make other expenditures or establish accruals in amounts that could not be reasonably estimated at SeptemberJune 30, 2017.2021. While the potential future charges could be material in the particular quarterly or annual periods in which they are recorded, based on information currently known to management, management does not believe any such charges are likely to have a material effect on the Company’s financial position. Given the large and/or indeterminate amounts sought in certain of these matters and the inherent unpredictability of litigation, it is possible that an adverse outcome in certain matters could, from time to time, have a material effect on the Company’s consolidated net income or cash flows in particular quarterly or annual periods.
Matters as to Which an Estimate Can Be Made
For some of the matters disclosed below, the Company is able to estimate a reasonably possible range of loss. For such matters where a loss is believed to be reasonably possible, but not probable, the Company has not made an accrual. As of SeptemberJune 30, 2017,2021, the Company estimates the aggregate range of reasonably possible losses in excess of amounts accrued for these matters to be $0 to $450$175 million.
Matters as to Which an Estimate Cannot Be Made
For other matters disclosed below, the Company is not currently able to estimate the reasonably possible loss or range of loss. The Company is often unable to estimate the possible loss or range of loss until developments in such matters have provided sufficient information to support an assessment of the range of possible loss, such as quantification of a damage demand from plaintiffs, discovery from other parties and investigation of factual allegations, rulings by the court on motions or appeals, analysis by experts, and the progress of settlement negotiations. On a quarterly and annual basis, the Company reviews relevant information with respect to litigation contingencies and updates its accruals, disclosures and estimates of reasonably possible losses or ranges of loss based on such reviews.
MetLife, Inc.
Notes to the Interim Condensed Consolidated Financial Statements (Unaudited) — (continued)
15. Contingencies, Commitments and Guarantees (continued)
Asbestos-Related Claims
MLIC is and has been a defendant in a large number of asbestos-related suits filed primarily in state courts. These suits principally allege that the plaintiff or plaintiffs suffered personal injury resulting from exposure to asbestos and seek both actual and punitive damages. MLIC has never engaged in the business of manufacturing, producing, distributing or selling asbestos or asbestos-containing products nor has MLIC issued liability or workers’ compensation insurance to companies in the business of manufacturing, producing, distributing or selling asbestos or asbestos-containing products. The lawsuits principally have focused on allegations with respect to certain research, publication and other activities of one or more of MLIC’s employees during the period from the 1920’s through approximately the 1950’s and allege that MLIC learned or should have learned of certain health risks posed by asbestos and, among other things, improperly publicized or failed to disclose those health risks. MLIC believes that it should not have legal liability in these cases. The outcome of most asbestos litigation matters, however, is uncertain and can be impacted by numerous variables, including differences in legal rulings in various jurisdictions, the nature of the alleged injury and factors unrelated to the ultimate legal merit of the claims asserted against MLIC. MLIC employs a number of resolution strategies to manage its asbestos loss exposure, including seeking resolution of pending litigation by judicial rulings and settling individual or groups of claims or lawsuits under appropriate circumstances.
MetLife, Inc.
Notes to the Interim Condensed Consolidated Financial Statements (Unaudited) — (continued)
15. Contingencies, Commitments and Guarantees (continued)
Claims asserted against MLIC have included negligence, intentional tort and conspiracy concerning the health risks associated with asbestos. MLIC’s defenses (beyond denial of certain factual allegations) include that: (i) MLIC owed no duty to the plaintiffs— it had no special relationship with the plaintiffs and did not manufacture, produce, distribute or sell the asbestos products that allegedly injured plaintiffs;plaintiffs, (ii) plaintiffs did not rely on any actions of MLIC;MLIC, (iii) MLIC’s conduct was not the cause of the plaintiffs’ injuries;injuries, (iv) plaintiffs’ exposure occurred after the dangers of asbestos were known;known, and (v) the applicable time with respect to filing suit has expired. During the course of the litigation, certain trial courts have granted motions dismissing claims against MLIC, while other trial courts have denied MLIC’s motions. There can be no assurance that MLIC will receive favorable decisions on motions in the future. While most cases brought to date have settled, MLIC intends to continue to defend aggressively against claims based on asbestos exposure, including defending claims at trials.
As reported in the 20162020 Annual Report, MLIC received approximately 4,1462,496 asbestos-related claims in 2016. During2020. For the ninesix months ended SeptemberJune 30, 20172021 and 2016,2020, MLIC received approximately 2,7421,304 and 3,2671,121 new asbestos-related claims, respectively. See Note 21 of the Notes to the Consolidated Financial Statements included in the 20162020 Annual Report for historical information concerning asbestos claims and MLIC’s increaseupdate in its recorded liability at December 31, 2014.2020. The number of asbestos cases that may be brought, the aggregate amount of any liability that MLIC may incur, and the total amount paid in settlements in any given year are uncertain and may vary significantly from year to year.
The ability of MLIC to estimate its ultimate asbestos exposure is subject to considerable uncertainty, and the conditions impacting its liability can be dynamic and subject to change. The availability of reliable data is limited and it is difficult to predict the numerous variables that can affect liability estimates, including the number of future claims, the cost to resolve claims, the disease mix and severity of disease in pending and future claims, the impact of the number of new claims filed in a particular jurisdiction and variations in the law in the jurisdictions in which claims are filed, the possible impact of tort reform efforts, the willingness of courts to allow plaintiffs to pursue claims against MLIC when exposure to asbestos took place after the dangers of asbestos exposure were well known, and the impact of any possible future adverse verdicts and their amounts.
The ability to make estimates regarding ultimate asbestos exposure declines significantly as the estimates relate to years further in the future. In the Company’s judgment, there is a future point after which losses cease to be probable and reasonably estimable. It is reasonably possible that the Company’s total exposure to asbestos claims may be materially greater than the asbestos liability currently accrued and that future charges to income may be necessary. While the potential future charges could be material in the particular quarterly or annual periods in which they are recorded, based on information currently known by management, management does not believe any such charges are likely to have a material effect on the Company’s financial position.
MetLife, Inc.
Notes to the Interim Condensed Consolidated Financial Statements (Unaudited) — (continued)
15. Contingencies, Commitments and Guarantees (continued)
The Company believes adequate provision has been made in its interim condensed consolidated financial statements for all probable and reasonably estimable losses for asbestos-related claims. MLIC’s recorded asbestos liability is based on its estimation of the following elements, as informed by the facts presently known to it, its understanding of current law and its past experiences: (i) the probable and reasonably estimable liability for asbestos claims already asserted against MLIC, including claims settled but not yet paid;paid, (ii) the probable and reasonably estimable liability for asbestos claims not yet asserted against MLIC, but which MLIC believes are reasonably probable of assertion;assertion, and (iii) the legal defense costs associated with the foregoing claims. Significant assumptions underlying MLIC’s analysis of the adequacy of its recorded liability with respect to asbestos litigation include: (i) the number of future claims;claims, (ii) the cost to resolve claims;claims, and (iii) the cost to defend claims.
MLIC reevaluates on a quarterly and annual basis its exposure from asbestos litigation, including studying its claims experience, reviewing external literature regarding asbestos claims experience in the United States, assessing relevant trends impacting asbestos liability and considering numerous variables that can affect its asbestos liability exposure on an overall or per claim basis. These variables include bankruptcies of other companies involved in asbestos litigation, legislative and judicial developments, the number of pending claims involving serious disease, the number of new claims filed against it and other defendants and the jurisdictions in which claims are pending. Based upon its regular reevaluation of its exposure from asbestos litigation, MLIC has updated its liability analysis for asbestos-related claims through SeptemberJune 30, 2017.
Regulatory Matters
The Company receives and responds to subpoenas or other inquiries seeking a broad range of information from state regulators, including state insurance commissioners; state attorneys general or other state governmental authorities; federal regulators, including the SEC; federal governmental authorities, including congressional committees; and the Financial Industry Regulatory Authority (“FINRA”), as well as from local and national regulators and government authorities in countries outside the United States where MetLife conducts business. The issues involved in information requests and regulatory matters vary widely. The Company cooperates in these inquiries.
In the Matter of Chemform, Inc. Site, Pompano Beach, Broward County, Florida
In July 2010, the Environmental Protection Agency (“EPA”) advised MLIC that it believed payments were due under two settlement agreements, known as “Administrative Orders on Consent,” that New England Mutual Life Insurance Company (“New England Mutual”) signed in 1989 and 1992 with respect to the cleanup of a Superfund site in Florida (the “Chemform Site”). The EPA originally contacted MLIC (as successor to New England Mutual) and a third party in 2001, and advised that they owed additional clean-up costs for the Chemform Site. The matter was not resolved at that time. In September 2012, the EPA, MLIC and the third party executed an Administrative Order on Consent under which MLIC and the third party agreed to be responsible for certain environmental testing at the Chemform Site. The EPA may seek additional costs if the environmental testing identifies issues. The EPA and MLIC have reached a settlement in principal on the EPA’s claim for past costs. The Company estimates that the aggregate cost to resolve this matter, including the settlement for claims of past costs and the costs of environmental testing, will not exceed $300 thousand.
Sales Practices Regulatory Matters
Regulatory authorities in a number of states and FINRA, and occasionally the SEC, have had investigations or inquiries relating to sales of individual life insurance policies or annuities or other products by MLIC, MetLife Insurance Company USA, New England Life Insurance Company (“NELICO”), General American Life Insurance Company, First MetLife Investors Insurance Company and broker-dealer, MetLife Securities, Inc. (“MSI”). These investigations often focus on the conduct of particular financial services representatives and the sale of unregistered or unsuitable products or the misuse of client assets. Over the past several years, these and a number of investigations by other regulatory authorities were resolved for monetary payments and certain other relief, including restitution payments. The Company may continue to resolve investigations in a similar manner. The Company believes adequate provision has been made in its consolidated financial statements for all probable and reasonably estimable losses for these sales practices-related investigations or inquiries.
2021.
MetLife, Inc.
Notes to the Interim Condensed Consolidated Financial Statements (Unaudited) — (continued)
15. Contingencies, Commitments and Guarantees (continued)
Unclaimed Property Litigation
City of Westland Police and Fire Retirement System v. MetLife, Inc., et. al. (S.D.N.Y., filed January 12, 2012)
Seeking to represent a class of persons who purchased MetLife, Inc. common shares between February 2, 2010, and October 6, 2011, the plaintiff alleges that MetLife, Inc. and several current and former directors and executive officers of MetLife, Inc. violated the Securities Act of 1933, as well as the Securities Exchange Act of 1934 and Rule 10b-5 promulgated thereunder by issuing, or causing MetLife, Inc. to issue, materially false and misleading statements concerning MetLife, Inc.’s potential liability for millions of dollars in insurance benefits that should have been paid to beneficiaries or escheated to the states. Plaintiff seeks unspecified compensatory damages and other relief. On September 22, 2017, the Court granted plaintiff’s motion to certify their proposed class of persons who purchased or acquired MetLife common stock in the Company’s August 3, 2010 Offering or the Company’s March 4, 2011 Offering. The defendants intend to defend this action vigorously.
Total Control Accounts Litigation
MLIC is a defendant in a lawsuit related to its use of retained asset accounts, known as total control accounts (“TCA”), as a settlement option for death benefits.
Owens v. Metropolitan Life Insurance Company (N.D. Ga., filed April 17, 2014)
Plaintiff filed this class action lawsuit on behalf of all persons for whom MLIC established a retained asset account, known as a TCA, to pay death benefits under an Employee Retirement Income Security Act of 1974 (“ERISA”) plan. The action alleges that MLIC’s use of the TCA as the settlement option for life insurance benefits under some group life insurance policies violates MLIC’s fiduciary duties under ERISA. As damages, plaintiff seeks disgorgement of profits that MLIC realized on accounts owned by members of the class. In addition, plaintiff, on behalf of a subgroup of the class, seeks interest under Georgia’s delayed settlement interest statute, alleging that the use of the TCA as the settlement option did not constitute payment. On September 27, 2016, the court denied MLIC’s summary judgment motion in full and granted plaintiff’s partial summary judgment motion. On September 29, 2017, the court certified a nationwide class. The court also certified a Georgia subclass. The Company intends to defend this action vigorously.
Diversified Lending Group Litigations
Hartshorne v. MetLife, Inc., et al. (Los Angeles County Superior Court, filed March 25, 2015)
Plaintiffs named MetLife, Inc., MSI, and NELICO in 12 related lawsuits in California state court alleging various causes of action including multiple negligence and statutory claims relating to a Ponzi scheme involving the Diversified Lending Group. In August 2016, a trial of claims by one of the 98 plaintiffs, Christine Ramirez, resulted in a verdict against MetLife, Inc., MSI, and NELICO for approximately $200 thousand in compensatory damages and $15 million in punitive damages. On November 30, 2016, Ramirez consented to the court’s reduction of punitive damages to approximately $7 million. These companies have filed a notice appealing this judgment to the Second Appellate District of the State of California. On May 2, 2017, the court awarded the plaintiff approximately $6.5 million in attorneys’ fees and costs; the Company has appealed this decision. The Company has reached a settlement in principle with 97 of the plaintiffs, including Ramirez.
MetLife, Inc.
Notes to the Interim Condensed Consolidated Financial Statements (Unaudited) — (continued)
15. Contingencies, Commitments and Guarantees (continued)
Other Litigation
Sun Life Assurance Company of Canada Indemnity Claim
In 2006, Sun Life Assurance Company of Canada (“Sun Life”), as successor to the purchaser of MLIC’s Canadian operations, filed a lawsuit in Toronto, seeking a declaration that MLIC remains liable for “market conduct claims” related to certain individual life insurance policies sold by MLIC that were subsequently transferred to Sun Life. In January 2010, the court found that Sun Life had given timely notice of its claim for indemnification but, because it found that Sun Life had not yet incurred an indemnifiable loss, granted MLIC’s motion for summary judgment. Both parties agreed to consider the indemnity claim through arbitration. In September 2010, Sun Life notified MLIC that a purported class action lawsuit was filed against Sun Life in Toronto alleging sales practices claims regarding the policies sold by MLIC and transferred to Sun Life. On August 30, 2011, Sun Life notified MLIC that another purported class action lawsuit was filed against Sun Life in Vancouver, BC alleging sales practices claims regarding certain of the same policies sold by MLIC and transferred to Sun Life. Sun Life contends that MLIC is obligated to indemnify Sun Life for some or all of the claims in these lawsuits. These sales practices cases against Sun Life are ongoing, and the Company is unable to estimate the reasonably possible loss or range of loss arising from this litigation.
MetLife, Inc. v. Financial Stability Oversight Council (D. D.C., January 13, 2015)
MetLife, Inc. filed this action in U.S. District Court for the District of Columbia (“D.C. District Court”) seeking to overturn the FSOC designation of MetLife, Inc. as a non-bank SIFI. The suit is brought under the section of the Dodd-Frank Wall Street Reform and Consumer Protection Act providing that a company designated as a non-bank SIFI may petition the federal courts for review, and seeks an order requiring that the final determination be rescinded. The D.C. District Court issued a decision on March 30, 2016 granting, in part, MetLife, Inc.’s cross motion for summary judgment and rescinding the FSOC’s designation of MetLife, Inc. as a non-bank SIFI. On April 8, 2016, the FSOC appealed the D.C. District Court’s order to the United States Court of Appeals for the District of Columbia (“D.C. Circuit”). On August 2, 2017, the D.C. Circuit ordered that the appeal be held in abeyance pending an upcoming report by the Secretary of the Treasury following its review of the FSOC SIFI designation process and standards.
Voshall v. Metropolitan Life Insurance Company (Superior Court of the State of California, County of Los Angeles, April 8, 2015)
Plaintiff filed this putative class action lawsuit on behalf of himself and all persons covered under a long-term group disability income insurance policy issued by MLIC to public entities in California between April 8, 2011 and April 8, 2015. Plaintiff alleges that MLIC improperly reduced benefits by including cost of living adjustments and employee paid contributions in the employer retirement benefits and other income that reduces the benefit payable under such policies. Plaintiff asserts causes of action for declaratory relief, violation of the California Business & Professions Code, breach of contract and breach of the implied covenant of good faith and fair dealing. The Company intends to defend this action vigorously.
Martin v. Metropolitan Life Insurance Company, (Superior Court of the State of California, County of Contra Costa, filed December 17, 2015)
Plaintiffs filed this putative class action lawsuit on behalf of themselves and all California persons who have been charged compound interest by MLIC in life insurance policy and/or premium loan balances within the last four years. Plaintiffs allege that MLIC has engaged in a pattern and practice of charging compound interest on life insurance policy and premium loans without the borrower authorizing such compounding, and that this constitutes an unlawful business practice under California law. Plaintiff asserts causes of action for declaratory relief, violation of California’s Unfair Competition Law and Usury Law, and unjust enrichment. Plaintiff seeks declaratory and injunctive relief, restitution of interest, and damages in an unspecified amount. On April 12, 2016, the court granted MLIC’s motion to dismiss. Plaintiffs have appealed this ruling.
MetLife, Inc.
Notes to the Interim Condensed Consolidated Financial Statements (Unaudited) — (continued)
15. Contingencies, Commitments and Guarantees (continued)
Lau v. Metropolitan Life Insurance Company (S.D.N.Y. filed, December 3, 2015)
This putative class action lawsuit was filed by a single defined contribution plan participant on behalf of all ERISA plans whose assets were invested in MetLife’s “Group Annuity Contract Stable Value Funds” within the past six years. The suit alleges breaches of fiduciary duty under ERISA and challenges the “spread” with respect to the stable value fund group annuity products sold to retirement plans. The allegations focus on the methodology MetLife uses to establish and reset the crediting rate, the terms under which plan participants are permitted to transfer funds from a stable value option to another investment option, the procedures followed if an employer terminates a contract, and the level of disclosure provided. Plaintiff seeks declaratory and injunctive relief, as well as damages in an unspecified amount. The Company intends to defend this action vigorously.
Newman v. Metropolitan Life Insurance Company (N.D. Ill., filed March 23, 2016)
Plaintiff filed this putative class action alleging causes of action for breach of contract, fraud, and violations of the Illinois Consumer Fraud and Deceptive Business Practices Act, based on MLIC’s class-wide increase in premiums charged for long-term care insurance policies. Plaintiff alleges a class consisting of herself and all persons over age 65 who selected a Reduced Pay at Age 65 payment feature and whose premium rates were increased after age 65. Plaintiff asserts that premiums could not be increased for these class members and/or that marketing material was misleading as to MLIC’s right to increase premiums. Plaintiff seeks unspecified compensatory, statutory and punitive damages, as well as recessionary and injunctive relief. On April 12, 2017, the court granted MLIC’s motion, dismissing the action with prejudice. On April 21, 2017, plaintiff appealed this ruling.
Miller, et al. v. MetLife, Inc., et al. (C.D. Cal., filed April 7, 2017)
Plaintiffs filed this putative class action against MetLife, Inc. and MLIC in the U.S. District Court for the Central District of California, purporting to assert claims on behalf of all persons who replaced their MetLife Optional Term Life or Group Universal Life policy for a Group Variable Universal Life policy wherein MetLife allegedly charged smoker rates for certain non-smokers. Plaintiffs seek unspecified compensatory and punitive damages, as well as other relief. On September 25, 2017, Plaintiffs dismissed the action and refiled the complaint in U.S. District Court for the Southern District of New York. The Company intends to defend this action vigorously.
Julian & McKinney v. Metropolitan Life Insurance Company (S.D.N.Y., filed February 9, 2017)
Plaintiffs filed this putative class and collective action on behalf of themselves and all current and former long-term disability (“LTD”) claims specialists between February 2011 and the present for alleged wage and hour violations under the Fair Labor Standards Act, the New York Labor Law, and the Connecticut Minimum Wage Act. The suit alleges that MetLifeMLIC improperly reclassified the plaintiffs and similarly situated LTD claims specialists from non-exempt to exempt from overtime pay in November 2013. As a result, they and members of the putative class were no longer eligible for overtime pay even though they allege they continued to work more than 40 hours per week. The CompanyPlaintiffs seek unspecified compensatory and punitive damages, as well as other relief. On March 22, 2018, the court conditionally certified the case as a collective action, requiring that notice be mailed to LTD claims specialists who worked for MLIC from February 8, 2014 to the present. MLIC intends to defend this action vigorously.
Sales PracticesTotal Asset Recovery Services, LLC. v. MetLife, Inc., et al. (Supreme Court of the State of New York, County of New York, filed December 27, 2017)
Total Asset Recovery Services (the “Relator”) brought an action under the qui tam provision of the New York False Claims
Over Act (the “Act”) on behalf of itself and the pastState of New York. The Relator originally filed this action under seal in 2010, and the complaint was unsealed on December 19, 2017. The Relator alleges that MetLife, Inc., MLIC, and several years,other insurance companies violated the Company has faced numerous claims, including class action lawsuits, alleging improper marketing or salesAct by filing false unclaimed property reports with the State of individualNew York from 1986 to 2017, to avoid having to escheat the proceeds of more than 25,000 life insurance policies, annuities, mutualincluding policies for which the defendants escheated funds other products oras part of their demutualizations in the misuse of client assets. Some of the current cases seek substantial damages, including punitive andlate 1990s. The Relator seeks treble damages and attorneys’ fees.other relief. On April 3, 2019, the court granted MetLife, Inc.’s and MLIC’s motion to dismiss and dismissed the complaint in its entirety. The Relator filed an appeal with the Appellate Division of the New York State Supreme Court, First Department. On December 10, 2020, the Appellate Division reversed the court’s order granting MetLife, Inc. and Metropolitan Life Insurance Company’s motion to dismiss, remanded the case to the trial court, and permitted the Relator’s counsel to file an amended complaint. On March 5, 2021, the Relator filed an amended complaint. The Company continuesintends to defend vigorously against the claimsaction vigorously.
Matters Related to Group Annuity Benefits and Assumed Variable Annuity Guarantee Reserves
In 2018, the Company announced that it identified two material weaknesses in its internal control over financial reporting related to the practices and procedures for estimating reserves for certain group annuity benefits and the calculation of reserves associated with certain variable annuity guarantees assumed from the former operating joint venture in Japan. Several regulators have made inquiries into these matters.issues and it is possible that other jurisdictions may pursue similar investigations or inquiries. The Company believes adequate provision has been madeis exposed to lawsuits, and could be exposed to additional legal actions relating to these issues. These may result in its consolidated financial statements for all probable and reasonably estimable losses for sales practices matters.
Summary
Putative or certified class action litigationpayments, including damages, fines, penalties, interest and other litigation and claims and assessments against theamounts assessed or awarded by courts or regulatory authorities under applicable escheat, tax, securities, Employee Retirement Income Security Act of 1974, or other laws or regulations. The Company in addition to those discussed previously and those otherwise provided for in the Company’s consolidated financial statements, have arisen in the course of the Company’s business, including, but not limited to,could incur significant costs in connection with these actions.
Litigation Matters
Parchmann v. MetLife, Inc., et. al. (E.D.N.Y., filed February 5, 2018)
Plaintiff filed this putative class action seeking to represent a class of persons who purchased MetLife, Inc. common stock from February 27, 2013 through January 29, 2018. Plaintiff alleges that MetLife, Inc., its activities as an insurer, mortgage lending bank, employer, investor, investment advisorformer Chief Executive Officer and taxpayer. Further, state insurance regulatory authoritiesChairman of the Board, and its former Chief Financial Officer violated Section 10(b) of the Exchange Act and Rule 10b-5 promulgated thereunder by issuing materially false and/or misleading financial statements. Plaintiff alleges that MetLife’s practices and procedures for estimating reserves for certain group annuity benefits were inadequate, and that MetLife had inadequate internal control over financial reporting. Plaintiff seeks unspecified compensatory damages and other federalrelief. On January 11, 2021, the court granted MetLife’s motion to dismiss and state authorities regularly make inquiries and conduct investigations concerningdismissed the Company’s compliancecomplaint in its entirety. Plaintiff filed an appeal with applicable insurance and other laws and regulations.
the United States Court of Appeals for the Second Circuit. Defendants intend to defend this action vigorously.
MetLife, Inc.
Notes to the Interim Condensed Consolidated Financial Statements (Unaudited) — (continued)
15. Contingencies, Commitments and Guarantees (continued)
Derivative Demands
It is not possible to predict the ultimate outcomeThe MetLife, Inc. Board of all pending investigationsDirectors received six letters, dated March 28, 2018, May 11, 2018, July 16, 2018, December 20, 2018, February 5, 2019, and legal proceedings. In someApril 7, 2020, written on behalf of the matters referred to previously, very largeindividual stockholders, demanding that MetLife, Inc. take action against current and former directors and officers for alleged breaches of fiduciary duty and/or indeterminate amounts, including punitiveinvestigate, remediate, and treblerecover damages are sought. Although in lightallegedly suffered by the Company as a result of these considerations it is possible that an adverse outcome in certain cases could have a material effect upon(i) the Company’s financial position, based on information currently known byallegedly inadequate practices and procedures for estimating reserves for certain group annuity benefits, (ii) the Company’s management,allegedly inadequate internal controls over financial reporting and corporate governance practices and procedures, and (iii) the alleged dissemination of false or misleading information related to these issues. The MetLife, Inc. Board of Directors appointed a special committee to investigate the allegations set forth in its opinion, the outcomes of such pending investigations and legal proceedings are not likely to have such an effect. However, given the large and/or indeterminate amounts sought in certain of these matters and the inherent unpredictability of litigation, it is possible that an adverse outcome in certain matters could, from time to time, have a material effect on the Company’s consolidated net income or cash flows in particular quarterly or annual periods.six letters.
Commitments
Mortgage Loan Commitments
The Company commits to lend funds under mortgage loan commitments. The amounts of these mortgage loan commitments were $3.4$4.4 billion and $4.0$3.3 billion at SeptemberJune 30, 20172021 and December 31, 2016,2020, respectively.
Commitments to Fund Partnership Investments, Bank Credit Facilities, Bridge Loans and Private Corporate Bond Investments
The Company commits to fund partnership investments and to lend funds under bank credit facilities, bridge loans and private corporate bond investments. The amounts of these unfunded commitments were $7.5$8.3 billionand $6.9$8.5 billion at SeptemberJune 30, 20172021 and December 31, 2016,2020, respectively.
Guarantees
In the normal course of its business, the Company has provided certain indemnities, guarantees and commitments to third parties such that it may be required to make payments now or in the future. In the context of acquisition, disposition, investment and other transactions, the Company has provided indemnities and guarantees, including those related to tax, environmental and other specific liabilities and other indemnities and guarantees that are triggered by, among other things, breaches of representations, warranties or covenants provided by the Company. In addition, in the normal course of business, the Company provides indemnifications to counterparties in contracts with triggers similar to the foregoing, as well as for certain other liabilities, such as third-party lawsuits. These obligations are often subject to time limitations that vary in duration, including contractual limitations and those that arise by operation of law, such as applicable statutes of limitation. In some cases, the maximum potential obligation under the indemnities and guarantees is subject to a contractual limitation ranging from less than $1 million to $329 million, with a cumulative maximum of $709$635 million, while in other cases such limitations are not specified or applicable. Since certain of these obligations are not subject to limitations, the Company does not believe that it is possible to determine the maximum potential amount that could become due under these guarantees in the future. Management believes that it is unlikely the Company will have to make any material payments under these indemnities, guarantees, or commitments.
In addition, the Company indemnifies its directors and officers as provided in its charters and by-laws. Also, the Company indemnifies its agents for liabilities incurred as a result of their representation of the Company’s interests. Since these indemnities are generally not subject to limitation with respect to duration or amount, the Company does not believe that it is possible to determine the maximum potential amount that could become due under these indemnities in the future.
The Company also has also minimum fund yield requirements on certain international pension funds in accordance with local laws.funds. Since these guarantees are not subject to limitation with respect to duration or amount, the Company does not believe that it is possible to determine the maximum potential amount that could become due under these guarantees in the future.
The Company’s recorded liabilities were $6 million and $8$20 million at Septemberboth June 30, 20172021 and December 31, 2016, respectively,2020 for indemnities, guarantees and commitments.
MetLife, Inc.
Notes to the Interim Condensed Consolidated Financial Statements (Unaudited) — (continued)
16. Subsequent Events
Senior Notes
In July 2021, MetLife, Inc. redeemed for cash and canceled $500 million aggregate principal amount of its outstanding 3.048% senior notes due December 2022. The Company recorded a premium of $17 million paid in excess of the debt principal and accrued and unpaid interest to other expenses.
Common Stock RepurchasesRepurchase Authorization
In the fourth quarter of 2017 through October 25, 2017, MetLife, Inc. repurchased 2,301,205 shares of its common stock in the open market for $121 million. On November 1, 2017,August 4, 2021, MetLife, Inc. announced that its Board of Directors approvedauthorized an additional $2.0$3.0 billion authorization for MetLife, Inc. to repurchase its common stock.
Common Stock Dividend
On October 24, 2017, the MetLife, Inc. Board of Directors declared a fourth quarter 2017 common stock dividend of $0.40 per share payable on December 13, 2017 to shareholders of record as of November 6, 2017. The Company estimates that the aggregate dividend payment will be $422 million.
The Separation
See Note 3 and Note 10 for subsequent events related to the Separation.
repurchases.
Item 2. Management’s Discussion and Analysis of Financial Condition and Results of Operations
Index to Management’s Discussion and Analysis of Financial Condition and Results of Operations
Forward-Looking Statements and Other Financial Information
For purposes of this discussion, “MetLife,” the “Company,” “we,” “our” and “us” refer to MetLife, Inc., a Delaware corporation incorporated in 1999, its subsidiaries and affiliates. Following this summary is a discussion addressing the consolidated results of operations and financial condition of the Company for the periods indicated. This discussion should be read in conjunction with MetLife, Inc.’s Annual Report on Form 10-K for the year ended December 31, 20162020 (the “2016“2020 Annual Report”), the cautionary language regarding forward-looking statements included below, the “Risk Factors” set forth in Part II, Item 1A, and the additional risk factors referred to therein, “Quantitative and Qualitative Disclosures About Market Risk” and the Company’s interim condensed consolidated financial statements included elsewhere herein.
This Management’s Discussion and Analysis of Financial Condition and Results of Operations may contain or incorporate by reference information that includes or is based upon forward-looking statements within the meaning of the Private Securities Litigation Reform Act of 1995. Forward-looking statements give expectations or forecasts of future events. These statements can be identified by the fact that they do not relate strictly to historical or current facts. They use words such as “anticipate,” “estimate,” “expect,” “project,” “intend,” “plan,” “believe” and other words and terms of similar meaning, or are tied to future periods, in connection with a discussion of future operating or financial performance. In particular, these include statements relating to future actions, prospective services or products, future performance or results of current and anticipated services or products, sales efforts, expenses, the outcome of contingencies such as legal proceedings, trends in operations and financial results. Any or all forward-looking statements may turn out to be wrong. Actual results could differ materially from those expressed or implied in the forward-looking statements. See “Note Regarding Forward-Looking Statements.”Statements” for cautionary language regarding forward-looking statements.
This Management’s Discussion and Analysis of Financial Condition and Results of Operations includes references to our performance measures, operatingadjusted earnings and operatingadjusted earnings available to common shareholders, that are not based on accounting principles generally accepted in the United States of America (“GAAP”). These measures are used by management to evaluate performance and allocate resources. Consistent with GAAP guidance for segment reporting, operating earnings is also our GAAP measure of segment performance. Operating earnings and other financial measures based on operating earnings are also the measures by which senior management’s and many other employees’ performance is evaluated for the purposes of determining their compensation under applicable compensation plans. Operating earnings and other financial measures based on operating earnings allow analysis of our performance relative to our business plan and facilitate comparisons to industry results. Forward-looking guidance provided on a non-GAAP basis cannot be reconciled to the most directly comparable GAAP measures on a forward-looking basis because net income may fluctuate significantly if net investment gains and losses and net derivative gains and losses move outside of estimated ranges. See “— Non-GAAP and Other Financial Disclosures” for definitions and a discussion of these and other financial measures, and “— Results of Operations” and “— Investments” for reconciliations of historical non-GAAP financial measures to the most directly comparable GAAP measures.
Executive Summary
Overview
MetLife is one of the world’s leading financial services companies, providing insurance, annuities, employee benefits and asset management. MetLife is organized into five segments: U.S.; Asia; Latin America; Europe, the Middle East and Africa (“EMEA”); and MetLife Holdings. In addition, the Company reports certain of its results of operations in Corporate & Other. See Note 2 of the Notes to the Interim Condensed Consolidated Financial Statements for further information on the Company’s segments and Corporate & Other. Management
COVID-19 Pandemic
We continue to closely monitor developments relating to the novel coronavirus COVID-19 pandemic (the “COVID-19 Pandemic”) and assess its impact on our business. The COVID-19 Pandemic continues to evaluateimpact the Company’s segment performanceglobal economy and allocated resourcesfinancial markets and may adjust related measurementshas caused volatility in the future to better reflect segment profitability.
On August 4, 2017, MetLife, Inc. completed the separation of Brighthouse Financial, Inc.global equity, credit and its subsidiaries (“Brighthouse”) through a distribution of96,776,670shares of Brighthouse Financial, Inc. common stock to the MetLife, Inc. common shareholders (the “Separation”).MetLife, Inc. retained the remaining ownership interest of 22,996,436 shares, or 19.2%, of Brighthouse Financial, Inc. common stock outstanding. The Separation resulted in the elimination of the Brighthouse Financial segment. The results of Brighthouse are reflected in the Company’s interim condensed consolidated financial statements as discontinued operations and had no impact on total consolidated net income (loss). Prior period results have been revised to reflect discontinued operations and are reported in Corporate & Other.real estate markets. See “— Other Key InformationIndustry Trends — Separation of Brighthouse”Financial and Economic Environment.” We have implemented risk management and business continuity plans and taken preventive measures and other precautions, such as employee business travel restrictions and remote work arrangements which, to date, have enabled us to maintain our critical business processes, customer service levels, relationships with key vendors, financial reporting systems, internal controls over financial reporting and disclosure controls and procedures.
We continue to grant certain accommodations to our customers and borrowers, including (i) relaxing claim documentation requirements for disability claims and (ii) payment deferrals and other loan modifications on certain commercial, agricultural and residential mortgage loans. See Note 36 of the Notes to the Interim Condensed Consolidated Financial Statements for further information.information regarding COVID-19 Pandemic-related mortgage loan concessions. See also “— Results of Operations — Segment Results and Corporate & Other” for further information regarding the effect of the COVID-19 Pandemic on our businesses.
Current Period Highlights
During the three months ended SeptemberJune 30, 2017, overall sales2021, adjusted premiums, fees and other revenues, net of foreign currency fluctuations, increased compared to the three months ended September 30, 2016, reflecting improved salesprior period driven by growth in our Retirement and Income SolutionsU.S. segment, which included the acquisition of Versant Health, Inc. (“RIS”Versant Health”) business, as well as our segments abroad,, largely offset by declinesthe disposition of MetLife Property and Casualty Insurance Company and certain of its wholly-owned subsidiaries (collectively, “MetLife P&C”). Strong returns in our U.S. life and annuity products due to the discontinued marketing of these productsprivate equity portfolio resulted in connection with the Separation. Higher taxes negatively impacted our results compared to the prior period. In addition, while positive net flows drove an increase in our investment portfolio,improved investment yields were down despite improved equity market performance. Results improved due to the impactand changes in both periods of our annual actuarial assumption review. An unfavorablelong-term interest rates drove a favorable change in net investment gains (losses) was primarily the result of losses recognized in connection with the Separation. Losses from discontinued operations were due to the Separation. Net derivative gains (losses) improved primarily as. Results for the quarter also included the gain on the sale of MetLife P&C and the release of a resultlegal reserve. Underwriting experience was unfavorable and reflected impacts from the COVID-19 Pandemic.
The following represents segment level results and percentage contributions to total segment level operatingadjusted earnings available to common shareholders for the ninethree months ended SeptemberJune 30, 2017:2021:
__________________
| |
(1) | Excludes Corporate & Other operating loss available to common shareholders of $580 million. |
| |
(2) | Consistent with GAAP guidance for segment reporting, operating earnings is our GAAP measure of segment performance. See “— Non-GAAP and Other Financial Disclosures.” |
__________________
103
(2)Consistent with GAAP guidance for segment reporting, adjusted earnings is our GAAP measure of segment performance. For additional information, see Note 2 of the Notes to the Interim Condensed Consolidated Financial Statements.
Three Months Ended SeptemberJune 30, 20172021 Compared with the Three Months Ended SeptemberJune 30, 2016
|
| | | | | | | | | | | | | | | | | | | |
| Consolidated Results - Highlights | |
Net income (loss) available to MetLife, Inc.’s common shareholders down $658 million, which includes a $1.1 billion loss from the Separation in the current period:up $3.3 billion: | |
| | |
| • | UnfavorableFavorable change in net investment gains (losses) of $837 million$1.4 billion ($544 million,1.1 billion, net of income tax) | |
| | |
| • | Income (loss) from discontinued operations, net of income tax, down $517 million |
| |
• | Operating earnings available to common shareholders down $187 million |
| |
• | Favorable change in net derivative gains (losses) of $353 million$1.1 billion ($229893 million, net of income tax)(2) | |
| | |
| • | Adjusted earnings available to common shareholders up $1.3 billion | |
| | |
| (1) See “— Results of Operations — Consolidated Results” and “— Non-GAAP and Other Financial Disclosures” for reconciliations and definitions of non-GAAP financial measures. | |
| (2) Includes amounts relating to investment hedge adjustments, which are also included in adjusted earnings available to common shareholders. See “— Investments — Investment Portfolio Results” for additional information. | |
| |
Consolidated Results - OperatingAdjusted Earnings Highlights | |
OperatingAdjusted earnings available to common shareholders down $187 million: |
• | Resultsup $1.3 billion primarily due to (i) higher investment yields, and (ii) the release of operations impacted by higher taxes and lower investment yields,a legal reserve in the current period, partially offset by (i) unfavorable underwriting, which reflected impacts from the impact in both periodsCOVID-19 Pandemic, and (ii) the disposition of our annual actuarial assumption review.
MetLife P&C, which decreased adjusted earnings by $83 million. | |
• | Our results for the three months ended September 30, 2017 included the following: | |
| • | net tax-related charges of $167 million consisting of (i) a $180 million net tax charge related tothe future repatriation of approximately $3.0 billion of cash following the post-Separation review of our capital needs, partially offset by a tax benefit associated with dividends from our non-U.S. operations, and (ii) a $13 million net tax-related benefit, including interest, from the finalization of certain tax audits
| |
| • | favorable reserve adjustments of $28 million, net of income tax, and $21 million, net of income tax, resulting from modeling improvements in the reserving process for our long-term care and life businesses, respectively |
| • | a $17 million, net of income tax, increase in expenses associated with our previously announced unit cost initiative |
For a more in-depth discussion of our consolidated results, see “— Results of Operations — Consolidated Results” and “— Results of Operations — Consolidated Results — Operating.”
Nine Months Ended September 30, 2017 Compared with the Nine Months Ended September 30, 2016
Six Months Ended June 30, 2021 Compared with the Six Months Ended June 30, 2020
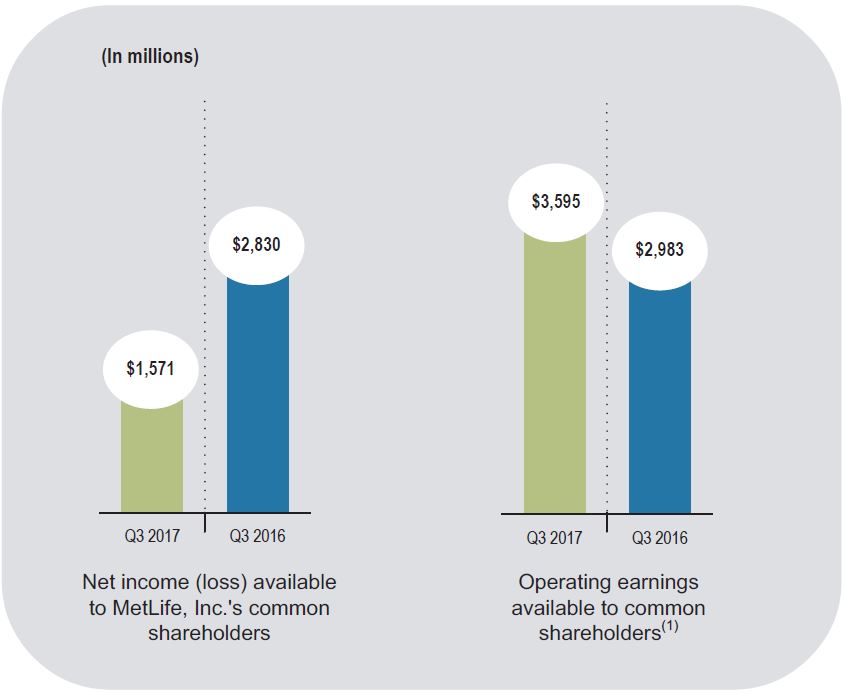
| | | | | | | | | | | | | | | | | | | | |
| Consolidated Results - Highlights | |
Net income (loss) available to MetLife, Inc.’s common shareholders down $1.3 billion, which includes a $1.3 billion loss from the Separation in the current period:$778 million: | |
| | |
| • | Unfavorable change in net derivative gains (losses) of $2.1$5.3 billion ($4.2 billion, net of income tax) (2) | |
| | |
| • | Favorable change in net investment gains (losses) of $1.8 billion ($1.4 billion, net of income tax) | |
| | |
| • | Unfavorable change in net investment gains (losses) of $1.0 billion ($674 million, net of income tax) |
| |
• | Favorable change in income (loss) from discontinued operations, net of income tax, of $390 million |
| |
• | OperatingAdjusted earnings available to common shareholders up $612 million$1.8 billion | |
| | |
| (1) See “— Results of Operations — Consolidated Results” and “— Non-GAAP and Other Financial Disclosures” for reconciliations and definitions of non-GAAP financial measures. | |
| (2) Includes amounts relating to investment hedge adjustments, which are also included in adjusted earnings available to common shareholders. See “— Investments — Investment Portfolio Results” for additional information. | |
| |
Consolidated Results - OperatingAdjusted Earnings Highlights | |
OperatingAdjusted earnings available to common shareholders up $612 million: |
• | Results$1.8 billion primarily due to (i) higher investment yields, (ii) an increase in net investment income due to a larger asset base, (iii) lower interest credited expenses and (iv) the release of operations impacted by annuities reinsurance activity with Brighthouse,a legal reserve in the impact in both periods of our annual actuarial assumption review and the impact of current and prior period, refinements made todeferred policy acquisition costs (“DAC”) and certain insurance-related liabilities
|
• | Our results for the nine months ended September 30, 2017 included the following: |
| • | net tax-related charges of $140 million consisting of (i) a $180 million net tax charge related tothe future repatriation of approximately $3.0 billion of cash following the post-Separation review of our capital needs, partially offset by a tax benefit associated with dividends(i) unfavorable underwriting, which reflected impacts from our non-U.S. operations,the COVID-19 Pandemic, and (ii) a $40 million net tax-related benefit, including interest, from the finalizationdisposition of certain tax audits
MetLife P&C, which decreased adjusted earnings by $192 million. | |
| • | a $44 million, net of income tax, charge for expenses incurred related to a guaranty fund assessment for Penn Treaty Network America Insurance Company (“Penn Treaty”) and an increase in litigation reserves |
| • | a $60 million, net of income tax, increase in expenses associated with our previously announced unit cost initiative | |
| • | favorable reserve adjustments of $55 million, net of income tax, and $28 million, net of income tax, resulting from modeling improvements in the reserving process for our life and long-term care businesses, respectively | |
| • | a charge of $36 million, net of income tax, for lease impairments | | |
| • | a benefit of $12 million, net of income tax, related to a refinement to prior period reinsurance receivables in Australia | | |
• | Our results for the nine months ended September 30, 2016 included the following: | | | |
| • | unfavorable reserve adjustments of $30 million, net of income tax, resulting from modeling improvements in the reserving process for our universal life business | | |
| • | one-time charge of $44 million, net of income tax, related to an adjustment to reinsurance receivables in Australia | | |
| • | tax benefit in Japan of $20 million related to a change in corporate tax rate that pertains to periods prior to 2016 | | |
| • | tax charge in Chile of $10 million as a result of tax reform legislation that pertains to periods prior to 2016 | | |
For a more in-depth discussion of our consolidated results, see “— Results of Operations — Consolidated Results” andResults,” “— Results of Operations — Consolidated Results — Operating.Adjusted Earnings” and “— Results of Operations — Segment Results and Corporate & Other.”
Consolidated Company Outlook
As evidenced by the completionThe following information should be read in conjunction with “Management’s Discussion and Analysis of Financial Condition and Results of Operations — Executive Summary — Consolidated Company Outlook” in Part II, Item 7, of the Separation2020 Annual Report. There have been no material changes to our consolidated company outlook from that previously discussed in the third quarter of 2017, we remain committed to Accelerating Value and our refreshed enterprise strategy, the center of which is One MetLife. Digital and simplified are the key enablers of our strategic initiatives which include (i) optimizing value and risk by prioritizing businesses with high internal rates of return, lower capital intensity, and maximum cash generation, (ii) driving operational excellence, by becoming a high-performance operating company with a competitive cost structure, (iii) transforming our distribution channels to drive efficiency and productivity through digital enablement and improved customer persistency, and (iv) undertaking a targeted approach to find the right solutions for the right customers through the commitment to creating differentiated customer value propositions. This new enterprise strategy will enhance our ability to focus on the right markets, build clear differentiators, and continue to make the right investments to deliver shareholder value.2020 Annual Report except as noted below.
We expect post-Separation MetLife operating earningsour direct expense ratio, excluding total notable items related to grow in 2018 driven by both business growthdirect expenses and expense discipline, andpension risk transfers, to be significantly less sensitive to interest rates. Notably, the Separation has made MetLife a more globally diversified company; we expect MetLife will generate over 40% of its operating earnings from outside the United States in 2018 and that percentage should continue to grow over time.
We expect to have cash commitments of between $1.0 billion and $2.0 billion over the two-year period of 2017 and 2018 relating to liability management transactions, including the repayment of certain debt maturities. In addition, we plan to maintain a liquidity buffer of $3.0 to $4.0 billion of liquid assets at the holding companies.
Assuming interest rates follow the observable forward yield curves as of December 31, 2016, we expect the average ratio of free cash flow to operating earnings over the two-year period of 2017 and 2018, excluding the impact of the Separation, to be 65% to 75%. This expectation reflects our unit cost improvement program and the related initiative to invest $1.0 billion by 2020 to generate $800 million pre-tax run rate annual savings, net of stranded overhead. We believe that free cash flow is a key determinant of dividends and share repurchases.
When making these and other projections, we must rely on the accuracy of our assumptions about future economic and business conditions, which can be affected by known and unknown risks and other uncertainties. Our assumptions have been and will continue to be impacted by (i) regulatory uncertainty regarding capital requirements that would have been applicable to MetLife, Inc. as a result of the Financial Stability Oversight Council’s (“FSOC”) former designation of MetLife, Inc. as a non-bank systemically important financial institution (“non-bank SIFI”), which, among other things, impacted the level of our share repurchases, (ii) lower investment margins (primarily in the United States) as a result of the sustained low interest rate environment, (iii) lower than anticipated merger and acquisition activity, and (iv) the effect on our foreign operations of the strengthening of the U.S. dollar. See “— Other Key Information — Separation of Brighthouse ” and “— Other Key Information — Non-Bank SIFI” for information regarding the Separation, and the status of court proceedings relating to MetLife, Inc.’s challenge to the FSOC’s former designation of it as a non-bank SIFI.
Other Key Information
Separation of Brighthouse
On August 4, 2017, MetLife, Inc. completed the separation of Brighthouse. MetLife, Inc. common shareholders received a distribution of one share of Brighthouse Financial, Inc. common stock for every 11 shares of MetLife, Inc. common stock they owned as of 5:00 p.m., New York City time, on the July 19, 2017 record date. Shareholders of MetLife, Inc. who owned less than 11 shares of common stock, or others who would have otherwise received fractional shares, received cash. MetLife, Inc. distributed 96,776,670 of the 119,773,106 shares of Brighthouse Financial, Inc. common stock outstanding, representing approximately 80.8% of those shares. Certain MetLife affiliates hold MetLife, Inc. common stock and, as a result, participated in the distribution.
The loss recognized in the third quarter of 2017 in connection with the Separation was $1,084 million, net of income tax, which includes: (i) a $1,061 million loss on MetLife's retained investment in Brighthouse Financial, Inc., (ii) a $42 million net tax charge and (iii) a $42 million charge, net of income tax, for transaction costs, partially offset by a $61 million gain, net of income tax, for previously deferred intercompany gains realized upon Separation. The $42 million net tax charge is comprised of a $1,093 million tax separation agreement charge offset by $1,051 million of Separation tax benefits. Of the $1,084 million total loss, net of income tax, a $104 million loss, net of income tax, was reported within continuing operations as (i) a $738 million net investment loss, (ii) a $147 million charge within policyholder benefits and claims, (iii) a $107 million charge within other expenses, and (iv) an $888 million income tax benefit. The remaining $980 million loss was reported within discontinued operations, which primarily includes a tax-related charge.
For the nine months ended September 30, 2017, the loss recognized in connection with the Separation was $1,347 million, net of income tax, which included additional transaction costs. Of the $1,347 million total loss, net of income tax, a $176 million loss, net of income tax, was reported within continuing operations as (i) a $738 million net investment loss, (ii) a $147 million charge within policyholder benefits and claims, (iii) a $218 million charge within other expenses, and (iv) a $927 million income tax benefit. The remaining $1,171 million loss was reported within discontinued operations, which primarily includes a tax-related charge.
MetLife, Inc. retained the remaining ownership interest of 22,996,436 shares, or 19.2%, of Brighthouse Financial, Inc. common stock and recognized its investment in Brighthouse Financial, Inc. common stock based on the NASDAQ reported market price. The Company elected to record the investment under the fair value option (“FVO”) as an observable measure of estimated fair value that is aligned with the Company’s intent to divest of the retained shares as soon as practicable. Subsequent changes in estimated fair value of the investment are recorded to net investment gains (losses). The estimated fair value of the Brighthouse Financial, Inc. common stock held by the Company (“FVO Brighthouse Common Stock”) as of September 30, 2017 was $1.4 billion reported within fair value option securities. In the third quarter of 2017, the Company recorded a $1,016 million mark-to-market loss on its retained investment in Brighthouse Financial, Inc. to net investment gains (losses) at Separation and an additional $45 million loss to net investment gains (losses)below 12.3% for the change in Brighthouse Financial, Inc.’s common stock share price from the Separation date to September 30, 2017. As of the Separation date, the Company evaluated the assets of Brighthouse for potential impairment,full year 2021 and determined that no impairment charge was required. On November 1, 2017, MetLife, Inc. announced that it currently intends to divest its retained Brighthouse Financial, Inc. common stock through an exchange offer for MetLife, Inc. common stock during 2018, subject to market conditions and regulatory approval.2022.
The Company incurred pre-tax Separation-related transaction costs of $64 million and $470 million for the three months and nine months ended September 30, 2017, respectively, primarily related to fees for the terminations of financing arrangements and professional services. The Company incurred pre-tax Separation-related transaction costs of $51 million and $108 million for the three months and nine months ended September 30, 2016, respectively, primarily related to professional services. For the three months and nine months ended September 30, 2017, the Company reported $39 million and $333 million, respectively, within discontinued operations for fees for the terminations of financing arrangements and costs required to complete the Separation. All other Separation-related transaction costs are recorded in other expenses and reported within continuing operations.
See Note 3 of the Notes to the Interim Condensed Consolidated Financial Statements for further information on the Separation.
U.S. Retail Advisor Force Divestiture
In July 2016, MetLife, Inc. completed the sale to Massachusetts Mutual Life Insurance Company (“MassMutual”) of our U.S. retail advisor force and certain assets associated with the MetLife Premier Client Group, including all of the issued and outstanding shares of MetLife’s affiliated broker-dealer, MetLife Securities, Inc. (“MSI”), a wholly-owned subsidiary of MetLife, Inc. (the “U.S. Retail Advisor Force Divestiture”) for $291 million. MassMutual assumed all of the liabilities related to such assets that arise or occur at or after the closing of the sale. As part of the transactions, MetLife, Inc. and MassMutual entered into a product development agreement under which the part of MetLife’s former U.S. retail business now in Brighthouse will be the exclusive developer of certain annuity products to be issued by MassMutual. In the MassMutual purchase agreement, MetLife, Inc. agreed to indemnify MassMutual for certain claims, liabilities and breaches of representations and warranties up to limits described in the purchase agreement.
Hurricanes
In the third quarter of 2017, Hurricanes Irma and Harvey made landfall in Florida and Texas, respectively, causing loss of lives and extensive property damage. MetLife’s property & casualty business’ gross losses from Hurricanes Irma and Harvey were approximately $65 million, before income tax. As of September 30, 2017, we recognized total net losses related to these hurricanes of $42 million, net of income tax, which impacted the U.S. segment. Additional storm-related losses may be recorded in future periods as claims are received from insureds.
Non-Bank SIFI
On December 18, 2014, the FSOC designated MetLife, Inc. as a non-bank SIFI subject to regulation by the Board of Governors of the Federal Reserve System (the “Federal Reserve Board”) and the Federal Reserve Bank of New York (collectively with the Federal Reserve Board, the “Federal Reserve”) and the Federal Deposit Insurance Corporation (the “FDIC”), as well as to enhanced supervision and prudential standards. On March 30, 2016, the D.C. District Court ordered that the designation of MetLife, Inc. as a non-bank SIFI by the FSOC be rescinded. On April 8, 2016, the FSOC appealed the D.C. District Court’s order to the United States Court of Appeals for the District of Columbia (“D.C. Circuit”), and oral argument was heard on October 24, 2016. In a Presidential Memorandum for the Secretary of the Treasury dated April 21, 2017, President Trump directed the Secretary of the Treasury to review the FSOC SIFI designation process for transparency, due process and other factors, and, pending the completion of the review and submission of the Secretary’s recommendations, to refrain from voting for any non-emergency designations. The Secretary’s review and report were due by October 18, 2017. As of November 3, 2017, the Secretary’s report has not yet been issued. On August 2, 2017, the D.C. Circuit ordered that the appeal be held in abeyance pending the issuance of that report by the Secretary of the Treasury. The D.C. Circuit also ordered the parties to file additional procedural motions to govern future proceedings by November 17, 2017, or within 30 days of the issuance of the Treasury Secretary’s report, whichever occurs first. If the FSOC prevails on appeal or designates MetLife, Inc. as systemically important as part of its ongoing review of non-bank financial companies, MetLife, Inc. could once again be subject to regulation as a non-bank SIFI. See “Business — Regulation — U.S. Regulation — Potential Regulation as a Non-Bank SIFI” included in the 2016 Annual Report.
Industry Trends
The following information on industry trends should be read in conjunction with “Management’s Discussion and Analysis of Financial Condition and Results of Operations — Industry Trends” in Part II, Item 7, of the 2016 Annual Report.
We continue to be impacted by the unstablechanging global financial and economic environment that has been affecting the industry.
Financial and Economic Environment
Our business and results of operations are materially affected by conditions in the global capital markets and the economy generally. Stressed conditions, volatility and disruptionsgenerally due to our market presence in global capital markets, particular markets, or financial asset classes can have an adverse effect on us, in part because we have anumerous countries, large investment portfolio and the sensitivity of our insurance liabilities and derivatives are sensitive to changing market factors.
We are closely monitoring political and economic conditions that might contribute to global market volatility and impact our business operations, investment portfolio and derivatives, such as the COVID-19 Pandemic. See “Risk Factors“— Investments — Economic EnvironmentCurrent Environment.”
We are also monitoring the imposition of tariffs or other barriers to international trade, changes to international trade agreements, and Capital Markets-Related Risks — We Are Exposed to Significant Global Financialtheir potential impacts on our business, results of operations and Capital Markets Risks Which May Adversely Affect Our Results of Operations, Financial Condition and Liquidity, and May Cause Our Net Investment Income to Vary from Period to Period” infinancial condition, including the 2016 Annual Report. The impact on global capital markets, and on the economy generally, of the priorities of the Trump Administration is uncertain. See “Risk Factors — Economic Environment and Capital Markets-Related Risks — If Difficult Conditions in the Global Capital Markets and the Economy Generally Persist, They May Materially Adversely Affect Our Business and Results of Operations” in the 2016 Annual Report.
We have market presence in numerous countries and increased exposure to risks posedtrade agreement reached by local and regional economic conditions. See “Risk Factors — Risks Related to Our Business — Our International Operations Face Political, Legal, Operational and Other Risks, Including Exposure to Local and Regional Economic Conditions, That Could Negatively Affect Those Operations or Our Profitability” in the 2016 Annual Report, as amended or supplemented in our subsequently filed Quarterly Reports on Form 10-Q.
Concerns about the political and/or economic instability in the United Kingdom (“U.K.”), Mexico, Italy, Turkey and Puerto Rico and weakness in the energy sector have recently contributed to global market volatility. See “— Investments — Current Environment — Selected Country and Sector Investments.” Events following the U.K.’s referendum on June 23, 2016 and the uncertainties, including foreign currency exchange risks, associated with its pending withdrawal from the European Union (“EU”), have also contributed to market volatility, both in December 2020. See “Regulatory Developments — Cross-Border Trade and Investments” herein and “Business — Regulation — Cross-Border Trade and Investments” included in the U.S.2020 Annual Report.
Governments and beyond. These factors could contribute to weakening gross domestic product growth, primarily in the U.K. and Europe. The magnitude and longevity of the potential negative economic impacts would depend on the detailed agreements reached by the U.K. and the EU as a result of the exit negotiations and negotiations regarding trade and other arrangements.
Centralcentral banks around the world have usedare responding to the COVID-19 Pandemic with unprecedented fiscal and monetary policies, which have had significant effects and may have ongoing effects on financial markets and the global economy. In the United States, the Board of Governors of the Federal Reserve System continues to combat global market volatility. For example,expand its balance sheet and board members’ forecasts suggest the policy rate is likely to remain near zero into 2023. Separately, the U.S. Congress passed another COVID-related stimulus package in March 2021. The European Central Bank (“ECB”) continues to institute support measures, including quantitative easing,conduct its pandemic asset purchase program and has signaled its intention to lessencontinue the riskprogram through at least March 31, 2022, while the Bank of deflation, lower borrowing costs in the Euro zone and encourage corporations to issue more asset-backed securities. These measures, however, could affect the Euro exchange rate and have uncertain impacts onEngland (“BoE”) has maintained low interest rates and risk markets. continued its expanded quantitative easing program which it has indicated will continue through year-end 2021. Both the ECB and BoE have stated their willingness to maintain such policies despite inflation currently above target levels, as economic activity and price levels rebound from COVID-19 Pandemic-depressed levels. Additionally, a number of European countries, including the U.K., have implemented large fiscal stimulus programs, as well as the provision of guarantees and loans for private sector companies. The EU also approved a regional stimulus package comprised of grants and low interest financing to member states, which became operational in mid-2021.
In Japan, the Japanese government and the Bank of Japan have implementedhas continued its monetary easing program but, in order to further enhance its effectiveness and sustainability, the Bank of Japan (i) introduced a coordinated strategyprogram to promote lending which includeswill enable the impositionBank of aJapan to mitigate potential negative rate on commercial bank deposits, continuedside effects of further reductions in short and long term interest rates; (ii) has clarified the target range of yield curve fluctuations for the 10-year Japanese government bond, purchasesincluding an upper limit when necessary, and tax reform, including the lowering of the Japanese corporate tax rate(iii) announced greater purchasing flexibility for exchange-traded funds and the delay until 2019 of an increase in the consumption tax to 10%. Going forward, Japan’s structural and demographic challenges may continue to limit its potential growth unless reforms that boost productivity are put into place. Japan’s high public sector debt levels are mitigated by low refinancing risks. For information regarding actions taken by the Federal Reserve Board’s Federal Open Market Committee (“FOMC”) in the United States, see “— Impact of a Sustained Low Interest Rate Environment.”Japan real estate investment trusts.
Impact of a Sustained Low Interest Rate Environment
AsMarket interest rates are a global insurance company, we are affected bykey driver of our results. For discussion on the monetary policypotential impact of central banks around the world,low interest rates, as well as the monetary policyour mitigating actions, see “Management’s Discussion and Analysis of the Federal Reserve Board in the United States. The Federal Reserve Board has takenFinancial Condition and Results of Operations — Industry Trends — Impact of a number of actions in recent years to spur economic activity, including asset purchases and keeping interest rates low. However, in December 2015, the FOMC increased the federal funds rate for the first time in 10 years and raised it a number of times since then, with the last raise, from 1.00% to 1.25%, occurring in June 2017. Further increases in the federal funds rate in the future may affect interest rates and risk markets in the U.S. and other developed and emerging economies. However, we cannot predict with certainty the effect of these programs and policies on interest rates or the impact on the pricing levels of risk-bearing investments at this time. See “— Investments — Current Environment.”
During periods of declining interest rates, we may have to invest insurance cash flows and reinvest the cash flows we received as interest or return of principal on our investments in lower yielding instruments. Moreover, borrowers may prepay or redeem the fixed income securities, mortgage loans and mortgage-backed securities in our investment portfolio with greater frequency in order to borrow at lower market rates. Therefore, some of our products expose us to the risk that a reduction in interest rates will reduce the difference between the amounts that we are required to credit on contracts in our general account and the rate of return we are able to earn on investments intended to support obligations under these contracts. This difference between interest earned and interest credited, or margin, is a key metric for the management of, and reporting for, many of our businesses.
Our expectations regarding future margins are an important component impacting the amortization of certain intangible assets such as DAC and value of business acquired (“VOBA”). Significantly lower margins may cause us to accelerate the amortization, thereby reducing net income in the affected reporting period. Additionally, lower margins may also impact the recoverability of intangible assets such as goodwill, require the establishment of additional liabilities or trigger loss recognition events on certain policyholder liabilities. We review this long-term margin assumption, along with other assumptions, as part of our annual actuarial assumption review.
Competitive Pressures
The life insurance industry remains highly competitive. The product development and product life cycles have shortened in many product segments, leading to more intense competition with respect to product features. Larger companies have the ability to invest in brand equity, product development, technology and risk management, which are among the fundamentals for sustained profitable growth in the life insurance industry. In addition, several of the industry’s products can be quite homogeneous and subject to intense price competition. Sufficient scale, financial strength and financial flexibility are becoming prerequisites for sustainable growth in the life insurance industry. Larger market participants tend to have the capacity to invest in additional distribution capability and the information technology needed to offer the superior customer service demanded by an increasingly sophisticated industry client base. We believe that the continued volatility of the financial markets, its impact on the capital position of many competitors, and subsequent actions by regulators and rating agencies have altered the competitive environment. In particular, we believe that these factors have highlighted financial strength as the most significant differentiator and, as a result, we believe the Company is well positioned to compete in this environment.
Regulatory Developments
In the United States, our life insurance companies are regulated primarily at the state level, with some products and services also subject to federal regulation. In addition, MetLife, Inc. and its U.S. insurance subsidiaries are subject to regulation under the insurance holding company laws of various U.S. jurisdictions. Furthermore, some of MetLife’s operations, products and services are subject to consumer protection laws, securities, broker-dealer and investment adviser regulations, environmental and unclaimed property laws and regulations, and to the Employee Retirement Income Security Act of 1974 (“ERISA”). If MetLife, Inc. were re-designated as a non-bank SIFI, it could also be subject to regulation by the Federal Reserve and the FDIC. See “— U.S. Regulation” below, as well as “Business — Regulation — U.S. Regulation,” “Risk Factors — Regulatory and Legal Risks — Our Insurance and Brokerage Businesses Are Highly Regulated, and Changes in Regulation and in Supervisory and Enforcement Policies May Reduce Our Profitability and Limit Our Growth,” “Risk Factors — Risks Related to Our Business — Our Statutory Life Insurance Reserve Financings May Be Subject to Cost Increases and New Financings May Be Subject to Limited Market Capacity,”Sustained Low Interest Rate Environment” and “Risk Factors — RegulatoryEconomic Environment and Legal Risks — Changes in U.S. Federal, State Securities and State Insurance Laws and Regulations May Affect Our Operations and Our Profitability”Capital Markets Risks” included in the 20162020 Annual Report.
Competitive Pressures
See “Business — Competition” and “Management’s Discussion and Analysis of Financial Condition and Results of Operations — Industry Trends — Competitive Pressures” in the 2020 Annual Report as amended or supplementedfor information on our competitive position.
Regulatory Developments
The following discussion on regulatory developments should be read in our subsequently filed Quarterly Reports on Form 10-Q under the captionconjunction with “Business — Regulation” and “Management’s Discussion and Analysis of Financial Condition and Results of Operations — Industry Trends — Regulatory Developments” and similarly named sections under the caption “Risk Factors.”
The Dodd-Frank Wall Street Reform and Consumer Protection Act (“Dodd-Frank”) effected the most far-reaching overhaul of financial regulationincluded in the United States in decades. However, President Trump and the majority party have expressed goals to amend Dodd-Frank. On June 8, 2017, the U.S. House of Representatives passed the Financial CHOICE Act of 2017, which proposes to amend or repeal various sections of Dodd-Frank. This proposed legislation is now being considered by the U.S. Senate. On February 3, 2017, President Trump issued an Executive Order that calls for a comprehensive review of laws, treaties, regulations, policies and guidance regulating the U.S. financial system, and requires the Secretary of the Treasury to consult with the heads of the member agencies of FSOC to identify any laws, regulations or requirements that inhibit federal regulation of the financial system in a manner consistent with the core principles identified in the Executive Order. The Secretary’s report on asset management and insurance was issued on October 26, 2017 and recommended activities-based evaluations of systemic risk in the insurance industry rather than an entity-based approach. The report also supported primary regulation of the U.S. insurance industry by the states rather than the federal government. See “Business — Regulation — U.S. Regulation” and “Risk Factors — Regulatory and Legal Risks — Our Insurance and Brokerage Businesses Are Highly Regulated, and Changes in Regulation and In Supervisory and Enforcement Policies May Reduce Our Profitability and Limit Our Growth” in the 20162020 Annual Report, as amended or supplemented in our subsequently filed Quarterly Reports on Form 10-Q, for a discussion of Dodd-Frank and other U.S. regulation.here.
Our international insurance operations are principally regulated by insurance regulatory authorities in the jurisdictions in which they are located or operate. In addition, our investment and pension companies outside of the U.S. are subject to oversight by the relevant securities, pension and other authorities of the countries in which the companies operate. Our non-U.S. insurance businesses are also subject to current and developing solvency regimes which impose various capital and other requirements. Having been named a global systemically important insurer (“G-SII”), MetLife, Inc. may also become subject to additional capital requirements. See “— International Regulation” below, as well as “Business — Regulation — International Regulation” and “Risk Factors — Regulatory and Legal Risks — Our Insurance and Brokerage Businesses Are Highly Regulated, and Changes in Regulation and in Supervisory and Enforcement Policies May Reduce Our Profitability and Limit Our Growth,” included in the 2016 Annual Report, as amended or supplemented in our subsequently filed Quarterly Reports on Form 10-Q under the caption “Management’s Discussion and Analysis of Financial Condition and Results of Operations — Industry Trends — Regulatory Developments” and similarly named sections under the caption “Risk Factors.”
U.S. Regulation
Insurance Regulation
Insurance Regulatory Examinations and Other Activities
In 2019, we and other insurance and pension fund companies provided annuities sales practices information to the Chilean insurance and pension regulators. The International Associationregulators found that non-employee sales agents of Insurance Supervisors (“IAIS”) has encouraged U.S. insurance supervisors, such asMetLife Chile and other insurers had engaged in improper sales practices and that ProVida S.A. and other pension fund companies provided improper advice to customers. MetLife Chile and ProVida S.A. contested the proposed fines. ProVida S.A’s objections were rejected and MetLife Chile’s objection is still pending.
NYDFS Guidance on Diversity and Corporate Governance
On March 16, 2021, the New York State Department of Financial Services (“NYDFS”), stated it expects the insurers it regulates to establish Supervisory Colleges for U.S.-based insurance groups with international operations,make diversity of their leadership a business priority and a key element of their corporate governance. The NYDFS is collecting data from insurers that meet certain New York premium thresholds, including MetLife, Inc. and certain of its subsidiaries, regarding the diversity of their corporate boards and management. We provided such data to facilitate cooperationthe NYDFS by the July 30, 2021 deadline. The NYDFS will include diversity-related questions in its examination process starting in 2022.
Securities, Broker-Dealer and coordination amongInvestment Adviser Regulation
In April 2021, the insurance groups’ supervisorsAppellate Division of the New York State Supreme Court overturned NYDFS Regulation 187- Suitability and Best Interests in Life Insurance and Annuity Transactions for being unconstitutionally vague. The NYDFS has appealed the decision.
Environmental Laws and Regulations
On March 25, 2021, the NYDFS issued for public comment proposed guidance for New York domestic insurers, which states that insurers are expected to enhancetake a proportionate approach to managing climate risks that reflects their exposure to climate risks. The NYDFS intends to formally adopt the member regulators’ understandingguidance, as modified by the comment process, in the third quarter of 2021, and it has integrated questions on this topic as part of its supervisory activities.
On July 14, 2021, the NYDFS published notice of the adoption of amendments to regulations governing enterprise risk management, effective August 13, 2021. Among other provisions, the amendments require that certain additional risks, including climate change risk, be specifically included in an insurance group’sgroup's enterprise risk profile. In October 2017, a Supervisory College meeting was chaired by the NYDFS and attended by MetLife’s key U.S. and international regulators. We have not received any reports or recommendations from the Supervisory College meeting, and we do not expect any outcome of the meeting to have a material adverse effect on our business.
ERISA Considerations
We provide products and services to certain employee benefit plans that are subject to ERISA or the Internal Revenue Code of 1986, as amended (the “Code”). As such, our activities are subject to the restrictions imposed by ERISA and the Code, including the requirement under ERISA that fiduciaries must perform their duties solely in the interests of ERISA plan participants and beneficiaries, and that fiduciaries may not cause a covered plan to engage in certain prohibited transactions. The applicable provisions of ERISA and the Code are subject to enforcement by the Department of Labor (“DOL”), the Internal Revenue Service and the Pension Benefit Guaranty Corporation.management function.
The prohibited transaction rules of ERISAU.S. Securities and Exchange Commission (the “SEC”) is continuing its focus on climate, and environmental, social and governance (“ESG”) risks and opportunities, and has published its rulemaking list which contains several ESG-related rulemakings that the Code generally restrict the provision of investment advice to ERISA plansSEC is considering.
Cross-Border Trade and participants and Individual Retirement Accounts (“IRAs”) if the investment recommendation results in fees paid to an individual advisor, the firm that employs the advisor or their affiliates that vary according to the investment recommendation chosen.Investments
The DOL issuedRecent U.S. sanctions have imposed new regulations on April 6, 2016, which, in accordance with an April 4, 2017 DOL final rule which delayed the original applicable date by 60 days, became for the most part applicable on June 9, 2017. These rules, substantially expand the definition of “investment advice” and require that an impartial or “best interests” standard be met in providing such advice, thereby broadening the circumstances under which MetLife or its representatives, in providing investment advicerestrictions with respect to ERISA plans, plan participants or IRAs, could be deemed a fiduciary under ERISA or the Code. Pursuant to the final regulations, certain communications with plans, plan participants and IRA holders, including the salesactivity involving China. A series of products, and investment management or advisory services, could be deemed fiduciary investment advice, thus causing increased exposure to fiduciary liability if the distributor does not recommend what isU.S. presidential executive orders imposes prohibitions on engaging in the client’s best interests. The DOL also issued amendments to certain of its prohibited transaction exemptions, and issued a new exemption, that apply more onerous disclosure and contract requirements to, and increases fiduciary requirements and fiduciary liability exposure in respect of, certain transactions involving ERISA plans, plan participantsthe purchase or sale of publicly traded securities, or any publicly traded securities that are derivative of, or are designed to provide investment exposure to such securities, of any listed Chinese Military-Industrial Complex Companies. In addition, the Biden administration issued an executive order directing a review of foreign adversary connected software applications to review transactions that risk sabotage of U.S. information and IRAs. communications technology or services, critical infrastructure, digital economy, national security, or the security and safety of U.S. persons. This review could result in new actions to restrict U.S. persons from engaging in certain transactions with any identified foreign parties.
Employee Retirement Income Security Act of 1974, Fiduciary Considerations, and Other Pension and Retirement Regulation
In general,2020, the changesChilean Congress approved two bills, each of which allowed individuals to withdraw up to 10% of pension accounts or the rule madeaccount balance if it is below a certain amount. ProVida S.A. and other companies in the industry continue to existing prohibited transaction exemptions and contract and disclosure requirementsprocess such payments. The Chilean Congress approved a third bill allowing for additional withdrawals of pension funds which could deplete approximately one third of pension accounts. The bill also requires insurance companies to advance payments of up to 10% of the reserves allocated to a customer’s annuity. Chile also continues to consider other pension reforms.
London Interbank Offered Rate
The Financial Conduct Authority, the U.K. regulator of London Interbank Offered Rates (“LIBOR”), previously indicated that it intends to stop persuading or compelling panel banks to submit quotes used to determine LIBOR after 2021. On March 5, 2021, the Intercontinental Exchange Benchmark Administration, the administrator of LIBOR, announced that it will cease the publication of one week and two-month U.S. Dollar LIBOR and all non-USD (GBP, EUR, CHF and JPY) LIBOR settings at the end of December 2021, but will extend the publication of the remaining U.S. Dollar LIBOR settings (overnight and one, three, six and 12 month U.S. Dollar LIBOR) until the end of June 2023. U.S. bank regulators have advised banks to cease writing, subject to certain limited exceptions, new exemption (other than the impartial interest standard) were delayed until January 1, 2018. On July 6, 2017, the DOL published a new Request for Information regarding a possible further delay in the applicability date of January 1, 2018 along with possible additional changes to the rule. Following this, on August 31, 2017, the DOL proposed to delay the applicability date to July 1, 2019. The public comment period for that proposal ended on September 15, 2017. The rule is also being challenged in the Fifth Circuit Court of Appeals (and elsewhere), where a decision is expectedU.S. Dollar LIBOR contracts by the end of 2017.2021.
On February 3, 2017 President Trump,We use LIBOR and other interbank offered rates as interest reference rates in a memorandummany of our financial instruments. Existing contract fallback provisions, and whether, how, and when we and others develop and adopt alternative reference rates, will influence the effect of any changes to or discontinuation of LIBOR on us. We actively participate in the SecretaryNew York Federal Reserve Bank convened Alternative Reference Rate Committee (“ARRC”) and other industry association efforts on the transition to alternative reference rates. In April 2021, the State of Labor, requested that the DOL prepare an updated economic and legal analysis concerning the likely impact of the new rules, and possible revisions to the rules. The applicable date for the new rules could be further extended to provide the DOL with additional timeNew York enacted legislation to address the requests intransition from LIBOR for certain New York law governed agreements, which is generally consistent with the President’s memorandum.
ARRC’s recommendations to facilitate the transition. We anticipate that we will needcontinue to undertake certain additional tasks in order to comply with certain of the exemptions provided in the DOL regulations, including additional compliance reviews of material shared with distributors, wholesalerassess current and call center trainingalternative reference rates’ merits, limitations, risks and product reportingsuitability for our investment and analysis. The change of administration and DOL officials leaves open the possibility of further modifications. Implementation of the portions of rules that became applicable on June 9, 2017 could create confusion among our distribution partners which could negatively impact product sales. We cannot predict what other proposals may be made, what legislation may be introduced or enacted, or what impact any such legislation may have on our business, results of operations and financial condition. See “Risk Factors — Regulatory and Legal Risks — Our Insurance and Brokerage Businesses Are Highly Regulated, and Changes in Regulation and In Supervisory and Enforcement Policies May Reduce Our Profitability and Limit Our Growth” in the 2016 Annual Report, as amended or supplemented in our subsequently filed Quarterly Reports on Form 10-Q.
insurance processes.
Potential Regulation as a Non-Bank SIFI
See “— Executive Summary — Other Key Information — Non-Bank SIFI” above for recent developments concerning FSOC’s appeal of the D.C. District Court’s order that the designation of MetLife, Inc. as a non-bank SIFI by the FSOC be rescinded.
Regulation of Over-the-Counter Derivatives and Qualified Financial Contracts
Federal banking regulators have recently adopted new rules that will apply to certain qualified financial contracts, including many derivatives contracts, securities lending agreements and repurchase agreements, with certain banking institutions and certain of their affiliates. These new rules, which will begin to go into effect in 2019, will generally require the banking institutions and their applicable affiliates to include contractual provisions in their qualified financial contracts that limit or delay certain rights of their counterparties including counterparties’ default rights (such as the right to terminate the contracts or foreclose on collateral) and restrictions on assignments and transfers of credit enhancements (such as guarantees) arising in connection with the banking institution or an applicable affiliate becoming subject to a bankruptcy, insolvency, resolution or similar proceeding. To the extent that any of the derivatives, securities lending agreements or repurchase agreements that we enter into are subject to these new rules, it could limit our recovery in the event of a default and increase our counterparty risk.
International Regulation
In Chile, in September 2015, a Presidential Advisory Committee issued several recommendations to reform the pension system and on August 10, 2017, Chilean President Bachelet submitted a pension reform proposal comprised of three legislative components: (i) a 5% additional contribution from employers; (ii) a public independent entity to manage the additional funds; and (iii) legislative text that modifies pension fund administrator regulations. Despite limited time before the November 19, 2017 Chilean Presidential election, the Chilean Congress has initiated discussion on the proposal and a group of members are hopeful to achieve at least the additional 5% contribution proposal. Certain of these proposals, if enacted, may have a significant adverse effect on our business in Chile. In fact, the recent unrest in Chile related to such pension system has already had, and continues to have, an adverse effect on our business in Chile. On July 21, 2016, the Chilean Pension Funds Superintendency instituted a proceeding to consider the validity of the action taken by the Superintendency in 2015 approving the merger of Administradora de Fondos de Pensiones ProVida, S.A. into a subsidiary of MetLife, Inc., which was effective on September 1, 2015. On December 13, 2016, the Superintendency upheld the legality of the merger for the third time.
The European Insurance and Occupational Pensions Authority (“EIOPA”), along with European legislation, requires European regulators, such as the Central Bank of Ireland (“CBI”), to establish Supervisory Colleges for European Economic Area (“EEA”)-based insurance groups with significant European operations, including MetLife, to facilitate cooperation and coordination among the insurance groups’ European supervisors and to enhance the member regulators’ understanding of an insurance group’s risk profile. An October 2016 Supervisory College was chaired by the CBI and was attended by MetLife’s key European regulators. We received feedback from the Supervisory College meeting regarding two areas of focus for the College in 2017, risk management and product governance, and we do not expect the outcome of the meeting to have a material adverse effect on our business. The next European Supervisory College is scheduled to take place in November 2017.
Solvency Regimes
Our insurance business throughout the EEA is subject to Solvency II, which became effective on January 1, 2016, after an extensive preparatory phase. Solvency II codifies and harmonizes the EU insurance regulation. Capital requirements are forward-looking and based on the risk profile of each individual insurance company in order to promote comparability, transparency and competitiveness. In line with the requirements, MetLife entities calculate and report their capital requirement using a standard formula prescribed by the EU Directive and further regulation by the EIOPA. The entities have completed their first annual submissions including the Regular Supervisory Report and the Solvency and Financial Condition Report. As legislated for by the EU, a review of Solvency II is currently being undertaken by EIOPA and the European Commission.
In Chile, the law implementing Solvency II-like regulation continues in the studies stage. However, the Chilean insurance regulator has already issued two resolutions, one for governance, and the other for risk management and control framework requirements. MetLife Chile has already implemented governance changes and risk policies to comply with these resolutions. A fifth impact study was completed and submitted in July 2017. On March 31, 2016, the local regulator issued a final regulation which requires insurance companies to implement a risk appetite framework and produce an Own Risk and Solvency Assessment. The first such report was submitted to the local regulator in September 2017. Even though a formal implementation date has not yet been set, it is estimated that the new solvency and supervisory regime could be in force between 2018 and 2020.
In China, our joint venture (as well as the industry) has been implementing China Risk Oriented Solvency System (“C-ROSS”), a new risk-based solvency regime which became effective on January 1, 2016. Like Solvency II, C-ROSS focuses on risk management and has three pillars (strengthen quantitative capital requirements, enhance qualitative supervision and establish a governance and market discipline process). In September 2017, the regulator announced a three-year plan aimed at improving C-ROSS rules in line with the changing market environment.
Global Systemically Important Insurers
The IAIS, an association of insurance supervisors and regulators and a member of the Financial Stability Board (“FSB”), an international entity established to coordinate, develop and promote regulatory, supervisory and other financial sector policies in the interest of financial stability, is participating in the FSB’s initiative to identify and manage systemic risk globally. To this end, the IAIS published a methodology to assess the systemic relevance of global insurers and a framework of policy measures to be applied to G-SIIs. The IAIS/FSB process is separate from the U.S. FSOC designation process and MetLife, Inc. remains a G-SII in spite of the rescission of its U.S. non-bank SIFI designation on March 30, 2016.
The global designation process is an annual process and IAIS policy requires that the IAIS evaluate whether updates to its assessment methodology are necessary every three years. Accordingly, the IAIS published an updated assessment methodology on June 16, 2016, which was used as the basis for the 2016 assessment of a pool of approximately 50 insurers, including MetLife, Inc. The new methodology reflects changes in the previous definitions of non-traditional and non-insurance activity, along with certain other changes in both quantitative and qualitative assessments, most notably introducing greater transparency into the process. On November 21, 2016, the FSB issued its 2016 list of G-SIIs, which included MetLife, Inc. With respect to the 2017 G-SII designation process, MetLife, Inc. filed data in response to a request from the FSB. The outcome is as yet uncertain.
Summary of Critical Accounting Estimates
The preparation of financial statements in conformity with GAAP requires management to adopt accounting policies and make estimates and assumptions that affect amounts reported on the Interim Condensed Consolidated Financial Statements. The most critical estimates include those used in determining:
| |
(i) | liabilities for future policy benefits and the accounting for reinsurance; |
| |
(ii) | capitalization and amortization of DAC and the establishment and amortization of VOBA; |
| |
(iii) | estimated fair values of investments in the absence of quoted market values; |
| |
(iv) | investment impairments; |
| |
(v) | estimated fair values of freestanding derivatives and the recognition and estimated fair value of embedded derivatives requiring bifurcation; |
| |
(vi) | measurement of goodwill and related impairment; |
| |
(vii) | measurement of employee benefit plan liabilities; |
| |
(viii) | measurement of income taxes and the valuation of deferred tax assets; and |
| |
(ix) | liabilities for litigation and regulatory matters. |
(i)liabilities for future policy benefits and the accounting for reinsurance;
(ii)capitalization and amortization of deferred policy acquisition costs (“DAC”) and the establishment and amortization of value of business acquired (“VOBA”);
(iii)estimated fair values of investments in the absence of quoted market values;
(iv)investment allowance for credit loss (“ACL”) and impairments;
(v)estimated fair values of freestanding derivatives and the recognition and estimated fair value of embedded derivatives requiring bifurcation;
(vi)measurement of goodwill and related impairment;
(vii)measurement of employee benefit plan liabilities;
(viii)measurement of income taxes and the valuation of deferred tax assets; and
(ix)liabilities for litigation and regulatory matters.
In addition, the application of acquisition accounting requires the use of estimation techniques in determining the estimated fair values of assets acquired and liabilities assumed — the most significant of which relate to the aforementioned critical accounting estimates. In applying these policies and estimates, management makes subjective and complex judgments that frequently require assumptions about matters that are inherently uncertain. Many of these policies, estimates and related judgments are common in the insurance and financial services industries; others are specific to our business and operations. Actual results could differ from these estimates.
The aboveCompany’s critical accounting estimates are described in “Management’s Discussion and Analysis of Financial Condition and Results of Operations — Summary of Critical Accounting Estimates” and Note 1 of the Notes to the Consolidated Financial Statements included in the 20162020 Annual Report.
Goodwill
Goodwill is tested for impairment at least annually or more frequently if events or circumstances, such as adverse changes in the business climate, indicate that there may be justification for conducting an interim test.
For purposes of goodwill impairment testing, if the carrying value of a reporting unit exceeds its estimated fair value, the implied fair value of the reporting unit goodwill is compared to the carrying value of that goodwill to measure the amount of impairment loss, if any. In such instances, the implied fair value of the goodwill is determined in the same manner as the amount of goodwill that would be determined in a business acquisition. The key inputs, judgments and assumptions necessary in determining estimated fair value of the reporting units include projected operating earnings, current book value, the level of economic capital required to support the mix of business, long-term growth rates, comparative market multiples, the account value of in-force business, projections of new and renewed business, as well as margins on such business, the level of interest rates, credit spreads, equity market levels, and the discount rate that we believe is appropriate for the respective reporting unit.
In the third quarter of 2017, the Company tested the MetLife Holdings life reporting unit for impairment using the actuarial based embedded value fair valuation approach. The estimated fair value of the reporting unit exceeded the carrying value by approximately 19% and, therefore, the reporting unit was not impaired. If we had assumed that the discount rate was 100 basis points higher than the discount rate used, the estimated fair value of the MetLife Holdings life reporting unit would have been higher than the carrying value by approximately 1%. The MetLife Holdings life reporting unit consists of operations relating to products and businesses no longer actively marketed by the Company. As of September 30, 2017, the amount of goodwill allocated to the MetLife Holdings life reporting unit was $887 million.
The Company also performed its annual goodwill impairment tests of all other reporting units during the third quarter of 2017 using a qualitative assessment and/or quantitative assessments under the market multiple and discounted cash flow valuation approaches based on best available data as of June 30, 2017 and concluded that the estimated fair values of all such reporting units were in excess of their carrying values and, therefore, goodwill was not impaired.
We apply significant judgment when determining the estimated fair value of our reporting units and when assessing the relationship of market capitalization to the aggregate estimated fair value of our reporting units. The valuation methodologies utilized are subject to key judgments and assumptions that are sensitive to change. Estimates of fair value are inherently uncertain and represent only management’s reasonable expectation regarding future developments. These estimates and the judgments and assumptions upon which the estimates are based will, in all likelihood, differ in some respects from actual future results. Declines in the estimated fair value of our reporting units could result in goodwill impairments in future periods which could materially adversely affect our results of operations or financial position.
Economic Capital
Economic capital is an internally developed risk capital model, the purpose of which is to measure the risk in the business and to provide a basis upon which capital is deployed. The economic capital model accounts for the unique and specific nature of the risks inherent in our business.
Our economic capital model, coupled with considerations of local capital requirements, aligns segment allocated equity with emerging standards and consistent risk principles. The model applies statistics-based risk evaluation principles to the material risks to which the Company is exposed. These consistent risk principles include calibrating required economic capital shock factors to a specific confidence level and time horizon while applying an industry standard method for the inclusion of diversification benefits among risk types. Economic capital-based risk estimation is an evolving science and industry best practices have emerged and continue to evolve. Areas of evolving industry best practices include stochastic liability valuation techniques, alternative methodologies for the calculation of diversification benefits, and the quantification of appropriate shock levels. MetLife’s management is responsible for the ongoing production and enhancement of the economic capital model and reviews its approach periodically to ensure that it remains consistent with emerging industry practice standards.
For further information, see “Financial Measures and Segment net investment income is credited or charged based on the level of allocated equity; however, changesAccounting Policies” in allocated equity do not impact our consolidated net investment income, income (loss) from continuing operations, net of income tax, or operating earnings.
Net investment income is based upon the actual results of each segment’s specifically identifiable investment portfolios adjusted for allocated equity. Other costs are allocated to eachNote 2 of the segments based upon: (i) a review ofNotes to the nature of such costs; (ii) time studies analyzing the amount of employee compensation costs incurred by each segment; and (iii) cost estimates included in the Company’s product pricing.Interim Condensed Consolidated Financial Statements.
Acquisitions and Dispositions
On October 25, 2017, MetLife Mexico entered into a definitive agreement to sell MetLife Afore, S.A. de C.V., its pension fund management business, to a subsidiaryAcquisitions
Acquisition of Principal Financial Group, subject to regulatory approval. The sale is expected to close duringVersant Health
For information regarding the first half of 2018.
On September 15, 2017, the Company completed theCompany’s December 2020 acquisition of Logan Circle Partners, L.P.Versant Health, see Note 3 of the Notes to the Consolidated Financial Statements included in the 2020 Annual Report.
Dispositions
Pending Disposition of MetLife Poland and Greece
For information regarding the Company's pending disposition of its wholly-owned subsidiaries in Poland and Greece (collectively, “MetLife Poland and Greece”) to NN Group N.V., from Fortress Investment Group LLC, for approximately $250 million in cash. Logan Circle Partners is a fundamental research-based investment manager providing institutional clients actively managed investment solutions across a broad spectrum of fixed income strategies, with more than 100 institutional clientsreported as held-for-sale, see Notes 1 and more than $37 billion in assets under management as of August 31, 2017.
See also “— Executive Summary — Other Key Information — Separation of Brighthouse” and Note 3 of the Notes to the Interim Condensed Consolidated Financial Statements for information on the Separation, as well as “— Executive Summary — Other Key Information — U.S. Retail Advisor Force Divestiture” for information on the U.S. Retail Advisor Force Divestiture.
Statements.
Disposition of MetLife P&C
For information regarding the Company's April 2021 disposition of MetLife P&C, which was reported as held-for-sale, see Notes 1 and 3 of the Notes to the Interim Condensed Consolidated Financial Statements.
Disposition of MetLife Russia
For information regarding the Company's January 2021 disposition of its wholly-owned Russian subsidiary, the Joint-stock Company MetLife Insurance Company (“MetLife Russia”), see Note 3 of the Notes to the Consolidated Financial Statements included in the 2020 Annual Report.
Disposition of MetLife Seguros de Retiro
For information regarding the Company's October 2020 disposition of one of its wholly-owned Argentinian subsidiaries, MetLife Seguros de Retiro S.A. (“MetLife Seguros de Retiro”), see Note 3 of the Notes to the Consolidated Financial Statements included in the 2020 Annual Report.
Results of Operations
Consolidated Results
Business Overview. Overall sales for the three months ended September 30, 2017 increased over prior period levels reflecting higher sales from the majority of our segments. The overall increase in sales from our U.S. segment was primarily driven by improved sales in our RIS business, partially offset by lower sales in our Group Benefits business. In our RIS business, higher sales of pension risk transfers and stable value products were partially offset by a decrease in funding agreement issuances. Higher sales of pension and credit life products were partially offset by lower sales of group accident & health products in our Latin America segment. Sales in EMEA also improved as a result of strong sales in the Gulf and Turkey, which more than offset the impact of the closing of the wealth management product to new business in the U.K. and the loss of a credit life contract in Poland. In our Asia segment, higher sales were primarily driven by a successful sales campaign in Korea, as well as agency growth in China, partially offset by sales declines in Japan and Hong Kong. In our MetLife Holdings segment, the U.S. Retail Advisor Force Divestiture and the Separation negatively impacted sales.
| | | | | Three Months
Ended
September 30, | | Nine Months
Ended
September 30, | | Three Months
Ended
June 30, | | Six Months
Ended
June 30, |
| | | 2017 | | 2016 | | 2017 | | 2016 | | 2021 | | 2020 | | 2021 | | 2020 |
| | | (In millions) | | (In millions) |
| Revenues | | | | | | | | | Revenues | |
| Premiums | | $ | 10,876 |
| | $ | 9,839 |
| | $ | 29,421 |
| | $ | 27,956 |
| Premiums | | $ | 9,132 | | | $ | 8,736 | | | $ | 19,459 | | | $ | 18,202 | |
| Universal life and investment-type product policy fees | | 1,428 |
| | 1,341 |
| | 4,152 |
| | 4,127 |
| Universal life and investment-type product policy fees | | 1,422 | | | 1,299 | | | 2,813 | | | 2,730 | |
| Net investment income | | 4,295 |
| | 4,609 |
| | 12,909 |
| | 12,527 |
| Net investment income | | 5,280 | | | 4,087 | | | 10,594 | | | 7,148 | |
| Other revenues | | 301 |
| | 356 |
| | 935 |
| | 1,309 |
| Other revenues | | 664 | | | 456 | | | 1,295 | | | 895 | |
| Net investment gains (losses) | | (606 | ) | | 231 |
| | (439 | ) | | 598 |
| Net investment gains (losses) | | 1,605 | | | 231 | | | 1,739 | | | (57) | |
| Net derivative gains (losses) | | (190 | ) | | (543 | ) | | (663 | ) | | 1,438 |
| Net derivative gains (losses) | | 421 | | | (710) | | | (1,814) | | | 3,491 | |
| Total revenues | | 16,104 |
| | 15,833 |
| | 46,315 |
| | 47,955 |
| Total revenues | | 18,524 | | | 14,099 | | | 34,086 | | | 32,409 | |
| Expenses | | | | | | | | | Expenses | | | | | | | | |
| Policyholder benefits and claims and policyholder dividends | | 10,947 |
| | 9,914 |
| | 29,848 |
| | 28,318 |
| Policyholder benefits and claims and policyholder dividends | | 9,641 | | | 8,957 | | | 20,411 | | | 18,271 | |
| Interest credited to policyholder account balances | | 1,338 |
| | 1,544 |
| | 4,081 |
| | 3,819 |
| Interest credited to policyholder account balances | | 1,515 | | | 1,962 | | | 2,866 | | | 2,042 | |
| | Capitalization of DAC | | (761 | ) | | (770 | ) | | (2,218 | ) | | (2,422 | ) | Capitalization of DAC | | (642) | | | (671) | | | (1,417) | | | (1,445) | |
| Amortization of DAC and VOBA | | 626 |
| | 660 |
| | 1,945 |
| | 2,052 |
| Amortization of DAC and VOBA | | 537 | | | 560 | | | 1,127 | | | 1,348 | |
| Amortization of negative VOBA | | (32 | ) | | (55 | ) | | (113 | ) | | (221 | ) | Amortization of negative VOBA | | (10) | | | (10) | | | (19) | | | (20) | |
| Interest expense on debt | | 284 |
| | 280 |
| | 851 |
| | 875 |
| Interest expense on debt | | 228 | | | 232 | | | 456 | | | 454 | |
| Other expenses | | 3,201 |
| | 3,101 |
| | 9,439 |
| | 10,012 |
| Other expenses | | 2,768 | | | 2,872 | | | 5,884 | | | 5,919 | |
| Total expenses | | 15,603 |
| | 14,674 |
| | 43,833 |
| | 42,433 |
| Total expenses | | 14,037 | | | 13,902 | | | 29,308 | | | 26,569 | |
| Income (loss) before provision for income tax | | 501 |
| | 1,159 |
| | 2,482 |
| | 5,522 |
| Income (loss) before provision for income tax | | 4,487 | | | 197 | | | 4,778 | | | 5,840 | |
| Provision for income tax expense (benefit) | | (392 | ) | | 135 |
| | (148 | ) | | 1,253 |
| Provision for income tax expense (benefit) | | 1,075 | | | 47 | | | 1,003 | | | 1,289 | |
| Income (loss) from continuing operations, net of income tax | | 893 |
| | 1,024 |
| | 2,630 |
| | 4,269 |
| |
| Income (loss) from discontinued operations, net of income tax | | (968 | ) | | (451 | ) | | (989 | ) | | (1,379 | ) | |
| Net income (loss) | | (75 | ) | | 573 |
| | 1,641 |
| | 2,890 |
| Net income (loss) | | 3,412 | | | 150 | | | 3,775 | | | 4,551 | |
| Less: Net income (loss) attributable to noncontrolling interests | | 6 |
| | (4 | ) | | 12 |
| | 2 |
| Less: Net income (loss) attributable to noncontrolling interests | | 5 | | | 5 | | | 10 | | | 8 | |
| Net income (loss) attributable to MetLife, Inc. | | (81 | ) | | 577 |
| | 1,629 |
| | 2,888 |
| Net income (loss) attributable to MetLife, Inc. | | 3,407 | | | 145 | | | 3,765 | | | 4,543 | |
| Less: Preferred stock dividends | | 6 |
| | 6 |
| | 58 |
| | 58 |
| Less: Preferred stock dividends | | 35 | | | 77 | | | 103 | | | 109 | |
| Preferred stock redemption premium | | Preferred stock redemption premium | | 6 | | | — | | | 6 | | | — | |
| Net income (loss) available to MetLife, Inc.’s common shareholders | | $ | (87 | ) | | $ | 571 |
| | $ | 1,571 |
| | $ | 2,830 |
| Net income (loss) available to MetLife, Inc.’s common shareholders | | $ | 3,366 | | | $ | 68 | | | $ | 3,656 | | | $ | 4,434 | |
Three Months Ended SeptemberJune 30, 20172021 Compared with the Three Months Ended SeptemberJune 30, 20162020
During the three months ended SeptemberJune 30, 2017,2021, net income (loss) decreased $648 million, net of income tax,increased $3.3 billion from the prior period, primarily driven by unfavorablefavorable changes in adjusted earnings, net investment gains (losses), income (loss) from discontinued operations, results from our divested businesses and operating earnings, partially offset by a favorable change in net derivative gains (losses)., net of investment hedge adjustments.
Management of Investment Portfolio and Hedging Market Risks with Derivatives.We manage our investment portfolio using disciplined asset/liability management (“ALM”) principles, focusing on cash flow and duration to support our current and future liabilities. Our intent is to match the timing and amount of liability cash outflows with invested assets that have cash inflows of comparable timing and amount, while optimizing risk-adjusted net investment income and risk-adjusted total return. Our investment portfolio is heavily weighted toward fixed income investments, with over 80% of our portfolio invested in fixed maturity securities available-for-sale (“AFS”) and mortgage loans. These securities and loans have varying maturities and other characteristics which cause them to be generally well suited for matching the cash flow and duration of insurance liabilities. In addition, our general account investment portfolio includes, within contractholder-directed equity securities and fair value option securities (“FVO”FVO Securities”), contractholder-directed unit-linked investmentsequity securities supporting unit-linked variable annuity type liabilities (“Unit-linked investments”), which do not qualify as separate account assets. The returnsReturns on these contractholder-directed unit-linkedUnit-linked investments, which can vary significantly from period to period, include changes in estimated fair value subsequent to purchase, inure to contractholders and are offset in earnings by a corresponding change in policyholder account balances through interest credited to policyholder account balances.
We purchase investments to support our insurance liabilities and not to generate net investment gains and losses. However, net investment gains and losses are incurred and can change significantly from period to period due to changes in external influences, including changes in market factors such as interest rates, foreign currency exchange rates, credit spreads and equity markets; counterparty specific factors such as financial performance, credit rating and collateral valuation; and internal factors such as portfolio rebalancing. Changes in these factors from period to period can significantly impact the levels of bothprovision for credit loss and impairments andon our investment portfolio, as well as realized gains and losses on investments sold.
We also use derivatives as an integral part of our management of the investment portfolio and insurance liabilities to hedge certain risks, including changes in interest rates, foreign currency exchange rates, credit spreads and equity market levels. We use freestanding interest rate, equity, credit and currency derivatives to hedge certain invested assets and insurance liabilities. A small portion of these hedges are designated and qualify as accounting hedges, which reduce volatility in earnings. For those hedges not designated as accounting hedges, changes in market factors lead to the recognition of fair value changes in net derivative gains (losses) generally without an offsetting gain or loss recognized in earnings for the item being hedged, which creates volatility in earnings. During the first quarter of 2017, we began restructuring certain derivative hedges to partially stabilize volatility from nonqualified interest rate derivatives and to help meet prospective dividend and free cash flow objectives under varying interest rate scenarios. The restructuring of the hedge program is substantially complete in meeting our initial objectives. As part of this restructuring, we replaced certain nonqualified derivatives with derivatives that qualify for hedge accounting treatment. In addition, we also entered into replication transactions using interest rate swaps, which are accounted for at amortized cost under statutory guidelines and are nonqualified derivatives under GAAP. We actively evaluate market risk hedging needs and strategies to ensure our free cash flow and capital objectives are met under a range of market conditions.
Certain variable annuity products with guaranteed minimum benefits contain embedded derivatives that are measured at estimated fair value separately from the host variable annuity contract, with changes in estimated fair value recorded in net derivative gains (losses). We use freestanding derivatives to hedge the market risks inherent in these variable annuity guarantees. The valuation of these embedded derivatives includes a nonperformance risk adjustment, which is unhedged, and can be a significant driver of net derivative gains (losses) and volatility in earnings, but does not have an economic impact on us.
We continuously review and refine our strategy and ongoing refinement of the strategy may be required to take advantage of the National Association of Insurance Commissioners (“NAIC”) rules related to a statutory accounting election for derivatives that mitigate interest rate sensitivity related to variable annuity guarantees. As a part of our current hedge strategy, we maintain portfolio level derivatives in our macro hedge program. These macro hedge program derivatives, which are included in the non-VA program derivatives section of the table below, mitigate the potential loss of our overall statutory capital from significant adverse economic conditions.
Net Derivative Gains (Losses).The variable annuity embedded derivatives and associated freestanding derivative hedges are collectively referred to as “VA program derivatives” in the following table.derivatives.” All other derivatives that are economic hedges of certain invested assets and insurance liabilities are referred to as “non-VA program derivatives” in the following table.derivatives.” The table below presents the impact on net derivative gains (losses) from non-VA program derivatives and VA program derivatives:
| | | | | | | | Three Months
Ended
June 30, |
| | Three Months Ended September 30, | | 2021 | | 2020 |
| | 2017 | | 2016 | | (In millions) |
| | (In millions) | |
| Non-VA program derivatives | | | | |
| Non-VA program derivatives: | | Non-VA program derivatives: | |
| Interest rate | $ | (38 | ) | | $ | (254 | ) | Interest rate | $ | 660 | | | $ | (53) | |
| Foreign currency exchange rate | (125 | ) | | 59 |
| Foreign currency exchange rate | (62) | | | (77) | |
| Credit | 52 |
| | 47 |
| Credit | 31 | | | 119 | |
| Equity | 10 |
| | 2 |
| Equity | (196) | | | (519) | |
| Non-VA embedded derivatives | (3 | ) | | 5 |
| Non-VA embedded derivatives | (37) | | | (130) | |
| Total non-VA program derivatives | (104 | ) | | (141 | ) | Total non-VA program derivatives | 396 | | | (660) | |
| VA program derivatives | | | | |
| VA program derivatives: | | VA program derivatives: | | | |
| Market risks in embedded derivatives | 360 |
| | 538 |
| Market risks in embedded derivatives | 78 | | | 657 | |
| Nonperformance risk adjustment on embedded derivatives | (52 | ) | | (154 | ) | Nonperformance risk adjustment on embedded derivatives | (8) | | | (110) | |
| Other risks in embedded derivatives | (71 | ) | | (112 | ) | Other risks in embedded derivatives | (37) | | | (46) | |
| Total embedded derivatives | 237 |
| | 272 |
| Total embedded derivatives | 33 | | | 501 | |
| Freestanding derivatives hedging embedded derivatives | (323 | ) | | (674 | ) | Freestanding derivatives hedging embedded derivatives | (8) | | | (551) | |
| Total VA program derivatives | (86 | ) | | (402 | ) | Total VA program derivatives | 25 | | | (50) | |
| Net derivative gains (losses) | $ | (190 | ) | | $ | (543 | ) | Net derivative gains (losses) | $ | 421 | | | $ | (710) | |
The favorable change in net derivative gains (losses) on non-VA program derivatives was $37 million$1.1 billion ($24834 million, net of income tax). This was primarily due to long-term rates decreasing in the current period versus increasing in the prior period. This favorably impacted the estimated fair value of receive fixed interest rates increasingrate swaps and interest total rate of return swaps. In addition, key equity indexes increased less in the current period thancompared with the prior period,period. This favorably impacting receive-fixed interestimpacted the estimated fair value of equity options and total rate swaps and floors primarily hedging long-duration liability portfolios. This was partially offset by the Japanese yen and the U.S. dollar, relative to other key currencies, weakening in the current period versus mostly strengthening in the prior period, unfavorably impacting foreign currency forwards andof return swaps that primarilyare part of our macro hedge foreign currency-denominated bonds.program. Because certain of these hedging strategies are not designated or do not qualify as accounting hedges, the changes in the estimated fair value of these freestanding derivatives are recognized in net derivative gains (losses) without an offsetting gain or loss recognized in earnings for the itemitems being hedged.
The favorable change in net derivative gains (losses) on VA program derivatives was $316$75 million ($20559 million, net of income tax). This was due to (i) a favorable change of $173$102 million ($11281 million, net of income tax) in the nonperformance risk adjustment on embedded derivatives, and (ii) a favorable change of $9 million, ($7 million, net of income tax) in other risks in embedded derivatives (primarily policyholder behavior and other non-market risks that generally cannot be hedged), partially offset by an unfavorable change of $36 million ($28 million, net of income tax) in market risks in embedded derivatives, net of the impact of freestanding derivatives hedging those risks, a favorable change of $102 million ($66 million, net of income tax) related to the change in the nonperformance risk adjustment on embedded derivatives and a favorable change in other risks in embedded derivatives of $41 million ($27 million, net of income tax). Other risks relate primarily to the impact of policyholder behavior and other non-market risks that generally cannot be hedged.
The foregoing $173 million ($112 million, net of income tax) favorable change reflects a $351 million ($228 million, net of income tax) favorable change in freestanding derivatives hedging market risks in embedded derivatives, partially offset by a $178 million ($116 million, net of income tax) unfavorable change in market risks in embedded derivatives. The primary changes in market factors are summarized as follows:
Long-term interest rates increased less in the current period than in the prior period, contributing to a favorable change in our freestanding derivatives and an unfavorable change in our embedded derivatives. For example, the 10-year U.S. swap rate increased 1 basis point in the current period and increased 9 basis points in the prior period.
Key weighted average equity index levels increased less in the current period than in the prior period, contributing to an unfavorable change in our embedded derivatives and a favorable change in our freestanding derivatives.
Changes in foreign currency exchange rates contributed to a favorable change in our embedded derivatives, related to the assumed reinsurance of certain variable annuity products from our former operating joint venture in Japan, and an unfavorable change in our freestanding derivatives. For example, the Japanese yen was unchanged against the U.S. dollar in the current period and strengthened by 1% in the prior period.
The aforementioned $102 million ($6681 million, net of income tax) favorable change in the nonperformance risk adjustment onincluded in the valuation of embedded derivatives resulted from a favorable change of $62$53 million, before income tax, as a result ofrelated to model changes and changes in capital market inputs, such as long-term interest rates and key equity index levels, on variable annuity guarantees, in addition to a favorable change of $40$49 million, before income tax, related to changes in our own credit spread.
The foregoing $41aforementioned $9 million ($277 million, net of income tax) favorable change in other risks in embedded derivatives reflects:
Updates toreflects actuarial policyholder behavior assumptions within the valuation model.
An increase in the risk margin adjustment measuring policyholder behavior risks, along with marketassumption updates and interest rate changes, and
Aa combination of other factors, which includesuch as fees being deducted from accounts, and changes in the benefit base, premiums, lapses, withdrawals and deaths.deaths, in addition to changes to cross-effect, basis mismatch, risk margin and fund allocation.
The aforementioned $36 million ($28 million, net of income tax) unfavorable change reflects a $579 million ($457 million, net of income tax) unfavorable change in market risks in embedded derivatives, partially offset by a $543 million ($429 million, net of income tax) favorable change in freestanding derivatives that hedge market risks in embedded derivatives.
The primary changes in market factors affecting the valuation of VA program derivatives are summarized as follows:
•Key equity index levels increased less in the current period compared with the prior period, contributing to an unfavorable change in our embedded derivatives and a favorable change in our freestanding derivatives. For example, the S&P Global Ratings (“S&P”) 500 Index increased 8% in the current period and increased 20% in the prior period.
•Long-term interest rates decreased in the current period versus increased in the prior period, contributing to an unfavorable change in our embedded derivatives and a favorable change in our freestanding derivatives. For example, the 30-year U.S. swap rate decreased 43 basis points in the current period and increased 4 basis points in the prior period.
When equity index levels decrease in isolation, the variable annuity guarantees become more valuable to policyholders, which results in an increase in the undiscounted embedded derivative liability. Discounting this unfavorable change by the risk adjusted rate yieldsresults in a smaller loss than by discounting at the risk-free rate, thus creating a gain from including an adjustment for nonperformance risk.
When the risk-free interest rate decreases in isolation, discounting the embedded derivative liability produces a higher valuation of the liability than if the risk-free interest rate had remained constant. Discounting this unfavorable change by the risk adjusted rate yieldsresults in a smaller loss than by discounting at the risk-free interest rate, thus creating a gain from including an adjustment for nonperformance risk.
When our own credit spread increases in isolation, discounting the embedded derivative liability produces a lower valuation of the liability than if our own credit spread had remained constant. As a result, a gain is created from including an adjustment for nonperformance risk. For each of these primary market drivers, the opposite effect occurs when they movethe driver moves in the opposite direction.
Net Investment Gains (Losses). The unfavorablefavorable change in net investment gains (losses) of $837 million$1.4 billion ($544 million,1.1 billion, net of income tax) primarily reflects athe current period gain on the disposition of MetLife P&C and gains on sales of real estate investments. These favorable changes were partially offset by the current period loss recognized in connection withon the Separationpending disposition of MetLife Poland and Greece and lower gains on sales of fixed maturity securities. These unfavorable changes were partially offset by higher gains on sales of real estate joint ventures and lower foreign currency transaction losses.
Actuarial Assumption Review. The annual review of actuarial assumptionssecurities in the current period included all ofperiod.
Taxes. For the three months ended June 30, 2021, our annuity and life businesses, whereas during the prior period, we performed a review of actuarial assumptions related to reserves and DAC for our annuity and life businesses, with the exception of our U.S. variable annuity business, which was reviewed in the second quarter of 2016 in connection with the Separation.
Results for the current period include a $72 million ($48 million, net ofeffective tax rate on income tax) gain associated with our annual review of actuarial assumptions related to reserves and DAC, of which a $21 million ($14 million, net of income tax) gain was recognized in net derivative gains (losses). Of the $72 million gain, a $131 million ($87 million, net of income tax) gain was associated with DAC, and a loss of $59 million ($39 million, net of income tax) was related to reserves. The $21 million gain recognized in net derivative gains (losses) associated with this annual review of actuarial assumptions was included within the other risks in embedded derivatives caption in the table above.
As a result of our annual review of actuarial assumptions, changes were made to economic, policyholder behavior, biometric and operational assumptions. These are summarized as follows:
Changes in operational assumptions, most notably related to updates to maintenance expense and closed block projections, resulted in a net gain of $149 million ($97 million net of income tax).
Changes in policyholder behavior assumptions resulted in reserve increases, partially offset by favorable DAC, resulting in a net charge of $47 million ($29 million, net of income tax).
Economic assumption updates resulted in reserve increases and DAC releases, resulting in a charge of $19 million ($13 million net of income tax).
Changes to biometric assumptions resulted in an increase in reserves, partially offset by favorable DAC, resulting in a charge of $11 million ($7 million, net of income tax).
The most significant impacts were in the MetLife Holdings Life and Annuity blocks of business.
Results for the prior period include a $116 million ($75 million, net of income tax) loss associated with our annual review of actuarial assumptions related to reserves and DAC, of which an $8 million ($5 million, net of income tax) gain was recognized in net derivative gains (losses) and a $103 million ($67 million, net of income tax) loss was recognized in updates to the closed block projection. Of the $116 million loss, a $5 million ($3 million, net of income tax) gain was related to reserves while a $121 million ($79 million, net of income tax) loss was associated with DAC.
Divested Businesses. Income (loss) before provision for income tax related to the divested businesses, excluding net investment gains (losses) and net derivative gains (losses)was 24%, decreased $151 million ($177 million, net of income tax) to a loss of $320 million ($290 million, net of income tax) in the current period from a loss of $169 million ($113 million, net of income tax) in the prior period. Included in this decline was an increase in total revenues of $223 million, before income tax, and an increase in total expenses of $374 million, before income tax. Divested businesses include activity primarily related to the Separation.
Discontinued Operations. Loss from discontinued operations, net of income tax, increased $517 million for the three months ended September 30, 2017 to a loss of $968 million, net of income tax, from a loss of $451 million, net of income tax, for the comparable 2016 period. Income (loss) from discontinued operations reflects the results of our former Brighthouse Financial segment, which includes a loss of $1.1 billion, net of income tax, from the Separation in the current period. For further information, see Note 3 of the Notes to the Interim Condensed Consolidated Financial Statements.
Taxes. Income tax benefit for the three months ended September 30, 2017 was $392 million, or 78% of income before provision for income tax, compared with income tax expense of $135 million, or 12% of income before provision for income tax, for the three months ended September 30, 2016. Our effective tax rates differdiffered from the U.S. statutory rate of 35%21% primarily due to non-taxable investment income, tax credits for low income housing, andcharges from foreign earnings taxed at lowerdifferent rates than the U.S. statutory rate. Our current period results include a tax-related benefitrate, the completed sale of $554 million related toMetLife P&C and the Separationpending disposition of MetLife Poland and a $13 million net tax-related benefit, including interest, from the finalization of certain tax audits,Greece, partially offset by a net tax chargebenefits related to tax credits and non-taxable investment income. For the three months ended June 30, 2020, our effective tax rate on income (loss) before provision for income tax was 24%, which differed from the U.S. statutory rate of $180 million. This charge was21% primarily due to tax charges from foreign earnings taxed at different rates than the result of the future repatriation of approximately $3.0 billion of cash following the post-Separation review of our capital needs,U.S. statutory rate, partially offset by a tax benefit associated with dividends from our non-U.S. operations. Our prior period results include a tax benefit of $36 millionbenefits related to tax audit settlements.credits and non-taxable investment income.
Operating Earnings.Adjusted Earnings. As more fully described in “— Non-GAAP and Other Financial Disclosures,” we use operatingadjusted earnings, which does not equate to net income (loss) from continuing operations, net of income tax,, as determined in accordance with GAAP, to analyze our performance, evaluate segment performance, and allocate resources. We believe that the presentation of operatingadjusted earnings and operatingother financial measures based on adjusted earnings, available to common shareholders, as we measure it for management purposes, enhances the understanding of our performance by highlighting the results of operations and the underlying profitability drivers of the business. OperatingAdjusted earnings and other financial measures based on operatingadjusted earnings allow analysis of our performance relative to our business plan and facilitate comparisons to industry results. OperatingAdjusted earnings and operatingshould not be viewed as a substitute for net income (loss). Adjusted earnings available to common shareholders and adjusted earnings available to common shareholders on a constant currency basis should not be viewed as substitutes for net income (loss) and net income (loss) available to MetLife, Inc.’s common shareholders, respectively. Operatingshareholders. Adjusted earnings available to common shareholders decreased $187 million,increased $1.3 billion, net of income tax, to $1.2$2.1 billion, net of income tax, for the three months ended SeptemberJune 30, 20172021 from $1.4 billion,$758 million, net of income tax, for the three months ended SeptemberJune 30, 2016.
2020.
NineSix Months Ended SeptemberJune 30, 20172021 Compared with the NineSix Months Ended SeptemberJune 30, 20162020
During the ninesix months ended SeptemberJune 30, 2017,2021, net income (loss) decreased $1.2 billion$776 million from the prior period, primarily driven by an unfavorable changeschange in net derivative gains (losses), results from our divested businesses and net of investment gains (losses),hedge adjustments, partially offset by favorable changes in operatingadjusted earnings and discontinued operations.net investment gains (losses).
Net Derivative Gains (Losses).The variable annuity embedded derivatives and associated freestanding derivative hedges are collectively referred to as “VA program derivatives” in the following table. All other derivatives that are economic hedges of certain invested assets and insurance liabilities are referred to as “non-VA program derivatives” in the following table. The table below presents the impact on net derivative gains (losses) from non-VA program derivatives and VA program derivatives:
| | | | | | | | Six Months
Ended
June 30, |
| | Nine Months Ended September 30, | | 2021 | | 2020 |
| | 2017 | | 2016 | | (In millions) |
| | (In millions) | |
| Non-VA program derivatives | | | | |
| Non-VA program derivatives: | | Non-VA program derivatives: | |
| Interest rate | $ | (20 | ) | | $ | 1,058 |
| Interest rate | $ | (1,025) | | | $ | 4,165 | |
| Foreign currency exchange rate | (273 | ) | | 820 |
| Foreign currency exchange rate | (209) | | | (52) | |
| Credit | 149 |
| | 58 |
| Credit | 62 | | | (105) | |
| Equity | 2 |
| | 8 |
| Equity | (682) | | | (4) | |
| Non-VA embedded derivatives | (100 | ) | | (139 | ) | Non-VA embedded derivatives | 19 | | | (5) | |
| Total non-VA program derivatives | (242 | ) | | 1,805 |
| Total non-VA program derivatives | (1,835) | | | 3,999 | |
| VA program derivatives | | | | |
| VA program derivatives: | | VA program derivatives: | | | |
| Market risks in embedded derivatives | 947 |
| | (1,249 | ) | Market risks in embedded derivatives | 738 | | | (830) | |
| Nonperformance risk adjustment on embedded derivatives | (161 | ) | | 738 |
| Nonperformance risk adjustment on embedded derivatives | (51) | | | 75 | |
| Other risks in embedded derivatives | (265 | ) | | (830 | ) | Other risks in embedded derivatives | (37) | | | (291) | |
| Total embedded derivatives | 521 |
| | (1,341 | ) | Total embedded derivatives | 650 | | | (1,046) | |
| Freestanding derivatives hedging embedded derivatives | (942 | ) | | 974 |
| Freestanding derivatives hedging embedded derivatives | (629) | | | 538 | |
| Total VA program derivatives | (421 | ) | | (367 | ) | Total VA program derivatives | 21 | | | (508) | |
| Net derivative gains (losses) | $ | (663 | ) | | $ | 1,438 |
| Net derivative gains (losses) | $ | (1,814) | | | $ | 3,491 | |
The unfavorable change in net derivative gains (losses) on non-VA program derivatives was $2.0$5.8 billion ($1.34.6 billion, net of income tax). This was primarily due to the Japanese yen, relative to other key currencies, strengthening lesslong-term rates increasing in the current period versus decreasing significantly in the prior period,period. This unfavorably impacting foreign currency forwards, futuresimpacted the estimated fair value of receive fixed interest rate swaps and options that primarilyare part of our macro hedge foreign currency-denominated bonds.program. In addition, mid- and long-term interest rates decreased lesskey equity indexes increased in the current period thanversus decreased in the prior period,period. This unfavorably impacting receive-fixed interestimpacted the estimated fair value of equity options and equity total rate of return swaps swaptions and floors primarily hedging long-duration liability portfolios.that are part of our macro hedge program. Because certain of these hedging strategies are not designated or do not qualify as accounting hedges, the changes in the estimated fair value of these freestanding derivatives are recognized in net derivative gains (losses) without an offsetting gain or loss recognized in earnings for the itemitems being hedged.
The unfavorablefavorable change in net derivative gains (losses) on VA program derivatives was $54$529 million ($35418 million, net of income tax). This was due to an unfavorable change of $899 million ($584 million, net of income tax) in the nonperformance risk adjustment on embedded derivatives, partially offset by(i) a favorable change of $565$401 million ($367 million, net of income tax) in other risks in embedded derivatives and a favorable change of $280 million ($182317 million, net of income tax) in market risks in embedded derivatives, net of the impact of freestanding derivatives hedging those risks. Otherthat hedge market risks relate primarily to the impactin embedded derivatives, and (ii) a favorable change of $254 million, ($201 million, net of income tax) in other risks in embedded derivatives, (primarily policyholder behavior and other non-market risks that generally cannot be hedged.
The foregoing $565hedged), partially offset by an unfavorable change of $126 million ($367100 million, net of income tax) favorable change in other risksthe nonperformance risk adjustment included in embedded derivatives reflects:
Updates to actuarial policyholder behavior assumptions within the valuation model.
An increase in the risk margin adjustment measuring policyholder behavior risks, along with market and interest rate changes, andof embedded derivatives.
The partially offsetting impact of a combination of other factors, which include fees being deducted from accounts and changes in the benefit base, premiums, lapses, withdrawals and deaths.
The foregoing $280aforementioned $401 million ($182317 million, net of income tax) favorable change reflects a $2.2$1.6 billion ($1.41.2 billion, net of income tax) favorable change in market risks in embedded derivatives, partially offset by a $1.9$1.2 billion ($1.2 billion,922 million, net of income tax) unfavorable change in freestanding derivatives hedgingthat hedge market risks in embedded derivatives.
The primary changes in market factors affecting the valuation of VA program derivatives are summarized as follows:
Long-term interest rates decreased less•Key equity index levels increased in the current period thanversus decreased in the prior period, contributing to a favorable change in our embedded derivatives and an unfavorable change in our freestanding derivativesderivatives. For example, the S&P 500 Index increased 14% in the current period and decreased 4% in the prior period.
•Long-term interest rates increased in the current period versus decreased significantly in the prior period, contributing to a favorable change in our embedded derivatives and an unfavorable change in our freestanding derivatives. For example, the 30-year U.S. swap rate decreased 6increased 37 basis points in the current period and decreased 84117 basis points in the prior period.
Key weighted average equity index levels increased more in the current period than in the prior period, contributing to an unfavorable change in our freestanding derivatives and aThe aforementioned $254 million ($201 million, net of income tax) favorable change in ourother risks in embedded derivatives.
Changes in foreign currency exchange rates contributed to an unfavorable change in our freestanding derivatives reflects actuarial assumption updates and a favorable change in our embedded derivatives related to the assumed reinsurancecombination of certain variable annuity productsfactors, such as fees deducted from our former operating joint venture in Japan. For example, the Japanese yen strengthened against the U.S. dollar by 3%accounts, changes in the current periodbenefit base, premiums, lapses, withdrawals and strengthened by 16%deaths, in the prior period.addition to changes to cross-effect, basis mismatch, risk margin and fund allocation.
The aforementioned $899$126 million ($584100 million, net of income tax) unfavorable change in the nonperformance risk adjustment on embedded derivatives resulted from an unfavorable change of $720$106 million, before income tax, as a result ofrelated to model changes and changes in capital market inputs, such as long-term interest rates and key equity index levels, on variable annuity guarantees, in addition to an unfavorable change of $179$20 million, before income tax, related to changes in our own credit spread.
Net Investment Gains (Losses). The unfavorablefavorable change in net investment gains (losses) of $1.0$1.8 billion ($674 million,1.4 billion, net of income tax) primarily reflects a(i) the current period loss recognized in connection withgain on the Separation, lower foreign currency transaction gains and lower gains on salesdisposition of fixed maturity securities. In addition, the priorMetLife P&C, (ii) current period includes a gain from the U.S. Retail Advisor Force Divestiture. These unfavorable changes were partially offset by higher gains on sales of real estate joint ventures andinvestments, (iii) a current period release compared to a prior yearperiod provision for mortgage loan credit loss, and related charge-off on an impaired mortgage loan acquired through an acquisition(iv) mark-to-market gains in 2010.
Actuarial Assumption Review. Results for the current period include a $72 million ($48 million, net of income tax) gain associated with our annual review of actuarial assumptions relatedcompared to reserves and DAC, of which a $21 million ($14 million, net of income tax) gain was recognized in net derivative gains (losses). Of the $72 million gain, a $131 million ($87 million, net of income tax) gain was associated with DAC, and a loss of $59 million ($39 million, net of income tax) was related to reserves. The $21 million gain recognized in net derivative gains (losses) associated with this review of actuarial assumptions was included within the other risks in embedded derivatives captionmark-to-market losses in the table above.
As a result of our annual review of actuarial assumptions,prior period on equity securities, which are measured at estimated fair value through net income (loss). These favorable changes were made to economic, policyholder behavior, biometric and operational assumptions. These are summarized as follows:
Changes in operational assumptions, most notably related to updates to maintenance expense and closed block projections, resulted in a net gain of $149 million ($97 million net of income tax).
Changes in policyholder behavior assumptions resulted in reserve increases, partially offset by favorable DAC, resulting in a net charge of $47 million ($29 million, net of income tax).
Economic assumption updates resulted in reserve increases and DAC releases, resulting in a charge of $19 million ($13 million net of income tax).
Changes to biometric assumptions resulted in an increase in reserves, partially offset by favorable DAC, resulting in a charge of $11 million ($7 million, net of income tax).
The most significant impacts werelosses in the MetLife Holdings Life and Annuity blocks of business.
Results forcurrent period compared to gains in the prior period include a $648 million ($421 million, neton sales of income tax)fixed maturity securities and the current period loss associated with our annual reviewon the pending disposition of actuarial assumptions related to reservesMetLife Poland and DAC, of which a $709 million ($461 million, net of income tax) loss was recognized in net derivative gains (losses) and a $103 million ($67 million, net of income tax) loss was recognized in updates to the closed block projection. Of the $648 million loss, a $729 million ($474 million, net of income tax) loss was related to reserves while an $81 million ($53 million, net of income tax) gain was associated with DAC.Greece.
Divested Businesses and Lag Elimination.Businesses.Income (loss) before provision for income tax related to the divested businesses, and lag elimination, excluding net investment gains (losses) and net derivative gains (losses), decreased $658increased $93 million ($40975 million, net of income tax) to a loss of $814$84 million ($51469 million, net of income tax) in the current period from a loss of $156$9 million ($1056 million, net of income tax) in the prior period. Included in this declineincrease was a decreasean increase in total revenues of $511$821 million, before income tax, and an increase in total expenses of $147$728 million, before income tax. Divested businesses primarily include activity primarily related to the Separation. In addition, divested businessesdisposition of MetLife P&C.
Taxes. For the six months ended June 30, 2021, our effective tax rate on income (loss) before provision for income tax was equal to the prior period also includestatutory rate of 21% as tax charges from foreign earnings taxed at different rates than the financial impactU.S. statutory rate, the completed sale of convertingMetLife P&C, and the pending disposition of MetLife Poland and Greece, were offset by tax benefits related to tax credits, non-taxable investment income and the corporate tax deduction for stock compensation. For the six months ended June 30, 2020, our Japan operationseffective tax rate on income (loss) before provision for income tax was 22%, which differed from the U.S. statutory rate of 21% primarily due to calendar year-end reporting without retrospective applicationtax charges from foreign earnings taxed at different rates than the U.S. statutory rate, partially offset by tax benefits related to non-taxable investment income, tax credits and the finalization of this changebankruptcy proceedings for a leveraged lease investment.
Adjusted Earnings. Adjusted earnings available to prior years.
Discontinued Operations.Loss from discontinued operations,common shareholders increased $1.8 billion, net of income tax, decreased $390 million for the nine months ended September 30, 2017 to a loss of $989 million, net of income tax, from a loss of $1.4$4.1 billion, net of income tax, for the comparable 2016 period. Income (loss) from discontinued operations reflects the results of our former Brighthouse Financial segment, which includes a loss of $1.3 billion, net of income tax, from the Separation in the current period. For further information, see Note3 of the Notes to the Interim Condensed Consolidated Financial Statements.
Taxes. Income tax benefit for the ninesix months ended SeptemberJune 30, 2017 was $148 million, or 6% of income before provision for income tax, compared with income tax expense of $1.3 billion, or 23% of income before provision for income tax, for the nine months ended September 30, 2016. Our effective tax rates differ2021 from the U.S. statutory rate of 35% due to non-taxable investment income, tax credits for low income housing, and foreign earnings taxed at lower rates than the U.S. statutory rate. Our current period results include a tax-related benefit of $554 million related to the Separation and a $40 million net tax-related benefit, including interest, from the finalization of certain tax audits, partially offset by a net tax charge of $180 million. This charge was the result of the future repatriation of approximately $3.0 billion of cash following the post-Separation review of our capital needs, partially offset by a tax benefit associated with dividends from our non-U.S. operations. Our current period results also include a tax benefit of $9 million related to the settlement of an audit in Argentina. Our prior period results include a tax benefit of $110 million in Japan related to a change in tax rate, a tax charge of $26 million related to the repatriation of earnings from Japan and a tax charge of $19 million in Chile, related to a change in tax rate. In addition, prior period results include a one-time tax benefit of $36 million for tax audit settlements.
Operating Earnings.Operating earnings available to common shareholders increased $612 million, net of income tax, to $3.6$2.2 billion, net of income tax, for the ninesix months ended SeptemberJune 30, 2017 from $3.0 billion, net of income tax, for the nine months ended September 30, 2016.
2020.
Reconciliation of net income (loss) to operatingadjusted earnings available to common shareholders and premiums, fees and other revenues to adjusted premiums, fees and other revenues
Three Months Ended SeptemberJune 30, 20172021
| | | | | | | | | | | | | | | | | | | | | | | | | | | | | | | | | | | | | | | | | | | | |
| | U.S. | | Asia | | Latin America | | EMEA | | MetLife Holdings | | Corporate & Other | | Total |
| | (In millions) |
| Net income (loss) available to MetLife, Inc.'s common shareholders | $ | 1,169 | | | $ | 711 | | | $ | 26 | | | $ | (69) | | | $ | 492 | | | $ | 1,037 | | | $ | 3,366 | |
| Add: Preferred stock dividends | — | | | — | | | — | | | — | | | — | | | 35 | | | 35 | |
| Add: Preferred stock redemption premium | — | | | — | | | — | | | — | | | — | | | 6 | | | 6 | |
| Add: Net income (loss) attributable to noncontrolling interests | — | | | 1 | | | 1 | | | — | | | — | | | 3 | | | 5 | |
| Net income (loss) | 1,169 | | | 712 | | | 27 | | | (69) | | | 492 | | | 1,081 | | | 3,412 | |
| Less: adjustments from net income (loss) to adjusted earnings available to common shareholders: | | | | | | | | | | | | | |
| Revenues: |
| Net investment gains (losses) | 403 | | | 66 | | | (4) | | | (204) | | | (72) | | | 1,416 | | | 1,605 | |
| Net derivative gains (losses) | 32 | | | 261 | | | (80) | | | 21 | | | 135 | | | 52 | | | 421 | |
| Premiums | — | | | — | | | — | | | — | | | — | | | — | | | — | |
| Universal life and investment-type product policy fees | — | | | 13 | | | — | | | 3 | | | 20 | | | — | | | 36 | |
| Net investment income | (85) | | | (8) | | | (8) | | | 333 | | | (69) | | | — | | | 163 | |
| Other revenues | — | | | — | | | — | | | — | | | — | | | 60 | | | 60 | |
| Expenses: |
| Policyholder benefits and claims and policyholder dividends | (12) | | | (15) | | | 21 | | | 11 | | | (81) | | | — | | | (76) | |
| Interest credited to policyholder account balances | 1 | | | (33) | | | (14) | | | (319) | | | — | | | — | | | (365) | |
| Capitalization of DAC | — | | | — | | | — | | | — | | | — | | | — | | | — | |
| Amortization of DAC and VOBA | — | | | (9) | | | — | | | 1 | | | 11 | | | — | | | 3 | |
| Amortization of negative VOBA | — | | | — | | | — | | | — | | | — | | | — | | | — | |
| Interest expense on debt | — | | | — | | | — | | | — | | | — | | | — | | | — | |
| Other expenses | — | | | — | | | (4) | | | (2) | | | — | | | (62) | | | (68) | |
| Goodwill impairment | — | | | — | | | — | | | — | | | — | | | — | | | — | |
| Provision for income tax (expense) benefit | (72) | | | (83) | | | 19 | | | (7) | | | 12 | | | (360) | | | (491) | |
| Adjusted earnings | $ | 902 | | | $ | 520 | | | $ | 97 | | | $ | 94 | | | $ | 536 | | | (25) | | | 2,124 | |
| Less: Preferred stock dividends | | | | | | | | | | | 35 | | | 35 | |
| Adjusted earnings available to common shareholders | | | | | | | | | | | $ | (60) | | | $ | 2,089 | |
| | | | | | | | | | | | | | |
| Premiums, fees and other revenues | $ | 6,136 | | | $ | 2,050 | | | $ | 934 | | | $ | 747 | | | $ | 1,201 | | | $ | 150 | | | $ | 11,218 | |
| Less: adjustments to premiums, fees and other revenues | — | | | 13 | | | — | | | 3 | | | 20 | | | 60 | | | 96 | |
| Adjusted premiums, fees and other revenues | $ | 6,136 | | | $ | 2,037 | | | $ | 934 | | | $ | 744 | | | $ | 1,181 | | | $ | 90 | | | $ | 11,122 | |
|
| | | | | | | | | | | | | | | | | | | | | | | | | | | |
| | U.S. | | Asia | | Latin America | | EMEA | | MetLife Holdings | | Corporate& Other | | Total |
| | (In millions) |
Net income (loss)
| $ | 572 |
| | $ | 243 |
| | $ | 224 |
| | $ | 62 |
| | $ | 230 |
| | $ | (1,406 | ) | | $ | (75 | ) |
Less: Income (loss) from discontinued operations, net of income tax
| — |
| | — |
| | — |
| | — |
| | — |
| | (968 | ) | | (968 | ) |
Income (loss) from continuing operations, net of income tax
| $ | 572 |
| | $ | 243 |
| | $ | 224 |
| | $ | 62 |
| | $ | 230 |
| | $ | (438 | ) | | $ | 893 |
|
| Less: Net investment gains (losses) | 96 |
| | (37 | ) | | 20 |
| | (12 | ) | | 23 |
| | (696 | ) | | (606 | ) |
| Less: Net derivative gains (losses) | (14 | ) | | (58 | ) | | 46 |
| | 3 |
| | (165 | ) | | (2 | ) | | (190 | ) |
| Less: Other adjustments to net income (1) | (43 | ) | | (12 | ) | | 25 |
| | — |
| | (136 | ) | | (328 | ) | | (494 | ) |
| Less: Provision for income tax (expense) benefit | (13 | ) | | 36 |
| | (30 | ) | | — |
| | 98 |
| | 918 |
| | 1,009 |
|
| Operating earnings | $ | 546 |
| | $ | 314 |
| | $ | 163 |
| | $ | 71 |
| | $ | 410 |
| | (330 | ) | | 1,174 |
|
| Less: Preferred stock dividends | | | | | | | | | | | 6 |
| | 6 |
|
| Operating earnings available to common shareholders | | | | | | | | | | | $ | (336 | ) | | $ | 1,168 |
|
Three Months Ended SeptemberJune 30, 20162020
|
| | | | | | | | | | | | | | | | | | | | | | | | | | | |
| | U.S. | | Asia | | Latin America | | EMEA | | MetLife Holdings | | Corporate& Other | | Total |
| | (In millions) |
Net income (loss)
| $ | 520 |
| | $ | 361 |
| | $ | 148 |
| | $ | 115 |
| | $ | (60 | ) | | $ | (511 | ) | | $ | 573 |
|
Less: Income (loss) from discontinued operations, net of income tax
| — |
| | — |
| | — |
| | — |
| | — |
| | (451 | ) | | (451 | ) |
Income (loss) from continuing operations, net of income tax
| $ | 520 |
| | $ | 361 |
| | $ | 148 |
| | $ | 115 |
| | $ | (60 | ) | | $ | (60 | ) | | $ | 1,024 |
|
| Less: Net investment gains (losses) | 44 |
| | 66 |
| | 12 |
| | 24 |
| | 5 |
| | 80 |
| | 231 |
|
| Less: Net derivative gains (losses) | (20 | ) | | (68 | ) | | (9 | ) | | 25 |
| | (469 | ) | | (2 | ) | | (543 | ) |
| Less: Other adjustments to net income (1) | (73 | ) | | 10 |
| | 17 |
| | 26 |
| | (36 | ) | | (161 | ) | | (217 | ) |
| Less: Provision for income tax (expense) benefit | 17 |
| | 29 |
| | (5 | ) | | (34 | ) | | 174 |
| | 11 |
| | 192 |
|
| Operating earnings | $ | 552 |
| | $ | 324 |
| | $ | 133 |
| | $ | 74 |
| | $ | 266 |
| | 12 |
| | 1,361 |
|
| Less: Preferred stock dividends | | | | | | | | | | | 6 |
| | 6 |
|
| Operating earnings available to common shareholders | | | | | | | | | | | $ | 6 |
| | $ | 1,355 |
|
| | | | | | | | | | | | | | | | | | | | | | | | | | | | | | | | | | | | | | | | | | | | |
| | U.S. | | Asia | | Latin America | | EMEA | | MetLife Holdings | | Corporate & Other | | Total |
| | (In millions) |
| Net income (loss) available to MetLife, Inc.'s common shareholders | $ | 498 | | | $ | 139 | | | $ | 124 | | | $ | 89 | | | $ | (483) | | | $ | (299) | | | $ | 68 | |
| Add: Preferred stock dividends | — | | | — | | | — | | | — | | | — | | | 77 | | | 77 | |
| Add: Preferred stock redemption premium | — | | | — | | | — | | | — | | | — | | | — | | | — | |
| Add: Net income (loss) attributable to noncontrolling interests | — | | | 1 | | | 2 | | | 2 | | | — | | | — | | | 5 | |
| Net income (loss) | 498 | | | 140 | | | 126 | | | 91 | | | (483) | | | (222) | | | 150 | |
| Less: adjustments from net income (loss) to adjusted earnings available to common shareholders: | | | | | | | | | | | | | |
| Revenues: |
| Net investment gains (losses) | 10 | | | 59 | | | 39 | | | 15 | | | 16 | | | 92 | | | 231 | |
| Net derivative gains (losses) | 49 | | | (173) | | | 91 | | | (60) | | | (526) | | | (91) | | | (710) | |
| Premiums | — | | | 20 | | | — | | | — | | | — | | | — | | | 20 | |
| Universal life and investment-type product policy fees | — | | | 7 | | | — | | | 3 | | | 21 | | | — | | | 31 | |
| Net investment income | (81) | | | 116 | | | 38 | | | 636 | | | (68) | | | 2 | | | 643 | |
| Other revenues | — | | | — | | | — | | | — | | | — | | | 39 | | | 39 | |
| Expenses: |
| Policyholder benefits and claims and policyholder dividends | (12) | | | (38) | | | (104) | | | 5 | | | (96) | | | 1 | | | (244) | |
| Interest credited to policyholder account balances | 3 | | | (143) | | | (46) | | | (615) | | | — | | | — | | | (801) | |
| Capitalization of DAC | — | | | 2 | | | — | | | — | | | — | | | — | | | 2 | |
| Amortization of DAC and VOBA | — | | | (9) | | | — | | | — | | | 17 | | | — | | | 8 | |
| Amortization of negative VOBA | — | | | — | | | — | | | — | | | — | | | — | | | — | |
| Interest expense on debt | — | | | — | | | — | | | — | | | — | | | — | | | — | |
| Other expenses | — | | | (10) | | | 4 | | | — | | | — | | | (49) | | | (55) | |
| Goodwill impairment | — | | | — | | | — | | | — | | | — | | | — | | | — | |
| Provision for income tax (expense) benefit | 6 | | | 53 | | | (28) | | | (9) | | | 133 | | | (4) | | | 151 | |
| Adjusted earnings | $ | 523 | | | $ | 256 | | | $ | 132 | | | $ | 116 | | | $ | 20 | | | (212) | | | 835 | |
| Less: Preferred stock dividends | | | | | | | | | | | 77 | | | 77 | |
| Adjusted earnings available to common shareholders | | | | | | | | | | | $ | (289) | | | $ | 758 | |
| | | | | | | | | | | | | | |
| Adjusted earnings available to common shareholders on a constant currency basis (1) | $ | 523 | | | $ | 272 | | | $ | 157 | | | $ | 122 | | | $ | 20 | | | $ | (289) | | | $ | 805 | |
| | | | | | | | | | | | | | |
| Premiums, fees and other revenues | $ | 5,692 | | | $ | 2,045 | | | $ | 737 | | | $ | 663 | | | $ | 1,229 | | | $ | 125 | | | $ | 10,491 | |
| Less: adjustments to premiums, fees and other revenues | — | | | 27 | | | — | | | 3 | | | 21 | | | 39 | | | 90 | |
| Adjusted premiums, fees and other revenues | $ | 5,692 | | | $ | 2,018 | | | $ | 737 | | | $ | 660 | | | $ | 1,208 | | | $ | 86 | | | $ | 10,401 | |
| | | | | | | | | | | | | | |
| Adjusted premiums, fees and other revenues on a constant currency basis (1) | $ | 5,692 | | | $ | 2,040 | | | $ | 834 | | | $ | 690 | | | $ | 1,208 | | | $ | 86 | | | $ | 10,550 | |
__________________
| |
(1) | See definitions of operating revenues and operating expenses under “— Non-GAAP and Other Financial Disclosures” for the components of such adjustments. |
(1)Amounts for U.S., MetLife Holdings and Corporate & Other are shown on a reported basis, as constant currency impact is not significant.
NineSix Months Ended SeptemberJune 30, 20172021
| | | | | | | | | | | | | | | | | | | | | | | | | | | | | | | | | | | | | | | | | | | | |
| | U.S. | | Asia | | Latin America | | EMEA | | MetLife Holdings | | Corporate & Other | | Total |
| | (In millions) |
| Net income (loss) available to MetLife, Inc.'s common shareholders | $ | 1,927 | | | $ | 561 | | | $ | 83 | | | $ | (40) | | | $ | 245 | | | $ | 880 | | | $ | 3,656 | |
| Add: Preferred stock dividends | — | | | — | | | — | | | — | | | — | | | 103 | | | 103 | |
| Add: Preferred stock redemption premium | — | | | — | | | — | | | — | | | — | | | 6 | | | 6 | |
| Add: Net income (loss) attributable to noncontrolling interests | — | | | 1 | | | 3 | | | 1 | | | — | | | 5 | | | 10 | |
| Net income (loss) | 1,927 | | | 562 | | | 86 | | | (39) | | | 245 | | | 994 | | | 3,775 | |
| Less: adjustments from net income (loss) to adjusted earnings available to common shareholders: | | | | | | | | | | | | | |
| Revenues: |
| Net investment gains (losses) | 358 | | | (60) | | | 4 | | | (187) | | | 46 | | | 1,578 | | | 1,739 | |
| Net derivative gains (losses) | 41 | | | (703) | | | (113) | | | 15 | | | (961) | | | (93) | | | (1,814) | |
| Premiums | 865 | | | — | | | — | | | — | | | — | | | — | | | 865 | |
| Universal life and investment-type product policy fees | — | | | 13 | | | — | | | 8 | | | 40 | | | — | | | 61 | |
| Net investment income | (147) | | | 61 | | | (18) | | | 418 | | | (142) | | | 11 | | | 183 | |
| Other revenues | 11 | | | — | | | — | | | — | | | — | | | 95 | | | 106 | |
| Expenses: |
| Policyholder benefits and claims and policyholder dividends | (595) | | | (38) | | | 91 | | | (49) | | | (149) | | | — | | | (740) | |
| Interest credited to policyholder account balances | 1 | | | (139) | | | (25) | | | (412) | | | — | | | — | | | (575) | |
| Capitalization of DAC | 89 | | | — | | | — | | | — | | | — | | | — | | | 89 | |
| Amortization of DAC and VOBA | (98) | | | 3 | | | — | | | 1 | | | 15 | | | — | | | (79) | |
| Amortization of negative VOBA | — | | | — | | | — | | | — | | | — | | | — | | | — | |
| Interest expense on debt | — | | | — | | | — | | | — | | | — | | | (1) | | | (1) | |
| Other expenses | (222) | | | 1 | | | 2 | | | (4) | | | — | | | (107) | | | (330) | |
| Goodwill impairment | — | | | — | | | — | | | — | | | — | | | — | | | — | |
| Provision for income tax (expense) benefit | (62) | | | 281 | | | 8 | | | 6 | | | 242 | | | (361) | | | 114 | |
| Adjusted earnings | $ | 1,686 | | | $ | 1,143 | | | $ | 137 | | | $ | 165 | | | $ | 1,154 | | | (128) | | | 4,157 | |
| Less: Preferred stock dividends | | | | | | | | | | | 103 | | | 103 | |
| Adjusted earnings available to common shareholders | | | | | | | | | | | $ | (231) | | | $ | 4,054 | |
| | | | | | | | | | | | | | |
| Premiums, fees and other revenues | $ | 13,404 | | | $ | 4,211 | | | $ | 1,809 | | | $ | 1,430 | | | $ | 2,384 | | | $ | 329 | | | $ | 23,567 | |
| Less: adjustments to premiums, fees and other revenues | 876 | | | 13 | | | — | | | 8 | | | 40 | | | 95 | | | 1,032 | |
| Adjusted premiums, fees and other revenues | $ | 12,528 | | | $ | 4,198 | | | $ | 1,809 | | | $ | 1,422 | | | $ | 2,344 | | | $ | 234 | | | $ | 22,535 | |
|
| | | | | | | | | | | | | | | | | | | | | | | | | | | |
| | U.S. | | Asia | | Latin America | | EMEA | | MetLife Holdings | | Corporate& Other | | Total |
| | (In millions) |
Net income (loss)
| $ | 1,467 |
| | $ | 927 |
| | $ | 552 |
| | $ | 210 |
| | $ | 597 |
| | $ | (2,112 | ) | | $ | 1,641 |
|
Less: Income (loss) from discontinued operations, net of income tax
| — |
| | — |
| | — |
| | — |
| | — |
| | (989 | ) | | (989 | ) |
Income (loss) from continuing operations, net of income tax
| $ | 1,467 |
| | $ | 927 |
| | $ | 552 |
| | $ | 210 |
| | $ | 597 |
| | $ | (1,123 | ) | | $ | 2,630 |
|
| Less: Net investment gains (losses) | 70 |
| | 61 |
| | 34 |
| | (8 | ) | | 30 |
| | (626 | ) | | (439 | ) |
| Less: Net derivative gains (losses) | (34 | ) | | (9 | ) | | 173 |
| | 21 |
| | (449 | ) | | (365 | ) | | (663 | ) |
| Less: Other adjustments to net income (1) | (161 | ) | | (28 | ) | | (65 | ) | | (7 | ) | | (248 | ) | | (817 | ) | | (1,326 | ) |
| Less: Provision for income tax (expense) benefit | 44 |
| | (16 | ) | | (50 | ) | | (14 | ) | | 234 |
| | 1,207 |
| | 1,405 |
|
| Operating earnings | $ | 1,548 |
| | $ | 919 |
| | $ | 460 |
| | $ | 218 |
| | $ | 1,030 |
| | (522 | ) | | 3,653 |
|
| Less: Preferred stock dividends | | | | | | | | | | | 58 |
| | 58 |
|
| Operating earnings available to common shareholders | | | | | | | | | | | $ | (580 | ) | | $ | 3,595 |
|
Nine Months Ended September 30, 2016
|
| | | | | | | | | | | | | | | | | | | | | | | | | | | |
| | U.S. | | Asia | | Latin America | | EMEA | | MetLife Holdings | | Corporate& Other | | Total |
| | (In millions) |
Net income (loss)
| $ | 1,615 |
| | $ | 1,995 |
| | $ | 377 |
| | $ | 285 |
| | $ | 587 |
| | $ | (1,969 | ) | | $ | 2,890 |
|
Less: Income (loss) from discontinued operations, net of income tax
| — |
| | — |
| | — |
| | — |
| | — |
| | (1,379 | ) | | (1,379 | ) |
Income (loss) from continuing operations, net of income tax
| $ | 1,615 |
| | $ | 1,995 |
| | $ | 377 |
| | $ | 285 |
| | $ | 587 |
| | $ | (590 | ) | | $ | 4,269 |
|
| Less: Net investment gains (losses) | 13 |
| | 429 |
| | 8 |
| | 48 |
| | 142 |
| | (42 | ) | | 598 |
|
| Less: Net derivative gains (losses) | 512 |
| | 949 |
| | 47 |
| | 27 |
| | (32 | ) | | (65 | ) | | 1,438 |
|
| Less: Other adjustments to net income (1) | (204 | ) | | 47 |
| | (88 | ) | | 92 |
| | 24 |
| | (241 | ) | | (370 | ) |
| Less: Provision for income tax (expense) benefit | (107 | ) | | (318 | ) | | (11 | ) | | (83 | ) | | (47 | ) | | 128 |
| | (438 | ) |
| Operating earnings | $ | 1,401 |
| | $ | 888 |
| | $ | 421 |
| | $ | 201 |
| | $ | 500 |
| | (370 | ) | | 3,041 |
|
| Less: Preferred stock dividends | | | | | | | | | | | 58 |
| | 58 |
|
| Operating earnings available to common shareholders | | | | | | | | | | | $ | (428 | ) | | $ | 2,983 |
|
__________________
| |
(1) | See definitions of operating revenues and operating expenses under “— Non-GAAP and Other Financial Disclosures” for the components of such adjustments. |
Six Months Ended June 30, 2020
Reconciliation | | | | | | | | | | | | | | | | | | | | | | | | | | | | | | | | | | | | | | | | | | | | |
| | U.S. | | Asia | | Latin America | | EMEA | | MetLife Holdings | | Corporate & Other | | Total |
| | (In millions) |
| Net income (loss) available to MetLife, Inc.'s common shareholders | $ | 1,551 | | | $ | 1,006 | | | $ | (89) | | | $ | 301 | | | $ | 2,241 | | | $ | (576) | | | $ | 4,434 | |
| Add: Preferred stock dividends | — | | | — | | | — | | | — | | | — | | | 109 | | | 109 | |
| Add: Preferred stock redemption premium | — | | | — | | | — | | | — | | | — | | | — | | | — | |
| Add: Net income (loss) attributable to noncontrolling interests | — | | | 1 | | | 3 | | | 3 | | | — | | | 1 | | | 8 | |
| Net income (loss) | 1,551 | | | 1,007 | | | (86) | | | 304 | | | 2,241 | | | (466) | | | 4,551 | |
| Less: adjustments from net income (loss) to adjusted earnings available to common shareholders: | | | | | | | | | | | | | |
| Revenues: |
| Net investment gains (losses) | (23) | | | 157 | | | 28 | | | 9 | | | (96) | | | (132) | | | (57) | |
| Net derivative gains (losses) | 488 | | | 600 | | | (269) | | | 11 | | | 2,680 | | | (19) | | | 3,491 | |
| Premiums | — | | | 52 | | | — | | | — | | | — | | | — | | | 52 | |
| Universal life and investment-type product policy fees | — | | | 28 | | | (3) | | | 9 | | | 43 | | | — | | | 77 | |
| Net investment income | (134) | | | (125) | | | (15) | | | (229) | | | (116) | | | 2 | | | (617) | |
| Other revenues | — | | | — | | | — | | | — | | | — | | | 81 | | | 81 | |
| Expenses: |
| Policyholder benefits and claims and policyholder dividends | (24) | | | (72) | | | (141) | | | 95 | | | (53) | | | — | | | (195) | |
| Interest credited to policyholder account balances | 7 | | | 92 | | | (6) | | | 244 | | | — | | | — | | | 337 | |
| Capitalization of DAC | — | | | 5 | | | — | | | — | | | — | | | — | | | 5 | |
| Amortization of DAC and VOBA | — | | | (43) | | | — | | | (1) | | | 3 | | | — | | | (41) | |
| Amortization of negative VOBA | — | | | — | | | — | | | — | | | — | | | — | | | — | |
| Interest expense on debt | — | | | — | | | — | | | — | | | — | | | — | | | — | |
| Other expenses | — | | | (24) | | | 4 | | | (2) | | | — | | | (99) | | | (121) | |
| Goodwill impairment | — | | | — | | | — | | | — | | | — | | | — | | | — | |
| Provision for income tax (expense) benefit | (66) | | | (269) | | | 89 | | | (26) | | | (517) | | | 12 | | | (777) | |
| Adjusted earnings | $ | 1,303 | | | $ | 606 | | | $ | 227 | | | $ | 194 | | | $ | 297 | | | (311) | | | 2,316 | |
| Less: Preferred stock dividends | | | | | | | | | | | 109 | | | 109 | |
| Adjusted earnings available to common shareholders | | | | | | | | | | | $ | (420) | | | $ | 2,207 | |
| | | | | | | | | | | | | | |
| Adjusted earnings available to common shareholders on a constant currency basis (1) | $ | 1,303 | | | $ | 639 | | | $ | 250 | | | $ | 202 | | | $ | 297 | | | $ | (420) | | | $ | 2,271 | |
| | | | | | | | | | | | | | |
| Premiums, fees and other revenues | $ | 11,881 | | | $ | 4,178 | | | $ | 1,655 | | | $ | 1,366 | | | $ | 2,484 | | | $ | 263 | | | $ | 21,827 | |
| Less: adjustments to premiums, fees and other revenues | — | | | 80 | | | (3) | | | 9 | | | 43 | | | 81 | | | 210 | |
| Adjusted premiums, fees and other revenues | $ | 11,881 | | | $ | 4,098 | | | $ | 1,658 | | | $ | 1,357 | | | $ | 2,441 | | | $ | 182 | | | $ | 21,617 | |
| | | | | | | | | | | | | | |
| Adjusted premiums, fees and other revenues on a constant currency basis (1) | $ | 11,881 | | | $ | 4,201 | | | $ | 1,762 | | | $ | 1,405 | | | $ | 2,441 | | | $ | 182 | | | $ | 21,872 | |
__________________
(1)Amounts for U.S., MetLife Holdings and Corporate & Other are shown on a reported basis, as constant currency impact is not significant.
Consolidated Results — Adjusted Earnings
Business Overview. Adjusted premiums, fees and other revenues for the three months ended June 30, 2021 increased $721 million, or 7%, compared to operatingthe prior period. Adjusted premiums, fees and other revenues, net of foreign currency fluctuations, increased $572 million, or 5%, compared to the prior period, primarily due to growth in our U.S. segment, despite a decrease of $835 million attributable to the disposition of MetLife P&C. The increase in our U.S. segment was due to growth in our Group Benefits business, including the acquisition of Versant Health, as well as higher premiums in our Retirement and expensesIncome Solutions (“RIS”) business. In our Asia segment, adjusted premiums, fees and other revenues were essentially flat compared to operating expensesthe prior period. Higher sales and persistency in Mexico coupled with higher annuitizations in Chile due to improved market conditions, resulted in an increase in adjusted premiums, fees and other revenues in our Latin America segment. An increase in adjusted premiums, fees and other revenues in our EMEA segment was primarily due to growth in our corporate solutions, accident & health and life businesses, as well as certain actuarial refinements in Italy, partially offset by the disposition of MetLife Russia. In our MetLife Holdings segment, we anticipate an average decline in adjusted premiums, fees and other revenues of approximately 5% to 7% per year from expected business run-off.
Three Months Ended SeptemberJune 30, 2017
|
| | | | | | | | | | | | | | | | | | | | | | | | | | | |
| | U.S. | | Asia | | Latin America | | EMEA | | MetLife Holdings | | Corporate& Other | | Total |
| | (In millions) |
| Total revenues | $ | 9,072 |
| | $ | 2,920 |
| | $ | 1,331 |
| | $ | 819 |
| | $ | 2,609 |
| | $ | (647 | ) | | $ | 16,104 |
|
| Less: Net investment gains (losses) | 96 |
| | (37 | ) | | 20 |
| | (12 | ) | | 23 |
| | (696 | ) | | (606 | ) |
| Less: Net derivative gains (losses) | (14 | ) | | (58 | ) | | 46 |
| | 3 |
| | (165 | ) | | (2 | ) | | (190 | ) |
| Less: Adjustments related to net investment gains (losses) and net derivative gains (losses) | — |
| | 3 |
| | — |
| | 1 |
| | — |
| | — |
| | 4 |
|
| Less: Other adjustments to revenues (1) | (43 | ) | | 85 |
| | 29 |
| | 116 |
| | (14 | ) | | (53 | ) | | 120 |
|
| Total operating revenues | $ | 9,033 |
| | $ | 2,927 |
| | $ | 1,236 |
| | $ | 711 |
| | $ | 2,765 |
| | $ | 104 |
| | $ | 16,776 |
|
| Total expenses | $ | 8,207 |
| | $ | 2,557 |
| | $ | 1,026 |
| | $ | 736 |
| | $ | 2,278 |
| | $ | 799 |
| | $ | 15,603 |
|
| Less: Adjustments related to net investment gains (losses) and net derivative gains (losses) | — |
| | 1 |
| | — |
| | 1 |
| | (6 | ) | | 2 |
| | (2 | ) |
| Less: Other adjustments to expenses (1) | — |
| | 99 |
| | 4 |
| | 116 |
| | 128 |
| | 273 |
| | 620 |
|
| Total operating expenses | $ | 8,207 |
| | $ | 2,457 |
| | $ | 1,022 |
| | $ | 619 |
| | $ | 2,156 |
| | $ | 524 |
| | $ | 14,985 |
|
Three Months Ended September 30, 2016
|
| | | | | | | | | | | | | | | | | | | | | | | | | | | |
| | U.S. | | Asia | | Latin America | | EMEA | | MetLife Holdings | | Corporate& Other | | Total |
| | (In millions) |
| Total revenues | $ | 7,914 |
| | $ | 3,000 |
| | $ | 1,222 |
| | $ | 1,192 |
| | $ | 2,583 |
| | $ | (78 | ) | | $ | 15,833 |
|
| Less: Net investment gains (losses) | 44 |
| | 66 |
| | 12 |
| | 24 |
| | 5 |
| | 80 |
| | 231 |
|
| Less: Net derivative gains (losses) | (20 | ) | | (68 | ) | | (9 | ) | | 25 |
| | (469 | ) | | (2 | ) | | (543 | ) |
| Less: Adjustments related to net investment gains (losses) and net derivative gains (losses) | — |
| | (4 | ) | | — |
| | (1 | ) | | — |
| | — |
| | (5 | ) |
| Less: Other adjustments to revenues (1) | (73 | ) | | 71 |
| | 17 |
| | 442 |
| | (45 | ) | | (272 | ) | | 140 |
|
| Total operating revenues | $ | 7,963 |
| | $ | 2,935 |
| | $ | 1,202 |
| | $ | 702 |
| | $ | 3,092 |
| | $ | 116 |
| | $ | 16,010 |
|
| Total expenses | $ | 7,123 |
| | $ | 2,526 |
| | $ | 1,016 |
| | $ | 1,032 |
| | $ | 2,696 |
| | $ | 281 |
| | $ | 14,674 |
|
| Less: Adjustments related to net investment gains (losses) and net derivative gains (losses) | — |
| | (10 | ) | | — |
| | — |
| | (71 | ) | | (1 | ) | | (82 | ) |
| Less: Other adjustments to expenses (1) | — |
| | 67 |
| | — |
| | 415 |
| | 62 |
| | (110 | ) | | 434 |
|
| Total operating expenses | $ | 7,123 |
| | $ | 2,469 |
| | $ | 1,016 |
| | $ | 617 |
| | $ | 2,705 |
| | $ | 392 |
| | $ | 14,322 |
|
__________________
| |
(1) | See definitions of operating revenues and operating expenses under “— Non-GAAP and Other Financial Disclosures” for the components of such adjustments. |
Nine Months Ended September 30, 2017
|
| | | | | | | | | | | | | | | | | | | | | | | | | | | |
| | U.S. | | Asia | | Latin America | | EMEA | | MetLife Holdings | | Corporate& Other | | Total |
| | (In millions) |
| Total revenues | $ | 24,077 |
| | $ | 8,767 |
| | $ | 3,939 |
| | $ | 2,689 |
| | $ | 8,039 |
| | $ | (1,196 | ) | | $ | 46,315 |
|
| Less: Net investment gains (losses) | 70 |
| | 61 |
| | 34 |
| | (8 | ) | | 30 |
| | (626 | ) | | (439 | ) |
| Less: Net derivative gains (losses) | (34 | ) | | (9 | ) | | 173 |
| | 21 |
| | (449 | ) | | (365 | ) | | (663 | ) |
| Less: Adjustments related to net investment gains (losses) and net derivative gains (losses) | — |
| | 14 |
| | — |
| | — |
| | — |
| | — |
| | 14 |
|
| Less: Other adjustments to revenues (1) | (160 | ) | | 214 |
| | 60 |
| | 574 |
| | (70 | ) | | (556 | ) | | 62 |
|
| Total operating revenues | $ | 24,201 |
| | $ | 8,487 |
| | $ | 3,672 |
| | $ | 2,102 |
| | $ | 8,528 |
| | $ | 351 |
| | $ | 47,341 |
|
| Total expenses | $ | 21,872 |
| | $ | 7,365 |
| | $ | 3,214 |
| | $ | 2,418 |
| | $ | 7,188 |
| | $ | 1,776 |
| | $ | 43,833 |
|
| Less: Adjustments related to net investment gains (losses) and net derivative gains (losses) | — |
| | 12 |
| | — |
| | — |
| | (46 | ) | | 2 |
| | (32 | ) |
| Less: Other adjustments to expenses (1) | 1 |
| | 244 |
| | 125 |
| | 581 |
| | 224 |
| | 259 |
| | 1,434 |
|
| Total operating expenses | $ | 21,871 |
| | $ | 7,109 |
| | $ | 3,089 |
| | $ | 1,837 |
| | $ | 7,010 |
| | $ | 1,515 |
| | $ | 42,431 |
|
Nine Months Ended September 30, 2016
|
| | | | | | | | | | | | | | | | | | | | | | | | | | | |
| | U.S. | | Asia | | Latin America | | EMEA | | MetLife Holdings | | Corporate& Other | | Total |
| | (In millions) |
| Total revenues | $ | 22,407 |
| | $ | 10,123 |
| | $ | 3,576 |
| | $ | 3,024 |
| | $ | 9,357 |
| | $ | (532 | ) | | $ | 47,955 |
|
| Less: Net investment gains (losses) | 13 |
| | 429 |
| | 8 |
| | 48 |
| | 142 |
| | (42 | ) | | 598 |
|
| Less: Net derivative gains (losses) | 512 |
| | 949 |
| | 47 |
| | 27 |
| | (32 | ) | | (65 | ) | | 1,438 |
|
| Less: Adjustments related to net investment gains (losses) and net derivative gains (losses) | — |
| | 28 |
| | — |
| | — |
| | — |
| | — |
| | 28 |
|
| Less: Other adjustments to revenues (1) | (192 | ) | | 394 |
| | 37 |
| | 836 |
| | (139 | ) | | (688 | ) | | 248 |
|
| Total operating revenues | $ | 22,074 |
| | $ | 8,323 |
| | $ | 3,484 |
| | $ | 2,113 |
| | $ | 9,386 |
| | $ | 263 |
| | $ | 45,643 |
|
| Total expenses | $ | 19,965 |
| | $ | 7,433 |
| | $ | 3,047 |
| | $ | 2,624 |
| | $ | 8,520 |
| | $ | 844 |
| | $ | 42,433 |
|
| Less: Adjustments related to net investment gains (losses) and net derivative gains (losses) | — |
| | 42 |
| | — |
| | 1 |
| | (257 | ) | | (1 | ) | | (215 | ) |
| Less: Other adjustments to expenses (1) | 12 |
| | 333 |
| | 125 |
| | 743 |
| | 94 |
| | (446 | ) | | 861 |
|
| Total operating expenses | $ | 19,953 |
| | $ | 7,058 |
| | $ | 2,922 |
| | $ | 1,880 |
| | $ | 8,683 |
| | $ | 1,291 |
| | $ | 41,787 |
|
__________________
| |
(1) | See definitions of operating revenues and operating expenses under “— Non-GAAP and Other Financial Disclosures” for the components of such adjustments. |
Consolidated Results — Operating
Three Months Ended September 30, 20172021 Compared with the Three Months Ended SeptemberJune 30, 20162020
Unless otherwise stated, all amounts discussed below are net of income tax.
Overview. The primary drivers of the decreaseincrease in operatingadjusted earnings were higher taxesinvestment yields due to strong returns in our private equity portfolio and lower investment yields,the release of a legal reserve in the current period, partially offset by unfavorable underwriting, which reflected impacts from the impactCOVID-19 Pandemic, and the disposition of our annual actuarial assumption review.MetLife P&C. The disposition of MetLife P&C decreased adjusted earnings by $83 million. All amounts discussed below are net of the results of this business.
Foreign Currency. Changes in foreign currency exchange rates had a $7$47 million negativepositive impact on operatingadjusted earnings for the thirdsecond quarter of 20172021 compared to the prior period. Unless otherwise stated, all amounts discussed below are net of foreign currency fluctuations. Foreign currency fluctuations can result in significant variances in the financial statement line items.
Business Growth. We benefited from positive net flows from manyin most of our businesses, which increased our invested asset base. Growth in the investment portfolios of our U.S., Asia U.S. and Latin America segments resulted in higher net investment income. However, this was offset by a corresponding increaseconsistent with the growth in average invested assets, interest credited expenseexpenses on certain insurance-related liabilities.liabilities increased. In our U.S. segment, an increaseaddition, higher premiums, net of corresponding changes in average premium per policypolicyholder benefits improved adjusted earnings, primarily from growth in our autoAsia and homeowners business,EMEA segments, partially offset by a decreasedecline in exposures, improved operating earnings. Negative net flowsour Latin America segment. Higher fee income in our EMEA, Latin America and Asia segments was partially offset by decreases in our MetLife Holdings segment contributedand U.S. segments. Also, an increase in expenses due to a decreasebusiness growth was more than offset by the related increase in average separate account balances, which resultedDAC capitalization and the 2021 abatement of the annual health insurer fee under the Patient Protection and Affordable Care Act (“PPACA”). The combined impact of the items affecting our business growth, in lower asset based-fee income. The items discussed aboveaddition to higher DAC amortization, resulted in a $40$68 million decreaseincrease in operatingadjusted earnings.
Market Factors. Market factors, including interest rate levels, variability in equity market returns, and foreign currency exchange rate fluctuations, continued to impact our results; however, certain impacts were mitigated by derivatives used to hedge these risks. Excluding the impact of changes in foreign currency exchange rates on reported net investment income in our non-U.S. segments and changes in inflation rates on our inflation-indexed investments, investment yields decreased. Investmentincreased. The increase in investment yields decreasedwas primarily due to lowerdriven by the favorable impact of equity market returns on real estate joint ventures, FVO securities,our private equity funds, partially offset by lower yields on fixed maturityincome securities and alternative investments, as well asdecreased returns on FVO Securities. The net impact of interest rate fluctuations resulted in a decline in prepayment fees and lower derivatives income. These reductions in yields were partially offset by increased yields on mortgage loans and higher returns on private equities, driven by improvements in equity market performance. In our MetLife Holdings segment, favorable equity market performance in the current period drove an increase in average separate account balances, resulting in higher asset-based fees. This increase was partially offset by higher interest credited expenses, primarily driven by our U.S. segment as a result of a higher average interest credited rate.rates on deposit-type and long-duration liabilities, which drove a decrease in interest credited expenses. The changes in market factors discussed above resulted in an $1.3 billion increase in adjusted earnings.
Underwriting. Unfavorable underwriting resulted in a $108$101 million decrease in operating earnings.
Underwriting, Actuarial Assumption Reviewadjusted earnings and Other Insurance Adjustments.Favorable underwriting resultedreflected impacts from the COVID-19 Pandemic. Unfavorable claims experience in a$32 million increaseour U.S. and EMEA segments, coupled with unfavorable mortality in operating earnings primarily as a result ofour Latin America segment, was partially offset by favorable mortality and claims experience in our MetLife Holdings segment and favorable mortality in our U.S. and MetLife Holdings segments, partially offset by unfavorable morbidity and an increase in catastrophe lossessegment.
Expenses. Adjusted earnings increased $85 million compared to the prior period, primarily due to hurricanes Harvey and Irmathe release of a legal reserve in the current period. Unfavorable morbidity in
Taxes. For the three months ended June 30, 2021, our MetLife Holdings and EMEA segments was partially offset by favorable morbidity in our U.S. segment. The impact in both periods of our annual actuarial assumption review resulted in a $165 million increase in operating earnings, primarily due to favorable DAC unlockings in the current period compared with unfavorable DAC unlockings in the prior period in our MetLife Holdings segment. The annual assumption review in the current period included all of our annuity and life businesses, whereas the annual review in the prior period included our annuity and life businesses with the exception of our U.S. variable annuity business, which was reviewed in the second quarter of 2016. Refinements to DAC and certain insurance-related liabilities, which were recorded in both periods across the majority of our segments, resulted in a $64 million increase in operating earnings. This includes the favorable impact of current period reserve refinements totaling $49 million, resulting from modeling improvements in the reserving process for our long-term care and life businesses in our MetLife Holdings segment.
Expenses and Taxes. A $69 million increase in expenses included increases in employee-related and Separation-related costs. Our effective tax rates differrate on adjusted earnings was 22%, which differed from the U.S. statutory rate of 35%21% primarily due to non-taxable investment income, tax credits for investments in low income housing, andcharges from foreign earnings taxed at lowerdifferent rates than the U.S. statutory rate. Lower utilization of tax preferenced items and foreign rate, differential decreased current period operating earnings by $42 million from the prior period. Our current period results include a net tax charge of $180 million related to the future repatriation of approximately $3.0 billion of cash following the post-Separation review of our capital needs, partially offset by a tax benefit associated with dividendsbenefits from tax credits and non-taxable investment income. For the three months ended June 30, 2020, our non-U.S. operations and a net tax-related benefit of $13 million, including interest,effective tax rate on adjusted earnings was 19%, which differed from the finalizationU.S. statutory rate of certain21% primarily due to tax audits. Our prior period results include abenefits from tax benefit of $36 million related tocredits and non-taxable investment income, partially offset by tax charges from foreign earnings taxed at different rates than the settlement of an audit.U.S. statutory rate.
NineSix Months Ended SeptemberJune 30, 20172021 Compared with the NineSix Months Ended SeptemberJune 30, 20162020
Unless otherwise stated, all amounts discussed below are net of income tax.
Overview. The primary drivers of the increase in operatingadjusted earnings were annuities reinsurance activity with Brighthouse, the impact ofhigher investment yields due to strong returns in our annual actuarial assumption review,private equity portfolio, an increase in net investment income due to a larger asset base, lower interest credited expenses and the impactrelease of a legal reserve in the current period, partially offset by unfavorable underwriting, which reflected impacts from the COVID-19 Pandemic, and prior period refinements made to DAC and certain insurance-related liabilities.the disposition of MetLife P&C. The disposition of MetLife P&C decreased adjusted earnings by $192 million. All amounts discussed below are net of the results of this business.
Foreign Currency. Changes in foreign currency exchange rates had a $28$64 million negativepositive impact on operatingadjusted earnings for the first ninesix months of 20172021 compared to the prior period. Unless otherwise stated, all amounts discussed below are net of foreign currency fluctuations. Foreign currency fluctuations can result in significant variances in the financial statement line items.
Business Growth. An increase of $14 million in operating earnings was attributable to business growth. We benefited from positive net flows from manyin most of our businesses. As a result, growthbusinesses, which increased our invested asset base. Growth in the investment portfolios of our U.S., Asia U.S. and Latin America segments generatedresulted in higher net investment income. However, thisconsistent with the growth in average invested assets, interest credited expenses on certain insurance-related liabilities increased. In addition, higher premiums, net of corresponding changes in policyholder benefits improved adjusted earnings, primarily from growth in our Asia and EMEA segments, partially offset by a decline in our Latin America segment. Lower fee income in our EMEA and MetLife Holdings segments was partially offset by a corresponding increaseincreases in interest credited expense on certain insurance-related liabilities. In our Asia, Latin America and U.S. segment,segments. Also, an increase in average premium per policy in our auto and homeownersexpenses due to business partiallygrowth was more than offset by a decrease in exposures, improved operating earnings. Growth in our segments abroad also contributed to the related increase in operatingDAC capitalization and the 2021 abatement of the annual health insurer fee under the PPACA. The combined impact of the items affecting our business growth, in addition to lower DAC amortization, resulted in a $121 million increase in adjusted earnings. In addition, in our MetLife Holdings segment, negative net flows contributed to a decrease in average separate account balances, and consequently, asset-based fee income. Improved results from our start-up operations also increased operating earnings.
Market Factors. Market factors, including interest rate levels, variability in equity market returns, and foreign currency exchange rate fluctuations, continued to impact our results; however, certain impacts were mitigated by derivatives used to hedge these risks. Excluding the impact of changes in foreign currency exchange rates on reported net investment income in our non-U.S. segments and changes in inflation rates on our inflation-indexed investments, investment yields decreased. Investmentincreased. The increase in investment yields were negatively affectedwas primarily driven by lower prepayment fees, lowerthe favorable impact of equity market returns on real estate joint ventures and lower income on derivatives. In addition, earnings on our securities lending program decreased, which primarily resulted from lower margins due to a flatter yield curve. These decreases in net investment income wereprivate equity funds, partially offset by higherlower yields on fixed income securities and decreased returns on private equities, driven by improvementsFVO Securities. The net impact of interest rate fluctuations resulted in equity market performance, and higher returns on real estate. Ina decline in our MetLife Holdings segment, favorable equity market performance in the current period drove an increase in average separate account balances, resulting in higher asset-based fees. This increase was partially offset by higher interest credited expenses, primarily driven by our U.S. segment as a result of a higher average interest credited rate.rates on deposit-type and long-duration liabilities, which drove a decrease in interest credited expenses. The changes in market factors discussed above resulted in a $32$2.1 billion increase in adjusted earnings.
Underwriting. Unfavorable underwriting resulted in a $369 million decrease in operating earnings.
Underwriting, Actuarial Assumption Reviewadjusted earnings and Other Insurance Adjustments.reflected impacts from the COVID-19 Pandemic. Unfavorable mortality in our U.S. and Latin America segments, was partially offset by net favorable claims experience. Favorable underwriting resultedclaims experience in a$26 million increase in operating earnings primarily as a result of favorable mortalityour MetLife Holdings and morbidity,Asia segments was partially offset by unfavorable claims experience and higher catastrophe losses. Favorable mortality in our MetLife Holdings and U.S. segments was partially offset by unfavorable mortality in our Latin AmericaEMEA segment. Favorable morbidity in our U.S. segment was partially offset by unfavorable morbidity in our MetLife Holdings and EMEA segments. Higher lapses and claims in Japan, as well as a change in product mix in Hong Kong, partially offset by favorable claims experience in other countries, drove unfavorable claims experience in our Asia segment. The impact in both periods of our annual actuarial assumption review resulted in a $189
Expenses. Adjusted earnings increased $121 million increase in operating earnings,compared to the prior period, primarily due to favorable DAC unlockingsthe release of a legal reserve in the current period, compareddeclines in certain corporate-related expenses, and lower interest expenses on tax positions due to unfavorable DAC unlockingsaudit settlements in the prior period in our MetLife Holdings segment. Refinements to DAC and certain insurance-related liabilities, which were recorded in both periods across the majority of our segments, resulted in a $202 million increase in operating earnings. This includes favorable current period, refinements of (i) a $36 million DAC adjustment related to certain participating whole life business assumed from Brighthouse; and (ii) reserve adjustments resulting from modeling improvements in the reserving process of $55 million and $28 million, in our life and long-term care businesses, respectively. This also includes an unfavorable prior period refinement of $30 million resulting from modeling improvements in the reserving process in our universal life business.
Expenses and Taxes. Higher expenses of $17 million included an increase in expenses incurred related to the guaranty fund assessment for Penn Treaty, an increase in litigation reserves, higher costs associated with corporate initiatives and projects, including leasehold impairments, Separation-related costs and costs related to our unit cost initiative, partially offset by lower costshigher employee-related costs.
Taxes. For the six months ended June 30, 2021, our effective tax rate on adjusted earnings was equal to the statutory rate of 21% as a result oftax charges from foreign earnings taxed at different rates than the U.S. Retail Advisor Force Divestiture. Ourstatutory rate were offset by tax benefits from tax credits, non-taxable investment income and the corporate tax deduction for stock compensation. For the six months ended June 30, 2020, our effective tax rates differrate on adjusted earnings was 18%, which differed from the U.S. statutory rate of 35%21% primarily due to tax benefits from tax credits, non-taxable investment income and the finalization of bankruptcy proceedings for a leveraged lease investment, partially offset by tax credits for investments in low income housing, andcharges from foreign earnings taxed at lowerdifferent rates than the U.S. statutory rate. Higher utilization of tax preferenced items and foreign rate differential improved current period operating earnings by $82 million over the prior period. Our current period results include a net tax-related benefit of $40 million, including interest, from the finalization of certain tax audits, as well as a net tax charge of $180 million related to the future repatriation of approximately $3.0 billion of cash following the post-Separation review of our capital needs, partially offset by a tax benefit associated with dividends from our non-U.S. operations. Our current period results also include a tax benefit of $9 million related to the settlement of an audit in Argentina. Our prior period results include a tax benefit of $20 million in Japan and a tax charge of $10 million in Chile, both related to changes in tax rates that pertain to periods prior to 2016, as well as a tax charge of $26 million related to the repatriation of earnings from Japan. In addition, prior period results include a one-time tax benefit of $36 million for tax audit settlements.
Other. In connection with the Separation, annuities reinsurance activity with Brighthouse increased operating earnings by $254 million. This favorable impact was primarily due to the recapture in 2016 of certain single-premium deferred annuity reinsurance agreements, and the elimination of interest credited payments on the related reinsurance payable, as well as lower DAC amortization. This increase was partially offset by the net unfavorable impact in the current period from the recapture and novation of, as well as refinements to, assumed and ceded agreements covering certain variable annuity business.
Segment Results and Corporate & Other
U.S.
Business Overview.SalesOverview. Adjusted premiums, fees and other revenues for the three months ended SeptemberJune 30, 20172021 increased over$444 million, or 8%, compared to the prior period. Growth in our Group Benefits business, including the acquisition of Versant Health, coupled with an increase in premiums in our RIS business, was largely offset by a decrease of $835 million attributable to the disposition of MetLife P&C. See Note 3 of the Notes to the Interim Condensed Consolidated Financial Statements for further information regarding this disposition. The increase in our Group Benefits business was primarily due to higher dental and vision premiums, driven by the impact of an unearned premium reserve established in the prior period primarilyto recognize the limited availability of services that could be provided due to the COVID-19 Pandemic restrictions, as well as the impact of premium credits we offered to our customers in the prior period due to such restrictions, coupled with the current period impact of the Versant Health acquisition. In addition, growth in other core products was driven by increases in the group life and group disability businesses. Growth from our group life business included increased premiums from our participating contracts, which can fluctuate with claims experience. Growth in voluntary products was due to the impact of new sales and growth in membership in our accident & health and legal plans businesses. The increase in premiums in RIS business, with higher sales of pension risk transferswas mainly driven by increases in the U.K. longevity reinsurance and stable value products,institutional income annuity businesses, partially offset by a decrease in funding agreement issuances.the structured settlement business. Changes in RIS premiums for the RIS business were almost entirelyare mostly offset by the related changesa corresponding change in policyholder benefitsbenefits.
Growth in RIS’s stable value and claims. Sales declinedcapital market investments businesses drove increases in the Group Benefits business compared to the prior period, mainly due to timing of the 2017 sales; however, sales on a year-to-date basis increased by 22% compared to the prior period. Thepolicyholder account and separate account balances, resulting increase in premiums,higher fees and other revenues was partially offset by the lossinterest margins.
| | | | | | | | | | | | | | | | | | | | | | | |
| Three Months
Ended
June 30, | | Six Months
Ended
June 30, |
| 2021 | | 2020 | | 2021 | | 2020 |
| (In millions) |
| Adjusted revenues | | | | | | | |
| Premiums | $ | 5,474 | | | $ | 5,184 | | | $ | 11,173 | | | $ | 10,858 | |
| Universal life and investment-type product policy fees | 282 | | | 268 | | | 579 | | | 543 | |
| Net investment income | 1,998 | | | 1,425 | | | 4,008 | | | 3,191 | |
| Other revenues | 380 | | | 240 | | | 776 | | | 480 | |
| Total adjusted revenues | 8,134 | | | 7,117 | | | 16,536 | | | 15,072 | |
| Adjusted expenses | | | | | | | |
| Policyholder benefits and claims and policyholder dividends | 5,739 | | | 5,038 | | | 11,881 | | | 10,473 | |
| Interest credited to policyholder account balances | 359 | | | 412 | | | 718 | | | 870 | |
| Capitalization of DAC | (13) | | | (122) | | | (31) | | | (234) | |
| Amortization of DAC and VOBA | 8 | | | 115 | | | 24 | | | 234 | |
| Interest expense on debt | 2 | | | 2 | | | 3 | | | 4 | |
| Other expenses | 898 | | | 1,012 | | | 1,809 | | | 2,078 | |
| Total adjusted expenses | 6,993 | | | 6,457 | | | 14,404 | | | 13,425 | |
| Provision for income tax expense (benefit) | 239 | | | 137 | | | 446 | | | 344 | |
| Adjusted earnings | $ | 902 | | | $ | 523 | | | $ | 1,686 | | | $ | 1,303 | |
| | | | | | | |
| Adjusted premiums, fees and other revenues | $ | 6,136 | | | $ | 5,692 | | | $ | 12,528 | | | $ | 11,881 | |
|
| | | | | | | | | | | | | | | |
| | Three Months
Ended
September 30, | | Nine Months
Ended
September 30, |
| | 2017 | | 2016 | | 2017 | | 2016 |
| | (In millions) |
| Operating revenues | | | | | | | |
| Premiums | $ | 6,987 |
| | $ | 5,936 |
| | $ | 18,049 |
| | $ | 16,127 |
|
| Universal life and investment-type product policy fees | 247 |
| | 245 |
| | 763 |
| | 743 |
|
| Net investment income | 1,602 |
| | 1,590 |
| | 4,789 |
| | 4,615 |
|
| Other revenues | 197 |
| | 192 |
| | 600 |
| | 589 |
|
| Total operating revenues | 9,033 |
| | 7,963 |
| | 24,201 |
| | 22,074 |
|
| Operating expenses | | | | | | | |
| Policyholder benefits and claims and policyholder dividends | 6,904 |
| | 5,894 |
| | 18,017 |
| | 16,210 |
|
| Interest credited to policyholder account balances | 376 |
| | 322 |
| | 1,086 |
| | 967 |
|
| Capitalization of DAC | (126 | ) | | (124 | ) | | (342 | ) | | (356 | ) |
| Amortization of DAC and VOBA | 118 |
| | 117 |
| | 346 |
| | 353 |
|
| Interest expense on debt | 2 |
| | 2 |
| | 8 |
| | 7 |
|
| Other operating expenses | 933 |
| | 912 |
| | 2,756 |
| | 2,772 |
|
| Total operating expenses | 8,207 |
| | 7,123 |
| | 21,871 |
| | 19,953 |
|
| Provision for income tax expense (benefit) | 280 |
| | 288 |
| | 782 |
| | 720 |
|
| Operating earnings | $ | 546 |
| | $ | 552 |
| | $ | 1,548 |
| | $ | 1,401 |
|
Three Months Ended SeptemberJune 30, 20172021 Compared with the Three Months Ended SeptemberJune 30, 20162020
Unless otherwise stated, all amounts discussed below are net of income tax.
The disposition of MetLife P&C decreased adjusted earnings by $83 million. All amounts discussed below are net of the results of this business.
Business Growth.The impact of deposits,positive flows from pension risk transfer transactions and funding agreement issuances and increased premiums resulted in higher average invested assets, improving net investment income. However, consistent with the growth in average invested assets, from increased premiums, interest credited expenses on long-duration contractsand deposit-type liabilities increased. An increase in averageHigher volume-related, premium per policy in both our autotax and homeowners businesses,direct expenses, driven by business growth, were partially offset by the decrease in exposures, improved operating earnings. The remaining increase in premiums, fees and other revenues, coupled with a reduction in direct and allocated expenses, was partially offset by higher volume-related expenses. The current period2021 abatement of the annual health insurer fee under the Patient Protection and Affordable Care Act (“PPACA”)PPACA. This net increase in expenses was more than offset by a corresponding decreaseincrease in adjusted premiums, fees and other revenues. The combined impact of the items discussed aboveaffecting our business growth increased operatingadjusted earnings by $18$25 million.
Market Factors. Market factors, including interest rate levels, variability in equity market returns and foreign currency exchange rate fluctuations, continued to impact our results; however, certain impacts were mitigated by derivatives used to hedge these risks. Investment yields decreased primarily due to lower returns on fixed maturity securities, real estate and real estate joint ventures, as well as lower derivative income. In addition, lower investment earnings on our securities lending program resulted primarily from lower margins, due to a flatter yield curve. These reductions were partially offset by higher returns on private equities, driven by improvements in equity market performance. Certain of our funding agreements and guaranteed interest contract liabilities have interest credited rates that are contractually tied to current market rates, specifically the 3-month London Interbank Offered Rate (“LIBOR”) and, as a result, a higher average interest credited rate drove an increase in interest credited expense. The changes in market factors discussed above resulted in a $39 million decrease in operating earnings.
Underwriting and Other Insurance Adjustments. Favorable current period utilization, as well as favorable prior period development and the impact of pricing actions in our dental business, coupled with favorable claims experience in our accident & health businesses, resulted in a $26 million increase in operating earnings. Favorable mortality in the current period, mainly due to decreases in both incidence and severity, as well as favorable prior period development in our term life business, resulted in a $49 million increase in operating earnings. Less favorable mortality in both our income annuities and specialized life insurance businesses decreased operating earnings by $13 million. In our Property & Casualty business, catastrophe-related losses increased $32 million in the current period, primarily related to hurricanes Harvey and Irma. Non-catastrophe claim costs decreased $5 million, as a result of lower frequencies in both our auto and homeowners businesses. Non-catastrophe favorable development of prior year losses increased operating earnings by $3 million. Refinements to certain insurance and other liabilities, which were recorded in both periods, resulted in a $20 million decrease in operating earnings.
Nine Months Ended September 30, 2017 Compared with the Nine Months Ended September 30, 2016
Unless otherwise stated, all amounts discussed below are net of income tax.
Business Growth. The impact of deposits, funding agreement issuances and increased premiums resulted in higher average invested assets, improving net investment income. However, consistent with the growth in average invested assets from increased premiums, interest credited on long-duration contracts increased. An increase in average premium per policy in our auto business, partially offset by the decrease in exposures, improved operating earnings. The remaining increase in premiums, fees and other revenues, coupled with a decline in direct and allocated expenses, was partially offset by higher volume-related expenses. The current period abatement of the annual health insurer fee under PPACA was offset by a corresponding decrease in premiums, fees and other revenues. The combined impact of the items discussed above increased operating earnings by $135 million.
Market Factors. Market factors, including the interest rate levels, variability in equity market returns and foreign currency exchange rate fluctuations, continued to impact our results; however, certain impacts were mitigated by derivatives used to hedge these risks. Investment yields increased primarily due to higherdriven by the favorable impact of equity market returns on other limited partnership interests, primarily inour private equities, driven by improvements in equity market performance. This increase in investment yields was largelyfunds, partially offset by lower prepayment fees, lower returnsyields on real estate and real estate joint ventures, and lower derivative income. In addition, lower investment earnings onfixed income securities. The net impact of interest rate fluctuations resulted in a decline in our securities lending program resulted primarily from lower margins, due to a flatter yield curve. Higher average interest credited rates on deposit-type and long-duration liabilities, which drove an increasea decrease in interest credited expenses; however, this was partially offset by an increase in operating earnings due to a decrease in the crediting rate on certain long-duration insurance contracts.expenses. The changes in market factors discussed above resulted in a $28$511 million decreaseincrease in operatingadjusted earnings.
Underwriting and Other Insurance Adjustments. FavorableLess unfavorable mortality in our Group Benefits business resulted in an increase in adjusted earnings of $25 million. This was primarily driven by decreases in both incidence and severity in COVID-19 claims in the current period, partially offset by unfavorable results in our accidental death & dismemberment business due to lower incidence in the prior period development, current period utilization andas a result of the COVID-19 Pandemic. Unfavorable mortality in our RIS business, including the impact of pricing actionsthe COVID-19 Pandemic, resulted in a decrease in adjusted earnings of $12 million, driven by our pension risk transfer and institutional income annuity businesses, partially offset by favorable results in our specialized benefit resource business. Unfavorable claims experience, partially offset by the impact of growth in our Group Benefits business, resulted in a $53 million decrease in adjusted earnings. This decrease was primarily driven by: (i) unfavorable dental business,results, as well as favorablea result of the COVID-19 Pandemic, which limited availability of services and reduced utilization in the prior period; and (ii) unfavorable claims experience in our group disability and accident & health businessesbusinesses. This unfavorable claims experience was partially offset by unfavorable(i) favorable claims experience in our individual disability business; (ii) the impact of the acquisition of Versant Health on our vision business; and (iii) the impact of business which resulted in an $85 million increase in operating earnings. Favorable mortality in the current period, mainly due to favorable prior period developmentgrowth in our term life business, was partially offset by less favorable mortality in both our accidental death and dismemberment and universal life businesses, which resulted in a $14 million increase in operating earnings. Favorable mortality from our pension risk transfer business was offset by less favorable mortality in our specialized life insurance and income annuities businesses. In our Propertyaccident & Casualty business, catastrophe-related losses increased $25 million in the current period, primarily due to severe storm activity, including hurricanes Harvey and Irma. Non-catastrophe claim costs increased by $10 million as a result of higher auto and home-related severities, as well as higher homeowner-related frequencies, partially offset by lower auto-related frequencies. Favorable development of prior year non-catastrophe losses of $5 million increased operating earnings.health business. Refinements to certain insurance and other liabilities which were recorded in both periods resulted in a $22$28 million decrease in operatingadjusted earnings.
Asia
Business Overview. Sales for the three months ended September 30, 2017 increased compared to the prior period, primarily driven by a successful sales campaign in Korea, as well as a larger agency force and the continued success of our whole life critical illness product in China. These increases were partially offset by lower yen-denominated life product sales in Japan and the continued impact from regulatory changes in Hong Kong.
|
| | | | | | | | | | | | | | | |
| | Three Months
Ended
September 30, | | Nine Months
Ended
September 30, |
| | 2017 |
| 2016 | | 2017 | | 2016 |
| | (In millions) |
| Operating revenues | | | | | | | |
| Premiums | $ | 1,696 |
| | $ | 1,822 |
| | $ | 5,063 |
| | $ | 5,161 |
|
| Universal life and investment-type product policy fees | 458 |
| | 394 |
| | 1,199 |
| | 1,114 |
|
| Net investment income | 762 |
| | 707 |
| | 2,193 |
| | 2,003 |
|
| Other revenues | 11 |
| | 12 |
| | 32 |
| | 45 |
|
| Total operating revenues | 2,927 |
| | 2,935 |
| | 8,487 |
| | 8,323 |
|
| Operating expenses | | | | | | | |
| Policyholder benefits and claims and policyholder dividends | 1,223 |
| | 1,363 |
| | 3,785 |
| | 3,923 |
|
| Interest credited to policyholder account balances | 349 |
| | 331 |
| | 1,003 |
| | 974 |
|
| Capitalization of DAC | (420 | ) | | (440 | ) | | (1,268 | ) | | (1,251 | ) |
| Amortization of DAC and VOBA | 424 |
| | 331 |
| | 1,005 |
| | 921 |
|
| Amortization of negative VOBA | (24 | ) | | (46 | ) | | (91 | ) | | (167 | ) |
| Other operating expenses | 905 |
| | 930 |
| | 2,675 |
| | 2,658 |
|
| Total operating expenses | 2,457 |
| | 2,469 |
| | 7,109 |
| | 7,058 |
|
| Provision for income tax expense (benefit) | 156 |
| | 142 |
| | 459 |
| | 377 |
|
| Operating earnings | $ | 314 |
| | $ | 324 |
| | $ | 919 |
| | $ | 888 |
|
ThreeSix Months Ended SeptemberJune 30, 20172021 Compared with the ThreeSix Months Ended SeptemberJune 30, 20162020
Unless otherwise stated, all amounts discussed below are net of income tax.
Foreign Currency. Changes in foreign currency exchange ratesThe disposition of MetLife P&C decreased operatingadjusted earnings by $10 million for the third quarter of 2017 compared to the prior period, primarily due to the weakening of the Japanese yen against the U.S. dollar. Unless otherwise stated, all$192 million. All amounts discussed below are net of foreign currency fluctuations. Foreign currency fluctuations can result in significant variances in the financial statement line items.results of this business.
Business Growth.Asia’s premiums, fees The impact of positive flows from pension risk transfer transactions and other revenues remained constant compared to the prior period as growth in our foreign currency-denominated life and accident & health businesses was offset by the decline in yen-denominated life business in Japan. Changes in premiums for these businesses were partially offset by related changes in policyholder benefits. Lower variable costs for Korea also increased operating earnings. Positive net flows in Japan and Koreafunding agreement issuances resulted in higher average invested assets, which improvedimproving net investment income. However, consistent with the growth in average invested assets, interest credited expenses on long-duration and deposit-type liabilities increased. Higher volume-related, premium tax and direct expenses, driven by business growth, were partially offset by the 2021 abatement of the annual health insurer fee under the PPACA. This net increase in expenses was more than offset by a corresponding increase in adjusted premiums, fees and other revenues. The combined impact of the items discussed above improved operatingaffecting our business growth increased adjusted earnings by $32$73 million.
Market Factors.Market factors, including interest rate levels, and variability in equity market returns and foreign currency fluctuations, continued to impact our results; however, certain impacts were mitigated by derivatives used to hedge these risks. Investment results were unfavorably impactedyields increased primarily driven by lower returns on equity securities. This decrease was partially offset by improved returns from higher valuations on other limited partnership interests, and higher income on real estate investments. In addition, the favorable impact of higherequity market returns on our private equity funds, partially offset by lower yields on fixed income securities and mortgage loans. The net impact of interest rate fluctuations resulted in a decrease in our average interest credited rates on fixed maturity securitiesdeposit-type and long-duration liabilities, which drove a decrease in Australia also increased operating earnings.interest credited expenses. The combined impact of the itemschanges in market factors discussed above resulted in a slight decrease$779 million increase in operatingadjusted earnings.
Underwriting Actuarial Assumption Review and Other Insurance Adjustments. The currentUnfavorable mortality in our Group Benefits business resulted in a decrease in adjusted earnings of $277 million. This was primarily driven by (i) increases in both incidence and severity in both COVID-19 and core claims across our life businesses and (ii) unfavorable results in our accidental death & dismemberment business due to lower incidence in the prior period includes higher lapses from Japanas a result of the COVID-19 Pandemic. Favorable mortality in our RIS business, including the impact of the COVID-19 Pandemic, resulted in an increase in adjusted earnings of $35 million, driven by our pension risk transfer, specialized benefit resource and structured settlement businesses, partially offset by unfavorable results in the institutional income annuity business. The impact of growth in our Group Benefits business was offset by net unfavorable claims experience, primarily due to: (i) the impact of the acquisition of Versant Health on our vision business; (ii) favorable claims experience in Australia. Thethe individual disability and accident & health businesses, and (iii) the impact of business growth in both periodsour accident & health business; offset by (i) unfavorable claims experience in the group disability business, and (ii) unfavorable dental results, as a result of our annual actuarial assumption review resultedthe COVID-19 Pandemic, which limited availability of services and reduced utilization in a slight increase in operating earnings.the prior period. Refinements to certain insurance and other liabilities which were recorded in both periods resulted in a $6$31 million increasedecrease in operatingadjusted earnings.
Asia
ExpensesBusiness Overview. Adjusted premiums, fees and Taxes. Higher expenses, primarily driven by project costsother revenues for the three months ended June 30, 2021 increased $19 million, or 1%, compared to the prior period. Adjusted premiums, fees and an increase in corporate overhead costs, reduced operating earnings by $16 million. Our current period results include a chargeother revenues, net of $15 million relatedforeign currency fluctuations, were flat compared to a U.S. tax on dividends from our Japan operations. Ourthe prior period results includedas growth in foreign currency-denominated life and annuities products in Japan, as well as business growth in other markets, was essentially offset by a $7 million tax benefit due to a lower tax ratedecrease in Japan.premiums from yen-denominated life and accident and health products.
Nine | | | | | | | | | | | | | | | | | | | | | | | |
| Three Months
Ended
June 30, | | Six Months
Ended
June 30, |
| 2021 | | 2020 | | 2021 | | 2020 |
| (In millions) |
| Adjusted revenues | | | | | | | |
| Premiums | $ | 1,582 | | | $ | 1,584 | | | $ | 3,267 | | | $ | 3,220 | |
| Universal life and investment-type product policy fees | 436 | | | 420 | | | 894 | | | 850 | |
| Net investment income | 1,158 | | | 767 | | | 2,422 | | | 1,704 | |
| Other revenues | 19 | | | 14 | | | 37 | | | 28 | |
| Total adjusted revenues | 3,195 | | | 2,785 | | | 6,620 | | | 5,802 | |
| Adjusted expenses | | | | | | | |
| Policyholder benefits and claims and policyholder dividends | 1,233 | | | 1,255 | | | 2,530 | | | 2,576 | |
| Interest credited to policyholder account balances | 496 | | | 447 | | | 985 | | | 892 | |
| Capitalization of DAC | (395) | | | (351) | | | (830) | | | (772) | |
| Amortization of DAC and VOBA | 296 | | | 284 | | | 610 | | | 599 | |
| Amortization of negative VOBA | (8) | | | (8) | | | (15) | | | (16) | |
| Other expenses | 832 | | | 797 | | | 1,731 | | | 1,671 | |
| Total adjusted expenses | 2,454 | | | 2,424 | | | 5,011 | | | 4,950 | |
| Provision for income tax expense (benefit) | 221 | | | 105 | | | 466 | | | 246 | |
| Adjusted earnings | $ | 520 | | | $ | 256 | | | $ | 1,143 | | | $ | 606 | |
| | | | | | | |
| Adjusted earnings on a constant currency basis | $ | 520 | | | $ | 272 | | | $ | 1,143 | | | $ | 639 | |
| | | | | | | |
| Adjusted premiums, fees and other revenues | $ | 2,037 | | | $ | 2,018 | | | $ | 4,198 | | | $ | 4,098 | |
| Adjusted premiums, fees and other revenues on a constant currency basis | $ | 2,037 | | $ | 2,040 | | $ | 4,198 | | $ | 4,201 |
Three Months Ended SeptemberJune 30, 20172021 Compared with the NineThree Months Ended SeptemberJune 30, 20162020
Unless otherwise stated, all amounts discussed below are net of income tax.
Foreign Currency. Changes in foreign currency exchange rates decreased operatingincreased adjusted earnings by $7$16 million for the first nine monthssecond quarter of 20172021 compared to the prior period, primarily due to the weakeningstrengthening of the Japanese yen, partially offset by the strengthening of theAustralian dollar and Korean won against the U.S. dollar. Unless otherwise stated, all amounts discussed below are net of foreign currency fluctuations. Foreign currency fluctuations can result in significant variances in the financial statement line items.
Business Growth.Asia’s adjusted premiums, fees and other revenues increased overremained essentially flat as compared to the prior period mainly driven by growth in our foreign currency-denominated life and accident & health businesses in Japan, as well as our group insurance business in Australia. Changes in premiums for these businesses were partially offset by related changesdiscussed above; however, a decline in policyholder benefits.benefits improved adjusted earnings. Positive net flows in Japan and Korea resulted in higher average invested assets, which improved net investment income. The increase in net investment income was offset by a corresponding increase in interest credited expenses on certain insurance liabilities. The combined impact of the items discussed aboveaffecting our business growth improved operatingadjusted earnings by $74$25 million.
Market Factors.Market factors, including interest rate levels and variability in equity market returns, continued to impact our results; however, certain impacts were mitigated by derivatives used to hedge these risks. Investment results were favorably impacted by higher returns on other limited partnership interests,yields increased driven by improvements in equity market performance and a real estate lease termination fee. These increases were partially offset by the unfavorable impact of lower interest rates on fixed maturity securities in Japan. The decrease in returns from lower interest rates in Japan was partially offset by the favorable impact of increased sales of foreign currency-denominated fixed annuities in Japan, primarily in its Australian currency-denominated portfolio, which drove an increase in higher yielding foreign currency-denominated fixed maturity securities. The combined impact of the items discussed above increased operating earnings by $9 million.
Underwriting, Actuarial Assumption Review and Other Insurance Adjustments. Higher lapses and claims in Japan, as well as a change in product mix in Hong Kong, partially offset by favorable claims experience in other countries, decreased operating earnings by $26 million. The impact in both periods ofequity market returns on our annual actuarial assumption review resulted in a slight increase in operating earnings. Refinements to certain insurance and other liabilities, which were recorded in both periods, resulted in a $47 million increase in operating earnings, which includes a $12 million favorable refinement in the current period to a $44 million charge in the prior period related to reinsurance receivables in Australia.
Expenses and Taxes. Higher expenses, primarily driven by project costs and an increase in corporate overhead costs, reduced operating earnings by $14 million. Current and prior period results include charges of $51 million and $26 million, respectively, related to a U.S. tax on dividends from our Japan operations. Prior period results also include a tax benefit of $20 million related to a change in the corporate tax rate in Japan that pertains to periods prior to 2016.
Latin America
Business Overview. Sales for the three months ended September 30, 2017 increased compared to the prior period, driven by higher pension sales in Mexico, Chile and Brazil and higher sales of credit life products in Mexico,private equity funds, partially offset by lower group accident & health sales primarilyyields on fixed income securities supporting products sold in Mexico.Japan denominated in U.S. and Australian dollars. In addition, a decrease in interest credited expense improved adjusted earnings. The changes in market factors discussed above increased adjusted earnings by $225 million.
|
| | | | | | | | | | | | | | | |
| | Three Months
Ended
September 30, | | Nine Months
Ended
September 30, |
| | 2017 | | 2016 | | 2017 | | 2016 |
| | (In millions) |
| Operating revenues | | | | | | | |
| Premiums | $ | 701 |
| | $ | 653 |
| | $ | 1,993 |
| | $ | 1,885 |
|
| Universal life and investment-type product policy fees | 229 |
| | 227 |
| | 764 |
| | 764 |
|
| Net investment income | 299 |
| | 311 |
| | 891 |
| | 809 |
|
| Other revenues | 7 |
| | 11 |
| | 24 |
| | 26 |
|
| Total operating revenues | 1,236 |
| | 1,202 |
| | 3,672 |
| | 3,484 |
|
| Operating expenses | | | | | | | |
| Policyholder benefits and claims and policyholder dividends | 640 |
| | 681 |
| | 1,869 |
| | 1,814 |
|
| Interest credited to policyholder account balances | 99 |
| | 85 |
| | 275 |
| | 249 |
|
| Capitalization of DAC | (94 | ) | | (83 | ) | | (264 | ) | | (236 | ) |
| Amortization of DAC and VOBA | — |
| | (2 | ) | | 146 |
| | 127 |
|
| Amortization of negative VOBA | (1 | ) | | (1 | ) | | (1 | ) | | (1 | ) |
| Interest expense on debt | 1 |
| | 1 |
| | 4 |
| | 1 |
|
| Other operating expenses | 377 |
| | 335 |
| | 1,060 |
| | 968 |
|
| Total operating expenses | 1,022 |
| | 1,016 |
| | 3,089 |
| | 2,922 |
|
| Provision for income tax expense (benefit) | 51 |
| | 53 |
| | 123 |
| | 141 |
|
| Operating earnings | $ | 163 |
| | $ | 133 |
| | $ | 460 |
| | $ | 421 |
|
ThreeSix Months Ended SeptemberJune 30, 20172021 Compared with the ThreeSix Months Ended SeptemberJune 30, 20162020
Unless otherwise stated, all amounts discussed below are net of income tax.
Foreign Currency.Changes in foreign currency exchange rates increased operatingadjusted earnings by $5$33 million for the third quarterfirst six months of 20172021 compared to the prior period, mainlyprimarily due to the strengthening of the Mexican pesoAustralian dollar, Korean won and Japanese Yen against the U.S. dollar. Unless otherwise stated, all amounts discussed below are net of foreign currency fluctuations. Foreign currency fluctuations can result in significant variances in the financial statement line items.
Business Growth. Latin America experienced growth across several lines of business within Mexico Asia’s adjusted premiums, fees and Chile. This growth resulted in increased premiums, which were partially offset by related changesother revenues remained essentially flat as compared to the prior period; however, a decline in policyholder benefits.benefits improved adjusted earnings. Positive net flows primarily from Chilein Japan and Mexico,Korea resulted in an increase inhigher average invested assets, and generated higherwhich improved net investment income. ThisThe increase in net investment income was partiallymore than offset by ana corresponding increase in interest credited expenseexpenses on certain insurance liabilities. BusinessThe combined impact of the items affecting our business growth also drove increases in operating expenses and commissions, which were partially offsetimproved adjusted earnings by higher DAC capitalization. The items discussed above resulted in a $20 million increase in operating earnings.$33 million.
Market Factors. Market factors, including interest rate levels and variability in equity market returns, continued to impact our results; however, certain impacts were mitigated by derivatives used to hedge these risks. Changes inInvestment yields increased driven by the favorable impact of equity market factors resulted in a $10 million decrease in operating earnings as lower investment yields werereturns on our private equity funds, partially offset by lower yields on fixed income securities supporting products sold in Japan denominated in U.S. and Australian dollars. In addition, a decrease in interest credited expenses.expense improved adjusted earnings. The decreasechanges in investment yields was primarily drivenmarket factors discussed above increased adjusted earnings by lower returns from FVO$430 million.
Underwriting and fixed maturity securities in Chile,Other Insurance Adjustments. Lower claims, partially offset by higher derivative incomelapses, in Mexico.
Underwriting, Actuarial Assumption Review and Other Insurance Adjustments. Favorable underwriting resulted in a $4 million increase in operatingJapan increased adjusted earnings driven by lower claims experience in Mexico. The impact in both periods of our annual actuarial assumption review resulted in a slight decrease to operating earnings. In addition, refinements$26 million. Refinements to certain insurance liabilities and other adjustmentsliabilities in both periodsthe prior period resulted in a $13$9 million increase in operatingadjusted earnings.
Expenses and Taxes. Higher expenses,Expenses. Adjusted earnings increased by $11 million, primarily driven by employee-relatedlower operating expenses in Japan and marketing costs, decreased operating earnings by $16lower corporate overhead.
Latin America
Business Overview. Adjusted premiums, fees and other revenues for the three months ended June 30, 2021 increased $197 million, asor 27%, compared to the prior period. Operating earningsAdjusted premiums, fees and other revenues, net of foreign currency fluctuations, increased by $11$100 million, as a result of aor 12%, compared to the prior period, tax charge related to the 2015 filing of local tax returnsmainly driven by higher sales and persistency in Mexico and an improvement in the annuity market in Chile.
| | | | | | | | | | | | | | | | | | | | | | | |
| Three Months
Ended
June 30, | | Six Months
Ended
June 30, |
| 2021 | | 2020 | | 2021 | | 2020 |
| (In millions) |
| Adjusted revenues | | | | | | | |
| Premiums | $ | 636 | | | $ | 489 | | | $ | 1,231 | | | $ | 1,129 | |
| Universal life and investment-type product policy fees | 287 | | | 238 | | | 557 | | | 508 | |
| Net investment income | 308 | | | 260 | | | 607 | | | 478 | |
| Other revenues | 11 | | | 10 | | | 21 | | | 21 | |
| Total adjusted revenues | 1,242 | | | 997 | | | 2,416 | | | 2,136 | |
| Adjusted expenses | | | | | | | |
| Policyholder benefits and claims and policyholder dividends | 724 | | | 449 | | | 1,485 | | | 1,059 | |
| Interest credited to policyholder account balances | 60 | | | 56 | | | 119 | | | 126 | |
| Capitalization of DAC | (100) | | | (74) | | | (195) | | | (174) | |
| Amortization of DAC and VOBA | 83 | | | 70 | | | 143 | | | 144 | |
| | | | | | | |
| Interest expense on debt | 1 | | | 1 | | | 2 | | | 2 | |
| Other expenses | 343 | | | 307 | | | 678 | | | 652 | |
| Total adjusted expenses | 1,111 | | | 809 | | | 2,232 | | | 1,809 | |
| Provision for income tax expense (benefit) | 34 | | | 56 | | | 47 | | | 100 | |
| Adjusted earnings | $ | 97 | | | $ | 132 | | | $ | 137 | | | $ | 227 | |
| | | | | | | |
| Adjusted earnings on a constant currency basis | $ | 97 | | | $ | 157 | | | $ | 137 | | | $ | 250 | |
| | | | | | | |
| Adjusted premiums, fees and other revenues | $ | 934 | | | $ | 737 | | | $ | 1,809 | | | $ | 1,658 | |
| Adjusted premiums, fees and other revenues on a constant currency basis | $ | 934 | | | $ | 834 | | | $ | 1,809 | | | $ | 1,762 | |
NineThree Months Ended SeptemberJune 30, 20172021 Compared with the NineThree Months Ended SeptemberJune 30, 20162020
Unless otherwise stated, all amounts discussed below are net of income tax.
Foreign Currency.Changes in foreign currency exchange rates decreased operatingincreased adjusted earnings by $6$25 million for the first nine monthssecond quarter of 20172021 compared to the prior period, mainly due to the weakeningstrengthening of the Mexican and Argentinean pesosforeign currencies against the U.S. dollar.dollar, primarily the Chilean and Mexican pesos. Unless otherwise stated, all amounts discussed below are net of foreign currency fluctuations. Foreign currency fluctuations can result in significant variances in the financial statement line items.
Business Growth. Latin America experienced growth across several lines of business, primarily within Mexico and Chile. ThisWhile this growth resulted in increased premiums and policy fee income, whichit was partially offset by related changes in policyholder benefits. Positive net flows, primarily from Mexico and Chile, resulted in anAn increase in average invested assets, andprimarily in Chile, generated higher net investment income. ThisAlthough business growth drove an increase in commissions and other variable expenses, this was partiallymore than offset by ana corresponding increase in DAC capitalization and lower interest credited expense on certain insurance liabilities. BusinessThe combined impact of the items affecting business growth also drove an increase in operating expenses and commissions, which were largely offsetincreased adjusted earnings by higher DAC capitalization. The items discussed above resulted in a $70 million increase in operating earnings.$12 million.
Market Factors. Market factors, including interest rate levels and variability in equity market returns, continued to impact our results; however, certain impacts were mitigated by derivatives used to hedge these risks. Changes in market factors resulted in a slight increase in operating earnings primarily due to higher investment yields. The increase in investmentInvestment yields was primarilydecreased driven by higher returns fromthe unfavorable impact of rising rates on FVO and fixed income securities in Chile and higher mortgage loan income in Mexico. These increases were largely offset by higher interest credited expensesSecurities within our Chilean encaje and lower yields on fixed income securities, in Argentina.
Underwriting, Actuarial Assumption Review and Other Insurance Adjustments. Unfavorable underwriting resulted in a $26 million decrease to operating earnings drivenpartially offset by higher claims experience in Mexico.returns on private equity funds. The impact in both periods of our annual actuarial assumption review resulted in a slight decrease in operating earnings. In addition, refinements to certain insurance liabilities, primarily in the ProVida pension business, and other adjustments in both periods resulted in a $4 million increase to operating earnings.
Expenses and Taxes. Higher expenses, primarily driven by employee-related and marketing costs, decreased operating earnings by $37 million as compared to the prior period. Our results for the current period include a $9 million tax benefit related to the settlement of a tax audit in Argentina. Thisinvestment yields was partially offset by a $7 million tax charge forlower interest credited expense. The changes in the valuation of the pesomarket factors discussed above decreased adjusted earnings by $30 million.
Underwriting. Unfavorable underwriting drove a $54 million decrease in Argentinaadjusted earnings which includes impacts from COVID-19-related claims, primarily in both periods. In theBrazil and Mexico.
Expenses. A decrease in expenses, primarily due to a prior period our Chilean business incurred a taxinformation technology charge, of $10 million as a result of tax reform legislation in Chile that pertains to periods prior to 2016. Also, our results for the prior period included a tax charge of $11 million related to the 2015 filing of local tax returns in Mexico and Chile. Other tax-related items in both periods resulted in a $6an $8 million increase in operatingadjusted earnings.
EMEA
Business Overview. Sales for the three months ended September 30, 2017 increased from the prior period due to strong growth in the Gulf and Turkey, partially offset by a decrease in sales due to the closing of the wealth management product to new business in the U.K. and the loss of a credit life contract in Poland.
|
| | | | | | | | | | | | | | | |
| | Three Months
Ended
September 30, | | Nine Months
Ended
September 30, |
| | 2017 | | 2016 | | 2017 | | 2016 |
| | (In millions) |
| Operating revenues | | | | | | | |
| Premiums | $ | 527 |
| | $ | 500 |
| | $ | 1,534 |
| | $ | 1,519 |
|
| Universal life and investment-type product policy fees | 109 |
| | 104 |
| | 296 |
| | 294 |
|
| Net investment income | 77 |
| | 81 |
| | 229 |
| | 244 |
|
| Other revenues | (2 | ) | | 17 |
| | 43 |
| | 56 |
|
| Total operating revenues | 711 |
| | 702 |
| | 2,102 |
| | 2,113 |
|
| Operating expenses | | | | | | | |
| Policyholder benefits and claims and policyholder dividends | 282 |
| | 257 |
| | 821 |
| | 801 |
|
| Interest credited to policyholder account balances | 26 |
| | 28 |
| | 75 |
| | 87 |
|
| Capitalization of DAC | (109 | ) | | (103 | ) | | (301 | ) | | (310 | ) |
| Amortization of DAC and VOBA | 78 |
| | 106 |
| | 260 |
| | 311 |
|
| Amortization of negative VOBA | (5 | ) | | (3 | ) | | (13 | ) | | (10 | ) |
| Other operating expenses | 347 |
| | 332 |
| | 995 |
| | 1,001 |
|
| Total operating expenses | 619 |
| | 617 |
| | 1,837 |
| | 1,880 |
|
| Provision for income tax expense (benefit) | 21 |
| | 11 |
| | 47 |
| | 32 |
|
| Operating earnings | $ | 71 |
| | $ | 74 |
| | $ | 218 |
| | $ | 201 |
|
ThreeSix Months Ended SeptemberJune 30, 20172021 Compared with the ThreeSix Months Ended SeptemberJune 30, 20162020
Unless otherwise stated, all amounts discussed below are net of income tax.
Foreign Currency. Changes in foreign currency exchange rates had no significant net impact to operatingincreased adjusted earnings by $23 million for the third quarterfirst six months of 20172021 compared to the prior period.period, mainly due to the strengthening of foreign currencies against the U.S. dollar, primarily the Chilean and Mexican pesos. Unless otherwise stated, all amounts discussed below are net of foreign currency fluctuations. Foreign currency fluctuations can result in significant variances in the financial statement line items.
Business Growth. Growth from Despite a decrease in annuity premiums in Chile driven by the COVID-19 Pandemic, Latin America experienced premium and fee growth in Mexico. The net increase in premiums and fees was offset by related changes in policyholder benefits. An increase in average invested assets, primarily in Chile, generated higher net investment income. In addition, DAC amortization and interest credited expenses on certain insurance liabilities decreased. Although business growth in Mexico drove an increase in commissions and other variable expenses, this was mostly offset by higher DAC capitalization. The combined impact of the items affecting business growth increased adjusted earnings by $26 million.
Market Factors. Market factors, including interest rate levels and variability in equity market returns, continued to impact our accident & health businesses in Turkeyresults; however, certain impacts were mitigated by derivatives used to hedge these risks. Investment yields decreased driven by lower yields on fixed income securities and Spain,mortgage loans and the unfavorable impact of rising rates on FVO Securities within our credit life business in Turkey and our individual protection and employee benefits businesses in the U.K. wasChilean encaje. These decreases were partially offset by higher returns on private equity funds. The net decrease in investment yields was more than offset by lower premium persistencyinterest credited expense. The changes in market factors discussed above increased adjusted earnings by $18 million.
Underwriting. Unfavorable underwriting drove a $178 million decrease in adjusted earnings which includes impacts from COVID-19-related life claims, primarily in Mexico.
Expenses. A prior period information technology charge and expense discipline across the region drove an increase in adjusted earnings of $15 million.
EMEA
Business Overview. Adjusted premiums, fees and other revenues for the three months ended June 30, 2021 increased $84 million, or 13%, compared to the prior period. Adjusted premiums, fees and other revenues, net of foreign currency fluctuations, increased $54 million, or 8%, compared to the prior period primarily due to growth in our employee benefits business in the Gulf and increased operating earnings by $7 million.
Underwriting, Actuarial Assumption Review and Other Insurance Adjustments. Unfavorable underwriting, primarily in our employee benefits(i) corporate solutions business in the U.K., decreased operating earnings by $8 million. The impact in both periods of our annual actuarial assumption review resulted in a net operating earnings increase of $8 million. Refinements to certain insurance liabilities(ii) accident and other adjustments in both periods resulted in a $6 million decrease to operating earnings.
Expenses. Operating expenses decreased by $3 million due to expense disciplinehealth and variable life businesses across the region, (iii) pension business in Romania, and (iv) ordinary life business in Ukraine and France, as well as enterprise-wide initiatives, notablya favorable refinement to an unearned premium reserve in Italy. These favorable variances were partially offset by the closingdisposition of the wealth management product to new business in the U.K. In addition, the aggregate impact of several small expense reductions in the prior period resulted in an operating earnings decline of $5 million.MetLife Russia.
Taxes. A current period incremental tax expense in Russia decreased operating earnings by $2 million. | | | | | | | | | | | | | | | | | | | | | | | |
| Three Months
Ended
June 30, | | Six Months
Ended
June 30, |
| 2021 | | 2020 | | 2021 | | 2020 |
| (In millions) |
| Adjusted revenues | | | | | | | |
| Premiums | $ | 621 | | | $ | 557 | | | $ | 1,219 | | | $ | 1,125 | |
| Universal life and investment-type product policy fees | 107 | | | 92 | | | 174 | | | 208 | |
| Net investment income | 62 | | | 63 | | | 125 | | | 132 | |
| Other revenues | 16 | | | 11 | | | 29 | | | 24 | |
| Total adjusted revenues | 806 | | | 723 | | | 1,547 | | | 1,489 | |
| Adjusted expenses | | | | | | | |
| Policyholder benefits and claims and policyholder dividends | 333 | | | 263 | | | 676 | | | 573 | |
| Interest credited to policyholder account balances | 25 | | | 27 | | | 49 | | | 54 | |
| Capitalization of DAC | (122) | | | (115) | | | (249) | | | (245) | |
| Amortization of DAC and VOBA | 94 | | | 85 | | | 156 | | | 215 | |
| Amortization of negative VOBA | (2) | | | (2) | | | (4) | | | (4) | |
| | | | | | | |
| Other expenses | 349 | | | 328 | | | 698 | | | 660 | |
| Total adjusted expenses | 677 | | | 586 | | | 1,326 | | | 1,253 | |
| Provision for income tax expense (benefit) | 35 | | | 21 | | | 56 | | | 42 | |
| Adjusted earnings | $ | 94 | | | $ | 116 | | | $ | 165 | | | $ | 194 | |
| | | | | | | |
| Adjusted earnings on a constant currency basis | $ | 94 | | | $ | 122 | | | $ | 165 | | | $ | 202 | |
| | | | | | | |
| Adjusted premiums, fees and other revenues | $ | 744 | | | $ | 660 | | | $ | 1,422 | | | $ | 1,357 | |
| Adjusted premiums, fees and other revenues on a constant currency basis | $ | 744 | | | $ | 690 | | | $ | 1,422 | | | $ | 1,405 | |
NineThree Months Ended SeptemberJune 30, 20172021 Compared with the NineThree Months Ended SeptemberJune 30, 20162020
Unless otherwise stated, all amounts discussed below are net of income tax.
Foreign Currency. Changes in foreign currency exchange rates reduced operatingincreased adjusted earnings by $15$6 million for the first nine monthssecond quarter of 20172021 as compared to the prior period, primarily driven by the weakening of the U.S. dollar against the British pound, the euro, Czech koruna and the Polish zloty, partially offset by the strengthening of the U.S. dollar against the Egyptian pound and Turkish lira. Unless otherwise stated, all amounts discussed below are net of foreign currency fluctuations. Foreign currency fluctuations can result in significant variances in the financial statement line items.
Business Growth. Growth across several European markets and in our (i) corporate solutions business in the U.K., (ii) variable life business across the region, (iii) pension business in Romania, as well as (iv) ordinary life and accident &and health and credit life businesses in Turkey, partially offsetEurope, resulted in a $19 million increase in adjusted earnings.
Underwriting and Other Insurance Adjustments. Adjusted earnings decreased by $42 million as a result of unfavorable underwriting experience, primarily due to the impact of the COVID-19 Pandemic, which resulted in lower premium persistencyutilization in the prior period and higher claims in the current period. Unfavorable underwriting experience in our employee benefits(i) corporate solutions business across the region, (ii) variable life business in the Gulf increased operating earnings by $17 million.
Underwriting, Actuarial Assumption Review and Other Insurance Adjustments. Unfavorable underwriting, primarily in our employee benefitsLebanon, (iii) accident & health business in the U.K.,Europe, and (iv) ordinary life business in Portugal was partially offset by favorable underwriting experience in our accident & health, credit and employee benefits businessesordinary life business in the Middle East, decreased operating earnings by $3 million. The impact in both periods of our annual actuarial assumption review resulted in a net operating earnings increase of $8 million.France. Refinements to certain insuranceinsurance-related assets and liabilities and other adjustments in both periods resulted in a $6$7 million decrease to operatingincrease in adjusted earnings.
Expenses. Operating expensesTaxes and Other. Taxes decreased adjusted earnings by $14$9 million, due to timingchanges in business mix among tax jurisdictions, as well as a revision to a tax asset in Greece. Adjusted earnings decreased by $4 million due to the disposition of MetLife Russia.
Six Months Ended June 30, 2021 Compared with the Six Months Ended June 30, 2020
Unless otherwise stated, all amounts discussed below are net of income tax.
Foreign Currency. Changes in foreign currency exchange rates increased adjusted earnings by $8 million for the first six months of 2021 as compared to the prior period, primarily driven by the weakening of the U.S. dollar against the euro, the British pound, Czech koruna and expense disciplinethe Polish zloty, partially offset by the strengthening of the U.S. dollar against the Turkish lira. Unless otherwise stated, all amounts discussed below are net of foreign currency fluctuations. Foreign currency fluctuations can result in significant variances in the financial statement line items.
Business Growth. Growth in our (i) corporate solutions business in the U.K., (ii) pension business in Romania, and (iii) ordinary life and accident and health businesses in Europe resulted in an $18 million increase in adjusted earnings.
Market Factors. Market factors, including interest rate levels and variability in equity market returns favorably impacted results and increased adjusted earnings by $8 million. This was primarily due to a decrease in DAC amortization in our variable life business.
Underwriting and Other Insurance Adjustments. Adjusted earnings decreased $53 million as a result of unfavorable underwriting experience, primarily due to the impact of the COVID-19 Pandemic, which resulted in lower utilization in the prior period and higher claims in the current period. Unfavorable underwriting experience in our (i) corporate solutions business across the region, as well as enterprise-wide initiatives, notably the closing of the wealth management product to new(ii) variable life business in the U.K.Gulf, Lebanon and Czech Republic, and (iii) accident & health business in Europe and the Gulf was partially offset by favorable underwriting experience in our ordinary life business in France. Refinements to certain insurance-related assets and liabilities in both periods resulted in a $13 million increase in adjusted earnings.
Expenses, Taxes and Other. A current period incremental tax expense in Russia of $2 million and a Lower prior period benefit of $3 million following the cancellation of a distribution agreement with one of our bancassurance partnerscompensation-related and various other expenses decreased operatingadjusted earnings by $5 million. This was largely offsetTaxes decreased adjusted earnings by lower effective$12 million, primarily due to changes in business mix among tax rates, which resultedjurisdictions, as well as a revision to a tax asset in a $4Greece. Adjusted earnings decreased by $6 million increasedue to operating earnings.the disposition of MetLife Russia.
MetLife Holdings
Business Overview. In connection with Our MetLife Holdings segment consists of operations relating to products and businesses, previously included in our former retail business, that we no longer actively market in the Separation and the U.S. Retail Advisor Force Divestiture, we have discontinued the marketing of life and annuity products in this segment, which has led to lower sales for the three months ended September 30, 2017 compared to the prior period. This will result in a declining DAC asset over time and weUnited States. We anticipate an average decline in adjusted premiums, fees and other revenues of approximately 5% to 7% per year from expected business run-off. The impact of recapturing certain agreements in both periods in connection with the Separation had a material impact on our results. A significant portion of our operatingadjusted earnings is driven by separate account balances. Most directly, these balances which determine asset-based fee income but they also impact DAC amortization and asset-based commissions. Separate account balances are driven by sales, movements in the market, surrenders, deposits, withdrawals, benefit payments, transfers and policy charges. Separate account balances increased due to equity market performance, partially offset by the impact of negative net flows, as benefits, surrenders and withdrawals exceeded sales. Although we have discontinued selling our long-term care product, we continue to collect premiums and administer the existing block of business, which contributed to asset growth in the segment, and we expect the related reserves to grow as this block matures.
| | | | | | | | | | | | Three Months
Ended
June 30, | | Six Months
Ended
June 30, |
| | Three Months
Ended
September 30, | | Nine Months
Ended
September 30, | | 2021 | | 2020 | | 2021 | | 2020 |
| | 2017 | | 2016 | | 2017 | | 2016 | | (In millions) |
| | (In millions) | |
| Operating revenues | | | | | | | | |
| Adjusted revenues | | Adjusted revenues | |
| Premiums | $ | 989 |
| | $ | 1,093 |
| | $ | 3,070 |
| | $ | 3,312 |
| Premiums | $ | 839 | | | $ | 889 | | | $ | 1,666 | | | $ | 1,793 | |
| Universal life and investment-type product policy fees | 349 |
| | 357 |
| | 1,056 |
| | 1,073 |
| Universal life and investment-type product policy fees | 273 | | | 249 | | | 547 | | | 543 | |
| Net investment income | 1,390 |
| | 1,537 |
| | 4,232 |
| | 4,489 |
| Net investment income | 1,543 | | | 981 | | | 3,189 | | | 2,296 | |
| Other revenues | 37 |
| | 105 |
| | 170 |
| | 512 |
| Other revenues | 69 | | | 70 | | | 131 | | | 105 | |
| Total operating revenues | 2,765 |
| | 3,092 |
| | 8,528 |
| | 9,386 |
| |
| Operating expenses | | | | | | | | |
| Total adjusted revenues | | Total adjusted revenues | 2,724 | | | 2,189 | | | 5,533 | | | 4,737 | |
| Adjusted expenses | | Adjusted expenses | | | | | | | |
| Policyholder benefits and claims and policyholder dividends | 1,661 |
| | 1,853 |
| | 5,117 |
| | 5,603 |
| Policyholder benefits and claims and policyholder dividends | 1,549 | | | 1,705 | | | 3,072 | | | 3,366 | |
| Interest credited to policyholder account balances | 255 |
| | 261 |
| | 767 |
| | 780 |
| Interest credited to policyholder account balances | 210 | | | 219 | | | 420 | | | 437 | |
| Capitalization of DAC | (14 | ) | | (44 | ) | | (71 | ) | | (240 | ) | Capitalization of DAC | (9) | | | (5) | | | (17) | | | (10) | |
| Amortization of DAC and VOBA | (70 | ) | | 219 |
| | 143 |
| | 636 |
| Amortization of DAC and VOBA | 56 | | | 11 | | | 110 | | | 111 | |
| Interest expense on debt | 2 |
| | 15 |
| | 22 |
| | 43 |
| Interest expense on debt | 2 | | | 1 | | | 3 | | | 3 | |
| Other operating expenses | 322 |
| | 401 |
| | 1,032 |
| | 1,861 |
| |
| Total operating expenses | 2,156 |
| | 2,705 |
| | 7,010 |
| | 8,683 |
| |
| Other expenses | | Other expenses | 244 | | | 239 | | | 497 | | | 467 | |
| Total adjusted expenses | | Total adjusted expenses | 2,052 | | | 2,170 | | | 4,085 | | | 4,374 | |
| Provision for income tax expense (benefit) | 199 |
| | 121 |
| | 488 |
| | 203 |
| Provision for income tax expense (benefit) | 136 | | | (1) | | | 294 | | | 66 | |
| Operating earnings | $ | 410 |
| | $ | 266 |
| | $ | 1,030 |
| | $ | 500 |
| |
| Adjusted earnings | | Adjusted earnings | $ | 536 | | | $ | 20 | | | $ | 1,154 | | | $ | 297 | |
| | Adjusted premiums, fees and other revenues | | Adjusted premiums, fees and other revenues | $ | 1,181 | | | $ | 1,208 | | | $ | 2,344 | | | $ | 2,441 | |
Three Months Ended SeptemberJune 30, 20172021 Compared with the Three Months Ended SeptemberJune 30, 20162020
Unless otherwise stated, all amounts discussed below are net of income tax.
Business Growth. LowerNegative net investment income, resulting from a reduced invested asset base, decreased operating earnings. The reduced asset base is primarily the result of the 2016 recapture of certain assumed single-premium deferred annuity reinsurance agreements with Brighthouse. This decline was partially offset by net asset growthflows in our long-term care and life businesses. Consistent with this asset growth, interest credited on insurance liabilities increased.annuity business resulted in lower asset-based fee income. In our deferred annuities business, negative net flows contributed toaddition, a decrease in average separate account balances, and consequently, asset based-feeinvested assets resulted in lower net investment income. The combined impact of the items discussed aboveaffecting our business growth, including higher DAC amortization, resulted in a $121$18 million decrease in operatingadjusted earnings.
Market Factors.Factors. Market factors, including interest rate levels, variability in equity market returns, and foreign currency exchange rate fluctuations, continued to impact our results; however, certain impacts were mitigated by derivatives used to hedge these risks. Investment yields decreased primarily due to declines in derivative income and prepayment fees, as well as higher prior periodincreased driven by the favorable impact of equity market returns on real estate joint ventures andour private equities.equity funds, partially offset by lower yields on fixed income securities. In our deferred annuity business, higher current period equity market returns drove an increase in average separate account balances which resulted in higher asset-based fee income.income, which increased adjusted earnings. The changes in market factors discussed above, including higher DAC amortization, resulted in a $15$463 million decreaseincrease in operatingadjusted earnings.
UnderwritingActuarial Assumption Reviewand Other Insurance Adjustments. Favorable mortalityunderwriting, mainly in our life business,and long-term care businesses, partially offset by unfavorable claims experience in our long-term careimmediate annuity business, resulted in a $7$36 million increase in operating earnings. Theadjusted earnings, which reflects the impact of the COVID-19 Pandemic. Dividend scale reductions, as well as run-off in both periods of our actuarial assumption review resulted in an increase of $155 million in operating earningsMetropolitan Life Insurance Company’s (“MLIC”) closed block, contributed to lower dividend expense and was primarily related to favorable DAC unlockings in the current period compared to unfavorable DAC unlockings in the prior period, primarily in our life business. The annual review in the current period included all of our annuity and life businesses, whereas the annual review in the prior period included our annuity and life businesses with the exception of our U.S. variable annuity business. Refinements to DAC and certain insurance-related liabilities that were recorded in both periods resulted in a $70$39 million increase in operatingadjusted earnings. This includes favorable current period reserve refinements
Expenses. Operating earnings increased by $35 million as a result of lower expenses, primarily due to lower employee-related costs, partially offset by Separation-related expenses.
NineSix Months Ended SeptemberJune 30, 20172021 Compared with the NineSix Months Ended SeptemberJune 30, 20162020
Unless otherwise stated, all amounts discussed below are net of income tax.
Business Growth. LowerNegative net investment income, resulting from a reduced invested asset base, decreased operating earnings. The reduced asset base is primarily the result of the 2016 recapture of certain assumed single-premium deferred annuity reinsurance agreements with Brighthouse. This decline was partially offset by net asset growthflows in our long-term careannuity business resulted in lower asset-based fee income. In addition, premiums declined due to business run-off and life businesses. Consistent with this asset growth, interest credited on insurance liabilities increased. In our deferred annuities business, negative net flows contributed tothe impact of dividend scale reductions. Also, a decrease in average separate account balances, and consequently, asset-based fee income. The discontinuance of a distribution agreement, resulting from the Separation, also contributed to the decline in variable annuity fee income. In our life business, a decrease in universal life salesinvested assets resulted in lower fee income, decreasing operating earnings.net investment income. The combined impact of the items discussed aboveaffecting our business growth, including higher DAC amortization, resulted in a $269$35 million decrease in operatingadjusted earnings.
Market Factors.Factors. Market factors, including interest rate levels, variability in equity market returns, and foreign currency exchange rate fluctuations, continued to impact our results; however, certain impacts were mitigated by derivatives used to hedge these risks. Investment yields decreased primarily due to declines in derivative income and prepayment fees, as well as lowerincreased driven by the favorable impact of equity market returns on real estate joint ventures. These reductions in yields wereour private equity funds and higher net investment income on derivatives, partially offset by higher returnslower yields on other limited partnership interests, driven by improvements in equity market performance.fixed income securities. In our deferred annuity business, higher equity market returns drove an increase in average separate account balances which resulted in higher asset-based fee income. Operating earningsincome, which increased due to declines in DAC amortization.adjusted earnings. The changes in market factors discussed above resulted in a slight$761 million increase in operatingadjusted earnings.
UnderwritingActuarial Assumption Reviewand Other Insurance Adjustments. Favorable mortality in our life business, partially offset by unfavorable claims experienceunderwriting, mainly in our long-term care business,and universal life businesses, resulted in a $27$77 million increase in operating earnings. Theadjusted earnings, which reflects the impact of the COVID-19 Pandemic. Dividend scale reductions, as well as run-off in both periods of our annual actuarial assumption review resulted in an increase of $179 million in operating earningsMLIC’s closed block, contributed to lower dividend expense and was primarily related to favorable DAC unlockings in the current period compared to unfavorable DAC unlockings in the prior period, primarily in our life business. Refinements to DAC and certain insurance-related liabilities that were recorded in both periods resulted in a $178$73 million increase in operatingadjusted earnings. This includes favorable current period refinements of (i) a $36
Expenses. Adjusted earnings decreased by $19 million DAC adjustment related to certain participating whole life business assumed from Brighthouse; and (ii) reserve adjustments resulting from modeling improvements in the reserving process of $55 million and $28 million, in our life and long-term care businesses, respectively. This also includes a current period net unfavorable impact from a life reinsurance recapture and an unfavorable prior period adjustment of $30 million resulting from modeling improvements in the reserving process in our universal life business.
Expenses. Operating earnings increased by $138 million as a result of lower expenses, primarily due to lower costs as a result of the U.S. Retail Advisor Force Divestiture, partially offset by Separation-related expenses.
Other. In connection with the Separation, annuities reinsurance activity with Brighthouse increased operating earnings by $254 million. This favorable impact was primarily due to the recapture in 2016 of certain single-premium deferred annuity reinsurance agreements, and the elimination of interest credited payments on the related reinsurance payable, as well as lower DAC amortization. This increase was partially offset by the net unfavorable impact in the current period from the recapture and novation of, as well as refinements to, assumed and ceded agreements covering certain variable annuity business. Favorable results from our reinsurance agreement with our former operating joint venture in Japanmainly due to higher fund returns resulted in a $17 million increase in operating earnings.
corporate-related expenses.
Corporate & Other
| | | | | | | | | | | | Three Months
Ended
June 30, | | Six Months
Ended
June 30, |
| | Three Months
Ended
September 30, | | Nine Months
Ended
September 30, | | 2021 | | 2020 | | 2021 | | 2020 |
| | 2017 | | 2016 | | 2017 | | 2016 | | (In millions) |
| | (In millions) | |
| Operating revenues | | | | | | | | |
| Adjusted revenues | | Adjusted revenues | |
| Premiums | $ | 13 |
| | $ | 41 |
| | $ | 59 |
| | $ | 50 |
| Premiums | $ | (20) | | | $ | 13 | | | $ | 38 | | | $ | 25 | |
| Universal life and investment-type product policy fees | — |
| | — |
| | — |
| | 2 |
| Universal life and investment-type product policy fees | 1 | | | 1 | | | 1 | | | 1 | |
| Net investment income | 26 |
| | 53 |
| | 107 |
| | 141 |
| Net investment income | 48 | | | (52) | | | 60 | | | (36) | |
| Other revenues | 65 |
| | 22 |
| | 185 |
| | 70 |
| Other revenues | 109 | | | 72 | | | 195 | | | 156 | |
| Total operating revenues | 104 |
| | 116 |
| | 351 |
| | 263 |
| |
| Operating expenses | | | | | | | | |
| Total adjusted revenues | | Total adjusted revenues | 138 | | | 34 | | | 294 | | | 146 | |
| Adjusted expenses | | Adjusted expenses | | | | | | | |
| Policyholder benefits and claims and policyholder dividends | 7 |
| | 31 |
| | 33 |
| | 23 |
| Policyholder benefits and claims and policyholder dividends | (13) | | | 3 | | | 27 | | | 29 | |
| Interest credited to policyholder account balances | — |
| | (1 | ) | | 1 |
| | 5 |
| |
| | Capitalization of DAC | (2 | ) | | 1 |
| | (6 | ) | | (7 | ) | Capitalization of DAC | (3) | | | (2) | | | (6) | | | (5) | |
| Amortization of DAC and VOBA | 3 |
| | 1 |
| | 5 |
| | 7 |
| Amortization of DAC and VOBA | 3 | | | 3 | | | 5 | | | 4 | |
| Interest expense on debt | 279 |
| | 275 |
| | 833 |
| | 862 |
| Interest expense on debt | 223 | | | 228 | | | 447 | | | 445 | |
| Other operating expenses | 237 |
| | 85 |
| | 649 |
| | 401 |
| |
| Total operating expenses | 524 |
| | 392 |
| | 1,515 |
| | 1,291 |
| |
| Other expenses | | Other expenses | 34 | | | 134 | | | 141 | | | 270 | |
| Total adjusted expenses | | Total adjusted expenses | 244 | | | 366 | | | 614 | | | 743 | |
| Provision for income tax expense (benefit) | (90 | ) | | (288 | ) | | (642 | ) | | (658 | ) | Provision for income tax expense (benefit) | (81) | | | (120) | | | (192) | | | (286) | |
| Operating earnings | (330 | ) | | 12 |
| | (522 | ) | | (370 | ) | |
| Adjusted earnings | | Adjusted earnings | (25) | | | (212) | | | (128) | | | (311) | |
| Less: Preferred stock dividends | 6 |
| | 6 |
| | 58 |
| | 58 |
| Less: Preferred stock dividends | 35 | | | 77 | | | 103 | | | 109 | |
| Operating earnings available to common shareholders | $ | (336 | ) | | $ | 6 |
| | $ | (580 | ) | | $ | (428 | ) | |
| Adjusted earnings available to common shareholders | | Adjusted earnings available to common shareholders | $ | (60) | | | $ | (289) | | | $ | (231) | | | $ | (420) | |
| | Adjusted premiums, fees and other revenues | | Adjusted premiums, fees and other revenues | $ | 90 | | | $ | 86 | | | $ | 234 | | | $ | 182 | |
The table below presents operatingadjusted earnings available to common shareholders by source, net of income tax:source:
| | | | | | | | | | | | | | | | | | | | | | | | |
| Three Months
Ended
June 30, | | Six Months
Ended
June 30, | |
| 2021 | | 2020 | | 2021 | | 2020 | |
| (In millions) | |
| Business activities | $ | 28 | | | $ | 12 | | | $ | 57 | | | $ | 30 | | |
| Net investment income | 51 | | | (50) | | | 64 | | | (33) | | |
| Interest expense on debt | (235) | | | (238) | | | (469) | | | (467) | | |
| Corporate initiatives and projects | (24) | | | (25) | | | (49) | | | (56) | | |
| Other | 74 | | | (31) | | | 77 | | | (71) | | |
| Provision for income tax (expense) benefit and other tax-related items | 81 | | | 120 | | | 192 | | | 286 | | |
| Preferred stock dividends | (35) | | | (77) | | | (103) | | | (109) | | |
| Adjusted earnings available to common shareholders | $ | (60) | | | $ | (289) | | | $ | (231) | | | $ | (420) | | |
|
| | | | | | | | | | | | | | | |
| | Three Months
Ended
September 30, | | Nine Months
Ended
September 30, |
| | 2017 | | 2016 | | 2017 | | 2016 |
| | (In millions) |
| Other business activities | $ | 3 |
| | $ | 6 |
| | $ | 12 |
| | $ | (6 | ) |
| Other net investment income | 32 |
| | 66 |
| | 126 |
| | 172 |
|
| Interest expense on debt | (195 | ) | | (197 | ) | | (586 | ) | | (617 | ) |
| Preferred stock dividends | (6 | ) | | (6 | ) | | (58 | ) | | (58 | ) |
| Corporate initiatives and projects | (29 | ) | | (23 | ) | | (128 | ) | | (83 | ) |
| Incremental tax benefit (expense) | (58 | ) | | 190 |
| | 235 |
| | 297 |
|
| Other | (83 | ) | | (30 | ) | | (181 | ) | | (133 | ) |
| Operating earnings available to common shareholders | $ | (336 | ) | | $ | 6 |
| | $ | (580 | ) | | $ | (428 | ) |
Three Months Ended SeptemberJune 30, 20172021 Compared with the Three Months Ended SeptemberJune 30, 20162020
Unless otherwise stated, all amounts discussed below are net of income tax.
Other Business Activities. Adjusted earnings from business activities increased $13 million. This was primarily related to improved results from certain of our businesses.
Net Investment Income. Other net Net investment income decreased by $34 million primarily driven by lower returns on real estate joint ventures, alternative investments, cash, shorter-term investments and fixed maturity securities. These decreases were partially offset by higher income on mortgage loans and a decrease in the amount credited to the segments due to both a reduction in the crediting rate and the amount of economic capital managed by Corporate & Other on their behalf.
Corporate Initiatives and Projects. Expenses associated with corporate initiatives and projects increased by $6$80 million, primarily due to higher costs associated with enterprise-wide initiatives, primarily related to its unit cost initiative.increased returns on our private equity funds, partially offset by lower yields on our fixed income securities and decreased returns on FVO Securities.
IncrementalProvision for Income Tax Benefit. (Expense) Benefit and Other Tax-Related Items. A favorable change in Corporate & Other benefits from the impact of certain permanent tax preferenced items, including non-taxable investment income and tax credits for investments in low income housing. As a result, ourOther’s effective tax rate differs from the U.S. statutory rate of 35%. In the current period, we had a $180 million net tax charge relatedwas primarily due to the future repatriation of approximately $3.0 billion of cash following the post-Separation review of our capital needs, partially offset by a tax benefit associated with dividends from our non-U.S. operations and a $13 million net tax-related benefit, including interest, from the finalization of certain tax audits. Results for the prior period include a $36 million tax benefit related to tax audit settlements. In addition, decreasedhigher utilization of tax preferenced items, decreased operatingwhich include non-taxable investment income, tax credits and foreign earnings by $36taxed at different rates than the U.S. statutory rate.
Other. Adjusted earnings increased $83 million, fromprimarily as a result of the prior period.
Other. An increaserelease of a legal reserve in employee-related expenses resulted inthe current period and a $50 million decrease in operating earnings. This was partially offset by an $11other corporate-related expenses.
Preferred Stock Dividends. Adjusted earnings available to common shareholders increased $42 million increaseprimarily as a result of changes in operating earnings resulting from net adjustments to certain reinsurance assetsdividend payments on the 5.25% Fixed-to-Floating Rate Non-Cumulative Preferred Stock, Series C (the “Series C preferred stock”) and liabilitiesthe partial redemption of this preferred stock in both periods.the fourth quarter of 2020.
NineSix Months Ended SeptemberJune 30, 20172021 Compared with the NineSix Months Ended SeptemberJune 30, 20162020
Unless otherwise stated, all amounts discussed below are net of income tax.
Other Business Activities. Operating Adjusted earnings from other business activities increased $17$21 million. This was primarily related to improved results from certain of our start-up operations.businesses.
Other Net Investment Income.Other net Net investment income decreased by $46 million primarily driven by a lower invested asset base, as well as lower returns on real estate joint ventures and alternative investments. These decreases were partially offset by higher income on mortgage loans and a decrease in the amount credited to the segments due to both a reduction in the crediting rate and the amount of economic capital managed by Corporate & Other on their behalf.
Interest Expense on Debt. Interest expense on debt decreased by $31 million, mainly due to the maturity of $1.25 billion of our senior notes in June 2016.
Corporate Initiatives and Projects. Expenses associated with corporate initiatives and projects increased by $45$77 million, primarily due to higher costs associated with enterprise-wide initiatives, primarily related to lease impairments and costs related to its unit cost initiative.
Incremental Tax Benefit. Corporate & Other benefits from the impact of certain permanent tax preferenced items, including non-taxable investment income and tax credits for investments in low income housing. As a result,increased returns on our effective tax rate differs from the U.S. statutory rate of 35%. In the current period, we had a $180 million net tax charge related to the future repatriation of approximately $3.0 billion of cash following the post-Separation review of our capital needs,private equity funds, partially offset by a tax benefit associated with dividends fromlower yields on our non-U.S. operationsfixed income securities and a $40 million net tax-related benefit, including interest, fromdecreased returns on FVO Securities.
Provision for Income Tax (Expense) Benefit and Other Tax-Related Items. An unfavorable change in Corporate & Other’s taxes was primarily due to the finalization of certain tax audits. Resultsbankruptcy proceedings for a leveraged lease investment in the prior period, include a $36 million tax benefit related to tax audit settlements. In addition, higherlower taxes on stock compensation and lower utilization of tax preferenced items, which include non-taxable investment income, tax credits and foreign earnings taxed at different rates than the U.S. statutory rate.
Other. Adjusted earnings increased operating earnings by $127$117 million, overprimarily as a result of the prior period.
Other. Therelease of a legal reserve in the current period, includes $44 million ofa decrease in certain corporate-related expenses incurred relatedand lower interest expense on tax positions due to audit settlements in the guaranty fund assessment for Penn Treaty and an increase in litigation reserves, as well as a $48 million increase in employee-related expenses. These increases werecurrent period, partially offset by higher employee-related costs.
Preferred Stock Dividends. Adjusted earnings available to common shareholders increased $6 million as a $14 million decreaseresult of changes in certain corporate expensesdividend payments on the Series C preferred stock and $26 millionthe partial redemption in the fourth quarter of favorable net adjustments to certain reinsurance assets and liabilities2020 of the Series C preferred stock, partially offset by dividends paid on the 3.85% Fixed Rate Reset Non-Cumulative Preferred Stock, Series G we issued in both periods.
September 2020.
Investments
Investment Risks
Our primary investment objective is to optimize, net of income tax, risk-adjusted net investment income and risk-adjusted total return while ensuring that assets and liabilities are managed on a cash flow and duration basis. The Investments Department, led by the Chief Investment Officer, manages investment risks using a risk control framework comprised of policies, procedures and limits, as discussed further below.limits. The InvestmentsInvestment Risk Committee chaired by the Global Risk Management Department, reviews and monitorsAsset-Liability Steering Committee review and monitor investment risk limits and tolerances. We are exposed to the following primary sources of investment risks:
credit risk, relating to the uncertainty associated with the continued ability of a given obligor to make timely payments of principal and interest;
interest rate risk, relating to the market price and cash flow variability associated with changes in market interest rates. Changes in market interest rates will impact the net unrealized gain or loss position of our fixed income investment portfolio and the rates of return we receive on both new funds invested and reinvestment of existing funds;
liquidity risk, relating to the diminished ability to sell certain investments, in times of strained market conditions;
market valuation risk, relating to the variability in the estimated fair value of investments associated with changes in market factors such as credit spreads and equity market levels. A widening of credit spreads will adversely impact the net unrealized gain (loss) position of the fixed income investment portfolio, will increase losses associated with credit-based non-qualifying derivatives where we assume credit exposure, and, if credit spreads widen significantly or for an extended period of time, will likely result in higher other-than-temporary impairment (“OTTI”). Credit spread tightening will reduce net investment income associated with purchases of fixed maturity securities and will favorably impact the net unrealized gain (loss) position of the fixed income investment portfolio;
currency risk, relating to the variability in currency exchange rates for foreign denominated investments. This risk relates to potential decreases in estimated fair value and net investment income resulting from changes in currency exchange rates versus the U.S. dollar. In general, the weakening of foreign currencies versus the U.S. dollar will adversely affect the estimated fair value of our foreign denominated investments; and
real estate risk, relating to commercial, agricultural and residential real estate, and stemming from factors, which include, but are not limited to, market conditions, including the demand and supply of leasable commercial space, creditworthiness of borrowers and their tenants and joint venture partners, capital markets volatility and inherent interest rate movements.
We manage investment risk through in-house fundamental credit analysis of the underlying obligors, issuers, transaction structures and real estate properties. We also manage credit risk, market valuation risk and liquidity risk through industry and issuer diversification and asset allocation. Risk limits to promote diversification by asset sector, to avoid concentrations in any single issuer and to limit overall aggregate credit and equity risk exposure, as measured by our economic capital framework, are approved annually by a committee of directors that oversees our investment portfolio. For real estate assets, we manage credit risk and market valuation risk through geographic, property type and product type diversification and asset allocation. We manage interest rate risk as part of our ALM strategies. These strategies include maintaining an investment portfolio with diversified maturities that has a weighted average duration that reflects the duration of our estimated liability cash flow profile, and utilizing product design, such as the use of market value adjustment features and surrender charges, to manage interest rate risk. We also manage interest rate risk through proactive monitoring and management of certain non-guaranteed elements of our products, such as the resetting of credited interest and dividend rates for policies that permit such adjustments. In addition to hedging with foreign currency derivatives, we manage currency risk by matching much of our foreign currency liabilities in our foreign subsidiaries with their respective foreign currency assets, thereby reducing our risk to foreign currency exchange rate fluctuation. We also use certain derivatives in the management of credit, interest rate and market valuation risk.
We use purchased credit default swaps to mitigate credit risk in our investment portfolio. Generally, we purchase credit protection by entering into credit default swaps referencing the issuers of specific assets we own. In certain cases, basis risk exists between these credit default swaps and the specific assets we own. For example, we may purchase credit protection on a macro basis to reduce exposure to specific industries or other portfolio concentrations. In such instances, the referenced entities and obligations under the credit default swaps may not be identical to the individual obligors or securities in our investment portfolio. In addition, our purchased credit default swaps may have shorter tenors than the underlying investments they are hedging. However, we dynamically hedge this risk through the rebalancing and rollover of our credit default swaps at their most liquid tenors. We believe that our purchased credit default swaps serve as effective economic hedges of our credit exposure.
We enter into market standard purchased and written credit default swap contracts. Payout under such contracts is triggered by certain credit events experienced by the referenced entities. For credit default swaps covering North American corporate issuers, credit events typically include bankruptcy and failure to pay on borrowed money. For European corporate issuers, credit events typically also include involuntary restructuring. With respect to credit default contracts on Western European sovereign debt, credit events typically include failure to pay debt obligations, repudiation, moratorium, or involuntary restructuring. In each case, payout on a credit default swap is triggered only after the Credit Derivatives Determinations Committee of the International Swaps and Derivatives Association determines that a credit event has occurred.
Current Environment
The global economy and markets continue to be affected by stress and volatility, which has adversely affected the financial services sector, in particular, and global capital markets. Recently, political and/or economic instability in the U.K., Mexico, Italy, Turkey and Puerto Rico have contributed to global market volatility. Events following the U.K.’s referendum on June 23, 2016 and the uncertainties, including foreign currency exchange risks, associated with its pending withdrawal from the EU have also contributed to market volatility, both in the U.S. and beyond. See “— Industry Trends — Financial and Economic Environment.”
As a global insurance company, we are affected by the monetary policy of central banks around the world. See “— Industry Trends — Financial and Economic Environment” for further information on such measures, as well as for information regarding actions taken by Japan’s central government and the Bank of Japan to boost inflation expectations and achieve sustainable economic growth in Japan. See also “— Industry Trends — Impact of a Sustained Low Interest Rate Environment” for information regarding the June 2017 action taken by the FOMC to raise the federal funds rate. The Federal Reserve may take further actions to influence interest rates in the future, which may have an impact on the pricing levels of risk-bearing investments and may adversely impact the level of product sales.
European Investments
We maintain general account investments in Europe to support our insurance operations and related policyholder liabilities in these countries and certain of our non-European operations invest in Europe for diversification. In Europe, we have proactively mitigated risk in both direct and indirect exposures by investing in a diversified portfolio of high quality investments with a focus on the higher-rated countries, including the U.K., Germany, France, the Netherlands, Poland, Norway and Sweden. The sovereign debt of these countries continues to maintain investment grade credit ratings from all major rating agencies. Our European fixed maturity and perpetual hybrid securities classified as non-redeemable preferred stock are invested in a diversified portfolio of primarily non-financial services securities. At September 30, 2017, our exposure to such securities in Europe totaled $37.9 billion, at estimated fair value, of which $8.6 billion was in sovereign fixed maturity securities. See “Management’s Discussion and Analysis of Financial Condition and Results of Operations — Investments — Current Environment — European Investments”Investment Risks” included in the 20162020 Annual Report for further information.an explanation of investment risks and our risk control framework.
Selected Country
Current Environment
As a global insurance company, we continue to be impacted by the changing global financial and Sector Investments
Recent elevated levelseconomic environment, the fiscal and monetary policy of marketgovernments and central banks around the world and other governmental measures. The COVID-19 Pandemic continues to impact the global economy and financial markets and has caused volatility have affectedin the performance of various asset classes. Contributing factors include concerns about global economic conditionsequity, credit and capital markets; lower energy and oil prices impacting the energy sector and recent country specific volatility due to local economic and/or political concerns has affected the performance of certain of our investments.real estate markets. See “— Industry Trends — Financial and Economic Environment.” Whether or when the global economy will return to the level of output and consumption prior to the COVID-19 Pandemic is uncertain. This uncertainty may persist for some time and may continue to impact pricing levels of risk-bearing investments, as well as our business operations, investment portfolio and derivatives.
Governments and central banks around the world are responding to the COVID-19 Pandemic with unprecedented fiscal and monetary policies, which have had significant effects and may have ongoing effects on financial markets and the global economy. These policy responses include fiscal and monetary stimulus measures, including, but not limited to, financial assistance, liquidity programs, new financing facilities and reductions in the level of interest rates. As time progresses, we will know more about the efficacy of these policies and what they may mean for the outlook for the global economy and financial markets, but currently the number of factors makes reliably estimating the duration and severity of the impact of the COVID-19 Pandemic on our business operations, investment portfolio and derivatives difficult.
Selected Country and Sector Investments
Selected Country: We have exposure to such volatility, as we maintain general account investmentsa market presence in the U.K., Mexico, Italy, Turkeynumerous countries and, Puerto Rico to supporttherefore, our investment portfolio, which supports our insurance operations and related policyholder liabilities, in these countries; and we also have exposure throughas well as our global portfolio diversification.diversification objectives, is exposed to risks posed by local political and economic conditions, as well as those resulting from the COVID-19 Pandemic. Our exposure to sovereigninvestment portfolio is currently the most affected by these conditions for the countries in the table below. The following table presents a summary of selected country fixed maturity securities AFS, at estimated fair value. The information below is presented on a “country of risk basis” (e.g. where the issuer primarily conducts business).
| | | | | | | | | | | | | | | | | | | | | | | | | | | | | |
| | Selected Country Fixed Maturity Securities AFS at June 30, 2021 |
| Country | Sovereign (1) | | Financial
Services | | Non-Financial
Services | | Structured Products | | Total (2) |
| | (Dollars in millions) |
| Mexico | $ | 2,747 | | | $ | 766 | | | $ | 2,202 | | | $ | 36 | | | $ | 5,751 | |
| Chile | 1,527 | | | 919 | | | 3,161 | | | 3 | | | 5,610 | |
| Colombia | 380 | | | 80 | | | 196 | | | — | | | 656 | |
| | | | | | | | | |
| | | | | | | | | |
| Peru | 120 | | | 49 | | | 272 | | | — | | | 441 | |
| Turkey | 99 | | | 2 | | | 14 | | | — | | | 115 | |
| | | | | | | | | |
| Argentina (3) | 72 | | | 1 | | | 22 | | | — | | | 95 | |
| Total | $ | 4,945 | | | $ | 1,817 | | | $ | 5,867 | | | $ | 39 | | | $ | 12,668 | |
| Investment grade % | 93.6 | % | | 95.9 | % | | 89.1 | % | | 89.2 | % | | 91.8 | % |
__________________
(1)Sovereign includes government and totalagency.
(2)The par value, amortized cost net of ACL, and estimated fair value, net of purchased credit default swaps, of these selected country fixed maturity securities of the U.K., Mexico, Italy, Turkey and Puerto Rico totaled $4.5AFS were $11.9 billion, $11.4 billion and $20.1$12.0 billion, respectively, at June 30, 2021. The notional value and estimated fair value of the purchased credit default swaps were $710 million and $2 million, respectively, at SeptemberJune 30, 2017. Our exposure to Puerto Rico political subdivision fixed maturities is in the form2021.
(3)The sovereign securities amount for Argentina was net of revenue bonds and we have no general obligation bonds. See “Management’s Discussion and AnalysisACL of Financial Condition and Results of Operations — Investments — Current Environment — $2 million at June 30, 2021.
Selected Country Investments” included in the 2016 Annual Report for further information by country.
There has been an increased focus on energy sector investments asSector: As a result of lower energycurrent economic conditions including the effects on the global economy and oil prices.financial markets from the COVID-19 Pandemic, certain sectors of our investment portfolio have continued to experience stress. Our net exposure to energy sector fixed maturity securities was $8.3 billion (comprised of fixedAFS exposure to stressed sectors is summarized below:
| | | | | | | | | | | | | | | | | |
| | Selected Sectors at June 30, 2021 |
| Sectors | Book Value (1) | | Investment
Grade % | | % of Total
Investments |
| (Dollars in millions) |
| Airports | $ | 3,233 | | | 82 | % | | 0.6 | % |
| Cruise Lines / Leisure | 755 | | | 92 | % | | 0.2 | |
| Airlines | 459 | | | 70 | % | | 0.1 | |
| Restaurants | 427 | | | 96 | % | | 0.1 | |
| Lodging | 176 | | | 68 | % | | — | |
| Fixed Maturity Securities AFS Exposure to Stressed Sectors (2) | $ | 5,050 | | | | | 1.0 | % |
| Total Investments (3) | $ | 516,280 | | | | | |
| | | | | |
| | | | | |
__________________
(1)Fixed maturity securities AFS at amortized cost, net of $8.3 billion atACL.
(2)The par value, estimated fair value, and relatedestimated fair value, net of written credit default swaps, of $65these selected sectors fixed maturity securities AFS were $5.1 billion, $5.5 billion and $5.7 billion, respectively, at June 30, 2021. The notional value and estimated fair value of the written credit default swaps were $169 million and $3 million, respectively, at notional value)June 30, 2021.
(3)Represents total cash, cash equivalents and invested assets.
We maintain a portfolio of Airports sector fixed maturity securities AFS that is diversified across issuers and geographies, with 46%, 24% and 23% of which 84% werethe exposure in Europe, Asia and U.S., respectively. This portfolio is primarily invested in higher quality, highly rated investment grade withsecurities. At June 30, 2021, this securities portfolio was in an unrealized gainsgain position of $572 million at September 30, 2017.
$340 million.
We manage direct and indirect investment exposure in the selected countries and the energy sectorsectors through fundamental credit analysis and we continually monitor and adjust our level of investment exposure. We do not expect that our general account investments in these countries and the energy sector will have a material adverse effect on our results of operations or financial condition.
Current Environment — Summary
All of these factors have had and could continue to have an adverse effect on the financial results of companies in the financial services industry, including MetLife. Such global economic conditions, as well as the global financial markets, continue to impact our net investment income, net investment gains (losses), net derivative gains (losses), level of unrealized gains (losses) within the various asset classes in our investment portfolio, and our level of investment in lower yielding cash equivalents, short-term investments and government securities. See “— Industry Trends,” and “Risk Factors — Economic Environment and Capital Markets-Related Risks — We Are Exposed to Significant Global Financial and Capital Markets Risks Which May Adversely Affect Our Results of Operations, Financial Condition and Liquidity, and May Cause Our Net Investment Income to Vary from Period to Period” included in the 2016 Annual Report.
Investment Portfolio Results
The following yield table presents the yield andreconciliation of net investment income as reported on an operating basis, for our investment portfolio for the periods indicated. We calculate yields usingunder GAAP to adjusted net investment income as reported on an operating basis. Netis presented below.
| | | | | | | | | | | | | | | | | | | | | | | |
| | For the Three Months Ended June 30, | | For the Six Months Ended June 30, |
| | 2021 | | 2020 | | 2021 | | 2020 |
| | (In millions) |
| Net investment income — GAAP basis | $ | 5,280 | | | $ | 4,087 | | | $ | 10,594 | | | $ | 7,148 | |
| Investment hedge adjustments | 212 | | | 188 | | | 432 | | | 326 | |
| Unit-linked investment income | (378) | | | (818) | | | (585) | | | 322 | |
| Other | 3 | | | (13) | | | (30) | | | (31) | |
| Adjusted net investment income (1) | $ | 5,117 | | | $ | 3,444 | | | $ | 10,411 | | | $ | 7,765 | |
__________________
(1)See “Financial Measures and Segment Accounting Policies” in Note 2 of the Notes to the Interim Condensed Consolidated Financial Statements for a discussion of the adjustments made to net investment income as reported on an operating basis, includes the impact of changesunder GAAP in foreign currency exchange rates. Thiscalculating adjusted net investment income.
The following yield table presentation is consistent with how we measure our investment performance for management purposes, and we believe it enhances understanding of our investment portfolio results.
| | | | | | | | | | | | | | | | | | | | | | | | | | | | | | | | | | | | | | | | | | | | | | | |
| | For the Three Months Ended June 30, | | For the Six Months Ended June 30, |
| | 2021 | | 2020 | | 2021 | | 2020 |
| Asset Class | Yield % (1) | | Amount | | Yield % (1) | | Amount | | Yield % (1) | | Amount | | Yield % (1) | | Amount |
| | (Dollars in millions) |
| Fixed maturity securities (2), (3) | 3.76 | | % | $ | 2,785 | | | 3.99 | | % | $ | 2,885 | | | 3.74 | | % | $ | 5,569 | | | 3.91 | | % | $ | 5,624 | |
| Mortgage loans (3) | 4.29 | | | 885 | | | 4.20 | | | 862 | | | 4.20 | | | 1,746 | | | 4.28 | | | 1,746 | |
| Real estate and real estate joint ventures | 3.65 | | | 109 | | | 0.62 | | | 18 | | | 3.42 | | | 204 | | | 1.76 | | | 99 |
| Policy loans | 5.18 | | | 120 | | | 5.15 | | | 124 | | | 5.16 | | | 241 | | | 5.19 | | | 250 |
| Equity securities | 4.30 | | | 9 | | | 4.12 | | | 11 | | | 4.62 | | | 20 | | | 4.77 | | | 25 |
| Other limited partnership interests | 36.58 | | | 1,050 | | | (30.23) | | | (605) | | | 43.04 | | | 2,335 | | | (7.06) | | | (282) |
| Cash and short-term investments | 0.72 | | | 21 | | | 1.35 | | | 38 | | | 0.79 | | | 42 | | | 1.53 | | | 82 |
| Other invested assets | | | 266 | | | | | 247 | | | | | 564 | | | | | 513 |
| Investment income | 4.85 | | % | 5,245 | | | 3.40 | | % | 3,580 | | | 4.95 | | % | 10,721 | | | 3.84 | | % | 8,057 | |
| Investment fees and expenses | (0.12) | | | (128) | | | (0.12) | | | (122) | | | (0.13) | | | (274) | | | (0.12) | | | (256) | |
| Net investment income including divested businesses (4) | 4.73 | | % | 5,117 | | | 3.28 | | % | 3,458 | | | 4.82 | | % | 10,447 | | | 3.72 | | % | 7,801 | |
| Less: net investment income from divested businesses (4) | | | — | | | | | 14 | | | | | 36 | | | | | 36 | |
| Adjusted net investment income | | | $ | 5,117 | | | | | $ | 3,444 | | | | | $ | 10,411 | | | | | $ | 7,765 | |
|
| | | | | | | | | | | | | | | | | | | | | | | | | | | |
| | For the Three Months Ended September 30, | | For the Nine Months Ended September 30, |
| | 2017 | | 2016 | | 2017 | | 2016 |
| | Yield % (1) | | Amount | | Yield % (1) | | Amount | | Yield % (1) | | Amount | | Yield % (1) | | Amount |
| | (Dollars in millions) |
| Fixed maturity securities (2), (3) | 4.25 |
| % | $ | 2,843 |
| | 4.38 |
| % | $ | 2,907 |
| | 4.29 |
| % | $ | 8,488 |
| | 4.39 |
| % | $ | 8,810 |
|
| Mortgage loans (3) | 4.78 |
| % | 809 |
| | 4.59 |
| % | 709 |
| | 4.59 |
| % | 2,303 |
| | 4.70 |
| % | 2,164 |
|
| Real estate and real estate joint ventures | 2.80 |
| % | 66 |
| | 5.42 |
| % | 120 |
| | 3.14 |
| % | 218 |
| | 3.83 |
| % | 245 |
|
| Policy loans | 5.40 |
| % | 130 |
| | 5.36 |
| % | 129 |
| | 5.37 |
| % | 386 |
| | 5.30 |
| % | 385 |
|
| Equity securities | 4.92 |
| % | 31 |
| | 4.73 |
| % | 29 |
| | 4.80 |
| % | 93 |
| | 4.76 |
| % | 90 |
|
| Other limited partnership interests | 15.94 |
| % | 214 |
| | 14.12 |
| % | 184 |
| | 16.46 |
| % | 648 |
| | 7.95 |
| % | 309 |
|
| Cash and short-term investments | 1.13 |
| % | 25 |
| | 1.16 |
| % | 28 |
| | 1.39 |
| % | 92 |
| | 1.15 |
| % | 82 |
|
| Other invested assets |
|
| | 173 |
| |
|
| | 246 |
| | | | 557 |
| |
|
| | 629 |
|
| Investment income | 4.54 |
| % | 4,291 |
| | 4.72 |
| % | 4,352 |
| | 4.58 |
| % | 12,785 |
| | 4.58 |
| % | 12,714 |
|
| Investment fees and expenses | (0.14 | ) | % | (133 | ) | | (0.13 | ) | % | (122 | ) | | (0.14 | ) | % | (390 | ) | | (0.14 | ) | % | (387 | ) |
| Net investment income including divested businesses and lag elimination (4) | 4.40 |
| % | 4,158 |
| | 4.59 |
| % | 4,230 |
| | 4.44 |
| % | 12,395 |
| | 4.44 |
| % | 12,327 |
|
| Less: net investment income from divested businesses and lag elimination (4) | | | 2 |
| | | | (49 | ) | | | | (46 | ) | | | | 26 |
|
| Net investment income, as reported on an operating basis (4) | | | $ | 4,156 |
| | | | $ | 4,279 |
| | | | $ | 12,441 |
| | | | $ | 12,301 |
|
__________________
| |
(1) | Yields are calculated as investment income as a percent of average quarterly asset carrying values. Investment income excludes recognized gains and losses. Asset carrying values exclude unrealized gains (losses), collateral received in connection with our securities lending program, annuities funding structured settlement claims, freestanding derivative assets, collateral received from derivative counterparties, the effects of consolidating certain variable interest entities (“VIEs”) under GAAP that are treated as consolidated securitization entities, contractholder-directed unit-linked investments and FVO Brighthouse Common Stock. A yield is not presented for other invested assets, as it is not considered a meaningful measure of performance for this asset class. |
| |
(2) | Investment income from fixed maturity securities includes amounts from FVO securities of $16 million and $61 million for the three months and nine months ended September 30, 2017, respectively, and $25 million and $41 million for the three months and nine months ended September 30, 2016, respectively. |
| |
(3) | Investment income from fixed maturity securities and mortgage loans includes prepayment fees. |
(1)We calculate yields using adjusted net investment income as a percent of average quarterly asset carrying values. Adjusted net investment income excludes recognized gains (losses) and includes the impact of changes in foreign currency exchange rates. Average quarterly asset carrying values exclude unrealized gains (losses), collateral received in connection with our securities lending program, annuities funding structured settlement claims, freestanding derivative assets, collateral received from derivative counterparties, the effects of consolidating under GAAP certain variable interest entities that are treated as consolidated securitization entities (“CSEs”) and contractholder-directed equity securities. In addition, average quarterly asset carrying values include invested assets reclassified to held-for-sale. A yield is not presented for other invested assets, as it is not considered a meaningful measure of performance for this asset class.
$50 million and $86 million for the three months and six months ended June 30, 2021, respectively, and $114 million and $36 million for the three months and six months ended June 30, 2020, respectively.
(3)Investment income from fixed maturity securities AFS and mortgage loans includes prepayment fees.
| |
(4) | See Note 2 of the Notes to the Interim Condensed Consolidated Financial Statements for further information, as well as for a reconciliation of net investment income, as reported on an operating basis, to the most directly comparable GAAP financial measure. See “— Non-GAAP and Other Financial Disclosures” for discussion of divested businesses and lag elimination. |
(4)See “Financial Measures and Segment Accounting Policies” in Note 2 of the Notes to the Interim Condensed Consolidated Financial Statements for discussion of divested businesses.
See “— Results of Operations — Consolidated Results — Three Months Ended September 30, 2017 Compared with the Three Months Ended September 30, 2016” and “— Results of Operations — Consolidated Results — Nine Months Ended September 30, 2017 Compared with the Nine Months Ended September 30, 2016”Adjusted Earnings” for an analysis of the period over period changes in net investment income, as reported on an operating basis.portfolio results.
Fixed Maturity Securities AFS and Equity Securities AFS
The following table presents fixed maturity securities AFS and equity securities available-for-sale (“AFS”) by type (public or private) and information about perpetual and redeemable securities held at:
| | | | | | | | | | | | | | | | | | | | | | | | | | |
| June 30, 2021 | | December 31, 2020 | |
| Estimated Fair Value | | % of Total | | Estimated Fair Value | | % of Total | |
| (Dollars in millions) | |
| Fixed maturity securities AFS: | | | | | | | | |
| Publicly-traded | $ | 269,568 | | | 79.1 | | % | $ | 284,083 | | | 80.1 | | % |
| Privately-placed | 71,127 | | | 20.9 | | | 70,726 | | | 19.9 | | |
| Total fixed maturity securities AFS | $ | 340,695 | | | 100.0 | | % | $ | 354,809 | | | 100.0 | | % |
| Percentage of cash and invested assets | 66.0 | % | | | | 67.2 | % | | | |
| Equity securities: | | | | | | | | |
| Publicly-traded | $ | 851 | | | 85.0 | | % | $ | 851 | | | 78.9 | | % |
| Privately-held | 150 | | | 15.0 | | | 228 | | | 21.1 | | |
| Total equity securities | $ | 1,001 | | | 100.0 | | % | $ | 1,079 | | | 100.0 | | % |
| Percentage of cash and invested assets | 0.2 | % | | | | 0.2 | % | | | |
| Perpetual and redeemable securities: | | | | | | | | |
| Perpetual securities included within fixed maturity securities AFS and equity securities | $ | 337 | | | | | $ | 344 | | | | |
| Redeemable preferred stock with a stated maturity included within fixed maturity securities AFS | $ | 503 | | | | | $ | 912 | | | | |
|
| | | | | | | | | | | | |
| | September 30, 2017 | | December 31, 2016 | |
| | Estimated Fair Value | | % of Total | | Estimated Fair Value | | % of Total | |
| | (Dollars in millions) | |
| Fixed maturity securities | | | | | | | | |
| Publicly-traded | $ | 263,083 |
| | 85.2 | % | $ | 247,229 |
| | 85.4 | % |
| Privately-placed | 45,811 |
| | 14.8 | | 42,334 |
| | 14.6 | |
| Total fixed maturity securities | $ | 308,894 |
| | 100.0 | % | $ | 289,563 |
| | 100.0 | % |
| Percentage of cash and invested assets | 67.3 | % | | | | 66.8 | % | | | |
| Equity securities | | | | | | | | |
| Publicly-traded | $ | 1,768 |
| | 63.7 | % | $ | 1,854 |
| | 64.1 | % |
| Privately-held | 1,008 |
| | 36.3 | | 1,040 |
| | 35.9 | |
| Total equity securities | $ | 2,776 |
| | 100.0 | % | $ | 2,894 |
| | 100.0 | % |
| Percentage of cash and invested assets | 0.6 | % | | | | 0.7 | % | | | |
| Perpetual securities included within fixed maturity and equity securities AFS | $ | 468 |
| | | | $ | 527 |
| | | |
| Redeemable preferred stock with a stated maturity included within fixed maturity securities AFS | $ | 556 |
| | | | $ | 758 |
| | | |
Included within fixed maturity securities AFS are structured securities, including residential mortgage-backed securities (“RMBS”), asset-backed securities (“ABS”) and commercial mortgage-backed securities (“CMBS”) (collectively, “Structured Products”).
Perpetual securities are included within fixed maturity securities AFS and equity securities. Upon acquisition, we classify perpetual securities that have attributes of both debt and equity as fixed maturity securities AFS if the securities have an interest rate step-up feature which, when combined with other qualitative factors, indicates that the securities have more debt-like characteristics; while those with more equity-like characteristics are classified as equity securities. Many of such securities, commonly referred to as “perpetual hybrid securities,” have been issued by non-U.S. financial institutions that are accorded the highest two capital treatment categories by their respective regulatory bodies (i.e. core capital, or “Tier 1 capital” and perpetual deferrable securities, or “Upper Tier 2 capital”).
Redeemable preferred stock with a stated maturity is included within fixed maturity securities.securities AFS. These securities, which are commonly referred to as “capital securities,” primarily have cumulative interest deferral features and are primarily issued by U.S. financial institutions.
In connection with our investment management business, we manage a broad array of securities, limited partnership interests and liquid investments on behalf of institutional clients, which are unaffiliated investors. Assets under management, by sector, as of September 30, 2017, at estimated fair value, were as follows: investment grade corporate fixed maturity securities, including privately-placed, infrastructure and state and political subdivision, $63.7 billion; structured finance fixed maturity securities, including residential mortgage-backed securities (“RMBS”), commercial mortgage-backed securities (“CMBS”) and asset-backed securities (“ABS”) (collectively, “Structured Securities”), $16.6 billion; U.S. government and agency fixed maturity securities, $22.1 billion; foreign government fixed maturity securities, $2.0 billion; below investment grade corporate fixed maturity securities, including emerging market and high yield, $7.2 billion; equity securities, $10.4 billion; other limited partnership interests, $1.7 billion; and cash equivalents and short-term investments, $3.7 billion. Assets under management, by sector, as of December 31, 2016, at estimated fair value, were as follows: investment grade corporate fixed maturity securities, including privately-placed and infrastructure, $8.0 billion; and below investment grade corporate fixed maturity securities, including high yield, $0.3 billion. As these assets are managed on behalf of, and owned by, our institutional clients, they are not included in our consolidated financial statements.
Also in connection with our investment management business, we manage index investment portfolios that track the return of industry fixed income and equity market indices such as the Barclay’s U.S. Aggregate Bond Index and Standard & Poor’s (“S&P”) 500® Index. These assets had an estimated fair value of $15.0 billion and $14.9 billion at September 30, 2017 and December 31, 2016, respectively, and are included within separate account assets in our interim condensed consolidated financial statements. Also, $12.3 billion of these assets, at estimated fair value, at December 31, 2016 are included within assets of disposed subsidiary in our interim condensed consolidated financial statements.
See also “Management’s Discussion and Analysis of Financial Condition and Results of Operations — Investments — Fixed Maturity Securities AFS and Equity Securities AFS — Valuation of Securities” included in the 20162020 Annual Report for further information on the processes used to value securities and the related controls.
Fair Value of Fixed Maturity Securities AFS and Equity Securities – AFS
Fixed maturity securities AFS and equity securities AFS measured at estimated fair value on a recurring basis and their corresponding fair value pricing sources arewere as follows:
| | | | September 30, 2017 | | June 30, 2021 |
| | Fixed Maturity Securities | | Equity Securities | | Fixed Maturity
Securities AFS | | | Equity
Securities |
| | (Dollars in millions) | | | (Dollars in millions) | |
| Level 1 | | | | | Level 1 | |
| Quoted prices in active markets for identical assets | $ | 26,788 |
| | 8.7 | % | | $ | 1,332 |
| | 48.0 | % | Quoted prices in active markets for identical assets | $ | 25,820 | | | 7.6 | | % | | $ | 662 | | | 66.1 | | % |
| Level 2 | | | | | Level 2 | | | | | | | | |
| Independent pricing sources | 262,327 |
| | 84.9 | | 923 |
| | 33.2 | | Independent pricing sources | 283,869 | | | 83.4 | | | 184 | | | 18.4 | | |
| Internal matrix pricing or discounted cash flow techniques | 2,869 |
| | 0.9 | | 97 |
| | 3.5 | | Internal matrix pricing or discounted cash flow techniques | 1,085 | | | 0.3 | | | 12 | | | 1.2 | | |
| Significant other observable inputs | 265,196 |
| | 85.8 | | 1,020 |
| | 36.7 | | Significant other observable inputs | 284,954 | | | 83.7 | | | 196 | | | 19.6 | | |
| Level 3 | | | | | Level 3 | | | | | | | | |
| Independent pricing sources | 12,564 |
| | 4.1 | | 302 |
| | 10.9 | | Independent pricing sources | 24,195 | | | 7.1 | | | 8 | | | 0.8 | | |
| Internal matrix pricing or discounted cash flow techniques | 3,964 |
| | 1.3 | | 120 |
| | 4.3 | | Internal matrix pricing or discounted cash flow techniques | 5,243 | | | 1.5 | | | 135 | | | 13.5 | | |
| Independent broker quotations | 382 |
| | 0.1 | | 2 |
| | 0.1 | | Independent broker quotations | 483 | | | 0.1 | | | — | | | — | | |
| Significant unobservable inputs | 16,910 |
| | 5.5 | | 424 |
| | 15.3 | | Significant unobservable inputs | 29,921 | | | 8.7 | | | 143 | | | 14.3 | | |
| Total estimated fair value | $ | 308,894 |
| | 100.0 | % | | $ | 2,776 |
| | 100.0 | % | Total estimated fair value | $ | 340,695 | | | 100.0 | | % | | $ | 1,001 | | | 100.0 | | % |
See Note 8 of the Notes to the Interim Condensed Consolidated Financial Statements for the fixed maturity securities AFS and equity securities AFS fair value hierarchy.
The composition of fair value pricing sources for and significant changes in Level 3 securities at September 30, 2017 are as follows:
The majority of the Level 3 fixed maturity securities AFS and equity securities AFS were concentrated in three sectors:sectors at June 30, 2021: foreign and United Statescorporate securities, U.S. corporate securities and RMBS.
During the three months ended June 30, 2021, Level 3 fixed maturity securities are priced principally through market standard valuation methodologies, independent pricing services and, to a much lesser extent, independent non-binding broker quotations using inputs that are not market observable or cannot be derived principally from or corroborated by observable market data. Level 3 fixed maturity securities consist of less liquid securities with very limited trading activity or where less price transparency exists around the inputs to the valuation methodologies. Level 3 fixed maturity securities include: sub-prime RMBS; certain below investment grade private securities and less liquid investment grade corporate securities (included in United States and foreign corporate securities) and less liquid ABS; and foreign government securities.
During the three months ended September 30, 2017, Level 3 fixed maturity securitiesAFS increased by $131$858 million, or 1%3%. The increase was driven by purchases in excess of sales and an increase in estimated fair value recognized in othercomprehensive income (loss) (“OCI”), partially offset by transfers out of Level 3 in excess of transfers into Level 3.
During the ninesix months ended SeptemberJune 30, 2017,2021, Level 3 fixed maturity securities decreasedAFS increased by $141$414 million, or 1%. The decreaseincrease was driven by purchases in excess of sales, partially offset by transfers out of Level 3 in excess of transfers into Level 3 partially offset by purchases in excess of sales and an increasea decrease in estimated fair value recognized in OCI.
See Note 8 of the Notes to the Interim Condensed Consolidated Financial Statements for a rollforward of the fair value measurements for fixed maturity securities and equity securities AFS measured at estimated fair value on a recurring basis using significant unobservable (Level 3) inputs;inputs, transfers into and/or out of Level 3;3, and further information about the valuation approaches and inputs by level by major classes of invested assets that affect the amounts reported above. See also “Management’s Discussion and Analysis of Financial Condition and Results of Operations — SummaryInvestments — Fixed Maturity Securities AFS and Equity Securities — Valuation of Critical Accounting Estimates — Estimated Fair Value of Investments”Securities” included in the 20162020 Annual Report for further information on the estimates and assumptions that affect the amounts reported above.
Fixed Maturity Securities AFS
See NoteNotes 1 and 6 of the Notes to the Interim Condensed Consolidated Financial Statements for information about fixed maturity securities AFS by sector, contractual maturities and continuous gross unrealized losses. Included within fixed maturity securities are Structured Securities.
Fixed Maturity Securities AFS Credit Quality — Ratings
See “Management’s Discussion and Analysis of Financial Condition and Results of Operations — Investments — Fixed Maturity Securities AFS and Equity Securities AFS — Fixed Maturity Securities AFS Credit Quality — Ratings” included in the 20162020 Annual Report for a discussion of the credit quality ratings assigned by Nationally Recognized Statistical Rating Organizations (“NRSRO”), credit quality designations assigned by and methodologies used by the Securities Valuation Office of the National Association of Insurance Commissioners (“NAIC”)NAIC for fixed maturity securities AFS and the revised methodologies adopted by the NAIC for certain Structured Securities.Products.
The following table presents total fixed maturity securities AFS by NRSRO rating and the applicable NAIC designation from the NAIC published comparison of NRSRO ratings to NAIC designations, except for certain Structured Securities,non-agency RMBS and CMBS, held by MetLife, Inc.'s insurance subsidiaries that maintain the NAIC statutory basis of accounting, which are presented using the revised NAIC methodologies,methodologies. NRSRO ratings are as well asof the percentage, baseddates shown below. Over time, credit ratings can migrate, up or down, through the NRSRO continuous monitoring process. See Notes 1 and 6 of the Notes to the Interim Condensed Consolidated Financial Statements for further information.
| | | | | | | | | | | | | | | | | | | | | | | | | | | | | | | | | | | | | | | | | | | | | | | | | | | | | | | | | | | | | | |
| | | | | June 30, 2021 | | | December 31, 2020 | |
NAIC
Designation | | NRSRO Rating | | Amortized
Cost net of ACL | | Unrealized
Gains (Losses) (1) | | Estimated Fair Value | | % of Total | | | Amortized
Cost net of ACL | | Unrealized
Gains (Losses) (1) | | Estimated Fair Value | | % of Total | |
| | | | | (Dollars in millions) | |
| 1 | | Aaa/Aa/A | | $ | 213,767 | | | $ | 23,464 | | | $ | 237,231 | | | 69.6 | | % | | $ | 218,252 | | | $ | 31,761 | | | $ | 250,013 | | | 70.5 | | % |
| 2 | | Baa | | 77,046 | | | 9,247 | | | 86,293 | | | 25.3 | | | | 76,342 | | | 11,360 | | | 87,702 | | | 24.7 | | |
| | Subtotal investment grade | | 290,813 | | | 32,711 | | | 323,524 | | | 94.9 | | | | 294,594 | | | 43,121 | | | 337,715 | | | 95.2 | | |
| 3 | | Ba | | 11,993 | | | 985 | | | 12,978 | | | 3.8 | | | | 11,840 | | | 972 | | | 12,812 | | | 3.6 | | |
| 4 | | B | | 3,511 | | | 23 | | | 3,534 | | | 1.1 | | | | 3,688 | | | 14 | | | 3,702 | | | 1.1 | | |
| 5 | | Caa and lower | | 636 | | | (32) | | | 604 | | | 0.2 | | | | 536 | | | (33) | | | 503 | | | 0.1 | | |
| 6 | | In or near default | | 50 | | | 5 | | | 55 | | | — | | | | 72 | | | 5 | | | 77 | | | — | | |
| | Subtotal below investment grade | | 16,190 | | | 981 | | | 17,171 | | | 5.1 | | | | 16,136 | | | 958 | | | 17,094 | | | 4.8 | | |
| | Total fixed maturity securities AFS | | $ | 307,003 | | | $ | 33,692 | | | $ | 340,695 | | | 100.0 | | % | | $ | 310,730 | | | $ | 44,079 | | | $ | 354,809 | | | 100.0 | | % |
| | | | | | | | | | | | | | | | | | | | |
__________________
(1) Excludes gross unrealized gains (losses) related to assets held-for-sale. See Note 3 of the Notes to the Interim Condensed Consolidated Financial Statements for information on estimated fair value that each NAIC designation is comprised of at:the Company’s business dispositions.
|
| | | | | | | | | | | | | | | | | | | | | | | | | | | | | | | | |
| | | | | September 30, 2017 | | | December 31, 2016 | |
NAIC Designation | | NRSRO Rating | | Amortized Cost | | Unrealized Gain (Loss) | | Estimated Fair Value | | % of Total | | | Amortized Cost | | Unrealized Gain (Loss) | | Estimated Fair Value | | % of Total | |
| | | | | (Dollars in millions) | |
| 1 | | Aaa/Aa/A | | $ | 202,744 |
| | $ | 16,414 |
| | $ | 219,158 |
| | 70.9 | % | | $ | 191,867 |
| | $ | 14,078 |
| | $ | 205,945 |
| | 71.1 | % |
| 2 | | Baa | | 67,286 |
| | 5,007 |
| | 72,293 |
| | 23.4 | | | 62,551 |
| | 3,269 |
| | 65,820 |
| | 22.7 | |
| | | Subtotal investment grade | | 270,030 |
|
| 21,421 |
|
| 291,451 |
| | 94.3 | | | 254,418 |
| | 17,347 |
| | 271,765 |
| | 93.8 | |
| 3 | | Ba | | 10,946 |
| | 616 |
| | 11,562 |
| | 3.7 | | | 11,729 |
| | 427 |
| | 12,156 |
| | 4.2 | |
| 4 | | B | | 4,805 |
| | 155 |
| | 4,960 |
| | 1.7 | | | 4,710 |
| | 78 |
| | 4,788 |
| | 1.7 | |
| 5 | | Caa and lower | | 896 |
| | 21 |
| | 917 |
| | 0.3 | | | 840 |
| | 13 |
| | 853 |
| | 0.3 | |
| 6 | | In or near default | | 7 |
| | (3 | ) | | 4 |
| | — | | | 4 |
| | (3 | ) | | 1 |
| | — | |
| | | Subtotal below investment grade | | 16,654 |
|
| 789 |
|
| 17,443 |
| | 5.7 | | | 17,283 |
| | 515 |
| | 17,798 |
| | 6.2 | |
| | | Total fixed maturity securities | | $ | 286,684 |
|
| $ | 22,210 |
|
| $ | 308,894 |
| | 100.0 | % | | $ | 271,701 |
| | $ | 17,862 |
| | $ | 289,563 |
| | 100.0 | % |
The following tables present total fixed maturity securities AFS, based on estimated fair value, by sector classification and by NRSRO rating and the applicable NAIC designations from the NAIC published comparison of NRSRO ratings to NAIC designations, except for certain Structured Securities,non-agency RMBS and CMBS, which are presented using the revised NAIC methodologies at:methodologies:
| | | | | | | | | | | | | | | | | | | | | | | | | | | | | | | | | | | | | | | | | |
| | Fixed Maturity Securities AFS — by Sector & Credit Quality Rating |
| NAIC Designation | 1 | | 2 | | 3 | | 4 | | 5 | | 6 | | Total
Estimated
Fair Value |
| NRSRO Rating | Aaa/Aa/A | | Baa | | Ba | | B | | Caa and Lower | | In or Near
Default | |
| | (Dollars in millions) |
| June 30, 2021 | | | | | | | | | | | | | |
| U.S. corporate | $ | 45,342 | | | $ | 39,077 | | | $ | 4,743 | | | $ | 1,883 | | | $ | 305 | | | $ | 21 | | | $ | 91,371 | |
| Foreign government | 54,759 | | | 6,156 | | | 3,169 | | | 467 | | | 73 | | | 6 | | | 64,630 | |
| Foreign corporate | 23,993 | | | 36,963 | | | 3,896 | | | 543 | | | 201 | | | 9 | | | 65,605 | |
| U.S. government and agency | 46,014 | | | 542 | | | — | | | — | | | — | | | — | | | 46,556 | |
| RMBS | 28,549 | | | 881 | | | 223 | | | 160 | | | 16 | | | 19 | | | 29,848 | |
| ABS | 14,548 | | | 1,804 | | | 270 | | | 90 | | | 1 | | | — | | | 16,713 | |
| Municipals | 13,406 | | | 499 | | | 18 | | | — | | | — | | | — | | | 13,923 | |
| CMBS | 10,620 | | | 371 | | | 659 | | | 391 | | | 8 | | | — | | | 12,049 | |
| Total fixed maturity securities AFS | $ | 237,231 | | | $ | 86,293 | | | $ | 12,978 | | | $ | 3,534 | | | $ | 604 | | | $ | 55 | | | $ | 340,695 | |
| Percentage of total | 69.6 | % | | 25.3 | % | | 3.8 | % | | 1.1 | % | | 0.2 | % | | — | % | | 100.0 | % |
| | | | | | | | | | | | | |
| December 31, 2020 | | | | | | | | | | | | | |
| U.S. corporate | $ | 46,847 | | | $ | 39,552 | | | $ | 4,649 | | | $ | 2,018 | | | $ | 326 | | | $ | 24 | | | $ | 93,416 | |
| Foreign government | 61,322 | | | 6,678 | | | 3,161 | | | 456 | | | 77 | | | 5 | | | 71,699 | |
| Foreign corporate | 26,812 | | | 37,884 | | | 3,984 | | | 648 | | | 74 | | | 6 | | | 69,408 | |
| U.S. government and agency | 46,543 | | | 557 | | | — | | | — | | | — | | | — | | | 47,100 | |
| RMBS | 29,347 | | | 706 | | | 197 | | | 153 | | | 14 | | | 18 | | | 30,435 | |
| ABS | 15,328 | | | 1,496 | | | 197 | | | 96 | | | 1 | | | 1 | | | 17,119 | |
| Municipals | 13,240 | | | 460 | | | 22 | | | — | | | — | | | — | | | 13,722 | |
| CMBS | 10,574 | | | 369 | | | 602 | | | 331 | | | 11 | | | 23 | | | 11,910 | |
| Total fixed maturity securities AFS | $ | 250,013 | | | $ | 87,702 | | | $ | 12,812 | | | $ | 3,702 | | | $ | 503 | | | $ | 77 | | | $ | 354,809 | |
| Percentage of total | 70.5 | % | | 24.7 | % | | 3.6 | % | | 1.1 | % | | 0.1 | % | | — | % | | 100.0 | % |
|
| | | | | | | | | | | | | | | | | | | | | | | | | | | |
| | Fixed Maturity Securities — by Sector & Credit Quality Rating |
| NAIC Designation: | 1 | | 2 | | 3 | | 4 | | 5 | | 6 | | Total Estimated Fair Value |
| NRSRO Rating: | Aaa/Aa/A | | Baa | | Ba | | B | | Caa and Lower | | In or Near Default | |
| | (Dollars in millions) |
| September 30, 2017 | | | | | | | | | | | | | |
| U.S. corporate | $ | 36,240 |
| | $ | 35,257 |
| | $ | 6,149 |
| | $ | 3,248 |
| | $ | 761 |
| | $ | — |
| | $ | 81,655 |
|
| Foreign government | 52,203 |
| | 5,204 |
| | 2,405 |
| | 928 |
| | 49 |
| | — |
| | 60,789 |
|
| Foreign corporate | 21,924 |
| | 29,905 |
| | 2,526 |
| | 724 |
| | 61 |
| | — |
| | 55,140 |
|
| U.S. government and agency | 47,352 |
| | 312 |
| | — |
| | — |
| | — |
| | — |
| | 47,664 |
|
| RMBS | 30,797 |
| | 285 |
| | 214 |
| | 59 |
| | 43 |
| | — |
| | 31,398 |
|
| State and political subdivision | 11,789 |
| | 488 |
| | 65 |
| | — |
| | — |
| | 3 |
| | 12,345 |
|
| ABS | 10,889 |
| | 720 |
| | 157 |
| | 1 |
| | 3 |
| | 1 |
| | 11,771 |
|
| CMBS | 7,964 |
| | 122 |
| | 46 |
| | — |
| | — |
| | — |
| | 8,132 |
|
| Total fixed maturity securities | $ | 219,158 |
|
| $ | 72,293 |
|
| $ | 11,562 |
|
| $ | 4,960 |
|
| $ | 917 |
|
| $ | 4 |
|
| $ | 308,894 |
|
| Percentage of total | 70.9 | % | | 23.4 | % | | 3.7 | % | | 1.7 | % | | 0.3 | % | | — | % | | 100.0 | % |
| | | | | | | | | | | | | | |
| December 31, 2016 | | | | | | | | | | | | | |
| U.S. corporate | $ | 34,753 |
| | $ | 32,823 |
| | $ | 6,949 |
| | $ | 3,289 |
| | $ | 729 |
| | $ | — |
| | $ | 78,543 |
|
| Foreign government | 48,371 |
| | 4,578 |
| | 2,144 |
| | 830 |
| | 53 |
| | — |
| | 55,976 |
|
| Foreign corporate | 21,033 |
| | 26,292 |
| | 2,638 |
| | 638 |
| | 62 |
| | — |
| | 50,663 |
|
| U.S. government and agency | 44,118 |
| | 315 |
| | — |
| | — |
| | — |
| | — |
| | 44,433 |
|
| RMBS | 28,252 |
| | 504 |
| | 244 |
| | 30 |
| | 2 |
| | — |
| | 29,032 |
|
| State and political subdivision | 11,670 |
| | 470 |
| | 87 |
| | — |
| | 4 |
| | — |
| | 12,231 |
|
| ABS | 10,433 |
| | 693 |
| | 94 |
| | 1 |
| | 3 |
| | 1 |
| | 11,225 |
|
| CMBS | 7,315 |
| | 145 |
| | — |
| | — |
| | — |
| | — |
| | 7,460 |
|
| Total fixed maturity securities | $ | 205,945 |
|
| $ | 65,820 |
|
| $ | 12,156 |
|
| $ | 4,788 |
|
| $ | 853 |
|
| $ | 1 |
|
| $ | 289,563 |
|
| Percentage of total | 71.1 | % | | 22.7 | % | | 4.2 | % | | 1.7 | % | | 0.3 | % | | — | % | | 100.0 | % |
U.S. and Foreign Corporate Fixed Maturity Securities AFS
We maintain a diversified portfolio of corporate fixed maturity securities AFS across industries and issuers. This portfolio doesdid not have any exposure to any single issuer in excess of 1% of total investments and theat June 30, 2021. The top ten10 holdings comprised 2% of total investments at both SeptemberJune 30, 20172021 and December 31, 2016.2020. The tablestable below presentpresents our U.S. and foreign corporate securities holdings by industry at:
| | | | | | | | | | | | | | | | | | | | | | | |
| | June 30, 2021 | | December 31, 2020 |
| Industry | Estimated
Fair
Value | | % of
Total | | Estimated
Fair
Value | | % of
Total |
| | (Dollars in millions) |
| Industrial | $ | 46,489 | | | 29.6 | % | | $ | 47,472 | | | 29.2 | % |
| Finance | 35,711 | | | 22.8 | | | 37,645 | | | 23.1 | |
| Consumer | 31,113 | | | 19.8 | | | 33,384 | | | 20.5 | |
| Utility | 29,149 | | | 18.6 | | | 29,984 | | | 18.4 | |
| Communications | 12,161 | | | 7.7 | | | 12,107 | | | 7.4 | |
| Other | 2,353 | | | 1.5 | | | 2,232 | | | 1.4 | |
| Total | $ | 156,976 | | | 100.0 | % | | $ | 162,824 | | | 100.0 | % |
|
| | | | | | | | | | | | | |
| | September 30, 2017 | | December 31, 2016 |
| | Estimated Fair Value | | % of Total | | Estimated Fair Value | | % of Total |
| | (Dollars in millions) |
| Industrial | $ | 41,598 |
| | 30.4 | % | | $ | 39,320 |
| | 30.4 | % |
| Consumer | 31,200 |
| | 22.8 |
| | 29,783 |
| | 23.1 |
|
| Finance | 29,699 |
| | 21.7 |
| | 27,787 |
| | 21.5 |
|
| Utility | 21,444 |
| | 15.7 |
| | 19,931 |
| | 15.4 |
|
| Communications | 11,026 |
| | 8.1 |
| | 10,635 |
| | 8.2 |
|
| Other | 1,828 |
| | 1.3 |
| | 1,750 |
| | 1.4 |
|
| Total | $ | 136,795 |
| | 100.0 | % | | $ | 129,206 |
| | 100.0 | % |
current economic conditions, including the effects of the COVID-19 Pandemic, we have experienced stress within certain sub-sectors of our industrial and consumer corporate securities portfolios, principally in Airports, Cruise Lines / Leisure, Airlines, Restaurants and Lodging. See “— Current Environment — Selected Country and Sector Investments.”
Structured SecuritiesProducts
We held $51.3$58.6 billion and $47.7$59.5 billion of Structured Securities,Products, at estimated fair value, at SeptemberJune 30, 20172021 and December 31, 2016,2020, respectively, as presented in the RMBS, ABS and CMBS sections below.
RMBS
Our RMBS portfolio is diversified by security type and risk profile. The following table below presents our RMBS holdingsportfolio by security type, risk profile and ratings profile at:
| | | | | | | | | | | | | | | | | | | | | | | | | | | | | | | | | | | |
| June 30, 2021 | | December 31, 2020 |
| Estimated
Fair
Value | | % of
Total | | Net
Unrealized
Gains (Losses) (1) | | Estimated
Fair
Value | | % of
Total | | Net
Unrealized
Gains (Losses) (1) |
| (Dollars in millions) |
| Security type | | | | | | | | | | | |
| Collateralized mortgage obligations | $ | 17,248 | | | 57.8 | % | | $ | 1,327 | | | $ | 17,342 | | | 57.0 | % | | $ | 1,468 | |
| Pass-through mortgage-backed securities | 12,600 | | | 42.2 | | | 310 | | | 13,093 | | | 43.0 | | | 552 | |
| Total RMBS | $ | 29,848 | | | 100.0 | % | | $ | 1,637 | | | $ | 30,435 | | | 100.0 | % | | $ | 2,020 | |
| Risk profile | | | | | | | | | | | |
| Agency | $ | 19,622 | | | 65.7 | % | | $ | 950 | | | $ | 20,408 | | | 67.1 | % | | $ | 1,314 | |
| Prime | 2,331 | | | 7.8 | | | 35 | | | 1,637 | | | 5.4 | | | 38 | |
| Alt-A | 3,602 | | | 12.1 | | | 305 | | | 3,809 | | | 12.5 | | | 306 | |
| Sub-prime | 4,293 | | | 14.4 | | | 347 | | | 4,581 | | | 15.0 | | | 362 | |
| Total RMBS | $ | 29,848 | | | 100.0 | % | | $ | 1,637 | | | $ | 30,435 | | | 100.0 | % | | $ | 2,020 | |
| Ratings profile | | | | | | | | | | | |
| Rated Aaa/AAA | $ | 21,752 | | | 72.9 | % | | | | $ | 22,555 | | | 74.1 | % | | |
| Designated NAIC 1 | $ | 28,549 | | | 95.6 | % | | | | $ | 29,347 | | | 96.4 | % | | |
__________________
(1) Excludes gross unrealized gains (losses) related to assets held-for-sale. See Note 3 of the Notes to the Interim Condensed Consolidated Financial Statements for information on the disposition of MetLife P&C.
|
| | | | | | | | | | | | | | | | | | | | | |
| | September 30, 2017 | | December 31, 2016 |
| | Estimated Fair Value | | % of Total | | Net Unrealized Gains (Losses) | | Estimated Fair Value | | % of Total | | Net Unrealized Gains (Losses) |
| | (Dollars in millions) |
| By security type: | | | | | | | | | | | |
| Collateralized mortgage obligations | $ | 16,289 |
| | 51.9 | % | | $ | 906 |
| | $ | 16,842 |
| | 58.0 | % | | $ | 575 |
|
| Pass-through securities | 15,109 |
| | 48.1 |
| | 124 |
| | 12,190 |
| | 42.0 |
| | 64 |
|
| Total RMBS | $ | 31,398 |
| | 100.0 | % | | $ | 1,030 |
| | $ | 29,032 |
| | 100.0 | % | | $ | 639 |
|
| By risk profile: | | | | | | | | | | | |
| Agency | $ | 22,177 |
| | 70.6 | % | | $ | 371 |
| | $ | 18,808 |
| | 64.8 | % | | $ | 268 |
|
| Prime | 1,316 |
| | 4.2 |
| | 80 |
| | 1,398 |
| | 4.8 |
| | 65 |
|
| Alt-A | 4,339 |
| | 13.8 |
| | 350 |
| | 4,964 |
| | 17.1 |
| | 160 |
|
| Sub-prime | 3,566 |
| | 11.4 |
| | 229 |
| | 3,862 |
| | 13.3 |
| | 146 |
|
| Total RMBS | $ | 31,398 |
| | 100.0 | % | | $ | 1,030 |
| | $ | 29,032 |
| | 100.0 | % | | $ | 639 |
|
| Ratings profile: | | | | | | | | | | | |
| Rated Aaa/AAA | $ | 22,614 |
| | 72.0 | % | | | | $ | 19,207 |
| | 66.2 | % | | |
| Designated NAIC 1 | $ | 30,797 |
| | 98.1 | % | | | | $ | 28,252 |
| | 97.3 | % | | |
See also “Management’s Discussion and Analysis of Financial Condition and Results of Operations — Investments — Fixed Maturity Securities AFS and Equity Securities AFS — Structured SecuritiesProducts — RMBS” included in the 20162020 Annual Report for further information about collateralized mortgage obligations and pass-through mortgage-backed securities, as well as agency, prime, alternative residential mortgage loanloans (“Alt-A”) and sub-prime RMBS.
Historically, we have managed our exposure to sub-prime RMBS holdings by focusing primarily on senior tranche securities, stress testing the portfolio with severe loss assumptions and closely monitoring the performance of the portfolio. Our sub-prime RMBS portfolio consists predominantly of securities that were purchased after 2012 at significant discounts to par value and discounts to the expected principal recovery value of these securities. The vast majority of these securities are investment grade under the NAIC designations (e.g., NAIC 1 and NAIC 2). The estimated fair value of our sub-prime RMBS holdings purchased since 2012 was $3.2 billion and $3.5 billion at September 30, 2017 and December 31, 2016, with unrealized gains (losses) of $189 million and $123 million at September 30, 2017 and December 31, 2016, respectively.
ABS
Our ABS holdings areportfolio is diversified both by collateral type and by issuer. The following table presents our ABS holdingsportfolio by collateral type and ratings profile at:
| | | | | | | | | | | | | | | | | | | | | | | | | | | | | | | | | | | |
| | June 30, 2021 | | December 31, 2020 |
| | Estimated
Fair
Value | | % of
Total | | Net
Unrealized
Gains (Losses) (1) | | Estimated
Fair
Value | | % of
Total | | Net
Unrealized
Gains (Losses) (1) |
| | (Dollars in millions) |
| Collateral type | | | | | | | | | | | |
| Collateralized obligations (2) | $ | 8,269 | | | 49.5 | % | | $ | 20 | | | $ | 8,946 | | | 52.2 | % | | $ | (16) | |
| Consumer loans | 1,700 | | | 10.2 | | | 48 | | | 1,535 | | | 9.0 | | | 46 | |
| Student loans | 1,145 | | | 6.9 | | | 17 | | | 1,174 | | | 6.9 | | | 7 | |
| Credit card loans | 722 | | | 4.3 | | | 11 | | | 1,006 | | | 5.9 | | | 13 | |
| Automobile loans | 1,103 | | | 6.6 | | | 20 | | | 976 | | | 5.7 | | | 20 | |
| Foreign residential loans | 871 | | | 5.2 | | | 9 | | | 956 | | | 5.5 | | | 15 | |
| Other loans | 2,903 | | | 17.3 | | | 69 | | | 2,526 | | | 14.8 | | | 71 | |
| Total | $ | 16,713 | | | 100.0 | % | | $ | 194 | | | $ | 17,119 | | | 100.0 | % | | $ | 156 | |
| Ratings profile | | | | | | | | | | | |
| Rated Aaa/AAA | $ | 7,958 | | | 47.6 | % | | | | $ | 9,164 | | | 53.5 | % | | |
| Designated NAIC 1 | $ | 14,548 | | | 87.0 | % | | | | $ | 15,328 | | | 89.5 | % | | |
|
| | | | | | | | | | | | | | | | | | | | | |
| | September 30, 2017 | | December 31, 2016 |
| | Estimated Fair Value | | % of Total | | Net Unrealized Gains (Losses) | | Estimated Fair Value | | % of Total | | Net Unrealized Gains (Losses) |
| | (Dollars in millions) |
| By collateral type: | | | | | | | | | | | |
| Collateralized obligations | $ | 5,381 |
| | 45.7 | % | | $ | 29 |
| | $ | 5,711 |
| | 50.9 | % | | $ | (42 | ) |
| Automobile loans | 1,157 |
| | 9.8 |
| | 1 |
| | 1,121 |
| | 10.0 |
| | 1 |
|
| Foreign residential loans | 1,027 |
| | 8.7 |
| | 19 |
| | 1,171 |
| | 10.4 |
| | 8 |
|
| Student loans | 1,309 |
| | 11.1 |
| | (1 | ) | | 984 |
| | 8.8 |
| | (25 | ) |
| Credit card loans | 1,442 |
| | 12.3 |
| | 3 |
| | 871 |
| | 7.8 |
| | 10 |
|
| Consumer Loans | 614 |
| | 5.2 |
| | 11 |
| | 509 |
| | 4.5 |
| | — |
|
| Other loans | 841 |
| | 7.2 |
| | 7 |
| | 858 |
| | 7.6 |
| | 7 |
|
| Total | $ | 11,771 |
| | 100.0 | % | | $ | 69 |
| | $ | 11,225 |
| | 100.0 | % | | $ | (41 | ) |
| Ratings profile: | | | | | | | | | | | |
| Rated Aaa/AAA | $ | 6,564 |
| | 55.8 | % | | | | $ | 5,704 |
| | 50.8 | % | | |
| Designated NAIC 1 | $ | 10,889 |
| | 92.5 | % | | | | $ | 10,433 |
| | 92.9 | % | | |
(1) Excludes gross unrealized gains (losses) related to assets held-for-sale. See Note 3 of the Notes to the Interim Condensed Consolidated Financial Statements for information on the Company’s business dispositions.
(2) Includes primarily collateralized loan obligations.
CMBS
Our CMBS holdings areportfolio is comprised primarily of securities collateralized by multiple commercial mortgage loans and is diversified by property type, borrower, geography and vintage year. The following tables present our CMBS holdingsportfolio by NRSRO rating and by vintage year at:year.
| | | | | | | | | | | | | | | | | | | | | | | | | | | | June 30, 2021 |
| | September 30, 2017 | | Aaa | | Aa | | A | | Baa | | Below
Investment
Grade | | Total |
| Vintage Year | | Vintage Year | Amortized
Cost net of ACL | | Estimated
Fair
Value | | Amortized
Cost net of ACL | | Estimated
Fair
Value | | Amortized
Cost net of ACL | | Estimated
Fair
Value | | Amortized
Cost net of ACL | | Estimated
Fair
Value | | Amortized
Cost net of ACL | | Estimated
Fair
Value | | Amortized
Cost net of ACL | | Estimated
Fair
Value |
| | Aaa | | Aa | | A | | Baa | | Below Investment Grade | | Total | | (Dollars in millions) |
| | Amortized Cost | | Estimated Fair Value | | Amortized Cost | | Estimated Fair Value | | Amortized Cost | | Estimated Fair Value | | Amortized Cost | | Estimated Fair Value | | Amortized Cost | | Estimated Fair Value | | Amortized Cost | | Estimated Fair Value | |
| | (Dollars in millions) | |
| 2003 - 2010 | $ | 114 |
| | $ | 124 |
| | $ | 8 |
| | $ | 9 |
| | $ | 34 |
| | $ | 34 |
| | $ | — |
| | $ | — |
| | $ | 1 |
| | $ | 1 |
| | $ | 157 |
| | $ | 168 |
| |
| 2011 | 175 |
| | 191 |
| | 34 |
| | 36 |
| | — |
| |
|
| | — |
| | — |
| | — |
| | — |
| | 209 |
| | 227 |
| |
| 2012 | 301 |
| | 316 |
| | 277 |
| | 286 |
| | 230 |
| | 238 |
| | 6 |
| | 7 |
| | — |
| | — |
| | 814 |
| | 847 |
| |
| 2013 | 807 |
| | 860 |
| | 718 |
| | 754 |
| | 285 |
| | 295 |
| | 61 |
| | 45 |
| | — |
| | — |
| | 1,871 |
| | 1,954 |
| |
| 2014 | 589 |
| | 605 |
| | 540 |
| | 553 |
| | 141 |
| | 144 |
| | — |
| | — |
| | — |
| | — |
| | 1,270 |
| | 1,302 |
| |
| 2003-2014 | | 2003-2014 | $ | 1,202 | | | $ | 1,278 | | | $ | 1,098 | | | $ | 1,152 | | | $ | 581 | | | $ | 593 | | | $ | 202 | | | $ | 194 | | | $ | 181 | | | $ | 167 | | | $ | 3,264 | | | $ | 3,384 | |
| 2015 | 1,271 |
| | 1,289 |
| | 225 |
| | 228 |
| | 143 |
| | 145 |
| | 9 |
| | 9 |
| | — |
| | — |
| | 1,648 |
| | 1,671 |
| 2015 | 415 | | | 444 | | | 109 | | | 117 | | | 49 | | | 51 | | | 7 | | | 7 | | | — | | | — | | | 580 | | | 619 | |
| 2016 | 468 |
| | 471 |
| | 69 |
| | 68 |
| | 34 |
| | 34 |
| | 70 |
| | 71 |
| | — |
| | — |
| | 641 |
| | 644 |
| 2016 | 232 | | | 252 | | | 106 | | | 114 | | | 50 | | | 52 | | | 1 | | | 1 | | | — | | | — | | | 389 | | | 419 | |
| 2017 | 619 |
| | 618 |
| | 468 |
| | 471 |
| | 187 |
| | 188 |
| | 41 |
| | 42 |
| | — |
| | — |
| | 1,315 |
| | 1,319 |
| 2017 | 695 | | | 735 | | | 419 | | | 449 | | | 182 | | | 188 | | | 8 | | | 8 | | | — | | | — | | | 1,304 | | | 1,380 | |
| 2018 | | 2018 | 1,625 | | | 1,791 | | | 580 | | | 632 | | | 184 | | | 198 | | | 10 | | | 10 | | | — | | | — | | | 2,399 | | | 2,631 | |
| 2019 | | 2019 | 1,022 | | | 1,064 | | | 146 | | | 150 | | | 656 | | | 677 | | | — | | | — | | | — | | | — | | | 1,824 | | | 1,891 | |
| 2020 | | 2020 | 615 | | | 621 | | | 276 | | | 283 | | | 203 | | | 210 | | | 27 | | | 28 | | | — | | | — | | | 1,121 | | | 1,142 | |
| 2021 | | 2021 | 253 | | | 256 | | | 127 | | | 129 | | | 174 | | | 176 | | | 22 | | | 22 | | | — | | | — | | | 576 | | | 583 | |
| Total | $ | 4,344 |
|
| $ | 4,474 |
|
| $ | 2,339 |
|
| $ | 2,405 |
|
| $ | 1,054 |
|
| $ | 1,078 |
|
| $ | 187 |
|
| $ | 174 |
|
| $ | 1 |
|
| $ | 1 |
|
| $ | 7,925 |
|
| $ | 8,132 |
| Total | $ | 6,059 | | | $ | 6,441 | | | $ | 2,861 | | | $ | 3,026 | | | $ | 2,079 | | | $ | 2,145 | | | $ | 277 | | | $ | 270 | | | $ | 181 | | | $ | 167 | | | $ | 11,457 | | | $ | 12,049 | |
| Ratings Distribution | | | 55.0 | % | | | | 29.6 | % | | | | 13.3 | % | | | | 2.1 | % | | | | — | % | | | | 100.0 | % | Ratings Distribution | | | 53.5 | % | | | | 25.1 | % | | | | 17.8 | % | | | | 2.2 | % | | | | 1.4 | % | | | | 100.0 | % |
| | | | | | | | | | | | | | | | | | | | | | | | | | | | | | | | | | | | |
| | December 31, 2016 | | December 31, 2020 |
| | Aaa | | Aa | | A | | Baa | | Below Investment Grade | | Total | | Aaa | | Aa | | A | | Baa | | Below
Investment
Grade | | Total |
| Vintage Year | | Vintage Year | Amortized
Cost net of ACL | | Estimated
Fair
Value | | Amortized
Cost net of ACL | | Estimated
Fair
Value | | Amortized
Cost net of ACL | | Estimated
Fair
Value | | Amortized
Cost net of ACL | | Estimated
Fair
Value | | Amortized
Cost net of ACL | | Estimated
Fair
Value | | Amortized
Cost net of ACL | | Estimated
Fair
Value |
| | Amortized
Cost | | Estimated
Fair
Value | | Amortized
Cost | | Estimated
Fair
Value | | Amortized
Cost | | Estimated
Fair
Value | | Amortized
Cost | | Estimated
Fair
Value | | Amortized
Cost | | Estimated
Fair
Value | | Amortized
Cost | | Estimated
Fair
Value | | (Dollars in millions) |
| | (Dollars in millions) | |
| 2003 - 2010 | $ | 246 |
| | $ | 258 |
| | $ | 46 |
| | $ | 46 |
| | $ | 102 |
| | $ | 104 |
| | $ | 24 |
| | $ | 24 |
| | $ | 26 |
| | $ | 28 |
| | $ | 444 |
| | $ | 460 |
| |
| 2011 | 185 |
| | 207 |
| | 41 |
| | 43 |
| | — |
| | — |
| | — |
| | — |
| | — |
| | — |
| | 226 |
| | 250 |
| |
| 2012 | 292 |
| | 308 |
| | 262 |
| | 271 |
| | 228 |
| | 236 |
| | 6 |
| | 6 |
| | — |
| | — |
| | 788 |
| | 821 |
| |
| 2013 | 844 |
| | 899 |
| | 699 |
| | 743 |
| | 339 |
| | 327 |
| | — |
| | — |
| | — |
| | — |
| | 1,882 |
| | 1,969 |
| |
| 2003 - 2013 | | 2003 - 2013 | $ | 958 | | | $ | 1,011 | | | $ | 898 | | | $ | 917 | | | $ | 373 | | | $ | 355 | | | $ | 105 | | | $ | 96 | | | $ | 114 | | | $ | 98 | | | $ | 2,448 | | | $ | 2,477 | |
| 2014 | 655 |
| | 667 |
| | 617 |
| | 626 |
| | 212 |
| | 204 |
| | — |
| | — |
| | — |
| | — |
| | 1,484 |
| | 1,497 |
| 2014 | 451 | | | 480 | | | 429 | | | 449 | | | 169 | | | 171 | | | 10 | | | 9 | | | — | | | — | | | 1,059 | | | 1,109 | |
| 2015 | 1,322 |
| | 1,326 |
| | 222 |
| | 214 |
| | 165 |
| | 164 |
| | 8 |
| | 9 |
| | — |
| | — |
| | 1,717 |
| | 1,713 |
| 2015 | 462 | | | 492 | | | 65 | | | 69 | | | 38 | | | 40 | | | 7 | | | 6 | | | — | | | — | | | 572 | | | 607 | |
| 2016 | 516 |
| | 514 |
| | 77 |
| | 75 |
| | 30 |
| | 31 |
| | 130 |
| | 130 |
| | — |
| | — |
| | 753 |
| | 750 |
| 2016 | 282 | | | 310 | | | 56 | | | 60 | | | 54 | | | 53 | | | — | | | — | | | — | | | — | | | 392 | | | 423 | |
| 2017 | | 2017 | 757 | | | 807 | | | 432 | | | 463 | | | 150 | | | 150 | | | — | | | — | | | — | | | — | | | 1,339 | | | 1,420 | |
| 2018 | | 2018 | 1,704 | | | 1,891 | | | 592 | | | 647 | | | 205 | | | 214 | | | 9 | | | 9 | | | — | | | — | | | 2,510 | | | 2,761 | |
| 2019 | | 2019 | 1,048 | | | 1,100 | | | 138 | | | 141 | | | 596 | | | 610 | | | — | | | — | | | — | | | — | | | 1,782 | | | 1,851 | |
| 2020 | | 2020 | 734 | | | 748 | | | 280 | | | 293 | | | 186 | | | 191 | | | 29 | | | 30 | | | — | | | — | | | 1,229 | | | 1,262 | |
| Total | $ | 4,060 |
|
| $ | 4,179 |
|
| $ | 1,964 |
|
| $ | 2,018 |
|
| $ | 1,076 |
|
| $ | 1,066 |
|
| $ | 168 |
|
| $ | 169 |
|
| $ | 26 |
|
| $ | 28 |
|
| $ | 7,294 |
|
| $ | 7,460 |
| Total | $ | 6,396 | | | $ | 6,839 | | | $ | 2,890 | | | $ | 3,039 | | | $ | 1,771 | | | $ | 1,784 | | | $ | 160 | | | $ | 150 | | | $ | 114 | | | $ | 98 | | | $ | 11,331 | | | $ | 11,910 | |
| Ratings Distribution | | | 56.0 | % | | | | 27.1 | % | | | | 14.3 | % | | | | 2.2 | % | | | | 0.4 | % | | | | 100.0 | % | Ratings Distribution | | | 57.4 | % | | | | 25.5 | % | | | | 15.0 | % | | | | 1.3 | % | | | | 0.8 | % | | | | 100.0 | % |
The tables above reflect NRSRO ratings including Moody’s Investors Service, S&P, Fitch Ratings and Morningstar, Inc. CMBS designated NAIC 1 were 97.9%88.1% and 98.1%88.8% of total CMBS at SeptemberJune 30, 20172021 and December 31, 2016.2020, respectively.
Evaluation of Fixed Maturity Securities AFS for Credit Loss, Rollforward of Allowance for Credit Loss and Credit Loss on Fixed Maturity Securities for OTTI and Evaluating Temporarily Impaired AFS SecuritiesRecognized in Earnings
See Note 6 of the Notes to the Interim Condensed Consolidated Financial Statements for information about the evaluation of fixed maturity securities and equity securities AFS for OTTI and evaluation of temporarily impaired AFS securities.
OTTI Losses on Fixed Maturity and Equity Securities AFS Recognized in Earnings
See Note 6credit loss, rollforward of the Notes to the Interim Condensed Consolidated Financial StatementsACL, net provision (release) for information about OTTI losses andcredit loss, as well as gross gains and gross losses on AFS securities sold.
Overview of Fixed Maturity and Equity Security OTTI Losses Recognized in Earnings
Impairments of fixed maturity and equity securities were $9 million and $24 million for the three months and nine months ended September 30, 2017, respectively, and $14 million and $154 million for the three months and nine months ended September 30, 2016, respectively. Impairments of fixed maturity securities were $5 millionAFS sold at and $7 million for the three months and ninesix months ended SeptemberJune 30, 2017, respectively,2021.
Contractholder-Directed Equity Securities and $9 million and $83 million for the three months and nine months ended September 30, 2016, respectively. Impairments of equity securities were $4 million and $17 million for the three months and nine months ended September 30, 2017, respectively, and $5 million and $71 million for the three months and nine months ended September 30, 2016, respectively.Fair Value Option Securities
Credit-related impairments of fixed maturity securities were $5 million and $7 million for the three months and nine months ended September 30, 2017, respectively, and $9 million and $73 million for the three months and nine months ended September 30, 2016, respectively.
Explanations of changes in fixed maturity and equity securities impairments are as follows:
Three Months Ended September 30, 2017 Compared with the Three Months Ended September 30, 2016
Overall OTTI losses recognized in earnings on fixed maturity and equity securities were $9 million for the three months ended September 30, 2017, as compared to $14 million for the three months ended September 30, 2016. The most significant decrease in OTTI losses were in RMBS, which comprised $1 million for the three months ended September 30, 2017, as compared to $9 million for the three months ended September 30, 2016. A decrease of $8 million in OTTI losses on RMBS reflected improving economic fundamentals.
Nine Months Ended September 30, 2017 Compared with the Nine Months Ended September 30, 2016
Overall OTTI losses recognized in earnings on fixed maturity and equity securities were $24 million for the nine months ended September 30, 2017 as compared to $154 million for the nine months ended September 30, 2016. The most significant decrease in OTTI losses were in U.S. and foreign corporate securities and common stock, which comprised $20 million for the nine months ended September 30, 2017, as compared to $137 million for the nine months ended September 30, 2016. A decrease of $62 million in OTTI losses on U.S. and foreign corporate securities was concentrated in the industrial sector and reflected the impact of lower oil prices on the energy sector in the prior year and weakening foreign currencies on non-functional currency denominated securities in the prior year. The decrease in OTTI losses on common stock was $55 million for the nine months ended September 30, 2017 and was also concentrated in industrial securities and reflected the impact of lower oil prices on the energy sector in the prior year.
Future Impairments
Future OTTI will depend primarily on economic fundamentals, issuer performance (including changes in the presentestimated fair value of future cash flows expected to be collected), and changes in credit ratings, collateral valuation, interest rates and credit spreads, as well as a change in our intention to hold or sell a security that is in an unrealized loss position. If economic fundamentals deteriorate or if there are adverse changes in the above factors, OTTI may be incurred in upcoming periods.
FVO Securities
FVO securitiesthese investments, which are primarily comprised of securities for which the FVO has been elected. FVO securities were $16.6Unit-linked investments, was $12.2 billion and $13.9$13.3 billion, at estimated fair value, or 3.6%2.4% and 3.2%2.5% of cash and invested assets, at SeptemberJune 30, 20172021 and December 31, 2016,2020, respectively. See Notes 6 and 8 of the Notes to the Interim Condensed Consolidated Financial Statements for a description of our FVO securitiesthis portfolio, the FVO securitiesits fair value hierarchy and a rollforward of the fair value measurements for FVO securitiesthese investments measured at estimated fair value on a recurring basis using significant unobservable (Level 3) inputs.
Securities Lending and Repurchase Agreements
We participate in a securities lending program whereby securities are loaned to third parties,third-parties, primarily brokerage firms and commercial banks. We obtain collateral, usually cash,also participate in an amount generally equal to 102% of the estimated fair value of the securities loaned, which is obtained at the inception of a loan and maintained at a level greater than or equal to 100% for the duration of the loan. We monitor the estimated fair value of the securities loaned on a daily basisshort-term repurchase agreement transactions with additional collateral obtained as necessary throughout the duration of the loan. Securities loaned under such transactions may be sold or re-pledged by the transferee. We are liable to return to our counterparties the cash collateral under our control. Security collateral received from counterparties may not be sold or re-pledged, unless the counterparty is in default, and is not reflected on the consolidatedunaffiliated financial statements. These transactions are treated as financing arrangements and the associated cash collateral liability is recorded at the amount of the cash received.
institutions. See “— Liquidity and Capital Resources — The Company — Liquidity and Capital Uses — Securities Lending”Lending and Repurchase Agreements” and Note 6 of the Notes to the Interim Condensed Consolidated Financial Statements for information regarding our securities lending program.further information.
Our mortgage loans held-for-investment are principally collateralized by commercial, agricultural and residential properties. Mortgage loans held-for-investment are carried at amortized cost and the related ACL are summarized as follows at:
Repurchase Agreements | | | | | | | | | | | | | | | | | | | | | | | | | | | | | | | | | | | | | | | | | | | | | | | | | | |
| June 30, 2021 | | December 31, 2020 |
| Portfolio Segment | | Amortized Cost | | % of Total | | ACL | | % of Amortized Cost | | Amortized Cost | | % of Total | | ACL | | % of Amortized Cost |
| | (Dollars in millions) |
| Commercial | | $ | 51,602 | | | 63.0 | % | | $ | 274 | | | 0.5 | % | | $ | 52,434 | | | 62.2 | % | | $ | 252 | | | 0.5 | % |
| Agricultural | | 18,044 | | | 22.0 | | | 86 | | | 0.5 | | | 18,128 | | | 21.5 | | | 106 | | | 0.6 | |
| Residential | | 12,281 | | | 15.0 | | | 210 | | | 1.7 | | | 13,782 | | | 16.3 | | | 232 | | | 1.7 | |
| Total | | $ | 81,927 | | | 100.0 | % | | $ | 570 | | | 0.7 | % | | $ | 84,344 | | | 100.0 | % | | $ | 590 | | | 0.7 | % |
The Company participates in short-term repurchase agreements with unaffiliated financial institutions. Under these agreements,carrying value of all mortgage loans, net of ACL, was 15.8% and 15.9% of cash and invested assets at June 30, 2021 and December 31, 2020, respectively.
Our commercial, agricultural and residential mortgage loan portfolios are subject to uncertain market conditions, including the Company lends fixed maturity securities and receives cash as collateral in an amount generally equal to 98%effects of the estimated fair valueCOVID-19 Pandemic. As a result of the securities loaned atCOVID-19 Pandemic, we granted concessions (e.g., payment deferrals and other loan modifications) to certain of our commercial mortgage loan borrowers (principally in the inceptionhotel and retail sectors) and residential mortgage loan borrowers and, to a much lesser extent, some of our agricultural mortgage loan borrowers. While we granted concessions in 2021, the transaction. The associated liability is recorded at the amount of cash received. The Company monitors the estimated fair value of the collateral and the securities loaned throughout the duration of the transaction and additional collateral is obtained as necessary. Securities loaned under such transactions may be sold or re-pledged by the transferee.
pace has significantly decreased from 2020. See Note 6 of the Notes to the Interim Condensed Consolidated Financial Statements for additionalfurther information regarding our repurchase agreements.
COVID-19 Pandemic-related mortgage loan concessions. See also “— Commercial Mortgage Loans by Geographic Region and Property Type.”
Our mortgage loans are principally collateralized by commercial, agricultural and residential properties. Mortgage loans and the related valuation allowances are summarized as follows at:
|
| | | | | | | | | | | | | | | | | | | | | | | | | | | | |
| | September 30, 2017 | | December 31, 2016 |
| | | Recorded Investment | | % of Total | | Valuation Allowance | | % of Recorded Investment | | Recorded Investment | | % of Total | | Valuation Allowance | | % of Recorded Investment |
| | | (Dollars in millions) |
| Commercial | | $ | 43,243 |
| | 63.8 | % | | $ | 213 |
| | 0.5 | % | | $ | 41,512 |
| | 64.0 | % | | $ | 202 |
| | 0.5 | % |
| Agricultural | | 12,967 |
| | 19.1 |
| | 41 |
| | 0.3 | % | | 12,564 |
| | 19.4 |
| | 39 |
| | 0.3 | % |
| Residential | | 11,599 |
| | 17.1 |
| | 62 |
| | 0.5 | % | | 10,829 |
| | 16.6 |
| | 63 |
| | 0.6 | % |
| Total | | $ | 67,809 |
| | 100.0 | % | | $ | 316 |
| | 0.5 | % | | $ | 64,905 |
| | 100.0 | % | | $ | 304 |
| | 0.5 | % |
The information presented in the tables herein exclude mortgage loans where we elected the FVO. Such amounts are presented in Note 6 of the Notes to the Interim Condensed Consolidated Financial Statements. The carrying value of all mortgage loans, net was 14.8% and 15.0% of cash and invested assets at September 30, 2017 and December 31, 2016, respectively.
We diversify our mortgage loan portfolio by both geographic region and property type to reduce the risk of concentration. Of our commercial and agricultural mortgage loan held-for-investment portfolios, 83% are collateralized by properties located in the United States, with the remaining 17% collateralized by properties located outside the United States, which includes 6%5% of properties located in the U.K.,Mexico and 1% of properties located in Chile, at SeptemberJune 30, 2017.2021. The carrying values of our commercial and agricultural mortgage loans held-for-investment located in California, New York and Texas were 19%17%, 11%10% and 8%7%, respectively, of total commercial and agricultural mortgage loans heldforinvestment at SeptemberJune 30, 2017.2021. Additionally, we manage risk when originating commercial and agricultural mortgage loans by generally lending up to 75% of the estimated fair value of the underlying real estate collateral.
We manage our residential mortgage loan heldforinvestment portfolio in a similar manner to reduce risk of concentration, with 91% collateralized by properties located in the United States, and the remaining 9% collateralizedcollateralized by properties located outside the United States, principally in Chile, at SeptemberJune 30, 2017.2021. The carrying values of our residential mortgage loans located in California, Florida, and New York were 31%, 9%, and 6%8%, respectively, of total residential mortgage loans at SeptemberJune 30, 2017.
In connection with our investment management business, we manage commercial, agricultural and residential mortgage loans on behalf of institutional clients, which are unaffiliated investors. These commercial, agricultural and residential mortgage loans had an estimated fair value of $14.2 billion at September 30, 2017 and these commercial mortgage loans had an estimated fair value of $3.0 billion at December 31, 2016. As these assets are managed on behalf of, and owned by, our institutional clients, they are not included in our interim condensed consolidated financial statements.
2021.
Commercial Mortgage Loans by Geographic Region and Property Type.Type. Commercial mortgage loans are the largest component of the mortgage loan invested asset class. The tables below present the diversification across geographic regions and property types of commercial mortgage loans held-for-investment at:
| | | | | | | | | | | | | | | | | | | | | | | | | | | | | |
| June 30, 2021 | | December 31, 2020 |
| Amount | | % of
Total | | Amount | | % of
Total |
| (Dollars in millions) |
| Region | | | | | | | |
| Non-U.S. | $ | 10,227 | | | 19.8 | % | | $ | 10,581 | | | 20.2 | % |
| Pacific | 10,161 | | | 19.7 | | | 10,235 | | | 19.5 | |
| Middle Atlantic | 8,115 | | | 15.7 | | | 8,233 | | | 15.7 | |
| South Atlantic | 7,186 | | | 13.9 | | | 7,217 | | | 13.8 | |
| West South Central | 3,636 | | | 7.0 | | | 3,887 | | | 7.4 | |
| East North Central | 2,197 | | | 4.3 | | | 2,494 | | | 4.8 | |
| New England | 2,214 | | | 4.3 | | | 2,126 | | | 4.0 | |
| Mountain | 1,903 | | | 3.7 | | | 1,777 | | | 3.4 | |
| East South Central | 781 | | | 1.5 | | | 700 | | | 1.3 | |
| West North Central | 649 | | | 1.3 | | | 609 | | | 1.2 | |
| Multi-Region and Other | 4,533 | | | 8.8 | | | 4,575 | | | 8.7 | |
| Total amortized cost | 51,602 | | | 100.0 | % | | 52,434 | | | 100.0 | % |
| Less: ACL | 274 | | | | | 252 | | | |
| Carrying value, net of ACL | $ | 51,328 | | | | | $ | 52,182 | | | |
| Property Type | | | | | | | |
| Office | $ | 22,883 | | | 44.3 | % | | $ | 23,928 | | | 45.6 | % |
| Retail | 8,960 | | | 17.4 | | | 8,911 | | | 17.0 | |
| Apartment | 8,699 | | | 16.9 | | | 8,764 | | | 16.7 | |
| Industrial | 5,437 | | | 10.5 | | | 5,365 | | | 10.2 | |
| Hotel | 3,187 | | | 6.2 | | | 3,377 | | | 6.5 | |
| Other | 2,436 | | | 4.7 | | | 2,089 | | | 4.0 | |
| Total amortized cost | 51,602 | | | 100.0 | % | | 52,434 | | | 100.0 | % |
| Less: ACL | 274 | | | | | 252 | | | |
| Carrying value, net of ACL | $ | 51,328 | | | | | $ | 52,182 | | | |
|
| | | | | | | | | | | | | | | |
| | September 30, 2017 | | December 31, 2016 |
| | Amount | | % of Total | | Amount | | % of Total |
| | (Dollars in millions) |
| Region | | | | | | | |
| Pacific | $ | 9,935 | | | 23.0 | % |
| $ | 9,506 | | | 22.9 | % |
| International | 8,361 | | | 19.3 |
| | 7,772 | | | 18.7 |
|
| Middle Atlantic | 7,616 | | | 17.6 |
| | 7,263 | | | 17.5 |
|
| South Atlantic | 4,624 | | | 10.7 |
| | 5,192 | | | 12.5 |
|
| West South Central | 3,679 | | | 8.5 |
| | 3,585 | | | 8.6 |
|
| East North Central | 2,413 | | | 5.6 |
| | 2,037 | | | 4.9 |
|
| Mountain | 1,200 | | | 2.8 |
| | 1,202 | | | 2.9 |
|
| New England | 1,162 | | | 2.7 |
| | 1,199 | | | 2.9 |
|
| West North Central | 478 | | | 1.1 |
| | 497 | | | 1.2 |
|
| East South Central | 835 | | | 1.9 |
| | 410 | | | 1.0 |
|
| Multi-Region and Other | 2,940 | | | 6.8 |
| | 2,849 | | | 6.9 |
|
| Total recorded investment | 43,243 | | | 100.0 | % | | 41,512 | | | 100.0 | % |
| Less: valuation allowances | 213 | | | | | 202 | | | |
| Carrying value, net of valuation allowances | $ | 43,030 | | | | | $ | 41,310 | | | |
| Property Type | | | | | | | |
| Office | $ | 22,339 | | | 51.7 | % | | $ | 20,868 | | | 50.3 | % |
| Retail | 8,694 | | | 20.1 |
| | 8,708 | | | 21.0 |
|
| Apartment | 5,730 | | | 13.2 |
| | 5,240 | | | 12.6 |
|
| Hotel | 3,493 | | | 8.1 |
| | 3,747 | | | 9.0 |
|
| Industrial | 2,744 | | | 6.3 |
| | 2,659 | | | 6.4 |
|
| Other | 243 | | | 0.6 |
| | 290 | | | 0.7 |
|
| Total recorded investment | 43,243 | | | 100.0 | % | | 41,512 | | | 100.0 | % |
| Less: valuation allowances | 213 | | | | | 202 | | | |
| Carrying value, net of valuation allowances | $ | 43,030 | | | | | $ | 41,310 | | | |
Mortgage Loan Credit Quality - Monitoring Process.We monitor our mortgage loan investments on an ongoing basis, including a review of loans by credit quality indicator and loans that are current, past due, restructured and under foreclosure. See Note 6 of the Notes to the Interim Condensed Consolidated Financial Statements for tables that presentfurther information regarding mortgage loans by credit quality indicator, past due and nonaccrual mortgage loans, as well as impaired mortgage loans. See “— Real Estate and Real Estate Joint Ventures” for real estate acquired through foreclosure.
We review our commercial mortgage loans on an ongoing basis. These reviews may include an analysis of the property financial statements and rent roll, lease rollover analysis, property inspections, market analysis, estimated valuations of the underlying collateral, loan-to-valueLTV ratios, debt service coverage ratiosDSCR and tenant creditworthiness. The monitoring process focuses on higher risk loans, which include those that are classified as restructured, delinquent or in foreclosure, as well as loans with higher loan-to-valueLTV ratios and lower debt service coverage ratios.DSCR and loans with a COVID-19 Pandemic-related payment deferral. The monitoring process for agricultural mortgage loans is generally similar, with a focus on higher risk loans, such as loans with higher loan-to-valueLTV ratios. Agricultural mortgage loans are reviewed on an ongoing basis which include, but are not limited to, property inspections, market analysis, estimated valuations of the underlying collateral, LTV ratios and borrower creditworthiness, including reviews on a geographic and sectorproperty-type basis. We review our residential mortgage loans on an ongoing basis.basis, with a focus on higher risk loans, such as nonperforming loans. See Note 8Notes 1 and 6 of the Notes to the Interim Condensed Consolidated Financial Statements included in the 2016 Annual Report for information on our evaluation of residential mortgage loans and related valuation allowanceACL methodology.
Loan-to-valueLTV ratios and debt service coverage ratiosDSCR are common measures in the assessment of the quality of commercial mortgage loans. Loan-to-valueLTV ratios are a common measure in the assessment of the quality of agricultural mortgage loans. Loan-to-valueLTV ratios compare the amount of the loan to the estimated fair value of the underlying collateral. A loan-to-valueAn LTV ratio greater than 100% indicates that the loan amount is greater than the collateral value. A loan-to-valueAn LTV ratio of less than 100% indicates an excess of collateral value over the loan amount. Generally, the higher the loan-to-valueLTV ratio, the higher the risk of experiencing a credit loss. The debt service coverage ratioDSCR compares a property’s net operating income to amounts needed to service the principal and interest due under the loan. Generally, the lower the debt service coverage ratio,DSCR, the higher the risk of experiencing a credit loss. For our commercial mortgage loans, our average loan-to-valueLTV ratio was 53%58% at both SeptemberJune 30, 20172021 and December 31, 20162020 and our average debt service coverage ratioDSCR was 2.8x2.6x and 2.7x2.5x at SeptemberJune 30, 20172021 and December 31, 2016,2020, respectively. Our debt service coverage ratioThe DSCR and the values utilized in calculating the ratio are updated annually, on a rolling basis, with a portion of the portfolio updated each quarter.routinely. In addition, the loan-to-valueLTV ratio is routinely updated for all but the lowest risk loans as part of our ongoing review of our commercial mortgage loan portfolio. For our agricultural mortgage loans, our average loan-to-valueLTV ratio was 43%48% at both SeptemberJune 30, 20172021 and December 31, 2016.2020. The values utilized in calculating theour agricultural mortgage loan loan-to-valueLTV ratio are developed in connection with the ongoing review of theour agricultural loan portfolio and are routinely updated.
Mortgage Loan Valuation Allowances. Allowance for Credit Loss.Our valuation allowances areACL is established both on a loan specific basis for those loans considered impaired where a property specific or market specific risk has been identified that could likely result in a future loss, as well as forboth pools of loans with similar risk characteristics whereand for mortgage loans with dissimilar risk characteristics, collateral dependent loans and reasonably expected troubled debt restructurings, individually on a propertyloan specific or market specific risk hasbasis. We record an allowance for expected lifetime credit loss in an amount that represents the portion of the amortized cost basis of mortgage loans that the Company does not been identified, but for which we expect to incur a loss. Accordingly, a valuation allowance is providedcollect, resulting in mortgage loans being presented at the net amount expected to absorb these estimated probablebe collected.
In determining our ACL, management (i) pools mortgage loans that share similar risk characteristics, (ii) considers expected lifetime credit losses.
The determinationloss over the contractual term of our mortgage loans, as adjusted for expected prepayments and any extensions, and (iii) considers past events and current and forecasted economic conditions. Actual credit loss realized could be different from the amount of valuation allowances is based upon our periodic evaluation and assessment of known and inherent risks associated with our loan portfolios. Such evaluations and assessments are based upon several factors, including our experience for loan losses, defaults and loss severity, and loss expectations for loans with similar risk characteristics.the ACL recorded. These evaluations and assessments are revised as conditions change and new information becomes available, which can cause the valuation allowancesACL to increase or decrease over time as such evaluations are revised. Negative credit migration, including an actual or expected increase in the level of problem loans, will result in an increase in the valuation allowance.ACL. Positive credit migration, including an actual or expected decrease in the level of problem loans, will result in a decrease in the valuation allowance.
ACL. See NotesNote 6 and 8 of the Notes to the Interim Condensed Consolidated Financial Statements for information abouton how valuation allowances arethe ACL is established and monitored, and activity in and balances of the valuation allowance, and the estimated fair value of impaired mortgage loans and related impairments included within net investment gains (losses)ACL, as of and for the ninesix months ended SeptemberJune 30, 20172021 and 2016.2020.
Real Estate and Real Estate Joint Ventures
Real estate and real estate joint ventures is comprised of wholly-owned real estate and joint ventures with interests in single property income-producing real estate and, to a lesser extent, joint ventures with interests in multi-property projects with varying strategies ranging from the development of properties to the operation of income-producing properties, as well as a runoff portfolio of real estate private equity funds.portfolio. The carrying valuesvalue of real estate and real estate joint ventures was $9.5 billion and $8.9$11.9 billion, or 2.1% and 2.1%2.3% of cash and invested assets, including properties acquired through foreclosure of $48 million and $59 million at Septemberboth June 30, 20172021 and December 31, 2016, respectively. The estimated fair value2020.
Our real estate investments are typically stabilized properties that we intend to hold for the longer-term for portfolio diversification and long-term appreciation. Our real estate investment portfolio has significantly appreciated since acquisition to a $6.2 billion and $6.1 billion unrealized gain position at June 30, 2021 and June 30, 2020, respectively, that is available to absorb valuation declines from the current economic conditions. We continuously monitor expected future cash flows of each of our real estate investments and incorporate them into our periodic impairment analyses. As a result of the COVID-19 Pandemic, we performed impairment analyses during the six months ended June 30, 2021 and June 30, 2020, which included updated estimates of expected future cash flows. As a result of our impairment analyses, we recorded one impairment during the six months ended June 30, 2020 for $13 million. This impairment was $14.5 billion and $14.0 billion at September 30, 2017 and December 31, 2016, respectively. The total gross market value of suchrecorded in net investment income as the investment is in a real estate investments was $18.7 billionfund. There were no impairments recognized in net investment gains (losses) on real estate and $18.5 billion at Septemberreal estate joint ventures for either the six months ended June 30, 2017 and December 31, 2016, respectively. Gross market value is the total fair value of these investments regardless of encumbering debt.2021 or 2020.
We diversify our real estate investments by both geographic region and property type to reduce risk of concentration. Of ourSee Note 6 of the Notes to the Interim Condensed Consolidated Financial Statements for a summary of real estate investments, excluding funds, 71% were located in the United States, with the remaining 29% located outside the United States, at September 30, 2017. The carrying value of our real estate investments, excluding funds, located in Japan, California and the District of Columbia were 26%, 16% and 10%, respectively, of total real estate investments, excluding funds, at September 30, 2017. Real estate funds were 13% of our real estate investments at September 30, 2017. The majority of these funds hold underlying real estate investments that areby income type, as well diversified across the United States.as income earned.
In connection with our investment management business, we manage real estate investments on behalf of institutional clients, which are unaffiliated investors. These real estate investments had an estimated fair value of $5.0 billion and $4.3 billion at September 30, 2017 and December 31, 2016, respectively. The total gross market value of commercial real estate investments under management for unaffiliated investors was $6.6 billion and $6.4 billion at September 30, 2017 and December 31, 2016, respectively. Gross market value is the total fair value of these investments regardless of encumbering debt. As these assets are managed on behalf of, and owned by, our institutional clients, they are not included in our consolidated financial statements.
Other Limited Partnership Interests
Other limited partnership interests are comprised of investments in private funds, including private equity funds and hedge funds. TheAt June 30, 2021 and December 31, 2020, the carrying value of other limited partnership interests was $5.5$12.0 billion or 1.2% and $9.5 billion, which included $643 million and $643 million of cashhedge funds, respectively. Other limited partnership interests were 2.32% and invested assets, and $5.1 billion, or 1.2%1.79% of cash and invested assets at SeptemberJune 30, 20172021 and December 31, 2016, respectively, which included $686 million and $834 million of hedge funds, at September 30, 2017 and December 31, 2016,2020, respectively. Cash distributions on these investments are generated from realized investment gains, operating income from the underlying investments of the funds and liquidation of the underlying investments of the funds.
We estimate thatuse the equity method of accounting for most of our private equity funds. We generally recognize our share of a private equity fund’s earnings in net investment income on a three-month lag when the information is reported to us. Accordingly, changes in equity market levels, which can impact the underlying investmentsresults of thethese private equity funds, will be liquidated over the next two to 10 years.are recorded in our net investment income on a three-month lag.
Other Invested Assets
The following table presents the carrying value of our other invested assets by type at:
| | | | | | | | | | | | | | | | | | | | | | | |
| | June 30, 2021 | | December 31, 2020 |
| Asset Type | Carrying
Value | | % of
Total | | Carrying
Value | | % of
Total |
| | (Dollars in millions) |
| Freestanding derivatives with positive estimated fair values | $ | 10,361 | | | 54.6 | % | | $ | 11,866 | | | 57.6 | % |
| Tax credit and renewable energy partnerships | 1,636 | | | 8.6 | | | 1,751 | | | 8.5 | |
| Direct financing leases | 1,336 | | | 7.0 | | | 1,340 | | | 6.5 | |
| Annuities funding structured settlement claims | 1,256 | | | 6.6 | | | 1,263 | | | 6.1 | |
| Leveraged leases | 796 | | | 4.2 | | | 816 | | | 4.0 | |
| FHLB common stock | 791 | | | 4.2 | | | 814 | | | 4.1 | |
| Operating joint ventures | 777 | | | 4.1 | | | 733 | | | 3.6 | |
| Funds withheld | 516 | | | 2.7 | | | 508 | | | 2.5 | |
| Other | 1,508 | | | 8.0 | | | 1,502 | | | 7.2 | |
| Total | $ | 18,977 | | | 100.0 | % | | $ | 20,593 | | | 100.0 | % |
| | | | | | | |
| Percentage of cash and invested assets | 3.7 | % | | | | 3.9 | % | | |
|
| | | | | | | | | | | | | |
| | September 30, 2017 | | December 31, 2016 |
| | Carrying Value | | % of Total | | Carrying Value | | % of
Total |
| | (Dollars in millions) |
| Freestanding derivatives with positive estimated fair values | $ | 8,792 |
|
| 49.8 | % |
| $ | 12,139 |
|
| 62.8 | % |
| Tax credit and renewable energy partnerships | 3,217 |
|
| 18.2 |
|
| 3,118 |
|
| 16.1 |
|
| Leveraged leases, net of non-recourse debt | 1,320 |
|
| 7.5 |
|
| 1,521 |
|
| 7.9 |
|
| Direct financing leases | 1,228 |
|
| 7.0 |
|
| 1,115 |
|
| 5.8 |
|
| Operating joint ventures | 601 |
|
| 3.4 |
|
| 576 |
|
| 3.0 |
|
| Funds withheld | 382 |
|
| 2.2 |
|
| 110 |
|
| 0.6 |
|
| Annuities funding structured settlement claims (1) | 1,286 |
|
| 7.3 |
|
| — |
|
| — |
|
| Other | 826 |
|
| 4.6 |
|
| 724 |
|
| 3.8 |
|
| Total | $ | 17,652 |
|
| 100.0 | % |
| $ | 19,303 |
|
| 100.0 | % |
| Percentage of cash and invested assets | 3.8 | % |
|
|
| 4.5 | % |
|
|
__________________
| |
(1) | See Note 3 of the Notes to the Interim Condensed Consolidated Financial Statements. |
As a structured settlements assignment company, the Company purchases annuities from Brighthouse to fund the periodic structured settlement claim payment obligations it assumes.
Derivatives
Derivative Risks
We are exposed to various risks relating to our ongoing business operations, including interest rate, foreign currency exchange rate, credit and equity market. We use a variety of strategies to manage these risks, including the use of derivatives. See Note 7 of the Notes to the Interim Condensed Consolidated Financial Statements for:
•A comprehensive description of the nature of our derivatives, including the strategies for which derivatives are used in managing various risks.
•Information about the gross notional amount, estimated fair value, and primary underlying risk exposure, gross notional amount, and estimated fair value of our derivatives by type of hedge designation, excluding embedded derivatives held at SeptemberJune 30, 20172021 and December 31, 2016.2020.
•The statement of operations effects of derivatives in net investments in foreign operations, cash flow, fair value, or nonqualifying hedge relationships for the three months and ninesix months ended SeptemberJune 30, 20172021 and 2016.2020.
See “Quantitative and Qualitative Disclosures About Market Risk — Management of Market Risk Exposures — Hedging Activities” included in the 20162020 Annual Report for more information about our use of derivatives by major hedge program.
Fair Value Hierarchy
See Note 8 of the Notes to the Interim Condensed Consolidated Financial Statements for derivatives measured at estimated fair value on a recurring basis and their corresponding fair value hierarchy.
The valuation of Level 3 derivatives involves the use of significant unobservable inputs and generally requires a higher degree of management judgment or estimation than the valuations of Level 1 and Level 2 derivatives. Although Level 3 inputs are unobservable, management believes they are consistent with what other market participants would use when pricing such instruments and are considered appropriate given the circumstances. The use of different inputs or methodologies could have a material effect on the estimated fair value of Level 3 derivatives and could materially affect net income.
Derivatives categorized as Level 3 at SeptemberJune 30, 20172021 include: interest rate forwards with maturities which extend beyond the observable portion of the yield curve; interest rate total return swaps with unobservable repurchase rates; interest rate caps with unobservable volatility inputs; foreign currency swaps and forwards with certain unobservable inputs, including the unobservable portion of the yield curve; credit default swaps priced using unobservable credit spreads, or that are priced through independent broker quotations; equity variance swaps with unobservable volatility inputs; and equity index options with unobservable correlation inputs. At SeptemberJune 30, 2017,2021, less than 1% of the estimated fair value of our derivatives was priced through independent broker quotations.
See Note 8 of the Notes to the Interim Condensed Consolidated Financial Statements for a rollforward of the fair value measurements for derivatives measured at estimated fair value on a recurring basis using significant unobservable (Level 3) inputs.
The gain (loss) on Level 3 derivatives primarily relates to interest rate total return swaps with unobservable repurchase rates, certain purchased equity index options that are valued using models dependent on an unobservable market correlation input, equity variance swaps that are valued using observable equity volatility data plus an unobservable equity variance spread and foreign currency swaps and forwardsderivatives that are valued using an unobservable portion of the swap yield curves.curves and interest rate total return swaps with observable interest rates. Other significant inputs include the unobservable interest rate which areextends beyond the observable include equity index levels, equity volatility andportion of the swap yield curves.curve. We validate the reasonableness of these inputs by valuing the positions using internal models and comparing the results to broker quotations.
The gain (loss) on Level 3 derivatives, percentage of gain (loss) attributable to observable and unobservable inputs, and the primary drivers of observable gain (loss) are summarized as follows:
|
| | | |
| | | Three Months
Ended
September 30, 2017 | Nine Months
Ended
September 30, 2017 |
| Gain (loss) recognized in net income (loss) | | $33 | $47 |
| Percentage of gain (loss) attributable to observable inputs | | 91% | 92% |
| Primary drivers of observable gain (loss) | | Weakening of the US dollar versus foreign currencies on receive inflation-linked foreign currency derivatives; partially offset by decreases in certain equity volatility levels and increases in certain equity index levels on equity derivatives. | Decreases in interest rates on interest rate derivatives; weakening of the US dollar and Euro versus foreign currencies on receive inflation-linked foreign currency derivatives; partially offset by decreases in certain equity volatility levels and increases in certain equity index levels on equity derivatives. |
| Percentage of gain (loss) attributable to unobservable inputs | | 9% | 8% |
| | | | | | | | | | | | | | |
| | Three Months
Ended
June 30, 2021 | | Six Months
Ended
June 30, 2021 |
| Gain (loss) recognized in net income (loss) (in millions) | | ($49) | | ($217) |
| Approximate percentage of gain (loss) attributable to observable inputs | | (27%) | | 53% |
| Primary drivers of observable gain (loss) | | Decreases in interest rates on interest rate total return swaps and increases in certain equity index levels on equity derivatives. | | Increases in interest rates on interest rate total return swaps and increases in certain equity index levels on equity derivatives. |
| Approximate percentage of gain (loss) attributable to unobservable inputs | | 127% | | 47% |
See “Management’s Discussion and Analysis of Financial Condition and Results of Operations — Summary of Critical Accounting Estimates — Derivatives” included in the 20162020 Annual Report for further information on the estimates and assumptions that affect derivatives.
Credit Risk
See Note 7 of the Notes to the Interim Condensed Consolidated Financial Statements for information about how we manage credit risk related to derivatives and for the estimated fair value of our net derivative assets and net derivative liabilities after the application of master netting agreements and collateral.
Our policy is not to offset the fair value amounts recognized for derivatives executed with the same counterparty under the same master netting agreement. This policy applies to the recognition of derivatives on the consolidated balance sheets, and does not affect our legal right of offset.
Credit Derivatives
The following table presents the gross notional amount and estimated fair value of credit default swaps at:
|
| | | | | | | | | | | | | | | | |
| | | September 30, 2017 | | December 31, 2016 |
| Credit Default Swaps | | Gross Notional Amount | | Estimated Fair Value | | Gross Notional Amount | | Estimated Fair Value |
| | | (In millions) |
| Purchased | | $ | 2,329 |
| | $ | (35 | ) | | $ | 2,001 |
| | $ | (26 | ) |
| Written | | 11,946 |
| | 255 |
| | 10,732 |
| | 152 |
|
| Total | | $ | 14,275 |
| | $ | 220 |
| | $ | 12,733 |
| | $ | 126 |
|
| | | | | | | | | | | | | | | | | | | | | | | | | | |
| | June 30, 2021 | | December 31, 2020 |
| Credit Default Swaps | | Gross
Notional
Amount | | Estimated
Fair Value | | Gross
Notional
Amount | | Estimated
Fair Value |
| | (In millions) |
| Purchased | | $ | 2,999 | | | $ | (103) | | | $ | 2,978 | | | $ | (112) | |
| Written | | 9,216 | | | 186 | | | 9,609 | | | 196 | |
| Total | | $ | 12,215 | | | $ | 83 | | | $ | 12,587 | | | $ | 84 | |
The following table presents the gross gains, gross losses and net gaingains (losses) recognized in incomenet derivative gains (losses) for credit default swaps as follows:
| | | | | Three Months
Ended
September 30, | | Nine Months
Ended
September 30, | | Three Months
Ended
June 30, | | Six Months
Ended
June 30, |
| | | 2017 | | 2016 | | 2017 | | 2016 | | 2021 | | 2020 | | 2021 | | 2020 |
| Credit Default Swaps | | Gross Gains
| | Gross Losses
| | Net Gains (Losses) | | Gross Gains (1) | | Gross Losses (1) | | Net Gains (Losses) | | Gross Gains
| | Gross Losses
| | Net Gains (Losses) | | Gross Gains (1) | | Gross Losses (1) | | Net Gains (Losses) | Credit Default Swaps | | Gross
Gains | | Gross
Losses | | Net
Gains
(Losses) | | Gross
Gains | | Gross
Losses | | Net
Gains
(Losses) | | Gross
Gains | | Gross
Losses | | Net
Gains
(Losses) | | Gross
Gains | | Gross
Losses | | Net
Gains
(Losses) |
| | | (In millions) | | | (In millions) |
| Purchased (2), (4) | | $ | 2 |
| | $ | (4 | ) | | $ | (2 | ) | | $ | — |
| | $ | (21 | ) | | $ | (21 | ) | | $ | 5 |
| | $ | (22 | ) | | $ | (17 | ) | | $ | 6 |
| | $ | (54 | ) | | $ | (48 | ) | |
| Written (3), (4) | | 39 |
| | (4 | ) | | 35 |
| | 51 |
| | — |
| | 51 |
| | 118 |
| | (7 | ) | | 111 |
| | 70 |
| | (21 | ) | | 49 |
| |
| Purchased (1) | | Purchased (1) | | $ | (4) | | | $ | (3) | | | $ | (7) | | | $ | (39) | | | $ | (22) | | | $ | (61) | | | $ | 16 | | | $ | (4) | | | $ | 12 | | | $ | 39 | | | $ | (27) | | | $ | 12 | |
| Written (1) | | Written (1) | | 30 | | | — | | | 30 | | | 27 | | | 135 | | | 162 | | | 42 | | | (7) | | | 35 | | | 29 | | | (178) | | | (149) | |
| Total | | $ | 41 |
| | $ | (8 | ) | | $ | 33 |
| | $ | 51 |
| | $ | (21 | ) | | $ | 30 |
| | $ | 123 |
| | $ | (29 | ) | | $ | 94 |
| | $ | 76 |
| | $ | (75 | ) | | $ | 1 |
| Total | | $ | 26 | | | $ | (3) | | | $ | 23 | | | $ | (12) | | | $ | 113 | | | $ | 101 | | | $ | 58 | | | $ | (11) | | | $ | 47 | | | $ | 68 | | | $ | (205) | | | $ | (137) | |
__________________
| |
(1) | Gains (losses) are reported in net derivative gains (losses), except for gains (losses) on the trading portfolio, which are reported in net investment income. |
| |
(2) | At September 30, 2017, the Company no longer maintained a trading portfolio for derivatives. The gross gains and gross (losses) for purchased credit default swaps in the trading portfolio were $0 and $0, respectively, for the three months ended September 30, 2016, and $4 million and ($4) million, respectively, for the nine months ended September 30, 2016. |
| |
(3) | At September 30, 2017, the Company no longer maintained a trading portfolio for derivatives. The gross gains and gross (losses) for written credit default swaps in the trading portfolio were $0 and $0, respectively, for the three months ended September 30, 2016 and $3 million and ($3) million, respectively, for the nine months ended September 30, 2016. |
| |
(4) | (1)Gains (losses) do not include earned income (expense) on credit default swaps. |
The favorable change in net gains (losses) on purchased credit default swaps of $31 million for the nine months ended September 30, 2017 compared to the nine months ended September 30, 2016 was due to widening in the current period as compared to the prior period of certain credit spreads on credit default swaps hedging certain bonds. swaps.
The favorable change in net gains (losses) on written credit default swaps of $62$184 million for the ninesix months ended SeptemberJune 30, 20172021 compared to the ninesix months ended SeptemberJune 30, 20162020 was due to narrowing in the current period, compared to the prior period, ofcertain credit spreads on certain credit default swaps used as replications.replications narrowing in the current period as compared to widening in the prior period.
The maximum amount at risk related to our written credit default swaps is equal to the corresponding gross notional amount. In a replication transaction, we pair an asset on our balance sheet with a written credit default swap to synthetically replicate a corporate bond, a core asset holding of life insurance companies. Replications are entered into in accordance with the guidelines approved by state insurance regulators and the NAIC and are an important tool in managing the overall corporate credit risk within the Company. In order to match our long-dated insurance liabilities, we seek to buy long-dated corporate bonds. In some instances, these may not be readily available in the market, or they may be issued by corporations to which we already have significant corporate credit exposure. For example, by purchasing Treasury bonds (or other high-quality assets) and associating them with written credit default swaps on the desired corporate credit name, we can replicate the desired bond exposures and meet our ALM needs. In addition, given the shorter tenor of the credit default swaps (generally five-year tenors) versus a long dated corporate bond, we have more flexibility in managing our credit exposures.
Embedded Derivatives
See Note 8 of the Notes to the Interim Condensed Consolidated Financial Statements for information about embedded derivatives measured at estimated fair value on a recurring basis and their corresponding fair value hierarchy.
See Note 8 of the Notes to the Interim Condensed Consolidated Financial Statements forhierarchy and a rollforward of the fair value measurements for embedded derivatives measured at estimated fair value on a recurring basis using significant unobservable (Level 3) inputs.
See Note 7 of the Notes to the Interim Condensed Consolidated Financial Statements for information about the nonperformance risk adjustment included in the valuation of guaranteed minimum benefits accounted for as embedded derivatives.
See “Management’s Discussion and Analysis of Financial Condition and Results of Operations — Summary of Critical Accounting Estimates — Derivatives” included in the 20162020 Annual Report for further information on the estimates and assumptions that affect embedded derivatives.
Off-Balance Sheet Arrangements
Credit and Committed Facilities
We maintain an unsecured revolving credit facility, andas well as certain committed facilities, with various financial institutions. See “— Liquidity and Capital Resources — The Company — Liquidity and Capital Sources — Global Funding Sources — Credit and Committed Facilities” for further descriptions of such arrangements. For the classification of expenses on such revolving credit and committed facilities and the nature of the associated liability for letters of credit issued and drawdowns on these credit and committed facilities, see Note 1213 of the Notes to the Consolidated Financial Statements included in the 20162020 Annual Report.
Collateral for Securities Lending, Repurchase Agreements, Third-Party Custodian Administered Repurchase Programs and Derivatives
We participate in a securities lending programtransactions, repurchase agreements and third-party custodian administered repurchase programs in the normal course of business for the purpose of enhancing the total return on our investment portfolio. Periodically, we receive non-cash collateral for securities lending from counterparties, which cannot be sold or re-pledged, and which has not been recorded on our consolidated balance sheets. The amount of this collateral was less than $1 million and $20 million at estimated fair value at September 30, 2017 and December 31, 2016, respectively. See Note 6 of the Notes to the Interim Condensed Consolidated Financial Statements, and “— Investments — Securities Lending,” as well as “Summary of Significant Accounting Policies — Investments — Securities Lending, Program”Repurchase Agreements and FHLB of Boston Advance Agreements” in Note 1 of the Notes to the Consolidated Financial Statements included in the 20162020 Annual Report for further discussion of our securities lending program,transactions and repurchase agreements, the classification of revenues and expenses, and the nature of the secured financing arrangementarrangements and associated liability.liabilities.
We also participate in third-partySecurities lending and repurchase agreements: Periodically we receive non-cash collateral for securities lending and repurchase agreements from counterparties, which is not reflected on our consolidated financial statements. The amount of this non-cash collateral was $31 million and $1 million at estimated fair value, at June 30, 2021 and December 31, 2020, respectively.
Third-party custodian administered repurchase programs for the purpose of enhancing the total return on our investment portfolio.programs: We loan certain of our fixed maturity securities AFS to unaffiliated financial institutions and, in exchange, non-cash collateral is put on deposit by the unaffiliated financial institutions on our behalf with third-party custodians. The estimated fair value of securities loaned in connection with these transactions was $406$223 million and $382$19 million at SeptemberJune 30, 20172021 and December 31, 2016,2020, respectively. Non-cash collateral on deposit with third-party custodians held on our behalf was $431$236 million and $401$20 million, at Septemberestimated fair value, at June 30, 20172021 and December 31, 2016,2020, respectively, which cannot be sold or re-pledged, and which hasis not been recorded onreflected in our consolidated balance sheets.financial statements.
Derivatives: We enter into derivatives to manage various risks relating to our ongoing business operations. We havereceive non-cash collateral from counterparties for derivatives, which can be sold or re-pledged subject to certain constraints, and which hasis not been recorded onreflected in our consolidated balance sheets.financial statements. The amount of this non-cash collateral was $1.3 billion and $1.7 billion, at Septemberestimated fair value, at June 30, 20172021 and December 31, 2016,2020, respectively. See “— Liquidity and Capital Resources — The Company — Liquidity and Capital Uses — Pledged Collateral” and Note 7 of the Notes to the Interim Condensed Consolidated Financial Statements for information regarding the earned income on and the gross notional amount, estimated fair value of assets and liabilities and primary underlying risk exposure of our derivatives.
Lease InvestmentCommitments
As lessee, we have enteredWe enter into various lease and sublease agreements for office space, information technology and other equipment. Ourthe following commitments under such lease agreements are included within the contractual obligations table. See “Management’s Discussion and Analysis of Financial Condition and Results of Operations — Liquidity and Capital Resources — The Company — Contractual Obligations” and Note 21 of the Notes to the Consolidated Financial Statements included in the 2016 Annual Report.
Guarantees
See “Guarantees” in Note 15normal course of business for the Notes topurpose of enhancing the Interim Condensed Consolidated Financial Statements.
Other
Additionally, we maketotal return on our investment portfolio: mortgage loan commitments and commitments to fund partnerships, bank credit facilities, bridge loans and private corporate bond investments in the normal course of business for the purpose of enhancing the total return on our investment portfolio. Other than these investment-related commitments which are disclosed ininvestments. See Note 15 of the Notes to the Interim Condensed Consolidated Financial Statements there are no other material obligations or liabilities arising from these investment- related commitments. Forfor further information onabout these investment-related commitments see “— Liquidity and Capital Resources — The Company — Contractual Obligations.”investment commitments. See “Net Investment Income” and “Net Investment Gains (Losses)” in Note 6 of the Notes to the Interim Condensed Consolidated Financial Statements for information on the investment income, investment expense, gains and losses from such investments.investments and the liability for credit loss for unfunded mortgage loan commitments. See also “— Investments — Fixed Maturity Securities AFS and Equity Securities, AFS,” “— Investments — Mortgage Loans,” “— Investments — Real Estate and Real Estate Joint Ventures” and “— Investments — Other Limited Partnership Interests”Interests.”
Lease Commitments
As lessee, we have entered into various lease and sublease agreements for information on our investmentsoffice space and equipment. Our commitments under such lease agreements are included within the contractual obligations table in fixed maturity“Management’s Discussion and equity securities, mortgage loansAnalysis of Financial Condition and partnerships.Results of Operations — Liquidity and Capital Resources — The Company — Contractual Obligations” in the 2020 Annual Report. See also Note 11 of the Notes to the Consolidated Financial Statements included in the 2020 Annual Report.
Guarantees
See “Guarantees” in Note 15 of the Notes to the Interim Condensed Consolidated Financial Statements.
Policyholder Liabilities
We establish, and carry as liabilities, actuarially determined amounts that are calculated to meet policy obligations or to provide for future annuity payments. Amounts for actuarial liabilities are computed and reported on the interim condensed consolidated financial statements in conformity with GAAP. For more details on Policyholder Liabilities, see “Management’s Discussion and Analysis of Financial Condition and Results of Operations — Summary of Critical Accounting Estimates” included in the 20162020 Annual Report.
Due to the nature of the underlying risks and the uncertainty associated with the determination of actuarial liabilities, we cannot precisely determine the amounts that will ultimately be paid with respect to these actuarial liabilities, and the ultimate amounts may vary from the estimated amounts, particularly when payments may not occur until well into the future.
We periodically review our estimates of actuarial liabilities for future benefits and compare them with our actual experience. We revise estimates, to the extent permitted or required under GAAP, if we determine that future expected experience differs from assumptions used in the development of actuarial liabilities. We charge or credit changes in our liabilities to expenses in the period the liabilities are established or re-estimated. If the liabilities originally established for future benefit payments prove inadequate, we must increase them. Such an increase could adversely affect our earnings and have a material adverse effect on our business, results of operations and financial condition.
We have experienced, and will likely in the future experience, catastrophe losses and possibly acts of terrorism, as well as turbulent financial markets that may have an adverse impact on our business, results of operations and financial condition. Due to their nature, we cannot predict the incidence, timing, severity or amount of losses from catastrophes and acts of terrorism, but we make broad use of catastrophic and non-catastrophic reinsurance to manage risk from these perils. We also use hedging, reinsurance and other risk management activities to mitigate financial market volatility.
Insurance regulators in many of the non-U.S. countries in which we operate require certain MetLife entities to prepare a sufficiency analysis of the reserves presented in the locally required regulatory financial statements, and to submit that analysis to the regulatory authorities. See “Business — Regulation — U.S. Regulation — Insurance Regulation — Policy and Contract Reserve Adequacy Analysis” and “Business“Risk Factors — Regulation — International Regulation”Business Risks” included in the 2016 Annual Report, as amended or supplemented in our subsequently filed Quarterly Reports on Form 10-Q under the caption “Management’s Discussion and Analysis of Financial Condition and Results of Operations — Industry Trends — Regulatory Developments.”
Future Policy Benefits
We establish liabilities for amounts payable under insurance policies. See Notes 1 and 4 of the Notes to the Consolidated Financial Statements included in the 20162020 Annual Report for additional information. See alsofurther information regarding required analyses of the adequacy of statutory reserves of our insurance operations.
The following discussion on future policy benefits and policyholder account balances should be read in conjunction with “Management’s Discussion and Analysis of Financial Condition and Results of Operations — Industry Trends — Impact of a Sustained Low Interest Rate Environment — Low Interest Rate Scenario”Environment” included in the 20162020 Annual Report, as amended or supplemented in our subsequently filed Quarterly Reports on Form 10-Q under similarly captioned sections, and “— Variable Annuity Guarantees.” See also Notes 1 and 4 of the Notes to the Consolidated Financial Statements included in the 2020 Annual Report for additional information.
Future Policy Benefits
We establish liabilities for amounts payable under insurance policies. A discussion of future policy benefits by segment (as well as Corporate & Other) follows.
U.S.
Amounts payable under insurance policies for this segment are comprised of group insurance and annuities, as well as property & casualty policies.annuities. For group insurance, future policyholder benefits are comprised mainly of liabilities for disabled lives under disability waiver of premium policy provisions, liabilities for survivor income benefit insurance, active life policies and premium stabilization and other contingency liabilities held under life insurance contracts. For group annuity contracts, future policyholder benefits are primarily related to payout annuities, including pension risk transfers, structured settlement annuities and institutional income annuities. There is no interest rate crediting flexibility on these liabilities. As a result, a sustained low interest rate environment could negatively impact earnings; however, we mitigate our risks by applying various ALM strategies, including the use of various interest rate derivative positions. The components of future policy benefits related to our property & casualty policies are liabilities for unpaid claims, estimated based upon assumptions such as rates of claim frequencies, levels of severities, inflation, judicial trends, legislative changes or regulatory decisions. Assumptions are based upon our historical experience and analysis of historical development patterns of the relationship of loss adjustment expenses to losses for each line of business, and we consider the effects of current developments, anticipated trends and risk management programs, reduced for anticipated salvage and subrogation.
Asia
Future policy benefits for this segment are held primarily for traditional life, endowment, annuity and accident & health contracts. They are also held for total return pass-through provisions included in certain universal life and savings products. They include certain liabilities for variable annuity and variable life guarantees of minimum death benefits, and longevity guarantees. Factors impacting these liabilities include sustained periods of lower yields than rates established at policy issuance,expected yields, lower than expected asset reinvestment rates, market volatility, actual lapses resulting in lower than expected income, and actual mortality or morbidity resulting in higher than expected benefit payments. We mitigate our risks by applying various ALM strategies.
Latin America
Future policy benefitsbenefit liabilities for this segment are held primarily for immediate annuities, in Chile, Argentina and Mexico and traditional life contracts mainly in Mexico, Brazil and Colombia. There are also liabilities held for total return pass-through provisions included in certain universal life and savings products in Mexico. Factorsproducts. There is limited interest rate crediting flexibility on the immediate annuity and traditional life liabilities. Other factors impacting these liabilities include sustained periods of lower yieldsare actual mortality resulting in higher than rates established at policy issuance,expected benefit payments and actual lapses resulting in lower than expected asset reinvestment rates, and mortality and lapses different than expected. We mitigate our risks by applying various ALM strategies.income.
EMEA
Future policy benefits for this segment include unearned premium reserves for group life and medical and credit insurance contracts. Future policy benefits are also held for traditional life, endowment and annuity contracts with significant mortality risk and accident & health contracts. Factors impacting these liabilities include lower than expected asset reinvestment rates, market volatility, actual lapses resulting in lower than expected income, and actual mortality or morbidity resulting in higher than expected benefit payments. We mitigate our risks by having premiums which are adjustable or cancellable in some cases, and by applying various ALM strategies.
MetLife Holdings
Future policy benefits for the life insurance business are comprised mainly of liabilities for traditional life insurance contracts. In order to manage risk, we have often reinsured a portion of the mortality risk on life insurance policies. The reinsurance programs are routinely evaluated and this may result in increases or decreases to existing coverage. We have entered into various interest rate derivative positions to mitigate the risk that investment of premiums received and reinvestment of maturing assets over the life of the policy will be at rates below those assumed in the original pricing of these contracts. For the annuities business, future policy benefits are comprised mainly of liabilities for life-contingent income annuities and liabilities for the variable annuity guaranteed minimum benefits whichthat are accounted for as insurance. OtherFor the long-term care business, future policyholder benefits are comprised mainly of liabilities for disabled lives under disability waiver of premium policy provisions, and active life policies. In addition, for our other products, future policyholder benefits related to the reinsurance of our former Japan joint venture are comprised of liabilities for the variable annuity guaranteed minimum benefits whichthat are accounted for as insurance.
Corporate & Other
Future policy benefits primarily include liabilities for the global employee benefits and other reinsurance business. Additionally, future policy benefits include liabilities for the U.S direct business sold directly to consumers.
Policyholder Account Balances
Policyholder account balances are generally equal to the account value, which includes accrued interest credited, but excludes the impact of any applicable charge that may be incurred upon surrender. See “Management’s Discussion and Analysis of Financial Condition and Results of Operations — Industry Trends — Impact of a Sustained Low Interest Rate Environment — Low Interest Rate Scenario” included in the 2016 Annual Report and “— Variable Annuity Guarantees.” See also Notes 1 and 4 of the Notes to the Consolidated Financial Statements included in the 2016 Annual Report for additional information. A discussion of policyholder account balances by segment follows.
U.S.
Policyholder account balances in this segment are comprised of funding agreements, retained asset accounts, universal life policies, the fixed account of variable life insurance policies and specialized life insurance products for benefit programs.
Group Benefits
Policyholder account balances in this business are held for retained asset accounts, universal life policies, the fixed account of variable life insurance policies and specialized life insurance products for benefit programs. Policyholder account balances are credited interest at a rate we determine, which is influenced by current market rates. A sustained low interest rate environment could negatively impact earnings as a result of the minimum credited rate guarantees present in mostMost of these policyholder account balances. Webalances have various interestminimum credited rate derivative positions to partially mitigate the risks associated with such a scenario.guarantees.
The table below presents the breakdown of account value subject to minimum guaranteed crediting rates for Group Benefits:
|
| | | | | | | |
| | September 30, 2017 |
| Guaranteed Minimum Crediting Rate | Account Value (1) | | Account Value at Guarantee (1) |
| | (In millions) |
| Greater than 0% but less than 2% | $ | 4,861 |
| | $ | 4,742 |
|
| Equal to or greater than 2% but less than 4% | $ | 1,843 |
| | $ | 1,843 |
|
| Equal to or greater than 4% | $ | 736 |
| | $ | 709 |
|
__________________
(1)These amounts are not adjusted for policy loans. | | | | | | | | | | | |
| June 30, 2021 |
| Guaranteed Minimum Crediting Rate | Account
Value | | Account
Value at
Guarantee |
| (In millions) |
| Greater than 0% but less than 2% | $ | 5,217 | | | $ | 5,090 | |
| Equal to or greater than 2% but less than 4% | $ | 1,597 | | | $ | 1,559 | |
| Equal to or greater than 4% | $ | 794 | | | $ | 765 | |
Retirement and Income Solutions
Policyholder account balances in this business are comprised ofheld largely for investment-type products, mainly funding agreements.agreements, as well as postretirement benefits and corporate-owned life insurance to fund non-qualified benefit programs for executives. Interest crediting rates vary by type of contract and can be fixed or variable. Variable interest crediting rates are generally tied to an external index, most commonly (1-month or 3-month) LIBOR.London Interbank Offered Rate or Secured Overnight Financing Rate. We are exposed to interest rate risks, as well as foreign currency exchange rate risk, when guaranteeingguarantee payment of interest and return of principal at the contractual maturity date. We may invest in floating rate assets or enter into receive-floating interest rate swaps, also tied
The table below presents the breakdown of account value subject to external indices, as well as interest rate caps, to mitigate the impact of changes in market interest rates. We also mitigate our risks by applying various ALM strategies and seek to hedge all foreign currency exchange rate risk through the use of foreign currency hedges, including cross currency swaps.minimum guaranteed crediting rates for RIS:
| | | | | | | | | | | |
| June 30, 2021 |
| Guaranteed Minimum Crediting Rate | Account
Value | | Account
Value at
Guarantee |
| (In millions) |
| Greater than 0% but less than 2% | $ | 146 | | | $ | — | |
| Equal to or greater than 2% but less than 4% | $ | 1,049 | | | $ | 143 | |
| Equal to or greater than 4% | $ | 4,619 | | | $ | 4,383 | |
Asia
Policyholder account balances in this segment are held largely for fixed income retirement and savings plans, fixed deferred annuities, interest sensitive whole life products, universal life and, to a lesser degree, liability amounts for unit-linked-type fundsUnit-linked investments that do not meet the GAAP definition of separate accounts. Also included are certain liabilities for retirement and savings products sold in certain countries in Asia that generally are sold with minimum credited rate guarantees. Liabilities for guarantees on certain variable annuities in Asia are accounted for as embedded derivatives and recorded at estimated fair value and are also included within policyholder account balances. These liabilities are generally impacted by sustained periodsMost of low interest rates, where there are interestthese policyholder account balances have minimum credited rate guarantees. We mitigate our risks by applying various ALM strategies and with reinsurance. Liabilities for unit-linked-type fundsUnit-linked investments are impacted by changes in the fair value of the associated underlying investments, as the return on assets is generally passed directly to the policyholder.
The table below presents the breakdown of account value subject to minimum guaranteed crediting rates for Asia:
| | | | | | | | | | | |
| June 30, 2021 |
| Guaranteed Minimum Crediting Rate | Account
Value | | Account
Value at
Guarantee |
| (In millions) |
| Annuities: | | | |
| Greater than 0% but less than 2% | $ | 31,595 | | | $ | 1,799 | |
| Equal to or greater than 2% but less than 4% | $ | 1,026 | | | $ | 427 | |
| Equal to or greater than 4% | $ | 1 | | | $ | 1 | |
| Life & Other: | | | |
| Greater than 0% but less than 2% | $ | 12,745 | | | $ | 12,211 | |
| Equal to or greater than 2% but less than 4% | $ | 32,574 | | | $ | 20,779 | |
| Equal to or greater than 4% | $ | 280 | | | $ | 280 | |
|
| | | | | | | |
| | September 30, 2017 |
| Guaranteed Minimum Crediting Rate | Account Value (1) | | Account Value at Guarantee (1) |
| | (In millions) |
| Annuities | | | |
| Greater than 0% but less than 2% | $ | 21,965 |
| | $ | 2,899 |
|
| Equal to or greater than 2% but less than 4% | $ | 1,168 |
| | $ | 409 |
|
| Equal to or greater than 4% | $ | 1 |
| | $ | 1 |
|
| Life & Other | | | |
| Greater than 0% but less than 2% | $ | 8,740 |
| | $ | 8,440 |
|
| Equal to or greater than 2% but less than 4% | $ | 21,521 |
| | $ | 8,906 |
|
| Equal to or greater than 4% | $ | 275 |
| | $ | 275 |
|
__________________
| |
(1) | These amounts are not adjusted for policy loans. |
Latin America
Policyholder account balances in this segment are held largely for investment-type products, and universal life products, in Mexico and Chile, and deferred annuities in Brazil. Some of the deferred annuities in Brazil are unit-linked-type fundsand Unit-linked investments that do not meet the GAAP definition of separate accounts. The rest of the deferred annuities have minimum credited rate guarantees, and these liabilities and the universal life liabilities are generally impacted by sustained periods of low interest rates. Liabilities for unit-linked-type fundsUnit-linked investments are impacted by changes in the fair value of the associated investments, as the return on assets is generally passed directly to the policyholder. Many of the other liabilities have minimum credited rate guarantees.
EMEA
Policyholder account balances in this segment are held mostly for universal life, deferred annuity,annuities, pension products, and unit-linked-type fundsUnit-linked investments that do not meet the GAAP definition of separate accounts. They are also held for endowment products without significant mortality risk. Where there are interestMost of these policyholder account balances have minimum credited rate guarantees, these liabilities are generally impacted by sustained periods of low interest rates. We mitigate our risks by applying various ALM strategies.guarantees. Liabilities for unit-linked-type fundsUnit-linked investments are impacted by changes in the fair value of the associated investments, as the return on assets is generally passed directly to the policyholder.
MetLife Holdings
Life policyholder account balances in this segment are held for retained asset accounts, universal life policies, the fixed account of variable life insurance policies, embedded derivatives related to the reinsurance of our former Japan joint venture, and funding agreements. For annuities, policyholder account balances are held for fixed deferred annuities, the fixed account portion of variable annuities, and non-life contingent income annuities.annuities, and embedded derivatives related to variable annuity guarantees. Interest is credited to the policyholder’s account at interest rates we determine which are influenced by current market rates, subject to specified minimums. A sustained low interest rate environment could negatively impact earnings as a result of the minimum credited rate guarantees present in mostMost of these policyholder account balances. Webalances have various interestminimum credited rate derivative positions to partially mitigate the risks associated with such a scenario.guarantees. Additionally, for our other products, policyholder account balances are held for variable annuity guaranteed minimum living benefitsguarantees assumed from a former operating joint venture in Japan that are accounted for as embedded derivatives.
The table below presents the breakdown of account value subject to minimum guaranteed crediting rates for the MetLife Holdings segment:
| | | | | | | | | | | |
| June 30, 2021 |
| Guaranteed Minimum Crediting Rate | Account
Value | | Account
Value at
Guarantee |
| (In millions) |
| Greater than 0% but less than 2% | $ | 1,202 | | | $ | 1,167 | |
| Equal to or greater than 2% but less than 4% | $ | 17,619 | | | $ | 16,005 | |
| Equal to or greater than 4% | $ | 7,486 | | | $ | 6,872 | |
|
| | | | | | | |
| | September 30, 2017 |
| Guaranteed Minimum Crediting Rate | Account Value (1) | | Account Value at Guarantee (1) |
| | (In millions) |
| Greater than 0% but less than 2% | $ | 1,793 |
| | $ | 1,705 |
|
| Equal to or greater than 2% but less than 4% | $ | 19,936 |
| | $ | 17,200 |
|
| Equal to or greater than 4% | $ | 9,204 |
| | $ | 6,184 |
|
__________________
| |
(1) | These amounts are not adjusted for policy loans. |
Variable Annuity Guarantees
We issue, directly and through assumed business, certain variable annuity products with guaranteed minimum benefits that provide the policyholder a minimum return based on their initial deposit (i.e., the benefit base) less withdrawals. In some cases, the benefit base may be increased by additional deposits, bonus amounts, accruals or optional market value resets. See Note 4 of the Notes to the Interim Condensed Consolidated Financial Statements, as well as Notes 1 and 4 of the Notes to the Consolidated Financial Statements included in the 20162020 Annual Report as well as Note 4 of the Notes to the Interim Condensed Consolidated Financial Statements, for additional information.
Certain guarantees, including portions thereof, have insurance liabilities established that are included in future policy benefits. Guarantees accounted for in this manner include guaranteed minimum death benefits (“GMDBs”), the life-contingent portion of certain guaranteed minimum withdrawal benefitbenefits (“GMWBs”), and the non-life contingent portions of both GMWBs andelective guaranteed minimum income benefitsbenefit (“GMIBs”GMIB”) annuitizations, and the life contingent portion of GMIBs that require annuitization.annuitization when the account balance goes to zero. These liabilities are accrued over the life of the contract in proportion to actual and future expected policy assessments based on the level of guaranteed minimum benefits generated using multiple scenarios of separate account returns. The scenarios are based on best estimate assumptions consistent with those used to amortize DAC. When current estimates of future benefits exceed those previously projected or when current estimates of future assessments are lower than those previously projected, liabilities will increase, resulting in a current period charge to net income. The opposite result occurs when the current estimates of future benefits are lower than those previously projected or when current estimates of future assessments exceed those previously projected. At the end of each reporting period, we update the actual amount of business remaining in-force, which impacts expected future assessments and the projection of estimated future benefits resulting in a current period charge or increase to earnings.
Certain guarantees, including portions thereof, accounted for as embedded derivatives, are recorded at estimated fair value and included in policyholder account balances. Guarantees accounted for as embedded derivatives include guaranteed minimum accumulation benefits (“GMABs”), the non-life contingent portion of GMWBs and thecertain non-life contingent portions of both GMWBs and GMIBs that do not require annuitization.GMIBs. The estimated fair values of guarantees accounted for as embedded derivatives are determined based on the present value of projected future benefits minus the present value of projected future fees. The projections of future benefits and future fees require capital market and actuarial assumptions including expectations concerning policyholder behavior. A risk neutralrisk-neutral valuation methodology is used to project the cash flows from the guarantees under multiple capital market scenarios to determine an economic liability. The reported estimated fair value is then determined by taking the present value of these risk-free generated cash flows using a discount rate that incorporates a spread over the risk-free rate to reflect our nonperformance risk and adding a risk margin. For more information on the determination of estimated fair value, see Note 8 of the Notes to the Interim Condensed Consolidated Financial Statements.
The table below presents the carrying value for guarantees at:
| | | | Future Policy Benefits | | Policyholder Account Balances | | Future Policy
Benefits | | Policyholder
Account Balances |
| | September 30, 2017 | | December 31, 2016 | | September 30, 2017 | | December 31, 2016 | | June 30, 2021 | | December 31, 2020 | | June 30, 2021 | | December 31, 2020 |
| | (In millions) | | (In millions) |
| Asia | | | | | | | | Asia | |
| GMDB | $ | 36 |
| | $ | 29 |
| | $ | — |
| | $ | — |
| GMDB | $ | 6 | | | $ | 6 | | | $ | — | | | $ | — | |
| GMAB | — |
| | — |
| | 22 |
| | 36 |
| GMAB | — | | | — | | | 12 | | | 26 | |
| GMWB | 85 |
| | 98 |
| | 184 |
| | 189 |
| GMWB | 34 | | | 35 | | | 118 | | | 134 | |
| EMEA | | | | | | | | EMEA | |
| GMDB | — |
| | 1 |
| | — |
| | — |
| GMDB | 4 | | | 6 | | | — | | | — | |
| GMAB | — |
| | — |
| | 14 |
| | 17 |
| GMAB | — | | | — | | | 11 | | | 31 | |
| GMWB | 36 |
| | 30 |
| | (91 | ) | | (50 | ) | GMWB | 24 | | | 31 | | | (68) | | | (23) | |
| MetLife Holdings | | | | | | | | MetLife Holdings | |
| GMDB | 302 |
| | 257 |
| | — |
| | — |
| GMDB | 465 | | | 450 | | | — | | | — | |
| GMIB | 574 |
| | 471 |
| | (75 | ) | | 454 |
| GMIB | 925 | | | 954 | | | 80 | | | 323 | |
| GMAB | — |
| | — |
| | 2 |
| | 15 |
| GMAB | — | | | — | | | (1) | | | — | |
| GMWB | 182 |
| | 161 |
| | 1,283 |
| | 1,296 |
| GMWB | 178 | | | 179 | | | 224 | | | 443 | |
| Total | $ | 1,215 |
| | $ | 1,047 |
| | $ | 1,339 |
| | $ | 1,957 |
| Total | $ | 1,636 | | | $ | 1,661 | | | $ | 376 | | | $ | 934 | |
The carrying amounts for guarantees included in policyholder account balances above include nonperformance risk adjustments of $490$86 million and $655$137 million at SeptemberJune 30, 20172021 and December 31, 2016,2020, respectively. These nonperformance risk adjustments represent the impact of including a credit spread when discounting the underlying risk neutralrisk-neutral cash flows to determine the estimated fair values. The nonperformance risk adjustment does not have an economic impact on us as it cannot be monetized given the nature of these policyholder liabilities. The change in valuation arising from the nonperformance risk adjustment is not hedged.
The carrying values of these guarantees can change significantly during periods of sizable and sustained shifts in equity market performance, equity volatility, interest rates or foreign currency exchange rates. Carrying values are also impacted by our assumptions around mortality, separate account returns and policyholder behavior, including lapse rates.
As discussed below, we use a combination of product design, hedging strategies, reinsurance, and other risk management actions to mitigate the risks related to these benefits. Within each type of guarantee, there is a range of product offerings reflecting the changing nature of these products over time. Changes in product features and terms are in part driven by customer demand but, more importantly, reflect our risk management practices of continuously evaluating the guaranteed benefits and their associated asset-liability matching. Recently, we have been diversifyingWe continue to diversify the concentration of income benefits in theour portfolio of the Company’s annuities business by focusing on withdrawal benefits, variable annuities without living benefits and index-linked annuities. To this end, the GMIBs were no longer available for new purchases after February 19, 2016.
The sections below provide further detail by total account value for certain of our most popular guarantees. Total account values include amounts not reported on the consolidated balance sheets from assumed business, contractholder-directedUnit-linked investments whichthat do not qualify for presentation as separate account assets, and amounts included in our general account. The total account values and the net amounts at risk include direct and assumed business, but exclude offsets from hedging or ceded reinsurance, if any.
GMDBs
We offer a range of GMDBs to our contractholders. The table below presents GMDBs, by benefit type, at SeptemberJune 30, 2017:2021:
| | | | Total Account Value (1) | | Total Account Value (1) |
| | Asia & EMEA | | MetLife Holdings | | Asia & EMEA | | MetLife Holdings |
| | (In millions) | | (In millions) |
| Return of premium or five to seven year step-up | $ | 8,114 |
| | $ | 54,813 |
| Return of premium or five to seven year step-up | $ | 7,921 | | | $ | 47,951 | |
| Annual step-up | — |
| | 3,726 |
| Annual step-up | — | | | 3,234 | |
| Roll-up and step-up combination | — |
| | 6,575 |
| Roll-up and step-up combination | — | | | 5,585 | |
| Total | $ | 8,114 |
| | $ | 65,114 |
| Total | $ | 7,921 | | | $ | 56,770 | |
__________________
| |
(1) | Total account value excludes $345 million for contracts with no GMDBs. Further, many of our annuity contracts offer more than one type of guarantee such that GMDB amounts listed above are not mutually exclusive to the amounts in the living benefit guarantees table below. |
(1)Total account value excludes $607 million for contracts with no GMDBs. The Company’s annuity contracts with guarantees may offer more than one type of guarantee in each contract. Therefore, the amounts listed for GMDBs and for living benefit guarantees are not mutually exclusive.
Based on total account value, less than 19%18% of our GMDBs included enhanced death benefits such as the annual step-up or roll-up and step-up combination products. We expect the above GMDB risk profile to be relatively consistent for the foreseeable future.products at June 30, 2021.
Living Benefit Guarantees
The table below presents our living benefit guarantees based on total account values at SeptemberJune 30, 2017:2021:
| | | | Total Account Value (1) | | Total Account Value (1) |
| | Asia & EMEA | | MetLife Holdings | | Asia & EMEA | | MetLife Holdings |
| | (In millions) | | (In millions) |
| GMIB | $ | — |
| | $ | 25,123 |
| GMIB | $ | — | | | $ | 21,100 | |
| GMWB - non-life contingent (2) | 2,396 |
| | 3,438 |
| GMWB - non-life contingent (2) | 1,053 | | | 2,238 | |
| GMWB - life-contingent | 3,859 |
| | 11,229 |
| GMWB - life-contingent | 3,392 | | | 8,816 | |
| GMAB | 1,247 |
| | 625 |
| GMAB | 1,780 | | | 166 | |
| | $ | 7,502 |
| | $ | 40,415 |
| |
| Total | | Total | $ | 6,225 | | | $ | 32,320 | |
__________________
| |
(1) | Total account value excludes $25.0 billion for contracts with no living benefit guarantees. Further, many of our annuity contracts offer more than one type of guarantee such that living benefit guarantee amounts listed above are not mutually exclusive of the amounts in the GMDBs table above. |
| |
(2) | The Asia and EMEA segments include the non-life contingent portion of the GMWB total account value of $975 million with a guarantee at annuitization. |
(1)Total account value excludes $26.8 billion for contracts with no living benefit guarantees. The Company’s annuity contracts with guarantees may offer more than one type of guarantee in each contract. Therefore, the amounts listed for GMDBs and for living benefit guarantee amounts are not mutually exclusive.
(2)The Asia and EMEA segments include the non-life contingent portion of the GMWB total account value of $1.0 billion with a guarantee at annuitization.
In terms of total account value, GMIBs are our most significant living benefit guarantee. Our primary risk management strategy for our GMIB products is our derivatives hedging program as discussed below. Additionally, we have engaged in certain reinsurance agreements covering some of our GMIB business. As part of our overall risk management approach for living benefit guarantees, we continually monitor the reinsurance markets for the right opportunity to purchase additional coverage for our GMIB business.
We stopped selling GMIBs in February 2016.
The table below presents our GMIB associated total account values, by their guaranteed payout basis, at SeptemberJune 30, 2017:2021:
|
| | | |
| | Total Account Value |
| | (In millions) |
| 7-year setback, 2.5% interest rate | $ | 6,517 |
|
| 7-year setback, 1.5% interest rate | 1,063 |
|
| 10-year setback, 1.5% interest rate | 5,668 |
|
| 10-year mortality projection, 10-year setback, 1.0% interest rate | 10,097 |
|
| 10-year mortality projection, 10-year setback, 0.5% interest rate | 1,778 |
|
| | $ | 25,123 |
|
| | | | | |
| Total Account Value |
| (In millions) |
| 7-year setback, 2.5% interest rate | $ | 6,191 | |
| 7-year setback, 1.5% interest rate | 1,232 | |
| 10-year setback, 1.5% interest rate | 4,221 | |
| 10-year mortality projection, 10-year setback, 1.0% interest rate | 8,044 | |
| 10-year mortality projection, 10-year setback, 0.5% interest rate | 1,412 | |
| $ | 21,100 | |
The annuitization interest rates on GMIBs have been decreased from 2.5% to 0.5% over time, partially in response to the low interest rate environment, accompanied by an increase in the setback period from seven years to 10 years and the introduction of a 10-year mortality projection.
Additionally, 40%39% of the $25.1$21.1 billion of GMIB total account value has been invested in managed volatility funds as of SeptemberJune 30, 2017.2021. These funds seek to manage volatility by adjusting the fund holdings within certain guidelines based on capital market movements. Such activity reduces the overall risk of the underlying funds while maintaining their growth opportunities. These risk mitigation techniques reduce or eliminate the need for us to manage the funds’ volatility through hedging or reinsurance.
Our GMIB products typically have a waiting period of 10 years to be eligible for annuitization. As of SeptemberJune 30, 2017,2021, only 14%32% of our contracts with GMIBs were eligible for annuitization. The remaining contracts are not eligible for annuitization for an average of fivethree years.
Once eligible for annuitization, contractholders would be expected to annuitize only if their contracts were in-the-money. We calculate in-the-moneyness with respect to GMIBs consistent with net amount at risk as discussed in Note 4 of the Notes to the Interim Condensed Consolidated Financial Statements, by comparing the contractholders’ income benefits based on total account values and current annuity rates versus the guaranteed income benefits. The net amount at risk was $568$451 million at SeptemberJune 30, 2017,2021, of which $383$406 million was related to GMIB guarantees.GMIBs. For those contracts with GMIB, the table below presents details of contracts that are in-the-money and out-of-the-money at SeptemberJune 30, 2017:2021:
| | | | | | | | | | | | | | | | | |
| In-the-
Moneyness | | Total
Account Value | | % of Total |
| | | (In millions) | | |
| In-the-money | 30% or greater | | $ | 413 | | | 2 | % |
| 20% to less than 30% | | 201 | | | 1 | % |
| 10% to less than 20% | | 384 | | | 2 | % |
| 0% to less than 10% | | 636 | | | 3 | % |
| | | 1,634 | | | |
| Out-of-the-money | -10% to 0% | | 1,542 | | | 7 | % |
| -20% to less than -10% | | 4,160 | | | 20 | % |
| Greater than -20% | | 13,764 | | | 65 | % |
| | | 19,466 | | | |
| Total GMIBs | | | $ | 21,100 | | | |
|
| | | | | | | | |
| | In-the- Moneyness | | Total Account Value | | % of Total |
|
| | (Dollars in millions) |
| In-the-money | 30% + | | $ | 346 |
| | 1 | % |
| | 20% to 30% | | 313 |
| | 1 | % |
| | 10% to 20% | | 603 |
| | 2 | % |
| | 0% to 10% | | 1,160 |
| | 5 | % |
| | | | 2,422 |
| | |
| Out-of-the-money | -10% to 0% | | 2,851 |
| | 11 | % |
| | -20% to -10% | | 2,859 |
| | 11 | % |
| | -20% + | | 16,991 |
| | 68 | % |
| | | | 22,701 |
| | |
| Total GMIBs | | | $ | 25,123 |
| | |
Derivatives Hedging Variable Annuity Guarantees
Our risk mitigating hedging strategy uses various over-the-counter and exchange traded derivatives. The table below presents the gross notional amount, estimated fair value and primary underlying risk exposure of the derivatives hedging our variable annuity guarantees:
| | | | | Instrument Type | | September 30, 2017 | | December 31, 2016 | | Instrument Type | | June 30, 2021 | | December 31, 2020 |
Primary Underlying Risk Exposure | | Gross Notional Amount | | Estimated Fair Value | | Gross Notional Amount | | Estimated Fair Value | Primary Underlying
Risk Exposure | | Gross Notional
Amount | | Estimated Fair Value | | Gross Notional
Amount | | Estimated Fair Value |
| Instrument Type | | Assets | | Liabilities | | Assets | | Liabilities | Instrument Type | | Liabilities | | Assets | | Liabilities |
| | | (In millions) | | | | | (In millions) |
| Interest rate | | Interest rate swaps | | $ | 16,532 |
| |
| | $ | 30 |
| | $ | 19,715 |
| | $ | 1,590 |
| | $ | 924 |
| Interest rate | | Interest rate swaps | | $ | 13,078 | | | $ | 16 | | | $ | 14,188 | | | $ | 85 | | | $ | 21 | |
| | | Interest rate futures | | 2,810 |
| | 13 |
| | — |
| | 2,671 |
| | 2 |
| | 11 |
| | Interest rate futures | | 1,610 | | | — | | | 3 | | | 1,442 | | | — | | | 2 | |
| | | Interest rate options | | 10,173 |
| | 492 |
| | 35 |
| | 3,423 |
| | 449 |
| | 1 |
| | Interest rate options | | 77 | | | 1 | | | — | | | 637 | | | 134 | | | — | |
| Foreign currency exchange rate | | Foreign currency forwards | | 2,726 |
| | 6 |
| | 138 |
| | 3,086 |
| | 10 |
| | 222 |
| Foreign currency exchange rate | | Foreign currency forwards | | 1,388 | | | 8 | | | 8 | | | 1,834 | | | 27 | | | 13 | |
| | | Currency futures | | — |
| | — |
| | — |
| | 85 |
| | — |
| | — |
| |
| | Equity market | | Equity futures | | 4,129 |
| | 2 |
| | 29 |
| | 4,283 |
| | 29 |
| | 3 |
| Equity market | | Equity futures | | 3,644 | | | 7 | | | 7 | | | 4,891 | | | 12 | | | 38 | |
| | | Equity index options | | 9,945 |
| | 339 |
| | 679 |
| | 13,975 |
| | 403 |
| | 524 |
| | Equity index options | | 4,940 | | | 409 | | | 413 | | | 5,360 | | | 558 | | | 408 | |
| | | Equity variance swaps | | 8,337 |
| | 103 |
| | 285 |
| | 8,263 |
| | 83 |
| | 239 |
| | Equity variance swaps | | 716 | | | 17 | | | 15 | | | 716 | | | 15 | | | 12 | |
| | | Equity total return swaps | | 1,103 |
| | — |
| | 35 |
| | 1,046 |
| | 1 |
| | 43 |
| | Equity total return swaps | | 2,292 | | | 2 | | | 46 | | | 1,533 | | | 3 | | | 124 | |
| | | Total | | $ | 55,755 |
| | $ | 1,383 |
| | $ | 1,231 |
| | $ | 56,547 |
| | $ | 2,567 |
| | $ | 1,967 |
| | Total | | $ | 27,745 | | | $ | 505 | | | $ | 508 | | | $ | 30,601 | | | $ | 834 | | | $ | 618 | |
The change in estimated fair values of our derivatives is recorded in policyholder benefits and claims if such derivatives are hedging guarantees included in future policy benefits, and in net derivative gains (losses) if such derivatives are hedging guarantees included in policyholder account balances.
Our hedging strategy involves the significant use of static longer-term derivative instruments to avoid the need to execute transactions during periods of market disruption or higher volatility. We continually monitor the capital markets for opportunities to adjust our liability coverage, as appropriate. Futures are also used to dynamically adjust the daily coverage levels as markets and liability exposures fluctuate.
We remain liable for the guaranteed benefits in the event that reinsurers or derivative counterparties are unable or unwilling to pay. Certain of our reinsurance agreements and mostall derivative positions are collateralized and derivatives positions are subject to master netting agreements, both of which significantly reduce the exposure to counterparty risk. In addition, we are subject to the risk that hedging and other risk management actions prove ineffective or that unanticipated policyholder behavior or mortality, combined with adverse market events, produces economic losses beyond the scope of the risk management techniques employed.
Liquidity and Capital Resources
Overview
Our business and results of operations are materially affected by conditions in the global capital markets and the economy generally. Stressed conditions, volatility and disruptions in global capital markets, particular markets, or financial asset classes can have an adverse effect on us, in part because we have a large investment portfolio and our insurance liabilities and derivatives are sensitive to changing market factors. TheChanging conditions in the global capital markets and the economy continue to experience volatility that may affect our financing costs and market interest for our debt or equity securities. For further information regarding market factors that could affect our ability to meet liquidity and capital needs, see “— Industry Trends” and “— Investments — Current Environment.”
Liquidity Management
Based upon the strength of our franchise, diversification of our businesses, strong financial fundamentals and the substantial funding sources available to us as described herein, we continue to believe we have access to ample liquidity to meet business requirements under current market conditions and reasonably possible stress scenarios. We continuously monitor and adjust our liquidity and capital plans for MetLife, Inc. and its subsidiaries in light of market conditions, as well as changing needs and opportunities.
Short-term Liquidity
We maintain a substantial short-term liquidity position, which was $10.8$13.4 billion and $9.1$9.4 billion at SeptemberJune 30, 20172021 and December 31, 2016,2020, respectively. Short-term liquidity includes cash and cash equivalents and short-term investments, excluding assets that are pledged or otherwise committed, including amounts received in connection with securities lending, repurchase agreements, derivatives, and secured borrowings, as well as amounts held in the closed block.
Liquid Assets
An integral part of our liquidity management includes managing our level of liquid assets, which was $210.3$226.6 billion and $199.1$235.1 billion at SeptemberJune 30, 20172021 and December 31, 2016,2020, respectively. Liquid assets include cash and cash equivalents, short-term investments and publicly-traded securities, excluding assets that are pledged or otherwise committed. Assets pledged or otherwise committed include amounts received in connection with securities lending, repurchase agreements, derivatives, regulatory deposits, athe collateral financing arrangement, funding agreements and secured borrowings, as well as amounts held in the closed block.
Capital Management
We have established several senior management committees as part of our capital management process. These committees, including the Capital Management Committee and the Enterprise Risk Committee (“ERC”), regularly review actual and projected capital levels (under a variety of scenarios including stress scenarios) and our annual capital plan in accordance with our capital policy. The Capital Management Committee is comprised of members of senior management, including MetLife, Inc.’s Chief Financial Officer (“CFO”), Treasurer, and Chief Risk Officer (“CRO”). The ERC is also comprised of members of senior management, including MetLife, Inc.’s CFO, CRO and Chief Investment Officer.
OurMetLife, Inc.’s Board of Directors (“Board”Board of Directors”) and senior management are directly involved in the development and maintenance of our capital policy. The capital policy sets forth, among other things, minimum and target capital levels and the governance of the capital management process. All capital actions, including proposed changes to the annual capital plan, capital targets or capital policy, are reviewed by the Finance and Risk Committee of the Board of Directors prior to obtaining full Board of Directors approval. The Board of Directors approves the capital policy and the annual capital plan and authorizes capital actions, as required.
See “Risk Factors — Capital-RelatedCapital Risks — We May not be Able to Pay Dividends or Repurchase Our Stock Due to Legal and Regulatory Restrictions and Uncertainty and Restrictions Under the Terms of Certain of Our Securities May Prevent Us from Repurchasing Our Stock and Paying Dividends at the Level We Wish” included in the 2016 Annual Reportor Cash Buffer Needs” and Note 16 of the Notes to the Consolidated Financial Statements included in the 20162020 Annual Report as updated in “Risk Factors — Capital-Related Risks” herein, for information regarding restrictions on payment of dividends and stock repurchases. See also “— The Company — Liquidity and Capital Uses — Common Stock Repurchases” for information regarding MetLife, Inc.’s common stock repurchase authorization.authorizations.
The Company
Liquidity
Liquidity refers to the ability to generate adequate amounts of cash to meet our needs. In the event of significant cash requirements beyond anticipated liquidity needs, we have various alternatives available depending on market conditions and the amount and timing of the liquidity need. These available alternatives include cash flows from operations, sales of liquid assets, global funding sources including commercial paper and various credit and committed facilities. See “Management’s Discussion and Analysis of Financial Condition — Liquidity and Capital Resources — The Company — Liquidity” included in the 2020 Annual Report.
Capital
We manage our capital position to maintain our financial strength and credit ratings. Our capital position is supported by our ability to generate strong cash flows within our operating companies and borrow funds at competitive rates, as well as by our demonstrated ability to raise additional capital to meet operating and growth needs despite adverse market and economic conditions.
Summary of the Company’s Primary Sources and Uses of Liquidity and Capital
Our primary sources and uses of liquidity and capital are summarized as follows:
| | | | Nine Months
Ended
September 30, | | Six Months
Ended
June 30, |
| | 2017 | | 2016 | | 2021 | | 2020 |
| | (In millions) | | (In millions) |
| Sources: | | | | Sources: | |
| Operating activities, net | $ | 10,233 |
| | $ | 9,131 |
| Operating activities, net | $ | 3,750 | | | $ | 2,693 | |
| Changes in policyholder account balances, net | 5,332 |
| | 4,080 |
| |
| Changes in payables for collateral under securities loaned and other transactions, net | 2,316 |
| | 7,227 |
| |
| Net change in policyholder account balances | | Net change in policyholder account balances | 3,870 | | | 7,011 | |
| Net change in payables for collateral under securities loaned and other transactions | | Net change in payables for collateral under securities loaned and other transactions | 506 | | | 7,401 | |
| Cash received for other transactions with tenors greater than three months | | Cash received for other transactions with tenors greater than three months | — | | | 50 | |
| Long-term debt issued | 3,657 |
| | — |
| Long-term debt issued | 15 | | | 1,074 | |
| Financing element on certain derivative instruments and other derivative related transactions, net | | Financing element on certain derivative instruments and other derivative related transactions, net | 318 | | | — | |
| Preferred stock issued, net of issuance costs | | Preferred stock issued, net of issuance costs | — | | | 972 | |
| Other, net | — |
| | 60 |
| Other, net | 58 | | | 91 | |
| Effect of change in foreign currency exchange rates on cash and cash equivalents | 382 |
| | 306 |
| |
| Total sources | 21,920 |
| | 20,804 |
| Total sources | 8,517 | | | 19,292 | |
| Uses: | | | | Uses: | | | |
| Investing activities, net | 17,158 |
| | 14,586 |
| Investing activities, net | 45 | | | 9,728 | |
| Cash paid for other transactions with tenors greater than three months | | Cash paid for other transactions with tenors greater than three months | 100 | | | 50 | |
| Long-term debt repaid | 60 |
| | 1,273 |
| Long-term debt repaid | 28 | | | 13 | |
| Collateral financing arrangement repaid | 2,852 |
| | 55 |
| Collateral financing arrangement repaid | 27 | | | 25 | |
| Distribution of Brighthouse | 2,793 |
| | — |
| |
| Financing element on certain derivative instruments and other derivative related transactions, net | 109 |
| | 336 |
| Financing element on certain derivative instruments and other derivative related transactions, net | — | | | 242 | |
| Treasury stock acquired in connection with share repurchases | 2,305 |
| | 70 |
| Treasury stock acquired in connection with share repurchases | 2,112 | | | 500 | |
| Redemption of preferred stock | | Redemption of preferred stock | 494 | | | — | |
| Preferred stock redemption premium | | Preferred stock redemption premium | 6 | | | — | |
| Dividends on preferred stock | 58 |
| | 58 |
| Dividends on preferred stock | 103 | | | 109 | |
| Dividends on common stock | 1,295 |
| | 1,295 |
| Dividends on common stock | 829 | | | 823 | |
| Other, net | 144 |
| | — |
| |
| Effect of change in foreign currency exchange rates on cash and cash equivalents | | Effect of change in foreign currency exchange rates on cash and cash equivalents | 192 | | | 111 | |
| Total uses | 26,774 |
| | 17,673 |
| Total uses | 3,936 | | | 11,601 | |
| Net increase (decrease) in cash and cash equivalents | $ | (4,854 | ) | | $ | 3,131 |
| Net increase (decrease) in cash and cash equivalents | $ | 4,581 | | | $ | 7,691 | |
Cash Flows from Operations
The principal cash inflows from our insurance activities come from insurance premiums, net investment income, annuity considerations and deposit funds. The principal cash outflows are the result of various life insurance, property &and casualty, annuity and pension products, operating expenses and income tax, as well as interest expense. A primary liquidity concern with respect to these cash flows is the risk of early contractholder and policyholder withdrawal.
Cash Flows from Investments
The principal cash inflows from our investment activities come from repayments of principal, proceeds from maturities and sales of investments and settlements of freestanding derivatives. The principal cash outflows relate to purchases of investments, issuances of policy loans and settlements of freestanding derivatives. Additional cash outflows relate to purchases of businesses. We typically have a net cash outflow from investing activities because cash inflows from insurance operations are reinvested in accordance with our ALM discipline to fund insurance liabilities. We closely monitor and manage these risks through our comprehensive investment risk management process. The primary liquidity concerns with respect to these cash flows are the risk of default by debtors and market disruption.
Cash Flows from Financing
The principal cash inflows from our financing activities come from issuances of debt and other securities, deposits of funds associated with policyholder account balances and lending of securities. The principal cash outflows come from repayments of debt and the collateral financing arrangement, payments of dividends on and repurchases of MetLife, Inc.’s securities, withdrawals associated with policyholder account balances and the return of securities on loan. The primary liquidity concerns with respect to these cash flows are market disruption and the risk of early contractholder and policyholder withdrawal.
Liquidity and Capital Sources
In addition to the general description of liquidity and capital sources in “— Summary of the Company’s Primary Sources and Uses of Liquidity and Capital,” the following additional information is provided regarding ourCompany’s primary sources of liquidity and capital. See also Note 3 to the Interim Condensed Consolidated Financial Statements for financing transactions in connection with the Separation.capital are set forth below.
Global Funding Sources
Liquidity is provided by a variety of global funding sources, including funding agreements, credit and committed facilities and commercial paper. Capital is provided by a variety of global funding sources, including short-term and long-term debt, athe collateral financing arrangement, junior subordinated debt securities, preferred securities, equity securities and equity-linked securities. MetLife, Inc. maintains a shelf registration statement with the SEC that permits the issuance of public debt, equity and hybrid securities. As a “Well-Known Seasoned Issuer” under SEC rules, MetLife, Inc.’s shelf registration statement provides for automatic effectiveness upon filing and has no stated issuance capacity. The diversity of our global funding sources enhances our funding flexibility, limits dependence on any one market or source of funds and generally lowers the cost of funds. Our primary global funding sources include:
Preferred Stock
See Note 10 of the Notes to the Interim Condensed Consolidated Financial Statements and Note 16 of the Notes to the Consolidated Financial Statements included in the 2020 Annual Report.
Common Stock
DuringFor the ninesix months ended SeptemberJune 30, 20172021 and 2016,2020, MetLife, Inc. issued 3,505,2404,317,294 and 2,403,2702,947,250 new shares of its common stock, respectively, for $124$174 million and $94$115 million, respectively, to satisfy various stock option exercises and other stock-based awards.
Commercial Paper, Reported in Short-term Debt
MetLife, Inc. and MetLife Funding, Inc. (“MetLife Funding”), a subsidiary of MLIC, each have a commercial paper program that is supported by our general corporateunsecured revolving credit facility (see “— Credit and Committed Facilities”). MetLife Funding raises cash from its commercial paper program and uses the proceeds to extend loans through MetLife Credit Corp., aanother subsidiary of Metropolitan Life Insurance Company (“MLIC”),MLIC, to affiliates in order to enhance the financial flexibility and liquidity of these companies.
Federal Home Loan Bank Funding Agreements, Reported in Policyholder Account Balances
Certain of our domesticU.S. insurance subsidiaries are members of a regional Federal Home Loan Bank (“FHLB”). DuringFor the ninesix months ended SeptemberJune 30, 20172021 and 2016,2020, we issued $16.1$18.2 billion and $10.0$19.1 billion, respectively, and repaid $16.1$18.2 billion and $8.4$18.1 billion, respectively, underof funding agreements with certain regional FHLBs. At both SeptemberJune 30, 20172021 and December 31, 2016,2020, total obligations outstanding under these funding agreements were $15.3$16.3 billion. See Note 4 of the Notes to the Consolidated Financial Statements included in the 20162020 Annual Report.
Federal Home Loan Bank Advance Agreements, Reported in Liabilities Held-for-Sale
For the six months ended June 30, 2021 and 2020, we borrowed $0 and $1.4 billion, respectively, and repaid $700 million and $1.4 billion, respectively, under advance agreements with the FHLB of Boston. At June 30, 2021 and December 31, 2020, total obligations outstanding under these advance agreements were $0 and $700 million, respectively.
Special Purpose Entity Funding Agreements, Reported in Policyholder Account Balances
We issue fixed and floating rate funding agreements, which are denominated in either U.S. dollars or foreign currencies, to certain unconsolidated special purpose entities (“SPEs”) that have issued either debt securities or commercial paper for which payment of interest and principal is secured by such funding agreements. DuringFor the ninesix months ended SeptemberJune 30, 20172021 and 2016,2020, we issued $32.8$22.0 billion and $29.4$22.5 billion, respectively, and repaid $31.3$20.7 billion and $30.1$18.3 billion, respectively, under such funding agreements. At SeptemberJune 30, 20172021 and December 31, 2016,2020, total obligations outstanding under these funding agreements were $34.2$41.2 billion and $30.8$39.9 billion, respectively. See Note 4 of the Notes to the Consolidated Financial Statements included in the 20162020 Annual Report.
Federal Agricultural Mortgage Corporation Funding Agreements, Reported in Policyholder Account Balances
We have issued funding agreements to a subsidiary of the Federal Agricultural Mortgage Corporation (“Farmer Mac”), as well as to certain SPEs that have issued debt securities for which payment of interest and principal is secured by such funding agreements, and such debt securities are also guaranteed as to payment of interest and principal by Farmer Mac.Corporation. The obligations under all such funding agreements are secured by a pledge of certain eligible agricultural mortgage loans. DuringFor the ninesix months ended SeptemberJune 30, 20172021 and 2016,2020, we issued $1.0 billion$225 million and $1.2 billion,$250 million, respectively, and repaid $1.0 billion$350 million and $1.0 billion,$250 million, respectively, under such funding agreements. At both SeptemberJune 30, 20172021 and December 31, 2016,2020, total obligations outstanding under these funding agreements were $2.6 billion.$2.3 billion and $2.4 billion, respectively. See Note 4 of the Notes to the Consolidated Financial Statements included in the 20162020 Annual Report.
Affiliated Preferred Units Issuances
In June 2017, Brighthouse Holdings, LLC issued 50,000 units of 6.50% fixed rate cumulative preferred units to MetLife, Inc. and in turn MetLife, Inc. sold the preferred units to third-party investors, for net proceeds of $49 million. See Note 3 of the Notes to the Interim Condensed Consolidated Financial Statements.
Credit and Committed Facilities
At SeptemberJune 30, 2017,2021, we maintained a $3.0 billion unsecured revolving credit facility and certain committed facilities aggregating $3.7 billion.$3.3 billion, of which MetLife, Inc. is a party and/or guarantor. When drawn upon, these facilities bear interest at varying rates in accordance with the respective agreements.
The committed facilities are used for collateral for certain of our affiliated reinsurance liabilities. At September 30, 2017, we had outstanding $3.1 billion in letters of credit and no drawdowns against these facilities. Remaining availability was $595 million at September 30, 2017. See Note 3 of the Notes to the Interim Condensed Consolidated Financial Statements for discussion of reductions in our committed facilities totaling $7.8 billion in April 2017, in connection with the Separation. At September 30, 2017, Brighthouse Insurance is a beneficiary of $2.3 billion of letters of credit issued under the MetLife Reinsurance Company of Vermont and MetLife, Inc.’s $2.9 billion committed facility. In connection with the Separation and the related transition services agreement, Brighthouse Insurance agreed to reimburse MetLife, Inc. a portion of the periodic letter of credit fees and/or the early termination fees paid for this committed facility.
The unsecured revolving credit facility is used for general corporate purposes, to support the borrowers’ commercial paper programs and for the issuance of letters of credit. At SeptemberJune 30, 2017,2021, we had outstanding $410$462 million in letters of credit and no drawdowns against this facility. Remaining availability was $2.6$2.5 billion at SeptemberJune 30, 2017.2021.
In December 2016, MetLife, Inc. and MetLife Funding entered into an agreement to amend their $4.0The committed facilities are used as collateral for certain of our affiliated reinsurance liabilities. At June 30, 2021, we had outstanding $2.9 billion unsecured revolving credit facility, pursuant to which, among other things, the parties amended and restated the facility upon completion of the Separation and the satisfaction of certain other conditions. As amended and restated, the unsecured revolving credit facility provides for borrowings and the issuance ofin letters of credit in an aggregate amount of up to $3.0 billion. All borrowings under this amended revolving credit facility must be repaid by December 20, 2021, except that letters of credit outstanding upon termination may remain outstanding until December 20, 2022.and no drawdowns against these facilities. Remaining availability was $413 million at June 30, 2021.
See Note 1213 of the Notes to the Consolidated Financial Statements included in the 20162020 Annual Report for further information about theseon credit and committed facilities.
We have no reason to believe that our lending counterparties will be unable to fulfill their respective contractual obligations under these facilities. As commitments associated with letters ofunder our credit and a financing arrangementcommitted facilities may expire unused, these amounts do not necessarily reflect our actual future cash funding requirements.
Outstanding Debt Under Global Funding Sources
The following table summarizes our outstanding debt, excluding long-term debt relatedrelating to VIEsCSEs, at:
| | | | | | | | June 30, 2021 | | December 31, 2020 |
| | September 30, 2017 | | December 31, 2016 | | (In millions) |
| | (In millions) | |
| Short-term debt | $ | 214 |
| | $ | 242 |
| |
| Long-term debt (1) | $ | 16,682 |
| | $ | 16,429 |
| |
| Short-term debt (1) | | Short-term debt (1) | $ | 393 | | | $ | 393 | |
| Long-term debt (2) | | Long-term debt (2) | $ | 14,518 | | | $ | 14,598 | |
| Collateral financing arrangement | $ | 1,220 |
| | $ | 1,274 |
| Collateral financing arrangement | $ | 818 | | | $ | 845 | |
| Junior subordinated debt securities | $ | 3,144 |
| | $ | 3,169 |
| Junior subordinated debt securities | $ | 3,154 | | | $ | 3,153 | |
__________________
| |
(1) | Includes $535 million and $366 million of non-recourse debt at September 30, 2017 and December 31, 2016, respectively, for which creditors have no access, subject to customary exceptions, to the general assets of the Company other than recourse to certain investment subsidiaries. |
(1)Includes $293 million of debt that is non-recourse to MetLife, Inc. and MLIC, subject to customary exceptions, at both June 30, 2021 and December 31, 2020. Certain subsidiaries have pledged assets to secure this debt.
(2)Includes $500 million and $474 million of debt that is non-recourse to MetLife, Inc. and MLIC, subject to customary exceptions, at June 30, 2021 and December 31, 2020, respectively. Certain investment subsidiaries have pledged assets to secure this debt.
Debt and Facility Covenants
Certain of our debt instruments and committed facilities, as well as our unsecured revolving credit facility, contain various administrative, reporting, legal and financial covenants. We believe we were in compliance with all applicable financial covenants at SeptemberJune 30, 2017.2021.
Dispositions
Cash proceeds fromFor information regarding pending and other dispositions, duringsee Note 3 of the nine months ended September 30, 2017 and 2016 were $0 and $291 million, respectively. See Note 3Notes to the Interim Condensed Consolidated Financial Statements for dividends from Brighthouse Financial, Inc. in connection with the Separation.
Statements.
Liquidity and Capital Uses
In addition to the general description of liquidity and capital uses in “— Summary of the Company’s Primary Sources and Uses of Liquidity and Capital,” the following additional information is provided regarding ourCompany’s primary uses of liquidity and capital. capital are set forth below.
Preferred Stock Redemption
See Note 310 of the Notes to the Interim Condensed Consolidated Financial Statements for financing transactions in connection withinformation about the Separation.redemption of Series C preferred stock.
Common Stock Repurchases
Utilizing an authorization fromSee Note 10 of the Notes to the Interim Condensed Consolidated Financial Statements for information relating to authorizations by the Board of Directors to repurchase MetLife, Inc. Board, MetLife, Inc. may purchase its common stock, from the MetLife Policyholder Trust, in the open market (including pursuant to the terms of a pre-set trading plan meeting the requirements of Rule 10b5-1 under the Securities Exchange Act of 1934 (“Exchange Act”)) and in privately negotiated transactions. See “Unregistered Sales of Equity Securities and Use of Proceeds — Issuer Purchases of Equity Securities.”
During the nine months ended September 30, 2017 and 2016, MetLife, Inc. repurchased 44,737,625 shares and 1,445,864 shares, respectively,amounts of common stock in open market purchasesrepurchased pursuant to such authorizations for $2.3 billionthe six months ended June 30, 2021 and $70 million, respectively.
At September 30, 2017, MetLife, Inc. had $383 million2020, and the amount remaining under the common stock repurchase authorization. such authorizations at June 30, 2021.
On November 1, 2017,August 4, 2021, MetLife, Inc. announced that its Board approvedof Directors authorized an additional $2.0$3.0 billion authorization for MetLife, Inc. to repurchase its common stock. Also on November 1, 2017, MetLife, Inc. announced that it currently intends to divest its retained Brighthouse Financial, Inc.of common stock through an exchange offer for MetLife, Inc. common stock during 2018, subject to market conditions and regulatory approval. Any shares of MetLife, Inc. common stock that MetLife, Inc. receives in the exchange offer would be in addition to other share repurchase authorizations. repurchases.
Common stock repurchases are dependentsubject to the discretion of our Board of Directors and will depend upon several factors, including our capital position, liquidity, financial strength and credit ratings, general market conditions, the market price of MetLife, Inc.’s common stock compared to management’s assessment of the stock’s underlying value, and applicable regulatory approvals, as well asand other legal and accounting factors. Restrictions on the payment of dividends that may arise under so-called “Dividend Stopper” provisions would also restrict MetLife, Inc.’s ability to repurchase common stock. See “Business — Regulation, — International Regulation — Global Systemically Important Insurers” in the 2016 Annual Report, as amended or supplemented in our subsequently filed Quarterly Reports on Form 10-Q under the caption “Management’s Discussion and Analysis of Financial Condition and Results of Operations — Industry Trends — Regulatory Developments.” See also “Business — Regulation — U.S. Regulation — Potential Regulation as a Non-Bank SIFI” and “Risk Factors — Capital-RelatedCapital Risks — We May not be Able to Pay Dividends or Repurchase Our Stock Due to Legal and Regulatory Restrictions and Uncertainty and Restrictions Under the Terms of Certain of Our Securities May Prevent Us from Repurchasing Our Stock and Paying Dividends at the Level We Wish” included in the 2016 Annual Report, as updated in “Risk Factors — Capital-Related Risks” herein,or Cash Buffer Needs” and Note 16 of the Notes to the Consolidated Financial Statements included in the 20162020 Annual Report.
Preferred Stock Dividends
InformationFor the six months ended June 30, 2021 and 2020, MetLife, Inc. paid dividends on the declaration, record and payment dates, as well as per share and aggregate dividend amounts, for MetLife, Inc.’sits preferred stock was as follows forof $103 million and $109 million, respectively. For the ninesix months ended SeptemberJune 30, 20172021 and 2016:
|
| | | | | | | | | | | | | | | | | | | | |
| Declaration Date | | Record Date | | Payment Date | | Preferred Stock Dividend |
Series A Per Share | | Series A Aggregate | | Series C
Per
Share | | Series C
Aggregate |
| | | | | | | (In millions, except per share data) |
| August 15, 2017 | | August 31, 2017 | | September 15, 2017 | | $ | 0.256 |
| | $ | 6 |
| | $ | — |
| | $ | — |
|
| May 15, 2017 | | May 31, 2017 | | June 15, 2017 | | $ | 0.256 |
| | $ | 7 |
| | $ | 26.250 |
| | $ | 39 |
|
| March 6, 2017 | | February 28, 2017 | | March 15, 2017 | | $ | 0.250 |
| | 6 |
| | $ | — |
| | — |
|
| | | | | | | | | $ | 19 |
| | | | $ | 39 |
|
| | | | | | | | | | | | | |
| August 15, 2016 | | August 31, 2016 | | September 15, 2016 | | $ | 0.256 |
| | $ | 6 |
| | $ | — |
| | $ | — |
|
| May 16, 2016 | | May 31, 2016 | | June 15, 2016 | | $ | 0.256 |
| | $ | 7 |
| | $ | 26.250 |
| | $ | 39 |
|
| March 7, 2016 | | February 29, 2016 | | March 15, 2016 | | $ | 0.253 |
| | 6 |
| | $ | — |
| | — |
|
| | | | | | | | | $ | 19 |
| | | | $ | 39 |
|
Dividends are2020, MetLife, Inc. paid quarterly$829 million and $823 million of dividends on MetLife, Inc.’s Floating Rate Non-Cumulative Preferred Stock, Series A. Dividends are paid semi-annually on MetLife, Inc.’s 5.25% Fixed-to-Floating Rate Non-Cumulative Preferred Stock, Series C, commencing December 15, 2015 and ending June 15, 2020 and, thereafter, will be paid quarterly.
Common Stock Dividends
Information on the declaration, record and payment dates, as well as per share and aggregate dividend amounts, for MetLife, Inc.’sits common stock, was as followsrespectively. See Note 10 of the Notes to the Interim Condensed Consolidated Financial Statements and Note 16 of the Notes to the Consolidated Financial Statements included in the 2020 Annual Report for information regarding the nine months ended September 30, 2017calculation and 2016:
|
| | | | | | | | | | | | |
| Declaration Date | | Record Date | | Payment Date | | Common Stock Dividend |
| Per Share | | Aggregate |
| | | | | | | (In millions, except per share data) |
| July 7, 2017 | | August 7, 2017 | | September 13, 2017 | | $ | 0.400 |
| | $ | 427 |
|
| April 25, 2017 | | May 8, 2017 | | June 13, 2017 | | $ | 0.400 |
| | $ | 431 |
|
| January 6, 2017 | | February 6, 2017 | | March 13, 2017 | | $ | 0.400 |
| | 437 |
|
| | | | | | | | | $ | 1,295 |
|
| | | | | | | | | |
| July 7, 2016 | | August 8, 2016 | | September 13, 2016 | | $ | 0.400 |
| | $ | 441 |
|
| April 26, 2016 | | May 9, 2016 | | June 13, 2016 | | $ | 0.400 |
| | $ | 441 |
|
| January 6, 2016 | | February 5, 2016 | | March 14, 2016 | | $ | 0.375 |
| | 413 |
|
| | | | | | | | | $ | 1,295 |
|
The declaration and payment of common stock dividends isare subject to the discretion of our Board of Directors, and will depend on MetLife, Inc.’s financial condition, results of operations, cash requirements, future prospects, regulatory restrictions on the payment of dividends by MetLife, Inc.’s insurance subsidiaries and other factors deemed relevant by the Board.Board of Directors. See Note 16 of the Notes to the Interim Condensed Consolidated Financial Statements included in the 2020 Annual Report for information regarding a common stock dividend declared subsequent to September 30, 2017.additional information.
Dividend Restrictions
If MetLife, Inc. were re-designated as a non-bank SIFI, the payment of dividends and other distributions by MetLife, Inc. to its security holders may be subject to regulation by the Federal Reserve. See “Business — Regulation — U.S. Regulation — Potential Regulation as a Non-Bank SIFI” included in the 2016 Annual Report. In addition, if additional capital requirements are imposed on MetLife, Inc. as a G-SII, its ability to pay dividends could be reduced by any such additional capital requirements that might be imposed. See “Business — Regulation — International Regulation — Global Systemically Important Insurers” in the 2016 Annual Report, as amended or supplemented in our subsequently filed Quarterly Reports on Form 10-Q under the caption “Management’s Discussion and Analysis of Financial Condition and Results of Operations — Industry Trends — Regulatory Developments” The payment of dividends is also subject to restrictions under the terms of our preferred stock and junior subordinated debentures in situations where we may be experiencing financial stress. See “Management’s Discussion and Analysis of Financial Condition and Results of Operations — Liquidity and Capital Resources — The Company — Liquidity and Capital Uses — Dividends — “Dividend Stopper” Provisions in MetLife’s Preferred Stock and Junior Subordinated Debentures,” “Risk Factors — Capital-RelatedCapital Risks — We May not be Able to Pay Dividends or Repurchase Our Stock Due to Legal and Regulatory Restrictions and Uncertainty and Restrictions Under the Terms of Certain of Our Securities May Prevent Us from Repurchasing Our Stock and Paying Dividends at the Level We Wish” included in the 2016 Annual Report, as updated in “Risk Factors — Capital-Related Risks” herein,or Cash Buffer Needs” and Note 16 of the Notes to the Consolidated Financial Statements included in the 20162020 Annual Report.
Certain terms of MetLife, Inc.’s preferred stock and junior subordinated debentures (sometimes referred to as “dividend stoppers”) may restrict it from repurchasing its common or preferred stock or paying dividends on its common or preferred stock and interest on its junior subordinated debentures in certain circumstances. In connection withDebt Repayments
For the Separation, MetLife, Inc. amended the dividend stoppers in its preferred stock in October 2017, and in its junior subordinated debentures in August 2017, to avoid such potential restrictions solely as a result of the spin-off of Brighthouse by MetLife. In connection with the amendments to the junior subordinated debentures, MetLife, Inc. incurred $26 million of related costs which have been capitalized and are being amortized over the terms of the junior subordinated debentures. See also Note 10 to the Interim Condensed Consolidated Financial Statements.
Debt and Collateral Financing Arrangement Repayments
During both the ninesix months ended SeptemberJune 30, 20172021 and 2016,2020, following regulatory approval, MetLife Reinsurance Company of Charleston, a wholly-owned subsidiary of MetLife, Inc., repurchased and canceled $55$27 million and $25 million, respectively, in aggregate principal amount of its surplus notes, which were reported in a collateral financing arrangement on the consolidated balance sheets.
Debt Repurchases, Redemptions and Exchanges
We may from time to time seek to retire or purchase our outstanding debt through cash purchases, redemptions and/or exchanges for other securities, in open market purchases, privately negotiated transactions or otherwise. Any such repurchases, redemptions, or exchanges will be dependent upon several factors, including our liquidity requirements, contractual restrictions, general market conditions, and applicable regulatory, legal and accounting factors. Whether or not to repurchase or redeem any debt and the size and timing of any such repurchases or redemptions will be determined at our discretion.
See Note 16 of the Notes to the Interim Condensed Consolidated Financial Statements for information about the redemption and cancellation of senior notes subsequent to June 30, 2021.
Support Agreements
MetLife, Inc. and several of its subsidiaries (each, an “Obligor”) are parties to various capital support commitments and guarantees with subsidiaries. Under these arrangements, each Obligor has agreed to cause the applicable entity to meet specified capital and surplus levels or has guaranteed certain contractual obligations. We anticipate that in the event these arrangements place demands upon us, there will be sufficient liquidity and capital to enable us to meet such demands. See “Management’s Discussion and AnalysisNote 5 of Financial Condition and Results of Operations — Liquidity and Capital Resources —the Notes to the MetLife, Inc. — Liquidity and Capital Uses — Support Agreements”(Parent Company Only) Condensed Financial Information included in the 20162020 Annual Report.
In April 2017, in connection with the Separation, MetLife, Inc. terminated various support agreements with the captive reinsurance companies included in the separated businesses. Upon Separation, MetLife, Inc. terminated a net worth maintenance agreement with Brighthouse Life Insurance Company of NY (“BLIC NY”) (formerly, First MetLife Investors Insurance Company), in accordance with its terms. See Schedule II included in the 2016 Annual Report for information on these agreements. See also Note 3 to the Interim Condensed Consolidated Financial Statements.
In connection with the issuance of $3.0 billion of Brighthouse Financial, Inc. senior notes, MetLife, Inc. had initially guaranteed the senior notes on a senior unsecured basis. The guarantee was released, in accordance with its terms, in connection with consummation of the Separation. See Note 3 to the Interim Condensed Consolidated Financial Statements.
Insurance LiabilitiesLiquid Assets
Liabilities arisingAn integral part of our liquidity management includes managing our level of liquid assets, which was $226.6 billion and $235.1 billion at June 30, 2021 and December 31, 2020, respectively. Liquid assets include cash and cash equivalents, short-term investments and publicly-traded securities, excluding assets that are pledged or otherwise committed. Assets pledged or otherwise committed include amounts received in connection with securities lending, repurchase agreements, derivatives, regulatory deposits, the collateral financing arrangement, funding agreements and secured borrowings, as well as amounts held in the closed block.
Capital Management
We have established several senior management committees as part of our capital management process. These committees, including the Capital Management Committee and the Enterprise Risk Committee (“ERC”), regularly review actual and projected capital levels (under a variety of scenarios including stress scenarios) and our annual capital plan in accordance with our capital policy. The Capital Management Committee is comprised of members of senior management, including MetLife, Inc.’s Chief Financial Officer (“CFO”), Treasurer, and Chief Risk Officer (“CRO”). The ERC is also comprised of members of senior management, including MetLife, Inc.’s CFO, CRO and Chief Investment Officer.
MetLife, Inc.’s Board of Directors (“Board of Directors”) and senior management are directly involved in the development and maintenance of our capital policy. The capital policy sets forth, among other things, minimum and target capital levels and the governance of the capital management process. All capital actions, including proposed changes to the annual capital plan, capital targets or capital policy, are reviewed by the Finance and Risk Committee of the Board of Directors prior to obtaining full Board of Directors approval. The Board of Directors approves the capital policy and the annual capital plan and authorizes capital actions, as required.
See “Risk Factors — Capital Risks — We May not be Able to Pay Dividends or Repurchase Our Stock Due to Legal and Regulatory Restrictions or Cash Buffer Needs” and Note 16 of the Notes to the Consolidated Financial Statements included in the 2020 Annual Report for information regarding restrictions on payment of dividends and stock repurchases. See also “— The Company — Liquidity and Capital Uses — Common Stock Repurchases” for information regarding MetLife, Inc.’s common stock repurchase authorizations.
The Company
Liquidity
Liquidity refers to the ability to generate adequate amounts of cash to meet our needs. In the event of significant cash requirements beyond anticipated liquidity needs, we have various alternatives available depending on market conditions and the amount and timing of the liquidity need. These available alternatives include cash flows from operations, sales of liquid assets, global funding sources including commercial paper and various credit and committed facilities. See “Management’s Discussion and Analysis of Financial Condition — Liquidity and Capital Resources — The Company — Liquidity” included in the 2020 Annual Report.
Capital
We manage our capital position to maintain our financial strength and credit ratings. Our capital position is supported by our ability to generate strong cash flows within our operating companies and borrow funds at competitive rates, as well as by our demonstrated ability to raise additional capital to meet operating and growth needs despite adverse market and economic conditions.
Summary of the Company’s Primary Sources and Uses of Liquidity and Capital
Our primary sources and uses of liquidity and capital are summarized as follows:
| | | | | | | | | | | |
| Six Months
Ended
June 30, |
| 2021 | | 2020 |
| (In millions) |
| Sources: | | | |
| Operating activities, net | $ | 3,750 | | | $ | 2,693 | |
| Net change in policyholder account balances | 3,870 | | | 7,011 | |
| Net change in payables for collateral under securities loaned and other transactions | 506 | | | 7,401 | |
| Cash received for other transactions with tenors greater than three months | — | | | 50 | |
| Long-term debt issued | 15 | | | 1,074 | |
| Financing element on certain derivative instruments and other derivative related transactions, net | 318 | | | — | |
| Preferred stock issued, net of issuance costs | — | | | 972 | |
| Other, net | 58 | | | 91 | |
| Total sources | 8,517 | | | 19,292 | |
| Uses: | | | |
| Investing activities, net | 45 | | | 9,728 | |
| Cash paid for other transactions with tenors greater than three months | 100 | | | 50 | |
| Long-term debt repaid | 28 | | | 13 | |
| Collateral financing arrangement repaid | 27 | | | 25 | |
| Financing element on certain derivative instruments and other derivative related transactions, net | — | | | 242 | |
| Treasury stock acquired in connection with share repurchases | 2,112 | | | 500 | |
| Redemption of preferred stock | 494 | | | — | |
| Preferred stock redemption premium | 6 | | | — | |
| Dividends on preferred stock | 103 | | | 109 | |
| Dividends on common stock | 829 | | | 823 | |
| Effect of change in foreign currency exchange rates on cash and cash equivalents | 192 | | | 111 | |
| Total uses | 3,936 | | | 11,601 | |
| Net increase (decrease) in cash and cash equivalents | $ | 4,581 | | | $ | 7,691 | |
Cash Flows from Operations
The principal cash inflows from our insurance activities primarily relate to benefit payments undercome from insurance premiums, net investment income, annuity considerations and deposit funds. The principal cash outflows are the result of various life insurance, property &and casualty, annuity and group pension products, operating expenses and income tax, as well as payments forinterest expense.
Cash Flows from Investments
The principal cash inflows from our investment activities come from repayments of principal, proceeds from maturities and sales of investments and settlements of freestanding derivatives. The principal cash outflows relate to purchases of investments, issuances of policy surrenders, withdrawalsloans and loans. For annuity or deposit type products, surrender or lapse behavior differs somewhat by segment. In the MetLife Holdings segment, which includes individual annuities, lapsessettlements of freestanding derivatives. Additional cash outflows relate to purchases of businesses. We typically have a net cash outflow from investing activities because cash inflows from insurance operations are reinvested in accordance with our ALM discipline to fund insurance liabilities. We closely monitor and surrenders tend to occur in the normal coursemanage these risks through our comprehensive investment risk management process.
Cash Flows from Financing
The principal cash inflows from our financing activities come from issuances of business. During both the nine months ended September 30, 2017 and 2016, general account surrenders and withdrawals from annuity products were $1.1 billion. In the Retirement and Income Solutions business within the U.S. segment, which includes pension risk transfers, bank-owned life insurancedebt and other fixed annuity contracts, as well assecurities, deposits of funds associated with policyholder account balances and lending of securities. The principal cash outflows come from repayments of debt and the collateral financing arrangement, payments of dividends on and repurchases of MetLife, Inc.’s securities, withdrawals associated with policyholder account balances and the return of securities on loan.
Liquidity and Capital Sources
In addition to the general description of liquidity and capital sources in “— Summary of the Company’s Primary Sources and Uses of Liquidity and Capital,” the Company’s primary sources of liquidity and capital are set forth below.
Global Funding Sources
Liquidity is provided by a variety of global funding sources, including funding agreements, credit and other capitalcommitted facilities and commercial paper. Capital is provided by a variety of global funding sources, including short-term and long-term debt, the collateral financing arrangement, junior subordinated debt securities, preferred securities, equity securities and equity-linked securities. MetLife, Inc. maintains a shelf registration statement with the SEC that permits the issuance of public debt, equity and hybrid securities. As a “Well-Known Seasoned Issuer” under SEC rules, MetLife, Inc.’s shelf registration statement provides for automatic effectiveness upon filing and has no stated issuance capacity. The diversity of our global funding sources enhances our funding flexibility, limits dependence on any one market products, mostor source of funds and generally lowers the products offered have fixed maturities or fairly predictable surrenders or withdrawals. With regard to the Retirement and Income Solutions business products that provide customers with limited rights to accelerate payments, at September 30, 2017 there werecost of funds. Our primary global funding agreements totaling $94 million that could be put back to the Company.sources include:
Pledged CollateralPreferred Stock
We pledge collateral to, and have collateral pledged to us by, counterparties in connection with our derivatives. At September 30, 2017 and December 31, 2016, we had received pledged cash collateral from counterparties of $5.2 billion and $5.7 billion, respectively. At September 30, 2017 and December 31, 2016, we had pledged cash collateral to counterparties of $477 million and $788 million, respectively. With respect to bilateral contracts between two counterparties derivatives in a net liability position that have credit contingent provisions, a one-notch downgrade in the Company’s credit or financial strength rating, as applicable, would have required $7 million of additional collateral be provided to our counterparties as of September 30, 2017. See Note 710 of the Notes to the Interim Condensed Consolidated Financial Statements for additional information about collateral pledged to us, collateral we pledge and derivatives subject to credit contingent provisions.
We pledge collateral and have had collateral pledged to us, and may be required from time to time to pledge additional collateral or be entitled to have additional collateral pledged to us, in connection with a collateral financing arrangement relatedNote 16 of the Notes to the reinsuranceConsolidated Financial Statements included in the 2020 Annual Report.
Common Stock
For the six months ended June 30, 2021 and 2020, MetLife, Inc. issued 4,317,294 and 2,947,250 new shares of closed blockits common stock, respectively, for $174 million and universal life secondary guarantee liabilities.$115 million, respectively, to satisfy various stock option exercises and other stock-based awards.
We pledge collateralCommercial Paper, Reported in Short-term Debt
MetLife, Inc. and MetLife Funding, Inc. (“MetLife Funding”), a subsidiary of MLIC, each have a commercial paper program that is supported by our unsecured revolving credit facility (see “— Credit and Committed Facilities”). MetLife Funding raises cash from timeits commercial paper program and uses the proceeds to timeextend loans through MetLife Credit Corp., another subsidiary of MLIC, to affiliates in connectionorder to enhance the financial flexibility and liquidity of these companies.
Federal Home Loan Bank Funding Agreements, Reported in Policyholder Account Balances
Certain of our U.S. insurance subsidiaries are members of a regional Federal Home Loan Bank (“FHLB”). For the six months ended June 30, 2021 and 2020, we issued $18.2 billion and $19.1 billion, respectively, and repaid $18.2 billion and $18.1 billion, respectively, of funding agreements with certain regional FHLBs. At both June 30, 2021 and December 31, 2020, total obligations outstanding under these funding agreements.agreements were $16.3 billion. See Note 4 of the Notes to the Consolidated Financial Statements included in the 20162020 Annual Report.
Federal Home Loan Bank Advance Agreements, Reported in Liabilities Held-for-Sale
For the six months ended June 30, 2021 and 2020, we borrowed $0 and $1.4 billion, respectively, and repaid $700 million and $1.4 billion, respectively, under advance agreements with the FHLB of Boston. At June 30, 2021 and December 31, 2020, total obligations outstanding under these advance agreements were $0 and $700 million, respectively.
Special Purpose Entity Funding Agreements, Reported in Policyholder Account Balances
We issue fixed and floating rate funding agreements, which are denominated in either U.S. dollars or foreign currencies, to certain unconsolidated special purpose entities that have issued either debt securities or commercial paper for which payment of interest and principal is secured by such funding agreements. For the six months ended June 30, 2021 and 2020, we issued $22.0 billion and $22.5 billion, respectively, and repaid $20.7 billion and $18.3 billion, respectively, under such funding agreements. At June 30, 2021 and December 31, 2020, total obligations outstanding under these funding agreements were $41.2 billion and $39.9 billion, respectively. See Note 4 of the Notes to the Consolidated Financial Statements included in the 2020 Annual Report.
Securities LendingFederal Agricultural Mortgage Corporation Funding Agreements, Reported in Policyholder Account Balances
We participate inhave issued funding agreements to a securities lending program whereby securitiessubsidiary of the Federal Agricultural Mortgage Corporation. The obligations under all such funding agreements are loaned to third parties, primarily brokerage firmssecured by a pledge of certain eligible agricultural mortgage loans. For the six months ended June 30, 2021 and commercial banks. We obtain collateral, usually cash, from the borrower, which must be returned to the borrower when the loaned securities are returned to us. Under our securities lending program,2020, we were liable for cash collateralissued $225 million and $250 million, respectively, and repaid $350 million and $250 million, respectively, under our control of $20.0 billion and $20.1 billion at Septembersuch funding agreements. At June 30, 20172021 and December 31, 2016,2020, total obligations outstanding under these funding agreements were $2.3 billion and $2.4 billion, respectively. OfSee Note 4 of the Notes to the Consolidated Financial Statements included in the 2020 Annual Report.
Credit and Committed Facilities
At June 30, 2021, we maintained a $3.0 billion unsecured revolving credit facility and certain committed facilities aggregating $3.3 billion, of which MetLife, Inc. is a party and/or guarantor. When drawn upon, these facilities bear interest at varying rates in accordance with the respective agreements.
The unsecured revolving credit facility is used for general corporate purposes, to support the borrowers’ commercial paper programs and for the issuance of letters of credit. At June 30, 2021, we had outstanding $462 million in letters of credit and no drawdowns against this facility. Remaining availability was $2.5 billion at June 30, 2021.
The committed facilities are used as collateral for certain of our affiliated reinsurance liabilities. At June 30, 2021, we had outstanding $2.9 billion in letters of credit and no drawdowns against these facilities. Remaining availability was $413 million at June 30, 2021.
See Note 13 of the Notes to the Consolidated Financial Statements included in the 2020 Annual Report for further information on credit and committed facilities.
We have no reason to believe that our lending counterparties will be unable to fulfill their respective contractual obligations under these facilities. As commitments under our credit and committed facilities may expire unused, these amounts $4.4 billiondo not necessarily reflect our actual future cash funding requirements.
Outstanding Debt Under Global Funding Sources
The following table summarizes our outstanding debt, excluding long-term debt relating to CSEs, at:
| | | | | | | | | | | |
| June 30, 2021 | | December 31, 2020 |
| (In millions) |
| Short-term debt (1) | $ | 393 | | | $ | 393 | |
| Long-term debt (2) | $ | 14,518 | | | $ | 14,598 | |
| Collateral financing arrangement | $ | 818 | | | $ | 845 | |
| Junior subordinated debt securities | $ | 3,154 | | | $ | 3,153 | |
__________________
(1)Includes $293 million of debt that is non-recourse to MetLife, Inc. and $4.5 billionMLIC, subject to customary exceptions, at Septemberboth June 30, 20172021 and December 31, 2016, respectively,2020. Certain subsidiaries have pledged assets to secure this debt.
(2)Includes $500 million and $474 million of debt that is non-recourse to MetLife, Inc. and MLIC, subject to customary exceptions, at June 30, 2021 and December 31, 2020, respectively. Certain investment subsidiaries have pledged assets to secure this debt.
Debt and Facility Covenants
Certain of our debt instruments and committed facilities, as well as our unsecured revolving credit facility, contain various administrative, reporting, legal and financial covenants. We believe we were on open, meaning that the related loaned security could be returned to us on the next business day, requiring the immediate return of cash collateral we hold. The estimated fair value of the securities on loan related to the cash collateral on openin compliance with all applicable financial covenants at SeptemberJune 30, 2017 was $4.3 billion, all of which were U.S. government2021.
Dispositions
For information regarding pending and agency securities which, if put to us, could be immediately sold to satisfy the cash requirements to immediately return the cash collateral. Seeother dispositions, see Note 63 of the Notes to the Interim Condensed Consolidated Financial Statements.
We participate in short-term repurchase agreements whereby securities are loaned to unaffiliated financial institutions. We obtain collateral, usually cash, from the borrower, which must be returnedLiquidity and Capital Uses
In addition to the borrower when the loaned securities are returned to us. Under these repurchase agreements, we were liable for cash collateral under our controlgeneral description of $2.1 billionliquidity and $102 million at September 30, 2017 and December 31, 2016, respectively. The estimated fair valuecapital uses in “— Summary of the securities on loan at September 30, 2017 was $2.1 billion which were primarily U.S. governmentCompany’s Primary Sources and agency securities which, if put to us, could be immediately sold to satisfyUses of Liquidity and Capital,” the cash requirements to immediately return the cash collateral. Company’s primary uses of liquidity and capital are set forth below.
Preferred Stock Redemption
See Note 610 of the Notes to the Interim Condensed Consolidated Financial Statements.Statements for information about the redemption of Series C preferred stock.
LitigationCommon Stock Repurchases
Putative or certified class action litigation and other litigation, and claims and assessments against us, in addition to those discussed elsewhere herein and those otherwise provided for in the consolidated financial statements, have arisen in the course of our business, including, but not limited to, in connection with our activities as an insurer, employer, investor, investment advisor, taxpayer and, formerly, a mortgage lending bank. Further, state insurance regulatory authorities and other federal and state authorities regularly make inquiries and conduct investigations concerning our compliance with applicable insurance and other laws and regulations. See Note 1510 of the Notes to the Interim Condensed Consolidated Financial Statements.
We establish liabilitiesStatements for litigationinformation relating to authorizations by the Board of Directors to repurchase MetLife, Inc. common stock, amounts of common stock repurchased pursuant to such authorizations for the six months ended June 30, 2021 and regulatory loss contingencies when it is probable that a loss has been incurred2020, and the amount remaining under such authorizations at June 30, 2021.
On August 4, 2021, MetLife, Inc. announced that its Board of Directors authorized an additional $3.0 billion of common stock repurchases.
Common stock repurchases are subject to the discretion of our Board of Directors and will depend upon our capital position, liquidity, financial strength and credit ratings, general market conditions, the market price of MetLife, Inc.’s common stock compared to management’s assessment of the loss canstock’s underlying value, applicable regulatory approvals, and other legal and accounting factors. Restrictions on the payment of dividends that may arise under so-called “Dividend Stopper” provisions would also restrict MetLife, Inc.’s ability to repurchase common stock. See “Business — Regulation,” “Risk Factors — Capital Risks — We May not be reasonably estimated. For material matters where a loss is believedAble to be reasonably possible but not probable, no accrual is made but we disclose the naturePay Dividends or Repurchase Our Stock Due to Legal and Regulatory Restrictions or Cash Buffer Needs” and Note 16 of the contingencyNotes to the Consolidated Financial Statements included in the 2020 Annual Report.
Dividends
For the six months ended June 30, 2021 and an aggregate estimate2020, MetLife, Inc. paid dividends on its preferred stock of $103 million and $109 million, respectively. For the six months ended June 30, 2021 and 2020, MetLife, Inc. paid $829 million and $823 million of dividends on its common stock, respectively. See Note 10 of the reasonably possible range of loss in excess of amounts accrued, when such an estimate can be made. It is not possibleNotes to predict or determine the ultimate outcome of all pending investigationsInterim Condensed Consolidated Financial Statements and legal proceedings. In someNote 16 of the matters referredNotes to herein, very large and/or indeterminate amounts, including punitivethe Consolidated Financial Statements included in the 2020 Annual Report for information regarding the calculation and treble damages, are sought. Although in lighttiming of these considerations, itdividend payments.
The declaration and payment of common stock dividends are subject to the discretion of our Board of Directors, and will depend on MetLife, Inc.’s financial condition, results of operations, cash requirements, future prospects, regulatory restrictions on the payment of dividends by MetLife, Inc.’s insurance subsidiaries and other factors deemed relevant by the Board of Directors. See Note 16 of the Notes to the Consolidated Financial Statements included in the 2020 Annual Report for additional information.
Dividend Restrictions
The payment of dividends is possible that an adverse outcomealso subject to restrictions under the terms of our preferred stock and junior subordinated debentures in certain cases could have a material adverse effect upon oursituations where we may be experiencing financial position, based on information currently known by us, in our opinion, the outcome of such pending investigations and legal proceedings are not likely to have such an effect. However, given the large and/or indeterminate amounts sought in certain of these matters and the inherent unpredictability of litigation, it is possible that an adverse outcome in certain matters could, from time to time, have a material adverse effect on our consolidated net income or cash flows in particular quarterly or annual periods.
Acquisitions
Cash outflows for acquisitions during the nine months ended September 30, 2017 were $211 million. There were no acquisitions during the nine months ended September 30, 2016.
Contractual Obligations
stress. See “Management’s Discussion and Analysis of Financial Condition and Results of Operations — Liquidity and Capital Resources — The Company — Contractual Obligations” included in the 2016 Annual Report for additional information regarding the Company’s contractual obligations.
MetLife, Inc.
Liquidity and Capital Management
Liquidity and capital are managed to preserve stable, reliable and cost-effective sources of cash to meet all current and future financial obligations and are provided by a variety of sources, including a portfolio of liquid assets, a diversified mix of short- and long-term funding sources from the wholesale financial markets and the ability to borrow through credit and committed facilities. Liquidity is monitored through the use of internal liquidity risk metrics, including the composition and level of the liquid asset portfolio, timing differences in short-term cash flow obligations, access to the financial markets for capital and debt transactions and exposure to contingent draws on MetLife, Inc.’s liquidity. MetLife, Inc. is an active participant in the global financial markets through which it obtains a significant amount of funding. These markets, which serve as cost-effective sources of funds, are critical components of MetLife, Inc.’s liquidity and capital management. Decisions to access these markets are based upon relative costs, prospective views of balance sheet growth and a targeted liquidity profile and capital structure. A disruption in the financial markets could limit MetLife, Inc.’s access to liquidity.
MetLife, Inc.’s ability to maintain regular access to competitively priced wholesale funds is fostered by its current credit ratings from the major credit rating agencies. We view our capital ratios, credit quality, stable and diverse earnings streams, diversity of liquidity sources and our liquidity monitoring procedures as critical to retaining such credit ratings.
See “— Executive Summary — Consolidated Company Outlook” for a discussion of post-Separation cash commitments.
Liquidity
For a summary of MetLife, Inc.’s liquidity, see “— The Company — Liquidity.”
Capital
For a summary of MetLife, Inc.’s capital, see “— The Company — Capital.” For further information regarding potential capital restrictions and limitations on MetLife, Inc. as a non-bank SIFI and G-SII, see “Business — Regulation — U.S. Regulation — Potential Regulation as a Non-Bank SIFI” and “Business — Regulation — International Regulation — Global Systemically Important Insurers” included in the 2016 Annual Report, as amended or supplemented in our subsequently filed Quarterly Reports on Form 10-Q under the caption “Management’s Discussion and Analysis of Financial Condition and Results of Operations — Industry Trends — Regulatory Developments.” See also “ — The Company — Liquidity and Capital Uses — CommonDividends — “Dividend Stopper” Provisions in MetLife’s Preferred Stock Repurchases”and Junior Subordinated Debentures,” “Risk Factors — Capital Risks — We May not be Able to Pay Dividends or Repurchase Our Stock Due to Legal and Regulatory Restrictions or Cash Buffer Needs” and Note 16 of the Notes to the Consolidated Financial Statements included in the 2020 Annual Report.
Debt Repayments
For the six months ended June 30, 2021 and 2020, following regulatory approval, MetLife Reinsurance Company of Charleston, a wholly-owned subsidiary of MetLife, Inc., repurchased and canceled $27 million and $25 million, respectively, in aggregate principal amount of its surplus notes, which were reported in collateral financing arrangement on the consolidated balance sheets.
Debt Repurchases, Redemptions and Exchanges
We may from time to time seek to retire or purchase our outstanding debt through cash purchases, redemptions and/or exchanges for other securities, in open market purchases, privately negotiated transactions or otherwise. Any such repurchases, redemptions, or exchanges will be dependent upon several factors, including our liquidity requirements, contractual restrictions, general market conditions, and applicable regulatory, legal and accounting factors. Whether or not to repurchase or redeem any debt and the size and timing of any such repurchases or redemptions will be determined at our discretion.
See Note 16 of the Notes to the Interim Condensed Consolidated Financial Statements for information regarding about the redemption and cancellation of senior notes subsequent to June 30, 2021.
Support Agreements
MetLife, Inc.’s common stock repurchases. and several of its subsidiaries (each, an “Obligor”) are parties to various capital support commitments and guarantees with subsidiaries. Under these arrangements, each Obligor has agreed to cause the applicable entity to meet specified capital and surplus levels or has guaranteed certain contractual obligations. We anticipate that in the event these arrangements place demands upon us, there will be sufficient liquidity and capital to enable us to meet such demands. See Note 5 of the Notes to the MetLife, Inc. (Parent Company Only) Condensed Financial Information included in the 2020 Annual Report.
Liquid AssetsCredit and Committed Facilities
At September 30, 2017We maintain an unsecured revolving credit facility, as well as certain committed facilities, with various financial institutions. See “— Liquidity and December 31, 2016, MetLife, Inc. and other MetLife holding companies had $6.5 billion and $5.8 billion, respectively, in liquid assets. Of these amounts, $3.9 billion and $3.7 billion were held by MetLife, Inc. and $2.6 billion and $2.1 billion were held by other MetLife holding companies, at September 30, 2017 and December 31, 2016, respectively. Liquid assets include cash and cash equivalents, short-term investments and publicly-traded securities excluding assets that are pledged or otherwise committed. Assets pledged or otherwise committed include amounts received in connection with derivatives and a collateral financing arrangement.
Liquid assets held in non-U.S. holding companies are generated in part through dividends from non-U.S. insurance operations. Such dividends are subject to local insurance regulatory requirements, as discussed in “Capital Resources — The Company — Liquidity and Capital Sources — Dividends from Subsidiaries.” The cumulative earningsGlobal Funding Sources — Credit and Committed Facilities” for descriptions of certain active non-U.S. operations have historically been reinvested indefinitely in such non-U.S. operations, as described inarrangements. For the classification of expenses on such credit and committed facilities and the nature of the associated liability for letters of credit issued and drawdowns on these credit and committed facilities, see Note 1913 of the Notes to the Consolidated Financial Statements included in the 20162020 Annual Report. Under current tax laws, should we repatriate such earnings, we may be subject to additional U.S. income taxes
Collateral for Securities Lending, Repurchase Agreements, Third-Party Custodian Administered Repurchase Programs and foreign withholding taxes. Following a post-Separation reviewDerivatives
We participate in securities lending transactions, repurchase agreements and third-party custodian administered repurchase programs in the normal course of business for the purpose of enhancing the total return on our capital needs as described in investment portfolio. See Note 136 of the Notes to the Interim Condensed Consolidated Financial Statements, as well as “Summary of Significant Accounting Policies — Investments — Securities Lending, Repurchase Agreements and FHLB of Boston Advance Agreements” in Note 1 of the Notes to the Consolidated Financial Statements included in the third quarter2020 Annual Report for further discussion of 2017,our securities lending transactions and repurchase agreements, the classification of revenues and expenses, and the nature of the secured financing arrangements and associated liabilities.
Securities lending and repurchase agreements: Periodically we recorded a $444receive non-cash collateral for securities lending and repurchase agreements from counterparties, which is not reflected on our consolidated financial statements. The amount of this non-cash collateral was $31 million tax charge relatedand $1 million at estimated fair value, at June 30, 2021 and December 31, 2020, respectively.
Third-party custodian administered repurchase programs: We loan certain of our fixed maturity securities AFS to unaffiliated financial institutions and, in exchange, non-cash collateral is put on deposit by the unaffiliated financial institutions on our behalf with third-party custodians. The estimated fair value of securities loaned in connection with these transactions was $223 million and $19 million at June 30, 2021 and December 31, 2020, respectively. Non-cash collateral on deposit with third-party custodians held on our behalf was $236 million and $20 million, at estimated fair value, at June 30, 2021 and December 31, 2020, respectively, which cannot be sold or re-pledged, and which is not reflected in our consolidated financial statements.
Derivatives: We enter into derivatives to manage various risks relating to our ongoing business operations. We receive non-cash collateral from counterparties for derivatives, which can be sold or re-pledged subject to certain constraints, and which is not reflected in our consolidated financial statements. The amount of this non-cash collateral was $1.3 billion and $1.7 billion, at estimated fair value, at June 30, 2021 and December 31, 2020, respectively. See “— Liquidity and Capital Resources — The Company — Liquidity and Capital Uses — Pledged Collateral” and Note 7 of the Notes to the future repatriationInterim Condensed Consolidated Financial Statements for information regarding the earned income on and the gross notional amount, estimated fair value of approximately $3.0 billionassets and liabilities and primary underlying risk exposure of pre-2017 earnings. our derivatives.
InvestmentCommitments
We will continueenter into the following commitments in the normal course of business for the purpose of enhancing the total return on our investment portfolio: mortgage loan commitments and commitments to assert that earningsfund partnerships, bank credit facilities, bridge loans and private corporate bond investments. See Note 15 of the Notes to the Interim Condensed Consolidated Financial Statements for further information about these non-U.S. operations will be indefinitely reinvestedinvestment commitments. See “Net Investment Income” and “Net Investment Gains (Losses)” in Note 6 of the Notes to the Interim Condensed Consolidated Financial Statements for amounts earnedinformation on the investment income, investment expense, gains and losses from such investments and the liability for credit loss for unfunded mortgage loan commitments. See also “— Investments — Fixed Maturity Securities AFS and Equity Securities,” “— Investments — Mortgage Loans,” “— Investments — Real Estate and Real Estate Joint Ventures” and “— Investments — Other Limited Partnership Interests.”
Lease Commitments
As lessee, we have entered into various lease and sublease agreements for office space and equipment. Our commitments under such lease agreements are included within the contractual obligations table in 2017 and subsequent years, as we expect to continue to invest in such operations.
See “Management’s Discussion and Analysis of Financial Condition and Results of Operations — Liquidity and Capital Resources — MetLife, Inc.The Company — Liquid Assets”Contractual Obligations” in the 2020 Annual Report. See also Note 11 of the Notes to the Consolidated Financial Statements included in the 20162020 Annual Report for additional information on the sources and uses of liquid assets for MetLife, Inc. and other MetLife holding companies. Report.
Guarantees
See also “— Executive Summary — Consolidated Company Outlook” for the targeted level of liquid assets at the holding companies.
Liquidity and Capital Sources
In addition to the description of liquidity and capital sources“Guarantees” in “— The Company — Summary of the Company’s Primary Sources and Uses of Liquidity and Capital” and “— The Company — Liquidity and Capital Sources,” the following additional information is provided regarding MetLife, Inc.’s primary sources of liquidity and capital:
Dividends from Subsidiaries
MetLife, Inc. relies, in part, on dividends from its subsidiaries to meet its cash requirements. MetLife, Inc.’s insurance subsidiaries are subject to regulatory restrictions on the payment of dividends imposed by the regulators of their respective domiciles. The dividend limitation for U.S. insurance subsidiaries is generally based on the surplus to policyholders at the end of the immediately preceding calendar year and statutory net gain from operations for the immediately preceding calendar year. Statutory accounting practices, as prescribed by insurance regulators of various states in which we conduct business, differ in certain respects from accounting principles used in financial statements prepared in conformity with GAAP. The significant differences relate to the treatment of DAC, certain deferred income tax, required investment liabilities, statutory reserve calculation assumptions, goodwill and surplus notes.
The table below sets forth the dividends permitted to be paid in 2017 by MetLife, Inc.’s primary insurance subsidiaries (prior to the Separation) without insurance regulatory approval and the respective dividends paid during the nine months ended September 30, 2017:
|
| | | | | | | | | |
| Company | | Paid | | Permitted w/o Approval (1) | |
| | | (In millions) | |
| Metropolitan Life Insurance Company | | $ | 2,000 |
| | $ | 2,723 |
| |
| Brighthouse Life Insurance Company (2) | | $ | — |
| | $ | 473 |
| |
| New England Life Insurance Company (2) | | $ | — |
| | $ | 106 |
| |
| Metropolitan Property and Casualty Insurance Company | | $ | — |
| | $ | 98 |
| |
| General American Life Insurance Company | | $ | — |
| | $ | 91 |
| |
| Metropolitan Tower Life Insurance Company | | $ | — |
| | $ | 66 |
| |
| American Life Insurance Company | | $ | — |
| | $ | — |
| |
__________________
| |
(1) | Reflects dividend amounts that may be paid during 2017 without prior regulatory approval. However, because dividend tests may be based on dividends previously paid over rolling 12-month periods, if paid before a specified date during 2017, some or all of such dividends may require regulatory approval. |
| |
(2) | Effective April 28, 2017 in connection with the Separation, MetLife, Inc. contributed all of the issued and outstanding shares of common stock of each of Brighthouse Insurance and New England Life Insurance Company (“NELICO”) to Brighthouse Holdings, LLC. As a result of the Separation, Brighthouse Insurance and NELICO ceased to be subsidiaries of MetLife, Inc. Accordingly, any dividends paid by Brighthouse Insurance and NELICO following the Separation will be paid to Brighthouse Financial, Inc. or its subsidiaries. MetLife will not receive the proceeds of any such dividends after the Separation. See Note 3 of the Notes to the Interim Condensed Consolidated Financial Statements. |
On August 3, 2017, Brighthouse Financial, Inc. paid a cash dividend to MetLife, Inc. of $1.8 billion in connection with the Separation. MetLife, Inc. also received cash of $20 million, representing a dividend from a non-Brighthouse subsidiary. Additionally, for the nine months ended September 30, 2017, MetLife, Inc. received cash returns of capital of $610 million from certain subsidiaries, including $590 million from MetLife Reinsurance Company of South Carolina (“MRSC”) in connection with the Separation. During the nine months ended September 30, 2017, MetLife, Inc., in connection with the Separation, also recorded net non-cash returns of capital of $10.2 billion from various Brighthouse entities. See Note 315 of the Notes to the Interim Condensed Consolidated Financial Statements.
Policyholder Liabilities
We establish, and carry as liabilities, actuarially determined amounts that are calculated to meet policy obligations or to provide for future annuity payments. Amounts for actuarial liabilities are computed and reported on the interim condensed consolidated financial statements in conformity with GAAP. For more details on Policyholder Liabilities, see “Management’s Discussion and Analysis of Financial Condition and Results of Operations — Summary of Critical Accounting Estimates” included in the 2020 Annual Report.
We periodically review our estimates of actuarial liabilities for future benefits and compare them with our actual experience. We revise estimates, to the extent permitted or required under GAAP, if we determine that future expected experience differs from assumptions used in the development of actuarial liabilities. We charge or credit changes in our liabilities to expenses in the period the liabilities are established or re-estimated. If the liabilities originally established for future benefit payments prove inadequate, we must increase them. Such an increase could adversely affect our earnings and have a material adverse effect on our business, results of operations and financial condition.
See “Business — Regulation — Insurance Regulation — Policy and Contract Reserve Adequacy Analysis” and “Risk Factors — Business Risks” included in the 2020 Annual Report for further information regarding required analyses of the adequacy of statutory reserves of our insurance operations.
The dividend capacityfollowing discussion on future policy benefits and policyholder account balances should be read in conjunction with “Management’s Discussion and Analysis of our non-U.S. operations is subject to similar restrictions established by the local regulators. The non-U.S. regulatory regimes also commonly limit dividend payments to the parent company toFinancial Condition and Results of Operations — Industry Trends — Impact of a portion of the subsidiary’s prior year statutory income, as determined by the local accounting principles. The regulators of our non-U.S. operations, including Japan’s Financial Services Agency, may also limit or not permit profit repatriations or other transfers of funds to the U.S. if such transfers are deemed to be detrimental to the solvency or financial strength of the non-U.S. operations, or for other reasons. Most of our non-U.S. subsidiaries are second tier subsidiaries which are owned by various non-U.S. holding companies. The capital and rating considerations applicable to our first tier subsidiaries may also impact the dividend flow into MetLife, Inc.
We proactively manage target and excess capital levels and dividend flows and forecast local capital positions as part of the financial planning cycle. The dividend capacity of certain U.S. and non-U.S. subsidiaries is also subject to business targets in excess of the minimum capital necessary to maintain the desired rating or level of financial strength in the relevant market. See “Risk Factors — Capital-Related Risks — As a Holding Company, MetLife, Inc. Depends on the Ability of Its Subsidiaries to Pay Dividends, a Major Component of Holding Company Free Cash Flow”Sustained Low Interest Rate Environment” included in the 20162020 Annual Report, as amended or supplemented in our subsequently filed Quarterly Reports on Form 10-Q under similarly captioned sections, and Note 16“— Variable Annuity Guarantees.” See also Notes 1 and 4 of the Notes to the Consolidated Financial Statements included in the 20162020 Annual Report.Report for additional information.
Short-term Debt
Future Policy Benefits
We establish liabilities for amounts payable under insurance policies. A discussion of future policy benefits by segment (as well as Corporate & Other) follows.
U.S.
Amounts payable under insurance policies for this segment are comprised of group insurance and annuities. For group insurance, future policyholder benefits are comprised mainly of liabilities for disabled lives under disability waiver of premium policy provisions, liabilities for survivor income benefit insurance, active life policies and premium stabilization and other contingency liabilities held under life insurance contracts. For group annuity contracts, future policyholder benefits are primarily related to payout annuities, including pension risk transfers, structured settlement annuities and institutional income annuities. There is no interest rate crediting flexibility on these liabilities.
Asia
Future policy benefits for this segment are held primarily for traditional life, endowment, annuity and accident & health contracts. They are also held for total return pass-through provisions included in certain universal life and savings products. They include certain liabilities for variable annuity and variable life guarantees of minimum death benefits, and longevity guarantees. Factors impacting these liabilities include sustained periods of lower than expected yields, lower than expected asset reinvestment rates, market volatility, actual lapses resulting in lower than expected income, and actual mortality or morbidity resulting in higher than expected benefit payments.
Latin America
Future policy benefit liabilities for this segment are held primarily for immediate annuities, traditional life contracts and total return pass-through provisions included in certain universal life and savings products. There is limited interest rate crediting flexibility on the immediate annuity and traditional life liabilities. Other factors impacting these liabilities are actual mortality resulting in higher than expected benefit payments and actual lapses resulting in lower than expected income.
EMEA
Future policy benefits for this segment include unearned premium reserves for group life and medical and credit insurance contracts. Future policy benefits are also held for traditional life, endowment and annuity contracts with significant mortality risk and accident & health contracts. Factors impacting these liabilities include lower than expected asset reinvestment rates, market volatility, actual lapses resulting in lower than expected income, and actual mortality or morbidity resulting in higher than expected benefit payments.
MetLife Inc. maintainsHoldings
Future policy benefits for the life insurance business are comprised mainly of liabilities for traditional life insurance contracts. For the annuities business, future policy benefits are comprised mainly of liabilities for life-contingent income annuities and liabilities for the variable annuity guaranteed minimum benefits that are accounted for as insurance. For the long-term care business, future policyholder benefits are comprised mainly of liabilities for disabled lives under disability waiver of premium policy provisions, and active life policies. In addition, for our other products, future policyholder benefits related to the reinsurance of our former Japan joint venture are comprised of liabilities for the variable annuity guaranteed minimum benefits that are accounted for as insurance.
Corporate & Other
Future policy benefits primarily include liabilities for other reinsurance business.
Policyholder Account Balances
Policyholder account balances are generally equal to the account value, which includes accrued interest credited, but excludes the impact of any applicable charge that may be incurred upon surrender. A discussion of policyholder account balances by segment follows.
U.S.
Policyholder account balances in this segment are comprised of funding agreements, retained asset accounts, universal life policies, the fixed account of variable life insurance policies and specialized life insurance products for benefit programs.
Group Benefits
Policyholder account balances in this business are held for retained asset accounts, universal life policies, the fixed account of variable life insurance policies and specialized life insurance products for benefit programs. Policyholder account balances are credited interest at a commercial paperrate we determine, which is influenced by current market rates. Most of these policyholder account balances have minimum credited rate guarantees.
The table below presents the breakdown of account value subject to minimum guaranteed crediting rates for Group Benefits:
| | | | | | | | | | | |
| June 30, 2021 |
| Guaranteed Minimum Crediting Rate | Account
Value | | Account
Value at
Guarantee |
| (In millions) |
| Greater than 0% but less than 2% | $ | 5,217 | | | $ | 5,090 | |
| Equal to or greater than 2% but less than 4% | $ | 1,597 | | | $ | 1,559 | |
| Equal to or greater than 4% | $ | 794 | | | $ | 765 | |
Retirement and Income Solutions
Policyholder account balances in this business are held largely for investment-type products, mainly funding agreements, as well as postretirement benefits and corporate-owned life insurance to fund non-qualified benefit programs for executives. Interest crediting rates vary by type of contract and can be fixed or variable. Variable interest crediting rates are generally tied to an external index, most commonly (1-month or 3-month) London Interbank Offered Rate or Secured Overnight Financing Rate. We guarantee payment of interest and return of principal at the contractual maturity date.
The table below presents the breakdown of account value subject to minimum guaranteed crediting rates for RIS:
| | | | | | | | | | | |
| June 30, 2021 |
| Guaranteed Minimum Crediting Rate | Account
Value | | Account
Value at
Guarantee |
| (In millions) |
| Greater than 0% but less than 2% | $ | 146 | | | $ | — | |
| Equal to or greater than 2% but less than 4% | $ | 1,049 | | | $ | 143 | |
| Equal to or greater than 4% | $ | 4,619 | | | $ | 4,383 | |
Asia
Policyholder account balances in this segment are held largely for fixed income retirement and savings plans, fixed deferred annuities, interest sensitive whole life products, universal life and, to a lesser degree, liability amounts for Unit-linked investments that do not meet the GAAP definition of separate accounts. Also included are certain liabilities for retirement and savings products sold in certain countries in Asia that generally are sold with minimum credited rate guarantees. Liabilities for guarantees on certain variable annuities in Asia are accounted for as embedded derivatives and recorded at estimated fair value and are also included within policyholder account balances. Most of these policyholder account balances have minimum credited rate guarantees. Liabilities for Unit-linked investments are impacted by changes in the fair value of the associated underlying investments, as the return on assets is generally passed directly to the policyholder.
The table below presents the breakdown of account value subject to minimum guaranteed crediting rates for Asia:
| | | | | | | | | | | |
| June 30, 2021 |
| Guaranteed Minimum Crediting Rate | Account
Value | | Account
Value at
Guarantee |
| (In millions) |
| Annuities: | | | |
| Greater than 0% but less than 2% | $ | 31,595 | | | $ | 1,799 | |
| Equal to or greater than 2% but less than 4% | $ | 1,026 | | | $ | 427 | |
| Equal to or greater than 4% | $ | 1 | | | $ | 1 | |
| Life & Other: | | | |
| Greater than 0% but less than 2% | $ | 12,745 | | | $ | 12,211 | |
| Equal to or greater than 2% but less than 4% | $ | 32,574 | | | $ | 20,779 | |
| Equal to or greater than 4% | $ | 280 | | | $ | 280 | |
Latin America
Policyholder account balances in this segment are held largely for investment-type products, universal life products, deferred annuities and Unit-linked investments that do not meet the GAAP definition of separate accounts. Liabilities for Unit-linked investments are impacted by changes in the fair value of the associated investments, as the return on assets is generally passed directly to the policyholder. Many of the other liabilities have minimum credited rate guarantees.
EMEA
Policyholder account balances in this segment are held mostly for universal life, deferred annuities, pension products, and Unit-linked investments that do not meet the GAAP definition of separate accounts. They are also held for endowment products without significant mortality risk. Most of these policyholder account balances have minimum credited rate guarantees. Liabilities for Unit-linked investments are impacted by changes in the fair value of the associated investments, as the return on assets is generally passed directly to the policyholder.
MetLife Holdings
Life policyholder account balances in this segment are held for retained asset accounts, universal life policies, the fixed account of variable life insurance policies, and funding agreements. For annuities, policyholder account balances are held for fixed deferred annuities, the fixed account portion of variable annuities, non-life contingent income annuities, and embedded derivatives related to variable annuity guarantees. Interest is credited to the policyholder’s account at interest rates we determine which are influenced by current market rates, subject to specified minimums. Most of these policyholder account balances have minimum credited rate guarantees. Additionally, for our other products, policyholder account balances are held for variable annuity guarantees assumed from a former operating joint venture in Japan that are accounted for as embedded derivatives.
The table below presents the breakdown of account value subject to minimum guaranteed crediting rates for the MetLife Holdings segment:
| | | | | | | | | | | |
| June 30, 2021 |
| Guaranteed Minimum Crediting Rate | Account
Value | | Account
Value at
Guarantee |
| (In millions) |
| Greater than 0% but less than 2% | $ | 1,202 | | | $ | 1,167 | |
| Equal to or greater than 2% but less than 4% | $ | 17,619 | | | $ | 16,005 | |
| Equal to or greater than 4% | $ | 7,486 | | | $ | 6,872 | |
Variable Annuity Guarantees
We issue, directly and through assumed business, certain variable annuity products with guaranteed minimum benefits that provide the policyholder a minimum return based on their initial deposit (i.e., the benefit base) less withdrawals. In some cases, the benefit base may be increased by additional deposits, bonus amounts, accruals or optional market value resets. See Note 4 of the Notes to the Interim Condensed Consolidated Financial Statements, as well as Notes 1 and 4 of the Notes to the Consolidated Financial Statements included in the 2020 Annual Report for additional information.
Certain guarantees, including portions thereof, have insurance liabilities established that are included in future policy benefits. Guarantees accounted for in this manner include guaranteed minimum death benefits (“GMDBs”), the life-contingent portion of guaranteed minimum withdrawal benefits (“GMWBs”), elective guaranteed minimum income benefit (“GMIB”) annuitizations, and the life contingent portion of GMIBs that require annuitization when the account balance goes to zero. These liabilities are accrued over the life of the contract in proportion to actual and future expected policy assessments based on the level of guaranteed minimum benefits generated using multiple scenarios of separate account returns. The scenarios are based on best estimate assumptions consistent with those used to amortize DAC. When current estimates of future benefits exceed those previously projected or when current estimates of future assessments are lower than those previously projected, liabilities will increase, resulting in a current period charge to net income. The opposite result occurs when the current estimates of future benefits are lower than those previously projected or when current estimates of future assessments exceed those previously projected. At the end of each reporting period, we update the actual amount of business remaining in-force, which impacts expected future assessments and the projection of estimated future benefits resulting in a current period charge or increase to earnings.
Certain guarantees, including portions thereof, accounted for as embedded derivatives, are recorded at estimated fair value and included in policyholder account balances. Guarantees accounted for as embedded derivatives include guaranteed minimum accumulation benefits (“GMABs”), the non-life contingent portion of GMWBs and certain non-life contingent portions of GMIBs. The estimated fair values of guarantees accounted for as embedded derivatives are determined based on the present value of projected future benefits minus the present value of projected future fees. The projections of future benefits and future fees require capital market and actuarial assumptions including expectations concerning policyholder behavior. A risk-neutral valuation methodology is used to project the cash flows from the guarantees under multiple capital market scenarios to determine an economic liability. The reported estimated fair value is then determined by taking the present value of these risk-free generated cash flows using a discount rate that incorporates a spread over the risk-free rate to reflect our nonperformance risk and adding a risk margin. For more information on the determination of estimated fair value, see Note 8 of the Notes to the Interim Condensed Consolidated Financial Statements.
The table below presents the carrying value for guarantees at:
| | | | | | | | | | | | | | | | | | | | | | | |
| Future Policy
Benefits | | Policyholder
Account Balances |
| June 30, 2021 | | December 31, 2020 | | June 30, 2021 | | December 31, 2020 |
| (In millions) |
| Asia | | | | | | | |
| GMDB | $ | 6 | | | $ | 6 | | | $ | — | | | $ | — | |
| GMAB | — | | | — | | | 12 | | | 26 | |
| GMWB | 34 | | | 35 | | | 118 | | | 134 | |
| EMEA | | | | | | | |
| GMDB | 4 | | | 6 | | | — | | | — | |
| GMAB | — | | | — | | | 11 | | | 31 | |
| GMWB | 24 | | | 31 | | | (68) | | | (23) | |
| MetLife Holdings | | | | | | | |
| GMDB | 465 | | | 450 | | | — | | | — | |
| GMIB | 925 | | | 954 | | | 80 | | | 323 | |
| GMAB | — | | | — | | | (1) | | | — | |
| GMWB | 178 | | | 179 | | | 224 | | | 443 | |
| Total | $ | 1,636 | | | $ | 1,661 | | | $ | 376 | | | $ | 934 | |
The carrying amounts for guarantees included in policyholder account balances above include nonperformance risk adjustments of $86 million and $137 million at June 30, 2021 and December 31, 2020, respectively. These nonperformance risk adjustments represent the impact of including a credit spread when discounting the underlying risk-neutral cash flows to determine the estimated fair values. The nonperformance risk adjustment does not have an economic impact on us as it cannot be monetized given the nature of these policyholder liabilities. The change in valuation arising from the nonperformance risk adjustment is not hedged.
The carrying values of these guarantees can change significantly during periods of sizable and sustained shifts in equity market performance, equity volatility, interest rates or foreign currency exchange rates. Carrying values are also impacted by our assumptions around mortality, separate account returns and policyholder behavior, including lapse rates.
As discussed below, we use a combination of product design, hedging strategies, reinsurance, and other risk management actions to mitigate the risks related to these benefits. Within each type of guarantee, there is a range of product offerings reflecting the changing nature of these products over time. Changes in product features and terms are in part driven by customer demand but, more importantly, reflect our risk management practices of continuously evaluating the guaranteed benefits and their associated asset-liability matching. We continue to diversify the concentration of income benefits in our portfolio by focusing on withdrawal benefits, variable annuities without living benefits and index-linked annuities.
The sections below provide further detail by total account value for certain of our most popular guarantees. Total account values include amounts not reported on the consolidated balance sheets from assumed business, Unit-linked investments that do not qualify for presentation as separate account assets, and amounts included in our general account. The total account values and the net amounts at risk include direct and assumed business, but exclude offsets from hedging or ceded reinsurance, if any.
GMDBs
We offer a range of GMDBs to our contractholders. The table below presents GMDBs, by benefit type, at June 30, 2021:
| | | | | | | | | | | |
| Total Account Value (1) |
| Asia & EMEA | | MetLife Holdings |
| (In millions) |
| Return of premium or five to seven year step-up | $ | 7,921 | | | $ | 47,951 | |
| Annual step-up | — | | | 3,234 | |
| Roll-up and step-up combination | — | | | 5,585 | |
| Total | $ | 7,921 | | | $ | 56,770 | |
__________________
(1)Total account value excludes $607 million for contracts with no GMDBs. The Company’s annuity contracts with guarantees may offer more than one type of guarantee in each contract. Therefore, the amounts listed for GMDBs and for living benefit guarantees are not mutually exclusive.
Based on total account value, less than 18% of our GMDBs included enhanced death benefits such as the annual step-up or roll-up and step-up combination products at June 30, 2021.
Living Benefit Guarantees
The table below presents our living benefit guarantees based on total account values at June 30, 2021:
| | | | | | | | | | | |
| Total Account Value (1) |
| Asia & EMEA | | MetLife Holdings |
| (In millions) |
| GMIB | $ | — | | | $ | 21,100 | |
| GMWB - non-life contingent (2) | 1,053 | | | 2,238 | |
| GMWB - life-contingent | 3,392 | | | 8,816 | |
| GMAB | 1,780 | | | 166 | |
| Total | $ | 6,225 | | | $ | 32,320 | |
__________________
(1)Total account value excludes $26.8 billion for contracts with no living benefit guarantees. The Company’s annuity contracts with guarantees may offer more than one type of guarantee in each contract. Therefore, the amounts listed for GMDBs and for living benefit guarantee amounts are not mutually exclusive.
(2)The Asia and EMEA segments include the non-life contingent portion of the GMWB total account value of $1.0 billion with a guarantee at annuitization.
In terms of total account value, GMIBs are our most significant living benefit guarantee. Our primary risk management strategy for our GMIB products is our derivatives hedging program as discussed below. Additionally, we have engaged in certain reinsurance agreements covering some of our GMIB business. As part of our overall risk management approach for living benefit guarantees, we continually monitor the proceedsreinsurance markets for the right opportunity to purchase additional coverage for our GMIB business. We stopped selling GMIBs in February 2016.
The table below presents our GMIB associated total account values, by their guaranteed payout basis, at June 30, 2021:
| | | | | |
| Total Account Value |
| (In millions) |
| 7-year setback, 2.5% interest rate | $ | 6,191 | |
| 7-year setback, 1.5% interest rate | 1,232 | |
| 10-year setback, 1.5% interest rate | 4,221 | |
| 10-year mortality projection, 10-year setback, 1.0% interest rate | 8,044 | |
| 10-year mortality projection, 10-year setback, 0.5% interest rate | 1,412 | |
| $ | 21,100 | |
The annuitization interest rates on GMIBs have been decreased from 2.5% to 0.5% over time, partially in response to the low interest rate environment, accompanied by an increase in the setback period from seven years to 10 years and the introduction of a 10-year mortality projection.
Additionally, 39% of the $21.1 billion of GMIB total account value has been invested in managed volatility funds as of June 30, 2021. These funds seek to manage volatility by adjusting the fund holdings within certain guidelines based on capital market movements. Such activity reduces the overall risk of the underlying funds while maintaining their growth opportunities. These risk mitigation techniques reduce or eliminate the need for us to manage the funds’ volatility through hedging or reinsurance.
Our GMIB products typically have a waiting period of 10 years to be eligible for annuitization. As of June 30, 2021, only 32% of our contracts with GMIBs were eligible for annuitization. The remaining contracts are not eligible for annuitization for an average of three years.
Once eligible for annuitization, contractholders would be expected to annuitize only if their contracts were in-the-money. We calculate in-the-moneyness with respect to GMIBs consistent with net amount at risk as discussed in Note 4 of the Notes to the Interim Condensed Consolidated Financial Statements, by comparing the contractholders’ income benefits based on total account values and current annuity rates versus the guaranteed income benefits. The net amount at risk was $451 million at June 30, 2021, of which can be$406 million was related to GMIBs. For those contracts with GMIB, the table below presents details of contracts that are in-the-money and out-of-the-money at June 30, 2021:
| | | | | | | | | | | | | | | | | |
| In-the-
Moneyness | | Total
Account Value | | % of Total |
| | | (In millions) | | |
| In-the-money | 30% or greater | | $ | 413 | | | 2 | % |
| 20% to less than 30% | | 201 | | | 1 | % |
| 10% to less than 20% | | 384 | | | 2 | % |
| 0% to less than 10% | | 636 | | | 3 | % |
| | | 1,634 | | | |
| Out-of-the-money | -10% to 0% | | 1,542 | | | 7 | % |
| -20% to less than -10% | | 4,160 | | | 20 | % |
| Greater than -20% | | 13,764 | | | 65 | % |
| | | 19,466 | | | |
| Total GMIBs | | | $ | 21,100 | | | |
Derivatives Hedging Variable Annuity Guarantees
Our risk mitigating hedging strategy uses various over-the-counter and exchange traded derivatives. The table below presents the gross notional amount, estimated fair value and primary underlying risk exposure of the derivatives hedging our variable annuity guarantees:
| | | | | | | | | | | | | | | | | | | | | | | | | | | | | | | | | | | | | | | | | | | | |
| | Instrument Type | | June 30, 2021 | | December 31, 2020 |
Primary Underlying
Risk Exposure | | Gross Notional
Amount | | Estimated Fair Value | | Gross Notional
Amount | | Estimated Fair Value |
| Assets | | Liabilities | | Assets | | Liabilities |
| | | | (In millions) |
| Interest rate | | Interest rate swaps | | $ | 13,078 | | | $ | 61 | | | $ | 16 | | | $ | 14,188 | | | $ | 85 | | | $ | 21 | |
| | Interest rate futures | | 1,610 | | | — | | | 3 | | | 1,442 | | | — | | | 2 | |
| | Interest rate options | | 77 | | | 1 | | | — | | | 637 | | | 134 | | | — | |
| Foreign currency exchange rate | | Foreign currency forwards | | 1,388 | | | 8 | | | 8 | | | 1,834 | | | 27 | | | 13 | |
| | | | | | | | | | | | | | |
| | | | | | | | | | | | | | |
| Equity market | | Equity futures | | 3,644 | | | 7 | | | 7 | | | 4,891 | | | 12 | | | 38 | |
| | Equity index options | | 4,940 | | | 409 | | | 413 | | | 5,360 | | | 558 | | | 408 | |
| | Equity variance swaps | | 716 | | | 17 | | | 15 | | | 716 | | | 15 | | | 12 | |
| | Equity total return swaps | | 2,292 | | | 2 | | | 46 | | | 1,533 | | | 3 | | | 124 | |
| | Total | | $ | 27,745 | | | $ | 505 | | | $ | 508 | | | $ | 30,601 | | | $ | 834 | | | $ | 618 | |
The change in estimated fair values of our derivatives is recorded in policyholder benefits and claims if such derivatives are hedging guarantees included in future policy benefits, and in net derivative gains (losses) if such derivatives are hedging guarantees included in policyholder account balances.
Our hedging strategy involves the significant use of static longer-term derivative instruments to avoid the need to execute transactions during periods of market disruption or higher volatility. We continually monitor the capital markets for opportunities to adjust our liability coverage, as appropriate. Futures are also used to financedynamically adjust the generaldaily coverage levels as markets and liability exposures fluctuate.
We remain liable for the guaranteed benefits in the event that reinsurers or derivative counterparties are unable or unwilling to pay. Certain of our reinsurance agreements and all derivative positions are collateralized and derivatives positions are subject to master netting agreements, both of which significantly reduce the exposure to counterparty risk. In addition, we are subject to the risk that hedging and other risk management actions prove ineffective or that unanticipated policyholder behavior or mortality, combined with adverse market events, produces economic losses beyond the scope of the risk management techniques employed.
Liquidity and Capital Resources
Overview
Our business and results of operations are materially affected by conditions in the global capital markets and the economy generally. Stressed conditions, volatility and disruptions in global capital markets, particular markets, or financial asset classes can have an adverse effect on us, in part because we have a large investment portfolio and our insurance liabilities and derivatives are sensitive to changing market factors. Changing conditions in the global capital markets and the economy may affect our financing costs and market interest for our debt or equity securities. For further information regarding market factors that could affect our ability to meet liquidity and capital needs, see “— Industry Trends” and “— Investments — Current Environment.”
Liquidity Management
Based upon the strength of our franchise, diversification of our businesses, strong financial fundamentals and the substantial funding sources available to us as described herein, we continue to believe we have access to ample liquidity to meet business requirements under current market conditions and reasonably possible stress scenarios. We continuously monitor and adjust our liquidity and capital plans for MetLife, Inc. and its subsidiaries. MetLife, Inc. had nosubsidiaries in light of market conditions, as well as changing needs and opportunities.
Short-term Liquidity
We maintain a substantial short-term debt outstandingliquidity position, which was $13.4 billion and $9.4 billion at either SeptemberJune 30, 2017 or2021 and December 31, 2016.2020, respectively. Short-term liquidity includes cash and cash equivalents and short-term investments, excluding assets that are pledged or otherwise committed, including amounts received in connection with securities lending, repurchase agreements, derivatives, and secured borrowings, as well as amounts held in the closed block.
Credit and Committed Facilities
We maintain an unsecured revolving credit facility, as well as certain committed facilities, with various financial institutions. See “— Liquidity and Capital Resources — The Company — Liquidity and Capital Sources — Global Funding Sources — Credit and Committed Facilities” for descriptions of such arrangements. For the classification of expenses on such credit and committed facilities and the nature of the associated liability for letters of credit issued and drawdowns on these credit and committed facilities, see Note 13 of the Notes to the Consolidated Financial Statements included in the 2020 Annual Report.
Collateral for Securities Lending, Repurchase Agreements, Third-Party Custodian Administered Repurchase Programs and Derivatives
We participate in securities lending transactions, repurchase agreements and third-party custodian administered repurchase programs in the normal course of business for the purpose of enhancing the total return on our investment portfolio. See Note 6 of the Notes to the Interim Condensed Consolidated Financial Statements, as well as “Summary of Significant Accounting Policies — Investments — Securities Lending, Repurchase Agreements and FHLB of Boston Advance Agreements” in Note 1 of the Notes to the Consolidated Financial Statements included in the 2020 Annual Report for further discussion of our securities lending transactions and repurchase agreements, the classification of revenues and expenses, and the nature of the secured financing arrangements and associated liabilities.
Securities lending and repurchase agreements: Periodically we receive non-cash collateral for securities lending and repurchase agreements from counterparties, which is not reflected on our consolidated financial statements. The amount of this non-cash collateral was $31 million and $1 million at estimated fair value, at June 30, 2021 and December 31, 2020, respectively.
Third-party custodian administered repurchase programs: We loan certain of our fixed maturity securities AFS to unaffiliated financial institutions and, in exchange, non-cash collateral is put on deposit by the unaffiliated financial institutions on our behalf with third-party custodians. The estimated fair value of securities loaned in connection with these transactions was $223 million and $19 million at June 30, 2021 and December 31, 2020, respectively. Non-cash collateral on deposit with third-party custodians held on our behalf was $236 million and $20 million, at estimated fair value, at June 30, 2021 and December 31, 2020, respectively, which cannot be sold or re-pledged, and which is not reflected in our consolidated financial statements.
Derivatives: We enter into derivatives to manage various risks relating to our ongoing business operations. We receive non-cash collateral from counterparties for derivatives, which can be sold or re-pledged subject to certain constraints, and which is not reflected in our consolidated financial statements. The amount of this non-cash collateral was $1.3 billion and $1.7 billion, at estimated fair value, at June 30, 2021 and December 31, 2020, respectively. See “— Liquidity and Capital Resources — The Company — Liquidity and Capital Uses — Pledged Collateral” and Note 7 of the Notes to the Interim Condensed Consolidated Financial Statements for information regarding the earned income on and the gross notional amount, estimated fair value of assets and liabilities and primary underlying risk exposure of our derivatives.
InvestmentCommitments
We enter into the following commitments in the normal course of business for the purpose of enhancing the total return on our investment portfolio: mortgage loan commitments and commitments to fund partnerships, bank credit facilities, bridge loans and private corporate bond investments. See Note 15 of the Notes to the Interim Condensed Consolidated Financial Statements for further information about these investment commitments. See “Net Investment Income” and “Net Investment Gains (Losses)” in Note 6 of the Notes to the Interim Condensed Consolidated Financial Statements for information on the investment income, investment expense, gains and losses from such investments and the liability for credit loss for unfunded mortgage loan commitments. See also “— Investments — Fixed Maturity Securities AFS and Equity Securities,” “— Investments — Mortgage Loans,” “— Investments — Real Estate and Real Estate Joint Ventures” and “— Investments — Other Limited Partnership Interests.”
Lease Commitments
As lessee, we have entered into various lease and sublease agreements for office space and equipment. Our commitments under such lease agreements are included within the contractual obligations table in “Management’s Discussion and Analysis of Financial Condition and Results of Operations — Liquidity and Capital Resources — The Company — Contractual Obligations” in the 2020 Annual Report. See also Note 11 of the Notes to the Consolidated Financial Statements included in the 2020 Annual Report.
Guarantees
See “Guarantees” in Note 15 of the Notes to the Interim Condensed Consolidated Financial Statements.
Policyholder Liabilities
We establish, and carry as liabilities, actuarially determined amounts that are calculated to meet policy obligations or to provide for future annuity payments. Amounts for actuarial liabilities are computed and reported on the interim condensed consolidated financial statements in conformity with GAAP. For more details on Policyholder Liabilities, see “Management’s Discussion and Analysis of Financial Condition and Results of Operations — Summary of Critical Accounting Estimates” included in the 2020 Annual Report.
We periodically review our estimates of actuarial liabilities for future benefits and compare them with our actual experience. We revise estimates, to the extent permitted or required under GAAP, if we determine that future expected experience differs from assumptions used in the development of actuarial liabilities. We charge or credit changes in our liabilities to expenses in the period the liabilities are established or re-estimated. If the liabilities originally established for future benefit payments prove inadequate, we must increase them. Such an increase could adversely affect our earnings and have a material adverse effect on our business, results of operations and financial condition.
See “Business — Regulation — Insurance Regulation — Policy and Contract Reserve Adequacy Analysis” and “Risk Factors — Business Risks” included in the 2020 Annual Report for further information regarding required analyses of the adequacy of statutory reserves of our insurance operations.
The following discussion on future policy benefits and policyholder account balances should be read in conjunction with “Management’s Discussion and Analysis of Financial Condition and Results of Operations — Industry Trends — Impact of a Sustained Low Interest Rate Environment” included in the 2020 Annual Report, as amended or supplemented in our subsequently filed Quarterly Reports on Form 10-Q under similarly captioned sections, and “— Variable Annuity Guarantees.” See also Notes 1 and 4 of the Notes to the Consolidated Financial Statements included in the 2020 Annual Report for additional information.
Future Policy Benefits
We establish liabilities for amounts payable under insurance policies. A discussion of future policy benefits by segment (as well as Corporate & Other) follows.
U.S.
Amounts payable under insurance policies for this segment are comprised of group insurance and annuities. For group insurance, future policyholder benefits are comprised mainly of liabilities for disabled lives under disability waiver of premium policy provisions, liabilities for survivor income benefit insurance, active life policies and premium stabilization and other contingency liabilities held under life insurance contracts. For group annuity contracts, future policyholder benefits are primarily related to payout annuities, including pension risk transfers, structured settlement annuities and institutional income annuities. There is no interest rate crediting flexibility on these liabilities.
Asia
Future policy benefits for this segment are held primarily for traditional life, endowment, annuity and accident & health contracts. They are also held for total return pass-through provisions included in certain universal life and savings products. They include certain liabilities for variable annuity and variable life guarantees of minimum death benefits, and longevity guarantees. Factors impacting these liabilities include sustained periods of lower than expected yields, lower than expected asset reinvestment rates, market volatility, actual lapses resulting in lower than expected income, and actual mortality or morbidity resulting in higher than expected benefit payments.
Latin America
Future policy benefit liabilities for this segment are held primarily for immediate annuities, traditional life contracts and total return pass-through provisions included in certain universal life and savings products. There is limited interest rate crediting flexibility on the immediate annuity and traditional life liabilities. Other factors impacting these liabilities are actual mortality resulting in higher than expected benefit payments and actual lapses resulting in lower than expected income.
EMEA
Future policy benefits for this segment include unearned premium reserves for group life and medical and credit insurance contracts. Future policy benefits are also held for traditional life, endowment and annuity contracts with significant mortality risk and accident & health contracts. Factors impacting these liabilities include lower than expected asset reinvestment rates, market volatility, actual lapses resulting in lower than expected income, and actual mortality or morbidity resulting in higher than expected benefit payments.
MetLife Holdings
Future policy benefits for the life insurance business are comprised mainly of liabilities for traditional life insurance contracts. For the annuities business, future policy benefits are comprised mainly of liabilities for life-contingent income annuities and liabilities for the variable annuity guaranteed minimum benefits that are accounted for as insurance. For the long-term care business, future policyholder benefits are comprised mainly of liabilities for disabled lives under disability waiver of premium policy provisions, and active life policies. In addition, for our other products, future policyholder benefits related to the reinsurance of our former Japan joint venture are comprised of liabilities for the variable annuity guaranteed minimum benefits that are accounted for as insurance.
Corporate & Other
Future policy benefits primarily include liabilities for other reinsurance business.
Policyholder Account Balances
Policyholder account balances are generally equal to the account value, which includes accrued interest credited, but excludes the impact of any applicable charge that may be incurred upon surrender. A discussion of policyholder account balances by segment follows.
U.S.
Policyholder account balances in this segment are comprised of funding agreements, retained asset accounts, universal life policies, the fixed account of variable life insurance policies and specialized life insurance products for benefit programs.
Group Benefits
Policyholder account balances in this business are held for retained asset accounts, universal life policies, the fixed account of variable life insurance policies and specialized life insurance products for benefit programs. Policyholder account balances are credited interest at a rate we determine, which is influenced by current market rates. Most of these policyholder account balances have minimum credited rate guarantees.
The table below presents the breakdown of account value subject to minimum guaranteed crediting rates for Group Benefits:
| | | | | | | | | | | |
| June 30, 2021 |
| Guaranteed Minimum Crediting Rate | Account
Value | | Account
Value at
Guarantee |
| (In millions) |
| Greater than 0% but less than 2% | $ | 5,217 | | | $ | 5,090 | |
| Equal to or greater than 2% but less than 4% | $ | 1,597 | | | $ | 1,559 | |
| Equal to or greater than 4% | $ | 794 | | | $ | 765 | |
Retirement and Income Solutions
Policyholder account balances in this business are held largely for investment-type products, mainly funding agreements, as well as postretirement benefits and corporate-owned life insurance to fund non-qualified benefit programs for executives. Interest crediting rates vary by type of contract and can be fixed or variable. Variable interest crediting rates are generally tied to an external index, most commonly (1-month or 3-month) London Interbank Offered Rate or Secured Overnight Financing Rate. We guarantee payment of interest and return of principal at the contractual maturity date.
The table below presents the breakdown of account value subject to minimum guaranteed crediting rates for RIS:
| | | | | | | | | | | |
| June 30, 2021 |
| Guaranteed Minimum Crediting Rate | Account
Value | | Account
Value at
Guarantee |
| (In millions) |
| Greater than 0% but less than 2% | $ | 146 | | | $ | — | |
| Equal to or greater than 2% but less than 4% | $ | 1,049 | | | $ | 143 | |
| Equal to or greater than 4% | $ | 4,619 | | | $ | 4,383 | |
Asia
Policyholder account balances in this segment are held largely for fixed income retirement and savings plans, fixed deferred annuities, interest sensitive whole life products, universal life and, to a lesser degree, liability amounts for Unit-linked investments that do not meet the GAAP definition of separate accounts. Also included are certain liabilities for retirement and savings products sold in certain countries in Asia that generally are sold with minimum credited rate guarantees. Liabilities for guarantees on certain variable annuities in Asia are accounted for as embedded derivatives and recorded at estimated fair value and are also included within policyholder account balances. Most of these policyholder account balances have minimum credited rate guarantees. Liabilities for Unit-linked investments are impacted by changes in the fair value of the associated underlying investments, as the return on assets is generally passed directly to the policyholder.
The table below presents the breakdown of account value subject to minimum guaranteed crediting rates for Asia:
| | | | | | | | | | | |
| June 30, 2021 |
| Guaranteed Minimum Crediting Rate | Account
Value | | Account
Value at
Guarantee |
| (In millions) |
| Annuities: | | | |
| Greater than 0% but less than 2% | $ | 31,595 | | | $ | 1,799 | |
| Equal to or greater than 2% but less than 4% | $ | 1,026 | | | $ | 427 | |
| Equal to or greater than 4% | $ | 1 | | | $ | 1 | |
| Life & Other: | | | |
| Greater than 0% but less than 2% | $ | 12,745 | | | $ | 12,211 | |
| Equal to or greater than 2% but less than 4% | $ | 32,574 | | | $ | 20,779 | |
| Equal to or greater than 4% | $ | 280 | | | $ | 280 | |
Latin America
Policyholder account balances in this segment are held largely for investment-type products, universal life products, deferred annuities and Unit-linked investments that do not meet the GAAP definition of separate accounts. Liabilities for Unit-linked investments are impacted by changes in the fair value of the associated investments, as the return on assets is generally passed directly to the policyholder. Many of the other liabilities have minimum credited rate guarantees.
EMEA
Policyholder account balances in this segment are held mostly for universal life, deferred annuities, pension products, and Unit-linked investments that do not meet the GAAP definition of separate accounts. They are also held for endowment products without significant mortality risk. Most of these policyholder account balances have minimum credited rate guarantees. Liabilities for Unit-linked investments are impacted by changes in the fair value of the associated investments, as the return on assets is generally passed directly to the policyholder.
MetLife Holdings
Life policyholder account balances in this segment are held for retained asset accounts, universal life policies, the fixed account of variable life insurance policies, and funding agreements. For annuities, policyholder account balances are held for fixed deferred annuities, the fixed account portion of variable annuities, non-life contingent income annuities, and embedded derivatives related to variable annuity guarantees. Interest is credited to the policyholder’s account at interest rates we determine which are influenced by current market rates, subject to specified minimums. Most of these policyholder account balances have minimum credited rate guarantees. Additionally, for our other products, policyholder account balances are held for variable annuity guarantees assumed from a former operating joint venture in Japan that are accounted for as embedded derivatives.
The table below presents the breakdown of account value subject to minimum guaranteed crediting rates for the MetLife Holdings segment:
| | | | | | | | | | | |
| June 30, 2021 |
| Guaranteed Minimum Crediting Rate | Account
Value | | Account
Value at
Guarantee |
| (In millions) |
| Greater than 0% but less than 2% | $ | 1,202 | | | $ | 1,167 | |
| Equal to or greater than 2% but less than 4% | $ | 17,619 | | | $ | 16,005 | |
| Equal to or greater than 4% | $ | 7,486 | | | $ | 6,872 | |
Variable Annuity Guarantees
We issue, directly and through assumed business, certain variable annuity products with guaranteed minimum benefits that provide the policyholder a minimum return based on their initial deposit (i.e., the benefit base) less withdrawals. In some cases, the benefit base may be increased by additional deposits, bonus amounts, accruals or optional market value resets. See Note 4 of the Notes to the Interim Condensed Consolidated Financial Statements, as well as Notes 1 and 4 of the Notes to the Consolidated Financial Statements included in the 2020 Annual Report for additional information.
Certain guarantees, including portions thereof, have insurance liabilities established that are included in future policy benefits. Guarantees accounted for in this manner include guaranteed minimum death benefits (“GMDBs”), the life-contingent portion of guaranteed minimum withdrawal benefits (“GMWBs”), elective guaranteed minimum income benefit (“GMIB”) annuitizations, and the life contingent portion of GMIBs that require annuitization when the account balance goes to zero. These liabilities are accrued over the life of the contract in proportion to actual and future expected policy assessments based on the level of guaranteed minimum benefits generated using multiple scenarios of separate account returns. The scenarios are based on best estimate assumptions consistent with those used to amortize DAC. When current estimates of future benefits exceed those previously projected or when current estimates of future assessments are lower than those previously projected, liabilities will increase, resulting in a current period charge to net income. The opposite result occurs when the current estimates of future benefits are lower than those previously projected or when current estimates of future assessments exceed those previously projected. At the end of each reporting period, we update the actual amount of business remaining in-force, which impacts expected future assessments and the projection of estimated future benefits resulting in a current period charge or increase to earnings.
Certain guarantees, including portions thereof, accounted for as embedded derivatives, are recorded at estimated fair value and included in policyholder account balances. Guarantees accounted for as embedded derivatives include guaranteed minimum accumulation benefits (“GMABs”), the non-life contingent portion of GMWBs and certain non-life contingent portions of GMIBs. The estimated fair values of guarantees accounted for as embedded derivatives are determined based on the present value of projected future benefits minus the present value of projected future fees. The projections of future benefits and future fees require capital market and actuarial assumptions including expectations concerning policyholder behavior. A risk-neutral valuation methodology is used to project the cash flows from the guarantees under multiple capital market scenarios to determine an economic liability. The reported estimated fair value is then determined by taking the present value of these risk-free generated cash flows using a discount rate that incorporates a spread over the risk-free rate to reflect our nonperformance risk and adding a risk margin. For more information on the determination of estimated fair value, see Note 8 of the Notes to the Interim Condensed Consolidated Financial Statements.
The table below presents the carrying value for guarantees at:
| | | | | | | | | | | | | | | | | | | | | | | |
| Future Policy
Benefits | | Policyholder
Account Balances |
| June 30, 2021 | | December 31, 2020 | | June 30, 2021 | | December 31, 2020 |
| (In millions) |
| Asia | | | | | | | |
| GMDB | $ | 6 | | | $ | 6 | | | $ | — | | | $ | — | |
| GMAB | — | | | — | | | 12 | | | 26 | |
| GMWB | 34 | | | 35 | | | 118 | | | 134 | |
| EMEA | | | | | | | |
| GMDB | 4 | | | 6 | | | — | | | — | |
| GMAB | — | | | — | | | 11 | | | 31 | |
| GMWB | 24 | | | 31 | | | (68) | | | (23) | |
| MetLife Holdings | | | | | | | |
| GMDB | 465 | | | 450 | | | — | | | — | |
| GMIB | 925 | | | 954 | | | 80 | | | 323 | |
| GMAB | — | | | — | | | (1) | | | — | |
| GMWB | 178 | | | 179 | | | 224 | | | 443 | |
| Total | $ | 1,636 | | | $ | 1,661 | | | $ | 376 | | | $ | 934 | |
The carrying amounts for guarantees included in policyholder account balances above include nonperformance risk adjustments of $86 million and $137 million at June 30, 2021 and December 31, 2020, respectively. These nonperformance risk adjustments represent the impact of including a credit spread when discounting the underlying risk-neutral cash flows to determine the estimated fair values. The nonperformance risk adjustment does not have an economic impact on us as it cannot be monetized given the nature of these policyholder liabilities. The change in valuation arising from the nonperformance risk adjustment is not hedged.
The carrying values of these guarantees can change significantly during periods of sizable and sustained shifts in equity market performance, equity volatility, interest rates or foreign currency exchange rates. Carrying values are also impacted by our assumptions around mortality, separate account returns and policyholder behavior, including lapse rates.
As discussed below, we use a combination of product design, hedging strategies, reinsurance, and other risk management actions to mitigate the risks related to these benefits. Within each type of guarantee, there is a range of product offerings reflecting the changing nature of these products over time. Changes in product features and terms are in part driven by customer demand but, more importantly, reflect our risk management practices of continuously evaluating the guaranteed benefits and their associated asset-liability matching. We continue to diversify the concentration of income benefits in our portfolio by focusing on withdrawal benefits, variable annuities without living benefits and index-linked annuities.
The sections below provide further detail by total account value for certain of our most popular guarantees. Total account values include amounts not reported on the consolidated balance sheets from assumed business, Unit-linked investments that do not qualify for presentation as separate account assets, and amounts included in our general account. The total account values and the net amounts at risk include direct and assumed business, but exclude offsets from hedging or ceded reinsurance, if any.
GMDBs
We offer a range of GMDBs to our contractholders. The table below presents GMDBs, by benefit type, at June 30, 2021:
| | | | | | | | | | | |
| Total Account Value (1) |
| Asia & EMEA | | MetLife Holdings |
| (In millions) |
| Return of premium or five to seven year step-up | $ | 7,921 | | | $ | 47,951 | |
| Annual step-up | — | | | 3,234 | |
| Roll-up and step-up combination | — | | | 5,585 | |
| Total | $ | 7,921 | | | $ | 56,770 | |
__________________
(1)Total account value excludes $607 million for contracts with no GMDBs. The Company’s annuity contracts with guarantees may offer more than one type of guarantee in each contract. Therefore, the amounts listed for GMDBs and for living benefit guarantees are not mutually exclusive.
Based on total account value, less than 18% of our GMDBs included enhanced death benefits such as the annual step-up or roll-up and step-up combination products at June 30, 2021.
Living Benefit Guarantees
The table below presents our living benefit guarantees based on total account values at June 30, 2021:
| | | | | | | | | | | |
| Total Account Value (1) |
| Asia & EMEA | | MetLife Holdings |
| (In millions) |
| GMIB | $ | — | | | $ | 21,100 | |
| GMWB - non-life contingent (2) | 1,053 | | | 2,238 | |
| GMWB - life-contingent | 3,392 | | | 8,816 | |
| GMAB | 1,780 | | | 166 | |
| Total | $ | 6,225 | | | $ | 32,320 | |
__________________
(1)Total account value excludes $26.8 billion for contracts with no living benefit guarantees. The Company’s annuity contracts with guarantees may offer more than one type of guarantee in each contract. Therefore, the amounts listed for GMDBs and for living benefit guarantee amounts are not mutually exclusive.
(2)The Asia and EMEA segments include the non-life contingent portion of the GMWB total account value of $1.0 billion with a guarantee at annuitization.
In terms of total account value, GMIBs are our most significant living benefit guarantee. Our primary risk management strategy for our GMIB products is our derivatives hedging program as discussed below. Additionally, we have engaged in certain reinsurance agreements covering some of our GMIB business. As part of our overall risk management approach for living benefit guarantees, we continually monitor the reinsurance markets for the right opportunity to purchase additional coverage for our GMIB business. We stopped selling GMIBs in February 2016.
The table below presents our GMIB associated total account values, by their guaranteed payout basis, at June 30, 2021:
| | | | | |
| Total Account Value |
| (In millions) |
| 7-year setback, 2.5% interest rate | $ | 6,191 | |
| 7-year setback, 1.5% interest rate | 1,232 | |
| 10-year setback, 1.5% interest rate | 4,221 | |
| 10-year mortality projection, 10-year setback, 1.0% interest rate | 8,044 | |
| 10-year mortality projection, 10-year setback, 0.5% interest rate | 1,412 | |
| $ | 21,100 | |
The annuitization interest rates on GMIBs have been decreased from 2.5% to 0.5% over time, partially in response to the low interest rate environment, accompanied by an increase in the setback period from seven years to 10 years and the introduction of a 10-year mortality projection.
Additionally, 39% of the $21.1 billion of GMIB total account value has been invested in managed volatility funds as of June 30, 2021. These funds seek to manage volatility by adjusting the fund holdings within certain guidelines based on capital market movements. Such activity reduces the overall risk of the underlying funds while maintaining their growth opportunities. These risk mitigation techniques reduce or eliminate the need for us to manage the funds’ volatility through hedging or reinsurance.
Our GMIB products typically have a waiting period of 10 years to be eligible for annuitization. As of June 30, 2021, only 32% of our contracts with GMIBs were eligible for annuitization. The remaining contracts are not eligible for annuitization for an average of three years.
Once eligible for annuitization, contractholders would be expected to annuitize only if their contracts were in-the-money. We calculate in-the-moneyness with respect to GMIBs consistent with net amount at risk as discussed in Note 4 of the Notes to the Interim Condensed Consolidated Financial Statements, by comparing the contractholders’ income benefits based on total account values and current annuity rates versus the guaranteed income benefits. The net amount at risk was $451 million at June 30, 2021, of which $406 million was related to GMIBs. For those contracts with GMIB, the table below presents details of contracts that are in-the-money and out-of-the-money at June 30, 2021:
| | | | | | | | | | | | | | | | | |
| In-the-
Moneyness | | Total
Account Value | | % of Total |
| | | (In millions) | | |
| In-the-money | 30% or greater | | $ | 413 | | | 2 | % |
| 20% to less than 30% | | 201 | | | 1 | % |
| 10% to less than 20% | | 384 | | | 2 | % |
| 0% to less than 10% | | 636 | | | 3 | % |
| | | 1,634 | | | |
| Out-of-the-money | -10% to 0% | | 1,542 | | | 7 | % |
| -20% to less than -10% | | 4,160 | | | 20 | % |
| Greater than -20% | | 13,764 | | | 65 | % |
| | | 19,466 | | | |
| Total GMIBs | | | $ | 21,100 | | | |
Derivatives Hedging Variable Annuity Guarantees
Our risk mitigating hedging strategy uses various over-the-counter and exchange traded derivatives. The table below presents the gross notional amount, estimated fair value and primary underlying risk exposure of the derivatives hedging our variable annuity guarantees:
| | | | | | | | | | | | | | | | | | | | | | | | | | | | | | | | | | | | | | | | | | | | |
| | Instrument Type | | June 30, 2021 | | December 31, 2020 |
Primary Underlying
Risk Exposure | | Gross Notional
Amount | | Estimated Fair Value | | Gross Notional
Amount | | Estimated Fair Value |
| Assets | | Liabilities | | Assets | | Liabilities |
| | | | (In millions) |
| Interest rate | | Interest rate swaps | | $ | 13,078 | | | $ | 61 | | | $ | 16 | | | $ | 14,188 | | | $ | 85 | | | $ | 21 | |
| | Interest rate futures | | 1,610 | | | — | | | 3 | | | 1,442 | | | — | | | 2 | |
| | Interest rate options | | 77 | | | 1 | | | — | | | 637 | | | 134 | | | — | |
| Foreign currency exchange rate | | Foreign currency forwards | | 1,388 | | | 8 | | | 8 | | | 1,834 | | | 27 | | | 13 | |
| | | | | | | | | | | | | | |
| | | | | | | | | | | | | | |
| Equity market | | Equity futures | | 3,644 | | | 7 | | | 7 | | | 4,891 | | | 12 | | | 38 | |
| | Equity index options | | 4,940 | | | 409 | | | 413 | | | 5,360 | | | 558 | | | 408 | |
| | Equity variance swaps | | 716 | | | 17 | | | 15 | | | 716 | | | 15 | | | 12 | |
| | Equity total return swaps | | 2,292 | | | 2 | | | 46 | | | 1,533 | | | 3 | | | 124 | |
| | Total | | $ | 27,745 | | | $ | 505 | | | $ | 508 | | | $ | 30,601 | | | $ | 834 | | | $ | 618 | |
The change in estimated fair values of our derivatives is recorded in policyholder benefits and claims if such derivatives are hedging guarantees included in future policy benefits, and in net derivative gains (losses) if such derivatives are hedging guarantees included in policyholder account balances.
Our hedging strategy involves the significant use of static longer-term derivative instruments to avoid the need to execute transactions during periods of market disruption or higher volatility. We continually monitor the capital markets for opportunities to adjust our liability coverage, as appropriate. Futures are also used to dynamically adjust the daily coverage levels as markets and liability exposures fluctuate.
We remain liable for the guaranteed benefits in the event that reinsurers or derivative counterparties are unable or unwilling to pay. Certain of our reinsurance agreements and all derivative positions are collateralized and derivatives positions are subject to master netting agreements, both of which significantly reduce the exposure to counterparty risk. In addition, we are subject to the risk that hedging and other risk management actions prove ineffective or that unanticipated policyholder behavior or mortality, combined with adverse market events, produces economic losses beyond the scope of the risk management techniques employed.
Liquidity and Capital Resources
Overview
Our business and results of operations are materially affected by conditions in the global capital markets and the economy generally. Stressed conditions, volatility and disruptions in global capital markets, particular markets, or financial asset classes can have an adverse effect on us, in part because we have a large investment portfolio and our insurance liabilities and derivatives are sensitive to changing market factors. Changing conditions in the global capital markets and the economy may affect our financing costs and market interest for our debt or equity securities. For further information regarding market factors that could affect our ability to meet liquidity and capital needs, see “— Industry Trends” and “— Investments — Current Environment.”
Liquidity Management
Based upon the strength of our franchise, diversification of our businesses, strong financial fundamentals and the substantial funding sources available to us as described herein, we continue to believe we have access to ample liquidity to meet business requirements under current market conditions and reasonably possible stress scenarios. We continuously monitor and adjust our liquidity and capital plans for MetLife, Inc. and its subsidiaries in light of market conditions, as well as changing needs and opportunities.
Short-term Liquidity
We maintain a substantial short-term liquidity position, which was $13.4 billion and $9.4 billion at June 30, 2021 and December 31, 2020, respectively. Short-term liquidity includes cash and cash equivalents and short-term investments, excluding assets that are pledged or otherwise committed, including amounts received in connection with securities lending, repurchase agreements, derivatives, and secured borrowings, as well as amounts held in the closed block.
Liquid Assets
An integral part of our liquidity management includes managing our level of liquid assets, which was $226.6 billion and $235.1 billion at June 30, 2021 and December 31, 2020, respectively. Liquid assets include cash and cash equivalents, short-term investments and publicly-traded securities, excluding assets that are pledged or otherwise committed. Assets pledged or otherwise committed include amounts received in connection with securities lending, repurchase agreements, derivatives, regulatory deposits, the collateral financing arrangement, funding agreements and secured borrowings, as well as amounts held in the closed block.
Capital Management
We have established several senior management committees as part of our capital management process. These committees, including the Capital Management Committee and the Enterprise Risk Committee (“ERC”), regularly review actual and projected capital levels (under a variety of scenarios including stress scenarios) and our annual capital plan in accordance with our capital policy. The Capital Management Committee is comprised of members of senior management, including MetLife, Inc.’s Chief Financial Officer (“CFO”), Treasurer, and Chief Risk Officer (“CRO”). The ERC is also comprised of members of senior management, including MetLife, Inc.’s CFO, CRO and Chief Investment Officer.
MetLife, Inc.’s Board of Directors (“Board of Directors”) and senior management are directly involved in the development and maintenance of our capital policy. The capital policy sets forth, among other things, minimum and target capital levels and the governance of the capital management process. All capital actions, including proposed changes to the annual capital plan, capital targets or capital policy, are reviewed by the Finance and Risk Committee of the Board of Directors prior to obtaining full Board of Directors approval. The Board of Directors approves the capital policy and the annual capital plan and authorizes capital actions, as required.
See “Risk Factors — Capital Risks — We May not be Able to Pay Dividends or Repurchase Our Stock Due to Legal and Regulatory Restrictions or Cash Buffer Needs” and Note 16 of the Notes to the Consolidated Financial Statements included in the 2020 Annual Report for information regarding restrictions on payment of dividends and stock repurchases. See also “— The Company — Liquidity and Capital Uses — Common Stock Repurchases” for information regarding MetLife, Inc.’s common stock repurchase authorizations.
The Company
Liquidity
Liquidity refers to the ability to generate adequate amounts of cash to meet our needs. In the event of significant cash requirements beyond anticipated liquidity needs, we have various alternatives available depending on market conditions and the amount and timing of the liquidity need. These available alternatives include cash flows from operations, sales of liquid assets, global funding sources including commercial paper and various credit and committed facilities. See “Management’s Discussion and Analysis of Financial Condition — Liquidity and Capital Resources — The Company — Liquidity” included in the 2020 Annual Report.
Capital
We manage our capital position to maintain our financial strength and credit ratings. Our capital position is supported by our ability to generate strong cash flows within our operating companies and borrow funds at competitive rates, as well as by our demonstrated ability to raise additional capital to meet operating and growth needs despite adverse market and economic conditions.
Summary of the Company’s Primary Sources and Uses of Liquidity and Capital
Our primary sources and uses of liquidity and capital are summarized as follows:
| | | | | | | | | | | |
| Six Months
Ended
June 30, |
| 2021 | | 2020 |
| (In millions) |
| Sources: | | | |
| Operating activities, net | $ | 3,750 | | | $ | 2,693 | |
| Net change in policyholder account balances | 3,870 | | | 7,011 | |
| Net change in payables for collateral under securities loaned and other transactions | 506 | | | 7,401 | |
| Cash received for other transactions with tenors greater than three months | — | | | 50 | |
| Long-term debt issued | 15 | | | 1,074 | |
| Financing element on certain derivative instruments and other derivative related transactions, net | 318 | | | — | |
| Preferred stock issued, net of issuance costs | — | | | 972 | |
| Other, net | 58 | | | 91 | |
| Total sources | 8,517 | | | 19,292 | |
| Uses: | | | |
| Investing activities, net | 45 | | | 9,728 | |
| Cash paid for other transactions with tenors greater than three months | 100 | | | 50 | |
| Long-term debt repaid | 28 | | | 13 | |
| Collateral financing arrangement repaid | 27 | | | 25 | |
| Financing element on certain derivative instruments and other derivative related transactions, net | — | | | 242 | |
| Treasury stock acquired in connection with share repurchases | 2,112 | | | 500 | |
| Redemption of preferred stock | 494 | | | — | |
| Preferred stock redemption premium | 6 | | | — | |
| Dividends on preferred stock | 103 | | | 109 | |
| Dividends on common stock | 829 | | | 823 | |
| Effect of change in foreign currency exchange rates on cash and cash equivalents | 192 | | | 111 | |
| Total uses | 3,936 | | | 11,601 | |
| Net increase (decrease) in cash and cash equivalents | $ | 4,581 | | | $ | 7,691 | |
Cash Flows from Operations
The principal cash inflows from our insurance activities come from insurance premiums, net investment income, annuity considerations and deposit funds. The principal cash outflows are the result of various life insurance, property and casualty, annuity and pension products, operating expenses and income tax, as well as interest expense.
Cash Flows from Investments
The principal cash inflows from our investment activities come from repayments of principal, proceeds from maturities and sales of investments and settlements of freestanding derivatives. The principal cash outflows relate to purchases of investments, issuances of policy loans and settlements of freestanding derivatives. Additional cash outflows relate to purchases of businesses. We typically have a net cash outflow from investing activities because cash inflows from insurance operations are reinvested in accordance with our ALM discipline to fund insurance liabilities. We closely monitor and manage these risks through our comprehensive investment risk management process.
Cash Flows from Financing
The principal cash inflows from our financing activities come from issuances of debt and other securities, deposits of funds associated with policyholder account balances and lending of securities. The principal cash outflows come from repayments of debt and the collateral financing arrangement, payments of dividends on and repurchases of MetLife, Inc.’s securities, withdrawals associated with policyholder account balances and the return of securities on loan.
Liquidity and Capital Sources
In addition to the general description of liquidity and capital sources in “— Summary of the Company’s Primary Sources and Uses of Liquidity and Capital,” the Company’s primary sources of liquidity and capital are set forth below.
Global Funding Sources
Liquidity is provided by a variety of global funding sources, including funding agreements, credit and committed facilities and commercial paper. Capital is provided by a variety of global funding sources, including short-term and long-term debt, the collateral financing arrangement, junior subordinated debt securities, preferred securities, equity securities and equity-linked securities. MetLife, Inc. maintains a shelf registration statement with the SEC that permits the issuance of public debt, equity and hybrid securities. As a “Well-Known Seasoned Issuer” under SEC rules, MetLife, Inc.’s shelf registration statement provides for automatic effectiveness upon filing and has no stated issuance capacity. The diversity of our global funding sources enhances our funding flexibility, limits dependence on any one market or source of funds and generally lowers the cost of funds. Our primary global funding sources include:
Preferred Stock
See Note 10 of the Notes to the Interim Condensed Consolidated Financial Statements and Note 16 of the Notes to the Consolidated Financial Statements included in the 2020 Annual Report.
Common Stock
For the six months ended June 30, 2021 and 2020, MetLife, Inc. issued 4,317,294 and 2,947,250 new shares of its common stock, respectively, for $174 million and $115 million, respectively, to satisfy various stock option exercises and other stock-based awards.
Commercial Paper, Reported in Short-term Debt
MetLife, Inc. and MetLife Funding, Inc. (“MetLife Funding”), a subsidiary of MLIC, each have a commercial paper program that is supported by our unsecured revolving credit facility (see “— Credit and Committed Facilities”). MetLife Funding raises cash from its commercial paper program and uses the proceeds to extend loans through MetLife Credit Corp., another subsidiary of MLIC, to affiliates in order to enhance the financial flexibility and liquidity of these companies.
Federal Home Loan Bank Funding Agreements, Reported in Policyholder Account Balances
Certain of our U.S. insurance subsidiaries are members of a regional Federal Home Loan Bank (“FHLB”). For the six months ended June 30, 2021 and 2020, we issued $18.2 billion and $19.1 billion, respectively, and repaid $18.2 billion and $18.1 billion, respectively, of funding agreements with certain regional FHLBs. At both June 30, 2021 and December 31, 2020, total obligations outstanding under these funding agreements were $16.3 billion. See Note 4 of the Notes to the Consolidated Financial Statements included in the 2020 Annual Report.
Federal Home Loan Bank Advance Agreements, Reported in Liabilities Held-for-Sale
For the six months ended June 30, 2021 and 2020, we borrowed $0 and $1.4 billion, respectively, and repaid $700 million and $1.4 billion, respectively, under advance agreements with the FHLB of Boston. At June 30, 2021 and December 31, 2020, total obligations outstanding under these advance agreements were $0 and $700 million, respectively.
Special Purpose Entity Funding Agreements, Reported in Policyholder Account Balances
We issue fixed and floating rate funding agreements, which are denominated in either U.S. dollars or foreign currencies, to certain unconsolidated special purpose entities that have issued either debt securities or commercial paper for which payment of interest and principal is secured by such funding agreements. For the six months ended June 30, 2021 and 2020, we issued $22.0 billion and $22.5 billion, respectively, and repaid $20.7 billion and $18.3 billion, respectively, under such funding agreements. At June 30, 2021 and December 31, 2020, total obligations outstanding under these funding agreements were $41.2 billion and $39.9 billion, respectively. See Note 4 of the Notes to the Consolidated Financial Statements included in the 2020 Annual Report.
Federal Agricultural Mortgage Corporation Funding Agreements, Reported in Policyholder Account Balances
We have issued funding agreements to a subsidiary of the Federal Agricultural Mortgage Corporation. The obligations under all such funding agreements are secured by a pledge of certain eligible agricultural mortgage loans. For the six months ended June 30, 2021 and 2020, we issued $225 million and $250 million, respectively, and repaid $350 million and $250 million, respectively, under such funding agreements. At June 30, 2021 and December 31, 2020, total obligations outstanding under these funding agreements were $2.3 billion and $2.4 billion, respectively. See Note 4 of the Notes to the Consolidated Financial Statements included in the 2020 Annual Report.
Credit and Committed Facilities
At June 30, 2021, we maintained a $3.0 billion unsecured revolving credit facility and certain committed facilities aggregating $3.3 billion, of which MetLife, Inc. is a party and/or guarantor. When drawn upon, these facilities bear interest at varying rates in accordance with the respective agreements.
The unsecured revolving credit facility is used for general corporate purposes, to support the borrowers’ commercial paper programs and for the issuance of letters of credit. At June 30, 2021, we had outstanding $462 million in letters of credit and no drawdowns against this facility. Remaining availability was $2.5 billion at June 30, 2021.
The committed facilities are used as collateral for certain of the Company’sour affiliated reinsurance liabilities. MetLife, Inc. maintains a committed facility with a capacity of $395 million at SeptemberAt June 30, 2017. At September 30, 2017, MetLife, Inc.2021, we had outstanding $395 million$2.9 billion in letters of credit and no drawdowns against these facilities. Remaining availability was $413 million at June 30, 2021.
See Note 13 of the Notes to the Consolidated Financial Statements included in the 2020 Annual Report for further information on credit and committed facilities.
We have no reason to believe that our lending counterparties will be unable to fulfill their respective contractual obligations under these facilities. As commitments under our credit and committed facilities may expire unused, these amounts do not necessarily reflect our actual future cash funding requirements.
Outstanding Debt Under Global Funding Sources
The following table summarizes our outstanding debt, excluding long-term debt relating to CSEs, at:
| | | | | | | | | | | |
| June 30, 2021 | | December 31, 2020 |
| (In millions) |
| Short-term debt (1) | $ | 393 | | | $ | 393 | |
| Long-term debt (2) | $ | 14,518 | | | $ | 14,598 | |
| Collateral financing arrangement | $ | 818 | | | $ | 845 | |
| Junior subordinated debt securities | $ | 3,154 | | | $ | 3,153 | |
__________________
(1)Includes $293 million of debt that is non-recourse to MetLife, Inc. and no remaining availability. MLIC, subject to customary exceptions, at both June 30, 2021 and December 31, 2020. Certain subsidiaries have pledged assets to secure this debt.
(2)Includes $500 million and $474 million of debt that is non-recourse to MetLife, Inc. and MLIC, subject to customary exceptions, at June 30, 2021 and December 31, 2020, respectively. Certain investment subsidiaries have pledged assets to secure this debt.
Debt and Facility Covenants
Certain of our debt instruments and committed facilities, as well as our unsecured revolving credit facility, contain various administrative, reporting, legal and financial covenants. We believe we were in compliance with all applicable financial covenants at June 30, 2021.
Dispositions
For information regarding pending and other dispositions, see Note 3 of the Notes to the Interim Condensed Consolidated Financial Statements.
Liquidity and Capital Uses
In addition to the general description of liquidity and capital uses in “— Summary of the Company’s Primary Sources and Uses of Liquidity and Capital,” the Company’s primary uses of liquidity and capital are set forth below.
Preferred Stock Redemption
See Note 10 of the Notes to the Interim Condensed Consolidated Financial Statements for information about the redemption of Series C preferred stock.
Common Stock Repurchases
See Note 10 of the Notes to the Interim Condensed Consolidated Financial Statements for information relating to authorizations by the Board of Directors to repurchase MetLife, Inc. common stock, amounts of common stock repurchased pursuant to such authorizations for the six months ended June 30, 2021 and 2020, and the amount remaining under such authorizations at June 30, 2021.
On August 4, 2021, MetLife, Inc. announced that its Board of Directors authorized an additional $3.0 billion of common stock repurchases.
Common stock repurchases are subject to the discretion of our Board of Directors and will depend upon our capital position, liquidity, financial strength and credit ratings, general market conditions, the market price of MetLife, Inc.’s common stock compared to management’s assessment of the stock’s underlying value, applicable regulatory approvals, and other legal and accounting factors. Restrictions on the payment of dividends that may arise under so-called “Dividend Stopper” provisions would also restrict MetLife, Inc.’s ability to repurchase common stock. See “Business — Regulation,” “Risk Factors — Capital Risks — We May not be Able to Pay Dividends or Repurchase Our Stock Due to Legal and Regulatory Restrictions or Cash Buffer Needs” and Note 16 of the Notes to the Consolidated Financial Statements included in the 2020 Annual Report.
Dividends
For the six months ended June 30, 2021 and 2020, MetLife, Inc. paid dividends on its preferred stock of $103 million and $109 million, respectively. For the six months ended June 30, 2021 and 2020, MetLife, Inc. paid $829 million and $823 million of dividends on its common stock, respectively. See Note 10 of the Notes to the Interim Condensed Consolidated Financial Statements and Note 16 of the Notes to the Consolidated Financial Statements included in the 2020 Annual Report for information regarding the calculation and timing of these dividend payments.
The declaration and payment of common stock dividends are subject to the discretion of our Board of Directors, and will depend on MetLife, Inc.’s financial condition, results of operations, cash requirements, future prospects, regulatory restrictions on the payment of dividends by MetLife, Inc.’s insurance subsidiaries and other factors deemed relevant by the Board of Directors. See Note 16 of the Notes to the Consolidated Financial Statements included in the 2020 Annual Report for additional information.
Dividend Restrictions
The payment of dividends is also subject to restrictions under the terms of our preferred stock and junior subordinated debentures in situations where we may be experiencing financial stress. See “Management’s Discussion and Analysis of Financial Condition and Results of Operations — Liquidity and Capital Resources — The Company — Liquidity and Capital Uses — Dividends — “Dividend Stopper” Provisions in MetLife’s Preferred Stock and Junior Subordinated Debentures,” “Risk Factors — Capital Risks — We May not be Able to Pay Dividends or Repurchase Our Stock Due to Legal and Regulatory Restrictions or Cash Buffer Needs” and Note 16 of the Notes to the Consolidated Financial Statements included in the 2020 Annual Report.
Debt Repayments
For the six months ended June 30, 2021 and 2020, following regulatory approval, MetLife Reinsurance Company of Charleston, a wholly-owned subsidiary of MetLife, Inc., repurchased and canceled $27 million and $25 million, respectively, in aggregate principal amount of its surplus notes, which were reported in collateral financing arrangement on the consolidated balance sheets.
Debt Repurchases, Redemptions and Exchanges
We may from time to time seek to retire or purchase our outstanding debt through cash purchases, redemptions and/or exchanges for other securities, in open market purchases, privately negotiated transactions or otherwise. Any such repurchases, redemptions, or exchanges will be dependent upon several factors, including our liquidity requirements, contractual restrictions, general market conditions, and applicable regulatory, legal and accounting factors. Whether or not to repurchase or redeem any debt and the size and timing of any such repurchases or redemptions will be determined at our discretion.
See Note 16 of the Notes to the Interim Condensed Consolidated Financial Statements for information about the redemption and cancellation of senior notes subsequent to June 30, 2021.
Support Agreements
MetLife, Inc. and several of its subsidiaries (each, an “Obligor”) are parties to various capital support commitments and guarantees with subsidiaries. Under these arrangements, each Obligor has agreed to cause the applicable entity to meet specified capital and surplus levels or has guaranteed certain contractual obligations. We anticipate that in the event these arrangements place demands upon us, there will be sufficient liquidity and capital to enable us to meet such demands. See Note 5 of the Notes to the MetLife, Inc. (Parent Company Only) Condensed Financial Information included in the 2020 Annual Report.
Insurance Liabilities
Liabilities arising from our insurance activities primarily relate to benefit payments under various life insurance, annuity and group pension products, as well as payments for policy surrenders, withdrawals and loans. For annuity or deposit type products, surrender or lapse behavior differs somewhat by segment. In the MetLife Holdings segment, which includes individual annuities, lapses and surrenders tend to occur in the normal course of business. For the six months ended June 30, 2021 and 2020, general account surrenders and withdrawals from annuity products were $645 million and $667 million, respectively. In the RIS business within the U.S. segment, which includes pension risk transfers, bank-owned life insurance and other fixed annuity contracts, as well as funding agreements and other capital market products, most of the products offered have fixed maturities or fairly predictable surrenders or withdrawals. With regard to the RIS business products that provide customers with limited rights to accelerate payments, at June 30, 2021 there were funding agreements totaling $141 million that could be put back to the Company.
Pledged Collateral
We pledge collateral to, and have collateral pledged to us by, counterparties in connection with our derivatives. At June 30, 2021 and December 31, 2020, we had received pledged cash collateral from counterparties of $6.7 billion and $7.6 billion, respectively. At June 30, 2021 and December 31, 2020, we had pledged cash collateral to counterparties of $251 million and $266 million, respectively. See Note 7 of the Notes to the Interim Condensed Consolidated Financial Statements for additional information about collateral pledged to us, collateral we pledge and derivatives subject to credit contingent provisions.
We pledge collateral and have had collateral pledged to us, and may be required from time to time to pledge additional collateral or be entitled to have additional collateral pledged to us, in connection with the collateral financing arrangement related to the reinsurance of closed block liabilities.
We pledge collateral from time to time in connection with funding agreements and advance agreements. See Note 6 of the Notes to the Interim Condensed Consolidated Financial Statements, as well as Note 4 of the Notes to the Consolidated Financial Statements included in the 2020 Annual Report.
Securities Lending and Repurchase Agreements
We participate in a securities lending program and in short-term repurchase agreements whereby securities are loaned to unaffiliated financial institutions. We obtain collateral, usually cash, from the borrower, which must be returned to the borrower when the loaned securities are returned to us. Through these arrangements, we were liable for cash collateral under our control of $23.9 billion and $21.8 billion at June 30, 2021 and December 31, 2020, respectively, including a portion that may require the immediate return of cash collateral we hold. See Note 6 of the Notes to the Interim Condensed Consolidated Financial Statements.
Litigation
We establish liabilities for litigation and regulatory loss contingencies when it is probable that a loss has been incurred and the amount of the loss can be reasonably estimated. For material matters where a loss is believed to be reasonably possible but not probable, no accrual is made but we disclose the nature of the contingency and an aggregate estimate of the reasonably possible range of loss in excess of amounts accrued, when such an estimate can be made. It is not possible to predict the ultimate outcome of all pending investigations and legal proceedings. In some of the matters referred to herein, very large and/or indeterminate amounts, including punitive and treble damages, are sought. Given the large and/or indeterminate amounts sought in certain of these matters and the inherent unpredictability of litigation, it is possible that an adverse outcome in certain matters could, from time to time, have a material adverse effect on our consolidated net income or cash flows in particular quarterly or annual periods. See Note 15 of the Notes to the Interim Condensed Consolidated Financial Statements.
Contractual Obligations
See “Management’s Discussion and Analysis of Financial Condition and Results of Operations — Liquidity and Capital Resources — The Company — Contractual Obligations” included in the 2020 Annual Report for additional information regarding the Company’s contractual obligations.
MetLife, Inc.
Liquidity and Capital Management
Liquidity and capital are managed to preserve stable, reliable and cost-effective sources of cash to meet all current and future financial obligations and are provided by a variety of sources, including a portfolio of liquid assets, a diversified mix of short- and long-term funding sources from the wholesale financial markets and the ability to borrow through credit and committed facilities. Liquidity is monitored through the use of internal liquidity risk metrics, including the composition and level of the liquid asset portfolio, timing differences in short-term cash flow obligations, access to the financial markets for capital and debt transactions and exposure to contingent draws on MetLife, Inc.’s liquidity. MetLife, Inc. is an active participant in the global financial markets through which it obtains a party and/significant amount of funding. These markets, which serve as cost-effective sources of funds, are critical components of MetLife, Inc.’s liquidity and capital management. Decisions to access these markets are based upon relative costs, prospective views of balance sheet growth and a targeted liquidity profile and capital structure. A disruption in the financial markets could limit MetLife, Inc.’s access to liquidity.
MetLife, Inc.’s ability to maintain regular access to competitively priced wholesale funds is fostered by its current credit ratings from the major credit rating agencies. We view our capital ratios, credit quality, stable and diverse earnings streams, diversity of liquidity sources and our liquidity monitoring procedures as critical to retaining such credit ratings. See “Management’s Discussion and Analysis of Financial Condition and Results of Operations — Liquidity and Capital Resources — The Company — Rating Agencies” included in the 2020 Annual Report.
Liquidity
For a summary of MetLife, Inc.’s liquidity, see “— The Company — Liquidity.”
Capital
For a summary of MetLife, Inc.’s capital, see “— The Company — Capital.” See also “— The Company — Liquidity and Capital Uses — Common Stock Repurchases” for information regarding MetLife, Inc.’s common stock repurchases.
Liquid Assets
At June 30, 2021 and December 31, 2020, MetLife, Inc., collectively with other MetLife holding companies, had $6.5 billion and $4.5 billion, respectively, in liquid assets. Of these amounts, $5.7 billion and $3.6 billion were held by MetLife, Inc. and $824 million and $873 million were held by other MetLife holding companies at June 30, 2021 and December 31, 2020, respectively. Liquid assets include cash and cash equivalents, short-term investments and publicly-traded securities, excluding assets that are pledged or guarantorotherwise committed. Assets pledged or otherwise committed include amounts received in connection with derivatives and a collateral financing arrangement.
See “Management’s Discussion and Analysis of Financial Condition and Results of Operations — Liquidity and Capital Resources — MetLife, Inc. — Liquid Assets” included in the 2020 Annual Report for additional information on the sources and uses of liquid assets, as well as sources and uses of liquid assets included in free cash flow for MetLife, Inc. and other MetLife holding companies.
Liquidity and Capital Sources
In addition to committed facilitiesthe description of certainliquidity and capital sources in “— The Company — Summary of the Company’s Primary Sources and Uses of Liquidity and Capital” and “— The Company — Liquidity and Capital Sources,” MetLife, Inc.’s primary sources of liquidity and capital are set forth below.
Dividends from Subsidiaries
MetLife, Inc. relies, in part, on dividends from its subsidiaries to meet its cash requirements. MetLife, Inc.’s insurance subsidiaries are subject to regulatory restrictions on the payment of dividends imposed by the regulators of their respective domiciles. The dividend limitation for U.S. insurance subsidiaries is generally based on the surplus to policyholders at the end of the immediately preceding calendar year and statutory net gain from operations for the immediately preceding calendar year. Statutory accounting practices, as prescribed by insurance regulators of various states in which aggregated $3.3 billion at Septemberwe conduct business, differ in certain respects from accounting principles used in financial statements prepared in conformity with GAAP. The significant differences relate to the treatment of DAC, certain deferred income tax, required investment liabilities, statutory reserve calculation assumptions, goodwill and surplus notes.
The table below sets forth the dividends permitted to be paid in 2021 by MetLife, Inc.’s primary U.S. insurance subsidiaries without insurance regulatory approval and the actual dividends paid for the six months ended June 30, 2017.2021:
| | | | | | | | | | | | | | |
| Company | | Paid (1) | | Permitted Without
Approval (2) |
| | (In millions) |
| Metropolitan Life Insurance Company | | $ | 1,430 | | | $ | 3,392 | |
| American Life Insurance Company | | $ | 600 | | | $ | 800 | |
| Metropolitan Property and Casualty Insurance Company (3) | | $ | 35 | | | $ | 222 | |
| Metropolitan Tower Life Insurance Company | | $ | — | | | $ | 82 | |
__________________
(1)Reflects all amounts paid, including those where regulatory approval was obtained as required.
(2)Reflects dividend amounts that may be paid during 2021 without prior regulatory approval. However, because dividend tests may be based on dividends previously paid over rolling 12-month periods, if paid before a specified date during 2021, some or all of such dividends may require regulatory approval.
(3)In April 2021, Metropolitan Property and Casualty Insurance Company paid a $35 million non-cash dividend consisting of the stock of a subsidiary. See Note 3 of the Notes to the Interim Condensed Consolidated Financial Statements for discussioninformation on the disposition of reductionsMetLife P&C.
In addition to the amounts presented in the committed facilities totaling $7.8 billiontable above, for the six months ended June 30, 2021, MetLife, Inc. also received from certain other subsidiaries cash dividends of $86 million, as well as cash returns of capital of $7 million.
The dividend capacity of our non-U.S. operations is subject to similar restrictions established by the local regulators. The non-U.S. regulatory regimes also commonly limit dividend payments to the parent company to a portion of the subsidiary’s prior year statutory income, as determined by the local accounting principles. The regulators of our non-U.S. operations, including Japan’s Financial Services Agency, may also limit or not permit profit repatriations or other transfers of funds to the U.S. if such transfers are deemed to be detrimental to the solvency or financial strength of the non-U.S. operations, or for other reasons. Most of our non-U.S. subsidiaries are second tier subsidiaries which are owned by various non-U.S. holding companies. The capital and rating considerations applicable to our first tier subsidiaries may also impact the dividend flow into MetLife, Inc.
We proactively manage target and excess capital levels and dividend flows and forecast local capital positions as part of the financial planning cycle. The dividend capacity of certain U.S. and non-U.S. subsidiaries is also subject to business targets in April 2017excess of the minimum capital necessary to maintain the desired rating or level of financial strength in connection with the Separation.relevant market. See “Risk Factors — Capital Risks — Our Subsidiaries May be Unable to Pay Dividends, a Major Component of Holding Company Free Cash Flow” and Note 16 of the Notes to the Consolidated Financial Statements included in the 2020 Annual Report.
Credit and Committed Facilities
See “— The Company — Liquidity and Capital Sources — Global Funding Sources — Credit and Committed Facilities” for further information regarding the Company’s unsecured revolving credit facility and thesecertain committed facilities.
Long-term Debt Outstanding
The following table summarizes the outstanding long-term debt of MetLife, Inc. at:
| | | | September 30, 2017 | | December 31, 2016 | | June 30, 2021 | | December 31, 2020 |
| | (In millions) | | (In millions) |
| Long-term debt — unaffiliated | $ | 15,589 |
| | $ | 15,505 |
| Long-term debt — unaffiliated | $ | 13,369 | | | $ | 13,463 | |
| Long-term debt — affiliated (1) | $ | 2,000 |
| | $ | 3,100 |
| Long-term debt — affiliated (1) | $ | 1,945 | | | $ | 2,073 | |
| Collateral financing arrangement (2) | $ | — |
| | $ | 2,797 |
| |
| Junior subordinated debt securities (3) | $ | 2,453 |
| | $ | 1,734 |
| |
| Junior subordinated debt securities | | Junior subordinated debt securities | $ | 2,462 | | | $ | 2,461 | |
__________________
| |
(1) | On April 28, 2017, in connection with the Separation, MetLife, Inc. repaid $750 million and $350 million of senior notes to MetLife Reinsurance Company of Delaware (“MRD”) due September 2032 and December 2033, respectively. The $750 million senior note bore interest at a fixed rate of 4.21% and the $350 million senior note bore interest at a fixed rate of 5.10%. Simultaneously, MRD repaid $750 million and $350 million of surplus notes to MetLife, Inc. See “— Liquidity and Capital Uses — Affiliated Capital and Debt Transactions.” |
| |
(2) | See Note 3 of the Notes to the Interim Condensed Consolidated Financial Statements for discussion of a $2.8 billion repayment on the MRSC collateral financing agreement liability in April 2017 in connection with the Separation, utilizing assets held in trust, which had been repositioned into short-term investments and cash equivalents. |
| |
(3) | See “— Liquidity and Capital Uses — Affiliated Capital and Debt Transactions” for discussion of a $750 million junior subordinated debt securities exchange. |
(1)In July 2021, a ¥53.7 billion 2.9725% senior unsecured note issued to various subsidiaries matured and was refinanced with the following senior unsecured notes issued to various subsidiaries: (i) ¥13.7 billion 1.610% due July 2026, (ii) ¥14.3 billion 1.755% due July 2028 and (iii) ¥25.7 billion 1.852% due July 2031.
Debt and Facility Covenants
Certain of MetLife, Inc.’s debt instruments and committed facilities, as well as its unsecured revolving credit facility, contain various administrative, reporting, legal and financial covenants. MetLife, Inc. believes it was in compliance with all applicable financial covenants at SeptemberJune 30, 2017.2021.
Dispositions
Cash proceeds from dispositions during eitherFor information on the disposition of MetLife P&C, see Note 3 of the nine months ended September 30, 2017 and 2016 were $0 and $291 million, respectively.Notes to the Interim Condensed Consolidated Financial Statements.
Liquidity and Capital Uses
The primary uses of liquidity of MetLife, Inc. include debt service, cash dividends on common and preferred stock, capital contributions to subsidiaries, common andstock, preferred stock and debt repurchases, payment of general operating expenses and acquisitions. Based on our analysis and comparison of our current and future cash inflows from the dividends we receive from subsidiaries that are permitted to be paid without prior insurance regulatory approval, our investment portfolio and other cash flows and anticipated access to the capital markets, we believe there will be sufficient liquidity and capital to enable MetLife, Inc. to make payments on debt, pay cash dividends on its common and preferred stock, contribute capital to its subsidiaries, repurchase its common stock and preferred stock,certain of its other securities, pay all general operating expenses and meet its cash needs.needs under current market conditions and reasonably possible stress scenarios.
In addition to the description of liquidity and capital uses in “— The Company — Liquidity and Capital Uses,” the following additional information is provided regarding MetLife, Inc.’s primary uses of liquidity and capital:capital are set forth below.
Affiliated Capital and Debt Transactions
DuringFor the ninesix months ended SeptemberJune 30, 2017,2021 and 2020, MetLife, Inc. invested a net amount of $735$114 million and $115 million, respectively, in various non-Brighthouse subsidiaries. During thenine months endedSeptember 30, 2016, MetLife, Inc. invested a net amount of $1.3 billion in various subsidiaries, which included a cash capital contribution of $1.5 billion to Brighthouse Insurance in connection with the Separation.
MetLife, Inc. lends funds, as necessary, through credit agreements or otherwise to its subsidiaries and affiliates, some of which are regulated, to meet their capital requirements.requirements or to provide liquidity. MetLife, Inc. had loans to subsidiaries outstanding of $100$140 million and $1.2 billion$0 at SeptemberJune 30, 20172021 and December 31, 2016,2020, respectively.
On April 28, 2017, in connection with the Separation, MRD repaid $750 million and $350 million of surplus notes to MetLife, Inc. due September 2032 and December 2033, respectively. The $750 million surplus note bore interest at a fixed rate of 5.13% and the $350 million surplus note bore interest at a fixed rate of 6.00%, both payable semi-annually. Simultaneously, MetLife, Inc. repaid $750 million and $350 million of senior notes to MRD.
On February 10, 2017, MetLife, Inc. exchanged $750 million aggregate principal amount of its 9.250% Fixed-to-Floating Rate Junior Subordinated Debentures due 2068 for $750 million aggregate liquidation preference of the 9.250% Fixed-to- Floating Rate Exchangeable Surplus Trust Securities of MetLife Capital Trust X (the “Trust”). As a result of the exchange, MetLife, Inc. became the sole beneficial owner of the Trust, a special purpose entity which issued the exchangeable surplus trust securities to third-party investors. On March 23, 2017, MetLife, Inc. dissolved the Trust and became the direct holder of $750 million 8.595% surplus notes previously held by the Trust that were issued by Brighthouse Insurance. See Note 9 of the Notes to the Interim Condensed Consolidated Financial Statements. On June 16, 2017, MetLife, Inc. forgave Brighthouse Insurance’s obligation to pay the principal amount of such surplus notes. This transaction, which was a non-cash capital contribution to Brighthouse Holdings, LLC, and a corresponding non-cash capital contribution to Brighthouse Insurance, had no impact on the consolidated financial statements of MetLife, Inc. as of the date of the transaction.
Support Agreements
MetLife, Inc. is party to various capital support commitments and guarantees with certain of its subsidiaries. Under these arrangements, MetLife, Inc. has agreed to cause each such entity to meet specified capital and surplus levels or has guaranteed certain contractual obligations. In connection with the Separation, the April 2017 contribution of entities, mergersSee “— The Company — Liquidity and termination of certain financing arrangements, MetLife, Inc. terminated various support agreements with the captive reinsurance companies merged into Brighthouse Reinsurance Company of Delaware. Upon Separation, MetLife, Inc. terminated a net worth maintenance agreement with BLIC NY in accordance with its terms. See Schedule II included in the 2016 Annual Report for information on these agreements. See also Note 3 of the Notes to the Interim Condensed Consolidated Financial Statements.Capital Uses — Support Agreements.”
In connection with the issuance of $3.0 billion of Brighthouse Financial, Inc. senior notes, MetLife, Inc. had initially guaranteed the senior notes on a senior unsecured basis. The guarantee was released, in accordance with its terms, in connection with consummation of the Separation. See Note 3 of the Notes to the Interim Condensed Consolidated Financial Statements.
Acquisitions
Cash outflows for acquisitions during the nine months ended September 30, 2017 were $211 million. There were no acquisitions by MetLife, Inc. during the nine months ended September 30, 2016.
Adoption of New Accounting Pronouncements
See Note 1 of the Notes to the Interim Condensed Consolidated Financial Statements.
Future Adoption of New Accounting Pronouncements
See Note 1 of the Notes to the Interim Condensed Consolidated Financial Statements.
Non-GAAP and Other Financial Disclosures
In this report, the Company presents certain measures of its performance on a consolidated and segment basis that are not calculated in accordance with GAAP. We believe that these non-GAAP financial measures enhance the understanding for the Company and our investors of our performance by highlighting the results of operations and the underlying profitability drivers of our business. Segment-specific financial measures are calculated using only the portion of consolidated results attributable to that specific segment.
The following non-GAAP financial measures should not be viewed as substitutes for the most directly comparable financial measures calculated in accordance with GAAP:
|
| | | | | | | | | | |
| Non-GAAP financial measures: | Comparable GAAP financial measures: |
| (i) | operatingadjusted premiums, fees and other revenues | (i) | premiums, fees and other revenues |
| (ii) | operating expensesadjusted earnings | (ii) | expensesnet income (loss) |
| (iii) | operating earnings | (iii) | income (loss) from continuing operations, net of income tax |
(iv) | operatingadjusted earnings available to common
shareholders
| (iv)(iii) | net income (loss) available to MetLife, Inc.’s common shareholders |
| (iv) | adjusted net investment income | (iv) | net investment income |
Any of these financial measures shown on a constant currency basis reflect the impact of changes in foreign currency exchange rates and are calculated using the average foreign currency exchange rates for the most recent period and applied to the comparable prior period (“constant currency basis”).
Reconciliations of these non-GAAP financial measures to the most directly comparable historical GAAP financial measures are included in the results of operations, see “— Results of Operations.Operations” and “— Investments.” Reconciliations of these non-GAAP measures to the most directly comparable GAAP measures isare not accessible on a forward-looking basis because we believe it is not possible without unreasonable effortseffort to provide other than a range of net investment gains and losses and net derivative gains and losses, which can fluctuate significantly within or outside the range and from period to period and may have a material impact on net income.
Our definitions of the various non-GAAP and other financial measures discussed in this report may differ from those used by other companies:companies.
OperatingAdjusted earnings and related measures:
operating•adjusted earnings; and
operating•adjusted earnings available to common shareholders.shareholders; and
•adjusted earnings available to common shareholders on a constant currency basis.
These measures are used by management to evaluate performance and allocate resources. Consistent with GAAP guidance for segment reporting, operatingadjusted earnings isand components of, or other financial measures based on, adjusted earnings are also our GAAP measuremeasures of segment performance. OperatingAdjusted earnings and other financial measures based on operatingadjusted earnings are also the measures by which senior management’s and many other employees’ performance is evaluated for the purposes of determining their compensation under applicable compensation plans. OperatingAdjusted earnings and other financial measures based on operatingadjusted earnings allow analysis of our performance relative to our business plan and facilitate comparisons to industry results.
OperatingAdjusted earnings is defined as operatingadjusted revenues less operatingadjusted expenses, both net of income tax. OperatingAdjusted loss is defined as negative adjusted earnings. Adjusted earnings available to common shareholders is defined as operatingadjusted earnings less preferred stock dividends.
Operating For information relating to adjusted revenues and operatingadjusted expenses, see “Financial Measures and Segment Accounting Policies” in Note 2 of the Notes to the Interim Condensed Consolidated Financial Statements.
These financial measures focus on our primary businesses principally by excludingIn addition, adjusted earnings available to common shareholders excludes the impact of market volatility,preferred stock redemption premium, which could distort trends, and revenues and costs related to non-core products and certain entities required to be consolidated under GAAP. Also, these measures exclude results of discontinued operations under GAAP and other businesses that have been or will be sold or exited by MetLife but do not meet the discontinued operations criteria under GAAP and are referred tois reported as divested businesses. Divested businesses also includes the net impact of transactions with exited businesses that have been eliminated in consolidation under GAAP and costs relating to businesses that have been or will be sold or exited by MetLife that do not meet the criteria to be included in results of discontinued operations under GAAP. In addition, for the three months ended March 31, 2016 and the nine months ended September 30, 2016, operating revenues and operating expenses exclude the financial impact of converting the Company’s Japan operations to calendar year-end reporting without retrospective application of this change to prior periods, and is referred to as lag elimination. Operating revenues also excludes net investment gains (losses) and net derivative gains (losses). Operating expenses also excludes goodwill impairments.
The following additional adjustments are made to revenues, in the line items indicated, in calculating operating revenues:
Universal life and investment-type product policy fees excludes the amortization of unearned revenue relateda reduction to net investment gains (losses) and net derivative gains (losses) and certain variable annuity GMIB fees (“GMIB Fees”);
Net investment income: (i) includes earned income on derivatives and amortization of premium on derivatives that are hedges of investments or that are used(loss) available to replicate certain investments, but do not qualify for hedge accounting treatment, (ii) excludes post-tax operating earnings adjustments relating to insurance joint ventures accounted for under the equity method, (iii) excludes certain amounts related to contractholder-directed unit-linked investments and (iv) excludes certain amounts related to securitization entities that are VIEs consolidated under GAAP; and
Other revenues are adjusted for settlements of foreign currency earnings hedges.
The following additional adjustments are made to expenses, in the line items indicated, in calculating operating expenses:
Policyholder benefits and claims and policyholder dividends excludes: (i) changes in the policyholder dividend obligation related to net investment gains (losses) and net derivative gains (losses), (ii) inflation-indexed benefit adjustments associated with contracts backed by inflation-indexed investments and amounts associated with periodic crediting rate adjustments based on the total return of a contractually referenced pool of assets and other pass through adjustments, (iii) benefits and hedging costs related to GMIBs (“GMIB Costs”) and (iv) market value adjustments associated with surrenders or terminations of contracts (“Market Value Adjustments”);
Interest credited to policyholder account balances includes adjustments for earned income on derivatives and amortization of premium on derivatives that are hedges of policyholder account balances but do not qualify for hedge accounting treatment and excludes amounts related to net investment income earned on contractholder-directed unit-linked investments;
Amortization of DAC and VOBA excludes amounts related to: (i) net investment gains (losses) and net derivative gains (losses), (ii) GMIB Fees and GMIB Costs and (iii) Market Value Adjustments;
Amortization of negative VOBA excludes amounts related to Market Value Adjustments;
Interest expense on debt excludes certain amounts related to securitization entities that are VIEs consolidated under GAAP; and
Other expenses excludes costs related to: (i) noncontrolling interests, (ii) implementation of new insurance regulatory requirements, and (iii) acquisition, integration and other costs.
Operating earnings also excludes the recognition of certain contingent assets and liabilities that could not be recognized at acquisition or adjusted for during the measurement period under GAAP business combination accounting guidance.
The tax impact of the adjustments mentioned above are calculated net of the U.S. or foreign statutory tax rate, which could differ from the Company’s effective tax rate. Additionally, the provision for income tax (expense) benefit also includes the impact related to the timing of certain tax credits, as well as certain tax reforms.
MetLife, Inc.’s common shareholders.
Return on equity, allocated equity and related measures:
•Total MetLife, Inc.’s common stockholders’ equity, excluding accumulated other comprehensive income (loss) (“AOCI”) other than foreign currency translation adjustments (“FCTA”), is defined as total MetLife, Inc.’s common stockholders’ equity, excluding the net unrealized investment gains (losses) and defined benefit plans adjustment components of AOCI, net of income tax.
•Adjusted return on MetLife, Inc.’s common stockholders’ equity is defined as operatingadjusted earnings available to common shareholders divided by MetLife, Inc.’s average GAAP common stockholders’ equity.
Operating ROE,•Adjusted return on MetLife, Inc.’s common stockholders’ equity, excluding AOCI other than FCTA, is defined as operatingadjusted earnings available to common shareholders divided by MetLife, Inc.’s average GAAP common stockholders’ equity, excluding AOCI other than FCTA.
•Allocated equity is the portion of MetLife, Inc.’s common stockholders’ equity that management allocates to each of its segments and sub-segments based on local capital requirements and economic capital. See “— Economic Capital.” Allocated equity excludes the impact of AOCI other than FCTA.
The above measures represent a level of equity consistent with the view that, in the ordinary course of business, we do not plan to sell most investments for the sole purpose of realizing gains or losses. Also, refer to the utilization of operatingadjusted earnings and components of, or other financial measures based on, operatingadjusted earnings mentioned above.
Expense ratio and direct expense ratio:
•Expense ratio: other expenses, net of capitalization of DAC, divided by premiums, fees and other revenues.
•Direct expense ratio: adjusted direct expenses divided by adjusted premiums, fees and other revenues. Direct expenses are comprised of employee-related costs, third party staffing costs, and general and administrative expenses.
•Direct expense ratio, excluding total notable items related to direct expenses and pension risk transfers: adjusted direct expenses excluding total notable items related to direct expenses, divided by adjusted premiums, fees and other revenues, excluding pension risk transfers.
The following additional information is relevant to an understanding of our performance results:
The impact of changes in our foreign currency exchange rates is calculated using the average foreign currency exchange rates for the current period and is applied to each of the comparable periods (“Constant Currency Basis”).
•We sometimes refer to sales activity for various products. These sales statistics do not correspond to revenues under GAAP, but are used as relevant measures of business activity. Further, sales statistics for our Latin America, Asia and EMEA segments are on a Constant Currency Basis.constant currency basis.
Asymmetrical•Near-term represents one to three years.
•Notable items reflect the unexpected impact of events that affect the Company’s results, but that were unknown and non-economic accounting refers to: (i)that the portionCompany could not anticipate when it devised its business plan. Notable items also include certain items regardless of net derivative gains (losses) on embedded derivatives attributable to the inclusion of our credit spreadsextent anticipated in the liability valuations, (ii) hedging activity that generates net derivative gains (losses) and creates fluctuations in net income because hedge accounting cannot be achieved and the item being hedged does notbusiness plan, to help investors have a have an offsetting gain or loss recognized in earnings, (iii) inflation-indexed benefit adjustments associated with contracts backed by inflation-indexed investments and amounts associated with periodic crediting rate adjustments based on the total return of a contractually referenced pool of assets and other pass through adjustments, and (iv) impact of changes in foreign currency exchange rates on the re-measurement of foreign denominated unhedged funding agreements and financing transactions to the U.S. dollar and the re-measurement of certain liabilities from non-functional currencies to functional currencies. We believe that excluding the impact of asymmetrical and non-economic accounting from total GAAP results enhances investorbetter understanding of our performance by disclosing how these accounting practices affect reported GAAPMetLife’s results and to evaluate and forecast those results. Notable items represent a positive (negative) impact to adjusted earnings available to common shareholders.
•The Company uses a measure of free cash flow to facilitate an understanding of its ability to generate cash for reinvestment into its businesses or use in non-mandatory capital actions. The Company defines free cash flow as the sum of cash available at MetLife’s holding companies from dividends from operating subsidiaries, expenses and other net flows of the holding companies (including capital contributions to subsidiaries), and net contributions from debt to be at or below target leverage ratios. This measure of free cash flow is prior to capital actions, such as common stock dividends and repurchases, debt reduction and mergers and acquisitions. Free cash flow should not be viewed as a substitute for net cash provided by (used in) operating activities calculated in accordance with GAAP. The free cash flow ratio is typically expressed as a percentage of annual operatingadjusted earnings available to common shareholders.
Subsequent Events
See Note 16 of the Notes to the Interim Condensed Consolidated Financial Statements.
Item 3. Quantitative and Qualitative Disclosures About Market Risk
We regularly analyze our exposure to interest rate, equity market price and foreign currency exchange rate risks. As a result of that analysis, we have determined that the estimated fair values of certain assets and liabilities are materially exposed to changes in interest rates, foreign currency exchange rates and changes in the equity markets. We have exposure to market risk through our insurance operations and investment activities. Our exposure is and will remain elevated due to the COVID-19 Pandemic. See “Management’s Discussion and Analysis of Financial Condition and Results of Operations — Executive Summary — COVID-19 Pandemic.” We use a variety of strategies to manage interest rate, foreign currency exchange rate and equity market risk, including the use of derivatives. A description of our market risk exposures may be found under “Quantitative and Qualitative Disclosures About Market Risk” in Part II, Item 7A, of the 2016 Annual Report. Further see “Item 2. Management’s Discussion and Analysis of Financial Condition and Results of Operations — Executive Summary — Other Key Information — Separation of Brighthouse” for relevant information about the Separation and its results that may have a material effect on our market risk exposures from the market risk exposures previously disclosedincluded in the 20162020 Annual Report.
Item 4. Controls and Procedures
Management, with the participation of the Chief Executive Officer (“CEO”) and Chief Financial Officer,CFO, has evaluated the effectiveness of the design and operation of the Company’s disclosure controls and procedures as defined in Rule 13a-15(e) under the Securities Exchange Act Rule 13a-15(e)of 1934 (“Exchange Act”), as of the end of the period covered by this report. Based on that evaluation, the Chief Executive OfficerCEO and Chief Financial OfficerCFO have concluded that these disclosure controls and procedures are effective.
There were no changes to the Company’s internal control over financial reporting as defined in Exchange Act Rule 13a-15(f) during the quarter ended SeptemberJune 30, 20172021 that have materially affected, or are reasonably likely to materially affect, the Company’s internal control over financial reporting.
Part II — Other Information
Item 1. Legal Proceedings
The following should be read in conjunction with (i) Part I, Item 3, of the 2016 Annual Report; (ii) Part II, Item 1, of MetLife, Inc.’s Quarterly Report on Form 10-Q for the quarter ended March 31, 2017 (the “First Quarter 2017 Report”) and MetLife, Inc.’s Quarterly Report on Form 10-Q for the quarter ended June 30, 2017 (the “Second Quarter 2017 Report”); and (iii)See Note 15 of the Notes to the Interim Condensed Consolidated Financial Statements in Part I of this report.Statements.
Asbestos-Related Claims
MLIC is and has been a defendant in a large number of asbestos-related suits filed primarily in state courts. These suits principally allege that the plaintiff or plaintiffs suffered personal injury resulting from exposure to asbestos and seek both actual and punitive damages.
As reported in the 2016 Annual Report, MLIC received approximately 4,146 asbestos-related claims in 2016. During the nine months ended September 30, 2017 and 2016, MLIC received approximately 2,742 and 3,267 new asbestos-related claims, respectively. See Note 21 of the Notes to the Consolidated Financial Statements included in the 2016 Annual Report for historical information concerning asbestos claims and MLIC’s increase in its recorded liability at December 31, 2014. The number of asbestos cases that may be brought, the aggregate amount of any liability that MLIC may incur, and the total amount paid in settlements in any given year are uncertain and may vary significantly from year to year.
MLIC reevaluates on a quarterly and annual basis its exposure from asbestos litigation, including studying its claims experience, reviewing external literature regarding asbestos claims experience in the United States, assessing relevant trends impacting asbestos liability and considering numerous variables that can affect its asbestos liability exposure on an overall or per claim basis. These variables include bankruptcies of other companies involved in asbestos litigation, legislative and judicial developments, the number of pending claims involving serious disease, the number of new claims filed against it and other defendants and the jurisdictions in which claims are pending. Based upon its regular reevaluation of its exposure from asbestos litigation, MLIC has updated its liability analysis for asbestos-related claims through September 30, 2017.
Regulatory Matters
In the Matter of Chemform, Inc. Site, Pompano Beach, Broward County, Florida
In July 2010, the Environmental Protection Agency (“EPA”) advised MLIC that it believed payments were due under two settlement agreements, known as “Administrative Orders on Consent,” that New England Mutual Life Insurance Company (“New England Mutual”) signed in 1989 and 1992 with respect to the cleanup of a Superfund site in Florida (the “Chemform Site”). The EPA originally contacted MLIC (as successor to New England Mutual) and a third party in 2001, and advised that they owed additional clean-up costs for the Chemform Site. The matter was not resolved at that time. In September 2012, the EPA, MLIC and the third party executed an Administrative Order on Consent under which MLIC and the third party agreed to be responsible for certain environmental testing at the Chemform Site. The EPA may seek additional costs if the environmental testing identifies issues. The EPA and MLIC have reached a settlement in principal on the EPA’s claim for past costs. The Company estimates that the aggregate cost to resolve this matter, including the settlement for claims of past costs and the costs of environmental testing, will not exceed $300 thousand.
Unclaimed Property Litigation
City of Westland Police and Fire Retirement System v. MetLife, Inc., et. al. (S.D.N.Y., filed January 12, 2012)
Seeking to represent a class of persons who purchased MetLife, Inc. common shares between February 2, 2010, and October 6, 2011, the plaintiff alleges that MetLife, Inc. and several current and former directors and executive officers of MetLife, Inc. violated the Securities Act of 1933, as well as the Exchange Act and Rule 10b-5 promulgated thereunder by issuing, or causing MetLife, Inc. to issue, materially false and misleading statements concerning MetLife, Inc.’s potential liability for millions of dollars in insurance benefits that should have been paid to beneficiaries or escheated to the states. Plaintiff seeks unspecified compensatory damages and other relief. On September 22, 2017, the Court granted plaintiff’s motion to certify their proposed class of persons who purchased or acquired MetLife common stock in the Company’s August 3, 2010 Offering or the Company’s March 4, 2011 Offering. The defendants intend to defend this action vigorously.
Total Control Accounts Litigation
MLIC is a defendant in a lawsuit related to its use of retained asset accounts, known as total control accounts (“TCA”), as a settlement option for death benefits.
Owens v. Metropolitan Life Insurance Company (N.D. Ga., filed April 17, 2014)
Plaintiff filed this class action lawsuit on behalf of all persons for whom MLIC established a retained asset account, known as a TCA, to pay death benefits under an ERISA plan. The action alleges that MLIC’s use of the TCA as the settlement option for life insurance benefits under some group life insurance policies violates MLIC’s fiduciary duties under ERISA. As damages, plaintiff seeks disgorgement of profits that MLIC realized on accounts owned by members of the class. In addition, plaintiff, on behalf of a subgroup of the class, seeks interest under Georgia’s delayed settlement interest statute, alleging that the use of the TCA as the settlement option did not constitute payment. On September 27, 2016, the court denied MLIC’s summary judgment motion in full and granted plaintiff’s partial summary judgment motion. On September 29, 2017, the court certified a nationwide class. The court also certified a Georgia subclass. The Company intends to defend this action vigorously.
Diversified Lending Group Litigations
Hartshorne v. MetLife, Inc., et al. (Los Angeles County Superior Court, filed March 25, 2015)
Plaintiffs named MetLife, Inc., MetLife Securities, Inc. (“MSI”), and NELICO in 12 related lawsuits in California state court alleging various causes of action including multiple negligence and statutory claims relating to a Ponzi scheme involving the Diversified Lending Group. In August 2016, a trial of claims by one of the 98 plaintiffs, Christine Ramirez, resulted in a verdict against MetLife, Inc., MSI, and NELICO for approximately $200 thousand in compensatory damages and $15 million in punitive damages. On November 30, 2016, Ramirez consented to the court’s reduction of punitive damages to approximately $7 million. These companies have filed a notice appealing this judgment to the Second Appellate District of the State of California. On May 2, 2017, the court awarded the plaintiff approximately $6.5 million in attorneys’ fees and costs; the Company has appealed this decision. The Company has reached a settlement in principle with 97 of the plaintiffs, including Ramirez.
Other Litigation
Miller, et al. v. MetLife, Inc., et al. (C.D. Cal., filed April 7, 2017)
Plaintiffs filed this putative class action against MetLife, Inc. and MLIC in the U.S. District Court for the Central District of California, purporting to assert claims on behalf of all persons who replaced their MetLife Optional Term Life or Group Universal Life policy for a Group Variable Universal Life policy wherein MetLife allegedly charged smoker rates for certain non-smokers. Plaintiffs seek unspecified compensatory and punitive damages, as well as other relief. On September 25, 2017, Plaintiffs dismissed the action and refiled the complaint in U.S. District Court for the Southern District of New York. The Company intends to defend this action vigorously.
Julian & McKinney v. Metropolitan Life Insurance Company (S.D.N.Y., filed February 9, 2017)
Plaintiffs filed this putative class and collective action on behalf of themselves and all current and former long-term disability (“LTD”) claims specialists between February 2011 and the present for alleged wage and hour violations under the Fair Labor Standards Act, the New York Labor Law, and the Connecticut Minimum Wage Act. The suit alleges that MetLife improperly reclassified the plaintiffs and similarly situated LTD claims specialists from non-exempt to exempt from overtime pay in November 2013. As a result, they and members of the putative class were no longer eligible for overtime pay even though they allege they continued to work more than 40 hours per week. The Company intends to defend this action vigorously.
Summary
Putative or certified class action litigation and other litigation and claims and assessments against the Company, in addition to those discussed previously and those otherwise provided for in the Company’s consolidated financial statements, have arisen in the course of the Company’s business, including, but not limited to, in connection with its activities as an insurer, mortgage lending bank, employer, investor, investment advisor and taxpayer. Further, state insurance regulatory authorities and other federal and state authorities regularly make inquiries and conduct investigations concerning the Company’s compliance with applicable insurance and other laws and regulations.
It is not possible to predict the ultimate outcome of all pending investigations and legal proceedings. In some of the matters referred to previously, very large and/or indeterminate amounts, including punitive and treble damages, are sought. Although in light of these considerations it is possible that an adverse outcome in certain cases could have a material effect upon the Company’s financial position, based on information currently known by the Company’s management, in its opinion, the outcomes of such pending investigations and legal proceedings are not likely to have such an effect. However, given the large and/or indeterminate amounts sought in certain of these matters and the inherent unpredictability of litigation, it is possible that an adverse outcome in certain matters could, from time to time, have a material effect on the Company’s consolidated net income or cash flows in particular quarterly or annual periods.
Item 1A. Risk Factors
The following should be read in conjunction with, and supplements and amends, theCertain factors that may affect the Company’s business or operations are described under “Risk Factors” in Part I, Item 1A, of the 20162020 Annual Report, as amended or supplemented by the information under “Risk Factors” in Part II, Item 1A, of MetLife, Inc.’s Quarterly Report on Form 10-Q for the quarter ended March 31, 2017 (the “First Quarter 2017 Report”) and MetLife, Inc.’s Quarterly Report on Form 10-Q for the quarter ended June 30, 2017 (the “Second Quarter 2017 Report”). Other than as described in this Item 1A, thereReport. There have been no other material changes to our risk factors from the risk factors previously disclosed in the 2016 Annual Report as amended or supplemented by such information in the First Quarter 2017 Report and the Second Quarter 2017 Report.
Risks Related to Our Business
The following updates and replaces the similar paragraphs of the risk factors entitled “An Inability to Access Our Credit Facility Could Result in a Reduction in Our Liquidity and Lead to Downgrades in Our Credit and Financial Strength Ratings” and“Differences Between Actual Claims Experience and Underwriting and Reserving Assumptions May Adversely Affect Our Financial Results” included in the 2016 Annual Report.
An Inability to Access Our Credit Facility Could Result in a Reduction in Our Liquidity and Lead to Downgrades in Our Credit and Financial Strength Ratings
We rely on our unsecured credit facility maintained by MetLife, Inc. and MetLife Funding, an indirect wholly-owned subsidiary of MetLife, Inc. (the “Credit Facility”), as a potential source of liquidity. The availability of this Credit Facility, which was $4.0 billion at June 30, 2017 but which decreased to $3.0 billion upon the completion of the Separation, could be critical to our credit and financial strength ratings and our ability to meet our obligations as they come due in a market when alternative sources of credit are tight. The Credit Facility contains certain administrative, reporting, legal and financial covenants, including a requirement to maintain a specified minimum consolidated net worth. See “Management’s Discussion and Analysis of Financial Condition and Results of Operations — Liquidity and Capital Resources — The Company — Liquidity and Capital Sources — Global Funding Sources — Credit and Committed Facilities” and Note 12 of the Notes to Consolidated Financial Statements included in the 20162020 Annual Report.
***
Differences Between Actual Claims Experience and Underwriting and Reserving Assumptions May Adversely Affect Our Financial Results
***
Due to the nature of the underlying risks and the uncertainty associated with the determination of liabilities for future policy benefits and claims, we cannot determine precisely the amounts which we will ultimately pay to settle our liabilities. Such amounts may vary from the estimated amounts, particularly when those payments may not occur until well into the future. We evaluate our liabilities periodically based on accounting requirements, which change from time to time, the assumptions used to establish the liabilities, as well as our actual experience. Reserve estimates in some instances are affected by our operating practices and procedures that are used, among other things, to support our assumptions with respect to the Company’s obligations to its policyholders and contractholders. To the extent that these practices and procedures do not accurately produce the data to support our assumptions our reserves may require adjustment. If the liabilities originally established for future benefit payments prove inadequate, we must increase them and/or reduce associated DAC and/or VOBA. Such adjustments could affect earnings negatively and have a material adverse effect on our business, results of operations and financial condition. See “Management’s Discussion and Analysis of Financial Condition and Results of Operations — Policyholder Liabilities,” as well as “Business — Policyholder Liabilities” and “Management’s Discussion and Analysis of Financial Condition and Results of Operations — Policyholder Liabilities” included in the 2016 Annual Report. See also “Management’s Discussion and Analysis of Financial Condition and Results of Operations — Results of Operations — Consolidated Results — Three Months Ended September 30, 2017 Compared with the Three Months Ended September 30, 2016 — Actuarial Assumption Review,” as well as “Management’s Discussion and Analysis of Financial Condition and Results of Operations — Summary of Critical Accounting Estimates — Deferred Policy Acquisition Costs and Value of Business Acquired” and “Management’s Discussion and Analysis of Financial Condition and Results of Operations — Summary of Critical Accounting Estimates — Derivatives” included in the 2016 Annual Report for further information regarding the manner in which policyholder behavior and other events may differ from our assumptions and, thereby affect our financial results.
Capital-Related Risks
The following updates and replaces the similar paragraphs of the risk factor entitled “Legal and Regulatory Restrictions and Uncertainty and Restrictions Under the Terms of Certain of Our Securities May Prevent Us from Repurchasing Our Stock and Paying Dividends at the Level We Wish” included in the 2016 Annual Report.
Legal and Regulatory Restrictions and Uncertainty and Restrictions Under the Terms of Certain of Our Securities May Prevent Us from Repurchasing Our Stock and Paying Dividends at the Level We Wish
***
Trigger Events for the Restrictions on the Payment of Dividends on Our Preferred Stock and Restrictions on the Payment of Interest on Our Junior Subordinated Debentures
In addition, the preferred stock and the junior subordinated debentures contain provisions that would automatically suspend the payment of preferred stock dividends and interest on junior subordinated debentures if MetLife, Inc. fails to meet certain tests (“Trigger Events”). In such cases, and subject to the terms of the instruments, MetLife, Inc. could make payments up to the amount of net proceeds from sales of (i) common stock during the 90 days preceding the dividend declaration date or (ii) common stock or certain kinds of warrants to purchase common stock generally during the 180 days prior to the interest payment date (the “New Equity Proceeds”). If the New Equity Proceeds were insufficient to make such payments, the “dividend stopper” provisions would come into effect and we would be unable to repurchase or pay dividends on our common stock.
A “Trigger Event” would occur if:
the risk-based capital ratio of MetLife’s largest U.S. insurance subsidiaries in the aggregate (as defined in the applicable instrument) were to be less than 175% of the company action level based on the subsidiaries’ prior year annual financial statements filed (generally around March 1) with state insurance commissioners; or
at the end of a quarter (“Final Quarter End Test Date”), consolidated GAAP net income for the four-quarter period ending two quarters before such quarter-end (the “Preliminary Quarter End Test Date”) is zero or a negative amount and the consolidated GAAP stockholders’ equity, minus AOCI (the “adjusted stockholders’ equity amount”), as of the Final Quarter End Test Date and the Preliminary Quarter End Test Date, declined by 10% or more from (A) its level 10 quarters before the Final Quarter End Test Date (the “Benchmark Quarter End Test Date”), for Benchmark Quarter End Test Dates after August 4, 2017 (the date of the Separation), or (B) $49,282,000,000, the consolidated GAAP stockholders’ equity, minus AOCI as of June 30, 2017 as reported on a pro forma basis reflecting the Separation in MetLife’s Form 8-K filed with the Securities and Exchange Commission on August 9, 2017, for Benchmark Quarter End Test Dates prior to August 4, 2017.
The Trigger Event would continue until there is no longer a Trigger Event at the specified time, and the adjusted stockholders’ equity amount is no longer 10% or more below its level at each Benchmark Quarter End Test Date that is associated with a “Trigger Event.”
Item 2. Unregistered Sales of Equity Securities and Use of Proceeds
Issuer Purchases of Equity Securities
Purchases of MetLife, Inc. common stock made by or on behalf of MetLife, Inc. or its affiliates during the quarter ended SeptemberJune 30, 20172021 are set forth below:
|
| | | | | | | | | | | | | | |
| Period | | Total Number
of Shares Purchased (1) | | Average Price Paid per Share | | Total Number
of Shares
Purchased as Part
of Publicly
Announced Plans
or Programs (2) | | Maximum Number
(or Approximate
Dollar Value) of
Shares that May Yet
Be Purchased Under the
Plans or Programs (3) |
| July 1 — July 31, 2017 | | 892,524 |
| | $ | 55.24 |
| | 892,524 |
| | $ | 838,739,268 |
|
| August 1 — August 31, 2017 | | 2,850,391 |
| | $ | 47.22 |
| | 2,850,391 |
| | $ | 704,141,933 |
|
| September 1 — September 30, 2017 | | 6,642,509 |
| | $ | 48.34 |
| | 6,639,743 |
| | $ | 383,192,714 |
|
| | | | | | | | | | | | | | | | | | | | | | | | | | |
| Period | | Total Number
of Shares Purchased (1) | | Average Price Paid per Share | | Total Number
of Shares
Purchased as Part
of Publicly
Announced Plans
or Programs | | Maximum Number
(or Approximate
Dollar Value) of
Shares that May Yet
Be Purchased Under the
Plans or Programs (2) |
| April 1 — April 30, 2021 | | 3,052,063 | | | $ | 62.26 | | | 3,051,588 | | | $ | 1,645,046,022 | |
| May 1 — May 31, 2021 | | 5,237,981 | | | $ | 64.91 | | | 5,237,981 | | | $ | 1,305,047,439 | |
| June 1 — June 30, 2021 | | 9,315,096 | | | $ | 62.55 | | | 9,312,721 | | | $ | 722,548,342 | |
| Total | | 17,605,140 | | | | | 17,602,290 | | | |
__________________
| |
(1) | Except for the foregoing, there were no shares of MetLife, Inc. common stock repurchased by MetLife, Inc. During the periods July 1 through July 31, 2017, August 1 through August 31, 2017 and September 1 through September 30, 2017, separate account index funds purchased 0 shares, 0 shares and 2,766 shares, respectively, of MetLife, Inc. common stock on the open market in nondiscretionary transactions. |
| |
(2) | MetLife, Inc. repurchased 10,382,658 shares of common stock for $505 million during the three months ended September 30, 2017. Also during the three months ended September 30, 2017, there was a $10 million reduction in treasury stock as a result of the Separation. These transactions are reflected on the Interim Condensed Consolidated Statement of Equity for the nine months ended September 30, 2017. See Note 3 of the Notes to the Interim Condensed Consolidated Financial Statements for information on the Separation. |
| |
(3) | At September 30, 2017, MetLife, Inc. had $383 million of common stock repurchases remaining under the authorization approved by its Board. On November 1, 2017, MetLife, Inc. announced that its Board approved an additional $2.0 billion authorization for MetLife, Inc. to repurchase its common stock. For more information on common stock repurchases, see “Management’s Discussion and Analysis of Financial Condition and Results of Operations — Liquidity and Capital Resources — The Company — Liquidity and Capital Uses — Common Stock Repurchases,” “Risk Factors — Capital-Related Risks — Legal and Regulatory Restrictions and Uncertainty and Restrictions Under the Terms of Certain of Our Securities May Prevent Us from Repurchasing Our Stock and Paying Dividends at the Level We Wish” included in the 2016 Annual Report, as updated in “Risk Factors — Capital-Related Risks” herein and Note 16 of the Notes to the Consolidated Financial Statements included in the 2016 Annual Report. |
(1)During the periods April 1 through April 30, 2021, May 1 through May 31, 2021 and June 1 through June 30, 2021, separate account index funds purchased 475 shares, 0 shares and 2,375 shares, respectively, of MetLife, Inc. common stock on the open market in non-discretionary transactions.
(2)In December 2020, MetLife, Inc. announced that its Board of Directors authorized $3.0 billion of common stock repurchases. At June 30, 2021, MetLife, Inc. had $723 million of common stock repurchases remaining under the authorization. On August 4, 2021, MetLife, Inc. announced that its Board of Directors authorized an additional $3.0 billion of common stock repurchases. For more information on common stock repurchases, see “Management’s Discussion and Analysis of Financial Condition and Results of Operations — Liquidity and Capital Resources — The Company — Liquidity and Capital Uses — Common Stock Repurchases.” See also “Risk Factors — Capital Risks — We May not be Able to Pay Dividends or Repurchase Our Stock Due to Legal and Regulatory Restrictions or Cash Buffer Needs” and Note 16 of the Notes to the Consolidated Financial Statements included in the 2020 Annual Report.
Purchases of MetLife, Inc. preferred stock made by or on behalf of MetLife, Inc. or its affiliates during the quarter ended June 30, 2021 are set forth below:
| | | | | | | | | | | | | | | | | | | | | | | | | | |
| Period | | Total Number
of Shares Purchased (1) | | Average Price Paid per Share | | Total Number
of Shares
Purchased as Part
of Publicly
Announced Plans
or Programs | | Maximum Number
(or Approximate
Dollar Value) of
Shares that May Yet
Be Purchased Under the
Plans or Programs |
| April 1 — April 30, 2021 | | — | | | $ | — | | | — | | | $ | — | |
| May 1 — May 31, 2021 | | — | | | $ | — | | | — | | | $ | — | |
| June 1 — June 30, 2021 | | 500,000 | | | $ | 1,000.00 | | | 500,000 | | | $ | — | |
| Total | | 500,000 | | | | | 500,000 | | | |
__________________
(1)In May 2021, MetLife, Inc. delivered a notice of redemption to the holders of MetLife, Inc.’s Series C preferred stock pursuant to which it would redeem the remaining 500,000 shares of Series C preferred stock at a redemption price of $1,000 per share. In June 2021, MetLife, Inc. redeemed and canceled 500,000 shares of Series C preferred stock for an aggregate redemption price of $500 million in cash. See Note 10 of the Notes to the Interim Condensed Consolidated Financial Statements.
Item 6. Exhibits
(Note Regarding Reliance on Statements in Our Contracts:In reviewing the agreements included as exhibits to this Quarterly Report on Form 10-Q, please remember that they are included to provide you with information regarding their terms and are not intended to provide any other factual or disclosure information about MetLife, Inc., its subsidiaries or affiliates, or the other parties to the agreements. The agreements contain representations and warranties by each of the parties to the applicable agreement. These representations and warranties have been made solely for the benefit of the other parties to the applicable agreement and (i) should not in all instances be treated as categorical statements of fact, but rather as a way of allocating the risk to one of the parties if those statements prove to be inaccurate; (ii) have been qualified by disclosures that were made to the other party in connection with the negotiation of the applicable agreement, which disclosures are not necessarily reflected in the agreement; (iii) may apply standards of materiality in a way that is different from what may be viewed as material to investors; and (iv) were made only as of the date of the applicable agreement or such other date or dates as may be specified in the agreement and are subject to more recent developments. Accordingly, these representations and warranties may not describe the actual state of affairs as of the date they were made or at any other time. Additional information about MetLife, Inc., its subsidiaries and affiliates may be found elsewhere in this Quarterly Report on Form 10-Q and MetLife, Inc.’s other public filings, which are available without charge through the U.S. Securities and Exchange Commission website at www.sec.gov.)
| | | | | | | | | | | | | | | | | | | | | | | | | | | | | | | | | | | | | | |
| | | | Incorporated by Reference | | |
| Exhibit No. | | Description | | Form | | File Number | | Exhibit | | Filing Date | | Filed or Furnished Herewith |
| | | | | | | | | | | | |
| | | | | | | | | | | | |
| | | | | | | | | | | | |
| | | | | | | | | | | | |
| | | | | | | | | | | | |
| | | | | | | | | | | | |
| | | | | | | | | | | | |
| | | | | | | | | | | | |
| | | | | | | | | | | | |
| | | | | | | | | | | | |
| | | | | | | | | | | | |
| | | | | | | | | | | | |
| | | | | | | | | | | | |
| | | | | | | | | | | | |
| | | | | | | | | | | | |
| | | | | | | | | | | | |
| | | | | | | | | | | | |
| | | | | | | | | | | | |
| | | | | | | | | | | | |
| 3.1.1 | | | | 10-K | | 001-15787 | | 3.1 | | March 1, 2017 | | |
| | | | | | | | | | | | |
| 3.1.2 | | | | 10-Q | | 001-15787 | | 3.6 | | November 7, 2013 | | |
| | | | | | | | | | | | |
| 3.1.3 | | | | 8-K | | 001-15787 | | 3.1 | | April 30, 2015 | | |
| | | | | | | | | | | | |
| 3.1.4 | | | | 8-K | | 001-15787 | | 3.1 | | June 29, 2021 | | |
| | | | | | | | | | | | |
| 3.1.5 | | | | 10-Q | | 001-15787 | | 3.7 | | November 5, 2015 | | |
| | | | | | | | | | | | |
| 3.1.6 | | | | 10-K | | 001-15787 | | 3.4 | | March 1, 2017 | | |
| | | | | | | | | | | | |
| 3.1.7 | | | | 10-K | | 001-15787 | | 3.2 | | March 1, 2017 | | |
| | | | | | | | | | | | |
| 3.1.8 | | | | 10-K | | 001-15787 | | 3.3 | | March 1, 2017 | | |
| | | | | | | | | | | | |
| 3.1.9 | | | | 8-K | | 001-15787 | | 3.1 | | October 24, 2017 | | |
| | | | | | | | | | | | |
| 3.1.10 | | | | 8-K | | 001-15787 | | 3.1 | | March 22, 2018 | | |
| | | | | | | | | | | | |
| 3.1.11 | | | | 8-K | | 001-15787 | | 3.1 | | June 4, 2018 | | |
| | | | | | | | | | | | |
| 3.1.12 | | | | 8-K | | 001-15787 | | 3.1 | | January 9, 2020 | | |
| | | | | | | | | | | | |
|
| | | | | | | | | | | | |
| |
|
| Incorporated by Reference |
|
|
| Exhibit No. |
| Description |
| Form |
| File Number |
| Exhibit |
| Filing Date |
| Filed or Furnished Herewith |
|
|
|
|
|
|
|
|
|
|
|
|
|
| 3.1 | | | | 10-K | | 001-15787 | | 3.1 | | March 1, 2017 | | |
| 3.2 | | | | 10-K | | 001-15787 | | 3.2 | | March 1, 2017 | | |
| 3.3 | | | | 10-K | | 001-15787 | | 3.3 | | March 1, 2017 | | |
| 3.4 | | | | 10-K | | 001-15787 | | 3.4 | | March 1, 2017 | | |
| 3.5 | | | | 10-K | | 001-15787 | | 3.6 | | March 1, 2017 | | |
| 3.6 | | | | 8-K | | 001-15787 | | 3.1 | | April 30, 2015 | | |
| 3.7 | | | | 8-K | | 001-15787 | | 3.1 | | May 28, 2015 | | |
| 3.8 | | | | 10-Q | | 001-15787 | | 3.7 | | November 5, 2015 | | |
| 3.9 | | | | 8-K | | 001-15787 | | 3.1 | | October 24, 2017 | | |
| 4.1 | | Certificate of Amendment of Amended and Restated Certificate of Incorporation of MetLife, Inc., dated October 23, 2017 (See Exhibit 3.9 above). | | | | | | | | | | |
| | | Certain instruments defining the rights of holders of long-term debt of MetLife, Inc. and its consolidated subsidiaries are omitted pursuant to Item 601(b)(4)(iii) of Regulation S-K. MetLife, Inc. hereby agrees to furnish to the Securities and Exchange Commission, upon request, copies of such instruments. | | | | | | | | | | |
| 10.1 | | | | | | | | | | | | X |
| | | | | | | | | | | | | | | | | | | | | | | | | | | | | | | | | | | | | | |
| 3.1.13 | | | | 8-K | | 001-15787 | | 3.1 | | September 10, 2020 | | |
| | | | | | | | | | | | |
| 31.1 | | | | | | | | | | | | X |
| | | | | | | | | | | | |
| 31.2 | | | | | | | | | | | | X |
| | | | | | | | | | | | |
| 32.1 | | | | | | | | | | | | X |
| | | | | | | | | | | | |
| 32.2 | | | | | | | | | | | | X |
| | | | | | | | | | | | |
| 101.SCH | | Inline XBRL Taxonomy Extension Schema Document. | | | | | | | | | | X |
| | | | | | | | | | | | |
| 101.CAL | | Inline XBRL Taxonomy Extension Calculation Linkbase Document | | | | | | | | | | X |
| | | | | | | | | | | | |
| 101.DEF | | Inline XBRL Taxonomy Extension Definition Linkbase Document | | | | | | | | | | X |
| | | | | | | | | | | | |
| 101.LAB | | Inline XBRL Taxonomy Extension Label Linkbase Document | | | | | | | | | | X |
| | | | | | | | | | | | |
| 101.PRE | | Inline XBRL Taxonomy Extension Presentation Linkbase Document. | | | | | | | | | | X |
| | | | | | | | | | | | |
| 101.INS | | XBRL Instance Document - the instance document does not appear in the Interactive Data file because its XBRL tags are embedded within the Inline XBRL document. | | | | | | | | | | X |
| | | | | | | | | | | | |
| 104 | | Cover Page Interactive Data File (embedded within the Inline XBRL document and included in Exhibit 101).
| | | | | | | | | | X |
|
| | | | | | | | | | | | |
| | | | | Incorporated by Reference | | |
| Exhibit No. | | Description | | Form | | File Number | | Exhibit | | Filing Date | | Filed or Furnished Herewith |
| | | | | | | | | | | | | |
| 10.2 | | | | | | | | | | | | X |
| 10.3 | | | | | | | | | | | | X |
| 10.4 | | | | | | | | | | | | X |
| 10.5 | | | | | | | | | | | | X |
| 10.6 | | | | | | | | | | | | X |
| 10.7 | | | | 10-Q | | 001-15787 | | 10.1 | | August 5, 2016 | | |
| 10.8 | | | | 10-K | | 001-15787 | | 10.15 | | February 25, 2016 | | |
| 31.1 | | | | | | | | | | | | X |
| 31.2 | | | | | | | | | | | | X |
| 32.1 | | | | | | | | | | | | X |
| 32.2 | | | | | | | | | | | | X |
| 101.INS | | XBRL Instance Document. | | | | | | | | | | X |
| 101.SCH | | XBRL Taxonomy Extension Schema Document. | | | | | | | | | | X |
| 101.CAL | | XBRL Taxonomy Extension Calculation Linkbase Document. | | | | | | | | | | X |
| 101.LAB | | XBRL Taxonomy Extension Label Linkbase Document. | | | | | | | | | | X |
| 101.PRE | | XBRL Taxonomy Extension Presentation Linkbase Document. | | | | | | | | | | X |
| 101.DEF | | XBRL Taxonomy Extension Definition Linkbase Document. | | | | | | | | | | X |
______________
*Indicates management contracts or compensatory plans or arrangements.
Signatures
Pursuant to the requirements of the Securities Exchange Act of 1934, the registrant has duly caused this report to be signed on its behalf by the undersigned thereunto duly authorized.
| | | | | | | | |
| METLIFE, INC. |
| | |
METLIFE, INC.By: | | /s/ Tamara L. Schock |
| | |
By: | | /s/ William O’Donnell |
| | Name: William O’DonnellTamara L. Schock Title: Executive Vice President and Chief Accounting Officer (Authorized Signatory and Principal Accounting Officer) |
Date: November 6, 2017
August 5, 2021