UNITED STATES
SECURITIES AND EXCHANGE COMMISSION
Washington, D.C. 20549
FORM 10-Q
(Mark One)
| | |
| | |
| | |
[ ✓ ] | QUARTERLY REPORT PURSUANT TO SECTION 13 OR 15(d) OF THE SECURITIES EXCHANGE ACT OF 1934 | |
| | |
| For the quarterly period ended | March 31, |
| | |
[ ] | TRANSITION REPORT PURSUANT TO SECTION 13 OR 15(d) OF THE SECURITIES EXCHANGE ACT OF 1934 | |
| | |
| For the transition period from ________________ to _________________ |
Commission File Number 000-28304
PROVIDENT FINANCIAL HOLDINGS, INC.
(Exact name of registrant as specified in its charter)
Delaware | 33-0704889 |
(State or other jurisdiction of | (I.R.S. Employer |
3756 Central Avenue, Riverside, California 92506
(Address of principal executive offices and zip code)
(951) 686-6060
(Registrant’s telephone number, including area code)
_________________________________________________________
(Former name, former address and former fiscal year, if changed since last report)
Securities registered pursuant to Section 12(b) of the Act:
| | |
Title of each class | Trading Symbol(s) | Name of each exchange on which registered |
Common stock, par value $0.01 per share | PROV | The NASDAQ Stock Market LLC |
Indicate by check mark whether the registrant (1) has filed all reports required to be filed by Section 13 or 15(d) of the Securities Exchange Act of 1934 during the preceding 12 months (or for such shorter period that the registrant was required to file such reports), and (2) has been subject to such filing requirements for the past 90 days. ⌧ Yes ◻ No
Indicate by check mark whether the registrant has submitted electronically every Interactive Data File required to be submitted pursuant to Rule 405 of Regulation S-T (§232.405 of this chapter) during the preceding 12 months (or for such shorter period that the registrant was required to submit such files). ⌧ Yes ◻ No
Indicate by check mark whether the registrant is a large accelerated filer, an accelerated filer, a non-accelerated filer, smaller reporting company, or an emerging growth company. See the definitions of “large accelerated filer,” “accelerated filer,” “smaller reporting company,” and “emerging growth company” in Rule 12b-2 of the Exchange Act.
Large accelerated filer ◻ | Accelerated filer ◻ |
Non-accelerated filer ⌧ | Smaller reporting company ⌧ |
| Emerging growth company ◻ |
If an emerging growth company, indicate by check mark if the registrant has elected not to use the extended transition period for complying with any new or revised financial accounting standards provided pursuant to Section 13(a) of the Exchange Act ◻
Indicate by check mark whether the registrant is a shell company (as defined in Rule 12b-2 of the Exchange Act).
◻ Yes ⌧ No
APPLICABLE ONLY TO CORPORATE ISSUERS
Indicate the number of shares outstanding of each of the issuer’s classes of common stock, as of the latest practicable date. As of April 30, 2023,2024, there were 7,022,6586,877,946 shares of the registrant's common stock, $0.01 par value per share, outstanding.
PROVIDENT FINANCIAL HOLDINGS, INC.
Table of Contents
PART 1 - | FINANCIAL INFORMATION | Page | |
| | | |
ITEM 1 - | Financial Statements. The Unaudited Interim Condensed Consolidated Financial Statements of | ||
| | | |
| 1 | ||
| 2 | ||
| 3 | ||
| 4 | ||
| 6 | ||
| Notes to Unaudited Interim Condensed Consolidated Financial Statements | 7 | |
| | | |
Management’s Discussion and Analysis of Financial Condition and Results of Operations: | |||
| | | |
|
| ||
|
| ||
|
| ||
|
| ||
|
| ||
| Comparison of Financial Condition at March 31, |
| |
|
| ||
|
| ||
|
| ||
|
| ||
|
| ||
| | | |
| |||
| | | |
| |||
| | | |
| | | |
| |||
| |||
| |||
| |||
| |||
| |||
| |||
| | | |
|
PROVIDENT FINANCIAL HOLDINGS, INC.
Condensed Consolidated Statements of Financial Condition
(Unaudited)
In Thousands, Except Share and Per Share Information
| | | | | | | | | | | | |
| | March 31, | | June 30, | | March 31, | | June 30, | ||||
| | 2023 |
| 2022 | | 2024 |
| 2023 | ||||
Assets | | | | | | | | | | | | |
Cash and cash equivalents | | $ | 60,771 | | $ | 23,414 | | $ | 51,731 | | $ | 65,849 |
Investment securities - held to maturity, at cost | |
| 161,336 | |
| 185,745 | ||||||
Investment securities - available for sale, at fair value | |
| 2,251 | |
| 2,676 | ||||||
Loans held for investment, net of allowance for loan losses $6,001 and $5,564, respectively; includes $1,352 and $1,396 of loans held at fair value, respectively | |
| 1,077,704 | |
| 939,992 | ||||||
Investment securities - held to maturity, at cost with no allowance for credit losses | |
| 135,971 | |
| 154,337 | ||||||
Investment securities - available for sale, at fair value with no allowance for credit losses | |
| 1,935 | |
| 2,155 | ||||||
Loans held for investment, net of allowance for credit losses of $7,108 and $5,946, respectively; includes $1,054 and $1,312 of loans held at fair value, respectively; $872.5 million and $967.6 million pledged to Federal Home Loan Bank ("FHLB") - San Francisco, respectively; $104.5 million and $0 pledged to Federal Reserve Bank ("FRB") - San Francisco, respectively | |
| 1,065,761 | |
| 1,077,629 | ||||||
Accrued interest receivable | |
| 3,610 | |
| 2,966 | |
| 4,249 | |
| 3,711 |
Federal Home Loan Bank (“FHLB”) - San Francisco stock | |
| 8,239 | |
| 8,239 | ||||||
FHLB - San Francisco stock | |
| 9,505 | |
| 9,505 | ||||||
Premises and equipment, net | |
| 9,193 | |
| 8,826 | |
| 9,637 | |
| 9,231 |
Prepaid expenses and other assets | |
| 12,176 | |
| 15,180 | |
| 11,258 | |
| 10,531 |
| |
| | |
| | |
| | |
| |
Total assets | | $ | 1,335,280 | | $ | 1,187,038 | | $ | 1,290,047 | | $ | 1,332,948 |
| |
| | |
| | |
| | |
| |
Liabilities and Stockholders’ Equity | |
| | |
| | |
| | |
| |
| |
| | |
| | |
| | |
| |
Liabilities: | |
| | |
| | |
| | |
| |
Non interest-bearing deposits | | $ | 108,479 | | $ | 125,089 | ||||||
Noninterest-bearing deposits | | $ | 91,708 | | $ | 103,007 | ||||||
Interest-bearing deposits | |
| 874,567 | |
| 830,415 | |
| 816,414 | |
| 847,564 |
Total deposits | |
| 983,046 | |
| 955,504 | |
| 908,122 | |
| 950,571 |
| |
| | |
| | |
| | |
| |
Borrowings | |
| 205,010 | |
| 85,000 | |
| 235,000 | |
| 235,009 |
Accounts payable, accrued interest and other liabilities | |
| 17,818 | |
| 17,884 | |
| 17,419 | |
| 17,681 |
Total liabilities | |
| 1,205,874 | |
| 1,058,388 | |
| 1,160,541 | |
| 1,203,261 |
| |
| | |
| | |
| | |
| |
Commitments and Contingencies | |
| | |
| | |
| | |
| |
| |
| | |
| | |
| | |
| |
Stockholders’ equity: | |
| | |
| | |
| | |
| |
Preferred stock, $0.01 par value (2,000,000 shares authorized; none issued and outstanding) | |
| — | |
| — | |
| — | |
| — |
Common stock, $.01 par value; (40,000,000 and 40,000,000 shares authorized; 18,229,615 and 18,229,615 shares issued respectively; 7,033,963 and 7,285,184 outstanding, respectively) | |
| 183 | |
| 183 | ||||||
Common stock, $0.01 par value, (40,000,000 and 40,000,000 shares authorized, 18,229,615 and 18,229,615 shares issued, and 6,896,297 and 7,043,170 outstanding, respectively) | |
| 183 | |
| 183 | ||||||
Additional paid-in capital | |
| 98,962 | |
| 98,826 | |
| 99,591 | |
| 99,505 |
Retained earnings | |
| 206,449 | |
| 202,680 | |
| 208,923 | |
| 207,274 |
Treasury stock at cost (11,195,652 and 10,944,431 shares, respectively) | |
| (176,163) | |
| (173,041) | ||||||
Accumulated other comprehensive (loss) income, net of tax | |
| (25) | |
| 2 | ||||||
Treasury stock at cost (11,333,318 and 11,186,445 shares, respectively) | |
| (179,183) | |
| (177,237) | ||||||
Accumulated other comprehensive loss, net of tax | |
| (8) | |
| (38) | ||||||
| |
| | |
| | |
| | |
| |
Total stockholders’ equity | |
| 129,406 | |
| 128,650 | |
| 129,506 | |
| 129,687 |
| |
| | |
| | |
| | |
| |
Total liabilities and stockholders’ equity | | $ | 1,335,280 | | $ | 1,187,038 | | $ | 1,290,047 | | $ | 1,332,948 |
The accompanying notes are an integral part of these condensed consolidated financial statements.
1
PROVIDENT FINANCIAL HOLDINGS, INC.
Condensed Consolidated Statements of Operations
(Unaudited)
In Thousands, Except Per Share Information
| | | | | | | | | | | | | | | | | | | | | | | | | | |
| | Quarter Ended | | Nine Months Ended | | | Quarter Ended | | Nine Months Ended | | ||||||||||||||||
| | March 31, | | March 31, | | | March 31, | | March 31, | | ||||||||||||||||
|
| 2023 | | 2022 |
| 2023 | | 2022 |
|
| 2024 | | 2023 |
| 2024 | | 2023 |
| ||||||||
Interest income: | | | | | |
| | | | | |
| | | | | | |
| | | | | |
| |
Loans receivable, net | | $ | 11,028 |
| $ | 7,581 | | $ | 30,365 |
| $ | 23,676 | | | $ | 12,683 |
| $ | 11,028 | | $ | 37,368 |
| $ | 30,365 | |
Investment securities | |
| 548 |
|
| 515 | |
| 1,632 |
|
| 1,366 | | |
| 517 |
|
| 548 | |
| 1,565 |
|
| 1,632 | |
FHLB - San Francisco stock | |
| 146 |
|
| 123 | |
| 414 |
|
| 368 | | |
| 210 |
|
| 146 | |
| 586 |
|
| 414 | |
Interest-earning deposits | |
| 286 |
|
| 39 | |
| 666 |
|
| 105 | | |
| 397 |
|
| 286 | |
| 1,295 |
|
| 666 | |
Total interest income | |
| 12,008 |
|
| 8,258 | |
| 33,077 |
|
| 25,515 | | |
| 13,807 |
|
| 12,008 | |
| 40,814 |
|
| 33,077 | |
| | | | |
| | | | | |
| | | | | | |
| | | | | |
| | |
Interest expense: | | | | |
| | | | | |
| | | | | | |
| | | | | |
| | |
Checking and money market deposits | | | 56 | | | 54 | | | 177 | | | 169 | | | | 90 | | | 56 | | | 219 | | | 177 | |
Savings deposits | | | 42 | | | 42 | | | 130 | | | 128 | | | | 97 | | | 42 | | | 208 | | | 130 | |
Time deposits | | | 781 | | | 178 | | | 1,364 | | | 592 | | | | 2,488 | | | 781 | | | 6,406 | | | 1,364 | |
Borrowings | |
| 1,728 |
|
| 446 | |
| 3,655 |
|
| 1,537 | | |
| 2,573 |
|
| 1,728 | |
| 7,509 |
|
| 3,655 | |
Total interest expense | |
| 2,607 |
|
| 720 | |
| 5,326 |
|
| 2,426 | | |
| 5,248 |
|
| 2,607 | |
| 14,342 |
|
| 5,326 | |
| | | | |
| | | | | |
| | | | | | |
| | | | | |
| | |
Net interest income | |
| 9,401 |
|
| 7,538 | |
| 27,751 |
|
| 23,089 | | |
| 8,559 |
|
| 9,401 | |
| 26,472 |
|
| 27,751 | |
Provision (recovery) for loan losses | |
| 169 |
|
| (645) | |
| 430 |
|
| (2,051) | | |||||||||||||
Net interest income, after provision (recovery) for loan losses | |
| 9,232 |
|
| 8,183 | |
| 27,321 |
|
| 25,140 | | |||||||||||||
Provision for (recovery of) credit losses | |
| 124 |
|
| 169 | |
| (51) |
|
| 430 | | |||||||||||||
Net interest income, after provision for (recovery of) credit losses | |
| 8,435 |
|
| 9,232 | |
| 26,523 |
|
| 27,321 | | |||||||||||||
| | | | |
| | | | | |
| | | | | | |
| | | | | |
| | |
Non-interest income: | | | | |
| | | | | |
| | | | | | |
| | | | | |
| | |
Loan servicing and other fees | |
| 104 |
|
| 237 | |
| 327 |
|
| 867 | | |
| 92 |
|
| 104 | |
| 195 |
|
| 327 | |
Deposit account fees | |
| 328 |
|
| 329 | |
| 998 |
|
| 966 | | |
| 289 |
|
| 328 | |
| 876 |
|
| 998 | |
Card and processing fees | |
| 361 |
|
| 378 | |
| 1,109 |
|
| 1,182 | | |
| 317 |
|
| 361 | |
| 1,003 |
|
| 1,109 | |
Other | |
| 188 |
|
| 170 | |
| 506 |
|
| 536 | | |
| 150 |
|
| 188 | |
| 400 |
|
| 506 | |
Total non-interest income | |
| 981 |
|
| 1,114 | |
| 2,940 |
|
| 3,551 | | |
| 848 |
|
| 981 | |
| 2,474 |
|
| 2,940 | |
| | | | |
| | | | | |
| | | | | | |
| | | | | |
| | |
Non-interest expense: | | | | |
| | | | | |
| | | | | | |
| | | | | |
| | |
Salaries and employee benefits | |
| 4,359 |
|
| 4,203 | |
| 12,882 |
|
| 11,778 | | |
| 4,540 |
|
| 4,359 | |
| 13,223 |
|
| 12,882 | |
Premises and occupancy | |
| 843 |
|
| 836 | |
| 2,500 |
|
| 2,499 | | |
| 835 |
|
| 843 | |
| 2,641 |
|
| 2,500 | |
Equipment expense | |
| 279 |
|
| 330 | |
| 848 |
|
| 932 | | |||||||||||||
Professional expense | |
| 260 |
|
| 299 | |
| 1,162 |
|
| 1,108 | | |||||||||||||
Sales and marketing expense | |
| 182 |
|
| 186 | |
| 504 |
|
| 477 | | |||||||||||||
Equipment | |
| 329 |
|
| 279 | |
| 962 |
|
| 848 | | |||||||||||||
Professional | |
| 321 |
|
| 260 | |
| 1,203 |
|
| 1,162 | | |||||||||||||
Sales and marketing | |
| 167 |
|
| 182 | |
| 516 |
|
| 504 | | |||||||||||||
Deposit insurance premium and regulatory assessments | |
| 191 |
|
| 136 | |
| 465 |
|
| 409 | | |
| 190 |
|
| 191 | |
| 596 |
|
| 465 | |
Other | |
| 810 |
|
| 909 | |
| 2,302 |
|
| 2,263 | | |
| 786 |
|
| 810 | |
| 2,227 |
|
| 2,302 | |
Total non-interest expense | |
| 6,924 |
|
| 6,899 | |
| 20,663 |
|
| 19,466 | | |
| 7,168 |
|
| 6,924 | |
| 21,368 |
|
| 20,663 | |
| | | | |
| | | | | |
| | | | | | |
| | | | | |
| | |
Income before income taxes | |
| 3,289 |
|
| 2,398 | |
| 9,598 |
|
| 9,225 | | |
| 2,115 |
|
| 3,289 | |
| 7,629 |
|
| 9,598 | |
Provision for income taxes | |
| 966 |
|
| 699 | |
| 2,814 |
|
| 2,595 | | |
| 620 |
|
| 966 | |
| 2,231 |
|
| 2,814 | |
Net income | | $ | 2,323 |
| $ | 1,699 | | $ | 6,784 |
| $ | 6,630 | | | $ | 1,495 |
| $ | 2,323 | | $ | 5,398 |
| $ | 6,784 | |
| | | | |
| | | | | |
| | | | | | |
| | | | | |
| | |
Basic earnings per share | | $ | 0.33 |
| $ | 0.23 | | $ | 0.94 |
| $ | 0.89 | | | $ | 0.22 |
| $ | 0.33 | | $ | 0.77 |
| $ | 0.94 | |
Diluted earnings per share | | $ | 0.33 |
| $ | 0.23 | | $ | 0.94 |
| $ | 0.89 | | | $ | 0.22 |
| $ | 0.33 | | $ | 0.77 |
| $ | 0.94 | |
The accompanying notes are an integral part of these condensed consolidated financial statements.
2
PROVIDENT FINANCIAL HOLDINGS, INC.
Condensed Consolidated Statements of Comprehensive Income
(Unaudited)
In Thousands
| | | | | | | | | | | | | | | | | | | | | | | | |
| | For the Quarter Ended | | For the Nine Months Ended | | For the Quarter Ended | | For the Nine Months Ended | ||||||||||||||||
| | March 31, | | March 31, | | March 31, | | March 31, | ||||||||||||||||
|
| 2023 |
| 2022 |
| 2023 |
| 2022 |
| 2024 |
| 2023 |
| 2024 |
| 2023 | ||||||||
Net income | | $ | 2,323 |
| $ | 1,699 | | $ | 6,784 |
| $ | 6,630 | | $ | 1,495 |
| $ | 2,323 | | $ | 5,398 |
| $ | 6,784 |
| | | | |
| | | | | |
| | | | | |
| | | | | |
| |
Change in unrealized holding income (losses) on securities available for sale and interest-only strips | |
| 11 |
|
| (27) | |
| (38) |
|
| (47) | ||||||||||||
Reclassification of losses to net income | |
| — |
|
| — | |
| — |
|
| — | ||||||||||||
Other comprehensive income (loss), before income tax expense (benefit) | |
| 11 |
|
| (27) | |
| (38) |
|
| (47) | ||||||||||||
Income tax expense (benefit) | |
| 3 |
|
| (8) | |
| (11) |
|
| (14) | ||||||||||||
Other comprehensive income (loss) | |
| 8 |
|
| (19) | |
| (27) |
|
| (33) | ||||||||||||
Change in unrealized holding (losses) income on securities available for sale and interest-only strips | |
| (1) |
|
| 11 | |
| 43 |
|
| (38) | ||||||||||||
Other comprehensive (loss) income, before income tax (benefit) expense | |
| (1) |
|
| 11 | |
| 43 |
|
| (38) | ||||||||||||
Income tax (benefit) expense | |
| (0) |
|
| 3 | |
| 13 |
|
| (11) | ||||||||||||
Other comprehensive (loss) income | |
| (1) |
|
| 8 | |
| 30 |
|
| (27) | ||||||||||||
Total comprehensive income | | $ | 2,331 |
| $ | 1,680 | | $ | 6,757 |
| $ | 6,597 | | $ | 1,494 |
| $ | 2,331 | | $ | 5,428 |
| $ | 6,757 |
The accompanying notes are an integral part of these condensed consolidated financial statements.
3
PROVIDENT FINANCIAL HOLDINGS, INC.
Condensed Consolidated Statements of Stockholders' Equity
(Unaudited)
In Thousands, Except Share and Per Share Information
For the Quarters Ended March 31, 20232024 and 2022:2023:
| | | | | | | | | | | | | | | | | | | | | | | | | | | | | | | | | | | | | | | | |
|
| |
| | |
| | |
| | |
| | |
| Accumulated |
| |
|
| |
| | |
| | |
| | |
| | |
| Accumulated |
| |
| ||
| | | | | | | | | | | | | | | | Other | | |
| | | | | | | | | | | | | | | | Other | | |
| ||
| | Common | | Additional | | | | | | | | Comprehensive | | |
| | Common | | Additional | | | | | | | | Comprehensive | | |
| ||||||||||
| | Stock | | Paid-In | | Retained | | Treasury | | (Loss) Income, | | |
| | Stock | | Paid-In | | Retained | | Treasury | | Loss, | | |
| ||||||||||||||
| | Shares | | Amount | | Capital | | Earnings | | Stock | | Net of Tax | | Total | | Shares | | Amount | | Capital | | Earnings | | Stock | | Net of Tax | | Total | ||||||||||||
Balance at December 31, 2022 |
| 7,132,270 | | $ | 183 | | $ | 98,732 | | $ | 205,117 | | $ | (174,758) | | $ | (33) | | $ | 129,241 | ||||||||||||||||||||
Balance at December 31, 2023 |
| 6,946,348 | | $ | 183 | | $ | 99,565 | | $ | 208,396 | | $ | (178,476) | | $ | (7) | | $ | 129,661 | ||||||||||||||||||||
| | | | | | | | | | | | | | | | | | | | | | | | | | | | | | | | | | | | | | | | |
Net income |
| | |
| | |
|
| |
| 2,323 | |
|
| |
|
| | | 2,323 |
| | |
| | |
|
| |
| 1,495 | |
|
| |
|
| | | 1,495 |
Other comprehensive income |
| | |
| | |
|
| |
|
| |
|
| |
| 8 | | | 8 | ||||||||||||||||||||
Other comprehensive loss |
| | |
| | |
|
| |
|
| |
|
| |
| (1) | | | (1) | ||||||||||||||||||||
Purchase of treasury stock |
| (98,307) | |
| | |
| | |
|
| |
| (1,396) | |
|
| | | (1,396) |
| (50,051) | |
| | |
| | |
|
| |
| (707) | |
|
| | | (707) |
Forfeiture of restricted stock |
| | |
| | |
| 9 | |
| | |
| (9) | |
|
| | | — | ||||||||||||||||||||
Amortization of restricted stock |
| | |
| | |
| 207 | |
|
| |
|
| |
|
| | | 207 |
| | |
| | |
| 35 | |
|
| |
|
| |
|
| | | 35 |
Stock options expense |
| | |
| | |
| 14 | |
|
| |
|
| |
|
| | | 14 |
| | |
| | |
| 6 | |
|
| |
|
| |
|
| | | 6 |
Tax effect from stock based compensation | | | | | | | | (15) | | | | | | | | | | | | (15) | ||||||||||||||||||||
Cash dividends(1) |
| | |
| | |
|
| |
| (991) | |
|
| |
|
| | | (991) |
| | |
| | |
|
| |
| (968) | |
|
| |
|
| | | (968) |
| | | | | | | | | | | | | | | | | | | | | | | | | | | | | | | | | | | | | | | | |
Balance at March 31, 2023 |
| 7,033,963 | | $ | 183 | | $ | 98,962 | | $ | 206,449 | | $ | (176,163) | | $ | (25) | | $ | 129,406 | ||||||||||||||||||||
Balance at March 31, 2024 |
| 6,896,297 | | $ | 183 | | $ | 99,591 | | $ | 208,923 | | $ | (179,183) | | $ | (8) | | $ | 129,506 |
(1) | Cash dividends of $0.14 per share were paid in the quarter ended March 31, |
| | | | | | | | | | | | | | | | | | | | | | | | | | | | | | | | | | | | | | | | |
|
| |
| | |
| | |
| | |
| | |
| Accumulated |
| |
|
| |
| | |
| | |
| | |
| | |
| Accumulated |
| |
| ||
| | | | | | | | | | | | | | | | Other | | |
| | | | | | | | | | | | | | | | Other | | |
| ||
| | Common | | Additional | | | | | | | | Comprehensive | | |
| | Common | | Additional | | | | | | | | Comprehensive | | |
| ||||||||||
| | Stock | | Paid-In | | Retained | | Treasury | | Income (Loss), | | |
| | Stock | | Paid-In | | Retained | | Treasury | | (Loss) Income, | | |
| ||||||||||||||
| | Shares | | Amount | | Capital | | Earnings | | Stock | | Net of Tax | | Total | | Shares | | Amount | | Capital | | Earnings | | Stock | | Net of Tax | | Total | ||||||||||||
Balance at December 31, 2021 |
| 7,389,943 | | $ | 183 | | $ | 98,404 | | $ | 200,569 | | $ | (171,280) | | $ | 58 | | $ | 127,934 | ||||||||||||||||||||
Balance at December 31, 2022 |
| 7,132,270 | | $ | 183 | | $ | 98,732 | | $ | 205,117 | | $ | (174,758) | | $ | (33) | | $ | 129,241 | ||||||||||||||||||||
| | | | | | | | | | | | | | | | | | | | | | | | | | | | | | | | | | | | | | | | |
Net income |
| | |
| | |
| | |
| 1,699 | |
| | |
| | | | 1,699 |
| | |
| | |
| | |
| 2,323 | |
| | |
| | | | 2,323 |
Other comprehensive loss |
| | |
| | |
| | |
| | |
| | |
| (19) | | | (19) | ||||||||||||||||||||
Other comprehensive income |
| | |
| | |
| | |
| | |
| | |
| 8 | | | 8 | ||||||||||||||||||||
Purchase of treasury stock |
| (69,271) | |
| | |
| | |
| | |
| (1,156) | |
| | | | (1,156) |
| (98,307) | |
| | |
| | |
| | |
| (1,396) | |
| | | | (1,396) |
Forfeiture of restricted stock |
| | |
| | |
| 23 | |
| | |
| (23) | |
| | | | — |
| | |
| | |
| 9 | |
| | |
| (9) | |
| | | | — |
Amortization of restricted stock |
| | |
| | |
| 177 | |
| | |
| | |
| | | | 177 |
| | |
| | |
| 207 | |
| | |
| | |
| | | | 207 |
Stock options expense |
| | |
| | |
| 13 | |
| | |
| | |
| | | | 13 |
| | |
| | |
| 14 | |
| | |
| | |
| | | | 14 |
Cash dividends(1) |
| | |
| | |
| | |
| (1,031) | |
| | |
| | | | (1,031) |
| | |
| | |
| | |
| (991) | |
| | |
| | | | (991) |
| | | | | | | | | | | | | | | | | | | | | | | | | | | | | | | | | | | | | | | | |
Balance at March 31, 2022 |
| 7,320,672 | | $ | 183 | | $ | 98,617 | | $ | 201,237 | | $ | (172,459) | | $ | 39 | | $ | 127,617 | ||||||||||||||||||||
Balance at March 31, 2023 |
| 7,033,963 | | $ | 183 | | $ | 98,962 | | $ | 206,449 | | $ | (176,163) | | $ | (25) | | $ | 129,406 |
(1) | Cash dividends of $0.14 per share were paid in the quarter ended March 31, |
4
For the Nine Months Ended March 31, 20232024 and 2022:2023:
| | | | | | | | | | | | | | | | | | | | |
| | | | | | | | | | | | | | | | Accumulated | | |
| |
| | | | | | | | | | | | | | | | Other | | |
| |
| | Common | | Additional | | | | | | | | Comprehensive | | |
| |||||
| | Stock | | Paid-In | | Retained | | Treasury | | Income (Loss), | | |
| |||||||
|
| Shares |
| Amount |
| Capital |
| Earnings |
| Stock |
| Net of Tax |
| Total | ||||||
Balance at June 30, 2022 | | 7,285,184 | | $ | 183 | | $ | 98,826 | | $ | 202,680 | | $ | (173,041) | | $ | 2 | | $ | 128,650 |
| | | | | | | | | | | | | | | | | | | | |
Net income |
| |
| | |
| | |
| | 6,784 |
| | |
| | |
| | 6,784 |
Other comprehensive loss |
| |
| | |
| | |
| | |
| | |
| | (27) |
| | (27) |
Purchase of treasury stock |
| (251,221) |
| | |
| | |
| | |
| | (3,592) |
| | |
| | (3,592) |
Awards of restricted stock |
| |
| | |
| | (479) |
| | |
| | 479 |
| | |
| | — |
Forfeiture of restricted stock |
| |
| | |
| | 9 |
| | |
| | (9) |
| | |
| | — |
Amortization of restricted stock |
| |
| | |
| | 615 |
| | |
| | |
| | |
| | 615 |
Stock options expense |
| |
| | |
| | 45 |
| | |
| | |
| | |
| | 45 |
Tax effect from stock based compensation | | | | | | | | (54) | | | | | | | | | | | | (54) |
Cash dividends(1) |
| |
| | |
| | |
| | (3,015) |
| | |
| | |
| | (3,015) |
| | | | | | | | | | | | | | | | | | | | |
Balance at March 31, 2023 |
| 7,033,963 | | $ | 183 | | $ | 98,962 | | $ | 206,449 | | $ | (176,163) | | $ | (25) |
| $ | 129,406 |
| | | | | | | | | | | | | | | | | | | | |
| | | | | | | | | | | | | | | | Accumulated | | |
| |
| | | | | | | | | | | | | | | | Other | | |
| |
| | Common | | Additional | | | | | | | | Comprehensive | | |
| |||||
| | Stock | | Paid-In | | Retained | | Treasury | | (Loss) Income, | | |
| |||||||
|
| Shares |
| Amount |
| Capital |
| Earnings |
| Stock |
| Net of Tax |
| Total | ||||||
Balance at June 30, 2023 | | 7,043,170 | | $ | 183 | | $ | 99,505 | | $ | 207,274 | | $ | (177,237) | | $ | (38) | | $ | 129,687 |
| | | | | | | | | | | | | | | | | | | | |
Net income |
| |
| | |
| | |
| | 5,398 |
| | |
| | |
| | 5,398 |
Other comprehensive income |
| |
| | |
| | |
| | |
| | |
| | 30 |
| | 30 |
Purchase of treasury stock |
| (148,873) |
| | |
| | |
| | |
| | (1,964) |
| | |
| | (1,964) |
Distribution of restricted stock |
| 2,000 |
| | |
| | |
| | |
| | |
| | |
| | — |
Awards of restricted stock |
| |
| | |
| | (18) |
| | |
| | 18 |
| | |
| | — |
Amortization of restricted stock |
| |
| | |
| | 137 |
| | |
| | |
| | |
| | 137 |
Stock options expense |
| |
| | |
| | 27 |
| | |
| | |
| | |
| | 27 |
Tax effect from stock based compensation | | | | | | | | (60) | | | | | | | | | | | | (60) |
Cash dividends(1) |
| |
| | |
| | |
| | (2,925) |
| | |
| | |
| | (2,925) |
Adoption of CECL standard | | | | | | | | | | | (824) | | | | | | | | | (824) |
| | | | | | | | | | | | | | | | | | | | |
Balance at March 31, 2024 |
| 6,896,297 | | $ | 183 | | $ | 99,591 | | $ | 208,923 | | $ | (179,183) | | $ | (8) |
| $ | 129,506 |
(1) | Cash dividends of $0.42 per share were paid in the nine months ended March 31, 2024. |
(1)Cash dividends of $0.42 per share were paid in the nine months ended March 31, 2023.
| | | | | | | | | | | | | | | | | | | | | | | | | | | | | | | | | | | | | | | ||
|
| |
| | |
| | |
| | |
| | |
| Accumulated |
| |
| |
| | |
| | |
| | |
| | |
| Accumulated |
| | ||||
| | | | | | | | | | | | | | | | Other | |
| | | | | | | | | | | | | | | | | Other | |
| | ||
| | Common | | Additional | | | | | | | | Comprehensive | |
| | | Common | | Additional | | | | | | | | Comprehensive | |
| | ||||||||||
| | Stock | | Paid-In | | Retained | | Treasury | | Income (Loss), | |
| | | Stock | | Paid-In | | Retained | | Treasury | | Income (Loss), | |
| | ||||||||||||||
| | Shares | | Amount | | Capital | | Earnings | | Stock | | Net of Tax | | Total | | Shares | | Amount | | Capital | | Earnings | | Stock | | Net of Tax | | Total | ||||||||||||
Balance at June 30, 2021 |
| 7,541,469 | | $ | 183 | | $ | 97,978 | | $ | 197,733 | | $ | (168,686) | | $ | 72 | | $ | 127,280 | ||||||||||||||||||||
Balance at June 30, 2022 |
| 7,285,184 | | $ | 183 | | $ | 98,826 | | $ | 202,680 | | $ | (173,041) | | $ | 2 | | $ | 128,650 | ||||||||||||||||||||
| | | | | | | | | | | | | | | | | | | | | | | | | | | | | | | | | | | | | | | ||
Net income |
| | |
| | |
| | |
| 6,630 | |
| | |
| | |
| 6,630 |
| | |
| | |
| | |
| 6,784 | |
| | |
| | |
| 6,784 |
Other comprehensive loss |
| | |
| | |
| | |
| | |
| | |
| (33) | |
| (33) |
| | |
| | |
| | |
| | |
| | |
| (27) | |
| (27) |
Purchase of treasury stock |
| (221,797) | |
| | |
| | |
| | |
| (3,741) | |
| | |
| (3,741) |
| (251,221) | |
| | |
| | |
| | |
| (3,592) | |
| | |
| (3,592) |
Distribution of restricted stock |
| 1,000 | |
| | |
| | | | | | | | |
| | |
| — | ||||||||||||||||||||
Awards of restricted stock | | | | | | | | (9) | | | | | | 9 | | | | | — | | | | | | | | (479) | | | | | | 479 | | | | | — | ||
Forfeiture of restricted stock |
| | |
| | |
| 41 | |
| | |
| (41) | |
| | |
| — |
| | |
| | |
| 9 | |
| | |
| (9) | |
| | |
| — |
Amortization of restricted stock |
| | |
| | |
| 570 | |
| | |
| | |
| | |
| 570 |
| | |
| | |
| 615 | |
| | |
| | |
| | |
| 615 |
Stock options expense |
| | |
| | |
| 37 | |
| | |
| | |
| | |
| 37 |
| | |
| | |
| 45 | |
| | |
| | |
| | |
| 45 |
Tax effect from stock based compensation | | | | | | | | (54) | | | | | | | | | | | (54) | |||||||||||||||||||||
Cash dividends(1) |
| | |
| | |
| | |
| (3,126) | |
| | |
| | |
| (3,126) |
| | |
| | |
| | |
| (3,015) | |
| | |
| | |
| (3,015) |
| | | | | | | | | | | | | | | | | | | | | | | | | | | | | | | | | | | | | | | ||
Balance at March 31, 2022 |
| 7,320,672 | | $ | 183 | | $ | 98,617 | | $ | 201,237 | | $ | (172,459) | | $ | 39 | | $ | 127,617 | ||||||||||||||||||||
Balance at March 31, 2023 |
| 7,033,963 | | $ | 183 | | $ | 98,962 | | $ | 206,449 | | $ | (176,163) | | $ | (25) | | $ | 129,406 |
(1) | Cash dividends of $0.42 per share were paid in the nine months ended March 31, 2023. |
The accompanying notes are an integral part of these condensed consolidated financial statements.
5
PROVIDENT FINANCIAL HOLDINGS, INC.
Condensed Consolidated Statements of Cash Flows
(Unaudited - In Thousands)
| | | | | | | | | | | | | | |
| | Nine Months Ended | | | Nine Months Ended | | ||||||||
| | March 31, | | | March 31, | | ||||||||
|
| 2023 |
| 2022 |
|
| 2024 |
| 2023 |
| ||||
Cash flows from operating activities: | | | | | |
| | | | | | |
| |
Net income | | $ | 6,784 |
| $ | 6,630 | | | $ | 5,398 |
| $ | 6,784 | |
Adjustments to reconcile net income to net cash provided by operating activities : | | | | |
| | | | | | |
| | |
Depreciation and amortization | |
| 2,412 |
|
| 4,029 | | |
| 2,306 |
|
| 2,412 | |
Provision (recovery) for loan losses | |
| 430 |
|
| (2,051) | | |||||||
(Recovery of) provision for credit losses | |
| (51) |
|
| 430 | | |||||||
Stock-based compensation | |
| 660 |
|
| 607 | | |
| 164 |
|
| 660 | |
Provision for deferred income taxes | |
| 824 |
|
| 834 | | |
| 60 |
|
| 824 | |
Decrease in accounts payable, accrued interest and other liabilities | |
| (151) |
|
| (673) | | |
| (347) |
|
| (151) | |
Decrease (increase) in prepaid expenses and other assets | |
| 879 |
|
| (2,021) | | |||||||
(Increase) decrease in prepaid expenses and other assets | |
| (1,089) |
|
| 879 | | |||||||
Net cash provided by operating activities | |
| 11,838 |
|
| 7,355 | | |
| 6,441 |
|
| 11,838 | |
| | | | |
| | | | | | |
| | |
Cash flows from investing activities: | | | | |
| | | | | | |
| | |
Net increase in loans held for investment | |
| (138,869) |
|
| (42,111) | | |||||||
Purchase of investment securities - held to maturity | |
| — |
|
| (18,159) | | |||||||
Net decrease (increase) in loans held for investment | |
| 10,070 |
|
| (138,869) | | |||||||
Maturity of investment securities - held to maturity | |
| 400 |
|
| 400 | | |
| — |
|
| 400 | |
Principal payments from investment securities - held to maturity | |
| 23,386 |
|
| 44,205 | | |
| 17,950 |
|
| 23,386 | |
Principal payments from investment securities - available for sale | |
| 387 |
|
| 597 | | |
| 263 |
|
| 387 | |
Purchase of premises and equipment | |
| (730) |
|
| (113) | | |
| (1,495) |
|
| (730) | |
Net cash used for investing activities | |
| (115,426) |
|
| (15,181) | | |||||||
Net cash provided by (used for) investing activities | |
| 26,788 |
|
| (115,426) | | |||||||
| | | | | | | | | | | | | | |
Cash flows from financing activities: | | | | | | | | | | | | | | |
Net increase in deposits | | | 27,542 | | | 25,527 | | |||||||
Net (decrease) increase in deposits | | | (42,449) | | | 27,542 | | |||||||
Proceeds from long-term borrowings | | | 35,000 | | | — | | | | 42,500 | | | 35,000 | |
Repayments of long-term borrowings | | | (20,000) | | | (20,983) | | | | (30,009) | | | (20,000) | |
Proceeds from short-term borrowings, net | | | 105,010 | | | — | | |||||||
(Repayments of) proceeds from short-term borrowings, net | | | (12,500) | | | 105,010 | | |||||||
Treasury stock purchases | | | (3,592) | | | (3,741) | | | | (1,964) | | | (3,592) | |
Cash dividends | | | (3,015) | | | (3,126) | | | | (2,925) | | | (3,015) | |
Net cash provided by (used for) financing activities | | | 140,945 | | | (2,323) | | |||||||
Net cash (used for) provided by financing activities | | | (47,347) | | | 140,945 | | |||||||
| | | | | | | | | | | | | | |
Net increase (decrease) in cash and cash equivalents | | | 37,357 | | | (10,149) | | |||||||
Net (decrease) increase in cash and cash equivalents | | | (14,118) | | | 37,357 | | |||||||
Cash and cash equivalents at beginning of period | | | 23,414 | | | 70,270 | | | | 65,849 | | | 23,414 | |
Cash and cash equivalents at end of period | | $ | 60,771 | | $ | 60,121 | | | $ | 51,731 | | $ | 60,771 | |
Supplemental information: | | | | | | | | | | | | | | |
Cash paid for interest | | $ | 4,422 | | $ | 2,473 | | | $ | 13,962 | | $ | 4,422 | |
Cash paid for income taxes | | $ | 2,000 | | $ | 2,025 | | | $ | 2,490 | | $ | 2,000 | |
The accompanying notes are an integral part of these condensed consolidated financial statements.
6
PROVIDENT FINANCIAL HOLDINGS, INC.
Notes to Unaudited Interim Condensed Consolidated Financial Statements
March 31, 20232024
Note 1: Basis of Presentation
The unaudited interim condensed consolidated financial statements included herein reflect all adjustments which are, in the opinion of management, necessary to present a fair statement of the results of operations for the interim periods presented. All such adjustments are of a normal, recurring nature. The condensed consolidated statement of financial condition at June 30, 20222023 is derived from the audited consolidated financial statements of Provident Financial Holdings, Inc. and its wholly-owned subsidiary, Provident Savings Bank, F.S.B. (the "Bank") (collectively, the "Corporation"). Certain information and note disclosures normally included in financial statements prepared in accordance with accounting principles generally accepted in the United States of America ("GAAP") have been omitted pursuant to the rules and regulations of the United States Securities and Exchange Commission ("SEC") with respect to interim financial reporting. It is recommended that these unaudited interim condensed consolidated financial statements be read in conjunction with the audited consolidated financial statements and notes thereto included in the Corporation’s Annual Report on Form 10-K for the fiscal year ended June 30, 20222023 (“20222023 Annual Form 10-K”). The results of operations for the quarter and nine months ended March 31, 20232024 are not necessarily indicative of results that may be expected for the entire fiscal year ending June 30, 2023.2024.
Note 2: Accounting Standard Updates (“ASU”)
There have been no accounting standard updates or changesASU 2023-09:
In December 2023, the Financial Accounting Standards Board (“FASB”) issued ASU No. 2023-09, Income Taxes (Topic 740): Improvements to Income Tax Disclosures. This ASU requires public business entities to annually (a) disclose specific categories in the statusrate reconciliation and (b) provide additional information for reconciling items that meet a quantitative threshold of theirequal to or greater than five percent of the amount computed by multiplying pretax income or loss by the applicable statutory income tax rate. This ASU is effective for annual periods beginning after December 15, 2024. Early adoption that are materialis permitted. The Corporation is in the process of reviewing the impact of this ASU and has not yet determined the impact of the adoption of this ASU on its consolidated financial statements.
ASU 2023-07:
In November 2023, the FASB issued ASU No. 2023-07, Segment Reporting (Topic 280): Improvements to Reportable Segment Disclosures. This ASU improves reportable segment disclosure requirements, primarily through enhanced disclosures about significant segment expenses. The key amendments include: (a) introduce a new requirement to disclose significant segment expenses regularly provided to the Corporation as previously disclosedchief operating decision maker (“CODM”), (b) extend certain annual disclosures to interim periods, (c) clarify single reportable segment entities must apply ASC 280 in Note 1its entirety, (d) permit more than one measure of segment profit or loss to be reported under certain conditions, and (e) require disclosure of the Corporation's 2022 Annual Form 10-K, excepttitle and position of the following:CODM. This ASU is effective for public entities fiscal years beginning after December 15, 2023, and interim periods within fiscal years beginning after December 15, 2024. Early adoption is permitted. The Corporation is in the process of reviewing the impact of this ASU and has not yet determined the impact of the adoption of this ASU on its consolidated financial statements.
ASU 2020-04:
In March 2020, the Financial Accounting Standards Board (“FASB”)FASB issued ASU No. 2020-04, Reference Rate Reform (Topic 848): Facilitation of the Effects of referenceReference Rate Reform on Financial Reporting. This ASU applies to contracts, hedging relationships and other transactions that reference the London Interbank Offered Rate (“LIBOR”) or other rate references expected to be discontinued becauseas a result of reference rate reform. The ASU permits an entity to make necessary modifications to eligible contracts or transactions without requiring contract remeasurement or reassessment of a previous accounting determination. In January 2021, ASU 2021-01 clarified that certain optional expedients and exceptions in Topic 848 for contract modifications and hedge accounting apply to derivatives that are affected by the changes in the interest rates used for margining, discounting, or contract price alignment for derivative instruments that are being implemented as part of the market-wide transition to new reference rates (commonly referred to as the “discounting transition”). In December
7
2022, the FASB issued ASU 2022-06, Deferral of the Sunset Date of Topic 848. The FASB had originally included a sunset provision within Topic 848 based on expectations of when the LIBOR would cease being published. In March 2021, it was announced that the intended cessation date of LIBOR would bewas extended to June 30, 2023. As a result, the FASB issued ASU 2022-06 deferring the sunset date of Topic 848 from MarchDecember 31, 20232022 to December 31, 2024. This ASU is effective for all entities as of March 12, 2020 through December 31, 2024. As of June 30, 2023, the Corporation had approximately $469.4 million in loans held for investment with LIBOR indices. Beginning July 1, 2023, the Corporation started to transition these loans to Secured Overnight Financing Rate (“SOFR”) indices or other rate indices in accordance with the government agency guidelines. As of September 30, 2023, all loans held for investment with LIBOR indices had been transitioned to SOFR or other rate indices. The Corporation is in the process of compiling data on the impact of reference rate reform and has not determined that the impact of the adoption of this ASU ondid not have a material impact to its consolidated financial statements.
ASU 2016-13:
In June 2016, the FASB issued ASU 2016-13, “Financial Instruments —- Credit Losses (Topic 326): Measurement of Credit Losses on Financial Instruments,” and subsequent amendments to the initial guidance in November 2018,guidance. On July 1, 2023, the Corporation adopted this ASU No. 2018-19, April 2019, ASU 2019-04, May 2019, ASU 2019-05, November 2019, ASU 2019-11, February 2020, ASU 2020-02, March 2020, ASU 2020-03 and March 2022, ASU 2022-02, allthat replaced the incurred loss methodology with the current expected credit loss (“CECL”) methodology. CECL requires an estimate of which clarifies codification and corrects unintended applicationcredit losses for the remaining estimated life of the guidance. In November 2019, the FASB also issued ASU 2019-10, “Financial Instruments — Credit Losses (Topic 326), Derivativesfinancial asset using historical experience, current conditions, and Hedging (Topic 815),reasonable and Leases (Topic 842): Effective Dates” extending the adoption date for certain registrants,supportable forecasts and applies to financial assets measured at amortized cost, including the Corporation. These ASUs related to Topic 326 will be effective for fiscal years beginning after December 15, 2022, including interim periods within those fiscal years. The Corporation is evaluating its current expected loss methodology of its loans held for investment, andheld-to-maturity investment securities and some off-balance sheet credit exposures such as unfunded commitments to extend credit. Financial assets measured at amortized cost will be presented at the net amount expected to be collected by using an allowance for credit losses (“ACL”).
In addition, CECL made changes to the accounting for available for sale investment securities. One such change is to require credit losses to be presented as an allowance rather than as a write-down on available for sale debt securities if management does not intend to sell and does not believe that it is more likely than not, they will be required to sell.
The Corporation adopted ASC 326, “Financial Instruments – Credit Losses,” and all related subsequent amendments using the prospective transition approach for all financial assets measured at amortized cost and off-balance sheet credit exposures. The transition adjustment of the adoption of CECL included an $1.2 million increase in the ACL, which is presented as a reduction to net loans held for investment. The Corporation recorded a net decrease to maturityretained earnings of $824,000 as of July 1, 2023 for the cumulative effect of adopting CECL, which reflects the transition adjustments noted above, net of the applicable deferred tax assets recorded. Results for reporting periods beginning after July 1, 2023 are presented under CECL while prior period amounts continue to be reported in accordance with previously applicable accounting standards.
The Corporation adopted ASC 326 using the prospective transition approach for debt securities for which other-than-temporary impairment had been recognized prior to July 1, 2023. As of June 30, 2023, the Corporation did not have any other-than-temporary impaired investment securities. Therefore, upon adoption of ASC 326, the Corporation determined that an ACL on available for sale securities was not deemed necessary.
78
to identify the necessary modifications in accordance with these standards and expects a change in the processes and procedures to calculate the allowance for credit losses, including changes in assumptions and estimates to consider expected credit losses over the life of the loan versus the current accounting practice that utilizes the incurred loss model. The Corporation has established a project team and implementation plan to address the key components to this process. The Corporation has determined its loan segmentation and compiled historical data, which is currently under evaluation. The Corporation is in the process of evaluating the appropriate methodologies for each loan grouping and has begun testing, parallel runs, and sensitivity analysis on its initial modeling assumptions and results prior to the adoption date of July 1, 2023. The Corporation anticipates the allowance for credit losses for loans held for investment to change through a one-time adjustment to retained earnings and is still evaluating the potential impact upon adoption that these ASUs will have on the Corporation’s Consolidated Financial Statements; however, until the evaluation is complete the magnitude of the potential change will be unknown.
The following table illustrates the impact on the ACL from the adoption of ASC 326:
| | | | | | | | | |
| Allowance for | Allowance | Impact to | ||||||
| credit losses | before adoption | allowance after ASC | ||||||
| under ASC 326 | of ASC 326 | 326 adoption | ||||||
(In Thousands) | (07/01/2023) | (06/30/2023) | (07/01/2023) | ||||||
Assets: | |
|
| |
|
|
| |
|
Mortgage loans: | | | | | | | | |
|
Single-family | $ | 6,325 | | $ | 1,720 |
| $ | 4,605 | |
Multi-family | | 656 | | | 3,270 | | | (2,614) | |
Commercial real estate | | 82 | | | 868 | | | (786) | |
Construction | | 62 | | | 15 | | | 47 | |
Other | | 5 | | | 2 | | | 3 | |
Commercial business loans | | 13 | | | 67 | | | (54) | |
Consumer loans | | — | | | 4 | | | (4) | |
ACL on loans | $ | 7,143 | | $ | 5,946 | | $ | 1,197 | |
| | | | | | | | | |
Liabilities: | | | | | | | | | |
Unfunded loan commitment reserve | $ | 42 | | $ | 42 | | $ | — | |
In March 2022, FASB issued ASU 2022-02, “Financial Instruments-Credit Losses (Topic 326) Troubled Debt Restructurings and Vintage Disclosures.” This ASU provides new guidance on the treatment of troubled debt restructurings (“TDR”) in relation to the adoption of the CECL model for the accounting for credit losses (see note above regarding ASU 2016-13). Previous accounting guidance related to TDRs is eliminated and new disclosure requirements are adopted in regards to loan modifications made to borrowers experiencing financial difficulties under the assumption that the CECL model will capture credit losses related to TDRs. The required disclosures regarding gross write-offs for financing receivables by year of origination and loan modifications are presented under Note 5 of the Notes to Unaudited Interim Condensed Consolidated Financial Statements of this Form 10-Q. Subsequent to the adoption of ASC 326, the Corporation no longer reports TDRs or classifies loans as TDRs given those loans previously recognized as TDRs have been incorporated into the CECL methodology in regard to loan loss reserves as of July 1, 2023. As of March 31, 2024, there were no loan modifications for borrowers experiencing financial difficulties.
Note 3: Earnings Per Share
Basic earnings per share (“EPS”) excludes dilution and is computed by dividing income available to common shareholders by the weighted-average number of shares outstanding for the period. Diluted EPS reflects the potential dilution that could occur if securities or other contracts to issue common stock were exercised or converted into common stock or resulted in the issuance of common stock that would then share in the earnings of the Corporation.
As of March 31, 20232024 and 2022,2023, there were outstanding stock options to purchase 434,500410,000 shares and 431,000434,500 shares of the Corporation’s common stock, respectively. Of those shares, asAs of March 31, 20232024 and 2022,2023, there were 382,000 and 434,500 shares and 130,000 shares,outstanding stock options, respectively, that were excluded from the diluted EPS computation as their effect was anti-dilutive. As of March 31, 20232024 and 2022,2023, there were outstanding restricted stock awards of 51,000 shares and 146,750 shares, and 96,750 shares, respectively.
9
The following table provides the basic and diluted EPS computations for the quarters and nine months ended March 31, 20232024 and 2022,2023, respectively.
| | | | | | | | | | | | | | | | | | | | | | |||
| | For the Quarter Ended | | For the Nine Months Ended | | For the Quarter Ended | | For the Nine Months Ended | ||||||||||||||||
| | March 31, | | March 31, | | March 31, | | March 31, | ||||||||||||||||
(In Thousands, Except Earnings Per Share) | | 2023 |
| 2022 |
| 2023 |
| 2022 | | 2024 |
| 2023 |
| 2024 |
| 2023 | ||||||||
Numerator: | | | | | | | | | | | | | | | | | | | | | | |||
Net income – numerator for basic earnings per share and |
| | | | | | | | | | |
| | | | | | | | | | |||
diluted earnings per share - available to common | | | | | | | | | | | | | | | | | | | | | | |||
stockholders | | $ | 2,323 | | $ | 1,699 | | $ | 6,784 | | $ | 6,630 | | $ | 1,495 | | $ | 2,323 | | $ | 5,398 | | $ | 6,784 |
| | | | | | | | | | | | | | | | | | | | | | |||
Denominator: | | | | | | | | | | | | | | | | | | | | | | |||
Denominator for basic earnings per share: | | | | | | | | | | | | | | | | | | | | | | |||
Weighted-average shares | |
| 7,081 | |
| 7,358 | |
| 7,181 | |
| 7,442 | |
| 6,919 | |
| 7,081 | |
| 6,968 | |
| 7,181 |
| | | | | | | | | | | | | | | | | | | | | | |||
Effect of dilutive shares: | | | | | | | | | | | | |||||||||||||
Less effect of dilutive shares: | | | | | | | | | | | ||||||||||||||
Stock options | |
| — | |
| 35 | |
| — | |
| 38 | |
| — | |
| — | |
| — | |
| — |
Restricted stock | |
| 65 | |
| 20 | |
| 51 | |
| 11 | |
| 16 | |
| 65 | |
| 13 | |
| 51 |
| | | | | | | | | | | | | | | | | | | | | | |||
Denominator for diluted earnings per share: | | | | | | | | | | | | | | | | | | | | | | |||
Adjusted weighted-average shares and assumed | |
| | | | | | | | | | |
| | | | | | | | | |||
conversions | | | 7,146 | | 7,413 | | | 7,232 | | | 7,491 | | | 6,935 | | 7,146 | | | 6,981 | | 7,232 | |||
| | | | | | | | | | | | | | | | | | | | | | |||
Basic earnings per share |
| $ | 0.33 |
| $ | 0.23 |
| $ | 0.94 |
| $ | 0.89 |
| $ | 0.22 |
| $ | 0.33 |
| $ | 0.77 |
| $ | 0.94 |
Diluted earnings per share |
| $ | 0.33 |
| $ | 0.23 |
| $ | 0.94 |
| $ | 0.89 |
| $ | 0.22 |
| $ | 0.33 |
| $ | 0.77 |
| $ | 0.94 |
Note 4: Investment Securities
The amortized cost and estimated fair value of investment securities as of March 31, 2024 and June 30, 2023 were as follows:
| | | | | | | | | | | | | | | |
|
|
| |
| Gross |
| Gross |
| Estimated |
| | ||||
| | Amortized | | Unrealized | | Unrealized | | Fair | | Carrying | |||||
March 31, 2024 | | Cost | | Gains | | (Losses) | | Value | | Value | |||||
(In Thousands) |
| |
|
| |
|
| |
|
| |
|
| |
|
Held to maturity |
| |
|
| |
|
| |
|
| |
|
| |
|
U.S. government sponsored enterprise MBS(1) | | $ | 131,711 | | $ | 72 | | $ | (15,501) | | $ | 116,282 | | $ | 131,711 |
U.S. government sponsored enterprise CMO(2) | | | 3,802 | | | — | | | (270) | | | 3,532 | | | 3,802 |
U.S. SBA securities(3) | |
| 458 | |
| — | |
| (1) | |
| 457 | |
| 458 |
Total investment securities - held to maturity | | | 135,971 | | | 72 | | | (15,772) | | | 120,271 | | | 135,971 |
| |
|
| |
|
| |
|
| |
|
| |
|
|
Available for sale | |
|
| |
|
| |
|
| |
|
| |
|
|
U.S. government agency MBS | | | 1,288 | | | 1 | | | (15) | | | 1,274 | | | 1,274 |
U.S. government sponsored enterprise MBS | | | 572 | | | 1 | | | (3) | | | 570 | |
| 570 |
Private issue CMO | |
| 93 | |
| — | |
| (2) | |
| 91 | |
| 91 |
Total investment securities - available for sale | | | 1,953 | | | 2 | | | (20) | | | 1,935 | | | 1,935 |
Total investment securities | | $ | 137,924 | | $ | 74 | | $ | (15,792) | | $ | 122,206 | | $ | 137,906 |
810
Note 4: Investment Securities
The amortized cost and estimated fair value of investment securities as of March 31, 2023 and June 30, 2022 were as follows:
| | | | | | | | | | | | | | | |
|
|
| |
| Gross |
| Gross |
| Estimated |
| | ||||
| | Amortized | | Unrealized | | Unrealized | | Fair | | Carrying | |||||
March 31, 2023 | | Cost | | Gains | | (Losses) | | Value | | Value | |||||
(In Thousands) |
| |
|
| |
|
| |
|
| |
|
| |
|
Held to maturity |
| |
|
| |
|
| |
|
| |
|
| |
|
U.S. government sponsored enterprise MBS(1) | | $ | 156,785 | | $ | 1 | | $ | (17,189) | | $ | 139,597 | | $ | 156,785 |
U.S. government sponsored enterprise CMO(2) | | | 3,895 | | | — | | | (278) | | | 3,617 | | | 3,895 |
U.S. SBA securities(3) | |
| 656 | |
| — | |
| — | |
| 656 | |
| 656 |
Total investment securities - held to maturity | | | 161,336 | | | 1 | | | (17,467) | | | 143,870 | | | 161,336 |
| |
|
| |
|
| |
|
| |
|
| |
|
|
Available for sale | |
|
| |
|
| |
|
| |
|
| |
|
|
U.S. government agency MBS | | | 1,463 | | | — | | | (23) | | | 1,440 | | | 1,440 |
U.S. government sponsored enterprise MBS | | | 725 | | | — | | | (12) | | | 713 | |
| 713 |
Private issue CMO | |
| 107 | |
| — | |
| (9) | |
| 98 | |
| 98 |
Total investment securities - available for sale | | | 2,295 | | | — | | | (44) | | | 2,251 | | | 2,251 |
Total investment securities | | $ | 163,631 | | $ | 1 | | $ | (17,511) | | $ | 146,121 | | $ | 163,587 |
| | | | | | | | | | | | | | | |
|
|
| |
| Gross |
| Gross |
| Estimated |
| | | |||
| | Amortized | | Unrealized | | Unrealized | | Fair | | Carrying | |||||
June 30, 2022 | | Cost | | Gains | | (Losses) | | Value | | Value | |||||
(In Thousands) |
| |
|
| |
|
| |
|
| |
|
| |
|
Held to maturity |
| |
|
| |
|
| |
|
| |
|
| |
|
U.S. government sponsored enterprise MBS | | $ | 180,492 | | $ | 63 | | $ | (13,945) | | $ | 166,610 | | $ | 180,492 |
U.S. government sponsored enterprise CMO | | | 3,913 | | | — | | | (150) | | | 3,763 | | | 3,913 |
U.S. SBA securities | |
| 940 | |
| 11 | |
| — | |
| 951 | |
| 940 |
Certificate of deposits | |
| 400 | |
| — | |
| — | |
| 400 | |
| 400 |
Total investment securities - held to maturity | | | 185,745 | | | 74 | | | (14,095) | | | 171,724 | | | 185,745 |
| |
|
| |
|
| |
|
| |
|
| |
|
|
Available for sale | |
|
| |
|
| |
|
| |
|
| |
|
|
U.S. government agency MBS | | | 1,698 | | | 6 | | | (6) | | | 1,698 | | | 1,698 |
U.S. government sponsored enterprise MBS | |
| 865 | |
| 4 | |
| (4) | |
| 865 | |
| 865 |
Private issue CMO | |
| 118 | |
| — | |
| (5) | |
| 113 | |
| 113 |
Total investment securities - available for sale | | | 2,681 | | | 10 | | | (15) | | | 2,676 | | | 2,676 |
Total investment securities | | $ | 188,426 | | $ | 84 | | $ | (14,110) | | $ | 174,400 | | $ | 188,421 |
| | | | | | | | | | | | | | | |
|
|
| |
| Gross |
| Gross |
| Estimated |
| | | |||
| | Amortized | | Unrealized | | Unrealized | | Fair | | Carrying | |||||
June 30, 2023 | | Cost | | Gains | | (Losses) | | Value | | Value | |||||
(In Thousands) |
| |
|
| |
|
| |
|
| |
|
| |
|
Held to maturity |
| |
|
| |
|
| |
|
| |
|
| |
|
U.S. government sponsored enterprise MBS | | $ | 149,803 | | $ | — | | $ | (18,459) | | $ | 131,344 | | $ | 149,803 |
U.S. government sponsored enterprise CMO | | | 3,883 | | | — | | | (336) | | | 3,547 | | | 3,883 |
U.S. SBA securities | |
| 651 | |
| — | |
| (1) | |
| 650 | |
| 651 |
Total investment securities - held to maturity | | | 154,337 | | | — | | | (18,796) | | | 135,541 | | | 154,337 |
| |
|
| |
|
| |
|
| |
|
| |
|
|
Available for sale | |
|
| |
|
| |
|
| |
|
| |
|
|
U.S. government agency MBS | | | 1,417 | | | — | | | (47) | | | 1,370 | | | 1,370 |
U.S. government sponsored enterprise MBS | |
| 697 | |
| — | |
| (14) | |
| 683 | |
| 683 |
Private issue CMO | |
| 103 | |
| — | |
| (1) | |
| 102 | |
| 102 |
Total investment securities - available for sale | | | 2,217 | | | — | | | (62) | | | 2,155 | | | 2,155 |
Total investment securities | | $ | 156,554 | | $ | — | | $ | (18,858) | | $ | 137,696 | | $ | 156,492 |
In the third quarters of fiscal 20232024 and 2022,2023, the Corporation received MBS principal payments of $6.9$5.7 million and $12.3$6.9 million, respectively, and there were no purchases or sales of investment securities during these periods. The Corporation did not purchase any investment securities in the third quarter of fiscal 2023; while in the third quarter of fiscal 2022, the Corporation purchased $3.0 million of U.S. government sponsored enterprise CMO to be held to maturity.
For the first nine months of fiscal 20232024 and 2022,2023, the Corporation received MBS principal payments of $23.8$18.2 million and $44.8$23.8 million, respectively, and there were no purchases or sales of investment securities during these periods.
The Corporation did not purchase anyheld investments with an unrealized loss position of $15.8 million at March 31, 2024 and $18.9 million at June 30, 2023 as follows:
| | | | | | | | | | | | | | | | | | |
As of March 31, 2024 | | Unrealized Holding Losses | | Unrealized Holding Losses | | Unrealized Holding Losses | ||||||||||||
(In Thousands) | | Less Than 12 Months | | 12 Months or More | | Total | ||||||||||||
| | Fair | | Unrealized | | Fair | | Unrealized | | Fair | | Unrealized | ||||||
Description of Securities |
| Value |
| Losses |
| Value |
| Losses |
| Value |
| Losses | ||||||
Held to maturity | | | | | | | | | | | | | | | | | | |
U.S. government sponsored enterprise MBS | | $ | — | | $ | — | | $ | 111,712 | | $ | 15,501 | | $ | 111,712 | | $ | 15,501 |
U.S. government sponsored enterprise CMO | | | — | | | — | | | 3,533 | | | 270 | | | 3,533 | | | 270 |
U.S. SBA securities | | | 457 | | | 1 | | | — | | | — | | | 457 | | | 1 |
Total investment securities - held to maturity | | | 457 | | | 1 | | | 115,245 | | | 15,771 | | | 115,702 | | | 15,772 |
| | | | | | | | | | | | | | | | | | |
Available for sale | | | | | | | | | | | | | | | | | | |
U.S government agency MBS | | | — | | | — | | | 1,179 | | | 15 | | | 1,179 | | | 15 |
U.S. government sponsored enterprise MBS | | | — | | | — | | | 462 | | | 3 | | | 462 | | | 3 |
Private issue CMO | | | — | | | — | | | 91 | | | 2 | | | 91 | | | 2 |
Total investment securities - available for sale | | | — | | | — | | | 1,732 | | | 20 | | | 1,732 | | | 20 |
Total investment securities | | $ | 457 | | $ | 1 | | | 116,977 | | $ | 15,791 | | $ | 117,434 | | $ | 15,792 |
11
| | | | | | | | | | | | | | | | | | |
As of June 30, 2023 | | Unrealized Holding Losses | | Unrealized Holding Losses | | Unrealized Holding Losses | ||||||||||||
(In Thousands) | | Less Than 12 Months | | 12 Months or More | | Total | ||||||||||||
| | Fair | | Unrealized | | Fair | | Unrealized | | Fair | | Unrealized | ||||||
Description of Securities |
| Value |
| Losses |
| Value |
| Losses |
| Value |
| Losses | ||||||
Held to maturity | | | | | | | | | | | | | | | | | | |
U.S. government sponsored enterprise MBS | | $ | 10,839 | | $ | 253 | | $ | 120,506 | | $ | 18,206 | | $ | 131,345 | | $ | 18,459 |
U.S. government sponsored enterprise CMO | | | — | | | — | | | 3,547 | | | 336 | | | 3,547 | | | 336 |
U.S. SBA securities | | | 650 | | | 1 | | | — | | | — | | | 650 | | | 1 |
Total investment securities - held to maturity | | | 11,489 | | | 254 | | | 124,053 | | | 18,542 | | | 135,542 | | | 18,796 |
| | | | | | | | | | | | | | | | | | |
Available for sale | | | | | | | | | | | | | | | | | | |
U.S government agency MBS | | | 696 | | | 20 | | | 673 | | | 27 | | | 1,369 | | | 47 |
U.S. government sponsored enterprise MBS | | | 87 | | | 2 | | | 558 | | | 12 | | | 645 | | | 14 |
Private issue CMO | | | — | | | — | | | 102 | | | 1 | | | 102 | | | 1 |
Total investment securities - available for sale | | | 783 | | | 22 | | | 1,333 | | | 40 | | | 2,116 | | | 62 |
Total investment securities | | $ | 12,272 | | $ | 276 | | $ | 125,386 | | $ | 18,582 | | $ | 137,658 | | $ | 18,858 |
The Corporation adopted ASC 326 on July 1, 2023. The Corporation evaluates individual investment securities inquarterly for impairment. At March 31, 2024, predominately all of the first nine months of fiscal 2023, while in the first nine months of fiscal 2022, the Corporation purchased $15.2$15.8 million of unrealized holding losses were in a loss position for 12 months or more; while at June 30, 2023, $18.6 million of the $18.9 million of unrealized holding losses were in a loss position for 12 months or more. The unrealized losses on investment securities were attributable to changes in interest rates relative to when the investment securities were purchased and not due to the credit quality of the investment securities, which are predominately U.S. government sponsored enterprise MBS(GSE) securities that are either explicitly or implicitly guaranteed by the U.S. government and have a long history of no credit losses. Therefore, the Corporation has determined that the unrealized losses are due to the fluctuating nature of interest rates, and not related to any potential credit risks within the investment portfolio. The Bank does not currently intend to sell any investment securities classified as held to maturity or available for sale and as such, records the investment security at book value or fair market value as prescribed by generally accepted accounting principles. As a part of the Corporation’s monthly risk assessment, the Corporation runs a number of stressed liquidity scenarios to determine if it is more likely than not that the Bank will be required to sell the investment security before the recovery of its amortized costs basis. These liquidity scenarios support the Corporation’s assessment that the Corporation has the ability to hold these held to maturity securities until maturity or available for sale securities until recovery of the amortized costs is realized and it is not more likely than not that the company will be required to sell the securities prior to recovery of the amortized costs. There were no ACL or impairment on investment securities held to maturity and $3.0there were no impairment on investment securities available for sale at adoption of ASC 326 and at March 31, 2024.
In order to maintain adequate liquidity, the Bank has established borrowing facilities with various counterparties. The Bank had a remaining borrowing capacity of $269.2 million as of U.S. government sponsored enterprise CMO to beMarch 31, 2024 at the FHLB of San Francisco. In addition, the Bank has secured an estimated $172.7 million discount window facility at the FRB of San Francisco collateralized by investment securities with total balance of $132.3 million and loans held for investment with total balance of $104.5 million as of March 31, 2024. As of March 31, 2024, the Bank also has an unsecured borrowing arrangement in the form of a federal funds facility with its correspondent bank for $50.0 million. The Bank had no advances under the Federal Reserve discount window or correspondent bank facility as of March 31, 2024. The total available borrowing capacity across all sources totaled approximately $491.9 million at March 31, 2024.
At June 30, 2023, the Bank had a remaining borrowing capacity of $287.9 million at the FHLB of San Francisco. In addition, the Bank had secured an estimated $139.0 million discount window facility at the FRB of San Francisco collateralized by investment securities with a June 30, 2023 total balance of $150.3 million. As of June 30, 2023, the Bank also had an unsecured borrowing arrangement in the form of a federal funds facility with its correspondent bank for $50.0
12
million. The Bank had no advances under the Federal Reserve discount window or correspondent bank facility as of June 30, 2023. The total available borrowing capacity across all sources totaled approximately $476.9 million at June 30, 2023.
At March 31, 2024 and June 30, 2023, the Corporation did not hold any investment securities held to maturity or investment securities available for sale with the intent to sell and determined it had the ability to hold these investment securities until maturity. It also determined that it was more likely than not that the Corporation would not be required to sell the securities prior to recovery of the amortized cost basis; therefore, no impairment losses on were recorded on investment securities available for sale and investment securities held to maturity for the quarters and nine months ended March 31, 2024 and 2023.
Contractual maturities of investment securities as of March 31, 2024 and June 30, 2023 were as follows:
| | | | | | | | | | | | |
| | March 31, 2024 | | June 30, 2023 | ||||||||
|
| | |
| Estimated |
| | |
| Estimated | ||
| | Amortized | | Fair | | Amortized | | Fair | ||||
(In Thousands) | | Cost | | Value | | Cost | | Value | ||||
Held to maturity |
| |
|
| |
|
| |
|
| |
|
Due in one year or less | | $ | 5 | | $ | 5 | | $ | 303 | | $ | 300 |
Due after one through five years | |
| 5,354 | |
| 5,161 | |
| 7,686 | |
| 7,365 |
Due after five through ten years | |
| 52,205 | |
| 47,404 | |
| 61,043 | |
| 54,686 |
Due after ten years | |
| 78,407 | |
| 67,701 | |
| 85,305 | |
| 73,190 |
Total investment securities - held to maturity | | | 135,971 | | | 120,271 | | | 154,337 | | | 135,541 |
| |
|
| |
|
| |
|
| |
|
|
Available for sale | |
|
| |
|
| |
|
| |
|
|
Due in one year or less | | | — | | | — | | | — | | | — |
Due after one through five years | |
| — | |
| — | |
| — | |
| — |
Due after five through ten years | |
| 781 | |
| 777 | |
| 590 | |
| 580 |
Due after ten years | |
| 1,172 | |
| 1,158 | |
| 1,627 | |
| 1,575 |
Total investment securities - available for sale | | | 1,953 | | | 1,935 | | | 2,217 | | | 2,155 |
Total investment securities | | $ | 137,924 | | $ | 122,206 | | $ | 156,554 | | $ | 137,696 |
Note 5: Loans Held for Investment
Loans held for investment, net of fair value adjustments, consisted of the following:
| | | | | | | |
| | March 31, | | June 30, | | ||
(In Thousands) | | 2024 |
| 2023 | | ||
Mortgage loans: |
| |
|
| |
|
|
Single-family | | $ | 517,039 | | $ | 518,821 | |
Multi-family | |
| 457,401 | |
| 461,113 | |
Commercial real estate | |
| 83,136 | |
| 90,558 | |
Construction | |
| 2,745 | |
| 1,936 | |
Other | |
| 99 | |
| 106 | |
Commercial business loans | |
| 2,835 | |
| 1,565 | |
Consumer loans | |
| 60 | |
| 65 | |
Total loans held for investment, gross | |
| 1,063,315 | |
| 1,074,164 | |
| |
|
| |
| | |
Advance payments of escrows | |
| 371 | |
| 148 | |
Deferred loan costs, net | |
| 9,183 | |
| 9,263 | |
ACL on loans | |
| (7,108) | |
| (5,946) | |
Total loans held for investment, net | | $ | 1,065,761 | | $ | 1,077,629 | |
913
The following table sets forth information at March 31, 2024 regarding the dollar amount of loans held for investment that are contractually repricing during the periods indicated, segregated between adjustable rate loans and fixed rate loans. At March 31, 2024 and June 30, 2023, fixed rate loans comprised 10 percent and 11 percent of loans held for investment, respectively. Adjustable rate loans that reprice when the index they are tied to reprices (e.g. prime rate index) and checking account overdrafts are reported as repricing within one year. The table does not include any estimate of prepayments which may cause the Corporation’s actual repricing experience to differ materially from that shown.
| | | | | | | | | | | | | | | | | | |
| | Adjustable Rate | | | | | | | ||||||||||
|
| | |
| After |
| After |
| After |
| | |
| | | |||
| | | Within | | One Year | | 3 Years | | 5 Years | | | | | | | |||
(In Thousands) | | One Year | | Through 3 Years | | Through 5 Years | | Through 10 Years | | Fixed Rate | | Total | ||||||
Mortgage loans: | | | | | | | | | | | | | | | | | | |
Single-family | | $ | 53,321 | | $ | 27,759 | | $ | 96,177 | | $ | 230,399 | | $ | 109,383 | | $ | 517,039 |
Multi-family | |
| 179,447 | |
| 149,111 | |
| 114,911 | |
| 13,831 | |
| 101 | |
| 457,401 |
Commercial real estate | |
| 35,078 | |
| 17,925 | |
| 28,892 | |
| — | |
| 1,241 | |
| 83,136 |
Construction | |
| 2,745 | |
| — | |
| — | |
| — | |
| — | |
| 2,745 |
Other | |
| — | |
| — | |
| — | |
| — | |
| 99 | |
| 99 |
Commercial business loans | |
| 2,720 | |
| — | |
| — | |
| — | |
| 115 | |
| 2,835 |
Consumer loans | |
| 60 | |
| — | |
| — | |
| — | |
| — | |
| 60 |
Total loans held for investment, gross | | $ | 273,371 | | $ | 194,795 | | $ | 239,980 | | $ | 244,230 | | $ | 110,939 | | $ | 1,063,315 |
The following tables present the Corporation’s commercial real estate loans by property types and LTVs as of March 31, 2024 and June 30, 2023:
| | | | | | | | | | | | | | | |
| | | Owner | | | Non-Owner | | | | % of Total | | | Weighted | | |
March 31, 2024 | | | Occupied Loan | | | Occupied Loan | | | Total | | Commercial | | | Average | |
(Dollars In Thousands) | | Balance | | | Balance | | | Balance | Real Estate | | | LTV (1) | | ||
Office | | $ | 6,733 | | $ | 20,216 | | $ | 26,949 | | 32 | % | | 43 | % |
Mixed use (2) | |
| 296 | |
| 15,918 | |
| 16,214 | | 20 | | | 35 | % |
Retail | | | — | | | 12,254 | | | 12,254 | | 15 | | | 31 | % |
Warehouse | | | 2,089 | | | 9,939 | | | 12,028 | | 14 | | | 33 | % |
Medical/dental office | | | 2,453 | | | 4,712 | | | 7,165 | | 9 | | | 44 | % |
Mobile home park | | | — | | | 6,945 | | | 6,945 | | 8 | | | 38 | % |
Restaurant/fast food | | | 692 | | | — | | | 692 | | 1 | | | 44 | % |
Automotive - non gasoline | |
| — | |
| 580 | |
| 580 |
| 1 | |
| 26 | % |
Live/work | |
| — | |
| 309 | |
| 309 |
| — | |
| 14 | % |
Total commercial real estate | | $ | 12,263 | | $ | 70,873 | | $ | 83,136 | | 100 | % | | 38 | % |
(2) | Mixed use includes $7.0 million in Office/Retail, $4.8 million in Multi-family/Retail, $3.0 million in Other Mixed Use, $757,000 in Multi-family/Commercial and $688,000 in Multi-family/Office.. |
14
The Corporation held investments with an unrealized loss position of $17.5 million at March 31, 2023 and $14.1 million at June 30, 2022.
| | | | | | | | | | | | | | | | | | |
As of March 31, 2023 | | Unrealized Holding Losses | | Unrealized Holding Losses | | Unrealized Holding Losses | ||||||||||||
(In Thousands) | | Less Than 12 Months | | 12 Months or More | | Total | ||||||||||||
| | Fair | | Unrealized | | Fair | | Unrealized | | Fair | | Unrealized | ||||||
Description of Securities |
| Value |
| Losses |
| Value |
| Losses |
| Value |
| Losses | ||||||
Held to maturity | | | | | | | | | | | | | | | | | | |
U.S. government sponsored enterprise MBS | | $ | 10,921 | | $ | 180 | | $ | 127,749 | | $ | 17,009 | | $ | 138,670 | | $ | 17,189 |
U.S. government sponsored enterprise CMO | | | — | | | — | | | 3,617 | | | 278 | | | 3,617 | | | 278 |
U.S. SBA securities | | | 656 | | $ | — | | | — | | | — | | | 656 | | | — |
Total investment securities - held to maturity | | | 11,577 | | | 180 | | | 131,366 | | | 17,287 | | | 142,943 | | | 17,467 |
| | | | | | | | | | | | | | | | | | |
Available for sale | | | | | | | | | | | | | | | | | | |
U.S government agency MBS | | | 1,440 | | | 23 | | | — | | | — | | | 1,440 | | | 23 |
U.S. government sponsored enterprise MBS | | | 315 | | | 5 | | | 352 | | | 7 | | | 667 | | | 12 |
Private issue CMO | | | — | | | — | | | 98 | | | 9 | | | 98 | | | 9 |
Total investment securities - available for sale | | | 1,755 | | | 28 | | | 450 | | | 16 | | | 2,205 | | | 44 |
Total investment securities | | $ | 13,332 | | $ | 208 | | | 131,816 | | $ | 17,303 | | $ | 145,148 | | $ | 17,511 |
| | | | | | | | | | | | | | | | | | |
As of June 30, 2022 | | Unrealized Holding Losses | | Unrealized Holding Losses | | Unrealized Holding Losses | ||||||||||||
(In Thousands) | | Less Than 12 Months | | 12 Months or More | | Total | ||||||||||||
| | Fair | | Unrealized | | Fair | | Unrealized | | Fair | | Unrealized | ||||||
Description of Securities |
| Value |
| Losses |
| Value |
| Losses |
| Value |
| Losses | ||||||
Held to maturity | | | | | | | | | | | | | | | | | | |
U.S. government sponsored enterprise MBS | | $ | 121,844 | | $ | 9,018 | | $ | 35,528 | | $ | 4,927 | | $ | 157,372 | | $ | 13,945 |
U.S. government sponsored enterprise CMO | | | 3,764 | | | 150 | | | — | | | — | | | 3,764 | | | 150 |
Total investment securities - held to maturity | | | 125,608 | | | 9,168 | | | 35,528 | | | 4,927 | | | 161,136 | | | 14,095 |
| | | | | | | | | | | | | | | | | | |
Available for sale | | | | | | | | | | | | | | | | | | |
U.S government agency MBS | | | 826 | | | 6 | | | — | | | — | | | 826 | | | 6 |
U.S. government sponsored enterprise MBS | | | 671 | | | 4 | | | — | | | — | | | 671 | | | 4 |
Private issue CMO | | | 113 | | | 5 | | | — | | | — | | | 113 | | | 5 |
Total investment securities - available for sale | | | 1,610 | | | 15 | | | — | | | — | | | 1,610 | | | 15 |
Total investment securities | | $ | 127,218 | | $ | 9,183 | | $ | 35,528 | | $ | 4,927 | | $ | 162,746 | | $ | 14,110 |
The Corporation evaluates individual investment securities quarterly for other-than-temporary impairment. At March 31, 2023, $17.3 million of the $17.5 million of unrealized holding losses were in a loss position for 12 months or more; while at June 30, 2022, $4.9 million of the $14.1 million of unrealized holding losses were in a loss position for 12 months or more. The unrealized losses on investment securities were attributable to changes in interest rates, relative to when the investment securities were purchased, and not due to the credit quality of the investment securities; which are
10
predominately U.S. government sponsored enterprise (GSE) securities. Therefore, the Corporation has determined that the unrealized losses are temporary in nature due to the fluctuating nature of interest rates, as well as the Corporation’s intent and ability to hold these investments until maturity. As a part of the Corporation’s monthly risk assessment, the Corporation runs a number of stressed liquidity scenarios. These liquidity scenarios support the Corporation’s assessment that the Corporation has the ability to hold these securities until maturity and does not need to liquidate these investment securities in order to maintain adequate liquidity.
In order to maintain adequate liquidity, the Bank has established borrowing facilities with various counterparties. The Bank had a remaining borrowing capacity of $228.6 million as of March 31, 2023 at the Federal Home Loan Bank of San Francisco. In addition, the Bank has secured an estimated $146.8 million discount window facility at the Federal Reserve Bank of San Francisco collateralized by investment securities with March 31, 2023 balances of $157.1 million. As of March 31, 2023, the Bank also has a borrowing arrangement in the form of a federal funds facility with its correspondent bank for $50.0 million. The Bank had no advances under the Federal Reserve discount window or correspondent bank facility as of March 31, 2023.
At June 30, 2022, the Bank had a remaining borrowing capacity of $310.3 million at the Federal Home Loan Bank of San Francisco. In addition, the Bank had secured an estimated $168.4 million discount window facility at the Federal Reserve Bank of San Francisco collateralized by investment securities with June 30, 2022 balances of $191.1 million. As of June 30, 2022, the Bank also had a borrowing arrangement in the form of a federal funds facility with its correspondent bank for $50.0 million. The Bank had no advances under the Federal Reserve discount window or correspondent bank facility as of June 30, 2022.
At March 31, 2023 and 2022, the Corporation did not hold any investment securities with the intent to sell and determined it had the ability to hold these investment securities until maturity. It also determined that it was more likely than not that the Corporation would not be required to sell the securities prior to recovery of the amortized cost basis; therefore, no impairment losses were recorded for the quarters and nine months ended March 31, 2023 and 2022.
Contractual maturities of investment securities as of March 31, 2023 and June 30, 2022 were as follows:
| | | | | | | | | | | | |
| | March 31, 2023 | | June 30, 2022 | ||||||||
|
| | |
| Estimated |
| | |
| Estimated | ||
| | Amortized | | Fair | | Amortized | | Fair | ||||
(In Thousands) | | Cost | | Value | | Cost | | Value | ||||
Held to maturity |
| |
|
| |
|
| |
|
| |
|
Due in one year or less | | $ | 662 | | $ | 656 | | $ | 1,427 | | $ | 1,425 |
Due after one through five years | |
| 8,665 | |
| 8,406 | |
| 10,908 | |
| 10,805 |
Due after five through ten years | |
| 64,372 | |
| 58,501 | |
| 77,167 | |
| 72,625 |
Due after ten years | |
| 87,637 | |
| 76,307 | |
| 96,243 | |
| 86,869 |
Total investment securities - held to maturity | | | 161,336 | | | 143,870 | | | 185,745 | | | 171,724 |
| |
|
| |
|
| |
|
| |
|
|
Available for sale | |
|
| |
|
| |
|
| |
|
|
Due in one year or less | | | — | | | — | | | — | | | — |
Due after one through five years | |
| — | |
| — | |
| — | |
| — |
Due after five through ten years | |
| 390 | |
| 381 | |
| 98 | |
| 98 |
Due after ten years | |
| 1,905 | |
| 1,870 | |
| 2,583 | |
| 2,578 |
Total investment securities - available for sale | | | 2,295 | | | 2,251 | | | 2,681 | | | 2,676 |
Total investment securities | | $ | 163,631 | | $ | 146,121 | | $ | 188,426 | | $ | 174,400 |
11
Note 5: Loans Held for Investment
Loans held for investment, net of fair value adjustments, consisted of the following:
| | | | | | | |
| | March 31, | | June 30, | | ||
(In Thousands) | | 2023 |
| 2022 | | ||
Mortgage loans: |
| |
|
| |
|
|
Single-family | | $ | 512,632 | | $ | 378,234 | |
Multi-family | |
| 466,332 | |
| 464,676 | |
Commercial real estate | |
| 90,496 | |
| 90,429 | |
Construction | |
| 2,891 | |
| 3,216 | |
Other | |
| 108 | |
| 123 | |
Commercial business loans | |
| 1,640 | |
| 1,206 | |
Consumer loans | |
| 61 | |
| 86 | |
Total loans held for investment, gross | |
| 1,074,160 | |
| 937,970 | |
| |
|
| |
| | |
Advance payments of escrows | |
| 265 | |
| 47 | |
Deferred loan costs, net | |
| 9,280 | |
| 7,539 | |
Allowance for loan losses | |
| (6,001) | |
| (5,564) | |
Total loans held for investment, net | | $ | 1,077,704 | | $ | 939,992 | |
The following table sets forth information at March 31, 2023 regarding the dollar amount of loans held for investment that are contractually repricing during the periods indicated, segregated between adjustable rate loans and fixed rate loans. Fixed-rate loans comprised 11 percent of loans held for investment at both March 31, 2023 and June 30, 2022. Adjustable rate loans having no stated repricing dates that reprice when the index they are tied to reprices (e.g. prime rate index) and checking account overdrafts are reported as repricing within one year. The table does not include any estimate of prepayments which may cause the Corporation’s actual repricing experience to differ materially from that shown.
| | | | | | | | | | | | | | | | | | |
| | Adjustable Rate | | | | | | | ||||||||||
|
| | |
| After |
| After |
| After |
| | |
| | | |||
| | | Within | | One Year | | 3 Years | | 5 Years | | | | | | | |||
(In Thousands) | | One Year | | Through 3 Years | | Through 5 Years | | Through 10 Years | | Fixed Rate | | Total | ||||||
Mortgage loans: | | | | | | | | | | | | | | | | | | |
Single-family | | $ | 54,826 | | $ | 19,064 | | $ | 64,330 | | $ | 264,053 | | $ | 110,359 | | $ | 512,632 |
Multi-family | |
| 144,363 | |
| 130,700 | |
| 143,405 | |
| 47,726 | |
| 138 | |
| 466,332 |
Commercial real estate | |
| 42,412 | |
| 14,277 | |
| 32,511 | |
| — | |
| 1,296 | |
| 90,496 |
Construction | |
| 625 | |
| 174 | |
| — | |
| — | |
| 2,092 | |
| 2,891 |
Other | |
| — | |
| — | |
| — | |
| — | |
| 108 | |
| 108 |
Commercial business loans | |
| 1,574 | |
| — | |
| — | |
| — | |
| 66 | |
| 1,640 |
Consumer loans | |
| 61 | |
| — | |
| — | |
| — | |
| — | |
| 61 |
Total loans held for investment, gross | | $ | 243,861 | | $ | 164,215 | | $ | 240,246 | | $ | 311,779 | | $ | 114,059 | | $ | 1,074,160 |
The Corporation has developed an internal loan grading system to evaluate and quantify the Bank’s loans held for investment portfolio with respect to quality and risk. Management continually evaluates the credit quality of the Corporation’s loan portfolio and conducts a quarterly review of the adequacy of the allowance for loan losses using quantitative and qualitative methods. The Corporation has adopted an internal risk rating policy in which each loan is rated for credit quality with a rating of pass, special mention, substandard, doubtful or loss. The two primary components that are used during the loan review process to determine the proper allowance levels are individually evaluated allowances and collectively evaluated allowances. Quantitative loan loss factors are developed by determining the historical loss experience, expected future cash flows, discount rates and collateral fair values, among others. Qualitative loan loss factors are developed by assessing general economic indicators such as gross domestic product, retail sales, unemployment rates, employment growth, California home sales and median California home prices. The Corporation assigns individual factors for the quantitative and qualitative methods for each loan category and each internal risk rating.
12
The Corporation categorizes all of the loans held for investment into risk categories based on relevant information about the ability of the borrower to service their debt such as current financial information, historical payment experience, credit documentation, public information, and current economic trends, among other factors. A description of the general characteristics of the risk grades is as follows:
The following tables summarize gross loans held for investment, net of fair value adjustments, by loan types and risk category at the dates indicated:
| | | | | | | | | | | | | | | | | | | | | | | | |
| | March 31, 2023 | ||||||||||||||||||||||
| | | | | | | | Commercial | | | | | Other | | Commercial | | | | | | ||||
(In Thousands) |
| Single-family |
| Multi-family |
| Real Estate |
| Construction |
| Mortgage |
| Business |
| Consumer |
| Total | ||||||||
| | | | | | | | | | | | | | | | | | | | | | | | |
Pass | | $ | 510,643 | | $ | 465,821 | | $ | 89,946 | | $ | 2,891 | | $ | 108 | | $ | 1,640 | | $ | 61 | | $ | 1,071,110 |
Special Mention | |
| 962 | |
| 511 | |
| — | |
| — | | | — | |
| — | |
| — | |
| 1,473 |
Substandard | |
| 1,027 | |
| — | |
| 550 | |
| — | | | — | |
| — | |
| — | |
| 1,577 |
Total loans held for investment, gross | | $ | 512,632 | | $ | 466,332 | | $ | 90,496 | | $ | 2,891 | | $ | 108 | | $ | 1,640 | | $ | 61 | | $ | 1,074,160 |
| | | | | | | | | | | | | | | | | | | | | | | | |
| | June 30, 2022 | ||||||||||||||||||||||
|
| | |
| | |
| Commercial |
| | |
| | Other | | Commercial |
| | |
| | | ||
(In Thousands) | | Single-family | | Multi-family | | Real Estate | | Construction | | | Mortgage | | Business | | Consumer | | Total | |||||||
| | | | | | | | | | | | | | | | | | | | | | | | |
Pass | | $ | 376,502 | | $ | 464,676 | | $ | 90,429 | | $ | 3,216 | | $ | 123 | | $ | 1,206 | | $ | 86 | | $ | 936,238 |
Special Mention | |
| 224 | |
| — | |
| — | |
| — | | | — | |
| — | |
| — | |
| 224 |
Substandard | |
| 1,508 | |
| — | |
| — | |
| — | | | — | |
| — | |
| — | |
| 1,508 |
Total loans held for investment, gross | | $ | 378,234 | | $ | 464,676 | | $ | 90,429 | | $ | 3,216 | | $ | 123 | | $ | 1,206 | | $ | 86 | | $ | 937,970 |
The allowance for loan losses is maintained at a level sufficient to provide for estimated losses based on evaluating known and inherent risks in the loans held for investment and upon management’s continuing analysis of the factors underlying the quality of the loans held for investment. These factors include changes in the size and composition of the loans held for investment, actual loan loss experience, current economic conditions, detailed analysis of individual loans for which full collectability may not be assured, and determination of the realizable value of the collateral securing the loans. The provision (recovery) for (from) the allowance for loan losses is charged (credited) against operations on a quarterly basis, as necessary, to maintain the allowance at appropriate levels. Although management believes it uses the best information available to make such determinations, there can be no assurance that regulators, in reviewing the Corporation’s loans held for investment, will not request a significant increase in its allowance for loan losses. Future adjustments to the allowance for loan losses may be necessary and results of operations could be significantly and adversely affected as a result of economic, operating, regulatory, and other conditions beyond the Corporation’s control.
13
Non-performing loans are charged-off to their fair market values in the period the loans, or portion thereof, are deemed uncollectible, generally after the loan becomes 150 days delinquent for real estate secured first trust deed loans and 120 days delinquent for commercial business or real estate secured second trust deed loans. For loans that were modified from their original terms, were re-underwritten and identified in the Corporation’s asset quality reports as troubled debt restructurings (“restructured loans”), the charge-off occurs when the loan becomes 90 days delinquent; and where borrowers file bankruptcy, the charge-off occurs when the loan becomes 60 days delinquent. The amount of the charge-off is determined by comparing the loan balance to the estimated fair value of the underlying collateral, less disposition costs, with the loan balance in excess of the estimated fair value charged-off against the allowance for loan losses. The allowance for loan losses for non-performing loans is determined by applying ASC 310, “Receivables.” For restructured loans that are less than 90 days delinquent, the allowance for loan losses is segregated into (a) individually evaluated allowances for those loans with applicable discounted cash flow calculations still in their restructuring period, classified lower than pass, and containing an embedded loss component or (b) collectively evaluated allowances based on the aggregated pooling method. For non-performing loans less than 60 days delinquent where the borrower has filed bankruptcy, the collectively evaluated allowances are assigned based on the aggregated pooling method. For non-performing commercial real estate loans, an individually evaluated allowance is derived based on the loan's discounted cash flow fair value (for restructured loans) or collateral fair value less estimated selling costs and if the fair value is higher than the loan balance, no allowance is required.
The following table is provided to disclose additional details for the periods indicated on the Corporation’s allowance for loan losses:
| | | | | | | | | | | | | |
| | For the Quarter Ended |
| For the Nine Months Ended |
| ||||||||
| | March 31, | | March 31, |
| ||||||||
(Dollars in Thousands) |
| 2023 |
| 2022 |
| 2023 |
| 2022 |
| ||||
| | | | | | | | | | | | | |
Allowance at beginning of period | | $ | 5,830 | | $ | 6,608 | | $ | 5,564 | | $ | 7,587 | |
| | | | | | | | | | | | | |
Provision (recovery) for loan losses | |
| 169 | |
| (645) | |
| 430 | |
| (2,051) | |
| | | | | | | | | | | | | |
Recoveries: | |
|
| |
|
| |
|
| |
|
| |
Mortgage loans: | |
|
| |
|
| |
|
| |
|
| |
Single-family | |
| 2 | |
| 6 | |
| 7 | |
| 433 | |
Total recoveries | |
| 2 | |
| 6 | |
| 7 | |
| 433 | |
| | | | | | | | | | | | | |
Total charge-offs | |
| — | |
| — | |
| — | |
| — | |
| | | | | | | | | | | | | |
Net recoveries (charge-offs) | |
| 2 | |
| 6 | |
| 7 | |
| 433 | |
Balance at end of period | | $ | 6,001 | | $ | 5,969 | | $ | 6,001 | | $ | 5,969 |
|
| | | | | | | | | | | | | |
Allowance for loan losses as a percentage of gross loans held for investment at the end of the period | |
| 0.56 | % |
| 0.66 | % |
| 0.56 | % |
| 0.66 | % |
Net (recoveries) charge-offs as a percentage of average loans receivable, net, during the period (annualized) | |
| (0.00) | % |
| (0.00) | % |
| (0.00) | % |
| (0.07) | % |
Allowance for loan losses as a percentage of gross non-performing loans at the end of the period | | | 584.32 | % | | 268.15 | % | | 584.32 | % | | 268.15 | % |
14
The following tables denote the past due status of the Corporation's gross loans held for investment, net of fair value adjustments, at the dates indicated.
| | | | | | | | | | | | |
| | March 31, 2023 | ||||||||||
| | | | | 30-89 Days Past | | | | | Total Loans Held for | ||
(In Thousands) |
| Current |
| Due |
| Non-Accrual(1) |
| Investment, Gross | ||||
| | | | | | | | | | | | |
Mortgage loans: | | | | | | | | | | | | |
Single-family | | $ | 510,643 | | $ | 962 | | $ | 1,027 | | $ | 512,632 |
Multi-family | |
| 466,332 | |
| — | |
| — | |
| 466,332 |
Commercial real estate | |
| 90,496 | |
| — | |
| — | |
| 90,496 |
Construction | |
| 2,891 | |
| — | |
| — | |
| 2,891 |
Other | |
| 108 | |
| — | |
| — | |
| 108 |
Commercial business loans | |
| 1,640 | |
| — | |
| — | |
| 1,640 |
Consumer loans | |
| 60 | |
| 1 | |
| — | |
| 61 |
Total loans held for investment, gross | | $ | 1,072,170 | | $ | 963 | | $ | 1,027 | | $ | 1,074,160 |
| | | | | | | | | | | | | | | |
| | | Owner | | | Non-Owner | | | | % of Total | | | Weighted | | |
June 30, 2023 | | | Occupied Loan | | | Occupied Loan | | | Total | | Commercial | | | Average | |
(Dollars In Thousands) | | Balance | | | Balance | | | Balance | Real Estate | | | LTV (1) | | ||
Office | | $ | 9,283 | | $ | 23,915 | | $ | 33,198 | | 37 | % | | 44 | % |
Mixed use (2) | |
| 306 | |
| 17,614 | |
| 17,920 | | 20 | | | 36 | % |
Retail | | | — | | | 12,991 | | | 12,991 | | 14 | | | 32 | % |
Warehouse | | | 2,133 | | | 8,511 | | | 10,644 | | 12 | | | 31 | % |
Mobile home park | | | — | | | 7,057 | | | 7,057 | | 8 | | | 39 | % |
Medical/dental office | | | 1,117 | | | 5,524 | | | 6,641 | | 7 | | | 50 | % |
Restaurant/fast food | | | — | | | 1,014 | | | 1,014 | | 1 | | | 24 | % |
Automotive - non gasoline | |
| — | |
| 485 | |
| 485 |
| 1 | |
| 19 | % |
Live/work | | | — | | | 337 | | | 337 | | — | | | 15 | % |
Light industrial/manufacturing | | | — | | | 271 | | | 271 | | — | | | 8 | % |
Total commercial real estate | | $ | 12,839 | | $ | 77,719 | | $ | 90,558 | | 100 | % | | 38 | % |
(1) |
(2) | Mixed use includes $8.2 million in Office/Retail, $5.6 million in Multi-family/Retail, $3.4 million in Other Mixed Use and $700,000 in Multi-family/Office.. |
The following tables present the Corporation’s commercial real estate loans by geographic concentration as of March 31, 2024 and June 30, 2023:
| | | | | | | | | | | | |
| | June 30, 2022 | ||||||||||
|
| | |
| 30-89 Days Past |
| | |
| Total Loans Held for | ||
(In Thousands) | | Current | | Due | | Non-Accrual(1) | | Investment, Gross | ||||
| | | | | | | | | | | | |
Mortgage loans: | | | | | | | | | | | | |
Single-family | | $ | 376,726 | | $ | — | | $ | 1,508 | | $ | 378,234 |
Multi-family | |
| 464,676 | |
| — | |
| — | |
| 464,676 |
Commercial real estate | |
| 90,429 | |
| — | |
| — | |
| 90,429 |
Construction | |
| 3,216 | |
| — | |
| — | |
| 3,216 |
Other | | | 123 | |
| — | |
| — | |
| 123 |
Commercial business loans | |
| 1,206 | |
| — | |
| — | |
| 1,206 |
Consumer loans | |
| 83 | |
| 3 | |
| — | |
| 86 |
Total loans held for investment, gross | | $ | 936,459 | | $ | 3 | | $ | 1,508 | | $ | 937,970 |
| | | | | | | | | | | | | | | | | | | | | |
| | Inland | | Southern | | Other | | | | | |
| |||||||||
March 31, 2024 | | Empire | | California(1) | | California | | Total |
| ||||||||||||
(Dollars in Thousands) | | Balance | | % | | Balance | | % | | Balance | | % | | Balance | | % |
| ||||
Owner occupied: | | | | | | | | | | | | | | | | | | | | | |
Office | | $ | 1,556 |
| 23 | % | $ | 4,984 |
| 74 | % | $ | 193 |
| 3 | % | $ | 6,733 |
| 100 | % |
Mixed use | | | — | | — | % | | — | | — | % | | 296 | | 100 | % | | 296 | | 100 | % |
Warehouse | | | — | | — | % | | 1,699 | | 81 | % | | 390 | | 19 | % | | 2,089 | | 100 | % |
Medical/dental office | | | 277 | | 11 | % | | 1,801 | | 74 | % | | 375 | | 15 | % | | 2,453 | | 100 | % |
Restaurant/fast food | | | — | | — | % | | 692 | | 100 | % | | — | | — | % | | 692 | | 100 | % |
Total owner occupied | | | 1,833 | | 15 | % | | 9,176 | | 75 | % | | 1,254 | | 10 | % | | 12,263 | | 100 | % |
| | | | | | | | | | | | | | | | | | | | | |
Non-owner occupied: | | | | | | | | | | | | | | | | | | | | | |
Office | | | 2,969 | | 15 | % | | 13,920 | | 69 | % | | 3,327 | | 16 | % | | 20,216 | | 100 | % |
Mixed use | | | 539 | | 3 | % | | 6,277 | | 40 | % | | 9,102 | | 57 | % | | 15,918 | | 100 | % |
Retail | | | 1,056 | | 9 | % | | 6,713 | | 55 | % | | 4,485 | | 36 | % | | 12,254 | | 100 | % |
Warehouse | | | 609 | | 6 | % | | 4,790 | | 48 | % | | 4,540 | | 46 | % | | 9,939 | | 100 | % |
Mobile home park | | | 4,886 | | 70 | % | | 359 | | 5 | % | | 1,700 | | 25 | % | | 6,945 | | 100 | % |
Medical/dental office | |
| 1,847 |
| 39 | % |
| 2,172 |
| 46 | % |
| 693 |
| 15 | % |
| 4,712 |
| 100 | % |
Automotive - non gasoline | |
| — |
| — | % |
| 580 |
| 100 | % |
| — |
| — | % |
| 580 |
| 100 | % |
Live/work | |
| — |
| — | % |
| — |
| — | % |
| 309 |
| 100 | % |
| 309 |
| 100 | % |
Total non-owner occupied | | | 11,906 | | 17 | % | | 34,811 | | 49 | % | | 24,156 | | 34 | % | | 70,873 | | 100 | % |
| | | | | | | | | | | | | | | | | | | | | |
Total commercial real estate | | $ | 13,739 |
| 16 | % | $ | 43,987 |
| 53 | % | $ | 25,410 |
| 31 | % | $ | 83,136 |
| 100 | % |
15
The following tables summarize the Corporation’s allowance for loan losses and recorded investment in gross loans, by portfolio type, at the dates and for the periods indicated.
| | | | | | | | | | | | | | | | | | | | | | | | | |
|
| Quarter Ended March 31, 2023 |
| ||||||||||||||||||||||
| | Single- | | Multi- | | Commercial | | | | | | | | Commercial | | | | | | | | ||||
(In Thousands) |
| family |
| family |
| Real Estate | | Construction | | Other |
| Business | | Consumer | | Total | | ||||||||
Allowance for loan losses: |
| |
|
| |
|
| |
|
| |
|
| |
|
| |
|
| |
|
| |
|
|
Allowance at beginning of period | | $ | 1,600 | | $ | 3,300 | | $ | 847 | | $ | 17 | | $ | 3 | | $ | 58 | | $ | 5 | | $ | 5,830 | |
Provision (recovery) for loan losses | |
| 127 | |
| 7 | |
| 21 | |
| 4 | |
| (1) | |
| 12 | |
| (1) | |
| 169 | |
Recoveries | |
| 2 | |
| — | |
| — | |
| — | |
| — | |
| — | |
| — | |
| 2 | |
Charge-offs | |
| — | |
| — | |
| — | |
| — | |
| — | |
| — | |
| — | |
| — | |
Allowance for loan losses, end of period | | $ | 1,729 | | $ | 3,307 | | $ | 868 | | $ | 21 | | $ | 2 | | $ | 70 | | $ | 4 | | $ | 6,001 | |
| | | | | | | | | | | | | | | | | | | | | | | | | |
Allowance for loan losses: | |
| | |
| | |
| | |
| | |
| | |
| | |
| | |
| | |
Individually evaluated for impairment | | $ | 38 | | $ | — | | $ | — | | $ | — | | $ | — | | $ | — | | $ | — | | $ | 38 | |
Collectively evaluated for impairment | |
| 1,691 | |
| 3,307 | |
| 868 | |
| 21 | |
| 2 | |
| 70 | |
| 4 | |
| 5,963 | |
Allowance for loan losses, end of period | | $ | 1,729 | | $ | 3,307 | | $ | 868 | | $ | 21 | | $ | 2 | | $ | 70 | | $ | 4 | | $ | 6,001 | |
| | | | | | | | | | | | | | | | | | | | | | | | | |
Loans held for investment: | |
| | |
| | |
| | |
| | |
| | |
| | |
| | |
| | |
Individually evaluated for impairment | | $ | 804 | | $ | — | | $ | — | | $ | — | | $ | — | | $ | — | | $ | — | | $ | 804 | |
Collectively evaluated for impairment | |
| 511,828 | |
| 466,332 | |
| 90,496 | |
| 2,891 | |
| 108 | |
| 1,640 | |
| 61 | |
| 1,073,356 | |
Total loans held for investment, gross | | $ | 512,632 | | $ | 466,332 | | $ | 90,496 | | $ | 2,891 | | $ | 108 | | $ | 1,640 | | $ | 61 | | $ | 1,074,160 | |
Allowance for loan losses as a percentage of gross loans held for investment | |
| 0.34 | % |
| 0.71 | % |
| 0.96 | % |
| 0.73 | % |
| 1.85 | % |
| 4.27 | % |
| 6.56 | % |
| 0.56 | % |
Net (recoveries) charge-offs to average loans receivable, net during the period | | | — | % | | — | % | | — | % | | — | % | | — | % | | — | % | | — | % | | — | % |
16
| | | | | | | | | | | | | | | | | | | | | | | | | |
|
| Quarter Ended March 31, 2022 | | ||||||||||||||||||||||
| | Single- | | Multi- | | Commercial | | | | | | | | Commercial | | | | | | | | ||||
(In Thousands) |
| family |
| family |
| Real Estate | | Construction |
| | Other | Business | | Consumer | | Total | | ||||||||
Allowance for loan losses: |
| |
|
| |
|
| |
|
| |
|
| | | | |
|
| |
|
| |
|
|
Allowance at beginning of period | | $ | 1,396 | | $ | 4,219 | | $ | 915 | | $ | 55 | | $ | 3 | | $ | 15 | | $ | 5 | | $ | 6,608 | |
(Recovery) provision for loan losses | |
| (64) | |
| (544) | |
| (45) | |
| 4 | |
| — | |
| 5 | |
| (1) | |
| (645) | |
Recoveries | |
| 6 | |
| — | |
| — | |
| — | |
| — | |
| — | |
| — | |
| 6 | |
Charge-offs | |
| — | |
| — | |
| — | |
| — | |
| — | |
| — | |
| — | |
| — | |
Allowance for loan losses, end of period | | $ | 1,338 | | $ | 3,675 | | $ | 870 | | $ | 59 | | $ | 3 | | $ | 20 | | $ | 4 | | $ | 5,969 | |
| | | | | | | | | | | | | | | | | | | | | | | | | |
Allowance for loan losses: | |
|
| |
|
| |
|
| |
|
| |
|
| |
|
| |
|
| |
|
| |
Individually evaluated for impairment | | $ | 51 | | $ | — | | $ | — | | $ | — | | $ | — | | $ | — | | $ | — | | $ | 51 | |
Collectively evaluated for impairment | |
| 1,287 | |
| 3,675 | |
| 870 | |
| 59 | |
| 3 | |
| 20 | |
| 4 | |
| 5,918 | |
Allowance for loan losses, end of period | | $ | 1,338 | | $ | 3,675 | | $ | 870 | | $ | 59 | | $ | 3 | | $ | 20 | | $ | 4 | | $ | 5,969 | |
| | | | | | | | | | | | | | | | | | | | | | | | | |
Loans held for investment: | |
|
| |
|
| |
|
| |
|
| |
|
| |
|
| |
|
| |
|
| |
Individually evaluated for impairment | | $ | 1,549 | | $ | — | | $ | — | | $ | — | | $ | — | | $ | — | | $ | — | | $ | 1,549 | |
Collectively evaluated for impairment | |
| 326,112 | |
| 468,656 | |
| 91,344 | |
| 4,127 | |
| 131 | |
| 459 | |
| 73 | |
| 890,902 | |
Total loans held for investment, gross | | $ | 327,661 | | $ | 468,656 | | $ | 91,344 | | $ | 4,127 | | $ | 131 | | $ | 459 | | $ | 73 | | $ | 892,451 | |
Allowance for loan losses as a percentage of gross loans held for investment | |
| 0.41 | % |
| 0.78 | % |
| 0.95 | % |
| 1.43 | % |
| 2.29 | % |
| 4.36 | % |
| 5.48 | % |
| 0.66 | % |
Net (recoveries) charge-offs to average loans receivable, net during the period | | | (0.01) | % | | — | % | | — | % | | — | % | | — | % | | — | % | | — | % | | — | % |
| | | | | | | | | | | | | | | | | | | | | |
| | Inland | | Southern | | Other | | | | | |
| |||||||||
June 30, 2023 | | Empire | | California(1) | | California | | Total |
| ||||||||||||
(Dollars in Thousands) | | Balance | | % | | Balance | | % | | Balance | | % | | Balance | | % |
| ||||
Owner occupied: | | | | | | | | | | | | | | | | | | | | | |
Office | | $ | 2,649 | | 29 | % | $ | 6,436 | | 69 | % | $ | 198 | | 2 | % | $ | 9,283 |
| 100 | % |
Mixed use | | | — | | — | % | | — | | — | % | | 306 | | 100 | % | | 306 |
| 100 | % |
Warehouse | | | — | | — | % | | 1,733 | | 81 | % | | 400 | | 19 | % | | 2,133 |
| 100 | % |
Medical/dental office | | | 281 | | 25 | % | | 453 | | 41 | % | | 383 | | 34 | % | | 1,117 |
| 100 | % |
Total owner occupied | | | 2,930 | | 23 | % | | 8,622 | | 67 | % | | 1,287 | | 10 | % | | 12,839 |
| 100 | % |
| | | | | | | | | | | | | | | | | | | | | |
Non-owner occupied: | | | | | | | | | | | | | | | | | | | | | |
Office | | | 4,420 | | 18 | % | | 14,767 | | 62 | % | | 4,728 | | 20 | % | | 23,915 | | 100 | % |
Mixed use | | | 660 | | 4 | % | | 7,292 | | 41 | % | | 9,662 | | 55 | % | | 17,614 | | 100 | % |
Retail | | | 1,076 | | 8 | % | | 7,353 | | 57 | % | | 4,562 | | 35 | % | | 12,991 | | 100 | % |
Warehouse | | | 623 | | 7 | % | | 5,690 | | 67 | % | | 2,198 | | 26 | % | | 8,511 | | 100 | % |
Mobile home park | | | 4,967 | | 70 | % | | 364 | | 5 | % | | 1,726 | | 25 | % | | 7,057 | | 100 | % |
Medical/dental office | |
| 1,910 |
| 35 | % |
| 3,325 |
| 60 | % |
| 289 |
| 5 | % |
| 5,524 |
| 100 | % |
Restaurant/fast food | | | — | | — | % | | 1,014 | | 100 | % | | — | | — | % | | 1,014 |
| 100 | % |
Automotive - non gasoline | |
| — |
| — | % |
| 485 |
| 100 | % |
| — |
| — | % |
| 485 |
| 100 | % |
Live/work | |
| — |
| — | % |
| — |
| — | % |
| 337 |
| 100 | % |
| 337 |
| 100 | % |
Light industrial/ manufacturing | | | — | | — | % | | 271 | | 100 | % | | — | | — | % | | 271 |
| 100 | % |
Total non-owner occupied | | | 13,656 | | 18 | % | | 40,561 | | 52 | % | | 23,502 | | 30 | % | | 77,719 | | 100 | % |
| | | | | | | | | | | | | | | | | | | | | |
Total commercial real estate | | $ | 16,586 |
| 18 | % | $ | 49,183 |
| 54 | % | $ | 24,789 |
| 28 | % | $ | 90,558 |
| 100 | % |
The Corporation has developed an internal loan grading system to evaluate and quantify loans held for investment with respect to quality and risk. Management continually evaluates the credit quality of the loan portfolio and conducts a quarterly review of the adequacy of the ACL. The Corporation has adopted an internal risk rating policy in which each loan is rated for credit quality with a rating of pass, special mention, substandard, doubtful or loss.
The two primary components that are used during the loan review process to determine the proper allowance levels are individually evaluated allowances and collectively evaluated allowances. The collectively evaluated allowance is based on a pooling method for groups of homogeneous loans sharing similar loan characteristics to calculate an allowance which reflects an estimate of lifetime expected credit losses using historical experience, current conditions, and reasonable and supportable forecasts. Loans identified to be individually evaluated have an allowance that is based upon the appraised value of the collateral, less selling costs or discounted cash flow with an appropriate default factor.
The Corporation categorizes all of the loans held for investment into risk categories based on relevant information about the ability of the borrower to service their debt such as current financial information, historical payment experience, credit documentation, public information, and current economic trends, among other factors. A description of the general characteristics of the risk grades is as follows:
● | Pass - These loans range from minimal credit risk to average, but still acceptable, credit risk. The likelihood of loss is considered remote. |
● | Special Mention - A special mention loan has potential weaknesses that may be temporary or, if left uncorrected, may result in a loss. While concerns exist, the Corporation is currently protected and loss is considered unlikely and not imminent. |
● | Substandard - A substandard loan is inadequately protected by the current sound worth and paying capacity of the borrower or of the collateral pledged, if any. Loans so classified must have a well-defined weakness, or |
16
weaknesses, that may jeopardize the liquidation of the debt. A substandard loan is characterized by the distinct possibility that the Corporation will sustain some loss if the deficiencies are not corrected. |
● | Doubtful - A doubtful loan has all of the weaknesses inherent in one classified as substandard with the added characteristic that the weaknesses make collection or liquidation in full, on the basis of the currently existing facts, conditions and values, highly questionable and improbable. |
● | Loss - A loss loan is considered uncollectible and of such little value that continuance as an asset of the institution is not warranted. |
17
The following table presents the Corporation’s recorded investment in loans by risk categories and gross charge-offs by year of origination as of March 31, 2024:
| | | | | | | | | | | | | | | | | | | | | | | | | |
| | Nine Months Ended March 31, 2023 |
| ||||||||||||||||||||||
| | | | | | | | Commercial | | | | | | | | Commercial | | | | | | | | ||
(In Thousands) |
| Single-family |
| Multi-family |
| Real Estate |
| Construction |
| Other |
| Business |
| Consumer |
| Total |
| ||||||||
Allowance for loan losses: | | | | | | | | | | | | | | | | | | | | | | | | |
|
Allowance at beginning of period | | $ | 1,383 | | $ | 3,282 | | $ | 816 | | $ | 23 | | $ | 3 | | $ | 52 | | $ | 5 | | $ | 5,564 | |
Provision (recovery) for loan losses | |
| 339 | |
| 25 | |
| 52 | |
| (2) | |
| (1) | |
| 18 | |
| (1) | |
| 430 | |
Recoveries | |
| 7 | |
| — | |
| — | |
| — | |
| — | |
| — | |
| — | |
| 7 | |
Charge-offs | |
| — | |
| — | |
| — | |
| — | |
| — | |
| — | |
| — | |
| — | |
Allowance for loan losses, end of period | | $ | 1,729 | | $ | 3,307 | | $ | 868 | | $ | 21 | | $ | 2 | | $ | 70 | | $ | 4 | | $ | 6,001 | |
| | | | | | | | | | | | | | | | | | | | | | | | | |
Allowance for loan losses: | | | | | | | | | | | | | | | | | | | | | | | | | |
Individually evaluated for impairment | | $ | 38 | | $ | — | | $ | — | | $ | — | | $ | — | | $ | — | | $ | — | | $ | 38 | |
Collectively evaluated for impairment | |
| 1,691 | |
| 3,307 | |
| 868 | |
| 21 | |
| 2 | |
| 70 | |
| 4 | |
| 5,963 | |
Allowance for loan losses, end of period | | $ | 1,729 | | $ | 3,307 | | $ | 868 | | $ | 21 | | $ | 2 | | $ | 70 | | $ | 4 | | $ | 6,001 | |
| | | | | | | | | | | | | | | | | | | | | | | | | |
Loans held for investment: | | | | | | | | | | | | | | | | | | | | | | | | | |
Individually evaluated for impairment | | $ | 804 | | $ | — | | $ | — | | $ | — | | $ | — | | $ | — | | $ | — | | $ | 804 | |
Collectively evaluated for impairment | |
| 511,828 | |
| 466,332 | |
| 90,496 | |
| 2,891 | |
| 108 | |
| 1,640 | |
| 61 | |
| 1,073,356 | |
Total loans held for investment, gross | | $ | 512,632 | | $ | 466,332 | | $ | 90,496 | | $ | 2,891 | | $ | 108 | | $ | 1,640 | | $ | 61 | | $ | 1,074,160 | |
Allowance for loan losses as a percentage of gross loans held for investment | |
| 0.34 | % |
| 0.71 | % |
| 0.96 | % |
| 0.73 | % |
| 1.85 | % |
| 4.27 | % |
| 6.56 | % |
| 0.56 | % |
Net (recoveries) charge-offs to average loans receivable, net during the period | | | — | % | | — | % | | — | % | | — | % | | — | % | | — | % | | — | % | | — | % |
| | | | | | | | | | | | | | | | | | | | | | | | |
March 31, 2024 | | Term Loans by Year of Origination | | Revolving | | | | |||||||||||||||||
(In Thousands) |
| 2024 |
| 2023 |
| 2022 |
| 2021 |
| 2020 |
| Prior |
| Loans |
| Total | ||||||||
Mortgage loans: | | | | | | | | | | | | | | | | | | | | | | | | |
Single-family: | | | | | | | | | | | | | | | | | | | | | | | | |
Pass | | $ | 8,944 | | $ | 63,451 | | $ | 208,980 | | $ | 150,992 | | $ | 19,728 | | $ | 61,770 | | $ | 17 | | $ | 513,882 |
Special Mention | | | - | | | - | | | - | | | 538 | | | - | | | 386 | | | - | | | 924 |
Substandard | | | - | | | - | | | - | | | - | | | - | | | 2,233 | | | - | | | 2,233 |
Total single-family | | | 8,944 | | | 63,451 | | | 208,980 | | | 151,530 | | | 19,728 | | | 64,389 | | | 17 | | | 517,039 |
Current period gross charge-off | | $ | - | | $ | - | | $ | - | | $ | - | | $ | - | | $ | - | | $ | - | | $ | - |
| | | | | | | | | | | | | | | | | | | | | | | | |
Multi-family: | | | | | | | | | | | | | | | | | | | | | | | | |
Pass | | | 5,864 | | | 28,966 | | | 76,236 | | | 89,392 | | | 62,089 | | | 192,779 | | | - | | | 455,326 |
Special Mention | | | - | | | - | | | - | | | 479 | | | - | | | 541 | | | - | | | 1,020 |
Substandard | | | - | | | - | | | - | | | - | | | - | | | 1,055 | | | - | | | 1,055 |
Total multi-family | | | 5,864 | | | 28,966 | | | 76,236 | | | 89,871 | | | 62,089 | | | 194,375 | | | - | | | 457,401 |
Current period gross charge-off | | $ | - | | $ | - | | $ | - | | $ | - | | $ | - | | $ | - | | $ | - | | $ | - |
| | | | | | | | | | | | | | | | | | | | | | | | |
Commercial real estate: | | | | | | | | | | | | | | | | | | | | | | | | |
Pass | | | 2,172 | | | 13,845 | | | 23,428 | | | 4,045 | | | 5,486 | | | 34,160 | | | - | | | 83,136 |
Special Mention | | | - | | | - | | | - | | | - | | | - | | | - | | | - | | | - |
Substandard | | | - | | | - | | | - | | | - | | | - | | | - | | | - | | | - |
Total commercial real estate | | | 2,172 | | | 13,845 | | | 23,428 | | | 4,045 | | | 5,486 | | | 34,160 | | | - | | | 83,136 |
Current period gross charge-off | | $ | - | | $ | - | | $ | - | | $ | - | | $ | - | | $ | - | | $ | - | | $ | - |
| | | | | | | | | | | | | | | | | | | | | | | | |
Construction: | | | | | | | | | | | | | | | | | | | | | | | | |
Pass | | | - | | | 226 | | | 835 | | | 1,684 | | | - | | | - | | | - | | | 2,745 |
Special Mention | | | - | | | - | | | - | | | - | | | - | | | - | | | - | | | - |
Substandard | | | - | | | - | | | - | | | - | | | - | | | - | | | - | | | - |
Total construction | | | - | | | 226 | | | 835 | | | 1,684 | | | - | | | - | | | - | | | 2,745 |
Current period gross charge-off | | $ | - | | $ | - | | $ | - | | $ | - | | $ | - | | $ | - | | $ | - | | $ | - |
| | | | | | | | | | | | | | | | | | | | | | | | |
Other: | | | | | | | | | | | | | | | | | | | | | | | | |
Pass | | | - | | | - | | | - | | | - | | | 99 | | | - | | | - | | | 99 |
Special Mention | | | - | | | - | | | - | | | - | | | - | | | - | | | - | | | - |
Substandard | | | - | | | - | | | - | | | - | | | - | | | - | | | - | | | - |
Total other | | | - | | | - | | | - | | | - | | | 99 | | | - | | | - | | | 99 |
Current period gross charge-off | | $ | - | | $ | - | | $ | - | | $ | - | | $ | - | | $ | - | | $ | - | | $ | - |
| | | | | | | | | | | | | | | | | | | | | | | | |
Commercial business loans: | | | | | | | | | | | | | | | | | | | | | | | | |
Pass | | | - | | | - | | | 142 | | | - | | | - | | | - | | | 2,693 | | | 2,835 |
Special Mention | | | - | | | - | | | - | | | - | | | - | | | - | | | - | | | - |
Substandard | | | - | | | - | | | - | | | - | | | - | | | - | | | - | | | - |
Total commercial business loans | | | - | | | - | | | 142 | | | - | | | - | | | - | | | 2,693 | | | 2,835 |
Current period gross charge-off | | $ | - | | $ | - | | $ | - | | $ | - | | $ | - | | $ | - | | $ | - | | $ | - |
| | | | | | | | | | | | | | | | | | | | | | | | |
Consumer loans: | | | | | | | | | | | | | | | | | | | | | | | | |
Not graded | | | 15 | | | - | | | - | | | - | | | - | | | - | | | - | | | 15 |
Pass | | | - | | | - | | | - | | | - | | | - | | | - | | | 45 | | | 45 |
Special Mention | | | - | | | - | | | - | | | - | | | - | | | - | | | - | | | - |
Substandard | | | - | | | - | | | - | | | - | | | - | | | - | | | - | | | - |
Total consumer loans | | | 15 | | | - | | | - | | | - | | | - | | | - | | | 45 | | | 60 |
Current period gross charge-off | | $ | - | | $ | - | | $ | - | | $ | - | | $ | - | | $ | - | | $ | - | | $ | - |
| | | | | | | | | | | | | | | | | | | | | | | | |
Total loans held for investment, gross | | $ | 16,995 | | $ | 106,488 | | $ | 309,621 | | $ | 247,130 | | $ | 87,402 | | $ | 292,924 | | $ | 2,755 | | $ | 1,063,315 |
Total current period gross charge-offs | | $ | — | | $ | — | | $ | — | | $ | — | | $ | — | | $ | — | | $ | — | | $ | — |
18
The following table presents the Corporation’s recorded investment in loans by risk categories by year of origination as of June 30, 2023:
| | | | | | | | | | | | | | | | | | | | | | | | | |
| | Nine Months Ended March 31, 2022 |
| ||||||||||||||||||||||
| | | | | | | | Commercial | | | | | | | | Commercial | | | | | | | | ||
(In Thousands) |
| Single-family |
| Multi-family |
| Real Estate |
| Construction |
| Other |
| Business |
| Consumer |
| Total |
| ||||||||
Allowance for loan losses: | | | | | | | | | | | | | | | | | | | | | | | | |
|
Allowance at beginning of period | | $ | 2,000 | | $ | 4,485 | | $ | 1,006 | | $ | 51 | | $ | 3 | | $ | 36 | | $ | 6 | | $ | 7,587 | |
(Recovery) provision for loan losses | |
| (1,095) | |
| (810) | |
| (136) | |
| 8 | |
| — | |
| (16) | |
| (2) | |
| (2,051) | |
Recoveries | |
| 433 | |
| — | |
| — | |
| — | |
| — | |
| — | |
| — | |
| 433 | |
Charge-offs | |
| — | |
| — | |
| — | |
| — | |
| — | |
| — | |
| — | |
| — | |
Allowance for loan losses, end of period | | $ | 1,338 | | $ | 3,675 | | $ | 870 | | $ | 59 | | $ | 3 | | $ | 20 | | $ | 4 | | $ | 5,969 | |
| | | | | | | | | | | | | | | | | | | | | | | | | |
Allowance for loan losses: | |
| | | | | | | | | | | | | | | | | | | | | | | |
Individually evaluated for impairment | | $ | 51 | | $ | — | | $ | — | | $ | — | | $ | — | | $ | — | | $ | — | | $ | 51 | |
Collectively evaluated for impairment | |
| 1,287 | |
| 3,675 | |
| 870 | |
| 59 | |
| 3 | |
| 20 | |
| 4 | |
| 5,918 | |
Allowance for loan losses, end of period | | $ | 1,338 | | $ | 3,675 | | $ | 870 | | $ | 59 | | $ | 3 | | $ | 20 | | $ | 4 | | $ | 5,969 | |
| | | | | | | | | | | | | | | | | | | | | | | | | |
Loans held for investment: | |
| | | | | | | | | | | | | | | | | | | | | | | |
Individually evaluated for impairment | | $ | 1,549 | | $ | — | | $ | — | | $ | — | | $ | — | | $ | — | | $ | — | | $ | 1,549 | |
Collectively evaluated for impairment | |
| 326,112 | |
| 468,656 | |
| 91,344 | |
| 4,127 | |
| 131 | |
| 459 | |
| 73 | |
| 890,902 | |
Total loans held for investment, gross | | $ | 327,661 | | $ | 468,656 | | $ | 91,344 | | $ | 4,127 | | $ | 131 | | $ | 459 | | $ | 73 | | $ | 892,451 | |
Allowance for loan losses as a percentage of gross loans held for investment | |
| 0.41 | % |
| 0.78 | % |
| 0.95 | % |
| 1.43 | % |
| 2.29 | % |
| 4.36 | % |
| 5.48 | % |
| 0.66 | % |
Net (recoveries) charge-offs to average loans receivable, net during the period | | | (0.20) | % | | — | % | | — | % | | — | % | | — | % | | — | % | | — | % | | (0.07) | % |
| | | | | | | | | | | | | | | | | | | | | | | | |
June 30, 2023 | | Term Loans by Year of Origination | | Revolving | | | | |||||||||||||||||
(In Thousands) |
| 2023 |
| 2022 |
| 2021 |
| 2020 |
| 2019 |
| Prior |
| Loans |
| Total | ||||||||
Mortgage loans: | | | | | | | | | | | | | | | | | | | | | | | | |
Single-family: | | | | | | | | | | | | | | | | | | | | | | | | |
Pass | | $ | 51,378 | | $ | 216,989 | | $ | 157,015 | | $ | 20,741 | | $ | 11,793 | | $ | 59,451 | | $ | 32 | | $ | 517,399 |
Special Mention | | | - | | | - | | | - | | | - | | | - | | | - | | | - | | | - |
Substandard | | | - | | | - | | | - | | | 251 | | | - | | | 1,171 | | | - | | | 1,422 |
Total single-family | | | 51,378 | | | 216,989 | | | 157,015 | | | 20,992 | | | 11,793 | | | 60,622 | | | 32 | | | 518,821 |
Current period gross charge-off | | $ | - | | $ | - | | $ | - | | $ | - | | $ | - | | $ | - | | $ | - | | $ | - |
| | | | | | | | | | | | | | | | | | | | | | | | |
Multi-family: | | | | | | | | | | | | | | | | | | | | | | | | |
Pass | | | 17,429 | | | 77,956 | | | 90,926 | | | 65,127 | | | 59,709 | | | 149,456 | | | - | | | 460,603 |
Special Mention | | | - | | | - | | | 510 | | | - | | | - | | | - | | | - | | | 510 |
Substandard | | | - | | | - | | | - | | | - | | | - | | | - | | | - | | | - |
Total multi-family | | | 17,429 | | | 77,956 | | | 91,436 | | | 65,127 | | | 59,709 | | | 149,456 | | | - | | | 461,113 |
Current period gross charge-off | | $ | - | | $ | - | | $ | - | | $ | - | | $ | - | | $ | - | | $ | - | | $ | - |
| | | | | | | | | | | | | | | | | | | | | | | | |
Commercial real estate: | | | | | | | | | | | | | | | | | | | | | | | | |
Pass | | | 8,586 | | | 23,815 | | | 5,527 | | | 6,525 | | | 9,981 | | | 35,577 | | | - | | | 90,011 |
Special Mention | | | - | | | - | | | - | | | - | | | - | | | - | | | - | | | - |
Substandard | | | - | | | - | | | - | | | - | | | - | | | 547 | | | - | | | 547 |
Total commercial real estate | | | 8,586 | | | 23,815 | | | 5,527 | | | 6,525 | | | 9,981 | | | 36,124 | | | - | | | 90,558 |
Current period gross charge-off | | $ | - | | $ | - | | $ | - | | $ | - | | $ | - | | $ | - | | $ | - | | $ | - |
| | | | | | | | | | | | | | | | | | | | | | | | |
Construction: | | | | | | | | | | | | | | | | | | | | | | | | |
Pass | | | 94 | | | 726 | | | 1,116 | | | - | | | - | | | - | | | - | | | 1,936 |
Special Mention | | | - | | | - | | | - | | | - | | | - | | | - | | | - | | | - |
Substandard | | | - | | | - | | | - | | | - | | | - | | | - | | | - | | | - |
Total construction | | | 94 | | | 726 | | | 1,116 | | | - | | | - | | | - | | | - | | | 1,936 |
Current period gross charge-off | | $ | - | | $ | - | | $ | - | | $ | - | | $ | - | | $ | - | | $ | - | | $ | - |
| | | | | | | | | | | | | | | | | | | | | | | | |
Other: | | | | | | | | | | | | | | | | | | | | | | | | |
Pass | | | - | | | - | | | - | | | 106 | | | - | | | - | | | - | | | 106 |
Special Mention | | | - | | | - | | | - | | | - | | | - | | | - | | | - | | | - |
Substandard | | | - | | | - | | | - | | | - | | | - | | | - | | | - | | | - |
Total other | | | - | | | - | | | - | | | 106 | | | - | | | - | | | - | | | 106 |
Current period gross charge-off | | $ | - | | $ | - | | $ | - | | $ | - | | $ | - | | $ | - | | $ | - | | $ | - |
| | | | | | | | | | | | | | | | | | | | | | | | |
Commercial business loans: | | | | | | | | | | | | | | | | | | | | | | | | |
Pass | | | - | | | 171 | | | - | | | - | | | - | | | - | | | 1,394 | | | 1,565 |
Special Mention | | | - | | | - | | | - | | | - | | | - | | | - | | | - | | | - |
Substandard | | | - | | | - | | | - | | | - | | | - | | | - | | | - | | | - |
Total commercial business loans | | | - | | | 171 | | | - | | | - | | | - | | | - | | | 1,394 | | | 1,565 |
Current period gross charge-off | | $ | - | | $ | - | | $ | - | | $ | - | | $ | - | | $ | - | | $ | - | | $ | - |
| | | | | | | | | | | | | | | | | | | | | | | | |
Consumer loans: | | | | | | | | | | | | | | | | | | | | | | | | |
Not graded | | | 15 | | | - | | | - | | | - | | | - | | | - | | | - | | | 15 |
Pass | | | - | | | - | | | - | | | - | | | - | | | - | | | 50 | | | 50 |
Special Mention | | | - | | | - | | | - | | | - | | | - | | | - | | | - | | | - |
Substandard | | | - | | | - | | | - | | | - | | | - | | | - | | | - | | | - |
Total consumer loans | | | 15 | | | - | | | - | | | - | | | - | | | - | | | 50 | | | 65 |
Current period gross charge-off | | $ | - | | $ | - | | $ | - | | $ | - | | $ | - | | $ | - | | $ | - | | $ | - |
| | | | | | | | | | | | | | | | | | | | | | | | |
Total loans held for investment, gross | | $ | 77,502 | | $ | 319,657 | | $ | 255,094 | | $ | 92,750 | | $ | 81,483 | | $ | 246,202 | | $ | 1,476 | | $ | 1,074,164 |
Total current period gross charge-offs | | $ | — | | $ | — | | $ | — | | $ | — | | $ | — | | $ | — | | $ | — | | $ | — |
19
As required by ASC 326,onJuly 1, 2023the Corporation implemented CECL and recognized a $1.2 million one-time increase to its ACL. Under ASC 326, the ACL is a valuation account that is deducted from the related loan’s amortized cost basis to present the net amount expected to be collected on the loans. The measurement of expected credit losses is based on relevant information about past events, including historical experience, current conditions, and reasonable and supportable forecasts that affect the collectability of the reported amount. The Corporation’s ACL is calculated quarterly, with any difference in the calculated ACL and the recorded ACL trued-up through an entry to the provision for credit losses. Management calculates the quantitative portion of the collectively evaluated allowance for all loan categories using an average charge-off or loss rate methodology and generally evaluates collectively evaluated loans by Call Report code in order to group and determine portfolio loan segments with similar risk characteristics. The Corporation primarily utilizes historical loss rates for the CECL calculation based on its own specific historical losses and/or with peer loss history where applicable.
The expected loss rates are applied to expected monthly loan balances estimated through the consideration of contractual repayment terms and expected prepayments. The prepayment assumptions applied to expected cash flow over the contractual life of the loans are estimated based on historical and bank-specific experience and the consideration of current and expected conditions and circumstances including the level of interest rates. The prepayment assumptions may be updated by management in the event that changing conditions impact management’s estimate or additional historical data gathered has resulted in the need for a reevaluation.
For its reasonable and supportable forecasting of current expected credit losses, the Corporation utilizes a regression model using forecasted economic metrics and historical loss data. The regression model utilized upon implementation of CECL on July 1, 2023, and as of March 31, 2024, relied upon reasonable and supportable 12-month forecasts of the National Unemployment Rate and change in the Real Gross Domestic Product, after which it reverts to a historical loss rate. Management selected the National Unemployment Rate and the Real Gross Domestic Product as the drivers of the forward look component of the collectively evaluated allowance, primarily as a result of high correlation coefficients identified in regression modeling, the availability of forecasts, including the quarterly Federal Open Market Committee forecast, and the widespread familiarity of these economic metrics.
Management recognizes that there are additional factors impacting risk of loss in the loan portfolio beyond what is captured in the quantitative portion of allowance on collectively evaluated loans. As current and expected conditions mayvary compared with conditions over the historical lookback period, which is utilized in the calculation of the quantitative allowance, management considers whether additional or reduced allowance levels on collectively evaluated loans may be warranted, given the consideration of a variety of qualitative factors. The following qualitative factors (“Q-factors”) considered by management reflect the regulatory guidance on the Q-factors:
● | Changes in the experience, ability, and depth of lending management and other relevant staff. |
● | Changes in the value of underlying collateral for collateral-dependent loans. |
● | The existence and effect of any concentrations of credit, and changes in the level of such concentrations. |
● | Changes in international, national, regional, and local economic and business conditions and developments that affect the collectability of the portfolio, including the condition of various market segments. |
● | The effect of other external factors such as competition and legal and regulatory requirements on the level of estimated credit losses in the institution's existing portfolio. |
● | Changes in the volume and severity of past due loans, the volume of non-performing loans, and the volume and severity of adversely classified or graded loans. |
● | Changes in the quality of the Corporation’s loan review system. |
● | Changes in the nature and volume of the portfolio and in the terms of loans. |
● | Changes in lending policies and procedures, including changes in underwriting standards and collection, charge-off, and recovery practices not considered elsewhere in estimating credit losses. |
The qualitative portion of the Corporation’s allowance on collectively evaluated loans are calculated using management judgement, to determine risk categorizations in each of the Q-factors presented above. The amount of qualitative allowance is also contingent upon the relative weighting of the Q-factors according to management’s judgement.
20
Loans that do not share risk characteristics are evaluated on an individual basis. When management determines that foreclosure is probable and the borrower is experiencing financial difficulty, the expected credit losses are based on the fair value of collateral at the reporting date, less selling costs.
Accrued interest receivable for loans is included in the accrued interest receivable line item on the Corporation’s Condensed Consolidated Statements of Financial Condition. The Corporation elected notto measure an allowance for accrued interest receivable and instead elected to reverse accrued interest income on loans that are placed on non-performing status. A loan is deemed non-performing when it is 90 days or more delinquent and the Bank has stopped accruing interest income. Any outstanding interest receivable that has not been collected is reversed, disclosed accordingly; and therefore, no allowance is established. The Corporation believes this policy results in the timely reversal of potentially uncollectible interest.
Pursuant to ASU 2022-02, “Troubled Debt Restructurings and Vintage Disclosures,” the Corporation may agree to different types of modifications, including principal forgiveness, interest rate reductions, term extension, significant payment delay or any combination of modifications noted above. During the quarter and nine months ended March 31, 2024, there were no loan modifications to borrowers experiencing financial difficulties.
Management believes the ACL on loans held for investment is maintained at a level sufficient to provide for expected losses on the Corporation’s loans held for investment based on historical loss experience, current conditions, and reasonable and supportable forecasts. The provision for (recovery of) credit losses is charged (credited) against operations on a quarterly basis, as necessary, to maintain the ACL at appropriate levels. Future adjustments to the ACL may be necessary and results of operations could be significantly and adversely affected as a result of economic, operating, regulatory, and other conditions beyond the Corporation’s control.
Non-performing loans are charged-off to their fair market values in the period the loans, or portion thereof, are deemed uncollectible, generally after the loan becomes 150 days delinquent for real estate secured first trust deed loans and 120 days delinquent for commercial business or real estate secured second trust deed loans. For loans that were modified from their original terms, were re-underwritten and identified as modified loans, the charge-off occurs when the loan becomes 90 days delinquent; and where borrowers file bankruptcy, the charge-off occurs when the loan becomes 60 days delinquent. The amount of the charge-off is determined by comparing the loan balance to the estimated fair value of the underlying collateral, less disposition costs, with the loan balance in excess of the estimated fair value charged-off against the ACL. For modified loans that are less than 90 days delinquent, the ACL is segregated into (a) individually evaluated allowances for those loans with applicable discounted cash flow calculations still in their modification period, classified lower than pass, and containing an embedded loss component or (b) collectively evaluated allowances based on the aggregated pooling method. For non-performing loans less than 60 days delinquent where the borrower has filed bankruptcy, the collectively evaluated allowances are assigned based on the aggregated pooling method. For non-performing commercial real estate loans, an individually evaluated allowance is derived based on the loan's discounted cash flow fair value (for modified loans) or collateral fair value less estimated selling costs and if the fair value is higher than the loan balance, no allowance is required.
21
The following table is provided to disclose additional details for the periods indicated on the Corporation’s ACL on loans held for investment:
| | | | | | | | | | | | | |
| | For the Quarter Ended |
| For the Nine Months Ended |
| ||||||||
| | March 31, | | March 31, |
| ||||||||
(Dollars in Thousands) |
| 2024 |
| 2023 |
| 2024 |
| 2023 |
| ||||
| | | | | | | | | | | | | |
ACL, beginning of period | | $ | 7,000 | | $ | 5,830 | | $ | 5,946 | | $ | 5,564 | |
| | | | | | | | | | | | | |
Impact of ASC 326 CECL adoption(1) | | | — | | | — | | | 1,197 | | | — | |
| | | | | | | | | | | | | |
Provision for (recovery of) credit losses | |
| 108 | |
| 169 | |
| (35) | |
| 430 | |
| | | | | | | | | | | | | |
Recoveries: | |
|
| |
|
| |
|
| |
|
| |
Mortgage loans: | |
|
| |
|
| |
|
| |
|
| |
Single-family | |
| — | |
| 2 | |
| — | |
| 7 | |
Total recoveries | |
| — | |
| 2 | |
| — | |
| 7 | |
| | | | | | | | | | | | | |
Total charge-offs | |
| — | |
| — | |
| — | |
| — | |
| | | | | | | | | | | | | |
Net recoveries (charge-offs) | |
| — | |
| 2 | |
| — | |
| 7 | |
ACL, end of period | | $ | 7,108 | | $ | 6,001 | | $ | 7,108 | | $ | 6,001 |
|
| | | | | | | | | | | | | |
ACL on loans as a percentage of gross loans held for investment | |
| 0.67 | % |
| 0.56 | % |
| 0.67 | % |
| 0.56 | % |
Net (recoveries) charge-offs as a percentage of average loans receivable, net, during the period (annualized) | |
| — | % |
| — | % |
| — | % |
| — | % |
ACL on loans as a percentage of gross non-performing loans at the end of the period | | | 307.84 | % | | 584.32 | % | | 307.84 | % | | 584.32 | % |
(1) | Represents the impact of adopting ASC 326 on July 1, 2023. Since that date, as a result of adopting ASC 326, the methodology to compute the ACL has been based on CECL methodology, rather than the previously applied incurred loss methodology. |
The following tables denote the past due status of the Corporation's gross loans held for investment, net of fair value adjustments, at the dates indicated.
| | | | | | | | | | | | |
| | March 31, 2024 | ||||||||||
| | | | | 30-89 Days Past | | | | | Total Loans Held for | ||
(In Thousands) |
| Current |
| Due |
| Non-Performing |
| Investment, Gross | ||||
| | | | | | | | | | | | |
Mortgage loans: | | | | | | | | | | | | |
Single-family | | $ | 514,420 | | $ | 386 | | $ | 2,233 | | $ | 517,039 |
Multi-family | |
| 457,401 | |
| — | |
| — | |
| 457,401 |
Commercial real estate | |
| 83,136 | |
| — | |
| — | |
| 83,136 |
Construction | |
| 2,745 | |
| — | |
| — | |
| 2,745 |
Other | |
| 99 | |
| — | |
| — | |
| 99 |
Commercial business loans | |
| 2,835 | |
| — | |
| — | |
| 2,835 |
Consumer loans | |
| 58 | |
| 2 | |
| — | |
| 60 |
Total loans held for investment, gross | | $ | 1,060,694 | | $ | 388 | | $ | 2,233 | | $ | 1,063,315 |
22
| | | | | | | | | | | | |
| | June 30, 2023 | ||||||||||
|
| | |
| 30-89 Days Past |
| | |
| Total Loans Held for | ||
(In Thousands) | | Current | | Due | | Non-Performing | | Investment, Gross | ||||
| | | | | | | | | | | | |
Mortgage loans: | | | | | | | | | | | | |
Single-family | | $ | 517,399 | | $ | — | | $ | 1,422 | | $ | 518,821 |
Multi-family | |
| 461,113 | |
| — | |
| — | |
| 461,113 |
Commercial real estate | |
| 90,558 | |
| — | |
| — | |
| 90,558 |
Construction | |
| 1,936 | |
| — | |
| — | |
| 1,936 |
Other | | | 106 | |
| — | |
| — | |
| 106 |
Commercial business loans | |
| 1,565 | |
| — | |
| — | |
| 1,565 |
Consumer loans | |
| 64 | |
| 1 | |
| — | |
| 65 |
Total loans held for investment, gross | | $ | 1,072,741 | | $ | 1 | | $ | 1,422 | | $ | 1,074,164 |
The following tables summarize the Corporation’s ACL and recorded investment in gross loans, by portfolio type, at the dates and for the periods indicated.
| | | | | | | | | | | | | | | | | | | | | | | | | |
|
| Quarter Ended March 31, 2024 |
| ||||||||||||||||||||||
| | Single- | | Multi- | | Commercial | | | | | | | | Commercial | | | | | | | | ||||
(Dollars In Thousands) |
| family |
| family |
| Real Estate | | Construction | | Other |
| Business | | Consumer | | Total | | ||||||||
ACL: |
| |
|
| |
|
| |
|
| |
|
| |
|
| |
|
| |
|
| |
|
|
ACL, beginning of period | | $ | 6,235 | | $ | 642 | | $ | 73 | | $ | 36 | | $ | 2 | | $ | 12 | | $ | — | | $ | 7,000 | |
Provision for (recovery of) credit losses | | | 136 | | | (41) | | | (8) | | | 8 | | | (1) | | | 14 | | | — | | | 108 | |
Recoveries | |
| — | |
| — | |
| — | |
| — | |
| — | |
| — | |
| — | |
| — | |
Charge-offs | |
| — | |
| — | |
| — | |
| — | |
| — | |
| — | |
| — | |
| — | |
ACL, end of period | | $ | 6,371 | | $ | 601 | | $ | 65 | | $ | 44 | | $ | 1 | | $ | 26 | | $ | — | | $ | 7,108 | |
| | | | | | | | | | | | | | | | | | | | | | | | | |
ACL: | |
| | |
| | |
| | |
| | |
| | |
| | |
| | |
| | |
Individually evaluated for impairment | | $ | 37 | | $ | — | | $ | — | | $ | — | | $ | — | | $ | — | | $ | — | | $ | 37 | |
Collectively evaluated for impairment | |
| 6,334 | |
| 601 | |
| 65 | |
| 44 | |
| 1 | |
| 26 | |
| — | |
| 7,071 | |
ACL, end of period | | $ | 6,371 | | $ | 601 | | $ | 65 | | $ | 44 | | $ | 1 | | $ | 26 | | $ | — | | $ | 7,108 | |
| | | | | | | | | | | | | | | | | | | | | | | | | |
Loans held for investment: | |
| | |
| | |
| | |
| | |
| | |
| | |
| | |
| | |
Individually evaluated for impairment | | $ | 1,138 | | $ | — | | $ | — | | $ | — | | $ | — | | $ | — | | $ | — | | $ | 1,138 | |
Collectively evaluated for impairment | |
| 515,901 | |
| 457,401 | |
| 83,136 | |
| 2,745 | |
| 99 | |
| 2,835 | |
| 60 | |
| 1,062,177 | |
Total loans held for investment, gross | | $ | 517,039 | | $ | 457,401 | | $ | 83,136 | | $ | 2,745 | | $ | 99 | | $ | 2,835 | | $ | 60 | | $ | 1,063,315 | |
ACL on loans as a percentage of gross loans held for investment | |
| 1.23 | % |
| 0.13 | % |
| 0.08 | % |
| 1.60 | % |
| 1.01 | % |
| 0.92 | % |
| — | % |
| 0.67 | % |
Net (recoveries) charge-offs to average loans receivable, net during the period | | | — | % | | — | % | | — | % | | — | % | | — | % | | — | % | | — | % | | — | % |
23
| | | | | | | | | | | | | | | | | | | | | | | | | |
|
| Quarter Ended March 31, 2023 | | ||||||||||||||||||||||
| | Single- | | Multi- | | Commercial | | | | | | | | Commercial | | | | | | | | ||||
(Dollars In Thousands) |
| family |
| family |
| Real Estate | | Construction |
| | Other | Business | | Consumer | | Total | | ||||||||
ACL: |
| |
|
| |
|
| |
|
| |
|
| | | | |
|
| |
|
| |
|
|
ACL, beginning of period | | $ | 1,600 | | $ | 3,300 | | $ | 847 | | $ | 17 | | $ | 3 | | $ | 58 | | $ | 5 | | $ | 5,830 | |
Provision for (recovery of) credit losses | |
| 127 | |
| 7 | |
| 21 | |
| 4 | |
| (1) | |
| 12 | |
| (1) | |
| 169 | |
Recoveries | |
| 2 | |
| — | |
| — | |
| — | |
| — | |
| — | |
| — | |
| 2 | |
Charge-offs | |
| — | |
| — | |
| — | |
| — | |
| — | |
| — | |
| — | |
| — | |
ACL, end of period | | $ | 1,729 | | $ | 3,307 | | $ | 868 | | $ | 21 | | $ | 2 | | $ | 70 | | $ | 4 | | $ | 6,001 | |
| | | | | | | | | | | | | | | | | | | | | | | | | |
ACL: | |
|
| |
|
| |
|
| |
|
| |
|
| |
|
| |
|
| |
|
| |
Individually evaluated for impairment | | $ | 38 | | $ | — | | $ | — | | $ | — | | $ | — | | $ | — | | $ | — | | $ | 38 | |
Collectively evaluated for impairment | |
| 1,691 | |
| 3,307 | |
| 868 | |
| 21 | |
| 2 | |
| 70 | |
| 4 | |
| 5,963 | |
ACL, end of period | | $ | 1,729 | | $ | 3,307 | | $ | 868 | | $ | 21 | | $ | 2 | | $ | 70 | | $ | 4 | | $ | 6,001 | |
| | | | | | | | | | | | | | | | | | | | | | | | | |
Loans held for investment: | |
|
| |
|
| |
|
| |
|
| |
|
| |
|
| |
|
| |
|
| |
Individually evaluated for impairment | | $ | 804 | | $ | — | | $ | — | | $ | — | | $ | — | | $ | — | | $ | — | | $ | 804 | |
Collectively evaluated for impairment | |
| 511,828 | |
| 466,332 | |
| 90,496 | |
| 2,891 | |
| 108 | |
| 1,640 | |
| 61 | |
| 1,073,356 | |
Total loans held for investment, gross | | $ | 512,632 | | $ | 466,332 | | $ | 90,496 | | $ | 2,891 | | $ | 108 | | $ | 1,640 | | $ | 61 | | $ | 1,074,160 | |
ACL on loans as a percentage of gross loans held for investment | |
| 0.34 | % |
| 0.71 | % |
| 0.96 | % |
| 0.73 | % |
| 1.85 | % |
| 4.27 | % |
| 6.56 | % |
| 0.56 | % |
Net (recoveries) charge-offs to average loans receivable, net during the period | | | — | % | | — | % | | — | % | | — | % | | — | % | | — | % | | — | % | | — | % |
24
| | | | | | | | | | | | | | | | | | | | | | | | | |
| | Nine Months Ended March 31, 2024 |
| ||||||||||||||||||||||
| | | | | | | | Commercial | | | | | | | | Commercial | | | | | | | | ||
(Dollars In Thousands) |
| Single-family |
| Multi-family |
| Real Estate |
| Construction |
| Other |
| Business |
| Consumer |
| Total |
| ||||||||
ACL: | | | | | | | | | | | | | | | | | | | | | | | | |
|
ACL, beginning of period | | $ | 1,720 | | $ | 3,270 | | $ | 868 | | $ | 15 | | $ | 2 | | $ | 67 | | $ | 4 | | $ | 5,946 | |
Adjustment to allowance for adoption of ASC 326 | |
| 4,605 | |
| (2,614) | |
| (786) | |
| 47 | |
| 3 | |
| (54) | |
| (4) | |
| 1,197 | |
Provision for (recovery of) credit losses | | | 46 | | | (55) | | | (17) | | | (18) | | | (4) | | | 13 | | | — | | | (35) | |
Recoveries | |
| — | |
| — | |
| — | |
| — | |
| — | |
| — | |
| — | |
| — | |
Charge-offs | |
| — | |
| — | |
| — | |
| — | |
| — | |
| — | |
| — | |
| — | |
ACL, end of period | | $ | 6,371 | | $ | 601 | | $ | 65 | | $ | 44 | | $ | 1 | | $ | 26 | | $ | — | | $ | 7,108 | |
| | | | | | | | | | | | | | | | | | | | | | | | | |
ACL: | | | | | | | | | | | | | | | | | | | | | | | | | |
Individually evaluated for impairment | | $ | 37 | | $ | — | | $ | — | | $ | — | | $ | — | | $ | — | | $ | — | | $ | 37 | |
Collectively evaluated for impairment | |
| 6,334 | |
| 601 | |
| 65 | |
| 44 | |
| 1 | |
| 26 | |
| — | |
| 7,071 | |
ACL, end of period | | $ | 6,371 | | $ | 601 | | $ | 65 | | $ | 44 | | $ | 1 | | $ | 26 | | $ | — | | $ | 7,108 | |
| | | | | | | | | | | | | | | | | | | | | | | | | |
Loans held for investment: | | | | | | | | | | | | | | | | | | | | | | | | | |
Individually evaluated for impairment | | $ | 1,138 | | $ | — | | $ | — | | $ | — | | $ | — | | $ | — | | $ | — | | $ | 1,138 | |
Collectively evaluated for impairment | |
| 515,901 | |
| 457,401 | |
| 83,136 | |
| 2,745 | |
| 99 | |
| 2,835 | |
| 60 | |
| 1,062,177 | |
Total loans held for investment, gross | | $ | 517,039 | | $ | 457,401 | | $ | 83,136 | | $ | 2,745 | | $ | 99 | | $ | 2,835 | | $ | 60 | | $ | 1,063,315 | |
ACL on loans as a percentage of gross loans held for investment | |
| 1.23 | % |
| 0.13 | % |
| 0.08 | % |
| 1.60 | % |
| 1.01 | % |
| 0.92 | % |
| — | % |
| 0.67 | % |
Net (recoveries) charge-offs to average loans receivable, net during the period | | | — | % | | — | % | | — | % | | — | % | | — | % | | — | % | | — | % | | — | % |
25
| | | | | | | | | | | | | | | | | | | | | | | | | |
| | Nine Months Ended March 31, 2023 |
| ||||||||||||||||||||||
| | | | | | | | Commercial | | | | | | | | Commercial | | | | | | | | ||
(Dollars In Thousands) |
| Single-family |
| Multi-family |
| Real Estate |
| Construction |
| Other |
| Business |
| Consumer |
| Total |
| ||||||||
ACL: | | | | | | | | | | | | | | | | | | | | | | | | |
|
ACL, beginning of period | | $ | 1,383 | | $ | 3,282 | | $ | 816 | | $ | 23 | | $ | 3 | | $ | 52 | | $ | 5 | | $ | 5,564 | |
Provision for (recovery of) credit losses | |
| 339 | |
| 25 | |
| 52 | |
| (2) | |
| (1) | |
| 18 | |
| (1) | |
| 430 | |
Recoveries | |
| 7 | |
| — | |
| — | |
| — | |
| — | |
| — | |
| — | |
| 7 | |
Charge-offs | |
| — | |
| — | |
| — | |
| — | |
| — | |
| — | |
| — | |
| — | |
ACL, end of period | | $ | 1,729 | | $ | 3,307 | | $ | 868 | | $ | 21 | | $ | 2 | | $ | 70 | | $ | 4 | | $ | 6,001 | |
| | | | | | | | | | | | | | | | | | | | | | | | | |
ACL: | |
| | | | | | | | | | | | | | | | | | | | | | | |
Individually evaluated for impairment | | $ | 38 | | $ | — | | $ | — | | $ | — | | $ | — | | $ | — | | $ | — | | $ | 38 | |
Collectively evaluated for impairment | |
| 1,691 | |
| 3,307 | |
| 868 | |
| 21 | |
| 2 | |
| 70 | |
| 4 | |
| 5,963 | |
ACL, end of period | | $ | 1,729 | | $ | 3,307 | | $ | 868 | | $ | 21 | | $ | 2 | | $ | 70 | | $ | 4 | | $ | 6,001 | |
| | | | | | | | | | | | | | | | | | | | | | | | | |
Loans held for investment: | |
| | | | | | | | | | | | | | | | | | | | | | | |
Individually evaluated for impairment | | $ | 804 | | $ | — | | $ | — | | $ | — | | $ | — | | $ | — | | $ | — | | $ | 804 | |
Collectively evaluated for impairment | |
| 511,828 | |
| 466,332 | |
| 90,496 | |
| 2,891 | |
| 108 | |
| 1,640 | |
| 61 | |
| 1,073,356 | |
Total loans held for investment, gross | | $ | 512,632 | | $ | 466,332 | | $ | 90,496 | | $ | 2,891 | | $ | 108 | | $ | 1,640 | | $ | 61 | | $ | 1,074,160 | |
ACL on loans as a percentage of gross loans held for investment | |
| 0.34 | % |
| 0.71 | % |
| 0.96 | % |
| 0.73 | % |
| 1.85 | % |
| 4.27 | % |
| 6.56 | % |
| 0.56 | % |
Net (recoveries) charge-offs to average loans receivable, net during the period | | | — | % | | — | % | | — | % | | — | % | | — | % | | — | % | | — | % | | — | % |
26
| | | | | | | | | | | | | | | | | | | | | | | | | |
| | | | | | | | | | | | | | | | | | | | | | | | | |
The following tables identify the Corporation’s total recorded investment in non-performing loans by type at the dates and for the periods indicated. Generally, a loan is placed on non-accrualnon-performing status when it becomes 90 days past due as to principal or interest or if the loan is deemed impaired, after considering economic and business conditions and collection efforts, where the borrower’s financial condition is such that collection of the contractual principal or interest on the loan is doubtful. In addition, interest income is not recognized on any loan where management has determined that collection is not reasonably assured. A non-performing loan may be restored to accrual status when delinquent principal and interest payments are brought current, the borrower(s) has demonstrated sustained payment performance and future monthly principal and interest payments are expected to be collected on a timely basis. Loans with a related allowance reserve have been (a) collectively evaluated using a pooling method analysis or (b) individually evaluated for impairment using either a discounted cash flow analysis or, for collateral dependent loans, current appraisals less costs to sell, to establish realizable value. This analysis may identify a specific impairment amount needed or may conclude that no reserveallowance is needed. Loans that are not individually evaluated for impairment are included in pools of homogeneous loans for evaluation of related allowance reserves.
| | | | | | | | | | | | | | | | | | | | | | | | | | | | | | |
| | At March 31, 2023 | | At March 31, 2024 | ||||||||||||||||||||||||||
| | Unpaid | | | | | | | | Net | | Unpaid | | | | | | | | Net | ||||||||||
| | Principal | | Related | | Recorded | | | | Recorded | | Principal | | Related | | Recorded | | | | Recorded | ||||||||||
(In Thousands) |
| Balance |
| Charge-offs |
| Investment |
| Allowance(1) |
| Investment |
| Balance |
| Charge-offs |
| Investment |
| ACL(1) |
| Investment | ||||||||||
| | | | | | | | | | | | | | | | | | | | | | | | | | | | | | |
Mortgage loans: | | | | | | | | | | | | | | | | | | | | | | | | | | | | | | |
Single-family: |
| |
|
| |
|
| |
|
| |
|
| |
|
| |
|
| |
|
| |
|
| |
|
| |
|
With a related allowance | | $ | 971 | | $ | — | | $ | 971 | | $ | (82) | | $ | 889 | | $ | 1,903 | | $ | — | | $ | 1,903 | | $ | (63) | | $ | 1,840 |
Without a related allowance(2) | |
| 83 | |
| (27) | |
| 56 | |
| — | |
| 56 | |
| 431 | |
| (25) | |
| 406 | |
| — | |
| 406 |
Total single-family loans | |
| 1,054 | |
| (27) | |
| 1,027 | |
| (82) | |
| 945 | |
| 2,334 | |
| (25) | |
| 2,309 | |
| (63) | |
| 2,246 |
| | | | | | | | | | | | | | | | | | | | | | | | | | | | | | |
Total non-performing loans | | $ | 1,054 | | $ | (27) | | $ | 1,027 | | $ | (82) | | $ | 945 | | $ | 2,334 | | $ | (25) | | $ | 2,309 | | $ | (63) | | $ | 2,246 |
(1) |
(2) | There was no related |
| | | | | | | | | | | | | | | | | | | | | | | | | | | | | | |
| | At June 30, 2022 | | At June 30, 2023 | ||||||||||||||||||||||||||
| | Unpaid | | Related | | | | | | Net | | Unpaid | | Related | | | | | | Net | ||||||||||
| | Principal | | Charge-offs | | Recorded | | | | Recorded | | Principal | | Charge-offs | | Recorded | | | | Recorded | ||||||||||
(In Thousands) |
| Balance |
| Related |
| Investment |
| Allowance(1) |
| Investment |
| Balance |
| Related |
| Investment |
| ACL(1) |
| Investment | ||||||||||
| | | | | | | | | | | | | | | | | | | | | | | | | | | | | | |
Mortgage loans: |
| |
|
| |
|
| |
|
| |
|
| |
|
| |
|
| |
|
| |
|
| |
|
| |
|
Single-family: |
| |
|
| |
|
| |
|
| |
|
| |
|
| |
|
| |
|
| |
|
| |
|
| |
|
With a related allowance | | $ | 993 | | $ | — | | $ | 993 | | $ | (85) | | $ | 908 | | $ | 1,171 | | $ | — | | $ | 1,171 | | $ | (122) | | $ | 1,049 |
Without a related allowance(2) | |
| 548 | |
| (33) | |
| 515 | |
| — | |
| 515 | |
| 276 | |
| (25) | |
| 251 | |
| — | |
| 251 |
Total single-family loans | |
| 1,541 | |
| (33) | |
| 1,508 | |
| (85) | |
| 1,423 | |
| 1,447 | |
| (25) | |
| 1,422 | |
| (122) | |
| 1,300 |
| | | | | | | | | | | | | | | | | | | | | | | | | | | | | | |
Total non-performing loans | | $ | 1,541 | | $ | (33) | | $ | 1,508 | | $ | (85) | | $ | 1,423 | | $ | 1,447 | | $ | (25) | | $ | 1,422 | | $ | (122) | | $ | 1,300 |
(1) |
(2) | There was no related |
At March 31, 2023,2024, there were no commitments to lend additional funds to those borrowers whose loans were classified as non-performing.
For the quarters ended March 31, 20232024 and 2022,2023, the Corporation’s average recorded investment in non-performing loans was $1.0$2.1 million and $3.0$1.0 million, respectively. The Corporation records payments on non-performing loans utilizing the cash basis or cost recovery method of accounting during the periods when the loans are on non-performing status. For the quarter ended March 31, 2024, the Bank received $41,000 in interest payments from non-performing loans, of which $41,000 was recognized as interest income and none was applied to reduce the loan balances under the cost recovery method. In comparison, for the quarter ended March 31, 2023, the Bank received $15,000 in interest payments from non-performing loans, of which $13,000 was recognized as interest income and the remaining $2,000 was applied to reduce the loan balances under the cost recovery method. In comparison, for the quarter ended March 31, 2022, the Bank received $34,000 in interest payments from non-performing loans, of which $28,000 was recognized as interest income and the remaining $6,000 was applied to reduce the loan balances under the cost recovery method.
2027
For the nine months ended March 31, 20232024 and 2022,2023, the Corporation’s average recorded investment in non-performing loans was $1.1$1.7 million and $5.0$1.1 million, respectively. For the nine months ended March 31, 2024, the Bank received $80,000 in interest payments from non-performing loans, of which $80,000 was recognized as interest income and none was applied to reduce the loan balances under the cost recovery method. In comparison, for the nine months ended March 31, 2023, the Bank received $38,000 in interest payments from non-performing loans, of which $33,000 was recognized as interest income and the remaining $5,000 was applied to reduce the loan balances under the cost recovery method. In comparison, for the nine months ended March 31, 2022, the Bank received $384,000 in interest payments from non-performing loans, of which $361,000 was recognized as interest income and the remaining $23,000 was applied to reduce the loan balances under the cost recovery method.
The following tables present the average recorded investment in non-performing loans and the related interest income recognized for the quarters and nine months ended March 31, 20232024 and 2022:2023:
| | | | | | | | | | | | | | | | | | | | | | | | |
| | | Quarter Ended March 31, | | | Quarter Ended March 31, | ||||||||||||||||||
| | 2023 | | 2022 | | 2024 | | 2023 | ||||||||||||||||
| | | Average | | Interest | | Average | | Interest | | | Average | | Interest | | Average | | Interest | ||||||
| | | Recorded | | Income | | Recorded | | Income | | | Recorded | | Income | | Recorded | | Income | ||||||
(In Thousands) |
| | Investment |
| Recognized |
| Investment |
| Recognized |
| | Investment |
| Recognized |
| Investment |
| Recognized | ||||||
Without related allowances: |
| | |
| | |
| | |
| | | ||||||||||||
Without related ACL: |
| | |
| | |
| | |
| | | ||||||||||||
Mortgage loans: | | | | | | | | | | | | | | | | | | | | | | | | |
Single-family | | $ | 57 | | $ | — | | $ | 540 |
| $ | 1 | | $ | 296 | | $ | 8 | | $ | 57 |
| $ | — |
|
|
| 57 | |
| — | |
| 540 |
|
| 1 |
|
| 296 | |
| 8 | |
| 57 |
|
| — |
| | | | | | | | | | | | | | | | | | | | | | | | |
With related allowances: |
|
| | |
| | |
| |
|
| | ||||||||||||
With related ACL: |
|
| | |
| | |
| |
|
| | ||||||||||||
Mortgage loans: | | | | | | | | | | | | | | | | | | | | | | | | |
Single-family | |
| 973 | |
| 13 | |
| 1,267 |
|
| 15 | |
| 1,852 | |
| 33 | |
| 973 |
|
| 13 |
Multi-family | |
| — | |
| — | |
| 1,172 |
|
| 12 | ||||||||||||
|
|
| 973 | |
| 13 | |
| 2,439 |
|
| 27 |
|
| 1,852 | |
| 33 | |
| 973 |
|
| 13 |
| | | | | | | | | | | | | | | | | | | | | | | | |
Total | | $ | 1,030 | | $ | 13 | | $ | 2,979 |
| $ | 28 | | $ | 2,148 | | $ | 41 | | $ | 1,030 |
| $ | 13 |
| | | | | | | | | | | | |
| | Nine Months Ended March 31, | ||||||||||
| | 2023 | | 2022 | ||||||||
| | | Average | | Interest | | Average | | Interest | |||
| | | Recorded | | Income | | Recorded | | Income | |||
(In Thousands) |
| | Investment |
| Recognized |
| Investment |
| Recognized | |||
Without related allowances: |
| | |
| | |
| | |
| | |
Mortgage loans: | | | | | | | | | | | | |
Single-family | | $ | 87 | | $ | — | | $ | 675 |
| $ | 232 |
|
| | 87 | |
| — | |
| 675 |
| | 232 |
| | | | | | | | | | | | |
With related allowances: |
| | | |
| | |
| |
| | |
Mortgage loans: | | | | | | | | | | | | |
Single-family | | | 983 | |
| 33 | |
| 3,126 |
| | 86 |
Multi-family | | | — | |
| — | |
| 1,179 |
| | 43 |
|
| | 983 | |
| 33 | |
| 4,305 |
| | 129 |
| | | | | | | | | | | | |
Total | | $ | 1,070 | | $ | 33 | | $ | 4,980 |
| $ | 361 |
|
|
|
|
|
|
|
|
|
|
|
|
|
| | | | | | | | | | | | |
| | Nine Months Ended March 31, | ||||||||||
| | 2024 | | 2023 | ||||||||
| | | Average | | Interest | | Average | | Interest | |||
| | | Recorded | | Income | | Recorded | | Income | |||
(In Thousands) |
| | Investment |
| Recognized |
| Investment |
| Recognized | |||
Without related ACL: |
| | |
| | |
| | |
| | |
Mortgage loans: | | | | | | | | | | | | |
Single-family | | $ | 206 | | $ | 16 | | $ | 87 |
| $ | — |
|
| | 206 | |
| 16 | |
| 87 |
| | — |
| | | | | | | | | | | | |
With related ACL: |
| | | |
| | |
| |
| | |
Mortgage loans: | | | | | | | | | | | | |
Single-family | | | 1,454 | |
| 64 | |
| 983 |
| | 33 |
|
| | 1,454 | |
| 64 | |
| 983 |
| | 33 |
| | | | | | | | | | | | |
Total | | $ | 1,660 | | $ | 80 | | $ | 1,070 |
| $ | 33 |
ForDuring the quarter ended March 31, 2023, no loans were restructured, while one previously restructured loan was downgraded from the pass category to the special mention category. For the quarter ended March 31, 2022, no loans were restructured, one previously restructured loan was downgraded from the pass category to the special mention category and two previously restructured loans were paid off. During both quarters ended March 31, 20232024 and 2022, no restructured loans were in default within a 12-month period subsequent to their original restructuring.
21
For the nine months ended March 31, 2023, no loans were restructured, 10 previously restructured loans were upgraded to the pass category, one previously restructured loan was downgraded from pass category to special mention category and one previously restructured loan was paid off. For the nine months ended March 31, 2022, no loans were restructured, 11 previously restructured loans were upgraded to the pass category, one previously restructured loan was upgraded from the substandard category to the special mention category and six previously restructured loans paid off. During both nine months ended March 31, 2023 and 2022, no restructured loans were in default within a 12-month period subsequent to their original restructuring.
As of March 31, 2023, the Corporation held three restructured loans with a net outstanding balance of $1.4 million of which one loan totaling $710,000 was classified as substandard and on non-accrual status. As of June 30, 2022, the Corporation held 13 restructured loans with a net outstanding balance of $4.5 million, of which one loan totaling $722,000 was classified as substandard on non-accrual status. As of March 31, 2023, $966,000 or 71 percent of the restructured loans were current with respect to their modified payment terms; while as of June 30, 2022, all of the restructured loans were current with respect to their modified payment terms.
The Corporation upgrades restructured single-family loans to the pass category if the borrower has demonstrated satisfactory contractual payments for at least six consecutive months; 12 months for those loans that were restructured more than once; and if the borrower has demonstrated satisfactory contractual payments beyond 12 consecutive months, the loan is no longer categorized as a restructured loan. In addition to the payment history described above, multi-family, commercial real estate, construction and commercial business loans must also demonstrate a combination of the following characteristics to be upgraded: satisfactory cash flow, satisfactory guarantor support, and additional collateral support, among others.
To qualify for restructuring, a borrower must provide evidence of their creditworthiness such as, current financial statements, their most recent income tax returns, current paystubs, current W-2s, and most recent bank statements, among other documents, which are then verified by the Corporation. The Corporation re-underwrites the loan with the borrower’s updated financial information, new credit report, current loan balance, new interest rate, remaining loan term, updated property value and modified payment schedule, among other considerations, to determine if the borrower qualifies.
The following table summarizes at the dates indicated the restructured loan balances, net of allowance for loan losses, by loan type:
| | | | | | | |
|
| At | | At |
| ||
(In Thousands) | | March 31, 2023 | | June 30, 2022 | | ||
Restructured loans on non-accrual status: | | | | | | | |
Mortgage loans: |
| |
|
| |
|
|
Single-family | | $ | 710 | | $ | 722 | |
Total | |
| 710 | |
| 722 | |
| | | | | | | |
Restructured loans on accrual status: | |
|
| |
| | |
Mortgage loans: | |
|
| |
| | |
Single-family | |
| 655 | |
| 3,748 | |
Total | |
| 655 | |
| 3,748 | |
Total restructured loans | | $ | 1,365 | | $ | 4,470 | |
22
The following tables identify the Corporation’s total recorded investment in restructured loans by type at the dates and for the periods indicated.
| | | | | | | | | | | | | | | |
| | At March 31, 2023 | |||||||||||||
| | Unpaid | | | | | | | | | | | Net | ||
| | Principal | | Related | | Recorded | | | | | Recorded | ||||
(In Thousands) |
| Balance |
| Charge-offs |
| Investment |
| Allowance(1) |
| Investment | |||||
| | | | | | | | | | | | | | | |
Mortgage loans: | | | | | | | | | | | | | | | |
Single-family: | | | | | | | | | | | | | | | |
With a related allowance | | $ | 748 | | $ | — | | $ | 748 | | $ | (38) | | $ | 710 |
Without a related allowance(2) | |
| 655 | |
| — | |
| 655 | |
| — | |
| 655 |
Total single-family | |
| 1,403 | |
| — | |
| 1,403 | |
| (38) | |
| 1,365 |
| | | | | | | | | | | | | | | |
Total restructured loans | | $ | 1,403 | | $ | — | | $ | 1,403 | | $ | (38) | | $ | 1,365 |
| | | | | | | | | | | | | | | |
| | At June 30, 2022 | |||||||||||||
| | Unpaid | | | | | | | | | | | Net | ||
| | Principal | | Related | | Recorded | | | | | Recorded | ||||
(In Thousands) |
| Balance |
| Charge-offs |
| Investment |
| Allowance(1) |
| Investment | |||||
| | | | | | | | | | | | | | | |
Mortgage loans: |
| |
|
| |
|
| |
|
| |
|
| |
|
Single-family: |
| |
|
| |
|
| |
|
| |
|
| |
|
With a related allowance | | $ | 760 | | $ | — | | $ | 760 | | $ | (38) | | $ | 722 |
Without a related allowance(2) | |
| 3,748 | |
| — | |
| 3,748 | |
| — | |
| 3,748 |
Total single-family | |
| 4,508 | |
| — | |
| 4,508 | |
| (38) | |
| 4,470 |
| | | | | | | | | | | | | | | |
Total restructured loans | | $ | 4,508 | | $ | — | | $ | 4,508 | | $ | (38) | | $ | 4,470 |
During the quarters and nine months ended March 31, 2023 and 2022, no properties were acquired in the settlement of loans and no previously foreclosed upon properties were sold. As of bothFor the nine months ended March 31, 2024 and 2023, no properties were acquired in the settlement of loans and June 30, 2022, thereno previously foreclosed upon properties were sold, except for one foreclosed property that was immediately sold with no real estate owned property.losses in the second quarter of fiscal 2024. A new appraisal is obtained on each of the properties at the time of foreclosure and fair value is derived by using the lower of the appraised value or the listing price of the property, net of selling costs. As of both March 31, 2024 and June 30, 2023, there was no real estate owned property. Any initial loss upon repossession is recorded as a charge to the allowance for loan lossesACL before being transferred to real estate owned. Subsequent to transfer to real estate owned, if there is further deterioration in real estate values, specific real estate owned loss reserves are established and charged to the condensed consolidated statementsCondensed Consolidated Statements of operations.Operations. In addition, the Corporation records costs to carry real estate owned as real estate owned operating expenses as incurred.
28
As outlined in the implementation of ASC 326, the Bank includes the off-balance sheet reserve for unfunded loan commitments within the provision for (recovery of) credit losses.
The following table provides information regarding the unfunded loan commitment reserve for the quarters and nine months ended March 31, 2024 and 2023.
| | | | | | | | | | | | |
| | For the Quarter Ended | | For the Nine Months Ended | ||||||||
| | March 31, | | March 31, | ||||||||
(In Thousands) |
| 2024 |
| 2023 |
| 2024 |
| 2023 | ||||
Balance, beginning of the period | | $ | 10 | | $ | 71 | | $ | 42 | | $ | 130 |
Impact of ASC 326 CECL adoption | |
| — | |
| — | |
| — | |
| — |
Provision for (recovery of) credit losses | | | 16 | | | 3 | | | (16) | | | (56) |
Balance, end of the period | | $ | 26 | | $ | 74 | | $ | 26 | | $ | 74 |
The method for calculating the unfunded commitment reserve is based on a historical funding rate applied to the undisbursed loan amount to estimate an average outstanding amount during the life of the loan commitment. The Corporation applies the same assumptions and methodologies by loan groupings to these unfunded loan commitments as it does for its funded loans held for investment to determine the reserve rate and the allowance. Assumptions are evaluated by management periodically as part of the CECL procedures. The unfunded loan commitment reserve is recorded in Accounts payable, accrued interest and other liabilities on the Condensed Consolidated Statements of Financial Condition.
Note 6: Derivative and Other Financial Instruments with Off-Balance Sheet Risks
The Corporation is a party to financial instruments with off-balance sheet risk in the normal course of business to meet the financing needs of its customers. These financial instruments include commitments to extend credit in the form of originating loans or providing funds under existing lines of credit, loan sale commitments to third parties and option contracts. These instruments involve, to varying degrees, elements of credit and interest-rate risk in excess of the amount recognized in the accompanying Condensed Consolidated Statements of Financial Condition. The Corporation’s exposure to credit loss, in the event of non-performance by the counterparty to these financial instruments, is represented by the
23
contractual amount of these instruments. The Corporation uses the same credit policies in entering into financial instruments with off-balance sheet risk as it does for on-balance sheet instruments. As of March 31, 20232024 and June 30, 2022,2023, the Corporation had commitments to extend credit on loans to be held for investment of $8.9$5.1 million and $43.4$2.4 million, respectively.
The following table provides information at the dates indicated regarding unfunded loan commitments, which are comprised of undisbursed funds on construction loans, undisbursed funds to borrowers on existing lines of credit with the Corporation as well asand commitments to originate loans to be held for investment at the dates indicated below.
| | | | | | | |
|
| | | | | |
|
Commitments | | March 31, 2023 | | June 30, 2022 | | ||
(In Thousands) |
| |
|
| |
|
|
Undisbursed loan funds – Construction loans | | $ | 2,867 | | $ | 3,384 | |
Undisbursed lines of credit – Commercial business loans | |
| 541 | |
| 541 | |
Undisbursed lines of credit – Consumer loans | |
| 373 | |
| 390 | |
Commitments to extend credit on loans to be held for investment | |
| 8,938 | |
| 43,386 | |
Total | | $ | 12,719 | | $ | 47,701 | |
The following table provides information regarding the allowance for loan losses for the undisbursed funds and commitments to extend credit on loans to be held for investment for the quarters and nine months ended March 31, 2023 and 2022.
| | | | | | | | | | | | | | | | | | | |
| | For the Quarter Ended | | For the Nine Months Ended |
| | | | | |
| ||||||||
| | March 31, | | March 31, | |||||||||||||||
Commitments | | March 31, 2024 | | June 30, 2023 | | ||||||||||||||
(In Thousands) |
| 2023 |
| 2022 |
| 2023 |
| 2022 |
| |
|
| |
|
| ||||
Balance, beginning of the period | | $ | 71 | | $ | 99 | | $ | 130 | | $ | 127 | |||||||
Provision (recovery) | |
| 3 | |
| 42 | |
| (56) | |
| 14 | |||||||
Balance, end of the period | | $ | 74 | | $ | 141 | | $ | 74 | | $ | 141 | |||||||
Undisbursed loan funds – Construction loans | | $ | 586 | | $ | 2,032 | | ||||||||||||
Undisbursed lines of credit – Commercial business loans | |
| 465 | |
| 607 | | ||||||||||||
Undisbursed lines of credit – Consumer loans | |
| 344 | |
| 363 | | ||||||||||||
Commitments to extend credit on loans to be held for investment | |
| 5,112 | |
| 2,394 | | ||||||||||||
Total | | $ | 6,507 | | $ | 5,396 | |
In accordance with ASC 815, “Derivatives and Hedging,” and interpretations of the Derivatives Implementation Group of the FASB, the fair value of the commitments to extend credit on loans to be held for sale, loan sale commitments, to be announced (“TBA”) MBS trades, put option contracts and call option contracts are recorded at fair value on the Condensed Consolidated Statements of Financial Condition. The Corporation does not apply hedge accounting to its derivative financial instruments; therefore, all changes in fair value are recorded in earnings. As of March 31, 20232024 and June 30, 2022,2023, there were no outstanding derivative financial instruments.
29
Loans previously sold to the FHLB – San Francisco under the Mortgage Partnership Finance (“MPF”) program have a recourse liability. The FHLB – San Francisco absorbs the first four basis points of loss by establishing a first loss account and a credit scoring process is used to calculate the maximum recourse amount for the Bank. All losses above the Bank’s maximum recourse amount are the responsibility of the FHLB – San Francisco. The FHLB – San Francisco pays the Bank a credit enhancement fee on a monthly basis to compensate the Bank for accepting the recourse obligation. As of March 31, 20232024 and June 30, 2022,2023, the Bank serviced $3.7$3.2 million and $4.1$3.5 million of loans under this program, respectively, and has established a recourse liability of $10,500$8,000 at both dates.
Occasionally, the Bank is required to repurchase loans sold to Freddie Mac, Fannie Mae or other investors if it is determined that such loans do not meet the credit requirements of the investor, or if one of the parties involved in the loan misrepresented pertinent facts, committed fraud, or if such loans were 90-days past due within 120 days of the loan funding date. During the quarters and nine months ended March 31, 20232024 and 2022,2023, the Bank did not repurchase any loans or settle any request to repurchase a loan. In addition to the specific recourse liability for the MPF program, the Bank established a recourse liability of $150,000$22,500 and $25,000 for loans sold to other investors at both March 31, 20232024 and June 30, 2022.2023, respectively.
24
The following table shows the summary of the recourse liability for the quarters and nine months ended March 31, 20232024 and 2022:2023:
| | | | | | | | | | | | | | | | | | | | | | | | |
| | For the Quarter Ended |
| For the Nine Months Ended | | For the Quarter Ended |
| For the Nine Months Ended | ||||||||||||||||
| | March 31, | | March 31, | | March 31, | | March 31, | ||||||||||||||||
Recourse Liability |
| 2023 |
| 2022 |
| 2023 |
| 2022 |
| 2024 |
| 2023 |
| 2024 |
| 2023 | ||||||||
(In Thousands) | | | | | | | | | | | | | | | | | | | | | | | | |
Balance, beginning of the period | | $ | 160 | | $ | 160 | | $ | 160 | | $ | 200 | | $ | 31 | | $ | 160 | | $ | 33 | | $ | 160 |
Recovery for recourse liability | |
| — | |
| — | |
| — | |
| (40) | ||||||||||||
(Recovery) provision for recourse liability | |
| — | |
| — | |
| (2) | |
| — | ||||||||||||
Net settlements in lieu of loan repurchases | |
| — | |
| — | |
| — | |
| — | |
| — | |
| — | |
| — | |
| — |
Balance, end of the period | | $ | 160 | | $ | 160 | | $ | 160 | | $ | 160 | | $ | 31 | | $ | 160 | | $ | 31 | | $ | 160 |
Note 7: Fair Value of Financial Instruments
The Corporation adopted ASC 820, “Fair Value Measurements and Disclosures,” and elected the fair value option pursuant to ASC 825, “Financial Instruments.” ASC 820 defines fair value, establishes a framework for measuring fair value, and expands disclosures about fair value measurements. ASC 825 permits entities to elect to measure many financial instruments and certain other assets and liabilities at fair value on an instrument-by-instrument basis (the “Fair Value Option”) at specified election dates. The Corporation elected the fair value option on loans held for investment which were previously originated for sale. At each subsequent reporting date, an entity is required to report unrealized gains and losses on items in earnings for which the fair value option has been elected. The objective of the Fair Value Option is to improve financial reporting by providing entities with the opportunity to mitigate volatility in reported earnings caused by measuring related assets and liabilities differently without having to apply complex hedge accounting provisions.
The following table describes the difference at the dates indicated between the aggregate fair value and the aggregate unpaid principal balance of loans held for investment at fair value:
| | | | | | | | | | | | | | | | | | |
| | | | | Aggregate | | | | | | | | Aggregate | | | | ||
| | | | | Unpaid | | Net | | | | | Unpaid | | Net | ||||
| | Aggregate | | Principal | | Unrealized | | Aggregate | | Principal | | Unrealized | ||||||
(In Thousands) |
| Fair Value |
| Balance |
| Loss |
| Fair Value |
| Balance |
| Loss | ||||||
As of March 31, 2023: | | | | | | | | | | |||||||||
As of March 31, 2024: | | | | | | | | | | |||||||||
Loans held for investment, at fair value | | $ | 1,352 | | $ | 1,506 | | $ | (154) | | $ | 1,054 | | $ | 1,211 | | $ | (157) |
| | | | | | | | | | | | | | | | | | |
As of June 30, 2022: | |
|
| |
|
| |
|
| |||||||||
As of June 30, 2023: | |
|
| |
|
| |
|
| |||||||||
Loans held for investment, at fair value | | $ | 1,396 | | $ | 1,569 | | $ | (173) | | $ | 1,312 | | $ | 1,483 | | $ | (171) |
ASC 820-10-65-4, “Determining Fair Value When the Volume and Level of Activity for the Asset or Liability Have Significantly Decreased and Identifying Transactions That Are Not Orderly,” provides additional guidance for estimating fair value in accordance with ASC 820, “Fair Value Measurements,” when the volume and level of activity for the asset or liability have significantly decreased.
2530
ASC 820 establishes a three-level valuation hierarchy that prioritizes inputs to valuation techniques used in fair value calculations. The three levels of inputs are defined as follows:
Level 1 | - | Unadjusted quoted prices in active markets for identical assets or liabilities that the Corporation has the ability to access at the measurement date. |
Level 2 | - | Observable inputs other than Level 1 such as: quoted prices for similar assets or liabilities in active markets, quoted prices for identical or similar assets or liabilities in markets that are not active, or other inputs that are observable or can be corroborated to observable market data for substantially the full term of the asset or liability. Valuation techniques may include the use of discounted cash flow models and similar techniques. |
Level 3 | - | Unobservable inputs for the asset or liability that use significant assumptions, including assumptions of risks. These unobservable assumptions reflect the Corporation’s estimate of assumptions that market participants would use in pricing the asset or liability. Valuation techniques include the use of pricing models, discounted cash flow models and similar techniques. |
ASC 820 requires the Corporation to maximize the use of observable inputs and minimize the use of unobservable inputs. If a financial instrument uses inputs that fall in different levels of the hierarchy, the instrument will be categorized based upon the lowest level of input that is significant to the fair value calculation.
The Corporation’s financial assets and liabilities measured at fair value on a recurring basis consist of investment securities available for sale, loans held for investment at fair value and interest-only strips; while non-performing loans with individually evaluated allowances and mortgage servicing assets ("MSA"(“MSA”) and real estate owned, if any, are measured at fair value on a nonrecurring basis.
Investment securities - available for sale are primarily comprised of U.S. government agency MBS, U.S. government sponsored enterprise MBS and privately issuedprivate issue CMO. The Corporation utilizes quoted prices in active markets for similar securities for its fair value measurement of MBS (Level 2) and broker price indications for similar securities in non-active markets for its fair value measurement of the private issue CMO (Level 3).
Loans held for investment at fair value are primarily single-family loans which have been transferred from loans held for sale. The fair value is determined by the management estimates of the specific credit risk attributes of each loan, in addition to the quoted secondary-market prices which account for the interest rate characteristics of each loan (Level 3).
Non-performing loans
Loans with an individually evaluated allowance that are recorded at fair value on a non-recurring basis are loans which are inadequately protected by the current sound worth and paying capacity of the borrowers or of the collateral pledged. The non-performingThese loans are characterized by the distinct possibility that the Corporation will sustain some loss if the deficiencies are not corrected. The fair value of a non-performing loan with an individually evaluated allowance is determined based on an observable market pricethe discounted cash flow or current appraised value of the underlying collateral. Appraised and reported values may be discounted based on management’s historical knowledge, changes in market conditions from the time of valuation, and/or management’s expertise and knowledge of the borrower.collateral. For non-performingcommercial real estate loans which are restructured loans, the fair value is derived from discounted cash flow analysis (Level 3), except those which are in the process of foreclosure or 90 days delinquent for whichwith an individually evaluated allowance, the fair value is derived from the appraised value of its collateral (Level 2). For other non-performing loans which are not restructured loans, other than non-performing commercial real estate loans, the fair value is derived from relative value analysis: historical experience and management estimates by loan type for which collectivelycollateral. Loans with an individually evaluated allowances are assigned (Level 3); or the appraised value of its collateral for loans which are in the process of foreclosure or where borrowers file bankruptcy (Level 2). For non-performing commercial real estate loans, the fair value is derived from the appraised value of its collateral (Level 2). Non-performing loansallowance are reviewed and evaluated on at least a quarterly basis for additional allowance and adjusted accordingly, based on the same factors identified above.above (Level 3). This loss is not recorded directly as an adjustment to current earnings or other comprehensive income (loss), but rather as a component in determining the overall adequacy of the allowance for loan losses.ACL. These adjustments to the estimated fair value of non-performing loans with individually evaluated allowance may result in increases or decreases to the provision for loan(recovery of) credit losses recorded in current earnings.
The Corporation uses the amortization method for its MSA, which amortizes the MSA in proportion to and over the period of estimated net servicing income and assesses the MSA for impairment based on fair value at each reporting date. The fair value of the MSA is derived using the present value method; which includes a third party’s prepayment projections of similar instruments, weighted-average coupon rates, estimated servicing costs and discount interest rates (Level 3).
The fair value of interest-only strips is derived using the same assumptions that are used to value the related MSA (Level 3).
The Corporation’s valuation methodologies may produce a fair value calculation that may not be indicative of net realizable value or reflective of future fair values. While management believes the Corporation’s valuation methodologies
2631
The rights to future income from serviced loans that exceed contractually specified servicing fees are recorded as interest-only strips. The fair value of interest-only strips is derived using the same assumptions that are used to value the related MSA (Level 3).
The Corporation’s valuation methodologies may produce a fair value calculation that may not be indicative of net realizable value or reflective of future fair values. While management believes the Corporation’s valuation methodologies are appropriate and consistent with other market participants, the use of different methodologies or assumptions to determine the fair value of certain financial instruments could result in a different estimate of fair value at the reporting date.
The following fair value hierarchy tables present information at the dates indicated about the Corporation’s assets and liabilities measured at fair value on a recurring basis:
| | | | | | | | | | | | | | | | | | | | | | | | |
| | Fair Value Measurement at March 31, 2023 Using: | | Fair Value Measurement at March 31, 2024 Using: | ||||||||||||||||||||
(In Thousands) |
| Level 1 |
| Level 2 |
| Level 3 |
| Total |
| Level 1 |
| Level 2 |
| Level 3 |
| Total | ||||||||
Assets: | | | | | | | | | | | | | | | | | | | | | | | | |
Investment securities - available for sale: | | | | | | | | | | | | | | | | | | | | | | | | |
U.S. government agency MBS | | $ | — | | $ | 1,440 | | $ | — | | $ | 1,440 | | $ | — | | $ | 1,274 | | $ | — | | $ | 1,274 |
U.S. government sponsored enterprise MBS | |
| — | |
| 713 | |
| — | |
| 713 | |
| — | |
| 570 | |
| — | |
| 570 |
Private issue CMO | |
| — | |
| — | |
| 98 | |
| 98 | |
| — | |
| — | |
| 91 | |
| 91 |
Investment securities - available for sale | |
| — | |
| 2,153 | |
| 98 | |
| 2,251 | |
| — | |
| 1,844 | |
| 91 | |
| 1,935 |
| | | | | | | | | | | | | | | | | | | | | | | | |
Loans held for investment, at fair value | |
| — | |
| — | |
| 1,352 | |
| 1,352 | |
| — | |
| — | |
| 1,054 | |
| 1,054 |
Interest-only strips | |
| — | |
| — | |
| 8 | |
| 8 | |
| — | |
| — | |
| 8 | |
| 8 |
Total assets | | $ | — | | $ | 2,153 | | $ | 1,458 | | $ | 3,611 | | $ | — | | $ | 1,844 | | $ | 1,153 | | $ | 2,997 |
| | | | | | | | | | | | | | | | | | | | | | | | |
Liabilities: | | $ | — | | $ | — | | $ | — | | $ | — | | $ | — | | $ | — | | $ | — | | $ | — |
Total liabilities | | $ | — | | $ | — | | $ | — | | $ | — | | $ | — | | $ | — | | $ | — | | $ | — |
| | | | | | | | | | | | | | | | | | | | | | | | |
| | Fair Value Measurement at June 30, 2022 Using: | | Fair Value Measurement at June 30, 2023 Using: | ||||||||||||||||||||
(In Thousands) |
| | Level 1 | | | Level 2 |
| | Level 3 |
| | Total |
| | Level 1 | | | Level 2 |
| | Level 3 |
| | Total |
Assets: | | | | | | | | | | | | | | | | | | | | | | | | |
Investment securities - available for sale: | | | | | | | | | | | | | | | | | | | | | | | | |
U.S. government agency MBS | | $ | — | | $ | 1,698 | | $ | — | | $ | 1,698 | | $ | — | | $ | 1,370 | | $ | — | | $ | 1,370 |
U.S. government sponsored enterprise MBS | |
| — | |
| 865 | |
| — | |
| 865 | |
| — | |
| 683 | |
| — | |
| 683 |
Private issue CMO | |
| — | |
| — | |
| 113 | |
| 113 | |
| — | |
| — | |
| 102 | |
| 102 |
Investment securities - available for sale | |
| — | |
| 2,563 | |
| 113 | |
| 2,676 | |
| — | |
| 2,053 | |
| 102 | |
| 2,155 |
| | | | | | | | | | | | | | | | | | | | | | | | |
Loans held for investment, at fair value | |
| — | |
| — | |
| 1,396 | |
| 1,396 | |
| — | |
| — | |
| 1,312 | |
| 1,312 |
Interest-only strips | |
| — | |
| — | |
| 7 | |
| 7 | |
| — | |
| — | |
| 9 | |
| 9 |
Total assets | | $ | — | | $ | 2,563 | | $ | 1,516 | | $ | 4,079 | | $ | — | | $ | 2,053 | | $ | 1,423 | | $ | 3,476 |
| | | | | | | | | | | | | | | | | | | | | | | | |
Liabilities: | | $ | — | | $ | — | | $ | — | | $ | — | | $ | — | | $ | — | | $ | — | | $ | — |
Total liabilities | | $ | — | | $ | — | | $ | — | | $ | — | | $ | — | | $ | — | | $ | — | | $ | — |
2732
The following tables summarize reconciliations of the beginning and ending balances during the periods shown of recurring fair value measurements recognized in the Condensed Consolidated Statements of Financial Condition using Level 3 inputs:
| | | | | | | | | | | | | | | | | | | | | | | ||
| | For the Quarter Ended March 31, 2023 | | For the Quarter Ended March 31, 2024 | ||||||||||||||||||||
| | Fair Value Measurement | | Fair Value Measurement | ||||||||||||||||||||
| | Using Significant Other Unobservable Inputs | | Using Significant Other Unobservable Inputs | ||||||||||||||||||||
| | (Level 3) | | (Level 3) | ||||||||||||||||||||
| | Private | | Loans Held For | | Interest- | | | | Private | | Loans Held For | | Interest- | | | ||||||||
| | Issue | | Investment, at | | Only | | | | Issue | | Investment, at | | Only | | | ||||||||
(In Thousands) |
| CMO |
| fair value(1) |
| Strips |
| Total |
| CMO |
| fair value(1) |
| Strips |
| Total | ||||||||
Beginning balance at December 31, 2022 | | $ | 102 | | $ | 1,345 | | $ | 9 | | $ | 1,456 | ||||||||||||
Beginning balance at December 31, 2023 | | $ | 98 | | $ | 1,092 | | $ | 8 | | $ | 1,198 | ||||||||||||
Total gains or losses (realized/unrealized): | | | | | | | | | | | | | | | | | | | | | | | ||
Included in earnings | |
| — | |
| 30 | |
| — | |
| 30 | |
| — | |
| (28) | |
| — | |
| (28) |
Included in other comprehensive income (loss) | |
| (1) | |
| — | |
| (1) | |
| (2) | ||||||||||||
Included in other comprehensive loss | |
| (1) | |
| — | |
| — | |
| (1) | ||||||||||||
Purchases | |
| — | |
| — | |
| — | |
| — | |
| — | |
| — | |
| — | |
| — |
Issuances | |
| — | |
| — | |
| — | |
| — | |
| — | |
| — | |
| — | |
| — |
Settlements | |
| (3) | |
| (23) | |
| — | |
| (26) | |
| (6) | |
| (10) | |
| — | |
| (16) |
Transfers in and/or out of Level 3 | |
| — | |
| — | |
| — | |
| — | |
| — | |
| — | |
| — | |
| — |
Ending balance at March 31, 2023 | | $ | 98 | | $ | 1,352 | | $ | 8 | | $ | 1,458 | ||||||||||||
Ending balance at March 31, 2024 | | $ | 91 | | $ | 1,054 | | $ | 8 | | $ | 1,153 |
(1) | The valuation of loans held for investment at fair value includes management estimates of the specific credit risk attributes of each loan, in addition to the quoted secondary-market prices which account for the interest rate characteristics of each loan. |
| | | | | | | | | | | | |
| | For the Quarter Ended March 31, 2022 | ||||||||||
| | Fair Value Measurement | ||||||||||
| | Using Significant Other Unobservable Inputs | ||||||||||
| | (Level 3) | ||||||||||
| | Private | | Loans Held For | | Interest- | | | ||||
| | Issue | | Investment, at | | Only | | | ||||
(In Thousands) |
| CMO |
| fair value(1) |
| Strips |
| Total | ||||
Beginning balance at December 31, 2021 | | $ | 146 | | $ | 1,555 | | $ | 9 | | $ | 1,710 |
Total gains or losses (realized/unrealized): | | | | | | | | | | | | |
Included in earnings | |
| — | |
| (67) | |
| (1) | |
| (68) |
Included in other comprehensive income (loss) | |
| (2) | |
| — | |
| — | |
| (2) |
Purchases | |
| — | |
| — | |
| — | |
| — |
Issuances | |
| — | |
| — | |
| — | |
| — |
Settlements | |
| (9) | |
| (18) | |
| — | |
| (27) |
Transfers in and/or out of Level 3 | |
| — | |
| — | |
| — | |
| — |
Ending balance at March 31, 2022 | | $ | 135 | | $ | 1,470 | | $ | 8 | | $ | 1,613 |
| | | | | | | | | | | | |
| | For the Quarter Ended March 31, 2023 | ||||||||||
| | Fair Value Measurement | ||||||||||
| | Using Significant Other Unobservable Inputs | ||||||||||
| | (Level 3) | ||||||||||
| | Private | | Loans Held For | | Interest- | | | ||||
| | Issue | | Investment, at | | Only | | | ||||
(In Thousands) |
| CMO |
| fair value(1) |
| Strips |
| Total | ||||
Beginning balance at December 31, 2022 | | $ | 102 | | $ | 1,345 | | $ | 9 | | $ | 1,456 |
Total gains or losses (realized/unrealized): | | | | | | | | | | | | |
Included in earnings | |
| — | |
| 30 | |
| — | |
| 30 |
Included in other comprehensive loss | |
| (1) | |
| — | |
| (1) | |
| (2) |
Purchases | |
| — | |
| — | |
| — | |
| — |
Issuances | |
| — | |
| — | |
| — | |
| — |
Settlements | |
| (3) | |
| (23) | |
| — | |
| (26) |
Transfers in and/or out of Level 3 | |
| — | |
| — | |
| — | |
| — |
Ending balance at March 31, 2023 | | $ | 98 | | $ | 1,352 | | $ | 8 | | $ | 1,458 |
(1) | The valuation of loans held for investment at fair value includes management estimates of the specific credit risk attributes of each loan, in addition to the quoted secondary-market prices which account for the interest rate characteristics of each loan. |
2833
| | | | | | | | | | | | | | | | | | | | | | | | |
| | For the Nine Months Ended March 31, 2023 | | For the Nine Months Ended March 31, 2024 | ||||||||||||||||||||
| | Fair Value Measurement | | Fair Value Measurement | ||||||||||||||||||||
| | Using Significant Other Unobservable Inputs | | Using Significant Other Unobservable Inputs | ||||||||||||||||||||
| | (Level 3) | | (Level 3) | ||||||||||||||||||||
| | Private | | Loans Held For | | Interest- | | | | Private | | Loans Held For | | Interest- | | | ||||||||
| | Issue | | Investment, at | | Only | | | | Issue | | Investment, at | | Only | | | ||||||||
(In Thousands) |
| CMO |
| fair value(1) |
| Strips |
| Total |
| CMO |
| fair value(1) |
| Strips |
| Total | ||||||||
Beginning balance at June 30, 2022 | | $ | 113 | | $ | 1,396 | | $ | 7 | | $ | 1,516 | ||||||||||||
Beginning balance at June 30, 2023 | | $ | 102 | | $ | 1,312 | | $ | 9 | | $ | 1,423 | ||||||||||||
Adjustment due to ASC 326 CECL adoption | | | — | | | 28 | | | — | | | 28 | ||||||||||||
Total gains or losses (realized/unrealized): | | | | | | | | | | | | | | | | | | | | | | | | |
Included in earnings | |
| — | |
| 19 | |
| — | |
| 19 | |
| — | |
| (14) | |
| — | |
| (14) |
Included in other comprehensive income (loss) | |
| (5) | |
| — | |
| 1 | |
| (4) | ||||||||||||
Included in other comprehensive loss | |
| (1) | |
| — | |
| (1) | |
| (2) | ||||||||||||
Purchases | |
| — | |
| — | |
| — | |
| — | |
| — | |
| — | |
| — | |
| — |
Issuances | |
| — | |
| — | |
| — | |
| — | |
| — | |
| — | |
| — | |
| — |
Settlements | |
| (10) | |
| (63) | |
| — | |
| (73) | |
| (10) | |
| (272) | |
| — | |
| (282) |
Transfers in and/or out of Level 3 | |
| — | |
| — | |
| — | |
| — | |
| — | |
| — | |
| — | |
| — |
Ending balance at March 31, 2023 | | $ | 98 | | $ | 1,352 | | $ | 8 | | $ | 1,458 | ||||||||||||
Ending balance at March 31, 2024 | | $ | 91 | | $ | 1,054 | | $ | 8 | | $ | 1,153 |
(1) | The valuation of loans held for investment at fair value includes management estimates of the specific credit risk attributes of each loan, in addition to the quoted secondary-market prices which account for the interest rate characteristics of each loan. |
| | | | | | | | | | | | |
| | For the Nine Months Ended March 31, 2022 | ||||||||||
| | Fair Value Measurement | ||||||||||
| | Using Significant Other Unobservable Inputs | ||||||||||
| | (Level 3) | ||||||||||
| | Private | | Loans Held For | | Interest- | | | ||||
| | Issue | | Investment, at | | Only | | | ||||
(In Thousands) |
| CMO |
| fair value(1) |
| Strips |
| Total | ||||
Beginning balance at June 30, 2021 | | $ | 154 | | $ | 1,874 | | $ | 10 | | $ | 2,038 |
Total gains or losses (realized/unrealized): | | | | | | | | | | | | |
Included in earnings | |
| — | |
| (59) | |
| — | |
| (59) |
Included in other comprehensive income (loss) | |
| (2) | |
| — | |
| (2) | |
| (4) |
Purchases | |
| — | |
| — | |
| — | |
| — |
Issuances | |
| — | |
| — | |
| — | |
| — |
Settlements | |
| (17) | |
| (345) | |
| — | |
| (362) |
Transfers in and/or out of Level 3 | |
| — | |
| — | |
| — | |
| — |
Ending balance at March 31, 2022 | | $ | 135 | | $ | 1,470 | | $ | 8 | | $ | 1,613 |
|
|
|
|
|
|
|
|
|
|
|
|
|
| | | | | | | | | | | | |
| | For the Nine Months Ended March 31, 2023 | ||||||||||
| | Fair Value Measurement | ||||||||||
| | Using Significant Other Unobservable Inputs | ||||||||||
| | (Level 3) | ||||||||||
| | Private | | Loans Held For | | Interest- | | | ||||
| | Issue | | Investment, at | | Only | | | ||||
(In Thousands) |
| CMO |
| fair value(1) |
| Strips |
| Total | ||||
Beginning balance at June 30, 2022 | | $ | 113 | | $ | 1,396 | | $ | 7 | | $ | 1,516 |
Total gains or losses (realized/ unrealized): | |
| | | | | | | | | | |
Included in earnings | |
| — | |
| 19 | |
| — | |
| 19 |
Included in other comprehensive loss | |
| (5) | |
| — | |
| 1 | |
| (4) |
Purchases | |
| — | |
| — | |
| — | |
| — |
Issuances | |
| — | |
| — | |
| — | |
| — |
Settlements | |
| (10) | |
| (63) | |
| — | |
| (73) |
Transfers in and/or out of Level 3 | |
| — | |
| — | |
| — | |
| — |
Ending balance at March 31, 2023 | | $ | 98 | | $ | 1,352 | | $ | 8 | | $ | 1,458 |
(1) | The valuation of loans held for investment at fair value includes management estimates of the specific credit risk attributes of each loan, in addition to the quoted secondary-market prices which account for the interest rate characteristics of each loan. |
The following fair value hierarchy tables present information about the Corporation’s assets measured at fair value at the dates indicated on a nonrecurring basis:
| | | | | | | | | | | | |
| | Fair Value Measurement at March 31, 2023 Using: | ||||||||||
(In Thousands) |
| Level 1 |
| Level 2 |
| Level 3 |
| Total | ||||
Non-performing loans | | $ | — | | $ | 56 | | $ | 889 | | $ | 945 |
Mortgage servicing assets | |
| — | |
| — | |
| 94 | |
| 94 |
Total | | $ | — | | $ | 56 | | $ | 983 | | $ | 1,039 |
| | | | | | | | | | | | |
| | Fair Value Measurement at June 30, 2022 Using: | ||||||||||
(In Thousands) | | Level 1 | | Level 2 | | Level 3 | | Total | ||||
Non-performing loans |
| $ | — | | $ | 515 | | $ | 908 | | $ | 1,423 |
Mortgage servicing assets | |
| — | |
| — | |
| 168 | |
| 168 |
Total | | $ | — | | $ | 515 | | $ | 1,076 | | $ | 1,591 |
2934
| | | | | | | | | | | | |
The following fair value hierarchy tables present information about the Corporation’s assets measured at fair value at the dates indicated on a nonrecurring basis:
| | | | | | | | | | | | |
| | Fair Value Measurement at March 31, 2024 Using: | ||||||||||
(In Thousands) |
| Level 1 |
| Level 2 |
| Level 3 |
| Total | ||||
Loans with individually evaluated allowance | | $ | — | | $ | — | | $ | 695 | | $ | 695 |
Mortgage servicing assets | |
| — | |
| — | |
| 83 | |
| 83 |
Total | | $ | — | | $ | — | | $ | 778 | | $ | 778 |
| | | | | | | | | | | | |
| | Fair Value Measurement at June 30, 2023 Using: | ||||||||||
(In Thousands) | | Level 1 | | Level 2 | | Level 3 | | Total | ||||
Loans with individually evaluated allowance |
| $ | — | | $ | 251 | | $ | 1,049 | | $ | 1,300 |
Mortgage servicing assets | |
| — | |
| — | |
| 90 | |
| 90 |
Total | | $ | — | | $ | 251 | | $ | 1,139 | | $ | 1,390 |
The following table presents additional information about valuation techniques and inputs used for assets and liabilities, which are measured at fair value and categorized within Level 3 as of March 31, 2023:2024:
| | | | | | | | | | | | | | | | | | | | | | |
| | | | | | | | | | | Impact to | | | | | | | | | | | Impact to |
| | Fair Value | | | | | | | | Valuation | | Fair Value | | | | | | | | Valuation | ||
| | As of | | | | | | | | from an | | As of | | | | | | | | from an | ||
| | March 31, | | Valuation | | | | Range(1) | | Increase in | | March 31, | | Valuation | | | | Range(1) | | Increase in | ||
(Dollars In Thousands) |
| 2023 |
| Techniques |
| Unobservable Inputs |
| (Weighted Average) |
| Inputs(2) |
| 2024 |
| Techniques |
| Unobservable Inputs |
| (Weighted Average) |
| Inputs(2) | ||
Assets: | | | | | | | | | | | | | | | | | | | | | | |
Securities available-for sale: Private issue CMO | | $ | 98 |
| Market comparable pricing |
| Comparability adjustment |
| (8.2%) - (8.7%) (8.6%) |
| Increase | | $ | 91 |
| Market comparable pricing |
| Comparability adjustment |
| (1.4%) - (6.1%) (2.4%) |
| Increase |
| | | | | | | | | | | | | | | | | | | | | | |
Loans held for investment, at fair value | | $ | 1,352 |
| Relative value analysis |
| Broker quotes |
| 91.5% - 98.0% (93.1%) |
| Increase | | $ | 1,054 |
| Relative value analysis |
| Broker quotes |
| 86.7% - 88.9% (88.1%) |
| Increase |
| | | | | | | Credit risk factor |
| 1.2% - 6.6% (3.3%) | | Decrease | | | | | | | ACL factors |
| 1.0% - 1.1% (1.1%) | | Decrease |
| | | | | | | | | | | | | | | | | | | | | | |
Non-performing loans(3) | | $ | 710 |
| Discounted cash flow |
| Default rates |
| 5.0% | | Decrease | |||||||||||
Loans with individually evaluated allowance | | $ | 695 |
| Discounted cash flow |
| Default Rate |
| 5.0% | | Decrease | |||||||||||
| | | | | | | | | | | | | | | | | | Discount Rate | | 4.8% | | Decrease |
Non-performing loans(4) | | $ | 179 |
| Relative value analysis |
| Credit risk factor |
| 20.0% |
| Decrease | |||||||||||
| | | | | | | | | | | | | | | | | | | | | | |
Mortgage servicing assets | | $ | 94 |
| Discounted cash flow |
| Prepayment speed (CPR) |
| 5.3% - 60.0% (9.7%) |
| Decrease | | $ | 83 |
| Discounted cash flow |
| Prepayment speed (CPR) |
| 5.5% - 60.0% (10.6%) |
| Decrease |
| | | | | |
| Discount rate |
| 9.0% - 10.5% (9.1%) |
| Decrease | | | | | |
| Discount rate |
| 9.0% - 10.5% (9.1%) |
| Decrease |
| | | | | | | | | | | | | | | | | | | | | | |
Interest-only strips | | $ | 8 |
| Discounted cash flow |
| Prepayment speed (CPR) |
| 7.2% - 15.1% (14.6%) | | Decrease | | $ | 8 |
| Discounted cash flow |
| Prepayment speed (CPR) |
| 7.3% - 15.1% (9.2%) | | Decrease |
| | | | | |
| Discount rate |
| 9.0% |
| Decrease | | | | | |
| Discount rate |
| 9.0% |
| Decrease |
| | | | | | | | | | | | | | | | | | | | | | |
| | | | | | | | | | | | | | | | | | | | | | |
Liabilities: | |
|
|
|
|
|
|
|
|
|
| |
|
|
|
|
|
|
|
|
|
|
| | | | | | | | | | | | | | | | | | | | | | |
None | | | | | | | | | | | | | | | | | | | | | | |
(1) | The range is based on the historical estimated fair values and management estimates. |
(2) | Unless otherwise noted, this column represents the directional change in the fair value of the Level 3 asset instruments that would result from an increase to the corresponding unobservable input. A decrease to the unobservable input would have the opposite effect. Significant changes in these inputs in isolation could result in significantly higher or lower fair value measurements. |
The significant unobservable inputs used in the fair value measurement of the Corporation’s assets and liabilities include the following: prepayment speeds, discount rates and broker quotes, among others. Significant increases or decreases in any of these inputs in isolation could result in significantly lower or higher fair value measurement. The various unobservable inputs used to determine valuations may have similar or diverging impacts on valuation.
The carrying amount and fair value of the Corporation’s other financial instruments as of March 31, 2023 and June 30, 2022 was as follows:
| | | | | | | | | | | | | | | |
| | March 31, 2023 | |||||||||||||
| | Carrying | | Fair | | | | | | | | | | ||
(In Thousands) |
| Amount |
| Value |
| Level 1 |
| Level 2 |
| Level 3 | |||||
Financial assets: | | | | | | | | | | | | | | | |
Loans held for investment, not recorded at fair value | | $ | 1,076,352 | | $ | 1,002,191 | | $ | — | | $ | — | | $ | 1,002,191 |
Investment securities - held to maturity | | $ | 161,336 | | $ | 143,870 | | $ | — | | $ | 143,870 | | $ | — |
FHLB – San Francisco stock | | $ | 8,239 | | $ | 8,239 | | $ | — | | $ | 8,239 | | $ | — |
| | | | | | | | | | | | | | | |
Financial liabilities: | |
|
| |
|
| |
|
| |
|
| |
|
|
Deposits | | $ | 983,046 | | $ | 866,706 | | $ | — | | $ | — | | $ | 866,706 |
Borrowings | | $ | 205,010 | | $ | 203,541 | | $ | — | | $ | — | | $ | 203,541 |
3035
| | | | | | | | | | | | | | | |
| | June 30, 2022 | |||||||||||||
| | Carrying | | Fair | | | | | | | | | | ||
(In Thousands) |
| Amount |
| Value |
| Level 1 |
| Level 2 |
| Level 3 | |||||
Financial assets: | | | | | | | | | | | | | | | |
Loans held for investment, not recorded at fair value | | $ | 938,596 | | $ | 892,339 | | $ | — | | $ | — | | $ | 892,339 |
Investment securities - held to maturity | | $ | 185,745 | | $ | 171,724 | | $ | — | | $ | 171,724 | | $ | — |
FHLB – San Francisco stock | | $ | 8,239 | | $ | 8,239 | | $ | — | | $ | 8,239 | | $ | — |
| | | | | | | | | | | | | | | |
Financial liabilities: | |
| | |
| | |
| | |
| | |
| |
Deposits | | $ | 955,504 | | $ | 917,220 | | $ | — | | $ | — | | $ | 917,220 |
Borrowings | | $ | 85,000 | | $ | 84,299 | | $ | — | | $ | — | | $ | 84,299 |
The carrying amount and fair value of the Corporation’s other financial instruments as of March 31, 2024 and June 30, 2023 was as follows:
| | | | | | | | | | | | | | | |
| | March 31, 2024 | |||||||||||||
| | Carrying | | Fair | | | | | | | | | | ||
(In Thousands) |
| Amount |
| Value |
| Level 1 |
| Level 2 |
| Level 3 | |||||
Financial assets: | | | | | | | | | | | | | | | |
Loans held for investment, not recorded at fair value | | $ | 1,064,707 | | $ | 982,881 | | $ | — | | $ | — | | $ | 982,881 |
Investment securities - held to maturity | | $ | 135,971 | | $ | 120,271 | | $ | — | | $ | 120,271 | | $ | — |
FHLB – San Francisco stock | | $ | 9,505 | | $ | 9,505 | | $ | — | | $ | 9,505 | | $ | — |
| | | | | | | | | | | | | | | |
Financial liabilities: | |
|
| |
|
| |
|
| |
|
| |
|
|
Deposits | | $ | 908,122 | | $ | 908,057 | | $ | — | | $ | 908,057 | | $ | — |
Borrowings | | $ | 235,000 | | $ | 234,043 | | $ | — | | $ | 234,043 | | $ | — |
| | | | | | | | | | | | | | | |
| | June 30, 2023 | |||||||||||||
| | Carrying | | Fair | | | | | | | | | | ||
(In Thousands) |
| Amount |
| Value |
| Level 1 |
| Level 2 |
| Level 3 | |||||
Financial assets: | | | | | | | | | | | | | | | |
Loans held for investment, not recorded at fair value | | $ | 1,076,317 | | $ | 970,277 | | $ | — | | $ | — | | $ | 970,277 |
Investment securities - held to maturity | | $ | 154,337 | | $ | 135,541 | | $ | — | | $ | 135,541 | | $ | — |
FHLB – San Francisco stock | | $ | 9,505 | | $ | 9,505 | | $ | — | | $ | 9,505 | | $ | — |
| | | | | | | | | | | | | | | |
Financial liabilities: | |
| | |
| | |
| | |
| | |
| |
Deposits | | $ | 950,571 | | $ | 949,116 | | $ | — | | $ | 949,116 | | $ | — |
Borrowings | | $ | 235,009 | | $ | 232,764 | | $ | — | | $ | 232,764 | | $ | — |
Loans held for investment, not recorded at fair value: For loans that reprice frequently at market rates, the carrying amount approximates the fair value. For fixed-rate loans, the fair value is determined by either (i) discounting the estimated future cash flows of such loans over their estimated remaining contractual maturities using a current interest rate at which suchsimilar loans would be made to borrowers, or (ii) quoted market prices.
Investment securities - held to maturity: The investment securities - held to maturity consist of time deposits at CRA qualified minority financial institutions, U.S. SBA securities, U.S. government sponsored enterprise CMOMBS and U.S. government sponsored enterprise MBS. Due to the short-term nature of the time deposits, the principal balance approximated fair value (Level 2).CMO. For the MBS, CMO andU.S. SBA securities and U.S. government sponsored enterprise MBS and CMO, the Corporation utilizes quoted prices in active markets for similar securities for its fair value measurement (Level 2).measurement.
FHLB – San Francisco stock: The carrying amount reported for FHLB – San Francisco stock approximates fair value. When redeemed, the Corporation will receive an amount equal to the par value of the stock.
Deposits: The fair value of time deposits is estimated using a discounted cash flow calculation. The discount rate is based upon observable inputs, including rates currently offered for deposits of similar remaining maturities. The fair value of transaction accounts (checking, money market and savings accounts) is equal to the carrying amounts payable on demand or estimated using a discounted cash flow calculation and management estimates of current market conditions.
Borrowings: The fair value of borrowings has been estimated using a discounted cash flow calculation. The discount rate on such borrowings is based upon rates currently offered for borrowings of similar remaining maturities.
The Corporation has various processes and controls in place to ensure that fair value is reasonably estimated. The Corporation generally determines fair value of their Level 3 assets and liabilities by using internally developed models which primarily utilize discounted cash flow techniques and prices obtained from independent management services or brokers. The Corporation performs due diligence procedures over third-party pricing service providers in order to support their use in the valuation process.
36
While the Corporation believes its valuation methods are appropriate and consistent with other market participants, the use of different methodologies or assumptions to determine the fair value of certain financial instruments could result in a different estimate of fair value at the reporting date. DuringFor the quarter ended March 31, 2023,and first nine months of fiscal 2024, there were no significant changes to the Corporation’s valuation techniques that had, or are expected to have, a material impact on its condensed consolidated financial position or results of operations.
Note 8: Revenue From Contracts With Customers
In accordance with ASC 606, revenues are recognized when goods or services are transferred to the customer in exchange for the consideration the Corporation expects to be entitled to receive. The largest portion of the Corporation's revenue is from interest income, which is not in the scope of ASC 606. All of the Corporation's revenue from contracts with customers in the scope of ASC 606 is recognized in non-interest income.
31
If a contract is determined to be within the scope of ASC 606, the Corporation recognizes revenue as it satisfies a performance obligation. Payments from customers are generally collected at the time services are rendered, monthly, quarterly or annually. For contracts with customers within the scope of ASC 606, revenue is either earned at a point in time or revenue is earned over time. Examples of revenue earned at a point in time are automated teller machine ("ATM") transaction fees, wire transfer fees, overdraft fees and interchange fees. Revenue is primarily based on the number and type of transactions that are generally derived from transactional information accumulated by our systems and is recognized immediately as the transactions occur or upon providing the service to complete the customer's transaction. The Corporation is generally the principal in these contracts, with the exception ofexcept for interchange fees, in which case the Corporation is acting as the agent and records revenue net of expenses paid to the principal. Examples of revenue earned over time, which generally occur on a monthly, basis, are deposit account maintenance fees, investment advisory fees, merchant revenue, trust and investment management fees and safe deposit box fees. Revenue is generally derived from transactional information accumulated by our systems or those of third-parties and is recognized as the related transactions occur or services are rendered to the customer.
Disaggregation of Revenue:
The following table includes the Corporation's non-interest income disaggregated by type of services for the quarters and nine months ended March 31, 20232024 and 2022:2023:
| | | | | | | | | | | | | | | | | | | | | | | | |
| | Quarter Ended | | Nine Months Ended | | Quarter Ended | | Nine Months Ended | ||||||||||||||||
| | March 31, | | March 31, | | March 31, | | March 31, | ||||||||||||||||
Type of Services |
| 2023 |
| 2022 |
| 2023 |
| 2022 |
| 2024 |
| 2023 |
| 2024 |
| 2023 | ||||||||
(In Thousands) |
| |
|
| |
|
| |
|
| |
|
| |
|
| |
|
| |
|
| |
|
Loan servicing and other fees(1) | | $ | 104 | | $ | 237 | | $ | 327 | | $ | 867 | | $ | 92 | | $ | 104 | | $ | 195 | | $ | 327 |
Deposit account fees | | | 328 | | | 329 | | | 998 | | | 966 | | | 289 | | | 328 | | | 876 | | | 998 |
Card and processing fees | | | 361 | | | 378 | | | 1,109 | | | 1,182 | | | 317 | | | 361 | | | 1,003 | | | 1,109 |
Other(2) | |
| 188 | |
| 170 | |
| 506 | |
| 536 | |
| 150 | |
| 188 | |
| 400 | |
| 506 |
Total non-interest income | | $ | 981 | | $ | 1,114 | | $ | 2,940 | | $ | 3,551 | | $ | 848 | | $ | 981 | | $ | 2,474 | | $ | 2,940 |
(1) | Not within the scope of ASC 606. |
(2) | Includes net BOLI income of $46 thousand |
For both the quarters and nine months ended March 31, 20232024 and 2022,2023, substantially all of the Corporation's revenues within the scope of ASC 606 are for performance obligations satisfied at a specified date.
Revenues recognized within the scope of ASC 606:
Deposit account fees: Fees are earned on the Bank's deposit accounts for various products offered to, or services performed for, the Bank's customers. Fees include business account fees, non-sufficient fund fees, ATM fees and others.other fees. These
37
fees are recognized concurrent with the event on a daily, monthly, quarterly or annual basis, depending on the type of service.
Card and processing fees: Debit interchange income represents fees earned when a debit card issued by the Bank is used. The Bank earns interchange fees from cardholder transactions through a third-party payment network. Interchange fees from cardholder transactions represent a percentage of the underlying transaction value and are recognized daily, concurrently with the transaction processing services provided to the cardholder. The performance obligation is satisfied and the fees are earned when the cost of themerchant transaction is charged to the cardholders’ debit card. Certain expenses directly associated with the debit cards are recorded on a net basis with the interchange income.
Other fees: Includes asset management fees, certain loan related fees, stop payment fees, wire services fees, safe deposit box fees and other fees earned on other services, such as merchant services or occasional non-recurring type services, and are recognized at the time of the event or the applicable billing cycle. Asset management fees are variable, since they are based on the underlying portfolio value, which is subject to market conditions and amounts invested by customers through a third-party provider. Asset management fees are recognized over the period that services are provided, and when the portfolio values are known or can be estimated at the end of each month. Loan related fees include (loss) gain on sale of
32
loans prepayment fees, late charges, brokeredand other loan fees, maintenance fees and others.fees. These fees are recognized concurrent with the event on a daily, monthly, quarterly or annual basis, depending on the type of service.
Note 9: Leases
The Corporation accounts for its leases in accordance with ASC 842 which requires the Corporation to record liabilities for future lease obligations as well as assets representing the right to use the underlying leased assets. The Corporation's leases primarily represent future obligations to make payments for the use of buildings, space or equipment for its operations. Liabilities to make future lease payments are recorded in accounts payable, accrued interest and other liabilities, while right-of-use assets are recorded in premises and equipment in the Corporation's condensed consolidated statementsCondensed Consolidated Statements of financial condition.Financial Condition. At March 31, 2023,2024, all of the Corporation's leases were classified as operating leases and the Corporation did not have any operating leases with an initial term of 12 months or less ("short-term leases"). Liabilities to make future lease payments and right-of-use assets are recorded for operating leases and do not include short-term leases. These liabilities and right-of-use assets are determined based on the total contractual base rents for each lease, which include options to extend or renew each lease, where applicable, and where the Corporation believes it has an economic incentive to extend or renew the lease. Due to the fact thatSince lease extensions are not reasonably certain, the Corporation generally does not recognize payments occurring during option periods in the calculation of its operating right-of-use lease assets and operating lease liabilities. The Corporation utilizes the FHLB – San Francisco rates as a discount rate for each of the remaining contractual terms at the adoption date as well as for future leases if the discount rate is not stated in the lease. For leases that contain variable lease payments, the Corporation assumes future lease payment escalations based on a lease payment escalation rate specified in the lease or the specified index rate observed at the time of lease commencement. Liabilities to make future lease payments are accounted for using the interest method, being reduced by periodic contractual lease payments net of periodic interest accretion. Right-of-use assets for operating leases are amortized over the term of the associated lease by amounts that represent the difference between periodic straight-line lease expense and periodic interest accretion in the related liability to make future lease payments.
For the quarters ended March 31, 20232024 and 2022,2023, expenses associated with the Corporation’s leases totaled $222,000 and $220,000, and $218,000, respectively, and were recorded in premises and occupancy expenses and equipment expenses in the condensed consolidated statements of operations.respectively. For the nine months ended March 31, 20232024 and 2022,2023, expenses associated with the Corporation’s leases totaled $716,000 and $651,000, and $660,000, respectively, and wererespectively. Expenses associated with the Corporation’s leases are recorded in either premises and occupancy expenses andor equipment, expensesas applicable, in the condensed consolidated statementsCondensed Consolidated Statements of operations.Operations.
The following table presents supplemental information related to operating leases at the date and for the periods indicated:
| | | | | | |
|
| As of | ||||
(In Thousands) | | March 31, 2023 | | | June 30, 2022 | |
Condensed Consolidated Statements of Condition: |
| |
|
| |
|
Premises and equipment - Operating lease right of use assets | | $ | 1,984 |
| $ | 1,969 |
Accounts payable, accrued interest and other liabilities – Operating lease liabilities | | $ | 2,000 |
| $ | 1,998 |
| | | | | | | | | | | | |
| | Quarter Ended | | Nine Months Ended | ||||||||
|
| March 31, |
| March 31, | ||||||||
(In Thousands) | | 2023 | | | 2022 | | 2023 | | | 2022 | ||
Condensed Consolidated Statements of Operations: | |
|
|
| |
| |
|
|
| |
|
Premises and occupancy expenses from operating leases(1) | | $ | 195 |
| $ | 196 | | $ | 581 |
| $ | 591 |
Equipment expenses from operating leases | | $ | 25 |
| $ | 22 | | $ | 70 |
| $ | 69 |
| | | | | | |
|
| Nine Months Ended | | Nine Months Ended | ||
(In Thousands) | | March 31, 2023 | | March 31, 2022 | ||
Condensed Consolidated Statements of Cash Flows: | |
|
|
| |
|
Operating cash flows from operating leases, net | | $ | 657 |
| $ | 697 |
3338
The following tables present supplemental information related to operating leases at the date and for the periods indicated:
| | | | | | |
|
| As of | ||||
(In Thousands) | | March 31, 2024 | | | June 30, 2023 | |
Condensed Consolidated Statements of Condition: |
| |
|
| |
|
Premises and equipment - Operating lease right of use assets | | $ | 1,550 |
| $ | 2,147 |
Accounts payable, accrued interest and other liabilities – Operating lease liabilities | | $ | 1,612 |
| $ | 2,169 |
| | | | | | | | | | | | |
| | Quarter Ended | | Nine Months Ended | ||||||||
|
| March 31, |
| March 31, | ||||||||
(In Thousands) | | 2024 | | | 2023 | | 2024 | | | 2023 | ||
Condensed Consolidated Statements of Operations: | |
|
|
| |
| |
|
|
| |
|
Premises and occupancy expenses from operating leases(1) | | $ | 188 |
| $ | 195 | | $ | 613 |
| $ | 581 |
Equipment expenses from operating leases | | | 34 |
| | 25 | | | 103 |
| | 70 |
Total lease expense | | $ | 222 | | $ | 220 | | $ | 716 | | $ | 651 |
(1) | Includes immaterial variable lease costs. |
| | | | | | |
|
| Nine Months Ended | | Nine Months Ended | ||
(In Thousands) | | March 31, 2024 | | March 31, 2023 | ||
Condensed Consolidated Statements of Cash Flows: | |
|
|
| |
|
Operating cash flows from operating leases, net | | $ | 666 |
| $ | 657 |
The following table provides information related to remaining minimum contractual lease payments and other information associated with the Corporation’s leases as of March 31, 2023:2024:
| | | | | | | | |
|
| Amount(1) |
|
| Amount(1) |
| ||
Year Ending June 30, |
| (In Thousands) | |
| (In Thousands) | | ||
2023 | | $ | 228 | | ||||
2024 | |
| 809 | | | $ | 218 | |
2025 | |
| 585 | | |
| 678 | |
2026 | |
| 296 | | |
| 387 | |
2027 | |
| 100 | | |
| 192 | |
2028 | |
| 156 | | ||||
Thereafter | |
| 71 | | |
| 74 | |
Total contract lease payments | | $ | 2,089 | | | $ | 1,705 | |
| | | | | | | | |
Total liability to make lease payments | | $ | 2,000 | | | $ | 1,612 | |
Difference in undiscounted and discounted future lease payments | | $ | 89 | | | $ | 93 | |
Weighted average discount rate | |
| 2.81 | % | |
| 3.30 | % |
Weighted average remaining lease term (years) | |
| 2.5 | | |
| 3.1 | |
(1) | Contractual base rents do not include property taxes and other operating expenses due under respective lease agreements. |
Note 10: Stock Repurchases
On April 28, 2022, the Corporation’s Board of Directors ofannounced a stock repurchase plan, authorizing the Corporation authorized the repurchasepurchase of up to five364,259 shares of the Corporation’s outstanding common stock over a one-year period. On April 27, 2023, the Board extended existing stock repurchase plan until April 28, 2024, or until completion, whichever occurs first. As of September 28, 2023, the Corporation had acquired a total of 338,831 shares, or 93 percent of the Corporation’s common stock, approximately 364,259total shares (the “April 2022 stock repurchase plan”). The Corporation may purchaseauthorized under the shares from time to time in the open market or through privately negotiated transactions over a one-year period depending on market conditions, the capital requirements of the Corporation, and available cash that can be allocated to the stock repurchase program, among other considerations. The April 2022 stock repurchase plan, will continueat an average cost of $13.98 per share.
39
On that same date, on September 28, 2023, the Board approved a new stock repurchase plan, authorizing the purchase of up to 350,353 shares of the Corporation’s outstanding common stock over a one-year period. Additionally, the Board terminated the remaining 25,428 shares available for a period of one year or until completed, whichever occurs first.purchase under the April 2022 plan.
During the quarter ended March 31, 2023,2024, the Corporation purchased 98,30750,051 shares of its common stock under the September 2023 stock repurchase plan with a weighted average cost of $13.99 per share. As of March 31, 2024, 237,592 shares or 68 percent of authorized common stock under the September 2023 plan remained available to purchase until the plan expires on September 28, 2024. For the nine months ended March 31, 2024, the Corporation purchased 148,873 shares of its common stock under the April 2022 and September 2023 stock repurchase planplans, with a weighted average cost of $14.20$13.06 per share. For the nine months ended March 31, 2023, the Corporation purchased 251,221 shares of the Corporation’s common stock under the April 2022 stock repurchase plan with a weighted average cost of $14.30 per share. As of March 31, 2023, a total of 113,038 shares or 31 percent of authorized shares under the plan remained available for purchase.
Note 11: Subsequent Events
On April 27, 2023,25, 2024, the Corporation announced that the Board of Directors declared a quarterly cash dividend of $0.14 per share. Shareholders of the Corporation’s common stock at the close of business on May 18, 202316, 2024 are entitled to receive the cash dividend. The cash dividend will be payable on June 8, 2023.
On April 27, 2023, the Corporation announced that the Board of Directors authorized an extension of the April 2022 stock repurchase plan (“Plan”), which was set to expire on April 28, 2023, for a period of one year or until completed, whichever occurs first. There were 101,044 shares available for purchase under the Plan as of April 28, 2023.6, 2024.
34
ITEM 2 – Management’s Discussion and Analysis of Financial Condition and Results of Operations
General
Provident Financial Holdings, Inc., a Delaware corporation, was organized in January 1996 for the purpose of becoming the holding company of Provident Savings Bank, F.S.B. (the “Bank") upon the Bank’s conversion from a federal mutual to a federal stock savings bank (“Conversion”). The Conversion was completed on June 27, 1996. The Corporation is regulated by the Board of Governors of the Federal Reserve BoardSystem (“FRB”Federal Reserve”). At March 31, 2023,2024, the Corporation had total assets of $1.34$1.29 billion, total deposits of $983.0$908.1 million and total stockholders’ equity of $129.4$129.5 million. The Corporation has not engaged in any significant activity other than holding the stock of the Bank. Accordingly, the information set forth in this report, including financial statements and related data, relates primarily to the Bank and its subsidiaries. As used in this report, the terms “we,” “our,” “us,” and “Corporation” refer to Provident Financial Holdings, Inc. and its consolidated subsidiaries, unless the context indicates otherwise.
The Bank, founded in 1956, is a federally chartered stock savings bank headquartered in Riverside, California. The Bank is regulated by the Office of the Comptroller of the Currency (“OCC”), its primary federal regulator, and the Federal Deposit Insurance Corporation (“FDIC”), the insurer of its deposits. The Bank’s deposits are federally insured up to applicable limits by the FDIC. The Bank has been a member of the Federal Home Loan BankFHLB System since 1956.
The Corporation operates in a single business segment through the Bank. The Bank’s activities include attracting deposits, offering banking services and originating and purchasing single-family, multi-family, commercial real estate, construction and, to a lesser extent, other mortgage, commercial business and consumer loans. Deposits are collected primarily from 13 banking locations located in Riverside and San Bernardino counties in California. Loans are primarily originated and purchased in Southern and Northern California. There are various risks inherent in the Corporation’s business including, among others, the general business environment, interest rates, the California real estate market, the demand for loans, the prepayment of loans, the repurchase of loans previously sold to investors, the secondary market conditions to buy and sell loans, competitive conditions, legislative and regulatory changes, fraud and other risks.
The Corporation began paying quarterly cash dividends during the quarter ended September 30, 2002. On January 24, 2023,25, 2024, the Corporation’s Board of Directors declared a quarterly cash dividend of $0.14 per share for the Corporation’s shareholders of record at the close of business on February 14, 2023,15, 2024, which was paid on March 7, 2023.2024. Future declarations or payments of dividends will be subject to the consideration of the Corporation’s Board of Directors, which will take into accountconsider the Corporation’s financial condition, results of operations, tax considerations, capital requirements, industry standards, legal restrictions, economic conditions and other factors, including the regulatory restrictions which affect the payment of dividends by the Bank to the Corporation. Under Delaware law, dividends may be paid either out of surplus or, if there is no surplus, out of net profits for the current fiscal year and/or the preceding fiscal year in which the dividend is declared.
40
Management’s Discussion and Analysis of Financial Condition and Results of Operations is intended to assist in understanding the financial condition and results of operations of the Corporation. The information contained in this section should be read in conjunction with the Unaudited Interim Condensed Consolidated Financial Statements and accompanying selected Notes to Unaudited Interim Condensed Consolidated Financial Statements.
Safe-Harbor Statement
Certain matters in thisThis Form 10-Q constitute forward-lookingcontains statements that the Corporation believes are “forward-looking statements” within the meaning of the Private Securities Litigation Reform Act of 1995. This Form 10-Q contains statements that the Corporation believes are “forward-looking statements.” These statements relate to the Corporation’s financial condition, liquidity, results of operations, plans, objectives, future performance or business. You should not place undue reliance on these statements as they are subject to various risks and uncertainties. When considering these forward-looking statements, you should keep in mind these risks and uncertainties, as well as any cautionary statements the Corporation may make. Moreover, you should treat these statements as speaking only as of the date they are made and based only on information then actually known to the Corporation. There are a number of important factors that could cause future results to differ materially from historical performance and these forward-looking statements. Factors which could cause actual results to differ materially from the results anticipated or implied by our forward-looking statements include, but are not limited to the following:to: potential adverse impacts to economic conditions in our local market areas, other
35
markets where the Corporation has lending relationships, or other aspects of the Corporation's business operations or financial markets, including, without limitation, as a result of employment levels, labor shortages, and the effects of inflation, a potential recession or slowed economic growth, as well as increasing prices and supply chain disruptions, and any governmental or societal responses to new COVID-19 variants; the credit risks of lending activities, includinggrowth; changes in the levelinterest rate environment, including the past increases in the Board of Governors of the Federal Reserve benchmark rate and trendduration at which such increased interest rate levels are maintained, which could adversely affect our revenues and expenses, the value of loan delinquenciesassets and charge-offsobligations, and the availability and cost of capital and liquidity; the impact of continuing elevated inflation levels and the current and future monetary policies of the Federal Reserve in response thereto; the effects of any federal government shutdown; increased competitive pressures; changes in our allowance for loan losses and provision for loan losses that may be impacted by deterioration inconditions within the residential and commercial real estate markets and may lead to increased losses and non-performing assets and may result in our allowance for loan losses not being adequate to cover actual losses and require us to materially increase our reserve; changes in the levels of general interest rates, and the relative differences between short and long term interest rates, deposit interest rates, our net interest margin and funding sources; the transition away from LIBOR toward new interest rate benchmarks;securities markets; fluctuations in the demand for loans, the number of unsold homes, land and other properties and fluctuations in real estate values in our market areas; results of examinations of the Corporation by the FRB or of the Bank by the OCC or other regulatory authorities,deposits; liquidity issues, including the possibility that any such regulatory authority may, among other things, require us to enter into a formal enforcement action or to increase our allowance for loan losses, write-down assets, change our regulatory capital position or affect our ability to borrow funds or maintainraise additional capital, if necessary; the impact of bank failures or increase deposits, or impose additional requirementsadverse developments at other banks and restrictionsrelated negative press about the banking industry in general on us, any of which could adversely affectinvestor and depositor sentiment; our liquidityability to attract and earnings;retain deposits; our ability to pay dividends on our common stock; legislative orand regulatory changes, that adversely affect our business including changes in banking, securities and tax law, and in regulatory policies and principles, or the interpretation of regulatory capital or other rules, and other governmental initiatives affecting the financial services industry; the availability of resources to address changes in laws, rules, or regulations or to respond to regulatory actions; adverse changes in the securities markets; our ability to attract and retain deposits; our ability to control operating costs and expenses; the use of estimates in determining fair value of certain of our assets, which estimates may prove to be incorrect and result in significant declines in valuation; difficulties in reducing risk associated with the loans on our balance sheet; staffing fluctuations in response to product demand or the implementation of corporate strategies that affect our workforce and potential associated charges;rules; disruptions, security breaches, or other adverse events, failures or interruptions in, or attacks on, our information technology systems or on the third-party vendors who perform several of our critical processing functions; our ability to successfully integrate any assets, liabilities, customers, systems, and management personnel we have acquired or may in the future acquire into our operations and our ability to realize related revenue synergies and cost savings within expected time frames and any goodwill charges related thereto; our ability to manage loan delinquency rates; our ability to retain key members of our senior management team; costs and effects of litigation, including settlements and judgments; increased competitive pressures among financial services companies and non-financial services companies; changes in consumer spending, borrowing and savings habits; the availability of resources to address changes in laws, rules, or regulations or to respond to regulatory actions; our ability to pay dividends on our common stock; the quality and composition of our securities portfolio and the impact of any adverse changes in the securities markets; the inability of key third-party providers to perform their obligations to us; changes in accounting policies and practices, as may be adopted by the financial institution regulatory agencies or the Financial Accounting Standards Board, including additional guidance and interpretation on accounting issues and details of the implementation of new accounting methods; the effects of climate change, severe weather events, natural disasters, pandemics, epidemics and other public health crises, acts of war or terrorism, and other external events on our business; other economic, competitive, governmental, regulatory and technological factors affecting our operations, pricing, products and services; and other risks detailed in this report andfactors described in the Corporation’s latest Annual Report on Form 10-K and Quarterly Reports on Form 10-Q and other reports filed with orand furnished to the SEC, including our 2022 Annual Form 10-K. These factors could have an adverse impactSecurities and Exchange Commission (“SEC”) which are available on our financial positionwebsite at www.myprovident.com and our results of operations.
Forward-looking statements are based upon management’s beliefson the SEC’s website at www.sec.gov. We do not undertake and assumptions at the time they are made. We undertake nospecifically disclaim any obligation to publicly update or revise any forward-looking statements included in this documentto reflect the occurrence of anticipated or to updateunanticipated events or circumstances after the reasons why actual results could differ from those contained indate of such statements whether as a result of new information, future events or otherwise. In light of theseThese risks uncertainties and assumptions, the forward-looking statements discussed in this document might not occur, and you should not put undue reliance on any forward-looking statements. These factors could cause our actual results for the remaining fiscal 20232024 and beyond to differ materially from those expressed in any forward-looking statements by, or on behalf of us and could negatively affect the Corporation’s consolidated financial conditionour operating and consolidated results of operations as well as its stock price performance.
36
Critical Accounting Estimates
The discussion and analysis of the Corporation’s financial condition and results of operations is based upon the Corporation’s condensed consolidated financial statements, which have been prepared in accordance with accounting principles generally accepted in the United States of America. The preparation of these financial statements requires management to make estimates and judgments that affect the reported amounts of assets and liabilities, revenues and expenses, and related disclosures of contingent assets and liabilities at the date of the condensed consolidated financial statements. Actual results may differ from these estimates under different assumptions or conditions.
The Corporation’s critical accounting estimates are described in the Corporation’s 2022 Annual Form 10-K in the Critical Accounting PoliciesEstimates section of Management’s Discussion and Analysis of Financial Condition and Results of Operations and in Note 1 - Organization and Summary of Significant Accounting Policies. There have been noPolicies of the Notes to Consolidated Financial Statement of our 2023 Annual
41
Form 10-K. The Corporation adopted the current expected credit loss, or CECL, methodology on July 1, 2023. Accounting for the allowance for credit losses (“ACL”) involves significant changes duringjudgement and assumptions by management and is based on historical data, current economic conditions and a reasonable and supportable forecast of future events. On a quarterly basis, management reviews the nine months ended March 31, 2023methodology and adequacy of the ACL. Refer to Notes 2, 4 and 5 of the critical accounting estimates as describedNotes to Unaudited Interim Condensed Consolidated Financial Statements, and the “Provision for (Recovery of) Credit Losses” section in this Form 10-Q for more information on the Corporation’s 2022 Annual Form 10-K.establishment of the ACL and the implementation of CECL.
Executive Summary and Operating Strategy
Provident Savings Bank, F.S.B., established in 1956, is a financial services company committed to serving consumers and small to mid-sized businesses in the Inland Empire region of Southern California. The Bank conducts its business operations as Provident Bank and through its subsidiary, Provident Financial Corp. The business activities of the Corporation, primarily through the Bank, consist of community banking and, to a lesser degree, investment services for customers and trustee services on behalf of the Bank.
Community banking operations primarily consist of accepting deposits from customers within the communities surrounding the Corporation’s full service offices and investing those funds in single-family, multi-family and commercial real estate loans. Also, to a lesser extent, the Corporation makes construction, commercial business, consumer and other mortgage loans. The primary source of income in community banking is net interest income, which is the difference between the interest income earned on loans and investment securities, and the interest expense paid on interest-bearing deposits and borrowed funds. Additionally, certain fees are collected from depositors, such as returned check fees, deposit account service charges, ATM fees, IRA/KEOGH fees, safe deposit box fees, wire transfer fees and overdraft protection fees, among others.
During the next three years,The Corporation, subject to market conditions, the Corporation intends to improve its community banking business over the next several years by moderately increasing total assets (byby increasing single-family, multi-family, commercial real estate, construction and commercial business loans). In addition,loans. Further, the Corporation intends to gradually decrease the percentage of customer time deposits in its deposit base and to increase the percentage of lower cost checking and savings accounts.accounts, although deposit account diversification will also remain a focus. This strategy is intended to improve core revenue through a higher net interest margin and ultimately, coupled with the growth of the Corporation, an increase in net interest income. While the Corporation’s long-term strategy is for moderate growth, management recognizes that growth may be challenging given the uncertainty of current general economic conditions, the high interest rate environment and risk of recession.the inverted yield curve.
Investment services operations primarily consist of selling alternative investment products such as annuities and mutual funds to the Bank’s depositors. Investment services and trustee services contribute a very small percentage of gross revenue.
Provident Financial Corp performs trustee services for the Bank’s real estate secured loan transactions and has in the past held, and may in the future hold, real estate for investment. Investment services and trustee services contribute a very small percentage of gross revenue.
There are a number of risks associated with the business activities of the Corporation, many of which are beyond the Corporation’s control as described in the Corporation’s 20222023 Annual Form 10-K. The Corporation attempts to mitigate many of these risks through prudent banking practices, such as interest rate risk management, credit risk management, operational risk management, and liquidity risk management. The California economic environment presents heightened risk for the Corporation primarily with respect to real estate values and loan delinquencies. Since the majority of the
37
Corporation’s loans are secured by real estate located within California, significant declines in the value of California real estate may also inhibit the Corporation’s ability to recover on defaulted loans by selling the underlying real estate. The commercial real estate environment, particularly office space of various types, currently presents elevated risk within the banking industry. In response, the Bank has reviewed its existing office space exposure for any outsized exposure and implemented tighter underwriting standards for this collateral type. At March 31, 2024, our commercial real estate portfolio totaled $83.1 million, including office space of various types, totaling approximately $41.8 million or 50.3 percent of the total commercial real estate portfolio and 3.9 percent of the total loan portfolio.
42
Commitments and Derivative Financial Instruments
The Corporation is a party to financial instruments with off-balance sheet risk in the normal course of business to meet the financing needs of its customers. These financial instruments include commitments to extend credit, in the form of originating loans or providing funds under existing lines of credit, loan sale agreements to third parties and option contracts. These instruments involve, to varying degrees, elements of credit and interest-rate risk in excess of the amount recognized in the accompanying Condensed Consolidated Statements of Financial Condition. The Corporation’s exposure to credit loss, in the event of non-performance by the counterparty to these financial instruments, is represented by the contractual amount of these instruments. The Corporation uses the same credit policies in entering into financial instruments with off-balance sheet risk as it does for on-balance sheet instruments. For a discussion on commitments and derivative financial instruments, see Note 6 of the Notes to Unaudited Interim Condensed Consolidated Financial Statements of this Form 10-Q.
Comparison of Financial Condition at March 31, 20232024 and June 30, 20222023
Total assets increased 12decreased three percent to $1.34$1.29 billion at March 31, 20232024 from $1.19$1.33 billion at June 30, 2022.2023. The increasedecrease was primarily attributable to the increasesdecreases in loans held for investment and cash and cash equivalents, partly offset by a decrease in investment securities.securities and loans held for investment.
Total cash and cash equivalents, primarily excess cash deposited with the Federal Reserve BankFRB of San Francisco, increased $37.4decreased $14.1 million, or 16021 percent, to $60.8$51.7 million at March 31, 20232024 from $23.4$65.8 million at June 30, 2022.2023. The increasedecrease in total cash and cash equivalents was primarily attributable to deposit outflows and management’s proactive strategy to increasemanage liquidity due tobased upon recent industry instability as a result of several high-profile bank failures.economic conditions.
Investment securities (held to maturity and available for sale) decreased $24.8$18.6 million, or 1312 percent, to $163.6$137.9 million at March 31, 20232024 from $188.4$156.5 million at June 30, 2022.2023. The decrease was primarily the result of scheduled and accelerated principal payments on mortgage-backed and other securities during the first nine months of fiscal 2023.2024. For further analysis on investment securities, see Note 4 of the Notes to Unaudited Interim Condensed Consolidated Financial Statements of this Form 10-Q.
Loans held for investment increased $137.7decreased $11.9 million, or 15one percent, to $1.08$1.07 billion at March 31, 20232024 from $940.0 million$1.08 billion at June 30, 2022, primarily2023, predominantly due to an increasedeclines in single-familymulti-family and commercial real estate loans. During the first nine months of fiscal 2023,2024, the Corporation originated $212.8$56.9 million of loans held for investment, consisting primarily of single-family, multi-family and commercial real estate loans located throughout California. The Corporation did not purchase any loans from other institutions during the first nine months of fiscal 2023.2024. Total loan principal payments during the first nine months of fiscal 20232024 were $77.2$69.3 million, down 5710 percent from $180.1$77.2 million during the comparable period in fiscal 2022.2023. Single-family loans held for investment at March 31, 20232024 and June 30, 2022 was $512.62023 totaled $517.0 million and $378.2$518.8 million, and representedrepresenting approximately 4849 percent and 4048 percent of loans held for investment, respectively. Multi-family loans held for investment at March 31, 2024 and June 30, 2023 totaled $457.4 million and $461.1 million, respectively, representing approximately 43 percent of loans held for investment at both dates. Commercial real estate loans held for investment at March 31, 2024 and June 30, 2023 totaled $83.1 million and $90.6 million, respectively, representing approximately eight percent of loans held for investment at both dates.
3843
The tables below describe the geographic dispersion of gross real estate secured loans held for investment at March 31, 20232024 and June 30, 2022,2023, as a percentage of the total dollar amount of loans outstanding:
As of March 31, 2023:2024:
| | | | | | | | | | | | | | | | | | | | | | | | | | | | | | | | | | | | | | | | | | | | | | | | | | | | |
|
| Inland |
| Southern |
| Other |
| Other |
|
| |
|
|
|
| Inland |
| Southern |
| Other |
| Other |
|
| |
|
|
| ||||||||||||||||||||||||
| | Empire | | California(1) | | California | | States | | Total | | | Empire | | California(1) | | California | | States | | Total | | ||||||||||||||||||||||||||||||
Loan Category |
| Balance |
| % |
| Balance |
| % |
| Balance |
| % |
| Balance |
| % |
| Balance |
| % | |
| Balance | Percent | Balance | Percent | Balance | Percent | Balance | Percent | Balance | Percent | ||||||||||||||||||||
Single-family | | $ | 149,311 |
| 29 | % | $ | 170,972 |
| 33 | % | $ | 192,075 |
| 38 | % | $ | 274 |
| — | % | $ | 512,632 |
| 100 | % | | $ | 146,337 |
| 28 | % | $ | 174,634 |
| 34 | % | $ | 195,812 |
| 38 | % | $ | 256 |
| — | % | $ | 517,039 |
| 100 | % |
Multi-family | |
| 62,500 |
| 13 | % |
| 273,995 |
| 59 | % |
| 129,837 |
| 28 | % |
| — |
| — | % |
| 466,332 |
| 100 | % | |
| 59,551 |
| 13 | % |
| 266,417 |
| 58 | % |
| 131,433 |
| 29 | % |
| — |
| — | % |
| 457,401 |
| 100 | % |
Commercial real estate | |
| 17,870 |
| 20 | % |
| 46,293 |
| 51 | % |
| 26,333 |
| 29 | % |
| — |
| — | % |
| 90,496 |
| 100 | % | |
| 13,739 |
| 16 | % |
| 43,987 |
| 53 | % |
| 25,410 |
| 31 | % |
| — |
| — | % |
| 83,136 |
| 100 | % |
Construction | |
| 2,111 |
| 73 | % |
| 606 |
| 21 | % |
| 174 |
| 6 | % |
| — |
| — | % |
| 2,891 |
| 100 | % | |
| 227 |
| 8 | % |
| 1,683 |
| 61 | % |
| 835 |
| 31 | % |
| — |
| — | % |
| 2,745 |
| 100 | % |
Other | |
| — |
| — | % |
| 108 |
| 100 | % |
| — |
| — | % |
| — |
| — | % |
| 108 |
| 100 | % | |
| — |
| — | % |
| 99 |
| 100 | % |
| — |
| — | % |
| — |
| — | % |
| 99 |
| 100 | % |
Total | | $ | 231,792 |
| 22 | % | $ | 491,974 |
| 46 | % | $ | 348,419 |
| 32 | % | $ | 274 |
| — | % | $ | 1,072,459 |
| 100 | % | | $ | 219,854 |
| 21 | % | $ | 486,820 |
| 46 | % | $ | 353,490 |
| 33 | % | $ | 256 |
| — | % | $ | 1,060,420 |
| 100 | % |
(1) | Other than the Inland Empire. |
As of June 30, 2022:2023:
| | | | | | | | | | | | | | | | | | | | | | | | | | | | | | | | | | | | | | | | | | | | | | | | | | | | |
| | Inland |
| Southern |
| Other |
| Other |
|
| |
|
|
| | Inland |
| Southern |
| Other |
| Other |
|
| |
|
|
| ||||||||||||||||||||||||
| | Empire | | California(1) | | California | | States | | Total | | | Empire | | California(1) | | California | | States | | Total | | ||||||||||||||||||||||||||||||
Loan Category |
| Balance |
| % |
| Balance |
| % |
| Balance |
| % |
| Balance |
| % |
| Balance |
| % | |
| Balance | Percent | Balance | Percent | Balance | Percent | Balance | Percent | Balance | Percent | ||||||||||||||||||||
Single-family | | $ | 126,638 |
| 33 | % | $ | 112,549 |
| 30 | % | $ | 138,767 |
| 37 | % | $ | 280 |
| — | % | $ | 378,234 |
| 100 | % | | $ | 149,569 |
| 29 | % | $ | 174,421 |
| 34 | % | $ | 194,570 |
| 37 | % | $ | 261 |
| — | % | $ | 518,821 |
| 100 | % |
Multi-family | |
| 63,764 |
| 14 | % |
| 275,642 |
| 59 | % |
| 124,993 |
| 27 | % |
| 277 |
| — | % |
| 464,676 |
| 100 | % | |
| 61,672 |
| 13 | % |
| 272,178 |
| 59 | % |
| 127,263 |
| 28 | % |
| — |
| — | % |
| 461,113 |
| 100 | % |
Commercial real estate | |
| 20,450 |
| 23 | % |
| 41,127 |
| 45 | % |
| 28,852 |
| 32 | % |
| — |
| — | % |
| 90,429 |
| 100 | % | |
| 16,586 |
| 18 | % |
| 49,183 |
| 54 | % |
| 24,789 |
| 28 | % |
| — |
| — | % |
| 90,558 |
| 100 | % |
Construction | |
| 3,157 |
| 98 | % |
| 59 |
| 2 | % |
| — |
| — | % |
| — |
| — | % |
| 3,216 |
| 100 | % | |
| 590 |
| 30 | % |
| 1,116 |
| 58 | % |
| 230 |
| 12 | % |
| — |
| — | % |
| 1,936 |
| 100 | % |
Other | |
| — |
| — | % |
| 123 |
| 100 | % |
| — |
| — | % |
| — |
| — | % |
| 123 |
| 100 | % | |
| — |
| — | % |
| 106 |
| 100 | % |
| — |
| — | % |
| — |
| — | % |
| 106 |
| 100 | % |
Total | | $ | 214,009 |
| 23 | % | $ | 429,500 |
| 46 | % | $ | 292,612 |
| 31 | % | $ | 557 |
| — | % | $ | 936,678 |
| 100 | % | | $ | 228,417 |
| 23 | % | $ | 497,004 |
| 46 | % | $ | 346,852 |
| 31 | % | $ | 261 |
| — | % | $ | 1,072,534 |
| 100 | % |
(1) | Other than the Inland Empire. |
For further analysis on loans held for investment, see Note 5 of the Notes to Unaudited Interim Condensed Consolidated Financial Statements of this Form 10-Q.
Total deposits increased $27.5decreased $42.5 million, or threefour percent, to $983.0$908.1 million at March 31, 20232024 from $955.5$950.6 million at June 30, 2022,2023, primarily due to a decrease in transaction accounts, partly offset by an increase in time deposits, partly offset by adeposits. The decrease in transaction accounts.total deposits was primarily due to customers seeking higher interest rates elsewhere. Total uninsured deposits adjusted lower by collateralized deposits, were approximately $177.8$136.4 million and $169.7$140.1 million at March 31, 20232024 and June 30, 2022,2023, respectively. The amounts of uninsured deposits are based on estimated amounts of uninsured deposits as of the reported period. Such estimates are based on the same methodologies and assumptions used for regulatory reporting requirements.
Transaction account balances or “core deposits” decreased $57.4$87.4 million, or seven12 percent, to $777.0$642.2 million at March 31, 20232024 from $834.4$729.6 million at June 30, 2022 and2023, while time deposits increased $85.0$45.0 million, or 7020 percent, to $206.1$265.9 million at March 31, 20232024 from $121.1$220.9 million at June 30, 2022.2023. The increase in time deposits was primarily due to a $95.3 million increaseboth increases in retail time deposits and brokered certificates of deposit with a weighted average cost of 4.37 percent (including broker fees).deposit. Excluding brokered certificates of deposit, the percentage of time deposits to total deposits decreased to 12was 17 percent at March 31, 2023 from 132024, compared to 14 percent at June 30, 2022. Brokered2023. At March 31, 2024 and June 30, 2023, total brokered certificates of deposit totaled $95.3were $130.9 million and $106.4 million, respectively.
Total borrowings were virtually unchanged at $235.0 million at March 31, 2023.
Total borrowings increased $120.0 million, or 141 percent, to $205.0 million at March 31, 2023 as compared to $85.0 million at2024 and June 30, 2022, due to additional borrowings to fund the increase in loans held for investment and to provide for additional liquidity.2023. At March 31, 2024 and June 30, 2023, borrowings arewere comprised of short-term and long-term FHLB - San Francisco advances used for liquidity and interest rate risk management purposes.
Total stockholders’ equity increaseddeclined to $129.4$129.5 million at March 31, 20232024 from $128.7$129.7 million at June 30, 2022, primarily as a result2023. Net income of $6.8$5.4 million of net income and $660,000 of stock-based compensation in the first nine months of fiscal 2023, partly2024 was mostly offset by $3.0$2.9 million of cash dividends paid to shareholders, and $3.6$2.0 million of stock repurchases.repurchases and the $824,000 impact of the CECL adoption. The Corporation repurchased 148,873 shares of its common stock at a weighted average cost of $13.06 per share during the first nine months of fiscal 2024.
3944
repurchased 251,221 shares of its common stock under its April 2022 stock repurchase plan at a weighted average cost of $14.30 per share during the first nine months of fiscal 2023.
Comparison of Operating Results for the Quarters and Nine Months Ended March 31, 20232024 and 20222023
Net income for the third quarter of fiscal 20232024 was $2.3$1.5 million, up $624,000down $828,000 or 3736 percent from $1.7$2.3 million in the same period of fiscal 2022.2023. The increasedecrease in net income was primarily attributable to a $1.9 million increase$842,000 decrease in net interest income, partly offset by an $814,000 change to the provision for loan losses to a $169,000 provision for loan losses this quarter$244,000 increase in contrast to a $645,000 recovery from the allowance for loan losses in the same quarter last yearnon-interest expense and a $133,000 decrease in non-interest income, mainly attributable to a decrease in loan prepayment fees.income.
For the first nine months of fiscal 2023,2024, net income was $6.8$5.4 million, an increase of $154,000,down $1.4 million. or two20 percent from $6.6$6.8 million in the same period of fiscal 2022.2023. The increasedecrease in net income was primarily attributable to a $4.7$1.3 million decrease in net interest income, a $705,000 increase in net interestnon-interest expense and a $466,000 decrease in non-interest income, partly offset by a $2.5 million$481,000 change toin the provision for loancredit losses to a $430,000 provision for loan$51,000 recovery of credit losses in the first nine months of fiscal 20232024, in contrast to a $2.1 million recovery from the allowance$430,000 provision for loancredit losses in the same period last year, a $1.2 million increase in non-interest expenses, mainly due to the $1.2 million credit from the Employee Retention Tax Credit (“ERTC”) recognized in the first quarter of last year and not replicated this period, and a $611,000 decrease in non-interest income, mainly attributable to a decrease in loan prepayment fees.fiscal 2023.
The Corporation’s efficiency ratio, defined as non-interest expense divided by the sum of net interest income and non-interest income, improved to 66.69was 76.20 percent for the third quarter of fiscal 2023 from 79.742024, compared to 66.69 percent in the same period last year. For the first nine months of fiscal 2023,2024, the Corporation’s efficiency ratio improvedwas 73.82 percent, compared to 67.33 percent from 73.07 percent for the same period of fiscal 2022.2023. The improvement indeterioration of the efficiency ratio during the current quarter and nine-month period compared to the same quarterperiods last year was due mainlyboth to higher non-interest expenses and lower total revenues. The improvement in the efficiency ratio during the first nine months of fiscal 2023 compared to the same period the prior year was due to higher total revenues, partly offset by higher non-interest expenses.
Return on average assets was 0.720.47 percent in the third quarter of fiscal 2023, up 152024, down 25 basis points from 0.570.72 percent in the same period last year. For the first nine months of fiscal 2023,2024, return on average assets was 0.720.56 percent, down two16 basis points from 0.740.72 percent in the same period last year.
Return on average stockholders’ equity was 7.124.57 percent in the third quarter of fiscal 2023, up2024, down from 5.337.12 percent in the same period last year. For the first nine months of fiscal 2023,2024, return on average stockholders’ equity was 5.51 percent, down from 6.94 percent unchanged fromin the same period last year.
Diluted earnings per share for the third quarter of fiscal 20232024 were $0.33, up 43$0.22, down 33 percent from $0.23$0.33 in the same period last year. For the first nine months of fiscal 2023,2024, diluted earnings per share were $0.94, up six$0.77, down 18 percent from $0.89$0.94 in the same period last year.
Net Interest Income:
For the Quarters Ended March 31, 20232024 and 2022.2023. Net interest income increased $1.9 milliondecreased $842,000 or 25nine percent to $9.4$8.6 million for the third quarter of fiscal 2024 from $7.5$9.4 million for the same quarter last year. The increasedecrease in net interest income was due to a higherlower net interest margin and, to a lesser extent, highera lower average earningbalance of interest-earning assets. The higherlower net interest margin wasdue to a shiftthe increase in the compositionaverage cost of interest-earning assets towards higher yielding loans held for investment and aninterest-bearing liabilities which exceeded the increase in the average yield on interest-earning deposits reflecting recent increases in the targeted federal funds rate, including a 50-basis point increase during the current quarter, to a range of 4.75% to 5.00%; partly offset by increases in the weighted average cost and average balance of customer deposits and borrowings.assets. The net interest margin during the third quarter of fiscal 2023 increased 392024 decreased 26 basis points to 3.002.74 percent from 2.613.00 percent in the same quarter last year. The average yield on interest-earning assets increased 9758 basis points to 3.834.41 percent in the third quarter of fiscal 20232024 from 2.863.83 percent in the same quarter last year, while the average cost of interest-bearing liabilities increased by 6593 basis points to 0.931.86 percent in the third quarter of fiscal 20232024 from 0.280.93 percent in the same quarter last year. The average balance of interest-earning assets increased by nine percentdecreased slightly to $1.25 billion in the third quarter of fiscal 2023 from $1.16 billion in2024 as compared to the same quarter last year. The increaseslight decrease in earninginterest-earning assets was primarily due to an increasea decrease in the average balance of investment securities, partly offset by increases in the average balance of loans receivable and interest-earning deposits. The average balance of interest-bearing liabilities decreased $4.1 million, or one percent, to $1.13 billion in the third quarter of fiscal 2024 from $1.14 billion in the same quarter last year primarily reflecting decreases in the average balance of core deposits or transaction accounts, partly offset by increases in the average balance of borrowings and time deposits.
For the Nine Months Ended March 31, 2024 and 2023. Net interest income decreased $1.3 million or five percent to $26.5 million for the first nine months of fiscal 2024 from $27.8 million in the same period in fiscal 2023, as a result of a lower net interest margin, partly offset by a higher average balance of interest-earning assets. The net interest margin was 2.80 percent in the first nine months of fiscal 2024, a decrease of 23 basis points from 3.03 percent in the same period of fiscal 2023, primarily due to the increase in the average cost of interest-bearing liabilities which exceeded the increase in the average yield on interest-earning assets. The weighted-average cost of interest-bearing liabilities increased by 103 basis
4045
offset by decreases in the average balance of both investment securities and interest-earning deposits. The average balance of interest-bearing liabilities increased by $95.4 million, or ninepoints to 1.67 percent to $1.14 billion in the third quarter of fiscal 2023 from $1.04 billion in the same quarter last year primarily reflecting an increase in the average balance of borrowings and, to a lesser extent, the average balance of time deposits, partly offset by a decrease in the average balance of transaction accounts.
For the Nine Months Ended March 31, 2023 and 2022. Net interest income increased $4.7 million or 20 percent to $27.8 million for the first nine months of fiscal 2023 from $23.1 million in the same period in fiscal 2022,2024 as a result of a higher net interest margin and,compared to a lesser extent, a higher average interest-earning asset balance. The net interest margin was 3.03 percent in the first nine months of fiscal 2023, an increase of 38 basis points from 2.65 percent in the same period of fiscal 2022, primarily due to an increase in the average yield on interest-earning assets which exceeded the increase in the average cost of interest-bearing liabilities. The weighted-average yield on interest-earning assets increased by 68 basis points to 3.61 percent in the first nine months of fiscal 2023 from 2.930.64 percent in the same period last year, while the weighted-average cost of interest-bearing liabilitiesyield on interest-earning assets increased by 3370 basis points to 0.644.31 percent forin the first nine months of fiscal 2023 as compared to 0.312024 from 3.61 percent in the same period last year. The average balance of interest-earning assets increased $59.5$41.1 million, or fivethree percent, to $1.22$1.26 billion in the first nine months of fiscal 20232024 from $1.16$1.22 billion in the comparable period of fiscal 2022,2023, primarily reflecting an increaseincreases in the average balance of loans receivable partly offset by decreases in the average balance of both investment securities and interest-earning deposits. The average balance of interest-bearing liabilities increased by $58.0 million, or six percent, to $1.11 billion in the first nine months of fiscal 2023 from $1.05 billion in the same period last year primarily reflecting an increase in the average balance of borrowings and, to a lesser extent, the average balance of time deposits, partly offset by a decrease in the average balance of investment securities. The average balance of interest-bearing liabilities increased by $38.0 million, or three percent, to $1.14 billion in the first nine months of fiscal 2024 from $1.11 billion in the same period last year primarily reflecting increases in the average balance of borrowings and time deposits, partly offset by the decrease in average balance of transaction accounts.
Interest Income:
For the Quarters Ended March 31, 20232024 and 2022.2023. Total interest income increased $3.7$1.8 million, or 4515 percent, to $12.0$13.8 million for the third quarter of fiscal 2023 as compared to $8.32024 from $12.0 million for the same quarter of fiscal 2022.2023. The increase was due primarily to an increase in interest income from loans receivable.
Interest income on loans receivable increased by $3.4$1.7 million, or 4515 percent, to $11.0$12.7 million in the third quarter of fiscal 20232024 from $7.6$11.0 million in the same quarter of fiscal 2022.2023. The increase was due to a higher average balanceyield and, to a lesser extent, a higher average yield.balance. The average yield on loans receivable increased 56 basis points to 4.74 percent in the third quarter of fiscal 2024 from an average yield of 4.18 percent in the same quarter last year. The higher weighted average loan yield was due primarily to the upward repricing of adjustable rate loans and new loan originations with higher weighted average interest rates. Adjustable-rate loans of approximately $112.9 million were repriced upward in the third quarter of fiscal 2024 by approximately 97 basis points from an average yield of 6.72 percent to 7.69 percent. The average balance of loans receivable increased $196.1$16.6 million, or 23two percent, to $1.05$1.07 billion in the third quarter of fiscal 20232024 from $858.3 million in the same quarter last year. Total loans originated and purchased for investment in the third quarter of fiscal 2023 were $53.9 million, down 43 percent from $94.0 million in the same quarter last year. Loan principal payments received in the third quarter of fiscal 2023 were $17.5 million, down 67 percent from $53.6 million in the same quarter last year. The average yield on loans receivable increased by 65 basis points to 4.18 percent in the third quarter of fiscal 2023 from an average yield of 3.53 percent$1.05 billion in the same quarter last year. Net deferred loan cost amortization in the third quarter of fiscal 2023 decreased 542024 increased 12 percent to $228,000$255,000 from $496,000$228,000 in the same quarter last year, attributable primarily to fewer loan payoffs. The higher weighted average loan yield was due primarily to the repricing of adjustable interest rateyear. Total loans and new loan originations with higher weighted average interest rates. Adjustable-rate loans of approximately $97.4 million were repriced upwardoriginated for investment in the third quarter of fiscal 2023 by approximately 137 basis points2024 were $18.2 million, down 66 percent from a weighted average 4.77$53.9 million in the same quarter last year; while loan principal payments received in the third quarter of fiscal 2024 were $28.5 million, up 63 percent to 6.14 percent.from $17.5 million in the same quarter last year.
Interest income from investment securities increased by $33,000,decreased $31,000, or six percent, to $548,000$517,000 in the third quarter of fiscal 20232024 from $515,000$548,000 for the same quarter of fiscal 2022.2023. This increasedecrease was attributable to a higherlower average yield,balance, partly offset by a lowerhigher average balance. The average yield on investment securities increased 30 basis points to 1.31 percent in the third quarter of fiscal 2023 from 1.01 percent for the same quarter last year. The increase in the average investment securities yield was primarily attributable to a lower premium amortization during the current quarter in comparison to the same quarter last year ($181,000 vs. $328,000) due to lower total principal repayments ($6.9 million vs. $12.3 million) and, to a lesser extent, the upward repricing of adjustable-rate mortgage-backed securities.yield. The average balance of investment securities decreased by $35.5$26.3 million, or 1716 percent, to $167.7$141.4 million in the third quarter of fiscal 20232024 from $203.2$167.7 million in the same quarter last year. The decrease in the average balance of investment securities was primarily the result of scheduled and accelerated principal payments on mortgage-backed securities.
41
Table The average yield on investment securities increased 15 basis points to 1.46 percent in the third quarter of Contentsfiscal 2024 from 1.31 percent for the same quarter last year. The increase in the average yield was primarily attributable to a lower premium amortization during the current quarter in comparison to the same quarter last year ($124,000 vs. $181,000) due to lower total principal repayments ($5.7 million vs. $6.9 million) and the upward repricing of adjustable-rate mortgage-backed securities.
The FHLB – San Francisco distributed a $146,000$210,000 of cash dividenddividends to the Bank on its stock in the third quarter of fiscal 2023,2024, up 1944 percent from $123,000$146,000 in the same quarter last year. The average balance of FHLB – San Francisco stock in the third quarter of fiscal 20232024 was $9.5 million, up 16 percent from $8.2 million virtually unchanged fromin the same quarter of fiscal 20222023 while the average yield was 7.098.84 percent, up 106175 basis points from 6.037.09 percent.
Interest income from interest-earning deposits, primarily cash deposited at the Federal Reserve BankFRB of San Francisco, was $286,000$397,000 in the third quarter of fiscal 2023,2024, up 63339 percent from $39,000$286,000 in the same quarter of fiscal 2022.2023. The increase was due to a higher average yield partly offset byand a lowerhigher average balance. The average yield earned on interest-earning deposits in the third quarter of fiscal 20232024 was 4.655.40 percent, up 44775 basis points from 0.184.65 percent in the same quarter last year, due primarily to an increase in the interest rate paid on excess reserves. The average balance of interest-earning deposits decreased by $61.4increased $4.5 million, or 7118 percent, to $24.6$29.1 million in the third quarter of fiscal 20232024 from $86.0$24.6 million in the same quarter last year primarily due to the utilizationBank increasing its liquidity position.
46
For the Nine Months Ended March 31, 20232024 and 2022.2023. Total interest income increased $7.6$7.7 million, or 3023 percent, to $33.1$40.8 million for the first nine months of fiscal 20232024 from $25.5$33.1 million in the same period of fiscal 2022.2023. The increase was due primarily to an increase in interest income from loans receivable.receivable and, to a lesser extent, interest income on interest-earning deposits.
Interest income from loans receivable increased $6.7$7.0 million, or 2823 percent, to $30.4$37.4 million in the first nine months of fiscal 20232024 from $23.7$30.4 million for the same period of fiscal 2022.2023. The increase was due to a higher average balanceyield and, to a lesser extent, a higher weighted average yield.balance. The average balance ofyield on loans receivable increased by $156.8 million, or 1864 basis points to 4.64 percent to $1.01 billion for the first nine months of fiscal 2023 from $855.1 million in the same period of fiscal 2022. Total loans originated and purchased for investment in the first nine months of fiscal 2023 were $212.8 million, down three percent from $220.3 million in the same period last year. Loan principal payments received in the first nine months of fiscal 2023 were $77.2 million, down 57 percent from $180.1 million in the same period last year. The weighted average loan receivable yield during the first nine months of fiscal 2023 increased 31 basis points to2024 from 4.00 percent from 3.69 percent in the same period last year. The increase in the average yield on loans receivable was primarily attributable to loans repricing upward, new loan originations with a higher average yield and a decrease in net deferred loan cost amortization to $727,000$664,000 in the first nine months of fiscal 20232024 from $1.6 million$726,000 in the same period of fiscal 2022.2023. Adjustable-rate loans of approximately $280.1$302.2 million were repriced upward in the first nine months of fiscal 20232024 by approximately 108104 basis points from a weightedan average 4.29yield of 6.35 percent to 5.377.39 percent. The average balance of loans receivable increased by $60.8 million, or six percent, to $1.07 billion for the first nine months of fiscal 2024 from $1.01 billion in the same period of fiscal 2023. Total loans originated for investment in the first nine months of fiscal 2024 were $56.9 million, down 73 percent from $212.8 million in the same period last year. Loan principal payments received in the first nine months of fiscal 2024 were $69.3 million, down 10 percent from $77.2 million in the same period last year.
Interest income from investment securities increased $266,000,decreased $67,000, or 19four percent, to $1.6 million in the first nine months of fiscal 2023 from $1.4 million for2024 as compared to the same period of fiscal 2022.2023. This increasedecrease was attributable to a higherlower average yield,balance, partly offset by a lowerhigher average balance. The average investment securities yield increased by 38 basis points to 1.24 percent in the first nine months of fiscal 2023 from 0.86 percent in the same period of fiscal 2022. The increase in the average investment securities yield was primarily attributable to a lower premium amortization ($622,000 compared to $1.3 million) due to lower total principal repayments ($23.8 million vs. $44.8 million) and, to a lesser extent, the upward repricing of adjustable rate mortgage-backed securities.yield. The average balance of investment securities decreased by $35.2$28.4 million, or 1716 percent, to $175.8$147.4 million in the first nine months of fiscal 20232024 from $211.0$175.8 million in the same period of fiscal 2022.2023. The decrease in the average balance of investment securities was primarily the result of scheduled and accelerated principal payments on mortgage-backed securities. The average yield on investment securities increased by 18 basis points to 1.42 percent in the first nine months of fiscal 2024 from 1.24 percent in the same period of fiscal 2023. The increase in the average yield was primarily attributable to a lower premium amortization ($416,000 compared to $622,000) attributable to lower total principal repayments ($18.2 million vs. $23.8 million) and, to a lesser extent, the upward repricing of adjustable rate mortgage-backed securities.
The FHLB – San Francisco cash dividenddividends received in the first nine months of fiscal 2023 was $414,000,2024 were $586,000, up 1342 percent from $368,000$414,000 in the same period of fiscal 2022.2023. The average balance of FHLB – San Francisco stock in the first nine months of fiscal 20232024 was $9.5 million, up 16 percent from $8.2 million virtually unchanged fromin the same period of fiscal 2022 while2023, and the average yield was 6.708.22 percent, up 68152 basis points from 6.026.70 percent.
Interest income from interest-earning deposits, primarily cash deposited at the Federal Reserve BankFRB of San Francisco, was $666,000$1.3 million in the first nine months of fiscal 2023,2024, up 53494 percent from $105,000$666,000 in the same period of fiscal 2022.2023. The increase was primarily due to a higher average yield.yield and, to a lesser extent, a higher average balance. The average yield earned on interest-earning deposits increased by 346176 basis points to 3.625.38 percent in the first nine months of fiscal 20232024 from 0.163.62 percent in the comparable period last year, due primarily to an increase in the interest rate paid on excess reserves. The average balance of the interest-earning deposits in the first nine months of fiscal 20232024 was $24.2$31.5 million, a decreasean increase of $62.2$7.3 million or 7230 percent, from $86.4$24.2 million in the same period of fiscal 2022.2023.
42
Interest Expense:
For the Quarters Ended March 31, 20232024 and 2022.2023. Total interest expense increased by $1.9$2.6 million or 262100 percent to $2.6$5.2 million in the third quarter of fiscal 20232024 from $720,000$2.6 million in the same quarter last year. The increase was attributable to higher interest expense on borrowings and time deposits, particularly brokered certificates of deposit.
Interest expense on deposits for the third quarter of fiscal 20232024 was $879,000,$2.7 million, a 221204 percent increase from $274,000$879,000 for the same periodquarter last year. The increase in interest expense on deposits was attributable to a higher average balancecost and, costto a lesser extent, a higher average balance of time deposits. The average cost of deposits was 0.371.18 percent for the third quarter of fiscal 2023,2024, up 2581 basis points from 0.120.37 percent in the same quarter last year, primarily attributable primarily to the average cost of time deposits (mainly(including brokered certificates of deposit) which increased 131199 basis points to 1.87%3.86 percent for the third quarter of fiscal 20232024 from 0.561.87 percent in the same quarter of fiscal 2022.2023. The average balance of deposits
47
decreased slightlyfive percent to $962.0$910.8 million in the third quarter of fiscal 20232024 from $963.1$962.0 million in the same quarter last year due to decreases in transaction accounts which was mainlypartly offset by an increase in time deposits. The average balance of transaction accounts was $651.5 million in the third quarter of fiscal 2024, down 18 percent from $792.9 million in the same quarter last year; while the average balance of time deposits (including brokered certificates of deposit.deposit) increased 53 percent to $259.3 million in the third quarter of fiscal 2024 from $169.1 million in the same quarter last year.
Interest expense on borrowings, consisting of FHLB – San Francisco advances, for the third quarter of fiscal 20232024 increased $1.3 million,$845,000, or 28749 percent, to $1.7$2.6 million from $446,000$1.7 million for the same periodquarter last year. The increase was primarily the result of a higher average balance and, to a lesser extent, a higher average cost.cost of borrowings. The average balance of borrowings increased by $96.5$47.1 million or 12127 percent to $176.5$223.6 million in the third quarter of fiscal 20232024 from $80.0$176.5 million in the same quarter last year and the average cost of borrowings increased by 17166 basis points to 3.974.63 percent in the third quarter of fiscal 20232024 from 2.263.97 percent in the same quarter last year.
For the Nine Months Ended March 31, 20232024 and 2022.2023. Total interest expense increased $2.9$9.0 million, or 120170 percent to $5.3$14.3 million in the first nine months of fiscal 20232024 from $2.4$5.3 million in the same period last year. ThisThe increase was attributable primarily to higher interest expense on borrowingborrowings and to a lesser extent, interest expense on time deposits, particularly brokered certificates of deposit.
Interest expense on deposits for the first nine months of fiscal 20232024 was $1.7$6.8 million, a $782,000 or 88300 percent increase from $889,000$1.7 million for the same period last year. The increase in interest expense on deposits was primarily attributable to a higher average cost of time deposits, and to a lesser extent, a higher average balance of time deposits. The average cost of deposits was 0.230.99 percent, up 1176 basis points from 0.120.23 percent in the same period last year, primarily attributable primarily to time deposits (mainly(including brokered certificates of deposit) which increased 65230 basis points to 1.24%3.54 percent for the first nine months of fiscal 20232024 from 0.59% in1.24 percent for the same period in fiscal 2022.2023. The average balance of deposits increased slightlydecreased $40.3 million or four percent to $962.2$921.9 million in the first nine months of fiscal 20232024 from $959.2$962.2 million in the same period last year due primarily to increasesa decrease of $134.6 million in time deposits (particularly brokered certificatesthe average balance of deposit) and savings deposits,transaction accounts, partly offset by a decreasean increase of $94.3 million in checking and money marketthe average balance of time deposits.
Interest expense on borrowings, consisting primarily of FHLB – San Francisco advances, for the first nine months of fiscal 20232024 increased by $2.2$3.8 million, or 138103 percent, to $3.7$7.5 million from $1.5$3.7 million in the same period last year. The increase in interest expense on borrowings was primarily the result of a higher average balance and, to a lesser extent, a higher average cost. The average balance of borrowings increased by $54.9$78.3 million or 6254 percent to $143.9$222.2 million in the first nine months of fiscal 20232024 from $89.0$143.9 million in the same period last year, and the average cost of borrowings increased by 108112 basis points to 3.384.50 percent in the first nine months of fiscal 20232024 from 2.303.38 percent in the same period last year.
year
4348
The following tables presenttable presents the average balance sheets for the quarters and nine months ended March 31, 20232024 and 2022,2023, respectively. Average balances of loans receivable, net include loans accounted for on a non-accrual basis.non-performing loans. Amortization of net deferred loan fees/costs is included with interest income on loans receivable. Average balances are calculated using daily balances.
Average Balance Sheets
| | | | | | | | | | | | | | | | | | | | | | | | | | | | | | | | | | | | |
| | Quarter Ended | | Quarter Ended | | Quarter Ended | | Quarter Ended | ||||||||||||||||||||||||||||
| | March 31, 2023 | | March 31, 2022 | | March 31, 2024 | | March 31, 2023 | ||||||||||||||||||||||||||||
| | Average | | | | | Yield/ | | | Average | | | | | Yield/ | | | Average | | | | | Yield/ | | | Average | | | | | Yield/ | | ||||
(Dollars In Thousands) | | Balance | | Interest | | Cost | | | Balance | | Interest | | Cost | | | Balance | | Interest | | Cost | | | Balance | | Interest | | Cost | | ||||||||
Interest-earning assets: |
| |
|
| |
|
|
|
|
| |
|
| |
|
|
|
|
| |
|
| |
|
|
|
|
| |
|
| |
|
|
|
|
Loans receivable, net(1) | | $ | 1,054,431 | | $ | 11,028 |
| 4.18 | % | | $ | 858,300 | | $ | 7,581 |
| 3.53 | % | | $ | 1,071,004 | | $ | 12,683 |
| 4.74 | % | | $ | 1,054,431 | | $ | 11,028 |
| 4.18 | % |
Investment securities | |
| 167,679 | |
| 548 |
| 1.31 | % | |
| 203,171 | |
| 515 |
| 1.01 | % | |
| 141,390 | |
| 517 |
| 1.46 | % | |
| 167,679 | |
| 548 |
| 1.31 | % |
FHLB – San Francisco stock | |
| 8,239 | |
| 146 |
| 7.09 | % | |
| 8,155 | |
| 123 |
| 6.03 | % | |
| 9,505 | |
| 210 |
| 8.84 | % | |
| 8,239 | |
| 146 |
| 7.09 | % |
Interest-earning deposits | |
| 24,615 | |
| 286 |
| 4.65 | % | |
| 86,007 | |
| 39 |
| 0.18 | % | |
| 29,099 | |
| 397 |
| 5.40 | % | |
| 24,615 | |
| 286 |
| 4.65 | % |
| | | | | | | | | | | | | | | | | | | | | | | | | | | | | | | | | | | | |
Total interest-earning assets | |
| 1,254,964 | |
| 12,008 |
| 3.83 | % | |
| 1,155,633 | |
| 8,258 |
| 2.86 | % | |
| 1,250,998 | |
| 13,807 |
| 4.41 | % | |
| 1,254,964 | |
| 12,008 |
| 3.83 | % |
| | | | | | | | | | | | | | | | | | | | | | | | | | | | | | | | | | | | |
Non interest-earning assets | |
| 32,416 | |
|
|
|
| | |
| 32,346 | |
| |
|
| | ||||||||||||||||||
Noninterest-earning assets | |
| 30,977 | |
|
|
|
| | |
| 32,416 | |
| |
|
| | ||||||||||||||||||
| | | | | | | | | | | | | | | | | | | | | | | | | | | | | | | | | | | | |
Total assets | | $ | 1,287,380 | |
|
|
|
| | | $ | 1,187,979 | |
|
|
|
| | | $ | 1,281,975 | |
|
|
|
| | | $ | 1,287,380 | |
|
|
|
| |
| | | | | | | | | | | | | | | | | | | | | | | | | | | | | | | | | | | | |
Interest-bearing liabilities: | |
|
| |
|
|
|
| | |
|
| |
|
|
|
| | |
|
| |
|
|
|
| | |
|
| |
|
|
|
| |
Checking and money market accounts(2) | | $ | 475,958 | | $ | 56 |
| 0.05 | % | | $ | 505,126 | | $ | 54 |
| 0.04 | % | | $ | 399,185 | | $ | 90 |
| 0.09 | % | | $ | 475,958 | | $ | 56 |
| 0.05 | % |
Savings accounts | |
| 316,980 | |
| 42 |
| 0.05 | % | |
| 328,757 | |
| 42 |
| 0.05 | % | |
| 252,309 | |
| 97 |
| 0.15 | % | |
| 316,980 | |
| 42 |
| 0.05 | % |
Time deposits | |
| 169,105 | |
| 781 |
| 1.87 | % | |
| 129,229 | |
| 178 |
| 0.56 | % | |
| 259,287 | |
| 2,488 |
| 3.86 | % | |
| 169,105 | |
| 781 |
| 1.87 | % |
| | | | | | | | | | | | | | | | | | | | | | | | | | | | | | | | | | | | |
Total deposits(3) | |
| 962,043 | |
| 879 |
| 0.37 | % | |
| 963,112 | |
| 274 |
| 0.12 | % | |
| 910,781 | |
| 2,675 |
| 1.18 | % | |
| 962,043 | |
| 879 |
| 0.37 | % |
| | | | | | | | | | | | | | | | | | | | | | | | | | | | | | | | | | | | |
Borrowings | |
| 176,501 | |
| 1,728 |
| 3.97 | % | |
| 80,000 | |
| 446 |
| 2.26 | % | |
| 223,632 | |
| 2,573 |
| 4.63 | % | |
| 176,501 | |
| 1,728 |
| 3.97 | % |
| | | | | | | | | | | | | | | | | | | | | | | | | | | | | | | | | | | | |
Total interest-bearing liabilities | |
| 1,138,544 | |
| 2,607 |
| 0.93 | % | |
| 1,043,112 | |
| 720 |
| 0.28 | % | |
| 1,134,413 | |
| 5,248 |
| 1.86 | % | |
| 1,138,544 | |
| 2,607 |
| 0.93 | % |
| | | | | | | | | | | | | | | | | | | | | | | | | | | | | | | | | | | | |
Non interest-bearing liabilities | |
| 18,291 | |
|
|
|
| | |
| 17,348 | |
|
|
|
| | ||||||||||||||||||
Noninterest-bearing liabilities | |
| 16,656 | |
|
|
|
| | |
| 18,291 | |
|
|
|
| | ||||||||||||||||||
| | | | | | | | | | | | | | | | | | | | | | | | | | | | | | | | | | | | |
Total liabilities | |
| 1,156,835 | |
|
|
|
| | |
| 1,060,460 | |
|
|
|
| | |
| 1,151,069 | |
|
|
|
| | |
| 1,156,835 | |
|
|
|
| |
| | | | | | | | | | | | | | | | | | | | | | | | | | | | | | | | | | | | |
Stockholders’ equity | |
| 130,545 | |
|
|
|
| | |
| 127,519 | |
|
|
|
| | |
| 130,906 | |
|
|
|
| | |
| 130,545 | |
|
|
|
| |
Total liabilities and stockholders’ equity | | $ | 1,287,380 | |
|
|
|
| | | $ | 1,187,979 | |
|
|
|
| | | $ | 1,281,975 | |
|
|
|
| | | $ | 1,287,380 | |
|
|
|
| |
| | | | | | | | | | | | | | | | | | | | | | | | | | | | | | | | | | | | |
Net interest income | |
|
| | $ | 9,401 |
|
| | |
|
| | $ | 7,538 |
|
| | |
|
| | $ | 8,559 |
|
| | |
|
| | $ | 9,401 |
|
| |
| | | | | | | | | | | | | | | | | | | | | | | | | | | | | | | | | | | | |
Interest rate spread(4) | |
|
| |
|
|
| 2.90 | % | |
|
| |
|
|
| 2.58 | % | |
|
| |
|
|
| 2.55 | % | |
|
| |
|
|
| 2.90 | % |
Net interest margin(5) | |
|
| |
|
|
| 3.00 | % | |
|
| |
|
|
| 2.61 | % | |
|
| |
|
|
| 2.74 | % | |
|
| |
|
|
| 3.00 | % |
Ratio of average interest- earning assets to average interest-bearing liabilities | |
|
| |
|
|
| 110.23 | % | |
|
| |
|
|
| 110.79 | % | |
|
| |
|
|
| 110.28 | % | |
|
| |
|
|
| 110.23 | % |
Return on average assets | | | | | | | | 0.72 | % | | | | | | | | 0.57 | % | | | | | | | | 0.47 | % | | | | | | | | 0.72 | % |
Return on average equity | | | | | | | | 7.12 | % | | | | | | | | 5.33 | % | | | | | | | | 4.57 | % | | | | | | | | 7.12 | % |
(1) | Includes the average balance of non-performing loans of |
(2) | Includes the average balance of |
(3) | Includes the average balance of uninsured deposits (adjusted lower by collateralized deposits) of approximately |
(4) | Represents the difference between the weighted-average yield on all interest-earning assets and the weighted-average rate on all interest-bearing liabilities. |
(5) | Represents net interest income before provision |
4449
| | | | | | | | | | | | | | | | | | |
| | Nine Months Ended | | Nine Months Ended | ||||||||||||||
| | March 31, 2023 | | March 31, 2022 | ||||||||||||||
| | Average | | | | | Yield/ | | | Average | | | | | Yield/ | | ||
(Dollars In Thousands) | | Balance | | Interest | | Cost | | | Balance | | Interest | | Cost | | ||||
Interest-earning assets: |
| |
|
| |
|
|
|
|
| |
|
| |
|
|
|
|
Loans receivable, net(1) | | $ | 1,011,916 | | $ | 30,365 |
| 4.00 | % | | $ | 855,080 | | $ | 23,676 |
| 3.69 | % |
Investment securities | |
| 175,802 | |
| 1,632 |
| 1.24 | % | |
| 210,978 | |
| 1,366 |
| 0.86 | % |
FHLB – San Francisco stock | |
| 8,239 | |
| 414 |
| 6.70 | % | |
| 8,155 | |
| 368 |
| 6.02 | % |
Interest-earning deposits | |
| 24,153 | |
| 666 |
| 3.62 | % | |
| 86,402 | |
| 105 |
| 0.16 | % |
| | | | | | | | | | | | | | | | | | |
Total interest-earning assets | |
| 1,220,110 | |
| 33,077 |
| 3.61 | % | |
| 1,160,615 | |
| 25,515 |
| 2.93 | % |
| | | | | | | | | | | | | | | | | | |
Non interest-earning assets | |
| 33,552 | |
|
|
|
| | |
| 32,604 | |
|
|
|
| |
| | | | | | | | | | | | | | | | | | |
Total assets | | $ | 1,253,662 | |
|
|
|
| | | $ | 1,193,219 | |
|
|
|
| |
| | | | | | | | | | | | | | | | | | |
Interest-bearing liabilities: | |
|
| |
|
|
|
| | |
|
| |
|
|
|
| |
Checking and money market accounts(2) | | $ | 489,633 | | $ | 177 |
| 0.05 | % | | $ | 504,282 | | $ | 169 |
| 0.04 | % |
Savings accounts | |
| 326,381 | |
| 130 |
| 0.05 | % | |
| 320,999 | |
| 128 |
| 0.05 | % |
Time deposits | |
| 146,227 | |
| 1,364 |
| 1.24 | % | |
| 133,872 | |
| 592 |
| 0.59 | % |
| | | | | | | | | | | | | | | | | | |
Total deposits(3) | |
| 962,241 | |
| 1,671 |
| 0.23 | % | |
| 959,153 | |
| 889 |
| 0.12 | % |
| | | | | | | | | | | | | | | | | | |
Borrowings | |
| 143,887 | |
| 3,655 |
| 3.38 | % | |
| 88,986 | |
| 1,537 |
| 2.30 | % |
| | | | | | | | | | | | | | | | | | |
Total interest-bearing liabilities | |
| 1,106,128 | |
| 5,326 |
| 0.64 | % | |
| 1,048,139 | |
| 2,426 |
| 0.31 | % |
| | | | | | | | | | | | | | | | | | |
Non interest-bearing liabilities | |
| 17,147 | |
|
|
|
| | |
| 17,722 | |
|
|
|
| |
| | | | | | | | | | | | | | | | | | |
Total liabilities | |
| 1,123,275 | |
|
|
|
| | |
| 1,065,861 | |
|
|
|
| |
| | | | | | | | | | | | | | | | | | |
Stockholders’ equity | |
| 130,387 | |
|
|
|
| | |
| 127,358 | |
|
|
|
| |
Total liabilities and stockholders’ equity | | $ | 1,253,662 | |
|
|
|
| | | $ | 1,193,219 | |
|
|
|
| |
| | | | | | | | | | | | | | | | | | |
Net interest income | |
|
| | $ | 27,751 |
|
| | |
|
| | $ | 23,089 |
|
| |
| | | | | | | | | | | | | | | | | | |
Interest rate spread(4) | |
|
| |
|
|
| 2.97 | % | |
|
| |
|
|
| 2.62 | % |
Net interest margin(5) | |
|
| |
|
|
| 3.03 | % | |
|
| |
|
|
| 2.65 | % |
Ratio of average interest- earning assets to average interest-bearing liabilities | |
|
| |
|
|
| 110.30 | % | |
|
| |
|
|
| 110.73 | % |
Return on average assets | | | | | | | | 0.72 | % | | | | | | | | 0.74 | % |
Return on average equity | | | | | | | | 6.94 | % | | | | | | | | 6.94 | % |
|
|
|
|
|
|
|
|
|
|
|
|
|
|
|
|
|
|
|
| | | | | | | | | | | | | | | | | | |
| | Nine Months Ended | | Nine Months Ended | ||||||||||||||
| | March 31, 2024 | | March 31, 2023 | ||||||||||||||
| | Average | | | | | Yield/ | | | Average | | | | | Yield/ | | ||
(Dollars In Thousands) | | Balance | | Interest | | Cost | | | Balance | | Interest | | Cost | | ||||
Interest-earning assets: |
| |
|
| |
|
|
|
|
| |
|
| |
|
|
|
|
Loans receivable, net(1) | | $ | 1,072,741 | | $ | 37,368 |
| 4.64 | % | | $ | 1,011,916 | | $ | 30,365 |
| 4.00 | % |
Investment securities | |
| 147,445 | |
| 1,565 |
| 1.42 | % | |
| 175,802 | |
| 1,632 |
| 1.24 | % |
FHLB – San Francisco stock | |
| 9,505 | |
| 586 |
| 8.22 | % | |
| 8,239 | |
| 414 |
| 6.70 | % |
Interest-earning deposits | |
| 31,538 | |
| 1,295 |
| 5.38 | % | |
| 24,153 | |
| 666 |
| 3.62 | % |
| | | | | | | | | | | | | | | | | | |
Total interest-earning assets | |
| 1,261,229 | |
| 40,814 |
| 4.31 | % | |
| 1,220,110 | |
| 33,077 |
| 3.61 | % |
| | | | | | | | | | | | | | | | | | |
Noninterest-earning assets | |
| 30,673 | |
|
|
|
| | |
| 33,552 | |
|
|
|
| |
| | | | | | | | | | | | | | | | | | |
Total assets | | $ | 1,291,902 | |
|
|
|
| | | $ | 1,253,662 | |
|
|
|
| |
| | | | | | | | | | | | | | | | | | |
Interest-bearing liabilities: | |
|
| |
|
|
|
| | |
|
| |
|
|
|
| |
Checking and money market accounts(2) | | $ | 415,207 | | $ | 219 |
| 0.07 | % | | $ | 489,633 | | $ | 177 |
| 0.05 | % |
Savings accounts | |
| 266,145 | |
| 208 |
| 0.10 | % | |
| 326,381 | |
| 130 |
| 0.05 | % |
Time deposits | |
| 240,553 | |
| 6,406 |
| 3.54 | % | |
| 146,227 | |
| 1,364 |
| 1.24 | % |
| | | | | | | | | | | | | | | | | | |
Total deposits(3) | |
| 921,905 | |
| 6,833 |
| 0.99 | % | |
| 962,241 | |
| 1,671 |
| 0.23 | % |
| | | | | | | | | | | | | | | | | | |
Borrowings | |
| 222,206 | |
| 7,509 |
| 4.50 | % | |
| 143,887 | |
| 3,655 |
| 3.38 | % |
| | | | | | | | | | | | | | | | | | |
Total interest-bearing liabilities | |
| 1,144,111 | |
| 14,342 |
| 1.67 | % | |
| 1,106,128 | |
| 5,326 |
| 0.64 | % |
| | | | | | | | | | | | | | | | | | |
Noninterest-bearing liabilities | |
| 17,105 | |
|
|
|
| | |
| 17,147 | |
|
|
|
| |
| | | | | | | | | | | | | | | | | | |
Total liabilities | |
| 1,161,216 | |
|
|
|
| | |
| 1,123,275 | |
|
|
|
| |
| | | | | | | | | | | | | | | | | | |
Stockholders’ equity | |
| 130,686 | |
|
|
|
| | |
| 130,387 | |
|
|
|
| |
Total liabilities and stockholders’ equity | | $ | 1,291,902 | |
|
|
|
| | | $ | 1,253,662 | |
|
|
|
| |
| | | | | | | | | | | | | | | | | | |
Net interest income | |
|
| | $ | 26,472 |
|
| | |
|
| | $ | 27,751 |
|
| |
| | | | | | | | | | | | | | | | | | |
Interest rate spread(4) | |
|
| |
|
|
| 2.64 | % | |
|
| |
|
|
| 2.97 | % |
Net interest margin(5) | |
|
| |
|
|
| 2.80 | % | |
|
| |
|
|
| 3.03 | % |
Ratio of average interest- earning assets to average interest-bearing liabilities | |
|
| |
|
|
| 110.24 | % | |
|
| |
|
|
| 110.30 | % |
Return on average assets | | | | | | | | 0.56 | % | | | | | | | | 0.72 | % |
Return on average equity | | | | | | | | 5.51 | % | | | | | | | | 6.94 | % |
(1) | Includes the average balance of non-performing loans of |
(2) | Includes the average balance of |
(3) | Includes the average balance of uninsured deposits (adjusted lower by collateralized deposits) of approximately |
(4) | Represents the difference between the weighted-average yield on all interest-earning assets and the weighted-average rate on all interest-bearing liabilities. |
(5) | Represents net interest income before provision |
4550
The following tables settable sets forth the effects of changing rates and volumes on interest income and expense for the quarters and nine months ended March 31, 20232024 and 2022,2023, respectively. Information is provided with respect to the effects attributable to changes in volume (changes in volume multiplied by prior rate), the effects attributable to changes in rate (changes in rate multiplied by prior volume) and the effects attributable to changes that cannot be allocated between rate and volume.
Rate/Volume Variance
| | | | | | | | | | | | | | | | | | | | | | | | |
| | Quarter Ended March 31, 2023 Compared | | Quarter Ended March 31, 2024 Compared | ||||||||||||||||||||
| | To Quarter Ended March 31, 2022 | | To Quarter Ended March 31, 2023 | ||||||||||||||||||||
| | Increase (Decrease) Due to | | Increase (Decrease) Due to | ||||||||||||||||||||
(In Thousands) | | Rate | | Volume | | Rate/Volume | | Net | | Rate | | Volume | | Rate/Volume | | Net | ||||||||
Interest-earning assets: |
| |
|
| |
|
| |
|
| |
|
| |
|
| |
|
| |
|
| |
|
Loans receivable(1) | | $ | 1,397 | | $ | 1,731 | | $ | 319 | | $ | 3,447 | | $ | 1,459 | | $ | 173 | | $ | 23 | | $ | 1,655 |
Investment securities | |
| 150 | |
| (90) | |
| (27) | |
| 33 | |
| 65 | |
| (86) | |
| (10) | |
| (31) |
FHLB – San Francisco stock | |
| 22 | |
| 1 | |
| — | |
| 23 | |
| 36 | |
| 22 | |
| 6 | |
| 64 |
Interest-earning deposits | |
| 961 | |
| (28) | |
| (686) | |
| 247 | |
| 51 | |
| 52 | |
| 8 | |
| 111 |
Total net change in income on interest-earning assets | |
| 2,530 | |
| 1,614 | |
| (394) | |
| 3,750 | |
| 1,611 | |
| 161 | |
| 27 | |
| 1,799 |
| | | | | | | | | | | | | | | | | | | | | | | | |
Interest-bearing liabilities: | |
|
| |
|
| |
|
| |
|
| |
|
| |
|
| |
|
| |
|
|
Checking and money market accounts | |
| 6 | |
| (3) | |
| (1) | |
| 2 | |
| 52 | |
| (10) | |
| (8) | |
| 34 |
Savings accounts | |
| — | |
| (1) | |
| 1 | |
| — | |
| 79 | |
| (8) | |
| (16) | |
| 55 |
Time deposits | |
| 419 | |
| 55 | |
| 129 | |
| 603 | |
| 840 | |
| 420 | |
| 447 | |
| 1,707 |
Borrowings | |
| 337 | |
| 538 | |
| 407 | |
| 1,282 | |
| 301 | |
| 466 | |
| 78 | |
| 845 |
Total net change in expense on interest-bearing liabilities | |
| 762 | |
| 589 | |
| 536 | |
| 1,887 | |
| 1,272 | |
| 868 | |
| 501 | |
| 2,641 |
Net increase (decrease) in net interest income | | $ | 1,768 | | $ | 1,025 | | $ | (930) | | $ | 1,863 | | $ | 339 | | $ | (707) | | $ | (474) | | $ | (842) |
(1) | For purposes of calculating volume, rate and rate/volume variances, non-performing loans were included in the weighted-average balance outstanding. |
| | | | | | | | | | | | | | | | | | | | | | | | |
| | Nine Months Ended March 31, 2023 Compared | | Nine Months Ended March 31, 2024 Compared | ||||||||||||||||||||
| | To Nine Months Ended March 31, 2022 | | To Nine Months Ended March 31, 2023 | ||||||||||||||||||||
| | Increase (Decrease) Due to | | Increase (Decrease) Due to | ||||||||||||||||||||
(In Thousands) | | Rate | | Volume | | Rate/Volume | | Net | | Rate | | Volume | | Rate/Volume | | Net | ||||||||
Interest-earning assets: |
| |
|
| |
|
| |
|
| |
|
| |
|
| |
|
| |
|
| |
|
Loans receivable(1) | | $ | 1,984 | | $ | 4,340 | | $ | 365 | | $ | 6,689 | | $ | 4,886 | | $ | 1,825 | | $ | 292 | | $ | 7,003 |
Investment securities | |
| 593 | |
| (227) | |
| (100) | |
| 266 | |
| 235 | |
| (264) | |
| (38) | |
| (67) |
FHLB – San Francisco stock | |
| 42 | |
| 4 | |
| — | |
| 46 | |
| 94 | |
| 64 | |
| 14 | |
| 172 |
Interest-bearing deposits | |
| 2,251 | |
| (75) | |
| (1,615) | |
| 561 | |
| 331 | |
| 201 | |
| 97 | |
| 629 |
Total net change in income on interest-earning assets | |
| 4,870 | |
| 4,042 | |
| (1,350) | |
| 7,562 | |
| 5,546 | |
| 1,826 | |
| 365 | |
| 7,737 |
| | | | | | | | | | | | | | | | | | | | | | | | |
Interest-bearing liabilities: | |
|
| |
|
| |
|
| |
|
| |
|
| |
|
| |
|
| |
|
|
Checking and money market accounts | |
| 13 | |
| (4) | |
| (1) | |
| 8 | |
| 81 | |
| (28) | |
| (11) | |
| 42 |
Savings accounts | |
| — | |
| 2 | |
| — | |
| 2 | |
| 124 | |
| (23) | |
| (23) | |
| 78 |
Time deposits | |
| 657 | |
| 55 | |
| 60 | |
| 772 | |
| 2,526 | |
| 881 | |
| 1,635 | |
| 5,042 |
Borrowings | |
| 725 | |
| 948 | |
| 445 | |
| 2,118 | |
| 1,199 | |
| 1,994 | |
| 661 | |
| 3,854 |
Total net change in expense on interest-bearing liabilities | |
| 1,395 | |
| 1,001 | |
| 504 | |
| 2,900 | |
| 3,930 | |
| 2,824 | |
| 2,262 | |
| 9,016 |
Net increase (decrease) in net interest income | | $ | 3,475 | | $ | 3,041 | | $ | (1,854) | | $ | 4,662 | | $ | 1,616 | | $ | (998) | | $ | (1,897) | | $ | (1,279) |
(1) | For purposes of calculating volume, rate and rate/volume variances, non-performing loans were included in the weighted-average balance outstanding. |
Provision for (Recovery of) Credit Losses:
For the Quarters Ended March 31, 2024 and 2023. During the third quarter of fiscal 2024, the Corporation recorded a provision for credit losses of $124,000, down 27 percent from a $169,000 provision for credit losses recorded during the
4651
Provision (Recovery)same period last year. The provision for Loan Losses:
For the Quarters Ended March 31, 2023 and 2022. Duringcredit losses recorded in the third quarter of fiscal 2023, the Corporation recorded a provision for loan losses of $169,000, compared2024 was primarily attributable to a $645,000 recoverylonger estimated life of the single-family loan portfolio resulting from increased market interest rates and lower loan prepayment estimates, while the allowance for loan losses recorded during the same quarter last year. The provision for loan losses primarily reflects an increase inoutstanding balance of loans held for investment in the third quarter of fiscalat March 31, 2024 declined one percent to $1.07 billion from $1.08 billion at December 31, 2023.
For the Nine Months Ended March 31, 20232024 and 2022.2023. During the first nine months of fiscal 2023,2024, the Corporation recorded a recovery of credit losses of $51,000, compared to a provision for loancredit losses of $430,000 compared to a recovery from the allowance for loan losses of $2.1 million in the same period of fiscal 2022.2023. The provision for loanrecovery of credit losses primarily reflects an increase in loans held for investmentrecorded in the first nine months of fiscal 2023.
Non-performing assets, comprised solely2024 was primarily attributable to a shorter estimated life of non-performingthe loan portfolio resulting in higher loan prepayment estimates and the decline in the outstanding balance of loans with underlying collateral located in California, decreased $478,000 or 34 percent to $945,000, or 0.07 percent of total assets,held for investment at March 31, 2023, compared2024 to $1.4 million, or 0.12 percent of total assets,$1.07 billion from $1.08 billion at June 30, 2022. Non-performing2023.
On July 1, 2023, the Corporation adopted ASC 326 resulting in a one-time increase to the ACL of $1.2 million, an $824,000 reduction to stockholders’ equity, a $345,000 increase to deferred tax assets and a $28,000 decrease to the mark on loans held at March 31, 2023 were comprised of five single-family loans, while non-performing loans at June 30, 2022 were comprised of seven single-family loans. At both March 31, 2023 and June 30, 2022, there was no real estate owned.
Net loan recoveries for the quarter ended March 31, 2023 were $2,000 or 0.00 percent (annualized) of average loans receivable, as comparedfair value. Prior to net loan recoveries of $6,000 or 0.00 percent (annualized) of average loans receivable for the quarter ended March 31, 2022. For the nine months ended March 31, 2023, net loan recoveries were $7,000 or 0.00 percent (annualized) of average loans receivable, as compared to net loan recoveries of $433,000 or 0.07 percent (annualized) of average loans receivable for the nine months ended March 31, 2022.
Classified assets were $3.0 million at March 31, 2023, consisting of $1.5 million of loans in the special mention category and $1.5 million of loans in the substandard category; while classified assets at June 30, 2022 were $1.6 million, consisting of $224,000 of loans in the special mention category and $1.4 million of loans in the substandard category.
At March 31,July 1, 2023, the allowance for loan losses was $6.0calculated using the incurred loss methodology, which is not directly comparable to the new CECL methodology used to calculate ACL due to the future forecast of loss component within CECL.
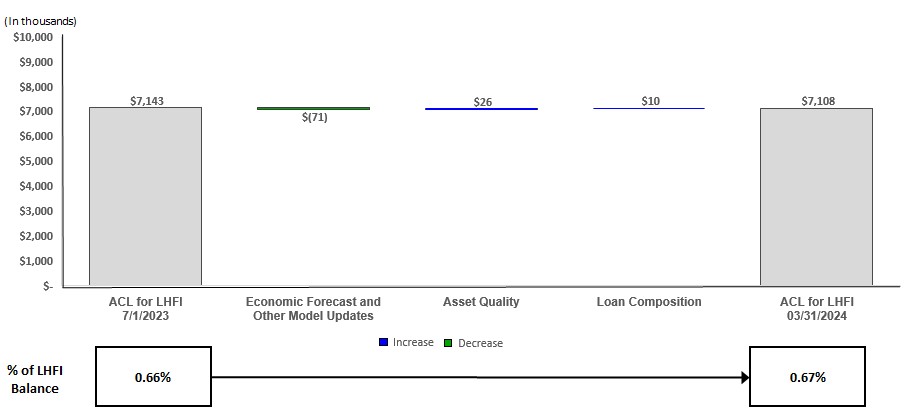
At March 31, 2024, the ACL on loans held for investment was $7.1 million, comprised of collectively evaluated allowances of $6.0$7.1 million and individually evaluated allowances of $38,000;$37,000; up eight20 percent from $5.6$5.9 million at June 30, 2022.2023. The allowance for loan lossesACL on loans as a percentage of gross loans held for investment was 0.560.67 percent at March 31, 2023,2024, compared to 0.590.55 percent at June 30, 2022.2023. The allowanceincrease in the ACL on loans was due primarily to the adoption of the CECL methodology ($1.2 million), partly offset by the recovery of credit losses in the first nine months of fiscal 2024 ($51,000, which includes $16,000 for the recovery of unfunded loan losses was determined through quantitative and qualitative adjustments includingcommitment reserves).
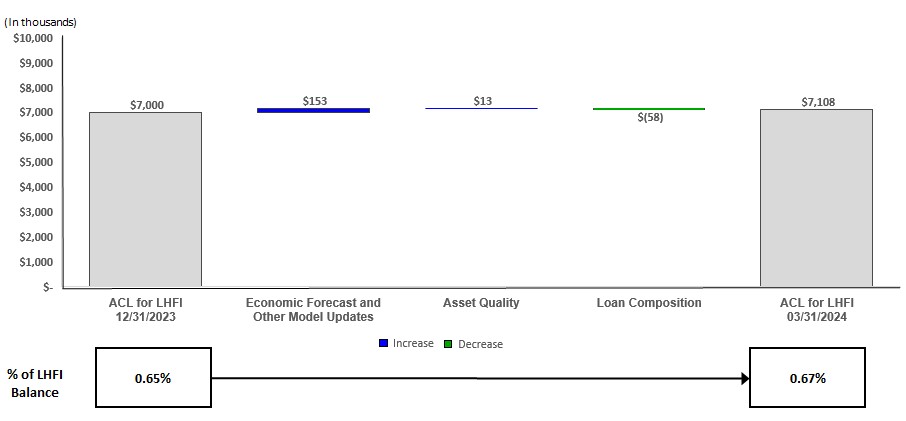
The following chart quantifies the Bank’s charge-off experience and reflectsfactors contributing to the impactchanges in the ACL on loans held for investment from(“LHFI”) for the current general economic conditionsquarter and nine months ended March 31, 2024 subsequent to the adoption of the U.S. and California economies.CECL methodology on July 1, 2023.
The changes in the ACL on LHFI for the quarter ended March 31, 2024:
52
The changes in the ACL on LHFI for the nine months ended March 31, 2024:
Management considers, based on currently available information, the allowance for loan lossesACL on loans sufficient to absorb potentialexpected losses inherent in loans held for investment. See “Asset Quality” below and Note 5 of the Notes to Unaudited Interim Condensed Consolidated Financial Statements in this Form 10-Q for additional discussion regarding the allowance for loan losses.ACL on LHFI.
Non-Interest Income:
For the Quarters Ended March 31, 20232024 and 2022.2023. Non-interest income decreased by $133,000, or 1214 percent, to $981,000$848,000 in the third quarter of fiscal 20232024 from $1.1 million$981,000 in the same period last year, primarily due to a decreasedecreases in loan servicing and other fees.
Loan servicing and other fees decreased $133,000 or 56 percent to $104,000 in the third quarter of fiscal 2023 from $237,000 in the same quarter last year. The decrease was attributable primarily to lower loan prepayment fees resulting from fewer loan payoffs, particularly in multi-family loans. Total loan prepayment fees in the third quarter of fiscal 2023 were $48,000, down $182,000 or 79 percent from $230,000 in the same quarter last year. Total loan repayments were $17.5 million in the third quarter of fiscal 2023, down 67 percent from $53.6 million in the same quarter last year.all non-interest income categories.
For the Nine Months Ended March 31, 20232024 and 2022.2023. Total non-interestNon-interest income decreased $611,000,$466,000, or 1716 percent, to $2.9$2.5 million for the nine months ended March 31, 20232024 from $3.6$2.9 million for the same period last year. The decrease was primarily attributableyear, due to a decreasedecreases in loan servicing and other fees.
47
Loan servicing and other fees decreased by $540,000 or 62 percent to $327,000 in the first nine months of fiscal 2023 from $867,000 in the same period last year. The decrease was due primarily to a decrease in loan prepayment fees resulting from fewer loan payoffs, particularly in multi-family loans. Total loan prepayment fees in the first nine months of fiscal 2023 was $270,000, down $556,000 or 67 percent from $826,000 in the same period last year. Total loan repayments were $77.2 million in the first nine months of fiscal 2023, down 57 percent from $180.1 million in the same period last year. Other changes inall non-interest income during the first nine months of fiscal 2023 compared to the same period in fiscal 2022, included a $73,000 or six percent decrease in card and processing fees.
categories.
Non-Interest Expense:
For the Quarters Ended March 31, 20232024 and 2022.2023. Non-interest expenses increased by $25,000$244,000 or less than onefour percent to $6.9$7.2 million in the third quarter of fiscal 20232024 from $6.9 million in the same quarter last year. The increase in the non-interest expense in the third quarter of fiscal 20232024 was primarily due to higher salaries and employee benefits, expenses and, to a lesser extent, higher deposit insurance premiumequipment and regulatory assessment,professional expenses, partly offset by lower equipment, professionalsales and marketing and other operating expenses.
Salaries and employee benefits increased $181,000, or four percent, to $4.5 million in the third quarter of fiscal 2024 from $4.4 million in the same quarter of fiscal 2023, representing the largest increase in non-interest expense. The increase was due primarily to higher compensation expenses and accruals for the supplemental executive retirement plans, partly offset by lower incentive compensation expenses.
For the Nine Months Ended March 31, 20232024 and 2022.2023. Non-interest expense for the nine months ended March 31, 2023 was $20.7 million, an increase of $1.2 million, or six percent, compared to $19.5 million in the nine months ended March 31, 2022.2024 was $21.4 million, an increase of $705,000 or three percent, compared to $20.7 million in the comparable period last year. The increase was primarily attributable to an increase in salaries and employee benefits expense.and, to a lesser extent, increases in premises and occupancy, equipment and deposit insurance premiums and regulatory assessments expenses.
Salaries and employee benefits expense increased by $1.1 million,$341,000, or ninethree percent, to $12.9$13.2 million in the first nine months of fiscal 20232024 from $11.8$12.9 million in the same period of fiscal 2022.2023. The increase was due primarily to higher compensation
53
expenses and accruals for the $1.2supplemental executive retirement plans, partly offset by lower incentive compensation expenses.
Premises and occupancy expenses increased $141,000, or six percent, to $2.6 million credit related to ERTC recorded in the first quarternine months of fiscal 20222024 from $2.5 million in the same period of fiscal 2023, primarily due to higher office rents, building security expenses and not replicateddepreciation of fixtures. Equipment expense increased $114,000, or 13 percent, to $962,000 in the first nine months of fiscal 2024 from $848,000 in the same period of fiscal 2023. Deposit insurance premiums and regulatory assessments increased $131,000, or 28 percent, to $596,000 in the first nine months of fiscal 2024 from $465,000 in the same period of fiscal 2023, primarily due to the increase in the FDIC assessment rate starting in January 2023.
Provision for Income Taxes:
The income tax provision reflects accruals for taxes at the applicable rates for federal income tax and California franchise tax based upon reported pre-tax income, adjusted for the effect of all permanent differences between income for tax and financial reporting purposes, such as non-deductible stock-based compensation and earnings from bank-owned life insurance policies, among others. Therefore, there are fluctuations in the effective income tax rate from period to period based on the relationship of net permanent differences to income before tax.
For the Quarters Ended March 31, 20232024 and 2022.2023. The income tax provision was $966,000$620,000 for the third quarter of fiscal 2023, up 382024, down 36 percent from $699,000$966,000 in the same quarter last year primarily due to higherlower pre-tax income. The effective tax rate in the third quarter of fiscal 20232024 was 29.429.3 percent as compared to 29.229.4 percent in the same quarter last year.
For the Nine Months Ended March 31, 20232024 and 2022.2023. The Corporation’s income tax provision was $2.8$2.2 million for the first nine months of fiscal 2023, an eight2024, a 21 percent increasedecrease from $2.6$2.8 million in the samecomparable period last year, primarily reflecting higherlower pre-tax income. The effective income tax rate for the nine months ended March 31, 2024 and 2023 was 29.2 percent and 2022 was 29.3 percent, and 28.1 percent, respectively. The lower effective income tax rate in the first nine months of fiscal 2022 was attributable primarily to the tax benefits from the non-taxable treatment of the ERTC for state income tax purposes. The Corporation believes that the effective income tax rates applied in the first nine months of fiscal 20232024 reflect its current income tax obligations.
Asset Quality
Non-performing assets were comprised solely of non-performing loans at both March 31, 20232024 and June 30, 2022.2023. Non-performing loans, net of the allowance for loan losses,ACL, consisting of loans with collateral located in California, were $945,000$2.2 million at March 31, 2023, down 342024, up 73 percent from $1.4$1.3 million at June 30, 2022.2023. Non-performing loans as a percentage of loans held for investment atLHFI March 31, 20232024 was 0.09%, down from 0.15%0.21 percent, compared to 0.12 percent at June 30, 2022. The non-performing2023. Non-performing loans at March 31, 2024 and June 30, 2023 were comprised of fivenine and six single-family loans; while the non-performing loans, at June 30, 2022 were comprised of seven single-family loans.respectively. No interest accruals were made for loans that were past due 90 days or more or if the loans were deemed non-performing. There was no real estate owned at either March 31, 20232024 or June 30, 2022.
48
As of March 31, 2023, total restructured loans were $1.4 million, down 69 percent from $4.5 million at June 30, 2022. At March 31, 2023, a total of $710,000 or 52 percent of these restructured loans were classified as non-performing; while at June 30, 2022, a total of $722,000 or 16 percent of these restructured loans were classified as non-performing. As of March 31, 2023, a total of $966,000 or 71 percent of the restructured loans had a current payment status, consistent with their modified payment terms. As of June 30, 2022, all of the restructured loans had a current payment status, consistent with their modified payment terms. Restructured loans which are performing in accordance with their modified terms and not otherwise classified as non-accrual are not included in non-performing assets.2023. For further analysis on non-performing loans, see the tables below and restructured loans, see Note 5 of the Notes to Unaudited Interim Condensed Consolidated Financial Statements of this Form 10-Q.
A decline in real estate values subsequent to the time of origination of the Corporation’s real estate secured loans could result in higher loan delinquency levels, foreclosures, provision for loancredit losses and net charge-offs. Real estate values and real estate markets are beyond the Corporation’s control and are generally affected by changes in national, regional or local economic conditions and other factors. These factors include fluctuations in interest rates and the availability of loans to potential purchasers, changes in tax laws and other governmental statutes, regulations and policies and acts of nature, such as earthquakes, fires and national disasters particular to California where substantially all of the Corporation’s real estate collateral is located. If real estate values decline, the value of the real estate collateral securing the Corporation’s loans as set forth in the table could be significantly overstated. The Corporation’s ability to recover on defaulted loans by foreclosing and selling the real estate collateral would then be diminished and it would be more likely to suffer losses on defaulted loans. The Corporation generally does not update the loan-to-value ratio on its loans held for investmentLHFI by obtaining new appraisals or broker price opinions (nor does the Corporation intend to do so in the future as a result of the costs and inefficiencies associated with completing the task) unless a specific loan has demonstrated deterioration in which case individually evaluated allowances are established, if required.
54
The following table sets forth information with respect to the Corporation’s non-performing assets, net of allowance for loan losses,ACL, at the dates indicated:
| | | | | | | | | | | | | | |
|
| At March 31, |
| At June 30, |
|
| At March 31, |
| At June 30, |
| ||||
(In Thousands) | | 2023 | | 2022 | | | 2024 | | 2023 | | ||||
Loans on non-accrual status (excluding restructured loans): |
| |
|
| |
| | |||||||
Loans on non-performing status |
| |
|
| |
| | |||||||
Mortgage loans: |
| |
|
| |
| |
| |
|
| |
| |
Single-family | | $ | 235 | | $ | 701 | | | $ | 2,246 | | $ | 1,300 | |
Total | |
| 235 | |
| 701 | | |
| 2,246 | |
| 1,300 | |
| | | | | | | | | | | | | | |
Accruing loans past due 90 days or more | |
| — | |
| — | | |
| — | |
| — | |
| | | | | | | | | | | | | | |
Restructured loans on non-accrual status: | |
|
| |
|
| | |||||||
Mortgage loans: | |
|
| |
|
| | |||||||
Single-family | |
| 710 | |
| 722 | | |||||||
Total | |
| 710 | |
| 722 | | |||||||
| | | | | | | | | | | | | | |
Total non-performing loans | |
| 945 | |
| 1,423 | | |
| 2,246 | |
| 1,300 | |
| | | | | | | | | | | | | | |
Real estate owned, net | |
| — | |
| — | | |
| — | |
| — | |
Total non-performing assets | | $ | 945 | | $ | 1,423 | | | $ | 2,246 | | $ | 1,300 | |
| | | | | | | | | | | | | | |
Non-performing loans as a percentage of loans held for investment, net of allowance for loan losses | |
| 0.09 | % |
| 0.15 | % | |||||||
Non-performing loans as a percentage of LHFI, net of ACL | |
| 0.21 | % |
| 0.12 | % | |||||||
| | | | | | | | | | | | | | |
Non-performing loans as a percentage of total assets | |
| 0.07 | % |
| 0.12 | % | |
| 0.17 | % |
| 0.10 | % |
| | | | | | | | | | | | | | |
Non-performing assets as a percentage of total assets | |
| 0.07 | % |
| 0.12 | % | |
| 0.17 | % |
| 0.10 | % |
49
The following table summarizes classified assets, which is comprised of classified loans, net of allowance for loan losses and fair value adjustments,ACL and real estate owned, if any, at the dates indicated:
| | | | | | | | | | | | | | | | | | | | |
|
| At March 31, 2023 |
| At June 30, 2022 |
| At March 31, 2024 |
| At June 30, 2023 | ||||||||||||
(Dollars In Thousands) |
| Balance |
| Count |
| Balance |
| Count |
| Balance |
| Count |
| Balance |
| Count | ||||
Special mention loans: |
| |
|
|
|
| |
|
|
|
| |
|
|
|
| |
|
|
|
Mortgage loans: |
| |
|
|
|
| |
|
|
|
| |
|
|
|
| |
|
|
|
Single-family | | $ | 1,017 |
| 3 | | $ | 224 |
| 1 | | $ | 914 |
| 2 | | $ | — |
| — |
Multi-family | |
| 511 |
| 1 | |
| — |
| — | |
| 1,019 |
| 2 | |
| 510 |
| 1 |
Total special mention loans | |
| 1,528 |
| 4 | |
| 224 |
| 1 | |
| 1,933 |
| 4 | |
| 510 |
| 1 |
| | | | | | | | | | | | | | | | | | | | |
Substandard loans: | |
|
|
|
| |
|
|
|
| |
|
|
|
| |
|
|
|
|
Mortgage loans: | |
|
|
|
| |
|
|
|
| |
|
|
|
| |
|
|
|
|
Single-family | |
| 945 |
| 5 | |
| 1,423 |
| 9 | |
| 2,246 |
| 9 | |
| 1,300 |
| 6 |
Multi-family | |
| 1,055 |
| 1 | |
| — |
| — | ||||||||||
Commercial real estate | | | 550 | | 1 | | | — | | — | | | — | | — | | | 547 | | 1 |
Total substandard loans | |
| 1,495 |
| 6 | |
| 1,423 |
| 9 | |
| 3,301 |
| 10 | |
| 1,847 |
| 7 |
| | | | | | | | | | | | | | | | | | | | |
Total classified loans | |
| 3,023 |
| 10 | |
| 1,647 |
| 10 | |
| 5,234 |
| 14 | |
| 2,357 |
| 8 |
| | | | | | | | | | | | | | | | | | | | |
Real estate owned | |
| — |
| — | |
| — |
| — | |
| — |
| — | |
| — |
| — |
| | | | | | | | | | | | | | | | | | | | |
Total classified assets | | $ | 3,023 |
| 10 | | $ | 1,647 |
| 10 | | $ | 5,234 |
| 14 | | $ | 2,357 |
| 8 |
| | | | | | | | | | | | | | | | | | | | |
Total classified assets as a percentage of total assets | |
| 0.23 | % |
| |
| 0.14 | % |
| |
| 0.41 | % |
| |
| 0.18 | % |
|
5055
Loan Volume Activities
The following table is provided to discloseprovides details related to the volume of loans originated, purchasedloan originations, sales and soldprincipal payments for the quarters and nine months indicated:
| | | | | | | | | | | | | | | | | | | | | | | | |
| | For the Quarter Ended |
| For the Nine Months Ended | | For the Quarter Ended |
| For the Nine Months Ended | ||||||||||||||||
| | March 31, | | March 31, | | March 31, | | March 31, | ||||||||||||||||
(In Thousands) |
| 2023 |
| 2022 |
| 2023 |
| 2022 |
| 2024 |
| 2023 |
| 2024 |
| 2023 | ||||||||
Loans originated for sale: |
| |
|
| |
|
| |
|
| |
|
| |
|
| |
|
| |
|
| |
|
Wholesale originations | | $ | — | | $ | — | | $ | 512 | | $ | — | | $ | 378 | | $ | — | | $ | 4,448 | | $ | 512 |
Total loans originated for sale | | | — | | | — | | | 512 | | | — | | | 378 | | | — | | | 4,448 | | | 512 |
| | | | | | | | | | | | | | | | | | | | | | | | |
Loans sold: | | | | | | | | | | | | | | | | | | | | | | | | |
Servicing retained | | | — | | | — | | | (512) | | | — | | | (378) | | | — | | | (4,448) | | | (512) |
Total loans sold | | | — | | | — | | | (512) | | | — | | | (378) | | | — | | | (4,448) | | | (512) |
| | | | | | | | | | | | | | | | | | | | | | | | |
Loans originated for investment: |
| |
|
| |
|
| |
|
| |
|
| |
|
| |
|
| |
|
| |
|
Mortgage loans: |
| |
|
| |
|
| |
|
| |
|
| |
|
| |
|
| |
|
| |
|
Single-family | | | 39,543 | | | 48,624 | | | 153,671 | | | 128,764 | | | 8,946 | | | 39,543 | | | 30,058 | | | 153,671 |
Multi-family | |
| 10,660 | |
| 31,487 | |
| 43,519 | |
| 71,725 | |
| 5,865 | |
| 10,660 | |
| 17,586 | |
| 43,519 |
Commercial real estate | |
| 3,422 | |
| 7,011 | |
| 13,772 | |
| 11,216 | |
| 2,172 | |
| 3,422 | |
| 8,047 | |
| 13,772 |
Construction | |
| 260 | |
| 544 | |
| 1,648 | |
| 2,228 | |
| — | |
| 260 | |
| — | |
| 1,648 |
Commercial business loans | | | — | | | — | | | 190 | | | — | | | 1,250 | | | — | | | 1,250 | | | 190 |
Total loans originated for investment | |
| 53,885 | |
| 87,666 | |
| 212,800 | |
| 213,933 | |
| 18,233 | |
| 53,885 | |
| 56,941 | |
| 212,800 |
| | | | | | | | | | | | | | | | | | | | | | | | |
Loans purchased for investment | |
| | | | | | | | | | | ||||||||||||
Mortgage loans: | |
|
| |
|
| |
|
| |
|
| ||||||||||||
Single-family | |
| — | |
| 6,354 | |
| — | |
| 6,354 | ||||||||||||
Total loans purchased for investment | |
| — | |
| 6,354 | |
| — | |
| 6,354 | ||||||||||||
| | | | | | | | | | | | | ||||||||||||
Mortgage loan principal payments | |
| (17,458) | |
| (53,647) | |
| (77,184) | |
| (180,053) | ||||||||||||
Loan principal payments | |
| (28,513) | |
| (17,458) | |
| (69,276) | |
| (77,184) | ||||||||||||
Increase in other items, net⁽¹⁾ | |
| 940 | |
| 1,184 | |
| 2,096 | |
| 2,369 | |
| 276 | |
| 940 | |
| 467 | |
| 2,096 |
| | | | | | | | | | | | | | | | | | | | | | | | |
Net increase in loans held for investment | | $ | 37,367 | | $ | 41,557 | | $ | 137,712 | | $ | 42,603 | ||||||||||||
Net (decrease) increase in loans held for investment | | $ | (10,004) | | $ | 37,367 | | $ | (11,868) | | $ | 137,712 |
(1) | Includes net changes in undisbursed loan funds, deferred loan fees or costs, |
Liquidity and Capital Resources
The Corporation’s primary sources of funds are deposits, proceeds from principal and interest payments on loans and investment securities, proceeds from the maturity of loans and investment securities, FHLB – San Francisco advances, access to the discount window facility at the Federal Reserve BankFRB of San Francisco and access to a federal funds facility with its correspondent bank. While maturities and scheduled amortization of loans and investment securities are a relatively predictable source of funds, deposit flows and mortgage prepayments are greatly influenced by general interest rates, economic conditions and competition.
The primary investing activity of the Corporation is the origination and purchase of loans held for investment. During the first nine months of fiscal 20232024 and 2022,2023, the Corporation originated and purchased loans held for investment of $212.8$56.9 million and $220.3$212.8 million, respectively. At March 31, 2023,2024, the Corporation had loan origination commitments totaling $8.9$5.1 million, undisbursed lines of credit totaling $914,000$809,000 and undisbursed construction loan funds totaling $2.9 million.$586,000. The Corporation anticipates that it will have sufficient funds available to meet its current loan commitments. During the first nine months of fiscal 20232024 and 2022,2023, total loan repayments were $69.3 million and $77.2 million, and $180.1 million, respectively.
51
The Corporation’s primary financing activity is gathering deposits and, when needed, borrowings, principally FHLB – San Francisco advances. During the first nine months of fiscal 2023, the net increase in2024, total deposits was $27.5decreased $42.5 million, or threefour percent, to $908.1 million, due primarily to a decrease in transaction accounts, partly offset by an increase in time deposits. The time deposits (attributable toinclude brokered certificates of deposit), partly offset by a decrease in transaction accounts. Transaction account balances decreased $57.4deposit totaling $130.9 million or seven percent, to $777.0and $106.4 million at March 31, 2023 from $834.4 million at2024 and June 30, 2022 and time deposits increased $85.0 million, or 70 percent, to $206.1 million at March 31, 2023, from $121.1 million at June 30, 2022. The increase in time deposits was due to a $95.3 million increase in brokered certificates of deposit with a weighted average cost of 4.37 percent (including broker fees). Brokered certificates of deposit totaled $95.3 million at March 31, 2023.respectively. At March 31, 2023,2024, time deposits with a principal amount of $250,000 or less and scheduled
56
to mature in one year or less were $148.3$193.8 million and total time deposits with a principal amount of more than $250,000 and scheduled to mature in one year or less were $16.0$37.9 million. Historically, the Corporation has been able to retain a significant percentagemost of its time deposits as they mature.
The Corporation must maintain an adequate level of liquidity to ensure the availability of sufficient funds to support loan growth and deposit withdrawals, to satisfy financial commitments and to take advantage of investment opportunities. The Corporation maintains sufficient cash and cash equivalents to meet short-term liquidity needs. At March 31, 2023,2024, total cash and cash equivalents were $60.8$51.7 million, or fivefour percent of total assets. Depending on market conditions and the pricing of deposit products, and the FHLB – San Francisco advances, the Bank may rely on FHLB – San Francisco advances for part of its liquidity needs. As of March 31, 2023,2024, total borrowings were $205.0$235.0 million and the financing availability at the FHLB – San Francisco was limited to 3540 percent of total assets. As a result, the remaining borrowing capacity available was $228.6$269.2 million and the remaining available collateral was $420.7 million.$431.2 million at March 31, 2024. In addition, the Bank has secured a $135.8$172.7 million discount window facility at the Federal Reserve BankFRB of San Francisco, collateralized by investment securities and single-family fixed-rate loans with a fair market valuetotal balance of $93.3 million and investment securities with par value of $53.5$236.8 million. As of March 31, 2023,2024, the Bank also has a borrowing arrangement in the form of a federal funds facility with its correspondent bank for $50.0 million. The Bank had no advances under its discount window or correspondent bank facilityfacilities as of March 31, 2023.2024.
The Bank continues to work with both the FHLB - San Francisco and Federal Reserve BankFRB of San Francisco to ensure that borrowing capacity is continuously reviewed and updated in order to be accessed seamlessly should the need arise. This includes establishing accounts and pledging assets as needed in order to maximize borrowing capacity and liquidity. The total available borrowing capacity across all sources totaled approximately $491.9 million at March 31, 2024.
Regulations require thriftsthe Bank to maintain adequate liquidity to assure safe and sound operations. The Bank’s average liquidity ratio (defined as the ratio of average qualifying liquid assets to average deposits and borrowings) for the quarter ended March 31, 20232024 decreased slightly to 18.117.2 percent from 24.318.1 percent for the quarter ended June 30, 2022.2023.
During the first nine months of fiscalOn September 28, 2023, the Corporation purchased 251,221Board of Directors approved a new stock repurchase plan, authorizing up to 350,353 shares of the Corporation’s outstanding common stock under the April 2022 stock repurchase plan withto be purchased over a weighted average cost of $14.30 per share.one-year period. As of March 31, 2024, a total of 237,592 shares or 68 percent of authorized shares for repurchase under the September 2023 there are 113,038 sharesplan remain available forto purchase until the plan expires on AprilSeptember 28, 2023. Subsequent to March 31, 2023, the Board of Directors extended the April 2022 stock repurchase plan for a period of one year or until completed, whichever occurs first.2024. The Corporation purchases the shares from time to time in the open market or through privately negotiated transactions depending on market conditions, the capital requirements of the Corporation, and available cash that can be allocated to the stock repurchase program, among other considerations.
Provident Financial Holdings is a separate legal entity from the Bank and, on a stand-alone level, must provide for its own liquidity and pay its own operating expenses and cash dividends. Provident Financial Holdings’sHoldings’ primary sources of funds consist of capital raised through dividends or capital distributions from the Bank, although there are regulatory restrictions on the ability of the Bank to pay dividends. We currently expect to continue our current practice of paying quarterly cash dividends on our common stock subject to our Board of Directors’ discretion to modify or terminate this practice at any time and for any reason without prior notice. Our current quarterly common stock dividend rate is $0.14 per share, as approved by our Board of Directors, which we believe is a dividend rate per share which enables us to balance our multiple objectives of managing and investing in the Bank, and returning a portion of our cash to our shareholders. Assuming continued paymentcash dividend payments during 2023fiscal 2024 at this rate of $0.14 per share, our average total dividend paid each quarter would be approximately $1.0 million$965,000 based on the number of outstanding shares at March 31, 2023.2024. At March 31, 2023,2024, the Corporation (on an unconsolidated basis) had liquid assets of $6.0$5.2 million.
52
The Bank, as a federally-chartered, federally insured savings bank, is subject to the capital requirements established by the OCC. Under the OCC’s capital adequacy guidelines and the regulatory framework for prompt corrective action, the Bank must meet specific capital guidelines that involve quantitative measures of the Bank’s assets, liabilities and certain off-balance-sheet items as calculated under regulatory accounting practices. The Bank’s capital amounts and classification are also subject to qualitative judgments by the regulators about components, risk weighting and other factors.
At March 31, 2023,2024, the Bank exceeded all regulatory capital requirements. The Bank was categorized as "well-capitalized" at March 31, 20232024 under the regulations of the OCC. As a bank holding company registered with the Federal Reserve, Provident Financial Holdings, Inc. is also subject to the capital adequacy requirements of the Federal Reserve. For a bank holding company with less than $3.0 billion in assets, the capital guidelines apply on a bank only basis, and the Federal
57
Reserve expects the holding company’s subsidiary bank to be well capitalized under the prompt corrective action regulations.
The Bank’s actual and required minimum capital amounts and ratios at the dates indicated are as follows (dollars in thousands):
| | | | | | | | | | | | | | | | | | | | | | | | | | | | | | | | |
| | | | | | | Regulatory Requirements |
| | | | | | | Regulatory Requirements |
| ||||||||||||||||
| | | | | | | Minimum for Capital | | Minimum to Be |
| | | | | | | Minimum for Capital | | Minimum to Be |
| ||||||||||||
| | Actual | | Adequacy Purposes(1) | | Well Capitalized |
| | Actual | | Adequacy Purposes | | Well Capitalized |
| ||||||||||||||||||
|
| Amount |
| Ratio |
| Amount |
| Ratio |
| Amount |
| Ratio |
|
| Amount |
| Ratio |
| Amount |
| Ratio(1) |
| Amount |
| Ratio |
| ||||||
| | | | | | | | | | | | | | | | | | | | | | | | | | | | | | | | |
Provident Savings Bank, F.S.B.: |
| |
|
|
|
| |
|
|
|
| |
|
|
| |
| |
|
|
|
| |
|
|
|
| |
|
|
| |
| | | | | | | | | | | | | | | | | | | | | | | | | | | | | | | | |
As of March 31, 2023 |
| |
|
|
|
| |
|
|
|
| |
|
|
| | ||||||||||||||||
As of March 31, 2024 (2) |
| |
|
|
|
| |
|
|
|
| |
|
|
| | ||||||||||||||||
Tier 1 leverage capital (to adjusted average assets) | | $ | 123,456 |
| 9.59 | % | $ | 51,493 |
| 4.00 | % | $ | 64,366 |
| 5.00 | % | | $ | 124,350 |
| 9.70 | % | $ | 51,275 |
| 4.00 | % | $ | 64,094 |
| 5.00 | % |
CET1 capital (to risk-weighted assets) | | $ | 123,456 |
| 17.90 | % | $ | 48,279 |
| 7.00 | % | $ | 44,831 |
| 6.50 | % | | $ | 124,350 |
| 18.77 | % | $ | 46,368 |
| 7.00 | % | $ | 43,056 |
| 6.50 | % |
Tier 1 capital (to risk-weighted assets) | | $ | 123,456 |
| 17.90 | % | $ | 58,625 |
| 8.50 | % | $ | 55,176 |
| 8.00 | % | | $ | 124,350 |
| 18.77 | % | $ | 56,303 |
| 8.50 | % | $ | 52,992 |
| 8.00 | % |
Total capital (to risk-weighted assets) | | $ | 129,530 |
| 18.78 | % | $ | 72,419 |
| 10.50 | % | $ | 68,970 |
| 10.00 | % | | $ | 131,483 |
| 19.85 | % | $ | 69,551 |
| 10.50 | % | $ | 66,239 |
| 10.00 | % |
| | | | | | | | | | | | | | | | | | | | | | | | | | | | | | | | |
As of June 30, 2022 | |
|
|
|
| |
|
|
|
| |
|
|
|
| | ||||||||||||||||
As of June 30, 2023 | |
|
|
|
| |
|
|
|
| |
|
|
|
| | ||||||||||||||||
Tier 1 leverage capital (to adjusted average assets) | | $ | 124,871 |
| 10.47 | % | $ | 47,699 |
| 4.00 | % | $ | 59,624 |
| 5.00 | % | | $ | 125,979 |
| 9.59 | % | $ | 52,521 |
| 4.00 | % | $ | 65,651 |
| 5.00 | % |
CET1 capital (to risk-weighted assets) | | $ | 124,871 |
| 19.58 | % | $ | 44,653 |
| 7.00 | % | $ | 41,463 |
| 6.50 | % | | $ | 125,979 |
| 18.50 | % | $ | 47,674 |
| 7.00 | % | $ | 44,269 |
| 6.50 | % |
Tier 1 capital (to risk-weighted assets) | | $ | 124,871 |
| 19.58 | % | $ | 54,221 |
| 8.50 | % | $ | 51,032 |
| 8.00 | % | | $ | 125,979 |
| 18.50 | % | $ | 57,890 |
| 8.50 | % | $ | 54,485 |
| 8.00 | % |
Total capital (to risk-weighted assets) | | $ | 130,565 |
| 20.47 | % | $ | 66,979 |
| 10.50 | % | $ | 63,790 |
| 10.00 | % | | $ | 131,967 |
| 19.38 | % | $ | 71,511 |
| 10.50 | % | $ | 68,106 |
| 10.00 | % |
(1) | Inclusive of the conservation buffer of |
(2) | The Bank elected to recognize the full $824 thousand adjustment to retained earnings resulting from the adoption of CECL on July 1, 2023 instead of over the permitted three-year phase-in option. |
In addition to the minimum CET1, Tier 1 and Total capital ratios, the Bank must maintain a capital conservation buffer consisting of additional CET1 capital greater than 2.5% of risk-weighted assets above the required minimum levels in order to avoid limitations on paying dividends, engaging in share repurchases, and paying discretionary bonuses based on percentages of eligible retained income that could be utilized for such actions.
If the Bank does not have the ability to pay dividends to the Corporation, the Corporation may be limited in its ability to pay dividends to its stockholders. The Bank may not declare or pay a cash dividend if the effect thereofthereafter would cause its net worth to be reduced below the regulatory capital requirements imposed by federal regulation.
53
Supplemental Information
| | | | | | | | | | | | | | | | | ||
| | At | | At | | At | | At | | At | | At | ||||||
| | March 31, | | June 30, | | March 31, | | March 31, | | June 30, | | March 31, | ||||||
| | 2023 | | 2022 | | 2022 | | 2024 | | 2023 | | 2023 | ||||||
| | | | | | | | | | | | | | | | | ||
Loans serviced for others (in thousands) | | $ | 33,960 | | $ | 37,707 | | $ | 39,936 | | $ | 34,158 | | $ | 32,624 | | $ | 33,960 |
| | | | | | | | | | | | | | | | | ||
Book value per share | | $ | 18.40 | | $ | 17.66 | | $ | 17.43 | | $ | 18.78 | | $ | 18.41 | | $ | 18.40 |
ITEM 3 – Quantitative and Qualitative Disclosures about Market Risk.
One of the Corporation’s principal financial objectives is to achieve long-term profitability while reducing its exposure to fluctuating interest rates. The Corporation has sought to reduce the exposure of its earnings to changes in interest rates by
58
attempting to manage the repricing mismatch between interest-earning assets and interest-bearing liabilities. The principal element in achieving this objective is to increase the interest-rate sensitivity of the Corporation’s interest-earning assets by retaining for its portfolio new loan originations with interest rates subject to periodic adjustment to market conditions.
In addition, the Corporation maintains an investment portfolio, which is largely comprised of U.S. government sponsored enterprise MBS with contractual maturities of up to 30 years that reprice frequently or have a relatively short average life. The Corporation relies on retail deposits as its primary source of funds while utilizing FHLB – San Francisco advances and, from time to time, brokered certificates of deposit as a secondary source of funding. Management believes retail deposits, unlike brokered certificates of deposit, reduces the effects of interest rate fluctuations because they generally represent a more stable source of funds. As part of its interest rate risk management strategy, the Corporation promotes transaction accounts and time deposits with terms up to seven years.
Through the use ofUsing an internal interest rate risk model, the Corporation is able to analyze its interest rate risk exposure by measuring the change in net portfolio value (“NPV”) over a variety of interest rate scenarios. NPV is defined as the net present value of expected future cash flows from assets, liabilities and off-balance sheet contracts. The calculation is intended to illustrate the change in NPV that would occur in the event of an immediate change in interest rates of -300, -200, -100, +100, +200 and +300 basis points (“bp”) with no effectconsideration given to steps that management might take to counter the effect of the interest rate movement. As of March 31, 2023,2024, the targeted federal funds rate range was 4.75%5.25% to 5.00%5.50%.
The following table is derived from the internal interest rate risk model and represents the NPV based on the indicated changes in interest rates as of March 31, 20232024 (dollars in thousands).
| | | | | | | | | | | | | | | | | | | | | | | | | | | | |
|
| Net |
| | |
| Portfolio |
| NPV as Percentage |
| | |
| Net |
| | |
| Portfolio |
| NPV as Percentage |
| | | ||||
Basis Points ("bp") | | Portfolio | | NPV | | Value of | | of Portfolio Value | | Sensitivity | | | Portfolio | | NPV | | Value of | | of Portfolio Value | | Sensitivity | | ||||||
Change in Rates | | Value | | Change(1) | | Assets | | Assets(2) | | Measure(3) | | | Value | | Change(1) | | Assets | | Assets(2) | | Measure(3) | | ||||||
+300 bp | | $ | 181,212 | | $ | 32,135 | | $ | 1,381,130 |
| 13.12 | % | +214 | bp | | $ | 99,105 | | $ | (29,034) | | $ | 1,252,370 |
| 7.91 | % | -200 | bp |
+200 bp | | $ | 174,775 | | $ | 25,698 | | $ | 1,377,736 |
| 12.69 | % | +171 | bp | | $ | 114,837 | | $ | (13,302) | | $ | 1,271,821 |
| 9.03 | % | -88 | bp |
+100 bp | | $ | 166,056 | | $ | 16,979 | | $ | 1,372,118 |
| 12.10 | % | +112 | bp | | $ | 124,323 | | $ | (3,816) | | $ | 1,285,122 |
| 9.67 | % | -24 | bp |
- | | $ | 149,077 | | $ | — | | $ | 1,358,298 |
| 10.98 | % | — | | ||||||||||||||
Base Case | | $ | 128,139 | | $ | — | | $ | 1,292,763 |
| 9.91 | % | — | | ||||||||||||||
-100 bp | | $ | 135,058 | | $ | (14,019) | | $ | 1,346,639 |
| 10.03 | % | -95 | bp | | $ | 132,594 | | $ | 4,455 | | $ | 1,301,142 |
| 10.19 | % | 28 | bp |
-200 bp | | $ | 114,902 | | $ | (34,175) | | $ | 1,329,752 | | 8.64 | % | -234 | bp | | $ | 122,679 | | $ | (5,460) | | $ | 1,295,045 | | 9.47 | % | -44 | bp |
-300 bp | | $ | 121,145 | | $ | (27,932) | | $ | 1,339,271 | | 9.05 | % | -193 | bp | | $ | 124,017 | | $ | (4,122) | | $ | 1,300,636 | | 9.54 | % | -37 | bp |
(1) | Represents the increase (decrease) of the NPV at the indicated interest rate change |
(2) | Derived from the NPV divided by the portfolio value of |
(3) | Derived from the change in the NPV as a Percentage of Portfolio Value Assets from the base case ratio assuming the indicated change in interest rates (expressed in basis points). |
54
The following table is derived from the internal interest rate risk model and represents the change in the NPV at a -200+200 basis point rate shock at March 31, 20232024 and at a -100-200 basis point rate shock at June 30, 2022.2023, each of which scenarios were the lowest shock of plus or minus 200 basis point rate shocks.
| | | | | | | | | | | | | | |
|
| At March 31, 2023 |
| At June 30, 2022 |
|
| At March 31, 2024 |
| At June 30, 2023 |
| ||||
|
| (-200 bp rate shock) |
| (-100 bp rate shock) | |
| (+200 bp rate shock) |
| (-200 bp rate shock) | | ||||
Pre-Shock NPV Ratio: NPV as a % of PV Assets |
| 10.98 | % | | 8.87 | % | |
| 9.91 | % | | 9.29 | % | |
Post-Shock NPV Ratio: NPV as a % of PV Assets |
| 8.64 | % | | 8.54 | % | |
| 9.03 | % | | 8.37 | % | |
Sensitivity Measure: Change in NPV Ratio |
| -234 | bp |
| -33 | bp | |
| -88 | bp |
| -92 | bp | |
The pre-shock NPV ratio increased 21162 basis points to 10.989.91 percent at March 31, 20232024 from 8.879.29 percent at June 30, 20222023 and the post-shock NPV ratio increased 1066 basis points to 8.649.03 percent at March 31, 20232024 from 8.548.37 percent at June 30, 2022.2023. The increase of the pre-shock NPV ratiosratio was primarily attributable to the changes in market interest rates, the composition of the balance sheet and net income in the first nine months of fiscal 2023,2024, partly offset by a $9.5$7.0 million cash dividend distribution from the Bank to the CorporationProvident Financial Holdings in September 2022.2023 and an $824,000 decrease in stockholders’ equity resulting from the CECL adoption, the changes in market interest rates and the composition of the balance sheet.
59
As with any method of measuring interest rate risk, certain shortcomings are inherent in the method of analysis presented in the foregoing tables. For example, although certain assets and liabilities may have similar maturities or periods to repricing, they may react in different degrees to changes in market interest rates. Also, the interest rates on certain types of assets and liabilities may fluctuate in advance of changes in market interest rates, while interest rates on other types of assets and liabilities may lag behind changes in market interest rates. Additionally, certain assets, such as adjustable rate mortgage (“ARM”) loans, have features that restrict changes in interest rates on a short-term basis and over the life of the asset. Further, in the event of a change in interest rates, expected rates of prepayments on loans and early withdrawals from time deposits could likely deviate significantly from those assumedassumptions when calculating the results described in the tables above. It is also possible that, as a result of an interest rate increase, the higher mortgage payments required from ARM loans could result in an increase in delinquencies and defaults. Accordingly, the data presented in the tables in this section should not be relied upon as indicative of actual results in the event of changes in interest rates. Furthermore, the NPV presented in the foregoing tables is not intended to present the fair market value of the Corporation, nor does it represent amounts that would be available for distribution to shareholders in the event of the liquidation of the Corporation.
The Corporation measures and evaluates the potential effects of interest rate movements through an interest rate sensitivity "gap" analysis. Interest rate sensitivity reflects the potential effect on net interest income when there is movement in interest rates. For loans held for investment, investment securities, deposits and liabilitiesborrowings with contractual maturities, the table presents contractual repricing or scheduled maturity. For transaction accounts (checking, money market and savings deposits) that have no contractual maturity, the table presents estimated principal cash flows and, as applicable, the Corporation’s historical experience, management’s judgment and statistical analysis concerning their most likely withdrawal behaviors.
5560
The following table represents the interest rate gap analysis of the Corporation’s assets and liabilities as of March 31, 2023:2024:
| | | | | | | | | | | | | | | | | | | | | | | | | | | | | | | | |
| | Term to Contractual Repricing, Estimated Repricing, or Contractual |
| | Term to Contractual Repricing, Estimated Repricing, or Contractual |
| ||||||||||||||||||||||||||
| | Maturity(1) |
| | Maturity(1) |
| ||||||||||||||||||||||||||
| | As of March 31, 2023 |
| | As of March 31, 2024 |
| ||||||||||||||||||||||||||
|
| | |
| Greater than |
| Greater than |
| Greater than |
| | |
|
| | |
| Greater than |
| Greater than |
| Greater than |
| | |
| ||||||
| | 12 months or | | 1 year to 3 | | 3 years to | | 5 years or | | | |
| | 12 months or | | 1 year to 3 | | 3 years to | | 5 years or | | | |
| ||||||||
(Dollars In Thousands) | | less |
| years |
| 5 years |
| non-sensitive | | Total | | | less |
| years |
| 5 years |
| non-sensitive | | Total | | ||||||||||
| | | | | | | | | | | | | | | | | | | | | | | | | | | | | | | | |
Repricing Assets: |
| |
|
| |
|
| |
|
| |
|
| |
| |
| |
|
| |
|
| |
|
| |
|
| |
| |
Cash and cash equivalents | | $ | 54,398 | | $ | — | | $ | — | | $ | 6,373 | | $ | 60,771 | | | $ | 44,648 | | $ | — | | $ | — | | $ | 7,083 | | $ | 51,731 | |
Investment securities | |
| 8,985 | |
| — | |
| — | |
| 154,602 | |
| 163,587 | | |
| 7,552 | |
| — | |
| — | |
| 130,354 | |
| 137,906 | |
Loans held for investment | |
| 243,680 | |
| 164,107 | |
| 240,438 | |
| 429,479 | |
| 1,077,704 | | |
| 274,055 | |
| 195,507 | |
| 240,686 | |
| 355,513 | |
| 1,065,761 | |
FHLB - San Francisco stock | |
| 8,239 | |
| — | |
| — | |
| — | |
| 8,239 | | |
| 9,505 | |
| — | |
| — | |
| — | |
| 9,505 | |
Other assets | |
| 3,610 | |
| — | |
| — | |
| 21,369 | |
| 24,979 | | |
| 4,249 | |
| — | |
| — | |
| 20,895 | |
| 25,144 | |
Total assets | |
| 318,912 | |
| 164,107 | |
| 240,438 | |
| 611,823 | |
| 1,335,280 | | | $ | 340,009 | | $ | 195,507 | | $ | 240,686 | | $ | 513,845 | | $ | 1,290,047 | |
| | | | | | | | | | | | | | | | | | | | | | | | | | | | | | | | |
Repricing Liabilities and Equity: | |
|
| |
|
| |
|
| |
|
| |
|
| | |
|
| |
|
| |
|
| |
|
| |
|
| |
Checking deposits - non interest-bearing | |
| — | |
| — | |
| — | |
| 108,479 | |
| 108,479 | | ||||||||||||||||
Checking deposits - noninterest-bearing | | $ | — | | $ | — | | $ | — | | $ | 91,708 | | $ | 91,708 | | ||||||||||||||||
Checking deposits - interest bearing | |
| 48,762 | |
| 97,523 | |
| 97,523 | |
| 81,269 | |
| 325,077 | | |
| 41,388 | |
| 82,776 | |
| 82,776 | |
| 68,980 | |
| 275,920 | |
Savings deposits | |
| 61,081 | |
| 122,161 | |
| 122,161 | |
| — | |
| 305,403 | | |
| 49,569 | |
| 99,139 | |
| 99,139 | |
| — | |
| 247,847 | |
Money market deposits | |
| 19,009 | |
| 19,009 | |
| — | |
| — | |
| 38,018 | | |
| 13,358 | |
| 13,357 | |
| — | |
| — | |
| 26,715 | |
Time deposits | |
| 164,345 | |
| 33,171 | |
| 6,605 | |
| 1,948 | |
| 206,069 | | |
| 231,622 | |
| 29,493 | |
| 3,680 | |
| 1,137 | |
| 265,932 | |
Borrowings | |
| 150,010 | |
| 55,000 | |
| — | |
| — | |
| 205,010 | | |
| 162,500 | |
| 57,500 | |
| 15,000 | |
| — | |
| 235,000 | |
Other liabilities | |
| 1,115 | |
| — | |
| — | |
| 16,703 | |
| 17,818 | | |
| 2,118 | |
| — | |
| — | |
| 15,301 | |
| 17,419 | |
Stockholders' equity | |
| — | |
| — | |
| — | |
| 129,406 | |
| 129,406 | | |
| — | |
| — | |
| — | |
| 129,506 | |
| 129,506 | |
Total liabilities and stockholders' equity | |
| 444,322 | |
| 326,864 | |
| 226,289 | |
| 337,805 | |
| 1,335,280 | | | $ | 500,555 | | $ | 282,265 | | $ | 200,595 | | $ | 306,632 | | $ | 1,290,047 | |
| | | | | | | | | | | | | | | | | | | | | | | | | | | | | | | | |
Repricing gap positive (negative) | | $ | (125,410) | | $ | (162,757) | | $ | 14,149 | | $ | 274,018 | | $ | — | | ||||||||||||||||
Repricing gap (negative) positive | | $ | (160,546) | | $ | (86,758) | | $ | 40,091 | | $ | 207,213 | | $ | — | | ||||||||||||||||
Cumulative repricing gap: | |
|
| |
|
| |
|
| |
|
| |
|
| | |
|
| |
|
| |
|
| |
|
| |
|
| |
Dollar amount | | $ | (125,410) | | $ | (288,167) | | $ | (274,018) | | $ | — | | $ | — | | | $ | (160,546) | | $ | (247,304) | | $ | (207,213) | | $ | — | | $ | — | |
Percent of total assets | |
| (9) | % |
| (22) | % |
| (21) | % |
| — | % |
| — | % | |
| (12) | % |
| (19) | % |
| (16) | % |
| — | % |
| — | % |
(1) | Cash and cash equivalents are presented as estimated repricing; investment securities and loans held for investment are presented as contractual maturities or contractual repricing (without consideration for prepayments); FHLB - San Francisco stock is presented as contractual repricing; transaction accounts (checking, savings and money market deposits) are presented as estimated repricing; while time deposits (without consideration for early withdrawals) and borrowings are presented as contractual maturities. |
The static gap analysis shows a negative position in the 12under “12 months or less and Greaterless” duration, “Greater than 1 year to 3 years” duration and “Greater than 3 years "cumulativeto 5 years” duration show negative positions in the "Cumulative repricing gap - dollar amount" categories,category, indicating more liabilities are sensitive to repricing than assets.assets in the short and intermediate terms. Management views non interest-bearing checkingnoninterest-bearing deposits to be the least sensitive to changes in market interest rates and these accounts are therefore characterized as long-term funding. Interest-bearing checking deposits are considered more sensitive, followed by increased sensitivity for savings and money market deposits. For the purpose of calculating gap, a portion of these interest-bearing deposit balances are assumed to be subject to estimated repricing as follows: interest-bearing checking deposits at 15% per year, savings deposits at 20% per year and money market deposits at 50% in the first and second years.
The gap results presented above could vary substantially if different assumptions are used or if actual experience differs from the assumptions used in the preparation of the gap analysis. Furthermore, the gap analysis provides a static view of
5661
interest rate risk exposure at a specific point in time without taking into account redirection of cash flowsflow activity and deposit fluctuations.
The extent to which the net interest margin will be impacted by changes in prevailing interest rates will depend on a number of factors, including how quickly interest-earning assets and interest-bearing liabilities react to interest rate changes. It is not uncommon for rates on certain assets or liabilities to lag behind changes in the market rates of interest.interest rates. Additionally, prepayments of loans and early withdrawals of time deposits could cause interest sensitivities to vary. As a result, the relationship between interest-earning assets and interest-bearing liabilities, as shown in the previous table, is only a general indicator of interest rate sensitivity and the effect of changing interest rates of interest on net interest income is likely to be different from that predicted solely on the basis of the interest rate sensitivity analysis set forth in the previous table.
The Corporation also models the sensitivity of net interest income for the 12-month period subsequent to any given month-end assuming a dynamic balance sheet accounting for, among other items:
● | The Corporation’s current balance sheet and repricing characteristics; |
● |
● | Current interest rates and yield curves and management estimates of projected interest rates; |
● | Embedded options, interest rate floors, periodic caps and lifetime caps; |
● | Repricing characteristics for market rate sensitive instruments; |
● | Loan, investment securities, deposit and borrowing cash flows; |
● | Loan prepayment estimates for each type of loan; and |
● | Immediate, permanent and parallel movements in interest rates of |
The following table describes the results of the sensitivity of the net interest income analysis at March 31, 20232024 and June 30, 2022.2023.
| | | | | | | | | | | | | | |
At March 31, 2023 | | At June 30, 2022 |
| |||||||||||
At March 31, 2024 | At March 31, 2024 | | At June 30, 2023 |
| ||||||||||
Basis Point (bp) | | Change in | | Basis Point (bp) | | Change in |
| | Change in | | Basis Point (bp) | | Change in |
|
Change in Rates | | Net Interest Income | | Change in Rates | | Net Interest Income |
| | Net Interest Income | | Change in Rates | | Net Interest Income |
|
+300 bp |
| -1.16% | | +300 bp |
| 3.32% | |
| -5.84% | | +300 bp |
| -10.56% | |
+200 bp |
| -0.77% | | +200 bp |
| 2.14% | |
| -2.33% | | +200 bp |
| -5.26% | |
+100 bp |
| -0.31% | | +100 bp |
| 1.05% | |
| -0.22% | | +100 bp |
| -1.95% | |
-100 bp |
| -0.89% | | -100 bp |
| -0.09% | |
| -2.18% | | -100 bp |
| 1.25% | |
-200 bp |
| -2.11% | | -200 bp |
| -3.28% | |
| -5.88% | | -200 bp |
| -0.59% | |
-300 bp |
| -4.80% | | -300 bp |
| -7.71% | |
| -10.08% | | -300 bp |
| -3.33% | |
At March 31, 2023,2024, the Corporation was close to a neutral position as its interest-bearing liabilities and interest-earning assets are expected to slightlyreprice similarly during the subsequent 12-month period. Therefore, in a rising or falling interest rate environment, the model projects a slight decrease in net interest income over the subsequent 12-month period for all scenarios.
At June 30, 2023, the Corporation was liability sensitive as its interest-bearing liabilities at this date arewere expected to reprice more quickly than its interest-earning assets during the subsequent 12-month period. Therefore, in a rising interest rate environment, the model projects a slight decrease in net interest income over the subsequent 12-month period. In a falling interest rate environment, the results also project a slight decrease in net interest income over the subsequent 12-month period.
At June 30, 2022, the Corporation was asset sensitive as its interest-earning assets at this date were expected to reprice more quickly than its interest-bearing liabilities during the subsequent 12 month period. Therefore, in a rising interest rate environment, the model projected an increase in net interest income over the subsequent 12 month period. In a falling interest rate environment,12-month period at the results projected-100 basis point scenario and a decrease in net interest income over the subsequent 12-month period.period for the -200 and -300 basis point scenarios.
Management believes that the assumptions used to complete the analysis described in the table above are reasonable. However, past experience has shown that immediate, permanent and parallel movements in interest rates will not necessarily occur. Additionally, while the analysis provides a tool to evaluate the projected net interest income to changes in interest rates, actual results may be substantially different if actual experience differs from the assumptions used to complete the analysis, particularly with respect to the 12-month business plan when asset growth is forecast. Therefore,
5762
the model results that the Corporation discloses should be thought of as a risk management tool to compare the trends of the Corporation’s current disclosure to previous disclosures, over time, within the context of the actual performance of the treasury yield curve.
ITEM 4 – Controls and Procedures.
(a) An evaluation of the Corporation’s disclosure controls and procedures (as defined in Section 13a-15(e) or 15d-15(e) of the Securities Exchange Act of 1934 (the “Act”)) was carried out under the supervision and with the participation of the Corporation’s Chief Executive Officer (principal executive officer), Chief Financial Officer (principal financial and accounting officer) and the Corporation’s Disclosure Committee as of the end of the period covered by this quarterly report. In designing and evaluating the Corporation’s disclosure controls and procedures, management recognizes that disclosure controls and procedures, no matter how well conceived and operated, can provide only reasonable, not absolute, assurance that the objectives of the disclosure controls and procedures are met. Also, because of the inherent limitations in all control procedures, no evaluation of controls can provide absolute assurance that all control issues and instances of fraud, if any, within the Corporation have been detected. Additionally, in designing disclosure controls and procedures, management necessarily was required to apply its judgment in evaluating the cost-benefit relationship of possible disclosure controls and procedures. The design of any disclosure controls and procedures is also based in part upon certain assumptions about the likelihood of future events, and there can be no assurance that any design will succeed in achieving its stated goals under all potential future conditions. Based on their evaluation, the Corporation’s Chief Executive Officer and Chief Financial Officer concluded that the Corporation’s disclosure controls and procedures as of March 31, 20232024 were effective, at the reasonable assurance level, in ensuring that the information required to be disclosed by the Corporation in the reports it files or submits under the Act is (i) accumulated and communicated to the Corporation’s management (including the Chief Executive Officer and Chief Financial Officer) in a timely manner, and (ii) recorded, processed, summarized and reported within the time periods specified in the SEC’s rules and forms.
(b) There have been no changes in the Corporation’s internal control over financial reporting (as defined in Rule 13a-15(f) of the Act) that occurred during the quarter ended March 31, 2023,2024, that has materially affected, or is reasonably likely to materially affect, the Corporation’s internal control over financial reporting. The Corporation does not expect that its internal control over financial reporting will prevent all error and all fraud. A control procedure, no matter how well conceived and operated, can provide only reasonable, not absolute, assurance that the objectives of the control procedure are met. Because of the inherent limitations in all control procedures, no evaluation of controls can provide absolute assurance that all control issues and instances of fraud, if any, within the Corporation have been detected. These inherent limitations include the realities that judgments in decision-making can be faulty, and that breakdowns can occur because of simple error or mistake. Additionally, controls can be circumvented by the individual acts of some persons, by collusion of two or more people, or by management override of the control. The design of any control procedure is also based in part upon certain assumptions about the likelihood of future events, and there can be no assurance that any design will succeed in achieving its stated goals under all potential future conditions; over time, controls may become inadequate because of changes in conditions, or the degree of compliance with the policies or procedures may deteriorate. Because of the inherent limitations in a cost-effective control procedure, misstatements due to error or fraud may occur and not be detected.
PART II – OTHER INFORMATION
Item 1. Legal Proceedings.
Periodically, there have been various claims and lawsuits involving the Corporation, such as claims to enforce liens, condemnation proceedings on properties in which the Corporation holds security interests, claims involving the making and servicing of real property loans, employment matters and other issues in the ordinary course of and incidental to the Corporation’s business. These proceedings and the associated legal claims are often contested and the outcome of individual matters is not always predictable. Additionally, in some actions, it is difficult to assess potential exposure because the Corporation is still in the early stages of the litigation. The Corporation is not a party to any pending legal proceedings that it believes would have a material adverse effect on its financial condition, operations or cash flows.
5863
Item 1A. Risk Factors.
There have been no material changes in the risk factors previously disclosed in Part I, Item 1A of the Corporation’s 20222023 Annual Form 10-K.
Item 2. Unregistered Sales of Equity Securities and Use of Proceeds.
(a) | Not applicable. |
(b) | Not applicable. |
(c) | The table below represents the Corporation’s purchases of its equity securities for the third quarter of fiscal |
| | | | | | | | | | | | | | | | | | | | |
|
| |
| | |
| |
| Maximum |
|
| |
| | |
| |
| Maximum |
|
| | | | | | | Total Number of | | Number of Shares |
| | | | | | | Total Number of | | Number of Shares |
|
| | | | | | | Shares Purchased as | | that May Yet Be |
| | | | | | | Shares Purchased as | | that May Yet Be |
|
| | Total Number of | | Average Price | | Part of Publicly | | Purchased Under |
| | Total Number of | | Average Price | | Part of Publicly | | Purchased Under |
| ||
Period | | Shares Purchased | | Paid per Share | | Announced Plan | | the Plan(1) |
| | Shares Purchased | | Paid per Share | | Announced Plan | | the Plan(1) |
| ||
January 1, 2023 – January 31, 2023 |
| 35,000 | | $ | 14.17 |
| 35,000 |
| 176,345 |
| ||||||||||
February 1, 2023 – February 28, 2023 |
| 27,945 | | $ | 14.41 |
| 27,945 |
| 148,400 |
| ||||||||||
March 1, 2023 – March 31, 2023 |
| 35,362 | | $ | 14.05 |
| 35,362 |
| 113,038 |
| ||||||||||
January 1, 2024 – January 31, 2024 |
| 19,652 | | $ | 13.50 |
| 19,652 |
| 267,991 |
| ||||||||||
February 1, 2024 – February 29, 2024 |
| 15,948 | | $ | 14.63 |
| 15,948 |
| 252,043 |
| ||||||||||
March 1, 2024 – March 31, 2024 |
| 14,451 | | $ | 13.94 |
| 14,451 |
| 237,592 | | ||||||||||
Total |
| 98,307 | | $ | 14.20 |
| 98,307 |
| 113,038 |
|
| 50,051 | | $ | 13.99 |
| 50,051 |
| 237,592 | (2) |
(1) | On September 28, 2023, the Board approved a new stock repurchase plan, authorizing the purchase of up to 350,353 shares of the Corporation’s outstanding common stock over a one-year period. Simultaneously, the Board canceled the remaining 25,428 shares available for purchase under the prior repurchase plan. The Corporation may purchase the shares from time to time in the open market or through privately negotiated transactions depending on market conditions, the capital requirements of the Corporation, and available cash that can be allocated to the stock repurchase program, among other considerations. The September 2023 stock repurchase plan terminates on September 28, 2024, unless completed sooner. |
(2) | Represents the shares available for future purchase under the September 2023 stock repurchase plan. |
On April 28, 2022, the Board of Directors of the Corporation announced the repurchase of up to five percent of the Corporation’s common stock, approximately 364,259 shares. The April 2022 stock repurchase plan will continue for a period of one year or until completed, whichever occurs first.
Item 3. Defaults Upon Senior Securities.
Not applicable.
Item 4. Mine Safety Disclosures.
Not applicable.
Item 5. Other Information.
(a) | Not applicable. |
Not applicable.
(b) | Not applicable. |
(c) | Trading Plans. During the quarter ended March 31, 2024, no director or officer (as defined in Rule 16a-1(f) under the Exchange Act) of the Corporation adopted or terminated a “Rule 10b5-1 trading arrangement” or “non-Rule 10b5-1 trading arrangement,” as each term is defined in Item 408(a) of Regulation S-K. |
5964
Item 6. Exhibits.
Exhibits:
| | |
3.1 |
| |
| | |
3.2 | | |
| | |
4.1 | | Form of Certificate of Provident’s Common Stock (incorporated by reference to the Corporation’s Registration Statement on Form S-1 (333-2230) filed on March 11, 1996) |
| | |
| | |
| | |
| | |
| | |
| | |
|
|
|
|
| |
| | |
31.1 | | Certification of Chief Executive Officer Pursuant to Section 302 of the Sarbanes-Oxley Act of 2002 |
| | |
31.2 | | Certification of Chief Financial Officer Pursuant to Section 302 of the Sarbanes-Oxley Act of 2002 |
| | |
32.1 | | Certification of Chief Executive Officer Pursuant to Section 906 of the Sarbanes-Oxley Act of 2002 |
| | |
32.2 | | Certification of Chief Financial Officer Pursuant to Section 906 of the Sarbanes-Oxley Act of 2002 |
| | |
101 | | The following materials from the Corporation’s Quarterly Report on Form 10-Q for the quarter ended March 31, |
| | |
104 | | Cover Page Interactive Data File (formatted in Inline XBRL and contained in Exhibit 101) |
6065
SIGNATURES
Pursuant to the requirements of Section 13 or 15(d) of the Securities Exchange Act of 1934, the registrant has duly caused this report to be signed on its behalf by the undersigned thereunto duly authorized.
| |
| Provident Financial Holdings, Inc. |
| |
| |
| |
Date: May | /s/ |
|
|
|
(Principal Executive Officer) |
| |
| |
| |
Date: May | /s/ |
|
|
| Senior Vice President Chief Financial Officer (Principal Financial and Accounting Officer) |
6166