UNITED STATES SECURITIES AND EXCHANGE COMMISSION
Washington, D.C. 20549
FORM 10-Q
(Mark One)
þ Quarterly report pursuant to Section 13 or 15(d) of the Securities Exchange Act of 1934
For the quarterly period ended March 31,June 30, 2016
OR
o Transition report pursuant to Section 13 or 15(d) of the Securities Exchange Act of 1934
For the transition period from _______ to ________
Commission file number: 001-12935
DENBURY RESOURCES INC.
(Exact name of registrant as specified in its charter)
|
| | |
| Delaware | | 20-0467835 |
(State or other jurisdiction of incorporation or organization) | | (I.R.S. Employer Identification No.) |
| | | |
5320 Legacy Drive, Plano, TX | | 75024 |
| (Address of principal executive offices) | | (Zip Code) |
|
| | |
| Registrant’s telephone number, including area code: | | (972) 673-2000 |
Not applicable
(Former name, former address and former fiscal year, if changed since last report)
Indicate by check mark whether the registrant: (1) has filed all reports required to be filed by Section 13 or 15(d) of the Securities Exchange Act of 1934 during the preceding 12 months (or for such shorter period that the registrant was required to file such reports), and (2) has been subject to such filing requirements for the past 90 days. Yes þ No o
Indicate by check mark whether the registrant has submitted electronically and posted on its corporate Web site, if any, every Interactive Data File required to be submitted and posted pursuant to Rule 405 of Regulation S-T during the preceding 12 months (or for such shorter period that the registrant was required to submit and post such files). Yes þ No o
Indicate by check mark whether the registrant is a large accelerated filer, an accelerated filer, a non-accelerated filer, or a smaller reporting company. See the definitions of “large accelerated filer,” “accelerated filer” and “smaller reporting company” in Rule 12b-2 of the Exchange Act. (Check one):
|
| | | |
Large accelerated filer þ | Accelerated filer o | Non-accelerated filer o | Smaller reporting company o |
| | | (Do not check if a smaller reporting company) | |
Indicate by check mark whether the registrant is a shell company (as defined in Rule 12b-2 of the Exchange Act). Yes o No þ
Indicate the number of shares outstanding of each of the issuer’s classes of common stock, as of the latest practicable date.
|
| | |
| | | |
| Class | | Outstanding at April 30,July 31, 2016 |
| Common Stock, $.001 par value | | 350,593,956398,326,717 |
Table of Contents
PART I. FINANCIAL INFORMATION
Item 1. Financial Statements
Denbury Resources Inc.
Unaudited Condensed Consolidated Balance Sheets
(In thousands, except par value and share data)
| | | | | March 31, | | December 31, | | June 30, | | December 31, |
| | | 2016 | | 2015 | | 2016 | | 2015 |
Assets | | Current assets | | | | | | | | |
| Cash and cash equivalents | | $ | 8,252 |
|
| $ | 2,812 |
| | $ | 2,545 |
|
| $ | 2,812 |
|
| Accrued production receivable | | 95,934 |
|
| 100,413 |
| | 120,473 |
|
| 100,413 |
|
| Trade and other receivables, net | | 87,228 |
|
| 87,924 |
| | 70,700 |
|
| 87,093 |
|
| Derivative assets | | 72,798 |
|
| 142,846 |
| | 4,699 |
|
| 142,846 |
|
| Other current assets | | 8,763 |
|
| 10,005 |
| | 14,402 |
|
| 10,005 |
|
| Total current assets | | 272,975 |
|
| 344,000 |
| | 212,819 |
|
| 343,169 |
|
| Property and equipment | | |
|
| |
| | |
|
| |
|
| Oil and natural gas properties (using full cost accounting) | | |
|
| |
| | |
|
| |
|
| Proved properties | | 10,296,792 |
|
| 10,245,195 |
| | 10,346,027 |
|
| 10,245,195 |
|
| Unevaluated properties | | 902,990 |
|
| 894,948 |
| | 909,310 |
|
| 894,948 |
|
CO2 properties | | 1,186,607 |
|
| 1,187,458 |
| | 1,186,596 |
|
| 1,187,458 |
|
| Pipelines and plants | | 2,293,102 |
|
| 2,293,219 |
| | 2,294,295 |
|
| 2,293,219 |
|
| Other property and equipment | | 405,039 |
|
| 408,194 |
| | 399,880 |
|
| 408,194 |
|
| Less accumulated depletion, depreciation, amortization and impairment | | (9,982,733 | ) |
| (9,653,205 | ) | | (10,521,061 | ) |
| (9,653,205 | ) |
| Net property and equipment | | 5,101,797 |
|
| 5,375,809 |
| | 4,615,047 |
|
| 5,375,809 |
|
| Derivative assets | |
| 31 |
| | — |
|
| Other assets | | 163,775 |
| | 166,555 |
| | 162,076 |
| | 166,555 |
|
| Total assets | | $ | 5,538,547 |
| | $ | 5,886,364 |
| | $ | 4,989,973 |
| | $ | 5,885,533 |
|
Liabilities and Stockholders’ Equity | | Current liabilities | | |
| | |
| | |
| | |
|
| Accounts payable and accrued liabilities | | $ | 186,715 |
| | $ | 253,197 |
| | $ | 162,334 |
|
| $ | 253,197 |
|
| Oil and gas production payable | | 79,765 |
| | 87,337 |
| | 83,713 |
|
| 87,337 |
|
| Derivative liabilities | | 25,005 |
| | — |
| | 107,105 |
|
| — |
|
| Current maturities of long-term debt | | 32,917 |
| | 32,481 |
| | 83,762 |
|
| 32,481 |
|
| Total current liabilities | | 324,402 |
| | 373,015 |
| | 436,914 |
|
| 373,015 |
|
| Long-term liabilities | | |
| | |
| | |
| | |
|
| Long-term debt, net of current portion | | 3,222,497 |
| | 3,245,114 |
| | 2,998,268 |
|
| 3,245,114 |
|
| Asset retirement obligations | | 142,101 |
| | 138,919 |
| | 143,981 |
|
| 138,919 |
|
| Derivative liabilities | | | 67 |
| | — |
|
| Deferred tax liabilities, net | | 742,148 |
| | 837,263 |
| | 519,207 |
|
| 852,089 |
|
| Other liabilities | | 26,121 |
| | 27,484 |
| | 26,232 |
|
| 27,484 |
|
| Total long-term liabilities | | 4,132,867 |
| | 4,248,780 |
| | 3,687,755 |
|
| 4,263,606 |
|
| Commitments and contingencies (Note 7) | |
|
| |
|
| |
|
| |
|
|
| Stockholders’ equity | | | | | | | | |
| Preferred stock, $.001 par value, 25,000,000 shares authorized, none issued and outstanding | | — |
| | — |
| | — |
|
| — |
|
| Common stock, $.001 par value, 600,000,000 shares authorized; 354,340,533 and 354,541,626 shares issued, respectively | | 354 |
| | 355 |
| |
| Common stock, $.001 par value, 600,000,000 shares authorized; 395,347,234 and 354,541,626 shares issued, respectively | | | 395 |
|
| 355 |
|
| Paid-in capital in excess of par | | 2,356,069 |
| | 2,353,134 |
| | 2,520,760 |
|
| 2,353,549 |
|
| Accumulated deficit | | (1,228,039 | ) | | (1,042,882 | ) | | (1,608,701 | ) |
| (1,058,954 | ) |
| Treasury stock, at cost, 3,734,768 and 3,124,311 shares, respectively | | (47,106 | ) | | (46,038 | ) | |
| Treasury stock, at cost, 3,745,901 and 3,124,311 shares, respectively | | | (47,150 | ) |
| (46,038 | ) |
Total stockholders’ equity | | 1,081,278 |
| | 1,264,569 |
| | 865,304 |
|
| 1,248,912 |
|
| Total liabilities and stockholders’ equity | | $ | 5,538,547 |
| | $ | 5,886,364 |
| | $ | 4,989,973 |
|
| $ | 5,885,533 |
|
See accompanying Notes to Unaudited Condensed Consolidated Financial Statements.
Denbury Resources Inc.
Unaudited Condensed Consolidated Statements of Operations
(In thousands, except per share data)
| | | | | Three Months Ended March 31, | | Three Months Ended June 30, | | Six Months Ended June 30, |
| | | 2016 | | 2015 | | 2016 | | 2015 | | 2016 | | 2015 |
| Revenues and other income | | | | | | | | | | | | |
| Oil, natural gas, and related product sales | | $ | 187,803 |
| | $ | 297,470 |
| | $ | 246,668 |
| | $ | 366,891 |
| | $ | 434,471 |
| | $ | 664,361 |
|
CO2 sales and transportation fees | | 6,272 |
| | 6,972 |
| | 6,622 |
| | 7,152 |
| | 12,894 |
| | 14,124 |
|
| Interest income and other income | | 769 |
| | 3,207 |
| | 1,858 |
| | 2,651 |
| | 2,627 |
| | 5,858 |
|
| Total revenues and other income | | 194,844 |
| | 307,649 |
| | 255,148 |
| | 376,694 |
| | 449,992 |
| | 684,343 |
|
| Expenses | | |
| | |
| | |
| | |
| | |
| | |
|
| Lease operating expenses | | 102,447 |
| | 141,084 |
| | 100,019 |
| | 132,170 |
| | 202,466 |
| | 273,254 |
|
| Marketing and plant operating expenses | | 13,194 |
| | 11,685 |
| | 12,999 |
| | 14,215 |
| | 26,193 |
| | 25,900 |
|
CO2 discovery and operating expenses | | 607 |
| | 947 |
| | 1,071 |
| | 945 |
| | 1,678 |
| | 1,892 |
|
| Taxes other than income | | 20,092 |
| | 26,679 |
| | 19,504 |
| | 33,555 |
| | 39,596 |
| | 60,234 |
|
| General and administrative expenses | | 33,901 |
| | 46,280 |
| | 22,545 |
| | 37,947 |
| | 56,446 |
| | 84,227 |
|
| Interest, net of amounts capitalized of $5,780 and $8,409, respectively | | 42,171 |
| | 40,099 |
| |
| Interest, net of amounts capitalized of $6,289, $8,738, $12,069, and $17,147, respectively | | | 36,058 |
| | 39,863 |
| | 78,229 |
| | 79,962 |
|
| Depletion, depreciation, and amortization | | 77,366 |
| | 149,958 |
| | 66,541 |
| | 147,940 |
| | 143,907 |
| | 297,898 |
|
| Commodity derivatives expense (income) | | 22,826 |
| | (83,076 | ) | | 98,209 |
| | 48,926 |
| | 121,035 |
| | (34,150 | ) |
| Gain on debt extinguishment | | (94,991 | ) | | — |
| | (12,278 | ) | | — |
| | (107,269 | ) | | — |
|
| Write-down of oil and natural gas properties | | 256,000 |
| | 146,200 |
| | 479,400 |
| | 1,705,800 |
| | 735,400 |
| | 1,852,000 |
|
| Other expenses | | 1,544 |
| | — |
| | 34,688 |
| | — |
| | 36,232 |
| | — |
|
| Total expenses | | 475,157 |
| | 479,856 |
| | 858,756 |
| | 2,161,361 |
| | 1,333,913 |
| | 2,641,217 |
|
| Loss before income taxes | | (280,313 | ) | | (172,207 | ) | | (603,608 | ) | | (1,784,667 | ) | | (883,921 | ) | | (1,956,874 | ) |
| Income tax benefit | | (95,120 | ) | | (64,461 | ) | | (222,940 | ) | | (636,168 | ) | | (318,060 | ) | | (700,629 | ) |
| Net loss | | $ | (185,193 | ) | | $ | (107,746 | ) | | $ | (380,668 | ) | | $ | (1,148,499 | ) | | $ | (565,861 | ) | | $ | (1,256,245 | ) |
| | | | | | |
|
| | | | | | |
| Net loss per common share | | | | | |
|
| | | | | | |
| Basic | | $ | (0.53 | ) | | $ | (0.31 | ) | | $ | (1.03 | ) | | $ | (3.28 | ) | | $ | (1.58 | ) | | $ | (3.59 | ) |
| Diluted | | $ | (0.53 | ) | | $ | (0.31 | ) | | $ | (1.03 | ) | | $ | (3.28 | ) | | $ | (1.58 | ) | | $ | (3.59 | ) |
| |
|
| |
|
| |
|
| | | | | | |
| Dividends declared per common share | | $ | — |
| | $ | 0.0625 |
| | $ | — |
| | $ | 0.0625 |
| | $ | — |
| | $ | 0.1250 |
|
| |
|
| |
|
| |
|
| |
|
| | | | |
| Weighted average common shares outstanding | | |
| | |
| | |
| | |
| | |
| | |
|
| Basic | | 347,235 |
| | 350,688 |
| | 370,566 |
| | 350,039 |
| | 358,901 |
| | 349,653 |
|
| Diluted | | 347,235 |
| | 350,688 |
| | 370,566 |
| | 350,039 |
| | 358,901 |
| | 349,653 |
|
See accompanying Notes to Unaudited Condensed Consolidated Financial Statements.
Denbury Resources Inc.
Unaudited Condensed Consolidated Statements of Comprehensive Operations
(In thousands)
| | | | | Three Months Ended March 31, | | Three Months Ended June 30, | | Six Months Ended June 30, |
| | | 2016 | | 2015 | | 2016 | | 2015 | | 2016 | | 2015 |
| Net loss | | $ | (185,193 | ) | | $ | (107,746 | ) | | $ | (380,668 | ) | | $ | (1,148,499 | ) | | $ | (565,861 | ) | | $ | (1,256,245 | ) |
| Other comprehensive income, net of income tax: | | |
| | |
| | |
| | |
| | |
| | |
|
| Interest rate lock derivative contracts reclassified to income, net of tax of $0 and $11, respectively | | — |
| | 17 |
| |
| Interest rate lock derivative contracts reclassified to income, net of tax of $0, $10, $0, and $21, respectively | | | — |
| | 18 |
| | — |
| | 35 |
|
| Total other comprehensive income | | — |
| | 17 |
| | — |
| | 18 |
| | — |
| | 35 |
|
| Comprehensive loss | | $ | (185,193 | ) | | $ | (107,729 | ) | | $ | (380,668 | ) | | $ | (1,148,481 | ) | | $ | (565,861 | ) | | $ | (1,256,210 | ) |
See accompanying Notes to Unaudited Condensed Consolidated Financial Statements.
Denbury Resources Inc.
Unaudited Condensed Consolidated Statements of Cash Flows
(In thousands)
| | | | | Three Months Ended March 31, | | Six Months Ended June 30, |
| | | 2016 | | 2015 | | 2016 | | 2015 |
| Cash flows from operating activities | | | | | | | | |
| Net loss | | $ | (185,193 | ) | | $ | (107,746 | ) | | $ | (565,861 | ) | | $ | (1,256,245 | ) |
| Adjustments to reconcile net loss to cash flows from operating activities | | | | |
| |
|
| | |
|
| Depletion, depreciation, and amortization | | 77,366 |
| | 149,958 |
| | 143,907 |
| | 297,898 |
|
| Write-down of oil and natural gas properties | | 256,000 |
| | 146,200 |
| | 735,400 |
| | 1,852,000 |
|
| Deferred income taxes | | (95,115 | ) | | (66,036 | ) | | (318,055 | ) | | (700,508 | ) |
| Stock-based compensation | | 859 |
| | 7,849 |
| | 4,122 |
| | 14,967 |
|
| Commodity derivatives expense (income) | | 22,826 |
| | (83,076 | ) | | 121,035 |
| | (34,150 | ) |
| Receipt on settlements of commodity derivatives | | 72,227 |
| | 148,465 |
| | 124,253 |
| | 272,616 |
|
| Gain on debt extinguishment | | (94,991 | ) | | — |
| | (107,269 | ) | | — |
|
| Amortization of debt issuance costs and discounts | | 3,306 |
| | 2,221 |
| |
| Debt issuance costs and discounts | | | 14,072 |
| | 4,501 |
|
| Other, net | | (416 | ) | | (2,359 | ) | | (1,743 | ) | | (4,019 | ) |
| Changes in assets and liabilities, net of effects from acquisitions | | |
| | |
| | |
| | |
|
| Accrued production receivable | | 4,479 |
| | 33,636 |
| | (20,060 | ) | | 17,683 |
|
| Trade and other receivables | | 812 |
| | 16,828 |
| | 17,568 |
| | 57,865 |
|
| Other current and long-term assets | | 1,437 |
| | (6,136 | ) | | (7,974 | ) | | (7,770 | ) |
| Accounts payable and accrued liabilities | | (53,548 | ) | | (83,248 | ) | | (71,830 | ) | | (71,892 | ) |
| Oil and natural gas production payable | | (7,572 | ) | | (17,716 | ) | | (3,624 | ) | | (13,217 | ) |
| Other liabilities | | (448 | ) | | (1,076 | ) | | (997 | ) | | (3,008 | ) |
| Net cash provided by operating activities | | 2,029 |
| | 137,764 |
| | 62,944 |
| | 426,721 |
|
| | | | | | | | | |
| Cash flows from investing activities | | |
| | |
| | |
| | |
|
| Oil and natural gas capital expenditures | | (65,692 | ) | | (162,192 | ) | | (126,302 | ) | | (276,783 | ) |
CO2 capital expenditures | | (315 | ) | | (14,855 | ) | | (451 | ) | | (15,608 | ) |
| Pipelines and plants capital expenditures | | (635 | ) | | (12,455 | ) | | (1,965 | ) | | (20,349 | ) |
| Other | | (312 | ) | | (3,076 | ) | | 1,198 |
| | (23,772 | ) |
| Net cash used in investing activities | | (66,954 | ) | | (192,578 | ) | | (127,520 | ) | | (336,512 | ) |
| | | | | | | | |
| Cash flows from financing activities | | |
| | |
| | |
| | |
|
| Bank repayments | | (696,000 | ) | | (595,000 | ) | | (994,000 | ) | | (1,007,000 | ) |
| Bank borrowings | | 831,000 |
| | 665,000 |
| | 1,139,000 |
| | 962,000 |
|
| Repurchases of senior subordinated notes | | (55,521 | ) | | — |
| | (55,521 | ) | | — |
|
| Pipeline financing and capital lease debt repayments | | | (14,336 | ) | | (17,122 | ) |
| Cash dividends paid | | (387 | ) | | (22,068 | ) | | (413 | ) | | (43,528 | ) |
| Other | | (8,727 | ) | | (10,250 | ) | | (10,421 | ) | | (3,299 | ) |
| Net cash provided by financing activities | | 70,365 |
| | 37,682 |
| |
| Net increase (decrease) in cash and cash equivalents | | 5,440 |
| | (17,132 | ) | |
| Net cash provided by (used in) financing activities | | | 64,309 |
| | (108,949 | ) |
| Net decrease in cash and cash equivalents | | | (267 | ) | | (18,740 | ) |
| Cash and cash equivalents at beginning of period | | 2,812 |
| | 23,153 |
| | 2,812 |
| | 23,153 |
|
| Cash and cash equivalents at end of period | | $ | 8,252 |
| | $ | 6,021 |
| | $ | 2,545 |
| | $ | 4,413 |
|
See accompanying Notes to Unaudited Condensed Consolidated Financial Statements.
Denbury Resources Inc.
Unaudited Condensed Consolidated Statement of Changes in Stockholders' Equity
(Dollar amounts in thousands)
|
| | | | | | | | | | | | | | | | | | | | | | | | | |
| | Common Stock ($.001 Par Value) | | Paid-In
Capital in
Excess of Par | | Retained Earnings (Accumulated Deficit) | | Treasury Stock (at cost) | | |
| | Shares | | Amount | Shares | | Amount | Total Equity |
| Balance – December 31, 2015 | 354,541,626 |
| | $ | 355 |
| | $ | 2,353,549 |
| | $ | (1,058,954 | ) | | 3,124,311 |
| | $ | (46,038 | ) | | $ | 1,248,912 |
|
| Cumulative effect of accounting change | — |
| | — |
| | (415 | ) | | 16,072 |
| | — |
| | — |
| | 15,657 |
|
| Issued or purchased pursuant to employee stock compensation plans | 44,346 |
| | — |
| | — |
| | — |
| | — |
| | — |
| | — |
|
| Issued pursuant to directors’ compensation plan | 31,930 |
| | — |
| | 50 |
| | — |
| | — |
| | — |
| | 50 |
|
| Issued as part of debt exchange | 40,729,332 |
| | 40 |
| | 160,451 |
| | — |
| | — |
| | — |
| | 160,491 |
|
| Stock-based compensation | — |
| | — |
| | 7,125 |
| | — |
| | — |
| | — |
| | 7,125 |
|
| Tax withholding – stock compensation | — |
| | — |
| | — |
| | — |
| | 621,590 |
| | (1,112 | ) | | (1,112 | ) |
| Dividends adjustments | — |
| | — |
| | — |
| | 42 |
| | — |
| | — |
| | 42 |
|
| Net loss | — |
| | — |
| | — |
| | (565,861 | ) | | — |
| | — |
| | (565,861 | ) |
| Balance – June 30, 2016 | 395,347,234 |
| | $ | 395 |
| | $ | 2,520,760 |
| | $ | (1,608,701 | ) | | 3,745,901 |
| | $ | (47,150 | ) | | $ | 865,304 |
|
See accompanying Notes to Unaudited Condensed Consolidated Financial Statements.
Denbury Resources Inc.
Notes to Unaudited Condensed Consolidated Financial Statements
Note 1. Basis of Presentation
Organization and Nature of Operations
Denbury Resources Inc., a Delaware corporation, is an independent oil and natural gas company with operations focused in two key operating areas: the Gulf Coast and Rocky Mountain regions. Our goal is to increase the value of our properties through a combination of exploitation, drilling and proven engineering extraction practices, with the most significant emphasis relating to CO2 enhanced oil recovery operations.
Interim Financial Statements
The accompanying unaudited condensed consolidated financial statements of Denbury Resources Inc. and its subsidiaries have been prepared in accordance with the rules and regulations of the Securities and Exchange Commission (“SEC”) and do not include all of the information and footnotes required by accounting principles generally accepted in the United States for complete financial statements. These financial statements and the notes thereto should be read in conjunction with our Annual Report on Form 10-K for the year ended December 31, 2015 (the “Form 10-K”). Unless indicated otherwise or the context requires, the terms “we,” “our,” “us,” “Company” or “Denbury,” refer to Denbury Resources Inc. and its subsidiaries.
Accounting measurements at interim dates inherently involve greater reliance on estimates than at year end, and the results of operations for the interim periods shown in this report are not necessarily indicative of results to be expected for the year. In management’s opinion, the accompanying unaudited condensed consolidated financial statements include all adjustments of a normal recurring nature necessary for a fair statement of our consolidated financial position as of March 31,June 30, 2016, our consolidated results of operations for the three and six months ended March 31,June 30, 2016 and 2015, our consolidated cash flows for the six months ended June 30, 2016 and 2015, and our consolidated cash flowsstatement of changes in stockholders’ equity for the threesix months ended March 31, 2016 and 2015.June 30, 2016.
Reclassifications
Certain prior period amounts have been reclassified to conform to the current year presentation. On the Unaudited Condensed Consolidated Balance Sheets, beginning “Other current assets,” “Deferred tax liabilities, net,” “Paid-in capital in excess of par” and “Accumulated deficit” have been adjusted for changes related to (1) the accounting for excess tax benefits and forfeitures associated with share-based payment transactions, (2) debt issuance costs associated with our senior subordinated notes have been reclassified from “Other assets” to “Long-term debt, net of current portion” and (3)(2) deferred tax assets have been reclassified from “Deferred tax assets, net” to “Deferred tax liabilities, net.” Such reclassifications were made as a result of our adoption of new accounting pronouncements described in Recent Accounting Pronouncements – Recently Adopted below and had no impact on our previously reported net income or cash flows.
Net Loss per Common Share
Basic net loss per common share is computed by dividing the net loss attributable to common stockholders by the weighted average number of shares of common stock outstanding during the period. Diluted net loss per common share is calculated in the same manner, but includes the impact of potentially dilutive securities. Potentially dilutive securities consist of nonvested restricted stock, stock options, stock appreciation rights (“SARs”), nonvested restricted stock and nonvested performance-based equity awards. For the three and six months ended March 31,June 30, 2016 and 2015, there were no adjustments to net loss for purposes of calculating basic and diluted net loss per common share.
Denbury Resources Inc.
Notes to Unaudited Condensed Consolidated Financial Statements
The following is a reconciliation of the weighted average shares used in the basic and diluted net loss per common share calculations for the periods indicated:
| | | | | Three Months Ended | | Three Months Ended | | Six Months Ended |
| | | March 31, | | June 30, | | June 30, |
| In thousands | | 2016 | | 2015 | | 2016 | | 2015 | | 2016 | | 2015 |
| Basic weighted average common shares outstanding | | 347,235 |
| | 350,688 |
| | 370,566 |
| | 350,039 |
| | 358,901 |
| | 349,653 |
|
| Potentially dilutive securities | | |
| | |
| | |
| | |
| | |
| | |
|
| Restricted stock, stock options, SARs and performance-based equity awards | | — |
| | — |
| | — |
| | — |
| | — |
| | — |
|
| Diluted weighted average common shares outstanding | | 347,235 |
| | 350,688 |
| | 370,566 |
| | 350,039 |
| | 358,901 |
| | 349,653 |
|
Basic weighted average common shares exclude shares of nonvested restricted stock. As these restricted shares vest, they will be included in the shares outstanding used to calculate basic net loss per common share (although time-vesting restricted stock is issued and outstanding upon grant).
The following securities could potentially dilute earnings per share in the future, but were excluded from the computation of diluted net loss per share, as their effect would have been antidilutive:
| | | | | Three Months Ended | | Three Months Ended | | Six Months Ended |
| | | March 31, | | June 30, | | June 30, |
| In thousands | | 2016 | | 2015 | | 2016 | | 2015 | | 2016 | | 2015 |
| Stock options and SARs | | 7,412 |
| | 10,507 |
| | 6,265 |
| | 9,949 |
| | 6,839 |
| | 10,228 |
|
| Restricted stock and performance-based equity awards | | 5,097 |
| | 2,948 |
| | 4,374 |
| | 2,241 |
| | 4,491 |
| | 2,595 |
|
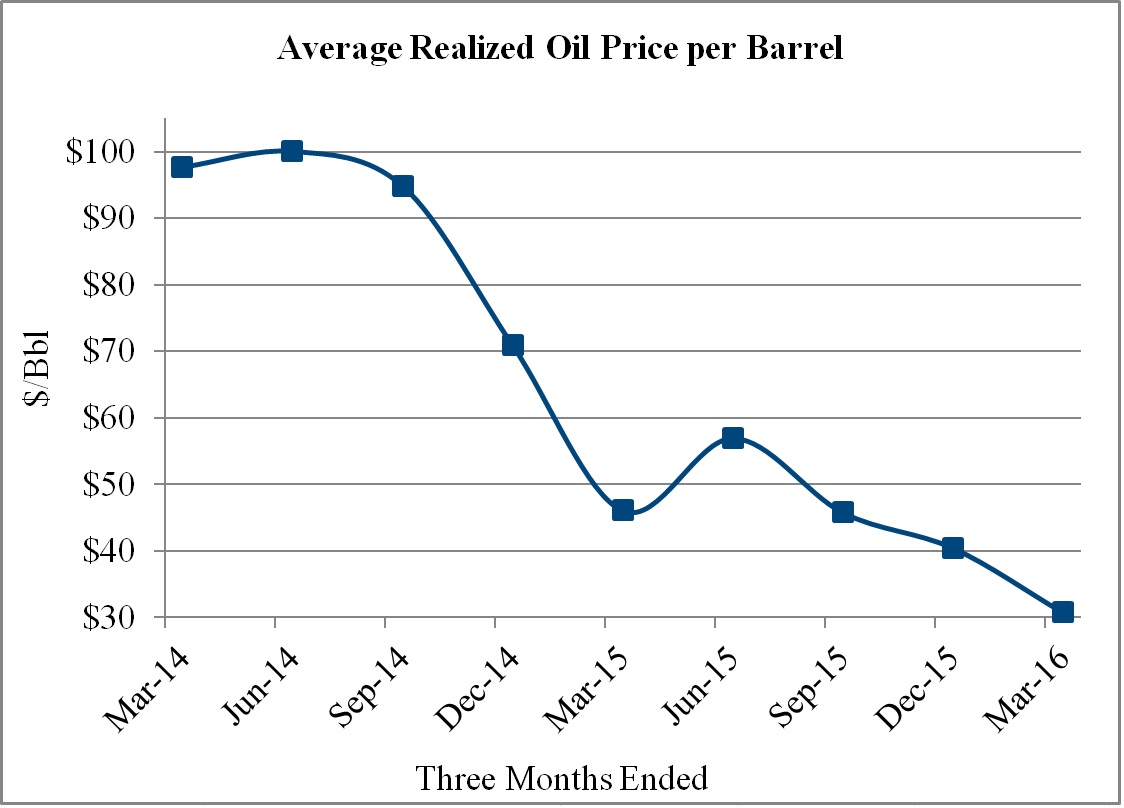
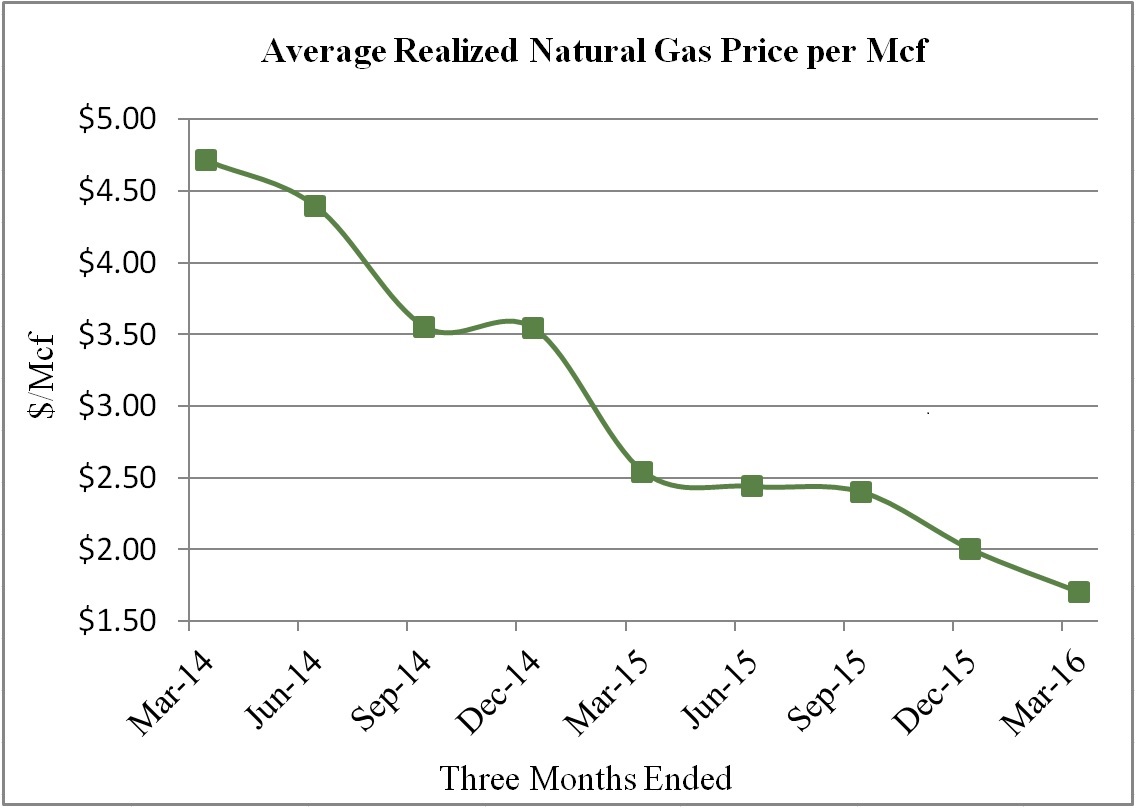
Write-Down of Oil and Natural Gas Properties
The net capitalized costs of oil and natural gas properties are limited to the lower of unamortized cost or the cost center ceiling. The cost center ceiling is defined as (1) the present value of estimated future net revenues from proved oil and natural gas reserves before future abandonment costs (discounted at 10%), based on the average first-day-of-the-month oil and natural gas price for each month during a 12-month rolling period prior to the end of a particular reporting period; plus (2) the cost of properties not being amortized; plus (3) the lower of cost or estimated fair value of unproved properties included in the costs being amortized, if any; less (4) related income tax effects. Our future net revenues from proved oil and natural gas reserves are not reduced for development costs related to the cost of drilling for and developing CO2 reserves nor those related to the cost of constructing CO2 pipelines, as thosewe do not have to incur additional costs have previously been incurred byto develop the Company.proved oil and natural gas reserves. Therefore, we include in the ceiling test, as a reduction of future net revenues, that portion of our capitalized CO2 costs related to CO2 reserves and CO2 pipelines that we estimate will be consumed in the process of producing our proved oil and natural gas reserves. The fair value of our oil and natural gas derivative contracts is not included in the ceiling test, as we do not designate these contracts as hedge instruments for accounting purposes. The cost center ceiling test is prepared quarterly.
As a result of the precipitous and continuing decline in NYMEX oil prices since the fourth quarter of 2014, the rollingaverage first-day-of-the-month averageNYMEX oil price for the preceding 12 months, after adjustments for market differentials by field,used in estimating our proved reserves has fallen throughout 2015 and the first quarterhalf of 2016, from $79.55$71.68 per Bbl for the firstsecond quarter of 2015 to $44.03$43.12 per Bbl for the firstsecond quarter of 2016. In addition, the average first-day-of-the-month averageNYMEX natural gas price used in estimating our proved reserves was $3.38 per MMBtu for the preceding 12 months, after adjustments for market differentials by field, was $3.95 per Mcf for the firstsecond quarter of 2015 and $2.22$2.33 per McfMMBtu for the firstsecond quarter of 2016. These falling prices have led to our recognizing full cost pool ceiling test write-downs of $479.4 million and $256.0 million during the three months ended June 30 and March 31, 2016, respectively, and $1.7 billion and $146.2 million during the three months ended March 31, 2016June 30 and March 31, 2015, respectively.
Denbury Resources Inc.
Notes to Unaudited Condensed Consolidated Financial Statements
Recent Accounting Pronouncements
Recently Adopted
Stock Compensation. In March 2016, the Financial Accounting Standards Board (“FASB”) issued Accounting Standards Update (“ASU”) 2016-09, Improvements to Employee Share-Based Payment Accounting (“ASU 2016-09”). ASU 2016-09
Denbury Resources Inc.
Notes to Unaudited Condensed Consolidated Financial Statements
simplifies the accounting for share-based payment transactions, including the income tax consequences, classification of awards as either equity or liabilities, and classification on the statement of cash flows. The amendments in this ASU are effective for fiscal years beginning after December 15, 2016, and interim periods within those fiscal years, and early adoption is permitted. The standard contains various amendments, each requiring a specific method of adoption, and designates whether each amendment should be adopted using a retrospective, modified retrospective, or prospective transition method. Effective January 1, 2016, we adopted ASU 2016-09. The amendments within ASU 2016-09 related to the timing of when excess tax benefits are recognized and accounting for forfeitures were adopted using a modified retrospective method. In accordance with this method, we recorded a cumulative-effect adjustment in our Unaudited Condensed Consolidated Balance Sheet as of December 31, 2015,on January 1, 2016, relating to the timing of recognition of excess tax benefits, representing a $15.7 million reduction to beginning “Accumulated deficit” with the offset to “Deferred tax liabilities, net” ($14.8 million) and “Other current assets” ($0.8 million). We also recorded a cumulative-effect adjustment in our Unaudited Condensed Consolidated Balance Sheet as of December 31, 2015,on January 1, 2016, to reflect actual forfeitures versus the previously-estimated forfeiture rate, representing a $0.4 million reduction to beginning “Accumulated deficit” with the offset to “Paid-in capital in excess of par.” The amendments within ASU 2016-09 related to the recognition of excess tax benefits and tax shortfalls in the income statement and presentation of excess tax benefits on the statement of cash flows were adopted prospectively, with no adjustments made to prior periods.
Income Taxes. In November 2015, the FASB issued ASU 2015-17, Income Taxes (“ASU 2015-17”). ASU 2015-17 simplifies the presentation of deferred income taxes and requires deferred tax assets and liabilities to be classified as noncurrent in the balance sheet. The amendments in this ASU are effective for fiscal years beginning after December 15, 2016, and interim periods within those fiscal years, and early adoption is permitted. Entities can transition to the standard either retrospectively to each period presented or prospectively. Effective January 1, 2016, we adopted ASU 2015-17, which has been applied retrospectively for all comparative periods presented. Accordingly, current deferred tax assets of $1.5 million have been reclassified from “Deferred tax assets, net” to “Deferred tax liabilities, net” in our Unaudited Condensed Consolidated Balance Sheet as of December 31, 2015. The adoption of ASU 2015-17 did not have an impact on our consolidated results of operations or cash flows.
Debt Issuance Costs. In April 2015, the FASB issued ASU 2015-03, Interest – Imputation of Interest: Simplifying the Presentation of Debt Issuance Costs (“ASU 2015-03”). ASU 2015-03 requires debt issuance costs related to a recognized debt liability to be presented as a direct reduction of the carrying amount of that debt in the balance sheet, consistent with the presentation of debt discounts. The amendments in this ASU are effective for fiscal years beginning after December 15, 2015, and interim periods within those fiscal years. Entities are required to apply the guidance on a retrospective basis to each period presented as a change in accounting principle. In August 2015, the FASB issued ASU 2015-15, Interest – Imputation of Interest: Simplifying the Presentation of Debt Issuance Costs (“ASU 2015-15”) which amends ASU 2015-03 to clarify the presentation and subsequent measurement of debt issuance costs associated with line of credit arrangements, such that entities may continue to apply current practice. Effective January 1, 2016, we adopted ASU 2015-03 and ASU 2015-15, which have been applied retrospectively for all comparative periods presented. Accordingly, debt issuance costs of $32.8 million associated with our previously issued senior subordinated notes of $32.8 million have been reclassified from “Other assets” to “Long-term debt, net of current portion” in our Unaudited Condensed Consolidated Balance Sheet as of December 31, 2015. The adoption of ASU 2015-03 and ASU 2015-15 did not have an impact on our consolidated results of operations or cash flows.flows for any periods.
Not Yet Adopted
Leases. In February 2016, the FASB issued ASU 2016-02, Leases (“ASU 2016-02”). ASU 2016-02 amends the guidance for lease accounting to require lease assets and liabilities to be recognized on the balance sheet, along with additional disclosures regarding key leasing arrangements. The amendments in this ASU are effective for fiscal years beginning after December 15, 2018, and interim periods within those fiscal years, and early adoption is permitted. Entities must adopt the standard using a modified retrospective transition and apply the guidance to the earliest comparative period presented, with certain practical expedients that entities may elect to apply. Management is currently assessing the impact the adoption of ASU 2016-02 will have on our consolidated financial statements.
Denbury Resources Inc.
Notes to Unaudited Condensed Consolidated Financial Statements
Revenue Recognition. In May 2014, the FASB issued ASU 2014-09, Revenue from Contracts with Customers (“ASU 2014-09”). ASU 2014-09 amends the guidance for revenue recognition to replace numerous, industry-specific requirements. The core principle of the ASU is that an entity should recognize revenue for the transfer of goods or services equal to the amount that it expects to be entitled to receive for those goods or services. The ASU implements a five-step process for customer contract revenue recognition that focuses on transfer of control, as opposed to transfer of risk and rewards. The amendment also requires enhanced disclosures regarding the nature, amount, timing and uncertainty of revenues and cash flows arising from contracts with
Denbury Resources Inc.
Notes to Unaudited Condensed Consolidated Financial Statements
customers. In August 2015, the FASB issued ASU 2015-14, Revenue from Contracts with Customers (“ASU 2015-14”) which amends ASU 2014-09 and delays the effective date for public companies, such that the amendments in the ASU are effective for reporting periods beginning after December 15, 2017, and early adoption will be permitted for periods beginning after December 15, 2016. In March, April and May 2016, the FASB issued ASU 2016-08, Revenue from Contracts with Customers (“ASU 2016-08”)four additional ASUs which clarifiesprimarily clarified the implementation guidance on principal versus agent considerations.considerations, performance obligations and licensing, collectibility, presentation of sales taxes and other similar taxes collected from customers, and non-cash consideration. Entities can transition to the standard either retrospectively to each period presented or as a cumulative-effect adjustment as of the date of adoption. Management is currently assessing the impact the adoption of ASU 2014-09, ASU 2015-14 and ASU 2016-08these standards will have on our consolidated financial statements.
Note 2. Long-Term Debt
The following long-term debt and capital lease obligations were outstanding as of the dates indicated:
| | | | | March 31, | | December 31, | | June 30, | | December 31, |
| In thousands | | 2016 | | 2015 | | 2016 | | 2015 |
| Senior Secured Bank Credit Agreement | | $ | 310,000 |
| | $ | 175,000 |
| | $ | 320,000 |
|
| $ | 175,000 |
|
| 9% Senior Secured Second Lien Notes due 2021 | | | 614,919 |
|
| — |
|
| 6⅜% Senior Subordinated Notes due 2021 | | 396,000 |
| | 400,000 |
| | 220,939 |
|
| 400,000 |
|
| 5½% Senior Subordinated Notes due 2022 | | 1,207,745 |
| | 1,250,000 |
| | 796,712 |
|
| 1,250,000 |
|
| 4⅝% Senior Subordinated Notes due 2023 | | 1,094,000 |
| | 1,200,000 |
| | 622,297 |
|
| 1,200,000 |
|
| Other Subordinated Notes, including premium of $6 and $7, respectively | | 2,256 |
| | 2,257 |
| |
| Other Subordinated Notes, including premium of $5 and $7, respectively | | | 2,255 |
|
| 2,257 |
|
| Pipeline financings | | 209,399 |
| | 211,766 |
| | 207,448 |
|
| 211,766 |
|
| Capital lease obligations | | 65,817 |
| | 71,324 |
| | 60,124 |
|
| 71,324 |
|
| Total | | 3,285,217 |
| | 3,310,347 |
| |
| Total principal balance | | | 2,844,694 |
|
| 3,310,347 |
|
Future interest payable on 9% Senior Secured Second Lien Notes due 2021 (1) | | | 254,660 |
|
| — |
|
| Issuance costs on senior subordinated notes | | (29,803 | ) | | (32,752 | ) | | (17,324 | ) |
| (32,752 | ) |
| Total, net of debt issuance costs on senior subordinated notes | | 3,255,414 |
| | 3,277,595 |
| |
| Less: current obligations | | (32,917 | ) | | (32,481 | ) | |
| Total debt, net of debt issuance costs on senior subordinated notes | | | 3,082,030 |
|
| 3,277,595 |
|
Less: current maturities of long-term debt (1) | | | (83,762 | ) |
| (32,481 | ) |
| Long-term debt and capital lease obligations | | $ | 3,222,497 |
| | $ | 3,245,114 |
| | $ | 2,998,268 |
|
| $ | 3,245,114 |
|
| |
| (1) | Future interest payable on our 9% Senior Secured Second Lien Notes due 2021 represents most of the interest due over the term of this obligation, which has been accounted for as debt in accordance with Financial Accounting Standards Board Codification (“FASC”) 470-60, Troubled Debt Restructuring by Debtors. Our current maturities of long-term debt as of June 30, 2016 include $51.0 million of future interest payable related to this balance that is due within the next twelve months. See 2016 Senior Subordinated Notes Exchange below for further discussion. |
The ultimate parent company in our corporate structure, Denbury Resources Inc. (“DRI”), is the sole issuer of all of our outstanding senior secured second lien notes and senior subordinated notes. DRI has no independent assets or operations. Each of the subsidiary guarantors of such notes is 100% owned, directly or indirectly, by DRI, and the guarantees of the notes are full and unconditional and joint and several; any subsidiaries of DRI that are not subsidiary guarantors of such notes are minor subsidiaries.
Senior Secured Bank Credit Facility
In December 2014, we entered into an Amended and Restated Credit Agreement with JPMorgan Chase Bank, N.A., as administrative agent, and other lenders party thereto (the “Bank Credit Agreement”). The Bank Credit Agreement is a senior secured revolving credit facility with a maturity date of December 9, 2019. As of April 18, 2016, inIn connection with our May 2016 borrowing base
Denbury Resources Inc.
Notes to Unaudited Condensed Consolidated Financial Statements
redetermination, requirement, we have reduced our borrowing base and lender commitments were reduced to $1.05 billion, with the next such redetermination scheduled for November 2016.
In order to provide more flexibility in managing our balance sheet, the credit extended by our lenders, and continuing compliance with maintenance financial covenants in this low oil price environment, we have entered into three amendments to the Bank Credit Agreement between May 2015 and April 2016 that have modified the Bank Credit Agreement as follows:
for 2016 and 2017, the maximum permitted ratio of consolidated total net debt to consolidated EBITDAX covenant has been suspended and replaced by a maximum permitted ratio of consolidated senior secured debt to consolidated EBITDAX covenant of 3.0 to 1.0 (currently, only debt under our Bank Credit Agreement is considered consolidated senior secured debt for purposes of this ratio);
for 2016 and 2017, a new covenant has been added to require a minimum permitted ratio of consolidated EBITDAX to consolidated interest charges of 1.25 to 1.0;
beginning in the first quarter of 2018, the ratio of consolidated total net debt to consolidated EBITDAX covenant will be reinstated, utilizing an annualized EBITDAX amount for the first, quartersecond, and third quarters of 2018 and building to a trailing four quarters
Denbury Resources Inc.
Notes to Unaudited Condensed Consolidated Financial Statements
by the end of 2018, with the maximum permitted ratios being 6.0 to 1.0 for the first quarter ending March 31, 2018, 5.5 to 1.0 for the second quarter ending June 30, 2018, and 5.0 to 1.0 for the third and fourth quarters ending September 30 and December 31, 2018, and returning to 4.25 to 1.0 for the first quarter ending March 31, 2019;
allows for the incurrence of up to $1.0 billion of junior lien debt (subject to customary requirements);, with $385.1 million of future incurrence available as of June 30, 2016;
limits unrestricted cash and cash equivalents to $225 million if more than $250 million of borrowings are outstanding under the Bank Credit Agreement; and
limits the amount spent on repurchases or other redemptions of our senior subordinated notes to $225 million.million, with $169.5 million available as of June 30, 2016.
Additionally, such amendments provide formade the following changes to the Bank Credit Agreement: (1) increasesincreased the applicable margin for ABR Loans and LIBOR Loans by 75 basis points such that the margin for ABR Loans now ranges from 1% to 2% per annum and the margin for LIBOR Loans now ranges from 2% to 3% per annum, (2) increasesincreased the commitment fee rate to 0.50%, and (3) providesprovided for semi-annual scheduled redeterminations of the borrowing base in May and November of each year. As of March 31,June 30, 2016, we were in compliance with all debt covenants under the Bank Credit Agreement. The weighted average interest rate on borrowings outstanding as of March 31,June 30, 2016, under the Bank Credit Agreement was 2.4%2.8%.
The above description of our Bank Credit Agreement financial covenants and the changes provided for within the three amendments are qualified by the express language and defined terms contained in the Bank Credit Agreement, the First Amendment to the Bank Credit Agreement dated May 4, 2015, the Second Amendment to the Bank Credit Agreement dated February 17, 2016, and the Third Amendment to the Bank Credit Agreement dated April 18, 2016, each of which are filed as exhibits to our periodic reports filed with the SEC.
2016 Senior Subordinated Notes Exchange
During May 2016, we entered into privately negotiated exchange agreements to exchange a total of $1,057.8 million of our existing senior subordinated notes for $614.9 million principal amount of our 9% Senior Secured Second Lien Notes due 2021(the “2021 Senior Secured Notes”) plus 40.7 million shares of Denbury common stock, resulting in a net reduction from these exchanges of $442.9 million in our debt principal. The exchanged notes consisted of $175.1 million principal amount of our 6⅜% Senior Subordinated Notes due 2021 (“2021 Notes”), $411.0 million principal amount of our 5½% Senior Subordinated Notes due 2022 (“2022 Notes”), and $471.7 million principal amount of our 4⅝% Senior Subordinated Notes due 2023 (“2023 Notes”).
In accordance with FASB ASC 470-60, the exchanges were accounted for as a troubled debt restructuring due to the level of concession provided by our lenders. Under this guidance, future interest applicable to the 2021 Senior Secured Notes is recorded as debt up to the point that the principal and future interest of the new notes is equal to the principal amount of the extinguished notes, rather than recognizing a gain on extinguishment for this amount. As a result, $254.7 million of future interest on the 2021 Senior Secured Notes has been recorded as debt, which will be reduced as semi-annual interest payments are made, with the remaining $22.8 million of future interest to be recognized as interest expense over the term of these notes. Therefore, future interest expense on the 2021 Senior Secured Notes will be significantly lower than the actual cash interest payments. In addition,
Denbury Resources Inc.
Notes to Unaudited Condensed Consolidated Financial Statements
we recognized a gain of $12.3 million as a result of this debt exchange, which is included in “Gain on debt extinguishment” in the accompanying Unaudited Condensed Consolidated Statements of Operations.
9% Senior Secured Second Lien Notes due 2021
In May 2016, we issued $614.9 million of 2021 Senior Secured Notes. The 2021 Senior Secured Notes, which bear interest at a rate of 9% per annum, were issued at par in connection with privately negotiated exchanges with a limited number of holders of $1,057.8 million of existing senior subordinated notes (see 2016 Senior Subordinated Notes Exchange above). The 2021 Senior Secured Notes mature on May 15, 2021, and interest is payable semi-annually in arrears on May 15 and November 15 of each year, beginning November 15, 2016. We may redeem the 2021 Senior Secured Notes in whole or in part at our option beginning December 15, 2018, at a redemption price of 109% of the principal amount, and at declining redemption prices thereafter, as specified in the indenture governing the 2021 Senior Secured Notes (the “Indenture”). Prior to December 15, 2018, we may at our option redeem up to an aggregate of 35% of the principal amount of the 2021 Senior Secured Notes at a price of 109% of par with the proceeds of certain equity offerings. In addition, at any time prior to December 15, 2018, we may redeem the 2021 Senior Secured Notes in whole or in part at a price equal to 100% of the principal amount plus a “make-whole” premium and accrued and unpaid interest. The 2021 Senior Secured Notes are not subject to any sinking fund requirements.
The Indenture contains customary covenants that restrict our ability and the ability of our restricted subsidiaries’ to (1) incur additional debt; (2) make investments; (3) create liens on our assets or the assets of our restricted subsidiaries; (4) create limitations on the ability of our restricted subsidiaries to pay dividends or make other payments to DRI or other restricted subsidiaries; (5) engage in transactions with our affiliates; (6) transfer or sell assets or subsidiary stock; (7) consolidate, merge or transfer all or substantially all of our assets and the assets of our restricted subsidiaries; and (8) make restricted payments (which includes paying dividends on our common stock or redeeming, repurchasing or retiring such stock or subordinated debt (including existing senior subordinated notes)), provided that in certain circumstances we may make unlimited restricted payments so long as we maintain a ratio of total debt to EBITDA (as defined in the Indenture) not to exceed 2.5 to 1.0 (both before and after giving effect to any restricted payment).
The 2021 Senior Secured Notes are guaranteed jointly and severally by our subsidiaries representing substantially all of our assets, operations and income and are secured by second-priority liens on substantially all of the assets that secure the Bank Credit Agreement, which second-priority liens are contractually subordinated to liens that secure our Bank Credit Agreement and any future additional priority lien debt.
2016 Repurchases of Senior Subordinated Notes
During February and March 2016, we repurchased a total of $152.3 million of our outstanding long-term indebtedness, consisting of $4.0 million in aggregate principal amount of our 6⅜% Senior Subordinated2021 Notes, due 2021 (the “2021 Notes”), $42.3 million in aggregate principal amount of our 5½% Senior Subordinated2022 Notes, due 2022 (the “2022 Notes”), and $106.0 million in aggregate principal amount of our 4⅝% Senior Subordinated2023 Notes due 2023 (the “2023 Notes”) in open-market transactions for a total purchase price of $55.5 million, excluding accrued interest. In connection with these transactions, we recognized a $95.0 million gain on extinguishment, net of unamortized debt issuance costs written off. During July 2016, we repurchased an additional $19.6 million of senior subordinated notes in open-market transactions, consisting of $3.3 million principal amount of our 2021 Notes and $16.3 million principal amount of our 2022 Notes, for a total purchase price of $14.2 million, excluding accrued interest. As of May 4,August 3, 2016, under the Bank Credit Agreement, an additional $169.5$155.3 million may be spent on senior subordinated notes repurchases under the Bank Credit Agreement.or other redemptions.
Note 3. Income Taxes
We evaluate our estimated annual effective income tax rate based on current and forecasted business results and enacted tax laws on a quarterly basis and apply this tax rate to our ordinary income or loss to calculate our estimated tax liability or benefit. As of March 31,June 30, 2016, we had $34.5 million of deferred tax assets associated with State of Louisiana net operating losses. As the result of a new tax law enacted in the State of Louisiana effective June 30, 2015, which limits a company’s utilization of certain deductions, including our net operating loss carryforwards, we recognized tax valuation allowances totaling $33.6 million during 2015 and an additional $0.9 million during the first quarter of 2016, to reducewhich reduced the carrying value of our deferred tax assets. The valuation allowances will remain until the realization of future deferred tax benefits are more likely than not to become utilized.
As of March 31,June 30, 2016, we had an unrecognized tax benefit of $5.4 million related to an uncertain tax position. The unrecognized tax benefit was recorded during the fourth quarter of 2015 as a direct reduction of the associated deferred tax asset and, if recognized,
Denbury Resources Inc.
Notes to Unaudited Condensed Consolidated Financial Statements
would not materially affect our annual effective tax rate. The tax benefit from an uncertain tax position will only be recognized if it is more likely than not that the tax position will be sustained upon examination by the taxing authorities, based upon the technical merits of the position. We currently do not expect a material change to the uncertain tax position within the next 12 months. Our policy is to recognize penalties and interest related to uncertain tax positions in income tax expense; however, no such amounts were accrued related to the uncertain tax position as of March 31,June 30, 2016.
In connection with the privately negotiated exchange agreements to exchange a portion of our existing senior subordinated notes for 2021 Senior Secured Notes, we realized a tax gain due to the concession extended by our note holders. This tax gain was offset by net operating losses and other deferred tax asset attributes.
Note 4. Stockholders’ Equity
Dividends
During the first three quarters of 2015, the Company’s Board of Directors declared quarterly cash dividends of $0.0625 per common share, with dividends totaling $22.1$43.5 million paid to stockholders during the threesix months ended March 31,June 30, 2015. In
Denbury Resources Inc.
Notes to Unaudited Condensed Consolidated Financial Statements
September 2015, in light of the continuing low oil price environment and our desire to maintain our financial strength and flexibility, the Company’s Board of Directors suspended our quarterly cash dividend.
Note 5. Commodity Derivative Contracts
We do not apply hedge accounting treatment to our oil and natural gas derivative contracts; therefore, the changes in the fair values of these instruments are recognized in income in the period of change. These fair value changes, along with the settlements of expired contracts, are shown under “Commodity derivatives expense (income)” in our Unaudited Condensed Consolidated Statements of Operations.
Historically, we have entered into various oil and natural gas derivative contracts to provide an economic hedge of our exposure to commodity price risk associated with anticipated future oil and natural gas production and to provide more certainty to our future cash flows. We do not hold or issue derivative financial instruments for trading purposes. Generally, these contracts have consisted of various combinations of price floors, collars, three-way collars, fixed-price swaps and fixed-price swaps enhanced with a sold put. The production that we hedge has varied from year to year depending on our levels of debt, financial strength and expectation of future commodity prices.
We manage and control market and counterparty credit risk through established internal control procedures that are reviewed on an ongoing basis. We attempt to minimize credit risk exposure to counterparties through formal credit policies, monitoring procedures and diversification, and all of our commodity derivative contracts are with parties that are lenders under our Bank Credit Agreement (or affiliates of such lenders). As of March 31,June 30, 2016, all of our outstanding derivative contracts were subject to enforceable master netting arrangements whereby payables on those contracts can be offset against receivables from separate derivative contracts with the same counterparty. It is our policy to classify derivative assets and liabilities on a gross basis on our balance sheets, even if the contracts are subject to enforceable master netting arrangements.
Denbury Resources Inc.
Notes to Unaudited Condensed Consolidated Financial Statements
The following table summarizes our commodity derivative contracts as of March 31,June 30, 2016, none of which are classified as hedging instruments in accordance with the Financial Accounting Standards Board Codification (“FASC”)FASC Derivatives and Hedging topic:
| | | Months | | Index Price | | Volume (Barrels per day) | | Contract Prices ($/Bbl) | | Index Price | | Volume (Barrels per day) | | Contract Prices ($/Bbl) |
Range (1) | | Weighted Average Price | Range (1) | | Weighted Average Price |
| Swap | | Sold Put | | Floor | | Ceiling | Swap | | Sold Put | | Floor | | Ceiling |
| Oil Contracts: | Oil Contracts: | | | | | | | | | | | | | Oil Contracts: | | | | | | | | | | | | |
2016 Enhanced Swaps (2) | | | | | | | | | | | |
| Apr – June | | NYMEX | | 2,000 | | $ | 90.35 | – | 90.35 |
| | $ | 90.35 |
| | $ | 68.00 |
| | $ | — |
| | $ | — |
| |
| Apr – June | | LLS | | 6,000 | | 93.30 | – | 93.50 |
| | 93.38 |
| | 70.00 |
| | — |
| | — |
| |
| 2016 Fixed-Price Swaps | 2016 Fixed-Price Swaps | | | | | | | | | | | 2016 Fixed-Price Swaps | | | | | | | | | | |
| Apr – June | | NYMEX | | 11,500 | | $ | 60.30 | – | 63.75 |
| | $ | 61.84 |
| | $ | — |
| | $ | — |
| | $ | — |
| |
| Apr – June | | LLS | | 3,500 | | 64.20 | – | 66.15 |
| | 64.99 |
| | — |
| | — |
| | — |
| |
| July – Sept | | NYMEX | | 16,500 | | 36.25 | – | 40.65 |
| | 38.24 |
| | — |
| | — |
| | — |
| | NYMEX | | 18,500 | | $ | 36.25 | – | 45.08 |
| | $ | 38.96 |
| | $ | — |
| | $ | — |
| | $ | — |
|
| July – Sept | | LLS | | 7,000 | | 37.24 | – | 42.15 |
| | 39.61 |
| | — |
| | — |
| | — |
| | LLS | | 7,000 | | 37.24 | – | 42.15 |
| | 39.61 |
| | — |
| | — |
| | — |
|
| Oct – Dec | | NYMEX | | 23,000 | | 36.25 | – | 40.00 |
| | 37.97 |
| | — |
| | — |
| | — |
| | NYMEX | | 26,000 | | 36.25 | – | 45.40 |
| | 38.70 |
| | — |
| | — |
| | — |
|
| Oct – Dec | | LLS | | 7,000 | | 37.24 | – | 41.00 |
| | 39.16 |
| | — |
| | — |
| | — |
| | LLS | | 7,000 | | 37.24 | – | 41.00 |
| | 39.16 |
| | — |
| | — |
| | — |
|
2016 Three-Way Collars (3) | | | | | | | | | | | |
| Apr – June | | NYMEX | | 2,000 | | $ | 85.00 | – | 95.50 |
| | $ | — |
| | $ | 68.00 |
| | $ | 85.00 |
| | $ | 95.50 |
| |
| Apr – June | | LLS | | 2,000 | | 88.00 | – | 98.25 |
| | — |
| | 70.00 |
| | 88.00 |
| | 98.25 |
| |
| 2016 Collars | | | | | | | | | | | | | | | | | | | | |
| Apr – June | | NYMEX | | 5,000 | | $ | 55.00 | – | 72.25 |
| | $ | — |
| | $ | — |
| | $ | 55.00 |
| | $ | 71.01 |
| |
| Apr – June | | LLS | | 2,000 | | 58.00 | – | 73.00 |
| | — |
| | — |
| | 58.00 |
| | 73.00 |
| |
| July – Sept | | NYMEX | | 4,500 | | 55.00 | – | 72.65 |
| | — |
| | — |
| | 55.00 |
| | 71.22 |
| | NYMEX | | 4,500 | | $ | 55.00 | – | 72.65 |
| | $ | — |
| | $ | — |
| | $ | 55.00 |
| | $ | 71.22 |
|
| July – Sept | | LLS | | 3,000 | | 58.00 | – | 74.30 |
| | — |
| | — |
| | 58.00 |
| | 73.85 |
| | NYMEX | | 4,000 | | 40.00 | – | 51.80 |
| | — |
| | — |
| | 40.00 |
| | 51.40 |
|
| July – Sept | | | LLS | | 3,000 | | 58.00 | – | 74.30 |
| | — |
| | — |
| | 58.00 |
| | 73.85 |
|
| July – Sept | | | LLS | | 5,000 | | 40.00 | – | 54.25 |
| | — |
| | — |
| | 40.00 |
| | 53.74 |
|
| Oct – Dec | | | NYMEX | | 4,000 | | 40.00 | – | 54.00 |
| | — |
| | — |
| | 40.00 |
| | 53.48 |
|
| Oct – Dec | | | LLS | | 4,000 | | 40.00 | – | 56.00 |
| | — |
| | — |
| | 40.00 |
| | 55.79 |
|
| 2017 Fixed-Price Swaps | 2017 Fixed-Price Swaps | | | | | | | | | | | 2017 Fixed-Price Swaps | | | | | | | | | | |
| Jan – Mar | | NYMEX | | 20,000 | | $ | 41.15 | – | 44.35 |
| | $ | 42.39 |
| | $ | — |
| | $ | — |
| | $ | — |
| | NYMEX | | 22,000 | | $ | 41.15 | – | 45.45 |
| | $ | 42.67 |
| | $ | — |
| | $ | — |
| | $ | — |
|
| Jan – Mar | | LLS | | 9,000 | | 42.35 | – | 45.60 |
| | 43.51 |
| | — |
| | — |
| | — |
| | LLS | | 10,000 | | 42.35 | – | 46.15 |
| | 43.77 |
| | — |
| | — |
| | — |
|
| Apr – June | | | NYMEX | | 22,000 | | 41.20 | – | 46.50 |
| | 43.99 |
| | — |
| | — |
| | — |
|
| Apr – June | | | LLS | | 7,000 | | 42.65 | – | 46.65 |
| | 45.35 |
| | — |
| | — |
| | — |
|
| 2017 Collars | | | | | | | | | | | |
| Jan – Mar | | | NYMEX | | 4,000 | | $ | 40.00 | – | 55.40 |
| | $ | — |
| | $ | — |
| | $ | 40.00 |
| | $ | 54.80 |
|
| Jan – Mar | | | LLS | | 3,000 | | 40.00 | – | 57.35 |
| | — |
| | — |
| | 40.00 |
| | 57.23 |
|
2017 Three-Way Collars (2) | | 2017 Three-Way Collars (2) | | | | | | | | | | |
| July – Sept | | | NYMEX | | 6,500 | | $ | 40.00 | – | 70.25 |
| | $ | — |
| | $ | 30.00 |
| | $ | 40.00 |
| | $ | 69.74 |
|
| July – Sept | | | LLS | | 1,000 | | 41.00 | – | 69.25 |
| | — |
| | 31.00 |
| | 41.00 |
| | 69.25 |
|
| |
| (1) | Ranges presented for fixed-price swaps and enhanced swaps represent the lowest and highest fixed prices of all open contracts for the period presented. For collars and three-way collars, ranges represent the lowest floor price and highest ceiling price for all open contracts for the period presented. |
| |
| (2) | An enhanced swap is a fixed-price swap contract combined with a sold put feature (at a lower price) with the same counterparty. The value associated with the sold put is used to increase or enhance the fixed price of the swap. At the contract settlement date, (1) if the index price is higher than the swap price, we pay the counterparty the difference between the index price and swap price for the contracted volumes, (2) if the index price is lower than the swap price but at or above the sold put price, the counterparty pays us the difference between the index price and the swap price for the contracted volumes and (3) if the index price is lower than the sold put price, the counterparty pays us the difference between the swap price and the sold put price for the contracted volumes. |
| |
(3) | A three-way collar is a costless collar contract combined with a sold put feature (at a lower price) with the same counterparty. The value received for the sold put is used to enhance the contracted floor and ceiling price of the related collar. At the contract settlement date, (1) if the index price is higher than the ceiling price, we pay the counterparty the difference between the index price and ceiling price for the contracted volumes, (2) if the index price is between the floor and ceiling price, no settlements occur, (3) if the index price is lower than the floor price but at or above the sold put price, the counterparty pays us the difference between the index price and the floor price for the contracted volumes and (4) if the index price is lower than the sold put price, the counterparty pays us the difference between the floor price and the sold put price for the contracted volumes. |
Denbury Resources Inc.
Notes to Unaudited Condensed Consolidated Financial Statements
Note 6. Fair Value Measurements
The FASC Fair Value Measurement topic defines fair value as the price that would be received to sell an asset or paid to transfer a liability in an orderly transaction between market participants at the measurement date (often referred to as the “exit price”). We utilize market data or assumptions that market participants would use in pricing the asset or liability, including assumptions about risk and the risks inherent in the inputs to the valuation technique. These inputs can be readily observable, market corroborated or generally unobservable. We primarily apply the income approach for recurring fair value measurements and endeavor to utilize the best available information. Accordingly, we utilize valuation techniques that maximize the use of observable inputs and minimize the use of unobservable inputs. We are able to classify fair value balances based on the observability
Denbury Resources Inc.
Notes to Unaudited Condensed Consolidated Financial Statements
of those inputs. The FASC establishes a fair value hierarchy that prioritizes the inputs used to measure fair value. The hierarchy gives the highest priority to unadjusted quoted prices in active markets for identical assets or liabilities (Level 1 measurement) and the lowest priority to unobservable inputs (Level 3 measurement). The three levels of the fair value hierarchy are as follows:
Level 1 – Quoted prices in active markets for identical assets or liabilities as of the reporting date.
Level 2 – Pricing inputs are other than quoted prices in active markets included in Level 1, which are either directly or indirectly observable as of the reported date. Level 2 includes those financial instruments that are valued using models or other valuation methodologies. Instruments in this category include non-exchange-traded oil derivatives that are based on NYMEX pricing and fixed-price swaps that are based on regional pricing other than NYMEX (e.g., Light Louisiana Sweet). The fixed-price swap features of our enhanced swaps are valued using a discounted cash flow model based upon forward commodity price curves. Our costless collars and the sold put features of our enhanced oil swaps and three-way collars are valued using the Black-Scholes model, an industry standard option valuation model that takes into account inputs such as contractual prices for the underlying instruments, maturity, quoted forward prices for commodities, interest rates, volatility factors and credit worthiness, as well as other relevant economic measures. Substantially all of these assumptions are observable in the marketplace throughout the full term of the instrument, can be derived from observable data or are supported by observable levels at which transactions are executed in the marketplace.
Level 3 – Pricing inputs include significant inputs that are generally less observable. These inputs may be used with internally developed methodologies that result in management’s best estimate of fair value. At March 31,June 30, 2016, instruments in this category include non-exchange-traded enhanced swaps, costless collars and three-way collars that are based on regional pricing other than NYMEX (e.g., Light Louisiana Sweet). The valuation models utilized for enhanced swaps, costless collars and three-way collars are consistent with the methodologies described above; however, the implied volatilities utilized in the valuation of Level 3 instruments are developed using a benchmark, which is considered a significant unobservable input. An increase or decrease of 100 basis points in the implied volatility inputs utilized in our fair value measurement would result in a change of approximately $14$80 thousand in the fair value of these instruments as of March 31,June 30, 2016.
We adjust the valuations from the valuation model for nonperformance risk, using our estimate of the counterparty’s credit quality for asset positions and our credit quality for liability positions. We use multiple sources of third-party credit data in determining counterparty nonperformance risk, including credit default swaps.
Denbury Resources Inc.
Notes to Unaudited Condensed Consolidated Financial Statements
The following table sets forth, by level within the fair value hierarchy, our financial assets and liabilities that were accounted for at fair value on a recurring basis as of the periods indicated:
| | | | | Fair Value Measurements Using: | | Fair Value Measurements Using: |
| In thousands | | Quoted Prices in Active Markets (Level 1) | | Significant Other Observable Inputs (Level 2) | | Significant Unobservable Inputs (Level 3) | | Total | | Quoted Prices in Active Markets (Level 1) | | Significant Other Observable Inputs (Level 2) | | Significant Unobservable Inputs (Level 3) | | Total |
| March 31, 2016 | | | | | | | | | |
| June 30, 2016 | | | | | | | | | |
| Assets | | | | | | | | | | | | | | | | |
| Oil derivative contracts – current | | $ | — |
| | $ | 49,758 |
| | $ | 23,040 |
| | $ | 72,798 |
| | $ | — |
| | $ | 2,619 |
| | $ | 2,080 |
| | $ | 4,699 |
|
| Oil derivative contracts – long-term | | | — |
| | 31 |
| | — |
| | 31 |
|
| Total Assets | | $ | — |
| | $ | 49,758 |
| | $ | 23,040 |
| | $ | 72,798 |
| | $ | — |
| | $ | 2,650 |
| | $ | 2,080 |
| | $ | 4,730 |
|
| | | | | | | | | | | | | | | | | |
| Liabilities | | | | | | | | | | | | | | | | |
| Oil derivative contracts – current | | $ | — |
| | $ | 25,005 |
| | $ | — |
| | $ | 25,005 |
| | $ | — |
| | $ | 105,310 |
| | $ | 1,795 |
| | $ | 107,105 |
|
| Oil derivative contracts – long-term | | | — |
| | 22 |
| | 45 |
| | 67 |
|
| Total Liabilities | | $ | — |
| | $ | 25,005 |
| | $ | — |
| | $ | 25,005 |
| | $ | — |
| | $ | 105,332 |
| | $ | 1,840 |
| | $ | 107,172 |
|
| | | | | | | | | | | | | | | | | |
| December 31, 2015 | | |
| | |
| | |
| | |
| | |
| | |
| | |
| | |
|
| Assets | | |
| | |
| | |
| | |
| | |
| | |
| | |
| | |
|
| Oil derivative contracts – current | | $ | — |
| | $ | 90,012 |
| | $ | 52,834 |
| | $ | 142,846 |
| | $ | — |
| | $ | 90,012 |
| | $ | 52,834 |
| | $ | 142,846 |
|
| Total Assets | | $ | — |
| | $ | 90,012 |
| | $ | 52,834 |
| | $ | 142,846 |
| | $ | — |
| | $ | 90,012 |
| | $ | 52,834 |
| | $ | 142,846 |
|
Since we do not apply hedge accounting for our commodity derivative contracts, any gains and losses on our assets and liabilities are included in “Commodity derivatives expense (income)” in the accompanying Unaudited Condensed Consolidated Statements of Operations.
Level 3 Fair Value Measurements
The following table summarizes the changes in the fair value of our Level 3 assets and liabilities for the three and six months ended March 31,June 30, 2016 and 2015:
| | | | | Three Months Ended | | Three Months Ended | | Six Months Ended |
| | | March 31, | | June 30, | | June 30, |
| In thousands | | 2016 | | 2015 | | 2016 | | 2015 | | 2016 | | 2015 |
| Fair value of Level 3 instruments, beginning of period | | $ | 52,834 |
| | $ | 188,446 |
| | $ | 23,040 |
| | $ | 165,015 |
| | $ | 52,834 |
| | $ | 188,446 |
|
| Fair value adjustments on commodity derivatives | | 281 |
| | 25,085 |
| | (4,818 | ) | | (7,302 | ) | | (4,536 | ) | | 17,783 |
|
| Payment (receipts) on settlements of commodity derivatives | | (30,075 | ) | | (48,516 | ) | |
| Receipts on settlements of commodity derivatives | | | (17,982 | ) | | (45,355 | ) | | (48,058 | ) | | (93,871 | ) |
| Fair value of Level 3 instruments, end of period | | $ | 23,040 |
| | $ | 165,015 |
| | $ | 240 |
| | $ | 112,358 |
| | $ | 240 |
| | $ | 112,358 |
|
| | | | | | | | | | | | | |
| The amount of total gains for the period included in earnings attributable to the change in unrealized gains relating to assets still held at the reporting date | | $ | 133 |
| | $ | 23,099 |
| |
| The amount of total gains (losses) for the period included in earnings attributable to the change in unrealized gains (losses) relating to assets or liabilities still held at the reporting date | | | $ | (3,857 | ) | | $ | (4,325 | ) | | $ | (3,870 | ) | | $ | 14,142 |
|
We utilize an income approach to value our Level 3 enhanced swaps, costless collars and three-way collars. We obtain and ensure the appropriateness of the significant inputs to the calculation, including contractual prices for the underlying instruments, maturity, forward prices for commodities, interest rates, volatility factors and credit worthiness, and the fair value estimate is prepared and
Denbury Resources Inc.
Notes to Unaudited Condensed Consolidated Financial Statements
reviewed on a quarterly basis. The following table details fair value inputs related to implied volatilities utilized in the valuation of our Level 3 oil derivative contracts:
Denbury Resources Inc.
Notes to Unaudited Condensed Consolidated Financial Statements
|
| | | | | | | | | | |
| | | Fair Value at
3/31/2016
(in thousands) | | Valuation Technique | | Unobservable Input | | Volatility Range |
| Oil derivative contracts | | $ | 23,040 |
| | Discounted cash flow / Black-Scholes | | Volatility of Light Louisiana Sweet for settlement periods beginning after March 31, 2016 | | 26.9% – 38.0% |
|
| | | | | | | | | | |
| | | Fair Value at
6/30/2016
(in thousands) | | Valuation Technique | | Unobservable Input | | Volatility Range |
| Oil derivative contracts | | $ | 240 |
| | Discounted cash flow / Black-Scholes | | Volatility of Light Louisiana Sweet for settlement periods beginning after June 30, 2016 | | 21.1% - 41.4% |
Other Fair Value Measurements
The carrying value of our loans under our Bank Credit Agreement approximate fair value, as they are subject to short-term floating interest rates that approximate the rates available to us for those periods. We use a market approach to determine the fair value of our fixed-rate long-term debt using observable market data. The fair values of our senior secured second lien notes and senior subordinated notes are based on quoted market prices. The estimated fair value of the principal amount of our debt as of March 31,June 30, 2016 and December 31, 2015, excluding pipeline financing and capital lease obligations, was $1,487.42,033.6 million and $1,119.0 million, respectively.respectively, which increase is primarily driven by an increase in quoted market prices. We have other financial instruments consisting primarily of cash, cash equivalents, short-term receivables and payables that approximate fair value due to the nature of the instrument and the relatively short maturities.
Note 7. Commitments and Contingencies
Commitments
In the second quarter of 2016, we amended our CO2 offtake agreement with Mississippi Power Company (“MSPC”), which amendment included increasing our offtake percentage from 70% to 100% of CO2 quantities produced and lowering the base price related to the cost of CO2, deliveries of which are currently expected to begin in the second half of 2016. Based on the amended terms in the agreement, we concluded for accounting purposes that the agreement contains an embedded lease related to the pipeline owned by MSPC used to transport CO2 to Denbury. We currently plan to record a capital lease on the balance sheet of approximately $110 million upon lease commencement.
Litigation
We are involved in various lawsuits, claims and regulatory proceedings incidental to our businesses. We are also subject to audits for various taxes (income, sales and use, and severance) in the various states in which we operate, and from time to time receive assessments for potential taxes that we may owe. While we currently believe that the ultimate outcome of these proceedings, individually and in the aggregate, will not have a material adverse effect on our financial position, results of operations or cash flows, litigation is subject to inherent uncertainties. Although a single or multiple adverse rulings or settlements could possibly have a material adverse effect on our finances, we only accrue for losses from litigation and claims if we determine that a loss is probable and the amount can be reasonably estimated.
NGS Sub Corp., Evolution, et al v. Denbury Onshore, LLC
In March 2015,On June 24, 2016, we entered into a settlement agreement with Evolution Petroleum Corporation (together with its subsidiaries, “Evolution”), resolving all outstanding disputes and claims the parentparties had or may have had against each other, including pending litigation claims, involving the Delhi Field in northeastern Louisiana.
In addition to clarifying certain aspects of the entity which sold Denbury Onshore, LLC (“Denbury Onshore”), a subsidiary of Denbury Resources Inc. (“DRI” and together with Denbury Onshore, “Denbury”), its originalparties’ ongoing relationship as joint interest holders in the Delhi Field, filed an amended petition in a lawsuit which has been pending in the 133rd Judicial District Court in Houston, Harris County, Texas since December 2013. Originally, that lawsuit involved ongoing disputes betweensettlement resolves (1) claims by Denbury and Evolution regarding the terms ofrelated to the purchase documents under which Denbury Onshore bought itsof our original Delhi Field interest includingfrom Evolution; (2) disputes regarding allocation of costs in determining “payout” as defined in the agreements, and the extentoccurrence, determination, timing, nature and terms of assignment of“payout” and Evolution’s related reversionary interestsinterest in the unit back toDelhi Field; and (3) any claims by Evolution following payout, along with related contractual terms. The amended petition added allegations of negligence and gross negligence against Denbury in connection with the June 2013 incident at the Delhi Field release of well fluids, and for the first time Evolution estimated its damages attributable to its allegations in the case as exceeding $200 million. The amended petition also added a claim for unspecified punitive damages. In Denbury’s answer and counterclaim, we have denied Evolution’s claims, alleged breach of contract by Evolution for failing to convey the full interest for which we paid and for violating our preferential purchase rights, and asked for a declaratory judgment as to various purchase document terms, including those pertaining to the determination of payout, the assignment of provisions of the documents, and cost sharing. Denbury has also filed a Motion for Summary Judgment seeking dismissal of Evolution’s tort claims for negligence and gross negligence.(the “June 2013 Incident”).
Discovery is ongoingUnder the terms of the settlement agreement, (1) we paid Evolution $27.5 million in cash on June 30, 2016; (2) effective July 1, 2016, Denbury conveyed to Evolution 25% of the interests in the case,Mengel Sand Interval, a separate interval within the Delhi Unit which we purchased for approximately $6.5 million in late 2014, and the casewhich interval is not currently set for trial in July 2016. We believe that Evolution’s claims and requests for damages in this matter are without merit and we intend to vigorously pursue our requested relief under the purchase documents.
producing; (3) effective
Denbury Resources Inc.
Notes to Unaudited Condensed Consolidated Financial Statements
July 1, 2016, we were credited with an additional 0.2226% overriding royalty interest in the Holt-Bryant interval (the currently producing interval of the Delhi Unit); (4) the parties reached agreement as to the ownership of certain field assets, and established future CO2 pipeline transportation charges following the end of the current ten-year fixed price arrangement set to expire in 2019; (5) Evolution waived and released any claims it may have to any insurance proceeds that may be received as a result of existing claims made by Denbury with respect to the June 2013 Incident; and (6) on July 11, 2016, the Court dismissed with prejudice the pending Delhi Field litigation between the parties. The cash payment was recorded to “Other expenses” in our Unaudited Condensed Consolidated Statements of Operations in the second quarter of 2016.
Note 8. Additional Balance Sheet Details
Accounts Payable and Accrued Liabilities
| | | | | March 31, | | December 31, | | June 30, | | December 31, |
| In thousands | | 2016 | | 2015 | | 2016 | | 2015 |
| Accrued interest | | $ | 44,201 |
| | $ | 48,908 |
| | $ | 29,182 |
| | $ | 48,908 |
|
| Accrued lease operating expenses | | | 28,482 |
| | 37,549 |
|
| Accounts payable | | 32,688 |
| | 30,477 |
| | 24,675 |
| | 30,477 |
|
| Accrued lease operating expenses | | 30,169 |
| | 37,549 |
| |
| Taxes payable | | 17,717 |
| | 32,438 |
| | 19,342 |
| | 32,438 |
|
| Accrued compensation | | 14,403 |
| | 46,780 |
| | 16,423 |
| | 46,780 |
|
| Accrued exploration and development costs | | 13,500 |
| | 20,892 |
| | 4,906 |
| | 20,892 |
|
| Other | | 34,037 |
| | 36,153 |
| | 39,324 |
| | 36,153 |
|
| Total | | $ | 186,715 |
| | $ | 253,197 |
| | $ | 162,334 |
| | $ | 253,197 |
|
Note 9. Subsequent Event
During the first week of May 2016, we entered into privately negotiated exchange agreements to exchange $922.5 million in aggregate principal amountEmployee Equity Award Grant
The Compensation Committee of our outstanding 2021 Notes, 2022 NotesBoard of Directors granted customary long-term equity incentive awards to our employees under the 2004 Omnibus Stock and 2023 Notes for $531.2 million in aggregate principal amount of new 9% Senior Secured Second Lien Notes due 2021 and 36.9 millionIncentive Plan on July 8, 2016 covering 6,851,346 shares of Denbury commonrestricted stock. The transactions are currently expected to close May 10,closing price of Denbury’s common stock on July 8, 2016 subject to customary closing conditions.was $3.22 per share. The awards generally vest one-third per year over a three-year period.
Denbury Resources Inc.
Management’s Discussion and Analysis of Financial Condition and Results of Operations
Item 2. Management’s Discussion and Analysis of Financial Condition and Results of Operations
The following discussion and analysis should be read in conjunction with our Unaudited Condensed Consolidated Financial Statements and Notes thereto included herein and our Consolidated Financial Statements and Notes thereto included in our Annual Report on Form 10-K for the year ended December 31, 2015 (the “Form 10-K”), along with Management’s Discussion and Analysis of Financial Condition and Results of Operations contained in the Form 10-K. Any terms used but not defined herein have the same meaning given to them in the Form 10-K. Our discussion and analysis includes forward-looking information that involves risks and uncertainties and should be read in conjunction with Risk Factors under Item 1A of Part II of this report, along with Forward-Looking Information at the end of this section for information on the risks and uncertainties that could cause our actual results to be materially different than our forward-looking statements.
OVERVIEW
Denbury is an independent oil and natural gas company with operations focused in two key operating areas: the Gulf Coast and Rocky Mountain regions. Our goal is to increase the value of our properties through a combination of exploitation, drilling and proven engineering extraction practices, with the most significant emphasis relating to CO2 enhanced oil recovery operations.
Oil Price Decline and Impact on Our Business. Oil prices generally constitute the single largest variable in our operating results. Oil prices have historically been volatile, with NYMEX prices ranging from $35 to $111 per Bbl over the last three calendar years, and prices have declined dramatically since the fourth quarter of 2014 to less than $27 per Bbl in January 2016, the lowest level in over 13 years.years, and an average of approximately $46 per Bbl in the second quarter of 2016. The following charts illustratechart illustrates the fluctuations in our realized oil and natural gas prices, excluding the impact of commodity derivative settlements, during 2014, 2015 and the first quarterhalf of 2016.
| | | | | Three Months Ended | | Three Months Ended |
| Average realized prices | | 3/31/14 | | 6/30/14 | | 9/30/14 | | 12/31/14 | | | 3/31/15 | | 6/30/15 | | 9/30/15 | | 12/31/15 | | | 3/31/16 | | 3/31/14 | | 6/30/14 | | 9/30/14 | | 12/31/14 | | | 3/31/15 | | 6/30/15 | | 9/30/15 | | 12/31/15 | | | 3/31/16 | | 6/30/16 |
| Oil price per Bbl | | $ | 97.69 |
| | $ | 100.04 |
| | $ | 94.78 |
| | $ | 70.80 |
| | | $ | 46.02 |
| | $ | 56.92 |
| | $ | 45.74 |
| | $ | 40.41 |
| | | $ | 30.71 |
| | $ | 97.69 |
| | $ | 100.04 |
| | $ | 94.78 |
| | $ | 70.80 |
| | | $ | 46.02 |
| | $ | 56.92 |
| | $ | 45.74 |
| | $ | 40.41 |
| | | $ | 30.71 |
| | $ | 43.38 |
|
| Natural gas price per Mcf | | 4.71 |
| | 4.39 |
| | 3.55 |
| | 3.54 |
| | | 2.54 |
| | 2.44 |
| | 2.40 |
| | 2.00 |
| | | 1.70 |
| |
AsAlthough average second quarter oil prices continued to declinehave increased from the lows experienced in the first quarter of 2016, from already depressed levels, our focus remainedcontinues to remain on cost reductions and preserving liquidity. We continue to take steps to reduce our costsCost reductions have been realized in all categories of our business, and we have made significantour second quarter results demonstrate our continued progress in that regard as demonstrated inregard. We previously set our first quarter results discussed below. We have set our2016 capital development budget (excluding capitalized interest) at $200 million, for 2016, which we currently anticipate willexpect to be primarily be funded with cash flow from operations, thus preserving our liquidity. One advantage we have in this environment is that our oil assets have relatively low decline rates even with our significantly reduced planned capital spending level, and therefore we anticipate that our average daily production will decline by less than 10% in 2016, assumingexcluding the mid-pointimpact of our production guidance, even with our significantly reduced planned capital spending level. This decline rate is even lower if we exclude wells that we anticipate will be shut in for economic reasons. Lastly, we have hedgedrecent weather-related downtime at Conroe and Thompson fields
Denbury Resources Inc.
Management’s Discussion and Analysis of Financial Condition and Results of Operations
and planned asset sales. This decline rate is even lower if we exclude wells that we anticipate will be shut in for economic reasons. Lastly, we have hedged approximately two-thirds of our estimated oil production through the first quarter of 2017 and approximately half of our estimated oil production throughin the second quarter of 2017 in order to cover our current level of cash costs and to help mitigate any future price declines or sustained low oil prices.
During this period of reduced capital spending, we have continued to evaluate our assets with a goal of increasing the value of both existing assets and future projects by optimizing field operational and development plans, reducing CO2 injection volumes due to increased efficiency, and reducing costs such as power and workovers. Over the past year, we have reduced our overall CO2 injection volumes by 35%40% and our lease operating expenses by 27%24% when comparing the firstsecond quarters of 2015 and 2016. These initiatives aim to increase the profitability of our assets, making them more resilient to lower oil prices. Together, we believe these initiatives will help us manage through this low oil price environment and provide us with liquidity for the foreseeable future.
As more fully discussed under Capital Resources and Liquidity2016 Debt Reduction Transactions. below, our banks recently completed their borrowing base redetermination under our senior secured bank credit facility, which resulted in a reduction in the banks’ commitment level under our facility from $1.5 billion to $1.05 billion. In addition, we entered into an amendment to our senior secured bank credit facility terms in February 2016 to relax certain of our financial covenants in 2016 and 2017, and we entered into another amendment in April 2016, which allows for up to $1.0 billion in junior lien debt capacity. As of March 31,During 2016, we had $310.0 million drawn on our senior secured bank credit facility, leaving us with $680.7 million in availability under our bank line after adjusting for the recently revised commitment level. Borrowings under our senior secured bank credit facility increased from $175.0 million at December 31, 2015, due in part to $55.5 million utilized to purchase $152.3 million in aggregate principal amounthave completed a series of senior subordinated notes inprivately negotiated exchange agreements and open-market transactions, resulting in a net reduction of $96.7 million in our long-term debt (see Capital Resources and Liquidity– 2016 Repurchasesprincipal balance of Senior Subordinated Notes below). The remaining portion of the increase in our senior secured bank credit facility balance from December 31, 2015 is primarily due to seasonal working capital outflows in the first quarter of 2016 associated with accrued compensation, ad valorem taxes and semi-annual interest payments on our senior subordinated notes.
Recent Debt Reduction Transactions. During February and March 2016, we reduced our outstanding long-term indebtedness through open-market purchases, and inapproximately $545 million. In May 2016, we entered into exchange agreementsexchanged $1,057.8 million of existing senior subordinated notes with a limited number of holders for $614.9 million of our outstanding senior subordinated notes to exchange these notes for the Company’snew 9% Senior Secured Second Lien Notes due 2021. The2021 (the “2021 Senior Secured Notes”) plus 40.7 million shares of Denbury common stock, resulting in a net reduction from these exchanges of $442.9 million in our debt principal. During February and March 2016, we repurchased $152.3 million of our existing senior subordinated notes for $55.5 million in open-market transactions, are currently expected to close May 10,for a net reduction of $96.7 million of our debt principal. During July 2016, subject to customary closing conditions.we repurchased additional existing senior subordinated notes in open-market transactions, for an additional net reduction of $5.4 million of our debt principal. See Capital Resources and Liquidity – 2016 Repurchases of Senior Subordinated Notes and 2016 Senior Subordinated Notes Exchange AgreementsDebt Reduction Transactions for further discussion.
2016 Divestiture of Non-Core Assets. On June 20, 2016, we entered into a purchase and sale agreement to sell our remaining non-core assets in the Williston Basin of North Dakota and Montana (the “Williston Assets”) for $58 million (before final closing adjustments) with an effective date of April 1, 2016. We expect to close on this transaction during the third quarter of 2016. Production from the Williston Assets averaged 1,267 BOE/d and 1,315 BOE/d during the three and six months ended June 30, 2016, respectively.
Operating Highlights. Our financial results continue to be impacted by the decrease in realized oil prices as highlighted above, which decreased from an average of $46.02$56.92 per Bbl in the firstsecond quarter of 2015 to $30.71$43.38 in the firstsecond quarter of 2016.2016, partially offset by significant reductions in nearly all of our expense categories. During the firstsecond quarter of 2016, we recognized a net loss of $185.2$380.7 million, or $0.53$1.03 per diluted common share, compared to a net loss of $107.7 million,$1.1 billion, or $0.31$3.28 per diluted common share, during the firstsecond quarter of 2015. The change in net loss between the firstsecond quarter of 2015 and 2016 was primarily due to the increase in the size of ourmuch smaller full cost pool ceiling test write-down of our oil and natural gas properties, which totaled $256.0$479.4 million ($160.5299.4 million net of tax) in the second quarter of 2016, compared to $1.7 billion ($1.1 billion net of tax) in the second quarter of 2015 (see Write-Down of Oil and Natural Gas Properties below), partially offset by a $95.0 million gain on debt extinguishment in the first quarter of 2016.. Other significant changes between the firstsecond quarter of 2015 and 2016 wereincluded a $109.7$120.2 million (37%(33%) decline in our oil and natural gas revenues between the periods which was primarily oil-price related,due to lower oil prices and production volumes, a $105.9$49.3 million decreaseincrease in commodity derivatives income,expense, and $34.7 million of other expenses in the second quarter of 2016, offset in part by a $72.6$81.4 million (48%(55%) decrease in depletion, depreciation, and amortization, a $38.6$32.2 million (27%(24%) reduction in lease operating expense, a $12.4$15.4 million (27%(41%) decrease in general and administrative expenses, and a $6.6$14.1 million (25%(42%) decrease in taxes other than income.income, and a $12.3 million gain on debt extinguishment in the second quarter of 2016. The $105.9$49.3 million decreaseincrease in commodity derivatives incomeexpense between the two periods was due to a $29.7$72.1 million increased loss associated with noncash fair value commodity adjustments and $76.2 million lesscomparative reduction in receipts from settlements of derivative contracts during the 2016 period.period, partially offset by a $22.8 million decrease in loss associated with noncash fair value commodity adjustments.
We generated $2.0$60.9 million of cash flows from operating activities in the second quarter of 2016, an increase of $58.9 million from the $2.0 million generated in the first quarter of 2016, compared to $164.9 million in the fourth quarter of 2015 and $137.8 million in the prior-year first quarter. These results include cash outflows for seasonal working capital changes of $54.8 million and $57.7 million during the three months ending March 31, 2016 and 2015, respectively, compared to cash inflows for working capital changes of $35.6 million during the three months ending December 31, 2015.2016. The decreasesequential increase in cash flows from operations betweenwas due primarily to quarter-to-quarter increases in oil prices, as well as reductions in general and administrative expenses, and a $22.8 million decrease in working capital outflows, partially offset by a decline in derivative settlements and the first$27.5 million cash outflow related to our legal settlement with Evolution Petroleum Corporation (“Evolution”). When compared to prior year, cash flows from operating activities decreased $228.1 million from $289.0 million in the prior-year second quarter, of 2015 and 2016 was due primarily to lower oil prices and production volumes, which caused a decrease in oil revenues, and approximately 51% lower receipts ona decline in derivative settlements, and the Evolution settlement, partially offset by reductions in lease operating expenses, general and administrative expenses, and taxes other than income.income, and changes in working capital items.
Denbury Resources Inc.
Management’s Discussion and Analysis of Financial Condition and Results of Operations
During the firstsecond quarter of 2016, our oil and natural gas production, which was 95%96% oil, averaged 69,35164,506 BOE/d, compared to an average of 74,35673,716 BOE/d produced during the firstsecond quarter of 2015 and 72,00269,351 BOE/d during the fourthfirst quarter of 2015.2016. The year-over-year and sequential quarterly declines were primarily due to weather-related shut-in production, production shut in due to economics, a higher net profits interest of a third party and downtime resulting from power failures and repair work at Cedar Creek Anticline (“CCA”), and natural production declines based on our lower capital spending level, coupled withlevel.
These production shutdecreases were partially offset by increases in production due to economics, ascontinued CO2 enhanced oil prices declined further duringrecovery response at Bell Creek Field in the quarter. We estimate that approximately 2,800 BOE/dRocky Mountain region. As a result of production was shut in asthe items discussed above and the planned sale of March 31, 2016 attributable to uneconomic wells, resulting in a decrease to sequential quarterlyour non-core Williston Assets, which had average production of approximately 1,1001,300 BOE/d. We estimate that approximately one-halfd for the first half of this year, we now expect our full-year 2016 production to range between 64,000 BOE/d and 66,000 BOE/d, as compared to our previous estimates of between 64,000 and 68,000 BOE/d, with our production for the remainder of the year being relatively flat with our second quarter production currently shut in is profitable at $50 per Bbl, approximately two-thirds at $60 per Bbl, withafter adjusting for the remainder requiring an oil price in excess of $60 per Bbl in order to be economic.planned asset sale. See Results of Operations – Production for further discussion.
Our average realized oil price per barrel, excluding the impact of commodity derivative contracts, was $30.71$43.38 per Bbl during the firstsecond quarter of 2016, a decrease of 33%24% compared to $46.02$56.92 per Bbl realized during the second quarter of 2015 and an increase of 41% compared to $30.71per Bbl realized during the first quarter of 2015 and a decrease of 24% compared to $40.41 per Bbl realized during the fourth quarter of 2015.2016. The oil price we realized relative to NYMEX oil prices (our NYMEX oil price differential) was $3.02$2.18 per Bbl below NYMEX prices in the firstsecond quarter of 2016, compared to a negative $2.810.89 per-Bbl NYMEX differential in the second quarter of 2015 and a negative $3.02 per-Bbl NYMEX differential in the first quarter of 2015 and a negative $1.74 per-Bbl NYMEX differential in the fourth quarter of 2015.2016. The weakening in our oil price differential in comparison to its level in the firstsecond quarter of 2015 was principally due to weakening of our Light Louisiana Sweet (“LLS”) premium relative to NYMEX oil prices.
One of our primary focuses in the past few years has been to reduce costs throughout the organization through a number of internal initiatives. As a result of these efforts, we have been able to make continued reductions in our lease operating expenses, and inwith total lease operating expenses of $100 million during the firstsecond quarter of 2016, these expenses were $16.23 per BOE, a 16% decrease on a sequential-quarter basis and a 23% decrease when compared to per-BOE levels in24% reduction from the first quarter of 2015. In addition, our recurring leaseprior-year second quarter. Lease operating expenses per BOE decreased in each sequentialduring the second quarter in 2014 and 2015 and decreased a total of 38% between fourth-quarter 2013 levels and those2016 were $17.04, as compared to $19.70 in the firstsecond quarter of 2016,2015, with decreases realized in most categories of lease operating expenses. On a sequential quarter basis, lease operating expenses per BOE increased 5% from the most significantfirst quarter of which were2016 primarily due to our 7% decline in production and higher workover expenses, while general and administrative expenses per BOE decreased 28% from the first quarter of 2016 due to lower employee-related costs CO2 costs, power costs,such as salaries and certain third-party contractorpayroll taxes following the involuntary workforce reduction in the first quarter of 2016. General and vendor costs.administrative expenses in the first quarter of 2016 also included severance-related payments of approximately $9.3 million.
Write-Down of Oil and Natural Gas Properties. Due to a continued decline in the rolling first-day-of-the-month average oil and natural gas price for the preceding 12-month periods in 2015 and 2016, we recognized full cost pool ceiling test write-downs of $256.0$479.4 million and $146.2 million$1.7 billion during the three months ended March 31,June 30, 2016 and March 31,June 30, 2015, respectively. See Note 1, Basis of Presentation – Write-Down of Oil and Natural Gas Properties, to the Unaudited Condensed Consolidated Financial Statements, and Results of Operations – Write-Down of Oil and Natural Gas Properties for additional information regarding the ceiling test.
Impact of Commodity Price Decline on Proved OilGrieve Field Revised Joint Venture. On August 4, 2016, the Company and Natural Gas Reserves Quantities. Declinesits joint venture partner in commodity prices may materially impact estimated quantities of proved reserves, as certain reserves may reachGrieve Field, located in Wyoming, reached an agreement to revise the point at which they become uneconomic to produce earlier than they would otherwise. The SEC requires proved reserves to be determined based on average first-day-of-the-month oil and natural gas pricesjoint venture arrangement between the parties for the trailing 12-month period. Using these prices,continued development of such field. The revised agreement provides for our total proved reserves at December 31, 2015, were 288.6 MMBOE,partner to fund the remaining estimated capital of which 98% was oil$55 million to complete development of the facility and 2% was natural gas. During 2015fieldwork in exchange for a 14% higher working interest and the first quartera disproportionate sharing of 2016, the average first-day-of-the-month NYMEX oil price used in estimating our proved reserves declined from $50.28 per Bbl at December 31, 2015, to $46.26 per Bbl at March 31, 2016, and for natural gas declined from $2.63 per MMBtu at December 31, 2015, to $2.45 per MMBtu at March 31, 2016. Although we had no significant change in our reserve quantitiesrevenue during the first quarter2 million barrels of 2016, based on current NYMEX futures prices, during 2016,production. As a result of this agreement, our working interest in the field will be reduced from 65% to 51%. This arrangement will accelerate the remaining development of the facility and fieldwork, which we currently expect negative price revisionsnow anticipate should be complete by the middle of less than 10% of our 2015 year-end proved reserves. The actual reserve revisions could occur for various reasons, including differences in actual commodity prices from commodity futures prices and changes in oil and natural gas price differentials, forecasted production rates, forecasted operating and capital costs, and changes in development plans, all of which are key assumptions in estimating proved oil and natural gas reserves.2018.
CAPITAL RESOURCES AND LIQUIDITY
Overview. Our primary sources of capital and liquidity are our cash flows from operations and availability of borrowing capacity under our senior secured bank credit facility. Outstanding borrowings under our senior secured bank credit facility were $310.0 million as of March 31, 2016, compared to $175.0 million as of December 31, 2015. The $135.0 million increase in borrowings includes $55.5 million utilized to repurchase $152.3 million in aggregate principal amount of senior subordinated notes in open-market transactions, with the remainder primarily due to seasonal working capital outflows in the first quarter of 2016 associated with accrued compensation, ad valorem taxes and semi-annual interest payments on our senior subordinated notes. As a result of the significant reduction in oil prices discussed above and less advantageous hedge positions, our cash flow from operations has significantly decreased, from $289.0 million during the three months ended June 30, 2015, to $60.9 million during the three months ended June 30, 2016.
Denbury Resources Inc.
Management’s Discussion and Analysis of Financial Condition and Results of Operations
operations has significantly decreased, from $137.8 million during the three months ended March 31, 2015 and $164.9 million during the three months ended December 31, 2015, to $2.0 million during the three months ended March 31, 2016.
The culmination of these factors places a significant priority on the preservation of cash and liquidity remains a significant priority until oil prices improve. We have taken and will continue to take steps to lower our costs in all categories of our business, and we have made significant progress in that regard. WeOver the past year, we have also amended our Bank Credit Agreement in the first quarter of 2016bank credit facility to relax certain bank covenants through 20172018 to address potential covenant compliance issues if oil prices remain atreturn to levels comparable to those realized in the first quarter of 2016. As of March 31,June 30, 2016, we had $310.0$320.0 million drawn on our $1.05 billion senior secured bank credit facility, leaving us $680.7$670.7 million of current liquidity after consideration of $59.3 million of outstanding letters of credit and adjusting for the recently revised lender commitment level of $1.05 billion.credit. This liquidity, coupled with our other cost saving and liquidity measures, should be sufficient to supplement our capital or operating cash outflows as needed until oil prices improve, which we believe will be in the next twelve to eighteen months. Based upon our current forecasted levels of production and costs, hedges in place as of May 2, 2016, and current oil commodity futures prices, we currently anticipate continuing to be in compliance with our bank covenants during 2016 and 2017.
To protect our liquidity, we have entered into additional oil swaps and collars for the second half of 2016 and the first halfthree quarters of 2017, such that we now have hedged approximately two-thirds of our estimated oil production through the first quarter of 2017 and approximately half of our estimated oil production hedged throughin the first halfsecond quarter of 2017. While a portion of these derivatives are fixed-price swaps at prices arethat do not sufficient to provide enough cash flow tosupport capital spending levels which would grow our production, they do at least cover our most recent total cash costs, which were in a per-barrel range in the low $30’s in the firstsecond quarter of 2016, including corporate overhead and interest, thereby minimizing the amount that would be required for day-to-day operations from our bank line.
Since we do not expect oil prices to recover to recent historical highs, we must adjust our business to compete in an oil price environment that is likely not as robust as it was a few years ago, requiring reductions in overall debt levels over time. We have made significant progress in this endeavor with a net debt reduction of $545 million through August 3, 2016, which lowers the urgency for other reductions, but we would prefer to reduce our debt further. Our subordinated debt is still trading below par, which provides further opportunities to acquire the debt at a discount, although such purchases are not as advantageous as they were earlier in 2016 and we must also be conscious of our liquidity in case oil prices were to remain lower or drop below current levels.
We plan to continue reviewing our options to reduce such debt which may include purchases of our subordinated debt in the open market, cash tenders for such debt or debt exchanges, and longer-term, potentially issuances of equity, asset sales and other cash-generating activities. We may utilize a portion of our bank line for such repurchases and may also consider other forms of capital such as second lien notes or other senior notes. Such activities will depend on the availability and cost of such capital and relevant market conditions, including oil prices and market trading levels of our subordinated notes. Any purchases of debt may be made in the open market, in privately negotiated transactions, through tender or exchange offers or otherwise.
Senior Secured Bank Credit Facility. In December 2014, we entered into an Amended and Restated Credit Agreement with JPMorgan Chase Bank, N.A., as administrative agent, and other lenders party thereto (the “Bank Credit Agreement”). As of March 31,June 30, 2016, we had $310.0$320.0 million of debt outstanding (based on a $1.05 billion borrowing base and commitment level from our banks) and $59.3 million in letters of credit on the senior secured bank credit facility. In order to provide more flexibility in managing our balance sheet, the credit extended by our lenders, and continuing compliance with maintenance financial covenants in this low oil price environment, we have entered into three amendments to the Bank Credit Agreement between May 2015 and April 2016 that have modified the Bank Credit Agreement as follows:
for 2016 and 2017, the maximum permitted ratio of consolidated total net debt to consolidated EBITDAX covenant has been suspended and replaced by a maximum permitted ratio of consolidated senior secured debt to consolidated EBITDAX covenant of 3.0 to 1.0 (currently, only debt under our Bank Credit Agreement is considered consolidated senior secured debt for purposes of this ratio);
for 2016 and 2017, a new covenant has been added to require a minimum permitted ratio of consolidated EBITDAX to consolidated interest charges of 1.25 to 1.0;
beginning in the first quarter of 2018, the ratio of consolidated total net debt to consolidated EBITDAX covenant will be reinstated, utilizing an annualized EBITDAX amount for the first, quartersecond, and third quarters of 2018 and building to a trailing four quarters by the end of 2018, with the maximum permitted ratios being 6.0 to 1.0 for the first quarter ending March 31, 2018, 5.5 to 1.0 for the second quarter ending June 30, 2018, and 5.0 to 1.0 for the third and fourth quarters ending September 30 and December 31, 2018, and returning to 4.25 to 1.0 for the first quarter ending March 31, 2019;
allows for the incurrence of up to $1.0 billion of junior lien debt (subject to customary requirements);, with $385.1 million of future incurrence available as of June 30, 2016;
limits unrestricted cash and cash equivalents to $225 million if more than $250 million of borrowings are outstanding under the Bank Credit Agreement; and
Denbury Resources Inc.
Management’s Discussion and Analysis of Financial Condition and Results of Operations
limits the amount spent on repurchases or other redemptions of our senior subordinated notes to $225 million.million, with $169.5 million available as of June 30, 2016.
For these financial performance covenant calculations as of March 31,June 30, 2016, our ratio of consolidated senior secured debt to consolidated EBITDAX was 0.360.45 to 1.0, our ratio of consolidated EBITDAX to consolidated interest charges was 4.714.01 to 1.0, and our current ratio was 4.99.3.57. Based upon our currentcurrently forecasted levels of production and costs, hedges in place as of May 2,August 3, 2016, and current oil commodity futures prices, we currently anticipate continuing to be in compliance with our bank covenants during 2016 and 2017.
The above description of our Bank Credit Agreement financial covenants and the changes provided for within the three amendments are qualified by the express language and defined terms contained in the Bank Credit Agreement, the First Amendment to the Bank Credit Agreement dated May 4, 2015, the Second Amendment to the Bank Credit Agreement dated February 17, 2016, (the “Second Amendment”), and the Third Amendment to the Bank Credit Agreement dated April 18, 2016, (the “Third Amendment”), each of which are filed as exhibits to our periodic reports filed with the SEC.
privately negotiated debt exchange agreements and open-market debt repurchase transactions, resulting in a net reduction of our debt principal balance of approximately $545 million. During May 2016, we entered into privately negotiated exchange agreements to exchange $175.1 million principal amount of our 6⅜% Senior Subordinated Notes due 2021 (“2021 Notes”), $411.0 million principal amount of our 5½% Senior Subordinated Notes due 2022 (“2022 Notes”), and $471.7 million principal amount of our 4⅝% Senior Subordinated Notes due 2023 (“2023 Notes”) for $614.9 million principal amount of new 2021 Senior Secured Notes plus 40.7 million shares of Denbury Resources Inc.
Management’s Discussion and Analysiscommon stock, resulting in a net reduction from these exchanges of Financial Condition and Results$442.9 million in our debt principal. Our Bank Credit Agreement allows for the incurrence of Operations
up to $1.0 billion of junior lien debt, so after taking these exchanges into account, we have an additional $385.1 million of junior lien debt capacity that remains available to us.
2016 Repurchases of Senior Subordinated Notes.During the first quarter of 2016, we repurchased a total of $152.3 million in aggregate principal amount of our existing senior subordinated notes in open-market transactions, consisting of $4.0 million in aggregate principal amount of our 6⅜% Senior Subordinated2021 Notes, due 2021 (the “2021 Notes”), $42.3 million in aggregate principal amount of our 5½% Senior Subordinated2022 Notes, due 2022 (the “2022 Notes”), and $106.0 million in aggregate principal amount of our 4⅝% Senior Subordinated2023 Notes due 2023 (the “2023 Notes”) for a total purchase price of $55.5 million, excluding accrued interest. The repurchases were made at prices ranging from approximately 25% to 45% of the principal amount of the individual senior subordinated notes. In connection with these transactions, we recognized a $95.0 million gain on debt extinguishment, net of unamortized debt issuance costs written off. During July 2016, we repurchased an additional $19.6 million of senior subordinated notes in open-market transactions, consisting of $3.3 million principal amount of our 2021 Notes and $16.3 million principal amount of our 2022 Notes in open-market transactions for a total purchase price of $14.2 million, excluding accrued interest. We currently estimate savingcombined cash interest savings of approximately $6$7 million in annual cash interest related to these repurchases which takes into account the reduction in debt and the lower interest rate on ourexchange transactions. Our bank credit facility as compared to the senior subordinated notes. The Second Amendmentagreement limits the cash amount of thesethat we may spend on open-market repurchases of our senior subordinated notes to $225 million, soand as of May 4,August 3, 2016, after taking these repurchases into account, we have an additional $169.5$155.3 million of remaining capacity to spend on senior subordinated notes repurchases.
2016 Senior Subordinated Notes Exchange Agreements. During the first week of May 2016, we entered into privately negotiated exchange agreements to exchange $126.6 million in aggregate principal amount of our 2021 Notes, $351.6 million in aggregate principal amount of our 2022 Notes, and $444.2 million in aggregate principal amount of our 2023 Notes for $531.2 million in aggregate principal amount of new 9% Senior Secured Second Lien Notes due 2021 plus 36.9 million shares of Denbury common stock. The transactions are currently expected to close May 10, 2016, subject to customary closing conditions. We expect to realize a minimal reduction in cash interest related to these transactions. Our Bank Credit Agreement allows for the incurrence of up to $1.0 billion of junior lien debt, so after taking these exchanges into account, we have an additional $468.8 million of junior lien debt capacity that remains available to us. Combined with the repurchases of senior subordinated notes in open-market transactions during February and March 2016, these transactions will result in a net reduction of the Company’s debt of approximately $488 million.or other redemptions.
Capital Spending. We anticipate that our full-year 2016 capital budget, excluding capitalized interest and acquisitions, will be approximately $200 million, which includes approximately $55 million in capitalized internal acquisition, exploration and development costs and pre-production tertiary startup costs. However, we could potentially adjust this budget higher or lower based on changes in estimated levels of cash flow. This combined 2016 capital budget amount, excluding capitalized interest and acquisitions, is comprised of the following:
$100 million allocated for tertiary oil field expenditures;
$35 million allocated for other areas, primarily non-tertiary oil field expenditures;
| |
| • | $10 million to be spent on CO2 sources and pipeline construction; and |
$55 million for other capital items such as capitalized internal acquisition, exploration and development costs and pre-production tertiary startup costs.
Based upon our currently forecasted levels of production and costs, commodity hedges in place, and current oil commodity futures prices, we intend to fund our development capital spending primarily with cash flow from operations, with any potential shortfall funded with incremental borrowings under our senior secured bank credit facility, and as of March 31,June 30, 2016, we had ample availability on our senior secured bank credit facility to cover any foreseeable cash flow shortfall. If prices were to decrease further or changes in operating results were to cause us to have a reduction in anticipated 2016 cash flows below our currently forecasted
Denbury Resources Inc.
Management’s Discussion and Analysis of Financial Condition and Results of Operations
operating cash flows, we could potentially make minor additional reductions in our capital expenditures, as further significant reductions in our capital spending are limited to some degree by existing prior commitments and capitalized items. If we further reduce our capital spending due to lower cash flows, any sizeable reduction could further lower our anticipated production levels in future years.
Denbury Resources Inc.
Management’s Discussion and Analysis of Financial Condition and Results of Operations
Capital Expenditure Summary. The following table reflects incurred capital expenditures (including accrued capital) for the threesix months ended March 31,June 30, 2016 and 2015:
| | | | | Three Months Ended | | Six Months Ended |
| | | March 31, | | June 30, |
| In thousands | | 2016 | | 2015 | | 2016 | | 2015 |
| Capital expenditures by project | | | | | | | | |
| Tertiary oil fields | | $ | 31,964 |
| | $ | 42,900 |
| | $ | 63,898 |
| | $ | 96,594 |
|
| Non-tertiary fields | | 5,873 |
| | 30,984 |
| | 10,776 |
| | 52,579 |
|
Capitalized internal costs (1) | | 14,473 |
| | 18,412 |
| | 25,787 |
| | 33,911 |
|
| Oil and natural gas capital expenditures | | 52,310 |
| | 92,296 |
| | 100,461 |
| | 183,084 |
|
CO2 pipelines | | — |
| | 779 |
| | 135 |
| | 6,296 |
|
CO2 sources (2) | | — |
| | 9,852 |
| | — |
| | 10,482 |
|
| Other | | 8 |
| | (238 | ) | | 17 |
| | 44 |
|
| Capital expenditures, before acquisitions and capitalized interest | | 52,318 |
| | 102,689 |
| | 100,613 |
| | 199,906 |
|
| Acquisitions of oil and natural gas properties | | 224 |
| | 261 |
| | 904 |
| | 21,959 |
|
| Capital expenditures, before capitalized interest | | 52,542 |
| | 102,950 |
| | 101,517 |
| | 221,865 |
|
| Capitalized interest | | 5,780 |
| | 8,409 |
| | 12,069 |
| | 17,147 |
|
| Capital expenditures, total | | $ | 58,322 |
| | $ | 111,359 |
| | $ | 113,586 |
| | $ | 239,012 |
|
| |
| (1) | Includes capitalized internal acquisition, exploration and development costs and pre-production tertiary startup costs. |
| |
(2) | Includes capital expenditures related to the Riley Ridge gas processing facility. |
For the threesix months ended March 31,June 30, 2016, our capital expenditures and property acquisitions were funded primarily with cash flows from operations and borrowings on our senior secured bank credit facility, as our cash flow was usedwith these incremental borrowings primarily being required to cover other working capital changes.outflows during the period. For the threesix months ended March 31,June 30, 2015, our capital expenditures and property acquisitions were fully funded with cash flows from operations.
Off-Balance Sheet Arrangements. Our off-balance sheet arrangements include operating leases for office space and various obligations for development and exploratory expenditures that arise from our normal capital expenditure program or from other transactions common to our industry, none of which are recorded on our balance sheet. In addition, in order to recover our undeveloped proved reserves, we must also fund the associated future development costs estimated in our proved reserve reports.
In the second quarter of 2016, we amended our CO2 offtake agreement with Mississippi Power Company (“MSPC”), which amendment included increasing our offtake percentage from 70% to 100% of CO2 quantities produced and lowering the base price related to the cost of CO2, deliveries of which are currently expected to begin in the second half of 2016. Based on the amended terms in the agreement, we concluded for accounting purposes that the agreement contains an embedded lease related to the pipeline owned by MSPC used to transport CO2 to Denbury. We currently plan to record a capital lease on the balance sheet of approximately $110 million upon lease commencement.
Our commitments and obligations consist of those detailed as of December 31, 2015, in our Form 10-K under Management’s Discussion and Analysis of Financial Condition and Results of Operations – Capital Resources and Liquidity – Commitments and Obligations.
Denbury Resources Inc.
Management’s Discussion and Analysis of Financial Condition and Results of Operations
RESULTS OF OPERATIONS
Our tertiary operations represent a significant portion of our overall operations and are our primary long-term strategic focus. The economics of a tertiary field and the related impact on our financial statements differ from a conventional oil and gas play, and we have outlined certain of these differences in our Form 10-K and other public disclosures. Our focus on these types of operations impacts certain trends in both current and long-term operating results. Please refer to Management’s Discussion and Analysis of Financial Condition and Results of Operations – Financial Overview of Tertiary Operations in our Form 10-K for further information regarding these matters.
Denbury Resources Inc.
Management’s Discussion and Analysis of Financial Condition and Results of Operations
Operating Results Table
Certain of our operating results and statistics for the comparative three and six months ended March 31,June 30, 2016 and 2015 are included in the following table:
| | | | | Three Months Ended | | Three Months Ended | | Six Months Ended |
| | | March 31, | | June 30, | | June 30, |
| In thousands, except per-share and unit data | | 2016 | | 2015 | | 2016 | | 2015 | | 2016 | | 2015 |
| Operating results | | | | | | | | | | | | |
Net income (loss) (1) | | $ | (185,193 | ) | | $ | (107,746 | ) | |
Net income (loss) per common share – basic (1) | | (0.53 | ) | | (0.31 | ) | |
Net income (loss) per common share – diluted (1) | | (0.53 | ) | | (0.31 | ) | |
Net loss (1) | | | $ | (380,668 | ) | | $ | (1,148,499 | ) | | $ | (565,861 | ) | | $ | (1,256,245 | ) |
Net loss per common share – basic (1) | | | (1.03 | ) | | (3.28 | ) | | (1.58 | ) | | (3.59 | ) |
Net loss per common share – diluted (1) | | | (1.03 | ) | | (3.28 | ) | | (1.58 | ) | | (3.59 | ) |
| Dividends declared per common share | | — |
| | 0.0625 |
| | — |
| | 0.0625 |
| | — |
| | 0.1250 |
|
| Net cash provided by operating activities | | 2,029 |
| | 137,764 |
| | 60,915 |
| | 288,957 |
| | 62,944 |
| | 426,721 |
|
| Average daily production volumes | | |
| | |
| | |
| | |
| | |
| | |
|
| Bbls/d | | 66,139 |
| | 70,564 |
| | 61,952 |
| | 69,837 |
| | 64,045 |
| | 70,199 |
|
| Mcf/d | | 19,270 |
| | 22,752 |
| | 15,328 |
| | 23,273 |
| | 17,299 |
| | 23,014 |
|
BOE/d (2) | | 69,351 |
| | 74,356 |
| | 64,506 |
| | 73,716 |
| | 66,929 |
| | 74,034 |
|
| Operating revenues | | |
| | |
| | |
| | |
| | |
| | |
|
| Oil sales | | $ | 184,816 |
| | $ | 292,270 |
| | $ | 244,572 |
| | $ | 361,732 |
| | $ | 429,388 |
| | $ | 654,002 |
|
| Natural gas sales | | 2,987 |
| | 5,200 |
| | 2,096 |
| | 5,159 |
| | 5,083 |
| | 10,359 |
|
| Total oil and natural gas sales | | $ | 187,803 |
| | $ | 297,470 |
| | $ | 246,668 |
| | $ | 366,891 |
| | $ | 434,471 |
| | $ | 664,361 |
|
Commodity derivative contracts (3) | | |
| | |
| | |
| | |
| | |
| | |
|
| Receipt on settlements of commodity derivatives | | $ | 72,227 |
| | $ | 148,465 |
| | $ | 52,026 |
| | $ | 124,151 |
| | $ | 124,253 |
| | $ | 272,616 |
|
Noncash fair value adjustments on commodity derivatives (4) | | (95,053 | ) | | (65,389 | ) | | (150,235 | ) | | (173,077 | ) | | (245,288 | ) | | (238,466 | ) |
| Commodity derivatives income (expense) | | $ | (22,826 | ) | | $ | 83,076 |
| | $ | (98,209 | ) | | $ | (48,926 | ) | | $ | (121,035 | ) | | $ | 34,150 |
|
| Unit prices – excluding impact of derivative settlements | | |
| | |
| | |
| | |
| | |
| | |
|
| Oil price per Bbl | | $ | 30.71 |
| | $ | 46.02 |
| | $ | 43.38 |
| | $ | 56.92 |
| | $ | 36.84 |
| | $ | 51.47 |
|
| Natural gas price per Mcf | | 1.70 |
| | 2.54 |
| | 1.50 |
| | 2.44 |
| | 1.61 |
| | 2.49 |
|
Unit prices – including impact of derivative settlements (3) | | | | |
| | | | |
| | |
| | |
| Oil price per Bbl | | $ | 42.71 |
| | $ | 69.28 |
| | $ | 52.61 |
| | $ | 76.30 |
| | $ | 47.50 |
| | $ | 72.79 |
|
| Natural gas price per Mcf | | 1.70 |
| | 2.91 |
| | 1.50 |
| | 2.89 |
| | 1.61 |
| | 2.90 |
|
| Oil and natural gas operating expenses | | | | |
| | | | |
| | |
| | |
| Lease operating expenses | | $ | 102,447 |
| | $ | 141,084 |
| | $ | 100,019 |
| | $ | 132,170 |
| | $ | 202,466 |
| | $ | 273,254 |
|
| Marketing expenses, net of third-party purchases, and plant operating expenses | | 11,592 |
| | 9,843 |
| | 10,890 |
| | 12,494 |
| | 22,482 |
| | 22,337 |
|
| Production and ad valorem taxes | | 17,178 |
| | 22,899 |
| | 17,040 |
| | 29,718 |
| | 34,218 |
| | 52,617 |
|
| Oil and natural gas operating revenues and expenses per BOE | | | | |
| | | | |
| | |
| | |
| Oil and natural gas revenues | | $ | 29.76 |
| | $ | 44.45 |
| | $ | 42.02 |
| | $ | 54.69 |
| | $ | 35.67 |
| | $ | 49.58 |
|
| Lease operating expenses | | 16.23 |
| | 21.08 |
| | 17.04 |
| | 19.70 |
| | 16.62 |
| | 20.39 |
|
| Marketing expenses, net of third-party purchases, and plant operating expenses | | 1.84 |
| | 1.47 |
| | 1.85 |
| | 1.86 |
| | 1.84 |
| | 1.66 |
|
| Production and ad valorem taxes | | 2.72 |
| | 3.42 |
| | 2.90 |
| | 4.43 |
| | 2.81 |
| | 3.93 |
|
CO2 sources – revenues and expenses | | |
| | |
| | |
| | |
| | |
| | |
|
CO2 sales and transportation fees | | $ | 6,272 |
| | $ | 6,972 |
| | $ | 6,622 |
| | $ | 7,152 |
| | $ | 12,894 |
| | $ | 14,124 |
|
CO2 discovery and operating expenses | | (607 | ) | | (947 | ) | | (1,071 | ) | | (945 | ) | | (1,678 | ) | | (1,892 | ) |
CO2 revenue and expenses, net | | $ | 5,665 |
| | $ | 6,025 |
| | $ | 5,551 |
| | $ | 6,207 |
| | $ | 11,216 |
| | $ | 12,232 |
|
Denbury Resources Inc.
Management’s Discussion and Analysis of Financial Condition and Results of Operations
| |
| (1) | Includes full cost pool ceiling test write-downs of $256.0$479.4 million and $146.2$735.4 million for the three and six months ended March 31,June 30, 2016, respectively, and March 31,$1.7 billion and $1.9 billion for the three and six months ended June 30, 2015, respectively. |
| |
| (2) | Barrel of oil equivalent using the ratio of one barrel of oil to six Mcf of natural gas (“BOE”). |
Denbury Resources Inc.
Management’s Discussion and Analysis of Financial Condition and Results of Operations
| |
| (3) | See also Commodity Derivative Contracts below and Item 3. Quantitative and Qualitative Disclosures about Market Risk for information concerning our derivative transactions. |
| |
| (4) | Noncash fair value adjustments on commodity derivatives is a non-GAAP measure and is different from “Commodity derivatives expense (income)” in the Unaudited Condensed Consolidated Statements of Operations in that the noncash fair value adjustments on commodity derivatives represent only the net changechanges between periods of the fair market values of commodity derivative positions, and exclude the impact of settlements on commodity derivatives during the period, which were receipts on settlements of $72.252.0 million and $124.3 million for the three and six months ended March 31,June 30, 2016, compared to receipts on settlements of $148.5$124.2 million and $272.6 million for the three and six months ended March 31,June 30, 2015. We believe that noncash fair value adjustments on commodity derivatives is a useful supplemental disclosure to “Commodity derivatives expense (income)” in order to differentiate noncash fair market value adjustments from receipts or payments upon settlements on commodity derivatives during the period.periods presented. This supplemental disclosure is widely used within the industry and by securities analysts, banks and credit rating agencies in calculating EBITDA and in adjusting net income (loss) to present those measures on a comparative basis across companies, as well as to assess compliance with certain debt covenants. Noncash fair value adjustments on commodity derivatives is not a measure of financial or operating performance under GAAP, nor should it be considered in isolation or as a substitute for “Commodity derivatives expense (income)” in the Unaudited Condensed Consolidated Statements of Operations. |
Denbury Resources Inc.
Management’s Discussion and Analysis of Financial Condition and Results of Operations
Production
Average daily production by area for each of the four quarters of 2015 and for the first quarterand second quarters of 2016 is shown below:
| | | | | Average Daily Production (BOE/d) | | Average Daily Production (BOE/d) |
| | First Quarter | | Second Quarter | | Third Quarter | | Fourth Quarter | | | First Quarter | | First Quarter | | Second Quarter |
| Third Quarter |
| Fourth Quarter | | | First Quarter |
| Second Quarter |
| Operating Area | | 2015 | | 2015 | | 2015 | | 2015 | | | 2016 | | 2015 | | 2015 |
| 2015 |
| 2015 | | | 2016 |
| 2016 |
| Tertiary oil production | | | | | | | | | | | | | | | | | | | | | | | | |
| Gulf Coast region | | | | | | | | | | | | | | | | | | | | | | | | |
Mature properties (1) | | 10,801 |
| | 11,170 |
|
| 10,946 |
| | 10,403 |
| | | 9,666 |
| | 10,801 |
| | 11,170 |
|
| 10,946 |
|
| 10,403 |
| | | 9,666 |
| | 9,415 |
|
| Delhi | | 3,551 |
| | 3,623 |
| | 3,676 |
| | 3,898 |
| | | 3,971 |
| | 3,551 |
| | 3,623 |
|
| 3,676 |
|
| 3,898 |
| | | 3,971 |
| | 3,996 |
|
| Hastings | | 4,694 |
| | 5,350 |
| | 5,114 |
| | 5,082 |
| | | 5,068 |
| | 4,694 |
| | 5,350 |
|
| 5,114 |
|
| 5,082 |
| | | 5,068 |
| | 4,972 |
|
| Heidelberg | | 6,027 |
| | 5,885 |
| | 5,600 |
| | 5,635 |
| | | 5,346 |
| | 6,027 |
| | 5,885 |
|
| 5,600 |
|
| 5,635 |
| | | 5,346 |
| | 5,246 |
|
| Oyster Bayou | | 5,861 |
| | 5,936 |
| | 5,962 |
| | 5,831 |
| | | 5,494 |
| | 5,861 |
| | 5,936 |
|
| 5,962 |
|
| 5,831 |
| | | 5,494 |
| | 5,088 |
|
| Tinsley | | 8,928 |
| | 8,740 |
| | 7,311 |
| | 7,522 |
| | | 7,899 |
| | 8,928 |
| | 8,740 |
|
| 7,311 |
|
| 7,522 |
| | | 7,899 |
| | 7,335 |
|
| Total Gulf Coast region | | 39,862 |
|
| 40,704 |
| | 38,609 |
| | 38,371 |
| |
| 37,444 |
| | 39,862 |
|
| 40,704 |
|
| 38,609 |
|
| 38,371 |
| |
| 37,444 |
| | 36,052 |
|
| Rocky Mountain region | | | | | | | | | | | | | | |
|
|
|
|
| | |
| |
|
|
| Bell Creek | | 1,965 |
| | 1,880 |
| | 2,225 |
| | 2,806 |
| | | 3,020 |
| | 1,965 |
| | 1,880 |
|
| 2,225 |
|
| 2,806 |
| | | 3,020 |
| | 3,160 |
|
| Total Rocky Mountain region | | 1,965 |
| | 1,880 |
| | 2,225 |
| | 2,806 |
| | | 3,020 |
| | 1,965 |
| | 1,880 |
|
| 2,225 |
|
| 2,806 |
| | | 3,020 |
| | 3,160 |
|
| Total tertiary oil production | | 41,827 |
| | 42,584 |
| | 40,834 |
| | 41,177 |
| | | 40,464 |
| | 41,827 |
| | 42,584 |
|
| 40,834 |
|
| 41,177 |
| | | 40,464 |
| | 39,212 |
|
| Non-tertiary oil and gas production | | | | | | | | | | | | | | | | | | | | | | | | |
| Gulf Coast region | | | | | | | | | | | | | | | | | | | | | | | | |
| Mississippi | | 1,761 |
| | 1,400 |
| | 1,592 |
| | 1,800 |
| | | 978 |
| | 1,761 |
| | 1,400 |
| | 1,592 |
| | 1,800 |
| | | 978 |
| | 1,280 |
|
| Texas | | 6,490 |
| | 6,304 |
| | 6,508 |
| | 6,470 |
| | | 6,148 |
| | 6,490 |
| | 6,304 |
| | 6,508 |
| | 6,470 |
| | | 6,148 |
| | 4,104 |
|
| Other | | 1,006 |
| | 906 |
| | 846 |
| | 800 |
| | | 549 |
| | 1,006 |
| | 906 |
| | 846 |
| | 800 |
| | | 549 |
| | 456 |
|
| Total Gulf Coast region | | 9,257 |
| | 8,610 |
| | 8,946 |
| | 9,070 |
| | | 7,675 |
| | 9,257 |
| | 8,610 |
|
| 8,946 |
|
| 9,070 |
| | | 7,675 |
|
| 5,840 |
|
| Rocky Mountain region | | | | | | | | | | | | | | | | | | | | | | | | |
| Cedar Creek Anticline | | 18,522 |
| | 18,089 |
| | 17,515 |
| | 17,875 |
| | | 17,778 |
| | 18,522 |
| | 18,089 |
|
| 17,515 |
|
| 17,875 |
| | | 17,778 |
|
| 16,325 |
|
| Other | | 4,750 |
| | 4,433 |
| | 4,115 |
| | 3,880 |
| | | 3,434 |
| | 4,750 |
| | 4,433 |
|
| 4,115 |
|
| 3,880 |
| | | 3,434 |
|
| 3,129 |
|
| Total Rocky Mountain region | | 23,272 |
| | 22,522 |
| | 21,630 |
| | 21,755 |
| | | 21,212 |
| | 23,272 |
| | 22,522 |
|
| 21,630 |
|
| 21,755 |
| | | 21,212 |
|
| 19,454 |
|
| Total non-tertiary production | | 32,529 |
| | 31,132 |
| | 30,576 |
| | 30,825 |
| |
| 28,887 |
| | 32,529 |
| | 31,132 |
|
| 30,576 |
|
| 30,825 |
| |
| 28,887 |
|
| 25,294 |
|
| Total production | | 74,356 |
| | 73,716 |
| | 71,410 |
| | 72,002 |
| | | 69,351 |
| | 74,356 |
| | 73,716 |
|
| 71,410 |
|
| 72,002 |
| | | 69,351 |
|
| 64,506 |
|
| Pending property sales | | | | | | | | | | | | | | |
Williston Assets (2) | | | (1,643 | ) | | (1,561 | ) | | (1,522 | ) | | (1,473 | ) | | | (1,364 | ) | | (1,267 | ) |
| Continuing production | | | 72,713 |
| | 72,155 |
| | 69,888 |
| | 70,529 |
| | | 67,987 |
| | 63,239 |
|
| |
| (1) | Mature properties include Brookhaven, Cranfield, Eucutta, Little Creek, Lockhart Crossing, Mallalieu, Martinville, McComb and Soso fields. |
| |
| (2) | Includes non-tertiary production in the Rocky Mountain region related to the sale of remaining non-core assets in the Williston Basin of North Dakota and Montana, expected to close in the third quarter of 2016. |
Denbury Resources Inc.
Management’s Discussion and Analysis of Financial Condition and Results of Operations
Total Production
Total production during the firstsecond quarter of 2016 averaged 69,35164,506 BOE/d, a decrease of 5,0054,845 BOE/d (7%) compared to first quarter of 20152016 production levels and a decrease of 2,6519,210 BOE/d (4%(12%) compared to fourthsecond quarter of 2015 production levels. The year-over-year and sequential quarterly declines were primarily due to weather-related shut-in production, production shut in due to economics, a higher net profits interest of a third party and downtime resulting from power failures and repair work at CCA, and natural production declines based on our lower capital spending level, coupled with production shut in due to economics, as oil prices declined further during the quarter. We estimate that approximately 2,800 BOE/d of production was shut in as of March 31, 2016 attributable to uneconomic wells, resulting in a decrease to sequential quarterly production of approximately 1,100 BOE/d. These decreases were partially offset by increases in production due to continued development at Bell Creek Field in the Rocky Mountain region. Our production during the three months ended March 31, 2016 was 95% oil, consistent with oil production during the three months ended March 31, 2015 and December 31, 2015.level. In mid-April 2016, a series of strong thunderstorms in the Houston area affected two Denbury fields, causing damage to a primary tank battery in Conroe Field and flooding at Thompson Field. Most of the impacted production at Conroe Field was back online in late-June 2016, with the remainder expected to be restored throughout the last half of 2016. As a result of these storms, we currently have approximately 2,000 Bbls/dwere beginning to return Thompson Field to production in late-May 2016, additional record rainfall in the area caused us to again shut in andproduction due to further flooding. We are currently working to restore full production in both fields. Wethe field, and expect to have most of this shut-in production back online by the end of May,August. These series of storms impacted quarterly production by approximately 1,450 BOE/d, which caused approximately one-third of the 7% sequential quarterly production decline.
Quarterly production was further impacted by production shut-in attributable to uneconomic wells, resulting in a decrease to quarterly production of approximately 2,750 BOE/d, representing an incremental decrease of approximately 300 BOE/d when compared to the first quarter of 2016 and approximately 2,100 BOE/d when compared to the second quarter of 2015. Although the quarterly production impact for these uneconomic wells was higher than the previous quarter, near the end of the second quarter, we began to restore some of these wells to production as oil prices were trending higher. As such, as of quarter end, we estimate that approximately 2,600 BOE/d of production remained shut in as of June 30, 2016 attributable to uneconomic wells, a reduction of approximately 200 BOE/d from March 31, 2016 levels.
These decreases were partially offset by increases in production due to continued CO2 enhanced oil recovery response at Bell Creek Field in the combinedRocky Mountain region. We currently estimate our production impact tofor the remainder of the year will be relatively flat with our second quarter production after adjusting for the planned sale of our non-core Williston Assets, which had average production of approximately 300 Bbls/1,300 BOE/d for the fullfirst half of this year. Our production during the three and six months ended June 30, 2016 was 96% oil, consistent with oil production of 95% during the three and six months ended June 30, 2015.
Tertiary Production
Oil production from our tertiary operations during the firstsecond quarter of 2016 decreased 713 Bbls/d (2%) when comparing the fourth quarter of 2015 and the first quarter of 2016 and decreased 1,3631,252 Bbls/d (3%) sequentially and by 3,372 Bbls/d (8%) compared to that in the same period in 2015. These decreases were primarily the result of natural production declines at Heidelberg Field, where future development has slowed due to commodity prices,seasonal facility processing constraints at Tinsley Field as the impact of warmer temperatures restricted CO2 injection and recycling, and at Oyster Bayou Field, wherewhich experienced downtime due to repairs and workovers. Although production isfrom these fields could have moderate increases in the third quarter of 2016 as production comes back online, both of these fields are believed to have peaked and our mature propertiestherefore are expected to generally decline in the Gulf Coast region,future. These declines were partially offset by increased production due to continued developmentCO2 enhanced oil recovery response at Bell Creek Field in the Rocky Mountain region. The year-over-year and sequential quarter changes were further impacted by first quarter of 2016 production at Tinsley Field, which decreased 1,029 Bbls/d from the prior year quarter, although production increased 377 Bbls/d from the fourth quarter of 2015. Although we experienced certain facility processing constraints at Tinsley Field during the third quarter of 2015, production has largely returned to normal levels; however, production from Tinsley Field is believed to have peaked in 2015, with a modest production decline currently expected in 2016.
Non-Tertiary Production
Production from our non-tertiary operations averaged 28,88725,294 BOE/d during the firstsecond quarter of 2016, a decrease of 1,9383,593 BOE/d (6%(12%) sequentially and a decrease of 5,838 BOE/d (19%) compared to the fourth quarter of 2015 levels and a decrease of 3,642 BOE/d (11%) compared to the firstsecond quarter of 2015 levels. The production declines were impacted byinclude weather-related downtime at Conroe and Thompson fields, as noted above, and production that we estimated to be attributable to wells shut in as uneconomic to either produce or repair due to commodity prices at this time.prices. In addition, the sequential and year-over-year changes include (1) decreases also includedat CCA due to the net profits interest of a third party, whereby improved operational efficiencies and margins have resulted in increased profitability and thus, lower reported production quantities net to Denbury of approximately 500 BOE/d when compared to the first quarter of 2016, (2) downtime at CCA resulting from weather-related power failures and repair work, resulting in a sequential decrease of approximately 150 BOE/d, and (3) natural production declines at Cedar Creek Anticline and our other non-tertiary Rocky Mountain properties and our non-tertiary properties in the Rocky Mountain and Gulf Coast.Coast regions.
Denbury Resources Inc.
Management’s Discussion and Analysis of Financial Condition and Results of Operations
Oil and Natural Gas Revenues
Our oil and natural gas revenues during the three and six months ended March 31,June 30, 2016 decreased 27% sequentially when compared to oil33% and natural gas revenues during the three months ended December 31, 2015 and decreased 37%35%, respectively, compared to these revenues for the same periodperiods in 2015. The changes in our oil and natural gas revenues are due to changes in production quantities and commodity prices (excluding any impact of our commodity derivative contracts), as reflected in the following table:
| | | | | Three Months Ended | | Three Months Ended | | Six Months Ended |
| | | March 31, | | June 30, | | June 30, |
| | | 2016 vs. 2015 | | 2016 vs. 2015 | | 2016 vs. 2015 |
| In thousands | | Decrease in Revenues | | Percentage Decrease in Revenues | | Decrease in Revenues | | Percentage Decrease in Revenues | | Decrease in Revenues | | Percentage Decrease in Revenues |
| Change in oil and natural gas revenues due to: | | | | | | | | | | | | |
| Decrease in production | | $ | (16,942 | ) | | (7 | )% | | $ | (45,836 | ) | | (12 | )% | | $ | (60,445 | ) | | (9 | )% |
| Decrease in commodity prices | | (92,725 | ) | | (30 | )% | | (74,387 | ) | | (21 | )% | | (169,445 | ) | | (26 | )% |
| Total decrease in oil and natural gas revenues | | $ | (109,667 | ) | | (37 | )% | | $ | (120,223 | ) | | (33 | )% | | $ | (229,890 | ) | | (35 | )% |
Excluding any impact of our commodity derivative contracts, our net realized commodity prices and NYMEX differentials were as follows during the first quarters, second quarters, and threesix months ended March 31,June 30, 2016 and 2015:
| | | | | Three Months Ended | | Three Months Ended | | Three Months Ended | | Six Months Ended |
| | | March 31, | | March 31, | | June 30, | | June 30, |
| | | 2016 | | 2015 | | 2016 | | 2015 | | 2016 | | 2015 | | 2016 | | 2015 |
| Average net realized prices: | | | | | | | | | | | | | | | | |
| Oil price per Bbl | | $ | 30.71 |
| | $ | 46.02 |
| | $ | 30.71 |
| | $ | 46.02 |
| | $ | 43.38 |
| | $ | 56.92 |
| | $ | 36.84 |
| | $ | 51.47 |
|
| Natural gas price per Mcf | | 1.70 |
| | 2.54 |
| | 1.70 |
| | 2.54 |
| | 1.50 |
| | 2.44 |
| | 1.61 |
| | 2.49 |
|
| Price per BOE | | 29.76 |
| | 44.45 |
| | 29.76 |
| | 44.45 |
| | 42.02 |
| | 54.69 |
| | 35.67 |
| | 49.58 |
|
| Average NYMEX differentials: | | |
| | |
| | |
| | |
| | |
| | |
| | |
| | |
|
| Oil per Bbl | | $ | (3.02 | ) | | $ | (2.81 | ) | | $ | (3.02 | ) | | $ | (2.81 | ) | | $ | (2.18 | ) | | $ | (0.89 | ) | | $ | (2.81 | ) | | $ | (1.87 | ) |
| Natural gas per Mcf | | (0.29 | ) | | (0.28 | ) | | (0.29 | ) | | (0.28 | ) | | (0.73 | ) | | (0.30 | ) | | (0.50 | ) | | (0.29 | ) |
As reflected in the table above, our average net realized oil price, excluding the impact of commodity derivative contracts, decreased 33%24% during the firstsecond quarter of 2016 from the average price received during the firstsecond quarter of 2015 and 24% whenincreased 41% compared to the fourthaverage price received during the first quarter of 2015.2016. Company-wide average oil price differentials in the firstsecond quarter of 2016 were $3.02$2.18 per Bbl below NYMEX, compared to an average differential of $2.81$0.89 per Bbl below NYMEX in the firstsecond quarter of 2015 and $1.74$3.02 per Bbl below NYMEX in the fourthfirst quarter of 2015,2016. The change versus prior year was principally due to weakening of our Gulf Coast region LLS price differentials, offset in part by Rocky Mountain region price differentials described below. Prices received in a regional market fluctuate frequently and can differ from NYMEX pricing due to a variety of reasons, including supply and/or demand factors, crude oil quality, and location differentials. The oil differentials we received in the Gulf Coast and Rocky Mountain regions are discussed in further detail below.
Our average NYMEX oil differential in the Gulf Coast region was a negative $1.95$1.22 per Bbl and $0.29a positive $1.86 per Bbl during the three months ended March 31,June 30, 2016 and 2015, respectively, and a negative $0.87$1.95 per Bbl during the three months ended DecemberMarch 31, 2015.2016. These differentials are impacted significantly by the changes in prices received for our crude oil sold under LLS index prices relative to the change in NYMEX prices, as well as various other price adjustments such as those noted above. The quarterly average LLS-to-NYMEX differential (on a trade-month basis) was a positive $2.04 per Bbl in the second quarter of 2016, down from a positive $6.29 per Bbl in the second quarter of 2015 and up from a positive $1.60 per Bbl in the first quarter of 2016, down from a positive $2.60 per Bbl in the first quarter of 2015 and a positive $2.08 per Bbl in the fourth quarter of 2015.2016. During the firstsecond quarter of 2016, we sold approximately 58%60% of our crude oil at prices based on, or partially tied to, the LLS index price, and the balance at prices based on various other indexes tied to NYMEX prices, primarily in the Rocky Mountain region.
Denbury Resources Inc.
Management’s Discussion and Analysis of Financial Condition and Results of Operations
the LLS index price, and the balance at prices based on various other indexes tied to NYMEX prices, primarily in the Rocky Mountain region.
NYMEX oil differentials in the Rocky Mountain region averaged $5.04$3.98 per Bbl and $7.75$6.48 per Bbl below NYMEX during the three months ended March 31,June 30, 2016 and 2015, respectively, and $3.41$5.04 per Bbl below NYMEX during the three months ended DecemberMarch 31, 2015.2016. Differentials in the Rocky Mountain region can fluctuate significantly on a month-to-month basis due to weather, refinery or transportation issues, and Canadian and U.S. crude oil price index volatility.
Commodity Derivative Contracts
The following table summarizes the impact our oil and natural gas derivative contracts had on our operating results for the three and six months ended March 31,June 30, 2016 and 2015:
| | | | | Three Months Ended March 31, | | Three Months Ended June 30, |
| | | 2016 | | 2015 | | 2016 | | 2015 | | 2016 | | 2015 | | 2016 | | 2015 | | 2016 | | 2015 | | 2016 | | 2015 |
| In thousands | | Crude Oil Derivative Contracts | | Natural Gas Derivative Contracts | | Total Commodity Derivative Contracts | | Crude Oil Derivative Contracts | | Natural Gas Derivative Contracts | | Total Commodity Derivative Contracts |
| Receipt on settlements of commodity derivatives | | $ | 72,227 |
| | $ | 147,716 |
| | $ | — |
| | $ | 749 |
| | $ | 72,227 |
| | $ | 148,465 |
| | $ | 52,026 |
| | $ | 123,183 |
| | $ | — |
| | $ | 968 |
| | $ | 52,026 |
| | $ | 124,151 |
|
Noncash fair value adjustments on commodity derivatives (1) | | (95,053 | ) | | (65,122 | ) | | — |
| | (267 | ) | | (95,053 | ) | | (65,389 | ) | | (150,235 | ) | | (172,022 | ) | | — |
| | (1,055 | ) | | (150,235 | ) | | (173,077 | ) |
| Total expense | | | $ | (98,209 | ) | | $ | (48,839 | ) | | $ | — |
| | $ | (87 | ) | | $ | (98,209 | ) | | $ | (48,926 | ) |
| | | | | | | | | | | | | | |
| | | | Six Months Ended June 30, |
| | | | 2016 | | 2015 | | 2016 | | 2015 | | 2016 | | 2015 |
| In thousands | | | Crude Oil
Derivative Contracts | | Natural Gas
Derivative Contracts | | Total Commodity
Derivative Contracts |
| Receipt on settlements of commodity derivatives | | | $ | 124,253 |
| | $ | 270,899 |
| | $ | — |
| | $ | 1,717 |
| | $ | 124,253 |
| | $ | 272,616 |
|
Noncash fair value adjustments on commodity derivatives (1) | | | (245,288 | ) | | (237,144 | ) | | — |
| | (1,322 | ) | | (245,288 | ) | | (238,466 | ) |
| Total income (expense) | | $ | (22,826 | ) | | $ | 82,594 |
| | $ | — |
| | $ | 482 |
| | $ | (22,826 | ) | | $ | 83,076 |
| | $ | (121,035 | ) | | $ | 33,755 |
| | $ | — |
| | $ | 395 |
| | $ | (121,035 | ) | | $ | 34,150 |
|
| |
| (1) | Noncash fair value adjustments on commodity derivatives is a non-GAAP measure. See Operating Results Table above for a discussion of the reconciliation between noncash fair value adjustments on commodity derivatives to “Commodity derivatives expense (income)” in the Unaudited Condensed Consolidated Statements of Operations. |
In order to protect our liquidity and provide price certainty to a portion of our oil production, we have hedged approximately two-thirds of our estimated oil production through the first quarter of 2017 and approximately half of our estimated oil production out throughin the second quarter of 2017. The following table summarizes our commodity derivative contracts2017 using both NYMEX and LLS fixed-price swaps and collars. Based on current futures prices as of May 2, 2016:
|
| | | | | | |
| | | 2Q16 | 3Q16 | 4Q16 | 1Q17 | 2Q17 |
| WTI NYMEX | Volumes Hedged (Bbls/d) | 11,500 | 18,500 | 26,000 | 22,000 | 22,000 |
| Fixed-Price Swaps | Swap Price (1) | $61.84 | $38.96 | $38.70 | $42.67 | $43.99 |
| WTI NYMEX | Volumes Hedged (Bbls/d) | 2,000 | — | — | — | — |
| Enhanced Swaps | Swap / Sold Put Price (1)(2) | $90.35 / $68 | — | — | — | — |
| Argus LLS | Volumes Hedged (Bbls/d) | 3,500 | 7,000 | 7,000 | 10,000 | 7,000 |
| Fixed-Price Swaps | Swap Price (1) | $64.99 | $39.61 | $39.16 | $43.77 | $45.35 |
| Argus LLS | Volumes Hedged (Bbls/d) | 6,000 | — | — | — | — |
| Enhanced Swaps | Swap / Sold Put Price (1)(2) | $93.38 / $70 | — | — | — | — |
| WTI NYMEX | Volumes Hedged (Bbls/d) | 5,000 | 4,500 | — | — | — |
| Collars | Ceiling Price / Floor (1) | $71.01 / $55 | $71.22 / $55 | — | — | — |
| WTI NYMEX | Volumes Hedged (Bbls/d) | 2,000 | — | — | — | — |
| 3-Way Collars | Ceiling Price / Floor / Sold Put Price (1)(2) | $95.50 / $85 / $68 | — | — | — | — |
| Argus LLS | Volumes Hedged (Bbls/d) | 2,000 | 3,000 | — | — | — |
| Collars | Ceiling Price / Floor (1) | $73 / $58 | $73.85 / $58 | — | — | — |
| Argus LLS | Volumes Hedged (Bbls/d) | 2,000 | — | — | — | — |
| 3-Way Collars | Ceiling Price / Floor / Sold Put Price (1)(2) | $98.25 / $88 / $70 | — | — | — | — |
| | Total Volumes Hedged (Bbls/d) | 34,000 | 33,000 | 33,000 | 32,000 | 29,000 |
| |
(1) | Averages are volume weighted. |
| |
(2) | If oil prices were to average less than the sold put price, receipts on settlement would be limited to the difference between the swap or floor price and the sold put price. |
Denbury Resources Inc.
Management’s Discussion2016, and Analysisthe fixed-price swaps that we have in place, we currently expect that we will begin making payments in the third quarter of Financial Condition and Results2016 (and continue to do so for the remainder of Operations
the year) upon settlement of these contracts, the amount of which is dependent upon fluctuations in future NYMEX prices in relation to the fixed prices of these swaps, which have a weighted average price of $38.95 per Bbl for the second half of 2016.
Changes in commodity prices, expiration of contracts, and new commodity contracts entered into cause fluctuations in the estimated fair value of our oil and natural gas derivative contracts. Because we do not utilize hedge accounting for our commodity derivative contracts, the period-to-period changes in the fair value of these contracts, as outlined above, are recognized in our statements of operations. The details of our outstanding commodity derivative contracts at March 31,June 30, 2016, are included in Note 5, Commodity Derivative Contracts, to the Unaudited Condensed Consolidated Financial Statements. Also, see Item 3, Quantitative and Qualitative Disclosures about Market Risk below for additional discussion on our commodity derivative contracts.
Denbury Resources Inc.
Management’s Discussion and Analysis of Financial Condition and Results of Operations
Production Expenses
Lease Operating Expense
| | | | | Three Months Ended | | Three Months Ended | | Six Months Ended |
| | | March 31, | | June 30, | | June 30, |
| In thousands, except per-BOE data | | 2016 | | 2015 | | 2016 | | 2015 | | 2016 | | 2015 |
| Lease operating expense | | | | | | | | | | | | |
| Tertiary | | $ | 62,188 |
| | $ | 85,459 |
| | $ | 63,096 |
| | $ | 79,499 |
| | $ | 125,284 |
| | $ | 164,958 |
|
| Non-tertiary | | 40,259 |
| | 55,625 |
| | 36,923 |
| | 52,671 |
| | 77,182 |
| | 108,296 |
|
| Total lease operating expense | | $ | 102,447 |
| | $ | 141,084 |
| | $ | 100,019 |
| | $ | 132,170 |
| | $ | 202,466 |
| | $ | 273,254 |
|
| | | | | | | | | | | | | |
| Lease operating expense per BOE | | |
| | |
| | |
| | |
| | |
| | |
|
| Tertiary | | $ | 16.89 |
| | $ | 22.70 |
| | $ | 17.68 |
| | $ | 20.52 |
| | $ | 17.28 |
| | $ | 21.59 |
|
| Non-tertiary | | 15.32 |
| | 19.00 |
| | 16.04 |
| | 18.59 |
| | 15.65 |
| | 18.80 |
|
| Total lease operating expense per BOE | | 16.23 |
| | 21.08 |
| | 17.04 |
| | 19.70 |
| | 16.62 |
| | 20.39 |
|
Our lease operating costs have declined as a result of our cost reduction efforts, as well as general market decreases in the prices of many of the components of these costs, culminatingresulting in a six-year lowdecrease in our total lease operating expenses in the first quarter of 2016, decreases in each of our last nine sequential quarters and a total decrease of 38% over approximately the last two years. Our recurring lease operating expenses was $16.23 per BOE in the first quarter of 2016, compared to $19.31 in the fourth quarter of 2015. Ttotal lease operating expenses decreased $38.6of $32.2 million (27%(24%) and $70.8 million (26%) on an absolute-dollar basis, or $4.85 (23%$2.66 (14%) and $3.77 (18%) on a per-BOE basis, during the three and six months ended March 31,June 30, 2016, respectively, compared to levels in the prior year period. This reduction wassame periods in 2015. These reductions were due to cost decreases in most lease operating expense categories, the most significant of which included (1) a decrease in workover costs and repairs as a result of reduced failures through root-cause analysis and fewer well repairs as more wells are uneconomic to repair based on low commodity prices, (2) lower power costs due to lower rates and usage, (3) lower CO2 expense resulting from a 35% decrease in CO2 injection volumes, (4) lower company labor costs resulting from a reduction in force, and (5) lower third-party contractor and vendor expenses.
On a per-BOE basis, our lease operating expenses such as contract laborwere $17.04 in the second quarter of 2016, compared to $16.23 in the first quarter of 2016, with the change attributable to higher workover costs and chemical costs.lower production volumes. Sequentially, lease operating expenses declined 20%2% on an absolute-dollar basis and 16%increased 5% on a per-BOE basis between the fourth quarter of 2015 and the first quarter of 2016 as we have seen manyand the second quarter of our costs decline, with the decrease in power, labor, CO2 and workover expense the primary components of lease operating expense cost reductions. As mentioned above, we2016. We have deferred certain well workovers and repairs in this current commodity price environment, resulting in us shutting in certain wells that are uneconomic to either produce or repair at this time.repair. As a result, it is unlikely that we will be able to sustain these current low lease operating expense levels in future periods as we expect production levels to gradually decline throughout the year and if prices improve, we may decide to increase our spending for workover and repair work. We estimate that approximately one-half of the production currently shut in is profitable at $50 per Bbl, approximately two-thirds at $60 per Bbl, with the remainder requiring an oil price in excess of $60 per Bbl in order to be economic.
Tertiary lease operating expenses decreased $23.3$16.4 million (27%)and $39.7 million on an absolute-dollar basis, or $5.81 (26%)$2.84 and $4.31 on a per-barrel basis, during the first quarter ofthree and six months ended June 30, 2016, respectively, compared to the first quarter oflevels in the same periods in 2015. When comparing the first quarter of 2016 to the fourth quarter of 2015, tertiary lease operating expenses decreased $14.5 million (19%) or $3.36 (17%) on a per-barrel basis. The year-over-year and sequential quarter declines were primarily due to (1) lower workover costs and repairs, (2) lower power costs due to lower rates and usage, (3) lower CO2 expense resulting from a decrease in CO2 injection volumes during both comparative periods, (2) lower power costs due to lower rates and usage, (3) lower company labor costs resulting from a reduction in force, (4) lower third-party contractor and vendor expenses such as contract labor and chemical costs.
Denbury Resources Inc.
Management’s Discussion and Analysis2016 to the first quarter of Financial Condition and Results of Operations
2016, tertiary lease operating expenses increased $0.79 (5%) on a per-barrel basis primarily due to production declines during the period.
Currently, our CO2 expense comprises approximately 20% of our typical tertiary lease operating expenses, and for the CO2 reserves we already own, consists of CO2 production expenses, and for the CO2 reserves we do not own, consists of our purchase of CO2 from royalty and working interest owners and industrial sources. During the first quartersecond quarters of 2016 and 2015, approximately 56%55% and 63%58%, respectively, of the CO2 utilized in our CO2 floods consisted of CO2 owned and produced by us (our net revenue interest). The price we pay others for CO2 varies by source and is generally indexed to oil prices. When combining the production cost of the CO2 we own with what we pay third parties for CO2, our average cost of CO2 during the firstsecond quarter of 2016 was approximately $0.30$0.38 per Mcf, including taxes paid on CO2 production but excluding depletion, depreciation and depreciationamortization of capital.capital expended at our CO2 source fields and industrial sources. This rateper-Mcf CO2 cost during the firstsecond quarter of 2016 was slightly
Denbury Resources Inc.
Management’s Discussion and Analysis of Financial Condition and Results of Operations
higher than the $0.29$0.33 per Mcf during the firstsecond quarter of 2015 and lower than the $0.35$0.30 per Mcf comparable measure during the fourth quarter of 2015. The rate increase between the first quarter of 2015 and 2016, wasdue primarily due to a higher percentage of our CO2utilization ofbeing industrial-sourced CO2, which has a higher average cost than our naturally occurring CO2 sources, partially offset by reductionsand an increase in the price of CO2 due to the significant decline in oil prices (though the decline is somewhat limited by certain contracts in place with price floors).higher processing and operating expenses. The decreasesequential increase in the price of CO2 cost per Mcf between the fourth quarter of 2015 and first quarter of 2016 was primarilyfurther impacted by an increase in royalty costs due to fewer workovers and a 10% decreasethe increase in CO2 injection volumes due to further increased efficiencies, largely inNYMEX prices during the Gulf Coast region.period. Including the cost of depletion, depreciation and amortization of capital expended at our CO2 source fields and industrial sources, but excluding depreciation of our CO2 pipelines, our cost of CO2 was $0.41$0.50 per Mcf and $0.39$0.44 per Mcf during the firstsecond quarter of 2016 and 2015, respectively. The increase between periods is primarily the result of the significant reduction of CO2 production volumes, while certain of our depreciation costs remain fixed. As we anticipate additional industrial-sourced CO2 volumes from MSPC coming into our CO2 supply late this year, we expect that our per-Mcf cost of CO2 could trend higher; however, utilizing industrial-sourced CO2 significantly reduces the future capital we would otherwise have to spend at Jackson Dome and provides a long-term consistent source of CO2.
Non-tertiary lease operating expenses decreased $15.4$15.7 million (28%(30%) on an absolute-dollar basis and $3.68 (19%$2.55 (14%) on a per-BOE basis between the three months ended March 31,June 30, 2016 and 2015, and decreased $31.1 million (29%) and $3.15 (17%) between the six months ended June 30, 2016 and 2015. On a sequential-quarter basis, our non-tertiary lease operating expenses decreased $10.9$3.3 million (21%(8%) on an absolute-dollar basis and $2.72 (15%increased $0.72 (5%) on a per-BOE basis betweenduring the fourth quarter of 2015 and firstsecond quarter of 2016. The year-over-year and sequential quarter decreases on an absolute-dollar basis were primarily due to lower(1) a decrease in workover costs and repairs as a result of reduced failures through root-cause analysis and maintenancefewer well repairs as more wells are uneconomic to repair based on low commodity prices, (2) lower power costs due to lower usage, (3) lower company labor costs resulting from a reduction in force, and (4) lower third-party contractor and vendor expenses such as contract labor and chemical costs during the 2016 period. The sequential-quarter increase on a per-BOE basis was impacted by lower production during the second quarter of 2016.
Marketing and Plant Operating Expenses
Marketing and plant operating expenses primarily consist of amounts incurred relating to the marketing, processing, and transportation of oil and natural gas production, as well as expenses related to our Riley Ridge gas processing facility. Marketing and plant operating expenses increased $1.5decreased $1.2 million (13%(9%) during the three months ended March 31,June 30, 2016 and increased $0.3 million (1%) during the six months ended June 30, 2016, compared to the same periodperiods in 2015, primarily due to an increase in marketing and compression expenses, partially offset by a reduction in expenses related to the Riley Ridge gas processing facility, which is currently shut in.2015.
Taxes Other Than Income
Taxes other than income includes ad valorem, production and franchise taxes. Taxes other than income decreased$6.6 $14.1 million (42%) and $20.6 million (34%) during the three and six months ended March 31,June 30, 2016, compared to the same periodperiods in 2015. The levels of, due primarily to a decrease in production taxes other than income during most periods are generally aligned with fluctuations inresulting from lower oil and natural gas revenues.revenues and a decrease in the assessed value of our properties resulting in lower ad valorem taxes during the second quarter of 2016.
Denbury Resources Inc.
Management’s Discussion and Analysis of Financial Condition and Results of Operations
General and Administrative Expenses (“G&A”)
| | | | | Three Months Ended | | Three Months Ended | | Six Months Ended |
| | | March 31, | | June 30, | | June 30, |
| In thousands, except per-BOE data and employees | | 2016 | | 2015 | | 2016 | | 2015 | | 2016 | | 2015 |
| Gross cash compensation and administrative costs | | $ | 79,738 |
| | $ | 95,280 |
| | $ | 61,742 |
| | $ | 84,365 |
| | $ | 141,480 |
| | $ | 179,645 |
|
| Gross stock-based compensation | | 2,884 |
| | 11,059 |
| | 4,241 |
| | 8,684 |
| | 7,125 |
| | 19,743 |
|
| Operator labor and overhead recovery charges | | (35,133 | ) | | (42,128 | ) | | (32,865 | ) | | (41,427 | ) | | (67,998 | ) | | (83,555 | ) |
| Capitalized exploration and development costs | | (13,588 | ) | | (17,931 | ) | | (10,573 | ) | | (13,675 | ) | | (24,161 | ) | | (31,606 | ) |
| Net G&A expense | | $ | 33,901 |
| | $ | 46,280 |
| | $ | 22,545 |
| | $ | 37,947 |
| | $ | 56,446 |
| | $ | 84,227 |
|
| | | | | | | | | | | | | |
| G&A per BOE: | | |
| | |
| | |
| | |
| | |
| | |
|
| Net administrative costs | | $ | 5.29 |
| | $ | 5.89 |
| | $ | 3.33 |
| | $ | 4.67 |
| | $ | 4.35 |
| | $ | 5.28 |
|
| Net stock-based compensation | | 0.08 |
| | 1.03 |
| | 0.51 |
| | 0.99 |
| | 0.28 |
| | 1.01 |
|
| Net G&A expense | | $ | 5.37 |
| | $ | 6.92 |
| | $ | 3.84 |
| | $ | 5.66 |
| | $ | 4.63 |
| | $ | 6.29 |
|
| | | | | | | | | | | | | |
| Employees as of March 31 | | 1,096 |
| | 1,496 |
| |
| Employees as of June 30 | | | 1,084 |
| | 1,442 |
| | | | |
Gross cash compensation and administrative costs on an absolute-dollar basis decreased $15.5$22.6 million (16%(27%) and $38.2 million (21%) during the three and six months ended March 31,June 30, 2016, compared to those costs in the same period in 2015, primarily due to lower employee-related costs such as salaries, bonus accruals and long-term incentives,incentives. The decrease during the six months ended June 30, 2016 was offset in part by higher severance costs.costs incurred during the first quarter of 2016 compared to severance costs in the second quarter of 2015. As part of our efforts to reduce overhead and operating costs in response to the significant decline in oil prices, we reduced our employee headcount in mid-2015 and further reduced our employee headcount in February 2016 through an involuntary workforce reduction, which contributed to an overall headcount reduction of approximately 27% since28% between March 31, 2015.2015 and June 30, 2016. The severance-related payments associated with the 2016 workforce reduction were approximately $9.3 million.
Net G&A expense on a per-BOE basis decreased 22%32% and 26% during the three and six months ended March 31,June 30, 2016, respectively, compared to levels in the same periodperiods in 2015,2015. The changes were primarily based upon the changes noted in gross cash compensation and administrative costs, partially offset by lower operating and overhead recovery charges, lower capitalized exploration and development costs, and lower production volumes.
Gross stock-based compensation on an absolute-dollar basis decreased $8.2$4.4 million (74%(51%) and $12.6 million (64%) during the three and six months ended March 31,June 30, 2016, respectively, compared to levels in the same periodperiods in 2015. The change between the comparative three-monthdecrease during both periods was primarily due to the reductions in headcount mentioned above, the reduction in previously recognizedpreviously-recognized stock compensation expense associated with our performance share awards for our executive officers which vested in the first quarter of 2016 or are projected to vest in future periods below target levels, and the postponement of our annual long-term incentive award grantgrants from January in prior yearyears to mid-yearthe third quarter for 2016. As a result of our customary annual long-term incentive award grant to all employees occurring on July 8, 2016, we currently expect our overall quarterly G&A costs to increase during the second half of 2016 compared to second quarter 2016 levels.
Our well operating agreements allow us, when we are the operator, to charge a well with a specified overhead rate during the drilling phase and also to charge a monthly fixed overhead rate for each producing well. In addition, salaries associated with field personnel are initially recorded as gross cash compensation and administrative costs and subsequently reclassified to lease operating expenses or capitalized to field development costs to the extent those individuals are dedicated to oil and gas production, exploration, and development activities.
Denbury Resources Inc.
Management’s Discussion and Analysis of Financial Condition and Results of Operations
Interest and Financing Expenses
| | | | | Three Months Ended | | Three Months Ended | | Six Months Ended |
| | | March 31, | | June 30, | | June 30, |
| In thousands, except per-BOE data and interest rates | | 2016 | | 2015 | | 2016 | | 2015 | | 2016 | | 2015 |
| Cash interest expense | | $ | 44,645 |
| | $ | 46,287 |
| |
Cash interest (1) | | | $ | 43,148 |
| | $ | 46,322 |
| | $ | 87,793 |
| | $ | 92,609 |
|
Interest on 2021 Senior Secured Notes not reflected as interest for financial reporting purposes (1) | | | (7,036 | ) | | — |
| | (7,036 | ) | | — |
|
| Noncash interest expense | | 3,306 |
| | 2,221 |
| | 6,235 |
| | 2,279 |
| | 9,541 |
| | 4,500 |
|
| Less: capitalized interest | | (5,780 | ) | | (8,409 | ) | | (6,289 | ) | | (8,738 | ) | | (12,069 | ) | | (17,147 | ) |
| Interest expense, net | | $ | 42,171 |
| | $ | 40,099 |
| | $ | 36,058 |
| | $ | 39,863 |
| | $ | 78,229 |
| | $ | 79,962 |
|
| Interest expense, net per BOE | | $ | 6.68 |
| | $ | 5.99 |
| | $ | 6.14 |
| | $ | 5.94 |
| | $ | 6.42 |
| | $ | 5.97 |
|
| Average debt outstanding | | $ | 3,326,140 |
| | $ | 3,615,918 |
| |
Average interest rate (1) | | 5.4 | % | | 5.1 | % | |
| Average debt principal outstanding | | | $ | 3,006,304 |
| | $ | 3,583,316 |
| | $ | 3,166,222 |
| | $ | 3,599,527 |
|
Average interest rate (2) | | | 5.7 | % | | 5.2 | % | | 5.5 | % | | 5.1 | % |
| |
| (1) | Cash interest is presented on an accrual basis, and includes interest on our new 2021 Senior Secured Notes (interest on which is to be paid semi-annually May 15 and November 15 of each year, beginning November 15, 2016), which are accounted for as debt and not reflected as interest for financial reporting purposes. See below for further discussion. |
| |
| (2) | Includes commitment fees but excludes debt issue costs and amortization of discount or premium. |
Our averageAs reflected in the table above, cash interest rate increased slightly betweenduring the three and six months ended June 30, 2016, decreased when compared to the same periods in 2015 as a result of (1) repurchasing a total of $152.3 million principal amount of our existing senior subordinated notes in open-market transactions during the first quarter of 20152016 and (2) entering into privately negotiated exchange transactions during the second quarter of 2016 to exchange approximately $1,057.8 million principal amount of our senior subordinated notes for $614.9 million principal amount of our new 2021 Senior Secured Notes plus 40.7 million shares of Denbury common stock (see Capital Resources and Liquidity – 2016 Debt Reduction Transactions). As more fully described in Note 2, Long-Term Debt, to the Unaudited Condensed Consolidated Financial Statements, the exchange transactions were accounted for in accordance with FASB ASC 470-60, Troubled Debt Restructuring by Debtors, whereby $254.7 million of future interest on the 2021 Senior Secured Notes has been recorded as debt, which will be reduced as semi-annual interest payments are made, with the remaining $22.8 million of future interest to be recognized as interest expense over the term of the 2021 Senior Secured Notes. Therefore, future interest expense on the 2021 Senior Secured Notes will be significantly lower than the actual cash interest payment. For the three months ended June 30, 2016, $7.0 million of interest on the 2021 Senior Secured Notes was accounted for as debt, and is therefore not reflected as interest expense in the Unaudited Condensed Consolidated Statements of Operations. Noncash interest expense during the three and six months ended June 30, 2016 increased when compared to the same prior year periods due to an increase in the applicable margin for loans under the senior secured bank credit facility and an increase in our commitment fee rate, as well as lower average borrowings on$4.5 million write-off of debt issuance costs associated with our senior secured bank credit facility following the May 2016 redetermination which is at a lower rate thanreduced our borrowing base. The six-month period was further impacted by the $1.0 million write-off of debt issuance costs associated with our senior subordinated notes.secured bank credit facility following the February 2016 amendment which reduced our lender commitments. Capitalized interest during the first quarter ofthree and six months ended June 30, 2016 decreased $2.6$2.4 million (31%(28%) and $5.1 million (30%), respectively, compared to the same periodperiods in 2015, primarily due to a reduction in the number of projects that qualify for interest capitalization.
Denbury Resources Inc.
Management’s Discussion and Analysis of Financial Condition and Results of Operations
Depletion, Depreciation, and Amortization (“DD&A”)
| | | | | Three Months Ended | | Three Months Ended | | Six Months Ended |
| | | March 31, | | June 30, | | June 30, |
| In thousands, except per-BOE data | | 2016 | | 2015 | | 2016 | | 2015 | | 2016 | | 2015 |
| Depletion and depreciation of oil and natural gas properties | | $ | 47,417 |
| | $ | 116,347 |
| | $ | 38,141 |
| | $ | 115,703 |
| | $ | 85,558 |
| | $ | 232,050 |
|
Depletion and depreciation of CO2 properties | | 5,573 |
| | 8,212 |
| | 4,471 |
| | 6,546 |
| | 10,044 |
| | 14,758 |
|
| Amortization of asset retirement obligations | | 2,902 |
| | 2,327 |
| | 2,975 |
| | 2,386 |
| | 5,877 |
| | 4,713 |
|
| Depreciation of pipelines, plants and other property and equipment | | 21,474 |
| | 23,072 |
| | 20,954 |
| | 23,305 |
| | 42,428 |
| | 46,377 |
|
| Total DD&A | | $ | 77,366 |
| | $ | 149,958 |
| | $ | 66,541 |
| | $ | 147,940 |
| | $ | 143,907 |
| | $ | 297,898 |
|
| | | | | | | | | | | | | |
| DD&A per BOE: | | |
| | |
| | |
| | |
| | |
| | |
|
| Oil and natural gas properties | | $ | 7.98 |
| | $ | 17.73 |
| | $ | 7.01 |
| | $ | 17.60 |
| | $ | 7.50 |
| | $ | 17.67 |
|
CO2 properties, pipelines, plants and other property and equipment | | 4.28 |
| | 4.68 |
| | 4.33 |
| | 4.45 |
| | 4.31 |
| | 4.56 |
|
| Total DD&A cost per BOE | | $ | 12.26 |
| | $ | 22.41 |
| | $ | 11.34 |
| | $ | 22.05 |
| | $ | 11.81 |
| | $ | 22.23 |
|
| | | | | | | | | | | | | |
| Write-down of oil and natural gas properties | | $ | 256,000 |
| | $ | 146,200 |
| | $ | 479,400 |
| | $ | 1,705,800 |
| | $ | 735,400 |
| | $ | 1,852,000 |
|
We adjust our DD&A rate each quarter for significant changes in our estimates of oil and natural gas reserves and costs. In addition, under full cost accounting rules, the divestiture of oil and gas properties generally does not result in gain or loss recognition; instead, the proceeds of the disposition reduce the full cost pool. As such, our DD&A rate has changed significantly over time, and it may continue to change in the future. DD&A of oil and natural gas properties and asset retirement obligations decreased 58%65% and 61% on an absolute-dollar basis during the three and decreased 55% onsix months ended June 30, 2016, respectively, compared to the same periods in 2015. On a per-BOE basis, betweenDD&A of oil and natural gas properties and asset retirement obligations decreased 60% and 58% during the first quarter of 2015three and six months ended June 30, 2016, and decreased 40% on an absolute-dollar basis and decreased 37% on a per-BOE basis betweenrespectively, compared to the fourth quarter of 2015 and first quarter of 2016,same periods in 2015. These decreases were primarily due to a reduction in depletable costs associated with our reserves base resulting from the significant full cost pool ceiling test write-downs recognized during 2015 and the first quarter of 2016 and an overall reduction in future development costs, partially offset by reductions in proved oil and natural gas reserve quantities. The per-BOE decrease was also partially offset by a decrease in production volumes during the firstsecond quarter of 2016 when compared to 2015.the 2015 period. Given the additional full cost pool ceiling test write-down recognized
Denbury Resources Inc.
Management’s Discussion and Analysis of Financial Condition and Results of Operations
during the three months ended March 31,June 30, 2016, we currently expect our DD&A rate in the secondthird quarter of 2016 to decrease slightly from the firstsecond quarter of 2016 rate and will likely decrease further as we are anticipating additional write-downs in the second quarter based on current oil prices.rate. However, the overall decrease in our secondthird quarter DD&A rate will also be impacted by potential changes in reserve volumes, production, and future capital expenditure estimates, among other factors, and therefore, the actual decrease may differ from this estimate.
Depletion and depreciation of our CO2 properties, pipelines, plants and other property and equipment decreased 14%15% on an absolute-dollar basis and 9%3% on a per-BOE basis during the three months ended March 31,June 30, 2016, compared to the same period in 2015, primarily due to lower depletion associated with our CO2 properties resulting from a decrease in CO2 production during the period.
Write-Down of Oil and Natural Gas Properties
Under full cost accounting rules, we are required each quarter to perform a ceiling test calculation. Under these rules, the full cost ceiling value is calculated using the average first-day-of-the-month oil and natural gas price for each month during a 12-month rolling period ended as of each quarterly reporting period. As a result of the precipitous and continuing decline in NYMEX oil prices since the fourth quarter of 2014, the rollingaverage first-day-of-the-month averageNYMEX oil price for the preceding 12 months, after adjustments for market differentials by field,used in estimating our proved reserves has fallen throughout 2015 and the first quarterhalf of 2016, from $79.55$71.68 per Bbl for the firstsecond quarter of 2015 to $44.03$43.12 per Bbl for the firstsecond quarter of 2016. In addition, the average first-day-of-the-month averageNYMEX natural gas price used in estimating our proved reserves was $3.38 per MMBtu for the preceding 12 months, after adjustments for market differentials by field, was $3.95 per Mcf for the firstsecond quarter of 2015 and $2.22$2.33 per McfMMBtu for the firstsecond quarter of 2016. These second quarter prices represent a decrease of 8%14% for crude oil and 9%11% for natural gas prices compared to adjusted prices used to calculate
Denbury Resources Inc.
Management’s Discussion and Analysis of Financial Condition and Results of Operations
the December 31, 2015, full cost ceiling value. These falling prices have led to our recognizing full cost pool ceiling test write-downs of $479.4 million and $256.0 million during the three months ended June 30 and March 31, 2016, respectively, and $1.7 billion and $146.2 million during the three months ended June 30 and March 31, 2016 and 2015, respectively. We currently do not expect that we will record an additionala significant write-down in the secondthird quarter of 2016 of $400 million or higher if oil and natural gas prices remain at or near late-Aprillate-July 2016 levels for the remainder of the second quarter, as the 12-month average prices used in determining the full cost ceiling value would reflect lower prices in the second quarter of 2016 than in the second quarter of 2015.levels. Any such write-down would also be affected, in part, by changes in proved oil and natural gas reserve volumes, future capital expenditures and operating costs.
Other Expenses
Other expenses totaled $34.7 million and $36.2 million during the three and six months ended June 30, 2016, respectively, primarily comprised of a $27.5 million cash payment to Evolution pursuant to a settlement agreement entered into in June 2016. See Note 7, Commitments and Contingencies, to the Unaudited Condensed Consolidated Financial Statements for further discussion.
Income Taxes
| | | | | Three Months Ended | | Three Months Ended | | Six Months Ended |
| | | March 31, | | June 30, | | June 30, |
| In thousands, except per-BOE amounts and tax rates | | 2016 | | 2015 | | 2016 | | 2015 | | 2016 | | 2015 |
| Current income tax expense (benefit) | | $ | (5 | ) | | $ | 1,575 |
| |
| Current income tax benefit | | | $ | — |
| | $ | (1,696 | ) | | $ | (5 | ) | | $ | (121 | ) |
| Deferred income tax benefit | | (95,115 | ) | | (66,036 | ) | | (222,940 | ) | | (634,472 | ) | | (318,055 | ) | | (700,508 | ) |
| Total income tax benefit | | $ | (95,120 | ) | | $ | (64,461 | ) | | $ | (222,940 | ) | | $ | (636,168 | ) | | $ | (318,060 | ) | | $ | (700,629 | ) |
| Average income tax benefit per BOE | | $ | (15.07 | ) | | $ | (9.63 | ) | | $ | (37.98 | ) | | $ | (94.84 | ) | | $ | (26.11 | ) | | $ | (52.28 | ) |
| Effective tax rate | | 33.9 | % | | 37.4 | % | | 36.9 | % | | 35.6 | % | | 36.0 | % | | 35.8 | % |
| Total net deferred tax liability | | $ | 742,148 |
| | $ | 837,263 |
| | $ | 519,207 |
| | $ | 852,089 |
| | | | |
We evaluate our estimated annual effective income tax rate based on current and forecasted business results and enacted tax laws on a quarterly basis and apply this tax rate to our ordinary income or loss to calculate our estimated tax liability or benefit. As of March 31,June 30, 2016, we had $34.5 million of deferred tax assets associated with State of Louisiana net operating losses. As the result of a new tax law enacted in the State of Louisiana effective June 30, 2015, which limits a company’s utilization of certain deductions, including our net operating loss carryforwards, we recognized a tax valuation allowanceallowances of $30.5 million during the second quarter of 2015, $3.1 million during the fourth quarter of $33.6 million2015, and an additional $0.9 million during the first quarter of 2016, to reducewhich reduced the carrying value of our deferred tax assets.assets associated with State of Louisiana net operating losses. The valuation allowances will remain until the realization of future deferred tax benefits are more likely than not to become utilized.
As of March 31,June 30, 2016, we had an unrecognized tax benefit of $5.4 million related to an uncertain tax position. The unrecognized tax benefit was recorded during the fourth quarter of 2015 as a direct reduction of the associated deferred tax asset and, if recognized, would not materially affect our annual effective tax rate. The tax benefit from an uncertain tax position will only be recognized if it is more likely than not that the tax position will be sustained upon examination by the taxing authorities, based upon the
Denbury Resources Inc.
Management’s Discussion and Analysis of Financial Condition and Results of Operations
technical merits of the position. We currently do not expect a material change to the uncertain tax position within the next 12 months. Our policy is to recognize penalties and interest related to uncertain tax positions in income tax expense; however, no such amounts were accrued related to the uncertain tax position as of March 31,June 30, 2016.
Our income taxes are based on estimated statutory rates of approximately 38% in 2016 and 2015. Our effective tax rate for the three months ended March 31,June 30, 2016 was lower than our estimated statutory rate, primarily due to the full cost pool ceiling test write-down recorded during the quarter. Our effective tax rate for the six months ended June 30, 2016 was further impacted by the impact of a tax shortfall on the stock-based compensation deduction (e.g., the compensation expense recognized in the financial statements was greater than the actual compensation realized resulting in a shortfall in the income tax deduction for stock awards that vested during the first quarter) which, prior to the adoption of ASU 2016-09, was recorded as an adjustment to equity. The amounts recorded as current incomeOur effective tax expense duringrate for the first quarterthree and six months ended June 30, 2015 was lower than our estimated statutory rate, primarily due to the impact of 2015 represent our federal taxes,the tax valuation allowance discussed above, which reduced by enhanced oil recovery credits during the prior year period, plus our state income taxes.net deferred tax benefit recognized. The deferred income tax benefits during the three and six months ended March 31,June 30, 2016 and March 31, 2015, were primarily due to the impact of the write-down of our oil and natural gas properties during the year. In connection with the privately negotiated exchange agreements to
Denbury Resources Inc.
Management’s Discussion and Analysis of Financial Condition and Results of Operations
exchange a portion of our existing senior subordinated notes for 2021 Senior Secured Notes, we realized a tax gain due to the concession extended by our note holders. This tax gain was offset by net operating losses and other deferred tax asset attributes.
As of March 31,June 30, 2016, we had an estimated $51.1 million of enhanced oil recovery credits to carry forward related to our tertiary operations, $21.6 million of research and development credits, and $41.1 million of alternative minimum tax credits that can be utilized to reduce our current income taxes during 2016 or future years. The enhanced oil recovery credits and research and development credits do not begin to expire until 2023 and 2031, respectively. We currently do not expect to earn additional enhanced oil recovery credits during 2016.
Per-BOE Data
The following table summarizes our cash flow and results of operations on a per-BOE basis for the comparative periods. Each of the significant individual components is discussed above.
| | | | | Three Months Ended | | Three Months Ended | | Six Months Ended |
| | | March 31, | | June 30, | | June 30, |
| Per-BOE data | | 2016 | | 2015 | | 2016 | | 2015 | | 2016 | | 2015 |
| Oil and natural gas revenues | | $ | 29.76 |
| | $ | 44.45 |
| | $ | 42.02 |
| | $ | 54.69 |
| | $ | 35.67 |
| | $ | 49.58 |
|
| Receipt on settlements of commodity derivatives | | 11.44 |
| | 22.19 |
| | 8.86 |
| | 18.51 |
| | 10.20 |
| | 20.34 |
|
| Lease operating expenses | | (16.23 | ) | | (21.08 | ) | | (17.04 | ) | | (19.70 | ) | | (16.62 | ) | | (20.39 | ) |
| Production and ad valorem taxes | | (2.72 | ) | | (3.42 | ) | | (2.90 | ) | | (4.43 | ) | | (2.81 | ) | | (3.93 | ) |
| Marketing expenses, net of third party purchases, and plant operating expenses | | (1.84 | ) | | (1.47 | ) | |
| Marketing expenses, net of third-party purchases, and plant operating expenses | | | (1.85 | ) | | (1.86 | ) | | (1.84 | ) | | (1.66 | ) |
| Production netback | | 20.41 |
| | 40.67 |
| | 29.09 |
| | 47.21 |
| | 24.60 |
| | 43.94 |
|
CO2 sales, net of operating and exploration expenses | | 0.89 |
| | 0.90 |
| | 0.95 |
| | 0.93 |
| | 0.92 |
| | 0.91 |
|
| General and administrative expenses | | (5.37 | ) | | (6.92 | ) | | (3.84 | ) | | (5.66 | ) | | (4.63 | ) | | (6.29 | ) |
| Interest expense, net | | (6.68 | ) | | (5.99 | ) | | (6.14 | ) | | (5.94 | ) | | (6.42 | ) | | (5.97 | ) |
| Other | | (0.24 | ) | | 0.55 |
| | (4.22 | ) | | 0.97 |
| | (2.16 | ) | | 0.77 |
|
| Changes in assets and liabilities relating to operations | | (8.69 | ) | | (8.62 | ) | | (5.46 | ) | | 5.57 |
| | (7.14 | ) | | (1.52 | ) |
| Cash flows from operations | | 0.32 |
| | 20.59 |
| | 10.38 |
| | 43.08 |
| | 5.17 |
| | 31.84 |
|
| DD&A | | (12.26 | ) | | (22.41 | ) | | (11.34 | ) | | (22.05 | ) | | (11.81 | ) | | (22.23 | ) |
| Write-down of oil and natural gas properties | | (40.56 | ) | | (21.85 | ) | | (81.67 | ) | | (254.29 | ) | | (60.37 | ) | | (138.21 | ) |
| Deferred income taxes | | 15.07 |
| | 9.87 |
| | 37.98 |
| | 94.58 |
| | 26.11 |
| | 52.28 |
|
| Gain on debt extinguishment | | 15.05 |
| | — |
| | 2.09 |
| | — |
| | 8.81 |
| | — |
|
Noncash fair value adjustments on commodity derivatives (1) | | (15.06 | ) | | (9.78 | ) | | (25.59 | ) | | (25.80 | ) | | (20.14 | ) | | (17.79 | ) |
| Other noncash items | | 8.10 |
| | 7.48 |
| | 3.30 |
| | (6.73 | ) | | 5.78 |
| | 0.36 |
|
| Net loss | | $ | (29.34 | ) | | $ | (16.10 | ) | | $ | (64.85 | ) | | $ | (171.21 | ) | | $ | (46.45 | ) | | $ | (93.75 | ) |
| |
| (1) | Noncash fair value adjustments on commodity derivatives is a non-GAAP measure. See Operating Results Table above for a discussion of the reconciliation between noncash fair value adjustments on commodity derivatives to “Commodity derivatives expense (income)” in the Unaudited Condensed Consolidated Statements of Operations. |
Denbury Resources Inc.
Management’s Discussion and Analysis of Financial Condition and Results of Operations
CRITICAL ACCOUNTING POLICIES
For additional discussion of our critical accounting policies, which remain unchanged, see Management’s Discussion and Analysis of Financial Condition and Results of Operations in our Form 10-K.
Denbury Resources Inc.
Management’s Discussion and Analysis of Financial Condition and Results of Operations
FORWARD-LOOKING INFORMATION
The statements contained in this Quarterly Report on Form 10-Q that are not historical facts, including, but not limited to, statements found in the section Management’s Discussion and Analysis of Financial Condition and Results of Operations, are forward-looking statements, as that term is defined in Section 21E of the Securities Exchange Act of 1934, as amended (the “Exchange Act”), that involve a number of risks and uncertainties. Such forward-looking statements may be or may concern, among other things, future hydrocarbon prices, the length or severity of the current commodity price downturn, levels of world monetary, currency or trade volatility, current or future liquidity sources or their adequacy to support our anticipated future activities, our ability to reduce our debt levels, possible future write-downs of oil and natural gas reserves, together with assumptions based on current and projected oil and gas costs, current or future expectations or estimations of our cash flows, availability of capital, borrowing capacity, availability of advantageous commodity derivative contracts or the predicted cash flow benefits therefrom, forecasted capital expenditures, drilling activity or methods, including the timing and location thereof, estimated timing of commencement of CO2 flooding of particular fields or areas, or the timing of pipeline construction or completion or the cost thereof, dates of completion of to-be-constructed industrial plants and the initial date of capture of CO2 from such plants, timing of CO2 injections and initial production responses in tertiary flooding projects, acquisition plans and proposals and dispositions, development activities, finding costs, anticipated future cost savings, capital budgets, production rates and volumes or forecasts thereof, hydrocarbon reserve quantities and values, CO2 reserves and their availability, helium reserves, potential reserves, percentages of recoverable original oil in place, the impact of regulatory rulings or changes, anticipated outcomes of pending litigation, prospective legislation affecting the oil and gas industry, mark-to-market values, competition, long-term forecasts of production, finding costs, rates of return, estimated costs, estimates of the range of potential insurance recoveries, changes in costs, future capital expenditures and overall economics, worldwide economic conditions and other variables surrounding our operations and future plans. Such forward-looking statements generally are accompanied by words such as “plan,” “estimate,” “expect,” “predict,” “to our knowledge,” “anticipate,” “projected,” “preliminary,” “should,” “assume,” “believe,” “may” or other words that convey, or are intended to convey, the uncertainty of future events or outcomes. Such forward-looking information is based upon management’s current plans, expectations, estimates, and assumptions and is subject to a number of risks and uncertainties that could significantly and adversely affect current plans, anticipated actions, the timing of such actions and our financial condition and results of operations. As a consequence, actual results may differ materially from expectations, estimates or assumptions expressed in or implied by any forward-looking statements made by us or on our behalf. Among the factors that could cause actual results to differ materially are fluctuations in worldwide oil prices or in U.S. oil prices and consequently in the prices received or demand for our oil and natural gas; decisions as to production levels and/or pricing by OPEC in future periods; levels of future capital expenditures; effects of our indebtedness; success of our risk management techniques; inaccurate cost estimates; availability of and fluctuations in the prices of goods and services; the uncertainty of drilling results and reserve estimates; operating hazards and remediation costs; disruption of operations and damages from well incidents, hurricanes, tropical storms, or forest fires; acquisition risks; requirements for capital or its availability; conditions in the worldwide financial and credit markets; general economic conditions; competition; government regulations, including tax and environmental; and unexpected delays, as well as the risks and uncertainties inherent in oil and gas drilling and production activities or that are otherwise discussed in this quarterly report, including, without limitation, the portions referenced above, and the uncertainties set forth from time to time in our other public reports, filings and public statements including, without limitation, the Company’s most recent Form 10-K.
Item 3. Quantitative and Qualitative Disclosures about Market Risk
Debt and Interest Rate Sensitivity
We finance some of our acquisitions and other expenditures with fixed and variable rate debt. These debt agreements expose us to market risk related to changes in interest rates. As of March 31,June 30, 2016, we had $310.0$320.0 million of debt outstanding on our senior secured bank credit facility. At this level of variable-rate debt, an increase or decrease of 10% in interest rates would have an immaterial effect on our interest expense. None of our existing debt has any triggers or covenants regarding our debt ratings with rating agencies, although under the NEJD financing lease, in light of recent credit downgrades in February 2016, we were required to provide a $41.3 million letter of credit to the lessor, which we provided on March 4, 2016. The letter of credit may be drawn upon in the event Denbury Onshore or Denbury fail to make a payment due under the pipeline financing lease agreement or upon other specified defaults set out in the pipeline financing lease agreement (filed as Exhibit 99.1 to the Form 8-K filed with the SEC on June 5, 2008). The fair valuevalues of our senior secured second lien notes and senior subordinated debt is based on quoted market prices. The following table presents the principal cash flows and fair values of our outstanding debt at March 31,June 30, 2016:
| | | In thousands | | 2017 | | 2019 | | 2021 | | 2022 | | 2023 | | Total | | 2017 | | 2019 | | 2021 | | 2022 | | 2023 | | Total |
| Variable rate debt: | | | | | | | | | | | | | | | | | | | | | | | | |
| Senior Secured Bank Credit Facility (weighted average interest rate of 2.4% at March 31, 2016) | | $ | — |
| | $ | 310,000 |
| | $ | — |
| | $ | — |
| | $ | — |
| | $ | 310,000 |
| |
| Senior Secured Bank Credit Facility (weighted average interest rate of 2.8% at June 30, 2016) | | | $ | — |
| | $ | 320,000 |
| | $ | — |
| | $ | — |
| | $ | — |
| | $ | 320,000 |
|
| Fixed rate debt: | | |
| | |
| | |
| | |
| | | | | | |
| | |
| | |
| | |
| | | | |
9% Senior Secured Second Lien Notes due 2021
| | | — |
| | — |
| | 614,919 |
| | — |
| | — |
| | 614,919 |
|
6⅜% Senior Subordinated Notes due 2021 | | — |
| | — |
| | 396,000 |
| | — |
| | — |
| | 396,000 |
| | — |
| | — |
| | 220,939 |
| | — |
| | — |
| | 220,939 |
|
| 5½% Senior Subordinated Notes due 2022 | | — |
| | — |
| | — |
| | 1,207,745 |
| | — |
| | 1,207,745 |
| | — |
| | — |
| | — |
| | 796,712 |
| | — |
| | 796,712 |
|
4⅝% Senior Subordinated Notes due 2023 | | — |
| | — |
| | — |
| | — |
| | 1,094,000 |
| | 1,094,000 |
| | — |
| | — |
| | — |
| | — |
| | 622,297 |
| | 622,297 |
|
| Other Subordinated Notes | | 2,250 |
| | — |
| | — |
| | — |
| | — |
| | 2,250 |
| | 2,250 |
| | — |
| | — |
| | — |
| | — |
| | 2,250 |
|
See Note 2, Long-Term Debt, to the Unaudited Condensed Consolidated Financial Statements for details regarding our long-term debt.
Oil and Natural Gas Derivative Contracts
Historically, we have entered into oil and natural gas derivative contracts to provide an economic hedge of our exposure to commodity price risk associated with anticipated future oil and natural gas production and to provide more certainty to our future cash flows. We do not hold or issue derivative financial instruments for trading purposes. Generally, these contracts have consisted of various combinations of price floors, collars, three-way collars, fixed-price swaps, and fixed-price swaps enhanced with a sold put. The production that we hedge has varied from year to year depending on our levels of debt, financial strength, and expectation of future commodity prices. In order to protect our liquidity and provide price certainty to a portion of our oil production, we have hedged approximately two-thirds of our estimated oil production out through the first quarter of 2017 and hedged approximately half of our estimated production out throughin the second quarter of 2017. See Management’s Discussion2017 using both NYMEX and Analysis of Financial Condition and Results of Operations – Results of Operations – Commodity Derivative Contracts for a detail of our commodity derivative contracts as of May 2, 2016. We anticipate that we may use more fixed-price swaps in the future or a combination ofLLS fixed-price swaps and collars as we look to provide more certainty around our future cash flows.collars. See also Note 5, Commodity Derivative Contracts, and Note 6, Fair Value Measurements, to the Unaudited Condensed Consolidated Financial Statements for additional information regarding our commodity derivative contracts.
All of the mark-to-market valuations used for our commodity derivatives are provided by external sources. We manage and control market and counterparty credit risk through established internal control procedures that are reviewed on an ongoing basis. We attempt to minimize credit risk exposure to counterparties through formal credit policies, monitoring procedures and diversification. All of our commodity derivative contracts are with parties that are lenders under our senior secured bank credit facility (or affiliates of such lenders). We have included an estimate of nonperformance risk in the fair value measurement of our commodity derivative contracts, which we have measured for nonperformance risk based upon credit default swaps or credit spreads.
For accounting purposes, we do not apply hedge accounting treatment to our commodity derivative contracts. This means that any changes in the fair value of these commodity derivative contracts will be charged to earnings on a quarterly basis instead of charging the effective portion to other comprehensive income and the ineffective portion to earnings.
At March 31,June 30, 2016, our commodity derivative contracts were recorded at their fair value, which was a net assetliability of $102.4 million, a $150.2 million decrease from the $47.8 million net asset recorded at March 31, 2015, and a $95.0$245.2 million decrease from the $142.8 million net asset recorded at December 31, 2015. Changes in this value are comprised of the expiration of commodity derivative contracts during the three and six months ended March 31,June 30, 2016, new commodity derivative contracts entered into during 2016 for future periods, and to the changes in oil futures prices between December 31, 2015 and March 31,June 30, 2016.
Commodity Derivative Sensitivity Analysis
Based on NYMEX and LLS crude oil futures prices as of March 31,June 30, 2016, and assuming both a 10% increase and decrease thereon, we would expect to receivemake payments on our crude oil derivative contracts as shown in the following table:
| | | | | Receipt / (Payment) | | Receipt / (Payment) |
| In thousands | | Crude Oil Derivative Contracts | | Crude Oil Derivative Contracts |
| Based on: | | | | |
| Futures prices as of March 31, 2016 | | $ | 47,419 |
| |
| Futures prices as of June 30, 2016 | | | $ | (104,472 | ) |
| 10% increase in prices | | 3,790 |
| | (168,146 | ) |
| 10% decrease in prices | | 91,035 |
| | (45,122 | ) |
Our commodity derivative contracts are used as an economic hedge of our exposure to commodity price risk associated with anticipated future production. As a result, changes in receipts or payments of our commodity derivative contracts due to changes in commodity prices as reflected in the above table would be mostly offset by a corresponding increase or decrease in the cash receipts on sales of our oil and natural gas production to which those commodity derivative contracts relate.
Item 4. Controls and Procedures
Evaluation of Disclosure Controls and Procedures. As of the end of the period covered by this report, an evaluation of the effectiveness of the design and operation of our disclosure controls and procedures (as defined in Rule 13a-15(e) under the Exchange Act) was performed under the supervision and with the participation of management, including our Chief Executive Officer and Chief Financial Officer. Based on that evaluation, our Chief Executive Officer and Chief Financial Officer concluded that our disclosure controls and procedures were effective as of March 31,June 30, 2016, to ensure that information that is required to be disclosed in the reports the Company files and submits under the Securities Exchange Act of 1934 is recorded, processed, summarized and reported within the time periods specified in the SEC’s rules and forms; and that information that is required to be disclosed under the Exchange Act is accumulated and communicated to management, including our Chief Executive Officer and our Chief Financial Officer, as appropriate, to allow timely decisions regarding required disclosures.
Evaluation of Changes in Internal Control over Financial Reporting. Under the supervision and with the participation of our management, including our Chief Executive Officer and our Chief Financial Officer, we have determined that, during the firstsecond quarter of fiscal 2016, there were no changes in our internal control over financial reporting that have materially affected, or are reasonably likely to materially affect, our internal control over financial reporting.
PART II. OTHER INFORMATION
Item 1. Legal Proceedings
We are involved in various lawsuits, claims and regulatory proceedings incidental to our businesses. While we currently believe that the ultimate outcome of these proceedings, individually and in the aggregate, will not have a material adverse effect on our business or finances, litigation is subject to inherent uncertainties. Although a single or multiple adverse rulings or settlements could possibly have a material adverse effect on our business or finances, we only accrue for losses from litigation and claims if we determine that a loss is probable and the amount can be reasonably estimated.
In mid-2006, Denbury Onshore, LLC (“Denbury Onshore”), a subsidiary of Denbury Resources Inc. (“DRI” and together with Denbury Onshore, “Denbury”), purchased its original interest in the Delhi Field in northeastern Louisiana from NGS Sub Corp. (“NGS”), a subsidiary of Evolution Petroleum Corporation (together with its subsidiaries, “Evolution”). Under the purchase documents, Denbury Onshore committed to develop the enhanced production of the Holt Bryant Unit (the “Unit”), which is a specific portion of the Delhi Field, and after Denbury Onshore’s receipt of a defined level of net cash flow from the Unit (as defined in the purchase documents, “payout”), agreed to assign a reversionary interest in the Unit back to NGS. After several years of dispute regarding payout calculations and related contractual terms, in December 2013, Evolution filed suit against Denbury Onshore and DRI in the 133rd Judicial District Court in Houston, Harris County, Texas for unspecified damages. Evolution’s amended petition alleges breach of contract, and requests a declaratory judgment as to various provisions of the purchase documents and accompanying oil and gas conveyancing instruments, including as to the method of calculation and timing of payout, the sharing of various costs, and the timing and extent of post-payout assignments from Denbury Onshore to NGS. Evolution also brings claims for negligence and gross negligence in connection with the June-2013 Delhi Field release of well fluids. Evolution states in its amended petition that it is seeking over $200 million in damages in addition to unspecified punitive damages and attorneys’ fees. In Denbury’s answer and counterclaim, we have denied Evolution’s claims, alleged breach of contract by Evolution for failing to convey the full interest for which we paid and for violating our preferential purchase rights, and asked for a declaratory judgment as to various purchase document terms, including those pertaining to the determination of payout, the assignment of provisions of the documents, and cost sharing. Denbury has also filed a Motion for Summary Judgment seeking dismissal of Evolution’s tort claims for negligence and gross negligence.
Discovery in the case is ongoing. The case is currently set for trial in July 2016. We believe that Evolution’s claims and requests for damages in this matter are without merit and we intend to vigorously pursue our requested relief under the purchase documents.
Potential Mississippi Environmental Administrative Proceeding
The Company is currently attempting to conclude negotiations with the Mississippi Department of Environmental Quality (“MDEQ”) that began following receipt of a February 2015 notice from the MDEQ related to a discharge of materials at the West Heidelberg Field in Jasper County, Mississippi in the third quarter of 2013. Based upon discussions with the MDEQ during the first quarter of 2016, it is currently anticipated that an agreementa settlement related to the discharge providing for a monetary fine as a civil penalty will be reached with the MDEQ in 2016, thus eliminating the need for an administrative proceeding. The Company expects any such fine will not be material to the Company’s business or financial condition.
Settlement of NGS Sub Corp., Evolution, et al v. Denbury Onshore, LLC
On June 24, 2016, we entered into a settlement agreement with Evolution Petroleum Corporation resolving all outstanding disputes and claims the parties have or may have against each other, including pending litigation claims, involving the Delhi Field in northeastern Louisiana. On July 11, 2016, the pending Delhi Field litigation between the parties was dismissed by the Court with prejudice. For further discussion of the settlement, see Note 7, Commitments and Contingencies, to the Unaudited Condensed Consolidated Financial Statements.
Item 1A. Risk Factors
Information with respect to the Company’s risk factors has been incorporated by reference to Item 1A of the Form 10-K. There have been no material changes to the risk factors contained in the Form 10-K since its filing.
Item 2. Unregistered Sales of Equity Securities and Use of Proceeds
Sales of Unregistered Securities
As part of the privately negotiated senior note exchanges which took place in May 2016, as more fully described in Note 2, Long-Term Debt, to the Unaudited Condensed Consolidated Financial Statements, we issued 40.7 million shares of Denbury common stock that were not and will not be registered under the Securities Act of 1933, as amended, and the rules and regulations promulgated thereunder. The shares of common stock were offered in reliance on the exemption from registration under Section 4(a)(2) of the Securities Act of 1933, as amended.
Issuer Purchases of Equity Securities
The following table summarizes purchases of our common stock during the firstsecond quarter of 2016:
|
| | | | | | | | | | | | | | |
| Month | | Total Number of Shares Purchased (1) | | Average Price Paid per Share | | Total Number of Shares Purchased as Part of Publicly Announced Plans or Programs | | Approximate Dollar Value of Shares that May Yet Be Purchased Under the Plans or Programs (in millions) (2) |
| January 2016 | | 557,800 |
| | $ | 1.71 |
| | — |
| | $ | 210.1 |
|
| February 2016 | | 3,058 |
| | 1.11 |
| | — |
| | 210.1 |
|
| March 2016 | | 49,599 |
| | 2.23 |
| | — |
| | 210.1 |
|
| Total | | 610,457 |
| | |
| — |
| |
|
|
|
| | | | | | | | | | | | | | |
| Month | | Total Number of Shares Purchased (1) | | Average Price Paid per Share | | Total Number of Shares Purchased as Part of Publicly Announced Plans or Programs | | Approximate Dollar Value of Shares that May Yet Be Purchased Under the Plans or Programs (in millions) (2) |
| April 2016 | | 4,876 |
| | $ | 3.80 |
| | — |
| | $ | 210.1 |
|
| May 2016 | | 615 |
| | 3.72 |
| | — |
| | 210.1 |
|
| June 2016 | | 5,642 |
| | 4.13 |
| | — |
| | 210.1 |
|
| Total | | 11,133 |
| | |
| — |
| |
|
|
| |
| (1) | Stock repurchases during the firstsecond quarter of 2016 were made in connection with delivery by our employees of shares to us to satisfy their tax withholding requirements related to the vesting of restricted shares and the exercise of stock appreciation rights. |
| |
| (2) | In October 2011, we commenced a common share repurchase program, which has been approved for up to an aggregate of $1.162 billion of Denbury common shares by the Company’s Board of Directors. The program has no pre-established ending date and may be suspended or discontinued at any time. We are not obligated to repurchase any dollar amount or specific number of shares of our common stock under the program.program, and do not anticipate repurchasing shares of our common stock as long as current commodity pricing and market conditions persist. |
Between early October 2011 when we announced the commencement of a common share repurchase program, and March 31,June 30, 2016, we repurchased 64.4 million shares of Denbury common stock (approximately 16.0% of our outstanding shares of common stock at September 30, 2011) for $951.8 million, with no repurchases made since October 2015. An additional $210.1 million remains authorized for purchases of common stock under this repurchase program.
Item 3. Defaults upon Senior Securities
None.
Item 4. Mine Safety Disclosures
None.
Item 5. Other Information
None.
Item 6. Exhibits
|
| | |
| Exhibit No. | | Exhibit |
10(a)*4(a) | | 2016 Form of TSR Performance Award-Equity under the 2004 Omnibus Stock and Incentive PlanIndenture for Denbury Resources Inc.
|
10(b)* | | 2016 Form of TSR Performance Award-Cash under the 2004 Omnibus Stock and Incentive Plan for Denbury Resources Inc.
|
10(c)* | | 2016 Form of EBITDAX Performance Award-Equity under the 2004 Omnibus Stock and Incentive Plan for Denbury Resources Inc.
|
10(d)* | | 2016 Form of EBITDAX Performance Award-Cash under the 2004 Omnibus Stock and Incentive Plan for Denbury Resources Inc.
|
10(e)* | | 2016 Form of Oil Price Change vs. TSR Performance Award.
|
10(f)* | | Denbury Resources Inc. Severance Protection Plan, as amended and restated effective as of March 31, 2016.
|
10(g) | | Third Amendment to Amended and Restated Credit Agreement,9% Senior Secured Second Lien Notes due 2021, dated as of April 18,May 10, 2016, by and among Denbury Resources Inc., certain of its subsidiaries, and Wilmington Trust, National Association, as Borrower, JPMorgan Chase Bank N.A.Trustee and Collateral Trustee (incorporated by reference to Exhibit 4.1 of Form 8-K filed by the Company on May 11, 2016, File No. 001-12935).
|
| 10(a) | | Collateral Trust Agreement, dated as of May 10, 2016, by and among Denbury Resources Inc., certain of its subsidiaries, and Wilmington Trust, National Association, as Administrative Agent,Trustee and the financial institutions party theretoCollateral Trustee (incorporated by reference to Exhibit 10.1 of Form 8-K filed by the Company on April 20,May 11, 2016, File. No. 001-12935). |
| 10(b) | | Intercreditor Agreement, dated as of May 10, 2016, by and between JPMorgan Chase Bank, N.A., as Priority Lien Agent, and Wilmington Trust, National Association, as Collateral Trustee (incorporated by reference to Exhibit 10.2 of Form 8-K filed by the Company on May 11, 2016, File No. 001-12935).
|
| 10(c) | | Denbury Resources Inc. 2004 Omnibus Stock and Incentive Plan, as amended and restated effective as of May 24, 2016 (incorporated by reference to Exhibit 10.1 of Form 8-K filed by the Company on May 27, 2016, File No. 001-12935). |
| 10(d)* | | 2016 Form of Restricted Share Award to officers pursuant to the 2004 Omnibus Stock and Incentive Plan for Denbury Resources Inc. |
| 10(e)* | | 2016 Form of Restricted Share Award to non-employee directors pursuant to the 2004 Omnibus Stock and Incentive Plan for Denbury Resources Inc. |
| 31(a)* | | Certification of Chief Executive Officer Pursuant to Section 302 of the Sarbanes-Oxley Act of 2002. |
| 31(b)* | | Certification of Chief Financial Officer Pursuant to Section 302 of the Sarbanes-Oxley Act of 2002. |
| 32* | | Certification of Chief Executive Officer and Chief Financial Officer Pursuant to Section 906 of the Sarbanes-Oxley Act of 2002. |
| 101* | | Interactive Data Files.
|
SIGNATURES
Pursuant to the requirements of the Securities Exchange Act of 1934, the registrant has duly caused this report to be signed on its behalf by the undersigned thereunto duly authorized.
|
| | |
| | | DENBURY RESOURCES INC. |
| | | |
May 6,August 5, 2016 | | /s/ Mark C. Allen |
| | | Mark C. Allen Sr. Vice President and Chief Financial Officer |
| | | |
May 6,August 5, 2016 | | /s/ Alan Rhoades |
| | | Alan Rhoades Vice President and Chief Accounting Officer |
INDEX TO EXHIBITS
|
| | |
| Exhibit No. | | Exhibit |
10(a)10(d) | | 2016 Form of TSR Performance Award-Equity underRestricted Share Award to officers pursuant to the 2004 Omnibus Stock and Incentive Plan for Denbury Resources Inc.
|
10(b)10(e) | | 2016 Form of TSR Performance Award-Cash underRestricted Share Award to non-employee directors pursuant to the 2004 Omnibus Stock and Incentive Plan for Denbury Resources Inc.
|
10(c) | | 2016 Form of EBITDAX Performance Award-Equity under the 2004 Omnibus Stock and Incentive Plan for Denbury Resources Inc.
|
10(d) | | 2016 Form of EBITDAX Performance Award-Cash under the 2004 Omnibus Stock and Incentive Plan for Denbury Resources Inc.
|
10(e) | | 2016 Form of Oil Price Change vs. TSR Performance Award.
|
10(f) | | Denbury Resources Inc. Severance Protection Plan, as amended and restated effective as of March 31, 2016.
|
| 31(a) | | Certification of Chief Executive Officer Pursuant to Section 302 of the Sarbanes-Oxley Act of 2002.
|
| 31(b) | | Certification of Chief Financial Officer Pursuant to Section 302 of the Sarbanes-Oxley Act of 2002.
|
| 32 | | Certification of Chief Executive Officer and Chief Financial Officer Pursuant to Section 906 of the Sarbanes-Oxley Act of 2002.
|
| 101 | | Interactive Data Files.
|