RESIDEO TECHNOLOGIES, INC.
CONSOLIDATED BALANCE SHEETS
(In millions, except shares in thousands, and per share data)
Statements.
|
| October 1, 2022 |
|
| December 31, 2021 |
| ||
ASSETS |
|
|
|
|
|
| ||
Current assets: |
|
|
|
|
|
| ||
Cash and cash equivalents |
| $ | 252 |
|
| $ | 775 |
|
Accounts receivable, net |
|
| 1,043 |
|
|
| 876 |
|
Inventories, net |
|
| 957 |
|
|
| 740 |
|
Other current assets |
|
| 198 |
|
|
| 150 |
|
Total current assets |
|
| 2,450 |
|
|
| 2,541 |
|
Property, plant and equipment, net |
|
| 351 |
|
|
| 287 |
|
Goodwill |
|
| 2,678 |
|
|
| 2,661 |
|
Other intangible assets, net |
|
| 460 |
|
|
| 120 |
|
Other assets |
|
| 323 |
|
|
| 244 |
|
Total assets |
| $ | 6,262 |
|
| $ | 5,853 |
|
LIABILITIES AND STOCKHOLDERS’ EQUITY |
|
|
|
|
|
| ||
Current liabilities: |
|
|
|
|
|
| ||
Accounts payable |
| $ | 936 |
|
| $ | 883 |
|
Current maturities of long-term debt |
|
| 12 |
|
|
| 10 |
|
Accrued liabilities |
|
| 594 |
|
|
| 601 |
|
Total current liabilities |
|
| 1,542 |
|
|
| 1,494 |
|
Long-term debt, net of current maturities |
|
| 1,407 |
|
|
| 1,220 |
|
Obligations payable under Indemnification Agreements |
|
| 575 |
|
|
| 585 |
|
Other liabilities |
|
| 338 |
|
|
| 302 |
|
Total liabilities |
|
| 3,862 |
|
|
| 3,601 |
|
COMMITMENTS AND CONTINGENCIES |
|
|
|
|
|
| ||
Stockholders’ equity: |
|
|
|
|
|
| ||
Common shares, $0.001 par value, 700,000 shares authorized, |
|
| - |
|
|
| - |
|
Additional paid-in capital |
|
| 2,162 |
|
|
| 2,121 |
|
Retained earnings |
|
| 561 |
|
|
| 317 |
|
Accumulated other comprehensive loss, net |
|
| (292 | ) |
|
| (165 | ) |
Treasury shares |
|
| (31 | ) |
|
| (21 | ) |
Total stockholders’ equity |
|
| 2,400 |
|
|
| 2,252 |
|
Total liabilities and stockholders’ equity |
| $ | 6,262 |
|
| $ | 5,853 |
|
| (in millions, except par value) | September 30, 2023 | December 31, 2022 | |||||||||
| ASSETS | |||||||||||
| Current assets: | |||||||||||
| Cash and cash equivalents | $ | 368 | $ | 326 | |||||||
| Accounts receivable, net | 988 | 1,002 | |||||||||
| Inventories, net | 970 | 975 | |||||||||
| Other current assets | 289 | 199 | |||||||||
| Total current assets | 2,615 | 2,502 | |||||||||
| Property, plant and equipment, net | 380 | 366 | |||||||||
| Goodwill | 2,687 | 2,724 | |||||||||
| Intangible assets, net | 456 | 475 | |||||||||
| Other assets | 321 | 320 | |||||||||
| Total assets | $ | 6,459 | $ | 6,387 | |||||||
| LIABILITIES AND STOCKHOLDERS’ EQUITY | |||||||||||
| Current liabilities: | |||||||||||
| Accounts payable | $ | 863 | $ | 894 | |||||||
| Current portion of long-term debt | 12 | 12 | |||||||||
| Accrued liabilities | 592 | 640 | |||||||||
| Total current liabilities | 1,467 | 1,546 | |||||||||
| Long-term debt | 1,397 | 1,404 | |||||||||
| Obligations payable under Indemnification Agreements | 599 | 580 | |||||||||
| Other liabilities | 351 | 328 | |||||||||
| Total liabilities | 3,814 | 3,858 | |||||||||
| COMMITMENTS AND CONTINGENCIES | |||||||||||
| Stockholders’ equity | |||||||||||
| Common stock, $0.001 par value: 700 shares authorized, 151 and 146 shares issued and outstanding at September 30, 2023, respectively, and 148 and 146 shares issued and outstanding at December 31, 2022, respectively | — | — | |||||||||
| Additional paid-in capital | 2,219 | 2,176 | |||||||||
| Retained earnings | 728 | 600 | |||||||||
| Accumulated other comprehensive loss, net | (221) | (212) | |||||||||
| Treasury stock at cost | (81) | (35) | |||||||||
| Total stockholders’ equity | 2,645 | 2,529 | |||||||||
| Total liabilities and stockholders’ equity | $ | 6,459 | $ | 6,387 | |||||||
RESIDEO TECHNOLOGIES, INC.
CONSOLIDATED STATEMENTS OF OPERATIONS
(In millions, except shares in thousands, and per share data)
|
| Three Months Ended |
|
| Nine Months Ended |
| ||||||||||
|
| October 1, 2022 |
|
| October 2, 2021 |
|
| October 1, 2022 |
|
| October 2, 2021 |
| ||||
Net revenue |
| $ | 1,618 |
|
| $ | 1,496 |
|
| $ | 4,810 |
|
| $ | 4,392 |
|
Cost of goods sold |
|
| 1,188 |
|
|
| 1,075 |
|
|
| 3,475 |
|
|
| 3,210 |
|
Gross profit |
|
| 430 |
|
|
| 421 |
|
|
| 1,335 |
|
|
| 1,182 |
|
Research and development expenses |
|
| 29 |
|
|
| 20 |
|
|
| 81 |
|
|
| 63 |
|
Selling, general and administrative expenses |
|
| 236 |
|
|
| 227 |
|
|
| 716 |
|
|
| 678 |
|
Intangible asset amortization |
|
| 10 |
|
|
| 7 |
|
|
| 25 |
|
|
| 23 |
|
Income from operations |
|
| 155 |
|
|
| 167 |
|
|
| 513 |
|
|
| 418 |
|
Other expense, net |
|
| 44 |
|
|
| 58 |
|
|
| 125 |
|
|
| 130 |
|
Interest expense, net |
|
| 15 |
|
|
| 12 |
|
|
| 40 |
|
|
| 37 |
|
Income before taxes |
|
| 96 |
|
|
| 97 |
|
|
| 348 |
|
|
| 251 |
|
Provision for income taxes |
|
| 33 |
|
|
| 29 |
|
|
| 104 |
|
|
| 76 |
|
Net income |
| $ | 63 |
|
| $ | 68 |
|
| $ | 244 |
|
| $ | 175 |
|
Earnings per share |
|
|
|
|
|
|
|
|
|
|
|
| ||||
Basic |
| $ | 0.43 |
|
| $ | 0.47 |
|
| $ | 1.68 |
|
| $ | 1.22 |
|
Diluted |
| $ | 0.42 |
|
| $ | 0.46 |
|
| $ | 1.64 |
|
| $ | 1.18 |
|
Weighted average number of shares outstanding |
|
|
|
|
|
|
|
|
|
|
|
| ||||
Basic |
|
| 145,755 |
|
|
| 144,284 |
|
|
| 145,442 |
|
|
| 143,865 |
|
Diluted |
|
| 149,158 |
|
|
| 148,559 |
|
|
| 148,972 |
|
|
| 148,260 |
|
|
|
|
|
|
|
|
|
|
|
|
|
| ||||
| Three Months Ended | Nine Months Ended | ||||||||||||||||||||||
| (in millions, except per share data) | September 30, 2023 | October 1, 2022 | September 30, 2023 | October 1, 2022 | |||||||||||||||||||
| Net revenue | $ | 1,554 | $ | 1,618 | $ | 4,705 | $ | 4,810 | |||||||||||||||
| Cost of goods sold | 1,137 | 1,188 | 3,432 | 3,475 | |||||||||||||||||||
| Gross profit | 417 | 430 | 1,273 | 1,335 | |||||||||||||||||||
| Operating expenses: | |||||||||||||||||||||||
| Research and development expenses | 28 | 29 | 84 | 81 | |||||||||||||||||||
| Selling, general and administrative expenses | 233 | 236 | 719 | 716 | |||||||||||||||||||
| Intangible asset amortization | 9 | 10 | 28 | 25 | |||||||||||||||||||
| Restructuring and impairment expenses | 38 | — | 42 | — | |||||||||||||||||||
| Total operating expenses | 308 | 275 | 873 | 822 | |||||||||||||||||||
| Income from operations | 109 | 155 | 400 | 513 | |||||||||||||||||||
| Other expenses, net | 56 | 44 | 138 | 126 | |||||||||||||||||||
| Interest expense, net | 16 | 15 | 50 | 39 | |||||||||||||||||||
| Income before taxes | 37 | 96 | 212 | 348 | |||||||||||||||||||
| Provision for income taxes | 16 | 33 | 84 | 104 | |||||||||||||||||||
| Net income | $ | 21 | $ | 63 | $ | 128 | $ | 244 | |||||||||||||||
| Earnings per share: | |||||||||||||||||||||||
| Basic | $ | 0.14 | $ | 0.43 | $ | 0.87 | $ | 1.68 | |||||||||||||||
| Diluted | $ | 0.14 | $ | 0.42 | $ | 0.86 | $ | 1.64 | |||||||||||||||
| Weighted average number of shares outstanding: | |||||||||||||||||||||||
| Basic | 147 | 146 | 147 | 145 | |||||||||||||||||||
| Diluted | 148 | 149 | 149 | 149 | |||||||||||||||||||
4
RESIDEO TECHNOLOGIES, INC.
CONSOLIDATED STATEMENTS OF COMPREHENSIVE (LOSS) INCOME
(In millions)
|
| Three Months Ended |
|
| Nine Months Ended |
| ||||||||||
|
| October 1, 2022 |
|
| October 2, 2021 |
|
| October 1, 2022 |
|
| October 2, 2021 |
| ||||
Comprehensive (loss) income: |
|
|
|
|
|
|
|
|
|
|
|
| ||||
Net income |
| $ | 63 |
|
| $ | 68 |
|
| $ | 244 |
|
| $ | 175 |
|
Other comprehensive (loss) income, net of tax: |
|
|
|
|
|
|
|
|
|
|
|
| ||||
Foreign exchange translation (loss) |
|
| (86 | ) |
|
| (24 | ) |
|
| (165 | ) |
|
| (41 | ) |
Changes in unrealized gain on derivatives |
|
| 14 |
|
|
| - |
|
|
| 38 |
|
|
| - |
|
Total other comprehensive (loss) |
|
| (72 | ) |
|
| (24 | ) |
|
| (127 | ) |
|
| (41 | ) |
Comprehensive (loss) income |
| $ | (9 | ) |
| $ | 44 |
|
| $ | 117 |
|
| $ | 134 |
|
| Three Months Ended | Nine Months Ended | ||||||||||||||||||||||
| (in millions) | September 30, 2023 | October 1, 2022 | September 30, 2023 | October 1, 2022 | |||||||||||||||||||
| Comprehensive income (loss): | |||||||||||||||||||||||
| Net income | $ | 21 | $ | 63 | $ | 128 | $ | 244 | |||||||||||||||
| Other comprehensive loss, net of tax: | |||||||||||||||||||||||
| Foreign exchange translation loss | (37) | (86) | (11) | (165) | |||||||||||||||||||
| Pension liability adjustments | 2 | — | 6 | — | |||||||||||||||||||
| Changes in fair value of effective cash flow hedges | (2) | 14 | (4) | 38 | |||||||||||||||||||
| Total other comprehensive loss, net of tax | (37) | (72) | (9) | (127) | |||||||||||||||||||
| Comprehensive income (loss) | $ | (16) | $ | (9) | $ | 119 | $ | 117 | |||||||||||||||
5
RESIDEO TECHNOLOGIES, INC.
CONSOLIDATED STATEMENTS OF CASH FLOWS
(In millions)
|
| Nine Months Ended |
| |||||
|
| October 1, 2022 |
|
| October 2, 2021 |
| ||
Cash flows from operating activities: |
|
|
|
|
|
| ||
Net income |
| $ | 244 |
|
| $ | 175 |
|
Adjustments to reconcile net income to net cash provided by operating activities: |
|
|
|
|
|
| ||
Depreciation and amortization |
|
| 69 |
|
|
| 67 |
|
Loss on extinguishment of debt |
|
| - |
|
|
| 41 |
|
Share-based compensation expense |
|
| 36 |
|
|
| 29 |
|
Other, net |
|
| 8 |
|
|
| 4 |
|
Changes in operating assets and liabilities, net of effect of acquisitions: |
|
|
|
|
|
| ||
Accounts receivable, net |
|
| (142 | ) |
|
| (78 | ) |
Inventories, net |
|
| (129 | ) |
|
| (40 | ) |
Other current assets |
|
| (38 | ) |
|
| (6 | ) |
Accounts payable |
|
| 5 |
|
|
| (19 | ) |
Accrued liabilities |
|
| (25 | ) |
|
| 26 |
|
Other, net |
|
| (15 | ) |
|
| 4 |
|
Net cash provided by operating activities |
|
| 13 |
|
|
| 203 |
|
Cash flows from investing activities: |
|
|
|
|
|
| ||
Capital expenditures |
|
| (34 | ) |
|
| (48 | ) |
Acquisitions, net of cash acquired |
|
| (660 | ) |
|
| (11 | ) |
Other, net |
|
| (13 | ) |
|
| 3 |
|
Net cash used in investing activities |
|
| (707 | ) |
|
| (56 | ) |
Cash flows from financing activities: |
|
|
|
|
|
| ||
Proceeds from issuance of A&R Term B Facility |
|
| 200 |
|
|
| 1,250 |
|
Payments of debt facility issuance and modification costs |
|
| (4 | ) |
|
| (39 | ) |
Repayments of long-term debt |
|
| (9 | ) |
|
| (1,185 | ) |
Other, net |
|
| (5 | ) |
|
| 2 |
|
Net cash provided by financing activities |
|
| 182 |
|
|
| 28 |
|
Effect of foreign exchange rate changes on cash, cash equivalents and restricted cash |
|
| (12 | ) |
|
| (6 | ) |
Net (decrease) increase in cash, cash equivalents and restricted cash |
|
| (524 | ) |
|
| 169 |
|
Cash, cash equivalents and restricted cash at beginning of period |
|
| 779 |
|
|
| 517 |
|
Cash, cash equivalents and restricted cash at end of period |
| $ | 255 |
|
| $ | 686 |
|
|
|
|
|
|
|
| ||
Supplemental Cash Flow Information: |
|
|
|
|
|
| ||
Interest paid |
| $ | 38 |
|
| $ | 33 |
|
Income taxes paid, net |
| $ | 129 |
|
| $ | 84 |
|
| Nine Months Ended | |||||||||||||||||
| (in millions) | September 30, 2023 | October 1, 2022 | |||||||||||||||
| Cash Flows From Operating Activities: | |||||||||||||||||
| Net income | $ | 128 | $ | 244 | |||||||||||||
| Adjustments to reconcile net income to net cash in operating activities: | |||||||||||||||||
| Depreciation and amortization | 71 | 69 | |||||||||||||||
| Restructuring and impairment expenses | 42 | — | |||||||||||||||
| Stock-based compensation expense | 36 | 36 | |||||||||||||||
| Other, net | 2 | 8 | |||||||||||||||
| Changes in assets and liabilities, net of acquired companies: | |||||||||||||||||
| Accounts receivable, net | (9) | (142) | |||||||||||||||
| Inventories, net | (4) | (129) | |||||||||||||||
| Other current assets | (5) | (38) | |||||||||||||||
| Accounts payable | (14) | 5 | |||||||||||||||
| Accrued liabilities | (114) | (25) | |||||||||||||||
| Other, net | 44 | (15) | |||||||||||||||
| Net cash provided by operating activities | 177 | 13 | |||||||||||||||
| Cash Flows From Investing Activities: | |||||||||||||||||
| Capital expenditures | (74) | (34) | |||||||||||||||
| Acquisitions, net of cash acquired | (16) | (660) | |||||||||||||||
| Other investing activities, net | — | (13) | |||||||||||||||
| Net cash used in investing activities | (90) | (707) | |||||||||||||||
| Cash Flows From Financing Activities: | |||||||||||||||||
| Common stock repurchases | (28) | — | |||||||||||||||
| Proceeds from issuance of A&R Term B Facility | — | 200 | |||||||||||||||
| Repayments of long-term debt | (9) | (9) | |||||||||||||||
| Other financing activities, net | (10) | (9) | |||||||||||||||
| Net cash (used in) provided by financing activities | (47) | 182 | |||||||||||||||
| Effect of foreign exchange rate changes on cash, cash equivalents and restricted cash | 1 | (12) | |||||||||||||||
| Net increase (decrease) in cash, cash equivalents and restricted cash | 41 | (524) | |||||||||||||||
| Cash, cash equivalents and restricted cash at beginning of period | 329 | 779 | |||||||||||||||
| Cash, cash equivalents and restricted cash at end of period | $ | 370 | $ | 255 | |||||||||||||
| Supplemental Cash Flow Information: | |||||||||||||||||
| Interest paid | $ | 81 | $ | 38 | |||||||||||||
| Taxes paid, net of refunds | $ | 104 | $ | 129 | |||||||||||||
| Capital expenditures in accounts payable | $ | 19 | $ | 18 | |||||||||||||
6
RESIDEO TECHNOLOGIES, INC.
CONSOLIDATED STATEMENTS OF STOCKHOLDERS' EQUITY
(In millions, except shares in thousands)
Fiscal Quarters |
| Common |
|
| Common |
|
| Additional |
|
| Retained |
|
| Accumulated |
|
| Treasury |
|
| Treasury |
|
| Total |
| ||||||||
Balance as of July 2, 2022 |
|
| 145,684 |
|
| $ | - |
|
| $ | 2,147 |
|
| $ | 498 |
|
| $ | (220 | ) |
|
| 1,844 |
|
| $ | (31 | ) |
| $ | 2,394 |
|
Net income |
|
| - |
|
|
| - |
|
|
| - |
|
|
| 63 |
|
|
| - |
|
|
| - |
|
|
| - |
|
|
| 63 |
|
Other comprehensive loss, net of tax |
|
| - |
|
|
| - |
|
|
| - |
|
|
| - |
|
|
| (72 | ) |
|
| - |
|
|
| - |
|
|
| (72 | ) |
Share issuances, net of shares withheld for taxes |
|
| 154 |
|
|
| - |
|
|
| 2 |
|
|
| - |
|
|
| - |
|
|
| 21 |
|
|
| - |
|
|
| 2 |
|
Share-based compensation |
|
| - |
|
|
| - |
|
|
| 13 |
|
|
| - |
|
|
| - |
|
|
| - |
|
|
| - |
|
|
| 13 |
|
Balance as of October 1, 2022 |
|
| 145,838 |
|
| $ | - |
|
| $ | 2,162 |
|
| $ | 561 |
|
| $ | (292 | ) |
|
| 1,865 |
|
| $ | (31 | ) |
| $ | 2,400 |
|
|
|
|
|
|
|
|
|
|
|
|
|
|
|
|
|
|
|
|
|
|
|
|
|
| ||||||||
Balance as of July 3, 2021 |
|
| 144,171 |
|
| $ | - |
|
| $ | 2,098 |
|
| $ | 182 |
|
| $ | (163 | ) |
|
| 1,188 |
|
| $ | (14 | ) |
| $ | 2,103 |
|
Net income |
|
| - |
|
|
| - |
|
|
| - |
|
|
| 68 |
|
|
| - |
|
|
| - |
|
|
| - |
|
|
| 68 |
|
Other comprehensive (loss), net of tax |
|
| - |
|
|
| - |
|
|
| - |
|
|
| - |
|
|
| (24 | ) |
|
| - |
|
|
| - |
|
|
| (24 | ) |
Share issuances, net of shares withheld for taxes |
|
| 212 |
|
|
| - |
|
|
| 3 |
|
|
| - |
|
|
| - |
|
|
| 45 |
|
|
| (2 | ) |
|
| 1 |
|
Share-based compensation |
|
| - |
|
|
| - |
|
|
| 10 |
|
|
| - |
|
|
| - |
|
|
| - |
|
|
| - |
|
|
| 10 |
|
Balance as of October 2, 2021 |
|
| 144,383 |
|
| $ | - |
|
| $ | 2,111 |
|
| $ | 250 |
|
| $ | (187 | ) |
|
| 1,233 |
|
| $ | (16 | ) |
| $ | 2,158 |
|
|
|
|
|
|
|
|
|
|
|
|
|
|
|
|
|
|
|
|
|
|
|
|
|
| ||||||||
Fiscal Year to Date Periods |
| Common |
|
| Common |
|
| Additional |
|
| Retained |
|
| Accumulated |
|
| Treasury |
|
| Treasury |
|
| Total |
| ||||||||
Balance as of December 31, 2021 |
|
| 144,808 |
|
| $ | - |
|
| $ | 2,121 |
|
| $ | 317 |
|
| $ | (165 | ) |
|
| 1,440 |
|
| $ | (21 | ) |
| $ | 2,252 |
|
Net income |
|
| - |
|
|
| - |
|
|
| - |
|
|
| 244 |
|
|
| - |
|
|
| - |
|
|
| - |
|
|
| 244 |
|
Other comprehensive loss, net of tax |
|
| - |
|
|
| - |
|
|
| - |
|
|
| - |
|
|
| (127 | ) |
|
| - |
|
|
| - |
|
|
| (127 | ) |
Share issuances, net of shares withheld for taxes |
|
| 1,030 |
|
|
| - |
|
|
| 5 |
|
|
| - |
|
|
| - |
|
|
| 425 |
|
|
| (10 | ) |
|
| (5 | ) |
Share-based compensation |
| - |
|
|
| - |
|
|
| 36 |
|
|
| - |
|
| - |
|
| - |
|
|
| - |
|
|
| 36 |
| |||
Balance as of October 1, 2022 |
|
| 145,838 |
|
| $ | - |
|
| $ | 2,162 |
|
| $ | 561 |
|
| $ | (292 | ) |
|
| 1,865 |
|
| $ | (31 | ) |
| $ | 2,400 |
|
|
|
|
|
|
|
|
|
|
|
|
|
|
|
|
|
|
|
|
|
|
|
|
|
| ||||||||
Balance as of December 31, 2020 |
|
| 143,059 |
|
| $ | - |
|
| $ | 2,070 |
|
| $ | 75 |
|
| $ | (146 | ) |
|
| 900 |
|
| $ | (6 | ) |
| $ | 1,993 |
|
Net income |
|
| - |
|
|
| - |
|
|
| - |
|
|
| 175 |
|
|
| - |
|
|
| - |
|
|
| - |
|
|
| 175 |
|
Other comprehensive loss, net of tax |
|
| - |
|
|
| - |
|
|
| - |
|
|
| - |
|
|
| (41 | ) |
|
| - |
|
|
| - |
|
|
| (41 | ) |
Share issuances, net of shares withheld for taxes |
|
| 1,324 |
|
|
| - |
|
|
| 12 |
|
|
| - |
|
|
| - |
|
|
| 333 |
|
|
| (10 | ) |
|
| 2 |
|
Share-based compensation |
| - |
|
|
| - |
|
|
| 29 |
|
|
| - |
|
| - |
|
| - |
|
|
| - |
|
|
| 29 |
| |||
Balance as of October 2, 2021 |
|
| 144,383 |
|
| $ | - |
|
| $ | 2,111 |
|
| $ | 250 |
|
| $ | (187 | ) |
|
| 1,233 |
|
| $ | (16 | ) |
| $ | 2,158 |
|
| Fiscal Quarters | Common Stock | Accumulated Other Comprehensive Loss | Treasury Stock | ||||||||||||||||||||||||||||||||||||||||||||
| (in millions, except shares in thousands) | Shares | Amount | Additional Paid-In Capital | Retained Earnings | Shares | Amount | Total Stockholders’ Equity | ||||||||||||||||||||||||||||||||||||||||
| Balance at July 2, 2023 | 147,649 | $ | — | $ | 2,204 | $ | 707 | $ | (184) | 2,902 | $ | (50) | $ | 2,677 | |||||||||||||||||||||||||||||||||
| Net income | — | — | — | 21 | — | — | — | 21 | |||||||||||||||||||||||||||||||||||||||
| Other comprehensive loss, net of tax | — | — | — | — | (37) | — | — | (37) | |||||||||||||||||||||||||||||||||||||||
| Common stock issuance, net of shares withheld for taxes | 284 | — | 4 | — | — | 71 | (1) | 3 | |||||||||||||||||||||||||||||||||||||||
| Stock-based compensation expense | — | — | 11 | — | — | — | — | 11 | |||||||||||||||||||||||||||||||||||||||
| Common stock repurchases | (1,840) | — | — | — | — | 1,840 | (30) | (30) | |||||||||||||||||||||||||||||||||||||||
| Balance at September 30, 2023 | 146,093 | $ | — | $ | 2,219 | $ | 728 | $ | (221) | 4,813 | $ | (81) | $ | 2,645 | |||||||||||||||||||||||||||||||||
| Balance at July 3, 2022 | 145,684 | $ | — | $ | 2,147 | $ | 498 | $ | (220) | 1,844 | $ | (31) | $ | 2,394 | |||||||||||||||||||||||||||||||||
| Net income | — | — | — | 63 | — | — | — | 63 | |||||||||||||||||||||||||||||||||||||||
| Other comprehensive loss, net of tax | — | — | — | — | (72) | — | — | (72) | |||||||||||||||||||||||||||||||||||||||
| Common stock issuance, net of shares withheld for taxes | 154 | — | 2 | — | — | 21 | — | 2 | |||||||||||||||||||||||||||||||||||||||
| Stock-based compensation expense | — | — | 13 | — | — | — | — | 13 | |||||||||||||||||||||||||||||||||||||||
| Balance at October 1, 2022 | 145,838 | $ | — | $ | 2,162 | $ | 561 | $ | (292) | 1,865 | $ | (31) | $ | 2,400 | |||||||||||||||||||||||||||||||||
| Fiscal Year to Date Periods | Common Stock | Accumulated Other Comprehensive Loss | Treasury Stock | ||||||||||||||||||||||||||||||||||||||||||||
| (in millions, except shares in thousands) | Shares | Amount | Additional Paid-In Capital | Retained Earnings | Shares | Amount | Total Stockholders’ Equity | ||||||||||||||||||||||||||||||||||||||||
| Balance at January 1, 2023 | 146,222 | $ | — | $ | 2,176 | $ | 600 | $ | (212) | 2,050 | $ | (35) | $ | 2,529 | |||||||||||||||||||||||||||||||||
| Net income | — | — | — | 128 | — | — | — | 128 | |||||||||||||||||||||||||||||||||||||||
| Other comprehensive loss, net of tax | — | — | — | — | (9) | — | — | (9) | |||||||||||||||||||||||||||||||||||||||
| Common stock issuance, net of shares withheld for taxes | 1,711 | — | 7 | — | — | 923 | (16) | (9) | |||||||||||||||||||||||||||||||||||||||
| Stock-based compensation expense | — | — | 36 | — | — | — | — | 36 | |||||||||||||||||||||||||||||||||||||||
| Common stock repurchases | (1,840) | — | — | — | — | 1,840 | (30) | (30) | |||||||||||||||||||||||||||||||||||||||
| Balance at September 30, 2023 | 146,093 | $ | — | $ | 2,219 | $ | 728 | $ | (221) | 4,813 | $ | (81) | $ | 2,645 | |||||||||||||||||||||||||||||||||
| Balance at January 1, 2022 | 144,808 | $ | — | $ | 2,121 | $ | 317 | $ | (165) | 1,440 | $ | (21) | $ | 2,252 | |||||||||||||||||||||||||||||||||
| Net income | — | — | — | 244 | — | — | — | 244 | |||||||||||||||||||||||||||||||||||||||
| Other comprehensive loss, net of tax | — | — | — | — | (127) | — | — | (127) | |||||||||||||||||||||||||||||||||||||||
| Common stock issuance, net of shares withheld for taxes | 1,030 | — | 5 | — | — | 425 | (10) | (5) | |||||||||||||||||||||||||||||||||||||||
| Stock-based compensation expense | — | — | 36 | — | — | — | — | 36 | |||||||||||||||||||||||||||||||||||||||
| Balance at October 1, 2022 | 145,838 | $ | — | $ | 2,162 | $ | 561 | $ | (292) | 1,865 | $ | (31) | $ | 2,400 | |||||||||||||||||||||||||||||||||
RESIDEO TECHNOLOGIES, INC.
NOTES TO CONSOLIDATED FINANCIAL STATEMENTS
October 1, 2022
(In millions, unless otherwise noted)
(Unaudited)
Note
Business Description
Resideo Technologies, Inc. (“Resideo”, “the Company”the “Company”, “we”, “us”, “our”, or “we”“our”), is a leading manufacturer and developer of technology-driven products that provide critical comfort, energy, smoke and carbon monoxide detection home safety products, and security solutions to homes globally. We are also thea leading wholesale distributor of low-voltage security products including access control, fire detection, fire suppression, intrusion,security, and video products, and participate significantly in the broader related markets of audio, communications, data communications, networking, power, ProAV, smart home, and wire and cable. Our global footprint serves both commercial and residential end markets.
The Company was incorporated in Delaware on April 24, 2018 and we separated from Honeywell International Inc. (“Honeywell”) on October 29, 2018, becoming an independent publicly traded company as a result of a pro rata distribution of our common stock to shareholders of Honeywell (the “Spin-Off”).
We acquired First Alert, Inc., a provider of home safety products (“First Alert”) on March 31, 2022. The acquisition is expected to expand and leverage our footprint in the home with complementary smoke and carbon monoxide detection home safety products and fire suppression products. Refer to Note 13. Acquisitions for additional information.
During the year, we changed the presentation of intangible asset amortization on the unaudited Consolidated Statements of Operations, whereas they were previously included in cost of goods sold and selling, general and administrative expenses. The reclassification decreased cost of goods sold by $5 million and $17 million, and decreased selling, general and administrative expenses by $2 million and $6 million for the three and nine months ended October 2, 2021, respectively.
Certain other reclassifications have been made to prior period amounts in the Financial Statements to conform to the current presentation.
8
RESIDEO TECHNOLOGIES, INC.
NOTES TO CONSOLIDATED FINANCIAL STATEMENTS
October 1, 2022
(In millions, unless otherwise noted)
(Unaudited)
Restricted Cash
The following table provides a reconciliation of cash and cash equivalents and restricted cashSouthwire Company, LLC (the “buyer”) for $87.5 million, subject to customary adjustments. Genesis is reported within the Products and Solutions Segment. The divestiture does not represent a strategic shift, nor will it have a significant impact on our Unaudited Consolidated Statements of Operations. As such, we have reclassified the related assets and liabilities to held for sale within other current assets and accrued liabilities, respectively, on the Unaudited Consolidated Balance Sheets. The estimated fair value less costs exceeds the carrying amount for Genesis, therefore no impairment was recognized for the three and nine months ended September 30, 2023. The transaction closed in October 2023.
| (in millions) | September 30, 2023 | ||||
| Accounts receivables, net | $ | 20 | |||
| Inventories, net | 14 | ||||
| Property, plant and equipment, net | 7 | ||||
| Goodwill | 40 | ||||
| Other assets | 5 | ||||
| Total assets held for sale | $ | 86 | |||
| Accounts payable | $ | 18 | |||
| Accrued liabilities | 8 | ||||
| Other liabilities | 5 | ||||
| Total liabilities held for sale | $ | 31 | |||
|
| October 1, 2022 |
|
| December 31, 2021 |
| ||
Cash and cash equivalents |
| $ | 252 |
|
| $ | 775 |
|
Restricted cash included in Other current assets (1) |
|
| 3 |
|
|
| 4 |
|
Total cash, cash equivalents and restricted cash shown in the Consolidated Statements of Cash Flows |
| $ | 255 |
|
| $ | 779 |
|
(1) Primarily collateral to support certain bank guarantees.
We consider the applicability and impact of all recent accounting standards updates (“ASUs”) issued by the Financial Accounting Standards Board (“FASB”) The following table represents summary financial data attributable to the segments: Three Months Ended Nine Months Ended October 1, 2022 October 2, 2021 October 1, 2022 October 2, 2021 Net revenue: Products & Solutions $ 707 $ 631 $ 2,090 $ 1,835 ADI Global Distribution 911 865 2,720 2,557 Total Net revenue $ 1,618 $ 1,496 $ 4,810 $ 4,392 Three Months Ended Nine Months Ended October 1, 2022 October 2, 2021 October 1, 2022 October 2, 2021 Income from operations: Products & Solutions $ 124 $ 157 $ 431 $ 416 ADI Global Distribution 78 73 244 198 Corporate (47 ) (63 ) (162 ) (196 ) Total Income from operations $ 155 $ 167 $ 513 $ 418 Three Months Ended Nine Months Ended October 1, 2022 October 2, 2021 October 1, 2022 October 2, 2021 Products & Solutions: Security and Safety $ 248 $ 172 $ 670 $ 512 Air 245 215 721 612 Energy 142 156 455 446 Water 72 88 244 265 Total Products & Solutions $ 707 $ 631 $ 2,090 $ 1,835 ADI Global Distribution: U.S. and Canada $ 792 $ 727 $ 2,335 $ 2,125 EMEA (1) 111 128 360 402 APAC (2) 8 10 25 30 Total ADI Global Distribution 911 865 2,720 2,557 Total Net revenue $ 1,618 $ 1,496 $ 4,810 $ 4,392 Three Months Ended Nine Months Ended October 1, 2022 October 2, 2021 October 1, 2022 October 2, 2021 Cost of goods sold $ 3 $ 5 $ 13 $ 13 Selling, general and administrative expenses 13 12 38 34 Total operating lease expense $ 16 $ 17 $ 51 $ 47 Financial As of October 1, As of December 31, Operating right-of-use assets Other assets $ 187 $ 141 Operating lease liabilities - current Accrued liabilities $ 37 $ 32 Operating lease liabilities - noncurrent Other long-term liabilities $ 161 $ 120 As of October 1, 2022 $ 11 2023 45 2024 37 2025 31 2026 28 Thereafter 91 Total future minimum lease payments 243 Less: Imputed interest 45 Present value of future minimum lease payments $ 198 Weighted-average remaining lease term (years) 6.96 Weighted-average incremental borrowing rate 5.74 % Nine Months Ended October 1, 2022 October 2, 2021 Cash paid for amounts included in the measurement of lease liabilities: Cash outflows for operating leases $ 25 $ 25 Non-cash activities: Right-of-use assets obtained in exchange for new operating lease liabilities $ 84 $ 31 Three Months Ended Nine Months Ended October 1, 2022 October 2, 2021 October 1, 2022 October 2, 2021 Reimbursement Agreement $ 30 $ 39 $ 116 $ 111 Loss on extinguishment of debt - 18 - 41 Settlement of pre-Spin-Off litigation 13 - 13 - Other, net 1 1 (4 ) (22 ) Total Other expenses, net $ 44 $ 58 $ 125 $ 130 For the three and nine months ended October 1, 2022, stock-based compensation expense, net of tax was $13 million and $36 million, respectively. Three Months Ended Nine Months Ended October 1, 2022 October 2, 2021 October 1, 2022 October 2, 2021 Numerator for Basic and Diluted Earnings Per Share Net income $ 63 $ 68 $ 244 $ 175 Denominator for Basic and Diluted Earnings Per Share Weighted average basic number of shares outstanding 145,755 144,284 145,442 143,865 Add: dilutive effect of share equivalents 3,403 4,275 3,530 4,395 Weighted average diluted number of shares outstanding 149,158 148,559 148,972 148,260 Earnings per share: Basic $ 0.43 $ 0.47 $ 1.68 $ 1.22 Diluted $ 0.42 $ 0.46 $ 1.64 $ 1.18 October 1, 2022 December 31, 2021 Accounts receivable $ 1,052 $ 885 Allowance for doubtful accounts (9 ) (9 ) Accounts receivable, net $ 1,043 $ 876 October 1, 2022 December 31, 2021 Raw materials $ 256 $ 174 Work in process 25 17 Finished products 676 549 Total Inventories, net $ 957 $ 740 October 1, 2022 December 31, 2021 Machinery and equipment $ 625 $ 602 Buildings and improvements 292 292 Construction in progress 64 35 Other 7 4 Total Property, plant, and equipment, at cost 988 933 Less: Accumulated depreciation (637 ) (646 ) Property, plant, and equipment, net $ 351 $ 287 The following table Cash $ 2 Accounts receivable, net 72 Inventories, net 117 Other current assets 2 Property, plant and equipment 82 Goodwill (1) 86 Other intangible assets 349 Other assets (non-current) 31 Total assets 741 Accounts payable 57 Accrued liabilities 33 Other liabilities 36 Total liabilities 126 Net assets acquired $ 615 Products & Solutions ADI Global Distribution Total Balance as of December 31, 2021 $ 2,010 $ 651 $ 2,661 Acquisitions and divestitures 86 24 110 Foreign currency translation adjustments and other changes (70 ) (23 ) (93 ) Balance as of October 1, 2022 $ 2,026 $ 652 $ 2,678 The following table Range of Life (Years) Weighted Average Amortization Period (Years) Gross Carrying Amount Accumulated Net As of October 1, 2022 Other intangible assets, net: Patents and technology 3-10 10 $ 62 $ (24 ) $ 38 Customer relationships 7-15 14 289 (104 ) 185 Trademarks (1) 10-Indefinite 10 193 (8 ) 185 Software 2-7 6 167 (115 ) 52 Total intangible assets $ 711 $ (251 ) $ 460 As of December 31, 2021 Other intangible assets, net: Patents and technology 3-10 9 $ 31 $ (23 ) $ 8 Customer relationships 7-15 14 162 (106 ) 56 Trademarks 10 10 14 (8 ) 6 Software 2-7 6 162 (112 ) 50 Total intangible assets $ 369 $ (249 ) $ 120 Amortization Expense 2022 $ 9 2023 33 2024 31 2025 30 2026 25 (Unaudited) Accrued liabilities consist of the following: October 1, 2022 December 31, 2021 Obligations payable under Indemnification Agreements $ 140 $ 140 Compensation, benefit and other employee-related 101 114 Customer rebate reserve 84 94 Current operating lease liability 37 32 Taxes payable 33 54 Other (1) 199 167 Total Accrued liabilities $ 594 $ 601 We are required to indemnify Honeywell for any taxes resulting from the failure of the Spin-Off and related internal transactions to qualify for their intended tax treatment under U.S. federal, state and local income tax law, as well as foreign tax law, where such taxes result from our action or omission not permitted by the Separation and Distribution Agreement between Honeywell and Resideo dated as of October 19, 2018 or the Tax Matters Agreement. Reimbursement Tax Matters Agreement Agreement Total Beginning Balance, December 31, 2021 $ 597 $ 128 $ 725 Accruals for liabilities deemed probable and reasonably estimable (1) 116 (2 ) 114 Payments to Honeywell (105 ) (19 ) (124 ) Balance as of October 1, 2022 $ 608 $ 107 $ 715 October 1, 2022 December 31, 2021 Accrued liabilities $ 140 $ 140 Obligations payable under Indemnification Agreements 575 585 $ 715 $ 725 For the three and nine months ended September 30, 2023, net expenses related to the Reimbursement Agreement were $43 million and $128 million, respectively, and for the three and nine months ended October 1, 2022, net expenses related to the Reimbursement Agreement were Note 15. Commitments and Contingencies in our 2022 Annual Report on Form 10-K for further discussion of these matters. The following table summarizes information concerning recorded obligations for product warranties and product performance guarantees: Nine Months Ended October 1, 2022 October 2, 2021 Beginning of period $ 23 $ 22 Accruals for warranties/guarantees issued during the period 15 12 Additions from acquisitions 14 - Settlements and adjustments (17 ) (14 ) End of period $ 35 $ 20 Note 17. October 1, 2022 December 31, 2021 4.000% Senior Notes due 2029 $ 300 $ 300 Seven-year variable rate A&R Term B Facility 1,134 943 Unamortized deferred financing costs (15 ) (13 ) Total outstanding indebtedness 1,419 1,230 Less: Amounts expected to be paid within one year 12 10 Total long-term debt due after one year $ 1,407 $ 1,220 October 1, 2022 December 31, 2021 Carrying Amount Fair Value Carrying Amount Fair Value 4.000% Senior Notes due 2029 $ 300 $ 241 $ 300 $ 294 Seven-year variable rate term loan due 2028 $ 1,134 $ 1,103 $ 943 $ 943 October 1, 2022 December 31, 2021 Level 1 Level 2 Total Level 1 Level 2 Total Assets: Interest rate swap assets $ - $ 46 $ 46 $ - $ 7 $ 7 Liabilities: Interest rate swap liabilities - - - - 1 1 Total $ - $ 46 $ 46 $ - $ 6 $ 6 U.S. Plans Three months ended Nine months ended October 1, 2022 October 2, 2021 October 1, 2022 October 2, 2021 Periodic benefit cost: Service cost $ 2 $ 2 $ 5 $ 6 Interest cost 3 5 8 7 Expected return on plan assets (4 ) (8 ) (13 ) (12 ) Net periodic benefit cost $ 1 $ (1 ) $ 0 $ 1 Non-U.S. Plans Three months ended Nine months ended October 1, 2022 October 2, 2021 October 1, 2022 October 2, 2021 Periodic benefit cost: Service cost $ 1 $ 2 $ 4 $ 5 Interest cost - - 1 1 Expected return on plan assets - - - - Net periodic benefit cost $ 1 $ 2 $ 5 $ 6 Operations. Three Months Ended Nine Months Ended October 1, October 2, October 1, October 2, Net revenue $ 1,618 $ 1,496 $ 4,810 $ 4,392 Cost of goods sold 1,188 1,075 3,475 3,210 Gross profit 430 421 1,335 1,182 Research and development expenses 29 20 81 63 Selling, general and administrative expenses 236 227 716 678 Intangible asset amortization 10 7 25 23 Income from operations 155 167 513 418 Other expense, net 44 58 125 130 Interest expense 15 12 40 37 Income before taxes 96 97 348 251 Provision for income taxes 33 29 104 76 Net income $ 63 $ 68 $ 244 $ 175 Earnings per share Basic $ 0.43 $ 0.47 $ 1.68 $ 1.22 Diluted $ 0.42 $ 0.46 $ 1.64 $ 1.18 Weighted average number of common shares outstanding Basic 145,755 144,284 145,442 143,865 Diluted 149,158 148,559 148,972 148,260 Three Months Ended Nine Months Ended October 1, October 2, October 1, October 2, Net revenue $ 1,618 $ 1,496 $ 4,810 $ 4,392 % change compared with prior period 8 % 10 % Three Months Ended Nine Months Ended October 1, October 2, October 1, October 2, 2022 2021 2022 2021 Cost of goods sold $ 1,188 $ 1,075 $ 3,475 $ 3,210 % change compared with prior period 11 % 8 % Gross profit percentage 27 % 28 % 28 % 27 % Three Months Ended Nine Months Ended October 1, October 2, October 1, October 2, 2022 2021 2022 2021 Research and development expenses $ 29 $ 20 $ 81 $ 63 % of revenue 2 % 1 % 2 % 1 % Three Months Ended Nine Months Ended October 1, October 2, October 1, October 2, 2022 2021 2022 2021 Selling, general and administrative expenses $ 236 $ 227 $ 716 $ 678 % of revenue 15 % 15 % 15 % 15 % Three Months Ended Nine Months Ended October 1, October 2, October 1, October 2, 2022 2021 2022 2021 Other expense, net $ 44 $ 58 $ 125 $ 130 Three Months Ended Nine Months Ended October 1, October 2, October 1, October 2, 2022 2021 2022 2021 Provision for income taxes $ 33 $ 29 $ 104 $ 76 Effective tax rate 34 % 30 % 30 % 30 % Three Months Ended Nine Months Ended October 1, October 2, October 1, October 2, 2022 2021 % Change 2022 2021 % Change Net revenue $ 707 $ 631 12 % $ 2,090 $ 1,835 14 % Income from operations $ 124 $ 157 (21 )% $ 431 $ 416 4 % Income from operations percentage 18 % 25 % (700 bps) 21 % 23 % (200 bps) Three Months Ended Nine Months Ended October 1, October 2, October 1, October 2, 2022 2021 % Change 2022 2021 % Change Total revenue $ 911 $ 865 5 % $ 2,720 $ 2,557 6 % Income from operations $ 78 $ 73 7 % $ 244 $ 198 23 % Income from operations percentage 9 % 8 % 100 bps 9 % 8 % 100 bps Three Months Ended Nine Months Ended October 1, October 2, October 1, October 2, 2022 2021 % Change 2022 2021 % Change Corporate expenses $ 47 $ 63 (25 )% $ 162 $ 196 (17 )% additional funding at any time, we believe our existing cash, cash equivalents and availability under our credit facilities are sufficient to meet our capital requirements through at least the next 12 months and the longer term. Nine months ended October 1, October 2, 2022 2021 Cash provided by (used for): Operating activities $ 13 $ 203 Investing activities (707 ) (56 ) Financing activities 182 28 Effect of exchange rate changes on cash, cash equivalents and restricted cash (12 ) (6 ) Net (decrease) increase in cash, cash equivalents and restricted cash $ (524 ) $ 169 Exhibit Exhibit Description 31.1 31.2 32.1 32.2 101.INS Inline XBRL Instance Document (filed herewith) 101.SCH Inline XBRL Taxonomy Extension Schema (filed herewith) 101.CAL Inline XBRL Taxonomy Extension Calculation Linkbase (filed herewith) 101.DEF Inline XBRL Taxonomy Extension Definition Linkbase (filed herewith) 101.LAB Inline XBRL Taxonomy Extension Label Linkbase (filed herewith) 101.PRE Inline XBRL Taxonomy Extension Presentation Linkbase (filed herewith) 104 Cover Page Interactive Data File (formatted as Inline XBRL and contained in Exhibit 101) Date: November 1, By: /s/ Anthony L. Trunzo Anthony L. Trunzo Date: November 1, By: /s/ Tina Beskid Tina Beskid Vice President, Controller, and Chief Accounting OfficerThe Company’sOur significant accounting policies are detailed in Note 2. Summary of Significant Accounting Policies of the Annual Report on Form 10-K for the year ended December 31, 2021.2022. There have been no significant changes to these policies that have had a material impact on the Unaudited Consolidated Financial Statements and accompanying notes for the three and nine months ended September 30, 2023.Recent Accounting Pronouncements. ASUs not listed below were assessed and determined to be either not applicable or are expected to have an immaterial impact on our Financial Statements.In September 2022, the FASB issued ASU No. 2022-04, Liabilities-Supplier Finance Programs (Topic 405): Disclosure of Supplier Finance Program Obligations, which provides guidance for a buyer in a supplier finance program to disclose sufficient information about the program to allow a user of financial statements to understand the program’s nature, activity during the period, changes from period to period and potential magnitude. The standard is effective for interim annual periods beginning after December 15, 2023, with early adoption permitted. We are currently evaluating the potential impact of adopting this standard but do not expect it toonly those that may have a material impact on our Financial Statements.impact.In October 2021, the FASB issued ASU No. 2021-08, Business Combinations (Topic 805):for Contract Assets and Contract Liabilities from Contracts with CustomersPronouncements. Under this standard, an acquirer must recognize, and measure contract assets and contract liabilities acquired in a business combination in accordance with ASU 2014-09, Revenue from Contracts with Customers (Topic 606). The standard is effective for interim and annual periods beginning after December 15, 2022, with early adoption permitted. We adopted ASU 2021-08 effective April 1, 2022, on a prospective basis. The impact of adoption of this standard on our Financial Statements, including accounting policies, processes, and systems, was not material. No. 2020-04, Reference Rate Reform (Topic 848): Facilitation of the Effects of Reference Rate Reform on Financial Reporting, which isand subsequent amendment to the initial guidance: ASU 2021-01, Reference Rate Reform (Topic 848): Scope (collectively, “Topic 848”). Topic 848 provides optional guidance relatedexpedients and exceptions for applying GAAP to contracts, hedging relationships, and other transactions affected by reference rate reform that provides practical expedients for contract modifications andif certain criteria are met. The amendments apply only to contracts, hedging relationships, associated with the transition fromand other transactions that reference rates that areLondon Interbank Offered Rate (“LIBOR”) or another reference rate expected to be discontinued. This standard, along with its subsequent clarifications, is effectivediscontinued because of reference rate reform. In December 2022, the FASB issued ASU 2022-06, Reference Rate Reform (Topic 848): Deferral of the Sunset Date of Topic 848. ASU 2022-06 defers the sunset date of Topic 848 from March 12, 2020 through December 31, 2022 to December 31, 2024. This guidance may be applied prospectively to contract modifications made and is applicable to our A&R Senior Credit Facilities and Swap Agreements, which use LIBOR as a reference rate.hedging relationships entered into or evaluated on or before December 31, 2024. The A&R Senior Credit Facilities include a transition clause to a new reference rate in the event LIBOR is discontinued and Swap Agreements will be amended to match the new reference rate. We have evaluated the potential impact of adoptingthe adoption of this standard and do not expect it to have a material impact on our Financial Statements.financial statements and related disclosures, including accounting policies, processes, and systems, was not material. Refer to Note 17. Long-term12. Long-Term Debt and Credit AgreementNote 13. Derivative Financial Instruments to the Unaudited Consolidated Financial Statements for further details.discussion.RESIDEO TECHNOLOGIES, INC.NOTES TO CONSOLIDATED FINANCIAL STATEMENTSBTX Technologies, Inc.October 1, —On January 23, 2023, we acquired 100% of the outstanding equity of BTX Technologies, Inc., (“BTX”) a leading distributor of professional audio, video, data communications, and broadcast equipment. We report BTX’s results within the ADI Global Distribution segment. We have made a preliminary purchase price allocation that is subject to change as additional information is obtained.(In millions, unless otherwise noted)Teknique Limited(Unaudited)—On December 23, 2022, we acquired 100% of the outstanding equity of Teknique Limited, a developer and producer of edge-based, artificial intelligence-enabled video camera solutions. We report Teknique Limited’s results within the Products and Solutions segment. Purchase consideration included cash and a note payable with the former owner. We have made a preliminary purchase price allocation that is subject to change as additional information is obtained.3.4. Segment Financial Data&and Solutions and ADI Global Distribution.Financial Statements.financial statements. We evaluate a segment’s performance on a U.S. GAAP basis, primarily operating income before corporate expenses.primarily include unallocated share-based compensation expenses, unallocated pension expense, restructuring charges,relate to functions within the corporate office that support the operating segments such as acquisition-related costs, and other expenses related to executive, legal, finance, tax, treasury, human resources, information technology,IT, strategy, accounting, communications, andinnovation, business development, facilities management, corporate travel expenses. Additionalexpenses and other executive costs. Additionally, included within Corporate are unallocated amounts primarily include non-operating items such as pension expense, Reimbursement Agreement expense, interest income, interest expense, and other income (expense).Three Months Ended Nine Months Ended (in millions) September 30, 2023 October 1, 2022 September 30, 2023 October 1, 2022 Net revenue Products and Solutions $ 654 $ 707 $ 1,989 $ 2,090 ADI Global Distribution 900 911 2,716 2,720 Total net revenue $ 1,554 $ 1,618 $ 4,705 $ 4,810 Three Months Ended Nine Months Ended (in millions) September 30, 2023 October 1, 2022 September 30, 2023 October 1, 2022 Income from operations Products and Solutions $ 107 $ 124 $ 352 $ 431 ADI Global Distribution 60 78 211 244 Corporate (58) (47) (163) (162) Total income from operations $ 109 $ 155 $ 400 $ 513 10RESIDEO TECHNOLOGIES, INC.NOTES TO CONSOLIDATED FINANCIAL STATEMENTSOctober 1, 2022(In millions, unless otherwise noted)(Unaudited)4.5. Revenue RecognitionDisaggregated RevenueThe Company has&and Solutions and ADI Global Distribution. Disaggregated revenue information for Products &and Solutions is presented by product grouping, while ADI Global Distribution is presented by region. Beginning January 1, 2022,Products & Solutions operating segment further disaggregated the Comfort product grouping into Airnature, amount, timing, and Water,uncertainty of net revenue and Residential Thermal Solutions is now referenced as Energy. As of April 1, 2022, the First Alert business is included in the Security and Safety grouping.Revenuescash flows are affected by product grouping and region are as follows:economic factors:Three Months Ended Nine Months Ended (in millions) September 30, 2023 October 1, 2022 September 30, 2023 October 1, 2022 Products and Solutions Air $ 211 $ 245 $ 640 $ 721 Safety and Security 245 248 721 670 Energy 123 142 391 455 Water 75 72 237 244 Total Products and Solutions 654 707 1,989 2,090 ADI Global Distribution U.S. and Canada 780 792 2,354 2,335 120 111 362 360 — 8 — 25 Total ADI Global Distribution 900 911 2,716 2,720 Total net revenue $ 1,554 $ 1,618 $ 4,705 $ 4,810 We recognizemajoritythird quarter of 2023, we initiated additional restructuring programs (“2023 Plan”) in order to align our cost structure with market conditions. For the three and nine months ended September 30, 2023, we recognized restructuring and impairment expenses of $38 million and $42 million, respectively. These expenses primarily related to workforce reductions.revenue from performance obligations outlined2022 restructuring programs.contractsconnection with our customers that are satisfied at a point in time. Less than these plans.3%revenue is satisfied over time. restructuring expenses included within accrued liabilities on the Unaudited Consolidated Balance Sheets.Nine Months Ended Twelve Months Ended (in millions) September 30, 2023 December 31, 2022 Beginning of period $ 27 $ 9 Charges 36 26 (22) (5) Other — (3) End of period $ 41 $ 27 October 1, 2022a voluntary lump sum window offering and October 2, 2021,the purchase of a group annuity contract that transferred a portion of the assets and liabilities were not material.to an insurance company during the first quarter of 2023, we triggered settlement accounting and performed a remeasurement of our U.S. qualified defined benefit pension plan. As a result, we recognized non-cash pension settlement losses within other expense, net in the Unaudited Consolidated Statements of Operations of $3 million and $6 million for the three and nine months ended September 30, 2023, respectively. The loss for the three months ended September 30, 2023 is mainly related to an adjustment to our estimate of the losses from settlements that occurred during the first quarter of 2023. The corresponding remeasurement of our U.S. qualified defined benefit pension plan resulted in decreases of $80 million in plan assets and $75 million in liabilities for the nine months ended September 30, 2023.5.8. Stock-Based Compensation PlansRestrictedUnits (“RSUs”)Incentive Plans, which consists of the Amended and Performance Stock Unit (“PSUs”)During the three and nine months ended October 1, 2022, we recorded share-based compensation expense for all awards of $13million and $36 million, respectively. During the three and nine months ended October 2, 2021, we recorded share-based compensation expense for all awards of $10million and $29million, respectively.Employee awardsDuring the nine months ended October 1, 2022, as part of our annual long-term compensation under theRestated 2018 Stock Incentive Plan of Resideo Technologies, Inc. and its Affiliates as may be amended from time to time, we granted 669,551 market-based PSUs and1,711,282 service-based RSUs to eligible employees. The weighted average grant date fair value per share for market-based PSUs and service-based RSUs was $36.11 and $22.68, respectively. During the nine months ended October 2, 2021, we granted 497,645 market-based PSUs and 1,075,887 service-based RSUs to eligible employees. The weighted average grant date fair value per share for market-based PSUs and service-based RSUs was $42.98 and $27.26, respectively.11RESIDEO TECHNOLOGIES, INC.NOTES TO CONSOLIDATED FINANCIAL STATEMENTSOctober 1, 2022(In millions, unless otherwise noted)(Unaudited)Non-employee Director awardsDuring the nine months ended October 1, 2022, as part of our annual long-term compensation under the 2018 Stock Incentive Plan for Non-Employee Directors of Resideo Technologies, Inc., as may be amended from time to time, we granted 66,580 service-based RSUs to eligible non-employee directors. The weighted averageprovide for the grant date fair value per share for service-based RSUs was $of stock options, stock appreciation rights, restricted stock units, restricted stock, and other stock-based awards.23.62. nine months ended October 1, 2022, we did notsecond quarter of 2023, the Amended and Restated 2018 Stock Incentive Plan of Resideo Technologies, Inc. and its Affiliates was further amended to increase the number of shares of our common stock available for issuance by 3.5 million shares for an aggregate of 19.5 million shares with no more than 7.5 million shares being available for grant any PSUsin the form of stock options.eligible non-employee directors. During the nine months ended October 2, 2021, we granted Consolidated Financial StatementsNine Months Ended September 30, 2023 Nine Months Ended October 1, 2022 Number of Stock Units Granted Weighted average grant date fair value per share Number of Stock Units Granted Weighted average grant date fair value per share Performance Stock Units (“PSUs”) 553,071 $ 29.89 669,551 $ 36.11 Restricted Stock Units (“RSUs”) 2,232,465 $ 18.85 1,711,282 $ 22.68 39,891 service-based RSUs to eligible non-employee directors. The weighted average grant date fair value per share for service-based RSUs was $31.75.three- or four-yearthree-year service or performance period. RSU awards to our non-employee directors have a one-year service period. The fair value is determined at the date of grant.Note 6. LeasesWe are party to operating leases forgrant date. PSUs granted in 2023 were issued with the majorityshares awarded per unit being based on the difference in performance between the total stockholders’ return of our manufacturing sites, offices, engineering and lab sites, stocking locations, warehouses, automobiles, and certain equipment.Certain real estate leases include variable rental payments which adjust periodicallycommon stock against that of the S&P 600 Industrials Index. PSUs granted prior to 2023 were issued with the shares awarded per unit being based on inflation. Many leases contain options to renew and extend lease terms and options to terminate leases early. Reflectedthe difference in performance between the right-of-use asset and lease liability on the Consolidated Balance Sheets are the periods provided by renewal and extension optionstotal stockholders’ return of our common stock against that we are reasonably certain to exercise, as well as the periods provided by termination options that we are reasonably certain not to exercise. Generally, the lease agreements do not contain any material residual value guarantees or material restrictive covenants.The operating lease expense for the three and nine months ended October 1, 2022 and October 2, 2021 consisted of the following:S&P 400 Industrials Index.Total operating leaseincludes variable lease expensenet of $6tax was $11 million and $15$36 million for the three and nine months ended October 1, 2022,September 30, 2023, respectively. For the three and nine months ended October 2, 2021, total operating lease expense includes variable lease expenses of $5 million and $13 million, respectively.In addition to the monthly base rent, we are often charged separately for common area maintenance which is considered a non-lease component. These non-lease component payments are expensed as incurred and are not included in operating lease assets or liabilities.A short-term lease is a lease with a term of 12 months or less and does not include the option to purchase the underlying asset that we would expect to exercise. We have elected to adopt the short-term lease exemption in ASC 842 and, as such have not recognized a right-of-use asset or lease liability for these short-term leases which are immaterial for the three and nine months ended October 1, 2022 and October 2, 2021.12RESIDEO TECHNOLOGIES, INC.NOTES TO CONSOLIDATED FINANCIAL STATEMENTSOctober 1, 2022(In millions, unless otherwise noted)(Unaudited)We recognized the following related to our operating leases:
Statement
Line Item
2022
2021Future minimum lease payments under non-cancelable leases are as follows:
2022Supplemental cash flow information related to operating leases is as follows:Note 7. Other Expense, NetOther expense, net consists of the following:The settlement liability related to pre-Spin-Off litigation is included in the Other current liabilities of the Financial Statements as of October 1, 2022.Refer to Note 16. Commitments and Contingencies for further details on the Reimbursement Agreement.13RESIDEO TECHNOLOGIES, INC.NOTES TO CONSOLIDATED FINANCIAL STATEMENTSOctober 1, 2022(In millions, unless otherwise noted)(Unaudited)Note 8. Income TaxesFor interim periods, income tax is equal to the total of (1) year-to-date pretax income multiplied by the forecasted effective tax rate plus (2) tax expense items specific to the period. In situations where we expect to report losses where we do not expect to receive tax benefits, we apply separate forecast effective tax rates to those jurisdictions rather than including them in the consolidated forecast effective tax rate.(in millions) September 30, 2023 December 31, 2022 Raw materials $ 229 $ 251 Work in process 21 25 Finished products 720 699 Total inventories, net $ 970 $ 975 (in millions) Products and Solutions ADI Global Distribution Total Balance at December 31, 2022 $ 2,072 $ 652 $ 2,724 Acquisitions 10 3 13 (42) — (42) Impact of foreign currency translation (6) (2) (8) Balance at September 30, 2023 $ 2,034 $ 653 $ 2,687 taxcarrying amount of intangible assets:(in millions) September 30, 2023 December 31, 2022 Intangible assets subject to amortization $ 276 $ 295 Indefinite-lived intangible assets 180 180 Total intangible assets $ 456 $ 475 September 30, 2023 December 31, 2022 (in millions) Gross
Carrying
AmountAccumulated
AmortizationNet
Carrying
AmountGross
Carrying
AmountAccumulated
AmortizationNet
Carrying
AmountPatents and technology $ 57 $ (23) $ 34 $ 65 $ (28) $ 37 Customer relationships 311 (129) 182 313 (117) 196 Trademarks 8 (8) — 14 (8) 6 Software 187 (127) 60 175 (119) 56 Intangible assets subject to amortization $ 563 $ (287) $ 276 $ 567 $ (272) $ 295 $33$9 million and $104 million, respectively, and consists primarily of interim period tax expense based on year-to-date pretax income multiplied by our forecast effective tax rate. In addition to items specific to the period, the Company’s income tax rate is impacted by the mix of earnings across the jurisdictions in which we operate, non-deductible expenses, and U.S. taxation of foreign earnings. Tax expense was $29 million and $76$28 million for the three and nine months ended October 2, 2021,September 30, 2023, respectively.Note 9. Earnings Per ShareThe following table sets forth the computation of basic and diluted earnings per share (in millions, except shares in thousands, and per share data):Diluted earnings per share is computed based upon the weighted average number of common shares outstanding for the period plus the dilutive effect of common stock equivalents using the treasury stock method and the average market price of our common stock for the three and nine months ended October 1, 2022 and October 2, 2021.For the three and nine months ended October 1, 2022, average options and other rights to purchase approximately 0.8intangible assets amortization expense was $10 million and 0.4$25 million, sharesrespectively.Three Months Ended Nine Months Ended (in millions) September 30, 2023 October 1, 2022 September 30, 2023 October 1, 2022 Operating lease costs Cost of goods sold $ 5 $ 3 $ 15 $ 13 Selling, general and administrative expenses 14 13 43 38 Total operating lease costs $ 19 $ 16 $ 58 $ 51 common stock, respectively, were outstanding and anti-dilutive, and therefore excluded from the computation of diluted earnings per share. In addition, an average of 1.5$6 million and 0.8$18 million shares of performance-based unit awards are excluded fromfor the computation of diluted earnings per share forthree and nine months ended September 30, 2023, respectively. For the three and nine months ended October 1, 2022, respectively, as the contingency had not been satisfied. For the three and nine months ended October 2, 2021, average options and other rights to purchase approximately 0.2 million sharestotal operating lease costs include variable lease costs of common stock were outstanding and anti-dilutive, and therefore excluded from the computation of diluted income per common share. An average of approximately 0.8$6 million and $15 million, respectively.(in millions) Financial Statement Line Item September 30, 2023 December 31, 2022 Operating lease assets Other assets $ 197 $ 191 Operating lease liabilities - current Accrued liabilities $ 36 $ 37 Operating lease liabilities - non-current Other liabilities $ 174 $ 166 Nine Months Ended (in millions) September 30, 2023 October 1, 2022 Cash paid for operating lease liabilities $ 27 $ 25 Non-cash activities: operating lease assets obtained in exchange for new operating lease liabilities $ 37 $ 84 (in millions) September 30, 2023 December 31, 2022 4.000% Senior Notes due 2029 $ 300 $ 300 Variable rate A&R Term B Facility 1,123 1,131 Gross debt 1,423 1,431 Less: current portion of long-term debt (12) (12) Less: unamortized deferred financing costs (14) (15) Total long-term debt $ 1,397 $ 1,404 0.7-year senior secured Term B loan facility in an aggregate principal amount of $950 million, shareswhich was later amended to add $200 million in additional term loans (the “A&R Term B Facility”) and (ii) a five-year senior secured revolving credit facility in an aggregate principal amount of performance-based unit awards are excluded$500 million (the “A&R Revolving Credit Facility” and, together with the A&R Term B Facility, the “A&R Senior Credit Facilities”).computationA&R Senior Credit Facilities bears interest at a rate per annum of diluted earnings per shareTerm SOFR plus a credit spread adjustment of 10 basis points for the threeA&R Revolving Credit Facility and nine months ended October 2, 2021, respectively, asvarying credit spread adjustments for the contingency had not been satisfied.14RESIDEO TECHNOLOGIES, INC.NOTES TO CONSOLIDATED FINANCIAL STATEMENTSOctober 1, 2022(In millions, unless otherwise noted)(Unaudited)Note 10. Accounts Receivable, NetAccounts receivable, net consistsA&R Term B Facility, based on the tenor of each individual borrowing. No other material terms of the following:A&R Senior Credit Facilities were amended.11. Inventories, Net13. Derivative Financial InstrumentscomponentsSwap Agreements were entered into to reduce the consolidated interest rate risk associated with variable rate, long-term debt.Fair Value of Derivative Assets (in millions) Financial Statement Line Item September 30, 2023 December 31, 2022 Derivatives designated as hedging instruments Interest rate swaps Other current assets $ 23 $ 23 Interest rate swaps Other assets 18 22 Total derivative assets designated as hedging instruments $ 41 $ 45 Unrealized gain Accumulated other comprehensive loss $ 38 $ 42 Three Months Ended Nine Months Ended (in millions) September 30, 2023 October 1, 2022 September 30, 2023 October 1, 2022 Gains recorded in accumulated other comprehensive loss, beginning of period $ 40 $ 30 $ 42 $ 6 Current period (loss) gain recognized in/reclassified from other comprehensive income (2) 14 (4) 38 Gains recorded in accumulated other comprehensive loss, end of period $ 38 $ 44 $ 38 $ 44 12. Property, Plant,14. Fair ValueEquipment, NetProperty, plantwhen applicable, issued to finance our operations, is summarized below. Certain estimates and equipment,judgments were required to develop the fair value amounts. The fair value amounts shown below are not necessarily indicative of the amounts that we would realize upon disposition, nor do they indicate our intent or ability to dispose of the financial instrument. Assets and liabilities that are carried at cost, consistsfair value are required to be classified and disclosed in one of the following major asset classes:three categories:Depreciation expenseboth the three months ended October 1, 2022identical assets and October 2, 2021 was $liabilities15 million, respectively. Depreciation expense for both the nine months ended October 1, 2022October 2, 2021 was $44 million, respectively.Note 13. AcquisitionsOn July 5, 2022, we acquired 100% of the outstanding equity of Electronic Custom Distributors Inc., a regional distributor of residential audio, video, automation, security, wirenon-financial assets and telecommunication products and is included within the ADI Global Distribution operating segment. We have made a preliminary purchase price allocationliabilities are classified in their entirety based on informationthe lowest level of input that is significant to the fair value measurement. There were no changes in the methodologies used in our valuation practices as of October 1, 2022 that is subject to changeSeptember 30, 2023.additional information is obtained.On March 31, 2022, we acquired 100% of the issued and outstanding capital stock of First Alert, a leading provider of home safety products for an aggregate cash purchase price of $613 million, net of cash acquired of $Level 2 million. First Alert expands and leverages our footprint measurements in the home with complementary smoke and carbon monoxide detection home safety products and fire suppression products. The business is included within the Products & Solutions operating segment.fair value hierarchy.presents the preliminary purchase price allocation, for First Alert, at estimated fair value asprovides a summary of October 1, 2022:15RESIDEO TECHNOLOGIES, INC.NOTES TO CONSOLIDATED FINANCIAL STATEMENTSOctober 1, 2022(In millions, unless otherwise noted)(Unaudited)(1) The $86 million of preliminary goodwill was allocated to the Products & Solutions operating segment. Goodwill from this acquisition is partially deductible for tax purposes.On February 14, 2022, we acquired 100% of the outstanding equity of Arrow Wire and Cable Inc., a leading regional distributor of data communications, connectivity and security products. The business is included within the ADI Global Distribution operating segment and is expected to strengthen our global distribution portfolio in the data communications category with an assortment of copper and fiber cabling and connectivity, connectors, racking solutions, and network equipment.Note 14. Goodwill and Other Intangible Assets, NetThe changes in the carrying amount and fair value of goodwilloutstanding debt:September 30, 2023 December 31, 2022 (in millions) Carrying Value Fair Value Carrying Value Fair Value Debt 4.000% Senior Notes due 2029 $ 300 $ 246 $ 300 $ 242 Variable rate A&R Term B Facility 1,123 1,127 1,131 1,125 Total debt $ 1,423 $ 1,373 $ 1,431 $ 1,367 nine months ended October 1, 2022future may enter, into various interest rate protection agreements in order to limit the impact of movements in interest rates. The fair values of interest rate swaps have been determined based on market value equivalents at the balance sheet date, taking into account the current interest rate environment and therefore, were classified as follows:Level 2 measurements in the fair value hierarchy.presentsprovides a summary of the major componentscarrying amount and fair value of Other intangibleour interest rate swaps:September 30, 2023 December 31, 2022 (in millions) Carrying Value Fair Value Carrying Value Fair Value Assets: Interest rate swaps $ 41 $ 41 $ 45 $ 45 net asor liabilities for the periods presented. The carrying amounts of October 1, 2022cash and December 31, 2021. Other intangiblecash equivalents, accounts receivable, other current assets, that are fully amortized have been omitted.16RESIDEO TECHNOLOGIES, INC.NOTES TO CONSOLIDATED FINANCIAL STATEMENTSOctober 1, 2022(In millions, unless otherwise noted)(Unaudited)
Amortization
Carrying
Amount(1)Includes trademarks of $180 million that have been assigned an indefinite life.We use the straight-line methodTable of amortization and expectsContentsrecognize amortization expense over the next five fiscal years as follows:Consolidated Financial Statements(in millions) September 30, 2023 December 31, 2022 Obligations payable under Indemnification Agreements $ 140 $ 140 Compensation, benefit and other employee-related 100 108 Customer rebate reserve 92 98 Restructuring 41 27 Current operating lease liability 36 37 31 — Product warranties 24 40 Taxes payable 17 38 111 152 Total accrued liabilities $ 592 $ 640 accruedaccruals for advertising, legal and professional reserves, freight, accrued advertising, accrued legal reserves. accruedroyalties, interest, accrued restructuring, and other miscellaneous accruals.items.Refer toThe Indemnification Agreements are further described in Note 16. Commitments and Contingencies for further details on Obligations payable under Indemnification Agreements.to the Unaudited Consolidated Financial Statements.17RESIDEO TECHNOLOGIES, INC.NOTES TO CONSOLIDATED FINANCIAL STATEMENTSOctober 1, 2022(In millions, unless otherwise noted)(Unaudited)Costcost of goods sold for operating sites. For the three and nine months ended September 30, 2023 and October 1, 2022, and October 2, 2021, environmental expenses related to these operating sites were not material. Liabilities for environmental costs were $22$22 million for both October 1, 2022at September 30, 2023 and December 31, 2021.2022.indemnification and reimbursement agreement (the “Reimbursement Agreement”)Reimbursement Agreement and the tax matters agreement (the “TaxTax Matters Agreement”)Agreement (collectively, the “Indemnification Agreements”) are further described below.with Honeywell that obligates uspursuant to which we have an obligation to make cash payments to Honeywell in amounts equal to 90%90% of payments for certain Honeywell environmental-liability payments, which include amounts billed (“payments”)(payments), less 90%90% of Honeywell’s net insurance receipts relating to such liabilities, and less 90%90% of the net proceeds received by Honeywell in connection with (i) affirmative claims relating to such liabilities, (ii) contributions by other parties relating to such liabilities and (iii) certain property sales (the “recoveries”)recoveries). TheWhile the amount payable by us in respect of such liabilities arising in respect of any given year is subject to a cap of $$140 million140 million.under the Reimbursement Agreement, the estimated liability for resolution of pending and future environmental-related liabilities recorded on our balance sheets are calculated as if we were responsible for 100% of the environmental-liability payments associated with certain sites. Refer toNote 17.15. Commitments and Contingencies in the Company’s 2021our 2022 Annual Report on Form 10-K for further discussion.that obligates uspursuant to which we are responsible and will indemnify Honeywell for certain taxes, including certain income taxes, sales taxes, VAT and payroll taxes, relating to the business for all periods, including periods prior to the consummation of the Spin-Off. In addition, the Tax Matters Agreement addresses the allocation of liability for taxes that are incurred as a result of restructuring activities undertaken to effectuate the Spin-Off.IndemnificationReimbursement and Tax Matter Agreements’ liabilities:(in millions) Reimbursement Agreement Tax Matters Agreement Total Balance as of December 31, 2022 $ 614 $ 106 $ 720 128 (4) 124 Payments to Honeywell (105) — (105) Balance as of September 30, 2023 $ 637 $ 102 $ 739 estimable,estimable; however, it is possible we could pay $140$140 million per year (exclusive of any late payment fees up to 5%5% per annum) until the earlier of (1) December 31, 2043; or (2) December 31 of the third consecutive year during which the annual reimbursement obligation (including in respect of deferred payment amounts) has been less than $25$25 million.IndemnificationReimbursement and Tax Matters Agreements are included in the following balance sheet accounts:(in millions) September 30, 2023 December 31, 2022 Accrued liabilities $ 140 $ 140 Obligations payable under Indemnification Agreements 599 580 Total indemnification liabilities $ 739 $ 720 18RESIDEO TECHNOLOGIES, INC.NOTES TO CONSOLIDATED FINANCIAL STATEMENTSOctober 1, 2022(In millions, unless otherwise noted)(Unaudited)$30$30 million and $116 million, respectively, and for the three and nine months ended October 2, 2021, net expenses related to the Reimbursement Agreement were $39 million and $111$116 million, respectively, and are recorded in Otherother expense, net.unaudited consolidated results of operations and operating cash flows in the periods recognized or paid.The Company isWe are subject to lawsuits, investigations and disputes arising out of the conduct of itsour business, including matters relating to commercial transactions, government contracts, product liability, prior acquisitions and divestitures, employee matters, intellectual property, and environmental, health, and safety matters. We recognize a liability for any contingency that is probable of occurrence and reasonably estimable. We continually assess the likelihood of adverse judgments or outcomes in these matters, as well as potential ranges of possible losses, (taking into consideration any insurance recoveries), based on a careful analysis of each matter with the assistance of outside legal counsel and, if applicable, other experts. No such matters are material to the Company’s Financial Statements.our financial statements. Refer to of the Company were defendants in a consolidated derivative action, In re Resideo Technologies, Inc. Derivative Litigation (the “Consolidated Federal Derivative Action”) and, which was stayed pending entry of final judgementjudgment in the Securities Litigationrelated securities litigation and the Delaware Chancery Derivative Action.derivative action. An additional suit was filed in the Court of Chancery of the State of Delaware in 2021 and not consolidated with the Consolidated Federal Derivative Suits.Action. On October 4,November 17, 2022, we reached an agreement in principlethe parties executed a Confidential Term Sheet summarizing the agreed terms of a global settlement to resolve all of the pending lawsuits.lawsuits and derivative claims. Under the terms of the settlement, we have agreed to implement or codify certain corporate governance reforms and reimburse the plaintiffs’ attorneys’ fees of $1.6up to $1.6 million. On February 3, 2023, the parties executed a definitive stipulation of settlement. The proposedU.S. District Court for the District of Minnesota preliminarily approved the settlement, isand a fairness hearing was held on June 22, 2023. The final settlement remains subject to, among other things, the execution of definitive settlement documentation and court approval. The settlement liability is included in the Accruedother accrued liabilities in the Unaudited Consolidated Balance Sheets, and the expected insurance recovery of approximately $0.6$0.6 million is included in Accountsaccounts receivable, net.United StatesU.S. District Court for the District of New Jersey against Honeywell International Inc. and the Company. Plaintiff alleges, among other things, that the Company violated certain consumer protection laws by falsely advertising the Company’s combination-listed single data-bus burglar and fire alarms system control units (the “Products”) as conforming to Underwriters Laboratories, Inc. (the “UL”) or the National Fire Protection Association (“NFPA”) standards and/or failing to disclose such non-nonconformance.nonconformance. Plaintiff further alleges that the Company’s Products are defective because they do not conform to the UL and NFPA industry standards. Plaintiff does not allege that he, or anyone else, has experienced any adverse event due to the alleged product defect or that the Products did not work. Plaintiff alleges causes of action for violation of the New Jersey Consumer Fraud Act, fraud, negligent misrepresentation, breach of express and implied warranties, violation of the Magnuson-Moss Warranty Act, unjust enrichment, and violation of the Truth-in-Consumer Contract, Warranty, and Notice Act.19RESIDEO TECHNOLOGIES, INC.NOTES TO CONSOLIDATED FINANCIAL STATEMENTSOctober 1, 2022(In millions, unless otherwise noted)(Unaudited)United StatesU.S. who purchased the Products. Plaintiff, on behalf of himself and the putative class, seeks damages in an unknown amount, which he describes as the cost to repair and/or replace the Products and/or the diminution in value of the ProductsProducts..Lawsuit.Lawsuit and our motion to dismiss Plaintiff's complaint was fully briefed on March 3, 2023. We intendcontinue to defend the matter vigorously; however, there can be no assurance that we will be successful in such defense. In light of the early stage of the Badalamenti Lawsuit, we are unable to estimate the total costs to defend the matter or the potential liability to us in the event that we are not successful in our defense.Accruedaccrued and other liabilities.(in millions) September 30, 2023 December 31, 2022 Beginning balance $ 48 $ 23 Accruals for warranties/guarantees issued during the year 19 30 Adjustment of pre-existing warranties/guarantees (2) (2) Settlement of warranty/guarantee claims (32) (17) Reserve of acquired company at date of acquisition — 14 Ending balance $ 33 $ 48 Long-term Debt and Credit AgreementIncome TaxesOur long-term debt as of October 1, 2022 and December 31, 2021as follows:As of October 1, 2022 and October 2, 2021, the weighted average interest rate for the Amendment and Restatement Agreement (“A&R”) Term B Facility (defined below) was 5.12% and 2.75%, respectively, and there were no borrowings and no letters of credit issued under the A&R Revolving Credit Facility (as defined below). As of October 1, 2022, we were in compliance with all covenants relatedequal to the A&R Credit Agreement and the Senior Notes due 2029 (as defined below).Senior Notes due 2029On August 26, 2021, we issued $300 million in principal amounttotal of 4.00% senior unsecured notes due in 2029 (the “Senior Notes due 2029”). The Senior Notes due 2029 are senior unsecured obligations guaranteed(1) year-to-date pretax income multiplied by the Company’s existingforecasted effective tax rate plus (2) tax expense items specific to the period. In situations where we expect to report losses and future domestic subsidiaries and rank equally with all senior unsecured debt and seniorwhere we do not expect to all subordinated debt.20RESIDEO TECHNOLOGIES, INC.NOTES TO CONSOLIDATED FINANCIAL STATEMENTSOctober 1, 2022(In millions, unless otherwise noted)(Unaudited)Credit AgreementOn February 12, 2021,receive tax benefits, we entered into an Amendment and Restatement Agreement with JP Morgan Chase Bank N.A. as administrative agent (the “A&R Credit Agreement”). This agreement effectively replaced the Company’s previous senior secured credit facilities.The A&R Credit Agreement provides for a (i) seven-year variable rate senior secured Term B loan facility in an initial aggregate principal amount of $950 million, which was further amended on March 28, 2022apply separate forecast effective tax rates to include an additional aggregate principal amount of $200 million in term loans (the “A&R Term B Facility”), (ii) a five-year senior secured revolving credit facility in an aggregate principal amount of $500 million (the “A&R Revolving Credit Facility” together with the A&R Term B Facility, the “A&R Senior Credit Facilities”).We entered into certain interest rate swap agreements in 2021 to effectively convert a portion of our variable rate debt to fixed rate debt. Refer to Note 18. - Derivatives Financial Instruments for further discussion.Refer to Note 18. Long-Term Debt and Credit Agreementthose jurisdictions rather than including them in the Company’s 2021 Annual Report on Form 10-K for further discussion regardingconsolidated forecast effective tax rate.Company’s long-term debtthree and credit agreement.Note 18. Derivative Financial InstrumentsWe use derivative financial instruments to manage interest rate risk. Our policy is not to use derivative instruments for trading or speculative purposes. We have written policies and procedures that place all financial instruments undernine months ended September 30, 2023, the direction of corporate treasury and restrict all derivative transactions to those intended for hedge accounting.All derivatives are recorded at fair value in the Consolidated Balance Sheets. Our derivatives are designated as cash flow hedges and the effective changes in fair values are recorded in Accumulated other comprehensive loss and are included in unrealized gains (losses) until the underlying hedged item is recognized in earnings.We use interest rate swap agreements to manage exposure to interest rate risks. We do not use interest rate swap agreements for speculative or trading purposes. The gain or loss on the interest rate swaps that qualify as derivatives is recorded in Accumulated other comprehensive loss and is subsequently recognized as Interestnet tax expense net in the Consolidated Statements of Operations when the hedged exposure affects earnings. If the related debt or the interest rate swap is terminated prior to maturity, the fair value of the interest rate swap recorded in Accumulated other comprehensive loss may be recognized in the Consolidated Statements of Operations based on an assessment of the agreements at the time of termination.On March 31, 2021, we entered into eight interest rate swap agreements (the “Swap Agreements”) with several financial institutions for a combined notional value of $560 million. The effect of the Swap Agreements is to convert a portion of the variable interest rate obligations based on three-month LIBOR with a minimum rate of 0.50% per annum to a base fixed weighted average rate of 0.9289% over terms ranging from two to four years remaining. The Swap Agreements are adjusted to fair value on a quarterly basis. The estimated fair value is based on Level 2 inputs primarily including the forward LIBOR curve available to swap dealers. Contract gains recognized in other comprehensive income (loss) totaled $14was $16 million and $38$84 million, respectively, and for the three and nine months ended October 1, 2022, respectively. Contract gains or losses recognizednet tax expense was $33 million and $104 million, respectively, and consists primarily of interim period tax expense based on year-to-date pretax income multiplied by our forecasted effective tax rate. In addition to items specific to the period, our income tax rate is impacted by the mix of earnings across the jurisdictions in which we operate, non-deductible expenses, and U.S. taxation of foreign earnings.Three Months Ended Nine Months Ended (in millions, except per share data) September 30, 2023 October 1, 2022 September 30, 2023 October 1, 2022 Numerator for basic and diluted earnings per share: Net income $ 21 $ 63 $ 128 $ 244 Denominator for basic and diluted earnings per share: Weighted average basic number of common shares outstanding 147 146 147 145 Plus: dilutive effect of common stock equivalents 1 3 2 4 Weighted average diluted number of common shares outstanding 148 149 149 149 Earnings per share: Basic $ 0.14 $ 0.43 $ 0.87 $ 1.68 Diluted $ 0.14 $ 0.42 $ 0.86 $ 1.64 comprehensiverights to purchase approximately 1.0 million and 1.5 million shares of common stock, respectively, were outstanding and anti-dilutive, and therefore excluded from the computation of diluted earnings per share. In addition, an average of 1.6 million and 1.1 million shares of PSU awards are excluded from the computation of diluted earnings per share for the three and nine months ended September 30, 2023, respectively, as the contingency had not been satisfied. For the three and nine months ended October 1, 2022, average options and other rights to purchase approximately 0.8 million and 0.4 million shares of common stock, respectively, were outstanding and anti-dilutive, and therefore excluded from the computation of diluted income (loss) were immaterialper share. In addition, an average of 1.5 million and 0.8 million shares of PSU awards are excluded from the computation of diluted earnings per share for the three and nine months ended October 2, 2021. Amounts reclassified1, 2022, respectively, as the contingency had not been satisfied.Accumulated other comprehensive loss into earnings were not material fortime-to-time through various methods, including in open market transactions, block trades, accelerated share repurchases, privately negotiated transactions, derivative transactions or otherwise, certain of which may be made pursuant to a trading plan meeting the requirements of Rule 10b5-1 under the Securities Exchange Act of 1934, as amended, in compliance with applicable state and federal securities laws. The Share Repurchase Program can be modified or terminated by our Board of Directors at any time.periods presented. The fairintrinsic value and market price of our common stock, general market and economic conditions, available liquidity, compliance with our debt and other agreements, applicable legal requirements, the Swap Agreements asnature of October 1, 2022 was $other investment opportunities available to us and other considerations.which $18 million was recognized in Other current assets and $28 million was recognized in Other assets. The fair value of the Swap Agreements as of October 2, 2021 was immaterial. Unrealized gains expected to be reclassified from Accumulated other comprehensive loss into earnings in the next 12 months are estimated to be $17 million as of October 1, 2022.Note 19. Fair Value21RESIDEO TECHNOLOGIES, INC.NOTES TO CONSOLIDATED FINANCIAL STATEMENTSOctober 1, 2022(In millions, unless otherwise noted)(Unaudited)Fair Value MeasurementsASC 820, Fair Value Measurements and Disclosures, requires us to use valuation techniques to measure fair value that maximize the use of observable inputs and minimize the use of unobservable inputs. These inputs are prioritized as follows:Level 1: Observable inputs such as quoted prices for identical assets or liabilities in active markets.Level 2: Other inputs that are observable directly or indirectly, such as quoted prices for similar assets or liabilities or market-corroborated inputs.Level 3: Unobservable inputs for which there is little or no market data and which require us to develop our own assumptions about how market participants would price the assets or liabilities.Fair Value of Financial InstrumentsThe carrying amounts of cash and cash equivalents, restricted cash, trade accounts receivable and accounts payable approximate fair value as of October 1, 2022 and December 31, 2021 because of their relatively short maturities. As of October 1, 2022, there were no borrowings and no letters of credit issuedauthorized repurchases remaining under the A&R Revolving Credit Facility. The fair values of the remaining financial instruments not currently recognizedShare Repurchase Program. Common stock repurchases are recorded at fair value on our Consolidated Balance Sheets at the respective period ends were:The fair value of the A&R Term B Facilitycost and the 4% Senior notes due 2029 was based on the quoted inactive prices and are therefore classifiedpresented as Level 2 within the valuation hierarchy.Fair Value MeasurementsThe following is a description of the valuation methodologies used for assets and liabilities measured at fair value. There have been no changes in the methodologies used as of October 1, 2022 and December 31, 2021.Credit and Market Risk—Wecontinually monitor the creditworthiness of our customers to which we grant credit terms in the normal course of business. The terms and conditions of credit sales are designed to mitigate or eliminate concentrations of credit risk with any single customer.Foreign Currency Risk Management—We conduct business on a multinational basis in a wide variety of foreign currencies. We are exposed to market risksdeduction from changes in currency exchange rates. These exposures may impact future earnings and/or operating cash flows. The exposure to market risk for changes in foreign currency exchange rates arises from transactions arising from international trade, foreign currency denominated monetary assets and liabilities, and international financing activities between subsidiaries. We rely primarily on natural offsets to address the exposures and may supplement this approach from time to time by entering into forward and option hedging contracts. As of October 1, 2022 and December 31, 2021, we had no forward or option hedging contracts.Interest rate swaps—Interest rate swaps are based on cash flow hedge contracts that have fixed rate structures and are measured against market-based LIBOR yield curves. These interest rate swaps are classified within Level 2 of the fair value hierarchy because they are valued using alternative pricing sources or models that utilized market observable inputs, including current and forward interest rates.22RESIDEO TECHNOLOGIES, INC.NOTES TO CONSOLIDATED FINANCIAL STATEMENTSOctober 1, 2022(In millions, unless otherwise noted)(Unaudited)The following tables summarize information regarding our financial assets and liabilities that are measured at fair value on a recurring basis as of October 1, 2022 and December 31, 2021, segregated by the level of the valuation inputs within the fair value hierarchy utilized to measure fair value:There were no Level 3 assets or liabilities for the periods presented.Note 20. Pension PlansWe sponsor multiple funded and unfunded U.S. and non-U.S. defined benefit pension plans. Pension benefits for many of our U.S. employees are provided through non-contributory, qualified and non-qualified defined benefit plans. We also sponsor defined benefit pension plans which cover non-U.S. employees who are not U.S. citizens, in certain jurisdictions, principally Germany, Austria, Belgium, France, India, Switzerland, and the Netherlands. Our pension obligations as of October 1, 2022 and December 31, 2021 were $101 million and $115 million, respectively, and are included in Other liabilities of the Financial Statements as of October 1, 2022.The following table summarizes the components of the periodic benefit cost, before tax for the periods indicated:The Company is not required to make contributions to the defined benefit plans in 2022.23OperationsOperations is intended to help you understand the results of operations and financial condition of Resideo Technologies, Inc. and its consolidated subsidiariesOperations” (“Resideo” or “the Company”, “we”, “us” or “our”MD&A”) for the three and nine months ended October 1, 2022 and should be read in conjunction with the unaudited Consolidated Financial Statements and the notes thereto contained elsewhere in this Form 10-Q. The financial information as of October 1, 2022 should be read in conjunction with the consolidated and combined financial statements for the year ended December 31, 2021 containedincluded in our 20212022 Annual Report on Form 10-K (the “2021 Annual Report on Form 10-K”).10-K.AsThis Quarterly Report includes industry and market data that we obtained from various third-party sources, including forecasts based upon such data; as with any projection or forecast, forward-looking statements are inherently susceptible to uncertainty and changes in circumstances. Our actual results may vary materially from those expressed or implied in our forward-looking statements. Accordingly, undue reliance should not be placed on any forward-looking statement made by us or on our behalf. Although we believe that the forward-looking statements contained in this Form 10-QQuarterly Report are based on reasonable assumptions, you should be aware that many factors could affect our actual financial results or results of operations and could cause actual results to differ materially from those in such forward-looking statements, including but not limited to:•industry cyclicality;successfully develop new technologiesidentify consumer preferences and products andindustry standards, develop and protect the intellectual property related thereto, and successfully market new technologies, products, and services to the same and to defend against IP threats of others;the impact of pandemics, epidemics, natural disasters and other public health emergencies, such as COVID-19;•failure to achieve and maintain a high level of product and service quality;•inability to compete in the market for potential acquisitions;•dependence upon information technology infrastructure having adequate cyber-security functionality;operations, including operations;effectsimpacts of aenhanced tariff, import/export restrictions, or other trade barriers on global economic slowdown or recession, geo-political instabilityconditions, financial markets and recent world events that have increased the risks posed by international trade disputes, tariffs and sanctions;failure to execute on key business transformation programsdependence upon IT infrastructure and activities;the failure to increase productivity through sustainable operational improvements;•the impact of inflation on employee expenses, shipping costs, raw material costs, energy and fuel costs and other production costs;•fluctuation in financial results due to the seasonal nature of portions of our business;•our ability to recruit and retain qualified personnel;•labor disputes, work stoppages, other disruptions, or the need to relocate any of our facilities;•changes in legislation or government regulations or policies;•the significant failure or inability to complyrisks associated with the specifications and manufacturing requirements of our original equipment manufacturers (“OEMs”) customers;•the operational constraints and financial distress of third parties;•our ability to borrow funds and access capital markets;24•the amount of our obligations and nature of our contractual restrictions pursuant to, and disputes that have or may hereafter arise under, the Reimbursement Agreement, and the other agreements we entered into with Honeywell in connection with the Spin-Off;•trademark;•liabilities;our inabilityregulations and societal actions to maintain intellectual property agreements necessaryrespond to our business;potential material costs as a resultfailure to comply with the broad range of warranty rights or claims, including product recalls,current and product liability actions that may be brought against us;matters;unforeseen U.S. federal income taxour ability to borrow funds and foreign tax liabilities; andcertain factors discussed elsewhere•currency exchange rate fluctuations; andForm 10-Q.25These and other factors are more fully discussedQuarterly Report, in Part I, Item 1A in our filings with the U.S. Securities and Exchange Commission, including the “Risk Factors” section in our 20212022 Annual Report on Form 10-K, and “Management’s Discussion and Analysis of Financial Condition and Results of Operations” section in this Form 10-Q. other filings we make with the SEC.20212022 Annual Report on Form 10-K. These risks could cause actual results to differ materially from those implied by forward-looking statements in this Form 10-Q.Quarterly Report. Even if our results of operations, financial condition and liquidity and the development of the industries in which we operate are consistent with the forward-looking statements contained in this Form 10-Q,Quarterly Report, those results or developments may not be indicative of results or developments in subsequent periods.Form 10-QQuarterly Report speak only as of the date on which they are made. We are under no obligation to and expressly disclaim any obligation to, update or alter our forward-looking statements, whether as a result of new information, subsequent events or otherwise.&and Solutions and ADI Global Distribution. The Products and Solutions operating segment, consistent with our industry, has a higher gross and operating profit profile in comparison to the ADI Global Distribution operating segment.&and Solutions operating segment offerings include temperature and humidity control, energy products and solutions, water and air solutions, smoke and carbon monoxide detection home safety products, security panels, sensors, peripherals, wire and cable, communications devices, video cameras, awarenessother home-related lifestyle convenience solutions, cloud infrastructure, installation and maintenance tools, and related software.thea leading wholesale distributor of low-voltage security products including access control, fire detection, intrusion,security, and video products and participates significantly in the broader related markets of audio, communications, data communications, networking, power, ProAV, smart home, and wire and cable. The Products & Solutions operating segment, consistent withOur ADI strategy is focused on growth in our industry, has a higher grossomni-channel presence, expansion into adjacent markets, and operating profit margin profile in comparisoncontinued enhancements to the ADI Global Distribution segment.In March 2022, we completed the acquisition of First Alert, Inc. (“First Alert”), a leading provider of home safety products. This acquisition was integrated into the Products & Solutions portfolioour value-add services to support our professional installers’ efficiency and expands our footprint in the home with complementary smoke and carbon monoxide detection home safety and fire suppression products.profitability.COVID-19 and Recent Macroeconomic Environmentthe COVID-19 pandemicand bank lending standards, supply chain dynamics, and the overall macroeconomic environment. Our visibility toward future performance is more limited than is typical due to the uncertainty surrounding the ultimate impact of COVID-19 and its variants and uncertainty surrounding the prevailing macroeconomic environment. For example, recent business conditions have been impacted byWhile we believe supply chain disruptions and global shortageslogistics will continue to normalize over the remainder of 2023, customer demand continues to moderate as inventories rebalance over the period and uncertainties remain including the potential for changes in key materialsinflation and components, which have impacted our ability to supply certain products. We have also experienced various inflationary impacts, such asinterest rates, increased labor costs, reduced consumer spending due to softening labor markets, elevated mortgage rates, materials price inflation, and increased freight and other costs, andthe resumption of student loan repayments, unfavorable foreign currency impacts from a stronger U.S. dollar. In response to these challenges, we have, amongDollar, and potential market and other measures, aggressively managed supplier relationships to mitigate some of these shortages, developed contingency plans for future supply, aligned our production schedules with demand in a proactive manner, and pursued further improvements indisruption from the productivity and effectiveness of our manufacturing, selling, and administrative activities.In February 2022, Russian military forces launched a military actionongoing conflicts in Ukraine and sustained conflict and disruption in the region is likely. Although the length, impact and outcome of the ongoing military action in Ukraine is highly unpredictable, this conflict could lead to significant market and other disruptions, including volatility in commodity prices and supply of energy resources, instability in financial markets, supply chain interruptions, political and social instability, changes in government agency budgets and funding preferences as well as increases in cyberattacks and cyber and corporate espionage. To date we have not experienced any material interruptions in our infrastructure, supplies, technology systems or networks needed to support our operations. We are actively monitoringIsrael.26the situation in Ukraine and assessing its impact on our business. Any of the above-mentioned factors could affect our business, financial condition and results of operations.Third Quarter HighlightsNet revenue increased $122 million, or 8%, overprior yearof 2023, we announced a restructuring program to align our cost structure with market conditions. For the three and nine months ended September 30, 2023, we recognized restructuring and impairment expenses of $38 million and $42 million, respectively. These expenses primarily related to workforce reductions.$135$1.62 billion in the third quarter of 2022revenue from acquisitions and $99the third quarter of 2023 as compared to $37 million in the third quarter of 2022($ in millions, except per share data) Q4 2023 2023 Net revenue $1,495 - $1,545 $6,200 - $6,250 Gross profit margin 26.0% - 27.0% 26.6% - 27.2% Income from operations $135 - $155 $535 - $555 GAAP Earnings per share $0.43 - $0.53 $1.30 - $1.41 Three Months Ended Nine Months Ended (in millions, except per share data and percentages) September 30, 2023 October 1, 2022 September 30, 2023 October 1, 2022 Net revenue $ 1,554 $ 1,618 $ 4,705 $ 4,810 Cost of goods sold 1,137 1,188 3,432 3,475 Gross profit 417 430 1,273 1,335 Gross profit % 26.8 % 26.6 % 27.1 % 27.8 % Operating expenses: Research and development expenses 28 29 84 81 Selling, general and administrative expenses 233 236 719 716 Intangible asset amortization 9 10 28 25 Restructuring and impairment expenses 38 — 42 — Total operating expenses 308 275 873 822 Income from operations 109 155 400 513 Other expenses, net 56 44 138 126 Interest expense, net 16 15 50 39 Income before taxes 37 96 212 348 Provision for income taxes 16 33 84 104 Net income $ 21 $ 63 $ 128 $ 244 Earnings per share: Basic $ 0.14 $ 0.43 $ 0.87 $ 1.68 Diluted $ 0.14 $ 0.42 $ 0.86 $ 1.64 our productsair and energy products.response to the current inflationary environment. Partially offsetting these increases were2022, driven primarily by lower organic sales volume of $61$358 million and unfavorable foreign currency fluctuations of approximately 300 bps or $51 million.$22 million, partially offset by $147 million in revenue from acquisitions and $128 million from higher selling prices.as a percent of net revenues was 27% forvariance from the three months ended October 1, 2022 a decrease of approximately 100to the three months ended September 30, 2023.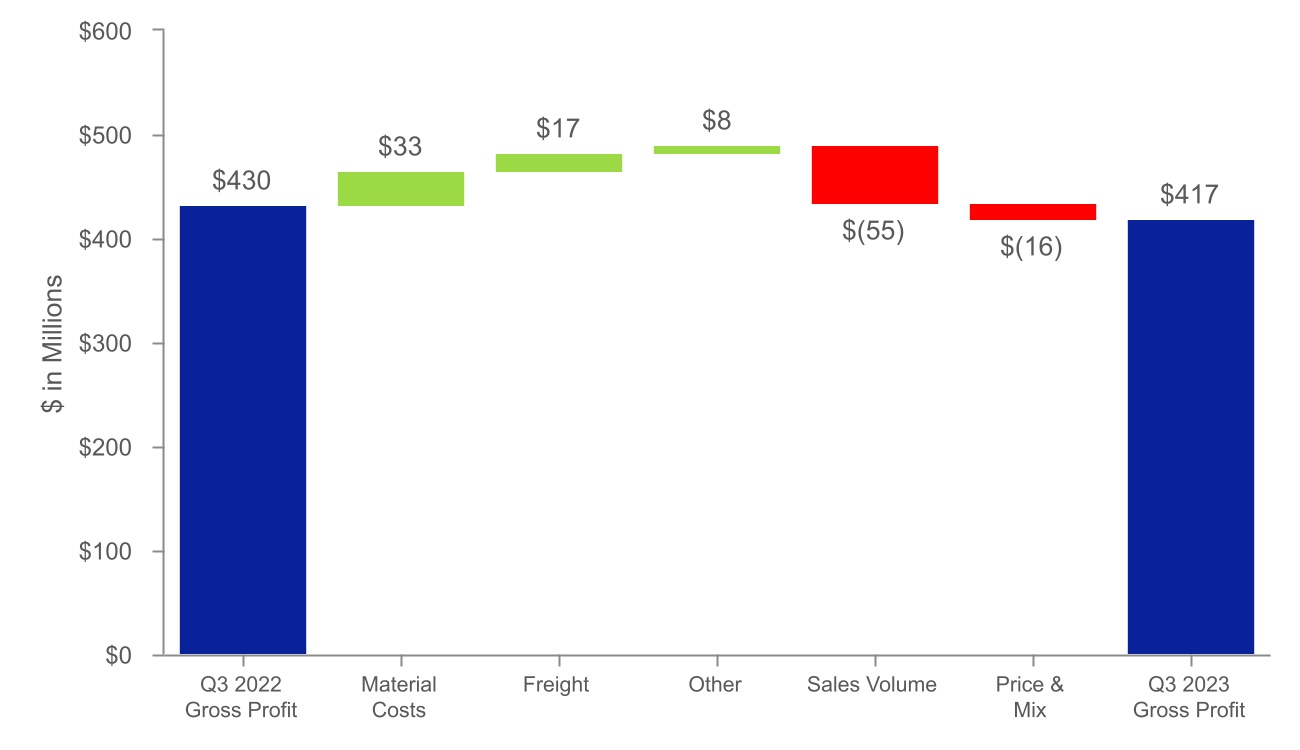
overto 26.8% compared to 26.6% in the same period lastin the prior year. The change in gross margin was driven by 340 bps of favorable material, freight and other manufacturing costs, partially offset by lower demand from customers as they continued to normalize inventory levels of 170 bps and unfavorable margin mix shift of 150 bps, as the inflationary environment has begun to stabilize.decrease include unfavorable impactsgross profit variance from higher coststhe nine months ended October 1, 2022 to the nine months ended September 30, 2023.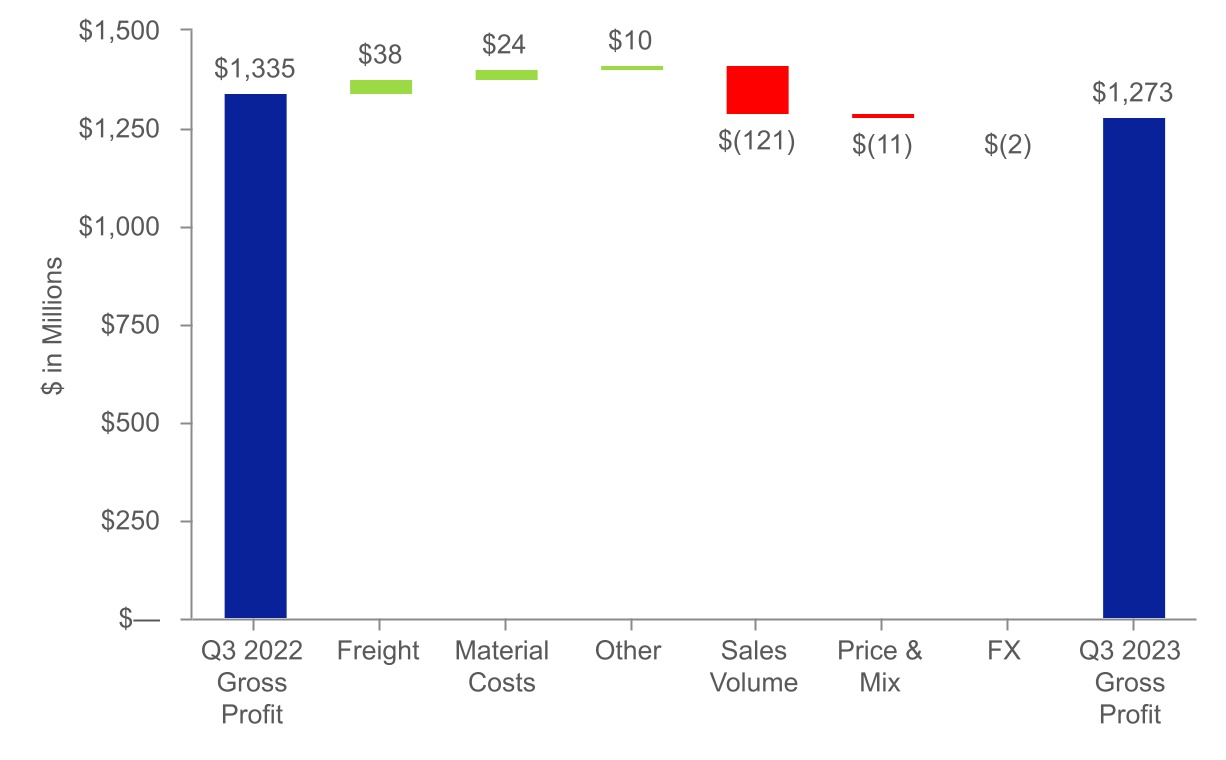
a resultcompared to the same period in 2022, and gross margin decreased 70 bps to 27.1% compared to 27.8% in the same period of the current inflationary environmentprior year. The decrease in gross margin was driven by lower demand from customers as they continue to normalize inventory levels of 130 bps and, unfavorable product mix shift of 100 bps as well as lower volume leverage primarily from the Products & Solutions operating segment of 100 bps. These impacts were partially offset by a150 bps of favorable pricematerial, freight and sales mixother costs as the inflationary environment has begun to stabilize and 10 bps of 100 bps.favorable foreign currency fluctuations.October 1, 2022September 30, 2023 were $29$28 million a slight decrease of $1 million, or 3.4%, as compared to the same period in 2022.$9$3 million, from $20 million foror 3.7%, as compared to the three months ended October 2, 2021.same period in 2022. The increase was primarily driven by acquisitionsadditional research and new product investments.development costs from the acquisition of First Alert, Inc. in first quarter of 2022.October 1, 2022September 30, 2023 were $236$233 million, an increasea decrease of $9$3 million, or 4% from $227 million for1.3%, as compared to the three months ended October 2, 2021.same period in 2022. The increasedecrease was primarily driven by increased costs associated with the First Alert acquisition of $19 million, investment in marketing and sales of $5 million, and labor inflation of $4 million,executed cost savings actions partially offset by lower impairment charges resulting from the relocation of our Austin, Texas corporate headquarters to a lower cost site in 2021 of $10 million, antax matters indemnification accrual release of $8 million and foreign currency impacts of $9 million.Net income for the three months ended October 1, 2022 was $63 million compared to net income of $68 million for the three months ended October 2, 2021, a 7% decrease and $0.04 decrease in earnings per share. The decrease is a result of the factors discussed above.Unrestricted cash on hand was approximately $252 million and liquidity was approximately $752 million as of October 1, 2022. Also, there were no borrowings under the $500 million the A&R Revolving Credit Facility.Results of OperationsWe report our segment information in the same way management internally organizes the business in assessing performance and making decisions regarding allocation of resources in accordance with ASC 280, Segment Reporting. We have determined that we have two reportable segments, organized and managed principally by the different services provided. While the segments often operate using shared infrastructure, each reportable segment is managed to address specific customer needs in these diverse market sectors. We report all other business activities in Corporate and unallocated costs. Corporate assets consist primarily of cash, investments, prepaid expenses, current and deferred taxes and property, plant and equipment. These items are not allocated to the operating segments. Corporate unallocated expenses primarily include share-based compensation expenses, restructuring charges, acquisition costs, gain on legal settlements, and other expenses related to executive, legal, finance, tax, treasury, human resources, information technology and strategy, and corporate travel expenses. Additional unallocated amounts primarily include non-operating items such as interest income, interest expense, and other income (expense).27Consolidated Statements of Operations(In millions, except shares in thousands and per share data)(Unaudited)
2022
2021
2022
2021Net Revenue
2022
2021
2022
2021Three months endedNet revenue increased $122 million, or 8%, over the third quarter prior year primarily due to $135 million in revenue from the acquisitions and $99 million in revenue from higher selling prices. Partially offsetting these increases were lower organic sales volume of $61 million and unfavorable foreign currency fluctuations of approximately 300 bps or $50 million.2022.Net revenue for the nine months ended October 1, 2022 was $4,810 million, an increase of $418 million, or 10%, from $4,392 million for the nine months ended October 2, 2021. The increase in net revenue was driven primarily by $288 million in revenue from the acquisitions, and higher selling prices of $305 million. Partially offsetting these increases were foreign currency fluctuations of approximately 300 bps or $115 million and lower sales volumes of $60 million.28Cost of Goods Sold and Gross ProfitThree months endedGross profit as a percentage of net sales was 27% for the three months ended October 1, 2022, compared to 28%, a 100 bps decrease over the same period last year. The drivers of the decrease include unfavorable impacts from higher costs as a result of the current inflationary environment of 100 bps, as well as lower volume leverage primarily from the Products & Solutions operating segment of 100 bps. These impacts were partially offset by favorable price and sales mix of 100 bps.Nine months endedGross profit as a percentage of net sales was 28% for the nine months ended October 1, 2022, compared to 27% for the nine months ended October 2, 2021. The primary items driving the increase in gross profit percentage were a 200 bps impact from price increases and favorable sales mix. This impact was partially offset by an unfavorable impact of 100 bps from increased material costs.Research and Development ExpensesThree months endedResearch and development expenses for the three months ended October 1, 2022 were $29 million, an increase of $9 million from $20 million for the three months ended October 2, 2021. The increase was driven by acquisitions of $3 million and new product investments of $2 million.Nine months endedResearch and development expenses for the nine months ended October 1, 2022 were $81 million, an increase of $18 million from $63 million for the nine months ended October 2, 2021. The increase was driven by the inclusion of acquisitions of $8 million and planned investment to support new product launches of $7 million.Selling, General and Administrative Expenses29Three months endedSelling, general and administrative expenses for the three months ended October 1, 2022 were $236 million, an increase of $9 million, or 4%, from $227 million for the three months ended October 2, 2021. The increase was primarily driven by increased costs associated with the First Alert acquisition of $19 million, investment in marketing and sales of $5 million, and labor inflation of $4 million partially offset by lower impairment charges resulting from the relocation of our Austin, Texas corporate headquarters to a lower cost site in 2021 of $10 million, an indemnification accrual release of $8 million, and foreign currency impacts of $9 million.Nine months endedOctober 1, 2022September 30, 2023 were $716$719 million, an increase of $38$3 million, from $678or 0.4%, as compared to the same period in 2022. The increase was primarily driven by $18 million in costs related to the inclusion of First Alert, Inc. and other acquisitions for the nine months ended September 30, 2023. This increase was partially offset by $10 million of transaction costs incurred in the first quarter of 2022.Three Months Ended (in millions) September 30, 2023 October 1, 2022 Products and Solutions $ 25 $ — ADI 10 — Corporate 3 — Restructuring and impairment expenses $ 38 $ — Nine Months Ended (in millions) September 30, 2023 October 1, 2022 Products and Solutions $ 27 $ — ADI 12 — Corporate 3 — Restructuring and impairment expenses $ 42 $ — October 2, 2021. The increase wasSeptember 30, 2023 as compared to the same period in 2022, due to the increased amortization costs primarily due to intangibles obtained through acquisition activities.costs1,096 bps for the three months ended September 30, 2023 compared to the same period in 2022, primarily due to non-deductible expenses associated with obligations payable under the Reimbursement Agreement being forecasted to be a larger portion of earnings.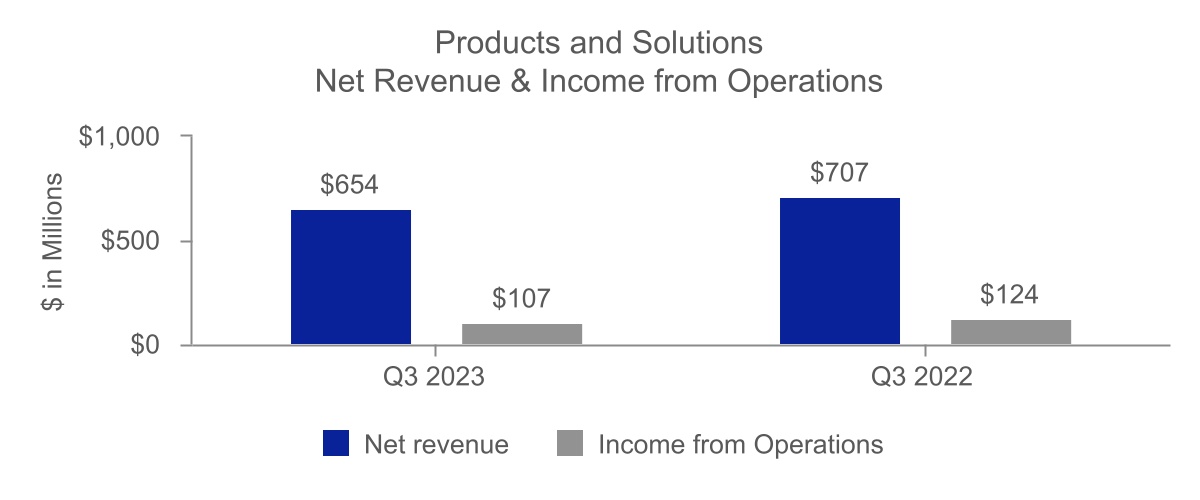
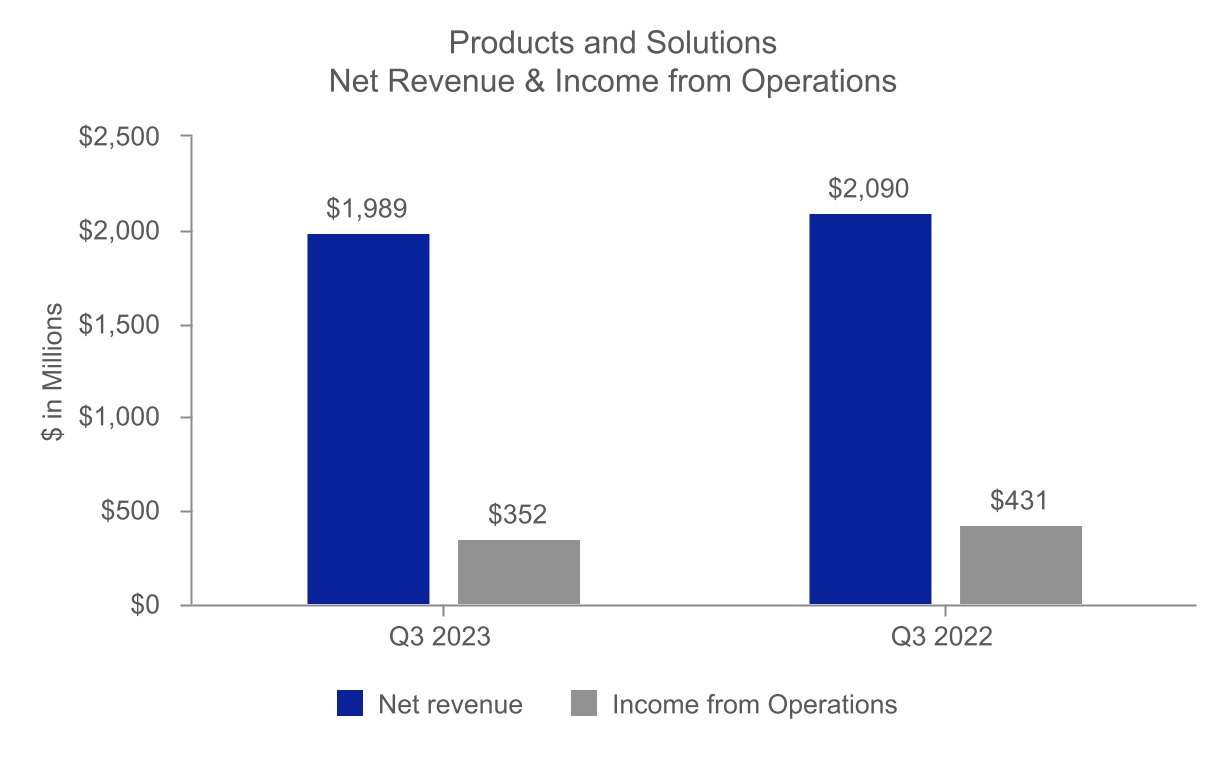
$35 million, investment in marketing and sales of $16 million, labor inflation of $13$99 million and transactionprice increases of $85 million. Income from operations decreased $79 million, or 18.3%, from the same period in 2022, primarily due to lower sales volume of $155 million, restructuring expense of $27 million, and unfavorable price/mix of $17 million from mix shifts to lower priced products. Partially offsetting the unfavorable impacts to income from operations were $74 million of lower manufacturing input costs, associated withprimarily material and freight, due to the inflationary environment stabilizing and $20 million from the First Alert, acquisitionInc. acquisition.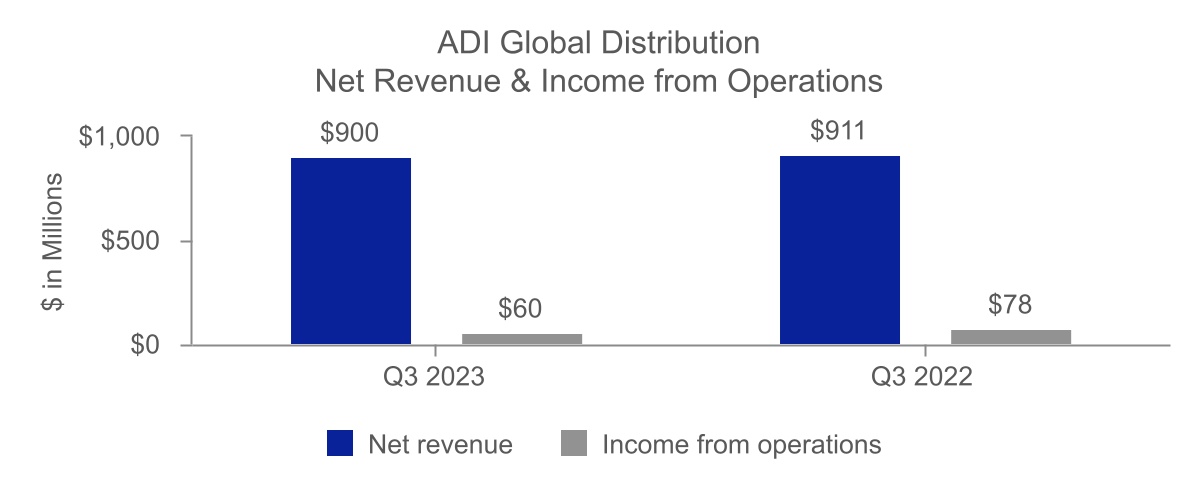
legalfreight and other selling, general and administrative costs of $4 million.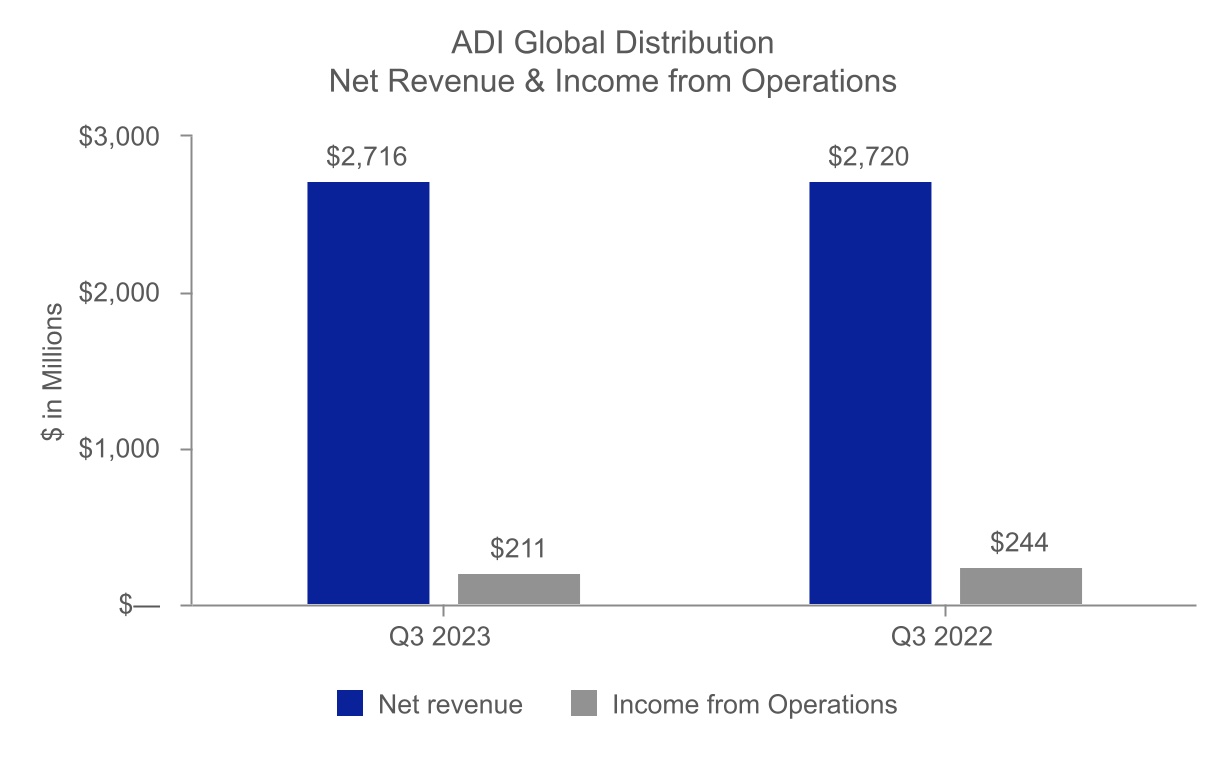
as a result of the previously disclosed 2021 securities class action litigation settlementslightly offset by price, net of insurance recoveriesmix and other favorable impacts of $16$15 million.lower impairment charges resulting froman $11 million increase compared to the relocation of our Austin, Texas corporate headquarterssame period in 2022 primarily due to a lower cost site in 2021 of $10 million,the tax matters indemnification accrual release of $8 million in the third quarter of 2022 and foreign currency impacts.Other Expense, NetThree months endedOther expense, net forrestructuring costs of $3 million incurred during the three months ended October 1, 2022 was $44 million, a decrease of $14 million from $58 million for the three months ended October 2, 2021. The decrease was primarily driven by $18 million from 2021 debt extinguishment costs incurred as a result of the redemption of the remaining Senior Notes due 2026, $9 million in lower expenses related to the Honeywell Reimbursement Agreement, and partially offset by $13 million in legal expenses as a result of the pre-Spin-Off litigation matter settlement.quarter.Other expense, netOctober 1, 2022 was $125September 30, 2023 were $163 million, a decreasean increase of $5$1 million, or 0.6%, from $130 million for the nine months ended October 2, 2021. The decrease was primarily driven by $41 million from 2021 debt extinguishment costs incurred as a result of the Senior Notes due 2026 redemption and the execution of the A&R Credit Agreement, and partially offset by $13$162 million in legal expenses as a result of the pre-Spin-Off litigation matter settlement, $9 million reductionsame period in the 2021 accruals related2022, primarily due to the Tax Matters Agreement, $5 million in lower expenses related to the Honeywell Reimbursement Agreement,cost savings actions offsetting incremental selling, general and $9 million in other non-operating income.Tax Expense30Three months endedFor the three months ended October 1, 2022, the net tax expense of $33 million consists primarily of year-to-date pretax income multiplied by our forecast effective tax rate. In addition to items specific to the period, our income tax rate is impacted by the mix of earnings across the jurisdictions in which we operate, non-deductible expenses, and U.S. taxation of foreign earnings.Nine months endedFor the nine months ended October 1, 2022, the net tax expense of $104 million consists primarily of year-to-date pretax income multiplied by our forecast effective tax rate. In addition to items specific to the period, our income tax rate is impacted by the mix of earnings across the jurisdictions in which we operate, non-deductible expenses, and U.S. taxation of foreign earnings.Results of Operations - Operating SegmentsProducts & SolutionsOn March 31, 2022, we completedadministrative costs from the acquisition of First Alert, a leading provider of home safety products. This acquisition was integrated into the Products & Solutions portfolio and expands our footprint in the home with complementary smoke and carbon monoxide detection home safety products and fire suppression products.Inc.Three months endedNet revenue increased $76 million or 12%, mainly due to $112 million in acquisition revenue and price increases of $64 million, partially offset by foreign exchange fluctuations of $30 million and lower organic sales volumes of $70 million. Income from operations decreased from $157 million to $124 million, or 21%, primarily from lower sales volumes of $35 million, partially offset by price increases, net of inflationary cost increases of $7 million.Nine months endedNet revenue increased $255 million or 14%, mainly due to acquisition revenue of $225 million and price increases of $181 million, partially offset by foreign exchange fluctuations of $69 million and lower organic sales volumes of $82 million. Income from operations increased $15 million, or 4%. Income from operations was positively impacted by price increases and favorable sales mix, net of inflationary cost increases of $51 million, contributions from the First Alert acquisition of $11 million and other cost reductions. These impacts were partially offset by lower organic sales volumes of $39 million and new product investment of $7 million.ADI Global DistributionThree months ended31Net revenue increased $46 million, or 5% highlighted by strong growth in the U.S. and Canada driven by price increases of $36 million, and the impact of acquisitions of $23 million, partially offset by foreign exchange fluctuations of $22 million. Income from operations increased $5 million, or 7%. Income from operations was favorably impacted primarily by changes in sales mix, price increases, impact of acquisitions, and other expense productivity totaling $14 million. These positive impacts were partially offset by commercial investments and increased freight costs, as well as labor inflation totaling $9 million.Nine months endedNet revenue increased $163 million, or 6% driven by price increases of $125 million and the impact of acquisitions of $64 million, partially offset by foreign exchange fluctuations of $46 million. Income from operations increased $46 million, or 23%. Income from operations was favorably impacted by changes in sales mix, price increases, impact of acquisitions, and other expense productivity totaling $74 million. These positive impacts were partially offset by commercial investments, increased freight costs, as well as labor inflation totaling $28 million.CorporateThree months endedCorporate expenses for the three months ended October 1, 2022 decreased $16 million, or 25%. The decrease was due primarily to lower impairment charges resulting from the relocation of our Austin, Texas corporate headquarters to a lower cost site in 2021 of $10 million and indemnification accrual releases of $8 million.Nine months endedCorporate expenses for the nine months ended October 1, 2022 decreased $34 million, or 17%. The decrease was due primarily to the 2021 securities class action litigation settlement net of insurance recoveries of $16 million, lower impairment charges resulting from the relocation of our Austin, Texas corporate headquarters to a lower cost site in 2021 of $10 million, indemnification accrual releases of $8 million, lower consulting spend of $7 million, and other cost reductions. These positive impacts were partially offset by transaction costs associated with the First Alert acquisition of $10 million.financial capital markets and a committed global credit facility. The following is a summary of our liquidity position:•Net cash provided by operating activities was $13 million for the nine months ended October 1, 2022 compared to cash provided by operating activities of $203 million for the nine months ended October 2, 2021.•As of October 1, 2022, cash and cash equivalents were $252 million.•As of October 1, 2022, long-term debt was $1,407 million and current maturities of long-term debt were $12 million. There were no borrowings and no letters of credit issued under our $500 million revolving credit facility.A&R Revolving Credit Facility.32enter into acquisitionsfrom time to time take steps to reduce our debt or strategic arrangementsotherwise improve our financial position. These actions could include prepayments, open market debt repurchases, negotiated repurchases, other redemptions or retirements of outstanding debt, opportunistic refinancing of debt, raising additional capital or divesting certain non-core assets. The amount of prepayments or the amount of debt that may be refinanced, repurchased or otherwise retired, if any, will depend on market conditions, trading levels of our debt, our cash position, compliance with debt covenants and other considerations.future which also could require us to seek additional equity or debt financing.Reimbursement AgreementIn connection with the Spin-Off, wenext 12 months. We entered into certain interest rate swap agreements to effectively convert a portion of our variable-rate debt to fixed rate debt. During the Reimbursement Agreement, pursuantsecond quarter of 2023, we transitioned the reference rate under the A&R Senior Credit Facilities and the Swap Agreements from LIBOR to which we have an obligationSOFR.make cash payments to Honeywell in amounts equal to 90% of payments for certain Honeywell environmental-liability payments, which include amounts billed, less 90% of Honeywell’s net insurance receipts relating to such liabilities,Note 12. Long-Term Debt and less 90% of the net proceeds received by Honeywell in connection with (i) affirmative claims relating to such liabilities, (ii) contributions by other parties relating to such liabilities and (iii) certain property sales. The amount payable by us in respect of such liabilities arising in any given year is subject to a cap of $140 million.The amount paid during the nine months ended October 1, 2022 was $105 million.Note 13. Refer toDerivative Financial Instruments Note 16. Commitments and Contingencies of Notes to the Unaudited Consolidated Financial Statements for a description of this Form 10-Qour debt obligations and Note 17. Commitments the timing of future principal and Contingenciesinterest payments, including impacts from our Swap Agreements.NotesDirectors authorized a share repurchase program for the repurchase of up to Consolidated and Combined Financial Statements$150 million of our common stock over an unlimited time period. During the three months ended September 30, 2023, we repurchased 1.8 million shares of common stock in our 2021 Annual Report on Form 10-K for further discussion.the open market at a total cost of $30 million. As of September 30, 2023, we had $120 million of authorized repurchases remaining under the share repurchase program.nine months endedNine Months Ended September 30, 2023 and October 1, 2022 and October 2, 2021 and October 2, 2021, as reflected in the unauditedUnaudited Consolidated Financial Statements, of Cash Flows, are summarized as follows:Nine Months Ended (in millions) September 30, 2023 October 1, 2022 $ change Cash provided by (used for) operating activities: Operating activities $ 177 $ 13 $ 164 Investing activities (90) (707) 617 Financing activities (47) 182 (229) Effect of exchange rate changes on cash 1 (12) 13 Net increase (decrease) in cash, cash equivalents and restricted cash $ 41 $ (524) $ 565 decreasednet cash provided by $190operating activities increased $164 million primarily due to an increaseimprovements in accounts receivable, inventory, and other current assets of $291 million partially offset by a decrease in net income of $69 million, more than offset by non-cash operating activities totaling $28 million, an increase in cash used in operating activities for accounts receivable, inventory, and accrued liabilities totaling $204 million, and cash used in other assets and liabilities totaling $27$116 million.increased by $651for the nine months ended September 30, 2023 was $90 million, a decrease of $617 million compared to the nine months ended October 1, 2022, primarily due to $649a decrease in acquisitions of $644 million resulting from the First Alert, Inc acquisition occurring in the prior year.additional cash paid$182 million for acquisitions in the nine months ended October 1, 2022.Net The primary uses of cash provided by financing activitiesduring the third quarter of 2023 was $28 million of common stock repurchases under our share repurchase program, $10 million for employee incentive plans and $9 million of principal debt repayments. During the second quarter of 2022, we received $200 million of proceeds from the A&R Credit Agreement to support the First Alert, Inc. acquisition.October 1, 2022 increased by $154 million. The increaseSeptember 30, 2023, we paid Honeywell $105 million under the Reimbursement Agreement.For further discussion on the Reimbursement Agreement, refer to Note 16. Commitments and Contingencies to the Unaudited Consolidated Financial Statements.primarily due to $196deemed probable and reasonably estimable.of net proceeds from the March 2022 Amended A&R Credit Agreement, partially offset by principal debt payments totaling $9with $36 million and other financing activities totaling $5 million in 2022, as compared to $26 million of net proceeds resulting from the 2021 execution of the A&R Credit Agreement, debt issuance, modification costs, repayments of long-term debt, and cash provided by other financing activities totaling $2 million.payable within 12 months.33support the requirements of the business. We expectmaintain efficient production capacity, to implement important product and process redesigns and to expand capacity to meet increased demand. Productivity projects have freed up capacity in our manufacturing facilities and are expected to continue investing to expand and modernize our existing facilities and to create capacity for new product development.do so.Critical Accounting PoliciesOur financial statements are prepared in accordance with U.S. GAAP. The preparation of these financial statements requires management to make estimates and assumptions that affect the reported amounts of assets and liabilities at the date of the financial statements and the reported amounts of revenues and expenses during the periods presented. We review our critical accounting policies throughout the year. We have concluded that there have been no significant changes to our critical accounting policies or estimates, as described in our Annual Report on Form 10-K for the year ended December 31, 2021, during the nine months ended October 1, 2022.of Notes to the Unaudited Consolidated Financial Statements of this Form 10-Q for a discussion of environmental and other litigation matters.further discussion.of Notes to the Unaudited Consolidated Financial Statements of this Form 10-Q for a discussion of recent accounting pronouncements.further discussion.QualitativeQualitative Disclosures About Market RiskRisk.October 1, 2022, $1,134 million of our total debt, excluding unamortized deferred financing costs, carried variable interest rates. In March 2021, eight interest rate swap agreements were entered intoSeptember 30, 2023, the Swap Agreements, with various financial institutions for a combined notional amountvalue of $560 million, (the “Swap Agreements”).effectively convert a portion of our $1,123 million long-term variable rate A&R Term B Facility to fixed rate debt. In June 2023, we modified our A&R Term B Facility to implement a forward-looking rate based on SOFR. In conjunction, we amended the Swap Agreements to transition from a hedge of LIBOR-based cash flows to a hedge of SOFR-based cash flows. The Swap Agreements effectively convertedconvert a portion of the Company’sour variable interest rate obligations to a rate based on three-month LIBORTerm SOFR with a minimum rate of 0.50%0.39% per annum to a base fixed weighted average rate of 0.9289%1.13% over a termthe remaining terms.two to four years. September 30, 2023, an increase in interest rates by 100 bps would have an approximately $6 million impact on our annual interest expense.18. 13.Derivative Financial Instruments of Notesand Note 14. Fair Value to the Unaudited Consolidated Financial Statements of this Form 10-Q. The fair market values of our fixed-rate financial instruments and Swap Agreements are sensitive to changes in interest rates. As of October 1, 2022, an increase or decrease in the interest rate by 100 basis points would have an approximate $6 million impact on our annual interest expense.Statements.Euro,Mexican Peso, British Pound, Canadian Dollar, Mexican Peso,Indian Rupee, Euro, Polish Zloty, and Czech Koruna, and Indian Rupee.Korona. These exposures may impact total assets, liabilities, future earnings and/or operating cash flows. Our exposure to market risk for changes in foreign currency exchange rates arisesresults from transactions arising fromout of international trade, foreign currency denominated monetary assets and liabilities, and international financing activities between subsidiaries. We rely primarily on natural offsets to address our exposures and may supplement this approach from time to time by entering into forward and option hedging contracts. As of October 1, 2022 and December 31, 2021,September 30, 2023, we have no outstanding foreign currency hedging arrangements.34the Company’sour reports filed or submitted under the Securities Exchange Act of 1934, as amended (the “Exchange Act”), is recorded, processed, summarized and reported within the time periods specified in the rules and forms of the SEC and that such information is accumulated and communicated to management to allow timely decisions regarding required disclosures.the Company’sour disclosure controls and procedures (as such term is defined in Rules 13a-15(e) and 15d-15(e) underof the Exchange Act) as of the end of the period covered by this Quarterly Report on Form 10-Q.Report. Based upon such evaluation, our Chief Executive Officer and Chief Financial Officer have concluded that our disclosure controls and procedures are effective at a reasonable assurance level as of the end of the period covered by this Quarterly Report on Form 10-Q.Report.October 1, 2022September 30, 2023 that has materially affected, or is reasonably likely to materially affect, our internal control over financial reporting.35 — Other Matters of Notes to Unaudited Consolidated Financial Statements of this Form 10-QQuarterly Report for a discussion on legal proceedings.20212022 Annual Report on Form 10-K.36Period Average Price Paid per Share Excluding Commissions Total Number of Shares Purchased as Part of Publicly Announced Plans or Programs (thousands) Approximate Dollar Value of Shares that May Yet Be Purchased Under the Plans or Programs (millions) July 2, 2023 to July 29, 2023 — — — $ 150 July 30, 2023 to August 26, 2023 656 $ 16.12 656 $ 139 August 27, 2023 to September 30, 2023 1,184 $ 16.22 1,184 $ 120 Total 1,840 $ 16.18 1,840 Form 10-Q.Quarterly Report.
Number4.110.110.210.337Resideo Technologies, Inc. Resideo Technologies, Inc.2022
Executive Vice President and Chief Financial Officer
(on behalf of the Registrant and as the
Registrant’s Principal Financial Officer)2022
(Principal Accounting Officer)38