4. Intangible assets
On August 27, 2021, the Corporation completed its acquisition of all outstanding equity interests in Grace Therapeutics Inc, via a merger. Grace, based in New Jersey and organized under the laws of Delaware, was a rare and orphan disease specialty pharmaceutical company.
In connection with the share-for-share noncash transaction, Grace was merged with a new wholly owned subsidiary of Acasti and became a subsidiary of Acasti. As a result, Acasti acquired Grace’s entire therapeutic pipeline consisting of three unique clinical stage and multiple pre-clinical stage assets supported by an intellectual property portfolio consisting of various granted and pending patents in various jurisdictions worldwide. Under the terms of the acquisition, each issued and outstanding share of Grace common stock was automatically converted into the right to receive Acasti common shares equal to the equity exchange ratio set forth in the merger agreement.
Intangible assets of $69,810 relate to the value of IPR&D, related to Grace’s therapeutic pipeline, consisting of three unique clinical stage programs/assets supported by intellectual property, the value of which has been attributed as follows:3. Fair Value Measurements
| ||||
| ||||
|
| |||
|
| |||
|
| |||
|
| |||
The Corporation performed an impairment test asAssets and liabilities measured at August 27, 2022 for each of our IPR&D technologies as well as for goodwill. The Corporation has one reporting unit which we have determined to be the Company. The estimated fair values of identifiable intangible assets and the reporting unit were determined using the multi-period excess earnings method. As a result of this quantitative assessment, we did not identify an impairment loss.
The projected discounted cash flow models used to estimate the fair value on a recurring basis as of assets of our IPR&D reflect significant assumptions andSeptember 30, 2023 are level 3 unobservable data regarding the estimates a market participant would make in order to evaluate a drug development asset, including the following:
14
All IPR&D projects have risks and uncertainties associated with the timely and successful completion of the development and commercialization of product candidates, including our ability to confirm safety and efficacy based on data from clinical trials, our ability to obtain necessary regulatory approvals and our ability to successfully complete these tasks within budgeted costs. It is not permitted to market a human therapeutic without obtaining regulatory approvals, and such approvals require the completion of clinical trials that demonstrate that a product candidate is safe and effective. In addition, the availability and extent of coverage and reimbursement from third-party payers, including government healthcare programs and private insurance plans as well as competitive product launches, affect the revenues a product can generate. Consequently, the eventual realized values, if any, of acquired IPR&D projects may vary from their estimated fair values. The Corporation reviews individual IPR&D projects for impairment annually on the anniversary of acquisition, whenever events or changes in circumstances indicate that the carrying amounts may not be recoverable and upon establishment of technological feasibility or regulatory approval.
5. Short-term investments
The Corporation holds various marketable securities, with maturities greater than 3 months at the time of purchase, as follows:
|
| September 30, |
|
| March 31, |
| ||
|
| $ |
|
| $ |
| ||
Term deposits issued in US currency earning interest at 0.20% and maturing on April 1, 2022 |
|
| — |
|
|
| 11,893 |
|
Term deposits issued in CAD currency earning interest at ranges between 0.50% and 0.58% and maturing on various dates from April 1, 2022 to March 30, 2023 |
|
| 14 |
|
|
| 1,429 |
|
Total short-term investments |
|
| 14 |
|
|
| 13,322 |
|
6. Assets held for sale
During the period, the Corporation determined to actively market for sale Other assets and Production equipment and has met the criteria for classification of assets held for sale:
|
| September 30, |
|
| March 31, |
| ||
|
|
|
|
| Reclassed as explained below |
| ||
|
| $ |
|
| $ |
| ||
Other assets (a) |
|
| 195 |
|
|
| 195 |
|
Production equipment (b) |
|
| 157 |
|
|
| 157 |
|
|
|
| 352 |
|
|
| 352 |
|
a. Other assets
Other assets represent krill oil (“RKO”) held by the Corporation that was expected to be used in commercial inventory scale up related to the development and commercialization of the CaPre drug candidate. Given that the development of CaPre will no longer be pursued by Acasti, the Corporation is expected to sell this reserve. The other asset is being recorded at the fair value less cost to sell. Management’s estimate of the fair value of the RKO less cost to sell is based primarily on estimated market prices obtained from an appraiser specializing in the krill oil market. These projections are based on Level 3 inputs of the fair value hierarchy and reflect management’s best estimate of market participants’ pricing of the assets as well as the general condition of the asset.
b. Production equipment
September 30, 2022 |
| Cost, net of |
|
| Accumulated |
|
| Net book |
| |||
|
| $ |
|
| $ |
|
| $ |
| |||
Production equipment |
|
| 1,179 |
|
|
| (1,022 | ) |
|
| 157 |
|
|
|
| 1,179 |
|
|
| (1,022 | ) |
|
| 157 |
|
During the three months ended June 30, 2022, the Corporation reclassed the following assets from assets held for sale as they no longer met the criteria of such classification.
|
| Cost, net of |
|
| Accumulated |
|
| Net |
| |||
|
| $ |
|
| $ |
|
| $ |
| |||
Furniture and office equipment |
|
| 17 |
|
|
| (5 | ) |
|
| 12 |
|
Computer equipment |
|
| 94 |
|
|
| (6 | ) |
|
| 88 |
|
Laboratory equipment |
|
| 585 |
|
|
| (435 | ) |
|
| 150 |
|
|
|
| 696 |
|
|
| (446 | ) |
|
| 250 |
|
Furthermore, depreciation expense of $167 was recognized related to the period from the date that the assets were classified as held for sale until the quarter ended June 30, 2022. The reclassification from held for sale to equipment was reflected on the comparative balance sheet.
1510
7. Capital and other components of equity
| Total |
| Quoted prices in active markets (Level 1) |
| Significant other observable inputs (Level 2) |
| Significant unobservable inputs (Level 3) |
| |
| $ |
| $ |
| $ |
| $ |
| |
Assets |
|
|
|
|
|
|
|
|
|
Guaranteed investment certificates and term deposits classified as cash equivalents |
| 16,395 |
| 16,395 |
| — |
| — |
|
Total assets |
| 16,395 |
| 16,395 |
| — |
| — |
|
Liabilities |
|
|
|
|
|
|
|
|
|
Derivative warrant liabilities |
| 3,457 |
| — |
| — |
| 3,457 |
|
Total liabilities |
| 3,457 |
| — |
| — |
| 3,457 |
|
On February 14, 2019, the Corporation entered into an ATM sales agreement with B. Riley FBR, Inc. (“B. Riley”) pursuant to which common shares may be sold from time to time for aggregate gross proceeds of up to $30 million, with sales only being made on the NASDAQ Stock Market. The common shares would be issued at market prices prevailing at the time of the sale and, as a result, prices may vary between purchasers and during the period of distribution. The ATM program has a 3-year term and requires the Corporation to pay between 3% and 4% commission to B. Riley based on volume of sales made.
On June 29, 2020, the Corporation entered into an amended and restated sales agreement (the “Sales Agreement”) with B. Riley, Oppenheimer & Co. Inc. and H.C. Wainwright & Co., LLC (collectively, the “Agents”) to amend the existing ATM program. Under the terms of the Sales Agreement, which has a three-year term, the Corporation may issue and sell from time-to-time common shares having an aggregate offering price of up to $There were 75,000,000no through the Agents. Subject to the terms and conditions of the Sales Agreement, the Agents will use their commercially reasonable efforts to sell the common shares from time to time, based upon the Corporation’s instructions. The Corporation has no obligation to sell any of the common shares and may at any time suspend sales under the Sales Agreement. The Corporation and the Agents may terminate the Sales Agreementchanges in accordance with its terms. Under the terms of the Sales Agreement, the Corporation has provided the Agents with customary indemnification rights and the Agents will be entitled to compensation at a commission rate equal to 3.0% of the gross proceeds from each sale of the common shares. The remaining balance of the costs incurred relating to the February 2019 ATM program for an amount of $115 were written off to financing expenses.
On November 10, 2021, the Corporation filed a prospectus supplement relating to its at-the-market program with B. Riley, Oppenheimer& Co. Inc. and H.C. Wainwright & Co., LLC acting as agents. Under the terms of the ATM Sales Agreement and the prospectus supplement, the Corporation may issue and sell from time-to-time common shares having an aggregate offering price of up to $75,000,000 through the agents. The common shares will be distributed at market prices prevailing at the time of the sale and, as a result, prices may varyvaluation techniques or transfers between purchasers andLevels 1, 2 or 3 during the period of distribution. The volume and timing of sales under the ATM program, if any, will be determined at the sole discretion of the Corporation’s board of directors and management. Costs incurred relating to prospectus supplement were $198 and are included in General and administrative expenses during the three and nine months ending December 31, 2021.
During the six months ended September 30, 2022 324,648 common shares were sold2023. The Corporation’s derivative warrant liabilities are measured at fair value on a recurring basis using unobservable inputs that are classified as Level 3 inputs. Refer to Note 8(b) for total net proceedsthe valuation techniques and assumptions used in estimating the fair value of approximately $304 with commissions, legal expenses and costs related to the share sale amounting to $10. The common shares were sold at the prevailing market prices, which resulted in an average price of approximately $0.95 per share. During the three and six months ended September 30, 2021, no common shares were sold under the ATM program.derivative warrant liabilities.
The outstanding warrants of the Corporation are composed of the following as at September 30, 2022, and March 31, 2022:4. Receivables
|
| September 30, 2022 |
|
| March 31, 2022 |
| ||||||||||
|
| Number |
|
| Amount |
|
| Number |
|
| Amount |
| ||||
|
|
|
|
| $ |
|
|
|
|
| $ |
| ||||
Liability |
|
|
|
|
|
|
|
|
|
|
|
| ||||
May 2018 Canadian public offering warrants (i) |
|
| 824,218 |
|
|
| — |
|
|
| 824,218 |
|
|
| 10 |
|
December 2017 U.S. public offering warrants (ii) |
|
| 884,120 |
|
|
| — |
|
|
| 884,120 |
|
|
| — |
|
|
|
| 1,708,338 |
|
|
| — |
|
|
| 1,708,338 |
|
|
| 10 |
|
|
|
|
|
|
|
|
|
|
|
|
|
| ||||
Equity |
|
|
|
|
|
|
|
|
|
|
|
| ||||
December 2017 US public offering broker warrants (iii) |
|
| 32,390 |
|
|
| 161 |
|
|
| 32,390 |
|
|
| 161 |
|
|
|
| 32,390 |
|
|
| 161 |
|
|
| 32,390 |
|
|
| 161 |
|
(i) Warrants to acquire one common share at an exercise price of CAD $10.48, expiring on May 9, 2023.
(ii) Warrants to acquire one common share at an exercise price of $10.08, expiring on December 27, 2022.
(iii) Warrants to acquire one common share at an exercise price of $10.10, expiring on December 19, 2022.
| September 30, 2023 |
| March 31, | |
|
| $ |
| $ |
Sales tax receivables |
| 360 |
| 338 |
Government assistance |
| 356 |
| 412 |
Interest receivable |
| 94 |
| 52 |
Other receivables |
| 27 |
| - |
Total receivables |
| 837 |
| 802 |
8. Government assistance
Government assistance is comprised of a government grant from the Canadian federal government and research and development investment tax credits receivable from the Québec provincial government, which relate to qualifiablequantifiable research and development expenditures under the applicable tax laws. The amounts recorded as receivables are subject to a government tax audit and the final amounts received may differ from those recorded. For the six months ended September 30, 2022, and 2021, the Corporation recorded $81 and $129, respectively, as a reduction of research and development expenses in the Statement of Loss and Comprehensive Loss.
9. Net financial income5. Short-term investments
The Corporation holds various marketable securities, with maturities greater than 3 months at the time of purchase, as follows:
16
| September 30, 2023 |
|
| March 31, |
| |||
| $ |
|
| $ |
| |||
Term deposits issued in CAD currency earning interest at 3% and maturing on March 29, 2024 |
|
| 15 |
|
|
| 15 |
|
Total short-term investments |
|
| 15 |
|
|
| 15 |
|
6. Trade and other payables
| September 30, 2023 |
|
| March 31, 2023 |
| |||
|
| $ |
|
| $ |
| ||
Trade payables |
|
| 685 |
|
|
| 1,242 |
|
Accrued liabilities and other payables |
|
| 460 |
|
|
| 946 |
|
Employee salaries and benefits payable |
|
| 206 |
|
|
| 1,148 |
|
Total trade and other payables |
|
| 1,351 |
|
|
| 3,336 |
|
7. Leases
The Corporation has historically entered into lease arrangements for its research and development and quality control laboratory facility located in Sherbrooke, Québec. As of September 30, 2023, the Corporation had one operating lease with required future minimum payments.
11
On March 14, 2022, the Corporation renewed the lease agreement effective April 1, 2022, resulting in a commitment of $556 over a 24 months base lease term and 48 months additional lease renewal term. In April 2023, the Corporation elected not to renew the additional 48 months lease renewal term with the lease expected to terminate March 31, 2024. The Corporation accounted for the change in lease term as a lease modification under ASC 842. Due to the modification in lease term, the Corporation remeasured the lease liability and right-of-use asset associated with the lease. As of the effective date of modification, the Corporation recorded an adjustment to the right-of-use asset and lease liability in the amount of $369 based on the net present value of lease payments discounted using an estimated incremental borrowing rate of 4.3%.
The following table contains a summary of the lease costs recognized under ASC 842 and other information pertaining to the Corporation’s operating lease for the six-month period ended September 30, 2023:
Operating cash flows for operating lease |
| $ | 47 |
|
Weighted-average remaining lease term (in years) |
|
| 0.50 |
|
Weighted-average discount rate |
|
| 4.3 | % |
As the Corporation's lease does not provide an implicit rate, the Corporation utilized its incremental borrowing rate to discount lease payments, which reflects the fixed rate at which the Corporation could borrow on a collateralized basis the amount of the lease payments in the same currency, for a similar term, in a similar economic environment.
Future minimum lease payments under the Corporation’s operating lease as of September 30, 2023 were as follows:
| September 30, 2023 |
| ||
|
| $ |
| |
2024 |
|
| 47 |
|
2025 and thereafter |
|
| - |
|
Total lease payments |
|
| 47 |
|
Less: interest |
|
| (1 | ) |
Total lease liability |
|
| 46 |
|
On July 19, 2023, the Corporation entered into a new short term lease for its headquarters located at 2572 boul. Daniel-Johnson, 2nd Floor Laval, Québec, Canada H7T 2R3. On July 24, 2023, the Corporation terminated the lease for its office located at 3009 boul. de la Concorde East, Suite 102, Laval, Québec, Canada H7E 2B5.
8. Capital and other components of equity
a. Common Shares
|
| Three months ended |
|
| Six Months ended |
| ||||||||||
|
| September 30, |
|
| September 30, |
|
| September 30, |
|
| September 30, |
| ||||
|
| $ |
|
| $ |
|
| $ |
|
| $ |
| ||||
Foreign exchange gain (loss) |
|
| (12 | ) |
|
| 1,099 |
|
|
| (90 | ) |
|
| 344 |
|
Change in fair value of warrant liabilities |
|
| — |
|
|
| 3,435 |
|
|
| 10 |
|
|
| 4,080 |
|
Interest income and bank charges |
|
| — |
|
|
| 14 |
|
|
| — |
|
|
| 151 |
|
Other income |
|
| 36 |
|
|
| — |
|
|
| 67 |
|
|
| — |
|
Financial income (expenses) |
|
| 24 |
|
|
| 4,548 |
|
|
| (13 | ) |
|
| 4,575 |
|
|
|
|
|
|
|
|
|
|
|
|
|
| ||||
Authorized capital stock
Unlimited number of shares
12
Private Placement
On September 24, 2023, the Corporation entered into a securities purchase agreement (the “Purchase Agreement”) with certain institutional and accredited investors in connection with a private placement of the Corporation's securities (the “Offering”). Pursuant to the Purchase Agreement, the Corporation agreed to offer and sell in the Offering 1,951,371 Common Shares, at a purchase price of $1.848 per Common Share and pre-funded warrants (the “Pre-funded Warrants”) to purchase up to 2,106,853 Common Shares (the “Pre-funded Warrant Shares”) at a purchase price equal to the purchase price per Common Share less $0.0001. Each Pre-funded Warrant is exercisable for one Pre-funded Warrant Share at an exercise price of $0.0001 per Pre-funded Warrant Share, is immediately exercisable and will expire once exercised in full. Pursuant to the Purchase Agreement, the Corporation also issued to such institutional and accredited investors common warrants (the “Common Warrants” and, together with the Pre-funded Warrants, the “Warrants”) to purchase Common Shares, exercisable for an aggregate of 2,536,391 Common Shares (the “Common Warrant Shares” and, together with the Pre-Funded Warrant Shares, the “Warrant Shares”). Under the terms of the Purchase Agreement, for each Common Share and each Pre-funded Warrant issued in the Offering, an accompanying five-eighths (0.625) of a Common Warrant was issued to the purchaser thereof. Each whole Common Warrant is exercisable for one Common Warrant Share at an exercise price of $3.003 per Common Warrant Share, is immediately exercisable and will expire on the earlier of (i) the 60th day after the date of the acceptance by the U.S. Food and Drug Administration of a New Drug Application for the Corporation's product candidate GTX-104 or (ii) five years from the date of issuance. The Common Warrants were offered and sold at a purchase price of $0.125 per whole underlying Common Warrant Share, which purchase price was included in the offering price per Common Share and Pre-funded Warrant issued in the Offering.
The Offering closed on September 25, 2023 (the “Closing Date”). The net proceeds to the Corporation from the Offering was approximately $7,300, after deducting fees and expenses.
At-the-Market (“ATM”) Program
On June 29, 2020, the Corporation entered into an amended and restated sales agreement (the “Sales Agreement”) with B. Riley FBR, Inc. ("B.Riley"), Oppenheimer & Co. Inc. and H.C. Wainwright & Co., LLC (collectively, the “Agents”) to amend the Corporation’s existing ATM program. Under the terms of the Sales Agreement, which had a three-year term, the Corporation could issue and sell from time-to-time Common Shares having aggregate gross proceeds of up to $75,000 through the Agents. Subject to the terms and conditions of the Sales Agreement, the Agents would use their commercially reasonable efforts to sell the Common Shares from time to time, based upon the Corporation’s instructions. The Corporation had no obligation to sell any of the Common Shares and could, at any time, suspend sales under the Sales Agreement. The Corporation and the Agents could terminate the Sales Agreement in accordance with its terms. Under the terms of the Sales Agreement, the Corporation provided the Agents with customary indemnification rights and the Agents were entitled to compensation at a commission rate equal to 3.0% of the gross proceeds from each sale of the Common Shares. The Sales Agreement expired pursuant to its terms on June 29, 2023.
During the six months ended September 30, 2023, no Common Shares were sold under the ATM program. During the six months ended September 30, 2022, 54,108 Common Shares were sold for total net proceeds of approximately $304 with commissions, legal expenses and costs related to the share sale amounting to $10. The Common Shares were sold at the prevailing market prices, which resulted in an average price of approximately $5.70 per share.
b. Warrants
During the six-month period ended June 30, 2023, 137,370 of the May 2018 Canadian public offering warrants to acquire one common share at an exercise price of CAD $62.88 expired on May 9, 2023.
As further discussed above, on September 25, 2023, the Corporation issued an aggregate of 4,643,244 Warrants exercisable for 4,643,244 Warrant Shares in the Offering pursuant to the terms of the Purchase Agreement entered into with certain institutional and accredited investors. Pursuant to the terms of the Purchase Agreement, the Corporation sold Pre-funded Warrants to purchase up to 2,106,853 Pre-funded Warrant Shares. Each Pre-funded Warrant is exercisable for one Pre-funded Warrant Share at an exercise price of $0.0001 per Pre-funded Warrant Share, is immediately exercisable and will expire once exercised in full. Pursuant to the Purchase Agreement, the Corporation also issued to such institutional and accredited investors Common Warrants to purchase an aggregate of 2,536,391 Common Warrant Shares. Each whole Common Warrant is exercisable for one Common Warrant Share at an exercise price of $3.003 per Common Warrant Share, is immediately exercisable and will expire on the earlier of (i) the 60th day after the date of the acceptance by the U.S. Food and Drug Administration of a New Drug Application for the Corporation's product candidate GTX-104 or (ii) five years from the date of issuance.
The Common Warrants issued as a part of the Offering are derivative warrant liabilities given the warrant indenture did not meet the fixed-for-fixed criterion and that the Common Warrants are not indexed to the Corporation’s own stock. Proceeds were allocated amongst Common Shares, Pre-funded Warrants and Common Warrants by applying the residual method, with fair value of the Common Warrants determined using the Black-Scholes model, resulting in an initial warrant liability of $1,631 and $45 of issuance costs allocated to Common Warrants. Accordingly, $2,822 and $3,047 of gross proceeds were allocated to Common Shares and Pre-funded Warrants, respectively;
13
and $78 and $84 of issuance costs were allocated to Common Shares and Pre-funded Warrants, respectively. For the six months ended September 30, 2023, Common Warrants were revalued at fair value through profit and loss.
The derivative warrant liabilities are measured at fair value at each reporting period and the reconciliation of changes in fair value is presented in the following table:
Balance - March 31, 2023 | $- | |
Issued during the year | 1,631 | |
Change in fair value | 1,826 | |
Balance - September 30, 2023 | $3,457 |
The warrant liability was determined based on the fair value of warrants at the issue date and the reporting dates using the Black-Scholes model with the following weighted average assumptions will expire on the earlier of (i) the 60th day after the date of the acceptance by the U.S. Food and Drug Administration of a New Drug Application for the Corporation's product candidate GTX-104 or (ii) five years from the date on issuance.
|
|
|
|
|
| Issue Date |
| Reporting date | |
|
| September 25, 2023 |
| September 30, 2023 |
Risk-free interest rate |
| 5.00% |
| 4.94% |
Share price |
| $1.78 |
| $2.78 |
Expected warrant life |
| 2.54 |
| 2.53 |
Dividend yield |
| 0% |
| 0% |
Expected volatility |
| 80.90% |
| 84.36% |
The weighted average assumptions were prorated based on the probability of the warrant liability expiring on the 60th day after the date of the acceptance by the U.S. Food and Drug Administration of a New Drug Application for the Corporation's product candidate GTX-104 and of it expiring on five years from the date of issuance. The weighted average fair value of the Common Warrants were determined to be $0.64 and $1.36 per Common Warrant, as of September 25, 2023 and September 30, 2023, respectively. The risk-free interest rate at the issue date and on the reporting date of September 30, 2023 was based on the interest rate corresponding to the U.S. Treasury rate issue with a remaining term equal to the expected term of the warrants. The expected volatility was based on the historical volatility for the Company.
9 10.. Stock-based compensation:compensation
At September 30, 2022,2023, the Corporation hashad in place a stock option plan for directors, officers, employees, and consultants of the Corporation (“Stock Option Plan”). An amendment of the Stock Option Plan was approved by shareholders on September 28, 2022. The amendment provides for an increase to the existing limits for common shares reserved for issuance under the Stock Option Plan.
The Stock Option Plan continues to provideprovides for the granting of options to purchase common shares. TheUnder the terms of the Stock Option Plan, the exercise price of the stock options granted under this amended plan isthe Stock Option Plan may not be lower than the closing price of the Corporation’s common shares on the TSXVNasdaq Capital Market at the close of marketssuch market the day preceding the grant. The maximum number of common shares that may be issued upon exercise of options granted under the amended Stock Option Plan shall not exceed 20% of the aggregate number of issued and outstanding shares of the Corporation as of July 28, 2022. The terms and conditions for acquiring and exercising options are set by the Corporation’s Board of Directors, subject to, among others, to the following limitations: the term of the options cannot exceed ten years and (i) all options granted to a director will be vested evenly on a monthly basis over a period of at least twelve (12) months, and (ii) all options granted to an employee will be vested evenly on a quarterly basis over a period of at least thirty-six (36) months.
The total number of sharesoptions issued to any one consultant within any twelve-month period cannot exceed 2% of the Corporation’s total issued and outstanding common shares (on a non-diluted basis). The Corporation is not authorized to granttotal number of options issued within any twelve-month period such numberto all directors, employees and/or consultants of options under the Stock Option Plan that could resultCorporation (or any subsidiary of the Corporation) conducting investor relations services, cannot exceed in a number of common shares issuable pursuant to options granted to (a) related persons exceedingthe aggregate 2% of the Corporation’s issued and outstanding common shares (on a non-diluted basis) on, calculated at the date an option is granted or (b)to any one eligible person in a twelve-month period exceeding 2% of the Corporation’s issued and outstanding common shares (on a non-diluted basis) on the date an option is granted.such person.
The following table summarizes information about activities within the Stock Option Plan for the six monthsix-month period ended:ended September 30, 2023:
|
| September 30, 2022 |
|
| September 30, 2021 |
| ||||||||||
|
| Weighted average |
|
| Number of |
|
| Weighted average |
|
| Number of |
| ||||
|
| CAD $ |
|
|
|
|
| CAD $ |
|
|
|
| ||||
Outstanding at beginning of period |
|
| 3.94 |
|
|
| 2,989,381 |
|
|
| 8.33 |
|
|
| 911,871 |
|
Granted |
|
| 1.10 |
|
|
| 1,482,500 |
|
|
| — |
|
|
| — |
|
Exercised |
|
| - |
|
|
| — |
|
|
| — |
|
|
| — |
|
Forfeited |
|
| 7.66 |
|
|
| (22,263 | ) |
|
| 10.39 |
|
|
| (7,995 | ) |
Expired |
|
| 37.06 |
|
|
| (3,774 | ) |
|
| — |
|
|
| — |
|
Outstanding at end of period |
|
| 2.94 |
|
|
| 4,445,844 |
|
|
| 8.32 |
|
|
| 903,876 |
|
|
|
|
|
|
|
|
|
|
|
|
|
| ||||
Exercisable at end of period |
|
| 5.34 |
|
|
| 1,584,279 |
|
|
| 8.95 |
|
|
| 723,916 |
|
|
|
|
|
|
|
|
|
|
|
|
|
| ||||
14
| Number of |
|
| Weighted average |
|
| Weighted average |
| ||||
Outstanding, March 31, 2023 |
|
| 740,957 |
|
|
| 13.60 |
|
|
| 11.23 |
|
Granted |
|
| 446,502 |
|
|
| 2.64 |
|
|
| 2.27 |
|
Exercised |
|
| (12,500 | ) |
|
| 1.27 |
|
|
| 2.27 |
|
Forfeited/Cancelled |
|
| (613,594 | ) |
|
| 13.68 |
|
|
| 1.61 |
|
Outstanding, September 30, 2023 |
|
| 561,365 |
|
|
| 4.14 |
|
|
| 2.08 |
|
Exercisable, September 30, 2023 |
|
| 141,455 |
|
|
| 6.70 |
|
|
| 1.56 |
|
Forfeited and cancelled options were as a result of the Corporations restructuring that occurred during the six months ended September 30, 2023. On July 14, 2023, the Corporation's Board of Directors approved the grant of 446,502 stock options at an exercise price of $2.64 under the Corporation's Stock Option Plan.
The weighted average grant date fair value of awards for options granted during the six months ended September 30, 2023 was $2.27. The fair value of options granted was estimated using the Black-Scholes option pricing model, resulting in the following weighted average assumptions for the options granted:
|
| Three months ended |
|
| Six Months ended |
| ||||
|
| September 30, |
|
| September 30, |
| ||||
|
|
| $ |
|
|
| $ |
| ||
Exercise price |
| CAD $ |
| 0.80 |
|
| CAD $ |
| 1.10 |
|
Share price |
| CAD $ |
| 0.80 |
|
| CAD $ |
| 1.10 |
|
Weighted average grant-date fair value per award |
| CAD $ |
| 0.67 |
|
| CAD $ |
| 0.94 |
|
Volatility |
|
|
| 117.96 | % |
|
|
| 117.56 | % |
Risk-free interest rate |
|
|
| 3.20 | % |
|
|
| 3.28 | % |
Expected life |
|
|
| 5.27 |
|
|
|
| 5.73 |
|
Dividend |
|
|
| — |
|
|
|
| — |
|
|
|
|
|
|
|
|
|
| ||
September 30, 2023 | ||
Weighted average | ||
Exercise price | $2.64 | |
Share price | $2.64 | |
Dividend | 0% | |
Risk-free interest | 3.62% | |
Estimated life (years) | 5.78 | |
Expected volatility | 118.40% |
Stock-based compensation payment transactions
17
The fair value of stock-based compensation transactions is measured using the Black-Scholes option pricing model. Measurement inputs include share price on measurement date, exercise price of the instrument, expected volatility (based on weighted average historic volatility for a duration equal to the estimated weighted average life of the instruments, life based on the average of the vesting and contractual periods for employee awards as minimal prior exercises of options in which to establish historical exercise experience; and contractual life for broker warrants), and the risk-free interest rate (based on government bonds). Service and performance conditions attached to the transactions, if any, are not taken into account in determining fair value. The expected life of the stock options is not necessarily indicative of exercise patterns that may occur. The expected volatility reflects the assumption that the historical volatility over a period similar to the life of the options is indicative of future trends, which may also not necessarily be the actual outcome.
Compensation expense recognized under the Stock Optionstock option plan is summarized as follows:
| Three months ended |
|
| Six months ended |
| |||||||||||
|
| September 30, 2023 |
|
| September 30, 2022 |
|
| September 30, 2023 |
|
| September 30, 2022 |
| ||||
| $ |
|
| $ |
|
| $ |
|
| $ |
| |||||
Research and development expenses |
|
| 82 |
|
|
| 184 |
|
|
| 84 |
|
|
| 342 |
|
General and administrative expenses |
|
| 198 |
|
|
| 368 |
|
|
| 258 |
|
|
| 650 |
|
Sales and marketing expenses |
|
| - |
|
|
| 30 |
|
|
| 16 |
|
|
| 54 |
|
|
| 280 |
|
|
| 582 |
|
|
| 358 |
|
|
| 1,046 |
| |
As of September 30, 2023, there was $680 of total unrecognized compensation cost, related to non-vested stock options, which is expected to be recognized over a remaining weighted average vesting period of 1.48 years.
Corporation equity incentive plan
The Corporation established an equity incentive plan (the “Equity Incentive Plan”) for employees, directors, and consultants. The Equity Incentive Plan provides for the six monthsissuance of restricted share units (RSUs), performance share units, restricted shares, deferred share units and other stock-based awards, subject to restricted conditions as may be determined by the Board of Directors. There were no such awards outstanding as of September 30, 2023 and 2022, and no stock-based compensation was recognized for the period ended September 30, 2023 and 2022 and 2021 was as follows:under the Equity Incentive Plan.
|
| Three months ended |
|
| Six Months ended |
| ||||||||||
|
| September 30, |
|
| September 30, |
|
| September 30, |
|
| September 30, |
| ||||
|
| $ |
|
| $ |
|
| $ |
|
| $ |
| ||||
Research and development expenses |
|
| 184 |
|
|
| 38 |
|
|
| 342 |
|
|
| 88 |
|
General and administrative expenses |
|
| 368 |
|
|
| 76 |
|
|
| 650 |
|
|
| 179 |
|
Sales and marketing expenses |
|
| 30 |
|
|
| — |
|
|
| 54 |
|
|
| — |
|
|
|
| 582 |
|
|
| 114 |
|
|
| 1,046 |
|
|
| 267 |
|
|
|
|
|
|
|
|
|
|
|
|
|
| ||||
15
10. Loss per share
The Corporation has generated a net loss for all periods presented, therefore diluted loss per share is the same as basic loss per share since the inclusion of potentially dilutive securities would have had an anti-dilutive effect. All currently outstanding options and warrants could potentially be dilutive in the future.
The Corporation excluded the following potential common shares, presented based on amounts outstanding at each period end, from the computation of diluted net loss per share attributable to common shareholders for the periods indicated because including them would have had an anti-dilutive effect:
| September 30, 2023 |
| September 30, 2022 | |
Options outstanding |
| 561,365 |
| 740,974 |
September 2023 US private offering pre-funded warrants |
| 2,106,853 |
| — |
September 2023 US private offering warrants |
| 2,536,391 |
| — |
May 2018 public offering warrants |
| — |
| 137,370 |
December 2017 public offering warrants |
| — |
| 147,354 |
December 2017 public offering broker warrants |
| — |
| 5,399 |
11. Supplemental cash flow disclosure
(a) Changes in non-cash operating items
Changes in operating assets and liabilities
|
|
|
|
|
|
| ||
|
| Six Months ended |
| |||||
|
| September 30, |
|
| September 30, |
| ||
|
| $ |
|
| $ |
| ||
Receivables |
|
| (359 | ) |
|
| (287 | ) |
Prepaid expenses |
|
| (704 | ) |
|
| (1,838 | ) |
Trade and other payables |
|
| 926 |
|
|
| (1,010 | ) |
|
|
| (137 | ) |
|
| (3,135 | ) |
|
|
|
|
|
|
| ||
| Six Months ended |
| ||||||
| September 30, |
|
| September 30, |
| |||
| $ |
|
| $ |
| |||
Receivables |
|
| (35 | ) |
|
| (359 | ) |
Prepaid expenses |
|
| (446 | ) |
|
| (704 | ) |
Trade and other payables |
|
| (1,986 | ) |
|
| 926 |
|
Write-off of operating lease right of use asset |
|
| (23 | ) |
|
| — |
|
Total changes in operating assets and liabilities |
|
| (2,489 | ) |
|
| (137 | ) |
16
12. Financial instruments
a. Concentration of credit risk
Financial instruments that potentially subject the Corporation to a concentration of credit risk consist primarily of cash and cash equivalents and investments. Cash and cash equivalents and investments are all invested in accordance with the Corporation’s Investment Policy with the primary objective being the preservation of capital and the maintenance of liquidity, which risk is managed by dealing only with highly rated Canadian institutions. The carrying amount of financial assets, as disclosed in the consolidated balance sheets, represents the Corporation’s credit exposure at the reporting date.
b. Foreign currency risk
The Corporation is exposed to financial risk related to the fluctuation of foreign exchange rates and the degrees of volatility of those rates. Foreign currency risk is limited to the portion of the Corporation's business transactions denominated in currencies other than the Corporation's functional currency of the U.S. dollar. Fluctuations related to foreign exchange rates could cause unforeseen fluctuations in the Corporation's operating results. The Corporation does not use derivative instruments to hedge exposure to foreign exchange risk. The fluctuation of the Canadian dollar in relation to the U.S. dollar and other foreign currencies will consequently have an impact upon the Corporation’s net loss.
c. Liquidity risk
Liquidity risk is the risk that the Corporation will encounter difficulty in meeting the obligations associated with its financial liabilities that are settled by delivering cash or another financial asset. The Corporation manages liquidity risk through the management of its capital structure and financial leverage. It also manages liquidity risk by continuously monitoring actual and projected cash flows. The Board of Directors reviews and approves the Corporation's operating budgets, and reviews material transactions outside the normal course of business. The Corporation currently does not have long-term debt nor arranged committed sources of financing and is operating via use of existing cash and short-term investment balances. Refer to Note 1 – Nature of Operations.
The Corporation’s financial liabilities obligations include trade and other payables, which fall due within the next 12 months.
13. Commitments and contingencies
Research and development contracts and contract research organizations agreements
We utilizeThe Corporation utilizes contract manufacturing organizations ("CMOs") for the development and production of clinical materials and contract research organizations (“CROs”) to perform services related to ourits clinical trials. Pursuant to the agreements with these contract manufacturing organizationsCMOs and contract research organizations, we haveCROs, the Corporation has either the right to terminate the agreements without penalties or under certain penalty conditions. As of September 30, 2023, the Corporation has no commitments from CMOs and approximately $8,500 of commitments for the next twelve months to CROs.
SupplyRaw krill oil supply contract
On October 25, 2019, the Corporation signed a supply agreement with Aker Biomarine Antartic.BioMarine Antarctic AS. (“Aker”AKBM”) to purchase raw krill oil product for a committed volume of commercial starting material for CaPre, one of the Corporation’s former drug candidates, for a total fixed value of $3.13,100 million.based on the value of krill oil at that time. As at September 30,of March 31, 2022, the remaining balance of the commitment with Aker amountsamounted to $2.82,800 million.. During the second calendar quarter of 2022, AkerAKBM informed the Corporation that AkerAKBM believed it had satisfied the terms of the supply agreement as to their abilityobligation to deliver the remaining balance of raw krill oil product, and that the Corporation was therefore required to accept the remaining product commitment and to pay Aker the $2.8 million balance.commitment. The Corporation disagreesdisagreed with Aker’sAKBM’s position and believesbelieved that Aker isAKBM was not entitled to further payment under the supply agreement. Accordingly, no liability has been recorded.was recorded by the Corporation. The dispute wasremained unresolved as of September 30, 2022,both March 31, 2023 and remains unresolved. There is uncertainty as to whether2022. On October 18, 2023, the Corporation will be requiredentered into a settlement agreement with AKBM to make further paymentsettle any and all potential claims regarding amounts due under the supply agreement. Pursuant to Akerthe terms of the settlement agreement, in exchange for a release and waiver of claims arising out of the supply agreement by AKBM and any of AKBM’s affiliates, the Corporation and AKBM agreed to the following: (a) AKBM retained ownership of all raw krill oil product, including amounts previously delivered to the Corporation, (b) AKBM acquired and took ownership of all production equipment related to the production of CaPre, (c) AKBM acquired and took ownership of all data from research, clinical trials and pre-clinical studies with respect to CaPre, and (d) AKBM acquired and took ownership over all rights, title and interest in and to all intellectual property rights related to CaPre owned by the Corporation, including all patents and trademarks. Pursuant to the terms of the settlement agreement, AKBM acknowledged that the CaPre assets were transferred on an “as is” basis, and in connection therewith the Corporation disclaimed all representations and warranties in connection with the dispute. Additionally, inCaPre assets, including any representations with respect to performance or sufficiency. The value of the eventraw krill oil previously delivered to the Corporation, is requiredthe production equipment and the intellectual property rights related to accept delivery from Aker of the remaining balance of krill oil product under the supply agreement, there is uncertainty as to whether the Corporation can recover value from the product, which may resultCaPre were fully impaired in the Corporation incurring a loss on the supply agreement in the near term.prior
1817
reporting periods and had a carrying value of nil as of March 31, 2023. As of September 30, 2023, no liability was recorded by the Corporation.
Legal proceedings and disputes
In the ordinary course of business, the Corporation is at times subject to various legal proceedings and disputes. The Corporation assesses its liabilities and contingencies in connection with outstanding legal proceedings utilizing the latest information available. Where it is probable that the Corporation will incur a loss and the amount of the loss can be reasonably estimated, the Corporation records a liability in its consolidated financial statements. These legal contingencies may be adjusted to reflect any relevant developments. Where a loss is not probable or the amount of loss is not estimable, the Corporation does not accrue legal contingencies. While the outcome of legal proceedings is inherently uncertain, based on information currently available, management believes that it has established appropriate legal reserves. Any incremental liabilities arising from pending legal proceedings are not expected to have a material adverse effect on the Corporation’s financial position, results of operations, or cash flows. However, it is possible that the ultimate resolution of these matters, if unfavorable, may be material to the Corporation’s financial position, results of operations, or cash flows. No reserves or liabilities have been accrued as atof September 30, 2022.2023.
14. Restructuring Costs
19
On May 8, 2023, the Corporation communicated its decision to terminate a substantial amount of its workforce as part of a plan that intended to align the Corporation’s organizational and management cost structure to prioritize resources to GTX-104 and reduce losses to improve cash flow and extend available cash resources. The Corporation incurred $1,485 of costs primarily consisting of employee severance costs and legal fees.
18
Item 2. Management’s Discussion and Analysis of Financial Condition and Results of Operation
This management’s discussion and analysis (“MD&A”) is presented in order to provide the reader with an overview of the financial results and changes to our consolidated balance sheet as at September 30, 2022, and for the three and six month period then ended.2023. This MD&A also explains the material variations in our results of operations balance sheet and cash flows for the three and six months ended September 30, 2023 and 2022, consolidated balance sheets as of September 30, 2023 and 2021.March 31, 2023, and cash flows as for the six months ended September 30, 2023 and 2022.
Market data, and certain industry data and forecasts included in this MD&A were obtained from internal corporationCorporation surveys and market research and those conducted by third parties hired by us, publicly available information, reports of governmental agencies and industry publications, and independent third-party surveys. We have relied upon industry publications as our primary sources for third-party industry data and forecasts. Industry surveys, publications and forecasts generally state that the information they contain has been obtained from sources believed to be reliable, but that the accuracy and completeness of that information is not guaranteed. We have not independently verified any of the data from third-party sources or the underlying economic assumptions they have made. Similarly, internal surveys, industry forecasts and market research, which we believe to be reliable based upon our management’s or contracted third parties’ knowledge of our industry, have not been independently verified. Our estimates involve risks and uncertainties, including assumptions that may prove not to be accurate, and these estimates and certain industry data are subject to change based on various factors, including those discussed in this quarterly report and in our most recently filed annual reportAnnual Report on Form 10-K.10-K, filed with the Securities and Exchange Commission (the “SEC”) on June 23, 2023 (the “Annual Report”). This MD&A contains forward-looking information. You should review our Special Note Regarding Forward-Looking Statements presented at the beginning of this quarterly report.
This MD&A approved by the Board of Directors on November 14, 2022, should be read in conjunction with our unaudited condensed consolidated interim financial statements for the Threethree and Six Monthssix months ended September 30, 20222023 and 20212022 included elsewhere in this quarterly report. Our interim financial statements were prepared in accordance with U.S. GAAP.
All amounts appearing in this MD&A for the period-by-period discussions are in thousands of U.S. dollars, except share and per share amounts or unless otherwise indicated.
Business Overview
On August 27, 2021, we completed our acquisition of Grace via a merger following the approval of Acasti’s shareholders and Grace’s stockholders. Following completion of the merger, Grace became a wholly owned subsidiary of Acasti and was renamed Acasti Pharma U.S. Inc.
The successful completion of the merger positions Acasti as a premier, late-stage specialty pharmaceutical companyWe are focused on developing and commercializing products for rare and orphan diseases that have the potential to improve clinical outcomes by using the Company’sour novel drug delivery technologies. We seek to apply new proprietary formulations to approved and marketed pharmaceutical compounds to achieve enhanced efficacy, faster onset of action, reduced side effects, and more convenient drug delivery and increased patient compliance; all of which could result in improved patient outcomes. The active pharmaceutical ingredients used in the drug candidates under development by Acasti may be already approved in a target indication or could be repurposed for use in new indications.
The existing well understood efficacy and safety profiles of these marketed compounds provides the opportunity for us to utilize the Section 505(b)(2) regulatory pathway under the Federal Food, Drug and Cosmetic Act (the “FFDCA”) for the development of our reformulated versions of these drugs, and therefore may provide a potentially shorter path to regulatory approval. Under Section 505(b)(2), if sufficient support of a product’s safety and efficacy either through previous FDAU.S. Food and Drug Administration ("FDA") experience or sufficiently within the existing and accepted scientific literature, can be established, it may eliminate the need to conduct some of the preclinicalpre-clinical studies and clinical studiestrials that new drug candidates might otherwise require.
In connection with the merger, we acquired Grace’s entireOur therapeutic pipeline, which has the potential to address critical unmet medical needs for the treatment of rare and orphan diseases. The pipeline consists of three unique clinical stage and multiple pre-clinical stage assets supported by an intellectual property portfolio of more than 40 granted and pending patents in various jurisdictions worldwide. These drug candidates aim to improve clinical outcomes in the treatment of rare and orphan diseases by applying proprietary formulation and drug delivery technologies to existing pharmaceutical compounds to achieve improvements over the current standard of care, or to provide treatment for diseases with no currently approved therapies.
RareWe believe that rare disorders represent an attractive area for drug development, and there remains an opportunity for Acastius to utilize already approved drugs that have established safety profiles and clinical experience to potentially address significant unmet medical needs. A key advantage of pursuing therapies for rare disorders is the potential to receive orphan drug designation (“ODD”) from the FDA. Our three drug candidates currently in clinical development have received ODD status, provided certain conditions are met at new drug application ("NDA") approval. ODD provides for seven years of marketing exclusivity in the United States post-launch, provided certain conditions are met, and the potential for faster regulatory review. ODD status can also result in tax credits of up to 50% of clinical development costs conducted in the United States upon marketmarketing approval and a waiver of the new drug application (NDA)NDA fees, which we estimate can range between $1 - $2 million.translate into savings of approximately $3.2 million for our lead drug candidate, GTX-104. Developing drugs for rare diseases can often allow for clinical trials that are more manageably scaled and may require a smaller, more targeted commercial infrastructure.
The specific diseases targeted for drug development by Acastius are well understood, although thesethe patient populations suffering from such diseases may remain poorly served by available therapies or in some cases, approved therapies do not yet exist. We aim to effectively treat debilitating symptoms that result from these underlying diseases.
19
Our three most advanced programs are:lead drug candidate:
Other pipeline drug candidates:
20
In May 2023, we announced the strategic decision to prioritize development of GTX-104 with a goal to advance the product candidate to commercialization, while conserving resources as much as possible to complete development efficiently. We estimate that the deferral of GTX-102 and GTX-101 clinical development could be at least three years given the timeline to complete the development and potential commercial launch of GTX-104. Further development of GTX-102 and GTX-101 will occur at such time as we obtain additional funding or enter into strategic partnerships for license or sale with third parties.
The decision to defer further development of GTX-102 and GTX-101 triggered a comprehensive impairment review of our intangible assets as of March 31, 2023. Given the extended timeline, we increased the discount rates used to value the related assets in order to recognize additional risks related to prioritizing one asset over the others, financing the projects given limited available resources and the need to preserve cash to advance GTX-104 as far as possible, potential competitor advances that could arise over three years, and the general market depression affecting small cap development companies like us and the prohibitively high dilution and expense of available funding in the capital markets. Increasing the discount rates significantly reduced the discounted cash flow values for each of the programs deferred. Accordingly, in the quarter ended March 31, 2023 we booked impairment charges related to GTX-102 and GTX-101 of $22.7 million and $6.0 million respectively, together with further adjustments made to deferred taxes and goodwill directly related to those assets. The impairment charge overall amounted to $33.5 million. We continue to believe that GTX-102 and GTX-101 may eventually provide significant value when development resumes and, if approved, commercialized successfully.
Our management team possesses significant experience in drug formulation and drug delivery research and development, clinical and pharmaceutical development and manufacturing, regulatory affairs, and business development, as well as being well-versed in late-stage drug development and commercialization. The AcastiImportantly, our team has been collectively involvedis comprised of industry professionals with deep expertise and knowledge, including a world-renowned practicing neurosurgeon-scientist and respected authority in theaSAH, as well as product development, chemistry, manufacturing and approvalcontrols (“CMC”), planning, implementation, management, and execution of numerous successfully marketed drugs, including TORADOL™, NAPROSYN™, ANDROGEL™, SUBSYS™, MARINOL™, KEPPRA XR™, CLARITIN®, EUFLEX®, EFFEXOR®, SONATA®, ATIVAN®, RD-HEPARIN®, RAPAMUNE®, ETODOLAC, ARICEPT®, CARDIZEM®, DEFLAZACORT®, AND MACIMORELIN®.global Phase 2 and Phase 3 trials for a drug candidate for aSAH.
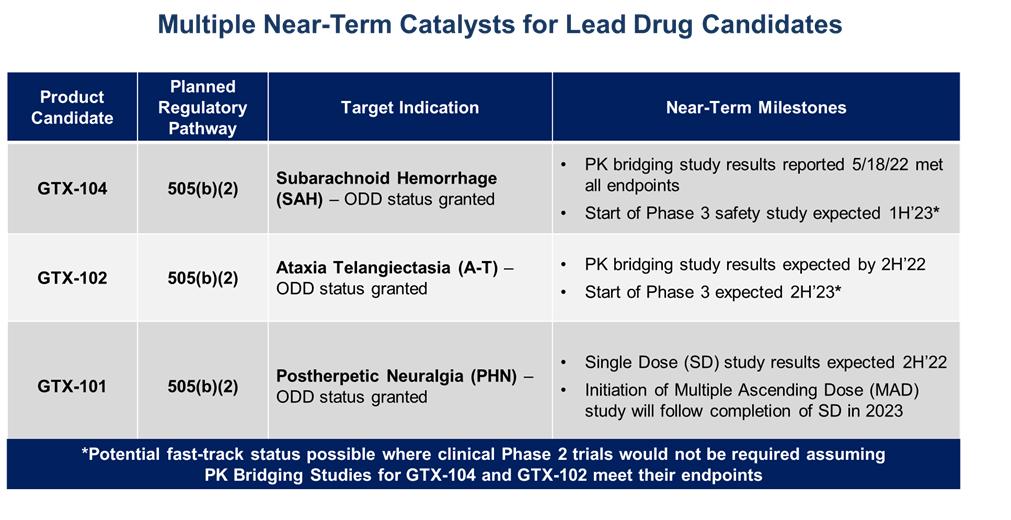
The table below summarizes planned key fiscal 2023 milestones for our three clinical drug candidates:
GTX-104 Overview
Nimodipine was granted FDA approval in 1988, and is the only approved drug that has been clinically shown to improve neurological outcomes in SAH.aSAH patients. It is only available in the United States as a generic oral capsule and as a branded oral liquid solution called NYMALIZE™, which is manufactured and sold by Arbor Pharmaceuticals (acquired in September 2021 by Azurity Pharmaceuticals). Nimodipine has poor water solubility and high permeability characteristics as a result of its high lipophilicity. Additionally, orally administered nimodipine has dose-limiting side-effects such as hypotension, poor absorption and low bioavailability resulting from high first-pass metabolism, and a narrow administration window as food effects lower bioavailability significantly. Due to these issues, blood levels of orally administered nimodipine can be highly variable, making it difficult to manage blood pressure in SAHaSAH patients. Nimodipine capsules are also difficult to administer, particularly to unconscious patients or those with impaired ability to swallow. Concomitant use with CYP3A inhibitors is contraindicated (NIMODIPINE Capsule PI).
NIMOTOP™ is an injectable form of nimodipine that is manufactured by Bayer Healthcare. It is approved in Europe and in other regulated markets (but not in the United States). It has limited utility for SAHaSAH patients because of its high organic solvent content, namely 23.7% ethanol and 17% polyethylene glycol 400 (NIMOTOP SmPC).
20
21
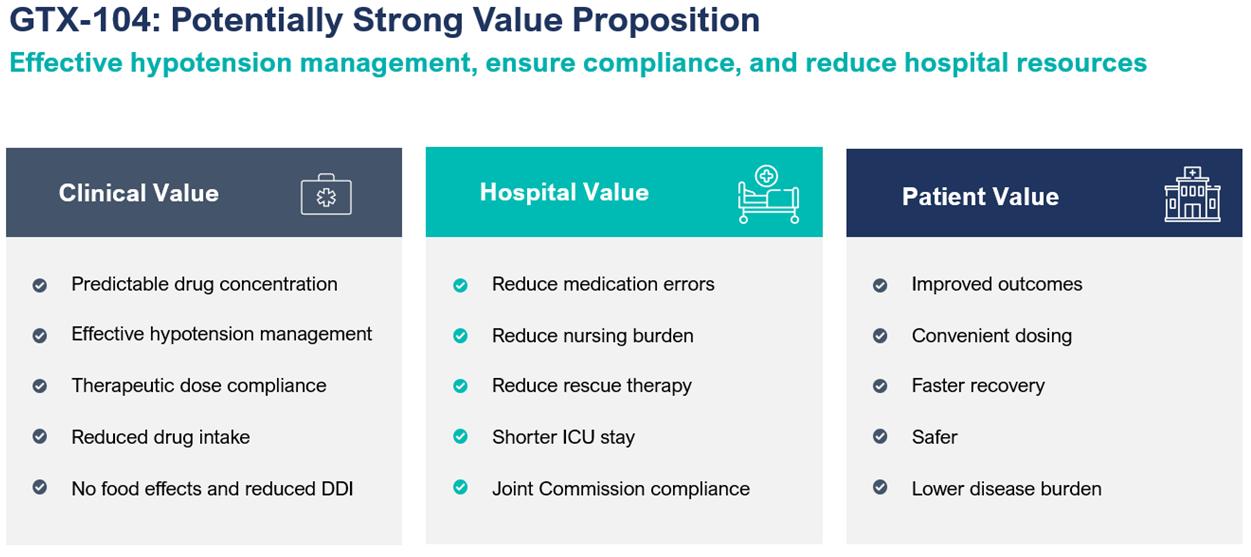
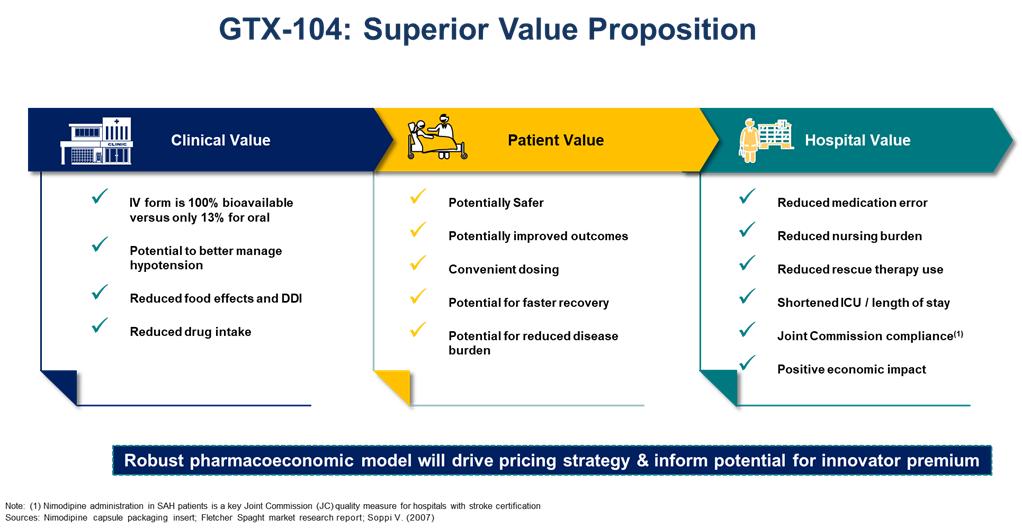
Key Potential Benefits:
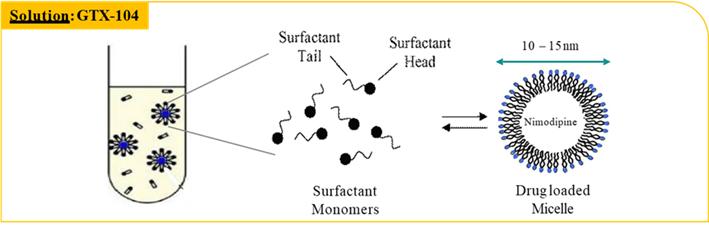
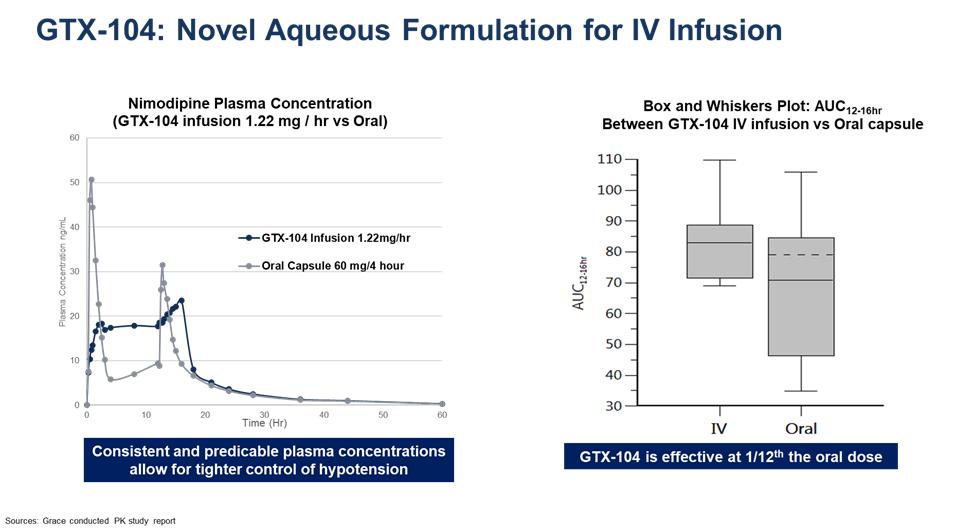
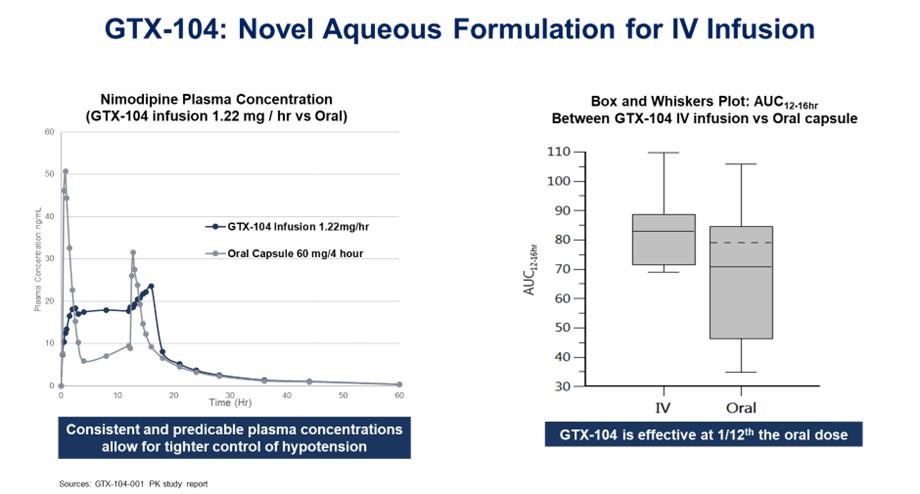
GTX-104 could provide a more convenient mode of administration as compared to generic nimodipine capsules or NYMALIZE™, GTX-104 is administered as an initial bolus followed by a continuousand intravenous infusion as compared to oral administration via a nasogastric tube in unconscious patients every two to four hours for both nimodipine capsules and NYMALIZE™ solution.. Therefore, GTX-104 could be considered asmake a major contribution to patient care by potentially reducing the dosing frequency, and the associated nursing burden. More convenient and continuous, moreand consistent dosing can also reduce the risk of medication errors. In addition, as depicted in the charts below, two PK studies have shown that GTX-104 has the potential to provide improved bioavailability and lowershow reduced inter- and intra-subject variability compared to oral nimodipine, which is hypothesized to limit the risk of hypotension and to better achieve a desired therapeutic concentration. The variability was observed higher following the capsule administration (see chart below).as compared to IV infusion administration (nimodipine exposure variability at steady state observed 37.5% following oral capsule administration versus 15.5%, following GTX-104 IV infusion) Because of its IV formulation, we also expect GTX-104 to reduce certain drug-drug interactions and food effects.
21
Despite the positive impact it has on recovery, physicians often must discontinue their patients onfrom oral nimodipine, primarily as a result of hypotensive episodes that cannot be controlled by titrating the oral form of drug. Such discontinuation could potentially be avoided by administering GTX-104, which because of its IV administration, may obviatereduce the complexity that results fromassociated with the need for careful attention to the timing of nimodipine administration at least one hour before or two hours after a meal. Administration of GTX-104 via a peripheral vein is often much more comfortable for the patients compared to administration by central venous access (as is the case for NIMOTOPTM), which can often be a difficult, invasive and more risky procedure. Also, unconscious patients will likely receive more consistent concentrations of nimodipine when delivered via the IV route as compared to oral gavage or a nasogastric tube. More consistent dosing is expected to result in a reduction of vasospasm and a better, more consistent management of hypotension. As summarized in the table below, we also anticipate reduced use of rescue therapies, such as vasopressors, and expensive hospital resources, such as the angiography suite, are possible by more effectively managing blood pressure with GTX-104. Reduced incidences of vasospasm could result in shorter length of stay and better outcomes.
22
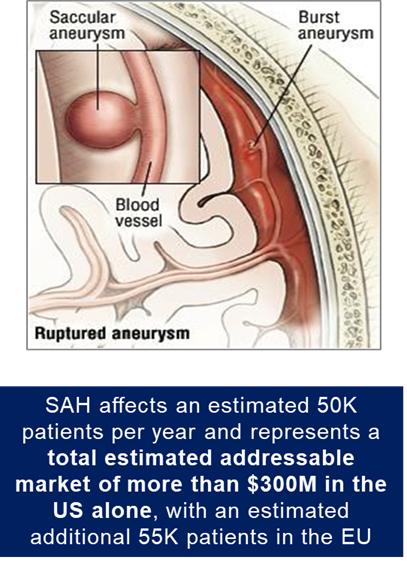
About aneurysmal Subarachnoid Hemorrhage (SAH)(aSAH)
SAHaSAH is bleeding over the surface of the brain in the subarachnoid space between the brain and the skull, which contains blood vessels that supply the brain. A primary cause of such bleeding is rupture of an aneurysm. The result is a relatively uncommon type of stroke that accounts for about 5% of all strokes and has an incidence of six per 100,000 person years (Becske, 2018).years.
In contrast to more common types of stroke in elderly individuals, SAHaSAH often occurs at a relatively young age, with approximately half the affected patients younger than 60 years old (Becske, 2018).old. Approximately 10% to 15% of aneurysmal SAH (“aSAH”) patients die before reaching the hospital, (Rinkel, 2016), and those who survive the initial hours post hemorrhage are admitted or transferred to tertiary care centers with high risk of complications, including rebleeding and delayed cerebral ischemia (“DCI”). Systemic manifestations affecting cardiovascular, pulmonary, and renal function are common and often complicate management of DCI. Approximately 70% of aSAH patients experience death or a permanent dependence on family members, and half die within one month after the hemorrhage. Of those who survive the initial month, half remain permanently dependent on a caregiver to maintain daily living (Becske, 2018).living.
23
We estimate that approximately 50,000 individuals experience aSAH each year in the US. TheU.S. based on third-party market research, and that total addressable market for SAH is approximately $300 million in the U.S., and There are an estimated 50,000150,000 aSAH patients each year in China and approximately 55,000 patients in the European Union based on annual inpatient admissions and the average length-of-stay.
GTX-104 Recent Activities & Near Term Milestones: Conduct Phase 3 Safety StudyTrial
In September 2021, we initiated our pivotal PK bridging studytrial to evaluate the relative bioavailability of GTX-104 compared to currently marketed oral nimodipine capsules in approximately 50 healthy subjects. The PK studytrial was the next required step in our proposed 505(b)(2) regulatory pathway for GTX-104.
Final results from this pivotal PK studytrial were reported on May 18, 2022, and showed that the bioavailability of GTX-104 compared favorably with the oral formulation of nimodipine in all subjects, and no serious adverse events were observed for GTX-104.
22
All three endpoints indicated that statistically there was no difference in exposures between GTX-104 and oral nimodipine over the defined time periods for both maximum exposure and total exposure. Plasma concentrations obtained following IV administration showed significantly less variability between subjects as compared to oral administration of capsules, since IV administration is not as sensitive to some of the physiological processes that affect oral administration, such as taking the drug with and without meals, variable gastrointestinal transit time, variable drug uptake from the gastrointestinal tract into the systemic circulation, and variable hepatic blood flow and hepatic first pass metabolism. Previous studies have shown these processes significantly affect the oral bioavailability of nimodipine, and therefore cause oral administration to be prone to larger inter- and intra-subject variability.
The bioavailability of oral nimodipine capsules observed was only 8% compared to 100% for GTX-104. Consequently, about one-twelfth the amount of nimodipine is delivered with GTX-104 to achieve the same blood levels as with the oral capsules.
No serious adverse events and no adverse events leading to withdrawal were reported during the study.trial.
Next Step – Initiate Phase 3 Safety StudyTrial for GTX-104
We plan to submit the final PK bridging study report to the FDA and to requestIn April 2023, we received a Type C written meeting withresponse and clarifying feedback from the FDA to get the agency’s guidance on our proposed phasePhase 3 study design. We expect to receivesafety trial for GTX-104. The FDA provided additional comments on our development plan that, guidance bypending submission of the endfinal clinical protocol and FDA approval of 2022 or early in the first calendar quarter of 2023. We anticipate that this feedback shouldsame, will allow us to initiateproceed with the initiation of a Phase 3 Safety Studysafety clinical trial in aSAH patients. On July 5, 2023, we announced the alignment with the U.S. Food and enrollDrug Administration on our GTX-104 pivotal Phase 3 safety trial protocol.
The FDA concurred with the suitability of the 505(b)(2) regulatory pathway with the selected Reference Listed Drug NIMOTOP oral capsules (NDA 018869), and that our GTX-104-002 PK trial may have met the criteria for a scientific bridge.
Based on the proposed design of our Phase 3 trial, which we have titled STRIVE-ON (Safety, Tolerability, Randomized, IV and Oral Nimodipine), the clinical trial will be a prospective, open-label, randomized (1:1 ratio), parallel group trial of GTX-104 compared with oral nimodipine, in patients hospitalized for aSAH. Key trial design features include:
On October 23, 2023, we enrolled our first patient in the first half of 2023.our STRIVE-ON clinical trial. The studytrial is expected to take aboutapproximately 18 months to complete from the time the first patient is enrolled, and we expect this safety studytrial to be the final clinical step required to seek FDA approval under the 505(b)(2) regulatory pathway. Before submitting a New Drug Application to the FDA, Acasti plansan NDA, we plan to hold a pre-NDA meeting to enhancewith the likelihood of market approval.FDA.
GTX-102 Overview
GTX-102 is a novel, concentrated oral-mucosal spray of betamethasone intended to improve neurological symptoms of Ataxia Telangiectasia (“A-T”)A-T for which there are currently no FDA-approved therapies. GTX-102 is a stable, concentrated oral spray formulation comprised of glucocorticoidthe gluco-corticosteroid betamethasone that together with other excipients can be sprayed conveniently over the tongue of the A-T patient and is rapidly absorbed.
About Ataxia Telangiectasia
A-T is a rare genetic progressive autosomal recessive neurodegenerative disorder that affects children, with the hallmark symptoms of cerebellar ataxia and other motor dysfunction, and dilated blood vessels (telangiectasia) that occur in the sclera of the eyes. A-T is caused by mutations in the ataxia telangiectasia gene, which is responsible for modulating cellular response to stress, including breaks in the double strands of DNA.
23
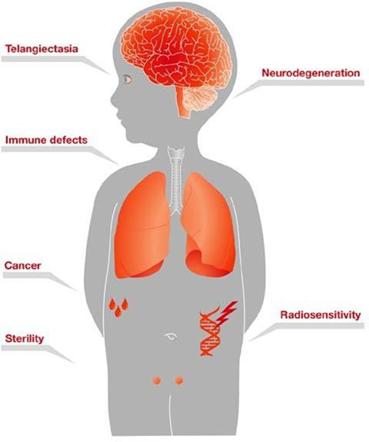
Children with A-T begin to experience balance and coordination problems when they begin to walk (toddler age), and ultimately become wheelchair-bound in their second decade of life. In pre-adolescence (between ages 5 and 8), patients experience oculomotor apraxia, dysarthria, and dysphagia. They also often develop compromised immune systems and are at increased risk of developing respiratory tract infections and cancer (typically lymphomas and leukemia) (U.S. National Cancer Institute A-T, 2015).
24
A-T is diagnosed through a combination of clinical assessment (especially neurologic and oculomotor deficits), laboratory analysis, and genetic testing. There is no known treatment to slow disease progression, and treatments that are used are strictly aimed at controlling the symptoms (e.g., physical, occupational or speech therapy for neurologic issues), or conditions secondary to the disease (e.g., antibiotics for lung infections, chemotherapy for cancer, etc.) (U.S. National Cancer Institute A-T, 2015). There are no FDA-approved therapeutic options currently available. Patients typically die by age 25 from complications of lung disease or cancer. According to a third-party report we commissioned, by Acasti Pharma US, A-T affects approximately 4,300 patients per year in the United States and has a potential total addressable market of $150 million, based on the number of treatable patients in the United States.
GTX-102 - R&D and Clinical StudiesTrials to Date
We have licensed the data from the multicenter, double-blinded, randomized, placebo-controlled crossover trial from Azienda Ospedaliera Universitaria Senese, Siena, Italy, where Dr. Zannolli et. al. studied the effect of oral liquid solution of betamethasone to reduce ataxia symptoms in patients with A-T. This oral liquid solution is not marketed in the United States, and therefore is not available for clinical use; currently, betamethasone is only available in the United States as an injectable or as a topical cream. This license gives us the right to reference the trial’s data in our NDA filing. On November 12, 2015, we submitted the data from the Zannolli trial to the FDA’s Division of Neurology at a pre-Investigational New Drug (“IND”) meeting and received guidance from the agency on the regulatory requirements to seek approval.
In a multicenter, double-blind, randomized, placebo-controlled crossover trial conducted in Italy, Dr. Zannolli et al. studied the effect of an oral liquid solution of betamethasone on the reduction of ataxia symptoms in 13 children (between ages 2 to 8 years) with A-T. The primary outcome measure was the reduction in ataxia symptoms as assessed by the International Cooperative Ataxia Rating Scale (“ICARS”).
In the trial, oral liquid betamethasone reduced the ICARS total score by a median of 13 points in the intent-to-treat (“ITT”) population and 16 points in the per-protocol (“PP”) population (the median percent decreases of ataxia symptoms of 28% and 31%, respectively). Adverse events in the trial were minimal, with no compulsory withdrawals and only minor side effects that did not require medical intervention. Clinical studytrial results in A-T patients administered oral betamethasone indicated that betamethasone significantly reduced ICARS total score relative to placebo (P = 0.01). The median ICARS change score (change in score with betamethasone minus change in score with placebo) was -13 points (95% confidence interval for the difference in medians was -19 to -5.5 points).
Based on the Zannolli data, we believe that our GTX-102 concentrated oral spray has the potential to provide clinical benefits in decreasing A-T symptoms, including assessments of posture and gait disturbance and kinetic, speech and oculomotor functions. In addition, GTX-102 may ease drug administration for patients experiencing A-T given its application of 1-3x/day of 140µL of concentrated betamethasone liquid sprayed onto the tongue using a more convenient metered dose delivery system, as these A-T patients typically have difficulty swallowing (lefton-greif 2000).swallowing.
24
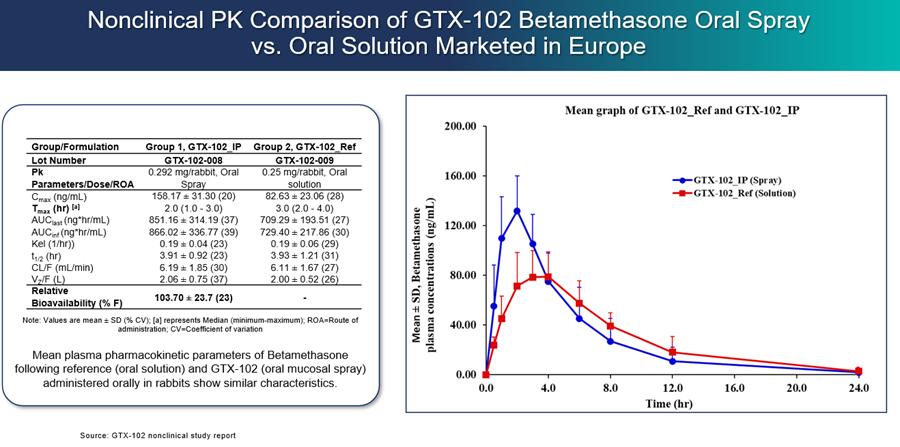
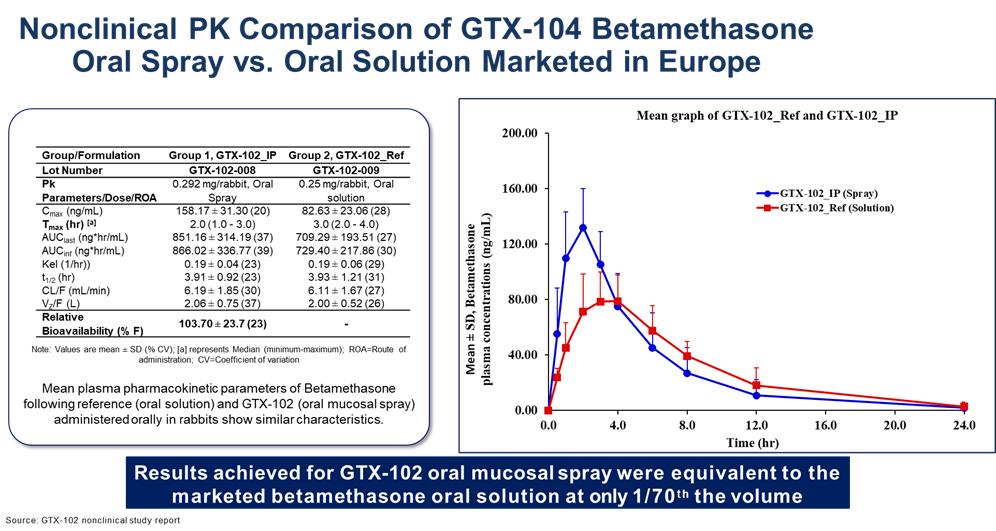
GTX-102 PK Data to Date:
GTX-102 administered as a concentrated oral spray achieves similar blood levels at only 1/70th the volume of an oral solution of betamethasone. This more convenient mode of administration will be important for A-T patients who have difficulties swallowing large volumes of liquids.
GTX-102 Near-Term Milestones: Conduct PK Bridging and Confirmatory Phase 3 Clinical Trials
Acasti Pharma US has licensed the data from the multicenter, double-blinded, randomized, placebo-controlled crossover trial from Azienda Ospedaliera Universitaria Senese, Siena, Italy, where Dr. Zannolli et. al. studied the effect of oral liquid solution of betamethasone to reduce ataxia symptoms in patients with A-T. Note that this oral liquid solution is not marketed in the United States, and therefore is not available for clinical use; currently, betamethasone is only available in the United States as an injectable or as a topical cream. This license gives Acasti Pharma US the right to reference the study’s data in its NDA filing. On November 12, 2015, Acasti Pharma US submitted the data from the Zannolli study to the FDA’s Division of Neurology at a pre-Investigational New Drug (“IND”) meeting and received guidance from the agency on the regulatory requirements to seek approval.
We plan to initiateinitiated a PK bridging studytrial of our proprietary concentrated oral sprayGTX-102 as compared to the oral liquid solution of betamethasone used in the Zannolli studytrial and against the injectable form of betamethasone that is approved in the U.S. in the third calendar quarter of 2022. We expectThe primary objectives of the PK bridging trial were to reportevaluate the bioavailability, pharmacokinetics and safety of GTX-102. On December 28, 2022, we reported that the topline results of this study beforetrial met all primary outcome measures.
Results showed that GTX-102 betamethasone blood concentrations were highly predictable and consistent based on AUC (the area under the endconcentration time curve up to 72 hours post-dose, extrapolated to infinity) and Cmax (the maximum concentration occurring between 0 hour to 72 hours after trial drug administration), indicating good linearity and dose-proportionality. GTX-102 betamethasone blood concentrations were within the same range of 2022. Assumingexposure as IM betamethasone, based on AUC. This IM formulation will serve as a bridge for GTX-102 in the PK bridging study meets its primary endpoint,context of the proposed 505(b)(2) regulatory pathway. GTX-102 betamethasone blood concentrations were also within the same range of exposure as Oral Solution (OS), based on AUC. This OS formulation was used by Zannolli and may serve as a clinical comparator for further clinical development. Furthermore, statistically there was no significant difference (p>0.05) between GTX-102 administered at a fast rate (each spray immediately following the preceding one) vs. a slow rate (1 spray/minute), as indicated by Cmax and AUC. We believe this result is important because being able to use the fast or the slow rate of administration may provide greater flexibility for patients and caregivers. The Cmax of GTX-102 was within the same range of exposure as the OS, but the Cmax for the IM formulation was lower than both GTX-102 and the OS, as well as what has been reported previously for the IM in industry publications. It is important to note that achieving bioequivalence with the IM was not an objective of this trial, nor was it expected. Finally, of the 48 healthy adult subjects, no serious adverse events (AE) were reported, and the most frequent drug-related adverse effect was mild headache (4 cases).
The further development of GTX-102 has been deprioritized in favor of our focus on development of GTX-104. Pending additional funding for GTX-102 or the signing of a strategic partnership, we will work with our clinical experts and the FDA to determine the best final dosing regimen for GTX-102 to incorporate into our Phase 3 trial design. Based on previous discussions with the FDA, we plan to conduct a confirmatory Phase 3 safety
25
confirmatory Phase 3 safety and efficacy trial in A-T patients, and plan to seek guidance from the FDA on the studytrial design at a Type B meeting. The Phase 3 studymeeting if and when development of GTX-102 resumes. It is expected to be initiated in the second half of 2023. If both studies meet their primary endpoints, a Pre-NDA meeting and an NDA filing under Section 505(b)(2) would follow.also possible that we may out-license or sell our GTX-102 drug candidate.
GTX-101 Overview
GTX-101 is a non-narcotic, topical bio-adhesive film-forming bupivacaine spray designed to ease the symptoms of patients suffering with postherpetic neuralgia (“PHN”). GTX-101’sGTX-101 is administered via a metered-dose of bupivacaine spray and forms a thin bio-adhesive topical film on the surface of the patient’s skin, which enables a touch-free, non-greasy application. It also comes in convenient, portable 30 ml plastic bottles. Unlike oral gabapentin and lidocaine patches, we believe that the biphasic delivery mechanism of GTX-101 has the potential for rapid onset of action and continuous pain relief for up to eight hours. No skin sensitivity was reported in a Phase 1 study.trial.
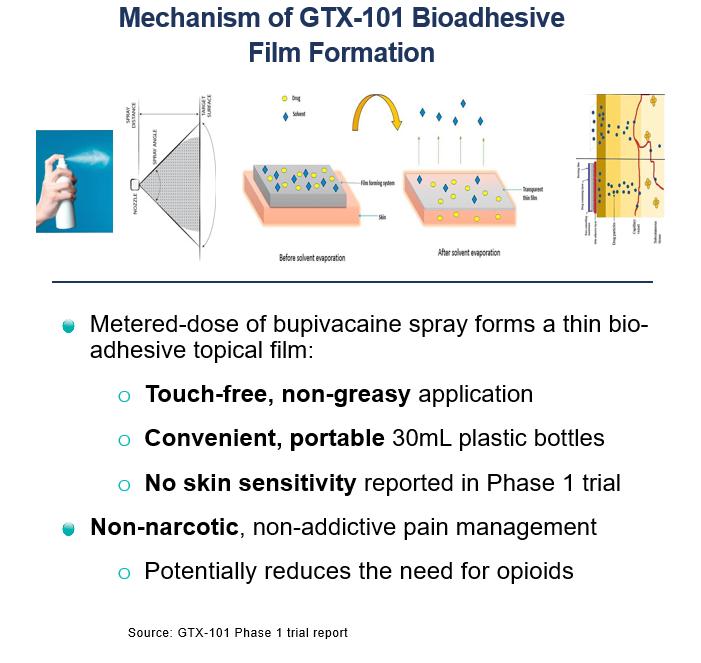
26
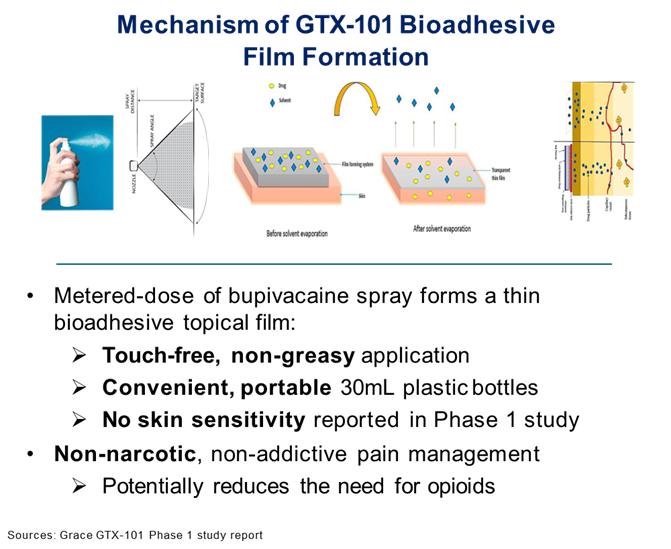
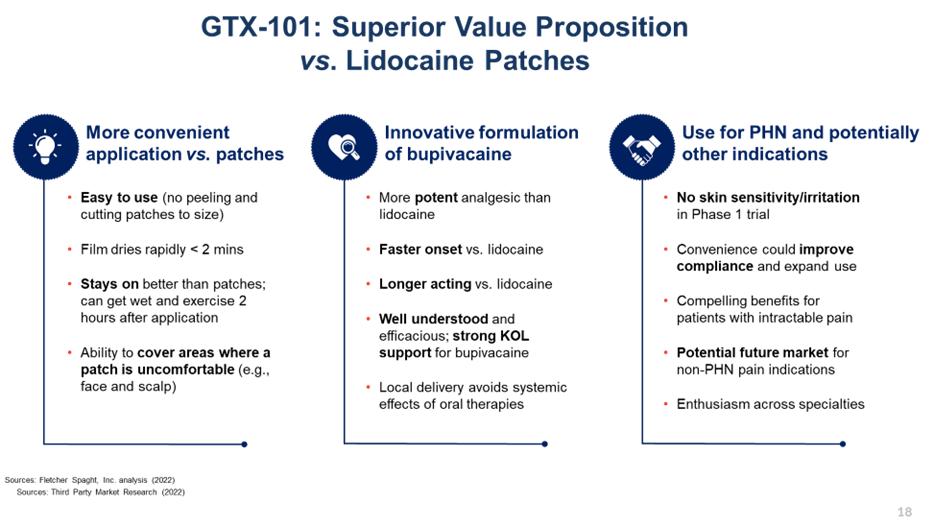
About Postherpetic Neuralgia (PHN)
PHN is neuropathic pain due to damage caused by the varicella zoster virus (“VZV”). Infection with VZV causes two distinct clinical conditions. Primary VZV infection causes varicella (i.e., chickenpox), a contagious rash illness that typically occurs among young children. Secondary VZV can reactivate clinically, decades after initial infection, to cause herpes zoster (“HZ”), otherwise known as shingles. Acute HZ arises when dormant virus particles, persisting within an affected sensory ganglion from the earlier, primary infection with VZV become reactivated when cellular immunity to varicella decreases. Viral particles replicate and may spread to the dorsal root, into the dorsal horn of the spinal cord, and through peripheral sensory nerve fibers down to the level of the skin. Viral particles also may circulate in the blood. This reactivation is accompanied by inflammation of the skin, immune response, hemorrhage, and destruction of peripheral and central neurons and their fibers. Following such neural degeneration, distinct types of pathophysiological mechanisms involving both the central and peripheral nervous systems may give rise to the severe nerve pain associated with PHN.
27
While the rash associated with HZ typically heals within two to four weeks, the pain may persist for months or even years, and this PHN manifestation is the most common and debilitating complication of HZ. There is currently no consensus definition for PHN, but it has been suggested by the Centers for Disease Control and Prevention (“CDC”) that PHN is best defined as pain lasting at least three months after resolution of the rash.
PHN is associated with significant loss of function and reduced quality of life, particularly in the elderly. It has a detrimental effect on all aspects of a patient's quality of life. The nature of PHN pain varies from mild to severe, constant, intermittent, or triggered by trivial stimuli. Approximately half of patients with PHN describe their pain as “horrible” or “excruciating,” ranging in duration from a few minutes to constant on a daily or almost daily basis (Katz, 2004).basis. The pain can disrupt sleep, mood, work, and activities of daily living, adversely impacting the
26
quality of life and leading to social withdrawal and depression. PHN is the number-one cause of intractable, debilitating pain in the elderly, and has been cited as the leading cause of suicide in chronic pain patients over the age of 70 (Hess, 1990).70.
Current treatment of PHN most often consists of oral gabapentin (first line) and prescription lidocaine patches or antidepressants (second line), and refractory cases may be prescribed opioids to address persistent pain. Gabapentin and opioid abuse have continued to proliferate, and lidocaine patches are suboptimal for many reasons. An independent third partythird-party market research firm we commissioned by Acasti interviewed more than 250 physicians who regularly treat PHN patients, and found that approximately 40% of patients using lidocaine patches experience insufficient pain relief. Lidocaine patches are difficult to use, fall off, and look unsightly with possible skin sensitivity and irritation. Additionally, itlidocaine patches can take up to two weeksonly be used for an optimal analgesic effect12 hours on and then need to be achieved.removed for 12 hours before being reapplied. Prescription lidocaine patches are only approved for PHN, and the market is currently made up of both branded and generic offerings. It is estimated that PHN affects approximately 120,000 patients per year in the United States. According to thea third-party report we commissioned, by Acasti, the total addressable market for GTX-101 could be as large as $2.5 billion, consisting of approximately $200 million for PHN pain and $2.3 billion for non-PHN pain indications.
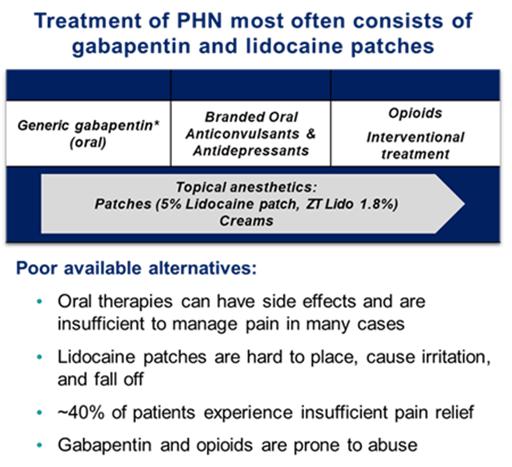
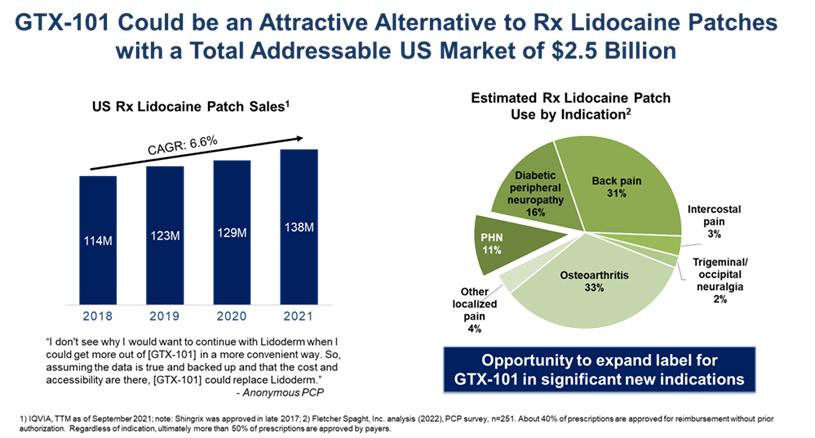
28
GTX-101 R&D History and Clinical StudiesTrials Completed to Date
To date, Acasti Pharma US haswe have conducted threefour Phase I studiestrials in healthy volunteers to assess the PK, safety and tolerability of GTX-101 and to determine the plasma levels of bupivacaine HCl administered as a single dose in various concentrations namelybetween 30 mg (three sprays), 50 and 2100 mg (five sprays), 70 mg (seven sprays) or 100 mg (ten(twenty sprays).
These studiestrials confirmed that bupivacaine delivered as a topical spray (GTX-101) is well absorbed through the skin, as demonstrated in the graph below, while very little is absorbed systemically.
In all three studies,four trials, the administration of GTX-101 to healthy volunteers was safe and well tolerated. In addition, no evidence of skin irritation was observed at the application site following the spray administrations. The data below is from two separate trials of GTX-101 and the Lidoderm patch superimposed on each other.
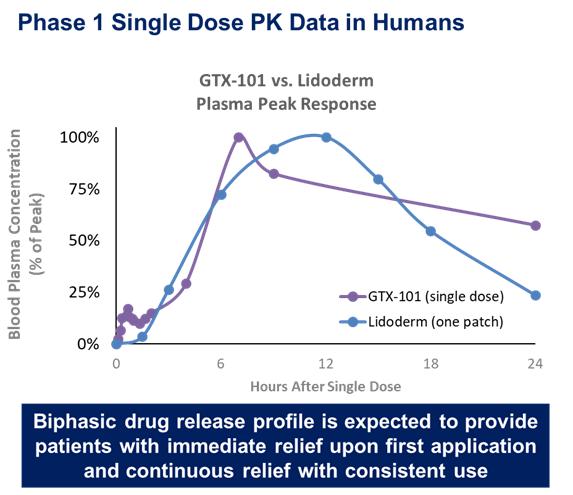
GTX-101 Near-Term Milestones: Conduct Dose Ranging Phase 1 Clinical Trials of GTX-101recent activities:
We believe that the PHN pain market will continue to grow, and non-opioid products like GTX-101 that can relieve PHN pain more quickly and in a sustained manner by means of a more efficient delivery system, will be an attractive therapy option for patients and physicians. GTX-101 is administered by spraying our proprietary bupivacaine formulation over the affected area, which we believe has the potential to provide several advantages over currently marketed products such as the lidocaine patch, including faster onset of action, sustained pain relief, possibly lower dosing requirements and improved dosing convenience, all which could lead to increased patient satisfaction and compliance.
The data from the single dose Phase 1 clinical trial for our topical bupivacaine sprayGTX-101 was submitted to the FDA’s Division of Anesthesiology and feedback was received at a pre-IND meeting on April 18, 2018, that informed the design of preclinicalpre-clinical toxicology studies and a clinical and regulatory pathway to approval under section 505(b)(2). We completed a minipig skin sensitivity study in the second calendar quarter of 2022, and we
27
initiated a single dose PK studytrial in healthy human volunteers in July 2022. ThisTopline results from this single dose PK study is expected to report out before the end oftrial were reported on December 23, 2022 and the results met all primary outcome measures.
The median Tmax (the time of maximum concentration between 0 hour and 240 hours after study drug administration) of bupivacaine in plasma following GTX-101 single-dose topical applications ranged between 18 to 24 hours depending on dose, while the median Tmax following the subcutaneous injection of 10 mg of bupivacaine was only 23 minutes. This result suggests that bupivacaine delivered by GTX-101 remains in the skin for a long period of time, potentially inducing prolonged analgesic effect in the sprayed area. The exposure to bupivacaine based on Cmax (the maximum concentration occurring at Tmax between 0 hour and 240 hours after study drug administration) and AUC (the area under the concentration time curve, extrapolated to infinity) following GTX-101 topical application as a single-dose increased with increasing dose.
The systemic exposure to bupivacaine following a 200mg dose of GTX-101 was approximately 29-fold less than a single subcutaneous dose of 10mg of bupivacaine based on Cmax and approximately 6-fold less than a single subcutaneous dose of 10mg of bupivacaine based on AUC. We predict these lower blood levels will be followedcorrespond to an increased safety margin for GTX-101 with regards to toxicity risk. Mean half-life (T half) following GTX-101 single-dose topical applications ranged between 24 to 37 hours depending on dose, suggesting a slow elimination and potentially long duration of effect, while mean Tmax following the subcutaneous injection of 10 mg of bupivacaine was only 8 hours.
There were only two adverse events judged as related to the study drug by the investigator for each of GTX-101 and the bupivacaine subcutaneous injection. Following GTX-101 topical application: headache (1 event = 3%) and numbness (1 event = 3%) at the sprayed area following bupivacaine subcutaneous injection: dizziness (1 event = 8%) and nausea (1 event = 8%).
The further development of GTX-101 has been deprioritized in favor of our focus on development of GTX-104. Pending additional funding for GTX-101 or the signing of a strategic partnership, we plan to follow this successful PK trial with a multiple ascending dose studytrial in 2023. Results from these non-clinical studies and clinical studiestrials are required before the initiation of our Phase 2 program in PHN patients. It is also possible that we may out-license or sell our GTX-101 drug candidate.
28
Overall Commercialization Strategy
We plan to retain ourhave worldwide commercialization rights for some ofall our keypipeline drug candidates while for other drug candidates we might consider collaboration opportunitiesand plan to maximize market penetrationthe value of each asset. Currently, we have prioritized the development of GTX-104 and returns.de-emphasized the development of GTX-102 and GTX-101. If we receive regulatory approval we expect to build a small and focused commercial organizationfor GTX-104 in the United StatesUS, we may look to out-license commercialization or consider self-commercialization including outsourcing sales to ensure efficient commercial management and maximize market penetration and sell GTX-104 and GTX-102.financial returns. We believe the patient populations and medical specialists for these indications are sufficiently concentrated to allow us to cost-effectively promote these drug products following approval for commercial sale. Given that GTX-101 will be targeted to a larger primary care and pain specialist market, if GTX-101 receives regulatory approval, it is likely we willmay seek commercial partnerships to fully exploit the market potential of this drug product.GTX-104 in territories outside the US. It is possible that we may out-license or sell GTX-102 and/or GTX-101 for the US and/or global markets.
As product candidates advance through the pipeline, our commercial plans may change. Clinical data, the size of the development programs, the size of the target market, the size of a commercial infrastructure and manufacturing needs may all influence our U.S., European Union, and rest-of-world strategies.
Recent Developments
Nasdaq LetterSeptember 2023 Private Placement Offering
On September 24, 2023, we entered into a securities purchase agreement (the “Purchase Agreement”) with certain institutional and accredited investors in connection with a private placement offering of our securities (the “Offering”). Pursuant to the Purchase Agreement, we agreed to offer and sell in the Offering 1,951,371 Class A common shares, no par value per share (the “Common Shares”), at a purchase price of $1.848 per Common Share and pre-funded warrants (the “Pre-funded Warrants”) to purchase up to 2,106,853 Common Shares (the “Pre-funded Warrant Shares”) at a purchase price equal to the purchase price per Common Share less $0.0001. Each Pre-funded Warrant is exercisable for one Pre-funded Warrant Share at an exercise price of $0.0001 per Pre-funded Warrant Share, is immediately exercisable and will expire once exercised in full. Pursuant to the Purchase Agreement, we also issued to such institutional and accredited investors common warrants (the “Common Warrants” and, together with the Pre-funded Warrants, the “Warrants”) to purchase Common Shares, exercisable for an aggregate of 2,536,391 Common Shares (the “Common Warrant Shares” and, together with the Pre-Funded Warrant Shares, the “Warrant Shares”). Under the terms of the Purchase Agreement, for each Common Share and each Pre-funded Warrant issued in the Offering, an accompanying five-eighths (0.625) of a Common Warrant was issued to the purchaser thereof. Each whole Common Warrant is exercisable for one Common Warrant Share at an exercise price of $3.003 per Common Warrant Share, is immediately exercisable and will expire on the earlier of (i) the 60th day after the date of the acceptance by the U.S. Food and Drug Administration of a New Drug Application for our product candidate GTX-104 or (ii) five years from the date of issuance. The Common Warrants were offered and sold at a purchase price of $0.125 per whole underlying Common Warrant Share, which purchase price was included in the offering price per Common Share and Pre-funded Warrant issued in the Offering.
The Offering closed on September 25, 2023 (the “Closing Date”). Shore Pharma LLC, an entity controlled by Vimal Kavuru, the Chair of our Board of Directors, and SS Pharma LLC, the beneficial owner of 5.5% of our Common Shares outstanding prior to the Offering, each a related party of ours, participated in the Offering. The net proceeds to us from the Offering was approximately $7.3 million, after deducting fees and expenses.
Pursuant to the terms of the Purchase Agreement, we agreed to register for resale the Common Shares sold in the Offering and the Warrant Shares. On October 6, 2023, we filed a resale Registration Statement on Form S-3 with the SEC, registering the Common Shares sold in the Offering and the Warrant Shares for resale. The resale Registration Statement on Form S-3 was declared effective on October 16, 2023.
Announcement of compliance with the Nasdaq minimum bid price requirement
On July 27, 2022,24, 2023, we received written notificationnotice (the “Notification Letter”) from theThe Nasdaq Listing Qualifications Department ("Nasdaq") for failing to maintain aStock Market LLC notifying us that we had regained compliance with the minimum bid price of $1.00 per common share for the last 30 consecutive business days, as required byrequirement set forth in Nasdaq Listing Rule 5550(a)(2) - bidfor continued listing on the Nasdaq Capital Market. The Notification Letter was sent following the implementation of a 1-for-6 reverse split of our Common Shares (the “Reverse Stock Split”), which became effective on July 10, 2023.
Reverse stock split
On June 29, 2023, our Board of Directors approved an amendment to our Articles of Incorporation to implement the Reverse Stock Split. On July 4, 2023, we filed Articles of Amendment to our Articles of Incorporation with the Registraire des entreprises du Québec, to implement the Reverse Stock Split. All applicable references in this MD&A to number of common shares, warrants and options, price (the "Minimum Bidper share and weighted average number of shares outstanding prior to the Reverse Stock Split have been adjusted to reflect the Reverse Stock Split, which was made effective on July 10, 2023.
29
Price Rule"). The Nasdaq notification has no immediate effect on the listing of our common shares, and we have 180 calendar days, or until January 23, 2023, to regain compliance. If at any time over this period the bid price of our common shares closes at $1.00 per share or more for at least a minimum of ten consecutive business days, Nasdaq will provide written confirmation of compliance and the matter will be closed.
If we do not regain compliance within the initial 180-day period, but otherwise meet the continued listing requirements for market value of publicly-held shares and all other initial listing standards for the Nasdaq Listing Rule 5505 - Capital Market criteria, except for the Minimum Bid Price Rule, we may be eligible for an additional 180 calendar days to regain compliance. If we are not granted additional time, then our common shares will be subject to delisting, at which time we may appeal the delisting determination to a Nasdaq Hearings Panel.
We intend to monitor the closing bid price of its common shares and, if necessary, evaluate all available options to resolve the deficiency and regain compliance with the Minimum Bid Price Rule.
Initiation of Pharmacokinetic Study for GTX-102
On September 13, 2022, we announced the initiation of our planned PK bridging study to evaluate the comparative bioavailability pharmacokinetics, and safety in 48 healthy subjects of our oral betamethasone spray, GTX-102, compared to an intramuscular injection of betamethasone and to an oral solution of betamethasone.
Newly Elected Directors
At our annual and special shareholders meeting held on September 28, 2022, all five nominees for the board of directors listed in our proxy statement dated August 31, 2022, being Jean Marie (John) Canan, Jan D’Alvise, Donald Olds, Vimal Kavuru and Michael L. Derby were elected as directors of Acasti to serve for a term that expires at our 2023 annual meeting of shareholders or until their successors are duly elected or appointed, unless such office is earlier vacated in accordance with our by-laws. Mr. Derby will join the Audit Committee together with Mr. Canan (Chair) and Mr. Olds, and Mr. Canan will join the GHR Committee together with Mr. Olds (Chair) and Mr. Kavuru. Acasti also announced that Vimal Kavuru, an independent director, was appointed as Chairman of the Company.
Stock Option Grants
On September 29, 2022, we announced an aggregate of 220,000 stock options were granted to certain directors of the Company under our stock option plan. The stock options were granted by the board of directors as part of the annual performance review in accordance with our long-term incentive program and upon the recommendation of our external compensation consultant. Subject to the terms and conditions of the stock option plan, options granted to directors will vest in equal monthly installments over a period of 12 months. Each option will entitle the holder to purchase one common share at a price of CDN$ 0.80 per share, until September 28, 2032.
Court Dismissal of Stockholder Litigation
On September 30, 2022, we announced that a New York court has dismissed the remaining stockholder litigation filed in connection with our acquisition of Grace Therapeutics, Inc. via merger in August 2021 (the “Merger”). As previously disclosed, four stockholder lawsuits were filed against Acasti and certain of its directors and officers in connection with the Merger, claiming that the Company’s public disclosures relating to the Merger misstated or omitted material information and violated Section 14(a) of the U.S. Securities Exchange Act of 1934. Two of the four cases were voluntarily dismissed. The remaining two cases were consolidated before the United States District Court for the Southern District of New York. Acasti and the individual defendants filed a motion to dismiss on February 25, 2022. In a 45-page opinion the court granted the motion to dismiss in its entirety, finding that the consolidated complaint failed to allege any facts showing that Acasti made a materially misleading statement or material omission in its Merger-related disclosures. Accordingly, subject to any appeal that may be taken in response to the ruling, all stockholder suits filed in connection with the Merger have now been dismissed.
Senior Management Changes
On September 13, 2022, we announced that Prashant Kohli has been named Chief Commercial Officer. Mr. Kohli previously served as our VP of Commercial Operations.
COVID-19 Update
To date, the ongoing COVID-19 pandemic has not caused significant disruptions to our business operations and research and development activities.
The extent to which the COVID-19 pandemic impacts our business and prospects and the timing and completion of future clinical trials for our new drug candidates will depend on future developments, which remain highly uncertain and cannot be predicted, including new information which may emerge concerning the severity of COVID-19 variants and the actions to contain the COVID-19 pandemic or treat its impact, among others.
Basis of Presentation of the Financial Statements
Our condensed consolidated interim financial statements, which include the accounts of our wholly owned subsidiaries, Acasti Innovations AGPharma U.S., and Acasti Pharma U.S.,Innovations AG, have been prepared in accordance with U.S. GAAP and the rules and regulations of the SEC related to quarterly reports filed on Form 10-Q. All intercompany transactions and balances are eliminated on consolidation.
Our assets as atof September 30, 2022,2023, include cash and cash equivalents and short-term investments totaling $34.9$27.0 million and intangible assets and goodwill totaling $82.8$49.3 million. Our current liabilities total $3.8$1.4 million as atof September 30, 20222023 and are comprised primarily of amounts due to or accrued for creditors.
Comparative Financial Information for the Three and Six Months ended September 30, 2022 and 2021
30
|
| Three months ended |
|
| Six Months ended |
| ||||||||||||||||||
|
| September 30, |
|
| September 30, |
|
| Increase (Decrease) |
|
| September 30, |
|
| September 30, |
|
| Increase (Decrease) |
| ||||||
|
| $ |
|
| $ |
|
| $ |
|
| $ |
|
| $ |
|
| $ |
| ||||||
Net income (loss) |
|
| (4,929 | ) |
|
| 981 |
|
|
| 5,910 |
|
|
| (9,453 | ) |
|
| (2,137 | ) |
|
| 7,316 |
|
Basic and diluted gain (loss) per share |
|
| (0.11 | ) |
|
| 0.03 |
|
|
| 0.14 |
|
|
| (0.21 | ) |
|
| (0.07 | ) |
|
| 0.14 |
|
Total assets |
|
| 120,911 |
|
|
| 119,796 |
|
|
| 1,115 |
|
|
| 120,911 |
|
|
| 119,796 |
|
|
| 1,115 |
|
Working capital1 |
|
| 33,700 |
|
|
| 50,069 |
|
|
| (16,369 | ) |
|
| 33,700 |
|
|
| 50,069 |
|
|
| (16,369 | ) |
Total non-current financial liabilities |
|
| 450 |
|
|
| 1,116 |
|
|
| (666 | ) |
|
| 450 |
|
|
| 1,116 |
|
|
| (666 | ) |
Total shareholders’ equity |
|
| 100,164 |
|
|
| 114,204 |
|
|
| (14,040 | ) |
|
| 100,164 |
|
|
| 114,204 |
|
|
| (14,040 | ) |
|
|
|
|
|
|
|
|
|
|
|
|
|
|
|
|
|
|
| ||||||
1 Working capital is calculated by subtracting current liabilities from current assets. Because there is no standard method endorsed by U.S. GAAP requirements, the results may not be comparable to similar measurements presented by other public companies.
Results of Operations for the Three and Six Monthsmonths ended September 30, 20222023 and 20212022
|
| Three months ended |
| Six Months ended |
|
| Three months ended |
| Six months ended |
| ||||||||||||||||||||||||||||||||||||||
|
| September 30, |
| September 30, |
| Increase (Decrease) |
|
| September 30, |
| September 30, |
| Increase (Decrease) |
|
| September 30, |
| September 30, |
| Increase (Decrease) |
| September 30, |
| September 30, |
| Increase (Decrease) |
| |||||||||||||||||||||
|
| $ |
| $ |
| $ |
| $ |
| $ |
| $ |
|
| $ |
| $ |
| $ |
| $ |
| $ |
| $ |
| ||||||||||||||||||||||
|
|
|
|
|
|
|
|
|
|
|
|
|
|
|
|
|
|
|
|
|
|
|
|
|
|
|
|
|
|
|
|
|
|
|
|
| ||||||||||||
|
|
|
|
|
|
|
|
|
|
|
|
|
|
|
|
|
|
|
|
|
|
|
|
|
|
|
|
|
|
|
|
|
|
|
|
| ||||||||||||
Operating expenses |
|
|
|
|
|
|
|
|
|
|
|
|
|
|
|
|
|
|
|
|
|
|
|
|
|
| ||||||||||||||||||||||
Research and development expenses, net of government assistance |
|
| 3,292 |
|
|
| 585 |
|
|
| 2,707 |
|
|
| 5,882 |
|
|
| 1,054 |
|
|
| 4,828 |
|
|
| 460 |
|
|
| 3,292 |
|
|
| (2,832 | ) |
|
| 1,555 |
|
|
| 5,882 |
|
|
| (4,327 | ) |
General and administrative expenses |
|
| 1,680 |
|
|
| 2,957 |
|
|
| (1,277 | ) |
|
| 3,598 |
|
|
| 5,633 |
|
|
| (2,035 | ) |
|
| 1,589 |
|
|
| 1,680 |
|
|
| (91 | ) |
|
| 3,352 |
|
|
| 3,599 |
|
|
| (247 | ) |
Sales and marketing expenses |
|
| 136 |
|
|
| 25 |
|
|
| 111 |
|
|
| 357 |
|
|
| 25 |
|
|
| 332 |
|
|
| 43 |
|
|
| 136 |
|
|
| (93 | ) |
|
| 154 |
|
|
| 357 |
|
|
| (203 | ) |
Restructuring costs |
|
| — |
|
|
| — |
|
|
| — |
|
|
| 1,485 |
|
|
| — |
|
|
| 1,485 |
| ||||||||||||||||||||||||
Loss from operating activities |
|
| (5,108 | ) |
|
| (3,567 | ) |
|
| 1,541 |
|
|
| (9,837 | ) |
|
| (6,712 | ) |
|
| 3,125 |
|
|
| (2,092 | ) |
|
| (5,108 | ) |
|
| (3,016 | ) |
|
| (6,546 | ) |
|
| (9,838 | ) |
|
| (3,292 | ) |
|
|
|
|
|
|
|
|
|
|
|
|
|
|
|
|
|
|
|
|
|
|
|
|
|
|
|
|
|
|
|
|
|
|
|
|
| ||||||||||||
Financial Income (expense) |
|
| 24 |
|
|
| 4,548 |
|
|
| (4,524 | ) |
|
| (13 | ) |
|
| 4,575 |
|
|
| (4,588 | ) | ||||||||||||||||||||||||
Foreign exchange gain (loss) |
|
| (13 | ) |
|
| (12 | ) |
|
| (1 | ) |
|
| (5 | ) |
|
| (90 | ) |
|
| 85 |
| ||||||||||||||||||||||||
Change in fair value of warrant liabilities |
|
| (1,826 | ) |
|
| — |
|
|
| (1,826 | ) |
|
| (1,826 | ) |
|
| 10 |
|
|
| (1,836 | ) | ||||||||||||||||||||||||
Interest income and other expense |
|
| 212 |
|
|
| 36 |
|
|
| 176 |
|
|
| 346 |
|
|
| 68 |
|
|
| 278 |
| ||||||||||||||||||||||||
Income tax recovery |
|
| 155 |
|
|
| — |
|
|
| 155 |
|
|
| 397 |
|
|
| — |
|
|
| 397 |
|
|
| 446 |
|
|
| 155 |
|
|
| 291 |
|
|
| 735 |
|
|
| 397 |
|
|
| 338 |
|
Net income (loss) |
|
| (4,929 | ) |
|
| 981 |
|
|
| 5,910 |
|
|
| (9,453 | ) |
|
| (2,137 | ) |
|
| 7,316 |
| ||||||||||||||||||||||||
|
|
|
|
|
|
|
|
|
|
|
|
|
|
|
|
|
|
|
|
|
|
|
|
|
|
|
|
|
|
|
| |||||||||||||||||
Net loss |
|
| (3,273 | ) |
|
| (4,929 | ) |
|
| (1,656 | ) |
|
| (7,296 | ) |
|
| (9,453 | ) |
|
| (2,157 | ) | ||||||||||||||||||||||||
|
|
|
|
|
|
|
|
|
|
|
|
|
| |||||||||||||||||||||||||||||||||||
Net Loss
The net loss of $4,929$3,273 or $0.11$0.43 per share for the three months ended September 30, 2022, increased2023 decreased by $5,910$1,656 from the net incomeloss of $981$4,929 or $0.03$0.66 per share for the three months ended September 30, 2021.2022.
The net loss of $9,453$7,296 or $0.21$0.97 per share for the six months ended September 30, 2022, increased2023 decreased by $7,316$2,157 from the net loss of $2,137$9,453 or $0.07$1.28 per share for the six months ended September 30, 2021.2022.
Research and development expenses
Research and development expenses consist primarily of:
We record research and development expenses as incurred.
Our research and development during the three and six months ended September 30, 2022,2023, was focused primarily on our clinical development programs for our GTX-104 GTX-102, and GTX-101 drug candidates, which were acquired in the Grace merger on August 27, 2021.candidate. Research and development expenses during the three and six months ended September 30, 2021 related to2022 were focused primarily on our clinical development programs GTX-104, GTX-102, and GTX-101 drug candidates, which were acquired in the completion of our TRILOGY Phase 3 clinical program for our former drug candidate, CaPre.Grace Therapeutics, Inc. (“Grace”) merger on August 27, 2021.
The following table summarizes our research and development expenses for the periods presented:
31
Research and development expenses |
|
|
|
|
|
|
|
|
|
|
|
|
|
|
|
|
|
| ||||||
|
| Three months |
|
| Six Months ended |
| ||||||||||||||||||
|
| September 30, |
|
| September 30, |
|
| Increase (Decrease) |
|
| September 30, |
|
| September 30, |
|
| Increase (Decrease) |
| ||||||
|
| $ |
|
| $ |
|
| $ |
|
| $ |
|
| $ |
|
| $ |
| ||||||
Third-party contract research expenses: |
|
|
|
|
|
|
|
|
|
|
|
|
|
|
|
|
|
| ||||||
Clinical development programs: |
|
|
|
|
|
|
|
|
|
|
|
|
|
|
|
|
|
| ||||||
GTX-104 |
|
| 116 |
|
|
| 177 |
|
|
| (61 | ) |
|
| 439 |
|
|
| 177 |
|
|
| 262 |
|
GTX-102 |
|
| 17 |
|
|
| — |
|
|
| 17 |
|
|
| 584 |
|
|
| — |
|
|
| 584 |
|
GTX-101 |
|
| 1,606 |
|
|
| — |
|
|
| 1,606 |
|
|
| 2,243 |
|
|
| — |
|
|
| 2,243 |
|
Other third-party contract research expenses |
|
| 456 |
|
|
| 110 |
|
|
| 346 |
|
|
| 610 |
|
|
| 186 |
|
|
| 424 |
|
Professional fees |
|
| 290 |
|
|
| 27 |
|
|
| 263 |
|
|
| 533 |
|
|
| 43 |
|
|
| 490 |
|
Other research and development costs |
|
| 76 |
|
|
| 30 |
|
|
| 46 |
|
|
| 164 |
|
|
| 63 |
|
|
| 101 |
|
Government grants & tax credits |
|
| 109 |
|
|
| (129 | ) |
|
| 238 |
|
|
| (81 | ) |
|
| (129 | ) |
|
| 48 |
|
Total third-party research and development expenses1 |
|
| 2,670 |
|
|
| 215 |
|
|
| 2,455 |
|
|
| 4,492 |
|
|
| 340 |
|
|
| 4,152 |
|
Salaries and benefits |
|
| 472 |
|
|
| 332 |
|
|
| 140 |
|
|
| 961 |
|
|
| 626 |
|
|
| 335 |
|
Stock-based compensation |
|
| 184 |
|
|
| 38 |
|
|
| 146 |
|
|
| 342 |
|
|
| 88 |
|
|
| 254 |
|
Depreciation and write off of equipment |
|
| (34 | ) |
|
| — |
|
|
| (34 | ) |
|
| 87 |
|
|
| — |
|
|
| 87 |
|
Total |
|
| 3,292 |
|
|
| 585 |
|
|
| 2,707 |
|
|
| 5,882 |
|
|
| 1,054 |
|
|
| 4,828 |
|
|
|
|
|
|
|
|
|
|
|
|
|
|
|
|
|
|
|
| ||||||
Research and development expenses |
|
|
|
|
|
|
|
|
|
|
|
|
|
|
|
|
|
| ||||||
| Three months ended |
|
| Six months ended |
| |||||||||||||||||||
| September 30, |
|
| September 30, |
|
| Increase (Decrease) |
|
| September 30, |
|
| September 30, |
|
| Increase (Decrease) |
| |||||||
| $ |
|
| $ |
|
| $ |
|
| $ |
|
| $ |
|
| $ |
| |||||||
Total third-party research and development expenses 1 |
|
| 152 |
|
|
| 2,561 |
|
|
| (2,409 | ) |
|
| 965 |
|
|
| 4,573 |
|
|
| (3,608 | ) |
Government grants & tax credits |
|
| 4 |
|
|
| 109 |
|
|
| (105 | ) |
|
| 55 |
|
|
| (81 | ) |
|
| 136 |
|
Salaries and benefits |
|
| 209 |
|
|
| 472 |
|
|
| (263 | ) |
|
| 435 |
|
|
| 961 |
|
|
| (526 | ) |
Research and development expense before stock-based compensation and depreciation |
|
| 365 |
|
|
| 3,142 |
|
|
| (2,777 | ) |
|
| 1,455 |
|
|
| 5,453 |
|
|
| (3,998 | ) |
Stock-based compensation |
|
| 83 |
|
|
| 184 |
|
|
| (101 | ) |
|
| 83 |
|
|
| 342 |
|
|
| (259 | ) |
Depreciation and write-off of equipment |
|
| 12 |
|
|
| (34 | ) |
|
| 46 |
|
|
| 17 |
|
|
| 87 |
|
|
| (70 | ) |
Total |
|
| 460 |
|
|
| 3,292 |
|
|
| (2,832 | ) |
|
| 1,555 |
|
|
| 5,882 |
|
|
| (4,327 | ) |
|
|
|
|
|
|
|
|
|
|
|
|
|
|
|
|
|
|
| ||||||
1 Total third-party research and development expenses isare calculated before salaries and benefits, depreciation, amortization write offwrite-off of equipment and stock-based compensation. Because there is no standard method endorsed by U.S. GAAP, the results may not be comparable to similar measurements presented by other public companies.
Total third-party research and development expenses before salaries and benefits, depreciation, amortization, write off and stock-based compensation expenses for the three and six months ended September 30, 2022,2023, totaled $2,670$152 and $4,492,$965, respectively, compared to $215$2,561 and $340 for the three and six months ended September 30, 2021. This increase of $2,455 and $4,152, respectively related mostly to the initiation of clinical development programs for GTX 104, GTX 102 and GTX 101.
Third-party contract research expenses related to GTX-104 amounted to $116 and $439,$4,573 for the three and six months ended September 30, 2022, asrespectively. This decrease of $2,409 and $3,608 related mostly to the restructuring to align our PK bridging study progressed. Third party contract research expensesorganizational and management cost structure to prioritize resources to GTX-104 and reduce losses and cash flow. Our clinical development programs for GTX-102, and GTX-101 were de-prioritized in the current year compared to the prior year.
Government grants and tax credits of $17$4 and $584$55 for the three and six months ended September 30, 2023, respectively, decreased by ($105) and increased by $136 compared to $109 and $(81) for the three and six months ended September 30, 2022, for GTX-102respectively. The changes within government grants and tax credits are relateddue to adjustments of provisions regarding the progressionestimated realizability of our CMC Phase 1 workcredits receivable after assessments and correspondence from tax authorities.
Salaries and benefits of $209 and $435 for the manufacturing of clinical trial materials. Third party contract research expenses of $1,606three and $2,243,six months ended September 30, 2023, respectively, decreased by $263 and $526 compared to $472 and $961 for the three and six months ended September 30, 2022, for GTX-101 were mostly relatedrespectively. The decrease relates to a reduction in research and development headcount due to the planning and initiation of the Phase 1 single dose study. Other third-party contract research expenses of $456 and $610 for the three and six months ended September 30, 2022 increased by $346 and $424, respectively from $110 and $610, respectively, for the three and six months ended September 30, 2021, duerestructuring as we prioritize resources to increased IP legal costs to support and maintain our patents that support GTX-104, GTX-102 and GTX-101. Professional fees of $290 and $533 for the three and six months ended September 30, 2022, increased by $263 and $490, respectively from $27 and $43 related to increased specialized consultants supporting our clinical programs for GTX-104, GTX-102 and GTX-101.GTX-104.
For the three months ended September 30, 2022, government grants and tax credits increased total third-party research and development expenses, due to adjustments of prior period provision regarding uncertain tax positions after assessments and correspondence from tax authorities. For the six months ended September 30, 2022, third-party research and development expenses were reduced by $81 related to government credit eligible research activities related to our clinical programs for GTX-104, GTX-102 and GTX-101.
32
Salaries and benefits of $472 and $ 961 for the three and six months ended September 30, 2022, increased by $140 and $335, respectively from $332 and $626 for the three and six months ended September 30, 2021. The increase for both the three and six months periods related to additional R&D headcount since the Grace merger, as well as the renewed accruals for our employee incentive bonus program.
General and administrative expenses
General and administrative expenses consist primarily of salaries and related benefits, including share-based compensation, related to our executive, finance, legal, and support functions, and other general and administrative expenses includeincluding professional fees for auditing, tax, consulting, rent and utilities and insurance.
General and administrative expenses |
|
|
|
|
|
|
|
|
|
|
|
|
|
|
|
|
|
| ||||||
| Three months ended |
|
| Six months ended |
| |||||||||||||||||||
| September 30, |
|
| September 30, |
|
| Increase (Decrease) |
|
| September 30, |
|
| September 30, |
|
| Increase (Decrease) |
| |||||||
| $ |
|
| $ |
|
| $ |
|
| $ |
|
| $ |
|
| $ |
| |||||||
Salaries and benefits |
|
| 228 |
|
|
| 472 |
|
|
| (244 | ) |
|
| 570 |
|
|
| 1,004 |
|
|
| (434 | ) |
Professional fees |
|
| 864 |
|
|
| 434 |
|
|
| 430 |
|
|
| 1,809 |
|
|
| 1,037 |
|
|
| 772 |
|
Other |
|
| 297 |
|
|
| 418 |
|
|
| (121 | ) |
|
| 710 |
|
|
| 874 |
|
|
| (164 | ) |
General and administrative expense before stock-based compensation and depreciation 1 |
|
| 1,389 |
|
|
| 1,324 |
|
|
| 65 |
|
|
| 3,089 |
|
|
| 2,915 |
|
|
| 174 |
|
Stock-based compensation |
|
| 199 |
|
|
| 368 |
|
|
| (169 | ) |
|
| 259 |
|
|
| 650 |
|
|
| (391 | ) |
Depreciation |
|
| 1 |
|
|
| (12 | ) |
|
| 13 |
|
|
| 4 |
|
|
| 34 |
|
|
| (30 | ) |
Total |
|
| 1,589 |
|
|
| 1,680 |
|
|
| (91 | ) |
|
| 3,352 |
|
|
| 3,599 |
|
|
| (247 | ) |
|
|
|
|
|
|
|
|
|
|
|
|
|
|
|
|
|
|
| ||||||
32
General and administrative expenses |
|
|
|
|
|
|
|
|
|
|
|
|
|
|
|
|
|
| ||||||
|
| Three months ended |
|
| Six Months ended |
| ||||||||||||||||||
|
| September 30, |
|
| September 30, |
|
| Increase (Decrease) |
|
| September 30, |
|
| September 30, |
|
| Increase (Decrease) |
| ||||||
|
| $ |
|
| $ |
|
| $ |
|
| $ |
|
| $ |
|
| $ |
| ||||||
Salaries and benefits |
|
| 472 |
|
|
| 276 |
|
|
| 196 |
|
|
| 1,004 |
|
|
| 603 |
|
|
| 401 |
|
Professional fees |
|
| 434 |
|
|
| 2,203 |
|
|
| (1,769 | ) |
|
| 1,037 |
|
|
| 4,144 |
|
|
| (3,107 | ) |
Other |
|
| 418 |
|
|
| 402 |
|
|
| 16 |
|
|
| 873 |
|
|
| 707 |
|
|
| 166 |
|
General and administrative expense before stock-based compensation and depreciation 1 |
|
| 1,324 |
|
|
| 2,881 |
|
|
| (1,557 | ) |
|
| 2,914 |
|
|
| 5,454 |
|
|
| (2,540 | ) |
Stock-based compensation |
|
| 368 |
|
|
| 76 |
|
|
| 292 |
|
|
| 650 |
|
|
| 179 |
|
|
| 471 |
|
Depreciation |
|
| (12 | ) |
|
| — |
|
|
| (12 | ) |
|
| 34 |
|
|
| — |
|
|
| 34 |
|
Total |
|
| 1,680 |
|
|
| 2,957 |
|
|
| (1,277 | ) |
|
| 3,598 |
|
|
| 5,633 |
|
|
| (2,035 | ) |
|
|
|
|
|
|
|
|
|
|
|
|
|
|
|
|
|
|
| ||||||
1 General and administrative sub-total expenses isare calculated before stock-based compensation and depreciation. Because there is no standard method endorsed by U.S. GAAP, the results may not be comparable to similar measurements presented by other public companies.
General and administrative expenses totaled $1,324$1,389 and $2,914$3,089 before stock-based compensation and depreciation expense for the three and six months ended September 30, 2022, a decrease2023, respectively, an increase of $1,557$65 and $2,540, respectively$174 from $2,881$1,324 and $5,454$2,915 for the three and six months ended September 30, 2021.
2022, respectively. The decrease in both the three and six months periods wereincrease was primarily a result of decreasedincrease legal, tax, accounting and other professional fees related to the Grace merger. The decrease in professional fees was partiallyrestructuring offset by an increase indecreased salaries and benefits due to a reduction in general and administrative headcount due to our restructuring and reorganization of our management structure. Stock-based compensation of $199 and $259 for the renewed accrualthree and six months ended September 30, 2023, respectively, decreased by $169 and $391 compared to $368 and $650 for the three and six months ended September 30, 2022, respectively. The decrease relates to a reduction in general and administrative headcount due to our employee incentive bonus program.restructuring and reorganization of our management structure.
Sales and marketing expenses
Sales and marketing expenses consist primarily of salaries and benefits, including share-based compensation, related to our commercial functions.
Sales and marketing expenses |
|
|
|
|
|
|
|
|
|
|
|
|
|
|
|
|
|
|
|
|
|
|
|
|
|
|
|
|
|
|
|
|
|
|
|
| ||||||||||||
|
| Three months ended |
|
| Six Months ended |
|
| Three months ended |
|
| Six months ended |
| ||||||||||||||||||||||||||||||||||||
|
| September 30, |
|
| September 30, |
|
| Increase (Decrease) |
|
| September 30, |
|
| September 30, |
|
| Increase (Decrease) |
|
| September 30, |
|
| September 30, |
|
| Increase (Decrease) |
|
| September 30, |
|
| September 30, |
|
| Increase (Decrease) |
| ||||||||||||
|
| $ |
|
| $ |
|
| $ |
|
| $ |
|
| $ |
|
| $ |
|
| $ |
|
| $ |
|
| $ |
|
| $ |
|
| $ |
|
| $ |
| ||||||||||||
Salaries and benefits |
|
| 99 |
|
|
| 25 |
|
|
| 74 |
|
|
| 281 |
|
|
| 25 |
|
|
| 256 |
|
|
| — |
|
|
| 99 |
|
|
| (99 | ) |
|
| 15 |
|
|
| 281 |
|
|
| (266 | ) |
Professional fees |
|
| 4 |
|
|
| — |
|
|
| 4 |
|
|
| 9 |
|
|
| — |
|
|
| 9 |
|
|
| — |
|
|
| 4 |
|
|
| (4 | ) |
|
| 20 |
|
|
| 9 |
|
|
| 11 |
|
Other |
|
| 3 |
|
|
| — |
|
|
| 3 |
|
|
| 13 |
|
|
| — |
|
|
| 13 |
|
|
| 43 |
|
|
| 3 |
|
|
| 40 |
|
|
| 103 |
|
|
| 13 |
|
|
| 90 |
|
Sub-total |
|
| 106 |
|
|
| 25 |
|
|
| 81 |
|
|
| 303 |
|
|
| 25 |
|
|
| 278 |
| ||||||||||||||||||||||||
Sales and Marketing expenses before stock-based compensation1 |
|
| 43 |
|
|
| 106 |
|
|
| (63 | ) |
|
| 138 |
|
|
| 303 |
|
|
| (165 | ) | ||||||||||||||||||||||||
Stock-based compensation |
|
| 30 |
|
|
| — |
|
|
| 30 |
|
|
| 54 |
|
|
| — |
|
|
| 54 |
|
|
| — |
|
|
| 30 |
|
|
| (30 | ) |
|
| 16 |
|
|
| 54 |
|
|
| (38 | ) |
Total |
|
| 136 |
|
|
| 25 |
|
|
| 111 |
|
|
| 357 |
|
|
| 25 |
|
|
| 332 |
|
|
| 43 |
|
|
| 136 |
|
|
| (93 | ) |
|
| 154 |
|
|
| 357 |
|
|
| (203 | ) |
|
|
|
|
|
|
|
|
|
|
|
|
|
|
|
|
|
|
|
|
|
|
|
|
|
|
| ||||||||||||||||||||||
1 Sales and marketing sub-total expenses isare calculated before stock-based compensation. Because there is no standard method endorsed by U.S. GAAP, the results may not be comparable to similar measurements presented by other public companies.
Sales and marketing expenses before stock-based compensation expense totaled $43 and $138 for the three and six months ended September 30, 2023, respectively, compared to $106 and $303 for the three and six months ended September 30, 2022, comparedrespectively. The decrease of $63 and $165, was mostly due to $25the reduction of headcount due to our restructuring and reorganization of our management structure.
33
Stock-based compensation of nil and $16 for the three and six months ended September 30, 2021. The increase of $812023, decreased by $30 and $278,$38, respectively, was mostly duecompared to an increase in salaries associated with added personnel.
Aggregate stock-based compensation expense increased by $468 to $1,046$30 and $54 for the three and six months ended September 30, 2022, respectively. The decrease relates to a reduction in sales and marketing headcount due to our restructuring and reorganization of our management structure.
Restructuring Costs
On May 8, 2023, we announced our decision to terminate a substantial amount of our workforce as comparedpart of a plan that intended to $267align our organizational and management cost structure to prioritize resources to GTX-104 and reduce losses to improve cash flow and extend available cash resources. We incurred $1,485 of cost primarily consisting of employee severance costs.
Change in fair value of warrant liabilities
Change in fair value of warrant liabilities for the three and six months ended September 30, 2021. This2023 increased by $1,826 mainly attributable to an increase was due to the timing of the stock options granted during the year ended March 31, 2022, and year ended March 31, 2021, as well as the new grants in the current fiscal period.fair value of derivative warrant liabilities.
Aggregate depreciationInterest income and other expense increased by $106
Interest income was $212 and $346 for the three and six months ended September 30, 2023, respectively, compared to $36 and $68 for the three and six months ended September 30, 2022, from nil for the six months ended September 30, 2021. Thisrespectively. The increase isin our interest income was due to the impacthigher interest rates earned on average balances of certain equipment being reclassified from held for sale to held for use during the six months ended September 30, 2022, resulting in additional depreciation being recognized.cash, cash equivalents and short-term investments.
Liquidity and Capital Resources
Share Capital Structurecapital structure
Our authorized share capital consists of an unlimited number of Class A, Class B, Class C, Class D and Class E common shares, without par value. Issued and outstanding fully paid shares, stock options, and warrants, were as follows for the periods indicated (after giving effect to our 8:1 share consolidation,the Reverse Stock Split, which became effective on August 31, 2021)July 10, 2023):
| September 30, |
|
| March 31, |
| |||
|
| Number |
|
| Number |
| ||
Class A common shares, voting, participating and without par value |
|
| 9,399,404 |
|
|
| 7,435,533 |
|
Stock options granted and outstanding |
|
| 561,365 |
|
|
| 740,957 |
|
September 2023 US private offering pre-funded warrants |
|
| 2,106,853 |
|
|
| — |
|
September 2023 US private offering warrants |
|
| 2,536,391 |
|
|
| — |
|
May 2018 Canadian public offering of warrants exercisable at CAD$62.88 until May 9, 2023 |
|
| — |
|
|
| 137,370 |
|
|
|
|
|
|
|
| ||
Total fully diluted shares |
|
| 14,604,013 |
|
|
| 8,313,860 |
|
33Cash flows and financial condition for the six months ended September 30, 2023 and 2022
Summary
We do not expect to generate revenue from product sales unless and until we successfully complete drug development and obtain regulatory approval, which we expect will take several years and is subject to significant uncertainty. To date, we have financed our operations primarily through public offerings and private placements of our Common Shares, warrants and convertible debt and with the proceeds from research tax credits. Until such time that we can generate significant revenue from drug product sales, if ever, we will require additional financing, which we expect to be sourced from a combination of public or private equity offerings or debt financings or other non-dilutive sources, which may include fees, milestone payments and royalties from collaborations with third parties.
As of September 30, 2023, cash and cash equivalents totaled $26,991, a decrease of $884 compared to cash and cash equivalents totaling $27,875 at March 31, 2023 primarily due to ongoing research and development activities, and funding the restructuring expense offset by the proceeds of our September 2023 Offering.
34
|
| September 30, |
|
| March 31, |
| ||
|
| Number |
|
| Number |
| ||
Class A shares, voting, participating and without par value |
|
| 44,494,193 |
|
|
| 44,288,183 |
|
Stock options granted and outstanding |
|
| 4,445,844 |
|
|
| 2,989,381 |
|
May 2018 Canadian public offering of warrants exercisable at CAD$10.48 until May 9, 2023 |
|
| 824,218 |
|
|
| 824,218 |
|
December 2017 U.S. public offering of warrants exercisable at US$10.08 until December 19, 2022 |
|
| 884,120 |
|
|
| 884,120 |
|
December 2017 U.S. public offering broker warrants exercisable at US$10.10 until December 27, 2022 |
|
| 32,390 |
|
|
| 32,390 |
|
|
|
|
|
|
|
| ||
Total fully diluted shares |
|
| 50,680,765 |
|
|
| 49,018,292 |
|
Cash Flows and Financial ConditionNet cash used in operating activities
Net cash used in operating activities for the six months ended September 30, 2023 was $8,353, compared to $8,865 for the six months ended September 30, 2022, and 2021
Summary
As ata decrease of $512. Cash used in operating activities during the six months ended September 30, 2022, cash2023 primarily related to our net loss of $7,296, adjusted for non-cash items such as stock-based compensation of $358, change in fair value of warrant liabilities of $1,826, income tax recovery of $(735) and cash equivalents totaled $34,926, a net increasechanges in our operating assets and liabilities of $4,587 compared to cash and cash equivalents totaling $30,339 at March 31, 2022.
Net cash used in operation activities
$(2,489). Net cash used in operating activities for the six months ended September 30, 2022, was $8,865, compared to $9,505 for the same period in 2021, a decrease of $640.$8,865. Cash used in operating activities during 2022 primarily related to our net loss of $9,453, adjusted for non-cash items such as stock-based compensation of $1,046, income tax recovery of $397 and changes in our operating assets and liabilities of $137. Cash used in operating activities during 2021 primarily related to our net loss of $2,137, adjusted for non-cash items such as change in fair value of warrant liabilities of $4,080, unrealized foreign exchange gain of $420 and changes in our operating assets and liabilities of $3,135.$(137).
Net cash used inprovided by investing activities
Net cash provided by investing activities for the six months ended September 30, 2023, was $110 related to our sale of equipment. For the six months ended September 30, 2022, our investing activities generated cash of $13,162, compared to cash used of $4,090 for the six months ended September 30, 2021. The increase in cash generatedwhich was a function of an increase in proceeds from maturity of short-term investments.
Net cash used inprovided by financing activities
Net cash provided by financing activities for the six months ended September 30, 2022,2023, totaled $304$7,359 compared to cash generated of nil$304 during the six months ended September 30, 2021,2022 due to net proceeds from the saleour September 2023 Offering of common shares under our ATM program.$7,338.
ATM programPrivate Placement
On September 24, 2023, we entered into the Purchase Agreement with certain institutional and accredited investors in connection with the Offering. Pursuant to the Purchase Agreement, we agreed to offer and sell in the Offering 1,951,371 Common Shares, at a purchase price of $1.848 per Common Share and Pre-funded Warrants to purchase up to 2,106,853 Pre-funded Warrant Shares at a purchase price equal to the purchase price per Common Share less $0.0001. Each Pre-funded Warrant is exercisable for one Pre-funded Warrant Share at an exercise price of $0.0001 per Pre-funded Warrant Share, is immediately exercisable and will expire once exercised in full. Pursuant to the Purchase Agreement, we also issued to such institutional and accredited Common Warrants to purchase Common Shares, exercisable for an aggregate of 2,536,391 Common Warrant Shares. Under the terms of the Purchase Agreement, for each Common Share and each Pre-funded Warrant issued in the Offering, an accompanying five-eighths (0.625) of a Common Warrant was issued to the purchaser thereof. Each whole Common Warrant is exercisable for one Common Warrant Share at an exercise price of $3.003 per Common Warrant Share, is immediately exercisable and will expire on the earlier of (i) the 60th day after the date of the acceptance by the U.S. Food and Drug Administration of a New Drug Application for our product candidate GTX-104 or (ii) five years from the date of issuance. The Common Warrants were offered and sold at a purchase price of $0.125 per whole underlying Common Warrant Share, which purchase price was included in the offering price per Common Share and Pre-funded Warrant issued in the Offering.
The Offering closed on September 25, 2023. The net proceeds to us from the Offering was approximately $7.3 million, after deducting fees and expenses.
At-the-Market (“ATM”) program
On June 29, 2020, we entered into an amended and restated sales agreement (the “Sales Agreement”) with B. Riley, Oppenheimer & Co. Inc. and H.C. Wainwright & Co., LLC (collectively, the “Agents”). Under the terms of the Sales Agreement, which hashad a three-year term, we maycould issue and sell from time-to-time common sharesCommon Shares having an aggregate offering price of up to $75,000,000$75 million through the Agents. Subject to the terms and conditions of the Sales Agreement, the Agents willwould use their commercially reasonable efforts to sell the common sharesCommon Shares from time to time, based upon our instructions. We havehad no obligation to sell any of the common sharesCommon Shares and maycould, at any time, suspend sales under the Sales Agreement. We and the Agents maycould terminate the Sales Agreement in accordance with its terms. Under the terms of the Sales Agreement, we have provided the Agents with customary indemnification rights and the Agents will bewere entitled to compensation at a commission rate equal to 3.0% of the gross proceeds from each sale of the common shares.Common Shares. The Sales Agreement expired pursuant to its terms on June 29, 2023. We intend to examine our financing strategies on a go-forward basis and may consider entering into a new ATM program in the future.
On November 10, 2021, we filed a prospectus supplement relating to our ATM program to restore available capacity to $75,000,000, with B. Riley, Oppenheimer & Co. Inc. and H.C. Wainwright & Co., LLC continuing to act as Agents. Under the terms of the Sales Agreement and the prospectus supplement, we may issue and sell from time-to-time common shares having an aggregate offering price of up to $75,000,000 through the Agents. The common shares will be distributed at market prices prevailing at the time of the sale and, as a result, prices may vary between purchasers and during the period of distribution. The volume and timing of sales under the ATM program, if any, will be determined at the sole discretion of our board of directors and management.
During the six months ended September 30, 2022, 324,648 common shares2023, no Common Shares were sold under the ATM Programprogram. During the six months ended September 30, 2022, 54,108 Common Shares were sold for total net proceeds of approximately $304.$304 with commissions, legal expenses and costs related to the share sale amounting to $10. The common sharesCommon Shares were sold at the prevailing market prices, which resulted in an average price of approximately $0.95$5.70 per share.
35
Financial Positionposition
The following table details the significant changes to the statementsour consolidated balance sheets as of financial position as at September 30, 2022,2023, compared to the prior fiscal year end at March 31, 2022:2023:
34
Accounts | Increase | Comments | ||||||
Cash and cash equivalents |
| (884 | ) | See cash flow statement | ||||
|
|
|
| |||||
Receivables |
| 35 | Timing of reimbursement of sales taxes | |||||
Prepaid expenses |
| 446 | Renewal of insurance contract and other prepaid expenses (advances to US vendors) | |||||
Right of use asset |
| (416 | ) | Adjustment to the net present value of lease contract for Sherbrooke due to lease modification | ||||
Equipment | ( | ) | Depreciation of equipment | |||||
Trade and other payables |
| (1,985 | ) | Timing of payments net of accruals | ||||
Lease liability |
| (439 |
| Adjustment to the net present value of lease | ||||
Derivative warrant liabilities |
|
| 3,457 |
| Issuance of warrants in relation to Purchase Agreement and change in fair value of | |||
Deferred tax liability | ( | ) | Related to | |||||
See the statementconsolidated statements of changes inshareholders' equity in our financial statements for details of changes to theour equity accounts during the three and six months ended September 30, 20222023 and 2021.2022.
Treasury Operations
Our treasury policy is to invest cash that is not required immediately into instruments with an investment strategy based on capital preservation. Cash equivalents and marketable securities are primarily made in guaranteed investment certificates, term deposits and high-interest savings accounts, which are issued and held with Canadian chartered banks, highly rated promissory notes issued by government bodies and commercial paper. We hold cash denominated in both U.S. and CADCanadian dollars. Funds received in U.S. dollars from equity financings are invested as per our treasury policy in U.S. dollar investments and converted to CADCanadian dollars as appropriate to fulfill operational requirements and funding.
Intangible assetsAssets
On August 27, 2021, we completed the acquisition of all outstanding equity interests in Grace Therapeutics Inc, via a merger. Grace, based in New Jersey and organized under the laws of Delaware, was a rare and orphan disease specialty pharmaceutical company.
In connection with the share-for-share noncash transaction, Grace was merged with a new wholly owned subsidiary of Acasti and became a subsidiary of Acasti. As a result, we acquired Grace’s entire therapeutic pipeline consisting of three unique clinical stage and multiple pre-clinical stage assets supported by an intellectual property portfolio consisting of various granted and pending patents in various jurisdictions worldwide. Under the terms of the acquisition, each issued and outstanding share of Grace common stock was automatically converted into the right to receive Acasti common sharesCommon Shares equal to the equity exchange ratio set forth in the merger agreement.
Intangible assets of $69,810 relate to the value of in-process research and development (“IPR&D,&D”), related to Grace’s therapeutic pipeline, consisting of three unique clinical stage programs/assets supported by intellectual property, the value of which has been attributed as follows:
|
| $ | $ | $ | $ |
|
| GTX-104 | GTX-102 | GTX-101 | Total |
Intangible assets – in-process research and development |
|
|
|
|
|
Balance, April 1, 2022 |
| 27,595 | 31,908 | 10,307 | 69,810 |
Impairment |
| — | (22,712) | (5,970) | (28,682) |
Balance, March 31, 2023 |
| 27,595 | 9,196 | 4,337 | 41,128 |
|
| $ | $ | $ | $ |
|
| GTX-104 | GTX-102 | GTX-101 | Total |
Intangible assets – in-process research and development |
|
|
|
|
|
Balance, April 1, 2023 |
| 27,595 | 9,196 | 4,337 | 41,128 |
Impairment |
| — | — | — | — |
Balance, September 30, 2023 |
| 27,595 | 9,196 | 4,337 | 41,128 |
36
| ||||
| ||||
|
| |||
|
| |||
|
| |||
|
| |||
Assets Held for Sale
In April 2023, we announced the strategic decision to prioritize development of GTX-104 with a goal to advance to commercialization, while conserving resources as much as possible to complete development efficiently. We determinedestimate that the deferral of the GTX-102 and GTX-101 clinical programs could be at least three years given the timeline to actively market for sale Other assets and Production equipment and have met the criteria for classification of assets held for sale:
|
| September 30, |
|
| March 31, |
| ||
|
|
|
|
| Reclassed as explained below |
| ||
|
| $ |
|
| $ |
| ||
Other assets (a) |
|
| 195 |
|
|
| 195 |
|
Production equipment (b) |
|
| 157 |
|
|
| 157 |
|
|
|
| 352 |
|
|
| 352 |
|
Other assets
Other assets represent krill oil (“RKO”) held by us that was expected to be used in commercial inventory scale up related tocomplete the development and commercializationpotential commercial launch of GTX-104. Further development of GTX-102 and GTX-101 will occur at such time as we obtain additional funding or enter into strategic partnerships for license or sale with third parties. The decision to defer further development triggered a comprehensive impairment review of our intangible assets in March 2023. Given the extended timeline, we increased the discount rates used to value the assets in order to recognize additional risks related to prioritizing one asset over the others, financing the projects given limited available resources and the need to preserve cash to advance GTX-104 as far as possible, potential competitor advances that could arise over three years, and the general market depression affecting small cap development companies like us and the prohibitively high dilution and expense of available funding in the capital markets. Increasing the discount rates significantly reduced the discounted cash flow values for each of the CaPre drug candidate. Given that the developmentprograms deferred. Accordingly, an impairment of CaPre will no longer be pursued by us, we expect to sell this reserve. The Otherintangible assets is being recorded at the fair value less cost to sell. Management’s estimate of the fair value of the RKO less cost to sell was based primarily on estimated market prices obtained from an appraiser specializing$28,682 resulted in the krill oil market. These projections are based on Level 3 inputsyear ended March 31, 2023. In addition, an impairment of the fair value hierarchy and reflect management’s best estimate$4,826 of market participants’ pricing of the assets as well as the general condition of the asset.
35
Production equipment
September 30, 2022 |
| Cost, net of |
|
| Accumulated |
|
| Net book |
| |||
|
| $ |
|
| $ |
|
| $ |
| |||
Production equipment |
|
| 1,179 |
|
|
| (1,022 | ) |
|
| 157 |
|
|
|
| 1,179 |
|
|
| (1,022 | ) |
|
| 157 |
|
The announcement of the discontinuation of the CaPre programgoodwill resulted in an impairment trigger for the related laboratory and production equipment. The impairment loss is based on management’s estimate of the fair value of the equipment less cost to sell, which is based primarily on estimated market prices obtained from brokers specializedyear ended March 31, 2023. We determined there was no triggering event in selling used equipment. These projections are based on Level 3 inputs of the fair value hierarchy and reflect our best estimate of market participants’ pricing of the assets as well as the general condition of the assets.
During the six months ended September 30, 2022, we reclassed the following assets from assets held for sale as they no longer met the criteria of such classification.2023 that would have required us to perform a quantitative impairment test.
|
| Cost, net of |
|
| Accumulated |
|
| Net |
| |||
|
| $ |
|
| $ |
|
| $ |
| |||
Furniture and office equipment |
|
| 17 |
|
|
| (5 | ) |
|
| 12 |
|
Computer equipment |
|
| 94 |
|
|
| (6 | ) |
|
| 88 |
|
Laboratory equipment |
|
| 585 |
|
|
| (435 | ) |
|
| 150 |
|
|
|
| 696 |
|
|
| (446 | ) |
|
| 250 |
|
Furthermore, depreciation expense of $106 was recognized related to the period from the date that the assets were classified as held for sale until the end of the current period. The reclassification from held for sale to equipment was reflected on the comparative balance sheet. .
Contractual Obligations and Commitments
A summary of theOur contractual obligations at September 30, 2022, isand commitments include trade payables, operating lease obligations, CMO and CRO agreements, and the raw krill oil supply agreement, as follows:described below.
Contractual Obligations |
| Total |
|
| Less than |
|
| 1 to 3 years |
|
| More than |
| ||||
|
| $ |
|
| $ |
|
| $ |
|
| $ |
| ||||
Trade and other payables |
|
| 3,735 |
|
|
| 3,735 |
|
|
| — |
|
|
| — |
|
Operating lease obligations |
|
| 529,734 |
|
|
| 89,288 |
|
|
| 187,787 |
|
|
| 252,659 |
|
RKO supply agreement |
|
| 2,800 |
|
|
| 2,800 |
|
|
| — |
|
|
| — |
|
|
|
|
|
|
|
|
|
|
|
|
|
| ||||
Total |
|
| 536,269 |
|
|
| 95,823 |
|
|
| 187,787 |
|
|
| 252,659 |
|
Research and development contracts and contract research organizations agreements:
We utilize contract manufacturing organizations,CMOs, for the development and production of clinical materials and contract research organizationsCROs to perform services related to our clinical trials. Pursuant to the agreements with these contract manufacturing organizationsCMOs and contract research organizations,CROs, we have either the right to terminate the agreements without penalties or under certain penalty conditions. As of September 30, 2023, we have no commitments from CMOs and approximately $8,500 of commitments for the next twelve months to CROs.
RKORaw krill oil supply agreementcontract
On October 25, 2019, we signed a supply agreement with Aker Biomarine Antarctic.BioMarine Antarctic AS. (“Aker”AKBM”) to purchase raw krill oil product for a committed volume of commercial starting material for CaPre, one of our former drug candidates, for a total fixed value of $3.1 million.million based on the value of krill oil at that time. As at September 30,of March 31, 2022, the remaining balance of the commitment with Aker amountsamounted to $2.8 million. During the second calendar quarter of 2022, AkerAKBM informed the Companyus that AkerAKBM believed it had satisfied the terms of the supply agreement as to their abilityobligation to deliver the remaining balance of raw krill oil product, and that the Company waswe were therefore required to accept the remaining product commitment and to pay Aker the $2.8 million balance.commitment. We disagreedisagreed with Aker’sAKBM’s position and believebelieved that Aker isAKBM was not entitled to further payment under the supply agreement. Accordingly, no liability has been recorded.was recorded by us. The dispute wasremained unresolved as of September 30, 2022both March 31, 2023 and remains unresolved. There is uncertainty as2022. On October 18, 2023, we entered into a settlement agreement with AKBM to whethersettle any and all potential claims regarding amounts due under the Company will be requiredsupply agreement. Pursuant to make further paymentthe terms of the settlement agreement, in exchange for a release and waiver of claims arising out of the supply agreement by AKBM and any of AKBM’s affiliates, we agreed to Akerthe following: (a) AKBM retained ownership of all raw krill oil product, including amounts previously delivered to us, (b) AKBM acquired and took ownership of all production equipment related to the production of CaPre, (c) AKBM acquired and took ownership of all data from research, clinical trials and pre-clinical studies with respect to CaPre, and (d) AKBM acquired and took ownership over all rights, title and interest in and to all intellectual property rights related to CaPre owned by us, including all patents and trademarks. Pursuant to the terms of the settlement agreement, AKBM acknowledged that the CaPre assets were transferred on an “as is” basis, and in connection therewith we disclaimed all representations and warranties in connection with the dispute. Additionally, in the event the Company is requiredCaPre assets, including any representations with respect to accept delivery from Akerperformance or sufficiency. The value of the remaining balance ofraw krill oil product underpreviously delivered to us, the supply agreement, there is uncertaintyproduction equipment and the intellectual property rights related to CaPre were fully impaired in prior reporting periods and had a carrying value of nil as to whether the Company can recover value from the product, which may result in the Corporation incurring a loss on the supply agreement in the near term.of March 31, 2023. As of September 30, 2023, no liability was recorded.
Contingencies
We evaluate contingencies on an ongoing basis and establish loss provisions for matters in which losses are probable and the amount of the loss can be reasonably estimated.
3637
Off-Balance Sheet Arrangements
As of the date of this quarterly report, we do not have any off-balance sheet arrangements that have or are reasonably likely to have a current or future effect on our financial condition, changes in financial condition, revenues or expenses, results of operations, liquidity, capital expenditures or capital resources that are material to investors, except for the RKO supply agreement.
Use of Estimates and Measurement of Uncertainty
The preparation of ourthese financial statements in conformity with U.S. GAAP requires management to make estimates and assumptions that affect the reported amounts of assets, liabilities, income, and expenses. Actual results may differ from these estimates.
Estimates are based on management’s best knowledge of current events and actions that management may undertake in the future. Estimates and underlying assumptions are reviewed on an ongoing basis. Revisions to accounting estimates are recognized in the period in which the estimates are revised and in any future periods affected.
Estimates and assumptions include the measurement of stock-based compensation, derivative warrant liabilities, stock-based compensation, assets heldaccruals for sale, acquisition of Graceresearch and development contracts and contract organization agreements, and valuation of intangibles goodwill and RKO supply agreement.goodwill. Estimates and assumptions are also involved in measuring the accrual of services rendered with respect to research and development expenditures at each reporting date and determining which research and development expenses qualify for research and development tax credits and in what amounts. We recognizeThe Corporation recognizes the tax credits once we haveit has reasonable assurance that they will be realized. Recorded tax credits are subject to review and approval by tax authorities and, therefore, could be different from the amounts recorded. Estimates and assumptions are also utilized in the assessment of impairment of deferred financing costs, equipment, and intangibles.
Critical Accounting Policies
Valuation of Intangible Assets and GoodwillDuring the six months ended September 30, 2023, there were no material changes to our critical accounting policies from those described in our Annual Report for the year ended March 31, 2023.
In a business combination, the fair value of IPR&D acquired is capitalized and accounted for as indefinite-lived intangible assets, and not amortized until the underlying project receives regulatory approval, at which point the intangible assets will be accounted for as definite-lived intangible assets or discontinued. If discontinued, the intangible assets will be written off. R&D costs incurred after the acquisition are expensed as incurred.
Our IPR&D and Goodwill was $82.8 million as of September 30, 2022, which represents 68% of total assets. Goodwill and indefinite-lived assets are not amortized but are subject to an impairment review annually and more frequently when indicators of impairment exist. An impairment of goodwill could occur if the carrying amount of a reporting unit exceeds the fair value of that reporting unit. An impairment of indefinite-lived intangible assets would occur if the fair value of the intangible asset is less than the carrying value.
We test goodwill for impairment by first assessing qualitative factors to determine whether it is more likely than not that the fair value is less than its carrying amount. If we conclude it is more likely than not that fair value of the reporting unit is less than its carrying amount, a quantitative impairment test is performed. We test indefinite lived intangible assets for impairment by first assessing qualitative factors to determine whether it is more likely than not that the fair value is less than its carrying amount.
If we conclude it is more likely than not that the fair value is less than its carrying amount, a quantitative impairment test is performed. We reviewed Goodwill and our IPR&D assets for impairment on the anniversary of acquisition of August 27, 2022. We performed a quantitative assessment of our three individual projects. The estimated fair values of identifiable intangible assets were determined using the multi-period excess earnings method, which is a valuation methodology that provides an estimate of the fair value of an asset based on market participant expectations of the cash flows an asset would generate over its remaining useful life. The projected discounted cash flow models used to estimate the fair value of assets of our IPR&D reflect significant assumptions and are level 3 unobservable data regarding the estimates a market participant would make in order to evaluate a drug development asset, including the following:
The projected discounted cash flow model used to estimate the fair value of our reporting unit includes a significant assumption related to each projects probability of clinical success, which is reflected in the cash flows. Based on our fair value assessment a possible impairment loss would result if the probability of success assumptions decreased more than approximately 7% for each year and each project, all other assumptions remaining constant.
The following table depicts as at the impairment assessment date, the discount rate used in the fair value model and the discount rate in which an impairment loss would occur.
Discount assumption |
| GTX 101 | GTX 104 | GTX 102 |
|
|
|
|
|
Discount rate used in fair value model |
| 22.8% | 24.8% | 21.5% |
Discount rate that results in possible impairment |
| > 24% | > 26.6% | > 21.7% |
The valuation of our IPR&D has significant measurement uncertainty given the risks and uncertainties associated with the timely and successful completion of the development and commercialization of product candidates. We engaged a third party valuation firm to assist us with the valuation of the IPR&D and goodwill. Assumptions are difficult to make accurately and were mainly derived from life science studies, industry data, and peer company information that
37
our management believes represent appropriate comparable data. Estimates of value are required to be discounted to account for risks related to the inherent uncertainties of the overall development and commercialization processes.
A quantitative assessment involves comparing the carrying values, including goodwill, to its estimated fair value. The projected discounted cash flow model used to estimate the fair value of our reporting unit includes an assumption related to our discount rate which reflects our weighted average cost of capital. The discount we used was 23.3% and if it were greater than 24.9% a possible impairment loss would occur of goodwill.
The summation of our Goodwill and IPR&D fair values, as indicated by our discounted cash flow calculations, were compared to our consolidated fair value, as indicated by our market capitalization, to evaluate the reasonableness of our calculations. We validated the control premium effect through identification of recent public market information of comparable peer acquisition transactions. The selection of comparable peer acquisition transactions are subject to judgment and uncertainty. The impairment assessment is sensitive to changes in forecasted cash flows, our selected discount rate as well as the implied control premiums. Changes to our results, forecast assumptions and estimates could materially affect the estimation of the fair value.
The result of our quantitative assessment indicated that there is no impairment.
Measurement of Assets Held for Sale and RKO Supply Agreement
Assets that are classified as held for sale are measured at the lower of their carrying amount or fair value less expected selling costs (“estimated selling price”) with a loss recognized to the extent that the carrying amount exceeds the estimated selling price. The classification is applicable at the date upon which the sale of assets is probable, and the assets are available for immediate sale in their present condition. Assets, once classified as held for sale, are not subject to depreciation or amortization and both the assets and any liabilities directly associated with the assets held for sale are classified as current in our consolidated balance sheets. Subsequent changes to the estimated selling price of assets held for sale are recorded as gains or losses to the consolidated statements of income wherein the recognition of subsequent gains is limited to the cumulative loss previously recognized.
In addition, there is judgement and potential for loss regarding the recognition and measurement of our RKO supply agreement with Aker to purchase raw krill oil product for a committed volume of commercial starting material for CaPre for a total fixed value of $3.1 million, which is described in more detail in note 12 of our financial statements found elsewhere in this quarterly report.
Financial Instruments
Credit Risk
Credit risk is the risk of a loss if a customer or counterparty to a financial asset fails to meet its contractual obligations. We have credit risk relating to cash, cash equivalents and short term investments, which we manage by dealing only with highly rated financial institutions. The carrying amount of financial assets, as disclosed in the statements of financial position, represents our credit exposure at the reporting date.
Currency Risk
We are exposed to the financial risk related to the fluctuation of foreign exchange rates and the degrees of volatility of those rates. Foreign currency risk is limited to the portion of our business transactions denominated in currencies other than our functional currency. On April 1, 2022, our functional currency was changed from the Canadian dollar to the US dollar. This change is reflected prospectively in our financial statements.
Fluctuations related to foreign exchange rates could cause unforeseen fluctuations in our operating results.
Since April 1, 2022, a portion of our expenses, mainly related to research contracts is incurred in Canadian dollars and in Euros, for which no financial hedging is in place.
There is a financial risk related to the fluctuation in the value of the Canadian dollar and the Euro in relation to the U.S. dollar. In order to minimize the financial risk related to the fluctuation in the value of the Canadian dollar in relation to the U.S. dollar, funds continue to be invested as cash and cash equivalents and short-term investments in the Canadian dollar.
The following table provides an indication of our significant foreign exchange currency exposures from functional currency at the following dates:
|
| September 30, 2022 | September 30, 2021 |
| ||||||||||
|
| US |
| Euro |
|
| CAD |
| Euro |
| ||||
|
|
|
|
|
|
|
|
|
|
| ||||
Cash and cash equivalents |
|
| 1,845 |
|
| — |
|
|
| 42,127 |
|
| — |
|
Investments |
|
| 14 |
|
| — |
|
|
| 15,747 |
|
| — |
|
Trade and other payables |
|
| (593 | ) |
| (102 | ) |
|
| (4,236 | ) |
| — |
|
|
|
| 1,266 |
|
| (102 | ) |
|
| 53,638 |
|
| — |
|
The following exchange rates are those applicable to the following periods and dates:
|
| September 30, 2022 |
|
| September 30, 2021 |
| ||||||||||
|
| Average |
|
| Reporting |
|
| Average |
|
| Reporting |
| ||||
|
|
|
|
|
|
|
|
|
|
|
|
| ||||
US$ per CAD (2021 - CAD per US $) |
|
| 0.7658 |
|
|
| 0.7231 |
|
|
| 1.2579 |
|
|
| 1.2680 |
|
USD$ per Euro |
|
| 1.0355 |
|
|
| 0.9802 |
|
|
| 1.4852 |
|
|
| 1.4683 |
|
38
Based on our foreign currency exposures noted above, varying the above foreign exchange rates to reflect a 5% strengthening of the Canadian dollar and Euro would have an increase (decrease) in net loss as follows, assuming that all other variables remain constant:
| ||||
| ||||
|
| |||
Based on our foreign currency exposures noted above, varying the above foreign exchange rates to reflect a 5% strengthening of the U.S. dollar and Euro would have an increase (decrease) in net loss as follows, assuming that all other variables remain constant:
| ||||
| ||||
|
| |||
An assumed 5% weakening of the foreign currencies would have an equal but opposite effect on the basis that all other variables remained constant.
Interest Rate Risk
Interest rate risk is the risk that the fair value or future cash flows of a financial instrument will fluctuate because of changes in market rates. Our exposure to interest rate risk as at September 30, 2022 and 2021 was as follows:
|
| |
|
|
Our capacity to reinvest the short-term amounts with equivalent return will be impacted by variations in short-term fixed interest rates available on the market. Management believes the risk we will realize a loss as a result of the decline in the fair value of our short-term investments is limited because these investments have short-term maturities and are held to maturity.
Liquidity Risk
Liquidity risk is the risk that we will not be able to meet our financial obligations as they fall due. We manage liquidity risk through the management of our capital structure and financial leverage. We also manage liquidity risk by continuously monitoring actual and projected cash flows. The Board of Directors reviews and approves our operating budgets and reviews material transactions outside the normal course of business.
Our contractual obligations related to financial instruments and other obligations and liquidity resources are presented in the liquidity and capital resources of this MD&A and note 1, of our financial statements found elsewhere in this quarterly report.
Future Accounting Changes
We have considered recent accounting pronouncements and concluded that they are either not applicable to our business or that the effect is not expected to be material to our consolidated financial statements as a result of future adoption.
Item 3. Quantitative and Qualitative Disclosures About Market Risk
Information relatingA smaller reporting company is not required to quantitative and qualitative disclosures about market risks is detailed in “Item 2. Management’s Discussion and Analysis of Financial Condition and Results of Operation.”provide the information required by this Item.
Item 4. Controls and Procedures
Disclosure Controls and Procedures
As of the end of the period covered by this quarterly report, our management, with the participation of our CEOChief Executive Officer and CFO,Chief Financial Officer, has performed an evaluation of the effectiveness of our disclosure controls and procedures within the meaning of Rules 13a-15 (e)13a-15(e) and 15d-15(e) of the Exchange Act. Based upon this evaluation, our management has concluded that, as of September 30, 2022,2023, our existing disclosure controls and procedures were effective. It should be noted that while our CEOChief Executive Officer and CFOChief Financial Officer believe that our disclosure controls and procedures provide a reasonable level of assurance that they are effective, they
39
do not expect the disclosure controls and procedures to be capable of preventing all errors and fraud. A control system, no matter how well conceived or operated, can provide only reasonable, but not absolute, assurance that the objectives of the control system are met.
Changes in Internal Control over Financial Reporting
No changes were made to our internal controls over financial reporting that occurred during the quarter ended September 30, 20222023 that have materially affected, or are reasonably likely to materially affect, our internal controls over financial reporting.
PART II. OTHER INFORMATION
Item 1. Legal Proceedings
In the ordinary course of business, we are at times subject to various legal proceedings and disputes, including the proceedings specifically discussed below.disputes. We assess our liabilities and contingencies in connection with outstanding legal proceedings utilizing the latest information available. Where it is probable that we will incur a loss and the amount of the loss can be reasonably estimated, we record a liability in our consolidated financial statements. These legal reserves may be increased or decreased to reflect any relevant developments on a quarterly basis. Where a loss is not probable or the amount of loss is not estimable, we do not accrue legal reserves. While the outcome of legal proceedings is inherently uncertain, based on information currently available and available insurance coverage, our management believes that it has established appropriate legal reserves. Any incremental liabilities arising from pending legal proceedings are not expected to have a material adverse effect on our financial position, results of operations, or cash flows. However, it is possible that the ultimate resolution of these matters, if unfavorable, may be material to our financial position, results of operations, or cash flows. We are not currently a party to any legal proceedings that, in the opinion of management, are likely to have a material adverse effect on our business.
38
Litigation Related to the Merger
In connection with the Grace merger, four stockholder lawsuits were filed:
The Complaints generally allege that our public disclosures pertaining to the Grace merger omitted material facts in purported violation of Section 14(a) of the Exchange Act and Rule 14a-9 promulgated thereunder, and further that members of our Board of Directors are liable for those purported omissions under Section 20(a) of the Exchange Act. The relief sought in the Complaints included, among other things to enjoin the consummation of the merger pending disclosure of sufficient information, to award damages purportedly caused by the alleged omissions, and to award plaintiffs’ attorneys’ fees and other costs.
The Dawson and Weir Complaints were voluntarily dismissed without prejudice. The Bisel and Castaldo Complaints were consolidated. The plaintiffs amended their Complaint in the consolidated action on October 1, 2021, to assert their claims on a class wide basis. The court appointed Plaintiff Castaldo as Lead Plaintiff for the putative class in the consolidated action. Castaldo filed an amended Complaint by February 4, 2022. we filed a motion to dismiss on February 25, 2022.
On September 30, 2022, we announced that a New York court has dismissed the remaining Complaint. In a 45-page opinion, the court granted our motion to dismiss in its entirety, finding that the amended Complaint failed to allege any facts showing that Acasti made a materially misleading statement or material omission in its merger-related disclosures. Accordingly, subject to any appeal that may be taken in response to the ruling, all stockholder suits filed in connection with the Grace merger have now been dismissed.
Item 1A. Risk FactorsFactors
There have been no material changes from the risk factors disclosed in our most recently filed annual report on Form 10-K.Annual Report.
Item 2. Unregistered Sales of Equity Securities and Use of Proceeds
None.
Item 3. Defaults upon Senior Securities
None.
Item 4. Mine Safety Disclosures
Not applicable.
Item 5. Other Information
40
None.
Item 6. Exhibits
Exhibit No. | Description | ||
| |||
| |||
101.INS | Inline XBRL Instance Document – the instance document does not appear in the Interactive Data File because its XBRL tags are embedded within the Inline XBRL document | ||
101.SCH | Inline XBRL Taxonomy Extension Schema Document | ||
39
101.CAL | Inline XBRL Taxonomy Extension Calculation Linkbase Document | |
101.LAB | Inline XBRL Taxonomy Extension Label Linkbase Document | |
101.PRE | Inline XBRL Taxonomy Extension Presentation Linkbase Document | |
101.DEF | Inline XBRL Taxonomy Extension Definition Linkbase Document | |
104 | Cover Page Interactive Data File (formatted as Inline XBRL and contained in Exhibit 101) |
* Filed or furnished herewith
41
SIGNATURES
Pursuant to the requirements of Section 13 or 15(d) of the Securities Exchange Act of 1934, the registrant has duly caused this report to be signed on its behalf by the undersigned, thereunto duly authorized.
Dated: November 14, 202213, 2023
ACASTI PHARMA INC. | |||
By: | /s/ | ||
| |||
Name: Prashant Kohli | |||
Title: (Principal Executive Officer) | |||
By: | /s/ Brian Ford | ||
Name: Brian Ford | |||
Title: Chief Financial Officer (Principal Financial Officer and Principal Accounting Officer) | |||
4240