UNITED STATES
SECURITIES AND EXCHANGE COMMISSION
WASHINGTON, D.C. 20549
FORM 10-Q
☒ | QUARTERLY REPORT PURSUANT TO SECTION 13 OR 15(d) OF THE SECURITIES EXCHANGE ACT OF 1934 |
For the quarterly period ended June 30,March 31, 20232024
☐ | TRANSITION REPORT PURSUANT TO SECTION 13 OR 15(d) OF THE SECURITIES EXCHANGE ACT OF 1934 |
For the transition period from to .
Commission file number: 001-06615
SUPERIOR INDUSTRIES INTERNATIONAL, INC.
(Exact Name of Registrant as Specified in Its Charter)
Delaware | 95-2594729 |
(State or Other Jurisdiction of Incorporation or Organization) | (I.R.S. Employer Identification No.) |
|
|
26600 Telegraph Road, Suite 400 | |
Southfield, Michigan | 48033 |
(Address of Principal Executive Offices) | (Zip Code) |
Registrant’s Telephone Number, Including Area Code: (248) 352-7300
Securities registered pursuant to Section 12(b) of the Act:
|
|
|
|
|
Title of Each Class |
| Trading Symbol | Name of Each Exchange on Which Registered | |
Common Stock, $0.01 par value |
| SUP | New York Stock Exchange |
Indicate by check mark whether the registrant: (1) has filed all reports required to be filed by Section 13 or 15(d) of the Securities Exchange Act of 1934 during the preceding 12 months (or for such shorter period that the registrant was required to file such reports), and (2) has been subject to such filing requirements for the past 90 days. Yes ☒ No ☐
Indicate by check mark whether the registrant has submitted electronically every Interactive Data File required to be submitted pursuant to Rule 405 of Regulation S-T (§232.405 of this chapter) during the preceding 12 months (or for such shorter period that the registrant was required to submit such files). Yes ☒ No ☐
Indicate by check mark whether the registrant is a large accelerated filer, an accelerated filer, a non-accelerated filer, a smaller reporting company, or an emerging growth company. See the definitions of “large accelerated filer,” “accelerated filer,” “smaller reporting company” and “emerging growth company” in Rule 12b-2 of the Exchange Act.
Large Accelerated Filer | ☐ | Accelerated Filer | ☒ |
Non-Accelerated Filer | ☐ | Smaller Reporting Company | ☒ |
Emerging Growth Company | ☐ |
If an emerging growth company, indicate by check mark if the registrant has elected not to use the extended transition period for complying with any new or revised financial accounting standards provided pursuant to Section 13(a) of the Exchange Act. ☐
Indicate by check mark whether the registrant is a shell company (as defined in Rule 12b-2 of the Exchange Act). Yes ☐ No ☒
Number of shares of common stock outstanding as of July 28, 2023:April 26, 2024: 28,091,44028,600,152
TABLE OF CONTENTS
Page | |||||
PART I | - | ||||
|
|
|
|
|
|
Item 1 |
| 1 | |||
|
|
|
|
|
|
1 | |||||
|
|
|
|
|
|
Condensed Consolidated Statements of Comprehensive Income (Loss) | 2 | ||||
|
|
|
|
|
|
3 | |||||
|
|
|
|
|
|
4 | |||||
|
|
|
|
|
|
Condensed Consolidated Statements of Shareholders’ Equity (Deficit) | 5 | ||||
|
|
|
|
|
|
| |||||
|
|
|
|
|
|
Item 2 |
| Management’s Discussion and Analysis of Financial Condition and Results of Operations |
| ||
|
|
|
|
|
|
Item 3 |
|
| |||
|
|
|
|
|
|
Item 4 |
|
| |||
|
|
|
| ||
PART II | - |
| |||
|
|
|
|
|
|
Item 1 |
|
| |||
|
|
|
|
|
|
|
| Item 1A |
|
| |
|
|
|
|
|
|
Item 2 |
|
| |||
|
|
|
|
|
|
|
| Item 3 |
|
| |
|
|
|
|
|
|
|
| Item 4 |
|
| |
|
|
|
|
|
|
|
| Item 5 |
|
| |
|
|
|
|
|
|
Item 6 |
|
| |||
|
|
|
| ||
| |||||
PART I
FINANCIAL INFORMATION
Item 1. Financial Statements
SUPERIOR INDUSTRIES INTERNATIONAL, INC.
CONDENSED CONSOLIDATED STATEMENTS OF INCOME (LOSS)
(Dollars in thousands, except per share amounts)
(Unaudited)
|
| Three Months Ended |
|
| Six Months Ended |
|
| Three Months Ended |
| |||||||||||||||
|
| June 30, |
|
| June 30, |
|
| June 30, |
|
| June 30, |
|
| March 31, |
|
| March 31, |
| ||||||
NET SALES |
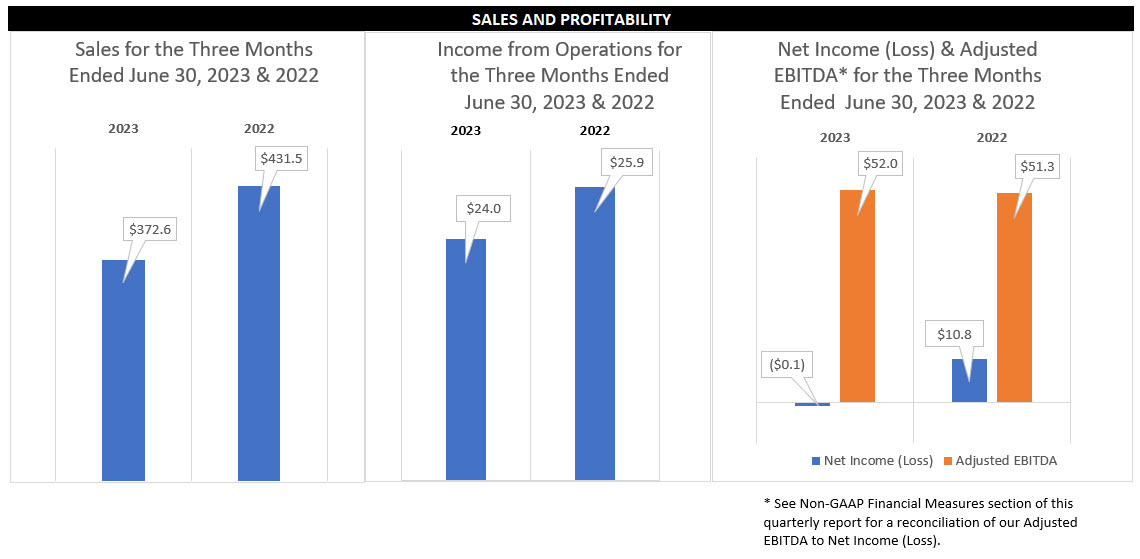
| $ | 372,603 |
|
| $ | 431,532 |
|
| $ | 753,569 |
|
| $ | 832,058 |
|
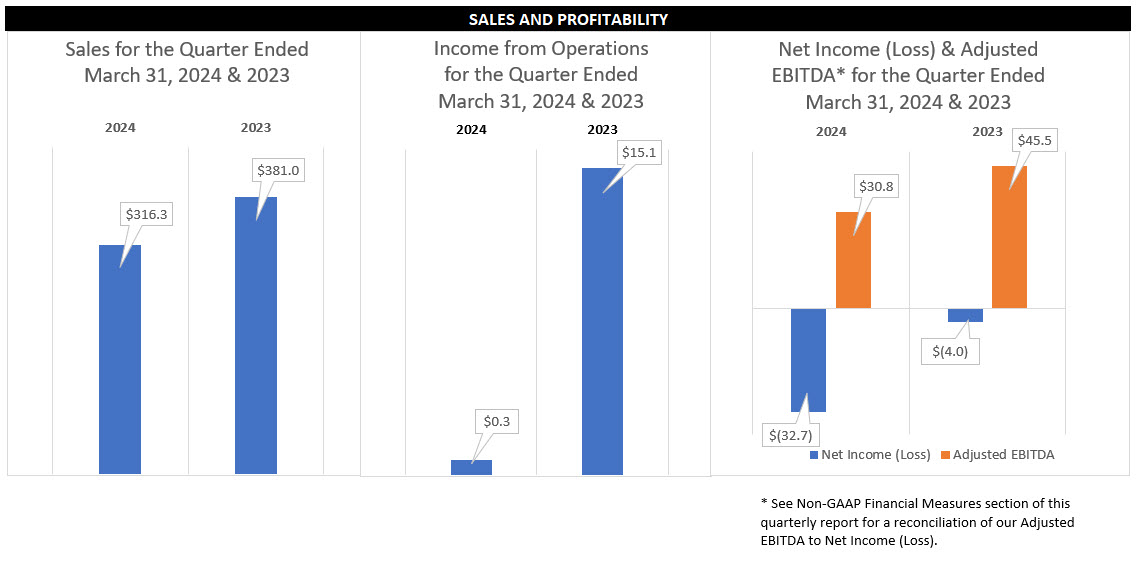
| $ | 316,276 |
|
| $ | 380,966 |
|
Cost of sales |
|
| 331,570 |
|
|
| 388,905 |
|
|
| 677,958 |
|
|
| 748,844 |
|
|
| 295,130 |
|
|
| 346,388 |
|
GROSS PROFIT |
|
| 41,033 |
|
|
| 42,627 |
|
|
| 75,611 |
|
|
| 83,214 |
|
|
| 21,146 |
|
|
| 34,578 |
|
Selling, general and administrative expenses |
|
| 17,016 |
|
|
| 16,721 |
|
|
| 36,458 |
|
|
| 33,671 |
|
|
| 20,832 |
|
|
| 19,442 |
|
INCOME FROM OPERATIONS |
|
| 24,017 |
|
|
| 25,906 |
|
|
| 39,153 |
|
|
| 49,543 |
|
|
| 314 |
|
|
| 15,136 |
|
Interest expense, net |
|
| (15,690 | ) |
|
| (10,338 | ) |
|
| (31,388 | ) |
|
| (20,300 | ) |
|
| (15,878 | ) |
|
| (15,698 | ) |
Other (expense) income, net |
|
| (2,600 | ) |
|
| 681 |
|
|
| (2,787 | ) |
|
| 594 |
| ||||||||
INCOME BEFORE INCOME TAXES |
|
| 5,727 |
|
|
| 16,249 |
|
|
| 4,978 |
|
|
| 29,837 |
| ||||||||
Other expense, net |
|
| (537 | ) |
|
| (187 | ) | ||||||||||||||||
LOSS BEFORE INCOME TAXES |
|
| (16,101 | ) |
|
| (749 | ) | ||||||||||||||||
Income tax provision |
|
| (5,794 | ) |
|
| (5,405 | ) |
|
| (9,092 | ) |
|
| (8,923 | ) |
|
| (16,648 | ) |
|
| (3,298 | ) |
NET (LOSS) INCOME |
| $ | (67 | ) |
| $ | 10,844 |
|
| $ | (4,114 | ) |
| $ | 20,914 |
| ||||||||
(LOSS) EARNINGS PER SHARE – BASIC |
| $ | (0.35 | ) |
| $ | 0.07 |
|
| $ | (0.84 | ) |
| $ | 0.11 |
| ||||||||
(LOSS) EARNINGS PER SHARE – DILUTED |
| $ | (0.35 | ) |
| $ | 0.07 |
|
| $ | (0.84 | ) |
| $ | 0.11 |
| ||||||||
NET LOSS |
| $ | (32,749 | ) |
| $ | (4,047 | ) | ||||||||||||||||
LOSS PER SHARE – BASIC |
| $ | (1.52 | ) |
| $ | (0.49 | ) | ||||||||||||||||
LOSS PER SHARE – DILUTED |
| $ | (1.52 | ) |
| $ | (0.49 | ) | ||||||||||||||||
The accompanying unaudited notes are an integral part of these condensed consolidated financial statements.
1
SUPERIOR INDUSTRIES INTERNATIONAL, INC.
CONDENSED CONSOLIDATED STATEMENTS OF COMPREHENSIVE INCOME (LOSS)
(Dollars in thousands)
(Unaudited)
|
| Three Months Ended |
|
| Six Months Ended |
| ||||||||||
|
| June 30, |
|
| June 30, |
|
| June 30, |
|
| June 30, |
| ||||
Net (loss) income |
| $ | (67 | ) |
| $ | 10,844 |
|
| $ | (4,114 | ) |
| $ | 20,914 |
|
Other comprehensive income, net of tax: |
|
|
|
|
|
|
|
|
|
|
|
| ||||
Foreign currency translation gain (loss) |
|
| 8,542 |
|
|
| (11,654 | ) |
|
| 23,173 |
|
|
| (9,611 | ) |
Change in unrecognized gains (losses) on derivative instruments: |
|
|
|
|
|
|
|
|
|
|
|
| ||||
Change in fair value of derivatives |
|
| 33,595 |
|
|
| (15,906 | ) |
|
| 53,048 |
|
|
| 1,346 |
|
Tax (provision) benefit |
|
| (3,251 | ) |
|
| 323 |
|
|
| (4,584 | ) |
|
| (108 | ) |
Change in unrecognized gains (losses) on derivative instruments, net of tax |
|
| 30,344 |
|
|
| (15,583 | ) |
|
| 48,464 |
|
|
| 1,238 |
|
Defined benefit pension plan: |
|
|
|
|
|
|
|
|
|
|
|
| ||||
Amortization of actuarial losses on pension obligation |
|
| — |
|
|
| 83 |
|
|
| — |
|
|
| 166 |
|
Tax provision |
|
| — |
|
|
| — |
|
|
| — |
|
|
| — |
|
Pension changes, net of tax |
|
| — |
|
|
| 83 |
|
|
| — |
|
|
| 166 |
|
Other comprehensive income (loss), net of tax |
|
| 38,886 |
|
|
| (27,154 | ) |
|
| 71,637 |
|
|
| (8,207 | ) |
Comprehensive income (loss) |
| $ | 38,819 |
|
| $ | (16,310 | ) |
| $ | 67,523 |
|
| $ | 12,707 |
|
|
| Three Months Ended |
| |||||
|
| March 31, |
|
| March 31, |
| ||
Net loss |
| $ | (32,749 | ) |
| $ | (4,047 | ) |
Other comprehensive income (loss), net of tax: |
|
|
|
|
|
| ||
Foreign currency translation gain |
|
| 2,499 |
|
|
| 14,631 |
|
Change in unrecognized gains on derivative instruments: |
|
|
|
|
|
| ||
Change in fair value of derivatives |
|
| 3,466 |
|
|
| 19,453 |
|
Tax provision |
|
| (772 | ) |
|
| (1,333 | ) |
Change in unrecognized gains on derivative instruments, net of tax |
|
| 2,694 |
|
|
| 18,120 |
|
Defined benefit pension plan: |
|
|
|
|
|
| ||
Amortization of actuarial losses on pension obligation |
|
| — |
|
|
| — |
|
Tax benefit |
|
| 178 |
|
|
| — |
|
Pension changes, net of tax |
|
| 178 |
|
|
| — |
|
Other comprehensive income, net of tax |
|
| 5,371 |
|
|
| 32,751 |
|
Comprehensive (loss) income |
| $ | (27,378 | ) |
| $ | 28,704 |
|
The accompanying unaudited notes are an integral part of these condensed consolidated financial statements.
2
SUPERIOR INDUSTRIES INTERNATIONAL, INC.
CONDENSED CONSOLIDATED BALANCE SHEETS
(Dollars in thousands)
(Unaudited)
|
| June 30, |
|
| December 31, |
|
| March 31, |
|
| December 31, |
| ||||
ASSETS |
|
|
|
|
|
|
|
|
|
|
|
| ||||
Current assets: |
|
|
|
|
|
|
|
|
|
|
|
| ||||
Cash and cash equivalents |
| $ | 181,115 |
|
| $ | 213,022 |
|
| $ | 191,071 |
|
| $ | 201,606 |
|
Accounts receivable, net |
|
| 101,017 |
|
|
| 72,725 |
|
|
| 66,170 |
|
|
| 56,393 |
|
Inventories, net |
|
| 181,860 |
|
|
| 178,688 |
|
|
| 149,030 |
|
|
| 144,609 |
|
Income taxes receivable |
|
| 1,959 |
|
|
| 2,261 |
|
|
| 2,175 |
|
|
| 1,559 |
|
Derivative financial instruments |
|
| 40,598 |
|
|
| 38,298 |
| ||||||||
Other current assets |
|
| 58,421 |
|
|
| 42,218 |
|
|
| 24,455 |
|
|
| 17,464 |
|
Total current assets |
|
| 524,372 |
|
|
| 508,914 |
|
|
| 473,499 |
|
|
| 459,929 |
|
Property, plant and equipment, net |
|
| 476,834 |
|
|
| 473,960 |
|
|
| 386,277 |
|
|
| 398,599 |
|
Deferred income tax assets, net |
|
| 22,408 |
|
|
| 35,187 |
|
|
| 35,106 |
|
|
| 52,213 |
|
Intangibles, net |
|
| 42,492 |
|
|
| 51,497 |
|
|
| 27,637 |
|
|
| 33,242 |
|
Derivative financial instruments |
|
| 39,670 |
|
|
| 40,471 |
| ||||||||
Other noncurrent assets |
|
| 94,106 |
|
|
| 64,181 |
|
|
| 43,323 |
|
|
| 46,117 |
|
Total assets |
| $ | 1,160,212 |
|
| $ | 1,133,739 |
|
| $ | 1,005,512 |
|
| $ | 1,030,571 |
|
LIABILITIES, MEZZANINE EQUITY AND SHAREHOLDERS’ EQUITY (DEFICIT) |
|
|
|
|
|
|
|
|
|
|
|
| ||||
Current liabilities: |
|
|
|
|
|
|
|
|
|
|
|
| ||||
Accounts payable |
| $ | 148,455 |
|
| $ | 158,049 |
|
| $ | 139,856 |
|
| $ | 124,907 |
|
Short-term debt |
|
| 7,236 |
|
|
| 5,873 |
|
|
| 4,571 |
|
|
| 5,322 |
|
Accrued expenses |
|
| 73,616 |
|
|
| 74,108 |
|
|
| 65,818 |
|
|
| 66,838 |
|
Income taxes payable |
|
| 1,568 |
|
|
| 13,300 |
|
|
| 1,920 |
|
|
| 1,844 |
|
Total current liabilities |
|
| 230,875 |
|
|
| 251,330 |
|
|
| 212,165 |
|
|
| 198,911 |
|
Long-term debt (less current portion) |
|
| 607,902 |
|
|
| 616,145 |
|
|
| 605,046 |
|
|
| 610,632 |
|
Noncurrent income tax liabilities |
|
| 7,882 |
|
|
| 8,524 |
|
|
| 5,795 |
|
|
| 8,129 |
|
Deferred income tax liabilities, net |
|
| 4,583 |
|
|
| 3,468 |
|
|
| 1,403 |
|
|
| 1,903 |
|
Other noncurrent liabilities |
|
| 49,923 |
|
|
| 55,733 |
|
|
| 48,296 |
|
|
| 47,821 |
|
Commitments and contingent liabilities (Note 17) |
|
| — |
|
|
| — |
|
|
| — |
|
|
| — |
|
Mezzanine equity: |
|
|
|
|
|
|
|
|
|
|
|
| ||||
Preferred stock, $0.01 par value |
|
|
|
|
|
| ||||||||||
Preferred stock, $0.01 par value |
|
|
|
|
|
| ||||||||||
Authorized – 1,000,000 shares |
|
|
|
|
|
|
|
|
|
|
|
| ||||
Issued and outstanding – 150,000 shares outstanding at |
|
| 235,143 |
|
|
| 222,753 |
| ||||||||
Issued and outstanding – 150,000 shares outstanding at |
|
| 255,032 |
|
|
| 248,222 |
| ||||||||
European noncontrolling redeemable equity |
|
| 1,087 |
|
|
| 1,083 |
|
|
| 682 |
|
|
| 893 |
|
Shareholders’ equity (deficit): |
|
|
|
|
|
| ||||||||||
Common stock, $0.01 par value |
|
|
|
|
|
| ||||||||||
Shareholders’ deficit: |
|
|
|
|
|
| ||||||||||
Common stock, $0.01 par value |
|
|
|
|
|
| ||||||||||
Authorized – 100,000,000 shares |
|
|
|
|
|
|
|
|
|
|
|
| ||||
Issued and outstanding – 28,091,440 and 27,016,125 shares at |
|
| 110,802 |
|
|
| 111,105 |
| ||||||||
Issued and outstanding – 28,600,152 and 28,091,440 shares at |
|
| 115,924 |
|
|
| 115,340 |
| ||||||||
Accumulated other comprehensive loss |
|
| (17,632 | ) |
|
| (89,269 | ) |
|
| (16,920 | ) |
|
| (22,291 | ) |
Retained earnings |
|
| (70,353 | ) |
|
| (47,133 | ) |
|
| (221,911 | ) |
|
| (178,989 | ) |
Total shareholders’ equity (deficit) |
|
| 22,817 |
|
|
| (25,297 | ) | ||||||||
Total liabilities, mezzanine equity and shareholders’ equity |
| $ | 1,160,212 |
|
| $ | 1,133,739 |
| ||||||||
Total shareholders’ deficit |
|
| (122,907 | ) |
|
| (85,940 | ) | ||||||||
Total liabilities, mezzanine equity and shareholders’ deficit |
| $ | 1,005,512 |
|
| $ | 1,030,571 |
| ||||||||
The accompanying unaudited notes are an integral part of these condensed consolidated financial statements.
3
SUPERIOR INDUSTRIES INTERNATIONAL, INC.
CONDENSED CONSOLIDATED STATEMENTS OF CASH FLOWS
(Dollars in thousands)
(Unaudited)
|
| Six Months Ended |
|
| Three Months Ended |
| ||||||||||
|
| June 30, |
|
| June 30, |
|
| March 31, 2024 |
|
| March 31, 2023 |
| ||||
CASH FLOWS FROM OPERATING ACTIVITIES: |
|
|
|
|
|
|
|
|
|
|
|
| ||||
Net (loss) income |
| $ | (4,114 | ) |
| $ | 20,914 |
| ||||||||
Net loss |
| $ | (32,749 | ) |
| $ | (4,047 | ) | ||||||||
Adjustments to reconcile net income to net cash provided by operating activities: |
|
|
|
|
|
|
|
|
|
|
|
| ||||
Depreciation and amortization |
|
| 46,308 |
|
|
| 47,208 |
|
|
| 21,946 |
|
|
| 22,841 |
|
Income tax, noncash changes |
|
| 11,316 |
|
|
| 4,087 |
|
|
| 16,257 |
|
|
| 2,292 |
|
Stock-based compensation |
|
| 3,004 |
|
|
| 4,652 |
|
|
| 1,720 |
|
|
| 801 |
|
Amortization of debt issuance costs |
|
| 2,383 |
|
|
| 2,465 |
|
|
| 1,170 |
|
|
| 1,186 |
|
Other noncash items |
|
| 44 |
|
|
| (1,044 | ) |
|
| 2,782 |
|
|
| 2,377 |
|
Changes in operating assets and liabilities: |
|
|
|
|
|
|
|
|
|
|
|
| ||||
Accounts receivable |
|
| (24,847 | ) |
|
| (35,483 | ) |
|
| (12,446 | ) |
|
| (13,346 | ) |
Inventories |
|
| 1,392 |
|
|
| (38,739 | ) |
|
| (5,612 | ) |
|
| (7,169 | ) |
Other assets and liabilities |
|
| 796 |
|
|
| (1,266 | ) |
|
| (3,107 | ) |
|
| 4,060 |
|
Accounts payable |
|
| (12,832 | ) |
|
| 53,755 |
|
|
| 16,305 |
|
|
| 32,181 |
|
Income taxes |
|
| (12,283 | ) |
|
| 664 |
|
|
| (2,796 | ) |
|
| (2,438 | ) |
NET CASH PROVIDED BY OPERATING ACTIVITIES |
|
| 11,167 |
|
|
| 57,213 |
|
|
| 3,470 |
|
|
| 38,738 |
|
CASH FLOWS FROM INVESTING ACTIVITIES: |
|
|
|
|
|
|
|
|
|
|
|
| ||||
Additions to property, plant, and equipment |
|
| (21,751 | ) |
|
| (34,288 | ) |
|
| (6,618 | ) |
|
| (15,589 | ) |
Proceeds from sale of fixed assets |
|
| — |
|
|
| 150 |
| ||||||||
NET CASH USED IN INVESTING ACTIVITIES |
|
| (21,751 | ) |
|
| (34,138 | ) |
|
| (6,618 | ) |
|
| (15,589 | ) |
CASH FLOWS FROM FINANCING ACTIVITIES: |
|
|
|
|
|
|
|
|
|
|
|
| ||||
Repayments of debt |
|
| (12,414 | ) |
|
| (2,505 | ) |
|
| (1,707 | ) |
|
| (2,228 | ) |
Cash dividends paid |
|
| (6,696 | ) |
|
| (6,792 | ) |
|
| (3,338 | ) |
|
| (3,330 | ) |
Financing costs paid and other |
|
| (31 | ) |
|
| — |
|
|
| (217 | ) |
|
| (23 | ) |
Payments related to tax withholdings for stock-based compensation |
|
| (3,307 | ) |
|
| (1,788 | ) |
|
| (1,136 | ) |
|
| (3,303 | ) |
Finance lease payments |
|
| (551 | ) |
|
| (547 | ) |
|
| (150 | ) |
|
| (288 | ) |
NET CASH USED IN FINANCING ACTIVITIES |
|
| (22,999 | ) |
|
| (11,632 | ) |
|
| (6,548 | ) |
|
| (9,172 | ) |
Effect of exchange rate changes on cash |
|
| 1,676 |
|
|
| (2,658 | ) |
|
| (839 | ) |
|
| 1,639 |
|
Net changes in cash and cash equivalents |
|
| (31,907 | ) |
|
| 8,785 |
|
|
| (10,535 | ) |
|
| 15,616 |
|
Cash and cash equivalents at the beginning of the period |
|
| 213,022 |
|
|
| 113,473 |
|
|
| 201,606 |
|
|
| 213,022 |
|
Cash and cash equivalents at the end of the period |
| $ | 181,115 |
|
| $ | 122,258 |
|
| $ | 191,071 |
|
| $ | 228,638 |
|
The accompanying unaudited notes are an integral part of these condensed consolidated financial statements.
4
SUPERIOR INDUSTRIES INTERNATIONAL, INC.
(Dollars in thousands, except share amounts)
(Unaudited)
For the six months ended June 30, 2023 |
|
|
|
|
|
|
|
|
|
|
|
|
|
|
| |||||||||||||||||||||||||||||||||||||||||
|
| Common Stock |
|
| Accumulated Other Comprehensive (Loss) |
|
|
|
|
|
|
| ||||||||||||||||||||||||||||||||||||||||||||
|
| Number of |
|
| Amount |
|
| Unrecognized |
|
| Pension |
|
| Cumulative |
|
| Retained |
|
| Total |
|
| Common Stock |
|
| Accumulated Other Comprehensive (Loss) |
|
|
|
|
|
|
| |||||||||||||||||||||||
BALANCE AT JANUARY 1, 2023 |
|
| 27,016,125 |
|
| $ | 111,105 |
|
| $ | 19,844 |
|
| $ | 1,591 |
|
| $ | (110,704 | ) |
| $ | (47,133 | ) |
| $ | (25,297 | ) | ||||||||||||||||||||||||||||
|
| Number of |
|
| Amount |
|
| Unrecognized |
|
| Pension |
|
| Cumulative |
|
| Retained |
|
| Total |
| |||||||||||||||||||||||||||||||||||
BALANCE AT JANUARY 1, 2024 |
|
| 28,091,440 |
|
| $ | 115,340 |
|
| $ | 59,859 |
|
| $ | 852 |
|
| $ | (83,002 | ) |
| $ | (178,989 | ) |
| $ | (85,940 | ) | ||||||||||||||||||||||||||||
Net loss |
|
| — |
|
|
| — |
|
|
| — |
|
|
| — |
|
|
| — |
|
|
| (4,114 | ) |
|
| (4,114 | ) |
|
| — |
|
|
| — |
|
|
| — |
|
|
| — |
|
|
| — |
|
|
| (32,749 | ) |
|
| (32,749 | ) |
Change in unrecognized gains (losses) on |
|
| — |
|
|
| — |
|
|
| 48,464 |
|
|
| — |
|
|
| — |
|
|
| — |
|
|
| 48,464 |
| ||||||||||||||||||||||||||||
Change in unrecognized gains on |
|
| — |
|
|
| — |
|
|
| 2,694 |
|
|
| — |
|
|
| — |
|
|
| — |
|
|
| 2,694 |
| ||||||||||||||||||||||||||||
Change in defined benefit plans, net of taxes |
|
| — |
|
|
| — |
|
|
| — |
|
|
| — |
|
|
| — |
|
|
| — |
|
|
| — |
|
|
| — |
|
|
| — |
|
|
| — |
|
|
| 178 |
|
|
| — |
|
|
| — |
|
|
| 178 |
|
Net foreign currency translation adjustment |
|
| — |
|
|
| — |
|
|
| — |
|
|
| — |
|
|
| 23,173 |
|
|
| — |
|
|
| 23,173 |
|
|
| — |
|
|
| — |
|
|
| — |
|
|
| — |
|
|
| 2,499 |
|
|
| — |
|
|
| 2,499 |
|
Common stock issued, net of shares withheld |
|
| 1,075,315 |
|
|
| — |
|
|
| — |
|
|
| — |
|
|
| — |
|
|
| — |
|
|
| — |
|
|
| 508,712 |
|
|
| — |
|
|
| — |
|
|
| — |
|
|
| — |
|
|
| — |
|
|
| — |
|
Stock-based compensation |
|
| — |
|
|
| (303 | ) |
|
| — |
|
|
| — |
|
|
| — |
|
|
| — |
|
|
| (303 | ) |
|
| — |
|
|
| 584 |
|
|
| — |
|
|
| — |
|
|
| — |
|
|
| — |
|
|
| 584 |
|
Redeemable preferred 9% dividend |
|
| — |
|
|
| — |
|
|
| — |
|
|
| — |
|
|
| — |
|
|
| (19,085 | ) |
|
| (19,085 | ) |
|
| — |
|
|
| — |
|
|
| — |
|
|
| — |
|
|
| — |
|
|
| (10,166 | ) |
|
| (10,166 | ) |
European noncontrolling redeemable equity |
|
| — |
|
|
| — |
|
|
| — |
|
|
| — |
|
|
| — |
|
|
| (21 | ) |
|
| (21 | ) |
|
| — |
|
|
| — |
|
|
| — |
|
|
| — |
|
|
| — |
|
|
| (7 | ) |
|
| (7 | ) |
BALANCE AT JUNE 30, 2023 |
|
| 28,091,440 |
|
| $ | 110,802 |
|
| $ | 68,308 |
|
| $ | 1,591 |
|
| $ | (87,531 | ) |
| $ | (70,353 | ) |
| $ | 22,817 |
| ||||||||||||||||||||||||||||
BALANCE AT MARCH 31, 2024 |
|
| 28,600,152 |
|
| $ | 115,924 |
|
| $ | 62,553 |
|
| $ | 1,030 |
|
| $ | (80,503 | ) |
| $ | (221,911 | ) |
| $ | (122,907 | ) | ||||||||||||||||||||||||||||
|
|
|
|
|
|
|
|
|
|
|
|
|
|
|
|
|
|
|
|
|
|
|
|
|
|
|
|
|
|
|
| |||||||||||||||||||||||||
For the three months ended June 30, 2023 |
|
|
|
|
|
|
|
|
|
|
|
|
|
|
| |||||||||||||||||||||||||||||||||||||||||
|
| Common Stock |
|
| Accumulated Other Comprehensive (Loss) |
|
|
|
|
|
|
| ||||||||||||||||||||||||||||||||||||||||||||
|
| Number of |
|
| Amount |
|
| Unrecognized |
|
| Pension |
|
| Cumulative |
|
| Retained |
|
| Total |
| |||||||||||||||||||||||||||||||||||
BALANCE AT APRIL 1, 2023 |
|
| 27,908,669 |
|
| $ | 108,603 |
|
| $ | 37,964 |
|
| $ | 1,591 |
|
| $ | (96,073 | ) |
| $ | (60,630 | ) |
| $ | (8,545 | ) | ||||||||||||||||||||||||||||
Net loss |
|
| — |
|
|
| — |
|
|
| — |
|
|
| — |
|
|
| — |
|
|
| (67 | ) |
|
| (67 | ) | ||||||||||||||||||||||||||||
Change in unrecognized gains (losses) on |
|
| — |
|
|
| — |
|
|
| 30,344 |
|
|
| — |
|
|
| — |
|
|
| — |
|
|
| 30,344 |
| ||||||||||||||||||||||||||||
Change in defined benefit plans, net of taxes |
|
| — |
|
|
| — |
|
|
| — |
|
|
| — |
|
|
| — |
|
|
| — |
|
|
| — |
| ||||||||||||||||||||||||||||
Net foreign currency translation adjustment |
|
| — |
|
|
| — |
|
|
| — |
|
|
| — |
|
|
| 8,542 |
|
|
| — |
|
|
| 8,542 |
| ||||||||||||||||||||||||||||
Common stock issued, net of shares withheld |
|
| 182,771 |
|
|
| — |
|
|
| — |
|
|
| — |
|
|
| — |
|
|
| — |
|
|
| — |
| ||||||||||||||||||||||||||||
Stock-based compensation |
|
| — |
|
|
| 2,199 |
|
|
| — |
|
|
| — |
|
|
| — |
|
|
| — |
|
|
| 2,199 |
| ||||||||||||||||||||||||||||
Redeemable preferred 9% dividend |
|
| — |
|
|
| — |
|
|
| — |
|
|
| — |
|
|
| — |
|
|
| (9,645 | ) |
|
| (9,645 | ) | ||||||||||||||||||||||||||||
European noncontrolling redeemable equity |
|
| — |
|
|
| — |
|
|
| — |
|
|
| — |
|
|
| — |
|
|
| (11 | ) |
|
| (11 | ) | ||||||||||||||||||||||||||||
BALANCE AT JUNE 30, 2023 |
|
| 28,091,440 |
|
| $ | 110,802 |
|
| $ | 68,308 |
|
| $ | 1,591 |
|
| $ | (87,531 | ) |
| $ | (70,353 | ) |
| $ | 22,817 |
| ||||||||||||||||||||||||||||
5
For the six months ended June 30, 2022 |
|
|
|
|
|
|
|
|
|
|
|
|
|
|
| |||||||||||||||||||||||||||||||||||||||||
|
| Common Stock |
|
| Accumulated Other Comprehensive (Loss) |
|
|
|
|
|
|
| ||||||||||||||||||||||||||||||||||||||||||||
|
| Number of |
|
| Amount |
|
| Unrecognized |
|
| Pension |
|
| Cumulative |
|
| Retained |
|
| Total |
|
| Common Stock |
|
| Accumulated Other Comprehensive (Loss) |
|
|
|
|
|
|
| |||||||||||||||||||||||
BALANCE AT JANUARY 1, 2022 |
|
| 26,163,077 |
|
| $ | 103,214 |
|
| $ | (9,051 | ) |
| $ | (6,133 | ) |
| $ | (110,790 | ) |
| $ | (47,661 | ) |
| $ | (70,421 | ) | ||||||||||||||||||||||||||||
Net income |
|
| — |
|
|
| — |
|
|
| — |
|
|
| — |
|
|
| — |
|
|
| 20,914 |
|
|
| 20,914 |
| ||||||||||||||||||||||||||||
|
| Number of |
|
| Amount |
|
| Unrecognized |
|
| Pension |
|
| Cumulative |
|
| Retained |
|
| Total |
| |||||||||||||||||||||||||||||||||||
BALANCE AT JANUARY 1, 2023 |
|
| 27,016,125 |
|
| $ | 111,105 |
|
| $ | 19,844 |
|
| $ | 1,591 |
|
| $ | (110,704 | ) |
| $ | (47,133 | ) |
| $ | (25,297 | ) | ||||||||||||||||||||||||||||
Net loss |
|
| — |
|
|
| — |
|
|
| — |
|
|
| — |
|
|
| — |
|
|
| (4,047 | ) |
|
| (4,047 | ) | ||||||||||||||||||||||||||||
Change in unrecognized gains (losses) on |
|
| — |
|
|
| — |
|
|
| 1,238 |
|
|
| — |
|
|
| — |
|
|
| — |
|
|
| 1,238 |
|
|
| — |
|
|
| — |
|
|
| 18,120 |
|
|
| — |
|
|
| — |
|
|
| — |
|
|
| 18,120 |
|
Change in defined benefit plans, net of taxes |
|
| — |
|
|
| — |
|
|
| — |
|
|
| 166 |
|
|
| — |
|
|
| — |
|
|
| 166 |
|
|
| — |
|
|
| — |
|
|
| — |
|
|
| — |
|
|
| — |
|
|
| — |
|
|
| — |
|
Net foreign currency translation adjustment |
|
| — |
|
|
| — |
|
|
| — |
|
|
| — |
|
|
| (9,611 | ) |
|
| — |
|
|
| (9,611 | ) |
|
| — |
|
|
| — |
|
|
| — |
|
|
| — |
|
|
| 14,631 |
|
|
| — |
|
|
| 14,631 |
|
Common stock issued, net of shares withheld |
|
| 853,048 |
|
|
| — |
|
|
| — |
|
|
| — |
|
|
| — |
|
|
| — |
|
|
| — |
|
|
| 892,544 |
|
|
| — |
|
|
| — |
|
|
| — |
|
|
| — |
|
|
| — |
|
|
| — |
|
Stock-based compensation |
|
| — |
|
|
| 2,864 |
|
|
| — |
|
|
| — |
|
|
| — |
|
|
| — |
|
|
| 2,864 |
|
|
| — |
|
|
| (2,502 | ) |
|
| — |
|
|
| — |
|
|
| — |
|
|
| — |
|
|
| (2,502 | ) |
Redeemable preferred 9% dividend |
|
| — |
|
|
| — |
|
|
| — |
|
|
| — |
|
|
| — |
|
|
| (17,911 | ) |
|
| (17,911 | ) |
|
| — |
|
|
| — |
|
|
| — |
|
|
| — |
|
|
| — |
|
|
| (9,440 | ) |
|
| (9,440 | ) |
European noncontrolling redeemable equity |
|
| — |
|
|
| — |
|
|
| — |
|
|
| — |
|
|
| — |
|
|
| (22 | ) |
|
| (22 | ) |
|
| — |
|
|
| — |
|
|
| — |
|
|
| — |
|
|
| — |
|
|
| (10 | ) |
|
| (10 | ) |
BALANCE AT JUNE 30, 2022 |
|
| 27,016,125 |
|
| $ | 106,078 |
|
| $ | (7,813 | ) |
| $ | (5,967 | ) |
| $ | (120,401 | ) |
| $ | (44,680 | ) |
| $ | (72,783 | ) | ||||||||||||||||||||||||||||
BALANCE AT MARCH 31, 2023 |
|
| 27,908,669 |
|
| $ | 108,603 |
|
| $ | 37,964 |
|
| $ | 1,591 |
|
| $ | (96,073 | ) |
| $ | (60,630 | ) |
| $ | (8,545 | ) | ||||||||||||||||||||||||||||
|
|
|
|
|
|
|
|
|
|
|
|
|
|
|
|
|
|
|
|
|
|
|
|
|
|
|
|
|
|
|
|
| ||||||||||||||||||||||||
For the three months ended June 30, 2022 |
|
|
|
|
|
|
|
|
|
|
|
|
|
|
| |||||||||||||||||||||||||||||||||||||||||
|
| Common Stock |
|
| Accumulated Other Comprehensive (Loss) |
|
|
|
|
|
|
| ||||||||||||||||||||||||||||||||||||||||||||
|
| Number of |
|
| Amount |
|
| Unrecognized |
|
| Pension |
|
| Cumulative |
|
| Retained |
|
| Total |
| |||||||||||||||||||||||||||||||||||
BALANCE AT APRIL 1, 2022 |
|
| 26,853,292 |
|
| $ | 104,216 |
|
| $ | 7,770 |
|
| $ | (6,050 | ) |
| $ | (108,747 | ) |
| $ | (46,512 | ) |
| $ | (49,323 | ) | ||||||||||||||||||||||||||||
Net income |
|
| — |
|
|
| — |
|
|
| — |
|
|
| — |
|
|
| — |
|
|
| 10,844 |
|
|
| 10,844 |
| ||||||||||||||||||||||||||||
Change in unrecognized gains (losses) on |
|
| — |
|
|
| — |
|
|
| (15,583 | ) |
|
| — |
|
|
| — |
|
|
| — |
|
|
| (15,583 | ) | ||||||||||||||||||||||||||||
Change in defined benefit plans, net of taxes |
|
| — |
|
|
| — |
|
|
| — |
|
|
| 83 |
|
|
| — |
|
|
| — |
|
|
| 83 |
| ||||||||||||||||||||||||||||
Net foreign currency translation adjustment |
|
| — |
|
|
| — |
|
|
| — |
|
|
| — |
|
|
| (11,654 | ) |
|
| — |
|
|
| (11,654 | ) | ||||||||||||||||||||||||||||
Common stock issued, net of shares withheld |
|
| 162,833 |
|
|
| — |
|
|
| — |
|
|
| — |
|
|
| — |
|
|
| — |
|
|
| — |
| ||||||||||||||||||||||||||||
Stock-based compensation |
|
| — |
|
|
| 1,862 |
|
|
| — |
|
|
| — |
|
|
| — |
|
|
| — |
|
|
| 1,862 |
| ||||||||||||||||||||||||||||
Redeemable preferred 9% dividend |
|
| — |
|
|
| — |
|
|
| — |
|
|
| — |
|
|
| — |
|
|
| (9,001 | ) |
|
| (9,001 | ) | ||||||||||||||||||||||||||||
European noncontrolling redeemable equity |
|
| — |
|
|
| — |
|
|
| — |
|
|
| — |
|
|
| — |
|
|
| (11 | ) |
|
| (11 | ) | ||||||||||||||||||||||||||||
BALANCE AT JUNE 30, 2022 |
|
| 27,016,125 |
|
| $ | 106,078 |
|
| $ | (7,813 | ) |
| $ | (5,967 | ) |
| $ | (120,401 | ) |
| $ | (44,680 | ) |
| $ | (72,783 | ) | ||||||||||||||||||||||||||||
The accompanying unaudited notes are an integral part of these condensed consolidated financial statements.
65
Superior Industries International, Inc.
Notes to Condensed Consolidated Financial Statements
June 30, 2023March 31, 2024
(Unaudited)
NOTE 1 – NATURE OF OPERATIONS AND PRESENTATION OF CONDENSED CONSOLIDATED FINANCIAL STATEMENTS
Nature of Operations
The principal business of Superior Industries International, Inc.’s (referred herein as the “Company,” “Superior,” or “we” and “our”) principal business is the design and manufacture of aluminum wheels for sale to original equipment manufacturers (“OEMs”) in North America and Europe and to the aftermarket in Europe. We employ approximately 7,1006,800 full-time employees, operating in eightseven manufacturing facilities in North America and Europe. We are one of the largest aluminum wheel suppliers to global OEMs and one of the leading European aluminum wheel aftermarket manufacturers and suppliers. Our OEM aluminum wheels accounted for approximately 9692 percent of our sales in the first sixthree months of 20232024 and are primarily sold for factory installation on vehicle models manufactured by BMW (including Mini), Ford, GM, Honda, Jaguar-Land Rover, Lucid Motors, Mazda, Mercedes-Benz Group,Mitsubishi, Nissan, PSA,Peugeot, Renault, Stellantis, Subaru, Suzuki, Toyota, VW Group (Volkswagen, Audi, SEAT, Skoda Porsche, Bentley)and Porsche) and Volvo. We sell aluminum wheels to the European aftermarket under the brands ATS, RIAL, ALUTEC and ANZIO. North America and Europe represent the principal markets for our products, but we have a diversified global customer base consisting of North American, European and Asian OEMs. We have determined that our North American and European operations should be treated as separate reportable segments as further described in Note 5, “Business Segments.”
Presentation of Condensed Consolidated Financial Statements
The accompanying unaudited condensed consolidated financial statements have been prepared in conformity with U.S. Generally Accepted Accounting Principles (“GAAP”) pursuant to the rules and regulations of the Securities and Exchange Commission (“SEC”(the “SEC”) for interim financial information. Accordingly, they do not include all the information and notes required by U.S. GAAP for complete financial statements. These unaudited condensed consolidated financial statements, in our opinion, include all adjustments, of a normal and recurring nature, which are necessary for fair presentation of the financial statements. This Quarterly Report on Form 10-Q should be read in conjunction with our consolidated financial statements and notes thereto filed with the SEC in our 20222023 Annual Report on Form 10-K.
These unaudited condensed consolidated financial statements include the accounts of the Company and its subsidiaries. All intercompany transactions are eliminated in consolidation.
Interim financial reporting standards require us to make estimates that are based on assumptions regarding the outcome of future events and circumstances not known at that time. Inevitably, some assumptions will not materialize, unanticipated events or circumstances may occur which vary from those estimates and such variations may significantly affect our future results. Additionally, interim results may not be indicative of our results for future interim periods or our annual results.
Cash Paid for Interest and Taxes and Noncash Investing Activities
Cash paid for interest was $30.812.2 million and $17.911.9 million for the sixthree months ended June 30,March 31, 2024 and March 31, 2023, and June 30, 2022, respectively. Net cash paid for income taxes was $10.03.2 million and $4.13.5 million for the sixthree months ended June 30,March 31, 2024 and March 31, 2023, and June 30, 2022, respectively. As of June 30,March 31, 2024 and March 31, 2023, and June 30, 2022, $1.73.4 million and $5.92.9 million, respectively, of equipment had been purchased but not yet paid and was included in accounts payable in our condensed consolidated balance sheets.
AdoptionAccounting Standards Issued But Not Yet Adopted
Accounting Standards Update (ASU) 2023-07, “Segment Reporting.” In November 2023, the FASB issued ASU 2023-07, “Segment Reporting (Topic 280): Improvements to Reportable Segment Disclosures,” which is intended to improve reportable segment disclosure requirements, primarily through enhanced disclosures about significant segment expenses, allowing financial statement users to better understand the components of New Accounting Standardsa segment's profit or loss to assess potential future cash flows for each reportable segment and the entity as a whole. The amendments expand a public entity's segment disclosures by requiring disclosure of significant segment expenses that are regularly provided to the chief operating decision maker (“CODM”), clarifying when an entity may report one or more additional measures to assess segment performance, requiring enhanced interim disclosures, providing new disclosure requirements for entities with a single reportable segment, and requiring other new disclosures. The amendments are effective for fiscal years beginning after December 15, 2023, and interim periods within fiscal years beginning after December 15, 2024, and early adoption is permitted. The Company is currently evaluating the impact of adopting this guidance.
Accounting Standards Update (ASU) 2016-13, “Financial Instruments – Credit Losses2023-09, “Income Taxes (Topic 326): Measurement of Credit Losses on Financial Instruments.740).”On January 1,In December 2023, the Company adoptedFASB issued ASU 2016-13, using a modified retrospective approach. ASU 2016-13 amends several aspects of2023-09, “Income Taxes (Topic 740): Improvements to Income Tax Disclosures,” which is intended to enhance the measurement of credit losses related to certain financial instruments, including the replacement of the existing incurred credit loss model with the current expected credit loss model. Under ASU 2016-13, credit losses are estimated based on relevant information about past events, current conditions, and reasonable and supportable forecasts and associated assumptions. The Company did not recognize a cumulative adjustment to retained earnings upon adoption as the adjustment was immaterial.transparency, decision
76
usefulness and effectiveness of income tax disclosures. The Company’s allowance for credit losses on accounts receivable represents management’s estimate of expected credit losses over the expected term of the receivables. In estimating current expected credit losses, the Company appliesamendments in this ASU require a losspublic entity to disclose a tabular tax rate reconciliation, using both percentages and currency, with specific categories. A public entity is also required to receivables aging categories by region and market, OEM or aftermarket, based on historical write-offs. Historical loss rates are adjusted for current conditions and reasonable and supportable forecasts, as necessary. Specific reserves are recognized for individual accounts whenever the Company becomes aware of circumstances indicating thatprovide a loss may be incurred on a particular customer account, such as in the event of a customer bankruptcy or significant deterioration in customer operating results or financial condition. Provision adjustments to the allowance for credit losses are recognized in selling, general and administrative expenses. As of June 30, 2023 and December 31, 2022, accounts receivable are reflected net of reserves (including the estimated allowance for credit losses) of $0.7 million and $0.6 million, respectively. Changes in expected credit losses were not significant during the three or six months ended June 30, 2023.
Accounting Standards Update (ASU) 2022-04, “Liabilities—Supplier Finance Programs (Subtopic 405-50): Disclosure of Supplier Finance Program Obligations.”On January 1, 2023, the Company adopted ASU 2022-04 which requires that a buyer in a supplier finance program disclose the key terms of the program, including aqualitative description of the payment terms. Forstates and local jurisdictions that make up the obligations that the buyer has confirmed as valid to the finance provider or intermediary, the buyer must disclose: the amount outstanding that remains unpaid by the buyer asmajority of the endeffect of each period, a description of where those obligations are presented in the balance sheetstate and a roll forward of those obligations duringlocal income tax category and the period, including thenet amount of obligations confirmedincome taxes paid, disaggregated by federal, state and foreign taxes and also disaggregated by individual jurisdictions. The amendments are effective prospectively for annual periods beginning after December 15, 2024, and early adoption and retrospective application are permitted. The Company is currently evaluating the amountimpact of obligations subsequently paid. In adopting ASU 2022-04, disclosures which had previously been included in Management’s Discussion and Analysis of Financial Condition and Results of Operations of previous Annual Reports on Form 10-K and Quarterly Reports on Form 10-Q regarding supply chain financing have now been included as Note 10, “Supplier Finance Program” to the condensed consolidated financial statements along with disclosure of payment terms under the program and a roll forward of the amounts owed to the financial institution.this guidance.
NOTE 2 – REVENUE
The Company disaggregates revenue from contracts with customers into our reportable segments, North America and Europe. Revenues by segment for the three- and six-monththree-month periods ended June 30,March 31, 2024 and March 31, 2023, and June 30, 2022, respectively, are summarized in Note 5, “Business Segments.”
The opening and closing balances of the Company’s customer receivables and current and long-term contract liabilities balances are as follows:
|
| June 30, |
|
| December 31, |
|
| Change |
|
| March 31, |
|
| December 31, |
|
| Change |
| ||||||
(Dollars in thousands) |
|
|
|
|
|
|
|
|
|
|
|
|
|
|
|
|
|
| ||||||
Customer receivables |
| $ | 90,304 |
|
| $ | 63,565 |
|
| $ | 26,739 |
|
| $ | 53,907 |
|
| $ | 41,879 |
|
| $ | 12,028 |
|
Contract liabilities—current |
|
| 6,930 |
|
|
| 6,251 |
|
|
| 679 |
|
|
| 1,680 |
|
|
| 2,982 |
|
|
| (1,302 | ) |
Contract liabilities—noncurrent |
|
| 8,358 |
|
|
| 8,355 |
|
|
| 3 |
|
|
| 10,623 |
|
|
| 8,530 |
|
|
| 2,093 |
|
8
NOTE 3 – FAIR VALUE MEASUREMENTS
The Company applies fair value accounting for all financial assets and liabilities and nonfinancial assets and liabilities that are recognized or disclosed at fair value in the financial statements on a recurring basis, while other assets and liabilities are measured at fair value on a nonrecurring basis, such as an asset impairment. Fair value is estimated by applying the following hierarchy, which prioritizes the inputs used to measure fair value into three levels and bases the categorization within the hierarchy upon the lowest level of input that is available and significant to the fair value measurement:
Level 1 - Quoted prices in active markets for identical assets or liabilities.
Level 2 - Observable inputs other than quoted prices in active markets for identical assets and liabilities, quoted prices for identical or similar assets or liabilities in inactive markets, or other inputs that are observable or can be corroborated by observable market data for substantially the full term of the assets or liabilities.
Level 3 - Inputs that are generally unobservable and typically reflect management’s estimate of assumptions that market participants would use in pricing the asset or liability.
The carrying amounts for cash and cash equivalents, accounts receivable, accounts payable and accrued expenses approximate their fair values due to the short period of time until maturity.
Derivative Financial Instruments
Our derivatives are over-the-counter customized derivative instruments and are not exchange traded. We estimate the fair value of these instruments using the income valuation approach. Under this approach, we project future cash flows and discount the future amounts to a present value using market-based expectations for interest rates, foreign exchange rates, commodity prices and the contractual terms of the derivative instruments. The discount rate used is the relevant benchmark rate (e.g., the secured overnight financing rate, “SOFR”) plus an adjustment for nonperformancecounterparty risk.
97
The following tables categorize items measured at fair value as of June 30, 2023March 31, 2024 and December 31, 2022:2023:
|
|
|
|
| Fair Value Measurement at Reporting Date Using |
| ||||||||||
June 30, 2023 |
|
|
|
| Quoted Prices in |
|
| Significant |
|
| Significant |
| ||||
(Dollars in thousands) |
|
|
|
|
|
|
|
|
|
|
|
| ||||
Assets |
|
|
|
|
|
|
|
|
|
|
|
| ||||
Derivative contracts |
| $ | 78,883 |
|
| $ | — |
|
| $ | 78,883 |
|
| $ | — |
|
Total |
| $ | 78,883 |
|
| $ | — |
|
| $ | 78,883 |
|
| $ | — |
|
Liabilities |
|
|
|
|
|
|
| . |
|
|
|
| ||||
Derivative contracts |
| $ | 2,456 |
|
| $ | — |
|
| $ | 2,456 |
|
| $ | — |
|
Total |
| $ | 2,456 |
|
| $ | — |
|
| $ | 2,456 |
|
| $ | — |
|
|
|
|
|
| Fair Value Measurement at Reporting Date Using |
| ||||||||||
March 31, 2024 |
|
|
|
| Quoted Prices in |
|
| Significant |
|
| Significant |
| ||||
(Dollars in thousands) |
|
|
|
|
|
|
|
|
|
|
|
| ||||
Assets |
|
|
|
|
|
|
|
|
|
|
|
| ||||
Derivative contracts |
| $ | 80,268 |
|
| $ | — |
|
| $ | 80,268 |
|
| $ | — |
|
Total |
| $ | 80,268 |
|
| $ | — |
|
| $ | 80,268 |
|
| $ | — |
|
Liabilities |
|
|
|
|
|
|
| . |
|
|
|
| ||||
Derivative contracts |
| $ | 3,723 |
|
| $ | — |
|
| $ | 3,723 |
|
| $ | — |
|
Total |
| $ | 3,723 |
|
| $ | — |
|
| $ | 3,723 |
|
| $ | — |
|
|
|
|
|
| Fair Value Measurement at Reporting Date Using |
|
|
|
|
| Fair Value Measurement at Reporting Date Using |
| ||||||||||||||||||||
December 31, 2022 |
|
|
|
| Quoted Prices in |
|
| Significant |
|
| Significant |
| ||||||||||||||||||||
December 31, 2023 |
|
|
|
| Quoted Prices in |
|
| Significant |
|
| Significant |
| ||||||||||||||||||||
(Dollars in thousands) |
|
|
|
|
|
|
|
|
|
|
|
|
|
|
|
|
|
|
|
|
|
|
|
| ||||||||
Assets |
|
|
|
|
|
|
|
|
|
|
|
|
|
|
|
|
|
|
|
|
|
| ||||||||||
Derivative contracts |
| $ | 34,960 |
|
| $ | — |
|
| $ | 34,960 |
|
| $ | — |
|
| $ | 78,769 |
|
| $ | — |
|
| $ | 78,769 |
|
| $ | — |
|
Total |
| $ | 34,960 |
|
| $ | — |
|
| $ | 34,960 |
|
| $ | — |
|
| $ | 78,769 |
|
| $ | — |
|
| $ | 78,769 |
|
| $ | — |
|
Liabilities |
|
|
|
|
|
|
| . |
|
|
|
|
|
|
|
|
|
|
| . |
|
|
|
| ||||||||
Derivative contracts |
| $ | 11,780 |
|
| $ | — |
|
| $ | 11,780 |
|
| $ | — |
|
| $ | 4,836 |
|
| $ | — |
|
| $ | 4,836 |
|
| $ | — |
|
Total |
| $ | 11,780 |
|
| $ | — |
|
| $ | 11,780 |
|
| $ | — |
|
| $ | 4,836 |
|
| $ | — |
|
| $ | 4,836 |
|
| $ | — |
|
Debt Instruments
The carrying values of the Company’s debt instruments vary from their fair values. The fair values were determined by reference to transacted prices and quotes for these instruments (Level 2). The estimated fair value, as well as the carrying value, of the Company’s debt instruments are shown below:
|
| June 30, |
|
| December 31, |
|
| March 31, |
|
| December 31, |
| ||||
(Dollars in thousands) |
|
|
|
|
|
|
|
|
|
|
|
| ||||
Estimated aggregate fair value |
| $ | 611,565 |
|
| $ | 615,394 |
|
| $ | 629,227 |
|
| $ | 627,008 |
|
Aggregate carrying value (1) |
|
| 638,687 |
|
|
| 647,443 |
|
|
| 630,201 |
|
|
| 637,509 |
|
NOTE 4 - DERIVATIVE FINANCIAL INSTRUMENTS
We use derivatives to partially offset our exposure to foreign currency, interest rate, aluminum and other commodity price risks. We may enter into forward contracts, option contracts, swaps, collars or other derivative instruments to offset some of the risk on expected future cash flows and on certain existing assets and liabilities. However, we may choose not to hedge certain exposures for a variety of reasons including, but not limited to, accounting considerations and the prohibitive economic cost of hedging particular exposures. There can be no assurance the hedges will fully offset the financial impact resulting from movements in foreign currency exchange rates, interest rates, and aluminum or other commodity prices.
To help mitigate gross margin and cash flow fluctuations due to changes in foreign currency exchange rates, certain of our subsidiaries, whose functional currency is the U.S. dollar or the Euro, hedge a portion of their forecasted foreign currency costs denominated in the Mexican Peso and Polish Zloty, respectively. We may hedge portions of our forecasted foreign currency exposure up to 48 months.
We account for our derivative instruments as either assets or liabilities and adjust them to fair value each period. For derivative instruments that hedge the exposure to variability in expected future cash flows and are designated as cash flow hedges, the gain or loss on the derivative instrument is recorded in accumulated other comprehensive income (“AOCI”) or loss in shareholders’ equity or deficit until the hedged item is recognized in earnings, at which point accumulated gains or losses are recognized in earnings and classified with the underlying hedged transactions. Derivatives that do not qualify or have not been designated as hedges are adjusted to fair value through earnings in the financial statement line item to which the derivative relates.
108
The following tables display the fair value of derivatives by balance sheet line item at June 30, 2023March 31, 2024 and December 31, 2022:2023:
|
| June 30, 2023 |
|
| March 31, 2024 |
| ||||||||||||||||||||||||||
|
| Other |
|
| Other |
|
| Accrued |
|
| Other |
|
| Derivative Financial Instruments (Current Asset) |
|
| Derivative Financial Instruments (Noncurrent Asset) |
|
| Accrued |
|
| Other |
| ||||||||
(Dollars in thousands) |
|
|
|
|
|
|
|
|
|
|
|
|
|
|
|
|
|
|
|
|
|
|
|
| ||||||||
Foreign exchange forward contracts designated as |
| $ | 27,803 |
|
| $ | 41,892 |
|
| $ | 730 |
|
| $ | 21 |
|
| $ | 36,021 |
|
| $ | 38,573 |
|
| $ | 332 |
|
| $ | 168 |
|
Foreign exchange forward contracts not |
|
| 1,339 |
|
|
| — |
|
|
| 76 |
|
|
| — |
|
|
| 713 |
|
|
| — |
|
|
| 118 |
|
|
| — |
|
Aluminum forward contracts designated as |
|
| — |
|
|
| — |
|
|
| 521 |
|
|
| — |
|
|
| 165 |
|
|
| — |
|
|
| — |
|
|
| — |
|
Natural gas forward contracts designated as |
|
| 390 |
|
|
| 433 |
|
|
| 494 |
|
|
| 614 |
|
|
| 192 |
|
|
| 71 |
|
|
| 2,371 |
|
|
| 734 |
|
Interest rate swap contracts designated as hedging |
|
| 4,736 |
|
|
| 2,290 |
|
|
| — |
|
|
| — |
|
|
| 3,507 |
|
|
| 1,026 |
|
|
| — |
|
|
| — |
|
Total derivative financial instruments |
| $ | 34,268 |
|
| $ | 44,615 |
|
| $ | 1,821 |
|
| $ | 635 |
|
| $ | 40,598 |
|
| $ | 39,670 |
|
| $ | 2,821 |
|
| $ | 902 |
|
|
| December 31, 2022 |
|
| December 31, 2023 |
| ||||||||||||||||||||||||||
|
| Other |
|
| Other |
|
| Accrued |
|
| Other |
|
| Derivative Financial Instruments (Current Asset) |
|
| Derivative Financial Instruments (Noncurrent Asset) |
|
| Accrued |
|
| Other |
| ||||||||
(Dollars in thousands) |
|
|
|
|
|
|
|
|
|
|
|
|
|
|
|
|
|
|
|
|
|
|
|
| ||||||||
Foreign exchange forward contracts designated as |
| $ | 11,210 |
|
| $ | 15,890 |
|
| $ | 2,873 |
|
| $ | 5,212 |
|
| $ | 33,075 |
|
| $ | 39,902 |
|
| $ | 440 |
|
| $ | 596 |
|
Foreign exchange forward contracts not |
|
| 603 |
|
|
| — |
|
|
| 192 |
|
|
| — |
|
|
| 1,512 |
|
|
| — |
|
|
| 677 |
|
|
| — |
|
Aluminum forward contracts designated as |
|
| — |
|
|
| — |
|
|
| 1,213 |
|
|
| — |
|
|
| 366 |
|
|
| — |
|
|
| 36 |
|
|
| — |
|
Natural gas forward contracts designated as |
|
| 498 |
|
|
| 655 |
|
|
| 1,520 |
|
|
| 770 |
|
|
| 183 |
|
|
| 115 |
|
|
| 2,358 |
|
|
| 729 |
|
Interest rate swap contracts designated as hedging |
|
| 4,112 |
|
|
| 1,992 |
|
|
| — |
|
|
| — |
|
|
| 3,162 |
|
|
| 454 |
|
|
| — |
|
|
| — |
|
Total derivative financial instruments |
| $ | 16,423 |
|
| $ | 18,537 |
|
| $ | 5,798 |
|
| $ | 5,982 |
|
| $ | 38,298 |
|
| $ | 40,471 |
|
| $ | 3,511 |
|
| $ | 1,325 |
|
9
11
The following table summarizes the notional amount and estimated fair value of our derivative financial instruments:
|
| June 30, 2023 |
|
| December 31, 2022 |
|
| March 31, 2024 |
|
| December 31, 2023 |
| ||||||||||||||||||||
|
| Notional |
|
| Fair |
|
| Notional |
|
| Fair |
|
| Notional |
|
| Fair |
|
| Notional |
|
| Fair |
| ||||||||
(Dollars in thousands) |
|
|
|
|
|
|
|
|
|
|
|
|
|
|
|
|
|
|
|
|
|
|
|
| ||||||||
Foreign exchange forward contracts designated as |
| $ | 435,204 |
|
| $ | 68,944 |
|
| $ | 462,783 |
|
| $ | 19,015 |
|
| $ | 382,274 |
|
| $ | 74,094 |
|
| $ | 432,529 |
|
| $ | 71,941 |
|
Foreign exchange forward contracts not designated |
|
| 39,447 |
|
|
| 1,263 |
|
|
| 39,726 |
|
|
| 411 |
|
|
| 35,690 |
|
|
| 595 |
|
|
| 34,764 |
|
|
| 835 |
|
Aluminum forward contracts designated as |
|
| 8,411 |
|
|
| (521 | ) |
|
| 9,495 |
|
|
| (1,213 | ) |
|
| 7,092 |
|
|
| 165 |
|
|
| 15,751 |
|
|
| 330 |
|
Natural gas forward contracts designated as hedging |
|
| 12,411 |
|
|
| (285 | ) |
|
| 13,500 |
|
|
| (1,137 | ) |
|
| 12,741 |
|
|
| (2,842 | ) |
|
| 11,262 |
|
|
| (2,789 | ) |
Interest rate swap contracts designated as hedging |
|
| 250,000 |
|
|
| 7,026 |
|
|
| 250,000 |
|
|
| 6,104 |
|
|
| 200,000 |
|
|
| 4,533 |
|
|
| 200,000 |
|
|
| 3,616 |
|
Total derivative financial instruments |
| $ | 745,473 |
|
| $ | 76,427 |
|
| $ | 775,504 |
|
| $ | 23,180 |
|
| $ | 637,797 |
|
| $ | 76,545 |
|
| $ | 694,306 |
|
| $ | 73,933 |
|
Notional amounts are presented on a net basis. The notional amounts of the derivative financial instruments do not represent amounts exchanged by the parties and, therefore, are not a direct measure of our exposure to the financial risks described above. The amounts exchanged are calculated by reference to the notional amounts and by other terms of the derivatives, such as interest rates, foreign currency exchange rates or commodity prices.
The following tables summarize the gain or loss recognized in AOCI, the amounts reclassified from AOCI into earnings and the amounts recognized directly into earnings for the three and six months ended June 30, 2023March 31, 2024 and June 30, 2022:March 31, 2023:
Three Months Ended June 30, 2023 |
| Amount of Gain or |
| Amount of Pre-tax |
|
| Amount of Pre-tax |
| ||||||||||||||||
Three Months Ended March 31, 2024 |
| Amount of Gain or |
| Amount of Pre-tax |
|
| Amount of Pre-tax |
| ||||||||||||||||
(Dollars in thousands) |
|
|
|
|
|
|
|
|
|
|
|
|
|
|
|
|
|
| ||||||
Derivative contracts |
| $ | 30,344 |
|
| $ | 6,150 |
|
| $ | 1,398 |
|
| $ | 2,694 |
|
| $ | 9,177 |
|
| $ | 225 |
|
|
|
|
|
|
|
|
|
|
| |||||||||||||||
Six Months Ended June 30, 2023 |
| Amount of Gain or |
| Amount of Pre-tax |
|
| Amount of Pre-tax |
| ||||||||||||||||
(Dollars in thousands) |
|
|
|
|
|
|
|
|
| |||||||||||||||
Derivative contracts |
| $ | 48,464 |
|
| $ | 10,078 |
|
| $ | 3,993 |
| ||||||||||||
Three Months Ended June 30, 2022 |
| Amount of Gain or |
| Amount of Pre-tax |
|
| Amount of Pre-tax |
| ||||||||||||||||
Three Months Ended March 31, 2023 |
| Amount of Gain or |
| Amount of Pre-tax |
|
| Amount of Pre-tax |
| ||||||||||||||||
(Dollars in thousands) |
|
|
|
|
|
|
|
|
|
|
|
|
|
|
|
|
|
| ||||||
Derivative contracts |
| $ | (15,583 | ) |
| $ | 4,558 |
|
| $ | (201 | ) |
| $ | 18,120 |
|
| $ | 3,928 |
|
| $ | 2,595 |
|
|
|
|
|
|
|
|
| |||||||||||||||||
Six Months Ended June 30, 2022 |
| Amount of Gain or |
| Amount of Pre-tax |
|
| Amount of Pre-tax |
| ||||||||||||||||
(Dollars in thousands) |
|
|
|
|
|
|
|
|
| |||||||||||||||
Derivative contracts |
| $ | 1,238 |
|
| $ | 9,335 |
|
| $ | 669 |
| ||||||||||||
Hedge accounting gains reclassified from AOCI into earnings in the secondfirst quarter of 20232024 included $4.98.0 million recognized as a credit to cost of sales and $1.2 million recognized as a credit to interest expense, net. Hedge accounting gains and (losses) reclassified from AOCI into earnings in the secondfirst quarter of 2022 included $5.5 million recognized as a credit to cost of sales and $(0.9) million recognized as a debit to interest expense, net. Gains on nondesignated hedges are recognized as a credit to other expense, net.
12
Hedge accounting gains reclassified from AOCI into earnings in the first six months of 2023 included $8.03.0 million recognized as a credit to cost of sales and $2.10.9 million recognized as a credit to interest expense, net. Hedge accounting gains and (losses) reclassified from AOCI into earnings in the first six months of 2022 included $11.4 million recognized as a credit to cost of sales and $(2.1) million recognized as a debit to interest expense, net. Loss on nondesignated hedges are recognized as a debit to other expense, net. Gains on nondesignated hedges are recognized as a credit to other expense, net.
NOTE 5 - BUSINESS SEGMENTS
The North American and European businesses represent separate operating segments in view of significantlythe different markets, customers and products in each of these regions. Within each of these regions, markets, customers, products, and production processes are similar. Moreover, our business within each region generally leverages common systems, processes and infrastructure. Accordingly, North America and Europe comprise the Company’s reportable segments.
(Dollars in thousands) |
| Net Sales |
|
| Income from Operations |
|
| Net Sales |
|
| Income from Operations |
| ||||||||||||||||||||
Three Months Ended |
| June 30, |
|
| June 30, |
|
| June 30, |
|
| June 30, |
|
| March 31, |
|
| March 31, |
|
| March 31, |
|
| March 31, |
| ||||||||
North America |
| $ | 208,205 |
|
| $ | 259,677 |
|
| $ | 21,504 |
|
| $ | 24,679 |
|
| $ | 193,508 |
|
| $ | 211,618 |
|
| $ | 8,082 |
|
| $ | 21,715 |
|
Europe |
|
| 164,398 |
|
|
| 171,855 |
|
|
| 2,513 |
|
|
| 1,227 |
|
|
| 122,768 |
|
|
| 169,348 |
|
|
| (7,768 | ) |
|
| (6,579 | ) |
| $ | 372,603 |
|
| $ | 431,532 |
|
| $ | 24,017 |
|
| $ | 25,906 |
|
| $ | 316,276 |
|
| $ | 380,966 |
|
| $ | 314 |
|
| $ | 15,136 |
| |
|
|
|
|
|
|
|
|
|
| |||||||||||||||||||||||
(Dollars in thousands) |
| Depreciation and Amortization |
|
| Capital Expenditures |
| ||||||||||||||||||||||||||
Three Months Ended |
| June 30, |
|
| June 30, |
|
| June 30, |
|
| June 30, |
| ||||||||||||||||||||
North America |
| $ | 9,378 |
|
| $ | 9,055 |
|
| $ | 3,627 |
|
| $ | 11,630 |
| ||||||||||||||||
Europe |
|
| 14,089 |
|
|
| 14,071 |
|
|
| 2,535 |
|
|
| 4,704 |
| ||||||||||||||||
| $ | 23,467 |
|
| $ | 23,126 |
|
| $ | 6,162 |
|
| $ | 16,334 |
| |||||||||||||||||
(Dollars in thousands) |
| Net Sales |
|
| Income from Operations |
| ||||||||||
Six Months Ended |
| June 30, |
|
| June 30, |
|
| June 30, |
|
| June 30, |
| ||||
North America |
| $ | 419,823 |
|
| $ | 486,875 |
|
| $ | 43,219 |
|
| $ | 44,246 |
|
Europe |
|
| 333,746 |
|
|
| 345,183 |
|
|
| (4,066 | ) |
|
| 5,297 |
|
| $ | 753,569 |
|
| $ | 832,058 |
|
| $ | 39,153 |
|
| $ | 49,543 |
| |
|
|
|
|
|
|
|
|
|
|
|
|
| ||||
(Dollars in thousands) |
| Depreciation and Amortization |
|
| Capital Expenditures |
| ||||||||||
Six Months Ended |
| June 30, |
|
| June 30, |
|
| June 30, |
|
| June 30, |
| ||||
North America |
| $ | 18,425 |
|
| $ | 18,014 |
|
| $ | 15,070 |
|
| $ | 24,142 |
|
Europe |
|
| 27,883 |
|
|
| 29,194 |
|
|
| 6,681 |
|
|
| 10,146 |
|
| $ | 46,308 |
|
| $ | 47,208 |
|
| $ | 21,751 |
|
| $ | 34,288 |
| |
(Dollars in thousands) |
| Property, Plant and Equipment, net |
|
| Intangible Assets |
| ||||||||||
|
| June 30, |
|
| December 31, |
|
| June 30, |
|
| December 31, |
| ||||
North America |
| $ | 230,448 |
|
| $ | 220,321 |
|
| $ | — |
|
| $ | — |
|
Europe |
|
| 246,386 |
|
|
| 253,639 |
|
|
| 42,492 |
|
|
| 51,497 |
|
| $ | 476,834 |
|
| $ | 473,960 |
|
| $ | 42,492 |
|
| $ | 51,497 |
| |
(Dollars in thousands) |
| Total Assets |
| |||||
|
| June 30, |
|
| December 31, |
| ||
North America |
| $ | 615,661 |
|
| $ | 582,339 |
|
Europe |
|
| 544,551 |
|
|
| 551,400 |
|
| $ | 1,160,212 |
|
| $ | 1,133,739 |
| |
10
13
(Dollars in thousands) |
| Depreciation and Amortization |
|
| Capital Expenditures |
| ||||||||||
Three Months Ended |
| March 31, |
|
| March 31, |
|
| March 31, |
|
| March 31, |
| ||||
North America |
| $ | 10,343 |
|
| $ | 9,047 |
|
| $ | 4,557 |
|
| $ | 11,443 |
|
Europe |
|
| 11,603 |
|
|
| 13,794 |
|
|
| 2,061 |
|
|
| 4,146 |
|
| $ | 21,946 |
|
| $ | 22,841 |
|
| $ | 6,618 |
|
| $ | 15,589 |
| |
(Dollars in thousands) |
| Property, Plant and Equipment, net |
|
| Intangible Assets |
| ||||||||||
|
| March 31, |
|
| December 31, |
|
| March 31, |
|
| December 31, |
| ||||
North America |
| $ | 217,327 |
|
| $ | 220,951 |
|
| $ | — |
|
| $ | — |
|
Europe |
|
| 168,950 |
|
|
| 177,648 |
|
|
| 27,637 |
|
|
| 33,242 |
|
| $ | 386,277 |
|
| $ | 398,599 |
|
| $ | 27,637 |
|
| $ | 33,242 |
| |
(Dollars in thousands) |
| Total Assets |
| |||||
|
| March 31, |
|
| December 31, |
| ||
North America |
| $ | 615,752 |
|
| $ | 625,612 |
|
Europe |
|
| 389,760 |
|
|
| 404,959 |
|
| $ | 1,005,512 |
|
| $ | 1,030,571 |
| |
Geographic information
Net sales and property, plant and equipment by location are as follows:
|
|
|
|
| ||||||||||||||||||||
(Dollars in thousands) |
| Three Months Ended |
|
| Six Months Ended |
|
| Net Sales |
| |||||||||||||||
|
| June 30, |
|
| June 30, |
|
| June 30, |
|
| June 30, |
| ||||||||||||
Net sales: |
|
|
|
|
|
|
|
|
| |||||||||||||||
Three Months Ended |
| March 31, |
|
| March 31, |
| ||||||||||||||||||
U.S. |
| $ | 992 |
|
| $ | 1,292 |
|
| $ | 1,975 |
|
| $ | 2,950 |
|
| $ | 1,401 |
|
| $ | 983 |
|
Mexico |
|
| 207,213 |
|
|
| 258,385 |
|
|
| 417,848 |
|
|
| 483,925 |
|
|
| 192,107 |
|
|
| 210,635 |
|
Germany |
|
| 48,434 |
|
|
| 48,035 |
|
|
| 91,292 |
|
|
| 102,123 |
|
|
| 17,350 |
|
|
| 42,859 |
|
Poland |
|
| 115,964 |
|
|
| 123,820 |
|
|
| 242,454 |
|
|
| 243,060 |
|
|
| 105,418 |
|
|
| 126,489 |
|
Consolidated net sales |
| $ | 372,603 |
|
| $ | 431,532 |
|
| $ | 753,569 |
|
| $ | 832,058 |
|
| $ | 316,276 |
|
| $ | 380,966 |
|
|
|
|
|
|
|
|
|
|
|
|
|
|
|
|
|
| ||||||||
(Dollars in thousands) |
|
|
|
|
| Property, Plant and Equipment, net |
|
| Property, Plant and Equipment, net |
| ||||||||||||||
|
|
|
|
|
| June 30, |
|
| December 31, |
|
| March 31, |
|
| December 31, |
| ||||||||
U.S. |
|
|
|
|
| $ | 1,382 |
|
| $ | 1,476 |
|
| $ | 1,142 |
|
| $ | 1,228 |
| ||||
Mexico |
|
|
|
|
|
| 229,066 |
|
|
| 218,845 |
|
|
| 216,185 |
|
|
| 219,723 |
| ||||
Germany |
|
|
|
|
|
| 85,010 |
|
|
| 76,158 |
|
|
| 1,838 |
|
|
| 1,933 |
| ||||
Poland |
|
|
|
|
|
| 161,376 |
|
|
| 177,481 |
|
|
| 167,112 |
|
|
| 175,715 |
| ||||
Property, plant and equipment, net |
|
|
|
|
| $ | 476,834 |
|
| $ | 473,960 |
|
| $ | 386,277 |
|
| $ | 398,599 |
| ||||
NOTE 6 - INVENTORIES
|
| June 30, |
|
| December 31, |
|
| March 31, |
|
| December 31, |
| ||||
(Dollars in thousands) |
|
|
|
|
|
|
|
|
|
|
|
| ||||
Raw materials |
| $ | 53,663 |
|
| $ | 62,639 |
|
| $ | 49,601 |
|
| $ | 44,539 |
|
Work in process |
|
| 43,003 |
|
|
| 37,993 |
|
|
| 30,629 |
|
|
| 25,289 |
|
Finished goods |
|
| 85,194 |
|
|
| 78,056 |
|
|
| 68,800 |
|
|
| 74,781 |
|
Inventories, net |
| $ | 181,860 |
|
| $ | 178,688 |
|
| $ | 149,030 |
|
| $ | 144,609 |
|
Service wheel and supplies inventory included in other noncurrent assets in the condensed consolidated balance sheets totaled $12.611.0 million and $11.311.7 million at June 30, 2023March 31, 2024 and December 31, 2022,2023, respectively.
11
NOTE 7 - PROPERTY, PLANT AND EQUIPMENT
|
| June 30, |
|
| December 31, |
|
| March 31, |
|
| December 31, |
| ||||
(Dollars in thousands) |
|
|
|
|
|
|
|
|
|
|
|
| ||||
Land and buildings |
| $ | 164,245 |
|
| $ | 144,870 |
|
| $ | 147,534 |
|
| $ | 145,912 |
|
Machinery and equipment |
|
| 950,453 |
|
|
| 887,222 |
|
|
| 942,443 |
|
|
| 934,223 |
|
Leasehold improvements and others |
|
| 5,183 |
|
|
| 4,993 |
|
|
| 3,213 |
|
|
| 2,943 |
|
Construction in progress |
|
| 68,567 |
|
|
| 80,263 |
|
|
| 25,721 |
|
|
| 30,252 |
|
|
| 1,188,448 |
|
|
| 1,117,348 |
|
|
| 1,118,911 |
|
|
| 1,113,330 |
| |
Accumulated depreciation |
|
| (711,614 | ) |
|
| (643,388 | ) |
|
| (732,634 | ) |
|
| (714,731 | ) |
Property, plant and equipment, net |
| $ | 476,834 |
|
| $ | 473,960 |
|
| $ | 386,277 |
|
| $ | 398,599 |
|
Depreciation expense for the three months ended June 30,March 31, 2024 and 2023 and June 30, 2022 was $18.617.1 million and $17.6 million, respectively.
Depreciation expense for the six months ended June 30, 3023 and June 30, 2022 was $36.6 million and $35.418.0 million, respectively.
14
NOTE 8 – INTANGIBLE ASSETS
The Company’s finite-lived intangible assets as of June 30, 2023March 31, 2024 and December 31, 20222023 are summarized in the following table.
As of June 30, 2023 |
| Gross |
|
| Accumulated |
|
| Currency |
|
| Net Carrying Amount |
|
| Remaining |
| |||||||||||||||||||||||
As of March 31, 2024 |
| Gross |
|
| Accumulated |
|
| Currency |
|
| Net Carrying Amount |
|
| Remaining |
| |||||||||||||||||||||||
(Dollars in thousands) |
|
|
|
|
|
|
|
|
|
|
|
|
|
|
|
|
|
|
|
|
|
|
|
|
|
|
|
| ||||||||||
Customer relationships |
| $ | 167,000 |
|
| $ | (124,335 | ) |
| $ | (173 | ) |
| $ | 42,492 |
|
| 1-5 |
|
| $ | 167,000 |
|
| $ | (138,981 | ) |
| $ | (382 | ) |
| $ | 27,637 |
|
| 1-4 |
|
Year Ended December 31, 2022 |
| Gross |
|
| Accumulated |
|
| Currency |
|
| Net Carrying Amount |
|
| Remaining |
| |||||||||||||||||||||||
Year Ended December 31, 2023 |
| Gross |
|
| Accumulated |
|
| Currency |
|
| Net Carrying Amount |
|
| Remaining |
| |||||||||||||||||||||||
(Dollars in thousands) |
|
|
|
|
|
|
|
|
|
|
|
|
|
|
|
|
|
|
|
|
|
|
|
|
|
|
|
| ||||||||||
Customer relationships |
| $ | 167,000 |
|
| $ | (114,595 | ) |
| $ | (908 | ) |
| $ | 51,497 |
|
| 1-6 |
|
| $ | 167,000 |
|
| $ | (134,097 | ) |
| $ | 339 |
|
| $ | 33,242 |
|
| 1-5 |
|
Amortization expense for these intangible assets was $4.9 million and $5.64.8 million for the three months ended June 30,March 31, 2024 and 2023, and 2022, respectively. Amortization expense for these intangible assets was $9.7 million and $11.8 millionfor the six months ended June 30, 2023 and 2022, respectively. The anticipated annual amortization expense for these intangible assets is $19.519.4 million for 2023 and 2024, $9.69.5 million for 2025, $2.5 million for 2026, and $1.0 million for 2027.
NOTE 9 – DEBT
A summary of long-term debt and the related weighted average interest rates is shown below:
|
| June 30, 2023 |
|
| March 31, 2024 |
| ||||||||||||||||||||||||||
Debt Instrument |
| Total |
|
| Debt Discount and |
|
| Total |
|
| Weighted Average |
|
| Total |
|
| Debt Discount and |
|
| Total |
|
| Weighted Average |
| ||||||||
(Dollars in thousands) |
|
|
|
|
|
|
|
|
|
|
|
|
|
|
|
|
|
|
|
|
|
|
|
| ||||||||
Term Loan Facility |
| $ | 398,000 |
|
| $ | (21,583 | ) |
| $ | 376,417 |
|
|
| 12.9 | % |
| $ | 395,000 |
|
| $ | (19,355 | ) |
| $ | 375,645 |
|
|
| 13.3 | % |
6.00% Senior Notes |
|
| 235,825 |
|
|
| (1,966 | ) |
|
| 233,859 |
|
|
| 6.0 | % | ||||||||||||||||
6.00% Senior Notes |
|
| 234,197 |
|
|
| (1,229 | ) |
|
| 232,968 |
|
|
| 6.0 | % | ||||||||||||||||
European CapEx loans |
|
| 2,174 |
|
|
| — |
|
|
| 2,174 |
|
|
| 2.2 | % |
|
| 67 |
|
|
| — |
|
|
| 67 |
|
|
| 2.2 | % |
Finance leases |
|
| 2,688 |
|
|
| — |
|
|
| 2,688 |
|
|
| 2.6 | % |
|
| 937 |
|
|
| — |
|
|
| 937 |
|
|
| 2.4 | % |
| $ | 638,687 |
|
| $ | (23,549 | ) |
|
| 615,138 |
|
|
|
|
| $ | 630,201 |
|
| $ | (20,584 | ) |
|
| 609,617 |
|
|
|
| |||
Less: Current portion |
|
|
|
|
|
|
|
| (7,236 | ) |
|
|
|
|
|
|
|
|
|
|
| (4,571 | ) |
|
|
| ||||||
Long-term debt |
|
|
|
|
|
|
| $ | 607,902 |
|
|
|
|
|
|
|
|
|
|
| $ | 605,046 |
|
|
|
| ||||||
12
|
| December 31, 2022 |
| |||||||||||||
Debt Instrument |
| Total |
|
| Debt Discount and |
|
| Total |
|
| Weighted Average |
| ||||
(Dollars in thousands) |
|
|
|
|
|
|
|
|
|
|
|
| ||||
Term Loan Facility |
| $ | 400,000 |
|
| $ | (22,967 | ) |
| $ | 377,033 |
|
|
| 12.3 | % |
6.00% Senior Notes |
|
| 232,352 |
|
|
| (2,458 | ) |
|
| 229,894 |
|
|
| 6.0 | % |
European CapEx loans |
|
| 12,365 |
|
|
| — |
|
|
| 12,365 |
|
|
| 2.3 | % |
Finance leases |
|
| 2,726 |
|
|
| — |
|
|
| 2,726 |
|
|
| 2.7 | % |
| $ | 647,443 |
|
| $ | (25,425 | ) |
|
| 622,018 |
|
|
|
| ||
Less: Current portion |
|
|
|
|
|
|
|
| (5,873 | ) |
|
|
| |||
Long-term debt |
|
|
|
|
|
|
| $ | 616,145 |
|
|
|
| |||
|
| December 31, 2023 |
| |||||||||||||
Debt Instrument |
| Total |
|
| Debt Discount and |
|
| Total |
|
| Weighted Average |
| ||||
(Dollars in thousands) |
|
|
|
|
|
|
|
|
|
|
|
| ||||
Term Loan Facility |
| $ | 396,000 |
|
| $ | (20,080 | ) |
| $ | 375,920 |
|
|
| 13.4 | % |
6.00% Senior Notes |
|
| 239,601 |
|
|
| (1,475 | ) |
|
| 238,126 |
|
|
| 6.0 | % |
European CapEx loans |
|
| 784 |
|
|
| — |
|
|
| 784 |
|
|
| 2.2 | % |
Finance leases |
|
| 1,124 |
|
|
| — |
|
|
| 1,124 |
|
|
| 2.4 | % |
| $ | 637,509 |
|
| $ | (21,555 | ) |
|
| 615,954 |
|
|
|
| ||
Less: Current portion |
|
|
|
|
|
|
|
| (5,322 | ) |
|
|
| |||
Long-term debt |
|
|
|
|
|
|
| $ | 610,632 |
|
|
|
| |||
15
Senior Notes
On June 15, 2017, the Company issued €250 million aggregate principal amount of 6.00% Senior Notes (“Notes”) due June 15, 2025.2025 (the “Notes”). Interest on the Notes is payable semiannually, on June 15 and December 15. The Company may redeem the Notes, in whole or in part, at a redemption price of 100 percent, plus any accrued and unpaid interest to, but not including, the applicable redemption date. If we experience a change of control or sell certain assets, the Company may be required to offer to purchase the Notes from the holders. The Notes are senior unsecured obligations ranking equally in right of payment with all of its existing and future senior indebtedness and senior in right of payment to any subordinated indebtedness. The Notes are effectively subordinated in right of payment to the existing and future secured indebtedness of the Company, including the Senior Secured Credit Facilities (as defined below), to the extent of the assets securing such indebtedness.
Guarantee
The Notes are unconditionally guaranteed by all material wholly owned direct and indirect domestic restricted subsidiaries of the Company (the “Notes Subsidiary Guarantors”), with customary exceptions including, among other things, where providing such guarantees is not permitted by law, regulation or contract, or would result in adverse tax consequences.
Covenants
Subject to certain exceptions, the indenture governing the Notes contains restrictive covenants that, among other things, limit the ability of the Company and the Notes Subsidiary Guarantors to: (i) incur additional indebtedness or issue certain preferred stock; (ii) pay dividends on, or make distributions in respect of, their capital stock; (iii) make certain investments or other restricted payments; (iv) sell certain assets or issue capital stock of restricted subsidiaries; (v) create liens; (vi) merge, consolidate, transfer or dispose of substantially all of their assets; and (vii) engage in certain transactions with affiliates. These covenants are subject to several important limitations and exceptions that are described in the indenture.
The indenture provides for customary events of default that include, among other things (subject in certain cases to customary grace and cure periods): (i) nonpayment of principal, premium, if any, and interest, when due; (ii) failure for 60 days to comply with any obligations, covenants or agreements in the indenture after receipt of written notice from the Bank of New York Mellon, London Branch (the “Trustee”) or holders of at least 30 percent in principal amount of the then outstanding Notes of such failure (other than defaults referred to in the foregoing clause (i)); (iii) default under any mortgage, indenture or instrument for money borrowed by the Company or certain of its subsidiaries; (iv) a failure to pay certain judgments; and (v) certain events of bankruptcy and insolvency. If an event of default occurs and is continuing, the Trustee or holders of at least 30 percent in principal amount of the then outstanding Notes may declare the principal, premium, if any, and accrued and unpaid interest on all the Notes to be due and payable. These events of default are subject to several important qualifications, limitations and exceptions that are described in the indenture. As of June 30, 2023,March 31, 2024, the Company was in compliance with all covenants under the indenture governing the Notes.
Senior Secured Credit Facilities
On December 15, 2022, the Company entered into a $400.0 million term loan facility (the “Term Loan Facility”) pursuant to a credit agreement (the “Term Loan Credit Agreement”) with Oaktree Fund Administration L.L.C., in its capacity as the administrative agent, JPMorgan Chase Bank, N.A., in its capacity as collateral agent, and other lenders party thereto. Concurrent with the execution of the Term Loan Facility, the Company entered into a $60.0 million revolving credit facility (the “Revolving Credit Facility” and, together with the Term Loan Facility, the “Senior Secured Credit Facilities” or “SSCF”) pursuant to a credit agreement (the “Revolving Credit Agreement” and, together with the Term Loan Credit Agreement, the “Credit Agreements”) with JPMorgan Chase Bank, N.A., in its
13
capacity as administrative agent, collateral agent and issuing bank, and other lenders and issuing banks thereunder. The previously outstanding $107.5 million U.S. revolving credit facility and €60.0 million European revolving credit facility were terminated.
The Revolving Credit Facility and the Term Loan Facility are scheduled to mature on December 15, 2027 and December 15, 2028, respectively. However, in the event the Company has not repaid, refinanced or otherwise extended the maturity date of the Notes beyond the maturity date of the Term Loan Facility by the date 91 days prior to June 15, 2025, the Term Loan Facility and Revolving Credit Facility would mature 91 days prior to June 15, 2025. Similarly, in the event the Company has not redeemed, refinanced or otherwise extended the unconditional redemption date of the redeemable preferred stock beyond the maturity date of the Term Loan Facility by the date 91 days prior to September 14, 2025, the Term Loan Facility and Revolving Credit Facility would mature 91 days prior to September 14, 2025. The Term Loan Facility requires quarterly principal payments of $1.0 million. Additional principal payments may be due with respect to asset sales, debt issuances and as a percentage of cash flow in excess of a specified threshold.
16
The $388.0 million of proceeds from the Term Loan Facility (consisting of the $400.0 million aggregate principal less the original issuance discount of $12.0 million) were used to repay $349.2 million in borrowings under the previously outstanding term loan and pay debt issuance costs and expenses incurred in connection with the Term Loan Facility and Revolving Credit Facility. Debt issuance costs associated with the Term Loan Facility of $11.1 million are being amortized over the six-year term. Debt issuance costs and expenses associated with the Revolving Credit Facility of $3.2 million have been recognized as a deferred charge and are being amortized over the five-year term. In connection with the termination of the previously outstanding term loan and revolving credit facilities, unamortized debt issuance costs of $3.7 million were written off and charged to interest expense.
The Company may at any time request one or more increases in the amount of (i) commitments under the Term Loan Facility, up to an unlimited additional amount if, on a pro forma basis after the incurrence of such amount, the First Lien Net Leverage Ratio (as defined in the Term Loan Credit Agreement) does not exceed 2.00 to 1.00 and (ii) commitments under the Revolving Credit Facility, up to an aggregate maximum additional amount of $50.0 million, in each case, subject to certain conditions (including the agreement of a lender to provide such commitment increase). Amounts borrowed under the Term Loan Facility may be voluntarily prepaid at any time subject to a prepayment premium of2.00 percent of the loan principal plus the net present value of any unpaid post redemption interest in the first year and 2.00 percent and 1.00 percent of the loan principal during second and third years, respectively. After the third anniversary of the closing date, there is no prepayment premium.
Borrowings under the Term Loan Credit Facility bear interest at a rate equal to, at the Company’s option, either (i) the secured overnight financing rate (“SOFR”), with a floor of 1.50 percent per annum, or (ii) a base rate (“Term Base Rate”), with a floor of 1.50 percent per annum, equal to the highest of (1) the rate of interest in effect as publicly announced by the administrative agent as its prime rate, (2) the New York Federal Reserve Bank (the “NYFRB”) rate plus 0.50 percent and (3) SOFR for an interest period of one month plus 1.00 percent, in each case, plus the applicable rate. The applicable rate is determined by reference to the Company’s Secured Net Leverage Ratio (as defined in the Term Loan Credit Agreement) and will rangeranges between 7.50 percent and 8.00 percent for SOFR loans (7.758.00 percent for the current fiscal quarter), and between 6.50 percent and 7.00 percent for Term Base Rate loans (6.757.00 percent for the current fiscal quarter). In the event of a payment default under the Term Loan Credit Agreement, past due amounts shall be subject to an additional default interest rate of 2.00 percent.
Borrowings under the Revolving Credit Facility bear interest at a rate equal to, at the Company’s option, either (i) SOFR plus 0.10 percent (or, with respect to any borrowings denominated in euros, the adjusted Euro Interbank Offered Rate, “EURIBOR”), with a floor of 0.00 percent per annum or (ii) a base rate (“Revolving Loan Base Rate”), with a floor of 1.00 percent per annum, equal to the highest of (1) the rate of interest in effect as publicly announced by the administrative agent as its prime rate, (2) the NYFRB rate plus 0.50 percent and (3) SOFR for an interest period of one month plus 1.00 percent, in each case, plus the applicable rate. The applicable rate is determined by reference to the Company’s Secured Net Leverage Ratio (as defined in the Revolving Credit Agreement) and ranges between 3.50 percent and 4.50 percent for SOFR and EURIBOR loans (3.50 percent for the current fiscal quarter), and between 2.50 percent and 3.50 percent for Revolving Base Rate loans (2.50 percent for the current fiscal quarter). The commitment fee for the unused commitment under the Revolving Credit Facility varies between 0.50 percent and 0.625 percent depending on the Company’s Secured Net Leverage Ratio (0.50 percent for the current fiscal quarter). Commitment fees are included in interest expense. In the event of a payment default under the Revolving Credit Agreement, past due amounts shall be subject to an additional default interest rate of 2.00 percent.
Guarantees and Collateral Security
Our obligations under the Credit Agreements are unconditionally guaranteed by the Notes Subsidiary Guarantors and certain other domestic and foreign subsidiaries of the Company (collectively, the “SSCF Subsidiary Guarantors”), with customary exceptions including, among other things, where providing such guarantees is not permitted by law, regulation or contract or would result in adverse tax consequences. The guarantees of such obligations, are secured, subject to permitted liens and other exceptions, by substantially all of our assets and the SSCF Subsidiary Guarantors’ assets, including but not limited to: (i) a perfected pledge of all of the capital stock issued by each of the SSCF Subsidiary Guarantors’ (subject to certain exceptions) and (ii) perfected security interests in and mortgages on substantially all tangible and intangible personal property and material fee-owned real property of the Company and the SSCF Subsidiary Guarantors (subject to certain exceptions and exclusions). The Company’s obligations under the Revolving Credit Facility are secured by liens on a super-priority basis ranking ahead of the liens securing the Term Loan Facility.
14
Covenants
The Credit Agreements contain a number of restrictive covenants that, among other things, restrict, subject to certain exceptions, our ability to incur additional indebtedness and guarantee indebtedness, create or incur liens, engage in mergers or consolidations, sell, transfer or otherwise dispose of assets, make investments, acquisitions, loans or advances, pay dividends, distributions or other restricted payments, or repurchase our capital stock. The Credit Agreements also restrict our ability to prepay, redeem or repurchase any subordinated indebtedness, enter into agreements which limit our ability to incur liens on our assets or that restrict the ability of restricted subsidiaries to pay dividends or make other restricted payments to us, and enter into certain transactions with our affiliates.
17
The Term Loan Credit Agreement requires the Company to maintain (i) a quarterly Secured Net Leverage Ratio (as defined in the Term Loan Credit Agreement) of no more than 3.50:1.00 and (ii) Liquidity (defined as the sum of unrestricted cash and cash equivalent balances and unborrowed commitments under the Revolving Credit Facility) of at least $37.5 million (subject to adjustments up to $50.0 million following any increase in the commitment under the Revolving Credit Facility). The Revolving Credit Agreement requires the Company to maintain (i) a quarterly Total Net Leverage Ratio (as defined in the Revolving Credit Agreement) of no more than 4.50:1.00; (ii) a quarterly Secured Net Leverage Ratio (as defined in the Revolving Credit Agreement) of no more than 3.50:1.00; and (iii) Liquidity of at least $37.5 million (subject to adjustments up to $50.0 million following any increase in the commitment under the Revolving Credit Facility) but only so long as loans under the Term Loan Facility are outstanding. In the event unrestricted cash and cash equivalent balances fall below $37.5 million at any quarter end (or up to a maximum of $50.0 million following any increase in borrowings available under the Revolving Credit Facility), the available commitment under the Revolving Credit Facility would be reduced by the amount of any shortfall.
The Credit Agreements contain customary default provisions that include among other things: nonpayment of principal or interest when due, failure to comply with obligations, covenants or other provisions in the Credit Agreements, any failure of representations and warranties, cross-default under other debt agreements for obligations in excess of $20.0 million, insolvency, failure to pay judgments in excess of $20.0 million within 60 days of the judicial award, failure to pay any material plan withdrawal obligations under ERISA, invalidity of the loan agreement, invalidity of any security interest in the loan collateral, change of control and failure to maintain the financial covenants. In the event a default occurs, all commitments under the Senior Secured Credit Facilities would be terminated and the lenders would be entitled to declare the principal, premium, if any, and accrued and unpaid interest on all borrowings outstanding to be due and payable.
In addition, the Credit Agreements contain customary representations and warranties and other covenants. As of June 30, 2023,March 31, 2024, the Company was in compliance with all covenants under the Credit Agreements.
Available Unused Commitments under the Revolving Credit Facility
As of June 30, 2023,March 31, 2024, the Company had no outstanding borrowings under the Revolving Credit Facility, had outstanding letters of credit of $4.88.4 million and had available unused commitments under the Revolving Credit Facility of $55.251.6 million.
European Debt
In connection with the acquisition of UNIWHEELS AG in 2017, the Company assumed $70.7 million of outstanding debt. As of June 30, 2023, $2.2 million of the assumed debt remained outstanding. The debt matures March 31, 2024, and is collateralized by the financed equipment, guaranteed by Superior and bears interest at a rate of 2.2 percent. Covenants under the loan agreement include a default provision for nonpayment, as well as a material adverse change default provision pursuant to which the lender could accelerate the loan maturity. As of June 30, 2023, the Company was in compliance with all covenants under the loan agreement.
Debt maturities as of June 30, 2023,March 31, 2024, which are due in the next five years and thereafter are as follows:
Debt Maturities |
| Amount |
|
| Amount |
| ||
(Dollars in thousands) |
|
|
|
|
|
| ||
Six remaining months of 2023 |
| $ | 4,511 |
| ||||
2024 |
|
| 5,452 |
| ||||
Nine remaining months of 2024 |
| $ | 3,571 |
| ||||
2025 |
|
| 240,417 |
|
|
| 238,554 |
|
2026 |
|
| 4,190 |
|
|
| 4,074 |
|
2027 |
|
| 4,106 |
|
|
| 4,016 |
|
Thereafter |
|
| 380,011 |
| ||||
2028 |
|
| 379,986 |
| ||||
Total debt liabilities |
| $ | 638,687 |
|
| $ | 630,201 |
|
1815
NOTE 10 - SUPPLIER FINANCE PROGRAM
The Company receives extended payment terms for a portion of our purchases (90 days rather than 60 days) with one of our principal aluminum suppliers in exchange for a nominal adjustment to the product pricing. The payment terms provided to us are consistent with aluminum industry norms, as well as those offered to the supplier’s other customers. The supplier factors receivables due from us with a financial institution. We are not a party to the supplier’s factoring agreement with the financial institution. We remit payments directly to our supplier, except with respect to product purchased under extended terms which have been factored by the supplier. These payments are remitted directly to the financial institution in accordance with the payment terms originally negotiated with our supplier. These payments are included in cash flows from operations within the condensed consolidated statements of cash flows. The following table summarizes activity in the amounts owed to the financial institution for the sixthree months ended June 30, 2023March 31, 2024 and June 30, 2022:March 31, 2023:
|
| Six Months Ended |
|
| Three Months Ended |
| ||||||||||
|
| June 30, |
|
| June 30, |
|
| March 31, |
|
| March 31, |
| ||||
(Dollars in thousands) |
|
|
|
|
|
|
|
|
|
|
|
| ||||
Outstanding at the beginning of the period |
|
| 14,371 |
|
|
| 17,638 |
|
|
| 18,000 |
|
|
| 14,371 |
|
Added during the period |
|
| 65,341 |
|
|
| 69,385 |
|
|
| 27,995 |
|
|
| 25,299 |
|
Settled during the period |
|
| (56,197 | ) |
|
| (75,751 | ) |
|
| (28,780 | ) |
|
| (21,594 | ) |
Outstanding at the end of the period |
|
| 23,515 |
|
|
| 11,272 |
|
|
| 17,215 |
|
|
| 18,076 |
|
NOTE 11 - REDEEMABLE PREFERRED STOCK
During 2017, we issued 150,000 shares of Series A (140,202 shares) and Series B (9,798 shares) Perpetual Convertible Preferred Stock, par value $0.01 per share for $150.0 million. On August 30, 2017, the Series B shares were converted into Series A redeemable preferred stock (the “redeemable preferred stock”) after approval by our shareholders. The redeemable preferred stock has an initial stated value of $1,000 per share, par value of $0.01 per share and liquidation preference over common stock.
The redeemable preferred stock is convertible into shares of our common stock equal to the number of shares determined by dividing the sum of the stated value and any accrued and unpaid dividends by the conversion price of $28.162. The redeemable preferred stock accrues dividends at a rate of 99.0 percent per annum, payable at our election either in-kind or in cash and is also entitled to participate in dividends on common stock in an amount equal to that which would have been due had the shares been converted into common stock.
We may mandate conversion of the redeemable preferred stock if the price of the common stock exceeds $84.49. The holder may redeem the shares upon the occurrence of any of the following events (referred to as a “redemption event”): a change in control, recapitalization, merger, sale of substantially all of the Company’s assets, liquidation or delisting of the Company’s common stock. In addition, the holder may unconditionally redeem the shares at any time on or after September 14, 2025. We may, at our option, redeem in whole at any time all of the shares of redeemable preferred stock outstanding. At redemption by either party, the redemption value will be the greater of two times the initial face value ($150.0 million) and any accrued unpaid dividends or dividends paid-in-kind, currently $300.0 million, or the product of the number of common shares into which the redeemable preferred stock could be converted (5.3 million shares currently) and the then current market price of the common stock. Under Delaware law, anyAny redemption payment would be limited to the “surplus” that our Board determines iscash legally available to fund a full or partial redemption without rendering us insolvent.pay such redemption.
We have determined that the conversion option and the redemption option exercisable upon the occurrence of a “redemption event” which are embedded in the redeemable preferred stock must be accounted for separately from the redeemable preferred stock as a derivative liability.
Since the redeemable preferred stock may be redeemed at the option of the holder, but is not mandatorily redeemable, the redeemable preferred stock was classified as mezzanine equity and initially recognized at fair value of $150.0 million (the proceeds on the date of issuance), less issuance costs of $3.7 million and $10.9 million assigned to the embedded derivative liability at date of issuance, resulting in an adjusted initial value of $135.5 million.
The difference between the redemption value of the redeemable preferred stock and the carrying value (the “premium”) is being accreted over the period from the date of issuance through September 14, 2025 using the effective interest method. The accretion is treated as a deemed dividend, recorded as a charge to retained earnings and deducted in computing earnings per share (analogous to the treatment for stated and participating dividends paid on the redeemable preferred shares). The cumulative premium accretion as of June 30, 2023March 31, 2024 and December 31, 20222023 was $99.6119.5 million and $87.3112.7 million, respectively, resulting in adjusted redeemable preferred stock balances of $235.1255.0 million and $222.8248.2 million, respectively.
1916
NOTE 12 – EARNINGS PER SHARE
Basic earnings per share is computed by dividing net income (loss), after deducting preferred dividends and accretion and European noncontrolling redeemable equity dividends, by the weighted average number of common shares outstanding. For purposes of calculating diluted earnings per share, the weighted average shares outstanding includes the dilutive effect of outstanding stock options and time and performance based restricted stock units under the treasury stock method.
The redeemable preferred shares discussed in Note 11, “Redeemable Preferred Stock” (convertible into 5,326 thousand shares) have not been included in the diluted earnings per share because the inclusion of such shares on an as converted basis would be anti-dilutive for the three and six months ended June 30,March 31, 2024 and 2023. In addition, the redeemable preferred shares are considered participating securities because they participate in any common share dividends. In calculating basic and diluted earnings per share, a company with participating securities must allocate earnings to the participating securities with a corresponding reduction in the earnings attributable to common shares under the two-class method. Losses are only allocated to participating securities when the security holders have a contractual obligation to share in the losses of the Company with common stockholders. Because the redeemable preferred shareholders do not have a contractual obligation to share in the Company's losses with common stockholders, the full amount of the Company’s losses for the three months ended March 31, 2024 and March 31, 2023 and 2022.were attributed to the common shares.
|
| Three Months Ended |
|
| Six Months Ended |
|
| Three Months Ended |
| |||||||||||||||
|
| June 30, |
|
| June 30, |
|
| June 30, |
|
| June 30, |
|
| March 31, |
|
| March 31, |
| ||||||
(Dollars in thousands, except per share amounts) |
|
|
|
|
|
|
|
|
|
|
|
|
|
|
|
|
|
| ||||||
Basic Earnings Per Share: |
|
|
|
|
|
|
|
|
|
|
|
| ||||||||||||
Net (loss) income |
| $ | (67 | ) |
| $ | 10,844 |
|
| $ | (4,114 | ) |
| $ | 20,914 |
| ||||||||
Basic (Loss) Earnings Per Share: |
|
|
|
|
|
| ||||||||||||||||||
Net loss |
| $ | (32,749 | ) |
| $ | (4,047 | ) | ||||||||||||||||
Less: Redeemable preferred stock dividends and accretion |
|
| (9,645 | ) |
|
| (9,001 | ) |
|
| (19,085 | ) |
|
| (17,911 | ) |
|
| (10,166 | ) |
|
| (9,440 | ) |
Less: European noncontrolling redeemable equity dividend |
|
| (11 | ) |
|
| (11 | ) |
|
| (21 | ) |
|
| (22 | ) | ||||||||
Less: European non-controlling redeemable equity dividend |
|
| (7 | ) |
|
| (10 | ) | ||||||||||||||||
Basic numerator |
| $ | (9,723 | ) |
| $ | 1,832 |
|
| $ | (23,220 | ) |
| $ | 2,981 |
|
| $ | (42,922 | ) |
| $ | (13,497 | ) |
Basic (loss) earnings per share |
| $ | (0.35 | ) |
| $ | 0.07 |
|
| $ | (0.84 | ) |
| $ | 0.11 |
|
| $ | (1.52 | ) |
| $ | (0.49 | ) |
Weighted average shares outstanding – Basic |
|
| 28,035 |
|
|
| 26,918 |
|
|
| 27,669 |
|
|
| 26,659 |
|
|
| 28,254 |
|
|
| 27,299 |
|
Diluted Earnings Per Share: |
|
|
|
|
|
|
|
|
|
|
|
| ||||||||||||
Net (loss) income |
| $ | (67 | ) |
| $ | 10,844 |
|
| $ | (4,114 | ) |
| $ | 20,914 |
| ||||||||
Diluted (Loss) Earnings Per Share: |
|
|
|
|
|
| ||||||||||||||||||
Net loss |
| $ | (32,749 | ) |
| $ | (4,047 | ) | ||||||||||||||||
Less: Redeemable preferred stock dividends and accretion |
|
| (9,645 | ) |
|
| (9,001 | ) |
|
| (19,085 | ) |
|
| (17,911 | ) |
|
| (10,166 | ) |
|
| (9,440 | ) |
Less: European noncontrolling redeemable equity dividend |
|
| (11 | ) |
|
| (11 | ) |
|
| (21 | ) |
|
| (22 | ) | ||||||||
Less: European non-controlling redeemable equity dividend |
|
| (7 | ) |
|
| (10 | ) | ||||||||||||||||
Diluted numerator |
| $ | (9,723 | ) |
| $ | 1,832 |
|
| $ | (23,220 | ) |
| $ | 2,981 |
|
| $ | (42,922 | ) |
| $ | (13,497 | ) |
Diluted (loss) earnings per share |
| $ | (0.35 | ) |
| $ | 0.07 |
|
| $ | (0.84 | ) |
| $ | 0.11 |
|
| $ | (1.52 | ) |
| $ | (0.49 | ) |
Weighted average shares outstanding – Basic |
|
| 28,035 |
|
|
| 26,918 |
|
|
| 27,669 |
|
|
| 26,659 |
|
|
| 28,254 |
|
|
| 27,299 |
|
Dilutive effect of common share equivalents |
|
| — |
|
|
| 504 |
|
|
| — |
|
|
| 677 |
|
|
| — |
|
|
| — |
|
Weighted average shares outstanding – Diluted |
|
| 28,035 |
|
|
| 27,422 |
|
|
| 27,669 |
|
|
| 27,336 |
|
|
| 28,254 |
|
|
| 27,299 |
|
NOTE 13 - INCOME TAXES
The estimated annual effective tax rate is forecasted quarterly using actual historical information and forward-looking estimates and applied to year-to-date ordinary income. The tax effects of unusual or infrequently occurring items, including changes in judgment about valuation allowances, settlements with taxing authorities and effects of changes in tax laws or rates, and changes due to tax restructuring are reported in the interim period in which they occur.
Income taxes for the three months ended March 31, 2024 were a $16.6 million tax provision on a pre-tax loss of $16.1, resulting in an effective income tax rate of (103.4) percent. The effective income tax rate for the three months ended March 31, 2024 differs from the statutory rate primarily due to valuation allowances, the reversal of an uncertain tax position, the mix of earnings among tax jurisdictions, and a tax charge impacting deferred tax assets related to tax restructuring of $17.8 million.
The income tax provision for the three and six months ended June 30,March 31, 2023 was $5.83.3 million and $9.1 million, respectively, on a pre-tax incomeloss of $5.7 million and $5.00.7 million, resulting in an effective income tax rate of (101.2440.3 percent and 182.6 percent, respectively.) percent. The effective income tax rate for the three months ended June 30, 2023 differs from the statutory rate primarily due to valuation allowances and the mix of earnings among tax jurisdictions. The effective income tax rate for the six months ended June 30,March 31, 2023 differs from the statutory rate primarily due to valuation allowances, the reversal of an uncertain tax position and the mix of earnings among tax jurisdictions.
The income tax provision for the three and six months ended June 30, 2022 was $5.4 million and $8.9 million, respectively, on pre-tax income of $16.2 million and $29.8 million, resulting in an effective income tax rate of 33.3 percent and 29.9 percent, respectively. The effective income tax rate for the three months ended June 30, 2022 differs from the statutory rate primarily due to valuation allowances and the mix of earnings among tax jurisdictions. The effective income tax rate for the six months ended June 30, 2022 differs from the statutory rate primarily due to valuation allowances, the reversal of an uncertain tax position and the mix of earnings among tax jurisdictions.
The Company continuously evaluates the realizability of our net deferred tax assets. As of June 30, 2023,March 31, 2024, certain U.S. and substantially all our U.S. and certain German deferred tax assets, net of deferred tax liabilities, were subject to valuation allowances. If our financial results improve, our assessment of the realization of our net deferred tax assets could result in the release of some or all of the valuation allowances. Such a release would result in a material noncash income tax benefit in the period of release and the recording of additional deferred tax assets. There is a reasonable possibility that, within the next twelve months, sufficient positive evidence becomes available to reach a conclusion that all or a significant portion of the valuation allowances against our U.S. net deferred tax assets would no longer be required.
2017
The Organization for Economic Co-operation and Development has issued Pillar Two model rules introducing a new global minimum tax of 15.0 percent effective January 1, 2024. While the United States has not yet adopted the Pillar Two rules, various other governments around the world have enacted part of the legislation. As currently designed, Pillar Two ultimately applies to our worldwide operations. Currently, enacted Pillar Two legislation does not have a material impact on our financial statements. We will continue to assess U.S. and global legislative action related to Pillar Two for potential impacts.
NOTE 14 - LEASES
The Company determines whether an arrangement is or contains a lease at the inception of the arrangement. Operating leases are included in other noncurrent assets, accrued expenses and other noncurrent liabilities in our condensed consolidated balance sheets. Finance leases are included in property, plant and equipment, net, short-term debt and long-term debt (less current portion) in our condensed consolidated balance sheets.
Right-of-use (“ROU”) assets represent our right to use an underlying asset for the lease term and lease liabilities represent our obligation to make lease payments arising from the lease. Finance and operating lease ROU assets and liabilities are recognized at the commencement date based on the present value of the lease payments over the lease term. Since we generally do not have access to the interest rate implicit in the lease, the Company uses our incremental borrowing rate (for fully collateralized debt) at the inception of the lease in determining the present value of the lease payments. The implicit rate is, however, used where readily available. Lease expense under operating leases is recognized on a straight-line basis over the term of the lease. Certain of our leases contain both lease and nonlease components, which are accounted for separately.
The Company has operating and finance leases for office facilities, a data center and certain equipment. The remaining terms of our leases range from over one year to sixfive years. Certain leases include options to extend the lease term for up to ten years, as well as options to terminate, both of which have been excluded from the term of the lease since exercise of these options is not reasonably certain.
2118
Lease expense and cash flow for the three and six months ended June 30,March 31, 2024 and March 31, 2023 and June 30, 2022 and operating and finance lease assets and liabilities, average lease term and average discount rate as of June 30, 2023March 31, 2024 and December 31, 20222023 are as follows:
|
| Three Months Ended |
|
| Six Months Ended |
|
| Three Months Ended |
| |||||||||||||||
|
| June 30, |
|
| June 30, |
|
| June 30, |
|
| June 30, |
|
| March 31, |
|
| March 31, |
| ||||||
(Dollars in thousands) |
|
|
|
|
|
|
|
|
|
|
|
|
|
| ||||||||||
Lease Expense |
|
|
|
|
|
|
|
|
|
|
|
|
|
|
|
|
|
| ||||||
Finance lease expense: |
|
|
|
|
|
|
|
|
|
|
|
|
|
|
|
|
|
| ||||||
Amortization of right-of-use assets |
| $ | 251 |
|
| $ | 259 |
|
| $ | 496 |
|
| $ | 573 |
|
| $ | 135 |
|
| $ | 245 |
|
Interest on lease liabilities |
|
| 15 |
|
|
| 14 |
|
|
| 31 |
|
|
| 29 |
|
|
| 6 |
|
|
| 16 |
|
Operating lease expense |
|
| 738 |
|
|
| 659 |
|
|
| 1,361 |
|
|
| 1,345 |
|
|
| 827 |
|
|
| 623 |
|
Total lease expense |
| $ | 1,004 |
|
| $ | 932 |
|
| $ | 1,888 |
|
| $ | 1,947 |
|
| $ | 968 |
|
| $ | 884 |
|
|
|
|
|
|
|
|
|
|
|
|
|
|
|
|
|
|
|
| ||||||
Cash Flow Components |
|
|
|
|
|
|
|
|
|
|
|
|
|
| ||||||||||
Cash paid for amounts included in the measurement of lease liabilities: |
|
|
|
|
|
|
|
|
|
|
|
|
|
| ||||||||||
Operating cash outflows from finance leases |
| $ | 15 |
|
| $ | 14 |
|
| $ | 31 |
|
| $ | 29 |
|
| $ | 6 |
|
| $ | 16 |
|
Operating cash outflows from operating leases |
|
| 766 |
|
|
| 711 |
|
|
| 1,402 |
|
|
| 1,469 |
|
|
| 853 |
|
|
| 636 |
|
Financing cash outflows from finance leases |
|
| 263 |
|
|
| 243 |
|
|
| 551 |
|
|
| 547 |
|
|
| 150 |
|
|
| 288 |
|
Right-of-use assets obtained in exchange for finance lease liabilities, |
|
| 142 |
|
|
| 212 |
|
|
| 538 |
|
|
| 335 |
|
|
| 7 |
|
|
| 396 |
|
Right-of-use assets obtained in exchange for operating lease liabilities, |
|
| 651 |
|
|
| 61 |
|
|
| 651 |
|
|
| 232 |
|
|
| 15 |
|
|
| — |
|
|
|
|
|
|
|
|
|
|
|
|
|
|
|
| ||||||||||
|
|
|
|
|
|
| June 30, |
|
| December 31, |
|
| March 31, |
|
| December 31, |
| |||||||
(Dollars in thousands, except lease term and discount rate) |
|
|
|
|
|
|
|
|
|
|
|
|
|
| ||||||||||
Balance Sheet Information |
|
|
|
|
|
|
|
|
|
|
|
|
|
| ||||||||||
Operating leases: |
|
|
|
|
|
|
|
|
|
|
|
|
|
| ||||||||||
Other noncurrent assets |
|
|
|
|
| $ | 8,145 |
|
| $ | 8,325 |
|
| $ | 9,176 |
|
| $ | 10,003 |
| ||||
Accrued liabilities |
|
|
|
|
| $ | (2,471 | ) |
| $ | (2,137 | ) |
| $ | (2,920 | ) |
| $ | (2,987 | ) | ||||
Other noncurrent liabilities |
|
|
|
|
|
| (5,698 | ) |
|
| (6,516 | ) |
|
| (6,221 | ) |
|
| (7,000 | ) | ||||
Total operating lease liabilities |
|
|
|
|
| $ | (8,169 | ) |
| $ | (8,653 | ) |
| $ | (9,141 | ) |
| $ | (9,987 | ) | ||||
|
|
|
|
|
|
|
|
|
|
|
|
|
|
| ||||||||||
Finance leases: |
|
|
|
|
|
|
|
|
|
|
|
|
|
| ||||||||||
Property, plant and equipment gross |
|
|
|
|
| $ | 8,460 |
|
| $ | 7,899 |
|
| $ | 2,308 |
|
| $ | 2,301 |
| ||||
Accumulated depreciation |
|
|
|
|
|
| (6,180 | ) |
|
| (5,684 | ) |
|
| (1,017 | ) |
|
| (882 | ) | ||||
Property, plant and equipment, net |
|
|
|
|
| $ | 2,280 |
|
| $ | 2,215 |
|
| $ | 1,291 |
|
| $ | 1,419 |
| ||||
Current portion of long-term debt |
|
|
|
|
| $ | (1,062 | ) |
| $ | (1,053 | ) |
| $ | (504 | ) |
| $ | (538 | ) | ||||
Long-term debt (less current portion) |
|
|
|
|
|
| (1,626 | ) |
|
| (1,673 | ) |
|
| (433 | ) |
|
| (586 | ) | ||||
Total finance lease liabilities |
|
|
|
|
| $ | (2,688 | ) |
| $ | (2,726 | ) |
| $ | (937 | ) |
| $ | (1,124 | ) | ||||
|
|
|
|
|
|
|
|
|
|
|
|
|
|
| ||||||||||
Lease Term and Discount Rates |
|
|
|
|
|
|
|
|
|
|
|
|
|
| ||||||||||
Weighted-average remaining lease term - finance leases (years) |
|
|
|
|
|
| 2.9 |
|
|
| 3.2 |
|
|
| 1.9 |
|
|
| 2.0 |
| ||||
Weighted-average remaining lease term - operating leases (years) |
|
|
|
|
|
| 3.6 |
|
|
| 4.2 |
|
|
| 3.1 |
|
|
| 3.3 |
| ||||
Weighted-average discount rate - finance leases |
|
|
|
|
|
| 2.6 | % |
|
| 2.7 | % |
|
| 2.4 | % |
|
| 2.4 | % | ||||
Weighted-average discount rate - operating leases |
|
|
|
|
|
| 3.8 | % |
|
| 3.6 | % |
|
| 5.0 | % |
|
| 5.0 | % | ||||
19
22
Future minimum payments under our leases as of June 30, 2023March 31, 2024 are as follows:
|
|
| Amount |
|
| Amount |
| |||||||||||||
(Dollars in thousands) |
|
|
|
|
|
|
|
|
|
|
|
| ||||||||
Lease Maturities |
|
| Finance Leases |
|
| Operating Leases |
|
| Finance Leases |
|
| Operating Leases |
| |||||||
Six remaining months of 2023 |
| $ | 1,062 |
|
| $ | 1,263 |
| ||||||||||||
2024 |
|
| 727 |
|
|
| 2,449 |
| ||||||||||||
Nine remaining months of 2024 |
| $ | 504 |
|
| $ | 2,575 |
| ||||||||||||
2025 |
|
| 592 |
|
|
| 2,099 |
|
|
| 357 |
|
|
| 3,048 |
| ||||
2026 |
|
| 190 |
|
|
| 1,941 |
|
|
| 74 |
|
|
| 2,902 |
| ||||
2027 |
|
| 106 |
|
|
| 915 |
|
|
| 16 |
|
|
| 1,299 |
| ||||
Thereafter |
|
| 103 |
|
|
| 43 |
| ||||||||||||
2028 |
|
| 8 |
|
|
| - |
| ||||||||||||
Total |
|
| 2,780 |
|
|
| 8,710 |
|
|
| 959 |
|
|
| 9,824 |
| ||||
Less: Imputed interest |
|
| (92 | ) |
|
| (541 | ) |
|
| (22 | ) |
|
| (683 | ) | ||||
Total lease liabilities, net of interest |
| $ | 2,688 |
|
| $ | 8,169 |
|
| $ | 937 |
|
| $ | 9,141 |
| ||||
NOTE 15 – RETIREMENT PLANS
We have an unfunded salary continuation plan covering certain directors, officers and other key members of management. Subject to certain vesting requirements, the plan provides for a benefit based on final average compensation, which becomes payable on the employee’s death or upon attaining age 65, if retired. The plan was closed to new participants effective February 3, 2011.
For the sixthree months ended June 30, 2023March 31, 2024 payments to retirees or their beneficiaries totaled approximately $0.70.4 million. We presently anticipate benefit payments in 20232024 to total $1.41.5 million. The following table summarizes the components of net periodic pension cost for the three and six months ended June 30, 2023March 31, 2024 and June 30, 2022.March 31, 2023.
|
| Three Months Ended |
|
| Six Months Ended |
|
| Three Months Ended |
| |||||||||||||||
|
| June 30, |
|
| June 30, |
|
| June 30, |
|
| June 30, |
|
| March 31, |
|
| March 31, |
| ||||||
(Dollars in thousands) |
|
|
|
|
|
|
|
|
|
|
|
|
|
|
|
|
|
| ||||||
Interest cost |
| $ | 304 |
|
| $ | 218 |
|
| $ | 608 |
|
| $ | 436 |
|
| $ | 290 |
|
| $ | 304 |
|
Net amortization |
|
| — |
|
|
| 83 |
|
|
| — |
|
|
| 166 |
|
|
| 1 |
|
|
| — |
|
Net periodic pension cost |
| $ | 304 |
|
| $ | 301 |
|
| $ | 608 |
|
| $ | 602 |
|
| $ | 291 |
|
| $ | 304 |
|
NOTE 16 - STOCK-BASED COMPENSATION
Equity Incentive Plan
Our 2018 Equity Incentive Plan (the “Plan”) was approved by stockholders in May 2018, authorizing us to issue up to 4.35 million shares of common stock, along with nonqualifiednon-qualified stock options, stock appreciation rights, restricted stock units and performance restricted stock units to our officers, key employees, nonemployee directors and consultants. In May 2021 and 2023, the stockholders approved an amendmentamendments to the Plan that, among other things, increased the authorized shares by 22.0 million. In May 2023, the stockholders approved an amendment to the Plan that, among other things, increased the authorized shares bymillion and 3.43.5 million.million, respectively. At June 30, 2023,March 31, 2024, there were 2.00.9 million shares available for future grants under this Plan. It is our policy to issue shares from authorized but not issued shares upon the exercise of stock options.
Under the terms of the Plan, each year eligible participants are granted time value restricted stock units (“RSUs”), vesting ratably over a three-year period, and performance restricted stock units (“PSUs”) with three-year cliff vesting. Upon vesting, each restricted stock award is exchangeable for one share of the Company’s common stock, with accrued dividends.
23
RSU, PSU and option activity for the sixthree months ended June 30,March 31, 2024 and March 31, 2023 and June 30, 2022 is summarized in the following table:
|
| Equity Incentive Awards |
|
| Equity Incentive Awards |
| ||||||||||||||||||||||||||||||||||
|
| Restricted |
|
| Weighted |
|
| Performance |
|
| Weighted |
|
| Options |
|
| Weighted |
|
| Restricted |
|
| Weighted |
|
| Performance |
|
| Weighted |
| ||||||||||
Balance at January 1, 2023 |
|
| 896,799 |
|
| $ | 4.16 |
|
|
| 2,323,101 |
|
| $ | 6.26 |
|
|
| — |
|
| $ | — |
| ||||||||||||||||
Balance at January 1, 2024 |
|
| 1,001,634 |
|
| $ | 4.39 |
|
|
| 2,192,759 |
|
| $ | 5.24 |
| ||||||||||||||||||||||||
Granted |
|
| 687,781 |
|
|
| 4.23 |
|
|
| 920,264 |
|
|
| 4.80 |
|
|
| — |
|
|
| — |
|
|
| 397,496 |
|
|
| 2.99 |
|
|
| 762,584 |
|
|
| 3.82 |
|
Settled |
|
| (553,093 | ) |
|
| 3.80 |
|
|
| (1,016,574 | ) |
|
| 5.13 |
|
|
| — |
|
|
| — |
|
|
| (231,037 | ) |
|
| 4.90 |
|
|
| (605,150 | ) |
|
| 5.80 |
|
Forfeited or expired |
|
| (29,853 | ) |
|
| 5.80 |
|
|
| (34,037 | ) |
|
| 8.50 |
|
|
| — |
|
|
| — |
|
|
| — |
|
|
| — |
|
|
| — |
|
|
| — |
|
Balance at June 30, 2023 |
|
| 1,001,634 |
|
| $ | 4.39 |
|
|
| 2,192,754 |
|
| $ | 5.98 |
|
|
| — |
|
| $ | — |
| ||||||||||||||||
Balance at March 31, 2024 |
|
| 1,168,093 |
|
| $ | 3.81 |
|
|
| 2,350,193 |
|
| $ | 4.63 |
| ||||||||||||||||||||||||
|
|
|
|
|
|
|
|
|
|
|
|
|
|
|
|
|
|
|
|
|
|
|
|
|
|
|
|
|
| |||||||||||
Awards estimated to vest in the future |
|
| 1,001,634 |
|
| $ | 4.39 |
|
|
| 2,362,196 |
|
| $ | 5.97 |
|
|
| — |
|
| $ | — |
|
|
| 1,168,093 |
|
| $ | 3.81 |
|
|
| 2,350,193 |
|
| $ | 4.63 |
|
|
| Equity Incentive Awards |
| |||||||||||||||||||||
|
| Restricted |
|
| Weighted |
|
| Performance |
|
| Weighted |
|
| Options |
|
| Weighted |
| ||||||
Balance at January 1, 2022 |
|
| 966,429 |
|
| $ | 4.62 |
|
|
| 2,484,581 |
|
| $ | 6.67 |
|
|
| 9,000 |
|
| $ | 16.76 |
|
Granted |
|
| 515,491 |
|
|
| 3.93 |
|
|
| 667,345 |
|
|
| 5.33 |
|
|
| — |
|
|
| — |
|
Settled |
|
| (580,551 | ) |
|
| 4.73 |
|
|
| (719,659 | ) |
|
| 6.68 |
|
|
| — |
|
|
| — |
|
Forfeited or expired |
|
| (4,570 | ) |
|
| 3.77 |
|
|
| (109,166 | ) |
|
| 7.24 |
|
|
| (9,000 | ) |
|
| 16.76 |
|
Balance at June 30, 2022 |
|
| 896,799 |
|
| $ | 4.16 |
|
|
| 2,323,101 |
|
| $ | 6.26 |
|
|
| — |
|
| $ | — |
|
|
|
|
|
|
|
|
|
|
|
|
|
|
|
|
|
|
| |||||||
Awards estimated to vest in the future |
|
| 896,799 |
|
| $ | 4.16 |
|
|
| 2,097,894 |
|
| $ | 6.28 |
|
|
| — |
|
| $ | — |
|
20
|
| Equity Incentive Awards |
| |||||||||||||
|
| Restricted |
|
| Weighted |
|
| Performance |
|
| Weighted |
| ||||
Balance at January 1, 2023 |
|
| 896,799 |
|
| $ | 4.16 |
|
|
| 2,323,101 |
|
| $ | 6.26 |
|
Granted |
|
| 56,818 |
|
|
| 4.40 |
|
|
| 56,818 |
|
|
| 5.39 |
|
Settled |
|
| (369,585 | ) |
|
| 4.04 |
|
|
| (1,016,574 | ) |
|
| 5.13 |
|
Forfeited or expired |
|
| (29,853 | ) |
|
| 5.80 |
|
|
| (34,037 | ) |
|
| 8.50 |
|
Balance at March 31, 2023 |
|
| 554,179 |
|
| $ | 4.23 |
|
|
| 1,329,308 |
|
| $ | 6.78 |
|
|
|
|
|
|
|
|
|
|
|
|
| |||||
Awards estimated to vest in the future |
|
| 554,179 |
|
| $ | 4.23 |
|
|
| 1,329,308 |
|
| $ | 6.78 |
|
Stock-based compensation expense for the three months ended June 30,March 31, 2024 and 2023 and 2022 was $2.21.7 million and $2.0 million, respectively. Stock-based compensation for the six months ended June 30, 2023 and 2022 was $3.0 million and $4.70.8 million, respectively. Unrecognized stock-based compensation expense related to nonvested awards of $11.510.1 million is expected to be recognized over a weighted average period of approximately 2.02.1 years as of June 30, 2023.March 31, 2024.
NOTE 17 – COMMITMENTS AND CONTINGENCIES
Purchase Commitments
When market conditions warrant, we may enter into purchase commitments to secure the supply of certain commodities used in the manufacture of our products, such as aluminum, electricity, natural gas and other raw materials. Prices under our aluminum contracts are based on a market index and regional premiums for processing, transportation and alloy components which are adjusted quarterly for purchases in the ensuing quarter. Certain of our purchase agreements include volume commitments, however any excess commitments are generally negotiated with suppliers and those which have occurred in the past have been carried over to future periods.
Contingencies
We are party to various legal and environmental proceedings incidental to our business. Certain claims, suits and complaints arising in the ordinary course of business have been filed or are pending against us. Based on facts now known, except as provided below, we believe all such matters are adequately provided for, covered by insurance, are without merit and/or involve such amounts that would not materially adversely affect our consolidated results of operations, cash flows or financial position.
In March 2022, the German Federal Cartel Office initiated an investigation related to European light alloy wheel manufacturers, including Superior Industries Europe AG (a wholly owned subsidiary of the Company), on suspicion of conduct restricting competition. The Company is cooperating fully with the German Federal Cartel Office. In the event Superior Industries Europe AG is deemed to have violated the applicable statutes, the Company could be subject to a fine or civil proceedings. At this point, we are unable to predict the duration or the outcome of the investigation.
2421
The Company purchases electricity and natural gas requirements for its manufacturing operations in Poland from a single energy distributor. Superior and its energy distributor, as well as the parent company of the energy distributor, have filed various claims against one another. These claims generally request the court to determine whether Superior’s energy contracts with the energy distributor were valid during the period December 2021 through May 2022.
In December 2021, the Company’s energy distributor informed the Company it would no longer supply energy, notwithstanding its contractual obligation to continue supply. Following a request from the Company, the court enjoinedissued an injunction ordering the energy distributor from terminating supplyto continue supplying energy and gas to the Company. TheIn 2022, the Company obtained a final and binding judgment confirming that the original contracts with the energy distributor had not been effectively dissolved, and thus remained binding.
In September of 2022, the energy distributor’s parent company filed a suit against the Company asserting that the Company’s energy contracts were no longer valid and asserting that the Company owed additional amounts for its purchases between December 2021 and May 2022 equal to the excess of market prices over prices set forth in the original energy contracts. IfIn June 2023, the court concludes thatCompany obtained a judgment dismissing the claim in its entirety. In August 2023, the energy contracts were not valid during this period, Superior could be required to pay up todistributor's parent company filed an additional $14.1 million for its energy purchases plus interest. Any such adverse judgment would be appealed byappeal. Based on recent developments at an appellate hearing, the Company. A final conclusion in this matter is anticipated to take 18-24 months. We haveCompany has concluded that an unfavorable rulingadverse judgment is notnow probable and, therefore, we have of occurring. Accordingly, the Company has recognized a provision of $no1.5t recognized any provision for this contingent million which represents the low end of the estimated range of the potential loss. The remaining potential loss as of June 30, 2023.is immaterial.
NOTE 18 – RECEIVABLES FACTORING
The Company sells certain customer trade receivables on a non-recourse basis under factoring arrangements with designated financial institutions. These transactions are accounted for as sales and cash proceeds are included in cash provided by operating activities. Factoring arrangements incorporate customary representations and warranties, including representations as to validity of amounts due, completeness of performance obligations and absence of commercial disputes. During the three months ended June 30,March 31, 2024 and 2023, and 2022, the Company sold trade receivables totaling $198.1161.8 million and $246.0225.3 million, respectively, and incurred factoring fees of $1.01.2 million and $0.8 million, respectively. During the six months ended June 30, 2023 and 2022, the Company sold trade receivables totaling $423.4 million and $454.7 million, respectively, and incurred factoring fees of $2.0 million and $1.41.0 million, respectively. As of June 30, 2023March 31, 2024 and December 31, 2022,2023, receivables of $102.398.9 million and $97.292.4 million, respectively, had been factored and had not yet been paid by customers to the respective financial institutions. The collective limit under our factoring arrangements was $165.6141.2 million and $150.0142.1 million as of June 30, 2023March 31, 2024 and December 31, 20222023 respectively.
NOTE 19 – RESTRUCTURING
During the first quarter of 2023, the Company initiated a reduction in its global workforce to better align our cost structure with lower automotive industry production levels. As a result, the Company recognized a restructuring charge of $5.3 million of separation costs, $2.8 million of which was charged to selling, general and administrative expenses and $2.5 million which was charged to cost of sales. During the second quarter of 2023, the Company incurredrecognized an additional restructuring charge of $2.5 million for separation costs which was charged to cost of sales. As of June 30, 2023,March 31, 2024, the Company had paid $1.93.8 million in separation costs, reduced the accrual by $1.8 million related to the deconsolidation of a subsidiary and reversed $0.7 million subsequent to recognition of the restructuring charges, resulting in a remaining accrual of $5.91.5 million.
25NOTE 20 – RECEIVABLE FROM SPG BANKRUPTCY ESTATE
On August 31, 2023 (the “Filing Date”), the Company’s wholly owned subsidiary Superior Industries Production Germany GmbH (“SPG”) filed voluntary petitions for preliminary insolvency proceedings (i.e., equivalent to Chapter 11 under the U.S. Bankruptcy Code) in the Neustadt an der Weinstrasse, Germany Insolvency Court (the “Insolvency Court”) seeking relief under the German Insolvency Code (the “Insolvency Code”). SPG filed motions with the Insolvency Court seeking authorization to continue to operate its business as a “debtor-in-possession” under the jurisdiction of the Insolvency Court and in accordance with the applicable provisions of the Insolvency Code and orders of the Insolvency Court. Effective as of the Filing Date, the Company no longer controlled SPG and, therefore, no longer included SPG in its consolidated financial statements. Prior to the Filing Date, SPG was included in the Company’s consolidated financial statements.
On November 21, 2023, upon the request of the managing directors of SPG, the Insolvency Court ordered the withdrawal from the preliminary self-administrative insolvency proceedings and the continuation in preliminary ordinary proceedings (equivalent to Chapter 7 under the U.S. Bankruptcy Code). On December 1, 2023, the Insolvency Court passed a resolution to terminate the preliminary phase and to open ordinary insolvency proceedings with respect to SPG. These actions had no impact on the Company’s consolidated financial statements due to the previously mentioned deconsolidation effective August 31, 2023.
As of March 31, 2024 and December 31, 2023, the Company's receivable due from the SPG bankruptcy estate was $14.5 million and $15.3 million, respectively, and the associated allowance was $13.8 million and $14.8 million, respectively. The resulting net receivable as of March 31, 2024 and December 31, 2023 was $0.7 million and $0.5 million, respectively, which has been included in other noncurrent assets in the Company’s condensed consolidated balance sheet.
22
Item 2. Management’s Discussion and Analysis of Financial Condition and Results of Operations
Forward-Looking Statements
The Private Securities Litigation Reform Act of 1995 provides a safe harbor for forward-looking statements made by us or on our behalf. We have included or incorporated by reference in this Quarterly Report on Form 10-Q (including in the sections entitled “Risk Factors” and “Management’s Discussion and Analysis of Financial Condition and Results of Operations”), and from time to time our management may make, statements that may constitute “forward-looking statements” within the meaning of Section 27A of the Securities Act of 1933 and Section 21E of the Securities Exchange Act of 1934. These forward-looking statements are based upon management’s current expectations, estimates, assumptions and beliefs concerning future events and conditions and may discuss, among other things, the impact of COVID-19 and the resulting supply chain disruptions, energy costs and semiconductor chip shortages, and rising interest rates, as well as the Russian military invasion of Ukraine (the “Ukraine Conflict”), and the United Auto Workers ("UAW") strike, on our future growth and earnings. Any statement that is not historical in nature is a forward-looking statement and may be identified using words and phrases such as “expects,” “anticipates,” “believes,” “will,” “will likely result,” “will continue,” “plans to,” “could,” “continue,” “estimates,” and similar expressions. These statements include our belief regarding general automotive industry and market conditions and growth rates, as well as general domestic and international economic conditions.
Readers are cautioned not to place undue reliance on forward-looking statements. Forward-looking statements are necessarily subject to risks, uncertainties and other factors, many of which are outside the control of the Company, which could cause actual results to differ materially from such statements and from the Company’s historical results and experience. These risks, uncertainties and other factors include, but are not limited to, those described in Part I, Item 1A, “Risk Factors” and Part II, Item 7 “Management’s Discussion and Analysis of Financial Condition and Results of Operations” of our Annual Report on Form 10-K for the year ended December 31, 20222023 and Part I, Item 2 “Management’s Discussion and Analysis of Financial Condition and Results of Operations,”Operations” and Part II, Item 1A “Risk Factors” and elsewhere in this Quarterly Report and those described from time to time in our other reports filed with the Securities and Exchange Commission.
Readers are cautioned that it is not possible to predict or identify all the risks, uncertainties and other factors that may affect future results and that the risks described herein should not be considered to be a complete list. Any forward-looking statement speaks only as of the date on which such statement is made, and the Company undertakes no obligation to update or revise any forward-looking statement, whether as a result of new information, future events or otherwise.
Management’s Discussion and Analysis of Financial Condition and Results of Operations should be read in conjunction with the accompanying unaudited condensed consolidated financial statements and notes thereto and with the audited consolidated financial statements and notes thereto and Management’s Discussion and Analysis of Financial Condition and Results of Operations included in our Annual Report on Form 10-K for the year ended December 31, 2022.2023.
Executive Overview
Overview of Superior
The principal business of Superior Industries International, Inc.’s (referred to herein as the “Company,” “Superior,” or “we” and “our”) principal business is the design and manufacture of aluminum wheels for sale to original equipment manufacturers (“OEMs”) in North America and Europe and to the aftermarket in Europe. We employ approximately 7,1006,800 full-time employees, operating in eightseven manufacturing facilities in North America and Europe. We are one of the largest aluminum wheel suppliers to global OEMs and one of the leading European aluminum wheel aftermarket manufacturers and suppliers. Our OEM aluminum wheels accounted for approximately 9692 percent of our sales in the first sixthree months of 20232024 and are primarily sold for factory installation on vehicle models manufactured by BMW (including Mini), Ford, GM, Honda, Jaguar-Land Rover, Lucid Motors, Mazda, Mercedes-Benz Group,Mitsubishi, Nissan, PSA,Peugeot, Renault, Stellantis, Subaru, Suzuki, Toyota, VW Group (Volkswagen, Audi, SEAT, Skoda, Porsche, Bentley) and Volvo. We sell aluminum wheels to the European aftermarket under the brands ATS, RIAL, ALUTEC and ANZIO. North America and Europe represent the principal markets for our products, but we have a diversified global customer base consisting of North American, European and Asian OEMs.
Demand for our products is mainly driven by light vehicle production levels in North America and Europe and customer take rates on specific vehicle platforms that we serve and wheel SKUs that we produce. The majority of our customers’ wheel programs are awarded two to four years before actual production is expected to begin. Our purchase orders with OEMs are typically specific to a particular vehicle model.
2623
GM, Ford, VW Group, Ford and Toyota each individually accounted for 10 percent or more of our consolidated sales for the three and six months ended June 30,March 31, 2024 and March 31, 2023. ForAs described in Note 20, "Receivable from SPG Bankruptcy Estate" in the Notes to Condensed Consolidated financial Statements in Item 1, "Financial Statements," sales to the VW Group for the three and six months ended June 30, 2022, GM, VW Group, and Ford each individually accounted for 10 percent or moreMarch 31, 2024 reflect the impact of our consolidated sales and Toyota accounted for 9 percentthe deconsolidation of our consolidated sales.the financial results of the manufacturing facility in Germany, SPG. Our sales to these customers were as follows:
Three Months Ended |
| June 30, 2023 |
|
| June 30, 2022 |
|
| March 31, 2024 |
|
| March 31, 2023 |
| ||||||||||||
(Dollars in millions) |
| Percent of |
| Dollars |
|
| Percent of |
| Dollars |
|
| Percent of |
| Dollars |
|
| Percent of |
| Dollars |
| ||||
GM |
| 20% |
| $ | 72.7 |
|
| 30% |
| $ | 127.4 |
|
| 23% |
| $ | 73.7 |
|
| 22% |
| $ | 83.0 |
|
Ford |
| 16% |
| $ | 50.2 |
|
| 12% |
| $ | 46.4 |
| ||||||||||||
VW Group |
| 17% |
| $ | 63.2 |
|
| 13% |
| $ | 56.4 |
|
| 12% |
| $ | 37.6 |
|
| 17% |
| $ | 66.4 |
|
Ford |
| 17% |
| $ | 64.2 |
|
| 17% |
| $ | 71.6 |
| ||||||||||||
Toyota |
| 10% |
| $ | 38.4 |
|
| 9% |
| $ | 37.2 |
|
| 10% |
| $ | 32.4 |
|
| 11% |
| $ | 43.5 |
|
|
|
|
|
|
| |||||||||||||||||||
Six Months Ended |
| June 30, 2023 |
|
| June 30, 2022 |
| ||||||||||||||||||
(Dollars in millions) |
| Percent of |
| Dollars |
|
| Percent of |
| Dollars |
| ||||||||||||||
GM |
| 21% |
| $ | 155.7 |
|
| 28% |
| $ | 233.7 |
| ||||||||||||
VW Group |
| 17% |
| $ | 129.6 |
|
| 13% |
| $ | 110.5 |
| ||||||||||||
Ford |
| 15% |
| $ | 110.6 |
|
| 15% |
| $ | 129.4 |
| ||||||||||||
Toyota |
| 11% |
| $ | 82.0 |
|
| 9% |
| $ | 78.2 |
| ||||||||||||
Industry Overview, Supply Chain Disruption and Ukraine Conflict
There is a broad range of factors which impact automotive industry sales and production volumes, including consumer demand and preferences, dealer inventory levels, labor relations issues, trade agreements, cost and availability of raw materials and components, fuel prices, regulatory requirements, government initiatives, availability and cost of credit, changing consumer attitudes toward vehicle ownership and other factors. Our sales are driven generally by overall automotive industry production volumes and, more specifically, by the volumes of the vehicles for which we supply wheels. In addition, larger diameter wheels and premium finishes command higher unit prices. Larger cars and light trucks, as well as premium vehicle platforms, such as luxury, sport utility and crossover vehicles, typically employ larger diameter wheels and premium finishes.
The automotive industry continues to bewas impacted by the supply chain disruption which emerged as OEM vehicle production resumed and began to scale following the shutdown because ofduring the COVID-19 pandemic. TheIn 2021 and 2022, the supply chain disruption includesincluded shortages of semiconductor chips, electric vehicle batteries, shipping containers, steel, resin and foam. The semiconductor chip shortage has continued to constrain OEM vehicle production throughout 2022 and 2023, although there was some improvement in the first and second quarter of 2023. Rising costsCost inflation experienced in 2021, 2022 and the first six months of 2023 are expected to continue.has moderated somewhat but remains higher than pre-pandemic levels. In addition, the Ukraine Conflict which resulted in temporary shutdowns at certain OEM production facilities in early 2022, began to affect our production volume in March 2022 and continues to contributecontributed to order volatility and inflationary cost pressures. AlthoughAfter significantly increasing in 2021 and 2022, the cost of energy has moderated in the first six months of 2023, although energy costs remain higher in Europe than prices prevailing prior to the pandemic and the Ukraine Conflict. While the prices under our OEM contracts are adjusted for changes in the cost of aluminum and certain other costs, our aftermarket contracts do not provide such pass through of aluminum or other costs. Future increases in raw material costs and OEM production volatility may cause our inventory levels to increase, negatively impacting our cash flows. In addition, higher interest rates have adversely affected, and will likely continue to affect our earnings and cash flow from operations due to the interest rates applicable under our $400 million Term Loan Facility.
Automotive industry production volumes in the North American and Western and Central European regions in the first sixthree months of 2023,2024 (as published by IHS, an automotive industry analyst), as compared to the corresponding periods of 20222023 and 2021,2022, are shown below:
Automotive Industry Production (North America and Western and Central Europe) | Automotive Industry Production (North America and Western and Central Europe) |
|
| Automotive Industry Production (North America and Western and Central Europe) |
|
| ||||||||||||||||||||||||||||||
Six Months Ended |
| June 30, |
|
| 2023 vs 2022 |
| 2022 vs 2021 |
|
| |||||||||||||||||||||||||||
Three Months Ended |
| March 31, |
|
| 2024 vs 2023 |
| 2023 vs 2022 |
|
| |||||||||||||||||||||||||||
|
| 2023 |
| 2022 |
| 2021 |
|
| % Change |
| % Change |
|
|
| 2024 |
| 2023 |
| 2022 |
|
| % Change |
| % Change |
|
| ||||||||||
(Units in thousands) |
|
|
|
|
|
|
|
|
|
|
|
|
|
|
|
|
|
|
|
|
|
|
|
|
|
| ||||||||||
North America |
|
| 7,966 |
| 7,121 |
| 6,800 |
|
|
| 11.9 | % |
| 4.7 | % |
|
|
| 3,945 |
| 3,891 |
| 3,550 |
|
|
| 1.4 | % |
| 9.6 | % |
| ||||
Western and Central Europe |
|
| 8,036 |
|
| 6,715 |
|
| 7,317 |
|
|
| 19.7 | % |
| (8.2 | %) |
|
|
| 3,871 |
|
| 4,088 |
|
| 3,260 |
|
|
| (5.3 | %) |
| 25.4 | % |
|
Total |
|
| 16,002 |
|
| 13,836 |
|
| 14,117 |
|
|
| 15.7 | % |
| (2.0 | %) |
|
|
| 7,816 |
|
| 7,979 |
|
| 6,810 |
|
|
| (2.0 | %) |
| 17.2 | % |
|
Automotive industry production volumes in our principal markets increased 15.7declined 2.0 percent in the first six monthsquarter of 2023 as compared to 2022. North American production volumes increased 11.9 percent and Western and Central European production volumes increased 19.7 percent primarily due to easing supply chain constraints. However, the Ukraine Conflict may continue to be a constraint on future European automotive production volumes and, therefore, Superior production volumes.
27
The July 2023 IHS forecast projects that the 2023 production will be 9.9 percent higher than 2022 (8.2 percent in North America and 11.72024 (declining 5.3 percent in Western and Central Europe) but 10.3Europe, partially offset by an increase of 1.4 percent in North America) and were 14.0 percent lower than 2019 pre-pandemic levels. Elevated vehicle cost, higher financing costs,Production volumes of our key customers decreased 0.9 percent (declining 9.4 percent in Western and consumer inflationCentral Europe, partially offset by an increase of 6.0 percent in North America).
In the first quarter of 2024, the Company’s unit shipments declined 0.3 million units, or 6.1 percent, on a year-over-year basis comprised of a 17.4 percent decline in Europe, partially offset by a 2.5 percent increase in North America. The European year-over-year decrease in unit shipments was primarily attributable to the exit from an unprofitable contract with one of our customers during
24
2023 resulting in a decrease of 0.2 million units and recession concerns are likely affecting vehicle demandthe deconsolidation of SPG resulting in a decrease of 0.3 million units. This was partially offset by a 0.1 million unit increase in our aftermarket business due to improving market demand.
The IHS forecast projects that production volumes in our principal markets.markets are expected to decline 0.5 percent in 2024 (a decline of 3.0 percent in Western and Central Europe, partially offset by a 2.1 percent increase in North America). Production volumes of our key customers are forecast to increase 0.8 percent (an increase of 4.1 percent in North America, partially offset by a decline of 3.9 percent in Western and Central Europe), according to IHS.
Sustainability
We published our 20222023 Sustainability Report on August 31, 2022.in December 2023. That report reflected the results of the materiality assessment we conducted in 2021 to identify the sustainability interests of our stakeholders toand develop our sustainability strategy. WeBased on that input, we remain committed to reducing natural gas, electricity and water consumption and solid waste and air emissions at our facilities. All Superior manufacturing plantsfacilities have implemented Environmental Management Systems that are ISO14001 certified and are subject to annual audits by an independent third party.
The 20222023 Sustainability Report confirmed our goal to be carbon neutral by 2039 and reported the carbon footprint of our global operations. Through 2022, weWe reduced our carbon footprint by approximately 12% and our emissions per pound of aluminum shipped by 21% versus our baselineas compared to 2020 levels.We continue to explore opportunities to:
Furthermore, our research and development team continues to develop light weighting solutions, such as our patented Alulite™ technology, and aerodynamic solutions that will assist in reducing our customers’ carbon footprint. We also collaborate with our customers and suppliers regarding sustainability practices throughout their supply chains. We expect to publish our 2023 Sustainability Report in the third quarter of 2023.
Overview of the SecondFirst Quarter of 20232024
The following charts show the operational performance in the quarter ended June 30, 2023March 31, 2024 in comparison to the quarter ended June 30, 2022March 31, 2023 (dollars in millions):
SALES AND PROFITABILITY FOR THE 3RD QUARTER OF 2019 AND 2018 ($ in millions) Sales for 3rd Quarter 2019 & 2018 $352.0 $347.6 2019 2019 Income from Operations 3rd Quarter 2019 & 2018$(0.2) $7.7 2019 218 Net Income & Adjusted EBITDA* for 3rd Quarter 2019 & 2018 Net Income Adjusted EBITDA $38.9 $30.6 $(6.6) 2019 2018 * See the Non-GAAP Financial Measures section of this quarterly report for a reconciliation of our Adjusted EBITDA to Net Income (Loss).
2825
Results of Operations
|
| Three Months Ended |
|
|
|
|
| Three Months Ended |
|
|
|
| ||||||||||||
|
| June 30, |
|
| June 30, |
|
| Net |
|
| March 31, |
|
| March 31, |
|
| Net |
| ||||||
(Dollars in thousands, except per share data) |
|
|
|
|
|
|
|
|
|
|
|
|
|
|
|
|
|
| ||||||
Net sales |
|
|
|
|
|
|
|
|
|
|
|
|
|
|
|
|
|
| ||||||
North America |
| $ | 208,205 |
|
| $ | 259,677 |
|
| $ | (51,472 | ) |
| $ | 193,508 |
|
| $ | 211,618 |
|
| $ | (18,110 | ) |
Europe |
|
| 164,398 |
|
|
| 171,855 |
|
|
| (7,457 | ) |
|
| 122,768 |
|
|
| 169,348 |
|
|
| (46,580 | ) |
Net sales |
|
| 372,603 |
|
|
| 431,532 |
|
|
| (58,929 | ) |
|
| 316,276 |
|
|
| 380,966 |
|
|
| (64,690 | ) |
Cost of sales |
|
| 331,570 |
|
|
| 388,905 |
|
|
| 57,335 |
|
|
| 295,130 |
|
|
| 346,388 |
|
|
| 51,258 |
|
Gross profit |
|
| 41,033 |
|
|
| 42,627 |
|
|
| (1,594 | ) |
|
| 21,146 |
|
|
| 34,578 |
|
|
| (13,432 | ) |
Percentage of net sales |
|
| 11.0 | % |
|
| 9.9 | % |
|
| 1.1 | % |
|
| 6.7 | % |
|
| 9.1 | % |
|
| (2.4 | )% |
Selling, general and administrative expenses |
|
| 17,016 |
|
|
| 16,721 |
|
|
| (295 | ) |
|
| 20,832 |
|
|
| 19,442 |
|
|
| (1,390 | ) |
Income from operations |
|
| 24,017 |
|
|
| 25,906 |
|
|
| (1,889 | ) |
|
| 314 |
|
|
| 15,136 |
|
|
| (14,822 | ) |
Percentage of net sales |
|
| 6.4 | % |
|
| 6.0 | % |
|
| 0.4 | % |
|
| 0.1 | % |
|
| 4.0 | % |
|
| (3.9 | )% |
Interest expense, net |
|
| (15,690 | ) |
|
| (10,338 | ) |
|
| (5,352 | ) |
|
| (15,878 | ) |
|
| (15,698 | ) |
|
| (180 | ) |
Other (expense) income, net |
|
| (2,600 | ) |
|
| 681 |
|
|
| (3,281 | ) | ||||||||||||
Other expense, net |
|
| (537 | ) |
|
| (187 | ) |
|
| (350 | ) | ||||||||||||
Income tax provision |
|
| (5,794 | ) |
|
| (5,405 | ) |
|
| (389 | ) |
|
| (16,648 | ) |
|
| (3,298 | ) |
|
| (13,350 | ) |
Net (loss) income |
| $ | (67 | ) |
| $ | 10,844 |
|
| $ | (10,911 | ) | ||||||||||||
Net loss |
| $ | (32,749 | ) |
| $ | (4,047 | ) |
| $ | (28,702 | ) | ||||||||||||
Percentage of net sales |
|
| — |
|
|
| 2.5 | % |
|
| (2.5 | )% |
|
| (10.4 | )% |
|
| (1.1 | )% |
|
| (9.3 | )% |
Diluted (loss) earnings per share |
| $ | (0.35 | ) |
| $ | 0.07 |
|
| $ | (0.42 | ) |
| $ | (1.52 | ) |
| $ | (0.49 | ) |
| $ | (1.03 | ) |
Value added sales (1) |
| $ | 200,243 |
|
| $ | 185,532 |
|
| $ | 14,711 |
|
| $ | 172,198 |
|
| $ | 202,662 |
|
| $ | (30,464 | ) |
Value added sales adjusted for foreign exchange (1) |
| $ | 198,216 |
|
| $ | 185,532 |
|
| $ | 12,684 |
|
| $ | 171,330 |
|
| $ | 202,662 |
|
| $ | (31,332 | ) |
Adjusted EBITDA (2) |
| $ | 52,018 |
|
| $ | 51,346 |
|
| $ | 672 |
|
| $ | 30,849 |
|
| $ | 45,489 |
|
| $ | (14,640 | ) |
Percentage of net sales |
|
| 14.0 | % |
|
| 11.9 | % |
|
| 2.1 | % |
|
| 9.8 | % |
|
| 11.9 | % |
|
| (2.1 | )% |
Percentage of value added sales |
|
| 26.0 | % |
|
| 27.7 | % |
|
| (1.7 | )% |
|
| 17.9 | % |
|
| 22.4 | % |
|
| (4.5 | )% |
Unit shipments in thousands |
|
| 3,781 |
|
|
| 4,004 |
|
|
| (223 | ) |
|
| 3,623 |
|
|
| 3,858 |
|
|
| (235 | ) |
Shipments
Wheel unit shipments were 3.83.6 million for the secondfirst quarter of 20232024 compared to unit shipments of 4.03.9 million for the same period in 2022,2023, a decrease of 5.66.1 percent. Our North American unit shipments were relatively flat as comparedThe majority of the decrease was due to the second quarter of 2022 despite the 14.9 percent increasedecline in automotive production volumes in North America primarily due to a temporary disruption in production at one of our customer’s facilities which has now resumed operations. European unit shipments declined 12.1 percent as compared to the second quarter of 2022 despite the 14.2 percent increase in automotive production volumes in Western and Central Europe. The majority of this decrease was attributable to the decrease in the European aftermarket unit shipments which were down 50.0 percent in the second quarter of 2023 as compared to the second quarter in 2022. This decrease was a result of soft aftermarket demand due to a slowdown of the European economy, which has negatively impacted consumer discretionary income, and high aftermarket wheel inventory levels. In addition, we exitedexit from an unprofitable contract with one of our European customers andduring 2023 which we have not yet replaced those volumes with new business.business, resulting in a 0.2 million reduction in unit shipments. In addition, the deconsolidation of the financial results of the manufacturing facility in Germany, SPG, resulted in a reduction of 0.3 million unit shipments. These declines were partially offset by a substantial improvement in our aftermarket business with unit shipments increasing 0.1 million, or 72.6 percent due to improved market demand.
Net Sales
Net sales for the secondfirst quarter of 20232024 were $372.6$316.3 million, compared to net sales of $431.5$381.0 million for the same period in 2022,2023, a decrease of 13.717.0 percent. The decrease in net sales was primarily due to lower aluminum pass throughs to our OEM customers of $73.6$34.1 million, unfavorable pricing and product mix of $16.1 million and $11.5 million of lower unit shipments, partially offset by favorable product mix and pricing of $23.5 million.
Value Added Sales Adjusted for Foreign Exchange
Value added sales adjusted for foreign exchange is a key metric in evaluating the growth of the Company excluding the volatility resulting from fluctuating aluminum costs and foreign exchange rates. Our aluminum wheel target market is heavily contented wheels; that is, large diameter wheels, wheels with lightweighting and aerodynamic technologies, and wheels with premium finishes. Value added sales adjusted for foreign exchange was $198.2 million for the second quarter of 2023 compared to value added sales
29
adjusted for foreign exchange of $185.5 million for the same period in 2022, an increase of 6.8 percent. This increase was primarily due to heavily contented wheels, favorable product mix and product pricing.
Cost of Sales
Cost of sales was $331.6 million for the second quarter of 2023 compared to cost of sales of $388.9 million for the same period in 2022. The decrease in cost of sales was primarily due to $65.2 million of lower aluminum costs and $6.2 million lower shipment volumes, partially offset by a $7.4 million increase due to product mix and a restructuring charge of $2.5 million (refer to Note 19 “Restructuring” in the Notes to the Condensed Consolidated Financial Statements in Item 1, “Financial Statements”), as well as an increase in conversion costs due to unfavorable cost absorption on lower production volumes.
Selling, General and Administrative Expenses
Selling, general and administrative (“SG&A”) expense of $17.0 million for the second quarter of 2023 was flat compared to $16.7 million for the same period in 2022.
Net Interest Expense
Net interest expense for the second quarter of 2023 was $15.7 million compared to net interest expense of $10.3 million for the same period in 2022, a $5.4 million increase. The increase is due to a $50.8 million increase in the principal amount of term loan debt as a result of the refinancing in December 2022, rising interest rates and a higher credit spread on the new term loan (refer to Note 9 “Debt” in the Notes to the Condensed Consolidated Financial Statements in Item 1, “Financial Statements”).
Other Income (Expense)
Other expense for the second quarter of 2023 was $2.6 million compared to other income of $0.7 million for the same period in 2022. The majority of the expense in the second quarter of 2023 is attributable to the additional $1.4 million casualty loss arising from the Werdohl flood. The remaining variance in other income (expense) is mainly driven by unfavorable foreign exchange.
Income Tax (Provision) Benefit
The income tax provision for the second quarter of 2023 was $5.8 million on pre-tax income of 5.7 million, representing an effective income tax rate of 101.2 percent. This differs from the statutory rate primarily due to valuation allowances and the mix of earnings among tax jurisdictions. The income tax provision for the second quarter of 2022 was $5.4 million on a pre-tax income of $16.2 million, representing an effective income tax rate of 33.3 percent. This differs from the statutory rate primarily due to valuation allowances and the mix of earnings among tax jurisdictions.
Net Income (Loss)
Net loss for the second quarter of 2023 was $0.1 million, or a $0.35 loss per diluted share, compared to net income of $10.8 million, or $0.07 per diluted share, for the same period in 2022.
Segment Sales and Income from Operations
|
| Three Months Ended |
|
|
|
| ||||||
|
| June 30, |
|
| June 30, |
|
| Change |
| |||
(Dollars in thousands) |
|
|
|
|
|
|
|
|
| |||
Selected data |
|
|
|
|
|
|
|
|
| |||
Net sales |
|
|
|
|
|
|
|
|
| |||
North America |
| $ | 208,205 |
|
| $ | 259,677 |
|
| $ | (51,472 | ) |
Europe |
|
| 164,398 |
|
|
| 171,855 |
|
|
| (7,457 | ) |
Total net sales |
| $ | 372,603 |
|
| $ | 431,532 |
|
| $ | (58,929 | ) |
Income from operations |
|
|
|
|
|
|
|
|
| |||
North America |
| $ | 21,504 |
|
| $ | 24,679 |
|
| $ | (3,175 | ) |
Europe |
|
| 2,513 |
|
|
| 1,227 |
|
|
| 1,286 |
|
Total income from operations |
| $ | 24,017 |
|
| $ | 25,906 |
|
| $ | (1,889 | ) |
North America
Net sales for our North American segment for the second quarter of 2023 decreased 19.8 percent while unit shipments remained flat, compared to the same period in 2022. The $51.5 million decrease in net sales was primarily due to lower aluminum cost pass throughs to our OEM customers of $59.6 million, partially offset by favorable product mix and pricing. North American segment income from operations for the second quarter of 2023 decreased by $3.2 million, as compared to the same period in 2022, primarily due to higher non-aluminum raw material costs of $8.5 million partially offset by favorable product mix and pricing.
30
Europe
Net sales for our European segment for the second quarter of 2023 decreased 4.3 percent while unit shipments decreased 12.1 percent, compared to the same period in 2022. Net sales were lower primarily due to $14.0 million of lower aluminum pass throughs and $11.0$15.4 million due to lower unit shipments partially offset by favorable product mix and pricing. European segment income from operations for the second quarter of 2023 was $1.30.2 million higher primarily due to favorable product mix and pricing of $9.8 million. Favorable product mix and pricing were largely offset by a decrease of $5.0 million due to lower unit shipments, a $2.5 million restructuring charge and higher conversion costs of $1.0 million due to unfavorable cost absorption as a result of lower production volumes (refer to Note 19 “Restructuring” in the Notes to the Condensed Consolidated Financial Statements in Item 1, “Financial Statements”).
Overview of the First Half of 2023
The following chart shows the operational performance in the six months ended June 30, 2023 in comparison to the six months ended June 30, 2022 ($ in millions):
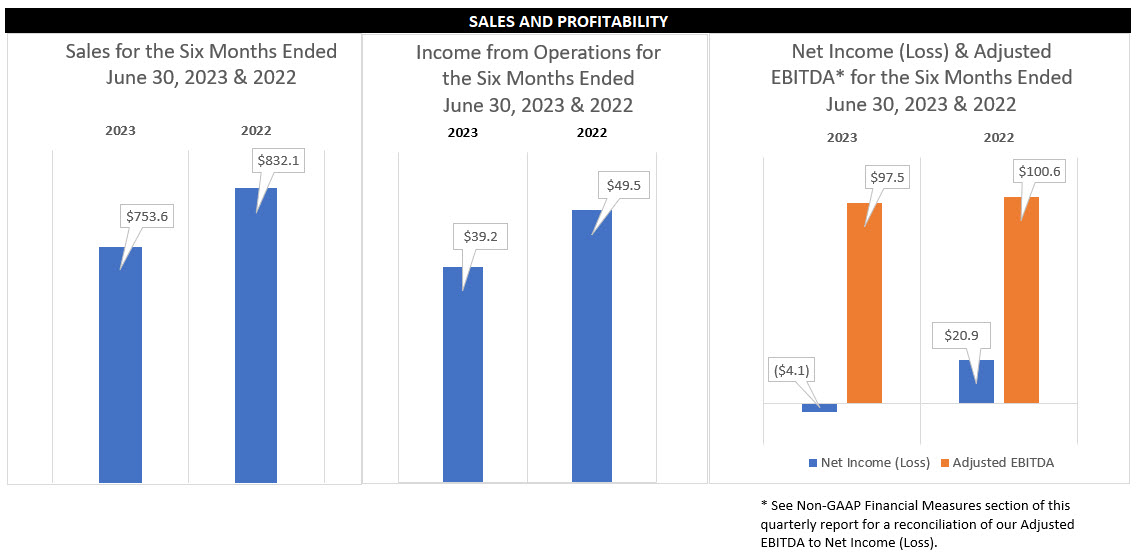
31
Results of Operations
|
| Six Months Ended |
|
|
|
| ||||||
|
| June 30, |
|
| June 30, |
|
| Net |
| |||
(Dollars in thousands, except per share data) |
|
|
|
|
|
|
|
|
| |||
Net sales |
|
|
|
|
|
|
|
|
| |||
North America |
| $ | 419,823 |
|
| $ | 486,875 |
|
| $ | (67,052 | ) |
Europe |
|
| 333,746 |
|
|
| 345,183 |
|
|
| (11,437 | ) |
Net sales |
|
| 753,569 |
|
|
| 832,058 |
|
|
| (78,489 | ) |
Cost of sales |
|
| 677,958 |
|
|
| 748,844 |
|
|
| 70,886 |
|
Gross profit |
|
| 75,611 |
|
|
| 83,214 |
|
|
| (7,603 | ) |
Percentage of net sales |
|
| 10.0 | % |
|
| 10.0 | % |
|
| — |
|
Selling, general and administrative expenses |
|
| 36,458 |
|
|
| 33,671 |
|
|
| (2,787 | ) |
Income from operations |
|
| 39,153 |
|
|
| 49,543 |
|
|
| (10,390 | ) |
Percentage of net sales |
|
| 5.2 | % |
|
| 6.0 | % |
|
| (0.8 | )% |
Interest expense, net |
|
| (31,388 | ) |
|
| (20,300 | ) |
|
| (11,088 | ) |
Other (expense) income, net |
|
| (2,787 | ) |
|
| 594 |
|
|
| (3,381 | ) |
Income tax provision |
|
| (9,092 | ) |
|
| (8,923 | ) |
|
| (169 | ) |
Net (loss) income |
| $ | (4,114 | ) |
| $ | 20,914 |
|
| $ | (25,028 | ) |
Percentage of net sales |
|
| (0.5 | )% |
|
| 2.5 | % |
|
| (3.0 | )% |
Diluted (loss) earnings per share |
| $ | (0.84 | ) |
| $ | 0.11 |
|
| $ | (0.95 | ) |
Value added sales (1) |
| $ | 402,905 |
|
| $ | 374,927 |
|
| $ | 27,978 |
|
Value added sales adjusted for foreign exchange (1) |
| $ | 405,251 |
|
| $ | 374,927 |
|
| $ | 30,324 |
|
Adjusted EBITDA (2) |
| $ | 97,506 |
|
| $ | 100,556 |
|
| $ | (3,050 | ) |
Percentage of net sales |
|
| 12.9 | % |
|
| 12.1 | % |
|
| 0.8 | % |
Percentage of value added sales |
|
| 24.2 | % |
|
| 26.8 | % |
|
| (2.6 | )% |
Unit shipments in thousands |
|
| 7,639 |
|
|
| 8,088 |
|
|
| (449 | ) |
Shipments
Wheel unit shipments were 7.6 million for the first half of 2023 compared to unit shipments of 8.1 million for the same period in 2022, a decrease of 5.6 percent. Our North American unit shipments decreased 2.2 percent despite the 11.9 percent increase in automotive production volumes in North America primarily due to a temporary disruption in production at one of our customer’s facilities which has now resumed operations. European unit shipments declined 9.7 percent as compared to the first half of 2022 despite the 19.7 percent increase in automotive production volumes in Western and Central Europe. The majority of this decrease was attributable to the 48.0 percent decrease in the aftermarket unit shipments as a result of soft aftermarket demand due to a slowdown of the European economy, which has negatively impacted consumer discretionary income, and high aftermarket wheel inventory levels. In addition, we exited an unprofitable contract with one of our European customers and have not yet replaced those volumes with new business.
Net Sales
Net sales for the first half of 2023 were $753.6 million, compared to net sales of $832.1 million for the same period in 2022, a decrease of 9.4 percent. The decrease in revenue was primarily due to lower aluminum pass throughs to our OEM customers of $106.5 million and lower shipment volumes of $22.1 million, partially offset by favorable pricing and product mix of $50.9 million.units.
Value Added Sales Adjusted for Foreign Exchange
Value added sales adjusted for foreign exchange was $405.3$171.3 million for the first halfquarter of 20232024 compared to value added sales adjusted for foreign exchange of $374.9$202.7 million for the same period in 2022, an increase2023, a decrease of 8.115.5 percent. This increaseThe decrease was primarily due to heavily contented wheels, favorableunfavorable pricing and product mix and product pricing.lower shipment volume.
3226
Cost of Sales
Cost of sales was $678.0$295.1 million for the first halfquarter of 20232024 compared to cost of sales of $748.8$346.4 million for the same period in 2022, a decrease of 9.5 percent.2023. The decrease in cost of sales was primarily due to $87.2$34.6 million of lower aluminum costs, and $10.4favorable conversion costs of $11.0 million ofand lower shipment volumes partially offset by an increase in conversion costs of $13.0 million due to unfavorable cost absorption resulting from lower production volumes, an increase of $12.3 million due to product mix and a restructuring charge of $5.0 million recognized in the first half of 2023 (refer to Note 19 “Restructuring” in the Notes to the Condensed Consolidated Financial Statements in Item 1, “Financial Statements”).$9.2 million.
Selling, General and Administrative ExpensesExpense
Selling, general and administrative (“SG&A”) expense was $36.5of $20.8 million for the first halfquarter of 2023 as2024 increased $1.4 million compared to $33.7 million for the same period in 2022. The increase in SG&A expense is attributable2023 primarily due to advisor fees and other restructuring related costs associated with the $2.8 million restructuring charge recognized in the first halftransformation of 2023 related to the Company's reduction in its global workforce (refer to Note 19 “Restructuring” in the Notes to the Condensed Consolidated Financial Statements in Item 1, “Financial Statements”).our European business.
Net Interest Expense
Net interest expense for the first halfquarter of 20232024 of $15.9 million was $31.4 millionflat compared to net interest expense of $20.3$15.7 million infor the same period in 2022, a $11.1 million increase. The increase is due to a $50.8 million increase in2023 since the principal amount of term loan debt as a result of the refinancing in December 2022, risingSOFR interest rates and a higher credit spreadrate on the new term loan (refer to Note 9 “Debt” in the Notes to the Condensed Consolidated Financial Statements in Item 1, “Financial Statements”).Term Loan Facility remained substantially unchanged.
Other Income (Expense)
Other expense was $0.5 million for the first halfquarter of 2023 was $2.8 million2024 compared to other incomeexpense of $0.6$0.2 million for the same period in 2022. The majority of the expense in the first half of 2023 is attributable to the additional $1.4 million casualty loss arising from the Werdohl flood and unfavorable foreign exchange.2023.
Income Tax (Provision) Benefit
The income tax provision for the first halfquarter of 20232024 was $9.1$16.6 million on pre-tax incomeloss of $5.0$16.1 million, representing an effective income tax rate of 182.6(103.4) percent. This differs from the statutory rate primarily due to valuation allowances, the reversal of an uncertain tax position, and the mix of earnings among tax jurisdictions.jurisdictions, and a tax charge impacting deferred tax assets related to tax restructuring of $17.8 million. The income tax provision for the first halfquarter of 20222023 was $8.9$3.3 million on a pre-tax incomeloss of $29.8$0.7 million, representing an effective income tax rate of 29.9(440.3) percent. This differs from the statutory rate primarily due to valuation allowances, the reversal of an uncertain tax position and the mix of earnings among tax jurisdictions.
Net Income (Loss)
Net loss for the first halfquarter of 20232024 was $4.1$32.7 million, or a $0.84$1.52 loss per diluted share, compared to net incomea loss of $20.9$4.0 million, or $0.11a $0.49 loss per diluted share, for the same period in 2022.2023.
Segment Sales and Income from Operations
|
| Six Months Ended |
|
|
|
| ||||||
|
| June 30, |
|
| June 30, |
|
| Change |
| |||
(Dollars in thousands) |
|
|
|
|
|
|
|
|
| |||
Selected data |
|
|
|
|
|
|
|
|
| |||
Net sales |
|
|
|
|
|
|
|
|
| |||
North America |
| $ | 419,823 |
|
| $ | 486,875 |
|
| $ | (67,052 | ) |
Europe |
|
| 333,746 |
|
|
| 345,183 |
|
|
| (11,437 | ) |
Total net sales |
| $ | 753,569 |
|
| $ | 832,058 |
|
| $ | (78,489 | ) |
Income from operations |
|
|
|
|
|
|
|
|
| |||
North America |
| $ | 43,219 |
|
| $ | 44,246 |
|
| $ | (1,027 | ) |
Europe |
|
| (4,066 | ) |
|
| 5,297 |
|
|
| (9,363 | ) |
Total income from operations |
| $ | 39,153 |
|
| $ | 49,543 |
|
| $ | (10,390 | ) |
33
|
| Three Months Ended |
|
|
|
| ||||||
|
| March 31, |
|
| March 31, |
|
| Change |
| |||
(Dollars in thousands) |
|
|
|
|
|
|
|
|
| |||
Selected data |
|
|
|
|
|
|
|
|
| |||
Net sales |
|
|
|
|
|
|
|
|
| |||
North America |
| $ | 193,508 |
|
| $ | 211,618 |
|
| $ | (18,110 | ) |
Europe |
|
| 122,768 |
|
|
| 169,348 |
|
|
| (46,580 | ) |
Total net sales |
| $ | 316,276 |
|
| $ | 380,966 |
|
| $ | (64,690 | ) |
Income from operations |
|
|
|
|
|
|
|
|
| |||
North America |
| $ | 8,082 |
|
| $ | 21,715 |
|
| $ | (13,633 | ) |
Europe |
|
| (7,768 | ) |
|
| (6,579 | ) |
|
| (1,189 | ) |
Total income from operations |
| $ | 314 |
|
| $ | 15,136 |
|
| $ | (14,822 | ) |
North America
Net sales for our North American segment for the first halfquarter of 20232024 decreased 13.88.6 percent while unit shipments decreased 2.2increased 2.5 percent, compared to the same period in 2022.2023. The $67.1$18.1 million decrease in net sales was primarily due to lower aluminum cost pass throughs to our OEM customers of $83.0$13.0 million and $4.7 million due to lower unit shipments, partially offset by favorableunfavorable pricing and product mix of $19.6 million.$7.1 million, partially offset by $1.6 million due to higher unit shipments. North American segment income from operations for the first halfquarter of 2023 was $1.02024 decreased by $13.6 million, lower thanas compared to the first half of 2022,same period in 2023, primarily due to higher non-aluminum raw material costsunfavorable product pricing and mix of $13.6$8.1 million higherand unfavorable conversion costs of $2.4 million attributable to unfavorable cost absorption on lower production volumes and a restructuring chargelargely because of $1.5 million recognized in the first half of 2023 (refer to Note 19 “Restructuring” in the Notes to the Condensed Consolidated Financial Statements in Item 1, “Financial Statements”), largely offset by favorable pricing and product mix of $17.3 million.higher labor costs.
27
Europe
Net sales for our European segment for the first halfquarter of 20232024 decreased 3.327.5 percent while unit shipments decreased 9.717.4 percent compared to the same period in 2022.2023. The decline$46.6 million decrease in unit shipmentsnet sales was primarily due to a 48.0 percent decrease in aftermarket unit shipments. Net sales were lower by $11.4 million primarily due to $23.4 million of lower aluminum pass throughs and $17.4of $21.1 million, due to lower unit shipments partially offset by favorableof $17.0 million and unfavorable pricing and product mix of $9.0 million. Net sales and pricingunit shipments reflect the deconsolidation of $31.3 million.the financial results of the manufacturing facility in Germany, SPG, and the exit of an unprofitable contract with one of our customers which has not yet been replaced with new business. The European segment incomeloss from operations for the first halfquarter of 20232024 was $9.4$1.2 million lowermore than the first half of 2022same period in 2023. The increase in the loss from operations was primarily due to lower unit shipments of $9.9 million, higher conversion costs of $7.8 million and a $6.3 million restructuring charge recognized in the first half of 2023 (refer to Note 19 “Restructuring” in the Notes to the Condensed Consolidated Financial Statements in Item 1, “Financial Statements”), partially offset by favorableunfavorable pricing and product mix of $20.4 million.$8.3 million and lower unit shipments of $6.8 million, largely offset by lower conversion costs of $13.4 million due to the ongoing transition of production to lower cost manufacturing facilities in Poland.
Financial Condition, Liquidity and Capital Resources
As of June 30, 2023,March 31, 2024, our cash and cash equivalents totaled $181.1$191.1 million compared to $122.3$228.6 million and $213.0$201.6 million at June 30, 2022March 31, 2023 and December 31, 2022,2023, respectively. Our sources of liquidity primarily include cash and cash equivalents, cash provided by operating activities, borrowings under available debt facilities, and factoring arrangements for trade receivables. Working capital (current assets minus current liabilities) and our current ratio (current assets divided by current liabilities) were $293.5$261.3 million and 2.2:1.0, respectively, at March 31, 2024, as compared to $261.0 million and 2.3:1.0 respectively, at June 30, 2023, versus $257.6 million and 2.0:1.0 at December 31, 2022. Although the Company continues to effectively manage all elements of working capital, payables declined significantly as of June 30, 2023 due primarily to a decline in aluminum orders in the back half of the quarter.2023.
Our working capital requirements, investing activities and cash dividend payments have historically been funded from internally generated funds, debt facilities, cash and cash equivalents, and we believe these sources will continue to meet our future requirements.requirements for the next 12 months. Capital expenditures relate to improving production quality and efficiency and extending the useful lives of existing property and expenditures for new product offerings, as well as expanded capacity for existing products. During 2023,2024, we expect that capital expenditures will be approximately $65.0$50.0 million.
In connection with the acquisition of our European operations, we entered into several debt and equity financing arrangements during 2017. On March 22, 2017, we entered into a senior secured credit facility consisting of a $400.0 million term loan facility (the “Acquisition Term Loan Facility”) and a $160.0 million revolving credit facility (the “U.S.“US Revolving Credit Facility”), subsequently reduced to $107.5 million by May 2022. On May 22, 2017,and we issued 150,000 shares of redeemable preferred stock for an aggregate purchase price of $150.0 million. On June 15, 2017, we issuedmillion and €250.0 million aggregate principal amount of the 6.00% Senior Notes due June 15, 2025 (the “Notes”). Finally, as part of the European business acquisition,Notes. In addition, we also assumed $70.7 million of outstanding debt, including a €30.0 million European revolving credit facility (the “European Revolving Credit Facility”) which was. The acquired European business subsequently increased to €60.0 million.entered into equipment loan agreements totaling $13.4 million (€12.0 million).
On December 15, 2022, the Company entered into a $400.0 million term loan facility (the “Term Loan Facility”) with Oaktree Fund Administration L.L.C., in its capacity as the administrative agent, JPMorgan Chase Bank, N.A., in its capacity as collateral agent, and other lenders party thereto. The Term Loan Facility requires quarterly principal payments of $1.0 million. Additional principal payments may be due with respect to asset sales, debt issuances and as a percentage of cash flow in excess of a specified threshold. Concurrent with the issuance of the Term Loan Facility, the Company entered into a $60.0 million revolving credit facility (the “Revolving Credit Facility”) and terminated the previously outstanding $107.5 million U.S. Revolving Credit Facility and €60.0 million European Revolving Credit Facility. The $388.0 million proceeds of the borrowings under the Term Loan Facility (consisting of the $400.0 million aggregate principal less the original issuance discount of $12.0 million) were used to repay the $349.2 million balance outstanding under the Acquisition Term Loan Facility and to pay debt issuance costs and expenses incurred in connection with the Term Loan Facility and Revolving Credit Facility. As a result of the refinancing, our annual interest expense on the Term Loan Facility is expected to increase by approximately $20.0 million in 2023.
34
Balances outstanding under the Term Loan Facility Notes, and equipment loansNotes as of June 30, 2023March 31, 2024 were $398.0$395.0 million, $235.8 million, and $2.2$234.2 million, respectively. The balance of the redeemable preferred stock was $235.1$255.0 million as of June 30, 2023.March 31, 2024. The Revolving Credit Facility and the Term Loan Facility mature on December 15, 2027 and December 15, 2028, respectively. However, in the event the Company has not repaid, refinanced or otherwise extended the maturity of the Notes beyond the maturity date of the Term Loan Facility by the date 91 days prior to June 15, 2025, the Term Loan Facility and Revolving Credit Facility will mature 91 days prior to June 15, 2025. Similarly, in the event the Company has not redeemed, refinanced or otherwise extended the unconditional redemption date of the redeemable preferred stock beyond the maturity date of the Term Loan Facility by the date 91 days prior to September 14, 2025, the Term Loan Facility and Revolving Credit Facility will mature 91 days prior to September 14, 2025.
The redeemable preferred stock may be unconditionally redeemed at the holder’s election on or after September 14, 2025 at the redemption amount, $300 million, provided the Company has sufficient available funds. Under Delaware law, any redemption payment would be limited to the “surplus” that our Board of Directors determines iscash legally available to fund a full or partial redemption without rendering us insolvent.pay such redemption. The shares of preferred stock not redeemed would continue to receive an annual dividend of 99.0 percent on the original stated value, plus any accrued and unpaid dividends, which would be paid quarterly. The Board of Directors would have to evaluate on an ongoing basisperiodically the ability of the Company to make any further redemption payments until the full redemption amount has been paid.
The Company currently intends to repay, refinance or otherwise extend the Notes prior to their maturity and to redeem, refinance or otherwise extend the unconditional redemption date of the redeemable preferred stock. If we are unable to repay, refinance or otherwise extend the Notes or redeem, refinance or otherwise extend the redeemable preferred stock prior to their respective maturity and redemption dates, the maturity of our Term Loan Facility and Revolving Credit Facility would accelerate to a date 91 days prior to the maturity date of the
28
Notes or redemption date of the redeemable preferred stock (refer to Note 9 “Debt” in the Notes to Condensed Consolidated Financial Statements in Item 1, “Financial Information”).
As of June 30, 2023,March 31, 2024, the Company had no outstanding borrowings under the Revolving Credit Facility, outstanding letters of credit of $4.8$8.4 million and available unused commitments under the Revolving Credit Facility of $55.2$51.6 million. As a result, our liquidity totaled $198.8$205.2 million at June 30, 2023,March 31, 2024, consisting of cash and cash equivalents of $143.6$153.6 million ($181.1191.1 million less the $37.5 million contractual liquidity required pursuant to the Term Loan Facility and Revolving Credit Facility) and available and unused commitments under the Revolving Credit Facility of $55.2$51.6 million.
As of June 30, 2023,March 31, 2024, we had no significant off-balance sheet arrangements other than factoring of $102.3$98.9 million of our trade receivables.
The Company operates a manufacturing facility in Germany that accounts for less than 10% of the Company’s assets and annual revenues but is in a relatively high-cost region. This manufacturing facility, within our European reportable segment and European long-live asset group, has experienced and continues to experience operational and financial challenges. The Company is taking steps to mitigate the impact of these challenges. There can be no assurance that our risk mitigation actions taken to date will adequately address these operational and financial challenges. Should this be the case, the Company may consider other actions, including restructuring actions, to address the matter.
The following table summarizes the cash flows from operating, investing and financing activities as reflected in the condensed consolidated statements of cash flows.
|
| Six Months Ended |
|
| Three Months Ended |
| ||||||||||
|
| June 30, |
|
| June 30, |
| ||||||||||
Fiscal Year Ended December 31, |
| March 31, |
|
| March 31, |
| ||||||||||
(Dollars in thousands) |
|
|
|
|
|
|
|
|
|
|
|
| ||||
Net cash provided by operating activities |
|
| 11,167 |
|
|
| 57,213 |
|
|
| 3,470 |
|
|
| 38,738 |
|
Net cash used in investing activities |
|
| (21,751 | ) |
|
| (34,138 | ) |
|
| (6,618 | ) |
|
| (15,589 | ) |
Net cash used in financing activities |
|
| (22,999 | ) |
|
| (11,632 | ) |
|
| (6,548 | ) |
|
| (9,172 | ) |
Effect of exchange rate changes on cash |
|
| 1,676 |
|
|
| (2,658 | ) |
|
| (839 | ) |
|
| 1,639 |
|
Net changes in cash and cash equivalents |
| $ | (31,907 | ) |
| $ | 8,785 |
|
| $ | (10,535 | ) |
| $ | 15,616 |
|
Operating Activities
Net cash provided by operating activities was $11.2$3.5 million for the first halfthree months of 20232024 compared to net cash provided by operating activities of $57.2$38.7 million for the same period in 2022.2023. The decrease in cash flow provided by operating activities was primarily driven by lower profitabilitya $28.7 million higher net loss, which includes higher non-cash taxes of $25.0$14.0 million, and higher uselower source of cash for working capital (accounts receivable, inventoryprovided by trade payables of $15.9 million and accounts payable)other assets and liabilities of $15.8$7.2 million.
35
Investing Activities
Net cash used in investing activities of $21.8$6.6 million for the first halfthree months of 20232024 was lower than the $34.1$15.6 million for the same period in 2022.2023 due to lower capital expenditures. The decrease in capital expenditures was primarily due to the completion of certaintwo capital projects related to paint line and refinishing capabilities.
Financing Activities
Net cash used in financing activities was $23.0$6.5 million for the first halfthree months of 20232024 compared to net cash used in financing activities of $11.6$9.2 million for the same period in 2022.2023. This increasedecrease was primarily due to an $8.5a $2.2 million repayment of certain capital equipment loans and a $1.5 million increasedecrease in tax withholdingwithholdings for stock-based compensation.
Non-GAAP Financial Measures
In this Quarterly Report, we discuss three important measures that are not calculated according to U.S. GAAP, value added sales, value added sales adjusted for foreign exchange and adjusted EBITDA.
Value added sales represents net sales less the value of aluminum and other costs, as well as outsourced service provider (“OSP”) costs that are included in net sales. Contractual arrangements with our customers allow us to pass on changes in aluminum and certain other costs. Value added sales adjusted for foreign exchange represents value added sales on a constant currency basis. For entities reporting in currencies other than the U.S. dollar, the current period amounts are translated using the prior year comparative period exchange rates, rather than the actual exchange rates in effect during the current period. Value added sales adjusted for foreign exchange allows users of the financial statements to consider our net sales information both with and without the aluminum, other costs and OSP costs and fluctuations in foreign exchange rates. Management utilizes value added sales adjusted for foreign exchange as a key metric in measuring and evaluating the growth of the Company because it eliminates the volatility of the cost of aluminum and changes in foreign exchange rates. Management utilizes value added sales in calculating adjusted EBITDA margin to eliminate volatility of the cost of aluminum in evaluating year-over-year margin growth.
29
The following table reconciles our net sales, the most directly comparable U.S. GAAP financial measure, to our value added sales and value added sales adjusted for foreign exchange:
|
| Three Months Ended |
|
| Six Months Ended |
|
| Three Months Ended |
| |||||||||||||||
|
| June 30, |
|
| June 30, |
|
| June 30, |
|
| June 30, |
|
| March 31, 2024 |
|
| March 31, 2023 |
| ||||||
(Dollars in thousands) |
|
|
|
|
|
|
|
|
|
|
|
|
|
|
|
|
|
| ||||||
Net sales |
| $ | 372,603 |
|
| $ | 431,532 |
|
| $ | 753,570 |
|
| $ | 832,058 |
|
| $ | 316,276 |
|
| $ | 380,966 |
|
Less: aluminum, other costs, and outside service provider costs |
|
| (172,360 | ) |
|
| (246,000 | ) |
|
| (350,665 | ) |
|
| (457,131 | ) |
|
| (144,078 | ) |
|
| (178,304 | ) |
Value added sales |
| $ | 200,243 |
|
| $ | 185,532 |
|
| $ | 402,905 |
|
| $ | 374,927 |
|
| $ | 172,198 |
|
| $ | 202,662 |
|
Currency impact on current period value added sales |
|
| (2,027 | ) |
|
| — |
|
|
| 2,346 |
|
|
| — |
|
|
| (868 | ) |
|
| — |
|
Value added sales adjusted for foreign exchange |
| $ | 198,216 |
|
| $ | 185,532 |
|
| $ | 405,251 |
|
| $ | 374,927 |
|
| $ | 171,330 |
|
| $ | 202,662 |
|
Adjusted EBITDA is defined as earnings before interest income and expense, income taxes, depreciation, amortization, restructuring charges and other closure costs and impairments of long-lived assets and investments, changes in fair value of the redeemable preferred stock embedded derivative, acquisition and integration, certain hiring and separation related costs, proxy contest fees, gains associated with early debt extinguishment and accounts receivable factoring fees. We use adjusted EBITDA as an important indicator of the operating performance of our business. Adjusted EBITDA is used in our internal forecasts and models when establishing internal operating budgets, supplementing the financial results and forecasts reported to our Board of Directors and evaluating short-term and long-term operating trends in our operations. We believe the adjusted EBITDA financial measure assists in providing a more complete understanding of our underlying operational measures to manage our business, to evaluate our performance compared to prior periods and the marketplace and to establish operational goals. Adjusted EBITDA is a non-GAAP financial measure and should not be considered in isolation or as a substitute for financial information provided in accordance with U.S. GAAP. This non-GAAP financial measure may not be computed in the same manner as similarly titled measures used by other companies.
36
The following table reconciles our net (loss) income,loss, the most directly comparable U.S. GAAP financial measure, to our adjusted EBITDA:
|
| Three Months Ended |
|
| Six Months Ended |
|
| Three Months Ended |
| |||||||||||||||
|
| June 30, |
|
| June 30, |
|
| June 30, |
|
| June 30, |
|
| March 31, 2024 |
|
| March 31, 2023 |
| ||||||
(Dollars in thousands) |
|
|
|
|
|
|
|
|
|
|
|
|
|
|
|
|
|
| ||||||
Net (loss) income |
| $ | (67 | ) |
| $ | 10,844 |
|
| $ | (4,114 | ) |
| $ | 20,914 |
| ||||||||
Net loss |
| $ | (32,749 | ) |
| $ | (4,047 | ) | ||||||||||||||||
Interest expense, net |
|
| 15,690 |
|
|
| 10,338 |
|
|
| 31,388 |
|
|
| 20,300 |
|
|
| 15,878 |
|
|
| 15,698 |
|
Income tax provision |
|
| 5,794 |
|
|
| 5,405 |
|
|
| 9,092 |
|
|
| 8,923 |
|
|
| 16,648 |
|
|
| 3,298 |
|
Depreciation |
|
| 18,567 |
|
|
| 17,571 |
|
|
| 36,584 |
|
|
| 35,405 |
|
|
| 17,062 |
|
|
| 18,016 |
|
Amortization |
|
| 4,900 |
|
|
| 5,555 |
|
|
| 9,724 |
|
|
| 11,803 |
|
|
| 4,884 |
|
|
| 4,825 |
|
Restructuring, factoring fees and other (1) (2) (3) (4) |
|
| 7,134 |
|
|
| 1,633 |
|
|
| 14,832 |
|
|
| 3,211 |
| ||||||||
Restructuring, factoring fees and other (1) (2) |
|
| 9,126 |
|
|
| 7,699 |
| ||||||||||||||||
Adjusted EBITDA |
| $ | 52,018 |
|
| $ | 51,346 |
|
| $ | 97,506 |
|
| $ | 100,556 |
|
| $ | 30,849 |
|
| $ | 45,489 |
|
Adjusted EBITDA as a percentage of net sales |
|
| 14.0 | % |
|
| 11.9 | % |
|
| 12.9 | % |
|
| 12.1 | % |
|
| 9.8 | % |
|
| 11.9 | % |
Adjusted EBITDA as a percentage of value added sales |
|
| 26.0 | % |
|
| 27.7 | % |
|
| 24.2 | % |
|
| 26.8 | % |
|
| 17.9 | % |
|
| 22.4 | % |
(3)
30
(4)
Critical Accounting Policies and Estimates
The preparation of consolidated financial statements in conformity with U.S. GAAP requires management to apply significant judgment in making estimates and assumptions that affect amounts reported therein, as well as financial information included in this Management’s Discussion and Analysis of Financial Condition and Results of Operations. These estimates and assumptions, which are based upon historical experience, industry trends, terms of various past and present agreements and contracts, and information available from other sources that are believed to be reasonable under the circumstances, form the basis for making judgments about the carrying values of assets and liabilities that are not readily apparent through other sources. We believe the accounting estimates employed are appropriate and the resulting balances are reasonable; however, due to the inherent uncertainties in developing estimates, actual results could differ from the original estimates, requiring adjustments to these balances in future periods. Critical accounting estimates that affect the condensed consolidated financial statements and the judgments and assumptions used are consistent with those described in the management’s discussion and analysis in our 20222023 Form 10-K (refer to “Management’s Discussion and Analysis of Financial Condition and Results of Operations” in Part II, Item 7 of our Annual Report on Form 10-K for the year ended December 31, 2022)2023).
Item 3. Quantitative and Qualitative Disclosures about Market Risk
As a smaller reporting company, as defined in Rule 10(f)(1) of Regulation S-K under the Securities and Exchange Act of 1934, as amended (the “Exchange Act”), the Company is not required to provide the information required by this item.
Item 4. Controls and Procedures
Evaluation of Disclosure Controls and Procedures
The Company’s management, with the participation of our Chief Executive Officer and Chief Financial Officer, evaluated the effectiveness of the Company’s disclosure controls and procedures (as defined in Rules 13a-15(e) and 15d-15(e) under the Exchange Act) as of June 30, 2023.March 31, 2024. Our disclosure controls and procedures are designed to ensure that information required to be disclosed in reports we file or submit under the Exchange Act is recorded, processed, summarized and reported within the time periods specified in SEC rules and forms and that such information is accumulated and communicated to our management, including our Chief Executive Officer and Chief Financial Officer, to allow timely decisions regarding required disclosures.
Based on this evaluation, our Chief Executive Officer and Chief Financial Officer concluded that, as of June 30, 2023March 31, 2024 our disclosure controls and procedures were effective.
Changes in Internal Control over Financial Reporting
There has been no change in our internal control over financial reporting during the three months ended June 30, 2023March 31, 2024 that has materially affected, or is reasonably likely to materially affect, our internal control over financial reporting.
3731
PART II
OTHER INFORMATION
Item 1. Legal Proceedings
We are party to various legal and environmental proceedings incidental to our business. Certain claims, suits and complaints arising in the ordinary course of business have been filed or are pending against us. Based on facts now known, except as provided below, and as set forth in Note 17 “Commitments and Contingencies” in the Notes to the Condensed Consolidated Financial Statements regarding a contractual dispute with the parent company of our energy supplier in Poland, we believe all such matters are adequately provided for, covered by insurance, are without merit, and/or involve such amounts that would not materially adversely affect our consolidated results of operations, cash flows or financial position.
In March 2022, the German Federal Cartel Office initiated an investigation related to European light alloy wheel manufacturers, including Superior Industries Europe AG (a wholly owned subsidiary of the Company), on suspicion of conduct restricting competition. The Company is cooperating fully with the German Federal Cartel Office. In the event Superior Industries Europe AG is deemed to have violated the applicable statutes, the Company could be subject to a fine or civil proceedings. At this point, we are unable to predict the duration or the outcome of the investigation.
On August 31, 2023 (the “Filing Date”), the Company’s wholly owned subsidiary Superior Industries Production Germany GmbH (“SPG”) filed voluntary petitions for preliminary insolvency proceedings (equivalent to Chapter 11 under the U.S. Bankruptcy Code) in the Neustadt an der Weinstrasse, Germany Insolvency Court (the “Insolvency Court”) seeking relief under the German Insolvency Code (the “Insolvency Code”). SPG filed motions with the Insolvency Court seeking authorization to continue to operate its business as a “debtor-in-possession” under the jurisdiction of the Insolvency Court and in accordance with the applicable provisions of the Insolvency Code and orders of the Insolvency Court. On November 21, 2023, upon the request of the managing directors of SPG, the Insolvency Court ordered the withdrawal from the preliminary self-administrative insolvency proceedings and the continuation in preliminary ordinary proceedings (equivalent to Chapter 7 under the U.S. Bankruptcy Code). On December 1, 2023, the Insolvency Court passed a resolution to terminate the preliminary phase and to open ordinary insolvency proceedings with respect to SPG.
Refer also to Item 1A, “Risk Factors” “We are from time to time subject to litigation, which could adversely affect our results of operations, financial condition or cash flows” in Part I of our Annual Report on Form 10-K for the year ended December 31, 2022.2023.
Item 1A. Risk Factors
There have been no material changes to the risk factors set forth
See Part I, Item 1A, “Risk Factors” in “Item 1A, Risk Factors” of our Annual Report on Form 10-K for the year ended December 31, 2022.2023.
Item 2. Unregistered Sales of Equity Securities and Use of Proceeds
None.
Item 3. Defaults upon Senior Securities
None.
Item 4. Mine Safety Disclosures
Not applicable.
Item 5. Other Information
None.
3832
Item 6. Exhibits
|
|
|
31.1 |
| |
|
|
|
31.2 |
| |
|
|
|
32.1 |
| |
|
|
|
101.INS |
| Inline XBRL Instance |
|
|
|
101.SCH |
| Inline XBRL Taxonomy Extension Schema |
|
| |
|
| |
|
| |
|
| |
|
|
|
104 |
| Cover Page Interactive Data File |
** Filed herewith.
**** Submitted electronically with the report.
† These certifications are furnished to the SEC pursuant to Section 906 of the Sarbanes-Oxley Act of 2002 and are deemed not filed for purposes of Section 18 of the Securities Exchange Act of 1934, as amended, nor shall they be deemed incorporated by reference in any filing under the Securities Act of 1933, except as shall be expressly set forth by specific reference in such filing.
3933
SIGNATURES
Pursuant to the requirements of the Securities Exchange Act of 1934, the registrant has duly caused this report to be signed on its behalf by the undersigned thereunto duly authorized.
SUPERIOR INDUSTRIES INTERNATIONAL, INC.
(Registrant)
Date: | /s/ Majdi B. Abulaban |
Majdi B. Abulaban President and Chief Executive Officer |
Date: | /s/ C. Timothy Trenary |
C. Timothy Trenary Executive Vice President, |
4034