The accompanying notes as they relate to Ameren Illinois are an integral part of these financial statements.
AMEREN ILLINOIS COMPANY (d/b/a AMEREN ILLINOIS)
STATEMENT OF CASH FLOWS
(Unaudited) (In millions)
| | | | | | | | | | | |
| Six Months Ended June 30, | | |
| 2020 | | 2019 |
| Cash Flows From Operating Activities: | | | |
| Net income | $ | 205 | | | $ | 184 | |
| Adjustments to reconcile net income to net cash provided by operating activities: | | | |
| Depreciation and amortization | 214 | | | 201 | |
| Amortization of debt issuance costs and premium/discounts | 6 | | | 6 | |
| Deferred income taxes and investment tax credits, net | 40 | | | 43 | |
| | | |
| Other | (5) | | | — | |
| Changes in assets and liabilities: | | | |
| Receivables | (13) | | | 35 | |
| Inventories | 13 | | | 28 | |
| Accounts and wages payable | (12) | | | (38) | |
| Taxes accrued | (32) | | | (22) | |
| Regulatory assets and liabilities | (65) | | | 1 | |
| Assets, other | (15) | | | 1 | |
| Liabilities, other | 12 | | | 24 | |
| Pension and other postretirement benefits | (8) | | | (11) | |
| | | |
| | | |
| Net cash provided by operating activities | 340 | | | 452 | |
| Cash Flows From Investing Activities: | | | |
| Capital expenditures | (661) | | | (556) | |
| | | |
| Other | 2 | | | (2) | |
| Net cash used in investing activities | (659) | | | (558) | |
| Cash Flows From Financing Activities: | | | |
| | | |
| Dividends on preferred stock | (2) | | | (2) | |
| Short-term debt, net | (12) | | | 127 | |
| | | |
| | | |
| | | |
| | | |
| Capital contribution from parent | 350 | | | — | |
| | | |
| | | |
| | | |
| Net cash provided by financing activities | 336 | | | 125 | |
| Net change in cash, cash equivalents, and restricted cash | 17 | | | 19 | |
| Cash, cash equivalents and restricted cash at beginning of year | 125 | | | 80 | |
| Cash, cash equivalents, and restricted cash at end of period | $ | 142 | | | $ | 99 | |
The accompanying notes as they relate to Ameren Illinois are an integral part of these financial statements.
AMEREN ILLINOIS COMPANY (d/b/a AMEREN ILLINOIS)
STATEMENT OF SHAREHOLDERS’ EQUITY
(Unaudited) (In millions)
| | | | | | | | | | | | | | | | | | | | | | | |
| | Three Months Ended June 30, | | | | Six Months Ended June 30, | | |
| | 2020 | | 2019 | | 2020 | | 2019 |
| Common Stock | $ | — | | | $ | — | | | $ | — | | | $ | — | |
| | | | | | | |
| Other Paid-in Capital: | | | | | | | |
| Beginning of period | 2,288 | | | 2,173 | | | 2,188 | | | 2,173 | |
| Capital contribution from parent | 250 | | | — | | | 350 | | | — | |
| | | | | | | |
| Other paid-in capital, end of period | 2,538 | | | 2,173 | | | 2,538 | | | 2,173 | |
| | | | | | | |
| | | | | | | |
| Preferred Stock | 62 | | | 62 | | | 62 | | | 62 | |
| | | | | | | |
| | | | | | | |
| | | | | | | |
| | | | | | | |
| | | | | | | |
| Retained Earnings: | | | | | | | |
| Beginning of period | 2,002 | | | 1,659 | | | 1,882 | | | 1,539 | |
| Net income | 84 | | | 63 | | | 205 | | | 184 | |
| | | | | | | |
| Preferred stock dividends | (1) | | | (1) | | | (2) | | | (2) | |
| | | | | | | |
| Retained earnings, end of period | 2,085 | | | 1,721 | | | 2,085 | | | 1,721 | |
| | | | | | | |
| | | | | | | |
| | | | | | | |
| | | | | | | |
| | | | | | | |
| | | | | | | |
| | | | | | | |
| | | | | | | |
| | | | | | | |
| | | | | | | |
| | | | | | | |
| | | | | | | |
| | | | | | | |
| | | | | | | |
| Total Shareholders’ Equity | $ | 4,685 | | | $ | 3,956 | | | $ | 4,685 | | | $ | 3,956 | |
The accompanying notes as they relate to Ameren Illinois are an integral part of these financial statements.
AMEREN CORPORATION (Consolidated)
UNION ELECTRIC COMPANY (d/b/a Ameren Missouri)
AMEREN ILLINOIS COMPANY (d/b/a Ameren Illinois)
COMBINED NOTES TO FINANCIAL STATEMENTS
(Unaudited)
SeptemberJune 30, 20172020
NOTE 1 – SUMMARY OF SIGNIFICANT ACCOUNTING POLICIES
General
Ameren, headquartered in St. Louis, Missouri, is a public utility holding company whose primary assets are its equity interests in its subsidiaries. Ameren’s subsidiaries are separate, independent legal entities with separate businesses, assets, and liabilities. Dividends on Ameren’s common stock and the payment of expenses by Ameren depend on distributions made to it by its subsidiaries. Ameren’s principal subsidiaries Ameren Missouri, Ameren Illinois, and ATXI, are describedlisted below. Ameren also has other subsidiaries that conduct other activities, such as the provision ofproviding shared services. Ameren evaluates competitive electric transmission investment opportunities outside of MISO as they arise.
•Union Electric Company, doing business as Ameren Missouri, operates a rate-regulated electric generation, transmission, and distribution business and a rate-regulated natural gas distribution business in Missouri.
•Ameren Illinois Company, doing business as Ameren Illinois, operates rate-regulated electric transmission, electric distribution, and natural gas distribution businesses in Illinois.
•ATXI operates a FERC rate-regulated electric transmission business. ATXIbusiness in the MISO.
The COVID-19 pandemic continues to be a rapidly evolving situation. In the first six months of 2020, we experienced a net decrease in our sales volumes, an increase in our accounts receivable balances that were past due or that were a part of a deferred payment arrangement, and a decline in our cash collections from customers. The continued effect of the COVID-19 pandemic on our results of operations, financial position, and liquidity in subsequent periods will depend on its severity and longevity, future regulatory or legislative actions with respect thereto, and the resulting impact on business, economic, and capital market conditions. Shelter-in-place orders began taking effect in our service territories in mid-March 2020. These orders generally required individuals to remain at home and precluded or limited the operation of businesses that were deemed nonessential. While our business operations were deemed essential and were not directly impacted by the shelter-in-place orders, approximately 65% of our workforce transitioned to remote working arrangements in mid-March. In early June, a small portion of our workforce began the process of returning to our work locations under a phased approach. In mid-May 2020, shelter-in-place orders effective in our service territories began to be relaxed, with fewer restrictions on social activities and nonessential businesses beginning to reopen. However, certain restrictions remain in place that limit individual activities and the operation of nonessential businesses. Additional restrictions may be imposed in the future. We continue to monitor the impacts the pandemic is developing MISO-approvedhaving on our businesses, including but not limited to potential impacts on our liquidity and financing plans; demand for residential, commercial, and industrial electric and natural gas services; more flexible payment plans for customers; the timing and extent to which recovery of incremental costs and forgone late fee revenues at Ameren Missouri is allowed by the MoPSC; changes in our ability to disconnect customers for nonpayment; bad debt expense; supply chain operations; the availability of our employees and contractors; counterparty credit; capital construction; infrastructure operations and maintenance; energy-efficiency programs; and pension valuations. While the revenues from Ameren Illinois’ electric distribution business, residential and small nonresidential customers of Ameren Illinois’ natural gas distribution business, and Ameren Illinois’ and ATXI’s electric transmission projects, includingbusinesses are decoupled from changes in sales volumes, earnings at Ameren Missouri and, with respect to large nonresidential natural gas customers, at Ameren Illinois, are exposed to such changes. Regarding bad debt expense, Ameren Illinois' electric distribution and natural gas distribution businesses have bad debt riders, which provide for recovery of bad debt write-offs, net of any subsequent recoveries. In 2020, Ameren Illinois’ electric bad debt rider provides for the recovery of bad debt expense. However, Ameren Missouri does not have a bad debt rider or regulatory tracking mechanism and its earnings are exposed to increases in bad debt expense, which could result in higher bad debt write-offs. Our customers’ payment for our services has been adversely affected by the COVID-19 pandemic, resulting in a decrease to our cash flow from operations. As of June 30, 2020, accounts receivable balances that were 30 days or greater past due or that were a part of a deferred payment arrangement represented 26%, 19%, and 33%, or $132 million, $42 million, and $90 million, of Ameren’s, Ameren Missouri’s, and Ameren Illinois’ "Accounts receivable – trade" before allowance for doubtful accounts, respectively. As of June 30, 2019, these percentages were 17%, 11%, and 25%, or $83 million, $24 million, and $59 million, for Ameren, Ameren Missouri, and Ameren Illinois, Rivers, Spoon River,respectively. For information regarding Ameren Missouri’s and Mark Twain projects. Ameren Illinois’ suspension and subsequent reinstatement of customer disconnections and late fee charges for nonpayment, see Note 2 – Rate and Regulatory Matters below.
The Coronavirus Aid, Relief, and Economic Security Act is a federal law enacted in March 2020. Provisions in the act include temporary changes to the utilization of net operating losses, deferral of the payment of the employer portion of Social Security taxes, and additional funding for customer energy assistance, among other things. Ameren has implemented certain provisions of the act, and is currently
evaluating other provisions of the act. As of June 30, 2020, there was no material impact to Ameren’s, Ameren Missouri’s, and Ameren Illinois’ financial statements as a result of the act.
Ameren’s financial statements are prepared on a consolidated basis and therefore include the accounts of its majority-owned subsidiaries. All intercompany transactions have been eliminated. Ameren Missouri and Ameren Illinois have no subsidiaries. All tabular dollar amounts are in millions, unless otherwise indicated. Also see the Glossary of Terms and Abbreviations at the front of this report and in the Form 10-K.
As of September 30, 2017 and December 31, 2016, Ameren had unconsolidated variable interests as a limited partner in various equity method investments, totaling $14 million and $9 million, respectively, included in “Other assets” on Ameren’s consolidated balance sheet. Ameren is not the primary beneficiary of these investments because it does not have the power to direct matters that most significantly impact the activities of these variable interest entities. As of September 30, 2017, the maximum exposure to loss related to these variable interests is limited to the investment in these partnerships of $14 million plus associated outstanding funding commitments of $23 million.
Our accounting policies conform to GAAP. Our financial statements reflect all adjustments (which include normal, recurring adjustments) that are necessary, in our opinion, for a fair statement of our results. The preparation of financial statements in conformity with GAAP requires management to make certain estimates and assumptions. Such estimates and assumptions affect reported amounts of assets and liabilities, the disclosure of contingent assets and liabilities at the dates of financial statements, and the reported amounts of revenues and expenses during the reported periods. Actual results could differ from those estimates. The results of operations of an interim period may not give a true indication of results that may be expected for a full year. See Note 2 – Rate and Regulatory Matters for information regarding the 2017 change in Ameren Illinois' method used to recognize interim period revenue in connection with the revenue decoupling provisions of the FEJA. These financial statements should be read in conjunction with the financial statements and theaccompanying notes thereto included in the Form 10-K.
Discontinued operationsVariable Interest Entities
As of June 30, 2020, Ameren and Ameren Missouri had interests in unconsolidated variable interest entities that were immaterialestablished to all periods presented in Ameren’s financial statements.construct wind generation facilities and, ultimately, sell those constructed facilities to Ameren Missouri. Neither Ameren nor Ameren Missouri are the primary beneficiary of these variable interest entities because neither has the power to direct matters that most significantly affect the entities' activities, which include designing, financing, and constructing the wind generation facilities. As such,a result, these variable interest entities have not been consolidated. As of June 30, 2020, the “Assetsmaximum exposure to loss related to these variable interest entities was approximately $17 million, which primarily represents due diligence and legal costs incurred by Ameren Missouri associated with the acquisitions. The risk of discontinued operations”a loss was assessed to be remote and, “Liabilitiesaccordingly, Ameren and Ameren Missouri have not recognized a liability associated with any portion of discontinued operations” includedthe maximum exposure to loss. See Note 2 – Rate and Regulatory Matters for additional information on the agreements to acquire these wind generation facilities.
As of June 30, 2020, and December 31, 2016 balance sheet have been reclassified2019, Ameren had unconsolidated variable interests as a limited partner in this report tovarious equity method investments, totaling $33 million and $28 million, respectively, included in “Other current assets” and “Other current liabilities,” respectively. See Note 1 – Summary of Significant Accounting Policies under Part II, Item 8, of the Form 10-K for additional information.
Asset Retirement Obligations
The following table provides a reconciliation of the beginning and ending carrying amount of AROs for the nine months ended September 30, 2017:
|
| | | | | | | | | | | | |
| | Ameren Missouri | | Ameren Illinois(a) | | Ameren | |
| Balance at December 31, 2016 | $ | 644 |
| (b) | $ | 6 |
| | $ | 650 |
| (b) |
| Liabilities settled | (4 | ) | | (1 | ) | | (5 | ) | |
Accretion(c) | 20 |
| | (d) |
| | 20 |
| |
Change in estimates(e) | (18 | ) | | (1 | ) | | (19 | ) | |
| Balance at September 30, 2017 | $ | 642 |
| (b) | $ | 4 |
| | $ | 646 |
| (b) |
| |
(a) | Included in “Other deferred credits and liabilities” on the balance sheet. |
| |
(b) | Balance included $15 million in “Other current liabilities” on the balance sheet as of both December 31, 2016 and September 30, 2017, respectively. |
| |
(c) | Accretion expense was recorded as a decrease to regulatory liabilities. |
| |
(e) | Ameren Missouri changed its fair value estimate primarily due to an extension of the remediation period of certain CCR storage facilities, an update to the decommissioning of the Callaway energy center to reflect the cost study and funding analysis filed with the MoPSC in 2017, and an increase in the discount rate assumption. |
Share-based Compensation
A summary of nonvested performance share units at September 30, 2017, and changes during the nine months ended September 30, 2017, under the 2014 Incentive Plan are presented below:
|
| | | | | | |
| | Performance Share Units |
| | Share Units | | Weighted-average Fair Value per Share Unit |
| Nonvested at January 1, 2017 | 1,059,639 |
| | $ | 48.04 |
|
Granted(a) | 500,943 |
| | 59.16 |
|
| Forfeitures | (48,661 | ) | | 52.54 |
|
Vested(b) | (27,446 | ) | | 52.88 |
|
| Nonvested at September 30, 2017 | 1,484,475 |
| | $ | 51.55 |
|
| |
(a) | Performance share units granted to certain executive and nonexecutive officers and other eligible employees under the 2014 Incentive Plan. |
| |
(b) | Performance share units vested due to the attainment of retirement eligibility by certain employees. Actual shares issued for retirement-eligible employees vary depending on actual performance over the three-year measurement period.
|
The fair value of each performance share unit awarded in 2017 under the 2014 Incentive Plan was determined to be $59.16, which was based on Ameren’s closing common share priceconsolidated balance sheet. Ameren is not the primary beneficiary of $52.46 at December 31, 2016, and lattice simulations. Lattice simulations are usedthese investments because it does not have the power to estimate expected share payout based on Ameren’s total shareholder return for a three-year performance period beginning January 1, 2017, relativedirect matters that most significantly affect the activities of these variable interest entities. As of June 30, 2020, the maximum exposure to loss related to these variable interests is limited to the designated peer group. The simulations can produce a greater fair value for the performance share unit than the December 31 applicable closing common share price because they include the weighted payout scenariosinvestment in which an increase in the share price has occurred. The significant assumptions used to calculate fair value also included a three-year risk-free ratethese partnerships of 1.47%, volatility$33 million plus associated outstanding funding commitments of 15% to 21% for the peer group, and Ameren’s attainment of a three-year average earnings per share threshold during the performance period.$38 million.
Operating Revenue
The Ameren Companies record operating revenue for electric or natural gas service when it is delivered to customers. We accrue an estimate of electric and natural gas revenues for service rendered but unbilled at the end of each accounting period. For certain regulatory recovery mechanisms qualifying as alternative revenue programs, such as revenue requirement reconciliations, the Ameren Companies recognize revenues that have been authorized for rate recovery, are objectively determinable and probable of recovery, and are expected to be collected from customers within two years from the end of the year.
Excise TaxesCompany-owned Life Insurance
Ameren Missouri and Ameren Illinois collect certain excise taxes from customershave company-owned life insurance, which is recorded at the net cash surrender value. The net cash surrender value is the amount that are levied oncan be realized under the sale or distributioninsurance policies at the balance sheet date. As of natural gas and electricity. Excise taxes are levied on Ameren Missouri’s electric and natural gas businesses and on Ameren Illinois’ natural gas business and are recorded gross in “Operating Revenues – Electric,” “Operating Revenues – Natural gas” and “Operating Expenses – Taxes other than income taxes” onJune 30, 2020, the statementcash surrender value of income or the statement of income and comprehensive income. Excise taxes for electric service in Illinois are levied on the customer and therefore are not included in Ameren Illinois’ revenues and expenses. The following table presents
excise taxes recorded in “Operating Revenues – Electric,” “Operating Revenues – Natural gas” and “Operating Expenses – Taxes other than income taxes” for the three and nine months ended September 30, 2017 and 2016:
|
| | | | | | | | | | | | | | | | |
| | Three Months | | | Nine Months |
| | 2017 | | 2016 | | | 2017 | | 2016 |
| Ameren Missouri | $ | 51 |
| | $ | 52 |
| | | $ | 122 |
| | $ | 122 |
|
| Ameren Illinois | 10 |
| | 9 |
| | | 40 |
| | 40 |
|
| Ameren | $ | 61 |
| | $ | 61 |
| | | $ | 162 |
| | $ | 162 |
|
Earnings Per Share
Basic earnings per share is computed by dividing “Net Income Attributable to Ameren Common Shareholders” by the weighted-average number of common shares outstanding during the period. Earnings per diluted share is computed by dividing “Net Income Attributable to Ameren Common Shareholders” by the weighted-average number of diluted common shares outstanding during the period. Earnings per diluted share reflects the dilution that would occur if certain stock-based performance share units were settled. The number of performance share units assumed to be settled was 2.1 million and 1.4 million in the three and nine months ended September 30, 2017, respectively, and 0.3 million and 0.4 million, respectively, in the year-ago periods. There were no potentially dilutive securities excluded from the earnings per diluted share calculations for the three and nine months ended September 30, 2017 and 2016.
Income Taxes
In July 2017, Illinois enacted a law that increased the state's corporate income tax rate from 7.75% to 9.5% as of July 1, 2017. The law made the increase in the state’s corporate income taxrate, which was previously scheduled to decrease to 7.3% in 2025, permanent. In July 2017, Ameren recorded an expense of $14 millioncompany-owned life insurance at Ameren (parent) dueand Ameren Illinois was $257 million (December 31, 2019 – $264 million) and $117 million (December 31, 2019 – $123 million), respectively, while total borrowings against the policies were $110 million (December 31, 2019 – $114 million) at both Ameren and Ameren Illinois. Ameren and Ameren Illinois have the right to offset the revaluation of accumulated deferred taxes andborrowings against the estimated state apportionment of such taxes. Beyond this expense, Ameren does not expect this tax increase to have a material impact on its consolidated net income prospectively. The tax increase is not expected to materially impact the earningscash surrender value of the Ameren Illinois Electric Distribution,policies and, consequently, present the Ameren Transmission, or the Ameren Illinois Transmission segments, since these businesses operate under formula ratemaking frameworks. The tax increase is expected to unfavorably affect 2017 net income of the Ameren Illinois Natural Gas segment by less than $1 million. In addition,asset in the third quarter of 2017, Ameren’s and Ameren Illinois’ accumulated deferred tax balances were revalued using the state’s new corporate income tax rate, which resulted in a net increase to the liability balances of $97 million and $79 million, respectively. These increased liabilities were offset by a regulatory asset, as well as income tax expense, as discussed above.“Other assets” on their respective balance sheets.
Accounting and Reporting Developments
Below is a summary of updates related to our adoption of recently issued authoritative accounting standards. See Note 1 – Summary of Significant Accounting Policies under Part II, Item 8, of the Form 10-K for additional information about recently issued authoritative accounting standardsguidance relating to leases, financial instruments, and restricted cash.defined benefit plan disclosures.
Revenue from Contracts with CustomersMeasurement of Credit Losses on Financial Instruments
In May 2014,On January 1, 2020, the FASB issuedAmeren Companies adopted authoritative accounting guidance that changes the criteria for recognizing revenue from a contract with a customer. The underlying principle of the guidance is that an entity will recognize revenue for the transfer of promised goodsrequires credit losses on most financial assets carried at amortized cost and off-balance sheet credit exposures, such as financial guarantees or services to customers at an amount that the entity expectsloan commitments, to be entitled to in exchange for those goods or services.measured using a current expected credit loss (CECL) model. The guidance requires additional disclosuresan entity to enable usersmeasure expected credit losses using relevant information about past events, current conditions, and reasonable and supportable forecasts that affect the collectibility of the reported amount. In addition, the guidance made certain changes to the impairment model applicable to available-for-sale debt securities, such as requiring credit losses to be presented as an allowance rather than a write-down on impaired debt securities for which there is neither an intent nor a more-likely-than-not requirement to sell. Our adoption of this guidance did not have a material impact on the Ameren Companies’ financial statements to understand the nature, amount, timing, and uncertainty of revenue and cash flows arising from contracts with customers, as well as separate presentation of alternative revenue programs on the income statement. Entities can apply the guidance to each reporting period presented (the full retrospective method) or by recordingdid not result in a cumulative effect adjustment to retained earnings in the period of initial adoption (the modified retrospective method).
We have substantially completed the evaluation of our contracts and do not expect material changes to the amount or timing of revenue recognition. We will finalize our contract assessments by the end of 2017. We will apply the guidance using the full retrospective method and include disaggregated revenue disclosures by segment and customer class in the combined notes to the financial statements in the first quarter of 2018.
Improving the Presentation of Net Periodic Pension Cost and Net Periodic Postretirement Benefit Cost
In March 2017, the FASB issued authoritative guidance that requires an entity to retrospectively report the service cost component of net benefit cost in the same line item(s) as other compensation costs arising from services rendered by employees during the period and to present the other components of net benefit cost in the income statement separately from the service cost component and outside of operating income. The guidance also requires that an entity only capitalize the service cost component as part of an asset, such as inventory or property, plant, and equipment, on a prospective basis. Previously, all of the net benefit cost components were eligible for capitalization.
This change in the capitalization of net benefit costs will not affect our ability to continue to obtain recovery of net benefit costs through customer rates.adoption date. See Note 1113 – Retirement BenefitsSupplemental Information for the components of net benefit cost. This guidance will be effective for the Ameren Companies in the first quarter of 2018. We are currently assessing the impacts of this guidanceadditional information regarding credit losses on our results of operations, financial position, and disclosures.accounts receivable.
NOTE 2 – RATE AND REGULATORY MATTERS
Below is a summary of updates to significant regulatory proceedings and related lawsuits.legal proceedings. See also Note 2 – Rate and Regulatory Matters under Part II, Item 8, of the Form 10-K.10-K for additional information and a summary of our regulatory frameworks. We are unable to predict the ultimate outcome of these matters, the timing of the final decisions of the various agencies and courts, or the impact on our results of operations, financial position, or liquidity.
Missouri
March 20172019 Electric Service Regulatory Rate OrderReview
In March 2017,2020, the MoPSC issued an order approving a unanimous stipulation and agreement in Ameren Missouri’s July 20162019 electric service regulatory rate review.review, approving nonunanimous stipulation and agreements. The order resulted in a $3.4 billion revenue requirement, which is a $92decrease of $32 million increase into Ameren Missouri’sMissouri's annual revenue requirement for electric service, comparedretail service. The order also provided for the continued use of the FAC and trackers for pension and postretirement benefits, uncertain income tax positions, and certain excess deferred income taxes that the MoPSC previously authorized in earlier electric rate orders. The order reduced the annualized base level of net energy costs pursuant to its prior revenue requirementthe FAC by approximately $115 million from the base level established in the MoPSC's April 2015MoPSC’s March 2017 electric rate order. The order also changed the annualized regulatory asset and liability amortization amounts and the base level of expenses for regulatory tracking mechanisms. On an annualized basis, these changes reflect approximately$20 millionof increased revenues and approximate decreases in purchased power expenses of$15 million, other operating and maintenance expenses of$60 million, and income tax expenses of $20 million. Additionally, the annual revenue requirement incorporated increases of approximately $50 million for the reduction in sales volumes resulting from MEEIA programs and approximately $50 million of depreciation and amortization expense for amounts previously deferred under PISA. The increase in the annual revenue requirement related to the MEEIA programs is seasonally weighted to the summer. One of the stipulation and agreements approved by the MoPSC’s March 2020 order states that the net impact of the revenue and expense changes noted above reflects a 9.4% to 9.8% ROE on an unspecified percent of common equity applicable to rate base. In addition, the order required Ameren Missouri to donate $8 million to low-income assistance programs, which was reflected in results of operations in the first quarter of 2020.The new rates, base level of expenses, and amortizations became effective on April 1, 2017.
The order authorized the continued use of the FAC and the regulatory tracking mechanisms for pension and postretirement benefits, uncertain income tax positions, and renewable energy standards that2020. In April 2020, the MoPSC authorized in earlier electric rate orders. These regulatory tracking mechanisms provide for a base level of expense to be reflectedissued another order in Ameren Missouri’s baseJuly 2019 electric rates with differences inservice regulatory rate review, reaffirming the actual expenses incurred recorded as a regulatory asset or liability. Excluding cost reductions associated with reduced sales volumes, the base levelexisting percentage of net energy costs decreased by $54 millioncost variances allowed to be recovered or refunded under the FAC.
Wind Generation Facilities
In 2019, Ameren Missouri entered into a build-transfer agreement to acquire, after construction, an up-to 300-megawatt wind generation facility. In 2018, Ameren Missouri entered into a build-transfer agreement to acquire, after construction, an up-to400-megawatt wind generation facility. These two agreements are subject to customary contract terms and conditions. The two build-transfer acquisitions collectively represent $1.2 billion of capital expenditures and would support Ameren Missouri’s compliance with the Missouri renewable energy standard. Both acquisitions have received all regulatory approvals, and both projects have received all applicable zoning approvals, have entered into RTO interconnection agreements, and are under construction.
In 2020, the developers of the wind generation facilities received notices from the base level establishedwind turbine supplier to each facility, and the developer of the up-to 300-megawatt project received a notice from the construction contractor, of changes in supply and/or construction activities resulting from the COVID-19 pandemic. There have been changes to the schedules for both projects, particularly with regard to wind turbine deliveries. Ameren Missouri and the developers continue to monitor the impact to each project schedule. Ameren Missouri expects the up-to 400-megawatt project and a majority of the up-to 300 megawatt project to be placed in-service by the end of 2020. However, at this time, due to manufacturing, shipping, and other supply chain issues, and based on an updated schedule from the developer, Ameren Missouri expects a portion of the up-to 300-megawatt project, representing approximately $100 million of investment, to be placed in-service in the MoPSC's April 2015 electric rate order. Changesfirst quarter of 2021. In May 2020, the IRS issued guidance that extended the in-service date criteria to December 31, 2021, for qualifying for federal production tax credits. As a result of this extension, Ameren does not anticipate that delays in amortizationsthe completion of the wind generation facilities will affect Ameren’s ability to realize anticipated federal production tax credits.
MEEIA
In August 2020, the MoPSC issued an order approving a unanimous stipulation and agreement with respect to the base level2022 program year of expensesAmeren Missouri’s MEEIA 2019 program. The order establishes performance incentives that would provide Ameren Missouri an opportunity to earn additional revenues, including $11 million if Ameren Missouri achieves certain energy-efficiency goals during the 2022 program year and an additional $1 million if Ameren Missouri exceeds its targeted energy-efficiency goals. Ameren Missouri intends to invest $70 million in energy-efficiency programs during the 2022 program year. The August 2020 order also approved Ameren Missouri’s energy savings results for the other regulatory tracking mechanisms, including extendingfirst year of the amortization periodMEEIA 2019 program. As a result of certain regulatory assets, reduced expenses by $26this order and in accordance with revenue recognition guidance, Ameren Missouri will recognize revenues of $6 million from the base levels established in the MoPSC's April 2015 electric rate order.
ATXI’s Mark Twain Project
The Mark Twain project is a MISO-approved transmission line to be located in northeast Missouri. In the third quarter of 2017, ATXI finalized an alternative project route and reached agreements with a cooperative electric company in northeast Missouri and2020. Ameren Missouri did not recognize revenues related to locate nearly all of the Mark Twain project on existing transmission line corridors. It also received assents for road crossings from the five affected counties in northeast Missouri. ATXI had previously filed suit in the circuit courts to obtain assents for the original project route. ATXI has since withdrawn one of the lawsuits. The other lawsuits remain pending but have been stayed until the first quarter of 2018. In September 2017, ATXI filed for a certificate of convenience and necessity with the MoPSC and anticipates a decision from the MoPSC inMEEIA performance incentives during the first half of 2018. ATXI plans2020. As a result of MoPSC orders issued in September 2017, October 2018, and January 2019 related to complete
performance incentives for the projectMEEIA 2013 and MEEIA 2016 programs, and in December 2019; however, delaysaccordance with revenue recognition guidance, Ameren Missouri recognized revenues of $20 million during the first quarter and first half of 2019.
Customer Disconnections and Late Fees
Ameren Missouri resumed charging late fees to commercial and industrial customers and disconnecting those customers for nonpayment in obtaining approval frommid-July 2020, while it resumed those activities for residential customers in early August 2020, following the MoPSC could delay completion.suspension of both disconnections and late fees for all customers in mid-March 2020. Ameren Missouri does not have a regulatory mechanism to recover forgone late fees.
Illinois
IEIMA & FEJA
Ameren Illinois’ electric distribution service rates are subject to an annual revenue requirement reconciliation to its actual recoverable costs and allowed return on equity under a formula ratemaking process effective through 2022. This formula ratemaking framework qualifies as an alternative revenue program under GAAP. Each year, Ameren Illinois records a regulatory asset or a regulatory liability and a corresponding increase or decrease to operating revenues for any differences between the revenue requirement reflected in customer rates for that year and its estimate of the probable increase or decrease in the revenue requirement expected to ultimately be approved by the ICC based on that year's actual recoverable costs incurred and investment return. As of September 30, 2017, Ameren Illinois had recorded regulatory assets of $24 million to reflect its 2016 revenue requirement reconciliation adjustment, which was included in the April 2017 formula rate update discussed below, and $16 million for the approved 2015 revenue requirement reconciliation adjustment, each with interest. As of September 30, 2017, Ameren Illinois had recorded a regulatory liability of $1 million to reflect the difference between Ameren Illinois’ estimate of its 2017 revenue requirement and the revenue requirement reflected in customer rates, including interest.Electric Distribution Service Rates
In April 2017,2020, Ameren Illinois filed with the ICC its annual electric distribution service formula rate update to establishreduce its rates by $45 million with the ICC. This update reflects a decrease to the annual formula rate based on 2019 actual costs, a decrease to include the 2019 revenue requirement usedreconciliation adjustment, and a decrease for the conclusion of the 2018 rates.revenue requirement reconciliation adjustment, which will be fully collected from customers in 2020, consistent with the ICC’s December 2019 annual update filing order. It also reflects an increase based on expected net plant additions for 2020. In June 2017,2020, the ICC staff submitted its calculation of the revenue requirement whichincluded in Ameren Illinois supported in its revised July 2017 filing, and recommended a decrease to the electric distribution service revenue requirement. Pending ICC approval, thisIllinois’ update filing, will result inrecommending a $17$53 million decrease in Ameren Illinois’ electric distribution service revenue requirement beginning in January 2018. This update reflects an increase to the annual formula rate based on 2016 actual costs and expected net plant additions for 2017, as well as an increase to include the 2016 revenue requirement reconciliation adjustment. The increases in the update filing are more than offset by a decrease for the conclusion of the 2015 revenue requirement reconciliation adjustment, which will be fully collected from
customers in 2017, consistent with the ICC’s December 2016 annual update filing order. In November 2017, an administrative law judge issued a proposed order that was consistent with Ameren Illinois’ revised July 2017 filing.rates. An ICC decision regarding the revenue requirement to be used for customer rates in 2018this proceeding is expected by December 2017.2020, with new rates effective January 2021.
Electric Customer Energy-Efficiency Investments
In May 2020, Ameren Illinois filed its annual electric customer energy-efficiency formula rate update to increase its rates by $7 million with the ICC. An ICC decision in this proceeding is expected by December 2020, with new rates effective January 2021.
2020 Natural Gas Delivery Service Regulatory Rate Review
In February 2020, Ameren Illinois filed a request with the ICC seeking approval to increase its annual revenues for natural gas delivery service. In July 2020, Ameren Illinois filed a revised request seeking to increase its annual revenues for natural gas delivery service by $96 million, which includes an estimated $46 million of annual revenues that would otherwise be recovered under the QIP and other riders. The FEJA revised certain portionsrequest is based on a 10.5% allowed ROE, a capital structure composed of the IEIMA, including extending the IEIMA formula ratemaking process through 2022 and clarifying that a54.1% common equity, ratioand a rate base of up to, and including, 50% is prudent. Beginning in 2017, the FEJA provides that$2.1 billion. Ameren Illinois used a 2021 future test year in this proceeding. In June 2020, the ICC staff recommended an increase to annual revenues for natural gas delivery service of $67 million, based on a 9.3% ROE, a capital structure composed of 50.4% common equity, and a rate base of $2.1 billion. A decision by the ICC in this proceeding is required by January 2021, with new rates expected to be effective in February 2021. Ameren Illinois cannot predict the level of any delivery service rate change the ICC may approve, nor whether any rate change that may eventually be approved will recover, withinbe sufficient to enable Ameren Illinois to earn a reasonable return on investments when the following two years, its electric distribution revenue requirementrate changes go into effect.
QIP Reconciliation Hearing
In March 2019, Ameren Illinois filed a request with the ICC for a given year, independentreconciliation hearing to determine the accuracy and prudence of actual sales volumes. Prior tonatural gas capital investments recovered under the FEJA, Ameren Illinois’ interim period revenue recognition was volume-based, as revenues were affected byQIP rider during 2018. In November 2019, the timingIllinois Attorney General's office challenged the recovery of sales volumes due to seasonal rates and changes in volumes resulting from,capital investments, among other things, weatherthat were made during 2018, alleging that the amount of investments is excessive based on a comparison to historical investment levels. The Illinois Attorney General's office is not alleging project imprudence or that the investments do not qualify for recovery. In March 2020, the ICC staff filed testimony that supports the prudence and energy efficiency. This previous revenue recognition method resulted in more revenues during the third quarter and less revenues during the other quarters of each year. Beginning in 2017, in connection with the decoupling provisionsreasonableness of the FEJA,capital investments made during 2018. Ameren Illinois changed its method usedIllinois’ 2018 QIP rate recovery request under review by the ICC is within the rate increase limitations allowed by law. The ICC is under no deadline to recognize interim period revenue. Ameren Illinois now recognizes revenue consistent with the timing of actual incurred electric distribution recoverable costs and recognizes revenue associated with the expected return on its rate base ratably over the year. Ameren Illinois recognized a reduction to electric revenue to reflect the difference between the estimate of its revenue requirement and the revenue requirement reflectedissue an order in customer rates of $76 million and $1 million for the three and nine months ended September 30, 2017, respectively. Comparative electric revenues at Ameren Illinois for the three and nine months ended September 30, 2016, were increased $11 million and $24 million, respectively, for the difference between the estimate of its revenue requirement and the revenue requirement reflected in customer rates.this proceeding.
Service Disconnection Moratorium Proceeding
In June 2017, pursuant to the FEJA, Ameren Illinois filed with the ICC an energy efficiency plan for 2018 through 2021. In September 2017,March 2020, the ICC issued an order approving Ameren Illinois' implementationrequiring all Illinois electric distribution and natural gas utilities to suspend disconnections and late fees for customer nonpayment, on an interim basis, effective March 18, 2020. Pursuant to an ICC order issued in June 2020 and a voluntary extension of FEJA electric energy efficiency savings targets and investments.the suspension of residential disconnections, Ameren Illinois plansexpects to invest upresume disconnecting commercial and industrial customers and residential customers for nonpayment in mid-August 2020 and early September 2020, respectively, while it resumed charging late fees to $99 millionall customers in electric energy efficiencylate July 2020.The June 2020 order requires Ameren Illinois to implement more flexible credit and collection practices, on a temporary basis, including longer deferred payment arrangements, extending to 24 months in certain cases, and programs per year from 2018 through 2021 thatto provide financial assistance to customers. In addition, the order allows Ameren Illinois to recover costs incurred related to the financial assistance programs. These costs will earn a return. The electric energy efficiency program investmentsbe deferred as regulatory assets and the return on those investmentsportion associated with Ameren Illinois’ electric
distribution business will be collected from customersrecovered through its bad debt rider and the portion associated with its natural gas distribution business will be recovered through a special purpose rider established by the order. The order also allows Ameren Illinois to recover forgone customer late fees and costs incurred related to the COVID-19 pandemic. The portion of these forgone late fees and costs associated with Ameren Illinois’ electric distribution business will be recovered through formula rates and the portion associated with its natural gas distribution business will be recovered through the special purpose rider. In addition, the order allows Ameren Illinois’ electric distribution business to recover bad debt expense, instead of write-offs, net of subsequent recoveries, through its bad debt riders until the end of 2020.
Federal
Transmission Formula Rate Revisions
In February 2020, MISO, on behalf of Ameren Missouri, Ameren Illinois, and ATXI, filed requests with the FERC to revise each company’s transmission formula rate calculations with respect to calculation inputs for materials and supplies. In May 2020, the FERC issued orders approving the revisions prospectively. In addition, the FERC declined to order refunds for earlier periods, as requested by intervenors in Ameren Illinois’ filing, but directed its audit staff to review historical rate recovery in connection with an ongoing FERC audit. This review could lead the FERC to ultimately require refunds for periods prior to 2019. In June 2020, Ameren Missouri, Ameren Illinois, and ATXI filed requests for rehearing arguing, among other things, the revisions should be applied retrospectively to include the period January 1, 2019, to June 1, 2020, and that the FERC should not be includedrequire refunds for periods prior to 2019. In July 2020, the FERC denied the rehearing requests without addressing the issues raised, and indicated it will issue future orders. The FERC is under no deadline to issue orders, nor is it required to address the issues raised in the IEIMA formula ratemaking process.
ATXI’srehearing requests. In July 2020, Ameren Missouri, Ameren Illinois, Rivers Project
In August 2017,and ATXI filed an appeal of the Illinois Circuit Court for Edgar County dismissed several of ATXI’s condemnation cases related to one segment in the Illinois Rivers project, which has an estimated segment cost of approximately $85 million, of which $32 million was invested as of September 30, 2017. These cases had been filed in order to obtain necessary easements and rights of way to complete the segment. The court found that required notice was not givenJuly 2020 rehearing denials to the relevant landowners duringUnited States Court of Appeals for the underlying ICC proceeding. ATXI intendsDistrict of Columbia Circuit, which is under no deadline to appeal this decision. ATXI plans to completeaddress the project in 2019; however, delays associated with the condemnation proceedings or an appeal arising from the order dismissing the Edgar County cases could delay the completion date. The other eight segmentsappeal. Regardless of the Illinois Rivers projectoutcome of the appeal, the impacts of the May 2020 orders are not affected by these proceedings.
Federalexpected to be material to Ameren’s, Ameren Missouri’s, or Ameren Illinois’ results of operations, financial position, or liquidity.
FERC Complaint Cases
In November 2013, a customer group filed a complaint case with the FERC seeking a reduction in the allowed base return on common equityROE for FERC-regulated transmission rate base under the MISO tariff from 12.38% to 9.15%. In September 2016, the FERC issued a finalan order in the November 2013 complaint case, which lowered the allowed base return on common equity for the 15-month period of November 2013 to February 2015ROE to 10.32%, or a 10.82% total allowed return on common equity with the inclusion of a 50 basis point incentive adder for participation in an RTO. The order required customer refunds, with interest, to be issued for that 15-month period. In the first six months of 2017, Ameren and Ameren Illinois refunded $21 million and $17 million, respectively, related to the November 2013 complaint case. In addition, the 10.82% allowed return on common equity has been reflected in rates since September 2016. The 10.82% allowed return on common equity may be replaced prospectively after the FERC issues a final order in the February 2015 complaint case, discussed below.
Since the maximum FERC-allowed refund period for the November 2013 complaint case ended in February 2015, another customer complaint case was filed in February 2015. MISO transmission owners have since filed a motion to dismiss the February 2015 complaint. See below for additional information about the motion. The February 2015 complaint case seeks a further reduction in the allowed base return on common equity for FERC-regulated transmission rate base under the MISO tariff. In June 2016, an administrative law judge issued an initial decision in the February 2015 complaint case, which, if approved by the FERC, would lower the allowed base return on common equity for the 15-month period of February 2015 to May 2016 to 9.70%, or a 10.20% total allowed return on equityROE with the inclusion of a 50 basis point incentive adder for participation in an RTO, that was effective from late September 2016 forward. The September 2016 order also required refunds for the period November 2013 to February 2015, which were paid in 2017. With the maximum FERC-allowed refund period for the November 2013 complaint case ending in February 2015, another customer complaint case was filed in February 2015, seeking a further reduction in the allowed base ROE for the period of February 2015 to May 2016. In November 2019, the FERC issued an order addressing the November 2013 complaint case, which set the allowed base ROE at 9.88%, superseding the 10.32% previously ordered, and require customerrequired refunds, with interest, for that 15-month period.the periods November 2013 to February 2015 and from late September 2016 forward. The timing of the issuance of the final order inalso dismissed the February 2015 complaint case is uncertaincase. In December 2019, MISO transmission owners, including Ameren Missouri, Ameren Illinois, and ATXI, filed requests for two reasons. First, whilerehearing with the FERC. Additionally, in December 2019, various parties filed requests for rehearing with the FERC, reestablished a quorumchallenging the dismissal of commissioners in August 2017 after six months without a quorum,the February 2015 complaint case. In May 2020, the FERC issued an order addressing the requests for rehearing, which set the allowed base ROE at 10.02%, superseding the 9.88% previously ordered, and required refunds, with interest, for the periods November 2013 to February 2015 and from late September 2016 forward. The May 2020 order also denied rehearing of the FERC's dismissal of the February 2015 complaint case. In June 2020, various parties filed requests for rehearing with the FERC, challenging the new ROE methodology established by the May 2020 order. The FERC has not ruled on the rehearing requests and is under no deadline to issue a final order. Second, indo so. In July 2020, Ameren Missouri, Ameren Illinois, and ATXI filed an appeal of the second quarter of 2017,May 2020 order to the United States Court of Appeals for the District of Columbia Circuit vacated and remanded tochallenging the FERC an order in a separate case in which the FERC established the allowed base return on common equity methodology used in the two MISO complaint cases described above. Ameren is unable to predict the impact of the outcome of the United States Court of Appealsrefunds required for the District of Columbia Circuit’s remand on the MISO FERC complaint cases at this time.
Inperiod from September 2017, MISO transmission owners, including Ameren Missouri, Ameren Illinois, and ATXI, filed a motion2016 to dismiss the February 2015 complaint case with the FERC.May 2020. The MISO transmission owners maintain that the February 2015 complaint was predicated on the now superseded 12.38% allowed base return on common equity being an unjust and unreasonable return and is not applicable given the currently effective 10.32% allowed base return on common equity. The MISO transmission owners further maintain that the currently effective 10.32% allowed base return on common equity has not been proven to be unjust and unreasonable based on information provided, including the base return on common equity methodology ranges set forth in the February 2015 complaint case and the initial decision issued by an administrative law judge in June 2016. Additionally, the MISO transmission owners maintain that the February 2015 complaint should be dismissed because the approach utilized in the case to assert that a return on common equity was unjust and unreasonable is insufficient. That same approach was rejected by the United States Court of Appeals for the District of Columbia Circuit, as discussed above. FERCcourt is under no deadline to issue an order on this motion.address the appeal.
As a result of Septemberthe May 2020 order, which increased the FERC-allowed base ROE from 9.88% to 10.02%, Ameren and Ameren Illinois recognized income of $13 million and $7 million, respectively, during the second quarter of 2020. As of June 30, 2017,2020, Ameren and Ameren Illinois had recorded current regulatory liabilities of $41$23 million and $24$11 million, respectively, to reflect the expected refunds, including interest, associated with the reduced allowed returns on common equitybase ROE set by the May 2020 order in the initial decision in the February 2015November 2013 complaint case. Ameren Missouri does not expect that a reductionThe increase in the FERC-allowed base return on common equity would beROE resulting from the May 2020 order is not material to itsAmeren Missouri’s results of operations, financial position, or liquidity.
In March 2019, the FERC issued separate Notices of Inquiry regarding its allowed base ROE policy and its transmission incentives policy. The Notice of Inquiry addressing the FERC’s base ROE policy, among other things, broadened the ability to comment on the new methodology beyond electric utilities that are participants in the complaint cases. The transmission incentives Notice of Inquiry was open for comment on the FERC’s transmission incentive policy, including incentive adders to the base ROE. In March 2020, the FERC issued a Notice of Proposed Rulemaking on its transmission incentives policy, which addressed many of the issues in the Notice of Inquiry on transmission incentives, and included an increased incentive in the allowed base ROE for participation in an RTO to 100 basis points from the current 50 basis points and improved parameters for awarding incentives, while limiting the overall incentives to a cap of 250 basis points,
among other things. Initial comments were due by July 2020. While the FERC has not formally terminated the Notice of Inquiry regarding its transmission incentives policy, Ameren does not expect further actions relating to it. Ameren is unable to predict the ultimate impact of the Notice of Inquiry regarding its allowed base ROE policy or the Notice of Proposed Rulemaking at this time.
NOTE 3 – SHORT-TERM DEBT AND LIQUIDITY
The liquidity needs of the Ameren Companies are typically supported through the use of available cash, drawings under committed credit agreements, commercial paper issuances, or,and, in the case of Ameren Missouri and Ameren Illinois, short-term intercompanyaffiliate borrowings. See Note 4 – Short-term Debt and Liquidity under Part II, Item 8, in the Form 10-K for a description of our indebtedness provisions and other covenants as well as a description of money pool arrangements.
Short-Term Borrowings
The Missouri Credit Agreement and the Illinois Credit Agreement both of which expire in December 2021, were not utilized for direct borrowings during the nine months ended September 30, 2017, but were usedare available to support issuances under Ameren (parent)’s, Ameren Missouri’s, and Ameren Illinois’ commercial paper issuancesprograms, respectively, subject to borrowing sublimits, and to issuethe issuance of letters of credit. BasedAs of June 30, 2020, based on commercial paper outstanding as well asand letters of credit issued under the Credit Agreements, along with cash and cash equivalents, the aggregate amount of credit capacitynet liquidity available under the Credit Agreements to Ameren (parent), Ameren Missouri, and Ameren Illinois, collectively, at September 30, 2017, was $1.7 billion.$2.2 billion. The Ameren Companies were in compliance with the covenants in their Credit Agreements as of SeptemberJune 30, 2017.2020. As of SeptemberJune 30, 2017,2020, the ratios of consolidated indebtedness to consolidated total capitalization, calculated in accordance with the provisions of the Credit Agreements, were 51%56%, 47%50%, and 46%44% for Ameren, Ameren Missouri, and Ameren Illinois, respectively.
Commercial Paper
The following table presents commercial paper outstanding, net of issuance discounts, as of SeptemberJune 30, 2017,2020, and December 31, 2016:2019. There were no borrowings outstanding under the Credit Agreements as of June 30, 2020, or December 31, 2019.
| | | | | | | | | | | | | | |
| June 30, 2020 | | | December 31, 2019 |
| Ameren (parent) | $ | — | | | | $ | 153 | |
| Ameren Missouri | 79 | | | | 234 | |
| Ameren Illinois | 41 | | | | 53 | |
| Ameren consolidated | $ | 120 | | | | $ | 440 | |
|
| | | | | | | |
| | 2017 | | 2016 |
| Ameren (parent) | $ | 277 |
| | $ | 507 |
|
| Ameren Missouri | — |
| | — |
|
| Ameren Illinois | 169 |
| | 51 |
|
| Ameren Consolidated | $ | 446 |
| | $ | 558 |
|
The following table summarizes the borrowing activity and relevant interest rates under Ameren’sfor Ameren (parent),’s, Ameren Missouri’s, and Ameren Illinois’ commercial paper programsissuances and borrowings under the Credit Agreements in the aggregate for the ninesix months ended SeptemberJune 30, 20172020 and 2016:2019:
| | | | | | | | | | | | | | | | | | | | | | | | | | | | | |
| | Ameren
(parent) | | Ameren
Missouri | | Ameren
Illinois | | Ameren
Consolidated | |
| 2020 | | | | | | | | | |
| Average daily amount outstanding | | $ | 93 | | | $ | 202 | | | $ | 40 | | | $ | 335 | | |
| | | | | | | | | |
| Weighted-average interest rate | | 2.05 | % | | 1.86 | % | | 1.98 | % | | 1.92 | % | |
Peak amount outstanding during period(a) | | $ | 425 | | | $ | 573 | | | $ | 150 | | | $ | 908 | | |
| Peak interest rate | | 3.30 | % | | 5.05 | % | (b) | 3.40 | % | | 5.05 | % | (b) |
| 2019 | | | | | | | | | |
| Average daily amount outstanding | | $ | 542 | | | $ | 174 | | | $ | 106 | | | $ | 822 | | |
| | | | | | | | | |
| Weighted-average interest rate | | 2.80 | % | | 2.79 | % | | 2.72 | % | | 2.79 | % | |
Peak amount outstanding during period(a) | | $ | 636 | | | $ | 549 | | | $ | 202 | | | $ | 1,113 | | |
| Peak interest rate | | 3.10 | % | | 2.97 | % | | 2.90 | % | | 3.10 | % | |
|
| | | | | | | | | | | | | | |
| | | Ameren (parent) | Ameren Missouri | Ameren Illinois | Ameren Consolidated |
| 2017 | | | | | | |
| Average daily commercial paper outstanding | | $ | 669 |
| | $ | 7 |
| $ | 78 |
| $ | 754 |
|
| Weighted-average interest rate | | 1.27 | % | | 1.20 | % | 1.28 | % | 1.27 | % |
Peak commercial paper during period(a) | | $ | 841 |
| | $ | 64 |
| $ | 193 |
| $ | 948 |
|
| Peak interest rate | | 1.50 | % | | 1.41 | % | 1.50 | % | 1.50 | % |
| 2016 | | | | | | |
| Average daily commercial paper outstanding | | $ | 435 |
| | $ | 80 |
| $ | 48 |
| $ | 563 |
|
| Weighted-average interest rate | | 0.81 | % | | 0.74 | % | 0.72 | % | 0.79 | % |
Peak commercial paper during period(a) | | $ | 574 |
| | $ | 208 |
| $ | 195 |
| $ | 839 |
|
| Peak interest rate | | 0.95 | % | | 0.85 | % | 0.85 | % | 0.95 | % |
| |
(a) | The timing of peak commercial paper issuances varies by company. Therefore, the sum of peak commercial paper issuances presented by company does not equal the Ameren Consolidated peak commercial paper issuances for the period. |
(a)The timing of peak outstanding commercial paper issuances and borrowings under the Credit Agreements varies by company. Therefore, the sum of individual company peak amounts may not equal the Ameren consolidated peak for the period.
(b)Ameren Missouri’s peak interest rate was affected by temporary disruptions in the commercial paper market in the first quarter of 2020.
Money Pools
Ameren has money pool agreements with and among its subsidiaries to coordinate and provide for certain short-term cash and working capital requirements. The average interest rate for borrowingborrowings under the utility money pool for the three and ninesix months ended SeptemberJune 30, 2017,2020, was 1.24%0.42% and 1.18%, respectively (2016(2019 – 0.53%2.75% and 0.54%2.81%, respectively). See Note 8 – Related PartyRelated-party Transactions for the amount of interest income and expense from the utility money pool arrangements recorded by the Ameren CompaniesMissouri and Ameren Illinois for the three and ninesix months ended SeptemberJune 30, 20172020 and 2016.2019.
NOTE 4 – LONG-TERM DEBT AND EQUITY FINANCINGS
Ameren Missouri
For the three and six months ended June 30, 2020, Ameren issued a total of 0.2 million and 0.4 million shares of common stock, respectively, under its DRPlus and 401(k) plan, and received proceeds of $14 million and $27 million, respectively. In addition, in the first quarter of 2020, Ameren issued 0.5 million shares of common stock valued at $38 million upon the vesting of stock-based compensation.
In August 2019, Ameren entered into a forward sale agreement with a counterparty relating to 7.5 million shares of common stock.The forward sale agreement will be physically settled unless Ameren elects to settle in cash or to net share settle. At June 30, 2020, Ameren could have settled the forward sale agreement with physical delivery of 7.5 million shares of common stock to the counterparty in exchange for $547 million. The forward sale agreement could also have been settled at June 30, 2020, with delivery of approximately $16 million or 0.2 million shares of common stock to the counterparty, if Ameren had elected to net cash or net share settle, respectively. For additional information about the forward sale agreement, see Note 5 – Long-Term Debt and Equity Financings under Part II, Item 8, in the Form 10-K.
In June 2017,April 2020, Ameren Missouri(parent) issued $400$800 million principal amount of 2.95%3.50% senior securedunsecured notes due June 2027,January 2031, with interest payable semiannually on JuneJanuary 15 and DecemberJuly 15, beginning July 15, 2020. Ameren received net proceeds of $793 million, which were used for general corporate purposes, including to repay outstanding short-term debt, and will be used to fund the repayment of Ameren’s 2.70% senior unsecured notes due November 2020.
Ameren Missouri
In March 2020, Ameren Missouri issued $465 million of 2.95% first mortgage bonds due March 2030, with interest payable semiannually on March 15 and September 15 of each year, beginning in December 2017.September 15, 2020. Ameren Missouri received net proceeds of $396$462 million, which were used in conjunction with other available funds, to repay at maturityoutstanding short-term debt, including short-term debt that Ameren Missouri incurred in June 2017 $425connection with the repayment of $85 million principal amount of its 6.40%5.00% senior secured notes.notes that matured in February 2020.
ATXIAmeren Illinois
In June 2017, pursuant to a note purchase agreement, ATXI agreed to issue $450 million principal amount of 3.43% senior unsecured notes, due 2050, through a private placement offering exempt from registration under the Securities Act of 1933, as amended. ATXI issued $150 million principal amount of the notes in June 2017 and the remaining $300 million principal amount of the notes in August 2017. ATXIAmeren Illinois received proceeds of $449cash capital contributions totaling $350 million from the notes, which were used by ATXI to repay existing short-term and long-term affiliate debt owed to Ameren (parent).
ATXI may prepay at any time not less than 5% of during the principal amount of notes then outstanding at 100% of the principal amount plus a make-whole premium. In the event of a change of control, as defined in the agreement, each holder of notes may require ATXI to prepay the entire unpaid principal amount of the notes held by such holder at a price equal to 100% of the principal amount of such notes together with accrued and unpaid interest thereon. The following table presents the principal maturities schedule for the notes: |
| | | |
| Payment Date | | Principal Payment |
|
| August 2022 | $ | 49.5 |
|
| August 2024 | | 49.5 |
|
| August 2027 | | 49.5 |
|
| August 2030 | | 49.5 |
|
| August 2032 | | 49.5 |
|
| August 2038 | | 49.5 |
|
| August 2043 | | 76.5 |
|
| August 2050 | | 76.5 |
|
| Total Principal Amount of Notes | $ | 450.0 |
|
The note purchase agreement includes financial covenants that require ATXI to not permit at any time: (i) debt to exceed 70% of total capitalization or (ii) secured debt to exceed 10% of total assets. The note purchase agreement also contains restrictive covenants that, among other things, restrict the ability of ATXI to: (i) enter into transactions with affiliates; (ii) consolidate, merge, transfer or lease all or substantially all of its assets; and (iii) create liens.six months ended June 30, 2020.
Indenture Provisions and Other Covenants
Ameren Missouri’s and Ameren Illinois’ indentures and articles of incorporation include covenants and provisions related to issuances of first mortgage bonds and preferred stock. Ameren Missouri and Ameren Illinois are required to meet certain ratios to issue additional first mortgage bonds and preferred stock. A failure to achieve these ratios would not result in a default under these covenants and provisions, but would restrict the companies’ ability to issue first mortgage bonds or preferred stock. See Note 5 – Long-Term Debt and Equity Financings under Part II, Item 8, in the Form 10-K for a description of our indenture provisions and other covenants, as well as restrictions on the payment of dividends. See the discussion above for covenants related to ATXI’s note purchase agreement. At SeptemberJune 30, 2017,2020, the Ameren Companies were in compliance with the provisions and covenants contained in their indentures and articles of incorporation, as applicable, and ATXI was in compliance with the provisions and covenants contained in its note purchase agreement.
Off-Balance-SheetOff-balance-sheet Arrangements
At SeptemberJune 30, 2017,2020, none of the Ameren Companies had any significant off-balance-sheet financing arrangements, other than operating leases
entered into in the ordinary course of business,forward sale agreement relating to common stock, variable interest entities, letters of credit, and Ameren parent(parent) guarantee arrangements on behalf of its subsidiaries. See Note 1 – Summary of Significant Accounting Policies for further detail concerning variable interest entities.
NOTE 5 – OTHER INCOME, AND EXPENSESNET
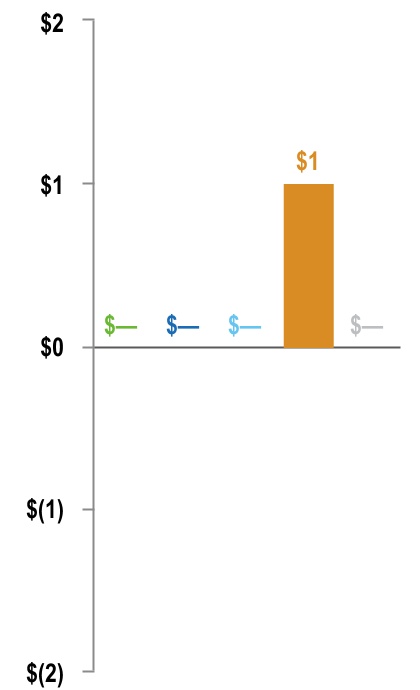
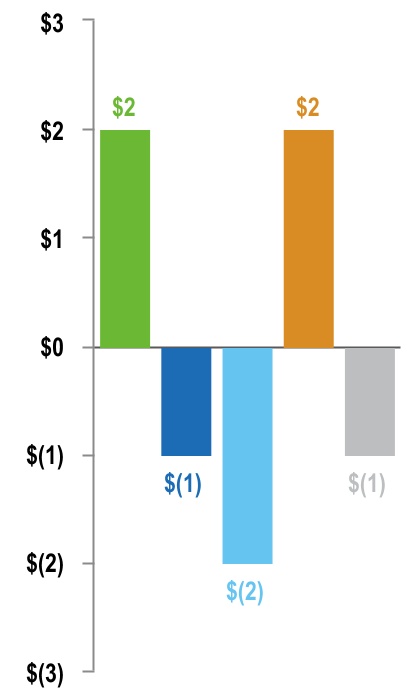
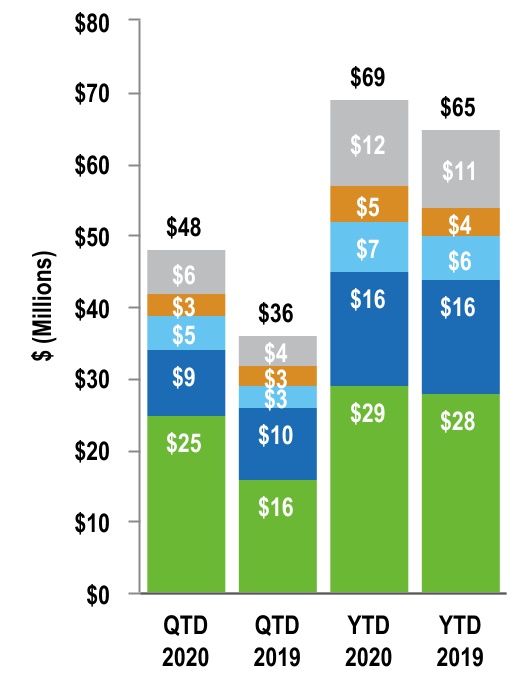
The following table presents the components of “Other Income, and Expenses”Net” in the Ameren Companies’ statements of income for the three and ninesix months ended SeptemberJune 30, 20172020 and 2016:2019:
| | | | | | | | | | | | | | | | | | | | | | | | | | |
| Three Months | | | | Six Months | | | |
| 2020 | | 2019 | | 2020 | | 2019 | |
| Ameren: | | | | | | | | |
| | | | | | | | |
| Allowance for equity funds used during construction | $ | 9 | | | $ | 8 | | | $ | 13 | | | $ | 13 | | |
| Interest income on industrial development revenue bonds | 6 | | | 6 | | | 12 | | | 13 | | |
| Other interest income | 1 | | | 3 | | | 2 | | | 4 | | |
| | | | | | | | |
Non-service cost components of net periodic benefit income(a) | 30 | | | 22 | | | 53 | | | 44 | | |
| Miscellaneous income | 7 | | | 1 | | | 9 | | | 4 | | |
| Donations | (1) | | | (1) | | | (14) | | (b) | (7) | | |
| Miscellaneous expense | (4) | | | (3) | | | (6) | | | (6) | | |
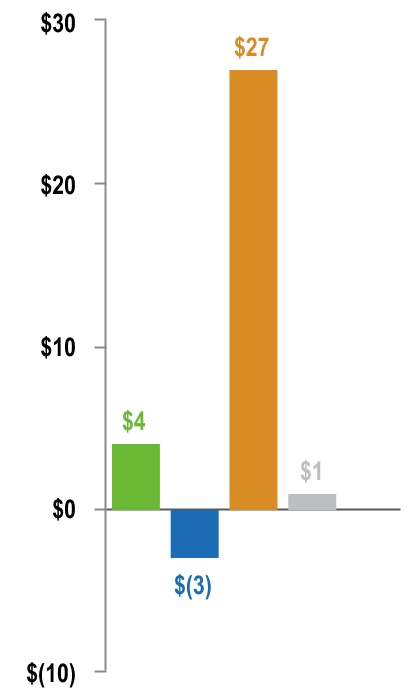
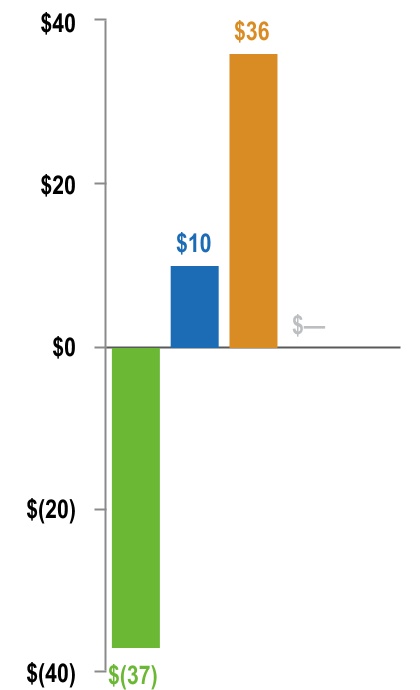
| Total Other Income, Net | $ | 48 | | | $ | 36 | | | $ | 69 | | | $ | 65 | | |
|
| | | | | | | | | | | | | | | | |
| | Three Months | | Nine Months | |
| | 2017 | | 2016 | | 2017 | | 2016 | |
Ameren:(a) | | | | | | | | |
| Miscellaneous income: | | | | | | | | |
| Allowance for equity funds used during construction | $ | 6 |
| | $ | 7 |
| | $ | 16 |
| | $ | 20 |
| |
| Interest income on industrial development revenue bonds | 7 |
| | 7 |
| | 20 |
| | 20 |
| |
| Interest income | — |
| | 3 |
| | 5 |
| | 11 |
| |
| Other | — |
| | 1 |
| | 1 |
| | 3 |
| |
| Total miscellaneous income | $ | 13 |
| | $ | 18 |
| | $ | 42 |
| | $ | 54 |
| |
| Miscellaneous expense: | | | | | | | | |
| Donations | $ | — |
| | $ | 1 |
| | $ | 7 |
| | $ | 8 |
| |
| Other | 2 |
| | 7 |
| | 9 |
| | 13 |
| |
| Total miscellaneous expense | $ | 2 |
| | $ | 8 |
| | $ | 16 |
| | $ | 21 |
| |
| Ameren Missouri: | | | | | | | | |
| Miscellaneous income: | | | | | | | | |
| Allowance for equity funds used during construction | $ | 6 |
| | $ | 6 |
| | $ | 15 |
| | $ | 16 |
| |
| Interest income on industrial development revenue bonds | 7 |
| | 7 |
| | 20 |
| | 20 |
| |
| Interest income | — |
| | 1 |
| | — |
| | 1 |
| |
| Other | — |
| | — |
| | 1 |
| | 1 |
| |
| Total miscellaneous income | $ | 13 |
| | $ | 14 |
| | $ | 36 |
| | $ | 38 |
| |
| Miscellaneous expense: | | | | | | | | |
| Donations | $ | — |
| | $ | — |
| | $ | 2 |
| | $ | 2 |
| |
| Other | 2 |
| | 2 |
| | 4 |
| | 4 |
| |
| Total miscellaneous expense | $ | 2 |
| | $ | 2 |
| | $ | 6 |
| | $ | 6 |
| |
| Ameren Illinois: | | | | | | | | |
| Miscellaneous income: | | | | | | | | |
| Allowance for equity funds used during construction | $ | — |
| | $ | 1 |
| | $ | 1 |
| | $ | 4 |
| |
| Interest income | 1 |
| | 2 |
| | 5 |
| | 9 |
| |
| Other | — |
| | 1 |
| | 1 |
| | 2 |
| |
| Total miscellaneous income | $ | 1 |
| | $ | 4 |
| | $ | 7 |
| | $ | 15 |
| |
| Miscellaneous expense: | | | | | | | | |
| Donations | $ | — |
| | $ | 1 |
| | $ | 5 |
| | $ | 6 |
| |
| Other | — |
| | 2 |
| | 3 |
| | 5 |
| |
| Total miscellaneous expense | $ | — |
| | $ | 3 |
| | $ | 8 |
| | $ | 11 |
| |
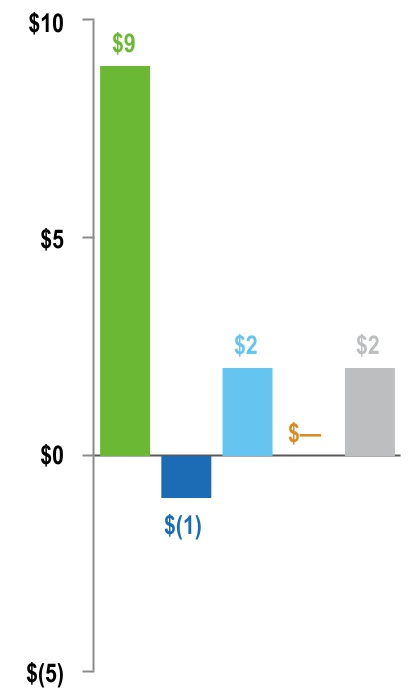
| | | | | | | | | | | | | | | | | | | | | | | | | | |
| Three Months | | | | Six Months | | | |
| 2020 | | 2019 | | 2020 | | 2019 | |
| Ameren Missouri: | | | | | | | | |
| | | | | | | | |
| Allowance for equity funds used during construction | $ | 6 | | | $ | 5 | | | $ | 8 | | | $ | 8 | | |
| Interest income on industrial development revenue bonds | 7 | | | 6 | | | 12 | | | 13 | | |
| | | | | | | | |
Non-service cost components of net periodic benefit income(a) | 14 | | | 4 | | | 19 | | | 9 | | |
| Miscellaneous income | 1 | | | 2 | | | 2 | | | 2 | | |
| Donations | (1) | | | — | | | (9) | | (b) | (2) | | |
| Miscellaneous expense | (2) | | | (1) | | | (3) | | | (2) | | |
| Total Other Income, Net | $ | 25 | | | $ | 16 | | | $ | 29 | | | $ | 28 | | |
| Ameren Illinois: | | | | | | | | |
| | | | | | | | |
| Allowance for equity funds used during construction | $ | 3 | | | $ | 3 | | | $ | 5 | | | $ | 5 | | |
| Interest income | 1 | | | 2 | | | 2 | | | 4 | | |
| | | | | | | | |
| Non-service cost components of net periodic benefit income | 11 | | | 12 | | | 24 | | | 24 | | |
| Miscellaneous income | 4 | | | 1 | | | 5 | | | 2 | | |
| Donations | (1) | | | (1) | | | (5) | | | (5) | | |
| Miscellaneous expense | (1) | | | (2) | | | (3) | | | (4) | | |
| Total Other Income, Net | $ | 17 | | | $ | 15 | | | $ | 28 | | | $ | 26 | | |
| |
(a) | Includes amounts for Ameren registrant and nonregistrant subsidiaries and intercompany eliminations. |
(a)For the three and six months ended June 30, 2020, the non-service cost components of net periodic benefit income were partially offset by amounts deferred of $(3) million and $3 million, respectively, due to a regulatory tracking mechanism for the difference between the level of such costs incurred by Ameren Missouri under GAAP and the level of such costs included in rates. The deferral was $8 million and $15 million for three and six months ended June 30, 2019, respectively. (b)Includes $8 million pursuant to Ameren Missouri’s March 2020 electric rate order. See Note 2 – Rate and Regulatory Matters for additional information.
NOTE 6 – DERIVATIVE FINANCIAL INSTRUMENTS
We use derivatives to manage the risk of changes in market prices for natural gas, power and uranium, as well as the risk of changes in rail transportation surcharges through fuel oil hedges. Such price fluctuations may cause the following:
•an unrealized appreciation or depreciation of our contracted commitments to purchase or sell when purchase or sale prices under the commitments are compared with current commodity prices;
•market values of natural gas and uranium inventories that differ from the cost of those commodities in inventory; and
•actual cash outlays for the purchase of these commodities that differ from anticipated cash outlays.outlays; and
•actual off-system sales revenues that differ from anticipated revenues
The derivatives that we use to hedge these risks are governed by our risk management policies for forward contracts, futures, options, and swaps. Our net positions are continually assessed within our structured hedging programs to determine whether new or offsetting transactions are required. The goal of the hedging program is generally to mitigate financial risks while ensuring that sufficient volumes are available to meet our requirements. Contracts we enter into as part of our risk management program may be settled financially, settled by physical delivery, or net settled with the counterparty.
The following table presents open gross commodity contract volumes by commodity type for derivative assets and liabilities as of September 30, 2017, and December 31, 2016. As of September 30, 2017, these contracts extended through October 2019, March 2023, May 2032, and March 2020 for fuel oils, natural gas, power, and uranium, respectively.
|
| | | | | | | | | | | | |
| | Quantity (in millions, except as indicated) |
| | 2017 | 2016 |
| Commodity | Ameren Missouri | Ameren Illinois | Ameren | Ameren Missouri | Ameren Illinois | Ameren |
Fuel oils (in gallons)(a) | 30 |
| (b) |
| 30 |
| 30 |
| (b) |
| 30 |
|
| Natural gas (in mmbtu) | 24 |
| 145 |
| 169 |
| 25 |
| 129 |
| 154 |
|
| Power (in megawatthours) | 2 |
| 9 |
| 11 |
| 1 |
| 9 |
| 10 |
|
| Uranium (pounds in thousands) | 370 |
| (b) |
| 370 |
| 345 |
| (b) |
| 345 |
|
| |
(a) | Consists of ultra-low-sulfur diesel products. |
All contracts considered to be derivative instruments are required to be recorded on the balance sheet at their fair values, unless the NPNS exception applies. See Note 7 – Fair Value Measurements for a discussion of our methods of assessing the fair value of derivative instruments. Many of our physical contracts, such as our purchased power contracts, qualify for the NPNS exception to derivative accounting rules. The revenue or expense on NPNS contracts is recognized at the contract price upon physical delivery. The following disclosures exclude NPNS contracts and other non-derivative commodity contracts that are accounted for under the accrual method of accounting.
If we determine that a contract meets the definition of a derivative and is not eligible for the NPNS exception, we review the contract to determine whether the resulting gains or losses qualify for regulatory deferral. Derivative contracts that qualify for regulatory deferral are recorded at fair value, with changes in fair value recorded as regulatory assets or liabilities in the period in which the change occurs. We believe derivative losses and gains deferred as regulatory assets and liabilities are probable of recovery, or refund, through future rates charged to customers. Regulatory assets and liabilities are amortized to operating income as related losses and gains are reflected in rates charged to customers. Therefore, gains and losses on these derivatives have no effect on operating income. As of SeptemberJune 30, 2017,2020, and December 31, 2016,2019, all contracts that met the definition of a derivative and were not eligible for the NPNS exception received regulatory deferral. Cash flows for all derivative financial instruments are classified in cash flows from operating activities.
The following table presents open gross commodity contract volumes by commodity type for derivative assets and liabilities as of June 30, 2020, and December 31, 2019. As of June 30, 2020, these contracts extended through October 2023, March 2024, May 2032 and March 2023 for fuel oils, natural gas, power and uranium, respectively.
| | | | | | | | | | | | | | | | | | | | |
| Quantity (in millions, except as indicated) | | | | | |
| June 30, 2020 | | | December 31, 2019 | | |
| Commodity | Ameren Missouri | Ameren Illinois | Ameren | Ameren Missouri | Ameren Illinois | Ameren |
| Fuel oils (in gallons) | 53 | | — | | 53 | | 58 | | — | | 58 | |
| Natural gas (in mmbtu) | 25 | | 137 | | 162 | | 20 | | 136 | | 156 | |
| Power (in megawatthours) | 6 | | 7 | | 13 | | 5 | | 7 | | 12 | |
| Uranium (pounds in thousands) | 365 | | — | | 365 | | 565 | | — | | 565 | |
The following table presents the carrying value and balance sheet location of all derivative commodity contracts, none of which were designated as hedging instruments, as of SeptemberJune 30, 2017,2020, and December 31, 2016:2019: |
| | | | | | | | | | | | | | |
| | Balance Sheet Location | | Ameren Missouri | | Ameren Illinois | | Ameren | |
| 2017 | | | | | | | |
| Fuel oils | Other current assets | | $ | 2 |
| | $ | — |
| | $ | 2 |
| |
| | Other assets | | 1 |
| | — |
| | 1 |
| |
| Natural gas | Other current assets | | — |
| | 1 |
| | 1 |
| |
| | Other assets | | — |
| | 1 |
| | 1 |
| |
| Power | Other current assets | | 10 |
| | — |
| | 10 |
| |
| | Other assets | | 1 |
| | — |
| | 1 |
| |
| | Total assets (a) | | $ | 14 |
| | $ | 2 |
| | $ | 16 |
| |
| Fuel oils | Other current liabilities | | $ | 2 |
| | $ | — |
| | $ | 2 |
| |
| Natural gas | Other current liabilities | | 3 |
| | 8 |
| | 11 |
| |
| | Other deferred credits and liabilities | | 4 |
| | 6 |
| | 10 |
| |
| Power | Other current liabilities | | 1 |
| | 13 |
| | 14 |
| |
| | Other deferred credits and liabilities | | — |
| | 179 |
| | 179 |
| |
| Uranium | Other deferred credits and liabilities | | — |
| (b) | — |
| | — |
| (b) |
| | Total liabilities (c) | | $ | 10 |
| | $ | 206 |
| | $ | 216 |
| |
| 2016 | | | | | | | |
| Fuel oils | Other current assets | | $ | 2 |
| | $ | — |
| | $ | 2 |
| |
| | Other assets | | 1 |
| | — |
| | 1 |
| |
| Natural gas | Other current assets | | 1 |
| | 11 |
| | 12 |
| |
| | Other assets | | 1 |
| | 2 |
| | 3 |
| |
| Power | Other current assets | | 9 |
| | — |
| | 9 |
| |
| | Total assets (a) | | $ | 14 |
| | $ | 13 |
| | $ | 27 |
| |
| Fuel oils | Other current liabilities | | $ | 5 |
| | $ | — |
| | $ | 5 |
| |
| Natural gas | Other current liabilities | | 1 |
| | 3 |
| | 4 |
| |
| | Other deferred credits and liabilities | | 5 |
| | 5 |
| | 10 |
| |
| Power | Other current liabilities | | 3 |
| | 12 |
| | 15 |
| |
| | Other deferred credits and liabilities | | — |
| | 173 |
| | 173 |
| |
| Uranium | Other deferred credits and liabilities | | 4 |
| | — |
| | 4 |
| |
| | Total liabilities (c) | | $ | 18 |
| | $ | 193 |
| | $ | 211 |
| |
| |
(a) | The cumulative amount of pretax net gains on all derivative instruments is deferred as a regulatory liability. |
| |
(b) | Beginning in 2017, as a result of rulebook amendments at the Chicago Mercantile Exchange, the fair value of uranium derivative liabilities are offset by certain settlement payments made to the exchange previously characterized as collateral and included within “Other assets” on Ameren’s and Ameren Missouri’s balance sheet. |
| |
(c) | The cumulative amount of pretax net losses on all derivative instruments is deferred as a regulatory asset. |
Derivative instruments are subject to various credit-related losses in the event of nonperformance by counterparties to the transaction. Exchange-traded contracts are supported by the financial and credit quality of the clearing members of the respective exchanges; these contracts have nominal credit risk. In all other transactions, we are exposed to credit risk. Our credit risk management program involves establishing credit limits and collateral requirements for counterparties, using master netting arrangements or similar agreements, and reporting daily exposure to senior management.
We believe that entering into master netting arrangements or similar agreements mitigates the level of financial loss that could result from default by allowing net settlement of derivative assets and liabilities. These master netting arrangements allow the counterparties to net settle sale and purchase transactions. Further, collateral requirements are calculated at the master netting arrangement or similar agreement level by counterparty. | | | | | | | | | | | | | | | | | | | | | | | | | | | | | | | | | | | | | | | | | | | | | | | | | | | | | | | | | | | | | |
| | | | | June 30, 2020 | | | | | | | | December 31, 2019 | | | | | | | | |
| Balance Sheet Location | | | | Ameren
Missouri | | | Ameren
Illinois | | | Ameren | | | | Ameren
Missouri | | | Ameren
Illinois | | | Ameren |
| | | | | | | | | | | | | | | | | | | | | |
| | | | | | | | | | | | | | | | | | | | | |
| | | | | | | | | | | | | | | | | | | | | |
| | | | | | | | | | | | | | | | | | | | | |
| | | | | | | | | | | | | | | | | | | | | |
| | | | | | | | | | | | | | | | | | | | | |
| | | | | | | | | | | | | | | | | | | | | |
| | | | | | | | | | | | | | | | | | | | | |
| | | | | | | | | | | | | | | | | | | | | |
| Fuel oils | Other current assets | | | $ | 2 | | | $ | — | | | $ | 2 | | | | $ | 4 | | | $ | — | | | $ | 4 | |
| Other assets | | | | 1 | | | | — | | | | 1 | | | | | 2 | | | | — | | | | 2 | |
| | | | | | | | | | | | | | | | | | | | | |
| | | | | | | | | | | | | | | | | | | | | |
| Natural gas | Other current assets | | | | — | | | | 3 | | | | 3 | | | | | — | | | | 3 | | | | 3 | |
| Other assets | | | | 1 | | | | 2 | | | | 3 | | | | | — | | | | 1 | | | | 1 | |
| | | | | | | | | | | | | | | | | | | | | |
| | | | | | | | | | | | | | | | | | | | | |
| Power | Other current assets | | | | 17 | | | | — | | | | 17 | | | | | 14 | | | | — | | | | 14 | |
| Other assets | | | | 2 | | | | — | | | | 2 | | | | | 2 | | | | — | | | | 2 | |
| | | | | | | | | | | | | | | | | | | | | |
| Uranium | Other assets | | | | 1 | | | | — | | | | 1 | | | | | — | | | | — | | | | — | |
| Total assets | | | $ | 24 | | | $ | 5 | | | $ | 29 | | | | $ | 22 | | | $ | 4 | | | $ | 26 | |
| | | | | | | | | | | | | | | | | | | | | |
| | | | | | | | | | | | | | | | | | | | | |
| | | | | | | | | | | | | | | | | | | | | |
| | | | | | | | | | | | | | | | | | | | | |
| | | | | | | | | | | | | | | | | | | | | |
| Fuel oils | Other current liabilities | | | $ | 15 | | | $ | — | | | $ | 15 | | | | $ | 4 | | | $ | — | | | $ | 4 | |
| Other deferred credits and liabilities | | | | 8 | | | | — | | | | 8 | | | | | 3 | | | | — | | | | 3 | |
| | | | | | | | | | | | | | | | | | | | | |
| | | | | | | | | | | | | | | | | | | | | |
| Natural gas | Other current liabilities | | | | 2 | | | | 10 | | | | 12 | | | | | 1 | | | | 12 | | | | 13 | |
| Other deferred credits and liabilities | | | | — | | | | 3 | | | | 3 | | | | | 1 | | | | 6 | | | | 7 | |
| | | | | | | | | | | | | | | | | | | | | |
| | | | | | | | | | | | | | | | | | | | | |
| Power | Other current liabilities | | | | 2 | | | | 18 | | | | 20 | | | | | 2 | | | | 17 | | | | 19 | |
| Other deferred credits and liabilities | | | | 2 | | | | 211 | | | | 213 | | | | | 1 | | | | 207 | | | | 208 | |
| | | | | | | | | | | | | | | | | | | | | |
| | | | | | | | | | | | | | | | | | | | | |
| Uranium | Other deferred credits and liabilities | | | | — | | | | — | | | | — | | | | | 1 | | | | — | | | | 1 | |
| Total liabilities | | | $ | 29 | | | $ | 242 | | | $ | 271 | | | | $ | 13 | | | $ | 242 | | | $ | 255 | |
| | | | | | | | | | | | | | | | | | | | | |
| | | | | | | | | | | | | | | | | | | | | |
| | | | | | | | | | | | | | | | | | | | | |
| | | | | | | | | | | | | | | | | | | | | |
| | | | | | | | | | | | | | | | | | | | | |
| | | | | | | | | | | | | | | | | | | | | |
| | | | | | | | | | | | | | | | | | | | | |
| | | | | | | | | | | | | | | | | | | | | |
| | | | | | | | | | | | | | | | | | | | | |
| | | | | | | | | | | | | | | | | | | | | |
| | | | | | | | | | | | | | | | | | | | | |
| | | | | | | | | | | | | | | | | | | | | |
| | | | | | | | | | | | | | | | | | | | | |
| | | | | | | | | | | | | | | | | | | | | |
| | | | | | | | | | | | | | | | | | | | | |
| | | | | | | | | | | | | | | | | | | | | |
| | | | | | | | | | | | | | | | | | | | | |
| | | | | | | | | | | | | | | | | | | | | |
| | | | | | | | | | | | | | | | | | | | | |
| | | | | | | | | | | | | | | | | | | | | |
| | | | | | | | | | | | | | | | | | | | | |
| | | | | | | | | | | | | | | | | | | | | |
| | | | | | | | | | | | | | | | | | | | | |
| | | | | | | | | | | | | | | | | | | | | |
| | | | | | | | | | | | | | | | | | | | | |
| | | | | | | | | | | | | | | | | | | | | |
| | | | | | | | | | | | | | | | | | | | | |
| | | | | | | | | | | | | | | | | | | | | |
| | | | | | | | | | | | | | | | | | | | | |
| | | | | | | | | | | | | | | | | | | | | |
| | | | | | | | | | | | | | | | | | | | | |
The Ameren Companies elect to present the fair value amounts of derivative assets and derivative liabilities subject to an enforceable master netting arrangement or similar agreement at the gross amounts on the balance sheet. However, if the gross amounts recognized on the balance sheet were netted with derivative instruments and cash collateral received or posted, the net amounts would not be materially different from the gross amounts at SeptemberJune 30, 2017,2020, and December 31, 2016.2019.
Concentrations of Credit Risk
In determining our concentrations of credit risk related to derivative instruments, we review our individual counterparties and categorize each counterparty into groupings according to the primary business in which each engages. We calculate maximum exposures based on the
gross fair value of financial instruments, including NPNS and other accrual contracts. These exposures are calculated on a gross basis, which include affiliate exposure not eliminated at the consolidated Ameren level. As of SeptemberJune 30, 2017,2020, if counterparty groups were to fail completely to perform on contracts, the Ameren Companies’ maximum exposure related to derivative assets would have been immaterial with or without consideration of the application of master netting arrangements or similar agreements and collateral held.
Derivative Instruments with Credit Risk-Related Contingent Features
Our commodity contractsCertain of our derivative instruments contain collateral provisions tied to the Ameren Companies’ credit ratings. If our credit ratings were downgraded below investment grade, or if a counterparty with reasonable grounds for uncertainty regarding our ability to satisfy an obligation requested adequate assurance of performance, additional collateral postings might be required. The following table presents, asadditional collateral required is the net liability position allowed under master netting arrangements or similar agreements, assuming (1) the credit risk-related contingent features underlying these arrangements were triggered and (2) those counterparties with rights to do so requested collateral. As of SeptemberJune 30, 2017,2020, the aggregate fair value of all derivative instruments with credit risk-related contingent features in a gross liability position, the cash collateral posted, and the aggregate amount of additional collateral that counterparties could require. The additional collateral required is the net liability position allowed under the master netting arrangements or similar agreements, assuming (1) the credit risk-related contingent features underlying these arrangementsrequire were triggered on September 30, 2017,each immaterial to Ameren, Ameren Missouri, and (2) those counterparties with rights to do so requested collateral.Ameren Illinois.
|
| | | | | | | | | | | |
| | Aggregate Fair Value of Derivative Liabilities(a) | | Cash Collateral Posted | | Potential Aggregate Amount of Additional Collateral Required(b) |
| 2017 | | | | | |
| Ameren Missouri | $ | 59 |
| | $ | 3 |
| | $ | 48 |
|
| Ameren Illinois | 48 |
| | — |
| | 41 |
|
| Ameren | $ | 107 |
| | $ | 3 |
| | $ | 89 |
|
| |
(a) | Before consideration of master netting arrangements or similar agreements and including NPNS and other accrual contract exposures. |
| |
(b) | As collateral requirements with certain counterparties are based on master netting arrangements or similar agreements, the aggregate amount of additional collateral required to be posted is determined after consideration of the effects of such arrangements. |
NOTE 7 – FAIR VALUE MEASUREMENTS
Fair value is defined as the price that would be received for an asset or paid to transfer a liability (an exit price) in the principal or most advantageous market for the asset or liability in an orderly transaction between market participants on the measurement date. We use various methods to determine fairFair value including market, income, and cost approaches. With these approaches, we adopt certain assumptions that market participants would usemeasurements are classified in pricingthree levels based on the asset or liability, including assumptions about market risk or the risks inherent in the inputs to the valuation. Inputs to valuation can be readily observable, market-corroborated, or unobservable. We use valuation techniques that maximize the use of observable inputs and minimize the use of unobservable inputs. Authoritative accounting guidance established a fair value hierarchy that prioritizes the inputs used to measure fair value.
All financial assets and liabilities carried at fair value are classified and disclosed in one of three hierarchy levels.as defined by GAAP. See Note 8 – Fair Value Measurements under Part II, Item 8, of the Form 10-K for information related to hierarchy levels. We perform an analysis each quarter to determine the appropriate hierarchy level of the assetslevels and liabilities subject to fair value measurements. Financial assets and liabilities are classified in their entirety according to the lowest level of input that is significant to the fair value measurement. All assets and liabilities whose fair value measurement is based on significant unobservable inputs are classified as Level 3.
The following table describes the valuation techniques and unobservable inputs utilized by the Ameren Companies for the fair value of financial assets and liabilities classified as Level 3 in the fair value hierarchy for the periods ended September 30, 2017 and December 31, 2016:techniques.
|
| | | | | | | | | | | |
| | | Fair Value | | | | Weighted Average |
| | | Assets | Liabilities |
| Valuation Technique(s) | Unobservable Input | Range |
Level 3 Derivative asset and liability – commodity contracts(a): | | | |
| 2017 | | | | | | | |
| | Fuel oils | $ | 1 |
| $ | (1 | ) | Option model | Volatilities(%)(b) | 24 – 32 | 26 |
| | | | | Discounted cash flow | Counterparty credit risk(%)(c)(d) | 0.12 – 0.22 | 0.17 |
| | | | | | Ameren Missouri credit risk(%)(c)(d) | 0.37 | (e) |
| | Natural gas | — |
| (2 | ) | Discounted cash flow | Nodal basis ($/mmbtu)(b) | (1.10) – (0.10) | (0.80) |
| | | | | | Counterparty credit risk (%)(c)(d) | 0.34 – 6 | 0.73 |
| | | | | | Ameren Illinois credit risk (%)(c)(d) | 0.37 | (e) |
| | Power(g) | $ | 11 |
| $ | (193 | ) | Discounted cash flow | Average forward peak and off-peak pricing – forwards/swaps ($/MWh)(h) | 25 – 41 | 28 |
| | | | | | Estimated auction price for FTRs ($/MW)(b) | (324) – 1,194 | 269 |
| | | | | | Nodal basis ($/MWh)(h) | (3) – 0 | (2) |
|
| | | | | | | | | | | |
| | | Fair Value | | | | Weighted Average |
| | | Assets | Liabilities |
| Valuation Technique(s) | Unobservable Input | Range |
| | | | | | Counterparty credit risk (%)(c)(d) | 0.28 | (e) |
| | | | | | Ameren Illinois credit risk (%)(c)(d) | 0.37 | (e) |
| | | | | Fundamental energy production model | Estimated future natural gas prices ($/mmbtu)(b) | 3 – 4 | 3 |
| | | | | | Escalation rate (%)(b)(i) | 3 | (e) |
| | | | | Contract price allocation | Estimated renewable energy credit costs ($/credit)(b) | 5 – 7 | 6 |
| 2016 | | | | | | | |
| | Fuel oils | $ | 1 |
| $ | — |
| Option model | Volatilities (%)(b) | 24 – 66 | 28 |
| | | | | Discounted cash flow | Counterparty credit risk (%)(c)(d) | 0.13 – 0.22 | 0.15 |
| | | | | | Ameren Missouri credit risk (%)(c)(d) | 0.38 | (e) |
| | | | | | Escalation rate (%)(b)(f) | (2) – 2 | 0 |
| | Natural gas | 1 |
| (1 | ) | Option model | Volatilities (%)(b) | 31 – 66 | 36 |
| | | | | | Nodal basis ($/mmbtu)(b) | (0.40) – (0.10) | (0.20) |
| | | | | Discounted cash flow | Nodal basis ($/mmbtu)(b) | (0.80) – 0 | (0.50) |
| | | | | | Counterparty credit risk (%)(c)(d) | 0.13 – 8 | 1 |
| | | | | | Ameren Illinois credit risk (%)(c)(d) | 0.38 | (e) |
| | Power(g) | 9 |
| (187 | ) | Discounted cash flow | Average forward peak and off-peak pricing – forwards/swaps ($/MWh)(h) | 26 – 44 | 29 |
| | | | | | Estimated auction price for FTRs ($/MW)(b) | (71) – 5,270 | 125 |
| | | | | | Nodal basis ($/MWh)(h) | (6) – 0 | (2) |
| | | | | | Ameren Illinois credit risk (%)(c)(d) | 0.38 | (e) |
| | | | | Fundamental energy production model | Estimated future natural gas prices ($/mmbtu)(b) | 3 – 4 | 3 |
| | | | | | Escalation rate (%)(b)(i) | 5 | (e) |
| | | | | Contract price allocation | Estimated renewable energy credit costs ($/credit)(b) | 5 – 7 | 6 |
| | Uranium | — |
| (4 | ) | Option model | Volatilities (%)(b) | 24 | (e) |
| | | | | Discounted cash flow | Average forward uranium pricing ($/pound)(b) | 22 – 24 | 22 |
| | | | | | Ameren Missouri credit risk (%)(c)(d) | 0.38 | (e) |
| |
(a) | The derivative asset and liability balances are presented net of counterparty credit considerations. |
| |
(b) | Generally, significant increases (decreases) in this input in isolation would result in a significantly higher (lower) fair value measurement. |
| |
(c) | Generally, significant increases (decreases) in this input in isolation would result in a significantly lower (higher) fair value measurement. |
| |
(d) | Counterparty credit risk is applied only to counterparties with derivative asset balances. Ameren Missouri and Ameren Illinois credit risk is applied only to counterparties with derivative liability balances. |
| |
(f) | Escalation rate applies to fuel oil prices 2019 and beyond. |
| |
(g) | Power valuations use visible third-party pricing evaluated by month for peak and off-peak demand through 2021 for September 30, 2017, and through 2020 for December 31, 2016. Valuations beyond 2021 for September 30, 2017, and 2020 for December 31, 2016 use fundamentally modeled pricing by month for peak and off-peak demand. |
| |
(h) | The balance at Ameren is comprised of Ameren Missouri and Ameren Illinois power contracts, which respond differently to unobservable input changes due to their opposing positions. |
| |
(i) | Escalation rate applies to power prices in 2031 and beyond. |
We consider nonperformance risk in our valuation of derivative instruments by analyzing our own credit standing and the credit standing of our counterparties, and by considering any counterparty credit enhancements (e.g., collateral). The guidance also requires that the fair value measurement of liabilities reflect the nonperformance risk of the reporting entity, as applicable. Therefore, we have factored the impact of our credit standing, as well as any potential credit enhancements, into the fair value measurement of both derivative assets and derivative liabilities. Included in our valuation, and based on current market conditions, is a valuation adjustment for counterparty default derived from market data such as the price of credit default swaps, bond yields, and credit ratings. No material gains or losses related to valuation adjustments for counterparty default risk were recorded at Ameren, Ameren Missouri, or Ameren Illinois in the three and ninesix months ended SeptemberJune 30, 20172020 or 2016.2019. At SeptemberJune 30, 2017,2020, and December 31, 2016,2019, the counterparty default risk valuation adjustment related to derivative contracts was immaterial for Ameren, Ameren Missouri, and Ameren Illinois.
The following table sets forth, by level within the fair value hierarchy, our assets and liabilities measured at fair value on a recurring basis as of SeptemberJune 30, 2017:2020, and December 31, 2019:
| | | | | | | | | | | | | | | | | | | | | | | | | | | | | | | | | | | | | | |
| | June 30, 2020 | | | | | | December 31, 2019 | | | | |
| | Level 1 | Level 2 | Level 3 | Total | | | Level 1 | Level 2 | Level 3 | Total | |
| Assets: | | | | | | | | | | | | |
| Ameren Missouri | | | | | | | | | | | | |
| Derivative assets – commodity contracts: | | | | | | | | | | | |
| Fuel oils | $ | — | | $ | — | | $ | 3 | | $ | 3 | | | | $ | — | | $ | — | | $ | 6 | | $ | 6 | | |
| Natural gas | — | | 1 | | — | | 1 | | | | — | | — | | — | | — | | |
| Power | 2 | | — | | 17 | | 19 | | | | — | | 2 | | 14 | | 16 | | |
| Uranium | — | | — | | 1 | | 1 | | | | — | | — | | — | | — | | |
| Total derivative assets – commodity contracts | $ | 2 | | $ | 1 | | $ | 21 | | $ | 24 | | | | $ | — | | $ | 2 | | $ | 20 | | $ | 22 | | |
| Nuclear decommissioning trust fund: | | | | | | | | | | | |
| | | | | | | | | | | | |
| Equity securities: | | | | | | | | | | | |
| U.S. large capitalization | $ | 556 | | $ | — | | $ | — | | $ | 556 | | | | $ | 569 | | $ | — | | $ | — | | $ | 569 | | |
| Debt securities: | | | | | | | | | | | |
| U.S. Treasury and agency securities | — | | 106 | | — | | 106 | | | | — | | 107 | | — | | 107 | | |
| Corporate bonds | — | | 116 | | — | | 116 | | | | — | | 93 | | — | | 93 | | |
| | | | | | | | | | | | |
| | | | | | | | | | | | |
| Other | — | | 72 | | — | | 72 | | | | — | | 73 | | — | | 73 | | |
| Total nuclear decommissioning trust fund | $ | 556 | | $ | 294 | | $ | — | | $ | 850 | | (a) | | $ | 569 | | $ | 273 | | $ | — | | $ | 842 | | (a) |
| Total Ameren Missouri | $ | 558 | | $ | 295 | | $ | 21 | | $ | 874 | | | | $ | 569 | | $ | 275 | | $ | 20 | | $ | 864 | | |
| Ameren Illinois | | | | | | | | | | | | |
| Derivative assets – commodity contracts: | | | | | | | | | | | |
| Natural gas | $ | — | | $ | 2 | | $ | 3 | | $ | 5 | | | | $ | — | | $ | 1 | | $ | 3 | | $ | 4 | | |
| | | | | | | | | | | | |
| | | | | | | | | | | | |
| Ameren | | | | | | | | | | | | |
| Derivative assets – commodity contracts(b) | $ | 2 | | $ | 3 | | $ | 24 | | $ | 29 | | | | $ | — | | $ | 3 | | $ | 23 | | $ | 26 | | |
| Nuclear decommissioning trust fund(c) | 556 | | 294 | | — | | 850 | | (a) | | 569 | | 273 | | — | | 842 | | (a) |
| Total Ameren | $ | 558 | | $ | 297 | | $ | 24 | | $ | 879 | | | | $ | 569 | | $ | 276 | | $ | 23 | | $ | 868 | | |
| Liabilities: | | | | | | | | | | | | |
| Ameren Missouri | | | | | | | | | | | | |
| Derivative liabilities – commodity contracts: | | | | | | | | | | | |
| Fuel oils | $ | 14 | | $ | — | | $ | 9 | | $ | 23 | | | | $ | 1 | | $ | — | | $ | 6 | | $ | 7 | | |
| Natural gas | — | | 2 | | — | | 2 | | | | — | | 2 | | — | | 2 | | |
| Power | 3 | | — | | 1 | | 4 | | | | — | | 2 | | 1 | | 3 | | |
| Uranium | — | | — | | — | | — | | | | — | | — | | 1 | | 1 | | |
| Total Ameren Missouri | $ | 17 | | $ | 2 | | $ | 10 | | $ | 29 | | | | $ | 1 | | $ | 4 | | $ | 8 | | $ | 13 | | |
| Ameren Illinois | | | | | | | | | | | | |
| Derivative liabilities – commodity contracts: | | | | | | | | | | | |
| Natural gas | $ | 1 | | $ | 9 | | $ | 3 | | $ | 13 | | | | $ | 3 | | $ | 12 | | $ | 3 | | $ | 18 | | |
| Power | — | | — | | 229 | | 229 | | | | — | | — | | 224 | | 224 | | |
| Total Ameren Illinois | $ | 1 | | $ | 9 | | $ | 232 | | $ | 242 | | | | $ | 3 | | $ | 12 | | $ | 227 | | $ | 242 | | |
| Ameren | | | | | | | | | | | | |
| Derivative liabilities – commodity contracts(b) | $ | 18 | | $ | 11 | | $ | 242 | | $ | 271 | | | | $ | 4 | | $ | 16 | | $ | 235 | | $ | 255 | | |
|
| | | | | | | | | | | | | | | | | | |
| | | | Quoted Prices in Active Markets for Identical Assets or Liabilities (Level 1) | | Significant Other Observable Inputs (Level 2) | | Significant Other Unobservable Inputs (Level 3) | | Total | |
| Assets: | | | | | | | | | | |
| Ameren | Derivative assets – commodity contracts(a): | | | | | | | | | |
| | Fuel oils | | $ | 2 |
| | $ | — |
| | $ | 1 |
| | $ | 3 |
| |
| | Natural gas | | 1 |
| | 1 |
| | — |
| | 2 |
| |
| | Power | | — |
| | — |
| | 11 |
| | 11 |
| |
| | Total derivative assets – commodity contracts | | $ | 3 |
| | $ | 1 |
| | $ | 12 |
| | $ | 16 |
| |
| | Nuclear decommissioning trust fund: | | | | | | | | | |
| | Cash and cash equivalents | | $ | 2 |
| | $ | — |
| | $ | — |
| | $ | 2 |
| |
| | Equity securities: | | | | | | | | | |
| | U.S. large capitalization | | 445 |
| | — |
| | — |
| | 445 |
| |
| | Debt securities: | | | | | | | | | |
| | U.S. treasury and agency securities | | — |
| | 119 |
| | — |
| | 119 |
| |
| | Corporate bonds | | — |
| | 82 |
| | — |
| | 82 |
| |
| | Other | | — |
| | 24 |
| | — |
| | 24 |
| |
| | Total nuclear decommissioning trust fund | | $ | 447 |
| | $ | 225 |
| | $ | — |
| | $ | 672 |
| |
| | Total Ameren | | $ | 450 |
| | $ | 226 |
| | $ | 12 |
| | $ | 688 |
| |
| Ameren Missouri | Derivative assets – commodity contracts(a): | | | | | | | | | |
| | Fuel oils | | $ | 2 |
| | $ | — |
| | $ | 1 |
| | $ | 3 |
| |
| | Power | | — |
| | — |
| | 11 |
| | 11 |
| |
| | Total derivative assets – commodity contracts | | $ | 2 |
| | $ | — |
| | $ | 12 |
| | $ | 14 |
| |
| | Nuclear decommissioning trust fund: | | | | | | | | | |
| | Cash and cash equivalents | | $ | 2 |
| | $ | — |
| | $ | — |
| | $ | 2 |
| |
| | Equity securities: | | | | | | | | | |
| | U.S. large capitalization | | 445 |
| | — |
| | — |
| | 445 |
| |
| | Debt securities: | | | | | | | | | |
| | U.S. treasury and agency securities | | — |
| | 119 |
| | — |
| | 119 |
| |
| | Corporate bonds | | — |
| | 82 |
| | — |
| | 82 |
| |
| | Other | | — |
| | 24 |
| | — |
| | 24 |
| |
| | Total nuclear decommissioning trust fund | | $ | 447 |
| | $ | 225 |
| | $ | — |
| | $ | 672 |
| |
| | Total Ameren Missouri | | $ | 449 |
| | $ | 225 |
| | $ | 12 |
| | $ | 686 |
| |
| Ameren Illinois | Derivative assets – commodity contracts(a): | | | | | | | | | |
| | Natural gas | | $ | 1 |
| | $ | 1 |
| | $ | — |
| | $ | 2 |
| |
| Liabilities: | | | | | | | | | | |
| Ameren | Derivative liabilities – commodity contracts(a): | | | | | | | | | |
| | Fuel oils | | $ | 1 |
| | $ | — |
| | $ | 1 |
| | $ | 2 |
| |
| | Natural gas | | — |
| | 19 |
| | 2 |
| | 21 |
| |
| | Power | | — |
| | — |
| | 193 |
| | 193 |
| |
| | Total Ameren | | $ | 1 |
| | $ | 19 |
| | $ | 196 |
| | $ | 216 |
| |
| Ameren Missouri | Derivative liabilities – commodity contracts(a): | | | | | | | | | |
| | Fuel oils | | $ | 1 |
| | $ | — |
| | $ | 1 |
| | $ | 2 |
| |
| | Natural gas | | — |
| | 7 |
| | — |
| | 7 |
| |
| | Power | | — |
| | — |
| | 1 |
| | 1 |
| |
| | Total Ameren Missouri | | $ | 1 |
| | $ | 7 |
| | $ | 2 |
| | $ | 10 |
| |
| Ameren Illinois | Derivative liabilities – commodity contracts(a): | | | | | | | | | |
| | Natural gas | | $ | — |
| | $ | 12 |
| | $ | 2 |
| | $ | 14 |
| |
| | Power | | — |
| | — |
| | 192 |
| | 192 |
| |
| | Total Ameren Illinois | | $ | — |
| | $ | 12 |
| | $ | 194 |
| | $ | 206 |
| |
| |
(a) | The derivative asset and liability balances are presented net of counterparty credit considerations. |
(a)Balance excludes $4 million and $5 million of cash and cash equivalents, receivables, payables, and accrued income, net, for June 30, 2020, and December 31, 2019, respectively.
The following(b)See the Ameren Missouri and Ameren Illinois sections of the table sets forth, by level withinfor a breakout of the fair value hierarchy, ourof Ameren’s derivative assets and liabilities by type of commodity.
(c)See the Ameren Missouri section of the table for a breakout of the fair value of Ameren's nuclear decommissioning trust fund by investment type.
Level 3 fuel oils, natural gas and uranium derivative contract assets and liabilities measured at fair value on a recurring basis aswere immaterial for all periods presented. The following table presents the fair value reconciliation of December 31, 2016:
|
| | | | | | | | | | | | | | | | | | |
| | | | Quoted Prices in Active Markets for Identical Assets or Liabilities (Level 1) | | Significant Other Observable Inputs (Level 2) | | Significant Other Unobservable Inputs (Level 3) | | Total | |
| Assets: | | | | | | �� | | | | |
| Ameren | Derivative assets – commodity contracts(a): | | | | | | | | | |
| | Fuel oils | | $ | 2 |
| | $ | — |
| | $ | 1 |
| | $ | 3 |
| |
| | Natural gas | | 2 |
| | 12 |
| | 1 |
| | 15 |
| |
| | Power | | — |
| | — |
| | 9 |
| | 9 |
| |
| | Total derivative assets – commodity contracts | | $ | 4 |
| | $ | 12 |
| | $ | 11 |
| | $ | 27 |
| |
| | Nuclear decommissioning trust fund: | | | | | | | | | |
| | Cash and cash equivalents | | $ | 1 |
| | $ | — |
| | $ | — |
| | $ | 1 |
| |
| | Equity securities: | | | | | | | | | |
| | U.S. large capitalization | | 408 |
| | — |
| | — |
| | 408 |
| |
| | Debt securities: | | | | | | | | | |
| | U.S. treasury and agency securities | | — |
| | 112 |
| | — |
| | 112 |
| |
| | Corporate bonds | | — |
| | 67 |
| | — |
| | 67 |
| |
| | Other | | — |
| | 17 |
| | — |
| | 17 |
| |
| | Total nuclear decommissioning trust fund | | $ | 409 |
| | $ | 196 |
| | $ | — |
| | $ | 605 |
| (b) |
| | Total Ameren | | $ | 413 |
| | $ | 208 |
| | $ | 11 |
| | $ | 632 |
| |
| Ameren Missouri | Derivative assets – commodity contracts(a): | | | | | | | | | |
| | Fuel oils | | $ | 2 |
| | $ | — |
| | $ | 1 |
| | $ | 3 |
| |
| | Natural gas | | — |
| | 1 |
| | 1 |
| | 2 |
| |
| | Power | | — |
| | — |
| | 9 |
| | 9 |
| |
| | Total derivative assets – commodity contracts | | $ | 2 |
| | $ | 1 |
| | $ | 11 |
| | $ | 14 |
| |
| | Nuclear decommissioning trust fund: | | | | | | | | | |
| | Cash and cash equivalents | | $ | 1 |
| | $ | — |
| | $ | — |
| | $ | 1 |
| |
| | Equity securities: | | | | | | | | | |
| | U.S. large capitalization | | 408 |
| | — |
| | — |
| | 408 |
| |
| | Debt securities: | | | | | | | | | |
| | U.S. treasury and agency securities | | — |
| | 112 |
| | — |
| | 112 |
| |
| | Corporate bonds | | — |
| | 67 |
| | — |
| | 67 |
| |
| | Other | | — |
| | 17 |
| | — |
| | 17 |
| |
| | Total nuclear decommissioning trust fund | | $ | 409 |
| | $ | 196 |
| | $ | — |
| | $ | 605 |
| (b) |
| | Total Ameren Missouri | | $ | 411 |
| | $ | 197 |
| | $ | 11 |
| | $ | 619 |
| |
| Ameren Illinois | Derivative assets – commodity contracts(a): | | | | | | | | | |
| | Natural gas | | $ | 2 |
| | $ | 11 |
| | $ | — |
| | $ | 13 |
| |
| Liabilities: | | | | | | | | | | |
| Ameren | Derivative liabilities – commodity contracts(a): | | | | | | | | | |
| | Fuel oils | | $ | 5 |
| | $ | — |
| | $ | — |
| | $ | 5 |
| |
| | Natural gas | | — |
| | 13 |
| | 1 |
| | 14 |
| |
| | Power | | — |
| | 1 |
| | 187 |
| | 188 |
| |
| | Uranium | | — |
| | — |
| | 4 |
| | 4 |
| |
| | Total Ameren | | $ | 5 |
| | $ | 14 |
| | $ | 192 |
| | $ | 211 |
| |
| Ameren Missouri | Derivative liabilities – commodity contracts(a): | | | | | | | | | |
| | Fuel oils | | $ | 5 |
| | $ | — |
| | $ | — |
| | $ | 5 |
| |
| | Natural gas | | — |
| | 6 |
| | — |
| | 6 |
| |
| | Power | | — |
| | 1 |
| | 2 |
| | 3 |
| |
| | Uranium | | — |
| | — |
| | 4 |
| | 4 |
| |
| | Total Ameren Missouri | | $ | 5 |
| | $ | 7 |
| | $ | 6 |
| | $ | 18 |
| |
| Ameren Illinois | Derivative liabilities – commodity contracts(a): | | | | | | | | | |
| | Natural gas | | $ | — |
| | $ | 7 |
| | $ | 1 |
| | $ | 8 |
| |
| | Power | | — |
| | — |
| | 185 |
| | 185 |
| |
| | Total Ameren Illinois | | $ | — |
| | $ | 7 |
| | $ | 186 |
| | $ | 193 |
| |
| |
(a) | The derivative asset and liability balances are presented net of counterparty credit considerations. |
| |
(b) | Balance excludes $2 million of receivables, payables, and accrued income, net. |
All costs related to financialLevel 3 power derivative contract assets and liabilities classified asmeasured at fair value on a recurring basis for the three and six months ended June 30, 2020 and 2019:
| | | | | | | | | | | | | | | | | | | | | | | | | | | | |
| 2020 | | | | | | | 2019 | | |
| Ameren
Missouri | Ameren
Illinois | | | Ameren | | | Ameren Missouri | Ameren Illinois | Ameren |
| For the three months ended June 30: | | | | | | | | | | |
| Beginning balance at April 1 | $ | 17 | | $ | (241) | | | | $ | (224) | | | | $ | — | | $ | (184) | | $ | (184) | |
| Realized and unrealized gains/(losses) included in regulatory assets/liabilities | 9 | | 7 | | | | 16 | | | | 16 | | (11) | | 5 | |
| | | | | | | | | | |
| | | | | | | | | | |
| Settlements | (10) | | 5 | | | | (5) | | | | (1) | | 4 | | 3 | |
| | | | | | | | | | |
| | | | | | | | | | |
| Ending balance at June 30 | $ | 16 | | $ | (229) | | | | $ | (213) | | | | $ | 15 | | $ | (191) | | $ | (176) | |
| Change in unrealized gains/(losses) related to assets/liabilities held at June 30 | $ | 8 | | $ | 7 | | | | $ | 15 | | | | $ | 16 | | $ | (11) | | $ | 5 | |
| For the six months ended June 30: | | | | | | | | | | |
| Beginning balance at January 1 | $ | 13 | | $ | (224) | | | | $ | (211) | | | | $ | — | | $ | (183) | | $ | (183) | |
| Realized and unrealized gains/(losses) included in regulatory assets/liabilities | 20 | | (14) | | | | 6 | | | | 16 | | (15) | | 1 | |
| | | | | | | | | | |
| | | | | | | | | | |
| Settlements | (17) | | 9 | | | | (8) | | | | (1) | | 7 | | 6 | |
| | | | | | | | | | |
| | | | | | | | | | |
| Ending balance at June 30 | 16 | | (229) | | | | (213) | | | | 15 | | (191) | | (176) | |
| Change in unrealized gains/(losses) related to assets/liabilities held at June 30 | $ | 12 | | $ | (13) | | | | $ | (1) | | | | $ | 16 | | $ | (15) | | $ | 1 | |
All gains or losses related to our Level 3 in the fair value hierarchyderivative commodity contracts are expected to be recoverablerecovered or returned through customer rates; therefore, there is no impact to either net income or other comprehensive income resulting from changes in the fair value of these instruments. For
The following table describes the threevaluation techniques and nine months ended September 30, 2017 and 2016, the balances and changes insignificant unobservable inputs utilized for the fair value of our Level 3 power derivative contract assets and liabilities as of June 30, 2020, and December 31, 2019:
| | | | | | | | | | | | | | | | | | | | | | | | | | | | | | |
| | | Fair Value | | | | | | Weighted Average(b) | |
| Commodity | | Assets | | Liabilities | Valuation Technique(s) | Unobservable Input(a) | Range | | |
| | | | | | | | | | |
| | | | | | | | | | |
| | | | | | | | | | |
| | | | | | | | | | |
| | | | | | | | | | |
| | | | | | | | | | |
| | | | | | | | | | |
| | | | | | | | | | |
| | | | | | | | | | |
| 2020 | Power(c) | $ | 17 | $ | (230) | Discounted cash flow | Average forward peak and off-peak pricing – forwards/swaps ($/MWh) | 22 – 35 | 26 | |
| | | | | | | | | | |
| | | | | | | Nodal basis ($/MWh) | (6) – 0 | (2) | |
| | | | | | | | | | |
| | | | | | | | | | |
| | | | | | | Trend rate (%) | 3 – 4 | 3 | |
| | | | | | | | | | |
| | | | | | | | | | |
| | | | | | | | | | |
| | | | | | | | | | |
| | | | | | | | | | |
| | | | | | | | | | |
| | | | | | | | | | |
| | | | | | | | | | |
| | | | | | | | | | |
| | | | | | | | | | |
| | | | | | | | | | |
| | | | | | | | | | |
| | | | | | | | | | |
| | | | | | | | | | |
| | | | | | | | | | |
| | | | | | | | | | |
| | | | | | | | | | |
| | | | | | | | | | |
| | | | | | | | | | |
| | | | | | | | | | |
| | | | | | | | | | |
| | | | | | | | | | |
| | | | | | | | | | |
| | | | | | | | | | |
| | | | | | | | | | |
| | | | | | | | | | |
| | | | | | | | | | |
| | | | | | | | | | |
| | | | | | | | | | |
| | | | | | | | | | |
| | | | | | | | | | |
| | | | | | | | | | |
| | | | | | | | | | |
| | | | | | | | | | |
| | | | | | | | | | |
| | | | | | | | | | |
| | | | | | | | | | |
| | | | | | | | | | |
| | | | | | | | | | |
| | | | | | | | | | |
| 2019 | Power(d) | $ | 14 | $ | (225) | Discounted cash flow | Average forward peak and off-peak pricing – forwards/swaps ($/MWh) | 22 – 34 | 25 | |
| | | | | | | | | | |
| | | | | | | Nodal basis ($/MWh) | (6) – 0 | (2) | |
| | | | | | | | | | |
| | | | | | | | | | |
| | | | | | | Trend rate (%) | (1) – 0 | 0 | |
| | | | | | | | | | |
| | | | | | | | | | |
| | | | | | | | | | |
| | | | | | | | | | |
| | | | | | | | | | |
(a)Generally, significant increases (decreases) in these inputs in isolation would result in a significantly higher (lower) fair value measurement.
(b)Unobservable inputs were weighted by relative fair value.
(c)Valuations through 2029 use visible forward prices adjusted for nodal-to-hub basis differentials. Valuations beyond 2029 use a trend rate factor and are similarly adjusted for nodal-to-hub basis differentials.
(d)Valuations through 2028 use visible forward prices adjusted for nodal-to-hub basis differentials. Valuations beyond 2028 use a trend rate factor and are similarly adjusted for nodal-to-hub basis differentials.
The following table sets forth the carrying amount and, by level within the fair value hierarchy, the fair value of financial assets and liabilities associated with fuel oils, natural gas,disclosed, but not recorded, at fair value as of June 30, 2020, and uraniumDecember 31, 2019:
| | | | | | | | | | | | | | | | | | | | | | | | | | | | | |
| Carrying
Amount | | Fair Value | | | | | | |
| | | Level 1 | | Level 2 | | Level 3 | | Total |
| June 30, 2020 | | | | | | | | |
| Ameren: | | | | | | | | | |
| Cash, cash equivalents, and restricted cash | $ | 163 | | | $ | 163 | | | $ | — | | | $ | — | | | $ | 163 | |
Investments in industrial development revenue bonds(a) | 263 | | | — | | | 263 | | | — | | | 263 | |
| Short-term debt | 120 | | | — | | | 120 | | | — | | | 120 | |
Long-term debt (including current portion)(a) | 10,528 | | (b) | — | | | 11,747 | | | 510 | | (c) | 12,257 | |
| Ameren Missouri: | | | | | | | | | |
| Cash, cash equivalents, and restricted cash | $ | 11 | | | $ | 11 | | | $ | — | | | $ | — | | | $ | 11 | |
| | | | | | | | | |
Investments in industrial development revenue bonds(a) | 263 | | | — | | | 263 | | | — | | | 263 | |
| Short-term debt | 79 | | | — | | | 79 | | | — | | | 79 | |
Long-term debt (including current portion)(a) | 4,567 | | (b) | — | | | 5,258 | | | — | | | 5,258 | |
| Ameren Illinois: | | | | | | | | | |
| Cash, cash equivalents, and restricted cash | $ | 142 | | | $ | 142 | | | $ | — | | | $ | — | | | $ | 142 | |
| Short-term debt | 41 | | | — | | | 41 | | | — | | | 41 | |
| | | | | | | | | |
| Long-term debt (including current portion) | 3,576 | | (b) | — | | | 4,369 | | | — | | | 4,369 | |
| December 31, 2019 | | | | | | | | |
| Ameren: | | | | | | | | | |
| Cash, cash equivalents, and restricted cash | $ | 176 | | | $ | 176 | | | $ | — | | | $ | — | | | $ | 176 | |
Investments in industrial development revenue bonds(a) | 263 | | | — | | | 263 | | | — | | | 263 | |
| Short-term debt | 440 | | | — | | | 440 | | | — | | | 440 | |
Long-term debt (including current portion)(a) | 9,357 | | (b) | — | | | 9,957 | | | 484 | | (c) | 10,441 | |
| Ameren Missouri: | | | | | | | | | |
| Cash, cash equivalents, and restricted cash | $ | 39 | | | $ | 39 | | | $ | — | | | $ | — | | | $ | 39 | |
Investments in industrial development revenue bonds(a) | 263 | | | — | | | 263 | | | — | | | 263 | |
| Short-term debt | 234 | | | — | | | 234 | | | — | | | 234 | |
Long-term debt (including current portion)(a) | 4,190 | | (b) | — | | | 4,772 | | | — | | | 4,772 | |
| Ameren Illinois: | | | | | | | | | |
| Cash, cash equivalents, and restricted cash | $ | 125 | | | $ | 125 | | | $ | — | | | $ | — | | | $ | 125 | |
| Short-term debt | 53 | | | — | | | 53 | | | — | | | 53 | |
| Long-term debt (including current portion) | 3,575 | | (b) | — | | | 4,019 | | | — | | | 4,019 | |
(a)Ameren and Ameren Missouri have investments in industrial development revenue bonds, classified as held-to-maturity and recorded in “Other Assets,” that are equal to the finance obligations for the Peno Creek and Audrain CT energy centers. As of June 30, 2020, and December 31, 2019, the carrying amount of both the investments in industrial development revenue bonds and the finance obligations approximated fair value.
(b)Included unamortized debt issuance costs, which were immaterial.
The following table summarizes the changes inexcluded from the fair value measurement, of power financial assets$78 million, $32 million, and liabilities classified$33 million for Ameren, Ameren Missouri, and Ameren Illinois, respectively, as Level 3 inof June 30, 2020. Included unamortized debt issuance costs, which were excluded from the fair value hierarchy:measurement, of $72 million, $30 million, and $34 million for Ameren, Ameren Missouri, and Ameren Illinois, respectively, as of December 31, 2019.
|
| | | | | | | | | |
| | | Net derivative commodity contracts |
| | | Ameren Missouri | | Ameren Illinois | | Ameren |
| For the three months ended September 30, 2017 | | | | | | |
| Beginning balance at July 1, 2017 | $ | 14 |
| $ | (192 | ) | $ | (178 | ) |
| Realized and unrealized gains (losses) included in regulatory assets/liabilities | | (2 | ) | | (3 | ) | | (5 | ) |
| Sales | | 1 |
| | — |
| | 1 |
|
| Settlements | | (3 | ) | | 3 |
| | — |
|
| Ending balance at September 30, 2017 | $ | 10 |
| $ | (192 | ) | $ | (182 | ) |
| Change in unrealized gains (losses) related to assets/liabilities held at September 30, 2017 | $ | — |
| $ | (2 | ) | $ | (2 | ) |
| For the three months ended September 30, 2016 | | | | | | |
| Beginning balance at July 1, 2016 | $ | 14 |
| $ | (169 | ) | $ | (155 | ) |
| Realized and unrealized gains (losses) included in regulatory assets/liabilities | | — |
| | (6 | ) | | (6 | ) |
| Settlements | | (5 | ) | | 3 |
| | (2 | ) |
| Ending balance at September 30, 2016 | $ | 9 |
| $ | (172 | ) | $ | (163 | ) |
| Change in unrealized gains (losses) related to assets/liabilities held at September 30, 2016 | $ | — |
| $ | (2 | ) | $ | (2 | ) |
| For the nine months ended September 30, 2017 | | | | | | |
| Beginning balance at January 1, 2017 | $ | 7 |
| $ | (185 | ) | $ | (178 | ) |
| Realized and unrealized gains (losses) included in regulatory assets/liabilities | | (3 | ) | | (14 | ) | | (17 | ) |
| Purchases | | 15 |
| | — |
| | 15 |
|
| Sales | | 1 |
| | — |
| | 1 |
|
| Settlements | | (10 | ) | | 7 |
| | (3 | ) |
| Ending balance at September 30, 2017 | $ | 10 |
| $ | (192 | ) | $ | (182 | ) |
| Change in unrealized gains (losses) related to assets/liabilities held at September 30, 2017 | $ | — |
| $ | (15 | ) | $ | (15 | ) |
| For the nine months ended September 30, 2016 | | | | | | |
| Beginning balance at January 1, 2016 | $ | 16 |
| $ | (170 | ) | $ | (154 | ) |
| Realized and unrealized gains (losses) included in regulatory assets/liabilities | | (4 | ) | | (13 | ) | | (17 | ) |
| Purchases | | 13 |
| | — |
| | 13 |
|
| Settlements | | (16 | ) | | 11 |
| | (5 | ) |
| Ending balance at September 30, 2016 | $ | 9 |
| $ | (172 | ) | $ | (163 | ) |
| Change in unrealized gains (losses) related to assets/liabilities held at September 30, 2016 | $ | — |
| $ | (7 | ) | $ | (7 | ) |
Transfers into or out of(c)The Level 3 represent either (1) existing assets and liabilities that were previously categorized as a higher level, but were recategorized to Level 3 because the inputs to the model became unobservable during the period or (2) existing assets and liabilities that were previously classified as Level 3, but were recategorized to a higher level because the lowest significant input became observable during the period. For the three and nine months ended September 30, 2017 and 2016, there were no material transfers between Level 1 and Level 2, Level 1 and Level 3, or Level 2 and Level 3 related to derivative commodity contracts.
The Ameren Companies’ carrying amounts of cash and cash equivalents, accounts receivable, unbilled revenue, accounts payable, and other current financial instruments approximate fair value becauseamount consists of the short-term nature of these instruments. They are considered to be Level 1 in the fair value hierarchy. The Ameren Companies' short-term borrowings also approximate fair value because of their short-term nature. Short-term borrowings are considered to be Level 2 in the fair value hierarchy as they are valued based on market rates for similar market transactions. The estimated fair value of long-term debt and preferred stock is based on the quoted market prices for same or similar issuances for companies with similar credit profiles or on the current rates offered to the Ameren Companies for similar financial instruments, which fair value measurement is considered to be Level 2 in the fair value hierarchy.ATXI’s senior unsecured notes.
The following table presents the carrying amounts and estimated fair values of our long-term debt, capital lease obligations and preferred stock at September 30, 2017, and December 31, 2016:
|
| | | | | | | | | | | | | | | |
| | September 30, 2017 | | December 31, 2016 |
| | Carrying Amount | | Fair Value | | Carrying Amount | | Fair Value |
| Ameren: | | | | | | | |
| Long-term debt and capital lease obligations (including current portion) | $ | 7,699 |
| | $ | 8,234 |
| | $ | 7,276 |
| | $ | 7,772 |
|
Preferred stock(a) | 142 |
| | 131 |
| | 142 |
| | 131 |
|
| Ameren Missouri: | | | | | | | |
| Long-term debt and capital lease obligations (including current portion) | $ | 3,967 |
| | $ | 4,312 |
| | $ | 3,994 |
| | $ | 4,304 |
|
| Preferred stock | 80 |
| | 79 |
| | 80 |
| | 79 |
|
| Ameren Illinois: | | | | | | | |
| Long-term debt (including current portion) | $ | 2,590 |
| | $ | 2,759 |
| | $ | 2,588 |
| | $ | 2,765 |
|
| Preferred stock | 62 |
| | 52 |
| | 62 |
| | 52 |
|
| |
(a) | Preferred stock is recorded in “Noncontrolling Interests” on the consolidated balance sheet. |
NOTE 8 – RELATED PARTYRELATED-PARTY TRANSACTIONS
In the normal course of business, Ameren Missouri and Ameren Illinois have engaged in, and may in the Ameren Companiesfuture engage in, affiliate transactions. These transactions primarily consist of natural gas and power purchases and sales, services received or rendered, and borrowings and lendings. Transactions between affiliatesAmeren’s subsidiaries are reported as intercompanyaffiliate transactions on their individual financial statements, but those transactions are eliminated in consolidation for Ameren’s consolidated financial statements. For a discussion of our material related partyrelated-party agreements and money pool arrangements, see Note 1413 – Related PartyRelated-party Transactions and Note 4 – Short-term Debt and Liquidity under Part II, Item 8, of the Form 10-K and the money pool arrangements discussed in Note 3 – Short-term Debt and Liquidity of this report.10-K.
Electric PowerCapacity Supply Agreement
In April 2017,2020, Ameren Illinois conducted a procurement event, administered by the IPA, to purchase energy products.acquire capacity. Ameren Missouri was among the winning suppliers in this event. As a result, in April 2017,2020, Ameren Missouri contracted to supply a portion of Ameren Illinois’ capacity requirements for $2 million from June 2021 through May 2023.
Tax Allocation Agreement
See Note 1 – Summary of Significant Accounting Policies under Part II, Item 8, of the Form 10-K for a discussion of the tax allocation agreement. The following table presents the affiliate balances related to income taxes for Ameren Missouri and Ameren Illinois entered into an energy product agreement by which Ameren Missouri agreed to sell,as of June 30, 2020, and December 31, 2019:
| | | | | | | | | | | | | | | | | | | | |
| June 30, 2020 | | | | December 31, 2019 | |
| Ameren Missouri | Ameren Illinois | | | Ameren Missouri | Ameren Illinois |
Income taxes payable to parent(a) | $ | 39 | | $ | 6 | | | | $ | 15 | | $ | 43 | |
Income taxes receivable from parent(b) | — | | 11 | | | | 15 | | 17 | |
(a)Included in “Accounts payable – affiliates” on the balance sheet.
(b)Included in “Accounts receivable – affiliates” on the balance sheet.
Capital Contributions
Ameren Illinois agreed to purchase, 85,600 megawatthours at an average price of $34 per megawatthourreceived cash capital contributions totaling $350 million from Ameren (parent) during the periodsix months ended June 30, 2020.
Effects of March 2019 through May 2020.Related-party Transactions on the Statement of Income
The following table presents the impacteffect on Ameren Missouri and Ameren Illinois of related partyrelated-party transactions for the three and ninesix months ended SeptemberJune 30, 20172020 and 2016:2019:
| | | | | | | | | | | | | | | | | | | | | | | | | | | | | | | | |
| | | | Three Months | | | | Six Months | | |
| Agreement | Income Statement
Line Item | | | Ameren
Missouri | | Ameren
Illinois | | Ameren
Missouri | | Ameren
Illinois |
| Ameren Missouri power supply | Operating Revenues | 2020 | $ | 3 | | $ | (a) | $ | 6 | | $ | (a) |
| agreements with Ameren Illinois | | 2019 | | 2 | | | (a) | | 2 | | | (a) |
| Ameren Missouri and Ameren Illinois | Operating Revenues | 2020 | $ | 6 | | $ | (b) | $ | 13 | | $ | 1 | |
| rent and facility services | | 2019 | | 6 | | | (b) | | 13 | | | 1 | |
| Ameren Missouri and Ameren Illinois | Operating Revenues | 2020 | $ | 1 | | $ | (b) | $ | 1 | | $ | (b) |
| miscellaneous support services | | 2019 | | (b) | | 1 | | | (b) | | 1 | |
| | | | | | | | | | |
| | | | | | | | | | |
| Total Operating Revenues | | 2020 | $ | 10 | | $ | (b) | $ | 20 | | $ | 1 | |
| | 2019 | | 8 | | | 1 | | | 15 | | | 2 | |
| Ameren Illinois power supply | Purchased Power | 2020 | $ | (a) | $ | 3 | | $ | (a) | $ | 6 | |
| agreements with Ameren Missouri | | 2019 | | (a) | | 2 | | | (a) | | 2 | |
| Ameren Illinois transmission | Purchased Power | 2020 | $ | (a) | $ | 1 | | $ | (a) | $ | 1 | |
| services with ATXI | | 2019 | | (a) | | (b) | | (a) | | (b) |
| Total Purchased Power | | 2020 | $ | (a) | $ | 4 | | $ | (a) | $ | 7 | |
| | 2019 | | (a) | | 2 | | | (a) | | 2 | |
| Ameren Missouri and Ameren Illinois | Other Operations and Maintenance | 2020 | $ | (b) | $ | 1 | | $ | (b) | $ | 2 | |
| rent and facility services | | 2019 | | 1 | | | 2 | | | 1 | | | 3 | |
| Ameren Services support services | Other Operations and Maintenance | 2020 | $ | 32 | | $ | 31 | | $ | 67 | | $ | 64 | |
| agreement | | 2019 | | 32 | | | 31 | | | 64 | | | 61 | |
| Total Other Operations and | | 2020 | $ | 32 | | $ | 32 | | $ | 67 | | $ | 66 | |
| Maintenance | | 2019 | | 33 | | | 33 | | | 65 | | | 64 | |
| Money pool borrowings (advances) | (Interest Charges)/Other Income, Net | 2020 | $ | (b) | $ | (b) | $ | (b) | $ | (b) |
| | 2019 | | (b) | | (b) | | (b) | | (b) |
(a)Not applicable.
(b)Amount less than $1 million.
|
| | | | | | | | | | | | | | |
| | | | | Three Months | | Nine Months |
| Agreement | Income Statement Line Item | | | Ameren Missouri | | Ameren Illinois | | Ameren Missouri | | Ameren Illinois |
| Ameren Missouri power supply | Operating Revenues | 2017 | $ | 4 |
| $ | (a) |
| $ | 21 |
| $ | (a) |
|
| agreements with Ameren Illinois | | 2016 | | 9 |
| | (a) |
| | 21 |
| | (a) |
|
| Ameren Missouri and Ameren Illinois | Operating Revenues | 2017 | | 7 |
| | 1 |
| | 20 |
| | 3 |
|
| rent and facility services | | 2016 | | 5 |
| | 1 |
| | 18 |
| | 3 |
|
| Ameren Missouri and Ameren Illinois | Operating Revenues | 2017 | | (b) |
| | (b) |
| | (b) |
| | 1 |
|
| miscellaneous support services | | 2016 | | 1 |
| | (b) |
| | 1 |
| | (b) |
|
| Total Operating Revenues | | 2017 | $ | 11 |
| $ | 1 |
| $ | 41 |
| $ | 4 |
|
| | | 2016 | | 15 |
| | 1 |
| | 40 |
| | 3 |
|
| Ameren Illinois power supply | Purchased Power | 2017 | $ | (a) |
| $ | 4 |
| $ | (a) |
| $ | 21 |
|
| agreements with Ameren Missouri | | 2016 | | (a) |
| | 9 |
| | (a) |
| | 21 |
|
| Ameren Illinois transmission | Purchased Power | 2017 | | (a) |
| | (b) |
| | (a) |
| | 1 |
|
| services with ATXI | | 2016 | | (a) |
| | 1 |
| | (a) |
| | 2 |
|
| Total Purchased Power | | 2017 | $ | (a) |
| $ | 4 |
| $ | (a) |
| $ | 22 |
|
| | | 2016 | | (a) |
| | 10 |
| | (a) |
| | 23 |
|
| Ameren Services support services | Other Operations and Maintenance | 2017 | $ | 34 |
| $ | 33 |
| $ | 103 |
| $ | 99 |
|
| agreement | | 2016 | | 30 |
| | 29 |
| | 96 |
| | 90 |
|
| Money pool borrowings (advances) | Interest Charges/ Miscellaneous Income | 2017 | $ | (b) |
| $ | (b) |
| $ | (b) |
| $ | (b) |
|
| | | 2016 | | (b) |
| | (b) |
| | (b) |
| | (b) |
|
| |
(b) | Amount less than $1 million. |
NOTE 9 – COMMITMENTS AND CONTINGENCIES
We are involved in legal, tax, and regulatory proceedings before various courts, regulatory commissions, authorities, and governmental agencies with respect to matters that arise in the ordinary course of business, some of which involve substantial amounts of money. We believe that the final disposition of these proceedings, except as otherwise disclosed in the notes to our financial statements in this report and in the Form 10-K, will not have a material adverse effect on our results of operations, financial position, or liquidity.
Reference is made to Note 1 – Summary of Significant Accounting Policies, Note 2 – Rate and Regulatory Matters, Note 1413 – Related PartyRelated-party Transactions, and Note 1514 – Commitments and Contingencies under Part II, Item 8, of the Form 10-K. See also Note 1 – Summary of
Significant Accounting Policies, Note 2 – Rate and Regulatory Matters, Note 8 – Related PartyRelated-party Transactions, and Note 10 – Callaway Energy Center of this report.
Other Obligations
In April and September 2017, Ameren Illinois conducted procurement events, administered by the IPA, to purchase energy products through May 2020. In the April 2017 procurement event, Ameren Illinois contracted to purchase 4,249,800 megawatthours of energy products for $128 million from June 2017 through May 2020. In the September 2017 procurement event, Ameren Illinois contracted to purchase approximately 1,950,200 megawatthours of energy products for $57 million from October 2017 through May 2020. The results of both procurement events are reflected in the below table. See Note 8 – Related Party Transactions for additional information regarding energy product agreements between Ameren Missouri and Ameren Illinois as a result of the April procurement event.
To supply a portion of the fuel requirements of Ameren Missouri’s energy centers, Ameren Missouri has entered into various long-term commitments for the procurement of coal, natural gas, nuclear fuel, and methane gas. Ameren Missouri and Ameren Illinois also have entered into various long-term commitments for purchased power and natural gas for distribution. The table below presents our estimated minimum fuel, purchased power, and other commitments for fuel at SeptemberJune 30, 2017.2020. Ameren’s and Ameren Illinois’ purchased power commitments include the Ameren Illinois agreements entered into as part of the IPA-administered power procurement process. Included in the Other column are minimum purchase commitments under contracts for equipment, design and construction, and meter reading services, among other agreements, at SeptemberJune 30, 2017.2020.
| | | | | | | | | | | | | | | | | | | | | | | | | | | | | | | | | | | | | | | | | |
| Coal | | Natural Gas(a) | | Nuclear
Fuel | | Purchased Power(b)(c) | | Methane
Gas | | Other | | Total |
| Ameren: | | | | | | | | | | | | | |
| 2020 | $ | 172 | | | $ | 102 | | | $ | 7 | | | $ | 115 | | (d) | $ | 1 | | | $ | 59 | | | $ | 456 | |
| 2021 | 235 | | | 148 | | | 57 | | | 113 | | (d) | 3 | | | 57 | | | 613 | |
| 2022 | 193 | | | 89 | | | 11 | | | 37 | | | 3 | | | 26 | | | 359 | |
| 2023 | 113 | | | 52 | | | 45 | | | 12 | | | 3 | | | 24 | | | 249 | |
| 2024 | 94 | | | 21 | | | 15 | | | 2 | | | 3 | | | 23 | | | 158 | |
| Thereafter | 55 | | | 72 | | | 16 | | | — | | | 21 | | | 63 | | | 227 | |
| Total | $ | 862 | | | $ | 484 | | | $ | 151 | | | $ | 279 | | | $ | 34 | | | $ | 252 | | | $ | 2,062 | |
| Ameren Missouri: | | | | | | | | | | | | | |
| 2020 | $ | 172 | | | $ | 22 | | | $ | 7 | | | $ | — | | | $ | 1 | | | $ | 44 | | | $ | 246 | |
| 2021 | 235 | | | 33 | | | 57 | | | — | | | 3 | | | 40 | | | 368 | |
| 2022 | 193 | | | 20 | | | 11 | | | — | | | 3 | | | 26 | | | 253 | |
| 2023 | 113 | | | 16 | | | 45 | | | — | | | 3 | | | 24 | | | 201 | |
| 2024 | 94 | | | 6 | | | 15 | | | — | | | 3 | | | 23 | | | 141 | |
| Thereafter | 55 | | | 21 | | | 16 | | | — | | | 21 | | | 26 | | | 139 | |
| Total | $ | 862 | | | $ | 118 | | | $ | 151 | | | $ | — | | | $ | 34 | | | $ | 183 | | | $ | 1,348 | |
| Ameren Illinois: | | | | | | | | | | | | | |
| 2020 | $ | — | | | $ | 80 | | | $ | — | | | $ | 115 | | (d) | $ | — | | | $ | 10 | | | $ | 205 | |
| 2021 | — | | | 115 | | | — | | | 113 | | (d) | — | | | 12 | | | 240 | |
| 2022 | — | | | 69 | | | — | | | 37 | | | — | | | — | | | 106 | |
| 2023 | — | | | 36 | | | — | | | 12 | | | — | | | — | | | 48 | |
| 2024 | — | | | 15 | | | — | | | 2 | | | — | | | — | | | 17 | |
| Thereafter | — | | | 51 | | | — | | | — | | | — | | | — | | | 51 | |
| Total | $ | — | | | $ | 366 | | | $ | — | | | $ | 279 | | | $ | — | | | $ | 22 | | | $ | 667 | |
|
| | | | | | | | | | | | | | | | | | | | | | | | | | | |
| | Coal | | Natural Gas(a) | | Nuclear Fuel | | Purchased Power(b)(c) | | Methane Gas | | Other | | Total |
Ameren:(d) | | | | | | | | | | | | | |
| 2017 | $ | 162 |
| | $ | 65 |
| | $ | 19 |
| | $ | 59 |
| | $ | 1 |
| | $ | 33 |
| | $ | 339 |
|
| 2018 | 453 |
| | 200 |
| | 67 |
| | 170 |
| | 4 |
| | 57 |
| | 951 |
|
| 2019 | 356 |
| | 148 |
| | 27 |
| | 63 |
| | 4 |
| | 39 |
| | 637 |
|
| 2020 | 79 |
| | 94 |
| | 39 |
| | 13 |
| | 5 |
| | 39 |
| | 269 |
|
| 2021 | 27 |
| | 36 |
| | 45 |
| | 2 |
| | 5 |
| | 26 |
| | 141 |
|
| Thereafter | — |
| | 47 |
| | 58 |
| | 20 |
| | 64 |
| | 123 |
| | 312 |
|
| Total | $ | 1,077 |
| | $ | 590 |
| | $ | 255 |
| | $ | 327 |
| | $ | 83 |
| | $ | 317 |
| | $ | 2,649 |
|
| Ameren Missouri: | | | | | | | | | | | | | |
| 2017 | $ | 162 |
| | $ | 14 |
| | $ | 19 |
| | $ | — |
| | $ | 1 |
| | $ | 20 |
| | $ | 216 |
|
| 2018 | 453 |
| | 42 |
| | 67 |
| | — |
| | 4 |
| | 44 |
| | 610 |
|
| 2019 | 356 |
| | 34 |
| | 27 |
| | — |
| | 4 |
| | 25 |
| | 446 |
|
| 2020 | 79 |
| | 26 |
| | 39 |
| | — |
| | 5 |
| | 25 |
| | 174 |
|
| 2021 | 27 |
| | 13 |
| | 45 |
| | — |
| | 5 |
| | 26 |
| | 116 |
|
| Thereafter | — |
| | 22 |
| | 58 |
| | — |
| | 64 |
| | 100 |
| | 244 |
|
| Total | $ | 1,077 |
| | $ | 151 |
| | $ | 255 |
| | $ | — |
| | $ | 83 |
| | $ | 240 |
| | $ | 1,806 |
|
| Ameren Illinois: | | | | | | | | | | | | | |
| 2017 | $ | — |
| �� | $ | 51 |
| | $ | — |
| | $ | 59 |
| | $ | — |
| | $ | 13 |
| | $ | 123 |
|
| 2018 | — |
| | 158 |
| | — |
| | 170 |
| | — |
| | 13 |
| | 341 |
|
| 2019 | — |
| | 114 |
| | — |
| | 63 |
| | — |
| | 14 |
| | 191 |
|
| 2020 | — |
| | 68 |
| | — |
| | 13 |
| | — |
| | 14 |
| | 95 |
|
| 2021 | — |
| | 23 |
| | — |
| | 2 |
| | — |
| | — |
| | 25 |
|
| Thereafter | — |
| | 25 |
| | — |
| | 20 |
| | — |
| | — |
| | 45 |
|
| Total | $ | — |
| | $ | 439 |
| | $ | — |
| | $ | 327 |
| | $ | — |
| | $ | 54 |
| | $ | 820 |
|
(b)The purchased power amounts for Ameren and Ameren Illinois exclude agreements for renewable energy credits through 2035 with various renewable energy suppliers due to the contingent nature of the payment amounts, with the exception of expected payments of $33 million through 2024.
(c)The purchased power amounts for Ameren and Ameren Missouri exclude a 102-megawatt power purchase agreement with a wind farm operator, which expires in 2024, due to the contingent nature of the payment amounts.
| |
(a) | Includes amounts for generation and for distribution. |
| |
(b) | The purchased power amounts for Ameren and Ameren Illinois exclude agreements for renewable energy credits through 2032 with various renewable energy suppliers due to the contingent nature of the payment amounts. |
| |
(c) | The purchased power amounts for Ameren and Ameren Missouri exclude a 102-megawatt power purchase agreement with a wind farm operator, which expires in 2024, due to the contingent nature of the payment amounts. |
| |
(d) | Includes amounts for Ameren registrant and nonregistrant subsidiaries. |
(d)In January 2018, as required by the FEJA, Ameren Illinois entered into agreements to acquire zero emission credits through 2026. Annual zero emission credit commitment amounts will be published by the IPA each May prior to the start of the subsequent planning year, which begins each June. The amounts above reflect Ameren Illinois’ commitment to acquire $58 million of zero emission credits through May 2021.
Environmental Matters
We are subject to various environmental laws, including statutes and regulations, enforced by federal, state, and local authorities. The development and operation of electric generation, transmission, and distribution facilities and natural gas storage, transmission, and distribution facilities can trigger compliance obligations with respect to diverse environmental laws and regulations.laws. These laws and regulations address emissions, discharges intoto surface and groundwater, water water usage,consumption; impacts to air, land, and water,water; and chemical and waste handling.storage, handling and disposal. Complex and lengthy processes are required to obtain and renew approvals, permits, and licenses for new, existing or modified facilities. Additionally, the use and handling of various chemicals or hazardous materials require release prevention plans and emergency response procedures.
The EPA has promulgated environmentalEnvironmental regulations that have a significant impact on the electric utility industry. Over time, complianceindustry and our operations. Compliance with these regulations could be costly for Ameren Missouri, which operates coal-fired power plants. As of December 31, 2016, Ameren Missouri’s fossil fuel-fired energy centers represented 18% and 34% of Ameren’s and Ameren Missouri’s rate base, respectively. Regulations impactingthat apply to air emissions from the electric utility industry include the revised NSPS, the CSAPR, the MATS, and the revised National Ambient Air Quality Standards, which are subject to periodic review for
certain pollutants. Collectively, these regulations cover a variety of pollutants, such as SO2, particulate matter, NOXx,mercury, toxic metals, and acid gases.gases, and CO2 emissions from new power plants. Water intake and discharges from power plants are regulated under the Clean Water Act. ModificationsSuch regulations could require modifications to water intake structures andor more stringent limitations or prohibitions againston wastewater discharges at Ameren Missouri’s energy centers, either of which could result in significant capital expenditures. The management and disposal of coal ash is regulated as a solid waste under the Resource Conservation Act and a regulation known as the CCR Rule,rule, which will require the closure of our surface impoundments and the installations of dry ash handling systems at several of Ameren Missouri’s energy centers, resulting in significant capital expenditures.centers. The individual or combined effects of existing and new environmental regulations could result in significant capital expenditures, increased operating costs, or the closure or alteration of the operation ofoperations at some of Ameren Missouri’s energy centers, or require further capital investment.centers. Ameren and Ameren Missouri expect that such compliance costs would be recoverable through rates, subject to MoPSC prudence review, but the timing of costs and their recovery could be subject to regulatory lag.
Ameren Missouri's current plan for compliance with existing air emission regulations includes burning ultra-low-sulfur coal and installing new or optimizing existing pollution control equipment. Ameren and Ameren Missouri estimate that they will need to make capital expenditures of $425$200 million to $525$250 million in the aggregate from 20172020 through 20212024 in order to comply with existing environmental regulations. Additional environmental controls beyond 20212024 could be required. This estimate of capital expenditures includes expenditures required forby the CCR regulations, by the Clean Water Act rulesrule applicable to cooling water intake structures at existing power plants, and by effluent limitation guidelines applicable to steam electric generating units, all of which are discussed below. The EPA has proposed to repealThis estimate does not include capital expenditures that may be required as a result of the NSR and Clean Power Plan, which would have regulated CO2 emissions from power plants. The above capital expenditure amounts exclude estimated impacts from the Clean Power Plan.Air Act litigation discussed below. Ameren Missouri’s current plan for compliance with existing air emission regulations includes burning low-sulfur coal and installing new or optimizing existing air pollution control equipment. The actual amount of capital expenditures required to comply with existing environmental regulations may vary substantially from the above estimate because of uncertainty as to whether the EPA will substantivelysubstantially revise regulatory obligations, the preciseexactly which compliance strategies that will be used and their ultimate cost, among other things.
The following sections describe the more significant environmental laws and rules and environmental enforcement and remediation matters that affect or could affect our operations. The EPA has initiated an administrative review of several regulations and rulemaking activities,proposed amendments to regulations and guidelines, including to the effluent limitation guidelines and the CCR rule,Rule, which could ultimately result in the revision of all or part of such rules.
Clean Air Act
Federal and state laws, require significant reductions inincluding CSAPR, regulate emissions of SO2and NOx through either emissionthe reduction of emissions at their source reductions orand the use and retirement of emission allowances. The first phase of the CSAPR emission reduction requirements became effective in 2015. The second phase of emission reduction requirements, which were revised by the EPA in 2016, became effective in 2017; additional emission reduction requirements may apply in subsequent years. To achieve compliance with the CSAPR, Ameren Missouri burns ultra-low-sulfurlow-sulfur coal, operates two2 scrubbers at its Sioux energy center,Energy Center, and optimizes other existing air pollution control equipment. Ameren Missouri did not make additional capital investments to comply with the 2017 CSAPR requirements. However, Ameren Missouri expects to incur additional costs to lower its emissions at one or more of its energy centers to comply with the CSAPR in future years. These higher costs are expected to be recovered from customers through the FAC or higher base rates.
CO2 Emissions Standards
In 2015,September 2019, the EPA’s Affordable Clean Energy Rule, which establishes emission guidelines for states to follow in developing plans to limit CO2 emissions from coal-fired electric generating units, became effective. The EPA has identified certain efficiency measures as the best system of emission reduction for coal-fired electric generating units. The rule requires the state of Missouri to develop a compliance plan and submit it to the EPA issuedfor approval by July 2022. The plan is expected to include a standard of performance for each affected generating unit. We are evaluating the impact of the adoption and implementation of the Affordable Clean Power Plan, which sets forth CO2 emissions standards applicableEnergy Rule and, along with other stakeholders, are working with the state of Missouri to existing power plants. In October 2017,develop the EPA announced a proposal to repeal the Clean Power Plan and will seek public comment ascompliance plan submitted to the scope of future regulations
under the Clean Air Act. The United States Court of Appeals for the District of Columbia Circuit has stayed further action pending the EPA’s administrative review.
WeEPA. At this time, we cannot predict the outcome of the EPA’s future rulemaking, the outcome of legal challenges relating to either the repeal of the Clean Power Plan orMissouri’s compliance plan development process. As such, future rulemakings, nor the resulting impact on ourthe results of operations, financial position, or liquidity.and liquidity of Ameren and Ameren Missouri is uncertain. We also cannot predict the outcome of any potential legal challenges to the rule.
NSR and Clean Air Litigation
In January 2011, the Department of Justice, on behalf of the EPA, filed a complaint against Ameren Missouri in the United States District Court for the Eastern District of Missouri. The complaint, as amended in October 2013, allegedMissouri alleging that in performing projects at its coal-fired Rush Island coal-fired energy centerEnergy Center in 2007 and 2010, Ameren Missouri violated provisions of the Clean Air Act and Missouri law. The litigation has been divided into two phases: liability and remedy. In January 2017, the district court issued a liability ruling and, in September 2019, entered a final order that required Ameren Missouri to install a flue gas desulfurization system at the projects violated provisions ofRush Island Energy Center and a dry sorbent injection system at the Clean Air Act and Missouri law. The case will now proceed to the second phase to determine the actions required to remedy the violations foundLabadie Energy Center. There were no fines in the liability phase of the litigation. The EPA previously withdrew all claims for penalties and fines. No date has been set byorder. In October 2019, Ameren Missouri appealed the district court for a trial on the remedy phase of the litigation. At the conclusion of both phases of the litigation, Ameren Missouri intends to appeal the liabilitycourt’s ruling to the United States Court of Appeals for the Eighth Circuit. The district court has stayed implementation of the majority of the requirements of its order while the case is under appeal. Ameren Missouri believes the district court both misinterpreted and misapplied the law in its ruling. We are unable to predict the ultimate resolution of this matter. Briefing in this case has been completed, and the appellate court is expected to hear oral arguments in 2020; however, it is under no deadline to issue a ruling in this case.
The ultimate resolution of this matter could have a material adverse effect on the results of operations, financial position, and liquidity of Ameren and Ameren Missouri. Among other things and subject to economic and regulatory considerations, resolution of this matter could result in increased capital expenditures for the installation of air pollution control equipment, as well as increased operations and maintenance expenses. WeBased upon engineering studies, capital expenditures to comply with the district court’s order for installation of a flue gas desulfurization system at the Rush Island Energy Center are unableestimated at approximately $1 billion. Further, the flue gas desulfurization system would result in additional operation and maintenance expenses of $30 million to predict$50 million annually for the ultimate resolutionlife of this matterthe energy center. Engineering studies required to develop estimated capital expenditures and estimated additional operation and maintenance expenses for the Labadie Energy Center to comply with the district court’s order will not be undertaken while the case is under appeal. As a result of the district court’s stay, Ameren Missouri does not expect to make significant capital expenditures or incur operations and maintenance expenses related to the costs that might be incurred.district court’s order while the case is under appeal.
Clean Water Act
In 2014,July 2018, the EPA issued its final ruleUnited States Court of Appeals for the Second Circuit upheld the EPA’s Section 316(b) Rule applicable to cooling water intake structures at existing power plants. The rule requires a case-by-case evaluation and plan for reducing the number of aquatic organisms impinged on the facility’sa power plant’s cooling water intake screens or entrained through the plant'splant’s cooling water system. All of Ameren Missouri’s coal-fired and nuclear energy centers are subject to the cooling water intake structures rule. ImplementationRequirements of the rule will occurare being implemented by Ameren Missouri during the permit renewal process of each energy center’s water discharge permit, which will occur between 2018 andis expected to be completed by 2023.
Additionally, inIn 2015, the EPA issued a rule to revise the effluent limitation guidelines applicable to steam electric generating units. These guidelines established national standards for water discharges that are based on the effectiveness of available control technology. The EPA'sEPA’s 2015 rule prohibits effluent discharges of certain waste streams and imposes more stringent limitations on certain water discharges from power plants. In September 2017, the EPA published a rule that postponed the compliance dates by two years for the limitations applicable to two2 specific waste streams so that it could potentially revise those standards.
Both To meet the intakerequirements of the guidelines, Ameren Missouri is constructing wastewater treatment facilities and effluent rules, if implemented as enacted, could have an adverse effect on Ameren’s and Ameren Missouri’s results of operations, financial position, and liquidity should such implementation require extensive modifications to the cooling water systems and water dischargedry ash handling systems at Ameren Missouri’s3 of its energy centers, and if such investmentsis scheduled to complete the projects in 2020. Estimated capital expenditures to complete these projects are not recovered on a timely basisincluded in electric rates charged to Ameren Missouri’s customers.the CCR management compliance plan, discussed below.
AshCCR Management
In 2015, the EPA issued regulations regardingthe CCR rule, which established requirements for the management and disposal of CCR from coal-fired energy centers.power plants. These regulations affect CCR disposal and handling costs at Ameren Missouri'sMissouri’s energy centers. They require closureAmeren Missouri is in the process of closing surface impoundments if performance criteria relatingat 3 facilities, and is scheduled to groundwater impacts and location restrictions are not achieved. In September 2017,complete the last of such closures in 2023. The EPA granted petitions filed on behalfhas issued a series of coal-fired electricity generators in which the EPA agreedrevisions to reconsider provisions of the CCR rules.rule and is proposing additional revisions. None of those revisions or proposals is expected to materially impact our closure schedule. Ameren and Ameren Missouri’sMissouri have AROs of $139 million recorded on their respective balance sheets as of June 30, 2020, associated with CCR storage facilities. Ameren Missouri estimates it will need to make capital expenditures of $75 million to $125 million from 2020 through 2024 to implement its CCR management compliance plan, which includes installation of dry ash handling systems, wastewater treatment facilities, reflect the regulations issued in 2015. Ameren plans to close these CCR storage facilities between 2018 and 2024. Ameren Missouri's capital expenditure plan includes the cost of constructing landfills as part of its environmental compliance plan.groundwater monitoring equipment.
Remediation
The Ameren Companies are involved in a number of remediation actions to clean up sites impacted by the use or disposal of materials containing hazardous substances. Federal and state laws can require responsible parties to fund remediation regardless of their degree of fault, the legality of original disposal, or the ownership of a disposal site. Ameren Missouri and Ameren Illinois have each been identified by federal or state governments as a potentially responsible party at several contaminated sites.
As of SeptemberJune 30, 2017,2020, Ameren Illinois owned or was otherwise responsible forhas remediated the majority of the 44 former MGP sites in Illinois it owned or for which are in various stages of investigation, evaluation, remediation, and closure.it was otherwise responsible. Ameren Illinois estimates it could substantially conclude remediation efforts at the remaining sites by
2023. The ICC allows Ameren Illinois to recover such remediation and related litigation costs associated with its former MGP sites from its electric and natural gas utility customers through environmental adjustment ratecost riders. Costs are subject to annual prudence review by the ICC. As of SeptemberJune 30, 2017,2020, Ameren Illinois estimated the remaining obligation related to these former MGP sites at $184$121 million to $255$190 million. Ameren and Ameren Illinois recorded a liability of $184$121 million to represent the estimated minimum obligation for these sites, as no other amount within the range was a better estimate.
The scope of the remediation activities at these former MGP sites may increase as remediation efforts continue. Considerable uncertainty remains in these estimates because many site-specific factors can influence the ultimate actual costs, including unanticipated underground structures, the degree to which groundwater is encountered, regulatory changes, local ordinances, and site accessibility. The actual costs and timing of completion may vary substantially from these estimates.
Ameren Missouri participated in the investigation of various sites known as Sauget Area 2, located in Sauget, Illinois. In 2000, the EPA notified Ameren Missouri and numerous other companies that former landfills and lagoons at those sites may contain soil and groundwater contamination. From about 1926 until 1976, Ameren Missouri operated an energy center adjacent to Sauget Area 2. Ameren Missouri currently owns a parcel of property at Sauget Area 2 that was once used by others as a landfill.
In 2013, the EPA issued its record of decision for Sauget Area 2, approving the investigation and the remediation actions recommended by the potentially responsible parties. Further negotiation among the potentially responsible parties will determine how to fund the implementation of the EPA-approved remedies. As of September 30, 2017, Ameren Missouri estimated its obligation related to Sauget Area 2 at $1 million to $2.5 million. Ameren Missouri recorded a liability of $1 million to represent its estimated minimum obligation for this site, as no other amount within the range was a better estimate.
Our operations or those of our predecessor companies involve the use of, disposal of, and, in appropriate circumstances, the cleanup of substances regulated under environmental laws. We are unable to determine whether such historical practices will result in future environmental commitments or will affect our results of operations, financial position, or liquidity.
Ameren Missouri Municipal Taxes
The cities of Creve Coeur and Winchester, Missouri, on behalf of themselves and other municipalities in Ameren Missouri’s service area, filed a class action lawsuit in 2011 against Ameren Missouri in the Circuit Court of St. Louis County, Missouri. The lawsuit alleges that Ameren Missouri failed to pay gross receipts taxes or license fees on certain revenues, including revenues from wholesale power and interchange sales. In the third quarter of 2017, the court issued an order preliminarily approving a settlement between Ameren Missouri and the plaintiffs, with final resolution of the case expected in the first quarter of 2018. Ameren and Ameren Missouri recorded immaterial liabilities on their respective balance sheets as of September 30, 2017, and December 31, 2016, representing their estimate of the probable loss due as a result of this lawsuit. Ameren and Ameren Missouri believe there is a remote possibility that a liability relating to this lawsuit could be material to Ameren's and Ameren Missouri’s results of operations, financial position, and liquidity.
NOTE 10 – CALLAWAY ENERGY CENTER
Spent Nuclear Fuel
UnderSee Note 9 – Callaway Energy Center under Part II, Item 8, of the NWPA, the DOE is responsibleForm 10-K for disposing ofinformation regarding spent nuclear fuel from the Callaway energy center and other commercial nuclear energy centers. The NWPA established the fee that Ameren Missouri and other utilities that own and operate those energy centers pay the federal government for disposing of the spent nuclear fuel at one mill, or one-tenth of one cent, for each kilowatthour generated and sold by those plants. The NWPA also requires the DOE to review the nuclear waste fee annually against the cost of the nuclear waste disposal program and to propose to the United States Congress any fee adjustment necessary to offset the costs of the program. As required by the NWPA, Ameren Missouri and other utilities have entered into standard contracts with the DOE. Consistent with the NWPA and its standard contract, which stated that the DOE would begin to dispose of spent nuclear fuel by 1998, Ameren Missouri had historically collected one mill from its electric customers for each kilowatthour of electricity that it generated and sold from its Callaway energy center. Because the federal government is not meeting its disposal obligation, the collection of this fee was suspended in May 2014. The DOE's delay in carrying out its obligation to dispose of spent nuclear fuel from the Callaway energy center is not expected to adversely affect the continued operations of the energy center.
As a result of the DOE's failure to fulfill its contractual obligations, Ameren Missouri and other nuclear energy center owners sued the DOE to recover costs incurred for ongoing storage of their spent fuel. The lawsuit resulted in a settlement agreement that provides for annual reimbursement of additional spent fuel storage and related costs. Ameren Missouri received reimbursements from the DOE of $3 million and $24 million in October 2017 and September 2016, respectively. Ameren Missouri will continue to apply for reimbursement from the DOE for allowable costs associated with the ongoing storage of spent fuel.
Decommissioning
Electric utility rates charged to customers provide for therecovery, recovery of the Callaway energy center's decommissioning costs, which include decontamination, dismantling, and site restoration costs, over the expected life of the nuclear energy center. Amounts collected from customers are deposited into the external nuclear decommissioning trust fund to provide for the Callaway energy center’s decommissioning. It is assumed that the Callaway energy center site will be decommissioned through the immediate dismantlement method and removed from service. Ameren and Ameren Missouri have recorded an ARO for the Callaway energy center decommissioning costs at fair value, which represents the present value of estimated future cash outflows. Annual decommissioning costs of $7 million are included in the costs used to establish electric rates for Ameren Missouri's customers. Every three years, the MoPSC requires Ameren Missouri to file an updated cost study and funding analysis for decommissioning its Callaway energy center. An updated cost study and funding analysis was filed with the MoPSC in September 2017 and reflected within the ARO. Ameren Missouri’s filing supported no change in electric service rates for decommissioning costs. There is no deadline by which the MoPSC must issue an order regarding the filing.
fund. The fair value of the trust fund for Ameren Missouri'sMissouri’s Callaway energy centerEnergy Center is reported as "Nuclear“Nuclear decommissioning trust fund"fund” in Ameren'sAmeren’s and Ameren Missouri'sMissouri’s balance sheets. This amount is legally restricted and may be used only to fund the costs of nuclear decommissioning. Changes in the fair value of the trust fund are recorded as an increase or decrease to the nuclear decommissioning trust fund, with an offsetting adjustment to the related regulatory liability. If the assumed return on trust assets is not earned, Ameren Missouri believes that it is probable that any such earnings deficiency will be recovered in rates.
Supplier of Fuel Assemblies
Ameren Missouri received all necessary fuel assemblies for the fourth quarter 2017 refueling and maintenance outage. The Callaway energy center uses nuclear fuel assemblies fabricated by Westinghouse, which is the only NRC-licensed supplier authorized to provide fuel assemblies to the Callaway energy center. During the first quarter of 2017, Westinghouse filed voluntary petitions for a court-supervised restructuring process under Chapter 11 of the United States Bankruptcy Code. Westinghouse could petition the bankruptcy court to reject Ameren Missouri’s contracts as part of the restructuring process, and if the bankruptcy court agrees, this could result in Ameren Missouri not having access to the fuel assemblies necessary to refuel the Callaway energy center in future scheduled refueling and maintenance outages. At this time, Ameren and Ameren Missouri believe the restructuring proceeding will not affect Westinghouse’s performance under the terms of its existing contracts with Ameren Missouri, and therefore do not expect any material impact to Ameren Missouri’s operations as a result of this restructuring proceeding. However, Ameren and Ameren Missouri could incur material unexpected costs as a result of the Westinghouse bankruptcy, such as the loss of fuel inventory that is stored at Westinghouse’s facility and the cost of replacement power if nuclear fuel assemblies were not available for a future scheduled refueling and maintenance outage. A change of fuel suppliers or a change in the type of fuel assembly design that is currently licensed for use at the Callaway energy center could take an estimated three years of analysis and NRC licensing efforts to implement.
Insurance
The following table presents insurance coverage at Ameren Missouri’s Callaway energy centerEnergy Center at SeptemberJune 30, 2017.2020:
| | | | | | | | | | | | | | | | | |
| Type and Source of Coverage | Most Recent
Renewal Date | Maximum Coverages | | Maximum Assessments
for Single Incidents | |
| Public liability and nuclear worker liability: | | | | | |
| American Nuclear Insurers | January 1, 2020 | $ | 450 | | | $ | — | | |
| Pool participation | (a) | 13,348 | | (a) | 138 | | (b) |
| | $ | 13,798 | | (c) | $ | 138 | | |
| Property damage: | | | | | |
| NEIL and EMANI | April 1, 2020 | $ | 3,200 | | (d) | $ | 25 | | (e) |
| Replacement power: | | | | | |
| NEIL | April 1, 2020 | $ | 490 | | (f) | $ | 7 | | (e) |
(a)Provided through mandatory participation in an industrywide retrospective premium assessment program. The maximum coverage available is dependent on the number of United States commercial reactors participating in the program.
(b)Retrospective premium under the Price-Anderson Act. This is subject to retrospective assessment with respect to a covered loss in excess of $450 million in the event of an incident at any licensed United States commercial reactor, payable at $21 million per year.
(c)Limit of liability for each incident under the Price-Anderson liability provisions of the Atomic Energy Act of 1954, as amended. This limit is subject to change to account for the effects of inflation and changes in the number of licensed power reactors.
(d)NEIL provides $2.7 billion in property coveragedamage, stabilization, decontamination, and premature decommissioning insurance for radiation events and $2.3 billion in property damage insurance for nonradiation events. EMANI provides $490 million in property damage insurance for both radiation and nonradiation events.
(e)All NEIL-insured plants could be subject to assessments should losses exceed the nuclear liability coverage renewal datesaccumulated funds from NEIL.
(f)Provides replacement power cost insurance in the event of a prolonged accidental outage. Weekly indemnity up to $4.5 million for 52 weeks, which commences after the first 12 weeks of an outage, plus up to $3.6 million per week for a minimum of 71 weeks thereafter for a total not exceeding the policy limit of $490 million. Nonradiation events are April 1 and January 1, respectively, of each year. Both coverages were renewed in 2017.
|
| | | | | | | | |
| Type and Source of Coverage | Maximum Coverages | | Maximum Assessments for Single Incidents | |
| Public liability and nuclear worker liability: | | | | |
| American Nuclear Insurers | $ | 450 |
| | $ | — |
| |
| Pool participation | 12,986 |
| (a) | 127 |
| (b) |
| | $ | 13,436 |
| (c) | $ | 127 |
| |
| Property damage: | | | | |
| NEIL and EMANI | $ | 3,200 |
| (d) | $ | 29 |
| (e) |
| Replacement power: | | | | |
| NEIL | $ | 490 |
| (f) | $ | 7 |
| (e) |
| |
(a) | Provided through mandatory participation in an industrywide retrospective premium assessment program. |
| |
(b) | Retrospective premium under the Price-Anderson Act. This is subject to retrospective assessment with respect to a covered loss in excess of $450 million in the event of an incident at any licensed United States commercial reactor, payable at $19 million per year. |
| |
(c) | Limit of liability for each incident under the Price-Anderson liability provisions of the Atomic Energy Act of 1954, as amended. This limit is subject to change to account for the effects of inflation and changes in the number of licensed reactors. |
| |
(d) | NEIL provides $2.7 billion in property damage, stabilization, decontamination, and premature decommissioning insurance for radiation events and $2.3 billion in property damage insurance for nonradiation events. EMANI provides $490 million in property damage insurance for both radiation and nonradiation events. |
| |
(e) | All NEIL insured plants could be subject to assessments should losses exceed the accumulated funds from NEIL. |
| |
(f) | Provides replacement power cost insurance in the event of a prolonged accidental outage. Weekly indemnity up to $4.5 million for 52 weeks, which commences after the first twelve weeks of an outage, plus up to $3.6 million per week for a minimum of 71 weeks thereafter for a total not exceeding the policy limit of $490 million. Nonradiation events are limited to $328 million. |
limited to $328 million.
The Price-Anderson Act is a federal law that limits the liability for claims from an incident involving any licensed United States commercial nuclear energy center. The limit is based on the number of licensed reactors. The limit of liability and the maximum potential annual payments are adjusted at least every five years for inflation to reflect changes in the Consumer Price Index. The most recent five-year inflationary adjustment became effective in September 2013.November 2018. Owners of a nuclear reactor cover this exposure through a combination of private insurance and mandatory participation in a financial protection pool, as established by the Price-Anderson Act.
Losses resulting from terrorist attacks on nuclear facilities insured by NEIL are subject to industrywide aggregates, such that terrorist acts against one or more commercial nuclear power plants insured by NEIL or EMANI within a stated time period would be treated as a single event, and the owners of the nuclear power plants would share one fullthe limit of liability. NEIL policies have an aggregate limit of $3.2 billion within a 12-month period for radiation events, or $1.8 billion for events not involving radiation contamination.contamination, resulting from terrorist attacks. The EMANI policies have an aggregate limitare not subject to industrywide aggregates in the event of €600 million for radiation and nonradiation events within a period of 72 hours.terrorist attacks on nuclear facilities.
If losses from a nuclear incident at the Callaway energy centerEnergy Center exceed the limits of, or are not covered by insurance, or if coverage is unavailable, Ameren Missouri is at risk for any uninsured losses. If a serious nuclear incident were to occur, it could have a material adverse effect on Ameren’s and Ameren Missouri’s results of operations, financial position, or liquidity.
NOTE 11 – RETIREMENT BENEFITS
The following table presents the components of the net periodic benefit cost (benefit), prior to capitalization,(income) incurred for Ameren’s pension and postretirement benefit plans for the three and ninesix months ended SeptemberJune 30, 20172020 and 2016:2019:
| | | | | | | | | | | | | | | | | | | | | | | | | | | | | | | | | | | | | | | | | | | | | | | |
| Pension Benefits | | | | | | | | Postretirement Benefits | | | | | | |
| Three Months | | | | Six Months | | | | Three Months | | | | Six Months | | |
| 2020 | | 2019 | | 2020 | | 2019 | | 2020 | | 2019 | | 2020 | | 2019 |
Service cost(a) | $ | 28 | | | $ | 22 | | | $ | 55 | | | $ | 44 | | | $ | 6 | | | $ | 5 | | | $ | 10 | | | $ | 9 | |
| Non-service cost components: | | | | | | | | | | | | | | | |
| Interest cost | 44 | | | 46 | | | 87 | | | 93 | | | 9 | | | 10 | | | 19 | | | 21 | |
| Expected return on plan assets | (72) | | | (69) | | | (145) | | | (138) | | | (20) | | | (19) | | | (40) | | | (38) | |
| Amortization of: | | | | | | | | | | | | | | | |
| | | | | | | | | | | | | | | |
| Prior service benefit | (1) | | | — | | | (1) | | | — | | | (1) | | | (2) | | | (2) | | | (3) | |
| Actuarial loss (gain) | 16 | | | 7 | | | 30 | | | 13 | | | (2) | | | (3) | | | (4) | | | (7) | |
Total non-service cost components(b) | $ | (13) | | | $ | (16) | | | $ | (29) | | | $ | (32) | | | $ | (14) | | | $ | (14) | | | $ | (27) | | | $ | (27) | |
| | | | | | | | | | | | | | | |
| Net periodic benefit cost (income) | $ | 15 | | | $ | 6 | | | $ | 26 | | | $ | 12 | | | $ | (8) | | | $ | (9) | | | $ | (17) | | | $ | (18) | |
|
| | | | | | | | | | | | | | | | | | | | | | | | | | | | | | | | |
| | Pension Benefits | | Postretirement Benefits | |
| | Three Months | | Nine Months | | Three Months | | Nine Months | |
| | 2017 | | 2016 | | 2017 | | 2016 | | 2017 | | 2016 | | 2017 | | 2016 | |
| Service cost | $ | 24 |
| | $ | 20 |
| | $ | 70 |
| | $ | 60 |
| | $ | 6 |
| | $ | 5 |
| | $ | 16 |
| | $ | 15 |
| |
| Interest cost | 44 |
| | 46 |
| | 134 |
| | 138 |
| | 12 |
| | 12 |
| | 35 |
| | 36 |
| |
| Expected return on plan assets | (65 | ) | | (63 | ) | | (196 | ) | | (189 | ) | | (19 | ) | | (18 | ) | | (56 | ) | | (54 | ) | |
| Amortization of: | | | | | | | | | | | | | | | | |
| Prior service benefit | (1 | ) | | — |
| | (1 | ) | | — |
| | (2 | ) | | (1 | ) | | (4 | ) | | (3 | ) | |
| Actuarial loss (gain) | 14 |
| | 8 |
| | 41 |
| | 24 |
| | (2 | ) | | (3 | ) | | (5 | ) | | (8 | ) | |
| Net periodic benefit cost (benefit) | $ | 16 |
| | $ | 11 |
| | $ | 48 |
| | $ | 33 |
| | $ | (5 | ) | | $ | (5 | ) | | $ | (14 | ) | | $ | (14 | ) | |
(b)Non-service cost components are reflected in “Other Income, Net” on Ameren’s statement of income. See Note 5 – Other Income, Net for additional information.
Ameren Missouri and Ameren Illinois are responsible for their respective sharesshare of Ameren’s pension and other postretirement costs. The following table presents the respective share of net periodic pension costs and theother postretirement benefit costs (benefit)(income) incurred for the three and ninesix months ended SeptemberJune 30, 20172020 and 2016:2019:
| | | | | | | | | | | | | | | | | | | | | | | | | | | | | | | | | | | | | | | | | | | | | | | |
| Pension Benefits | | | | | | | | Postretirement Benefits | | | | | | |
| Three Months | | | | Six Months | | | | Three Months | | | | Six Months | | |
| 2020 | | 2019 | | 2020 | | 2019 | | 2020 | | 2019 | | 2020 | | 2019 |
Ameren Missouri(a) | $ | 7 | | | $ | 1 | | | $ | 11 | | | $ | 2 | | | $ | (1) | | | $ | (1) | | | $ | (2) | | | $ | (3) | |
| Ameren Illinois | 9 | | | 5 | | | 16 | | | 10 | | | (8) | | | (8) | | | (16) | | | (15) | |
| Other | (1) | | | — | | | (1) | | | — | | | 1 | | | — | | | 1 | | | — | |
Ameren(a) | $ | 15 | | | $ | 6 | | | $ | 26 | | | $ | 12 | | | $ | (8) | | | $ | (9) | | | $ | (17) | | | $ | (18) | |
(a)Does not include the impact of the regulatory tracking mechanism for the difference between the level of pension and postretirement benefit costs incurred by Ameren Missouri under GAAP and the level of such costs included in rates.
Funding
Based on its assumptions at June 30, 2020, its investment performance in 2020, and its pension funding policy, Ameren expects to make estimated aggregate contributions of approximately $80 million through 2024. This is an increase from the estimated aggregate contributions of $70 million at December 31, 2019, due to year-to-date performance of Ameren’s pension and other postretirement benefit plan assets in 2020.
NOTE 12 – INCOME TAXES
The following table presents a reconciliation of the federal statutory corporate income tax rate to the effective income tax rate for the three and six months ended June 30, 2020 and 2019:
| | | | | | | | | | | | | | | | | | | | | | | | | | | | | | | | | | | | | | |
| Ameren | | | | Ameren Missouri | | | | Ameren Illinois | | | |
| 2020 | | 2019 | | 2020 | | 2019 | | 2020 | | 2019 | |
| Three Months | | | | | | | | | | | | |
| Federal statutory corporate income tax rate: | 21% | | 21% | | 21% | | 21% | | 21% | | 21% | |
| Increases (decreases) from: | | | | | | | | | | | | |
| Amortization of excess deferred taxes | (9) | | (9) |
| (16) | | (12) |
| (3) | | (4) | |
| Depreciation differences | — | | — | | — | | — | | 1 | | (1) | |
| Amortization of deferred investment tax credit | — | | — | | (1) | | (1) | | — | | — | |
| State tax | 5 | | 6 | | 3 | | 4 | | 7 | | 7 | |
| | | | | | | | | | | | |
| | | | | | | | | | | | |
| | | | | | | | | | | | |
| | | | | | | | | | | | |
| Effective income tax rate | 17% | | 18% | | 7% | | 12% | | 26% | | 23% | |
|
| | | | | | | | | | | | | | | | | | | | | | | | | | | | | | | | |
| | Pension Benefits | | Postretirement Benefits | |
| | Three Months | | Nine Months | | Three Months | | Nine Months | |
| | 2017 | | 2016 | | 2017 | | 2016 | | 2017 | | 2016 | | 2017 | | 2016 | |
Ameren Missouri(a) | $ | 6 |
| | $ | 6 |
| | $ | 18 |
| | $ | 19 |
| | $ | (1 | ) | | $ | (1 | ) | | $ | (3 | ) | | $ | (3 | ) | |
| Ameren Illinois | 10 |
| | 6 |
| | 30 |
| | 17 |
| | (3 | ) | | (3 | ) | | (10 | ) | | (10 | ) | |
| Other | — |
| | (1 | ) | | — |
| | (3 | ) | | (1 | ) | | (1 | ) | | (1 | ) | | (1 | ) | |
Ameren(a)(b) | $ | 16 |
| | $ | 11 |
| | $ | 48 |
| | $ | 33 |
| | $ | (5 | ) | | $ | (5 | ) | | $ | (14 | ) | | $ | (14 | ) | |
| | | | | | | | | | | | | | | | | | | | | | | | | | | | | | | | | | | | | | |
| Ameren | | | | Ameren Missouri | | | | Ameren Illinois | | | |
| 2020 | | 2019 | | 2020 | | 2019 | | 2020 | | 2019 | |
| Six Months | | | | | | | | | | | | |
| Federal statutory corporate income tax rate: | 21% | | 21% | | 21% | | 21% | | 21% | | 21% | |
| Increases (decreases) from: | | | | | | | | | | | | |
| Amortization of excess deferred taxes | (9) | | (8) | | (16) | | (12) | | (3) | | (4) | |
| Depreciation differences | — | | — | | — | | 1 | | — | | — | |
| Amortization of deferred investment tax credit | — | | — | | (1) | | (1) | | — | | — | |
| State tax | 5 | | 6 | | 3 | | 4 | | 7 | | 7 | |
| Stock-based compensation | (2) | | (3) | | — | | — | | — | | — | |
| | | | | | | | | | | | |
| | | | | | | | | | | | |
| Other permanent items | — | | (1) | | — | | (1) | | — | | — | |
| Effective income tax rate | 15% | | 15% | | 7% | | 12% | | 25% | | 24% | |
| |
(a) | Does not include the impact of the regulatory tracking mechanism for the difference between the level of pension and postretirement benefit costs incurred by Ameren Missouri under GAAP and the level of such costs included in rates. |
| |
(b) | Includes amounts for Ameren registrants and nonregistrant subsidiaries. |
NOTE 13 – SUPPLEMENTAL INFORMATION
Cash, Cash Equivalents, and Restricted Cash
The following table provides a reconciliation of cash, cash equivalents, and restricted cash reported within the balance sheets and the statements of cash flows as of June 30, 2020, and December 31, 2019:
| | | | | | | | | | | | | | | | | | | | | | | | | | | | | | | | | | | | | | | | | | | | | | |
| June 30, 2020 | | | | | | | December 31, 2019 | | | | | | | | | | | | |
| Ameren | | Ameren
Missouri | | Ameren
Illinois | | | Ameren | | Ameren
Missouri | | Ameren
Illinois | | | | | | | | |
| Cash and cash equivalents | $ | 8 | | | $ | — | | | $ | 2 | | | | $ | 16 | | | $ | 9 | | | $ | — | | | | | | | | | |
| Restricted cash included in “Other current assets” | 14 | | | 5 | | | 5 | | | | 14 | | | 4 | | | 5 | | | | | | | | | |
| Restricted cash included in “Other assets” | 135 | | | — | | | 135 | | | | 120 | | | — | | | 120 | | | | | | | | | |
| Restricted cash included in “Nuclear decommissioning trust fund” | 6 | | | 6 | | | — | | | | 26 | | | 26 | | | — | | | | | | | | | |
| Total cash, cash equivalents, and restricted cash | $ | 163 | | | $ | 11 | | | $ | 142 | | | | $ | 176 | | | $ | 39 | | | $ | 125 | | | | | | | | | |
Restricted cash included in “Other current assets” primarily represents funds held by an irrevocable Voluntary Employee Beneficiary Association (VEBA) trust, which provides health care benefits for active employees. Restricted cash included in “Other assets” on Ameren’s and Ameren Illinois’ balance sheets primarily represents amounts collected under a cost recovery rider restricted for use in the procurement of renewable energy credits and amounts in a trust fund restricted for the use of funding certain asbestos-related claims.
Accounts Receivable
“Accounts receivable – trade” on Ameren’s and Ameren Illinois’ balance sheets include certain receivables purchased at a discount from alternative retail electric suppliers that elect to participate in the utility consolidated billing program. At June 30, 2020, and December 31, 2019, “Other current liabilities” on Ameren’s and Ameren Illinois’ balance sheets included payables for purchased receivables of $34 million and $32 million, respectively.
The following table provides a reconciliation of the beginning and ending amount of the allowance for doubtful accounts for the three and six months ended June 30, 2020 and 2019:
| | | | | | | | | | | | | | | | | | | | | | | | | | |
| Three Months | | | | | Six Months | | |
| 2020 | | 2019 | | | 2020 | | 2019 |
| Ameren: | | | | | | | | |
| Beginning of period | $ | 19 | | | $ | 19 | | | | $ | 17 | | | $ | 18 | |
| Bad debt expense | 7 | | | 5 | | | | 10 | | | 8 | |
| | | | | | | | |
| Net write-offs | (1) | | | (5) | | | | (2) | | | (7) | |
| | | | | | | | |
| End of period | $ | 25 | | | $ | 19 | | | | $ | 25 | | | $ | 19 | |
| Ameren Missouri: | | | | | | | | |
| Beginning of period | $ | 8 | | | $ | 7 | | | | $ | 7 | | | $ | 7 | |
| Bad debt expense | 2 | | | 2 | | | | 4 | | | 3 | |
| | | | | | | | |
| Net write-offs | (1) | | | (2) | | | | (2) | | | (3) | |
| End of period | $ | 9 | | | $ | 7 | | | | $ | 9 | | | $ | 7 | |
Ameren Illinois:(a) | | | | | | | | |
| Beginning of Period | $ | 11 | | | $ | 12 | | | | $ | 10 | | | $ | 11 | |
| Bad debt expense | 5 | | | 3 | | | | 6 | | | 5 | |
| | | | | | | | |
| Net write-offs | — | | | (3) | | | | — | | | (4) | |
| | | | | | | | |
| End of Period | $ | 16 | | | $ | 12 | | | | $ | 16 | | | $ | 12 | |
(a)Ameren Illinois has rate-adjustment mechanisms that allow it to recover the difference between its actual net bad debt write-offs under GAAP, including those associated with receivables purchased from alternative retail electric suppliers, and the amount of net bad debt write-offs included in its base rates. In 2020, the rate-adjustment mechanism for electric distribution allows for recovery of bad debt expense recognized under GAAP. See Note 2 – Rate and Regulatory Matters for additional information.
Net write-offs decreased for the three and six months ended June 30, 2020, compared with the year-ago periods, due to the temporary suspension of disconnecting customers for nonpayment. See Note 2 – Rate and Regulatory Matters for additional information.
Supplemental Cash Flow Information
The following table provides noncash financing and investing activity excluded from the statements of cash flows for the six months ended June 30, 2020 and 2019:
| | | | | | | | | | | | | | | | | | | | | | | | |
| June 30, 2020 | | | | | June 30, 2019 | | |
| Ameren | Ameren
Missouri | | Ameren
Illinois | | Ameren | Ameren
Missouri | Ameren
Illinois |
| Investing | | | | | | | | |
| | | | | | | | |
| | | | | | | | |
| Accrued capital expenditures | $ | 287 | | $ | 111 | | | $ | 165 | | | $ | 263 | | $ | 101 | | $ | 143 | |
| | | | | | | | |
| | | | | | | | |
Net realized and unrealized gain (loss) – nuclear decommissioning trust fund | (4) | | (4) | | | — | | | 90 | | 90 | | — | |
| Financing | | | | | | | | |
| | | | | | | | |
| Issuance of common stock for stock-based compensation | $ | 38 | | $ | — | | | $ | — | | | $ | 54 | | $ | — | | $ | — | |
Asset Retirement Obligations
The following table provides a reconciliation of the beginning and ending carrying amount of AROs for the six months ended June 30, 2020:
| | | | | | | | | | | | | | | | | | | | | | |
| Ameren
Missouri | | Ameren
Illinois | | | | Ameren | |
| Balance at December 31, 2019 | $ | 687 | | (a) | $ | 4 | | | | (b) | $ | 691 | | (a) |
| | | | | | | | |
| Liabilities settled | (28) | | | — | | | | | (28) | | |
| Accretion | 15 | | (c) | — | | | | | 15 | | (c) |
| Change in estimates | 14 | | (d) | — | | | | | 14 | | (d) |
| Balance at June 30, 2020 | $ | 688 | | (a) | $ | 4 | | | | (b) | $ | 692 | | (a) |
(a)Balance included $53 million in “Other current liabilities” on the balance sheet as of both December 31, 2019, and June 30, 2020.
(b)Included in “Other deferred credits and liabilities” on the balance sheet.
(c)Accretion expense attributable to Ameren Missouri was recorded as a decrease to regulatory liabilities.
(d)Ameren Missouri changed its fair value estimate primarily due to an increase in the cost estimate for closure of certain CCR storage facilities.
Stock-based Compensation
On January 1, 2020, Ameren granted 294,320 performance share units with a grant date fair value of $24 million and 132,307 restricted share units with a grant date fair value of $10 million. Awards vest approximately 38 months after the grant date or on a pro-rata basis upon death or eligible retirement. The performance share units vest based on the achievement of certain specified market performance measures (252,370 performance share units) or based on the achievement of renewable generation and energy storage installation targets (41,950 performance share units). The exact number of shares issued pursuant to a performance share unit varies from 0% to 200% of the target award, depending on actual company performance relative to the performance goals.
For the six months ended June 30, 2020 and 2019, excess tax benefits associated with the settlement of stock-based compensation awards reduced income tax expense by $8 million and $14 million, respectively.
Deferred Compensation
As of June 30, 2020, and December 31, 2019, “Other current liabilities” and “Other deferred credits and liabilities” on Ameren’s balance sheet included deferred compensation obligations of $87 millionand$86 million, respectively, recorded at the present value of future benefits to be paid.
Operating Revenues
As of June 30, 2020 and 2019, our remaining performance obligations for contracts with a term greater than one year were immaterial. The Ameren Companies elected not to disclose the aggregate amount of the transaction price allocated to the performance obligations that are unsatisfied as of the end of the reporting period for contracts with an initial expected term of one year or less.
See Note 14 – Segment Information for disaggregated revenue information.
Excise Taxes
Ameren Missouri and Ameren Illinois collect from their customers excise taxes, including municipal and state excise taxes and gross receipts taxes that are levied on the sale or distribution of natural gas and electricity. The following table presents the excise taxes recorded on a gross basis in “Operating Revenues – Electric,” “Operating Revenues – Natural gas” and “Operating Expenses – Taxes other than income taxes” on the statements of income for the three and six months ended June 30, 2020 and 2019:
| | | | | | | | | | | | | | | | | | | | | | | |
| Three Months | | | Six Months | | | |
| 2020 | 2019 | | 2020 | | 2019 | |
| Ameren Missouri | $ | 36 | | $ | 38 | | | $ | 66 | | | $ | 69 | | |
| Ameren Illinois | 26 | | 25 | | | 61 | | | 64 | | |
| Ameren | $ | 62 | | $ | 63 | | | $ | 127 | | | $ | 133 | | |
Earnings per Share
The following table reconciles the basic weighted-average number of common shares outstanding to the diluted weighted-average number of common shares outstanding for the three and six months ended June 30, 2020 and 2019:
| | | | | | | | | | | | | | | | | | | | | | | |
| Three Months | | | | Six Months | | |
| 2020 | | 2019 | | 2020 | | 2019 |
| | | | | | | |
| | | | | | | |
| Weighted-average Common Shares Outstanding – Basic | 246.9 | | | 245.6 | | | 246.7 | | | 245.3 | |
| Assumed settlement of performance share units and restricted stock units | 1.0 | | | 1.6 | | | 1.0 | | | 1.5 | |
| Dilutive effect of forward sale agreement | — | | | — | | | 0.3 | | | — | |
Weighted-average Common Shares Outstanding – Diluted(a) | 247.9 | | | 247.2 | | | 248.0 | | | 246.8 | |
| | | | | | | |
| | | | | | | |
| | | | | | | |
(a)There were 0 potentially dilutive securities excluded from the earnings per diluted share calculations for the three and six months ended June 30, 2020 and 2019.
NOTE 1214 – SEGMENT INFORMATION
Ameren has four segments: Ameren Missouri, Ameren Illinois Electric Distribution, Ameren Illinois Natural Gas, and Ameren Transmission. The Ameren Missouri segment includes all of the operations of Ameren Missouri. Ameren Illinois Electric Distribution consists of the electric distribution business of Ameren Illinois. Ameren Illinois Natural Gas consists of the natural gas business of Ameren Illinois. Ameren Transmission is primarily composed of the aggregated electric transmission businesses of Ameren Illinois and ATXI. The category called Other primarily includes Ameren parent company activities and Ameren Services.
Ameren Missouri has one segment. Ameren Illinois has three segments: Ameren Illinois Electric Distribution, Ameren Illinois Natural Gas, and Ameren Illinois Transmission. See Note 1 – Summary of Significant Accounting Policies for additional information regarding the operations of Ameren Missouri, Ameren Illinois, and ATXI.
Segment operating revenues and a majority of operating expenses are directly recognized and incurred by Ameren Illinois to each Ameren Illinois segment. Common operating expenses, miscellaneous income and expenses, interest charges, and income tax expense are allocated by Ameren Illinois to each Ameren Illinois segment based on certain factors, which primarily relate to the nature of the cost. Additionally, Ameren Illinois Transmission earns revenue from transmission service provided to Ameren Illinois Electric Distribution. The transmission expense for Illinois customers who have elected to purchase their power from Ameren Illinois is recovered through a cost recovery mechanism with no net effect on Ameren Illinois Electric Distribution earnings, as costs are offset by corresponding revenues. Transmission revenues from these transactions are reflected at Ameren Transmission and Ameren Illinois Transmission. An intersegment elimination at Ameren and Ameren Illinois occurs to eliminate these transmission revenues and expenses.
The following tables present revenues, net income (loss) attributable to common shareholders, and capital expenditures by segment at Ameren and Ameren Illinois for the three and ninesix months ended SeptemberJune 30, 20172020 and 2016.2019. Ameren, Ameren Missouri, and Ameren Illinois management review segment capital expenditure information rather than any individual or total asset amount. For additional information about our segments, see Note 16 – Segment Information under Part II, Item 8, of the Form 10-K.
Ameren
| | | | | | | | | | | | | | | | | | | | | | | | | | | | | | | | | | | | | | | | | | | | |
| Ameren Missouri | | Ameren Illinois Electric Distribution | | Ameren Illinois Natural Gas | | Ameren Transmission | | Other | | Intersegment Eliminations | | Ameren | |
| Three Months 2020: | | | | | | | | | | | | | | |
| External revenues | $ | 782 | | | $ | 352 | | | $ | 140 | | | $ | 124 | | | $ | — | | | $ | — | | | $ | 1,398 | | |
| Intersegment revenues | 10 | | | — | | | — | | | 12 | | (a) | — | | | (22) | | | — | | |
| Net income (loss) attributable to Ameren common shareholders | 152 | | | 36 | | | 9 | | | 59 | | (b) | (13) | | | — | | | 243 | | |
| Capital expenditures | 238 | | | 139 | | | 79 | | | 135 | | | (1) | | | 2 | | | 592 | | |
| Three Months 2019: | | | | | | | | | | | | | | |
| External revenues | $ | 790 | | | $ | 358 | | | $ | 136 | | | $ | 95 | | | $ | — | | | $ | — | | | $ | 1,379 | | |
| Intersegment revenues | 8 | | | 1 | | | — | | | 14 | | (a) | — | | | (23) | | | — | | |
| Net income (loss) attributable to Ameren common shareholders | 107 | | | 37 | | | 1 | | | 42 | | (b) | (8) | | | — | | | 179 | | |
| Capital expenditures | 255 | | | 127 | | | 77 | | | 127 | | | — | | | (5) | | | 581 | | |
| Six Months 2020: | | | | | | | | | | | | | | |
| External revenues | $ | 1,452 | | | $ | 741 | | | $ | 411 | | | $ | 234 | | | $ | — | | | $ | — | | | $ | 2,838 | | |
| Intersegment revenues | 20 | | | 1 | | | — | | | 25 | | (a) | — | | | (46) | | | — | | |
| Net income attributable to Ameren common shareholders | 142 | | | 73 | | | 64 | | | 106 | | (b) | 4 | | | — | | | 389 | | |
| Capital expenditures | 516 | | | 262 | | | 140 | | | 305 | | | 2 | | | 3 | | | 1,228 | | |
| Six Months 2019: | | | | | | | | | | | | | | |
| External revenues | $ | 1,541 | | | $ | 744 | | | $ | 456 | | | $ | 194 | | | $ | — | | | $ | — | | | $ | 2,935 | | |
| Intersegment revenues | 15 | | | 2 | | | — | | | 29 | | (a) | — | | | (46) | | | — | | |
| Net income attributable to Ameren common shareholders | 146 | | | 73 | | | 58 | | | 86 | | (b) | 7 | | | — | | | 370 | | |
| Capital expenditures | 495 | | | 251 | | | 128 | | | 248 | | | 10 | | | (7) | | | 1,125 | | |
|
| | | | | | | | | | | | | | | | | | | | | | | | | | | | |
| Three Months | Ameren Missouri | | Ameren Illinois Electric Distribution | | Ameren Illinois Natural Gas | | Ameren Transmission | | Other | | Intersegment Eliminations | | Consolidated | |
| 2017 | | | | | | | | | | | | | | |
| External revenues | $ | 1,104 |
| | $ | 405 |
| | $ | 111 |
| | $ | 105 |
| | $ | (2 | ) | | $ | — |
| | $ | 1,723 |
| |
| Intersegment revenues | 11 |
| | — |
| | 1 |
| | 14 |
| (a) | — |
| | (26 | ) | | — |
| |
| Net income attributable to Ameren common shareholders | 234 |
| | 31 |
| | 2 |
| | 38 |
| (b) | (17 | ) | | — |
| | 288 |
| |
| Capital expenditures | 178 |
| | 112 |
| | 71 |
| | 173 |
| | (2 | ) | | (7 | ) | | 525 |
| |
| 2016 | | | | | | | | | | | | | | |
| External revenues | $ | 1,150 |
| | $ | 502 |
| | $ | 113 |
| | $ | 94 |
| | $ | — |
| | $ | — |
| | $ | 1,859 |
| |
| Intersegment revenues | 15 |
| | 1 |
| | 1 |
| | 14 |
| (a) | — |
| | (31 | ) | | — |
| |
| Net income attributable to Ameren common shareholders | 241 |
| | 93 |
| | 2 |
| | 39 |
| (b) | (6 | ) | | — |
| | 369 |
| |
| Capital expenditures | 147 |
| | 123 |
| | 50 |
| | 175 |
| | 1 |
| | — |
| | 496 |
| |
| Nine Months | | | | | | | | | | | | | | |
| 2017 | | | | | | | | | | | | | | |
| External revenues | $ | 2,799 |
| | $ | 1,176 |
| | $ | 509 |
| | $ | 293 |
| | $ | (2 | ) | | $ | — |
| | $ | 4,775 |
| |
| Intersegment revenues | 41 |
| | 3 |
| | 1 |
| | 33 |
| (a) | — |
| | (78 | ) | | — |
| |
| Net income attributable to Ameren common shareholders | 359 |
| | 94 |
| | 40 |
| | 106 |
| (b) | (16 | ) | | — |
| | 583 |
| |
| Capital expenditures | 533 |
| | 354 |
| | 180 |
| | 463 |
| | 3 |
| | (10 | ) | | 1,523 |
| |
| 2016 | | | | | | | | | | | | | | |
| External revenues | $ | 2,733 |
| | $ | 1,210 |
| | $ | 529 |
| | $ | 247 |
| | $ | 1 |
| | $ | — |
| | $ | 4,720 |
| |
| Intersegment revenues | 40 |
| | 3 |
| | 1 |
| | 36 |
| (a) | — |
| | (80 | ) | | — |
| |
| Net income attributable to Ameren common shareholders | 347 |
| | 122 |
| | 44 |
| | 98 |
| (b) | 10 |
| | — |
| | 621 |
| |
| Capital expenditures | 500 |
| | 359 |
| | 130 |
| | 503 |
| | 4 |
| | — |
| | 1,496 |
| |
| |
(a) | Ameren Transmission earns revenue from transmission service provided to Ameren Illinois Electric Distribution. See discussion of transactions above. |
| |
(b) | Ameren Transmission earnings include an allocation of financing costs from Ameren (parent). |
(a)Ameren Transmission earns revenue from transmission service provided to Ameren Illinois Electric Distribution.
(b)Ameren Transmission earnings reflect an allocation of financing costs from Ameren (parent).
Ameren Illinois
| | | | | | | | | | | | | | | | | | | | | | | | | | | | | |
| Ameren Illinois Electric Distribution | | Ameren Illinois Natural Gas | | Ameren Illinois Transmission | | Intersegment Eliminations | | Ameren Illinois |
| Three Months 2020: | | | | | | | | | |
| External revenues | $ | 352 | | | $ | 140 | | | $ | 75 | | | $ | — | | | $ | 567 | |
| Intersegment revenues | — | | | — | | | 12 | | (a) | (12) | | | — | |
| Net income available to common shareholder | 36 | | | 9 | | | 38 | | | — | | | 83 | |
| Capital expenditures | 139 | | | 79 | | | 119 | | | — | | | 337 | |
| Three Months 2019: | | | | | | | | | |
| External revenues | $ | 359 | | | $ | 136 | | | $ | 52 | | | $ | — | | | $ | 547 | |
| Intersegment revenues | — | | | — | | | 14 | | (a) | (14) | | | — | |
| Net income available to common shareholder | 37 | | | 1 | | | 24 | | | — | | | 62 | |
| Capital expenditures | 127 | | | 77 | | | 85 | | | — | | | 289 | |
| Six Months 2020: | | | | | | | | | |
| External revenues | $ | 742 | | | $ | 411 | | | $ | 137 | | | $ | — | | | $ | 1,290 | |
| Intersegment revenues | — | | | — | | | 24 | | (a) | (24) | | | — | |
| Net income available to common shareholder | 73 | | | 64 | | | 66 | | | — | | | 203 | |
| Capital expenditures | 262 | | | 140 | | | 259 | | | — | | | 661 | |
| Six Months 2019: | | | | | | | | | |
| External revenues | $ | 746 | | | $ | 456 | | | $ | 107 | | | $ | — | | | $ | 1,309 | |
| Intersegment revenues | — | | | — | | | 29 | | (a) | (29) | | | — | |
| Net income available to common shareholder | 73 | | | 58 | | | 51 | | | — | | | 182 | |
| Capital expenditures | 251 | | | 128 | | | 177 | | | — | | | 556 | |
(a)Ameren Illinois Transmission earns revenue from transmission service provided to Ameren Illinois Electric Distribution.
|
| | | | | | | | | | | | | | | | | | | |
| Three Months | Ameren Illinois Electric Distribution | | Ameren Illinois Natural Gas | | Ameren Illinois Transmission | | Intersegment Eliminations | | Consolidated |
| 2017 | | | | | | | | | |
| External revenues | $ | 405 |
| | $ | 112 |
| | $ | 58 |
| | $ | — |
| | $ | 575 |
|
| Intersegment revenues | — |
| | — |
| | 14 |
| (a) | (14 | ) | | — |
|
| Net income available to common shareholder | 31 |
| | 2 |
| | 22 |
| | — |
| | 55 |
|
| Capital expenditures | 112 |
| | 71 |
| | 93 |
| | — |
| | 276 |
|
| 2016 | | | | | | | | | |
| External revenues | $ | 503 |
| | $ | 114 |
| | $ | 59 |
| | $ | — |
| | $ | 676 |
|
| Intersegment revenues | — |
| | — |
| | 14 |
| (a) | (14 | ) | | — |
|
| Net income available to common shareholder | 93 |
| | 2 |
| | 24 |
| | — |
| | 119 |
|
| Capital expenditures | 123 |
| | 50 |
| | 68 |
| | — |
| | 241 |
|
| Nine Months | | | | | | | | | |
| 2017 | | | | | | | | | |
| External revenues | $ | 1,179 |
| | $ | 510 |
| | $ | 165 |
| | $ | — |
| | $ | 1,854 |
|
| Intersegment revenues | — |
| | — |
| | 32 |
| (a) | (32 | ) | | — |
|
| Net income available to common shareholder | 94 |
| | 40 |
| | 57 |
| | — |
| | 191 |
|
| Capital expenditures | 354 |
| | 180 |
| | 226 |
| | — |
| | 760 |
|
| 2016 | | | | | | | | | |
| External revenues | $ | 1,213 |
| | $ | 530 |
| | $ | 152 |
| | $ | — |
| | $ | 1,895 |
|
| Intersegment revenues | — |
| | — |
| | 35 |
| (a) | (35 | ) | | — |
|
| Net income available to common shareholder | 122 |
| | 44 |
| | 57 |
| | — |
| | 223 |
|
| Capital expenditures | 359 |
| | 130 |
| | 194 |
| | — |
| | 683 |
|
| |
(a) | Ameren Illinois Transmission earns revenue from transmission service provided to Ameren Illinois Electric Distribution. See discussion of transactions above. |
The following tables present disaggregated revenues by segment at Ameren and Ameren Illinois for the three and six months ended June 30, 2020 and 2019. Economic factors affect the nature, timing, amount, and uncertainty of revenues and cash flows in a similar manner across customer classes. Revenues from alternative revenue programs have a similar distribution among customer classes as revenues from contracts with customers. Other revenues not associated with contracts with customers are presented in the Other customer classification, along with electric transmission and off-system revenues.
Ameren
| | | | | | | | | | | | | | | | | | | | | | | | | | | | | | | | | | | | | | | | |
| Ameren Missouri | | Ameren Illinois Electric Distribution | | Ameren Illinois Natural Gas | | Ameren Transmission | | | | Intersegment Eliminations | | Ameren | |
| Three Months 2020: | | | | | | | | | | | | | | |
| Residential | $ | 359 | | | $ | 210 | | | $ | — | | | $ | — | | | | | $ | — | | | $ | 569 | | |
| Commercial | 264 | | | 112 | | | — | | | — | | | | | — | | | 376 | | |
| Industrial | 67 | | | 30 | | | — | | | — | | | | | — | | | 97 | | |
| Other | 81 | | | — | |
| — | | | 136 | | | | | (22) | | | 195 | | |
| Total electric revenues | $ | 771 | | | $ | 352 | | | $ | — | | | $ | 136 | | | | | $ | (22) | | | $ | 1,237 | | |
| Residential | $ | 11 | | | $ | — | | | $ | 94 | | | $ | — | | | | | $ | — | | | $ | 105 | | |
| Commercial | 4 | | | — | | | 22 | | | — | | | | | — | | | 26 | | |
| Industrial | 1 | | | — | | | 3 | | | — | | | | | — | | | 4 | | |
| Other | 5 | | | — | | | 21 | |
| — | | | | | — | | | 26 | | |
| Total gas revenues | $ | 21 | | | $ | — | | | $ | 140 | | | $ | — | | | | | $ | — | | | $ | 161 | | |
Total revenues(a) | $ | 792 | | | $ | 352 | | | $ | 140 | | | $ | 136 | | | | | $ | (22) | | | $ | 1,398 | | |
| Three Months 2019: | | | | | | | | | | | | | | |
| Residential | $ | 333 | | | $ | 199 | | | $ | — | | | $ | — | | | | | $ | — | | | $ | 532 | | |
| Commercial | 310 | | | 124 | | | — | | | — | | | | | — | | | 434 | | |
| Industrial | 77 | | | 33 | | | — | | | — | | | | | — | | | 110 | | |
| Other | 53 | |
| 3 | | | — | | | 109 | | | | | (23) | | | 142 | |
|
| Total electric revenues | $ | 773 | | | $ | 359 | | | $ | — | | | $ | 109 | | | | | $ | (23) | | | $ | 1,218 | | |
| Residential | $ | 10 | | | $ | — | | | $ | 88 | | | $ | — | | | | | $ | — | | | $ | 98 | | |
| Commercial | 4 | | | — | | | 23 | | | — | | | | | — | | | 27 | | |
| Industrial | — | | | — | | | 3 | | | — | | | | | — | | | 3 | | |
| Other | 11 | | | — | | | 22 | | | — | | | | | — | | | 33 | | |
| Total gas revenues | $ | 25 | | | $ | — | | | $ | 136 | | | $ | — | | | | | $ | — | | | $ | 161 | | |
Total revenues(a) | $ | 798 | | | $ | 359 | | | $ | 136 | | | $ | 109 | | | | | $ | (23) | | | $ | 1,379 | | |
| Six Months 2020: | | | | | | | | | | | | | | |
| Residential | $ | 656 | | | $ | 430 | | | $ | — | | | $ | — | | | | | $ | — | | | $ | 1,086 | | |
| Commercial | 485 | | | 238 | | | — | | | — | | | | | — | | | 723 | | |
| Industrial | 120 | | | 65 | | | — | | | — | | | | | — | | | 185 | | |
| Other | 141 | | | 9 | | | — | | | 259 | | | | | (46) | | | 363 | | |
| Total electric revenues | $ | 1,402 | | | $ | 742 | | | $ | — | | | $ | 259 | | | | | $ | (46) | | | $ | 2,357 | | |
| Residential | $ | 44 | | | $ | — | | | $ | 307 | | | $ | — | | | | | $ | — | | | $ | 351 | | |
| Commercial | 17 | | | — | | | 76 | | | — | | | | | — | | | 93 | | |
| Industrial | 2 | | | — | | | 6 | | | — | | | | | — | | | 8 | | |
| Other | 7 | | | — | | | 22 | | | — | | | | | — | | | 29 | | |
| Total natural gas revenues | $ | 70 | | | $ | — | | | $ | 411 | | | $ | — | | | | | $ | — | | | $ | 481 | | |
Total revenues(a) | $ | 1,472 | | | $ | 742 | | | $ | 411 | | | $ | 259 | | | | | $ | (46) | | | $ | 2,838 | | |
| | | | | | | | | | | | | | | | | | | | | | | | | | | | | | | | | | | | | | | | |
| Ameren Missouri | | Ameren Illinois Electric Distribution | | Ameren Illinois Natural Gas | | Ameren Transmission | | | | Intersegment Eliminations | | Ameren | |
| Six Months 2019: | | | | | | | | | | | | | | |
| Residential | $ | 645 | | | $ | 416 | | | $ | — | | | $ | — | | | | | $ | — | | | $ | 1,061 | | |
| Commercial | 549 | | | 247 | | | — | | | — | | | | | — | | | 796 | | |
| Industrial | 132 | | | 67 | | | — | | | — | | | | | — | | | 199 | | |
| Other | 151 | | | 16 | | | — | | | 223 | | | | | (46) | | | 344 | | |
| Total electric revenues | $ | 1,477 | | | $ | 746 | | | $ | — | | | $ | 223 | | | | | $ | (46) | | | $ | 2,400 | | |
| Residential | $ | 48 | | | $ | — | | | $ | 334 | | | $ | — | | | | | $ | — | | | $ | 382 | | |
| Commercial | 20 | | | — | | | 88 | | | — | | | | | — | | | 108 | | |
| Industrial | 2 | | | — | | | 7 | | | — | | | | | — | | | 9 | | |
| Other | 9 | | | — | | | 27 | | | — | | | | | — | | | 36 | | |
| Total natural gas revenues | $ | 79 | | | $ | — | | | $ | 456 | | | $ | — | | | | | $ | — | | | $ | 535 | | |
Total revenues(a) | $ | 1,556 | | | $ | 746 | | | $ | 456 | | | $ | 223 | | | | | $ | (46) | | | $ | 2,935 | | |
(a)The following table presents increases/(decreases) in revenues from alternative revenue programs and other revenues not from contracts with customers for the three and six months ended June 30, 2020 and 2019:
| | | | | | | | | | | | | | | | | | | | | | | | | | | | | |
| Ameren Missouri | | Ameren Illinois Electric Distribution | | Ameren Illinois Natural Gas | | Ameren Transmission | | Ameren |
| Three Months 2020: | | | | | | | | | |
| Revenues from alternative revenue programs | $ | (6) | | | $ | 5 | | | $ | 3 | | | $ | 18 | | | $ | 20 | |
| Other revenues not from contracts with customers | 7 | | | — | | | — | | | — | | | 7 | |
| | | | | | | | | |
| Three Months 2019: | | | | | | | | | |
| Revenues from alternative revenue programs | $ | — | | | $ | 12 | | | $ | 4 | | | $ | (8) | | | $ | 8 | |
| Other revenues not from contracts with customers | 4 | | | 1 | | | — | | | — | | | 5 | |
| | | | | | | | | |
| Six Months 2020: | | | | | | | | | |
| Revenues from alternative revenue programs | $ | (9) | | | $ | 51 | | | $ | 14 | | | $ | 30 | | | $ | 86 | |
| Other revenues not from contracts with customers | 15 | | | 1 | | | 1 | | | — | | | 17 | |
| | | | | | | | | |
| Six Months 2019: | | | | | | | | | |
| Revenues from alternative revenue programs | $ | 15 | | | $ | 34 | | | $ | 1 | | | $ | (13) | | | $ | 37 | |
| Other revenues not from contracts with customers | 9 | | | 4 | | | 1 | | | — | | | 14 | |
| | | | | | | | | |
Ameren Illinois
| | | | | | | | | | | | | | | | | | | | | | | | | | | | | | | | |
| Ameren Illinois Electric Distribution | | Ameren Illinois Natural Gas | | Ameren Illinois Transmission | | Intersegment Eliminations | | Ameren Illinois | |
| Three Months 2020: | | | | | | | | | | |
| Residential | $ | 210 | | | $ | 94 | | | $ | — | | | $ | — | | | $ | 304 | | |
| Commercial | 112 | | | 22 | | | — | | | — | | | 134 | | |
| Industrial | 30 | | | 3 | | | — | | | — | | | 33 | | |
| Other | — | |
| 21 | |
| 87 | | | (12) | | | 96 | | |
Total revenues(a) | $ | 352 | | | $ | 140 | | | $ | 87 | | | $ | (12) | | | $ | 567 | | |
| Three Months 2019: | | | | | | | | | | |
| Residential | $ | 199 | | | $ | 88 | | | $ | — | | | $ | — | | | $ | 287 | | |
| Commercial | 124 | | | 23 | | | — | | | — | | | 147 | | |
| Industrial | 33 | | | 3 | | | — | | | — | | | 36 | | |
| Other | 3 | | | 22 | | | 66 | | | (14) | | | 77 | | |
Total revenues(a) | $ | 359 | | | $ | 136 | | | $ | 66 | | | $ | (14) | | | $ | 547 | | |
| Six Months 2020: | | | | | | | | | | |
| Residential | $ | 430 | | | $ | 307 | | | $ | — | | | $ | — | | | $ | 737 | | |
| Commercial | 238 | | | 76 | | | — | | | — | | | 314 | | |
| Industrial | 65 | | | 6 | | | — | | | — | | | 71 | | |
| Other | 9 | | | 22 | | | 161 | | | (24) | | | 168 | | |
Total revenues(a) | $ | 742 | | | $ | 411 | | | $ | 161 | | | $ | (24) | | | $ | 1,290 | | |
| Six Months 2019: | | | | | | | | | | |
| Residential | $ | 416 | | | $ | 334 | | | $ | — | | | $ | — | | | $ | 750 | | |
| Commercial | 247 | | | 88 | | | — | | | — | | | 335 | | |
| Industrial | 67 | | | 7 | | | — | | | — | | | 74 | | |
| Other | 16 | | | 27 | | | 136 | | | (29) | | | 150 | | |
Total revenues(a) | $ | 746 | | | $ | 456 | | | $ | 136 | | | $ | (29) | | | $ | 1,309 | | |
(a)The following table presents increases/(decreases) in revenues from alternative revenue programs and other revenues not from contracts with customers for the Ameren Illinois segments for the three and six months ended June 30, 2020 and 2019:
| | | | | | | | | | | | | | | | | | | | | | | |
| Ameren Illinois Electric Distribution | | Ameren Illinois Natural Gas | | Ameren Illinois Transmission | | Ameren Illinois |
| Three Months 2020: | | | | | | | |
| Revenues from alternative revenue programs | $ | 5 | | | $ | 3 | | | $ | 14 | | | $ | 22 | |
| Other revenues not from contracts with customers | — | | | — | | | — | | | — | |
| | | | | | | |
| Three Months 2019: | | | | | | | |
| Revenues from alternative revenue programs | $ | 12 | | | $ | 4 | | | $ | (9) | | | $ | 7 | |
| Other revenues not from contracts with customers | 1 | | | — | | | — | | | 1 | |
| | | | | | | |
| Six Months 2020: | | | | | | | |
| Revenues from alternative revenue programs | $ | 51 | | | $ | 14 | | | $ | 24 | | | $ | 89 | |
| Other revenues not from contracts with customers | 1 | | | 1 | | | — | | | 2 | |
| | | | | | | |
| Six Months 2019: | | | | | | | |
| Revenues from alternative revenue programs | $ | 34 | | | $ | 1 | | | $ | (14) | | | $ | 21 | |
| Other revenues not from contracts with customers | 4 | | | 1 | | | — | | | 5 | |
| | | | | | | |
ITEM 2. MANAGEMENT’S DISCUSSION AND ANALYSIS OF FINANCIAL CONDITION AND RESULTS OF OPERATIONS.
The following discussion should be read in conjunction with the financial statements and Risk Factors contained in this Form 10-Q, as well as Management’s Discussion and Analysis of Financial Condition and Results of Operations and Risk Factors contained in the Form 10-K. We intend for this discussion to provide the reader with information that will assist in understanding our financial statements, the changes in certain key items in those financial statements, and the primary factors that accounted for those changes, as well as how certain accounting principles affect our financial statements. The discussion also provides information about the financial results of our business segments to provide a better understanding of how those segments and their results affect the financial condition and results of operations of Ameren as a whole. Also see the Glossary of Terms and Abbreviations at the front of this report and in the Form 10-K.
Ameren, headquartered in St. Louis, Missouri, is a public utility holding company whose primary assets are its equity interests in its subsidiaries. Ameren’s subsidiaries are separate, independent legal entities with separate businesses, assets, and liabilities. Dividends on Ameren’s common stock and the payment of expenses by Ameren depend on distributions made to it by its subsidiaries. Ameren’s principal subsidiaries Ameren Missouri, Ameren Illinois, and ATXI, are describedlisted below. Ameren also has other subsidiaries that conduct other activities, such as the provision ofproviding shared services. Ameren evaluates competitive electric transmission investment opportunities outside of MISO as they arise.
•Union Electric Company, doing business as Ameren Missouri, operates a rate-regulated electric generation, transmission, and distribution business and a rate-regulated natural gas distribution business in Missouri.
•Ameren Illinois Company, doing business as Ameren Illinois, operates rate-regulated electric transmission, electric distribution, and natural gas distribution businesses in Illinois.
•ATXI operates a FERC rate-regulated electric transmission business. ATXI is developing MISO-approved electric transmission projects, includingbusiness in the Illinois Rivers, Spoon River, and Mark Twain projects.MISO.
Ameren’s financial statements are prepared on a consolidated basis and therefore include the accounts of its majority-owned subsidiaries. All intercompany transactions have been eliminated. Ameren Missouri and Ameren Illinois have no subsidiaries. All tabular dollar amounts are in millions, unless otherwise indicated.
In addition to presenting results of operations and earnings amounts in total, we present certain information in cents per diluted share. These amounts reflect factors that directly affect Ameren’s earnings. We believe this per diluted share information helps readers to understand the impact of these factors on Ameren’s earnings per share.
OVERVIEW
Net income attributable to Ameren common shareholders was $288 million in the three months ended SeptemberJune 30, 2017,2020, was $243 million, or $0.98 per diluted share, compared with $369$179 million, or $0.72 per diluted share, in the year-ago period. Net income attributable to Ameren common shareholders was $583 million in ninethe six months ended SeptemberJune 30, 2017,2020, was $389 million, or $1.57 per diluted share, compared with $621$370 million, or $1.50 per diluted share, in the year-agoyear-ago period. Net income was unfavorably affected infor the three and ninesix months ended SeptemberJune 30, 2017, compared to the year-ago periods, by milder temperatures in 2017 and decreased Ameren Illinois Electric Distribution earnings due to a change in the method used to recognize interim period revenue related to Ameren Illinois Electric Distribution’s revenue requirement reconciliation in connection with the decoupling provisions of the FEJA. Earnings were also unfavorably affected in the three and nine months ended September 30, 2017, compared to the year-ago periods, by the absence of the recognition in 2016 of a MEEIA 2013 performance incentive award at Ameren Missouri. Net income in the three and nine months ended September 30, 2017,2020, compared to the year-ago periods, was favorably affected by an increasethe absence in base rates2020 of expenses related to the Callaway Energy Center’s 2019 scheduled refueling and maintenance outage; infrastructure investments that drove higher earnings at Ameren Transmission and Ameren Illinois Electric Distribution, each of which utilizes formula ratemaking; a lower base level of tracked expense expenses, partially offset by lower base rates,at Ameren Missouri pursuant to the MoPSC’s March 20172020 electric rate order; and increased Ameren Transmission earnings resulting from the May 2020 FERC order addressing the allowed base ROE. Net income for the three and increased investments in infrastructuresix months ended June 30, 2020, compared to the year-ago periods, was unfavorably affected by a lower recognized ROE at the Ameren Illinois Electric DistributionDistribution. Excluding the absence of the Callaway Energy Center’s scheduled refueling and maintenance outage costs, earnings for the three months ended June 30, 2020, compared to the year-ago period, were favorably affected by lower other operations and maintenance expenses not subject to riders or regulatory tracking mechanisms, primarily due to lower electric system infrastructure maintenance expenses as a result of decreased system load, disciplined cost management, and the deferral of projects to future periods. Earnings for the three months ended June 30, 2020, were also favorably affected by weather, which was offset by decreased electric retail sales not attributable to weather due, in part, to the COVID-19 pandemic. Earnings for the six months ended June 30, 2020, compared to the year-ago period, were unfavorably affected by lower revenues due to the absence of MEEIA performance incentives recognition in 2020, decreased electric retail sales at Ameren Transmission segments reflecting Ameren’s strategyMissouri due, in part, to allocate incremental capitalthe COVID-19 pandemic, and decreased income tax benefits at Ameren (parent) related to those businesses.stock-based compensation.
Ameren’s strategic plan includes investing in, and operating its utilities in a manner consistent with existing regulatory frameworks, enhancing those frameworks, and advocating for responsible energy and economic policies, as well as creating and capitalizing on opportunities for investment for the benefit of its customers and shareholders. Ameren remains focused on disciplined cost management and strategic capital allocation. Ameren believes it has constructive regulatory frameworks for investment at all of its utility businesses and invested $1.2 billion in those businesses in the six months ended June 30, 2020.
The COVID-19 pandemic continues to be a rapidly evolving situation. In the first ninesix months of 2017, Ameren2020, we experienced a net decrease in our sales volumes, an increase in our accounts receivable balances that were past due or that were a part of a deferred payment arrangement, and a decline in our cash collections from customers. The continued effect of the COVID-19 pandemic on our results of operations, financial position, and liquidity in subsequent periods will depend on its severity and longevity, future regulatory or legislative actions with respect thereto, and the resulting impact on business, economic, and capital market conditions. Shelter-in-place orders began taking effect in our service territories in mid-March 2020. These orders generally required individuals to allocate significant amountsremain at home and precluded or limited the operation of capital to those businesses that are supportedwere deemed nonessential. In early 2020, Ameren began implementing its business continuity plans, and continues to implement measures to mitigate the risk of COVID-19 transmission. Actions included restricting travel for employees, implementing work-from-home policies, securing and supplying personal protective equipment, and implementing work practices to ensure the safety of our employees and customers, while maintaining social distancing. While our business operations were deemed essential and were not directly impacted by constructive regulatory frameworks, investing $1 billion the shelter-in-place orders, approximately 65% of capital expendituresour workforce transitioned to remote working arrangements in its FERC rate-regulated electric transmissionmid-March. In early June, a small portion of our workforce began the process of returning to our work locations under a phased approach. In mid-May 2020, shelter-in-place orders effective in our service territories began to be relaxed, with fewer restrictions on social activities and Illinois
nonessential businesses beginning to reopen. However, certain restrictions remain in place that limit individual activities and the operation of nonessential businesses. Additional restrictions may be imposed in the future. We continue to monitor the impacts the pandemic is having on our businesses, including impacts on electric and natural gas distribution businesses.sales volumes, liquidity, bad debt expense, and supply chain operations. For further discussion of these and other matters, see Note 2 – Rate and Regulatory Mattersunder Part I, Item 1, of this report, and Management’s Discussion and Analysis of Results of Operations, Liquidity and Capital Resources, and Outlook sections below. In addition, for information regarding Ameren Missouri’s and Ameren Illinois’ suspension and subsequent reinstatement of customer disconnections and late fee charges for nonpayment, see Note 2 – Rate and Regulatory Matters under Part I, Item 1, of this report.
In February 2020, Ameren Missouri filed an update to its Smart Energy Plan with the MoPSC, which includes a five-year capital investment overview with a detailed one-year plan for 2020. The plan is designed to upgrade Ameren Missouri’s electric infrastructure and includes investments that will upgrade the grid and accommodate more renewable energy. Investments under the plan are expected to total approximately $7.6 billion over the five-year period from 2020 through 2024, with expenditures largely recoverable under the PISA and the RESRAM. The planned investments in 2024 included in the five-year range above are based on the assumption that Ameren Missouri requests and receives MoPSC approval of an extension of the PISA through December 2028.
In March 2017,2020, the MoPSC issued an order in Ameren Missouri’s July 2019 electric service regulatory rate review, approving nonunanimous stipulation and agreements. The order resulted in a decrease of $32 million to Ameren Missouri's annual revenue requirement for electric retail service. The order also provided for the continued use of the FAC and trackers for pension and postretirement benefits, uncertain income tax positions, and certain excess deferred income taxes that the MoPSC previously authorized in earlier electric rate orders. In addition, the order required Ameren Missouri to donate $8 million to low-income assistance programs, which was reflected in results of operations in the first quarter of 2020.The new rates became effective on April 1, 2020. In April 2020, the MoPSC issued another order in Ameren Missouri’s July 2019 electric service regulatory rate review, reaffirming the existing percentage of net energy cost variances allowed to be recovered or refunded under the FAC. See Note 2 – Rate and Regulatory Mattersunder Part I, Item 1, of this report for more information regarding Ameren Missouri’s March and April 2020 electric service regulatory rate orders.
Construction on the new wind generation facilities continues to progress. Delays to the original construction schedule have occurred in 2020 as a result of changes in supply and construction activities. Ameren Missouri and the developers continue to monitor the impact to each project schedule. Ameren Missouri expects the up-to 400-megawatt project and a majority of the up-to 300 megawatt project to be placed in-service by the end of 2020. Based on an updated schedule from the developer, Ameren Missouri expects a portion of the up-to 300-megawatt project, representing approximately $100 million of investment, to be placed in-service in the first quarter of 2021. In May 2020, the IRS issued guidance that extended the in-service date criteria to December 31, 2021, for qualifying for production tax credits. As a result of this extension, Ameren does not anticipate that delays in the completion of the wind generation facilities will affect Ameren’s ability to realize anticipated federal production tax credits. See Note 2 – Rate and Regulatory Matters under Part I, Item 1, of this report for information regarding Ameren Missouri wind generation facilities.
In February 2020, the MoPSC issued an order approving a unanimous stipulation and agreement inallowing Ameren Missouri’sMissouri to defer and amortize maintenance expenses related to scheduled refueling and maintenance outages at its Callaway Energy Center. Maintenance expenses associated with the fall 2020 refueling and maintenance outage are being deferred, as incurred, as a regulatory asset, and will be amortized after completion of the outage. Maintenance expenses will be amortized over the period between refueling and maintenance outages, which is approximately 18 months. Deferring and amortizing these expenses allows the timing of expense recognition to more closely align with revenues and mitigates future earnings volatility between outage and non-outage years.
In February 2020, Ameren Illinois filed a request with the ICC seeking approval to increase its annual revenues for natural gas delivery service. In July 2016 regulatory rate review. 2020, Ameren Illinois filed a revised request seeking to increase its annual revenues for natural gas delivery service by $96 million, which includes an estimated $46 million of annual revenues that would otherwise be recovered under the QIP and other riders. The electric rate order resulted inrequest is based on a $92 million increase in Ameren Missouri’s revenue requirement,10.5% allowed ROE, a $54 million decrease in the base levelcapital structure composed of net energy costs,54.1% common equity, and a $26rate base of $2.1 billion. Ameren Illinois used a 2021 future test year in this proceeding. In June 2020, the ICC staff recommended an increase to annual revenues for natural gas delivery service of $67 million, reductionbased on a 9.3% ROE, a capital structure composed of 50.4% common equity, and a rate base of $2.1 billion. A decision by the ICC in the base level of certain tracked expenses, compared to the amounts in the MoPSC’s April 2015 rate order. Thethis proceeding is required by January 2021, with new rates and base level of expenses became effective on April 1, 2017. In September 2017, Ameren Missouri filed its non-binding 20-year integrated resource plan with the MoPSC, which includes Ameren Missouri’s preferred plan for meeting customers’ projected long-term energy needs in a cost-effective fashion that maintains system reliability as it targets cleaner and more diverse sources of energy generation. These new renewable energy sources would also support Ameren Missouri’s compliance
with the state of Missouri’s requirement of achieving 15% of native load sales from renewable energy sources by 2021, subject to customer rate increase limitations. Ameren Missouri’s plan contemplates adding at least 700 megawatts of wind generation by 2020, as well as 100 megawatts of solar generation over the next 10 years, with 50 megawatts anticipated to come online by 2025. The new wind generation is expected to be locatedeffective in Missouri and neighboring states. The source, location, and cost of the new wind generation, among other items, remain subject to reaching agreements with developers.Based on current and projected market prices for energy, and for wind and solar generation technologies, among other factors, Ameren Missouri expects its ownership of these renewable resources would represent the lowest-cost alternative for customers. The plan also includes expected implementation of continued customer energy efficiency programs. Ameren Missouri’s plan for the addition of renewable resources could be impacted by, among other factors: the availability of federal production tax credits related to renewable energy and its ability to use such credits; the cost of wind and solar generation technologies, as well as energy prices; Ameren Missouri’s ability to obtain interconnection agreements with MISO or other RTOs, including the cost of such interconnections; and Ameren Missouri’s ability to obtain a certificate of convenience and necessity from the MoPSC for projects located in Missouri, or any other required project approvals. The wind generation identified in Ameren Missouri’s plan could represent incremental investments of approximately $1 billion. In connection with the integrated resource plan filing, Ameren Missouri established a goal of reducing CO2 emissions 80% by 2050 from a 2005 base level. To meet this goal, Ameren Missouri is targeting a 35% CO2 emission reduction by 2030 and a 50% reduction by 2040 from the 2005 level by retiring coal-fired generation at the end of its useful life.
February 2021. Ameren Illinois invested approximately $535 million in electric distribution and natural gas infrastructure projects incannot predict the first nine monthslevel of 2017. any delivery service rate change the ICC may approve, nor whether any rate change that may eventually be approved will be sufficient to enable Ameren Illinois to earn a reasonable return on investments when the rate changes go into effect.
In April 2017,2020, Ameren Illinois filed with the ICC its annual electric distribution service formula rate update to establishreduce its rates by $45 million with the revenue requirement used for 2018 rates. In June 2017, the ICC staff submitted its calculation of the revenue requirement, which Ameren Illinois supported in its revised July 2017 filing, and recommended a decrease to the electric distribution service revenue requirement. Pending ICC approval, this update filing will result in a $17 million decrease in Ameren Illinois’ electric distribution service revenue requirement beginning in January 2018.ICC. This update reflects an increasea decrease to the annual formula rate based on 20162019 actual costs, and expected net plant additions for 2017, as well as an increasea decrease to include the 20162019 revenue requirement reconciliation adjustment. The increases in the update filing are more than offset byadjustment, and a decrease for the conclusion of the 20152018 revenue requirement reconciliation adjustment, which will be fully collected from customers in 2017.2020, consistent with the ICC’s December 2019 annual update filing order. It also reflects an increase based on expected net plant additions for 2020. In June 2020, the ICC staff submitted its calculation of the revenue requirement included in
Ameren Illinois’ update filing, recommending a $53 million decrease in Ameren Illinois’ electric distribution service rates. An ICC decision on the revenue requirement to be used for 2018 ratesin this proceeding is expected by December 2017.2020, with new rates effective January 2021.
In the first nine months of 2017, Ameren Transmission invested approximately $460 million in FERC rate-regulated electric transmission projects, including the Illinois Rivers project, the Spoon River project, and Ameren Illinois’ transmission projects to maintain and improve reliability. ATXI’s construction activities for its Illinois Rivers and Spoon River projects are continuing on schedule and are expected to be completed by 2019 and 2018, respectively. Related to its Mark Twain project, in the third quarter of 2017, ATXI finalized an alternative project route and reached agreements with a cooperative electric company in northeast Missouri and Ameren Missouri to locate nearly all of the project on existing transmission line corridors. It also received assents for road crossings from the five affected counties in northeast Missouri. ATXI filed for a certificate of convenience and necessity with the MoPSC and anticipates a decision from the MoPSC in the first half of 2018. ATXI plans to complete the project in December 2019; however, delays in obtaining approval from the MoPSC could delay completion.
In June 2017, pursuant to a note purchase agreement, ATXI agreed to issue $450 million principal amount of 3.43% senior unsecured notes, due 2050, through a private placement offering. ATXI issued $150 million principal amount of the notes in June 2017 and the remaining $300 million principal amount of the notes in August 2017. ATXI received proceeds of $449 million from the notes which were used by ATXI to repay existing short-term and long-term affiliate debt owed to Ameren (parent).
RESULTS OF OPERATIONS
Our results of operations and financial position are affected by many factors. Economic conditions, energy efficiencyincluding those resulting from the COVID-19 pandemic discussed below, energy-efficiency investments by our customers and by us, technological advances, distributed generation, and the actions of key customers can significantly affect the demand for our services. Ameren and Ameren Missouri results are also affected by seasonal fluctuations in winter heating and summer cooling demands, as well as by nuclear refueling and other energy center maintenance outages. Additionally, fluctuations in interest rates and conditions in the capital and credit markets affect our cost of borrowing, and our pension and postretirement benefits costs. Almost all of Ameren’s revenues are subject to state or federal regulation. This regulation has a material impact on the pricesrates we charge customers for our services. Our results of operations, financial position, and liquidity are affected by our ability to align our overall spending, both operating and capital, with regulatorythe frameworks established by our regulators. See Note 2 – Rate and Regulatory Matters, under Part I, Item 1, of this report and the Business Section under Part I, Item 1, of the Form 10-K for additional information regarding Ameren Missouri’s, Ameren Illinois’, and ATXI’s regulatory mechanisms.
We continue to monitor the impacts of the COVID-19 pandemic on our businesses, including impacts on electric and natural gas sales volumes, supply chain operations, and bad debt expense.Ameren Missouri and Ameren Illinois suspended customer disconnections and late fee charges for nonpayment in mid-March 2020 and began to resume these activities in the third quarter of 2020. For additional information, see Note 2 – Rate and Regulatory Matters under Part I, Item 1, of this report.Regarding bad debt expense, Ameren Illinois' electric distribution and natural gas distribution businesses have bad debt riders, which provide for recovery of bad debt write-offs, net of any subsequent recoveries. In 2020, Ameren Illinois’ electric bad debt rider provides for the recovery of bad debt expense. However, Ameren Missouri does not have a bad debt rider or regulatory tracking mechanism and its earnings are exposed to increases in bad debt expense, which could result in higher bad debt write-offs. As of June 30, 2020, accounts receivable balances that were 30 days or greater past due or that were a part of a deferred payment arrangement represented 26%, 19%, and 33%, or $132 million, $42 million, and $90 million, of Ameren’s, Ameren Missouri’s, and Ameren Illinois’ "Accounts receivable – trade" before allowance for doubtful accounts, respectively. As of June 30, 2019, these percentages were 17%, 11%, and 25%, or $83 million, $24 million, and $59 million, for Ameren, Ameren Missouri, and Ameren Illinois, respectively. Ameren Missouri's electric sales volumes have been, and continue to be, affected by the COVID-19 pandemic. In the three and six months ended June 30, 2020, compared to the same periods in 2019, Ameren Missouri experienced a reduction in commercial and industrial electric sales volumes, partially offset by increased electric sales volumes to higher margin residential customers, excluding the estimated effects of weather and customer energy-efficiency programs. While the impacts of the COVID-19 pandemic are difficult to predict, Ameren Missouri expects the net reduction in sales volumes, excluding the estimated effects of weather and customer energy-efficiency programs, to continue in the July through December 2020 period, compared to the same period in 2019. The COVID-19 pandemic may continue to affect Ameren Missouri’s total electric sales volumes and sales volumes by customer class beyond 2020. Assuming a ratable change in Ameren Missouri's electric sales volumes by month, a 1% change for the calendar year 2020 to residential, commercial, and industrial customers would affect earnings per diluted share by approximately 3 cents, 2 cents, and a half-cent, respectively. The actual change in earnings per diluted share will be affected by the timing of sales volume changes due to seasonal customer rates. Based on Ameren Missouri's current projections, the net decline in electric sales volumes for July 1 through December 31, 2020, compared to the same period in 2019, excluding the estimated effects of weather and customer energy-efficiency programs, is expected to result in a decline in earnings per diluted share of approximately 5 cents. The following table provides the increases and (decreases) in Ameren Missouri electric sales volumes by customer class for the three and six months ended June 30, 2020, and the estimated changes for the calendar year 2020, compared to the same periods in 2019, excluding the estimated effects of weather and customer energy-efficiency programs:
| | | | | | | | | | | | | | | | | | | | | | | | |
| | | | | | | | | | Calendar Year (a) |
| | | | | | QTD YoY | | YTD YoY | | |
| Residential | | | | | | 7.0 | % | | 4.5 | % | | 4.0 | % |
| Commercial | | | | | | (13.1) | % | | (7.3) | % | | (7.5) | % |
| Industrial | | | | | | (9.0) | % | | (5.8) | % | | (4.5) | % |
| Total | | | | | | (4.9) | % | | (2.2) | % | | (2.5) | % |
| | | | | | | | | | |
(a) Based on actual results from January 1 through June 30, 2020, and Ameren Missouri’s projection for July 1 through December 31, 2020, compared to the same period in 2019.
Ameren Illinois also experienced decreases in electric and natural gas sales volumes in the three and six months ended June 30, 2020. However, Ameren Illinois’ electric distribution and transmission businesses have formula ratemaking frameworks, which provide for recovery of their revenue requirements independent of sales volumes, and Ameren Illinois' natural gas distribution business has a VBA, which provides for recovery of the natural gas distribution service revenue requirement associated with sales volumes for residential and small nonresidential customers. Additionally, ATXI’s electric transmission business has a formula ratemaking framework, which provides for recovery of its revenue requirement independent of sales volumes. None of Ameren’s businesses have experienced significant disruptions to their supply
chain operations. However, see Note 2 – Rate and Regulatory Mattersunder Part I, Item 1, of this report for information regarding the impact of supply chain disruptions related to Ameren Missouri’s acquisition of an up-to 300-megawatt wind generation facility.
Ameren Missouri principally uses coal nuclear fuel, and natural gasenriched uranium for fuel in its electric operations and purchases natural gas for its customers. Ameren Illinois purchases power and natural gas for its customers. The prices for these commodities can fluctuate significantly because of the global economic and political environment, weather, supply, demand, and many other factors. As described below, weWe have natural gas cost recovery mechanisms for our Illinois and Missouri natural gas distribution service businesses, a purchased power cost recovery mechanism for Ameren Illinois'Illinois’ electric distribution service business, and a FAC for Ameren Missouri'sMissouri’s electric utility business.
Ameren Missouri’s FAC cost recovery mechanism allows it to recover or refund, through customer rates, 95% of changes in net energy costs greater or less than the amount set in base rates without a traditional rate proceeding, subject to MoPSC prudence reviews, with the
remaining 5% of changes retained by Ameren Missouri. Net energy costs, as defined in the FAC, include fuel and purchased power costs net of off-system sales. Ameren Missouri accrues net energy costs that exceed the amount set in base rates (FAC under-recovery) as a regulatory asset. Net recovery of these costs through customer rates does not affect Ameren Missouri's electric margins, as any change in revenue is offset by a corresponding change in fuel expense to reduce the previously recognized FAC regulatory asset. See the definition of margin in the Electric and Natural Gas Margins section below. In addition, Ameren Missouri’s MEEIA customer energy efficiency program costs, throughput disincentive, and any performance incentive are recoverable through the MEEIA cost recovery mechanism without a traditional rate proceeding. Ameren Missouri also has a cost recovery mechanism for natural gas purchased on behalf of its customers. These pass-through purchased gas costs do not affect Ameren Missouri’s natural gas margins as any change in costs is offset by a corresponding change in revenues. Ameren Missouri employs other cost recovery mechanisms, including a pension and postretirement benefit cost tracker, an uncertain tax position tracker, a renewable energy standards cost tracker, and a solar rebate program tracker. Each of these trackers allows Ameren Missouri to record the difference between the level of incurred costs under GAAP and the level of such costs included in rates as a regulatory asset or regulatory liability, which will be reflected in base rates in a subsequent MoPSC rate order.
Ameren Illinois’ electric distribution service business has cost recovery mechanisms for power purchased and transmission services incurred on behalf of its customers. The FEJA also provides Ameren Illinois electric distribution with cost recovery of renewable energy credit compliance, zero-emission credits, and energy efficiency investments as well as a return on those investments. Ameren Illinois’ natural gas business has a cost recovery mechanism for natural gas purchased on behalf of its customers. These pass-through costs do not affect Ameren Illinois' electric or natural gas margins, as any change in costs is offset by a corresponding change in revenues. Ameren Illinois employs other cost recovery mechanisms for customer energy efficiency program costs and certain environmental costs as well as bad debt expense and costs of certain asbestos-related claims not recovered in base rates. Ameren Illinois’ natural gas business also has the QIP rider to recover the costs of qualifying infrastructure plant investments placed in service between rate cases and earn a return those investments.
Ameren Illinois’ electric distribution service rates are subject to an annual revenue requirement reconciliation to its actual recoverable costs and allowed return on equity under a formula ratemaking process effective through 2022. These recoverable electric distribution costs include other operations and maintenance expenses, depreciation and amortization, taxes other than income taxes, interest charges, and income taxes. These recoverable costs do not include those costs recovered through separate cost recovery mechanisms. A portion of the electric distribution costs included in those income statement line items are not recoverable. If a given year's revenue requirement is greater than the revenue requirement reflected in that year's customer rates, an increase to electric operating revenues with an offset to a regulatory asset is recorded to reflect the expected recovery of those additional amounts from customers within two years. If a given year's revenue requirement is less than the revenue requirement reflected in that year's customer rates, a reduction to electric operating revenues with an offset to a regulatory liability is recorded to reflect the expected refund to customers within two years.
Ameren Illinois’ electric distribution service revenue requirement is based on recoverable costs, year-end rate base, a capital structure of 50% common equity, and a return on equity. The return on equity is equal to the average of the monthly yields of 30-year United States Treasury bonds plus 580 basis points. Therefore, Ameren Illinois' annual return on equity for its electric distribution business is directly correlated to yields on United States Treasury bonds. Beginning in 2017, the FEJA also provides that Ameren Illinois recovers, within the following two years, its electric distribution revenue requirement for a given year, independent of actual sales volumes.
The provisions of FERC's electric transmission formula rate framework provide for an annual reconciliation of the electric transmission service revenue requirement, which reflects the actual recoverable costs incurred and the 13-month average rate base for a given year, with the revenue requirement in customer rates, including an allowed return on equity. These recoverable transmission costs are included in other operations and maintenance expenses, depreciation and amortization, taxes other than income taxes, interest charges, and income taxes. A portion of the transmission costs included in those income statement line items are not recoverable. Ameren Illinois and ATXI use a company-specific, forward-looking rate formula framework in setting their transmission rates. These rates are updated each January with forecasted information. If a given year's revenue requirement is greater than the revenue requirement reflected in that year's customer rates, an increase to electric operating revenues with an offset to a regulatory asset is recorded to reflect the expected recovery of those additional amounts from customers within two years. If a given year's revenue requirement is less than the revenue requirement reflected in that year's customer rates, a reduction to electric operating revenues with an offset to a regulatory liability is recorded to reflect the expected refund to customers within two years. The total return on equity currently allowed for Ameren Illinois’ and ATXI’s electric transmission service businesses is 10.82% and is subject to a FERC complaint case. See Note 2 – Rate and Regulatory Matters under Part I, Item 1, of this report for additional information.
We employ various risk management strategies to reduce our exposure to commodity risk and other risks inherent in our business. The reliability of Ameren Missouri'sMissouri’s energy centers and our transmission and distribution systems, and the level and timing of operations and maintenance costs and capital investment, are key factors that we seek to manage in order to optimize our results of operations, financial position, and liquidity.
Earnings Summary
The following table presents a summary of Ameren'sAmeren’s earnings for the three and ninesix months ended SeptemberJune 30, 20172020 and 2016:2019:
| | | | | | | | | | | | | | | | | | | | | | | |
| Three Months | | | | Six Months | | |
| 2020 | | 2019 | | 2020 | | 2019 |
| Net income attributable to Ameren common shareholders | $ | 243 | | | $ | 179 | | | $ | 389 | | | $ | 370 | |
Earnings per common share – diluted | 0.98 | | | 0.72 | | | 1.57 | | | 1.50 | |
|
| | | | | | | | | | | | | | | | | |
| | Three Months | | | Nine Months | |
| | 2017 | | 2016 | | | 2017 | | 2016 | |
| Net income attributable to Ameren common shareholders | $ | 288 |
| | $ | 369 |
| | | $ | 583 |
| | $ | 621 |
| |
Earnings per common share – diluted | 1.18 |
| | 1.52 |
| | | 2.39 |
| | 2.56 |
| |
Net income attributable to Ameren common shareholders decreased $81increased $64 million, or 3426 cents per diluted share, in the three months ended SeptemberJune 30, 2017,2020, compared with the year-ago period. The decreaseincrease was principally due to net income decreasesincreases of $62$45 million, $17 million and $7$8 millionat Ameren Illinois Electric DistributionMissouri, Ameren Transmission, and Ameren Missouri, respectively, and anIllinois Natural Gas, respectively. These increases were partially offset by a $5 million increase in the net loss of $11 million for activity not reported as part of a segment, primarily at Ameren (parent)., and a $1 million decrease in net income at Ameren Illinois Electric Distribution.
Net income attributable to Ameren common shareholders decreased $38increased $19 million, or 177 cents per diluted share, in the ninesix months ended SeptemberJune 30, 2017,2020, compared with the year-ago period. The decreaseincrease was due to net income decreasesincreases of $28$20 million and $4$6 million at Ameren Illinois Electric DistributionTransmission and Ameren Illinois Natural Gas, respectively. Additionally,These increases were partially offset by net income decreases of $4 million and $3 million at Ameren Missouri and from activity not reported as part of a segment, primarily at Ameren (parent), had a $16 million net loss in the first nine months of 2017, compared with net income of $10 million in the same period in 2016. The decrease was partially offset by an increase in net income of $12 million and $8 million at Ameren Missouri and Ameren Transmission, respectively.
Earnings per diluted share were unfavorably affected in the three and nine months ended September 30, 2017, compared to the year-ago periods (except where a specific period is referenced), by:
decreased demand primarily at Ameren Missouri due to milder winter and summer temperatures in 2017 (estimated at 8 cents per share and 16 cents per share, respectively);
a change in the method used to recognize Ameren Illinois Electric Distribution’s interim period revenue in connection with the decoupling provisions of the FEJA as discussed in Note 2 – Rate and Regulatory Matters under Part I, Item 1, of this report (24 cents per share and 12 cents per share, respectively);
an increase in income tax expense due to an increase in the Illinois corporate income tax rate recorded at Ameren (parent) as discussed in Note 1 – Summary of Significant Accounting Policies under Part I, Item 1, of this report (6 cents per share for both periods);
the absence in 2017 of the MEEIA 2013 performance incentive at Ameren Missouri recognized in the third quarter of 2016 (5 cents per share for both periods);
increased depreciation and amortization expenses, primarily at Ameren Missouri, resulting from additional electric property, plant, and equipment (2 cents per share and 5 cents per share, respectively);
an increase in the effective tax rate, excluding the effect of the increase in the Illinois corporate income tax rate discussed above, primarily due to a decrease in the income tax benefit recorded at Ameren (parent) related to share-based compensation (4 cents per share for the nine months ended September 30, 2017);
the absence of increased Ameren Missouri electric margins in 2016 resulting from the suspension of operations at the New Madrid Smelter in the first quarter of 2016 and the elimination of recovery under the FAC tariff effective April 1, 2017, which had allowed Ameren Missouri to retain a portion of the revenues from off-system sales it made as a result of reduced sales to the New Madrid Smelter as discussed in the Electric and Natural Gas Margins section below (1 cent per share and 2 cents per share, respectively); and
increased other operations and maintenance expenses not subject to riders or regulatory tracking mechanisms at Ameren Missouri, primarily due to increased repairs and compliance expenditures (2 cents per share for the nine months ended September 30, 2017).
Earnings per diluted share were favorably affected in the three and ninesix months ended SeptemberJune 30, 2017,2020, compared to the year-ago periods (except(except where a specific period is referenced), by:
an increase•decreased other operations and maintenance expenses related to the absence of a scheduled refueling and maintenance outage at the Callaway Energy Center, which last occurred in base ratesthe second quarter of 2019 and which costs previously were expensed as incurred, as compared with the deferral of expenses for the fall 2020 refueling and maintenance outage under the February 2020 MoPSC order (8 cents and 10 cents per share, respectively);
•lower base level of expenses, partially offset by lower base rates, net of recovery for amounts associated with the reduction in sales volumes resulting from MEEIA programs and recoverable depreciation under the PISA, at Ameren Missouri pursuant to the MoPSC’s March 20172020 electric rate order as discussed in Note 2 – Rate and Regulatory Matters under Part I, Item 1, of this report (15 cents per share and 26 cents per share, respectively);
the absence in 2017 of costs associated with the Callaway energy center’s scheduled refueling and maintenance outage in the second quarter of 2016, partially offset by costs incurred to prepare for the scheduled outage that began in October 2017 (7 cents per share for the nine months ended September 30, 2017)both periods);
•increased Ameren Transmission earnings under formula ratemaking, primarily due to additional rate base partially offset by a lower recognized return on equity (1 cent per share and 5 cents per share, respectively); and
increased Ameren Illinois Electric Distribution earnings under formula ratemaking because of additional rate base investments (4 cents and 7 cents per share, respectively);
•increased electric retail sales at Ameren Missouri for the three months ended June 30, 2020, due to weather resulting from warmer early summer temperatures experienced in 2020 (estimated at 5 cents per share for the three months ended June 30, 2020);
•increased Ameren Transmission earnings resulting from the May 2020 FERC order addressing the allowed base ROE for FERC regulated transmission rate base under the MISO tariff (4 cents per share for both periods);
•increased Ameren Illinois Natural Gas earnings from investments in qualifying infrastructure recovered under the QIP rider (1 cent and 2 cents per share, respectively); and
•decreased other operations and maintenance expenses not subject to riders or regulatory tracking mechanisms, excluding decreased costs associated with the Callaway Energy Center’s scheduled refueling and maintenance outage, primarily due to additional rate base investment as welllower electric system infrastructure maintenance expenses as a higherresult of decreased system load, disciplined cost management, and the deferral of projects to future periods, and changes in the cash surrender value of company-owned life insurance, which increased in the three months ended June 30, 2020, but decreased in the six months ended June 30, 2020 (9 cents and 1 cent per share, respectively).
Earnings per diluted share were unfavorably affected in the three and six months ended June 30, 2020, compared to the year-ago periods (except where a specific period is referenced), by:
•the absence in 2020 of MEEIA 2013 and MEEIA 2016 performance incentives at Ameren Missouri recognized return on equity (2in the first quarter of 2019 (6 cents per share for the six months ended June 30, 2020);
•decreased electric retail sales, excluding the estimated effects of weather, at Ameren Missouri due to decreased demand from commercial and industrial customers, partially offset by increased demand from higher margin residential customers. Demand was affected, in part, by the COVID-19 pandemic (estimated at 5 cents per share for both periods);
•decreased Ameren Illinois Electric Distribution earnings under formula ratemaking because of a lower recognized ROE (2 cents and 4 cents per share, respectively).;
•decreased income tax benefits at Ameren (parent) related to stock-based compensation (3 cents per share for the six months ended June 30, 2020);
•increased net financing costs primarily at Ameren (parent), because of its April 2020 debt issuance (3 cents and 2 cents per share, respectively);
•increased charitable donations at Ameren Missouri pursuant to its March 2020 electric rate order (2 cents per share for the six months ended June 30, 2020);
•decreased electric sales at Ameren Missouri, primarily due to milder winter temperatures experienced in 2020 (1 cent per share for the six months ended June 30, 2020); and
•increased weighted-average basic common shares outstanding (1 cent per share for both periods).
The cents per share information presented is based on the average dilutedweighted-average basic common shares outstanding in the three and ninesix months ended SeptemberJune 30, 2016.2019, and does not reflect any change in earnings per share resulting from dilution, unless otherwise noted. Amounts other than variances related to income taxes have been presented net of income taxes using Ameren’s 20162020 statutory tax rate of 39%26%. For additional details regarding the Ameren Companies’ results of operations, including explanations of Electric and Natural Gas Margins, Other Operations and Maintenance Expenses, Depreciation and Amortization, Taxes Other Than Income Taxes, Other Income, and Expenses,Net, Interest Charges, and Income Taxes, see the major headings below.
Below is Ameren’s table of income statement components by segment for the three and ninesix months ended SeptemberJune 30, 20172020 and 2016:2019:
| | | | | | | | | | | | | | | | | | | | | | | | | | | | | | | | | | | |
| Ameren
Missouri | | Ameren
Illinois
Electric
Distribution | | Ameren
Illinois
Natural Gas | | Ameren Transmission | | Other /
Intersegment
Eliminations | | Ameren |
| Three Months 2020: | | | | | | | | | | | |
| Electric margins | $ | 615 | | | $ | 264 | | | $ | — | | | $ | 136 | | | $ | (6) | | | $ | 1,009 | |
| Natural gas margins | 15 | | | — | | | 104 | | | — | | | — | | | 119 | |
| | | | | | | | | | | |
| Other operations and maintenance expenses | (202) | | | (118) | | | (52) | | | (15) | | | 3 | | | (384) | |
| | | | | | | | | | | |
| Depreciation and amortization expenses | (155) | | | (71) | | | (20) | | | (23) | | | (2) | | | (271) | |
| Taxes other than income taxes | (83) | | | (19) | | | (13) | | | (2) | | | (2) | | | (119) | |
| Other income, net | 25 | | | 9 | | | 5 | | | 3 | | | 6 | | | 48 | |
| Interest charges | (50) | | | (18) | | | (10) | | | (18) | | | (12) | | | (108) | |
| Income taxes | (12) | | | (11) | | | (4) | | | (22) | | | (1) | | | (50) | |
| | | | | | | | | | | |
| | | | | | | | | | | |
| Net income (loss) | 153 | | | 36 | | | 10 | | | 59 | | | (14) | | | 244 | |
Noncontrolling interests – preferred stock dividends | (1) | | | — | | | (1) | | | — | | | 1 | | | (1) | |
| Net income (loss) attributable to Ameren common shareholders | $ | 152 | | | $ | 36 | | | $ | 9 | | | $ | 59 | | | $ | (13) | | | $ | 243 | |
| Three Months 2019: | | | | | | | | | | | |
| Electric margins | $ | 611 | | | $ | 267 | | | $ | — | | | $ | 109 | | | $ | (7) | | | $ | 980 | |
| Natural gas margins | 17 | | | — | | | 100 | | | — | | | — | | | 117 | |
| | | | | | | | | | | |
| Other operations and maintenance expenses | (254) | | | (126) | | | (59) | | | (14) | | | 3 | | | (450) | |
| | | | | | | | | | | |
| Depreciation and amortization expenses | (139) | | | (68) | | | (19) | | | (21) | | | (2) | | | (249) | |
| Taxes other than income taxes | (83) | | | (19) | | | (13) | | | (1) | | | (2) | | | (118) | |
| Other income, net | 16 | | | 10 | | | 3 | | | 3 | | | 4 | | | 36 | |
| Interest charges | (45) | | | (17) | | | (9) | | | (19) | | | (7) | | | (97) | |
| Income (taxes) benefit | (15) | | | (10) | | | (1) | | | (15) | | | 2 | | | (39) | |
| | | | | | | | | | | |
| | | | | | | | | | | |
| Net income (loss) | 108 | | | 37 | | | 2 | | | 42 | | | (9) | | | 180 | |
Noncontrolling interests – preferred stock dividends | (1) | | | — | | | (1) | | | — | | | 1 | | | (1) | |
| Net income (loss) attributable to Ameren common shareholders | $ | 107 | | | $ | 37 | | | $ | 1 | | | $ | 42 | | | $ | (8) | | | $ | 179 | |
| Six Months 2020: | | | | | | | | | | | |
| Electric margins | $ | 1,067 | | | $ | 544 | | | $ | — | | | $ | 259 | | | $ | (15) | | | $ | 1,855 | |
| Natural gas margins | 46 | | | — | | | 286 | | | — | | | — | | | 332 | |
| | | | | | | | | | | |
| Other operations and maintenance expenses | (441) | | | (248) | | | (109) | | | (29) | | | 5 | | | (822) | |
| | | | | | | | | | | |
| Depreciation and amortization expenses | (294) | | | (142) | | | (41) | | | (47) | | | (2) | | | (526) | |
| Taxes other than income taxes | (162) | | | (38) | | | (35) | | | (4) | | | (5) | | | (244) | |
| Other income, net | 29 | | | 16 | | | 7 | | | 5 | | | 12 | | | 69 | |
| Interest charges | (90) | | | (36) | | | (20) | | | (39) | | | (16) | | | (201) | |
| Income (taxes) benefit | (11) | | | (22) | | | (23) | | | (39) | | | 24 | | | (71) | |
| | | | | | | | | | | |
| | | | | | | | | | | |
| Net income | 144 | | | 74 | | | 65 | | | 106 | | | 3 | | | 392 | |
Noncontrolling interests – preferred stock dividends | (2) | | | (1) | | | (1) | | | — | | | 1 | | | (3) | |
| Net income attributable to Ameren common shareholders | $ | 142 | | | $ | 73 | | | $ | 64 | | | $ | 106 | | | $ | 4 | | | $ | 389 | |
| Six Months 2019: | | | | | | | | | | | |
| Electric margins | $ | 1,104 | | | $ | 534 | | | $ | — | | | $ | 223 | | | $ | (15) | | | $ | 1,846 | |
| Natural gas margins | 44 | | | — | | | 286 | | | — | | | — | | | 330 | |
| | | | | | | | | | | |
| Other operations and maintenance expenses | (478) | | | (245) | | | (118) | | | (29) | | | 3 | | | (867) | |
| | | | | | | | | | | |
| Depreciation and amortization expenses | (279) | | | (136) | | | (39) | | | (41) | | | (2) | | | (497) | |
| Taxes other than income taxes | (160) | | | (39) | | | (37) | | | (2) | | | (6) | | | (244) | |
| Other income, net | 28 | | | 16 | | | 6 | | | 4 | | | 11 | | | 65 | |
| Interest charges | (92) | | | (35) | | | (19) | | | (38) | | | (10) | | | (194) | |
| Income (taxes) benefit | (19) | | | (21) | | | (20) | | | (31) | | | 25 | | | (66) | |
| | | | | | | | | | | |
| | | | | | | | | | | |
| Net income | 148 | | | 74 | | | 59 | | | 86 | | | 6 | | | 373 | |
Noncontrolling interests – preferred stock dividends | (2) | | | (1) | | | (1) | | | — | | | 1 | | | (3) | |
| Net income attributable to Ameren common shareholders | $ | 146 | | | $ | 73 | | | $ | 58 | | | $ | 86 | | | $ | 7 | | | $ | 370 | |
|
| | | | | | | | | | | | | | | | | | | | | | | |
| | Ameren Missouri | | Ameren Illinois Electric Distribution | | Ameren Illinois Natural Gas | | Ameren Transmission | | Other / Intersegment Eliminations | | Total |
| Three Months 2017: | | | | | | | | | | | |
| Electric margins | $ | 857 |
| | $ | 267 |
| | $ | — |
| | $ | 119 |
| | $ | (10 | ) | | $ | 1,233 |
|
| Natural gas margins | 13 |
| | — |
| | 91 |
| | — |
| | — |
| | 104 |
|
| Other operations and maintenance | (224 | ) | | (118 | ) | | (52 | ) | | (16 | ) | | 8 |
| | (402 | ) |
| Depreciation and amortization | (134 | ) | | (60 | ) | | (15 | ) | | (15 | ) | | (1 | ) | | (225 | ) |
| Taxes other than income taxes | (95 | ) | | (20 | ) | | (12 | ) | | (1 | ) | | (1 | ) | | (129 | ) |
| Other income (expense) | 11 |
| | 1 |
| | — |
| | — |
| | (1 | ) | | 11 |
|
| Interest charges | (50 | ) | | (19 | ) | | (8 | ) | | (18 | ) | | (2 | ) | | (97 | ) |
| Income taxes | (143 | ) | | (20 | ) | | (2 | ) | | (31 | ) | | (9 | ) | | (205 | ) |
| Net income (loss) | 235 |
| | 31 |
| | 2 |
| | 38 |
| | (16 | ) | | 290 |
|
Noncontrolling interests – preferred stock dividends | (1 | ) | | — |
| | — |
| | — |
| | (1 | ) | | (2 | ) |
| Net income (loss) attributable to Ameren common shareholders | $ | 234 |
| | $ | 31 |
| | $ | 2 |
| | $ | 38 |
| | $ | (17 | ) | | $ | 288 |
|
| Three Months 2016: | | | | | | | | | | | |
| Electric margins | $ | 862 |
| | $ | 379 |
| | $ | — |
| | $ | 108 |
| | $ | (7 | ) | | $ | 1,342 |
|
| Natural gas margins | 14 |
| | — |
| | 86 |
| | — |
| | — |
| | 100 |
|
| Other revenues | 1 |
| | — |
| | — |
| | — |
| | (1 | ) | | — |
|
| Other operations and maintenance | (220 | ) | | (132 | ) | | (52 | ) | | (17 | ) | | 10 |
| | (411 | ) |
| Depreciation and amortization | (130 | ) | | (57 | ) | | (13 | ) | | (10 | ) | | (1 | ) | | (211 | ) |
| Taxes other than income taxes | (96 | ) | | (20 | ) | | (10 | ) | | (1 | ) | | (2 | ) | | (129 | ) |
| Other income (expense) | 12 |
| | 2 |
| | (1 | ) | | — |
| | (3 | ) | | 10 |
|
| Interest charges | (53 | ) | | (17 | ) | | (8 | ) | | (17 | ) | | (2 | ) | | (97 | ) |
| Income (taxes) benefit | (148 | ) | | (62 | ) | | — |
| | (24 | ) | | 1 |
| | (233 | ) |
| Net income (loss) | 242 |
| | 93 |
| | 2 |
| | 39 |
| | (5 | ) | | 371 |
|
Noncontrolling interests – preferred stock dividends | (1 | ) | | — |
| | — |
| | — |
| | (1 | ) | | (2 | ) |
| Net income (loss) attributable to Ameren common shareholders | $ | 241 |
| | $ | 93 |
| | $ | 2 |
| | $ | 39 |
| | $ | (6 | ) | | $ | 369 |
|
| Nine Months 2017: | | | | | | | | | | | |
| Electric margins | $ | 1,962 |
| | $ | 834 |
| | $ | — |
| | $ | 326 |
| | $ | (24 | ) | | $ | 3,098 |
|
| Natural gas margins | 54 |
| | — |
| | 343 |
| | — |
| | (1 | ) | | 396 |
|
| Other revenues | — |
| | 1 |
| | — |
| | — |
| | (1 | ) | | — |
|
| Other operations and maintenance | (655 | ) | | (391 | ) | | (159 | ) | | (47 | ) | | 23 |
| | (1,229 | ) |
| Depreciation and amortization | (399 | ) | | (178 | ) | | (44 | ) | | (44 | ) | | (3 | ) | | (668 | ) |
| Taxes other than income taxes | (255 | ) | | (56 | ) | | (43 | ) | | (4 | ) | | (6 | ) | | (364 | ) |
| Other income (expense) | 30 |
| | 1 |
| | (2 | ) | | — |
| | (3 | ) | | 26 |
|
| Interest charges | (157 | ) | | (55 | ) | | (27 | ) | | (49 | ) | | (7 | ) | | (295 | ) |
| Income (taxes) benefit | (218 | ) | | (61 | ) | | (27 | ) | | (76 | ) | | 6 |
| | (376 | ) |
| Net income (loss) | 362 |
| | 95 |
| | 41 |
| | 106 |
| | (16 | ) | | 588 |
|
Noncontrolling interests – preferred dividends | (3 | ) | | (1 | ) | | (1 | ) | | — |
| | — |
| | (5 | ) |
| Net income (loss) attributable to Ameren common shareholders | $ | 359 |
| | $ | 94 |
| | $ | 40 |
| | $ | 106 |
| | $ | (16 | ) | | $ | 583 |
|
| Nine Months 2016: | | | | | | | | | | | |
| Electric margins | $ | 1,939 |
| | $ | 874 |
| | $ | — |
| | $ | 283 |
| | $ | (20 | ) | | $ | 3,076 |
|
| Natural gas margins | 57 |
| | — |
| | 336 |
| | — |
| | (1 | ) | | 392 |
|
| Other revenues | 1 |
| | — |
| | — |
| | — |
| | (1 | ) | | — |
|
| Other operations and maintenance | (670 | ) | | (399 | ) | | (153 | ) | | (47 | ) | | 23 |
| | (1,246 | ) |
| Depreciation and amortization | (384 | ) | | (169 | ) | | (40 | ) | | (30 | ) | | (5 | ) | | (628 | ) |
| Taxes other than income taxes | (252 | ) | | (54 | ) | | (42 | ) | | (3 | ) | | (7 | ) | | (358 | ) |
| Other income (expense) | 32 |
| | 5 |
| | (2 | ) | | 1 |
| | (3 | ) | | 33 |
|
| Interest charges | (158 | ) | | (54 | ) | | (26 | ) | | (43 | ) | | (6 | ) | | (287 | ) |
| Income (taxes) benefit | (215 | ) | | (80 | ) | | (28 | ) | | (63 | ) | | 30 |
| | (356 | ) |
| Net income | 350 |
| | 123 |
| | 45 |
| | 98 |
| | 10 |
| | 626 |
|
Noncontrolling interests – preferred dividends | (3 | ) | | (1 | ) | | (1 | ) | | — |
| | — |
| | (5 | ) |
| Net income attributable to Ameren common shareholders | $ | 347 |
| | $ | 122 |
| | $ | 44 |
| | $ | 98 |
| | $ | 10 |
| | $ | 621 |
|
Below is Ameren Illinois'Illinois’ table of income statement components by segment for the three and ninesix months ended SeptemberJune 30, 20172020 and 2016:2019:
| | | | | | | | | | | | | | | | | | | | | | | | | |
| Ameren
Illinois
Electric
Distribution | | Ameren
Illinois
Natural Gas | | Ameren
Illinois Transmission | | | | Ameren Illinois |
| Three Months 2020: | | | | | | | | | |
| Electric and natural gas margins | $ | 264 | | | $ | 104 | | | $ | 87 | | | | | $ | 455 | |
| | | | | | | | | |
| | | | | | | | | |
| Other operations and maintenance expenses | (118) | | | (52) | | | (12) | | | | | (182) | |
| Depreciation and amortization expenses | (71) | | | (20) | | | (16) | | | | | (107) | |
| Taxes other than income taxes | (19) | | | (13) | | | — | | | | | (32) | |
| Other income, net | 9 | | | 5 | | | 3 | | | | | 17 | |
| Interest charges | (18) | | | (10) | | | (10) | | | | | (38) | |
| Income taxes | (11) | | | (4) | | | (14) | | | | | (29) | |
| | | | | | | | | |
| | | | | | | | | |
| Net income | 36 | | | 10 | | | 38 | | | | | 84 | |
| Preferred stock dividends | — | | | (1) | | | — | | | | | (1) | |
| Net income attributable to common shareholder | $ | 36 | | | $ | 9 | | | $ | 38 | | | | | $ | 83 | |
| Three Months 2019: | | | | | | | | | |
| Electric and natural gas margins | $ | 267 | | | $ | 100 | | | $ | 66 | | | | | $ | 433 | |
| | | | | | | | | |
| | | | | | | | | |
| Other operations and maintenance expenses | (126) | | | (59) | | | (11) | | | | | (196) | |
| Depreciation and amortization expenses | (68) | | | (19) | | | (14) | | | | | (101) | |
| Taxes other than income taxes | (19) | | | (13) | | | — | | | | | (32) | |
| Other income, net | 10 | | | 3 | | | 2 | | | | | 15 | |
| Interest charges | (17) | | | (9) | | | (10) | | | | | (36) | |
| Income taxes | (10) | | | (1) | | | (9) | | | | | (20) | |
| | | | | | | | | |
| | | | | | | | | |
| Net income | 37 | | | 2 | | | 24 | | | | | 63 | |
| Preferred stock dividends | — | | | (1) | | | — | | | | | (1) | |
| | | | | | | | | |
| Net income attributable to common shareholder | $ | 37 | | | $ | 1 | | | $ | 24 | | | | | $ | 62 | |
| Six Months 2020: | | | | | | | | | |
| Electric and natural gas margins | $ | 544 | | | $ | 286 | | | $ | 161 | | | | | $ | 991 | |
| | | | | | | | | |
| | | | | | | | | |
| Other operations and maintenance expenses | (248) | | | (109) | | | (24) | | | | | (381) | |
| Depreciation and amortization expenses | (142) | | | (41) | | | (31) | | | | | (214) | |
| Taxes other than income taxes | (38) | | | (35) | | | (1) | | | | | (74) | |
| Other income, net | 16 | | | 7 | | | 5 | | | | | 28 | |
| Interest charges | (36) | | | (20) | | | (21) | | | | | (77) | |
| Income taxes | (22) | | | (23) | | | (23) | | | | | (68) | |
| | | | | | | | | |
| | | | | | | | | |
| Net income | 74 | | | 65 | | | 66 | | | | | 205 | |
| Preferred stock dividends | (1) | | | (1) | | | — | | | | | (2) | |
| Net income attributable to common shareholder | $ | 73 | | | $ | 64 | | | $ | 66 | | | | | $ | 203 | |
| Six Months 2019: | | | | | | | | | |
| Electric and natural gas margins | $ | 534 | | | $ | 286 | | | $ | 136 | | | | | $ | 956 | |
| | | | | | | | | |
| | | | | | | | | |
| Other operations and maintenance expenses | (245) | | | (118) | | | (24) | | | | | (387) | |
| Depreciation and amortization expenses | (136) | | | (39) | | | (27) | | | | | (202) | |
| Taxes other than income taxes | (39) | | | (37) | | | (1) | | | | | (77) | |
| Other income, net | 16 | | | 6 | | | 4 | | | | | 26 | |
| Interest charges | (35) | | | (19) | | | (19) | | | | | (73) | |
| Income taxes | (21) | | | (20) | | | (18) | | | | | (59) | |
| | | | | | | | | |
| | | | | | | | | |
| Net income | 74 | | | 59 | | | 51 | | | | | 184 | |
| Preferred stock dividends | (1) | | | (1) | | | — | | | | | (2) | |
| | | | | | | | | |
| Net income attributable to common shareholder | $ | 73 | | | $ | 58 | | | $ | 51 | | | | | $ | 182 | |
|
| | | | | | | | | | | | | | | |
| | Ameren Illinois Electric Distribution | | Ameren Illinois Natural Gas | | Ameren Illinois Transmission | | Total |
| Three Months 2017: | | | | | | | |
| Electric and natural gas margins | $ | 267 |
| | $ | 91 |
| | $ | 72 |
| | $ | 430 |
|
| Other operations and maintenance | (118 | ) | | (52 | ) | | (13 | ) | | (183 | ) |
| Depreciation and amortization | (60 | ) | | (15 | ) | | (11 | ) | | (86 | ) |
| Taxes other than income taxes | (20 | ) | | (12 | ) | | (1 | ) | | (33 | ) |
| Other income | 1 |
| | — |
| | — |
| | 1 |
|
| Interest charges | (19 | ) | | (8 | ) | | (9 | ) | | (36 | ) |
| Income taxes | (20 | ) | | (2 | ) | | (16 | ) | | (38 | ) |
| Net income | 31 |
| | 2 |
| | 22 |
| | 55 |
|
| Preferred stock dividends | — |
| | — |
| | — |
| | — |
|
| Net income attributable to common shareholder | $ | 31 |
| | $ | 2 |
| | $ | 22 |
| | $ | 55 |
|
| Three Months 2016: | | | | | | | |
| Electric and natural gas margins | $ | 379 |
| | $ | 86 |
| | $ | 73 |
| | $ | 538 |
|
| Other operations and maintenance | (132 | ) | | (52 | ) | | (14 | ) | | (198 | ) |
| Depreciation and amortization | (57 | ) | | (13 | ) | | (10 | ) | | (80 | ) |
| Taxes other than income taxes | (20 | ) | | (10 | ) | | — |
| | (30 | ) |
| Other income (expense) | 2 |
| | (1 | ) | | — |
| | 1 |
|
| Interest charges | (17 | ) | | (8 | ) | | (10 | ) | | (35 | ) |
| Income taxes | (62 | ) | | — |
| | (15 | ) | | (77 | ) |
| Net income | 93 |
| | 2 |
| | 24 |
| | 119 |
|
| Preferred stock dividends | — |
| | — |
| | — |
| | — |
|
| Net income attributable to common shareholder | $ | 93 |
| | $ | 2 |
| | $ | 24 |
| | $ | 119 |
|
| Nine Months 2017: | | | | | | | |
| Electric and natural gas margins | $ | 834 |
| | $ | 343 |
| | $ | 197 |
| | $ | 1,374 |
|
| Other revenues | 1 |
| | — | | — | | 1 |
|
| Other operations and maintenance | (391 | ) | | (159 | ) | | (40 | ) | | (590 | ) |
| Depreciation and amortization | (178 | ) | | (44 | ) | | (32 | ) | | (254 | ) |
| Taxes other than income taxes | (56 | ) | | (43 | ) | | (2 | ) | | (101 | ) |
| Other income (expense) | 1 |
| | (2 | ) | | — |
| | (1 | ) |
| Interest charges | (55 | ) | | (27 | ) | | (27 | ) | | (109 | ) |
| Income taxes | (61 | ) | | (27 | ) | | (39 | ) | | (127 | ) |
| Net income | 95 |
| | 41 |
| | 57 |
| | 193 |
|
| Preferred stock dividends | (1 | ) | | (1 | ) | | — |
| | (2 | ) |
| Net income attributable to common shareholder | $ | 94 |
| | $ | 40 |
| | $ | 57 |
| | $ | 191 |
|
| Nine Months 2016: | | | | | | | |
| Electric and natural gas margins | $ | 874 |
| | $ | 336 |
| | $ | 187 |
| | $ | 1,397 |
|
| Other operations and maintenance | (399 | ) | | (153 | ) | | (40 | ) | | (592 | ) |
| Depreciation and amortization | (169 | ) | | (40 | ) | | (28 | ) | | (237 | ) |
| Taxes other than income taxes | (54 | ) | | (42 | ) | | (2 | ) | | (98 | ) |
| Other income (expense) | 5 |
| | (2 | ) | | 1 |
| | 4 |
|
| Interest charges | (54 | ) | | (26 | ) | | (25 | ) | | (105 | ) |
| Income taxes | (80 | ) | | (28 | ) | | (36 | ) | | (144 | ) |
| Net income | 123 |
| | 45 |
| | 57 |
| | 225 |
|
| Preferred stock dividends | (1 | ) | | (1 | ) | | — |
| | (2 | ) |
| Net income attributable to common shareholder | $ | 122 |
| | $ | 44 |
| | $ | 57 |
| | $ | 223 |
|
Electric and Natural Gas Margins
The following table presents the favorable (unfavorable) variations by Ameren segment for electric and natural gas margins for the three and nine months ended September 30, 2017, compared with the year-ago periods. Electric margins are defined as electric revenues less fuel and purchased power costs. Natural gas margins are defined as natural gas revenues less natural gas purchased for resale. We consider electric and natural gas margins useful measures to analyze the change in profitability of our electric and natural gas operations between periods. We have included the analysis below as ato complement to the financial information we provide in accordance with GAAP. However, these margins may not be a presentation defined under GAAP, and they may not be comparable to other companies’ presentations or more useful than the GAAP information we provide elsewhere in this report.
|
| | | | | | | | | | | | | | | | | | | | | | | | |
| Three Months | Ameren
Missouri | | Ameren Illinois Electric Distribution | | Ameren Illinois Natural Gas | | Ameren Transmission(a) | | Other /
Intersegment
Eliminations | | Ameren |
| Electric revenue change: | | | | | | | | | | | |
Effect of weather (estimate)(b) | $ | (33 | ) | | $ | (9 | ) | | $ | — |
| | $ | — |
| | $ | — |
| | $ | (42 | ) |
Base rates (estimate)(c) | 29 |
| | 10 |
| | — |
| | 11 |
| | — |
| | 50 |
|
FEJA impact on IEIMA – timing of revenue recognition
| — |
| | (94 | ) | | — |
| | — |
| | — |
| | (94 | ) |
| Recovery of power restoration efforts provided to other utilities | 5 |
| | 1 |
| | — |
| | — |
| | — |
| | 6 |
|
| Sales volume (excluding the effect of weather and the New Madrid Smelter) | 8 |
| | — |
| | — |
| | — |
| | — |
| | 8 |
|
| New Madrid Smelter revenues | (1 | ) | | — |
| | — |
| | — |
| | — |
| | (1 | ) |
| MEEIA 2013 performance incentive | (19 | ) | | — |
| | — |
| | — |
| | — |
| | (19 | ) |
| Off-system sales | (38 | ) | | — |
| | — |
| | — |
| | — |
| | (38 | ) |
| Transmission services revenues | 2 |
| | — |
| | — |
| | — |
| | — |
| | 2 |
|
| Other | (8 | ) | | (4 | ) | | — |
| | — |
| | 2 |
| | (10 | ) |
Cost recovery mechanisms – offset in fuel and purchased power:(d) | | | | | | | | | | | |
| Power supply costs | — |
| | (7 | ) | | — |
| | — |
| | — |
| | (7 | ) |
| Renewable energy adjustment | — |
| | 4 |
| | — |
| | — |
| | — |
| | 4 |
|
| Zero-emission credits | — |
| | 21 |
| | — |
| | — |
| | — |
| | 21 |
|
| Recovery of FAC under-recovery | 3 |
| | — |
| | — |
| | — |
| | — |
| | 3 |
|
Other cost recovery mechanisms:(e) | | | | | | | | | | | |
| Bad debt, energy efficiency programs, and remediation cost riders | — |
| | (20 | ) | | — |
| | — |
| | — |
| | (20 | ) |
| MEEIA program costs | 6 |
| | — |
| | — |
| | — |
| | — |
| | 6 |
|
| Total electric revenue change | $ | (46 | ) | | $ | (98 | ) | | $ | — |
| | $ | 11 |
| | $ | 2 |
| | $ | (131 | ) |
| Fuel and purchased power change: | | | | | | | | | | | |
| Energy costs (excluding the effect of weather and the New Madrid Smelter) | $ | 37 |
| | $ | — |
| | $ | — |
| | $ | — |
| | $ | — |
| | $ | 37 |
|
| New Madrid Smelter energy costs | (6 | ) | | — |
| | — |
| | — |
| | — |
| | (6 | ) |
Effect of weather (estimate)(b) | 7 |
| | 2 |
| | — |
| | — |
| | — |
| | 9 |
|
| Effect of lower net energy costs included in base rates | 20 |
| | — |
| | — |
| | — |
| | — |
| | 20 |
|
| Transmission services charges | (5 | ) | | — |
| | — |
| | — |
| | — |
| | (5 | ) |
| Other | (9 | ) | | 2 |
| | — |
| | — |
| | (5 | ) | | (12 | ) |
Cost recovery mechanisms – offset in electric revenue:(d) | | | | | | | | |
|
| | |
| Power supply costs | — |
| | 7 |
| | — |
| | — |
| | — |
| | 7 |
|
| Renewable energy adjustment | — |
| | (4 | ) | | — |
| | — |
| | — |
| | (4 | ) |
| Zero-emission credits | — |
| | (21 | ) | | — |
| | — |
| | — |
| | (21 | ) |
| Recovery of FAC under-recovery | (3 | ) | | — |
| | — |
| | ��� |
| | — |
| | (3 | ) |
| Total fuel and purchased power change | $ | 41 |
| | $ | (14 | ) | | $ | — |
| | $ | — |
| | $ | (5 | ) | | $ | 22 |
|
| Net change in electric margins | $ | (5 | ) | | $ | (112 | ) | | $ | — |
| | $ | 11 |
| | $ | (3 | ) | | $ | (109 | ) |
| Natural gas revenue change: | | | | | | | | | | | |
| QIP rider | — |
| | — |
| | 3 |
| | — |
| | — |
| | 3 |
|
| Other | — |
| | — |
| | (1 | ) | | — |
| | — |
| | (1 | ) |
Purchased natural gas costs – offset in natural gas purchased for resale(d) | (2 | ) | | — |
| | (7 | ) | | — |
| | — |
| | (9 | ) |
Other cost recovery mechanisms:(e) | | | | | | | | | | | |
| Bad debt, energy efficiency programs, and remediation cost riders | — |
| | — |
| | 2 |
| | — |
| | — |
| | 2 |
|
| Gross receipts tax | (1 | ) | | — |
| | 1 |
| — |
| — |
| | — |
| | — |
|
| Total natural gas revenue change | $ | (3 | ) | | $ | — |
| | $ | (2 | ) | | $ | — |
| | $ | — |
| | $ | (5 | ) |
| Natural gas purchased for resale change: | | | | | | | | | | | |
Purchased natural gas costs – offset in natural gas revenue(d) | 2 |
| | — |
| | 7 |
| | — |
| | — |
| | 9 |
|
| Total natural gas purchased for resale change | $ | 2 |
| | $ | — |
| | $ | 7 |
| | $ | — |
| | $ | — |
| | $ | 9 |
|
| Net change in natural gas margins | $ | (1 | ) | | $ | — |
| | $ | 5 |
| | $ | — |
| | $ | — |
| | $ | 4 |
|
|
| | | | | | | | | | | | | | | | | | | | | | | |
| Nine Months | Ameren
Missouri | | Ameren Illinois Electric Distribution | | Ameren Illinois Natural Gas | | Ameren Transmission(a) | | Other /
Intersegment
Eliminations | | Ameren |
| Electric revenue change: | | | | | | | | | | | |
Effect of weather (estimate)(b) | $ | (72 | ) | | $ | (7 | ) | | $ | — |
| | $ | — |
| | $ | — |
| | $ | (79 | ) |
Base rates (estimate)(c) | 53 |
| | 31 |
| | — |
| | 43 |
| | — |
| | 127 |
|
FEJA impact on IEIMA – timing of revenue recognition
| — |
| | (47 | ) | | — |
| | — |
| | — |
| | (47 | ) |
| Recovery of power restoration efforts provided to other utilities | 5 |
| | 1 |
| | — |
| | — |
| | — |
| | 6 |
|
| Sales volume (excluding the effect of weather and the New Madrid Smelter) | (4 | ) | | — |
| | — |
| | — |
| | — |
| | (4 | ) |
| New Madrid Smelter revenues | (9 | ) | | — |
| | — |
| | — |
| | — |
| | (9 | ) |
| MEEIA 2013 performance incentive | (19 | ) | | — |
| | — |
| | — |
| | — |
| | (19 | ) |
| Off-system sales | 94 |
| | — |
| | — |
| | — |
| | — |
| | 94 |
|
| Transmission services revenues | 3 |
| | — |
| | — |
| | — |
| | — |
| | 3 |
|
| Other | 8 |
| | (4 | ) | | — |
| | — |
| | (1 | ) | | 3 |
|
Cost recovery mechanisms – offset in fuel and purchased power:(d) | | | | | | | | | | | |
| Power supply costs | — |
| | (18 | ) | | — |
| | — |
| | — |
| | (18 | ) |
| Renewable energy adjustment | — |
| | 4 |
| | — |
| | — |
| | — |
| | 4 |
|
| Zero-emission credits | — |
| | 21 |
| | — |
| | — |
| | — |
| | 21 |
|
| Transmission services recovery mechanism | — |
| | 1 |
| | — |
| | — |
| | — |
| | 1 |
|
| Recovery of FAC under-recovery | (7 | ) | | — |
| | — |
| | — |
| | — |
| | (7 | ) |
Other cost recovery mechanisms:(e) | | | | | | | | | | | |
| Bad debt, energy efficiency programs, and remediation cost riders | — |
| | (17 | ) | | — |
| | — |
| | — |
| | (17 | ) |
| Gross receipts tax | 1 |
| | — |
| | — |
| | — |
| | — |
| | 1 |
|
| MEEIA program costs | 22 |
| | — |
| | — |
| | — |
| | — |
| | 22 |
|
| Total electric revenue change | $ | 75 |
| | $ | (35 | ) | | $ | — |
| | $ | 43 |
| | $ | (1 | ) | | $ | 82 |
|
| Fuel and purchased power change: | | | | | | | | | | | |
| Energy costs (excluding the effect of weather and the New Madrid Smelter) | $ | (91 | ) | | $ | — |
| | $ | — |
| | $ | — |
| | $ | — |
| | $ | (91 | ) |
| New Madrid Smelter energy costs | 1 |
| | — |
| | — |
| | — |
| | — |
| | 1 |
|
Effect of weather (estimate)(b) | 16 |
| | — |
| | — |
| | — |
| | — |
| | 16 |
|
| Effect of lower net energy costs included in base rates | 32 |
| | — |
| | — |
| | — |
| | — |
| | 32 |
|
| Transmission service charges | (7 | ) | | — |
| | — |
| | — |
| | — |
| | (7 | ) |
| Other | (10 | ) | | 3 |
| | — |
| | — |
| | (3 | ) | | (10 | ) |
Cost recovery mechanisms – offset in electric revenue:(d) | | | | | | | | |
|
| | |
| Power supply costs | — |
| | 18 |
| | — |
| | — |
| | — |
| | 18 |
|
| Renewable energy adjustment | — |
| | (4 | ) | | — |
| | — |
| | — |
| | (4 | ) |
| Zero-emission credits | — |
| | (21 | ) | | — |
| | — |
| | — |
| | (21 | ) |
| Transmission services recovery mechanism | — |
| | (1 | ) | | — |
| | — |
| | — |
| | (1 | ) |
| Recovery of FAC under-recovery | 7 |
| | — |
| | — |
| | — |
| | — |
| | 7 |
|
| Total fuel and purchased power change | $ | (52 | ) | | $ | (5 | ) | | $ | — |
| | $ | — |
| | $ | (3 | ) | | $ | (60 | ) |
| Net change in electric margins | $ | 23 |
| | $ | (40 | ) | | $ | — |
| | $ | 43 |
| | $ | (4 | ) | | $ | 22 |
|
| Natural gas revenue change: | | | | | | | | | | | |
Effect of weather (estimate)(b) | $ | (6 | ) | | $ | — |
| | $ | — |
| | $ | — |
| | $ | — |
| | $ | (6 | ) |
| QIP rider | — |
| | — |
| | 6 |
| | — |
| | — |
| | 6 |
|
| Other | (1 | ) | | — |
| | (2 | ) | | — |
| | — |
| | (3 | ) |
Purchased natural gas costs – offset in natural gas purchased for resale(d) | 1 |
| | — |
| | (27 | ) | | — |
| | — |
| | (26 | ) |
Other cost recovery mechanisms:(e) | | | | | | | | | | | |
| Bad debt, energy efficiency programs, and remediation cost riders | — |
| | — |
| | 3 |
| | — |
| | — |
| | 3 |
|
| Gross receipts tax | (1 | ) | | — |
| | — |
| | — |
| | — |
| | (1 | ) |
| Total natural gas revenue change | $ | (7 | ) | | $ | — |
| | $ | (20 | ) | | $ | — |
| | $ | — |
| | $ | (27 | ) |
| Natural gas purchased for resale change: | | | | | | | | | | | |
Effect of weather (estimate)(b) | $ | 5 |
| | $ | — |
| | $ | — |
| | $ | — |
| | $ | — |
| | $ | 5 |
|
Purchased natural gas costs – offset in natural gas revenue(d) | (1 | ) | | — |
| | 27 |
| | — |
| | — |
| | 26 |
|
| Total natural gas purchased for resale change | $ | 4 |
| | $ | — |
| | $ | 27 |
| | $ | — |
| | $ | — |
| | $ | 31 |
|
| Net change in natural gas margins | $ | (3 | ) | | $ | — |
| | $ | 7 |
| | $ | — |
| | $ | — |
| | $ | 4 |
|
| | | | | | | | | | | | | | | | | | | | |
(a) | Includes a decrease in transmission margins of $1 million and an increase of $10 million for the three- and nine-month periods, respectively, at Ameren Illinois.Total by Segment(a) |
| Increase (Decrease) by Segment | | | |
(b) | Represents the estimated variation resulting primarily from changes in cooling and heating degree-days on electric and natural gas demand compared with the prior year; this variation is based on temperature readings from the National Oceanic and Atmospheric Administration weather stations at local airports in our service territories. Beginning in 2017, FEJA eliminated the impact | | Overall Ameren Increase of weather on$29 Million (QTD YoY) | | Overall Ameren Illinois Electric Distribution’s electric margins.Increase of $9 Million (YTD YoY) | |
| | | | | | |
(a)Includes other/intersegment eliminations of $(6) million and $(7) million in the three months ended June 30, 2020,and 2019, respectively. Also includes other/intersegment eliminations of $(15) million and $(15) million in the six months ended June 30, 2020,and 2019, respectively.
| | | | | | | | | | | | | | | | | | | | | | | | | | | | | |
(c) | For | Ameren Missouri | | Ameren Illinois Electric Distribution and | | Ameren Transmission base rates include increases or decreases to operating revenues related to the revenue requirement reconciliation adjustment under formula rates. | | Other/Intersegment Eliminations | |
Natural Gas Margins
| | | | | | | | | | | | | | | | | | | | |
(d) | Electric and natural gas revenue changes are offsetTotal by corresponding changes in Fuel, Purchased power, and Natural gas purchased for resale, resulting in no change to electric and natural gas margins.Segment |
| Increase (Decrease) by Segment | | | |
(e) | See Other Operations and Maintenance Expenses or Taxes Other Than Income Taxes in this section for the related offsetting increase or decrease to expense. These items have no overall impact on earnings. | | Overall Ameren Increase of $2 Million (QTD YoY) | | Overall Ameren Increase of $2 Million (YTD YoY) | |
| | | | | | |
| | | | | | | | | | | | | | | | | | | | | | | |
| | Ameren Missouri | | Ameren Illinois Natural Gas | | | |
The following tables present the favorable (unfavorable) variations by Ameren segment for electric and natural gas margins for the three and six months ended June 30, 2020, compared with the year-ago periods.
| | | | | | | | | | | | | | | | | | | | | | | | | | | | | | | | | | | | | | | | |
| | | | | | | | | | | | | | | | |
| Three Months | Ameren Missouri | | Ameren Illinois
Electric Distribution | | Ameren Illinois
Natural Gas | | Ameren Transmission(a) | | Other /Intersegment Eliminations | | Ameren | | | | | |
| Electric revenue change: | | | | | | | | | | | | | | | | |
Effect of weather (estimate)(b) | $ | 21 | | | $ | — | | | $ | — | | | $ | — | | | $ | — | | | $ | 21 | | | | | | |
Base rates (estimate)(c) | (18) | | | (7) | | | — | | | 27 | | | — | | | 2 | | | | | | |
| | | | | | | | | | | | | | | | |
| Sales volumes and changes in customer usage patterns (excluding the estimated effects of weather and MEEIA) | (25) | | | — | | | — | | | — | | | — | | | (25) | | | | | | |
| | | | | | | | | | | | | | | | |
| Off-system sales | 21 | | | — | | | — | | | — | | | — | | | 21 | | | | | | |
| Energy-efficiency program investments | — | | | 3 | | | — | | | — | | | — | | | 3 | | | | | | |
| Other | (5) | | | — | | | — | | | — | | | 1 | | | (4) | | | | | | |
Cost recovery mechanisms – offset in fuel and purchased power(d) | 2 | | | (3) | | | — | | | — | | | — | | | (1) | | | | | | |
Other cost recovery mechanisms(e) | 2 | | | — | | | — | | | — | | | — | | | 2 | | | | | | |
| Total electric revenue change | $ | (2) | | | $ | (7) | | | $ | — | | | $ | 27 | | | $ | 1 | | | $ | 19 | | | | | | |
| Fuel and purchased power change: | | | | | | | | | | | | | | | | |
| Energy costs (excluding the estimated effect of weather) | $ | (15) | | | $ | — | | | $ | — | | | $ | — | | | $ | — | | | $ | (15) | | | | | | |
Effect of weather (estimate)(b) | (4) | | | — | | | — | | | — | | | — | | | (4) | | | | | | |
| Effect of lower net energy costs included in base rates | 29 | | | | | | | | | — | | | 29 | | | | | | |
| Transmission services charges | (1) | | | — | | | — | | | — | | | — | | | (1) | | | | | | |
| Other | (1) | | | 1 | | | — | | | — | | | — | | | — | | | | | | |
Cost recovery mechanisms – offset in electric revenue(d) | (2) | | | 3 | | | — | | | — | | | — | | | 1 | | | | | | |
| Total fuel and purchased power change | $ | 6 | | | $ | 4 | | | $ | — | | | $ | — | | | $ | — | | | $ | 10 | | | | | | |
| Net change in electric margins | $ | 4 | | | $ | (3) | | | $ | — | | | $ | 27 | | | $ | 1 | | | $ | 29 | | | | | | |
| Natural gas revenue change: | | | | | | | | | | | | | | | | |
Effect of weather (estimate)(b) | $ | — | | | $ | — | | | $ | — | | | $ | — | | | $ | — | | | $ | — | | | | | | |
| | | | | | | | | | | | | | | | |
| Change in rate design | (1) | | | — | | | — | | | — | | | — | | | (1) | | | | | | |
| QIP rider | — | | | — | | | 5 | | | — | | | — | | | 5 | | | | | | |
| | | | | | | | | | | | | | | | |
| Other | (1) | | | — | | | (1) | | | — | | | — | | | (2) | | | | | | |
Cost recovery mechanisms – offset in natural gas purchased for resale(d) | (2) | | | — | | | — | | | — | | | — | | | (2) | | | | | | |
Other cost recovery mechanisms(e) | — | | | — | | | — | | | — | | | — | | | — | | | | | | |
| Total natural gas revenue change | $ | (4) | | | $ | — | | | $ | 4 | | | $ | — | | | $ | — | | | $ | — | | | | | | |
| Natural gas purchased for resale change: | | | | | | | | | | | | | | | | |
Effect of weather (estimate)(b) | $ | — | | | $ | — | | | $ | — | | | $ | — | | | $ | — | | | $ | — | | | | | | |
Cost recovery mechanisms – offset in natural gas revenue(d) | 2 | | | — | | | — | | | — | | | — | | | 2 | | | | | | |
| Total natural gas purchased for resale change | $ | 2 | | | $ | — | | | $ | — | | | $ | — | | | $ | — | | | $ | 2 | | | | | | |
| Net change in natural gas margins | $ | (2) | | | $ | — | | | $ | 4 | | | $ | — | | | $ | — | | | $ | 2 | | | | | | |
| | | | | | | | | | | | | | | | | | | | | | | | | | | | | | | | | | | | | | | | |
| | | | | | | | | | | | | | | | |
| Six Months | Ameren Missouri | | Ameren Illinois
Electric Distribution | | Ameren Illinois
Natural Gas | | Ameren Transmission(a) | | Other /Intersegment Eliminations | | Ameren | | | | | |
| Electric revenue change: | | | | | | | | | | | | | | | | |
Effect of weather (estimate)(b) | $ | (6) | | | $ | — | | | $ | — | | | $ | — | | | $ | — | | | $ | (6) | | | | | | |
Base rates (estimate)(c) | (18) | | | 4 | | | — | | | 36 | | | — | | | 22 | | | | | | |
| | | | | | | | | | | | | | | | |
| Sales volumes and changes in customer usage patterns (excluding the estimated effects of weather and MEEIA) | (24) | | | — | | | — | | | — | | | — | | | (24) | | | | | | |
| MEEIA 2013 and MEEIA 2016 performance incentives | (20) | | | — | | | — | | | — | | | — | | | (20) | | | | | | |
| Off-system sales | (1) | | | — | | | — | | | — | | | — | | | (1) | | | | | | |
| Energy-efficiency program investments | — | | | 6 | | | — | | | — | | | — | | | 6 | | | | | | |
| Other | (4) | | | (1) | | | — | | | — | | | — | | | (5) | | | | | | |
Cost recovery mechanisms – offset in fuel and purchased power(d) | (1) | | | (12) | | | — | | | — | | | — | | | (13) | | | | | | |
Other cost recovery mechanisms(e) | (1) | | | (1) | | | — | | | — | | | — | | | (2) | | | | | | |
| Total electric revenue change | $ | (75) | | | $ | (4) | | | $ | — | | | $ | 36 | | | $ | — | | | $ | (43) | | | | | | |
| Fuel and purchased power change: | | | | | | | | | | | | | | | | |
| Energy costs (excluding the estimated effect of weather) | $ | 9 | | | $ | — | | | $ | — | | | $ | — | | | $ | — | | | $ | 9 | | | | | | |
Effect of weather (estimate)(b) | 4 | | | — | | | — | | | — | | | — | | | 4 | | | | | | |
| Effect of lower net energy costs included in base rates | 29 | | | — | | | — | | | — | | | — | | | 29 | | | | | | |
| Transmission services charges | (3) | | | — | | | — | | | — | | | — | | | (3) | | | | | | |
| Other | (2) | | | 2 | | | — | | | — | | | — | | | — | | | | | | |
Cost recovery mechanisms – offset in electric revenue(d) | 1 | | | 12 | | | — | | | — | | | — | | | 13 | | | | | | |
| Total fuel and purchased power change | $ | 38 | | | $ | 14 | | | $ | — | | | $ | — | | | $ | — | | | $ | 52 | | | | | | |
| Net change in electric margins | $ | (37) | | | $ | 10 | | | $ | — | | | $ | 36 | | | $ | — | | | $ | 9 | | | | | | |
| Natural gas revenue change: | | | | | | | | | | | | | | | | |
Effect of weather (estimate)(b) | $ | (1) | | | $ | — | | | $ | — | | | $ | — | | | $ | — | | | $ | (1) | | | | | | |
| | | | | | | | | | | | | | | | |
| Change in rate design | 3 | | | — | | | — | | | — | | | — | | | 3 | | | | | | |
| QIP rider | — | | | — | | | 10 | | | — | | | — | | | 10 | | | | | | |
| | | | | | | | | | | | | | | | |
| Other | — | | | — | | | (2) | | | — | | | — | | | (2) | | | | | | |
Cost recovery mechanisms – offset in natural gas purchased for resale(d) | (11) | | | — | | | (45) | | | — | | | — | | | (56) | | | | | | |
Other cost recovery mechanisms(e) | — | | | — | | | (8) | | | — | | | — | | | (8) | | | | | | |
| Total natural gas revenue change | $ | (9) | | | $ | — | | | $ | (45) | | | $ | — | | | $ | — | | | $ | (54) | | | | | | |
| Natural gas purchased for resale change: | | | | | | | | | | | | | | | | |
Effect of weather (estimate)(b) | $ | — | | | $ | — | | | $ | — | | | $ | — | | | $ | — | | | $ | — | | | | | | |
Cost recovery mechanisms – offset in natural gas revenue(d) | 11 | | | — | | | 45 | | | — | | | — | | | 56 | | | | | | |
| Total natural gas purchased for resale change | $ | 11 | | | $ | — | | | $ | 45 | | | $ | — | | | $ | — | | | $ | 56 | | | | | | |
| Net change in natural gas margins | $ | 2 | | | $ | — | | | $ | — | | | $ | — | | | $ | — | | | $ | 2 | | | | | | |
| | | | | | | | | | | | | | | | |
(a)Includes an increase in transmission margins of $21 million and $25 million at Ameren Illinois for the three and six months ended June 30, 2020, compared with the year-ago periods.
(b)Represents the estimated variation resulting primarily from changes in cooling and heating degree-days on electric and natural gas demand compared with the year-ago periods; this variation is based on temperature readings from the National Oceanic and Atmospheric Administration weather stations at local airports in our service territories.
(c)For Ameren Illinois Electric Distribution and Ameren Transmission, base rates include increases or decreases to operating revenues related to the revenue requirement reconciliation adjustment under formula rates. For Ameren Missouri, base rates exclude an increase of $12 million for the recovery of lost electric margins for the three and six months ended June 30, 2020, compared with the year-ago periods, resulting from the MEEIA 2016 and 2019 customer energy-efficiency programs. This amount is included in the “sales volumes and changes in customer usage patterns (excluding the estimated effects of weather and MEEIA)” line item.
(d)Electric and natural gas revenue changes are offset by corresponding changes in “Fuel,” “Purchased power,” and “Natural gas purchased for resale” on the statement of income, resulting in no change to electric and natural gas margins.
(e)Offsetting expense increases or decreases are reflected in “Other operations and maintenance,” “Depreciation and amortization,” or in “Taxes other than income taxes,” within the “Operating Expenses” section of the statement of income. These items have no overall impact on earnings.
Ameren
Ameren'sAmeren’s electric margins decreased $109increased $29 million, or 8%3%, for the three months ended SeptemberJune 30, 2017,2020, compared with the year-ago period, primarily because of decreasedincreased margins at Ameren Illinois Electric Distribution.Transmission. Ameren’s electric margins increased $22$9 million, or less than 1%, for the ninesix months ended SeptemberJune 30, 2017,2020, compared with the year-ago period, primarily because of increased margins at Ameren Transmission and Ameren Missouri,Illinois Electric Distribution, partially offset by decreased margins at Ameren Illinois Electric Distribution.Missouri, as discussed below.
Ameren'sAmeren’s natural gas margins were comparable between periods, as discussed below.
Ameren Transmission
Ameren Transmission’s margins increased $4$27 million, or 4%25%, and $4$36 million, or 1%16%, for the three and ninesix months ended SeptemberJune 30, 2017, respectively, compared with the year-ago periods, primarily because of increased margins at Ameren Illinois Natural Gas, partially offset by decreased margins at Ameren Missouri.
Ameren Transmission
Ameren Transmission's margins increased $11 million, or 10%, and $43 million, or 15%, for the three and nine months ended September 30, 2017,2020, respectively, compared with the year-ago periods. Margins were favorably affected by increased capital investment, as evidenced by a 22%13% increase in rate base used to calculate the revenue requirement, at September 30, 2017, comparedand the result of a May 2020 FERC order, which increased the ROE related to September 30, 2016, as well as higher recoverable costs for the three and nine months ended September 30, 2017,November 2013 complaint case, compared with the year-ago periods, under forward-looking formula ratemaking. Margins were unfavorably affected for the threeROE set by a November 2019 FERC order, and nine months ended September 30, 2017, compared with the year-ago periods, by the absence of a temporarily higher allowed return on common equity of 12.38% for nearly four months in 2016 as a result of the expiration of the refund period indismissed the February 2015 complaint case. See Note 2 – Rate and Regulatory Matters under Part I, Item 1, of this report for additional information regarding the FERC complaint cases.
Ameren Missouri
Ameren Missouri’s electric margins increased $4 million, or 1%, and decreased $37 million, or 3%, for the three and six months ended June 30, 2020, respectively, compared with the year-ago periods.
The following items had an unfavorable effect on Ameren Missouri’s electric margins for the three and six months ended June 30, 2020, compared with the year-ago periods (except when a specific period is referenced):
•Excluding the estimated effects of weather and the MEEIA 2016 and 2019 customer energy-efficiency programs, electric revenues decreased an estimated $25 million and $24 million, respectively. The decrease was primarily due to a decrease in sales volumes (-$17 million and -$18 million, respectively), which were unfavorably affected by the COVID-19 pandemic, and a decrease in the average retail price per kilowatthour due to changes in customer usage patterns and shifts in commercial and industrial usage between rate classes (-$8 million and -$6 million, respectively). While the MEEIA 2016 and 2019 customer energy-efficiency programs reduced retail sales volumes, the recovery of lost electric margins under the MEEIA ensured that electric margins were not affected.
•The absence of revenues associated with MEEIA 2013 and 2016 performance incentives in 2020, which were recognized in the first quarter of 2019, decreased revenues $20 million for the six months ended June 30, 2020. See Note 2 – Rate and Regulatory Matters under Part 1,I, Item 1 of this report for information regarding the allowed return on common equity for FERC-regulated transmission rate base.MEEIA 2013 and MEEIA 2016 performance incentives.
Ameren Missouri
Ameren Missouri's electric margins decreased $5 million, or 1%, for the three months ended September 30, 2017, compared with the year-ago period. Ameren Missouri’s electric margins increased $23 million, or 1%, for the nine months ended September 30, 2017, compared with the year-ago period. Ameren Missouri’s natural gas margins were comparable for the three months ended September 30, 2017, compared with the year-ago period. Ameren Missouri’s natural gas margins decreased $3 million, or 5%, for the nine months ended September 30, 2017, compared with the year-ago period.
The following items had a favorable effect on Ameren Missouri'sMissouri’s electric margins for the three and ninesix months ended SeptemberJune 30, 2017,2020, compared with the year-ago periods (except wherewhen a specific period is referenced):
Higher•Summer temperatures were warmer as cooling degree days increased 5% and spring temperatures were colder as heating degree days increased 48% for the three months ended June 30, 2020. The aggregate effect of weather increased margins an estimated $17 million. The change in margins due to weather is the sum of the effect of weather (estimate) on electric revenues (+$21 million) and the effect of weather (estimate) on fuel and purchased power (-$4 million) in the table above.
•Lower net energy costs included in base rates partially offset by lower electric base rates effective April 1, 2017, as a result of the March 20172020 electric rate order (effective April 1st) increased margins by an estimated $49$11 million and $85 million, respectively.for the three months ended June 30, 2020. The change in electric base rates is the sum of the change in base rates (estimate) (+(-$29 million and +$53 million, respectively)18 million) and the effect of lower net energy costs included in base rates (+$2029 million) in the table above.
•Net energy costs increased margins $6 million and +$32$8 million, respectively, as a result of decreased sales volumes, which were reduced by the COVID-19 pandemic. The change in net energy costs is the sum of the effect of revenue change in off-system sales (+$21 million and -$1 million, respectively), and the effect of the change in energy costs (-$15 million and $9 million, respectively) in the Electric and Natural Gas Margins table above.
ExcludingAmeren Missouri’s natural gas margins were comparable between periods.
Ameren Illinois
Ameren Illinois’ electric margins increased $18 million, or 5%, and $35 million, or 5%, for the estimated effect of weather, residential sales volumesthree and six months ended June 30, 2020, respectively, compared with the year-ago periods, driven by increased by less than 1%margins at Ameren Illinois Transmission in both periods and increased margins at Ameren Illinois Electric Distribution in the six months ended June 30, 2020. Ameren Illinois Natural Gas’ margins increased $4 million, or 4%, for the three months ended SeptemberJune 30, 2017,2020, compared with the year-ago period. Ameren Illinois Natural Gas’ margins were comparable between the six months ended June 30, 2020 and 2019.
Ameren Illinois Electric Distribution
Ameren Illinois Electric Distribution’s margins decreased $3 million, or 1%, and increased $10 million, or 2%, for the three and six months ended June 30, 2020, respectively, compared with the year-ago periods.
The following items had a favorable effect on Ameren Illinois Electric Distribution’s margins for the three and six months ended June 30, 2020, compared with the year-ago periods (except when a specific period is referenced):
•Margins increased due to higher recoverable non-purchased power expenses (+$9 million) and increased capital investment (+$5 million), as evidenced by a 7% increase in rate base, partially offset by a lower recognized ROE (-$10 million), as evidenced by a decrease of 118 basis points in the estimated annual average of the monthly yields of the 30-year United States Treasury bonds under formula ratemaking for the six months ended June 30, 2020. The sum of these changes collectively increased margins $4 million for the six months ended June 30, 2020.
•Revenues increased $3 million and $6 million, respectively, due to increased energy-efficiency program investments under formula ratemaking.
Ameren Illinois Electric Distribution’s margins decreased for the three months ended June 30, 2020, compared with the year-ago period which increased margins by $8 million, asdue to lower recoverable non-purchased power expenses (-$5 million) and a result of customer growth.
The recovery of labor and benefit costs for crews assisting other utilities with power restoration efforts primarily caused by hurricane damage, which increased revenues by $5 million for both periods and was fullylower recognized ROE (-$4 million), partially offset by a related increase in operations and maintenance costs,increased capital investment (+$2 million) under performance-based formula ratemaking. The sum of these changes collectively decreased margins $7 million.
Ameren Illinois Natural Gas
Ameren Illinois Natural Gas’ margins increased $4 million, or 4%, for the three months ended June 30, 2020, compared with no overall impact on net income.
Increased transmission services revenuesthe year-ago period. Revenues increased from QIP recoveries due to additional rate base investment whichin qualified natural gas infrastructure. Ameren Illinois Natural Gas’ margins were comparable between the six months ended June 30, 2020 and 2019.
Ameren Illinois Transmission
Ameren Illinois Transmission’s margins increased margins by $2$21 million, or 32%, and $3$25 million, or 18%, respectively.
The following items had an unfavorable effect on Ameren Missouri's electric margins for the three and ninesix months ended SeptemberJune 30, 2017,2020, respectively, compared with the year-ago periods. Margins were favorably affected by increased capital investment, as evidenced by a 19% increase in rate base used to calculate the revenue requirement, and the result of a May 2020 FERC order, which increased the ROE related to the November 2013 complaint case, compared with the ROE set by a November 2019 FERC order, and dismissed the February 2015 complaint case. See Note 2 – Rate and Regulatory Matters under Part I, Item 1, of this report for additional information regarding the FERC complaint cases.
Other Operations and Maintenance Expenses
| | | | | | | | | | | | | | | | | | | | |
| Total by Segment(a) | | Increase (Decrease) by Segment | | | |
| | | Overall Ameren Decrease of $66 Million (QTD YoY) | | Overall Ameren Decrease of $45 Million (YTD YoY) | |
| | | | | | |
(a)Includes other/intersegment eliminations of $(3) million and $(3) million in the three months ended June 30, 2020,and 2019, respectively. Also includes other/intersegment eliminations of $(5) million and $(3) million in the six months ended June 30, 2020,and 2019, respectively.
| | | | | | | | | | | | | | | | | | | | | | | |
| | Ameren Missouri | | Ameren Illinois Natural Gas | | Other/Intersegment Eliminations | |
| | | | | | | |
| | Ameren Illinois Electric Distribution | | Ameren Transmission | | | |
Ameren
Other operations and maintenance expenses decreased $66 million and $45 million in the three and six months ended June 30, 2020, respectively, compared with the year-ago periods, due to changes discussed below.
Ameren Transmission
Other operations and maintenance expenses were comparable between periods.
Ameren Missouri
Other operations and maintenance expenses decreased $52 million and $37 million in the three and six months ended June 30, 2020, respectively, compared with the year-ago periods. The following items decreased other operations and maintenance expenses in the three and six months ended June 30, 2020, compared with the year-ago periods (except where a specific period is referenced):
Summer temperatures•Callaway Energy Center refueling operations and maintenance costs decreased $25 million and $32 million, respectively, primarily because of the refueling and maintenance outage that was completed in May 2019. The 2019 outage costs were milderexpensed as cooling degree daysincurred. Costs for the current year’s fall refueling and maintenance outage are deferred as a regulatory asset pursuant to the February 2020 MoPSC order.
•Non-Callaway Energy Center maintenance costs decreased 11%$13 million and 8% for$15 million, respectively, primarily due to lower electric system infrastructure maintenance expenses as a result of decreased system load, disciplined cost management, and the deferral of projects to future periods.
•The cash surrender value of company-owned life insurance increased $6 million in the three months ended June 30, 2020, because of increased favorable market returns in the current-year period compared with the year-ago period.
•Transmission and distribution expenditures decreased $6 million and $5 million, respectively, primarily due to storms in the second quarter of 2019.
•Amortization of solar rebate costs decreased $4 million in both periods as a result of the March 2020 MoPSC electric rate order.
The following items partially offset the above decreases in other operations and maintenance expenses in the three and ninesix months ended SeptemberJune 30, 2017,2020, compared with the year-ago periods (except where a specific period is referenced):
•The cash surrender value of company-owned life insurance decreased $9 million in the six months ended June 30, 2020, because of favorable market returns in the year-ago period.
•Customer energy-efficiency program costs increased $5 million in the three months ended June 30, 2020, because of lower participation in the MEEIA 2019 programs in the second quarter of 2019 as programs had just begun.
•Technology-related expenditures increased $5 million in the six months ended June 30, 2020, primarily due to costs associated with the implementation of cloud computing technology.
Ameren Illinois
Other operations and maintenance expenses decreased $14 million and $6 million in the three and six months ended June 30, 2020, respectively, compared with the year-ago periods, as discussed below. Other operations and winter temperaturesmaintenance expenses were mildercomparable between periods at Ameren Illinois Transmission.
Ameren Illinois Electric Distribution
Other operations and maintenance expenses decreased $8 million in the three months ended June 30, 2020, compared with the year-ago period, primarily due to a $3 million increase in the cash surrender value of company-owned life insurance, resulting from increased favorable market returns in the current-year period compared with the year-ago period, and a $2 million decrease in labor and benefit costs, primarily due to lower medical costs. Additionally, meter reading costs decreased by $2 million due to increased automated meter deployment. Other operations and maintenance expenses increased $3 million in the six months ended June 30, 2020, compared with the year-ago period, primarily due to a $4 million decrease in the cash surrender value of company-owned life insurance because of favorable market returns in the year-ago period and a $4 million increase in amortization of regulatory assets associated with energy-efficiency program investments under performance-based formula ratemaking. These increases were partially offset by a $3 million decrease in meter reading costs and a $2 million decrease in injury claims.
Ameren Illinois Natural Gas
Other operations and maintenance expenses decreased $7 million in the three months ended June 30, 2020, compared with the year-ago period, primarily due to a $2 million increase in the cash surrender value of company-owned life insurance because of increased favorable market returns in the current-year period compared with the year-ago period, and insignificant decreases in various other operations and maintenance expenses, including reductions in medical benefit costs, meter reading costs, and energy-efficiency rider costs. Other operations and maintenance expenses decreased $9 million in the six months ended June 30, 2020, compared with the year-ago period, primarily due to a $5 million reduction in energy-efficiency and environmental remediation rider costs and a $3 million reduction in meter reading costs due to increased automated meter deployment.
Depreciation and Amortization Expenses
| | | | | | | | | | | | | | | | | | | | |
| Total by Segment(a) | | Increase (Decrease) by Segment | | | |
| | | Overall Ameren Increase of $22 Million (QTD YoY) | | Overall Ameren Increase of $29 Million (YTD YoY) | |
| | | | | | |
(a)Includes other/intersegment eliminations of $2 million and $2 million in the three months ended June 30, 2020,and 2019, respectively. Also includes other/intersegment eliminations of $2 million and $2 million in the six months ended June 30, 2020,and 2019, respectively.
| | | | | | | | | | | | | | | | | | | | | | | |
| | Ameren Missouri | | Ameren Illinois Natural Gas | | Other/Intersegment Eliminations | |
| | | | | | | |
| | Ameren Illinois Electric Distribution | | Ameren Transmission | | | |
Depreciation and amortization expenses increased $22 million, $16 million, and $6 million in the three months ended June 30, 2020, and $29 million, $15 million, and $12 million in the six months ended June 30, 2020 compared with the year-ago periods, at Ameren, Ameren Missouri, and Ameren Illinois, respectively, primarily because of additional property, plant, and equipment investments across their respective segments. Ameren’s and Ameren Missouri’s depreciation and amortization expenses include a deferral to a regulatory asset of depreciation and amortization expenses pursuant to the PISA. As a result of the March 2020 MoPSC electric rate order, the deferral to a regulatory asset of depreciation and amortization expenses related to PISA-eligible assets placed in-service through December 31, 2019, ceased as heating degree days decreased 15%of April 1, 2020, as the associated depreciation and amortization expenses were then reflected in customer rates. The PISA deferral of depreciation and amortization expenses was $1 million and $4 million for the ninethree months ended SeptemberJune 30, 2017,2020 and 2019, respectively, and $14 million and $7 million for the six months ended June 30, 2020 and 2019, respectively.
Taxes Other Than Income Taxes
| | | | | | | | | | | | | | | | | | | | |
| Total by Segment(a) | | Increase (Decrease) by Segment | | | |
| | | Overall Ameren Increase of $1 Million (QTD YoY) | | Overall Ameren Change of $— Million (YTD YoY) | |
| | | | | | |
(a)Includes $2 million, $1 million, $4 million, and $2 million at Ameren Transmission in the three months ended June 30, 2020, thethree months ended June 30, 2019, the six months ended June 30, 2020, and the six months ended June 30, 2019, respectively, and other/intersegment eliminations of $2 million, $2 million, $5 million, and $6 million, in the three months ended June 30, 2020, thethree months ended June 30, 2019, the six months ended June 30, 2020, and the six months ended June 30, 2019, respectively.
| | | | | | | | | | | | | | | | | | | | | | | |
| | Ameren Missouri | | Ameren Illinois Natural Gas | | Other/Intersegment Eliminations | |
| | | | | | | |
| | Ameren Illinois Electric Distribution | | Ameren Transmission | | | |
Taxes other than income taxes were comparable between periods at Ameren, Ameren Missouri, Ameren Illinois, and their respective segments.
Other Income, Net
| | | | | | | | | | | | | | | | | | | | |
| Total by Segment | | Increase (Decrease) by Segment | | | |
| | | Overall Ameren Increase of $12 Million (QTD YoY) | | Overall Ameren Increase of $4 Million (YTD YoY) | |
| | | | | | |
| | | | | | | | | | | | | | | | | | | | | | | |
| | Ameren Missouri | | Ameren Illinois Natural Gas | | Other/Intersegment Eliminations | |
| | | | | | | |
| | Ameren Illinois Electric Distribution | | Ameren Transmission | | | |
Other income, net, increased $12 million in the three months ended June 30, 2020, compared with the year-ago period, primarily due to a $9 million increase in the non-service cost components of net periodic benefit income at Ameren Missouri, partially due to changes in the base level of pension and postretirement costs as a result of the March 2020 MoPSC electric rate order. Other income, net, increased $4 million in the six months ended June 30, 2020, compared with the year-ago period. The effectAn increase of weather decreased margins by an estimated $26$10 million and $56 million, respectively. The change in margins due to weather is the sum of the effect of weather (estimate)
on electric revenues (-$33 million and -$72 million, respectively) and the effect of weather (estimate) on fuel and purchased power (+$7 million and +$16 million, respectively) in the Electric and Natural Gas Margins table above.
The absence in 2017non-service cost components of the MEEIA 2013 performance incentive, which increased margins by $19 million for the three and nine months ended September 30, 2016.
Suspension of operationsnet periodic benefit income at the New Madrid Smelter in the first quarter of 2016 and the elimination of recovery under the FAC tariff effective April 1, 2017, which had allowed Ameren Missouri to retain a portion of the revenues from off-system sales it made as a result of reduced sales to the New Madrid Smelter, which decreased margins by $7 million and $8 million, respectively. As of April 1, 2017, higher electric base rates offset the absence of these revenues recovered under the FAC tariff. The decrease in margins due to the suspension of operations and elimination of the provision in the FAC tariff is the sum of New Madrid Smelter revenues (-$1 million and -$9 million, respectively) and New Madrid Smelter energy costs (-$6 million and +$1 million, respectively).
Increased transmission services charges resulting from additional MISO-approved electric transmission investments made by other entities and shared by all MISO participants, which decreased margins by $5 million and $7 million, respectively.
Excluding the estimated effect of weather and reduced sales to the New Madrid Smelter, total retail sales volumes decreased by less than 1% for the nine months ended September 30, 2017, compared with the year-ago period, which decreased margins by $4 million due to the absence of the leap year benefit experienced in 2016 and the effects of the MEEIA programs,was partially offset by growth. The throughput disincentive recovery, as part of MEEIA 2016, ensures that electric margins are not affected by reduced sales volumes as a result of MEEIA programs. Lower sales volumes led to a decrease in net energy costs of $3 million for nine months ended September 30, 2017, compared with the year-ago period. The change in net energy costs is the sum of the change in off-system sales (+$94 million for the nine months ended September 30, 2017) and the change in energy costs (excluding the effect of weather and the New Madrid Smelter) (-$91 million for the nine months ended September 30, 2017) in the Electric and Natural Gas Margins table above.
Ameren Illinois
Ameren Illinois' electric margins decreased by $113 million, or 25%, and $30 million, or 3%, for the three and nine months ended September 30, 2017, respectively, compared with the year-ago periods, driven by a decrease in Ameren Illinois Electric Distribution ($112 million and $40 million, respectively). Ameren Illinois Natural Gas’ margins increased by $5 million, or 6%, and $7 million or 2%, for the three and nine months ended September 30, 2017, respectively, compared with the year-ago periods,increase in donations, primarily due to charitable donations made pursuant to the March 2020 MoPSC electric rate order. Additionally, other income, net, increased rate base in 2017 underdue to insignificant activity across the QIP rider, which increased margins by $3 million and $6 million, respectively.
other Ameren Illinois Electric Distribution
Ameren Illinois Electric Distribution’s margins decreased $112 million, or 30%, and $40 million or 5%, for the three and nine months ended September 30, 2017, respectively, compared with the year-ago periods. The following items had an unfavorable effect on Ameren Illinois Electric Distribution’s margins for the three and nine months ended September 30, 2017, compared with the year-ago periods:
A change in the method used to recognize interim period revenue, in connection with the decoupling provisions of the FEJA, which decreased margins by $94 million and $47 million, respectively. This change will not impact annual earnings.segments. See Note 2 – Rate and Regulatory Matters under Part I, Item 1, of this report for additional information on FEJA and IEIMA.
The absence ofregarding the impact of warmer-than-normal summer temperatures experienced in the third quarter of 2016 and the decoupling of revenues in 2017, which decreased margins by $7 million for both periods. The change in margins due to weather is the sum of the effect of weather (estimate) on revenues (-$9 million and -$7 million, respectively) and the effect of weather (estimate) on fuel and purchased power (+$2 million and flat, respectively) in the Electric and Natural Gas Margins table above.
Ameren Illinois Electric Distribution’s base rates were favorably affected by increased recoverable expenses and rate base, as well as a higher 30-year United States Treasury bond yield under formula ratemaking, which collectively increased margins by $10 million and $31 million, respectively.
Ameren Illinois Transmission
Ameren Illinois Transmission's margins decreased $1 million, or 1%, for the three months ended September 30, 2017, compared to the year-ago period. Ameren Illinois Transmission’s margins increased $10 million, or 5%, for the nine months ended September 30, 2017, compared with the year-ago period. Margins were unfavorably affected for the three and nine months ended September 30, 2017, compared with the year-ago periods, by the absence of a temporarily higher allowed return on common equity of 12.38% for nearly four months in 2016 as a result of the expiration of the refund period in the February 2015 complaint case. Margins were favorably affected by increased capital investment, as evidenced by a 15% increase in rate base used to calculate the revenue requirement at September 30, 2017, compared to September 30, 2016, as well as higher recoverable costs for the three and nine months ended September 30, 2017, compared with the year-ago periods, under forward-looking formula ratemaking.
Other Operations and Maintenance Expenses
Ameren
Other operations and maintenance expenses were $9 million and $17 million lower in the three and nine months ended September 30, 2017, respectively, as compared with the year-ago periods, as discussed below.
Ameren Transmission
Other operations and maintenance expenses were comparable in the three and nine months ended September 30, 2017, with the year-ago periods.
Ameren Missouri
Other operations and maintenance expenses were $4 million higher and $15 million lower in the three and nine months ended September 30, 2017, respectively, as compared with the year-ago periods. The following items decreased other operations and maintenance expenses for the three and nine months ended September 30, 2017, compared with the year-ago periods (except where a specific period is referenced):
Refueling and maintenance outage costs at the Callaway energy center were lower by $27 million in the nine-month period, as the current year refueling and maintenance outage began in October 2017, while the 2016 refueling and maintenance outage was completed in the second quarter.
Pension and benefit costs decreased by $5 million and $10 million, respectively, primarily as a result of the March 2017 MoPSC electric rate order.
Solar rebate amortization costs decreased by $3 million and $6 million, respectively, primarily as a result of the March 2017 MoPSC electric rate order.
Estimated litigation costs decreased by $3 million and $5 million, respectively.
The following items increased other operations and maintenance expenses for the three and nine months ended September 30, 2017, compared with the year-ago periods:
MEEIA customer energy efficiency program costs increased by $6 million and $22 million, respectively. Electric revenues related to MEEIA program costs increased by a corresponding amount, with no overall effect on net income.
Ameren Missouri incurred $5 million of labor and benefit costs in both periods for crews assisting other utilities with power restoration, primarily caused by hurricane damage. These costs are being recovered from the other utilities, with no overall effect on net income.2019 electric service regulatory rate review.
Energy center maintenance costs, excluding refueling and maintenance outage costs at the Callaway energy center, increased by $5 million in both periods, primarily because of higher coal handling charges.
Ameren Illinois
Other operations and maintenance expenses were $15 million lower in the three months ended September 30, 2017, compared with the year-ago period, as discussed below. Other operations and maintenance expenses were comparable in the nine months ended September 30, 2017, with the year-ago period. Other operations and maintenance expenses were comparable in the three and nine months ended September 30, 2017, with the year-ago periods, at Ameren Illinois Transmission.
Ameren Illinois Electric Distribution
Other operations and maintenance expenses decreased $14 million and $8 million in the three and nine months ended September 30, 2017, respectively, compared with the year-ago periods, primarily because of decreased customer energy efficiency and environmental remediation costs, which are included in cost recovery mechanisms resulting in decreased electric revenues, with no overall effect on net income. These decreases were partially offset by an increase in storm-related repair costs, as well as increased wages and staffing additions.
Ameren Illinois Natural Gas
Other operations and maintenance expenses were comparable in the three months ended September 30, 2017, with the year-ago period. Other operations and maintenance expenses increased $6 million in the nine months ended September 30, 2017, compared with the year-ago period, primarily because of increased bad debt, customer energy efficiency, and environmental remediation costs, which are included in cost recovery mechanisms resulting in increased natural gas revenues, with no overall effect on net income. In addition, higher gas pipeline compliance costs contributed to the increase.
Depreciation and Amortization
Depreciation and amortization expenses increased $14 million and $40 million at Ameren, $4 million and $15 million at Ameren Missouri, and $6 million and $17 million at Ameren Illinois in the three and nine months ended September 30, 2017, respectively, compared with the year-ago periods, primarily because of additional property, plant, and equipment across their respective segments.
Taxes Other Than Income Taxes
Taxes other than income taxes were comparable at each of the Ameren Companies and their respective segments in the three months ended September 30, 2017, with the year-ago period. Taxes other than income taxes increased $6 million at Ameren in the nine months ended September 30, 2017, compared with the year-ago period, primarily because of higher property taxes at Ameren Missouri and at each Ameren Illinois segment.
Other Income and Expenses
Ameren
Other income, net of expenses, was comparable in the three months ended September 30, 2017, with the year-ago period. Other income, net of expenses, decreased $7 million in the nine months ended September 30, 2017, compared with the year-ago period, as discussed below. See Note 5 – Other Income, and ExpensesNet under Part I, Item 1, of this report for additional information.
Other income, net of expenses, was comparable
Interest Charges
| | | | | | | | | | | | | | | | | | | | |
| Total by Segment | | Increase (Decrease) by Segment | | | |
| | | Overall Ameren Increase of $11 Million (QTD YoY) | | Overall Ameren Increase of $7 Million (YTD YoY) | |
| | | | | | |
| | | | | | | | | | | | | | | | | | | | | | | |
| | Ameren Missouri | | Ameren Illinois Natural Gas | | Other/Intersegment Eliminations | |
| | | | | | | |
| | Ameren Illinois Electric Distribution | | Ameren Transmission | | | |
Interest charges increased $11 million and $7 million in the three and ninesix months ended SeptemberJune 30, 2017,2020, respectively, compared with the year-ago periods.
Interest charges at Ameren and Ameren Missouri
Other income, net include a deferral to a regulatory asset of expenses,interest charges pursuant to the PISA. As a result of the March 2020 MoPSC electric rate order, the deferral to a regulatory asset of amounts related to PISA-eligible assets placed in-service through December 31, 2019, ceased as of April 1, 2020, as the return on those PISA assets was comparablethen reflected in customer rates. The PISA deferral of interest charges was less than $1 million and $3 million for the three and nine months ended SeptemberJune 30, 2017, with2020 and 2019, respectively, and $9 million and $5 million for the year-ago periods.
Ameren Illinois
Other income, net of expenses, was comparablesix months ended June 30, 2020 and 2019, respectively. The increase in interest charges in the three months ended SeptemberJune 30, 2017, with2020, was primarily due to a long-term debt issuance at Ameren (parent) in April 2020 and the year-ago period, forlower PISA deferral at Ameren Illinois and each of its segments. Other income, net of expenses, decreased $5 millionMissouri. The increase in interest charges in the ninesix months ended SeptemberJune 30, 2017, compared with the year-ago period,2020, was primarily because of lowerdue to increased interest income associated with the IEIMA revenue requirement reconciliationcharges at Ameren Illinois Electric Distribution. Other income, net of expenses, was comparable in the nine months ended September 30, 2017, with the year-ago period, for the remaining Ameren Illinois segments.(parent), resulting from its April 2020 long-term debt issuance.
Interest Charges
Ameren
Interest charges were comparable in the three months ended September 30, 2017, with the year-ago period. Interest charges increased $8 million in the nine months ended September 30, 2017, compared with the year-ago period, as discussed below.
Ameren Transmission
Interest charges were comparable in the three months ended September 30, 2017, with the year-ago period. Interest charges increased $6 million in the nine months ended September 30, 2017, compared with the year-ago period, primarily because of an increase in average outstanding debt at Ameren Illinois and ATXI.
Ameren Missouri
Interest charges were comparable in the three and nine months ended September 30, 2017, with the year-ago periods.
Ameren Illinois
Interest charges were comparable in the three months ended September 30, 2017, with the year-ago period, for Ameren Illinois and each of its segments. Interest charges increased $4 million in the nine months ended September 30, 2017, compared with the year-ago period, primarily because of an increase in average outstanding debt at Ameren Illinois.
Income Taxes
The following table presents effective income tax rates for the three and ninesix months ended SeptemberJune 30, 20172020 and 2016:2019:
| | | | | | | | | | | | | | | | | | | | | | | | | | | | | | |
| | | | | | Three Months(a) | | | | Six Months(a) | | |
| | | | | | 2020 | | 2019 | | 2020 | | 2019 |
| Ameren | | | | | | 17 | % | | 18 | % | | 15 | % | | 15 | % |
| Ameren Missouri | | | | | | 7 | % | | 12 | % | | 7 | % | | 12 | % |
| Ameren Illinois | | | | | | 26 | % | | 23 | % | | 25 | % | | 24 | % |
| Ameren Illinois Electric Distribution | | | | | | 25 | % | | 21 | % | | 24 | % | | 22 | % |
| Ameren Illinois Natural Gas | | | | | | 29 | % | | 22 | % | | 26 | % | | 25 | % |
| Ameren Illinois Transmission | | | | | | 27 | % | | 26 | % | | 26 | % | | 25 | % |
| Ameren Transmission | | | | | | 27 | % | | 27 | % | | 27 | % | | 27 | % |
| | | | | | | | | | | | |
(a)Estimate of the annual effective income tax rate adjusted to reflect the tax effect of items discrete to the three and six months ended June 30, 2020 and 2019.
See Note 12 – Income Taxes under Part I, Item 1, of this report for a reconciliation of the federal statutory corporate income tax rate to the effective income tax rate for the Ameren Companies.
|
| | | | | | | | | | | | |
| | | Three Months(a) | | Nine Months(a) |
| | | 2017 | | 2016 | | 2017 | | 2016 |
| Ameren | | 41 | % | | 39 | % | | 39 | % | | 36 | % |
| Ameren Missouri | | 38 | % | | 38 | % | | 38 | % | | 38 | % |
| Ameren Illinois | | 40 | % | | 39 | % | | 40 | % | | 39 | % |
| Ameren Illinois Electric Distribution | | 38 | % | | 40 | % | | 39 | % | | 39 | % |
| Ameren Illinois Natural Gas | | 51 | % | | 20 | % | | 40 | % | | 39 | % |
| Ameren Illinois Transmission | | 42 | % | | 38 | % | | 40 | % | | 38 | % |
| Ameren Transmission | | 44 | % | | 38 | % | | 41 | % | | 39 | % |
| |
(a) | Estimate of the annual effective income tax rate adjusted to reflect the tax effect of items discrete to the three and nine months ended September 30, 2017 and 2016. |
Ameren
The effective income tax rate was higher at Ameren Illinois Electric Distribution and Ameren Illinois Natural Gas in the three and nine months ended SeptemberJune 30, 2017,2020, compared with the year-ago periods, because of an increase in the Illinois statutory income tax rate, which became effective on July 1, 2017. Additionally, the effective income tax rate was higher in the nine-month period, because of a decrease in the recognition of income tax benefits associated with share-based compensation.
Ameren Transmission
The effective income tax rate was higher in the three and nine months ended September 30, 2017, compared with the year-ago periods, primarily because of the decreased effectlower amortization of incomeexcess deferred taxes and lower tax benefits from certain depreciation differences on property-related items along withlargely attributable to the increase in the Illinois statutory income tax rate.
Ameren Missouri
allowance for equity funds used during construction. The effective income tax rate was comparable in the three and nine months ended September 30, 2017, with the year-ago periods.
Ameren Illinois
The effective income tax rate was comparable in the three and nine months ended September 30, 2017, with the year-ago periodshigher at Ameren Illinois, Ameren Illinois Electric Distribution and Ameren Illinois Natural Gas and Ameren Illinois Transmission, except as discussed below.
Ameren Illinois Electric Distribution
The effective income tax rate was lower in the threesix months ended SeptemberJune 30, 2017,2020, compared with the year-ago period, primarily because of the increased effectlower amortization of income tax benefits on lower pretax income in the current year from certain depreciation differences on property-related items, partially offset by the increase in the Illinois statutory income tax rate.excess deferred taxes.
Ameren Illinois Natural Gas
The effective income tax rate was higher in the three months ended September 30, 2017, compared with the year-ago period, primarily because of the decreased effect of income tax benefits on higher pretax income in the current year from certain depreciation differences on property-related items, as well as the increase in the Illinois statutory income tax rate. Due to the small amount of pretax income in the third quarter of each year, the effective income tax rates in both periods can vary significantly.
Ameren Illinois Transmission
The effective income tax rate was higher in the three months ended September 30, 2017, compared with the year-ago period, primarily because of a decrease in the income tax benefits from certain depreciation differences on property-related items, along with the increase in the Illinois statutory income tax rate.
LIQUIDITY AND CAPITAL RESOURCES
Collections from our tariff-based revenues are our principal source of cash provided by operating activities. A diversified retail customer mix, primarily consisting of rate-regulated residential, commercial, and industrial customers, provides us with a reasonably predictable source
of cash. In addition to using cash provided by operating activities, we use available cash, borrowingsdrawings under the Credit Agreements,committed credit agreements, commercial paper issuances, and/or, in the case of Ameren Missouri and Ameren Illinois, short-term intercompanyaffiliate borrowings to support normal operations and temporary capital requirements. We may reduce our short-term borrowings with cash provided by operations or, at our discretion, with long-term borrowings, or, in the case of Ameren Missouri and Ameren Illinois, with capital contributions from Ameren (parent). We expect to make significant capital expenditures over the next five years as we invest in our electric and natural gas utility infrastructure to support overall system reliability, grid modernization, renewable energy requirements, environmental compliance, and other improvements. We intendAs part of its plan to fund those capital expenditures primarilythese cash flow requirements, Ameren is using newly issued shares of common stock, rather than market-purchased shares, to satisfy requirements under the DRPlus and employee benefit plans and expects to continue to do so through at least 2024. Ameren expects these issuances to provide equity of about $100 million annually. Ameren also plans to issue incremental common equity to fund a portion of Ameren Missouri’s wind generation investments through the physical settlement of the forward sale agreement entered into in August 2019 relating to 7.5 million shares of common stock. Additionally, Ameren plans to issue incremental equity of about $150 million annually from 2021 to 2024. For additional information about the forward sale agreement, see Note 4 – Long-Term Debt and Equity Financings under Part I, Item 1, of this report. Ameren expects its equity to total capitalization to be about 45% through the period ending December 2024, with cash provided by operating activities and short-term andthe long-term debt issuances so that we maintain an equity ratio around 50%, assuming constructive regulatory environments.intent to support solid investment-grade credit ratings.
The use of cash provided by operating activities and short-term borrowings to fund capital expenditures and other long-term investments may periodically resultat the Ameren Companies frequently results in a working capital deficit, defined as current liabilities exceeding current assets, as was the case at SeptemberJune 30, 2017,2020, for the Ameren Companies. The working capital deficit as of September 30, 2017, was primarily the result of current maturities of long-term debt and our decision to finance our businesses with lower-cost commercial paper issuances.Ameren Illinois. With the credit capacity available under the Credit Agreements, and cash and cash equivalents, the Ameren Companies had accessnet available liquidity of $2.2 billion atJune 30, 2020. As a result of capital market volatility due, in part, to $1.7 billionthe COVID-19 pandemic, and to increase net available liquidity, Ameren (parent) accelerated a debt issuance to April 2020, which had been planned for later in 2020. Additionally, Ameren expects to receive between $540 million and $550 million upon settlement of liquiditythe forward sale agreement, which can be settled atSeptember 30, 2017. Ameren’s discretion on or prior to March 31, 2021. See Credit Facility Borrowings and Liquidity and Long-term Debt and Equity below for additional information.
The following table presents net cash provided by (used in) operating, investing, and financing activities for the ninesix months ended SeptemberJune 30, 20172020 and 2016:2019:
| | | | | | | | | | | | | | | | | | | | | | | | | | | | | | | | | | | | | | | | | | | | | | | | | | | | | |
| Net Cash Provided By
Operating Activities | | | | | | Net Cash Used In
Investing Activities | | | | | | Net Cash Provided by
Financing Activities | | | | |
| 2020 | | 2019 | | Variance | | 2020 | | 2019 | | Variance | | 2020 | | 2019 | | Variance |
| Ameren | $ | 694 | | | $ | 879 | | | $ | (185) | | | $ | (1,315) | | | $ | (1,154) | | | $ | (161) | | | $ | 608 | | | $ | 290 | | | $ | 318 | |
| | | | | | | | | | | | | | | | | |
| Ameren Missouri | 292 | | | 361 | | | (69) | | | (604) | | | (521) | | | (83) | | | 284 | | | 165 | | | 119 | |
| Ameren Illinois | 340 | | | 452 | | | (112) | | | (659) | | | (558) | | | (101) | | | 336 | | | 125 | | | 211 | |
|
| | | | | | | | | | | | | | | | | | | | | | | | | | | | | | | | | | | |
| | Net Cash Provided By Operating Activities | | Net Cash Used In Investing Activities | | Net Cash Provided by (Used In) Financing Activities |
| | 2017 | | 2016 | | Variance | | 2017 | | 2016 | | Variance | | 2017 | | 2016 | | Variance |
Ameren(a) | $ | 1,643 |
| | $ | 1,559 |
| | $ | 84 |
| | $ | (1,585 | ) | | $ | (1,551 | ) | | $ | (34 | ) | | $ | (58 | ) | | $ | (282 | ) | | $ | 224 |
|
| Ameren Missouri | 819 |
| | 888 |
| | (69 | ) | | (455 | ) | | (724 | ) | | 269 |
| | (364 | ) | | (362 | ) | | (2 | ) |
| Ameren Illinois | 628 |
| | 627 |
| | 1 |
| | (754 | ) | | (679 | ) | | (75 | ) | | 126 |
| | (16 | ) | | 142 |
|
| |
(a) | Includes amounts for Ameren registrant and nonregistrant subsidiaries and intercompany eliminations. |
Cash Flows from Operating Activities
Our cash provided by operating activities is affected by fluctuations of trade accounts receivable, inventories, and accounts and wages payable, among other things, as well as the unique regulatory environment for each of our businesses. Substantially all expenditures related to fuel, purchased power, and natural gas purchased for resale are recovered from customers through rate adjustment mechanisms, which may be adjusted without a traditional rate proceeding. Similar regulatory mechanisms exist for certain other operating expenses that can also affect the timing of cash provided by operating activities. The timing of cash paidpayments for costs recoverable under our regulatory mechanisms differs from the recovery period of those costs. Additionally, the seasonality of our electric and natural gas businesses, primarily caused by changes in customer demand due to weather, significantly impactaffects the amount and timing of our cash provided by operating activities.
Ameren
Ameren’sOur customers’ payment for our services has been adversely affected by the COVID-19 pandemic, resulting in a decrease to our cash flow from operating activities increased $84 million in the first nine months of 2017, compared with the year-ago period. The following items contributed to the increase:
A $160 million increase resulting from electric and natural gas margins, as discussed in Results of Operations, excluding certain noncash items, as well as the change in customer receivable balances.
A $26 million decrease in payments for scheduled nuclear refueling and maintenance outages atoperations.For information regarding Ameren Missouri’s Callaway energy center, as the current year refueling and maintenance outage began in October 2017, while the 2016 refueling and maintenance outage was completed in the second quarter.
A $23 million increase in cash collected from Ameren Illinois’ alternative retail electric supplier customerssuspension and subsequent reinstatement of customer disconnections and late fee charges for renewable energy credit compliance pursuant to the FEJA.
A $21 million increase in cash collected from Ameren Illinois customers related to zero-emission credits pursuant to the FEJA.
A $12 million increase in net energy costs collected from Ameren Missouri customers under the FAC.
An increase of $12 million in income tax refunds primarily as a result of higher tax credit sales and the receipt of a 2010 Illinois income tax refund.
The following items partially offset the increase in Ameren's cash from operating activities between periods:
The absence of a $42 million insurance receipt at Ameren Missouri related to the Taum Sauk breach received in 2016.
A $35 million increase in expenditures for customer energy efficiency programs at Ameren Illinois compared with amounts collected from customers.
A $30 million decrease in cash recoveries associated with Ameren Illinois' IEIMA revenue requirement reconciliation adjustments. The 2015 revenue requirement reconciliation adjustment, which is being recovered from customers in 2017, was less than the 2014 revenue requirement reconciliation adjustment, which was recovered from customers in 2016.
Refunds of $21 million associated with the November 2013 FERC complaint case, as discussed innonpayment, see Note 2 – Rate and Regulatory Matters under Part I, Item 1, of this report.
An $18 million increase in purchased power costs collected from Ameren Illinois customers under the PGA.
A $13 million increase in payments related to natural gas held in storage caused primarily by reduced withdrawals as a result In addition, see Results of milder winter temperatures compared with the prior year.
Ameren Missouri
Operations above for more information on Ameren’s, Ameren Missouri’s, and Ameren Illinois’ accounts receivable balances that were 30 days or greater past due or that were a part of a deferred payment arrangement.
Ameren
Ameren’s cash fromprovided by operating activities decreased $69$185 million in the first ninesix months of 2017,2020, compared with the year-ago period. The following items contributed to the decrease:
An•A $156 million decrease resulting from decreased customer collections, primarily due to an increase in income taxaccounts receivable balances, which was affected by an increase in amounts that were 30 days or greater past due or that were a part of a deferred payment arrangement, and a decrease in sales volumes at Ameren Missouri, partially offset by decreased fuel and purchased power costs at Ameren Missouri, decreased purchased power costs and volumes and natural gas costs at Ameren Illinois, and a net increase attributable to regulatory recovery mechanisms.
•A $32 million decrease, primarily resulting from increased coal inventory levels as less coal was purchased in 2019 due to delivery disruptions that occurred from flooding.
•A $21 million increase in payments of $115 millionto settle ARO liabilities, primarily related to Ameren (parent)Missouri’s CCR storage facilities.
•A net $20 million decrease in collateral received from counterparties, primarily resulting from changes in the market prices of power and natural gas, changes in contracted commodity volumes, and decreases resulting from Ameren Illinois’ renewable energy contracts entered into pursuant to the FEJA.
•A $14 million increase in property tax allocation agreement,payments at Ameren Missouri due to higher property tax values in 2019, compared with 2018. Property tax payments in a given year are based on the preceding year’s property tax values.
The following items partially offset the decrease in Ameren’s cash from operating activities between periods:
•A $27 million decrease in payments for nuclear refueling and maintenance outages at Ameren Missouri’s Callaway Energy Center. There was no refueling and maintenance outage in the first half of 2020.
•A $17 million decrease in non-Callaway Energy Center maintenance costs at Ameren Missouri, primarily due to lower electric system infrastructure maintenance expenses as a result of decreased system load, disciplined cost management, the deferral of projects to future periods, and lower storm costs.
•A $12 million decrease in payments for the employer portion of Social Security taxes as a result of a payment deferral allowed under the Coronavirus Aid, Relief, and Economic Security Act. The deferred amounts will be paid over two years beginning in 2021.
Ameren Missouri
Ameren Missouri’s cash provided by operating activities decreased $69 million in the first six months of 2020, compared with the year-ago period. The following items contributed to the decrease:
•An $89 million decrease resulting from decreased customer collections, primarily due to an increase in accounts receivable balances and a decrease in sales volumes, partially offset by decreased fuel and purchased power costs and a net increase attributable to regulatory recovery mechanisms.
•A $32 million decrease, primarily resulting from increased coal inventory levels as less coal was purchased in 2019 due to delivery disruptions that occurred from flooding in 2019.
•A $21 million increase in payments to settle ARO liabilities, primarily related to higher taxable incomeCCR storage facilities.
•A net $14 million decrease in 2017,collateral received from counterparties, primarily resulting from changes in the market prices of power and natural gas and changes in contracted commodity volumes.
•A $14 million increase in property tax payments due to significantly lower property-related deductions.
The absence ofhigher property tax values in 2019, compared with 2018. Property tax payments in a $42 million insurance receipt related togiven year are based on the Taum Sauk breach received in 2016.
preceding year’s property tax values.
The following items partially offset the decrease in Ameren Missouri’s cash from operating activities between periods:
•A $62$57 million increase resulting from electricdecrease in income tax payments to Ameren (parent) pursuant to the tax allocation agreement, primarily due to the timing of payments and natural gas margins, as discussedlower taxable income in Results of Operations, excluding certain noncash items, as well as the change in customer receivable balances.2020.
•A $26$27 million decrease in payments for scheduled nuclear refueling and maintenance outages at the Callaway energy center, as the current yearEnergy Center. There was no refueling and maintenance outage began in October 2017, while the 2016 refueling and maintenance outage was completed in the second quarter.first half of 2020.
•A $12$17 million increasedecrease in net energynon-Callaway Energy Center maintenance costs, collected from customersprimarily due to lower electric system infrastructure maintenance expenses as a result of decreased system load, disciplined cost management, the deferral of projects to future periods, and lower storm costs.
•A $6 million decrease in payments for the employer portion of Social Security taxes as a result of a payment deferral allowed under the FAC.Coronavirus Aid, Relief, and Economic Security Act. The deferred amounts will be paid over two years beginning in 2021.
Ameren Illinois
Ameren Illinois’ cash fromprovided by operating activities increased $1decreased $112 million in the first ninesix months of 2017,2020, compared with the year-ago period. The following items contributed to the increase:decrease:
An $84•A $67 million increasedecrease resulting from electricdecreased customer collections, primarily due to an increase in accounts receivable balances that were 30 days or greater past due or that were a part of a deferred payment arrangement and a net decrease attributable to regulatory recovery mechanisms, partially offset by decreased purchased power costs and volumes and natural gas margins, as discussed in Results of Operations, excluding certain noncash items, as well as the change in customer receivable balances.costs.
•A $23$31 million increase in cash collected from alternative retail electric supplier customers for renewable energy credit compliance pursuant to the FEJA.
A $21 million increase in cash collected from customers related to zero-emission credits pursuant to the FEJA.
An increase of $15 million in income tax refunds frompayments to Ameren (parent) pursuant to the tax allocation agreement, primarily related to a larger taxable loss in 2017, due to higher property-related deductionsthe timing.
•A net $6 million decrease in collateral received from counterparties, primarily resulting from changes in the market prices of power and use of net operating losses.
natural gas, changes in contracted commodity volumes, and decreases resulting from renewable energy contracts entered into pursuant to the FEJA.
The following items substantially offset the increasedecrease in Ameren Illinois’ cash from operating activities between periods:
A $35 million increase in expenditures for customer energy efficiency programs compared with amounts collected from customers.
A $30periods was partially offset by a $5 million decrease in cash recoveries associated with IEIMA revenue requirement reconciliation adjustments. The 2015 revenue requirement reconciliation adjustment, which is being recovered from customers in 2017, was less thanpayments for the 2014 revenue requirement reconciliation adjustment, which was recovered from customers in 2016.
An $18 million increase in purchased power costs collected from customers under the PGA.
Refundsemployer portion of $17 million associated with the November 2013 FERC complaint case, as discussed in Note 2 – Rate and Regulatory Matters under Part I, Item 1, of this report.
A $13 million increase in interest payments, primarily due to an increase in the average outstanding debt.
A $12 million increase in payments related to natural gas held in storage caused primarily by reduced withdrawalsSocial Security taxes as a result of milder winter temperatures compared witha payment deferral allowed under the prior year.Coronavirus Aid, Relief, and Economic Security Act. The deferred amounts will be paid over two years beginning in 2021.
A $5 million increase in payments to contractors for additional reliability, maintenance, and IEIMA projects.
Cash Flows from Investing Activities
Ameren’s cash used in investing activities increased $34$161 million in the first ninesix months of 2017,2020, compared with the year-ago period. Capital expenditures increased $27 millionperiod, primarily as a result of activitya $103 million increase in capital expenditures. Partially offsetting capital expenditure increases at Ameren Missouri and Ameren Illinois discussed below, partially offset byAmeren’s capital expenditures decreased due to a $72$25 million decrease in capital expenditures at ATXI. ATXI’s capital expenditures decreased as a result of decreased expenditures on the
Illinois Rivers Mark Twain project partially offset by increased expenditures relatedcompared to the Spoon River project. Nuclearyear-ago period. Cash used in investing activities also increased $31 million due to the timing of nuclear fuel expenditures increased $11and $31 million as a result ofdue to net investment activity in the activitynuclear decommissioning trust fund at Ameren Missouri as discussed below.in the first six months of 2020, compared with the year-ago period.
Ameren Missouri’s cash used in investing activities decreased $269increased $83 million between periods,in the first six months of 2020, compared with the year-ago period, primarily as a result of a $31 million increase due to the timing of nuclear fuel expenditures and a $31 million net money pool advances. In 2017,increase in investment activity in the nuclear decommissioning trust fund. Ameren Missouri received $143also had a $21 million increase in returns of net money pool advances, compared to investing $165 million in money pool advances in 2016. The decrease was partially offset by increased capital expenditures of $33 millioncompared with the year-ago period, primarily related to electric distributiondelivery infrastructure upgrades and electric transmission system reliability and energy center projects and investments in transmission communication technology, as well as an $11 million increase in nuclear fuel expenditures because of the timing of purchases in the first nine months of 2017, compared with the prior-year period.projects.
Ameren Illinois’ cash used in investing activities increased $75$101 million between periods largelyin the first six months of 2020, compared with the year-ago period, primarily due to ana $105 million increase in capital expenditures of $77 million primarily related to electric distribution and transmission system reliability projects updatesand upgrades to electric delivery and natural gas main infrastructure, substation upgrades and investments in smart grid technology.infrastructure.
Cash Flows from Financing Activities
Cash provided by, or used in, financing activities is a result of our financing needs, which depend on the level of cash provided by operating activities, the level of cash used in investing activities, the level of dividends, and our long-term debt maturities, among other things.
Ameren’s cash used inprovided by financing activities decreased $224increased $318 million during the first ninesix months of 2017,2020, compared towith the year-ago period. During the first ninesix months of 2017,2020, Ameren utilized net proceeds of $737 million from the issuance of $1,263 million of long-term indebtednessdebt for general corporate purposes, including to repay then-outstanding short-term debt, including short-term debt incurred in connection with the repayment at maturity of long-term debt of $85 million, and to fund, in part, investing activities. During the first six months of 2020, Ameren repaid net short-term debt of $320 million. In comparison, during the first six months of 2019, Ameren utilized proceeds of $851 million from a long-term debt issuance and net commercial paper issuances to repay $329 million of higher-cost long-term debt and to fund, in part, investing activities. During the first six months of 2020, Ameren paid common stock dividends of $244 million, compared with $233 million in dividend payments in the year-ago period.
Ameren Missouri’s cash provided by financing activities increased $119 million during the first six months of 2020, compared with the year-ago period. During the first six months of 2020, Ameren Missouri utilized net proceeds from the issuance of $465 million of long-term debt to repay then-outstanding short-term debt, including short-term debt incurred in connection with the repayment at maturity $425of long-term debt of $85 million. During the first six months of 2020, Ameren Missouri repaid net short-term debt of $155 million, of higher cost long-term indebtednessborrowed $65 million from the money pool, and used cash provided by financing activities to fund, in part, investing activities. In comparison, during the first ninesix months of 2016,2019, Ameren usedMissouri utilized net proceeds of $456 million from the issuance of $450 million in long-term indebtednessdebt to repay then-outstanding commercial paper issuances, including short-term debt incurred in connection with the repayment at maturity of long-term debt of $329 million, and net commercial paper issuances to repay at maturity $389of $150 million of higher cost long-term indebtedness and to fund, in part, investing activities.
Ameren Missouri’s cash used in financing activities was comparable between periods. During the first ninesix months of 2017,2020, Ameren Missouri issued $399 million of long-term indebtedness and used the proceeds, along with cash on hand, to repay at maturity $425 million of higher cost long-term indebtedness. In comparison, during the first nine months of 2016, Ameren Missouri issued $149 million of long-term indebtedness and used the proceeds, along with cash on hand, to repay at maturity $260 million of higher cost long-term indebtedness. In addition, during the first nine months of 2017, Ameren Missouri paid $332 million indid not pay common stock dividends, compared with $285$100 million in dividend payments and the receipt of a $38 million capital contribution in the year-ago period.
Ameren Illinois’ cash provided by financing activities provided cash of $126increased $211 million during the first ninesix months of 2017,2020, compared with $16 million of cash used in financing activities during the year-ago period. During the first ninesix months of 2017,2020, Ameren Illinois received $350 million in capital contributions from Ameren (parent), repaid net short-term debt of $12 million, and used proceeds from net commercial paper issuances of $118 millioncash provided by financing activities to fund, in part, investing activities. In comparison, during the first ninesix months of 2016,2019, Ameren Illinois usedutilized net proceeds from net commercial paper issuances of $127 million to repay at maturity $129 million of higher cost long-term indebtedness. Ameren Illinois did not pay common stock dividends during the nine months ended September 30, 2017, compared to dividend payments of $95 million during the same periodfund, in 2016. Additionally, money pool borrowings decreased $43 million, compared with the year-ago period.part, investing activities.
See Long-term Debt and Equity in this section for additional information on maturities and issuances of long-term debt.
Credit Facility Borrowings and Liquidity
The liquidity needs of the Ameren Ameren Missouri, and Ameren IllinoisCompanies are typically supported through the use of available cash, drawings under committed credit agreements, commercial paper issuances, and/or, in the case of Ameren Missouri and Ameren Illinois, short-term intercompanyaffiliate borrowings. See Note 3 – Short-term Debt and Liquidity under Part I, Item 1, of this report for additional information on credit agreements, commercial paper issuances, Ameren’s money pool arrangements and related borrowings, or drawings under theand relevant interest rates.
The following table presents Ameren’s consolidated liquidity as of June 30, 2020:
| | | | | | | | | |
| | | | | |
Ameren (parent)and Ameren Missouri: | | | | | |
Missouri Credit Agreement – borrowing capacity | | | | | $ | 1,200 | |
| | | | | |
| Less: Ameren Missouri commercial paper outstanding | | | | | 79 | |
| | | | | |
| Less: Ameren Missouri letters of credit | | | | | 3 | |
| Missouri Credit Agreement – subtotal | | | | | 1,118 | |
| Ameren (parent) and Ameren Illinois: | | | | | |
Illinois Credit Agreement – borrowing capacity | | | | | 1,100 | |
| | | | | |
| Less: Ameren Illinois commercial paper outstanding | | | | | 41 | |
| | | | | |
| Less: Ameren Illinois letters of credit | | | | | 2 | |
Illinois Credit Agreement – subtotal | | | | | 1,057 | |
| Subtotal | | | | | $ | 2,175 | |
| Add: Cash and cash equivalents | | | | | 8 | |
| Net Available Liquidity | | | | | $ | 2,183 | |
The Credit Agreements.Agreements, among other things, provide $2.3 billion of credit until maturity in December 2024. See Note 3 – Short-term Debt and Liquidity under Part I, Item 1, of this report for additional information on the Credit Agreements, short-term borrowing activity, commercial paper issuances, relevant interest rates, and borrowings under Ameren’s money pool arrangements.
The following table presents Ameren’s consolidated liquidity as of SeptemberAgreements. During the six months ended June 30, 2017: |
| | | |
Ameren and Ameren Missouri: | |
Missouri Credit Agreement – borrowing capacity | $ | 1,000 |
|
| Less: Ameren (parent) commercial paper outstanding | 162 |
|
| Missouri Credit Agreement – credit available | 838 |
|
| Ameren and Ameren Illinois: | |
Illinois Credit Agreement – borrowing capacity | 1,100 |
|
| Less: Ameren (parent) commercial paper outstanding | 115 |
|
| Less: Ameren Illinois commercial paper outstanding | 169 |
|
| Less: Letters of credit | 1 |
|
Illinois Credit Agreement – credit available | 815 |
|
| Total Credit Available | $ | 1,653 |
|
| Cash and cash equivalents | 9 |
|
| Total Liquidity | $ | 1,662 |
|
The Credit Agreements are used to borrow cash, to issue letters of credit, and to support issuances under Ameren’s (parent), Ameren Missouri’s, and Ameren Illinois’ commercial paper programs. Both of the Credit Agreements are available to Ameren to support issuances under Ameren’s commercial paper program, subject to borrowing sublimits. The Missouri Credit Agreement is available to support issuances under Ameren Missouri’s commercial paper program. The Illinois Credit Agreement is available to support issuances under Ameren Illinois’ commercial paper program. Issuances under the2020, Ameren (parent), Ameren Missouri, and Ameren Illinois commercial paper programs were available at lower interest rates than the interest rates availableeach borrowed under the Credit Agreements. CommercialAgreements and issued commercial paper. Borrowings under the Credit Agreements and commercial paper issuances were thus preferred to credit facility borrowings asare based upon available interest rates at that time of the borrowing or issuance. As a sourceresult of third-party short-term debt.volatility in the capital markets, the Ameren Companies borrowed under the Credit Agreements in certain instances in the first quarter of 2020 rather than issuing commercial paper.
In addition, Ameren Missouri and Ameren Illinois may borrow cash from the utilityhas a money pool when funds are available. The rateagreement with and among its utility subsidiaries to coordinate and to provide for certain short-term cash and working capital requirements. As short-term capital needs arise, and based on availability of interest depends on the composition of internal and external funds in the utility money pool.funding sources, Ameren Missouri and Ameren Illinois will access funds from the utility money pool, the Credit Agreements, or the commercial paper programs depending on which option offershas the lowest interest rates.
The issuance of short-term debt securities by Ameren’s utility subsidiaries is subject to FERC approval by the FERC under the Federal Power Act. In June 2017,March 2020, the FERC issued an order authorizing Ameren Missouri to issue up to $1 billion of short-term debt securities, which expires in March 2022. In 2018, the FERC issued an order authorizing Ameren Illinois to issue up to $1 billion of short-term debt securities, which expires in September 2020. In July 2019, the FERC issued an order authorizing ATXI to issue up to $300 million of short-term debt securities, throughwhich expires in July 2019.2021.
The Ameren Companies continually evaluate the adequacy and appropriateness of their liquidity arrangements givenfor changing business conditions. When business conditions warrant, changes may be made to existing credit agreements or to other short-term borrowing arrangements.
arrangements, or other arrangements may be made.
Long-term Debt and Equity
The following table presents theAmeren’s issuances (net of any issuance premiums or discounts), maturities, of long-term debt and equity, as well as redemptions and maturities of long-term debt for the six months ended June 30, 2020 and 2019:
| | | | | | | | | | | | | | | | | | | | |
| Month Issued, Redeemed, or Matured | | 2020 | | 2019 | |
| Issuances of Long-term Debt | | | | | | |
| Ameren: | | | | | | |
| 3.50% Senior unsecured notes due 2031 | April | | $ | 798 | | | $ | — | | |
| Ameren Missouri: | | | | | | |
| 2.95% First mortgage bonds due 2030 | March | | $ | 465 | | | $ | — | | |
| 3.50% First mortgage bonds due 2029 | March | | — | | | 450 | | |
| | | | | | |
| | | | | | |
| Total Ameren long-term debt issuances | | | $ | 1,263 | | | $ | 450 | | |
| Issuances of Common Stock | | | | | | |
| Ameren: | | | | | | |
| DRPlus and 401(k) | Various | | $ | 27 | | (a) (b) | $ | 37 | | (a) (b) |
| Total common stock issuances | | | $ | 27 | | | $ | 37 | | |
| Total Ameren long-term debt and common stock issuances | | | $ | 1,290 | | | $ | 487 | | |
| Redemptions and Maturities of Long-term Debt | | | | | | |
| Ameren Missouri: | | | | | | |
| 5.00% Senior secured notes due 2020 | February | | $ | 85 | | | $ | — | | |
| 6.70% Senior secured notes due 2019 | February | | — | | | 329 | | |
| | | | | | |
| | | | | | |
| Total Ameren long-term debt redemptions and maturities | | | $ | 85 | | | $ | 329 | | |
(a)Ameren Missouri, Ameren Illinois,issued a total of 0.4 million and ATXI0.5 million shares of common stock under its DRPlus and 401(k) plan in the six months ended June 30, 2020 and 2019, respectively.
(b)Excludes 0.5 million and 0.8 million shares of common stock valued at $38 million and $54 million issued for no cash consideration in connection with stock-based compensation for the ninesix months ended SeptemberJune 30, 20172020 and 2016. The Ameren Companies did not issue any2019, respectively.
See Note 4 – Long-Term Debt and Equity Financings under Part I, Item 1, of this report for additional information, including proceeds from issuances of long-term debt, the use of those proceeds, Ameren’s forward equity sale agreement relating to 7.5 million shares of common stock, during the first nine months of 2017 or 2016. In March 2016,and Ameren Missouri received cash(parent)’s capital contributions of $38 million from Ameren (parent).
|
| | | | | | | | | |
| | Month Issued, Redeemed, or Matured | | 2017 | | 2016 |
| Issuances of Long-term Debt | | | | | |
| Ameren Missouri: | | | | | |
| 2.95% Senior secured notes due 2027 | June | | $ | 399 |
| | $ | — |
|
| 3.65% Senior secured notes due 2045 | June | | — |
| | 149 |
|
| ATXI: | | | | | |
| 3.43% Senior notes due 2050 | June | | $ | 150 |
| | $ | — |
|
| 3.43% Senior notes due 2050 | August | | $ | 300 |
| | $ | — |
|
| Total Ameren long-term debt issuances | | | $ | 849 |
| | $ | 149 |
|
| Redemptions and Maturities of Long-term Debt | | | | | |
| Ameren Missouri: | | | | | |
| 6.40% Senior secured notes due 2017 | June | | $ | 425 |
| | $ | — |
|
| 5.40% Senior secured notes due 2016 | February | | — |
| | 260 |
|
| Ameren Illinois: | | | | | |
| 6.20% Senior secured notes due 2016 | June | | — |
| | 54 |
|
| 6.25% Senior secured notes due 2016 | June | | — |
| | 75 |
|
| Total Ameren long-term debt redemptions and maturities | | | $ | 425 |
| | $ | 389 |
|
In June 2017, Ameren Missouri issued $400 million of 2.95% senior secured notes due June 2027, with interest payable semiannually on June 15 and December 15 of each year, beginning December 15, 2017. Ameren Missouri received proceeds of $396 million, which were used, in conjunction with other available funds, to repay at maturity $425 million of Ameren Missouri’s 6.40% senior secured notes in June 2017.
In June 2017, pursuant to a note purchase agreement, ATXI agreed to issue $450 million principal amount of 3.43% senior unsecured notes, due 2050, through a private placement offering exempt from registration under the Securities Act of 1933, as amended. ATXI issued $150 million principal amount of the notes in June 2017 and the remaining $300 million principal amount of the notes in August 2017. ATXI received proceeds of $449 million from the notes, which were used by ATXI to repay existing short-term and long-term affiliate debt owed to Ameren (parent).Illinois.
Indebtedness Provisions and Other Covenants
See Note 3 – Short-term Debt and Liquidity and Note 4 – Long-term Debt and Equity Financings under Part I, Item 1, of this report and Note 4 – Short-term Debt and Liquidity and Note 5 – Long-term Debt and Equity Financings under Part II, Item 8, of the Form 10-K for a discussion of covenants and provisions (and applicable cross-default provisions) and covenants contained in our credit agreements, in ATXI’s note purchase agreement, and in certain of the Ameren Companies’ indentures and articles of incorporation.
At SeptemberJune 30, 2017,2020, the Ameren Companies were in compliance with the provisions and covenants contained in their credit agreements, indentures, and articles of incorporation, as applicable, and ATXI was in compliance with the provisions and covenants contained in its note purchase agreement.
We consider access to short-term and long-term capital markets to be a significant source of funding for capital requirements not satisfied by cash generated fromprovided by our operating activities. Inability to raise capital on reasonable terms, particularly during times of uncertainty in the capital markets, could negatively affect our ability to maintain and expand our businesses. After assessing its current operating performance, liquidity, and credit ratings (see Credit Ratings below), Ameren, Ameren Missouri, and Ameren Illinois each believes that it will continue to have access to the capital markets.markets on reasonable terms. However, events beyond Ameren’s, Ameren Missouri’s, and Ameren Illinois’ control may create uncertainty in the capital markets or make access to the capital markets uncertain or limited. Such events could increase our cost of capital and adversely affect our ability to access the capital markets.
Dividends
The amount and timing of dividends payable on Ameren’s common stock dividends are within the sole discretion of Ameren’s board of directors. Ameren’s board of directors has not set specific targets or payout parameters when declaring common stock dividends, but it considers various factors, including Ameren’s overall payout ratio, payout ratios of our peers, projected cash flow and potential future cash flow requirements, historical earnings and cash flow, projected earnings, impacts of regulatory orders or legislation, and other key business considerations. Ameren expects its dividend payout ratio to be between 55% and 70% of annual earnings over the next few years. On October 13, 2017, Ameren’s board of directors declared a quarterly common stock dividend of 45.75 cents per share payable on December 29, 2017, to shareholders of record on December 13, 2017, resulting in an annualized equivalent dividend rate of $1.83 per share. The previous annualized equivalent dividend rate, based on the common stock dividend declared and paid in the third quarter of 2017, was $1.76 per share.
See Note 4 – Short-term Debt and Liquidity and Note 5 – Long-term Debt and Equity Financings under Part II, Item 8, of the Form 10-K for additional discussion of covenants and provisions contained in certain of the Ameren Companies’ financial agreements and articles of incorporation that would restrict the Ameren Companies’ payment of dividends in certain circumstances. At SeptemberJune 30, 2017,2020, none of these circumstances existed at Ameren, Ameren Missouri, or Ameren Illinois and, as a result, these companies were not restricted from paying dividends.
The following table presents common stock dividends declared and paid by Ameren Corporation to its common shareholders and by Ameren Missouri and Ameren Illinoissubsidiaries to their parent, Ameren Corporation, for the ninesix months ended SeptemberJune 30, 20172020 and 20162019:
| | | | | | | | | | | |
| Six Months | | |
| 2020 | | 2019 |
| Ameren | $ | 244 | | | $ | 233 | |
| Ameren Missouri | — | | | 100 | |
| | | |
| ATXI | — | | | 15 | |
|
| | | | | | | |
| | Nine Months |
| | 2017 | | 2016 |
| Ameren Missouri | $ | 332 |
| | $ | 285 |
|
| Ameren Illinois | — |
| | 95 |
|
| Ameren | 320 |
| | 309 |
|
Contractual ObligationsCommitments
For a listing of our obligations and commitments, see Other Obligations in Note 9 – Commitments and Contingencies under Part I, Item 1, of this report. See Note 1110 – Retirement Benefits under Part I,II, Item 1,8, of this reportthe Form 10-K for information regarding expected minimum funding levels for our pension plan.
At September 30, 2017, total obligations related to minimum purchase commitments for coal, natural gas, nuclear fuel, purchased power, methane gas, equipment, and meter reading services, among other agreements, at Ameren, Ameren Missouri, and Ameren Illinois were $2,649 million, $1,806 million, and $820 million, respectively.
Off-Balance-SheetOff-balance-sheet Arrangements
At SeptemberJune 30, 2017,2020, none of the Ameren Companies had any significant off-balance-sheet financing arrangements, other than operating leases entered into in the ordinary course of business,forward sale agreement relating to common stock, variable interest entities, letters of credit, and Ameren parent(parent) guarantee arrangements on behalf of its subsidiaries. See Note 1 – Summary of Significant Accounting Policies under Part I, Item 1, of this report for further detail concerning variable interest entities. See Note 5 – Long-Term Debt and Equity under Part II, Item 8, of the Form 10-K for further detail concerning the forward sale agreement relating to common stock.
Credit Ratings
TheOur credit ratings of the Ameren Companies and ATXI assigned by Moody’s and S&P, as applicable, can affect our liquidity, our access to the capital markets and credit markets, our cost of borrowing under our credit facilities and our commercial paper programs, and our collateral posting requirements under commodity contracts.
The following table presents the principal credit ratings of the Ameren Companies and ATXI, by Moody’s and S&P, as applicable, effective on the date of this report:
|
| | | | | | | | | | | | | |
| | Moody’s | | S&P |
| Ameren: | | | | |
| Issuer/corporate credit rating | | Baa1 | | BBB+ |
| Senior unsecured debt | | Baa1 | | BBB |
| Commercial paper | | P-2 | | A-2 |
| Ameren Missouri: | | | | |
| Issuer/corporate credit rating | | Baa1 | | BBB+ |
| Secured debt | | A2 | | A |
| Senior unsecured debt | | Baa1 | | BBB+Not Rated |
| Commercial paper | | P-2 | | A-2 |
| Ameren Illinois: | | | | |
| Issuer/corporate credit rating | | A3 | | BBB+ |
| Secured debt | | A1 | | A |
| Senior unsecured debt | | A3 | | BBB+ |
| Commercial paper | | P-2 | | A-2 |
| ATXI: | | | | |
| Issuer credit rating | | A2 | | Not Rated |
| Senior unsecured debt | | A2 | | Not Rated |
A credit rating is not a recommendation to buy, sell, or hold securities. It should be evaluated independently of any other rating. Ratings are subject to revision or withdrawal at any time by the rating organization.
Collateral Postings
Any weakening of our credit ratings may reduce access to capital and trigger additional collateral postings and prepayments. Such changes may also increase the cost of borrowing, resulting in an adverse effect on earnings. Cash collateral postings and prepayments made with external parties, including postings related to exchange-traded contracts, and cash collateral posted by external parties were immaterial at Ameren, Ameren Missouri, and Ameren Illinois at SeptemberJune 30, 2017.2020. A sub-investment-grade issuer or senior unsecured debt rating (whether(below “Baa3” from Moody’s or below “BBB-” from S&P or below “Baa3” from Moody’s)&P) at SeptemberJune 30, 2017,2020, could have resulted in Ameren, Ameren Missouri, or Ameren Illinois being required to post additional collateral or other assurances for certain trade obligations amounting to $89$170 million, $48$144 million, and $41$26 million, respectively.
Changes in commodity prices could trigger additional collateral postings and prepayments. Based on credit ratings at SeptemberJune 30, 2017,2020, if market prices were 15% higher or lower than SeptemberJune 30, 20172020 levels in the next 12 months and 20% higher or lower thereafter through the end of the term of the commodity contracts, then Ameren, Ameren Missouri, or Ameren Illinois could be required to post an immaterial amount, compared to each company’s liquidity, of collateral or other assurances for certain trade obligations.
OUTLOOK
We seek to earn competitive returns on investments in our businesses. We seek to improve our regulatory frameworks and cost recovery mechanisms and simultaneously pursuing constructive regulatory outcomes within existing frameworks, while also advocating for responsible energy policies. We seek to align our overall spending, both operating and capital, with economic conditions and with regulatory frameworks established by our regulators and to create and capitalize on investment opportunities for the benefit of our customers and shareholders. We focus on minimizing the gap between allowed and earned returns on equity and allocating capital resources to our business opportunities that we expect to offer the most attractive risk-adjusted return potential.
As a part of Ameren's strategic plan, we pursue projects to meet our customer energy needs and to improve electric and natural gas system reliability, safety, and security within our service territories, as well as evaluate competitive electric transmission investment opportunities outside of these territories, including investments outside of MISO as they arise. Additionally, Ameren Missouri will make investments over time that will enable it to transition to a more diverse energy generation portfolio.
Below are some key trends, events, and uncertainties that aremay reasonably likely to affect our results of operations, financial condition, or liquidity, as well as our ability to achieve strategic and financial objectives, for 20172020 and beyond.
The continued effect of the COVID-19 pandemic on our results of operations, financial position, and liquidity in subsequent periods will depend on its severity and longevity, future regulatory or legislative actions with respect thereto, and the resulting impact on business, economic, and capital market conditions. We continue to monitor the impacts the pandemic is having on our businesses, including but not limited to potential impacts on our liquidity and financing plans; demand for residential, commercial, and industrial electric and natural gas services; extended deferred payment arrangements and additional financial assistance programs for customers; bad debt expense; supply chain operations; the availability of our employees and contractors; counterparty credit; capital construction; infrastructure operations and maintenance; energy efficiency programs; and pension valuations. For additional information regarding recent rate orders, lawsuits, and pending requests filed with state and federal regulatory commissions, including those discussed below, see Note 2 – Rate and Regulatory Matters under Part I, Item 1, of this report and Note 2 – Rate and Regulatory Matters under Part II, Item 8, of the Form 10-K.
Operations
Ameren continues to invest•In the first six months of 2020, we have experienced a net decrease in FERC-regulated electric transmission. MISO has approved three electric transmission projectsour sales volumes, which have been, and continue to be, developedaffected by ATXI. The Illinois Rivers project involves the constructionCOVID-19 pandemic, among other things. Further, our customers' payment for services has been adversely affected by the COVID-19 pandemic, which has led to an increase in our accounts receivable balances that are past due or that are a part of a transmission linedeferred payment arrangement. Because of Ameren Illinois' and ATXI's regulatory frameworks, revenues are largely decoupled from eastern Missouri across the statechanges in sales volumes. Additionally, bad debt write-offs, net of Illinois to western Indiana. Construction activitiesany subsequent recoveries, at Ameren Illinois' electric distribution and natural gas distribution businesses are recoverable through regulatory mechanisms. In 2020, Ameren Illinois' electric bad debt rider provides for the Illinois Rivers projectrecovery of bad debt expense. However, earnings at Ameren Missouri are continuingexposed to sales volume changes and increases in bad debt expense, which could result in higher bad debt write-offs. See the Results of Operations section above for additional information on schedule,our accounts receivable balances and the last section of this project is expectedchanges in Ameren Missouri's sales volumes in 2020, compared to be completed by 2019. The Spoon River project, located in northwest Illinois, and the Mark Twain project, located in northeast Missouri and connecting the Illinois Rivers project to Iowa, are the other two MISO-approved projects to be constructed by ATXI. Construction activities for the Spoon River project are continuing on schedule, and the project is expected to be completed in 2018. SeeAdditionally, see Note 2 – Rate and Regulatory Matters under Part I, Item 1, of this report for information regardingon our reinstatement of customer disconnection and late fee charges for non-payment, as well as a June 2020 ICC order in a service disconnection moratorium proceeding, which required Ameren Illinois to implement more flexible credit and collection practices and allowed for recovery of costs incurred related to the Mark Twain projectCOVID-19 pandemic and its approval processforgone late fees.
•The PISA permits Ameren Missouri to defer and recover 85% of the depreciation expense and a return at the applicable WACC on investments in certain property, plant, and equipment placed in service after September 1, 2018, and not included in base rates. The regulatory asset for accumulated PISA deferrals also earns a return at the applicable WACC, with all approved PISA deferrals added to rate base prospectively and recovered over a period of 20 years following a regulatory rate review. Additionally, under the RESRAM, Ameren Missouri is permitted to recover the 15% of depreciation expense and a return at the applicable WACC for investments in renewable generation plant placed in service and not recovered under the PISA. Accumulated RESRAM deferrals earn carrying costs at short-term interest rates. The PISA and the Illinois Rivers project.RESRAM mitigate the effects of regulatory lag between regulatory rate reviews. Those investments not eligible for recovery under the PISA and the remaining 15% of certain property, plant, and equipment placed in service, unless eligible for recovery under the RESRAM, remain subject to regulatory lag. Ameren Missouri recognizes the cost of debt on PISA deferrals in revenue, instead of using the applicable WACC, with the difference recognized in revenues when recovery of such deferrals is reflected in customer rates. As a result of the PISA election, additional provisions of the law apply to Ameren Missouri, including limitations on electric customer rate increases. Both the rate increase limitation and the PISA are effective through December 2023, unless Ameren Missouri requests and the MoPSC approves an extension through December 2028.
•In February 2020, Ameren Missouri filed an update to its Smart Energy Plan with the MoPSC, which includes a five-year capital investment overview with a detailed one-year plan for 2020. The plan is designed to upgrade Ameren Missouri’s electric infrastructure
and includes investments that will upgrade the grid and accommodate more renewable energy. Investments under the plan are expected to total investmentapproximately $7.6 billion over the five-year period from 2020 through 2024, with expenditures largely recoverable under the PISA and the RESRAM. The planned investments in all2024 included in the five-year range above are based on the assumption that Ameren Missouri requests and receives MoPSC approval of an extension of the PISA through December 2028. As a part of its Smart Energy Plan, Ameren Missouri expects to build solar generation facilities, including utility scale facilities and nonresidential customer site facilities. In September 2019, Ameren Missouri filed for certificates of convenience and necessity with the MoPSC to build three projectssolar-plus-storage facilities. In June 2020, Ameren Missouri withdrew its application for the certificates of convenience and necessity following intervenor feedback. Ameren Missouri is evaluating new solar generation facilities as a part of its integrated resource plan, which is expected to be more than $540filed in September 2020.Also in 2019, the MoPSC approved Ameren Missouri’s Charge Ahead program, which provides incentives for the development of over 1,000 electric vehicle charging stations along highways and at various locations in communities throughout Ameren Missouri’s service territory. The purpose of the program is to promote the development of electric vehicle charging infrastructure that will enable long-distance electric vehicle travel and encourage electrification of the transportation sector.
•In 2018, the MoPSC issued an order approving Ameren Missouri’s MEEIA 2019 plan. The initial plan included a portfolio of customer energy-efficiency programs through December 2021 and low-income customer energy-efficiency programs through December 2024, along with a rate-adjustment mechanism. Ameren Missouri intends to invest $226 million over the life of the plan, including $65 million per year through 2021 and $70 million in 2022. The plan includes the continued use of the MEEIA rider, which allows Ameren Missouri to collect from, or refund to, customers any difference in actual MEEIA program costs and related lost electric margins and the amounts collected from customers. In addition, the plan includes a performance incentive that provides Ameren Missouri an opportunity to earn additional revenues by achieving certain customer energy-efficiency goals. In August 2020, the MoPSC issued an order approving a unanimous stipulation and agreement establishing performance incentives for the 2022 program year. The order also approved Ameren Missouri’s energy savings results for the first year of the MEEIA 2019 program. As a result of this order and in accordance with revenue recognition guidance, Ameren Missouri will recognize revenues of $6 million in the third quarter of 2020. If the target goals are achieved for 2020, 2021, and 2022, additional revenues of $10 million, $13 million, and $11 million would be recognized in 2021, 2022, and 2023, respectively. Incremental additional revenues of $3 million, $3 million, and $1 million may be earned for 2020, 2021, and 2022, respectively, and would be recognized in the respective following year if Ameren Missouri exceeds its targeted energy savings goals. Ameren Missouri’s ability to achieve and/or exceed targeted energy savings goals could be affected by the COVID-19 pandemic. Ameren Missouri recognized $28 million, $11 million, and $37 million in revenues related to MEEIA performance incentives in 2016, 2018, and 2019, respectively.
•In March 2020, the MoPSC issued an order in Ameren Missouri’s July 2019 electric service regulatory rate review, resulting in a decrease of $32 million to Ameren Missouri's annual revenue requirement for electric retail service. The order reduced the annualized base level of net energy costs pursuant to the FAC by approximately $115 million from the base level established in the MoPSC’s March 2017 through 2019.electric rate order. The order also changed the annualized regulatory asset and liability amortization amounts and the base level of expenses for regulatory tracking mechanisms. On an annualized basis, these changes reflect approximately$20 millionof increased revenues and approximate decreases in purchased power expenses of$15 million, other operating and maintenance expenses of$60 million, and income tax expenses of $20 million. Additionally, the annual revenue requirement incorporated increases of approximately $50 million for the reduction in sales volumes resulting from MEEIA programs and approximately $50 million of depreciation and amortization expense for amounts previously deferred under PISA. The increase in the annual revenue requirement related to the MEEIA programs is seasonally weighted to the summer. One of the stipulation and agreements approved by the MoPSC’s March 2020 order states that the net impact of the revenue and expense changes noted above reflects a 9.4% to 9.8% ROE on an unspecified percent of common equity applicable to rate base.The new rates, base level of expenses, and amortizations became effective on April 1, 2020. In April 2020, the MoPSC issued another order in Ameren Illinois expectsMissouri’s July 2019 electric service regulatory rate review, reaffirming the existing percentage of net energy cost variances allowed to invest $2.2 billion in electric transmission assets from 2017 through 2021 to replace aging infrastructure and improve reliability.be recovered or refunded under the FAC.
Both •Ameren Illinois and ATXI use a forward-looking rate calculation with an annual revenue requirement reconciliation for each company’s electric transmission business. Based on the preliminaryexpected rate calculations that will become effective on January 1, 2018,base growth and the currently allowed 10.82% return on common equity,10.52% ROE, the 2018 revenue requirement that is expected to be collectedrequirements included in 2020 rates for Ameren Illinois’ and ATXI’s electric transmission business is $297 million. The 2018businesses are $313 million and $192 million, respectively. These revenue requirements represent an increase in Ameren Illinois’ and ATXI’s revenue requirements of $16 million and $15 million, respectively, from the revenue requirements reflected in 2019 rates, reflect a $38 million increase over the 2017 revenue requirement, primarily due to expected rate base growth. These rates reflect a capital structure comprised of 51.6% common equitywill affect Ameren Illinois’ and ATXI’s cash receipts during 2020, but will not determine their respective electric transmission service operating revenues, which will instead be based on 2020 actual recoverable costs, rate base, and a projected averagereturn on rate base of $1.6 billion. Based onat the preliminary rate calculations that will become effective on January 1, 2018, andapplicable WACC as calculated under the currentlyFERC formula ratemaking framework.
•In May 2020, the FERC issued an order in a complaint case filed in November 2013, which set the allowed 10.82% return on equity, the 2018 revenue requirement that is expected to be collected in rates for ATXI’s electric transmission business is $197 million. The 2018 rates represents a $27 million increase over the 2017 revenue requirement, primarily due to rate base growth. These rates reflect a capital structure comprised of 56.2% common equity and a projected average rate base of $1.3 billion, reflecting additional investments in the Illinois Rivers and Spoon River projects.
The return on common equityROE for MISO transmission owners, including Ameren Illinois and ATXI, wasat 10.02%, superseding the subject of two FERC complaint proceedings, the November 2013 complaint case9.88% previously ordered, and the February 2015 complaint case, that each challenged the allowed base return on common equity. In September 2016, the FERC issued a final order in the November 2013 complaint case, which lowered the allowed base return on common equityrequired refunds, with interest, for the 15-month period ofperiods November 2013 to February 2015 and from late September 2016 forward. As a result of this order, Ameren and Ameren Illinois expect to 10.32%, or a 10.82%pay total allowed return on common equityrefunds of approximately $28 million and $16 million. In June 2020, various parties filed requests for rehearing with the inclusion of a 50 basis point incentive adder for participation in an RTO. The order required customer refunds, with interest, to be issued for that 15-month period. Refunds forFERC, challenging the November 2013 complaint case were issued in the first six months of 2017. In June 2016, an administrative law judge issued an initial decision in the February 2015 complaint case, which, if approvednew ROE methodology established by the FERC, would lower the allowed base return on common equity for the 15-month period of February 2015 to May 2016 to 9.70%, or a 10.20% total allowed return on equity with the inclusion of a 50 basis point incentive adder for participation in2020 order. In July 2020, Ameren Missouri,
Ameren Illinois, and ATXI filed an RTO, and require customer refunds, with interest, for that 15-month period. The timingappeal of the issuance of the finalMay 2020 order in the February 2015 complaint case is uncertain for two reasons. First, while the FERC reestablished a quorum of commissioners in August 2017 after six months without a quorum, the FERC is under no deadline to issue a final order. Second, in the second quarter of 2017, the United States Court of Appeals for the District of Columbia Circuit vacated and remandedchallenging the refunds required for the period from September 2016 to May 2020. The court is under no deadline to address the FERC an order in a separate case in whichappeal. The allowed ROE may also be affected by the FERC established theFERC’s Notice of Inquiry regarding its allowed base returnROE policy issued in 2019, or the FERC’s Notice of Proposed Rulemaking on common equity methodology usedits transmission incentives policy issued in the two MISO complaint cases described above. In addition, in September 2017, MISO transmission owners, including Ameren Missouri, Ameren Illinois, and ATXI, filed a motion to dismiss the February 2015 complaint case with the FERC. See Note 2 – Rate and Regulatory Matters under Part I, Item 1, of this report for information regarding the MISO transmission owners’ motion to dismiss the February 2015 complaint case.March 2020. A 50 basis point reductionchange in the FERC-allowed base return on common equityROE would reduce Ameren'saffect Ameren’s and Ameren Illinois'Illinois’ annual earningsnet income by an estimated $7$10 million and $4$6 million, respectively, based on each company’s 20172020 projected rate base.
•Ameren andIllinois’ electric distribution service performance-based formula ratemaking framework allows Ameren Illinois recorded currentto reconcile electric distribution service rates to its actual revenue requirement on an annual basis. If a given year’s revenue requirement varies from the amount collected from customers, an adjustment is made to electric operating revenues with an offset to a regulatory liabilities on their respective September 30, 2017asset or liability to reflect that year’s actual revenue requirement, independent of actual sales volumes. The regulatory balance sheets, representing their estimateis then collected from, or refunded to, customers within two years from the end of the expected refunds relatedyear. Unless extended, the formula ratemaking framework expires at the end of 2022. If not extended, Ameren Illinois would then be required to establish future rates through a traditional regulatory rate review with the February 2015 complaint case.
ICC. The decoupling provisions extend beyond the end of the formula ratemaking by law, which ensures that Ameren Illinois’ electric distribution revenues authorized in a regulatory rate review are not affected by changes in sales volumes.•In March 2017,2019, the MoPSCICC issued an order approving a unanimous stipulation and agreement in Ameren Missouri’s July 2016 regulatory rate review. The order resulted inIllinois’ annual update filing that approved a $3.4 billion revenue requirement, which is a $92$7 million increasedecrease in Ameren Missouri’s annual revenue requirement forIllinois’ electric distribution service compared to its prior revenue requirement establishedrates beginning in the MoPSC's April 2015 electric rate order. The new rates, base level of expenses, and amortizations became effective on April 1, 2017. Excluding cost reductions associated with reduced sales volumes, the base level of net energy costs decrease by $54 million from the base level established in the MoPSC's April 2015 electric rate order. Changes in amortizations and the base level of expenses for the other regulatory tracking mechanisms, including extending the amortization period of certain regulatory assets, reduced expenses by $26 million from the base levels established in the MoPSC's April 2015 electric rate order.
January 2020. Illinois law provides for an annual reconciliation of the electric distribution revenue requirement as is necessary to reflect the actual costs incurred and investmenta return at the applicable WACC on year-end rate base in a given year with the revenue requirement that was reflected in customer rates for that year. Consequently, Ameren Illinois' 2017Illinois’ 2020 electric distribution service revenues will be based on its 20172020 actual recoverable costs, 2020 year-end rate base, and a return on common equityat the applicable WACC as calculated under the Illinois performance-based formula ratemaking framework. The 2017 revenue
requirement is expectedAs of June 30, 2020, Ameren Illinois expects its 2020 year-end rate base to be higher than the 2016$3.4 billion. The 2020 revenue requirement because of an expected increase in recoverable costs, expected rate base growth of 5%, and an expected increase in the monthly average of 30-year United States Treasury bonds. The 2017 revenue requirement reconciliation is expected to result in a regulatory asset that will be collected from, or refunded to, customers in 2019.2022. A 50 basis point change in the annual average of the monthly yields of the 30-year United States Treasury bonds would result in an estimated $7$9 million change in Ameren'sAmeren’s and Ameren Illinois'Illinois’ annual net income, based on Ameren Illinois’ 20172020 projected year-end rate base. Ameren Illinois’ allowed ROE for the first half of 2020 and 2019 was based on an expected annual average of the monthly yields of the 30-year United States Treasury bonds of 1.6% and 2.8%, respectively.
•In April 2017,2020, Ameren Illinois filed with the ICC its annual electric distribution service formula rate update to establishreduce its rates by $45 million with the revenue requirement used for 2018 rates. In June 2017, theICC. An ICC staff submitted its calculation of the revenue requirement, which Ameren Illinois supporteddecision in its revised July 2017 filing, and recommended a decrease to the electric distribution service revenue requirement. Pending ICC approval, this update filing will result in a $17 milliondecrease in Ameren Illinois’ electric distribution service revenue requirement beginning inproceeding is expected by December 2020, with new rates effective January 2018.2021. These rates will affect Ameren Illinois' cash receipts during 2018,2021, but will not determine itsaffect electric distribution service operating revenues, which will instead be based on its 20182021 actual recoverable costs, 2021 year-end rate base, and a return on common equityat the applicable WACC as calculated under the Illinois performance-based formula ratemaking framework.
•In November 2017, an administrative law judge issued a proposed order that was consistent with Ameren Illinois’ revised July 2017 filing. An ICC decision on the revenue requirement used for 2018 rates is expected by December 2017.
Beginning in 2017, the FEJA provides that2020, Ameren Illinois recovers, withinfiled a revised request seeking to increase its annual revenues for natural gas delivery service by $96 million, which includes an estimated $46 million of annual revenues that would otherwise be recovered under the following two years, its electric distribution revenue requirement for a given year, independent of actual sales volumes. In connectionQIP and other riders. A decision by the ICC in this proceeding is required by January 2021, with the decoupling provisions of the FEJA,new rates expected to be effective in February 2021. Ameren Illinois changed its method usedcannot predict the level of any delivery service rate change the ICC may approve, nor whether any rate change that may eventually be approved will be sufficient to recognize its interim period revenue. Ameren Illinois now recognizes revenues consistent with the timing of incurred electric distribution recoverable costs and recognizes revenue associated with the expected return on its rate base ratably over the year. As a result of this change in recognition of the interim period revenue for the IEIMA formula rate framework, as modified by FEJA, Ameren Illinois incurred quarterly year-over-year increases to earnings in 2017 in comparison to 2016 for the first and second quarters and a decrease to earnings in the third quarter. Ameren Illinois expects an estimated $28 million increase to earnings in the fourth quarter of 2017 in comparison to 2016 as a result of the change. The change in interim period revenue recognition will not impact 2017’s annual earnings.
Beginning in June 2017, the FEJA allowsenable Ameren Illinois to earn a reasonable return on investments when the rate changes go into effect.
•Ameren Illinois earns a return at the applicable WACC on its electric energy efficiencyenergy-efficiency program investments. Ameren IllinoisIllinois’ electric energy efficiencyenergy-efficiency investments will beare deferred as a regulatory asset and will earn a return at the company’s weighted average cost of capital,applicable WACC, with the equity returnROE based on the annual average of the monthly average yieldyields of the 30-year United States Treasury bonds plus 580 basis points. The equity portion of Ameren Illinois’ returnallowed ROE on electric energy efficiencyenergy-efficiency investments can also be increased or decreased by up to 200 basis points, baseddepending on the achievement of annual energy savings goals. Based on Ameren Illinois’ 2018 through 2021 energy efficiency plan and a formula provided ingoals, which may be affected by the COVID-19 pandemic. Pursuant to the FEJA, Ameren Illinois estimates it can annuallyplans to invest up to $99approximately $100 million from 2018per year in electric energy-efficiency programs through 2024, and will earn a return on those investments. While the ICC has approved a plan consistent with this spending level through 2021, up to $107 million annually from 2022 through 2025, and up to $114 million annually from 2026 through 2030. Thethe ICC has the ability to lowerreduce the amount of electric energy efficiency savingenergy-efficiency savings goals in future plan program years if there are insufficient cost effective measurescost-effective programs available, or if achievingwhich could reduce the savings goals would require investment levels that exceed the formula amounts shown above.investments in electric energy-efficiency programs. The electric energy efficiencyenergy-efficiency program investments and the return on those investments will be recoveredare collected from customers through a rider and willare not be included in the IEIMA formula rate process. See Note 2 – Rate and Regulatory Matters under Part I, Item 1, of this report for information regarding Ameren Illinois approved energy efficiency program for 2018 through 2021.
In July 2017, Illinois enacted a law that increased the state's corporate income tax rate from 7.75% to 9.5% as of July 1, 2017. The law made the increase in the state’s corporate income taxrate, which was previously scheduled to decrease to 7.3% in 2025, permanent. In July 2017, Ameren recordedan expense of $14 million at Ameren (parent) due to the revaluation of accumulated deferred taxes and the estimated state apportionment of such taxes. Beyond this expense, Ameren does not expect this tax increase to have a material impact on its consolidated net income prospectively. The tax increase is not expected to materially impact the earnings of the Ameren Illinois Electric Distribution, the Ameren Transmission, or the Ameren Illinois Transmission segments, since these businesses operate underelectric distribution service performance-based formula ratemaking frameworks. The tax increase is expectedframework.
•In February 2020, the MoPSC issued an order approving a stipulation and agreement allowing Ameren Missouri to unfavorably affect 2017 net income of the Ameren Illinois Natural Gas segment by less than $1 million. The Ameren Illinois Natural Gas segment will continuedefer and amortize maintenance expenses related to be impacted by the tax increase by approximately $1 million annually until customer rates are reset in a rate review to reflect the increased taxes.
In early 2018, Ameren Illinois expects to file for a natural gas regulatory rate review with the ICC. Ameren Illinois’ current allowed return on equity for natural gas delivery service is 9.60%, with a capital structure of 50% common equity, a rate base of $1.2 billion, and a 2016 future test year.
Ameren Missouri's scheduled refueling and maintenance outageoutages at its Callaway energy center began in October 2017.Energy Center. Maintenance expenses associated with the fall 2020 refueling and maintenance outage are being deferred, as incurred, as a regulatory asset, and will be amortized after completion of the outage. Maintenance expenses will be amortized over the period between refueling and maintenance outages, which is approximately 18 months.Ameren Missouri expects to incur $32approximately $40 million ofin maintenance expenses which approximatesrelated to the cost of the spring 2016fall 2020 outage. During a scheduled outage, which occurs every 18 months, maintenance expenses increase relative to non-outage years. Additionally, depending on the availability of its other generation sources and the market
prices for power, Ameren Missouri'sMissouri’s purchased power costs may increase and the amount of excess power available for sale may decrease versus non-outage years. Changes in purchased power costs and excess
power available for sale are included in the FAC, which results in limited impacts to earnings. Ameren Missouri does not have a scheduledPrior to 2020, maintenance expenses for refueling and maintenance outage in 2018.outages were expensed as incurred.
•Ameren Missouri and Ameren Illinois continue to make infrastructure investments and expect to seek increases to electric and natural gas rates to recover the cost of investments and earn an adequate return. Ameren Missouri and Ameren Illinois will also seek new, or to maintain existing, legislative solutions to address regulatory lag and to support investment in their utility infrastructure for the benefit of their customers. Ameren Missouri and Ameren Illinois continue to face cost recovery pressures, including limited economic growth in their service territories, economic impacts of COVID-19, customer conservation efforts, the impacts of additional customer energy-efficiency programs, and increased customer use of increasingly cost-effective technological advances, including private generation and energy storage. However, over the long-term, we expect an approximately $15 million decrease in annual interest chargesthe decreased demand to be partially offset by increased demand resulting from increased electrification of the economy for efficiencies and as a means to address economywide CO2 emission concerns. Increased investments, including expected future investments for environmental compliance, system reliability improvements, and potential new generation sources, result of the repayment of $425 million of Ameren Missouri’s 6.40% senior secured notes at maturityin rate base and issuance of $400 million 2.95% senior secured notes in 2017. In 2018, Ameren Missouri expects to refinance maturing long-term debt with lower-cost long-term debt, which would further reduce Ameren’srevenue growth but also higher depreciation and Ameren Missouri’s annual interest charges.
| |
• | As we continue to make infrastructure investments and to experience cost increases, Ameren Missouri and Ameren Illinois expect to seek regular electric and natural gas rate increases and timely cost recovery and tracking mechanisms from their regulators. Ameren Missouri and Ameren Illinois will also seek legislative solutions, as necessary, to address regulatory lag and to support investment in their utility infrastructure for the benefit of their customers. Ameren Missouri and Ameren Illinois continue to face cost recovery pressures, including limited economic growth in their service territories, customer conservation efforts, the impacts of additional customer energy efficiency programs, and increased customer use of increasingly cost-effective technological advances including private generation and storage. However, we expect the decreased demand to be partially offset by increased demand resulting from increased electrification of the economy as a means to address CO2 emission concerns. Increased investments, including expected future investments for environmental compliance, system reliability improvements, and potential new generation sources, result in rate base earnings growth but also higher depreciation and financing costs. Increased costs are also expected from rising employee benefit costs, higher property taxes, and higher state income taxes, among other costs.
|
For additional information regarding recent rate orders, lawsuits, the Westinghouse bankruptcy filing, and pending requests filed with state and federal regulatory commissions, see Note 2 – Rate and Regulatory Matters and Note 10 – Callaway Energy Center under Part I, Item 1, of this report and Note 2 – Rate and Regulatory Matters under Part II, Item 8, of the Form 10-K.financing costs.
Liquidity and Capital Resources
Ameren Missouri files•Our customers’ payment for our services has been adversely affected by the COVID-19 pandemic, resulting in a non-binding 20-year integrated resource plan withdecrease to our cash flow from operations. See the MoPSC every three years.Results of Operations section above for additional information on our accounts receivable balances. Further, our liquidity and our capital expenditure plans could be adversely affected by other impacts resulting from the COVID-19 pandemic, including but not limited to potential impacts on our ability to access the capital markets on reasonable terms and when needed, Ameren Missouri’s integrated resource plan filed withexpected wind generation acquisitions, and the MoPSC in September 2017 includestiming of tax payments and the utilization of tax credits. We expect to make significant capital expenditures to improve our electric and natural gas utility infrastructure, however, disruptions to the capital markets and the ability of our suppliers and contractors to perform as required under their contracts could impact the execution of our capital investment strategy. For further discussion on the impacts to our ability to access the capital markets, Ameren Missouri’s preferred plan for meeting customers’ projected long-term energy needs in a cost-effective fashion that maintains system reliability as itexpected wind generation acquisitions, and the timing of tax payments and the utilization of tax credits, see below.
•Ameren Missouri’s 2017 IRP targets cleaner and more diverse sources of energy generation.generation, including solar, wind, natural gas, hydro, and nuclear power. It also includes expanding renewable sources by adding 700 megawatts of wind generation by the end of 2020 in Missouri and adding 100 megawatts of solar generation by 2027. These new renewable energy sources would also support Ameren Missouri’s compliance with the state of Missouri’s requirement of achieving 15% of native load sales from renewable energy sources by 2021, subject to customer rate increase limitations. Ameren Missouri’s plan contemplates adding at least 700 megawatts of wind generation by 2020, as well as 100 megawatts of solar generation over the next 10 years, with 50 megawatts anticipated to come online by 2025. The new wind generation is expected to be located in Missouri and neighboring states. The source, location, and cost of the new wind generation, among other items, remain subject to reaching agreements with developers.Based on current and projected market prices for energy and for wind and solar generation technologies, among other factors, Ameren Missouri expects its ownership of these renewable resources would represent the lowest-cost alternativeoption for customers. The plan also includesprovides for the expected implementation of continued customer energy efficiencyenergy-efficiency programs. Ameren Missouri’s plan for the addition of renewable resources could be impactedaffected by, among other factors: the availability of federal production tax credits related to renewable energy and its ability to use such credits; the cost of wind and solar generation technologies, as well as energy prices; Ameren Missouri’s ability to obtain interconnection agreements with MISO or other RTOs, including the cost of such interconnections; and Ameren Missouri’s ability to obtain a certificate of convenience and necessity from the MoPSC, for projects located in Missouri, orand any other required project approvals.approvals; the ability of developers to meet contractual commitments and timely complete projects, which is dependent upon the availability of necessary materials and equipment, including those that are affected by the disruptions in the global supply chain caused by the COVID-19 pandemic, among other things; the availability of federal production and investment tax credits related to renewable energy and Ameren Missouri’s ability to use such credits; the cost of wind and solar generation technologies; energy prices; and Ameren Missouri’s ability to obtain timely interconnection agreements with the MISO or other RTOs at an acceptable cost. Ameren Missouri expects to file its next integrated resource plan in September 2020. Ameren Missouri will seek stakeholder feedback and assess different scenarios to meet future energy needs, which will be used to create an updated plan for its current generation portfolio and ongoing transition to cleaner sources of energy.
•In connection with the 2017 IRP filing, Ameren Missouri established a goal of reducing CO2 emissions 80% by 2050 from a 2005 base level. Ameren Missouri is also targeting a 35% CO2 emission reduction by 2030 and a 50% reduction by 2040 from the 2005 level. In order to meet these goals, among other things, Ameren Missouri expects to retire its coal-fired generation at the end of each energy center’s useful life. As indicated in the 2017 IRP, the Meramec, Sioux, Labadie, and Rush Island energy centers are expected to be retired in 2022, 2033, 2042, and 2045, respectively. The next integrated resource plan is expected to be filed in September 2020.
•Consistent with its 2017 IRP filing, Ameren Missouri entered into build-transfer agreements to acquire, after construction, an up-to 300-megawatt wind generation facility and an up-to 400-megawatt wind generation facility in 2019 and 2018, respectively. Delays to the original construction schedule have occurred in 2020 as a result of changes in supply and construction activities. Ameren Missouri and the developers continue to monitor the impact to each project schedule. Ameren Missouri and the developers continue to monitor the impact to each project schedule. Ameren Missouri expects the up-to400-megawatt project and a majority of the up-to 300 megawatt project to be placed in-service by the end of 2020. However, at this time, due to manufacturing, shipping, and other supply chain issues, and based on an updated schedule from the developer, Ameren Missouri expects a portion of the up-to 300-megawatt project,
| |
• | In connection with the integrated resource plan filing, discussed above, Ameren Missouri established a goal of reducing CO2 emissions 80% by 2050 from a 2005 base level. To meet this goal, Ameren Missouri is targeting a 35% CO2 emission reduction by 2030 and a 50% reduction by 2040 from the 2005 level by retiring coal-fired generation at the end of its useful life.
|
representing approximately $100 million of investment, to be placed in-service in the first quarter of 2021.See discussion below related to production tax credits.
•Through 2021,2024, we expect to make significant capital expenditures to improve our electric and natural gas utility infrastructure, with a major portion directed to our transmission and distribution systems. We estimate that we will invest in total up to $11.2$16.6 billion (Ameren Missouri – up to $4.2$8.4 billion; Ameren Illinois – up to $6.4$8.0 billion; ATXI – up to $0.6$0.2 billion) of capital expenditures during the period from 20172020 through 2021. These estimates do not reflect the potential additional investments identified in2024. Ameren’s and Ameren Missouri’s integrated resource planestimates exclude any capital expenditures related to pollution control equipment that may be required as a result of the NSR and Clean Air Act litigation discussed above, whichin Note 9 – Commitments and Contingencies under Part I, Item 1, of this report.
•Environmental regulations, including those related to CO2 emissions, or other actions taken by the EPA, could represent incremental investmentsresult in significant increases in capital expenditures and operating costs. Certain of approximately $1 billionthese regulations are being challenged through litigation, or reviewed or recommended for repeal by the EPA, or new replacement or alternative regulations are being contemplated, proposed, or adopted by the EPA and state regulators. The ultimate implementation of any of these regulations, as well as the timing of any such implementation, is uncertain. However, the individual or combined effects of existing and new environmental regulations could result in significant capital expenditures, increased operating costs, or the closure or alteration of some of Ameren Missouri’s coal-fired energy centers. Ameren Missouri’s capital expenditures are subject to MoPSC prudence reviews, which could result in cost disallowances as well as regulatory approval. Ameren and Ameren Missouri will evaluate alternatives for funding these potential additional investments.
| |
• | Environmental regulations, including those related to CO2 emissions, or other actions taken by the EPA could result in significant increases in capital expenditures and operating costs. Certain of these regulations are being challenged through litigation or are being reviewed by the EPA, so their ultimate implementation, as well as the timing of any such implementation, is uncertain. However, the individual or combined effects of existing environmental regulations could result in significant capital expenditures, increased operating costs, the closure or alteration of some of Ameren Missouri's coal-fired energy centers, or require further capital investment. Ameren Missouri's capital expenditures are subject to MoPSC prudence reviews, which could result in cost disallowances as well as regulatory
|
lag. The cost of Ameren Illinois’ purchased power and natural gas purchased for resale could increase. However, Ameren Illinois expects that these costs would be recovered from customers with no material adverse effect on its results of operations, financial position, or liquidity. Ameren'sAmeren’s and Ameren Missouri'sMissouri’s earnings could benefit from increased investment to comply with environmental regulations if those investments are reflected and recovered on a timely basis in customer rates.
•The Ameren Companies have multiyear credit agreements that cumulatively provide $2.1$2.3 billion of credit through December 2021,2024, subject to a 364-day repayment term in the case offor Ameren Missouri and Ameren Illinois.Illinois, with the option to seek incremental commitments to increase the cumulative credit provided to $2.7 billion. See Note 43 – Short-term Debt and Liquidity under Part I, Item 1, of this report for additional information regarding the Credit Agreements. By the end of 2018, $378 million and $707Ameren (parent)’s $350 million of senior securedunsecured notes mature in November 2020, and are scheduledexpected to mature atbe repaid using a portion of the proceeds from Ameren (parent)’s April 2020 issuance of $800 million of senior unsecured notes. The Ameren Companies have no additional maturities of long-term debt until 2022. With the recently completed Ameren Missouri and Ameren Illinois, respectively. Ameren Missouri(parent) debt issuances and Ameren Illinois expect to refinance these senior secured notes,availability under the Credit Agreements, as well as a portionanticipated proceeds from the settlement of any outstanding short-term debt at the time, with long-term debt.forward sale agreement discussed below, Ameren, Ameren Missouri, and Ameren Illinois believe that their liquidity is adequate given their expected operating cash flows, capital expenditures, including the expected wind generation acquisitions, and related financing plans. The Ameren Companies continue to monitor the effect of the COVID-19 pandemic on their liquidity, including as a result of decreased sales and increased customer nonpayment. To date, the Ameren Companies have been able to access the capital markets on reasonable terms when needed. However, there can be no assurance that significant changes in economic conditions, disruptions in the capital and credit markets, or other unforeseen events will not materially affect their ability to execute their expected operating, capital, or financing plans.
In December 2015, a federal tax law was enacted that authorized the continued use of bonus depreciation, which allows for an acceleration of deductions for tax purposes at a rate of 50% through 2017. The rate will be reduced to 40% in 2018 and to 30% in 2019. Bonus depreciation will be phased out in 2020 unless a new law is enacted. Based on existing tax laws, Ameren expects to use this incremental cash flow to make capital investments in utility infrastructure for the benefit of its customers. Without these investments, bonus depreciation would reduce rate base, which reduces our revenue requirements and future earnings growth. The impact of bonus depreciation on the Ameren Companies will vary based on investment levels at each company.
As of September 30, 2017, Ameren had $450 million in tax benefits from federal and state net operating loss carryforwards (Ameren Missouri – $4 million and Ameren Illinois – $115 million) and $116 million in federal and state income tax credit carryforwards (Ameren Missouri – $31 million and Ameren Illinois – $2 million). In addition, Ameren has $7 million of expected state income tax refunds and state overpayments. Consistent with the tax allocation agreement between Ameren and its subsidiaries, these carryforwards are expected to partially offset income tax liabilities for Ameren Missouri and Ameren Illinois until 2021. These tax benefits, primarily at the Ameren (parent) level, when realized, would be available to support funding Ameren Transmission investments. Based on existing tax laws, Ameren does not expect to make material federal income tax payments until 2021 and Ameren and Ameren Missouri do not expect to make material state income tax payments until 2021. Due to differences between federal and state tax laws, Ameren and Ameren Illinois expect to begin making material state income tax payments in 2018.
Since the 2016 presidential and congressional elections, there have been various legislative proposals to reform the federal income tax code. Tax law changes that would affect our businesses include those changes associated with the statutory federal corporate income tax rate, interest deductibility, tax deductions for capital investments, the availability of federal production tax credits and our ability to use them, and state and local tax deductibility. Changes to the normalization of income taxes for ratemaking and return of excess deferred tax liabilities to customers could also affect our businesses. Depending on the magnitude and mix of any implemented changes, federal income tax reform could materially affect our results of operations, financial position, and liquidity.
•Ameren expects its cash used for currently planned capital expenditures and dividends to exceed cash provided by operating activities over the next several years. As part of its plan to fund these cash flow requirements, Ameren is using newly issued shares of common stock, rather than market-purchased shares, to satisfy requirements under the DRPlus and employee benefit plans and expects to continue to do so through at least 2024. Ameren expects these issuances to provide equity of about $100 million annually. Ameren also plans to issue incremental common equity to fund a portion of Ameren Missouri’s wind generation investments through the physical settlement of the forward sale agreement discussed below. Additionally, Ameren plans to issue incremental equity of about $150 million annually from 2021 to 2024. Ameren expects its equity to total capitalization to be about 45% through the period ending December 2024, with the long-term intent to support solid investment-grade credit ratings. Ameren Missouri and Ameren Illinois expect to fund cash flow needs through debt issuances, adjustments of dividends to Ameren (parent), and/or capital contributions from Ameren (parent).
•In August 2019, Ameren entered into a forward sale agreement with a counterparty relating to 7.5 million shares of common stock. The forward sale agreement can be settled at Ameren’s discretion on or prior to March 31, 2021. On a settlement date or dates, if Ameren elects to physically settle the forward sale agreement, Ameren will issue shares of common stock to the counterparty at the then-applicable forward sale price.The forward sale agreement will be physically settled unless Ameren elects to settle in cash or to net share settle. If physically settled, Ameren expects to use debtreceive between $540 million and $550 million upon settlement. See Note 5 – Long-Term Debt and Equity Financings under Part II, Item 8, of the Form 10-K for additional information.
•As of June 30, 2020, Ameren had $99 million in tax benefits related to fund such cash shortfalls. If cash flows change materially from thosefederal and state income tax credit carryforwards and $6 million in outstanding income tax refunds. Future expected such asincome tax payments and refunds are based on expected taxable income, available income tax credits, and current tax law. Expected taxable income is affected by expected capital expenditures, when property, plant, and equipment is placed in-service or retired, and the cash flow needs associatedtiming of regulatory reviews, among other things. In the case of Ameren Missouri and Ameren Illinois, future expected income tax payments and refunds are consistent with the potential investments identifiedtax allocation agreement between Ameren
(parent) and its subsidiaries. Ameren expects to make income tax payments between $5 million and $75 million in each year from 2020 to 2024, totaling $150 million to $200 million for the five-year period. Ameren Missouri expects to make income tax payments to Ameren (parent) between $20 million and $30 million in 2020. Additionally, Ameren Missouri expects to receive refunds from Ameren (parent) in each year from 2021 to 2024, totaling $60 million to $100 million for the four-year period, primarily due to the expected utilization of federal production tax credits to be generated from its wind generation acquisitions. Ameren Illinois expects to make income tax payments to Ameren (parent) between $20 million and $30 million in 2020 and between $50 million and $90 million in each year from 2021 to 2024, totaling $260 million to $310 million for the five-year period.
•Ameren Missouri expects its wind generation acquisitions to generate federal production tax credits between $65 million and $70 million in each year from 2021 to 2030. Ameren expects to utilize approximately $140 million of these federal production tax credits from 2021 to 2024. In May 2020, the IRS issued guidance that extended the in-service date criteria to December 31, 2021, for qualifying for federal production tax credits. As a result of this extension, Ameren does not anticipate that delays in the completion of the wind generation facilities will affect Ameren’s ability to realize anticipated federal production tax credits.
•The Coronavirus Aid, Relief, and Economic Security Act is a federal law enacted in March 2020. Provisions in the act include temporary changes to the utilization of net operating losses, deferral of the payment of the employer portion of Social Security taxes, and additional funding for customer energy assistance, among other things. Ameren has implemented certain provisions of the act, and is currently evaluating other provisions of the act. As of June 30, 2020, there was no material impact to Ameren’s, Ameren Missouri’s, and Ameren Illinois’ financial statements as a result of the act.
•In 2018, legislation modifying Missouri tax law was enacted to decrease the state’s corporate income tax rate from 6.25% to 4%, effective January 1, 2020. The effect of this tax decrease is reflected in Ameren Missouri’s integrated resource plan,electric service rates that became effective on April 1, 2020. Ameren will reevaluate its funding plan.and Ameren Missouri do not expect this income tax decrease to have a material impact on net income.
The above items could have a material impact on our results of operations, financial position, orand liquidity. Additionally, in the ordinary course of business, we evaluate strategies to enhance our results of operations, financial position, orand liquidity. These strategies may include acquisitions, divestitures, opportunities to reduce costs or increase revenues, and other strategic initiatives to increase Ameren'sAmeren’s shareholder value. We are unable to predict which, if any, of these initiatives will be executed. The execution of these initiatives may have a material impact on our future results of operations, financial position, or liquidity.
REGULATORY MATTERS
See Note 2 – Rate and Regulatory Matters under Part I, Item 1, of this report.
ITEM 3. QUANTITATIVE AND QUALITATIVE DISCLOSURES ABOUT MARKET RISK.
Market risk is the risk of changes in value of a physical asset or a financial instrument, derivative or nonderivative, caused by fluctuations in market variables such as interest rates, commodity prices, and equity security prices. A derivative is a contract whose value is dependent on, or derived from, the value of some underlying asset or index. The following discussion of our risk management activities includes forward-looking statements that involve risks and uncertainties. Actual results could differ materially from those projected in the
forward-looking statements. We handle market risk in accordance with established policies, which may include entering into various derivative transactions. In the normal course of business, we also face risks that are either nonfinancial or nonquantifiable. Such risks, principally business, legal, and operational risks, are not part of the following discussion.
Our risk management objectives are to optimize our physical generating assets and to pursue market opportunities within prudent risk parameters. Our risk management policies are set by a risk management steering committee, which is composed of senior-level Ameren officers, with Ameren board of directors oversight.
With the exception of the following, thereThere have been no material changes to the quantitative and qualitative disclosures about interest rate risk, credit risk, equityinvestment price risk, commodity price risk, and commodity supplier risk included in the Form 10-K. In the first quarter of 2017, Ameren Missouri’s supplier of nuclear fuel assemblies, Westinghouse, filed a voluntary petition for a court-supervised restructuring process under Chapter 11 of the United States Bankruptcy Code. At this time, Ameren and Ameren Missouri believe the restructuring proceeding will not affect Westinghouse’s performance under the terms of its existing contracts with Ameren Missouri, and therefore do not expect any material impact to Ameren Missouri’s operations as a result of this restructuring proceeding. Ameren Missouri received all necessary fuel assemblies for the fall 2017 refueling and maintenance outage. See Note 10 – Callaway Energy Center under Part I, Item 1, of this report for additional information. See Item 7A under Part II of the Form 10-K for a more detailed discussion of our market risk.
Fair Value of Contracts
We use derivatives principally to manage the risk of changes in market prices for natural gas, power, and uranium, as well as the risk of changes in rail transportation surcharges through fuel oil hedges. The following table presents the favorable (unfavorable) changes in the fair value of all derivative contracts marked-to-market during the three and nine months ended September 30, 2017. We use various methods to determine the fair value of our contracts. In accordance with authoritative accounting guidance for fair value hierarchy levels, the sources we used to determine the fair value of these contracts were active quotes (Level 1), inputs corroborated by market data (Level 2), and other modeling and valuation methods that are not corroborated by market data (Level 3). See Note 7 – Fair Value Measurements under Part I, Item 1, of this report for additional information regarding the methods used to determine the fair value of these contracts.
|
| | | | | | | | | | | | | | | | | | | | | | | | |
| | Three Months | | | Nine Months |
| | Ameren Missouri | | Ameren Illinois | | Ameren | | | Ameren
Missouri | | Ameren
Illinois | | Ameren |
| Fair value of contracts at beginning of period, net | $ | 2 |
| | $ | (205 | ) | | $ | (203 | ) | | | $ | (4 | ) | | $ | (180 | ) | | $ | (184 | ) |
| Contracts realized or otherwise settled during the period | (1 | ) | | 6 |
| | 5 |
| | | (3 | ) | | 2 |
| | (1 | ) |
| Fair value of new contracts entered into during the period | 1 |
| | — |
| | 1 |
| | | 10 |
| | (2 | ) | | 8 |
|
| Other changes in fair value | 2 |
| | (5 | ) | | (3 | ) | | | 1 |
| | (24 | ) | | (23 | ) |
| Fair value of contracts outstanding at end of period, net | $ | 4 |
| | $ | (204 | ) | | $ | (200 | ) | | | $ | 4 |
| | $ | (204 | ) | | $ | (200 | ) |
The following table presents maturities of derivative contracts as of September 30, 2017, based on the hierarchy levels used to determine the fair value of the contracts:
|
| | | | | | | | | | | | | | | | | | | |
| Sources of Fair Value | Maturity Less than 1 Year | | Maturity 1-3 Years | | Maturity 3-5 Years | | Maturity in Excess of 5 Years | | Total Fair Value |
| Ameren Missouri: |
| |
| |
| |
| |
|
| Level 1 | $ | 1 |
| | $ | — |
| | $ | — |
| | $ | — |
| | $ | 1 |
|
Level 2(a) | (3 | ) | | (4 | ) | | — |
| | — |
| | (7 | ) |
Level 3(b) | 8 |
| | 2 |
| | — |
| | — |
| | 10 |
|
| Total | $ | 6 |
| | $ | (2 | ) | | $ | — |
| | $ | — |
| | $ | 4 |
|
| Ameren Illinois: |
| |
| |
| |
| |
|
| Level 1 | $ | — |
| | $ | 1 |
| | $ | — |
| | $ | — |
| | $ | 1 |
|
Level 2(a) | (7 | ) | | (4 | ) | | — |
| | — |
| | (11 | ) |
Level 3(b) | (13 | ) | | (29 | ) | | (29 | ) | | (123 | ) | | (194 | ) |
| Total | $ | (20 | ) | | $ | (32 | ) | | $ | (29 | ) | | $ | (123 | ) | | $ | (204 | ) |
| Ameren: | | | | | | | | | |
| Level 1 | $ | 1 |
| | $ | 1 |
| | $ | — |
| | $ | — |
| | $ | 2 |
|
Level 2(a) | (10 | ) | | (8 | ) | | — |
| | — |
| | (18 | ) |
Level 3(b) | (5 | ) | | (27 | ) | | (29 | ) | | (123 | ) | | (184 | ) |
| Total | $ | (14 | ) | | $ | (34 | ) | | $ | (29 | ) | | $ | (123 | ) | | $ | (200 | ) |
| |
(a) | Principally fixed-price vs. floating over-the-counter power swaps, power forwards, and fixed-price vs. floating over-the-counter natural gas swaps. |
| |
(b) | Principally power forward contract values based on information from external sources, historical results, and our estimates. Level 3 also includes option contract values based on an option valuation model. |
ITEM 4. CONTROLS AND PROCEDURES.
| |
(a) | Evaluation of Disclosure Controls and Procedures |
(a)Evaluation of Disclosure Controls and Procedures
As of SeptemberJune 30, 2017,2020, evaluations were performed under the supervision and with the participation of management, including the principal executive officer and the principal financial officer of each of the Ameren Companies, of the effectiveness of the design and operation of such registrant’s disclosure controls and procedures (as defined in Rules 13a-15(e) and 15d-15(e) of the Exchange Act). Based on those evaluations, as of SeptemberJune 30, 2017,2020, the principal executive officer and the principal financial officer of each of the Ameren Companies concluded that such disclosure controls and procedures are effective to provide assurance that information required to be disclosed in such registrant’s reports filed or submitted under the Exchange Act is recorded, processed, summarized, and reported within the time periods specified in the SEC’s rules and forms and such information is accumulated and communicated to its management, including its principal executive officer and its principal financial officer, to allow timely decisions regarding required disclosure.
| |
(b) | Changes in Internal Controls over Financial Reporting |
(b)Changes in Internal Controls over Financial Reporting
There has been no change in any of the Ameren Companies’ internal control over financial reporting during their most recent fiscal quarter that has materially affected, or is reasonably likely to materially affect, each of their internal control over financial reporting.
PART II. OTHER INFORMATION
ITEM 1. LEGAL PROCEEDINGS.
We are involved in legal and administrative proceedings before various courts and agencies with respect to matters that arise in the ordinary course of business, some of which involve substantial amounts of money. We believe that the final disposition of these proceedings, except as otherwise disclosed in this report, will not have a material adverse effect on our results of operations, financial position, or liquidity. Risk of loss is mitigated, in some cases, by insurance or contractual or statutory indemnification. Material legal and administrative proceedings, which are discussed in Note 2 – Rate and Regulatory Matters, Note 9 – Commitments and Contingencies, and Note 10 – Callaway Energy Center, under Part I, Item 1, of this report, include the following:
ATXI’s request for certificate of convenience and necessity from the MoPSC for the Mark Twain project;
•Ameren Illinois’ annual electric distribution service formula rate update filed with the ICC in April 2017;2020;
the February 2015 complaint case•Ameren Illinois’ natural gas delivery service regulatory rate review filed with the FERC seeking a reductionICC in February 2020;
•Ameren Illinois’ annual electric energy-efficiency formula rate update filed with the ICC in May 2020;
•Ameren Illinois’ QIP reconciliation hearing with the ICC requested in March 2019;
•the July 2020 appeal filed by Ameren Missouri, Ameren Illinois, and ATXI challenging the FERC’s rehearing denials in the transmission formula rate revision cases;
•various parties’ requests for a rehearing of the May 2020 FERC order related to the November 2013 complaint case;
•the July 2020 appeal filed by Ameren Missouri, Ameren Illinois, and ATXI challenging the May 2020 FERC order related to the November 2013 complaint case;
•the March 2019 FERC Notice of Inquiry regarding its allowed base returnROE policy;
•the March 2020 FERC Notice of Proposed Rulemaking on common equity under the MISO tariff;its transmission incentives policy;
•litigation against Ameren Missouri relatedwith respect to NSR and the EPA Clean Air Act; and
•remediation matters associated with former MGP and waste disposal sites of the Ameren Companies; andIllinois.
the class action lawsuit against Ameren Missouri relating to municipal taxes.
ITEM 1A. RISK FACTORS.
AThe Form 10-K includes a detailed discussion of our risk factors is included in Part I, Item 1A, Risk Factors in the Form 10-K.factors. The information presented below updates, and should be read in conjunction with, the risk factors and information disclosed in the Form 10-K.
Our results of operations, financial position, and liquidity have been and are subjectexpected to acts of terrorism, cyber-attacks, and other intentionally disruptive acts.
Like other electric and natural gas utilities, our energy centers, fuel storage facilities, transmission and distribution facilities, and information systems maycontinue to be adversely affected by terrorist activities and other intentionally disruptive acts, including cyber-attacks, which could disrupt our abilitythe international public health emergency associated with the COVID-19 pandemic.
The COVID-19 pandemic continues to produce or distribute our energy products. Within our industry, there have been attacks on energy infrastructure such as power plants, substations, and related assets inbe a rapidly evolving situation. In the past, and there may be more attacks in the future. Any such incident could limit our ability to generate, purchase, or transmit power or natural gas and could have significant regional economic consequences. Any such disruption could result infirst six months of 2020, we experienced a significantnet decrease in revenues, a significantour sales volumes, an increase in costs including those for repair,our accounts receivable balances that were past due or adversely impact economic activitythat were a part of a deferred payment arrangement, and a decline in our service territory which could adversely affectcash collections from customers. The continued effect of the COVID-19 pandemic on our results of operations, financial position, and liquidity.
Thereliquidity in subsequent periods will depend on its severity and longevity, future regulatory or legislative actions with respect thereto, and the resulting impact on business, economic, and capital market conditions. It may also affect Ameren Missouri’s ability to recover any lost revenues or incremental costs. As a result of the COVID-19 pandemic, measures have been taken by local, state, and federal governments, such as travel bans, quarantines, and shelter-in place orders. Shelter-in-place orders began taking effect in our service territories in mid-March 2020. These orders generally required individuals to remain at home and precluded or limited the operation of businesses that were deemed nonessential. In mid-May 2020, shelter-in-place orders effective in our service territories began to be relaxed, with individuals allowed to leave their homes and nonessential businesses allowed to begin reopening. However, certain restrictions remain in place that limit individual activities and the operation of nonessential businesses. Additional restrictions may be imposed in the future. Ameren's business operations are deemed essential and are not directly impacted by the shelter-in-place orders. As a result of the COVID-19 pandemic, economic activity has been an increasedisrupted in the numberservice territories of Ameren Missouri and sophisticationAmeren Illinois. It has also caused disruptions in the capital markets, which could adversely affect our ability to access these markets on reasonable terms and when needed. These disruptions could continue for a prolonged period of cyber-attacks acrosstime or become more severe.
We rely on the issuance of short-term and long-term debt and equity as significant sources of liquidity and funding for capital requirements not satisfied by our operating cash flow, as well as to refinance existing long-term debt. Disruptions to the capital markets as a result of the COVID-19 pandemic could negatively affect our ability to maintain and to expand our businesses. In addition, our credit ratings may be impacted by the economic conditions of the COVID-19 pandemic. The COVID-19 pandemic could lead to events beyond our control, such as further depressed economic conditions or extreme volatility in the debt, equity, or credit markets, and might create uncertainty that could increase our cost of capital or impair or eliminate our ability to access the debt, equity, or credit markets, including our ability to draw on bank credit facilities or issue commercial paper.
As a result of the COVID-19 pandemic, we have experienced and expect to continue to experience changes to our sales volumes. In the three and six months ended June 30, 2020, compared to the same periods in 2019, Ameren Missouri experienced a reduction in commercial and industrial electric sales volumes, partially offset by increased electric sales volumes to higher margin residential customers, excluding the estimated effects of weather and customer energy-efficiency programs. While the impacts of the COVID-19 pandemic are difficult to predict, Ameren Missouri expects the net reduction in sales volumes, excluding the estimated effects of weather and customer energy-efficiency
programs, to continue in the July through December 2020 period, compared to the same period in 2019. The COVID-19 pandemic may continue to affect Ameren Missouri’s total electric sales volumes and sales volumes by customer class beyond 2020. Assuming a ratable change in Ameren Missouri's electric sales volumes by month, a 1% change for the calendar year 2020 to residential, commercial, and industrial customers would affect earnings per diluted share by approximately 3 cents, 2 cents, and a half-cent, respectively. The actual change in earnings per diluted share will be affected by the timing of sales volume changes due to seasonal customer rates. Pursuant to the PISA, Ameren Missouri’s electric rates are limited to a 2.85% compound annual growth rate cap. Continued long-term declines in sales volumes, along with increased capital investments and operating costs, could result in Ameren Missouri’s inability to recover amounts exceeding the rate cap. Ameren Illinois also experienced decreases in electric and natural gas sales volumes in the three and six months ended June 30, 2020. While the revenues from Ameren Illinois’ electric distribution business, residential and small nonresidential customers of Ameren Illinois’ natural gas distribution business, and Ameren Illinois’ and ATXI’s electric transmission businesses are decoupled from changes in sales volumes, earnings at Ameren Missouri and, with respect to large nonresidential natural gas customers, at Ameren Illinois, are exposed to such changes.
Our customers’ payment for our services has been adversely affected by the COVID-19 pandemic, resulting in a decrease to our cash flow from operations. Ameren Missouri resumed charging late fees to commercial and industrial customers and disconnecting those customers for nonpayment in mid-July 2020, while it resumed those activities for residential customers in early August 2020, following the suspension of both disconnections and late fees for all industries aroundcustomers in mid-March 2020. Ameren Illinois expects to resume disconnecting commercial and industrial customers and residential customers for nonpayment in mid-August 2020 and early September 2020, respectively, while it resumed charging late fees to all customers in late July 2020, following the world. A security breach atsuspension of both disconnections and late fees for all customers in mid-March 2020. However, future regulatory or legislative action could require suspension of customer disconnections and/or late fees, among other things, for an extended period of time. As of June 30, 2020, accounts receivable balances that were 30 days or greater past due or that were a part of a deferred payment arrangement represented 26%, 19%, and 33%, or $132 million, $42 million, and $90 million, of Ameren’s, Ameren Missouri’s, and Ameren Illinois’ "Accounts receivable – trade" before allowance for doubtful accounts, respectively. As of June 30, 2019, these percentages were 17%, 11%, and 25%, or $83 million, $24 million, and $59 million, for Ameren, Ameren Missouri, and Ameren Illinois, respectively. Ameren Illinois' electric distribution and natural gas distribution businesses have bad debt riders, which provide for recovery of bad debt write-offs, net of any subsequent recoveries. In 2020, Ameren Illinois’ electric bad debt rider provides for the recovery of bad debt expense. However, Ameren Missouri does not have a bad debt rider or regulatory tracking mechanism and its earnings are exposed to increases in bad debt expense, which could result in higher bad debt write-offs. If Ameren Missouri seeks recovery of certain COVID-19 pandemic related costs, it could be unsuccessful in obtaining regulatory approval to recover them, which may adversely affect Ameren and Ameren Missouri’s results of operations.
In addition, suppliers and contractors may not perform as provided under their contracts. This could cause delays in construction projects, including additional delays related to Ameren Missouri’s expected acquisition of two wind generation facilities, or the performance of necessary maintenance to our physical assetselectric and natural gas infrastructure, which could lead to failures of equipment that can result in unanticipated liabilities or unplanned outages. Delays in our information systemsconstruction projects could affectalso result in reduced planned capital expenditures and decreased rate base growth.
Also, our businesses depend on skilled professional and technical employees. Our operations could be adversely affected if a large portion of our employees contracted COVID-19 or became quarantined at the reliabilitysame time. This could lead to facility shutdowns and disruptions in the delivery of the transmissionelectricity and distribution system, disrupt electric generation,natural gas to our customers. In addition, remote working arrangements increase our data security risks, including nuclear generation, and/or subject usloss of data related to financial harm associated with theft or inappropriate release of certain types of information, including sensitive customer, employee, financial, and operating system information. Manyinformation, through insider or outsider actions.
Ameren cannot predict the extent or duration of ourthe COVID-19 pandemic or its effects on the global, national, or local economy, the capital markets, or its customers, suppliers, vendors, contractors, and information technology providers have access to our systems that support our operations and maintain customer and employee data. A breach of these third-party systems could adversely affect our business as if it was a breach of our own system. If a significant breach occurred, our reputation could be adversely affected, customer confidence could be diminished, or we could be subject to legal claims, any of which could result in a significant decrease in revenues or significant costs for remedying the impacts of such a breach. Our generation, transmission, and distribution systems are part of an interconnected system. Therefore, a disruption caused by a cyber-incident at another
utility, electric generator, RTO, or commodity supplier could also adversely affect our businesses. In addition, new regulations could require changes in our security measures and result in increased costs. The occurrence of any of these events could adversely affect ourcontinuity plans, results of operations, financial position, and liquidity.liquidity, planned rate base growth, or sales volumes.
ITEM 2. UNREGISTERED SALES OF EQUITY SECURITIES AND USE OF PROCEEDS.
Ameren Corporation, Ameren Missouri, and Ameren Illinois did not purchase equity securities reportable under Item 703 of Regulation S-K during the period from JulyApril 1, 20172020, to SeptemberJune 30, 2017.2020.
ITEM 6. EXHIBITS.
The documents listed below are being filed or have previously been filed on behalf of the Ameren Companies and are incorporated herein by reference from the documents indicated and made a part hereof. Exhibits not identified as previously filed are filed herewith. | | | | | | | | | | | | | | | | | | | | |
Exhibit
Designation | | Registrant(s) | | Nature of Exhibit | | Previously Filed as Exhibit to: |
| | | | | | |
| | | | | | |
Exhibit
Designation
| | Registrant(s) | | Nature of Exhibit | | Previously Filed as Exhibit to: |
Instruments Defining Rights of Security Holders, Including Indentures |
4.1 | | Ameren
Ameren Illinois
| | | | |
Statement re: Computation of Ratios |
12.1 | | Ameren | | | | |
12.2 | | Ameren
Missouri
| | | | |
12.3 | | Ameren
Illinois
| | | | |
| Rule 13a-14(a) / 15d-14(a) Certifications | | | | | | |
| 31.1 | | Ameren | | | | |
| 31.2 | | Ameren | | | | |
| 31.3 | | Ameren Missouri | | Ameren
Missouri
| | | | |
| 31.4 | | Ameren Missouri | | Ameren
Missouri
| | | | |
| 31.5 | | Ameren Illinois | | Ameren
Illinois
| | | | |
| 31.6 | | Ameren Illinois | | Ameren
Illinois
| | | | |
| Section 1350 Certifications | | | | | | |
| 32.1 | | Ameren | | | | |
| 32.2 | | Ameren Missouri | | Ameren
Missouri
| | | | |
| 32.3 | | Ameren Illinois | | Ameren
Illinois
| | | | |
| Interactive Data Files | | | | | | |
| 101.INS | | Ameren Companies | | Inline XBRL Instance Document - the instance document does not appear in the Interactive Data File because its XBRL tags are embedded within the Inline XBRL document | | |
| 101.SCH | | Ameren Companies | | Inline XBRL Taxonomy Extension Schema Document | | |
| 101.CAL | | Ameren Companies | | Inline XBRL Taxonomy Extension Calculation Linkbase Document | | |
| 101.LAB | | Ameren Companies | | Inline XBRL Taxonomy Extension Label Linkbase Document | | |
| 101.PRE | | Ameren Companies | | Inline XBRL Taxonomy Extension Presentation Linkbase Document | | |
| 101.DEF | | Ameren Companies | | Inline XBRL Taxonomy Extension Definition Document | | |
| 104 | | Ameren Companies | | Cover Page Interactive Data File (formatted as Inline XBRL and contained in Exhibit 101) | | |
The file number references for the Ameren Companies’ filings with the SEC are: Ameren, 1-14756; Ameren Missouri, 1-2967; and Ameren Illinois, 1-3672.
Each registrant hereby undertakes to furnish to the SEC upon request a copy of any long-term debt instrument not listed above that such registrant has not filed as an exhibit pursuant to the exemption provided by Item 601(b)(4)(iii)(A) of Regulation S-K.
SIGNATURES
Pursuant to the requirements of the Exchange Act, each registrant has duly caused this report to be signed on its behalf by the undersigned thereunto duly authorized. The signature for each undersigned company shall be deemed to relate only to matters having reference to such company or its subsidiaries.
| | |
|
AMEREN CORPORATION
(Registrant) |
AMEREN CORPORATION
(Registrant)
|
| /s/ Michael L. Moehn |
/s/ Martin J. Lyons, Jr. |
Martin J. Lyons, Jr.
Michael L. Moehn
Executive Vice President and Chief Financial Officer
(Principal Financial Officer)
|
|
|
UNION ELECTRIC COMPANY
(Registrant)
|
|
/s/ Martin J. Lyons, Jr.Michael L. Moehn |
Martin J. Lyons, Jr.
Michael L. Moehn
Executive Vice President and Chief Financial Officer
(Principal Financial Officer)
|
|
|
AMEREN ILLINOIS COMPANY
(Registrant)
|
|
/s/ Martin J. Lyons, Jr.Michael L. Moehn |
Martin J. Lyons, Jr.
Michael L. Moehn
Executive Vice President and Chief Financial Officer
(Principal Financial Officer)
|
Date: November 3, 2017
August 7, 2020