0001002910us-gaap:OperatingSegmentsMemberaee:CommercialMembersrt:NaturalGasReservesMemberaee:AmerenIllinoisElectricDistributionSegmentMember2023-01-012023-09-30
UNITED STATES
SECURITIES AND EXCHANGE COMMISSION
Washington, D.C. 20549
FORM 10-Q
| | | | | |
| ☒ | Quarterly report pursuant to Section 13 or 15(d) of the Securities Exchange Act of 1934 for the Quarterly Period Ended September 30, 2023March 31, 2024 |
OR
| | | | | |
| ☐ | Transition report pursuant to Section 13 or 15(d) of the Securities Exchange Act of 1934
for the transition period from to |
| | | | | | | | |
Commission
File Number | Exact name of registrant as specified in its charter;
State of Incorporation;
Address and Telephone Number | IRS Employer
Identification No. |
| 1-14756 | Ameren Corporation | 43-1723446 |
(Missouri Corporation)
1901 Chouteau Avenue
St. Louis, Missouri 63103
(314) 621-3222
| | | | | | | | |
| 1-2967 | Union Electric Company | 43-0559760 |
(Missouri Corporation)
1901 Chouteau Avenue
St. Louis, Missouri 63103
(314) 621-3222
| | | | | | | | |
| 1-3672 | Ameren Illinois Company | 37-0211380 |
(Illinois Corporation)
10 Richard Mark Way
Collinsville, Illinois 62234
(618) 343-8150
Securities Registered Pursuant to Section 12(b) of the Act:
| | | | | | | | |
| Title of each class | Trading Symbol(s) | Name of each exchange on which registered |
| Common Stock, $0.01 par value per share | AEE | New York Stock Exchange |
Indicate by check mark whether the registrants:each registrant: (1) havehas filed all reports required to be filed by Section 13 or 15(d) of the Securities Exchange Act of 1934 during the preceding 12 months (or for such shorter period that the registrant was required to file such reports), and (2) havehas been subject to such filing requirements for the past 90 days.
| | | | | | | | | | | | | | | | | | | | | | | | | | |
| Ameren Corporation | | Yes | | ☒ | | No | | ☐ |
| Union Electric Company | | Yes | | ☒ | | No | | ☐ |
| Ameren Illinois Company | | Yes | | ☒ | | No | | ☐ |
Indicate by check mark whether each registrant has submitted electronically every Interactive Data File required to be submitted pursuant to Rule 405 of Regulation S-T (§ 232.405 of this chapter) during the preceding 12 months (or for such shorter period that the registrant was required to submit such files).
| | | | | | | | | | | | | | | | | | | | | | | | | | |
| Ameren Corporation | | Yes | | ☒ | | No | | ☐ |
| Union Electric Company | | Yes | | ☒ | | No | | ☐ |
| Ameren Illinois Company | | Yes | | ☒ | | No | | ☐ |
Indicate by check mark whether each registrant is a large accelerated filer, an accelerated filer, a non-accelerated filer, a smaller reporting company or an emerging growth company. See the definitions of “large accelerated filer,” “accelerated filer,” “smaller reporting company,” and “emerging growth company” in Rule 12b-2 of the Exchange Act.
| | | | | | | | | | | | | | | | | | | | |
| Ameren Corporation | Large accelerated filer | ☒ | Accelerated filer | ☐ | Non-accelerated filer | ☐ |
| | | Smaller reporting company | ☐ | Emerging growth company | ☐ |
| Union Electric Company | Large accelerated filer | ☐ | Accelerated filer | ☐ | Non-accelerated filer | ☒ |
| | | Smaller reporting company | ☐ | Emerging growth company | ☐ |
| Ameren Illinois Company | Large accelerated filer | ☐ | Accelerated filer | ☐ | Non-accelerated filer | ☒ |
| | | Smaller reporting company | ☐ | Emerging growth company | ☐ |
If an emerging growth company, indicate by check mark if the registrant has elected not to use the extended transition period for complying with any new or revised financial accounting standards provided pursuant to Section 13(a) of the Exchange Act.
| | | | | |
| Ameren Corporation | ☐ |
| Union Electric Company | ☐ |
| Ameren Illinois Company | ☐ |
Indicate by check mark whether each registrant is a shell company (as defined in Rule 12b-2 of the Exchange Act).
| | | | | | | | | | | | | | | | | | | | | | | | | | |
| Ameren Corporation | | Yes | | ☐ | | No | | ☒ |
| Union Electric Company | | Yes | | ☐ | | No | | ☒ |
| Ameren Illinois Company | | Yes | | ☐ | | No | | ☒ |
The number of shares outstanding of each registrant’s classes of common stock as of October 31, 2023,April 30, 2024, was as follows:
| | | | | | | | | | | |
| Registrant | | Title of each class of common stock | Shares outstanding |
| Ameren Corporation | | Common stock, $0.01 par value per share | 262,945,048266,670,374 | |
| Union Electric Company | | Common stock, $5 par value per share, held by Ameren Corporation | 102,123,834 | |
| Ameren Illinois Company | | Common stock, no par value, held by Ameren Corporation | 25,452,373 | |
| | | |
This combined Form 10-Q is separately filed by Ameren Corporation, Union Electric Company, and Ameren Illinois Company. Each registrant hereto is filing on its own behalf all of the information contained in this quarterly report that relates to such registrant. Each registrant hereto is not filing any information that does not relate to such registrant, and therefore makes no representation as to any such information.
TABLE OF CONTENTS
| | | | | | | | |
| | | Page |
| |
| |
| |
| |
| |
| | |
| Item 1. | | |
| | |
| | |
| | |
| | |
| | |
| | |
| | |
| | |
| | |
| | |
| | |
| | |
| | |
| | |
| | |
| | |
| | |
| | |
| | |
| | |
| | |
| | |
| | |
| | |
| | |
| | |
| | |
| | |
| | |
| | |
| Item 2. | | |
| Item 3. | | |
| Item 4. | | |
| |
| |
| | |
| Item 1. | | |
| Item 1A. | | |
| Item 2. | | |
| Item 5. | | |
| Item 6. | | |
| |
| |
GLOSSARY OF TERMS AND ABBREVIATIONS
We use the words “our,” “we” or “us” with respect to certain information that relates to Ameren, Ameren Missouri, and Ameren Illinois, collectively. When appropriate, subsidiaries of Ameren Corporation are named specifically as their various business activities are discussed. Refer to the Form 10-K for a complete listing of glossary terms and abbreviations. Only new or significantly changed terms and abbreviations are included below.
2023 IRP – Integrated Resource Plan, a long-term nonbinding plan that Ameren Missouri filed with the MoPSC in September 2023 that includes Ameren Missouri’s preferred plan for meeting customers’ projected long-term energy needs.
CCN – Certificate of convenience and necessity.
Form 10-K – The combined Annual Report on Form 10-K for the year ended December 31, 2022,2023, filed by the Ameren Companies with the SEC.
QTD – Three months ended September 30.
YTD – Nine months ended September 30.
YoY – Compared with the year-ago period.
FORWARD-LOOKING STATEMENTS
Statements in this report not based on historical facts are considered “forward-looking” and, accordingly, involve risks and uncertainties that could cause actual results to differ materially from those discussed. Although such forward-looking statements have been made in good faith and are based on reasonable assumptions, there is no assurance that the expected results will be achieved. These statements include (without limitation) statements as to future expectations, beliefs, plans, projections, strategies, targets, estimates, objectives, events, conditions, and financial performance. In connection with the “safe harbor” provisions of the Private Securities Litigation Reform Act of 1995, we are providing this cautionary statement to identify important factors that could cause actual results to differ materially from those anticipated. The following factors, in addition to those discussed within Risk Factors in the Form 10-K, and elsewhere in this report and in our other filings with the SEC, could cause actual results to differ materially from management expectations suggested in such forward-looking statements:
•regulatory, judicial, or legislative actions, and any changes in regulatory policies and ratemaking determinations, that may change regulatory recovery mechanisms, such as those that may result from Ameren Missouri’s petition to the MoPSC staff reviewfor a financing order to authorize the issuance of securitized utility tariff bonds to finance the cost of the planned accelerated retirement of the Rush Island Energy Center, retirement,any additional mitigation relief related to the operation of the Rush Island Energy Center that may be ordered by the United States District Court for the Eastern District of Missouri, Ameren Missouri’s proposed customer energy-efficiency plan under the MEEIA filed with the MoPSC in January 2024, Ameren Illinois’ December 2023 ICC order for the MYRP electric distribution service regulatory rate review that directed Ameren Illinois to file a revised Grid Plan and a request to update the associated MYRP revenue requirements for 2024 through 2027, both subsequently filed in January 2023March 2024, along with the ICC, Ameren Illinois’ natural gas regulatory rate review filed in January 2023 with2024 rehearing request of the ICC,order and appeal of the order to the Illinois Appellate Court for the Fifth Judicial District, Ameren Illinois’ electric distribution service revenue requirement reconciliation adjustment request filed with the ICC in April 2024, Ameren Illinois’ appeal of the November 2023 ICC natural gas delivery service rate order to the Illinois Appellate Court for the Fifth Judicial District, and the August 2022 United States Court of Appeals for the District of Columbia Circuit ruling that vacated the FERC’s MISO ROE-determining orders and remanded the proceedings to the FERC;
•our ability to control costs and make substantial investments in our businesses, including our ability to recover costs and investments, and to earn our allowed ROEs, within frameworks established by our regulators, while maintaining affordability of our services for our customers;
•the effect of Ameren Illinois’ use of the performance-based formula ratemaking framework for its electric distribution service under the IEIMA, which established and allows for a reconciliation of electric distribution service rates through 2023, its participation in electric energy-efficiency programs, and the related impact of the direct relationship between Ameren Illinois’ ROE and the 30-year United States Treasury bond yields;
•the effect and duration of Ameren Illinois’ election to utilize MYRPs for electric distribution service ratemaking effective for rates beginning in 2024, including the effect of the reconciliation cap on the electric distribution revenue requirement;
•the effect of Ameren Illinois’ use of the performance-based formula ratemaking framework for its participation in electric energy-efficiency programs, and the related impact of the direct relationship between Ameren Illinois’ ROE and the 30-year United States Treasury bond yields;
•the effect on Ameren Missouri of any customer rate caps or limitations on increasing the electric service revenue requirement in connection withpursuant to Ameren Missouri’s election to use the PISA;
•Ameren Missouri’s ability to construct and/or acquire wind, solar, and other renewable energy generation facilities and battery storage, as well as natural gas-fired energy centers, extend the operating license for the Callaway Energy Center, retire fossil fuel-fired energy centers, and implement new or existing customer energy-efficiency programs, including any such construction, acquisition, retirement, or implementation in connection with its Smart Energy Plan, integrated resource plan, or emissions reduction goals, and to recover its cost of investment, a related return, and, in the case of customer energy-efficiency programs, any lost marginselectric revenues in a timely manner, each of which is affected by the ability to obtain all necessary regulatory and project approvals, including CCNs from the MoPSC or any other required approvals for the addition of renewable resources;resources and natural gas-fired energy centers;
•Ameren Missouri’s ability to use or transfer federal production and investment tax credits related to renewable energy centers;projects; the cost of wind, solar, and other renewable generation and storage technologies; and our ability to obtain timely interconnection agreements with the MISO or other RTOs at an acceptable cost for each facility;
•the outcome of competitive bids related to requests for proposals associated with the MISO’s long-range transmission planning;
•the inability of our counterparties to meet their obligations with respect to contracts, credit agreements, and financial instruments, including as they relate to the construction and acquisition of electric and natural gas utility infrastructure and the ability of counterparties to complete projects, which is dependent upon the availability of necessary materials and equipment, including those obligations that are affected by supply chain disruptions;
•advancements in energy technologies, including carbon capture, utilization, and sequestration, hydrogen fuel for electric production and energy storage, next generation nuclear, and large-scale long-cycle battery energy storage, and the impact of federal and state energy and economic policies with respect to those technologies;
•the effects of changes in federal, state, or local laws and other governmental actions, including monetary, fiscal, foreign trade, and energy policies;
•the effects of changes in federal, state, or local tax laws or rates, including the effects of the IRA and the 15% minimum tax on adjusted financial statement income, as well as additional regulations, interpretations, amendments, or technical corrections to or in connection with the IRA, and challenges if any, to the tax positions taken by the Ameren Companies, if any, as well as resulting effects on customer rates and the recoverability of the minimum tax imposed under the IRA;
•the effects on energy prices and demand for our services resulting from technological advances, including advances in customer energy efficiency, electric vehicles, electrification of various industries, energy storage, and private generation sources, which generate electricity at the site of consumption and are becoming more cost-competitive;
•the cost and availability of fuel, such as low-sulfur coal, natural gas, and enriched uranium used to produce electricity; the cost and availability of natural gas for distribution and the cost and availability of purchased power, including capacity, zero emission credits, renewable energy credits, and emission allowances; and the level and volatility of future market prices for such commodities and credits;
•disruptions in the delivery of fuel, failure of our fuel suppliers to provide adequate quantities or quality of fuel, or lack of adequate inventories of fuel, including nuclear fuel assemblies primarily from primarilythe one NRC-licensed supplier of assemblies for Ameren Missouri’s Callaway Energy Center assemblies;Center;
•the cost and availability of transmission capacity for the energy generated by Ameren Missouri’s energy centers or required to satisfy our energy sales;
•the effectiveness of our risk management strategies and our use of financial and derivative instruments;
•the ability to obtain sufficient insurance, or, in the absence of insurance, the ability to timely recover uninsured losses from our customers;
•the impact of cyberattacks and data security risks on us, or our suppliers, or other entities on the grid, which could, among other things, result in the loss of operational control of energy centers and electric and natural gas transmission and distribution systems and/or the loss of data, such as customer, employee, financial, and operating system information;
•acts of sabotage, which have increased in frequency and severity within the utility industry, war, terrorism, or other intentionally disruptive acts;
•business, economic, and capital market conditions, including the impact of such conditions on interest rates, inflation, and investments;
•the impact of inflation or a recession on our customers and the related impact on our results of operations, financial position, and liquidity;
•disruptions of the capital and credit markets, deterioration in credit metrics of the Ameren Companies, or other events that may have an adverse effect on the cost or availability of capital, including short-term credit and liquidity, and our ability to access the capital and credit markets on reasonable terms when needed;
•the actions of credit rating agencies and the effects of such actions;
•the impact of weather conditions and other natural phenomenaconditions on us and our customers, including the impact of system outages and the level of wind and solar resources;
•the construction, installation, performance, and cost recovery of generation, transmission, and distribution assets;
•the ability to maintain system reliability during the transition to clean energy generation by Ameren Missouri and the electric utility industry, including within the MISO, as well as Ameren Missouri’s ability to meet generation capacity obligations;
•the effects of failures of electric generation, electric and natural gas transmission or distribution, or natural gas storage facilities systems and equipment, which could result in unanticipated liabilities or unplanned outages;
•the operation of Ameren Missouri’s Callaway Energy Center, including planned and unplanned outages, as well as the ability to recover costs associated with such outages and the impact of such outages on off-system sales and purchased power, among other things;
•Ameren Missouri’s ability to recover the remaining investment and decommissioning costs associated with the retirement of an energy center, as well as the ability to earn a return on that remaining investment and those decommissioning costs;
•the impact of current environmental laws and new, more stringent, or changing requirements, including those related to NSR, CO2, NOx, and other emissions and discharges, Illinois emission standards, cooling water intake structures, CCR, energy efficiency, and wildlife protection, that could limit or terminate the operation of certain of Ameren Missouri’s energy centers, increase our operating costs or investment requirements, result in an impairment of our assets, cause us to sell our assets, reduce our customers’ demand for electricity or natural gas, or otherwise have a negative financial effect;
•the impact of complying with renewable energy standards in Missouri and Illinois and with the zero emission standard in Illinois;
•the effectiveness of Ameren Missouri’s customer energy-efficiency programs and the related revenues and performance incentives earned under its MEEIA programs;
•Ameren Illinois’ ability to achieve the performance standards applicable to its electric distribution business and electric customer energy-efficiency goals and the resulting impact on its allowed ROE;
•labor disputes, work force reductions, changes in future wage and employee benefits costs, including those resulting from changes in discount rates, mortality tables, returns on benefit plan assets, and other assumptions;
•the impact of negative opinions of us or our utility services that our customers, investors, legislators, regulators, creditors, or other stakeholders may have or develop, which could result from a variety of factors, including failures in system reliability, failure to implement our investment plans or to protect sensitive customer information, increases in rates, negative media coverage, or concerns about ESG practices;
•the impact of adopting new accounting and reporting guidance;
•the effects of strategic initiatives, including mergers, acquisitions, and divestitures;
•legal and administrative proceedings;
•pandemics or other significant global health events, and their impacts on our results of operations, financial position, and liquidity; and
•the impacts of the Russian invasion of Ukraine and conflicts in the Israel-Hamas war,Middle East, related sanctions imposed by the U.S.United States and other governments, and any broadening of suchthese or other global conflicts, including potential impacts on the cost and availability of fuel, natural gas, enriched uranium, and other commodities, materials, and services, the inability of our counterparties to perform their obligations, disruptions in the capital and credit markets, acts of sabotage or terrorism, including cyberattacks, and other impacts on business, economic, and geopolitical conditions, including inflation.
New factors emerge from time to time, and it is not possible for usmanagement to predict all of such factors, nor can weit assess the impact of each such factor on the business or the extent to which any factor, or combination of factors, may cause actual results to differ materially from those contained or implied in any forward-looking statement. Given these uncertainties, undue reliance should not be placed on these forward-looking statements. Except to the extent required by the federal securities laws, we undertake no obligation to update or revise publicly any forward-looking statements to reflect new information or future events.
PART I. FINANCIAL INFORMATION
ITEM 1. FINANCIAL STATEMENTS.
AMEREN CORPORATION
CONSOLIDATED STATEMENT OF INCOME AND COMPREHENSIVE INCOME
(Unaudited) (In millions, except per share amounts)
| | | |
| | | | Three Months Ended September 30, | | Nine Months Ended September 30, | | | Three Months Ended March 31, |
| | | 2023 | | 2022 | | 2023 | | 2022 | | | | | | 2024 | | 2023 |
| Operating Revenues: | Operating Revenues: | | | | | | | |
| Electric | Electric | $ | 1,921 | | | $ | 2,140 | | | $ | 5,096 | | | $ | 4,971 | |
| Electric | |
| Electric | |
| Natural gas | Natural gas | 139 | | | 166 | | | 786 | | | 940 | |
| Total operating revenues | Total operating revenues | 2,060 | | | 2,306 | | | 5,882 | | | 5,911 | |
| Operating Expenses: | Operating Expenses: | | | | | | | |
| Fuel | 158 | | | 117 | | | 423 | | | 376 | |
| Purchased power | 272 | | | 563 | | | 1,095 | | | 1,058 | |
| Fuel and purchased power | |
| Fuel and purchased power | |
| Fuel and purchased power | |
| | Natural gas purchased for resale | |
| Natural gas purchased for resale | |
| Natural gas purchased for resale | Natural gas purchased for resale | 30 | | | 58 | | | 280 | | | 431 | |
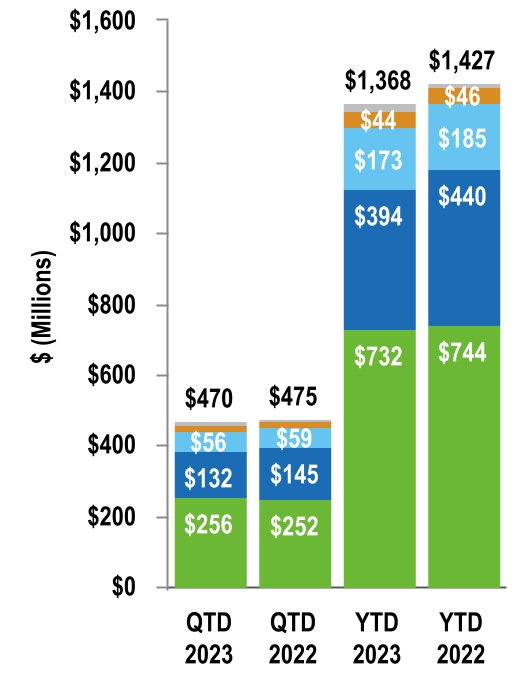
| Other operations and maintenance | Other operations and maintenance | 470 | | | 475 | | | 1,368 | | | 1,427 | |
| | Depreciation and amortization | |
| Depreciation and amortization | |
| Depreciation and amortization | Depreciation and amortization | 369 | | | 350 | | | 1,024 | | | 965 | |
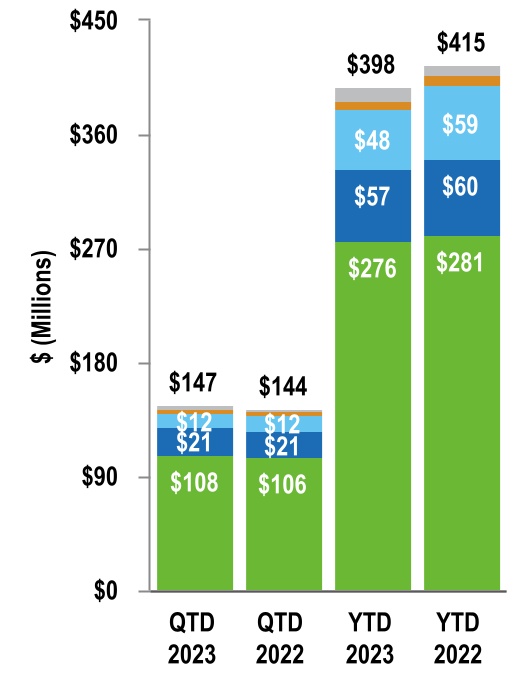
| Taxes other than income taxes | Taxes other than income taxes | 147 | | | 144 | | | 398 | | | 415 | |
| Total operating expenses | Total operating expenses | 1,446 | | | 1,707 | | | 4,588 | | | 4,672 | |
| Operating Income | Operating Income | 614 | | | 599 | | | 1,294 | | | 1,239 | |
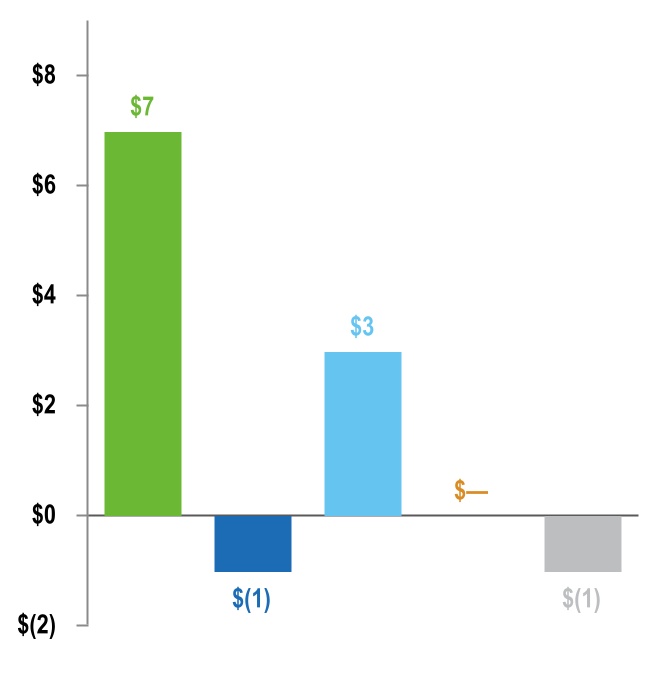
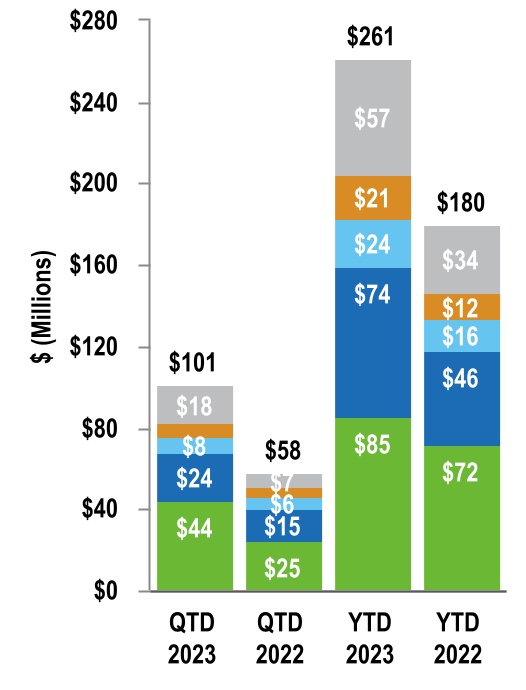
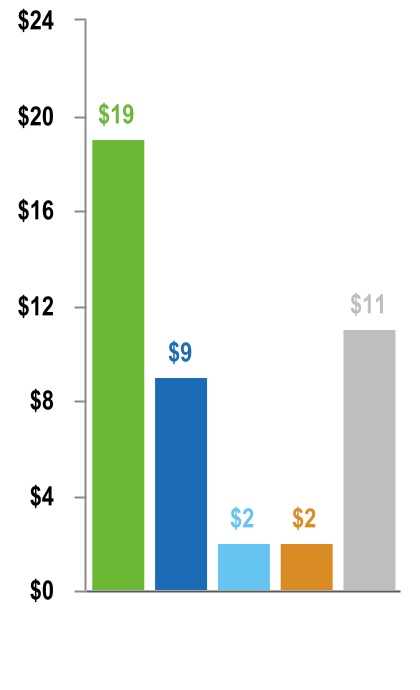
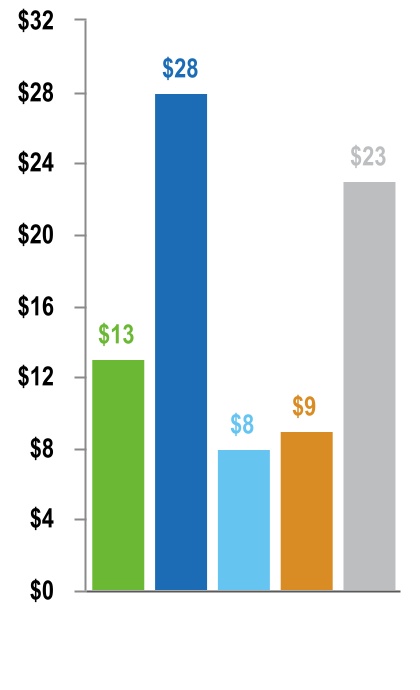
| | Other Income, Net | Other Income, Net | 101 | | | 58 | | | 261 | | | 180 | |
| | Other Income, Net | |
| | Other Income, Net | |
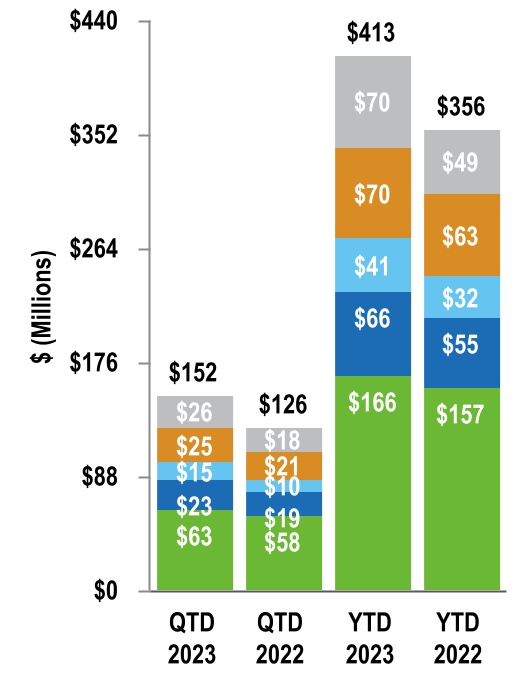
| Interest Charges | Interest Charges | 152 | | | 126 | | | 413 | | | 356 | |
| Income Before Income Taxes | Income Before Income Taxes | 563 | | | 531 | | | 1,142 | | | 1,063 | |
| Income Taxes | Income Taxes | 69 | | | 78 | | | 144 | | | 148 | |
| | | Net Income | |
| | Net Income | |
| | Net Income | Net Income | 494 | | | 453 | | | 998 | | | 915 | |
| Less: Net Income Attributable to Noncontrolling Interests | Less: Net Income Attributable to Noncontrolling Interests | 1 | | | 1 | | | 4 | | | 4 | |
| | Net Income Attributable to Ameren Common Shareholders | Net Income Attributable to Ameren Common Shareholders | $ | 493 | | | $ | 452 | | | $ | 994 | | | $ | 911 | |
| | | | Net Income Attributable to Ameren Common Shareholders | |
| | Net Income Attributable to Ameren Common Shareholders | |
| | Net Income | Net Income | $ | 494 | | | $ | 453 | | | $ | 998 | | | $ | 915 | |
| Other Comprehensive Income (Loss), Net of Taxes | |
| Pension and other postretirement benefit plan activity, net of income taxes (benefit) of $(1), $—, $(1), and $—, respectively | (1) | | | — | | | (3) | | | 1 | |
| | Net Income | |
| | Net Income | |
| Other Comprehensive Loss, Net of Taxes | |
| Pension and other postretirement benefit plan activity, net of income taxes (benefit) of $— and $—, respectively | |
| Pension and other postretirement benefit plan activity, net of income taxes (benefit) of $— and $—, respectively | |
| Pension and other postretirement benefit plan activity, net of income taxes (benefit) of $— and $—, respectively | |
| Comprehensive Income | Comprehensive Income | 493 | | | 453 | | | 995 | | | 916 | |
| Less: Comprehensive Income Attributable to Noncontrolling Interests | Less: Comprehensive Income Attributable to Noncontrolling Interests | 1 | | | 1 | | | 4 | | | 4 | |
| Comprehensive Income Attributable to Ameren Common Shareholders | Comprehensive Income Attributable to Ameren Common Shareholders | $ | 492 | | | $ | 452 | | | $ | 991 | | | $ | 912 | |
| | | | Earnings per Common Share – Basic | Earnings per Common Share – Basic | $ | 1.88 | | | $ | 1.75 | | | $ | 3.79 | | | $ | 3.53 | |
| | | Earnings per Common Share – Basic | |
| | Earnings per Common Share – Basic | |
| | Earnings per Common Share – Diluted | |
| | Earnings per Common Share – Diluted | |
| | Earnings per Common Share – Diluted | Earnings per Common Share – Diluted | $ | 1.87 | | | $ | 1.74 | | | $ | 3.78 | | | $ | 3.51 | |
| | Weighted-average Common Shares Outstanding – Basic | Weighted-average Common Shares Outstanding – Basic | 262.8 | | | 258.4 | | | 262.5 | | | 258.2 | |
| Weighted-average Common Shares Outstanding – Basic | |
| Weighted-average Common Shares Outstanding – Basic | |
| Weighted-average Common Shares Outstanding – Diluted | Weighted-average Common Shares Outstanding – Diluted | 263.4 | | | 259.5 | | | 263.2 | | | 259.3 | |
The accompanying notes are an integral part of these consolidated financial statements.
AMEREN CORPORATION
CONSOLIDATED BALANCE SHEET
(Unaudited) (In millions, except per share amounts)
| | September 30,
2023 | | December 31, 2022 |
| March 31,
2024 | | | March 31,
2024 | | December 31, 2023 |
| ASSETS | ASSETS | | | |
| Current Assets: | Current Assets: | |
| Current Assets: | |
| Current Assets: | |
| Cash and cash equivalents | Cash and cash equivalents | $ | 8 | | | $ | 10 | |
| Accounts receivable – trade (less allowance for doubtful accounts of $33 and $31, respectively) | 597 | | | 600 | |
| Cash and cash equivalents | |
| Cash and cash equivalents | |
| Accounts receivable – trade (less allowance for doubtful accounts of $37 and $30, respectively) | |
| Unbilled revenue | Unbilled revenue | 360 | | | 446 | |
| Miscellaneous accounts receivable | Miscellaneous accounts receivable | 65 | | | 54 | |
| Inventories | Inventories | 760 | | | 667 | |
| | Current regulatory assets | Current regulatory assets | 157 | | | 354 | |
| | Investment in industrial development revenue bonds | — | | | 240 | |
| Current collateral assets | 13 | | | 142 | |
| Current regulatory assets | |
| | Current regulatory assets | |
| | Other current assets | Other current assets | 124 | | | 155 | |
| | | Other current assets | |
| | Other current assets | |
| | Total current assets | |
| Total current assets | |
| Total current assets | Total current assets | 2,084 | | | 2,668 | |
| Property, Plant, and Equipment, Net | Property, Plant, and Equipment, Net | 32,938 | | | 31,262 | |
| Investments and Other Assets: | Investments and Other Assets: | |
| Nuclear decommissioning trust fund | Nuclear decommissioning trust fund | 1,042 | | | 958 | |
| Nuclear decommissioning trust fund | |
| Nuclear decommissioning trust fund | |
| Goodwill | Goodwill | 411 | | | 411 | |
| | Regulatory assets | |
| Regulatory assets | |
| Regulatory assets | Regulatory assets | 1,772 | | | 1,426 | |
| Pension and other postretirement benefits | Pension and other postretirement benefits | 470 | | | 411 | |
| Other assets | Other assets | 882 | | | 768 | |
| | Total investments and other assets | Total investments and other assets | 4,577 | | | 3,974 | |
| Total investments and other assets | |
| Total investments and other assets | |
| TOTAL ASSETS | TOTAL ASSETS | $ | 39,599 | | | $ | 37,904 | |
| LIABILITIES AND EQUITY | LIABILITIES AND EQUITY | | | |
| Current Liabilities: | Current Liabilities: | |
| Current Liabilities: | |
| Current Liabilities: | |
| Current maturities of long-term debt | |
| Current maturities of long-term debt | |
| Current maturities of long-term debt | Current maturities of long-term debt | $ | 849 | | | $ | 340 | |
| Short-term debt | Short-term debt | 1,340 | | | 1,070 | |
| Accounts and wages payable | Accounts and wages payable | 955 | | | 1,159 | |
| Taxes accrued | 209 | | | 59 | |
| | Customer deposits | |
| | Customer deposits | |
| | Customer deposits | |
| | Other current liabilities | Other current liabilities | 664 | | | 738 | |
| | | Other current liabilities | |
| | Other current liabilities | |
| | Total current liabilities | |
| Total current liabilities | |
| Total current liabilities | Total current liabilities | 4,017 | | | 3,366 | |
| Long-term Debt, Net | Long-term Debt, Net | 13,829 | | | 13,685 | |
| Deferred Credits and Other Liabilities: | Deferred Credits and Other Liabilities: | |
| Accumulated deferred income taxes and tax credits, net | Accumulated deferred income taxes and tax credits, net | 4,068 | | | 3,804 | |
| Accumulated deferred income taxes and tax credits, net | |
| Accumulated deferred income taxes and tax credits, net | |
| | Regulatory liabilities | |
| Regulatory liabilities | |
| Regulatory liabilities | Regulatory liabilities | 5,336 | | | 5,309 | |
| Asset retirement obligations | Asset retirement obligations | 761 | | | 763 | |
| | Other deferred credits and liabilities | Other deferred credits and liabilities | 416 | | | 340 | |
| Other deferred credits and liabilities | |
| Other deferred credits and liabilities | |
| | Total deferred credits and other liabilities | |
| Total deferred credits and other liabilities | |
| Total deferred credits and other liabilities | Total deferred credits and other liabilities | 10,581 | | | 10,216 | |
| Commitments and Contingencies (Notes 2, 9, and 10) | Commitments and Contingencies (Notes 2, 9, and 10) | | | | Commitments and Contingencies (Notes 2, 9, and 10) | | | |
| Shareholders’ Equity: | Shareholders’ Equity: | |
| Common stock, $.01 par value, 400.0 shares authorized – shares outstanding of 262.9 and 262.0, respectively | 3 | | | 3 | |
| Common stock, $.01 par value, 400.0 shares authorized – shares outstanding of 266.6 and 266.3, respectively | |
| Common stock, $.01 par value, 400.0 shares authorized – shares outstanding of 266.6 and 266.3, respectively | |
| Common stock, $.01 par value, 400.0 shares authorized – shares outstanding of 266.6 and 266.3, respectively | |
| Other paid-in capital, principally premium on common stock | Other paid-in capital, principally premium on common stock | 6,900 | | | 6,860 | |
| Retained earnings | Retained earnings | 4,144 | | | 3,646 | |
| Accumulated other comprehensive loss | Accumulated other comprehensive loss | (4) | | | (1) | |
| | Total shareholders’ equity | Total shareholders’ equity | 11,043 | | | 10,508 | |
| Total shareholders’ equity | |
| Total shareholders’ equity | |
| Noncontrolling Interests | Noncontrolling Interests | 129 | | | 129 | |
| Total equity | Total equity | 11,172 | | | 10,637 | |
| TOTAL LIABILITIES AND EQUITY | TOTAL LIABILITIES AND EQUITY | $ | 39,599 | | | $ | 37,904 | |
The accompanying notes are an integral part of these consolidated financial statements.
| | AMEREN CORPORATION | AMEREN CORPORATION | AMEREN CORPORATION |
| CONSOLIDATED STATEMENT OF CASH FLOWS | CONSOLIDATED STATEMENT OF CASH FLOWS | CONSOLIDATED STATEMENT OF CASH FLOWS |
| (Unaudited) (In millions) | (Unaudited) (In millions) | (Unaudited) (In millions) |
| | | Nine Months Ended September 30, | | Three Months Ended March 31, |
| | | 2023 | | 2022 | | 2024 | | 2023 |
| Cash Flows From Operating Activities: | Cash Flows From Operating Activities: | | | |
| Net income | Net income | $ | 998 | | | $ | 915 | |
| Net income | |
| Net income | |
| | Adjustments to reconcile net income to net cash provided by operating activities: | Adjustments to reconcile net income to net cash provided by operating activities: | |
| Adjustments to reconcile net income to net cash provided by operating activities: | |
| Adjustments to reconcile net income to net cash provided by operating activities: | |
| | Depreciation and amortization | |
| | Depreciation and amortization | |
| | Depreciation and amortization | Depreciation and amortization | 1,063 | | | 1,016 | |
| Amortization of nuclear fuel | Amortization of nuclear fuel | 56 | | | 46 | |
| Amortization of debt issuance costs and premium/discounts | Amortization of debt issuance costs and premium/discounts | 12 | | | 17 | |
| Deferred income taxes and investment tax credits, net | Deferred income taxes and investment tax credits, net | 128 | | | 137 | |
| Allowance for equity funds used during construction | Allowance for equity funds used during construction | (39) | | | (31) | |
| Stock-based compensation costs | Stock-based compensation costs | 21 | | | 18 | |
| Other | Other | 12 | | | 63 | |
| Changes in assets and liabilities: | Changes in assets and liabilities: | |
| Receivables | Receivables | 54 | | | (296) | |
| Receivables | |
| Receivables | |
| Inventories | Inventories | (93) | | | (103) | |
| Accounts and wages payable | Accounts and wages payable | (287) | | | (128) | |
| Taxes accrued | Taxes accrued | 156 | | | 147 | |
| Regulatory assets and liabilities | Regulatory assets and liabilities | 15 | | | (17) | |
| Assets, other | Assets, other | (78) | | | (87) | |
| Liabilities, other | Liabilities, other | 51 | | | 19 | |
| Pension and other postretirement benefits | Pension and other postretirement benefits | (182) | | | (49) | |
| Counterparty collateral, net | Counterparty collateral, net | 144 | | | (68) | |
| | Net cash provided by operating activities | Net cash provided by operating activities | 2,031 | | | 1,599 | |
| | Net cash provided by operating activities | |
| | Net cash provided by operating activities | |
| Cash Flows From Investing Activities: | Cash Flows From Investing Activities: | | | |
| Capital expenditures | Capital expenditures | (2,571) | | | (2,437) | |
| Capital expenditures | |
| Capital expenditures | |
| | Nuclear fuel expenditures | |
| Nuclear fuel expenditures | |
| Nuclear fuel expenditures | Nuclear fuel expenditures | (63) | | | (22) | |
| Purchases of securities – nuclear decommissioning trust fund | Purchases of securities – nuclear decommissioning trust fund | (156) | | | (176) | |
| Sales and maturities of securities – nuclear decommissioning trust fund | Sales and maturities of securities – nuclear decommissioning trust fund | 136 | | | 163 | |
| | Other | Other | (2) | | | 14 | |
| | | Other | |
| | Other | |
| | Net cash used in investing activities | |
| | Net cash used in investing activities | |
| | Net cash used in investing activities | Net cash used in investing activities | (2,656) | | | (2,458) | |
| Cash Flows From Financing Activities: | Cash Flows From Financing Activities: | | | |
| Dividends on common stock | Dividends on common stock | (496) | | | (457) | |
| Dividends on common stock | |
| Dividends on common stock | |
| Dividends paid to noncontrolling interest holders | Dividends paid to noncontrolling interest holders | (4) | | | (4) | |
| Short-term debt, net | Short-term debt, net | 272 | | | 675 | |
| Maturities of long-term debt | (100) | | | (450) | |
| | Issuances of long-term debt | |
| | Issuances of long-term debt | |
| | Issuances of long-term debt | Issuances of long-term debt | 997 | | | 1,118 | |
| Issuances of common stock | Issuances of common stock | 28 | | | 29 | |
| | Employee payroll taxes related to stock-based compensation | Employee payroll taxes related to stock-based compensation | (20) | | | (16) | |
| | Employee payroll taxes related to stock-based compensation | |
| | Employee payroll taxes related to stock-based compensation | |
| Debt issuance costs | Debt issuance costs | (12) | | | (11) | |
| Other | Other | (10) | | | — | |
| | | Net cash provided by financing activities | |
| | Net cash provided by financing activities | |
| | Net cash provided by financing activities | Net cash provided by financing activities | 655 | | | 884 | |
| Net change in cash, cash equivalents, and restricted cash | Net change in cash, cash equivalents, and restricted cash | 30 | | | 25 | |
| Cash, cash equivalents, and restricted cash at beginning of year | Cash, cash equivalents, and restricted cash at beginning of year | 216 | | | 155 | |
| | Cash, cash equivalents, and restricted cash at end of period | Cash, cash equivalents, and restricted cash at end of period | $ | 246 | | | $ | 180 | |
| | Cash, cash equivalents, and restricted cash at end of period | |
| | Cash, cash equivalents, and restricted cash at end of period | |
| |
The accompanying notes are an integral part of these consolidated financial statements.
AMEREN CORPORATION
CONSOLIDATED STATEMENT OF SHAREHOLDERS’ EQUITY
(Unaudited) (In millions, except per share amounts)
| | | | Three Months Ended September 30, | | Nine Months Ended September 30, |
| | | 2023 | | 2022 | | 2023 | | 2022 |
| | | | Three Months Ended March 31, |
| | | | | | | | 2024 | | 2023 |
| | Common Stock | |
| Common Stock | |
| Common Stock | Common Stock | $ | 3 | | | $ | 3 | | | $ | 3 | | | $ | 3 | |
| | | Other Paid-in Capital: | Other Paid-in Capital: | |
| Beginning of period | 6,880 | | | 6,527 | | | 6,860 | | | 6,502 | |
| | | Other Paid-in Capital: | |
| | Other Paid-in Capital: | |
| Beginning of year | |
| Beginning of year | |
| Beginning of year | |
| | Shares issued under the DRPlus and 401(k) plan | |
| | Shares issued under the DRPlus and 401(k) plan | |
| | Shares issued under the DRPlus and 401(k) plan | Shares issued under the DRPlus and 401(k) plan | 12 | | | 12 | | | 35 | | | 37 | |
| Stock-based compensation activity | Stock-based compensation activity | 8 | | | 9 | | | 5 | | | 9 | |
| | Other paid-in capital, end of period | Other paid-in capital, end of period | 6,900 | | | 6,548 | | | 6,900 | | | 6,548 | |
| | | Other paid-in capital, end of period | |
| | Other paid-in capital, end of period | |
| | Retained Earnings: | Retained Earnings: | |
| Beginning of period | 3,817 | | | 3,336 | | | 3,646 | | | 3,182 | |
| Retained Earnings: | |
| Retained Earnings: | |
| Beginning of year | |
| Beginning of year | |
| Beginning of year | |
| Net income attributable to Ameren common shareholders | Net income attributable to Ameren common shareholders | 493 | | | 452 | | | 994 | | | 911 | |
| Dividends on common stock | Dividends on common stock | (166) | | | (152) | | | (496) | | | (457) | |
| | Retained earnings, end of period | Retained earnings, end of period | 4,144 | | | 3,636 | | | 4,144 | | | 3,636 | |
| Retained earnings, end of period | |
| Retained earnings, end of period | |
| | Accumulated Other Comprehensive Income (Loss): | |
| Accumulated Other Comprehensive Loss: | |
| Accumulated Other Comprehensive Loss: | |
| Accumulated Other Comprehensive Loss: | |
| | Deferred retirement benefit costs, beginning of period | (3) | | | 14 | | | (1) | | | 13 | |
| Deferred retirement benefit costs, beginning of year | |
| | | Deferred retirement benefit costs, beginning of year | |
| | Deferred retirement benefit costs, beginning of year | |
| | Change in deferred retirement benefit costs | |
| Change in deferred retirement benefit costs | |
| Change in deferred retirement benefit costs | Change in deferred retirement benefit costs | (1) | | | — | | | (3) | | | 1 | |
| | Deferred retirement benefit costs, end of period | Deferred retirement benefit costs, end of period | (4) | | | 14 | | | (4) | | | 14 | |
| Total accumulated other comprehensive income (loss), end of period | (4) | | | 14 | | | (4) | | | 14 | |
| Deferred retirement benefit costs, end of period | |
| Deferred retirement benefit costs, end of period | |
| Total accumulated other comprehensive loss, end of period | |
| Total Shareholders’ Equity | Total Shareholders’ Equity | $ | 11,043 | | | $ | 10,201 | | | $ | 11,043 | | | $ | 10,201 | |
| | Noncontrolling Interests: | Noncontrolling Interests: | |
| Beginning of period | 129 | | | 129 | | | 129 | | | 129 | |
| Noncontrolling Interests: | |
| Noncontrolling Interests: | |
| Beginning of year | |
| Beginning of year | |
| Beginning of year | |
| Net income attributable to noncontrolling interest holders | Net income attributable to noncontrolling interest holders | 1 | | | 1 | | | 4 | | | 4 | |
| Dividends paid to noncontrolling interest holders | Dividends paid to noncontrolling interest holders | (1) | | | (1) | | | (4) | | | (4) | |
| | Noncontrolling interests, end of period | Noncontrolling interests, end of period | 129 | | | 129 | | | 129 | | | 129 | |
| | Noncontrolling interests, end of period | |
| | Noncontrolling interests, end of period | |
| Total Equity | Total Equity | $ | 11,172 | | | $ | 10,330 | | | $ | 11,172 | | | $ | 10,330 | |
| | | Common stock shares outstanding at beginning of period | 262.7 | | | 258.4 | | | 262.0 | | | 257.7 | |
| Common stock shares outstanding at beginning of year | |
| | Common stock shares outstanding at beginning of year | |
| | Common stock shares outstanding at beginning of year | |
| | Shares issued under the DRPlus and 401(k) plan | |
| | Shares issued under the DRPlus and 401(k) plan | |
| | Shares issued under the DRPlus and 401(k) plan | Shares issued under the DRPlus and 401(k) plan | 0.2 | | | 0.1 | | | 0.4 | | | 0.4 | |
| Shares issued for stock-based compensation | Shares issued for stock-based compensation | — | | | — | | | 0.5 | | | 0.4 | |
| Common stock shares outstanding at end of period | Common stock shares outstanding at end of period | 262.9 | | | 258.5 | | | 262.9 | | | 258.5 | |
| | Dividends per common share | Dividends per common share | $ | 0.63 | | | $ | 0.59 | | | $ | 1.89 | | | $ | 1.77 | |
| Dividends per common share | |
| Dividends per common share | |
The accompanying notes are an integral part of these consolidated financial statements.
UNION ELECTRIC COMPANY (d/b/a AMEREN MISSOURI)
CONSOLIDATED STATEMENT OF INCOME
(Unaudited) (In millions)
| | | |
| | | | Three Months Ended September 30, | | Nine Months Ended September 30, | | | Three Months Ended March 31, |
| | | 2023 | | 2022 | | 2023 | | 2022 | | | | | | 2024 | | 2023 |
| Operating Revenues: | Operating Revenues: | | | | | | | |
| Electric | Electric | $ | 1,219 | | | $ | 1,338 | | | $ | 2,978 | | | $ | 2,966 | |
| Electric | |
| Electric | |
| Natural gas | Natural gas | 18 | | | 21 | | | 123 | | | 130 | |
| | Total operating revenues | Total operating revenues | 1,237 | | | 1,359 | | | 3,101 | | | 3,096 | |
| Total operating revenues | |
| Total operating revenues | |
| Operating Expenses: | Operating Expenses: | | | | | | | |
| Fuel | 158 | | | 117 | | | 423 | | | 376 | |
| Purchased power | 75 | | | 247 | | | 420 | | | 458 | |
| Fuel and purchased power | |
| Fuel and purchased power | |
| Fuel and purchased power | |
| | Natural gas purchased for resale | |
| Natural gas purchased for resale | |
| Natural gas purchased for resale | Natural gas purchased for resale | 4 | | | 7 | | | 60 | | | 65 | |
| Other operations and maintenance | Other operations and maintenance | 256 | | | 252 | | | 732 | | | 744 | |
| | Depreciation and amortization | |
| Depreciation and amortization | |
| Depreciation and amortization | Depreciation and amortization | 217 | | | 208 | | | 579 | | | 550 | |
| Taxes other than income taxes | Taxes other than income taxes | 108 | | | 106 | | | 276 | | | 281 | |
| Total operating expenses | Total operating expenses | 818 | | | 937 | | | 2,490 | | | 2,474 | |
| Operating Income | Operating Income | 419 | | | 422 | | | 611 | | | 622 | |
| | Other Income, Net | Other Income, Net | 44 | | | 25 | | | 85 | | | 72 | |
| | Other Income, Net | |
| | Other Income, Net | |
| Interest Charges | Interest Charges | 63 | | | 58 | | | 166 | | | 157 | |
| Income Before Income Taxes | Income Before Income Taxes | 400 | | | 389 | | | 530 | | | 537 | |
| Income Taxes Benefit | (12) | | | (9) | | | (14) | | | (13) | |
| Income Taxes (Benefit) | |
| Net Income | Net Income | 412 | | | 398 | | | 544 | | | 550 | |
| | Preferred Stock Dividends | Preferred Stock Dividends | 1 | | | 1 | | | 3 | | | 3 | |
| | Preferred Stock Dividends | |
| | Preferred Stock Dividends | |
| Net Income Available to Common Shareholder | Net Income Available to Common Shareholder | $ | 411 | | | $ | 397 | | | $ | 541 | | | $ | 547 | |
The accompanying notes as they relate to Ameren Missouri are an integral part of these consolidated financial statements.
UNION ELECTRIC COMPANY (d/b/a AMEREN MISSOURI)
CONSOLIDATED BALANCE SHEET
(Unaudited) (In millions, except per share amounts)
| | September 30,
2023 | | December 31, 2022 |
| March 31,
2024 | | | March 31,
2024 | | December 31, 2023 |
| ASSETS | ASSETS | | | |
| Current Assets: | Current Assets: | |
| Current Assets: | |
| Current Assets: | |
| Cash and cash equivalents | |
| Cash and cash equivalents | |
| Cash and cash equivalents | Cash and cash equivalents | $ | 3 | | | $ | — | |
| | Accounts receivable – trade (less allowance for doubtful accounts of $12 and $13, respectively) | 289 | | | 244 | |
| Accounts receivable – trade (less allowance for doubtful accounts of $11 and $12, respectively) | |
| Accounts receivable – trade (less allowance for doubtful accounts of $11 and $12, respectively) | |
| Accounts receivable – trade (less allowance for doubtful accounts of $11 and $12, respectively) | |
| Accounts receivable – affiliates | Accounts receivable – affiliates | 16 | | | 51 | |
| Unbilled revenue | Unbilled revenue | 240 | | | 184 | |
| Miscellaneous accounts receivable | Miscellaneous accounts receivable | 24 | | | 18 | |
| Inventories | Inventories | 512 | | | 434 | |
| | Current regulatory assets | Current regulatory assets | 91 | | | 254 | |
| Investment in industrial development revenue bonds | — | | | 240 | |
| Current collateral assets | 12 | | | 101 | |
| Current regulatory assets | |
| Current regulatory assets | |
| | Other current assets | |
| | Other current assets | |
| | Other current assets | Other current assets | 41 | | | 66 | |
| Total current assets | Total current assets | 1,228 | | | 1,592 | |
| Property, Plant, and Equipment, Net | Property, Plant, and Equipment, Net | 16,797 | | | 16,124 | |
| Investments and Other Assets: | Investments and Other Assets: | |
| Nuclear decommissioning trust fund | Nuclear decommissioning trust fund | 1,042 | | | 958 | |
| Nuclear decommissioning trust fund | |
| Nuclear decommissioning trust fund | |
| | Regulatory assets | |
| Regulatory assets | |
| Regulatory assets | Regulatory assets | 700 | | | 594 | |
| Pension and other postretirement benefits | Pension and other postretirement benefits | 120 | | | 98 | |
| Other assets | Other assets | 137 | | | 140 | |
| Total investments and other assets | Total investments and other assets | 1,999 | | | 1,790 | |
| TOTAL ASSETS | TOTAL ASSETS | $ | 20,024 | | | $ | 19,506 | |
| LIABILITIES AND SHAREHOLDERS’ EQUITY | LIABILITIES AND SHAREHOLDERS’ EQUITY | | | |
| Current Liabilities: | Current Liabilities: | |
| Current Liabilities: | |
| Current Liabilities: | |
| Current maturities of long-term debt | |
| Current maturities of long-term debt | |
| Current maturities of long-term debt | Current maturities of long-term debt | $ | 350 | | | $ | 240 | |
| Short-term debt | Short-term debt | 157 | | | 329 | |
| | Borrowings from money pool | |
| Accounts and wages payable | Accounts and wages payable | 396 | | | 606 | |
| Accounts payable – affiliates | Accounts payable – affiliates | 85 | | | 43 | |
| Taxes accrued | Taxes accrued | 181 | | | 29 | |
| | Other current liabilities | Other current liabilities | 213 | | | 323 | |
| | Other current liabilities | |
| | Other current liabilities | |
| Total current liabilities | Total current liabilities | 1,382 | | | 1,570 | |
| Long-term Debt, Net | Long-term Debt, Net | 5,991 | | | 5,846 | |
| Deferred Credits and Other Liabilities: | Deferred Credits and Other Liabilities: | |
| Accumulated deferred income taxes and tax credits, net | Accumulated deferred income taxes and tax credits, net | 2,018 | | | 1,982 | |
| Accumulated deferred income taxes and tax credits, net | |
| Accumulated deferred income taxes and tax credits, net | |
| | Regulatory liabilities | |
| Regulatory liabilities | |
| Regulatory liabilities | Regulatory liabilities | 2,851 | | | 2,871 | |
| Asset retirement obligations | Asset retirement obligations | 757 | | | 759 | |
| | Other deferred credits and liabilities | Other deferred credits and liabilities | 57 | | | 51 | |
| Other deferred credits and liabilities | |
| Other deferred credits and liabilities | |
| Total deferred credits and other liabilities | Total deferred credits and other liabilities | 5,683 | | | 5,663 | |
| Commitments and Contingencies (Notes 2, 8, 9, and 10) | Commitments and Contingencies (Notes 2, 8, 9, and 10) | | | | Commitments and Contingencies (Notes 2, 8, 9, and 10) | | | |
| Shareholders’ Equity: | Shareholders’ Equity: | |
| Common stock, $5 par value, 150.0 shares authorized – 102.1 shares outstanding | |
| Common stock, $5 par value, 150.0 shares authorized – 102.1 shares outstanding | |
| Common stock, $5 par value, 150.0 shares authorized – 102.1 shares outstanding | Common stock, $5 par value, 150.0 shares authorized – 102.1 shares outstanding | 511 | | | 511 | |
| Other paid-in capital, principally premium on common stock | Other paid-in capital, principally premium on common stock | 2,725 | | | 2,725 | |
| Preferred stock | Preferred stock | 80 | | | 80 | |
| Retained earnings | Retained earnings | 3,652 | | | 3,111 | |
| Total shareholders’ equity | Total shareholders’ equity | 6,968 | | | 6,427 | |
| TOTAL LIABILITIES AND SHAREHOLDERS’ EQUITY | TOTAL LIABILITIES AND SHAREHOLDERS’ EQUITY | $ | 20,024 | | | $ | 19,506 | |
The accompanying notes as they relate to Ameren Missouri are an integral part of these consolidated financial statements.
UNION ELECTRIC COMPANY (d/b/a AMEREN MISSOURI)
CONSOLIDATED STATEMENT OF CASH FLOWS
(Unaudited) (In millions)
| | Nine Months Ended September 30, |
| 2023 | | 2022 |
| Three Months Ended March 31, | | | Three Months Ended March 31, |
| 2024 | | | 2024 | | 2023 |
| Cash Flows From Operating Activities: | Cash Flows From Operating Activities: | | | |
| Net income | Net income | $ | 544 | | | $ | 550 | |
| Net income | |
| Net income | |
| Adjustments to reconcile net income to net cash provided by operating activities: | Adjustments to reconcile net income to net cash provided by operating activities: | |
| | Depreciation and amortization | |
| | Depreciation and amortization | |
| | Depreciation and amortization | Depreciation and amortization | 618 | | | 603 | |
| Amortization of nuclear fuel | Amortization of nuclear fuel | 56 | | | 46 | |
| | Amortization of debt issuance costs and premium/discounts | Amortization of debt issuance costs and premium/discounts | 5 | | | 5 | |
| Amortization of debt issuance costs and premium/discounts | |
| Amortization of debt issuance costs and premium/discounts | |
| Deferred income taxes and investment tax credits, net | Deferred income taxes and investment tax credits, net | (73) | | | (17) | |
| Allowance for equity funds used during construction | Allowance for equity funds used during construction | (20) | | | (17) | |
| Other | Other | (12) | | | 9 | |
| Changes in assets and liabilities: | Changes in assets and liabilities: | |
| Receivables | |
| Receivables | |
| Receivables | Receivables | (119) | | | (160) | |
| Inventories | Inventories | (78) | | | (19) | |
| Accounts and wages payable | Accounts and wages payable | (206) | | | (192) | |
| Taxes accrued | Taxes accrued | 222 | | | 161 | |
| Regulatory assets and liabilities | Regulatory assets and liabilities | 65 | | | (164) | |
| Assets, other | Assets, other | 12 | | | (9) | |
| Liabilities, other | Liabilities, other | (5) | | | 14 | |
| Pension and other postretirement benefits | Pension and other postretirement benefits | (67) | | | (12) | |
| Counterparty collateral, net | Counterparty collateral, net | 89 | | | (72) | |
| Net cash provided by operating activities | Net cash provided by operating activities | 1,031 | | | 726 | |
| Cash Flows From Investing Activities: | Cash Flows From Investing Activities: | | | |
| Capital expenditures | Capital expenditures | (1,255) | | | (1,237) | |
| Capital expenditures | |
| Capital expenditures | |
| | Nuclear fuel expenditures | |
| Nuclear fuel expenditures | |
| Nuclear fuel expenditures | Nuclear fuel expenditures | (63) | | | (22) | |
| Purchases of securities – nuclear decommissioning trust fund | Purchases of securities – nuclear decommissioning trust fund | (156) | | | (176) | |
| Sales and maturities of securities – nuclear decommissioning trust fund | Sales and maturities of securities – nuclear decommissioning trust fund | 136 | | | 163 | |
| | Other | — | | | 17 | |
| | Net cash used in investing activities | |
| | Net cash used in investing activities | |
| | Net cash used in investing activities | Net cash used in investing activities | (1,338) | | | (1,255) | |
| Cash Flows From Financing Activities: | Cash Flows From Financing Activities: | | | |
| | Dividends on preferred stock | Dividends on preferred stock | (3) | | | (3) | |
| | Dividends on preferred stock | |
| | Dividends on preferred stock | |
| Short-term debt, net | Short-term debt, net | (172) | | | 13 | |
| | Money pool borrowings, net | |
| | Issuances of long-term debt | Issuances of long-term debt | 499 | | | 524 | |
| Issuances of long-term debt | |
| Issuances of long-term debt | |
| | Debt issuance costs | |
| Debt issuance costs | |
| Debt issuance costs | Debt issuance costs | (7) | | | (6) | |
| Other | Other | (10) | | | — | |
| Net cash provided by financing activities | Net cash provided by financing activities | 307 | | | 528 | |
| Net change in cash, cash equivalents, and restricted cash | Net change in cash, cash equivalents, and restricted cash | — | | | (1) | |
| Cash, cash equivalents, and restricted cash at beginning of year | Cash, cash equivalents, and restricted cash at beginning of year | 13 | | | 8 | |
| Cash, cash equivalents, and restricted cash at end of period | Cash, cash equivalents, and restricted cash at end of period | $ | 13 | | | $ | 7 | |
The accompanying notes as they relate to Ameren Missouri are an integral part of these consolidated financial statements.
UNION ELECTRIC COMPANY (d/b/a AMEREN MISSOURI)
CONSOLIDATED STATEMENT OF SHAREHOLDERS’ EQUITY
(Unaudited) (In millions)
| | | |
| | | | Three Months Ended September 30, | | Nine Months Ended September 30, | | | Three Months Ended March 31, |
| | | 2023 | | 2022 | | 2023 | | 2022 | | | | | | 2024 | | 2023 |
| Common Stock | Common Stock | $ | 511 | | | $ | 511 | | | $ | 511 | | | $ | 511 | |
| | Other Paid-in Capital | |
| Other Paid-in Capital | |
| Other Paid-in Capital | Other Paid-in Capital | 2,725 | | | 2,725 | | | 2,725 | | | 2,725 | |
| | | Preferred Stock | Preferred Stock | 80 | | | 80 | | | 80 | | | 80 | |
| | | Preferred Stock | |
| | Preferred Stock | |
| | Retained Earnings: | Retained Earnings: | |
| Beginning of period | 3,241 | | | 2,745 | | | 3,111 | | | 2,595 | |
| Retained Earnings: | |
| Retained Earnings: | |
| Beginning of year | |
| Beginning of year | |
| Beginning of year | |
| Net income | Net income | 412 | | | 398 | | | 544 | | | 550 | |
| | Dividends on preferred stock | |
| Dividends on preferred stock | |
| Dividends on preferred stock | Dividends on preferred stock | (1) | | | (1) | | | (3) | | | (3) | |
| Retained earnings, end of period | Retained earnings, end of period | 3,652 | | | 3,142 | | | 3,652 | | | 3,142 | |
| | Total Shareholders’ Equity | Total Shareholders’ Equity | $ | 6,968 | | | $ | 6,458 | | | $ | 6,968 | | | $ | 6,458 | |
| Total Shareholders’ Equity | |
| Total Shareholders’ Equity | |
The accompanying notes as they relate to Ameren Missouri are an integral part of these consolidated financial statements.
AMEREN ILLINOIS COMPANY (d/b/a AMEREN ILLINOIS)
STATEMENT OF INCOME
(Unaudited) (In millions)
| | | |
| | | | Three Months Ended September 30, | | Nine Months Ended September 30, | | | Three Months Ended March 31, |
| | | 2023 | | 2022 | | 2023 | | 2022 | | | | | | 2024 | | 2023 |
| Operating Revenues: | Operating Revenues: | | | | | | | |
| Electric | Electric | $ | 661 | | | $ | 758 | | | $ | 1,998 | | | $ | 1,886 | |
| Electric | |
| Electric | |
| Natural gas | Natural gas | 122 | | | 146 | | | 665 | | | 811 | |
| Total operating revenues | Total operating revenues | 783 | | | 904 | | | 2,663 | | | 2,697 | |
| Operating Expenses: | Operating Expenses: | | | | | | | |
| Purchased power | |
| Purchased power | |
| Purchased power | Purchased power | 200 | | | 319 | | | 679 | | | 608 | |
| Natural gas purchased for resale | Natural gas purchased for resale | 26 | | | 51 | | | 220 | | | 366 | |
| Other operations and maintenance | Other operations and maintenance | 200 | | | 215 | | | 603 | | | 663 | |
| Depreciation and amortization | Depreciation and amortization | 139 | | | 130 | | | 410 | | | 382 | |
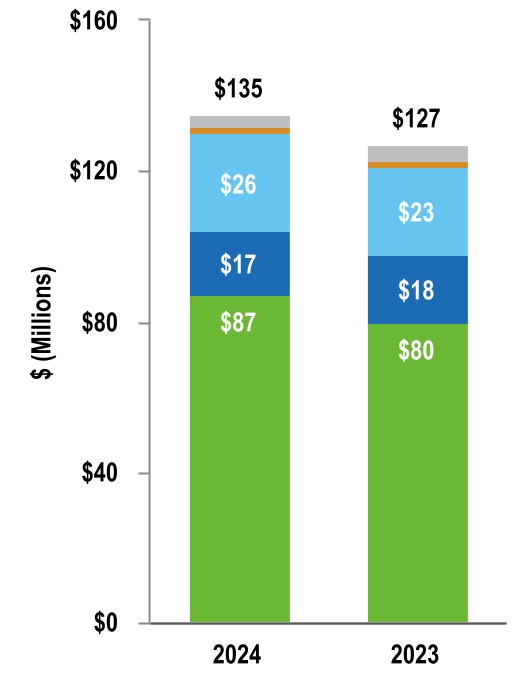
| Taxes other than income taxes | Taxes other than income taxes | 34 | | | 34 | | | 108 | | | 122 | |
| Total operating expenses | Total operating expenses | 599 | | | 749 | | | 2,020 | | | 2,141 | |
| Operating Income | Operating Income | 184 | | | 155 | | | 643 | | | 556 | |
| | Other Income, Net | Other Income, Net | 37 | | | 26 | | | 115 | | | 75 | |
| | Other Income, Net | |
| | Other Income, Net | |
| Interest Charges | Interest Charges | 54 | | | 42 | | | 151 | | | 125 | |
| Income Before Income Taxes | Income Before Income Taxes | 167 | | | 139 | | | 607 | | | 506 | |
| Income Taxes | Income Taxes | 42 | | | 36 | | | 154 | | | 130 | |
| Net Income | 125 | | | 103 | | | 453 | | | 376 | |
| | Preferred Stock Dividends | — | | | — | | | 1 | | | 1 | |
| | Net Income Available to Common Shareholder | Net Income Available to Common Shareholder | $ | 125 | | | $ | 103 | | | $ | 452 | | | $ | 375 | |
| | Net Income Available to Common Shareholder | |
| | Net Income Available to Common Shareholder | |
The accompanying notes as they relate to Ameren Illinois are an integral part of these financial statements.
AMEREN ILLINOIS COMPANY (d/b/a AMEREN ILLINOIS)
BALANCE SHEET
(Unaudited) (In millions)
| | September 30,
2023 | | December 31, 2022 |
| March 31,
2024 | | | March 31,
2024 | | December 31, 2023 |
| ASSETS | ASSETS | | | |
| Current Assets: | Current Assets: | |
| Current Assets: | |
| Current Assets: | |
| Cash and cash equivalents | |
| Cash and cash equivalents | |
| Cash and cash equivalents | Cash and cash equivalents | $ | — | | | $ | — | |
| | Accounts receivable – trade (less allowance for doubtful accounts of $21 and $18, respectively) | 294 | | | 341 | |
| Accounts receivable – trade (less allowance for doubtful accounts of $26 and $18, respectively) | |
| Accounts receivable – trade (less allowance for doubtful accounts of $26 and $18, respectively) | |
| Accounts receivable – trade (less allowance for doubtful accounts of $26 and $18, respectively) | |
| Accounts receivable – affiliates | Accounts receivable – affiliates | 11 | | | 12 | |
| Unbilled revenue | Unbilled revenue | 120 | | | 262 | |
| Miscellaneous accounts receivable | Miscellaneous accounts receivable | 29 | | | 23 | |
| Inventories | Inventories | 248 | | | 233 | |
| | Current regulatory assets | Current regulatory assets | 63 | | | 87 | |
| | Current regulatory assets | |
| | Current regulatory assets | |
| | Other current assets | |
| Other current assets | |
| Other current assets | Other current assets | 46 | | | 98 | |
| Total current assets | Total current assets | 811 | | | 1,056 | |
| Property, Plant, and Equipment, Net | Property, Plant, and Equipment, Net | 14,271 | | | 13,353 | |
| Investments and Other Assets: | Investments and Other Assets: | |
| Goodwill | |
| Goodwill | |
| Goodwill | Goodwill | 411 | | | 411 | |
| Regulatory assets | Regulatory assets | 1,046 | | | 821 | |
| Pension and other postretirement benefits | Pension and other postretirement benefits | 341 | | | 318 | |
| Other assets | Other assets | 565 | | | 482 | |
| Total investments and other assets | Total investments and other assets | 2,363 | | | 2,032 | |
| TOTAL ASSETS | TOTAL ASSETS | $ | 17,445 | | | $ | 16,441 | |
| LIABILITIES AND SHAREHOLDERS’ EQUITY | LIABILITIES AND SHAREHOLDERS’ EQUITY | | | |
| Current Liabilities: | Current Liabilities: | |
| Current Liabilities: | |
| Current Liabilities: | |
| Current maturities of long-term debt | |
| Current maturities of long-term debt | |
| Current maturities of long-term debt | Current maturities of long-term debt | $ | — | | | $ | 100 | |
| Short-term debt | Short-term debt | 59 | | | 264 | |
| | Borrowings from money pool | |
| Accounts and wages payable | Accounts and wages payable | 420 | | | 451 | |
| Accounts payable – affiliates | Accounts payable – affiliates | 136 | | | 93 | |
| | Customer deposits | Customer deposits | 132 | | | 87 | |
| | Customer deposits | |
| | Customer deposits | |
| | Current regulatory liabilities | |
| | Current regulatory liabilities | |
| | Current regulatory liabilities | Current regulatory liabilities | 53 | | | 64 | |
| Other current liabilities | Other current liabilities | 242 | | | 232 | |
| Total current liabilities | Total current liabilities | 1,042 | | | 1,291 | |
| Long-term Debt, Net | Long-term Debt, Net | 5,231 | | | 4,735 | |
| Deferred Credits and Other Liabilities: | Deferred Credits and Other Liabilities: | |
| Accumulated deferred income taxes and investment tax credits, net | Accumulated deferred income taxes and investment tax credits, net | 1,845 | | | 1,699 | |
| Accumulated deferred income taxes and investment tax credits, net | |
| Accumulated deferred income taxes and investment tax credits, net | |
| | Regulatory liabilities | Regulatory liabilities | 2,353 | | | 2,313 | |
| Regulatory liabilities | |
| Regulatory liabilities | |
| | | Other deferred credits and liabilities | |
| | Other deferred credits and liabilities | |
| | Other deferred credits and liabilities | Other deferred credits and liabilities | 304 | | | 235 | |
| Total deferred credits and other liabilities | Total deferred credits and other liabilities | 4,502 | | | 4,247 | |
| Commitments and Contingencies (Notes 2, 8, and 9) | Commitments and Contingencies (Notes 2, 8, and 9) | | | | Commitments and Contingencies (Notes 2, 8, and 9) | | | |
| Shareholders’ Equity: | Shareholders’ Equity: | |
| Common stock, no par value, 45.0 shares authorized – 25.5 shares outstanding | Common stock, no par value, 45.0 shares authorized – 25.5 shares outstanding | — | | | — | |
| Common stock, no par value, 45.0 shares authorized – 25.5 shares outstanding | |
| Common stock, no par value, 45.0 shares authorized – 25.5 shares outstanding | |
| Other paid-in capital | Other paid-in capital | 2,979 | | | 2,929 | |
| Preferred stock | Preferred stock | 49 | | | 49 | |
| Retained earnings | Retained earnings | 3,642 | | | 3,190 | |
| | Total shareholders’ equity | Total shareholders’ equity | 6,670 | | | 6,168 | |
| Total shareholders’ equity | |
| Total shareholders’ equity | |
| TOTAL LIABILITIES AND SHAREHOLDERS’ EQUITY | TOTAL LIABILITIES AND SHAREHOLDERS’ EQUITY | $ | 17,445 | | | $ | 16,441 | |
The accompanying notes as they relate to Ameren Illinois are an integral part of these financial statements.
AMEREN ILLINOIS COMPANY (d/b/a AMEREN ILLINOIS)
STATEMENT OF CASH FLOWS
(Unaudited) (In millions)
| | Nine Months Ended September 30, |
| 2023 | | 2022 |
| Three Months Ended March 31, | | | Three Months Ended March 31, |
| 2024 | | | 2024 | | 2023 |
| Cash Flows From Operating Activities: | Cash Flows From Operating Activities: | | | |
| Net income | Net income | $ | 453 | | | $ | 376 | |
| Net income | |
| Net income | |
| Adjustments to reconcile net income to net cash provided by operating activities: | Adjustments to reconcile net income to net cash provided by operating activities: | |
| Depreciation and amortization | |
| Depreciation and amortization | |
| Depreciation and amortization | Depreciation and amortization | 410 | | | 381 | |
| Amortization of debt issuance costs and premium/discounts | Amortization of debt issuance costs and premium/discounts | 3 | | | 9 | |
| Deferred income taxes and investment tax credits, net | Deferred income taxes and investment tax credits, net | 123 | | | 92 | |
| | Allowance for equity funds used during construction | Allowance for equity funds used during construction | (15) | | | (14) | |
| Allowance for equity funds used during construction | |
| Allowance for equity funds used during construction | |
| Other | Other | 31 | | | 19 | |
| Changes in assets and liabilities: | Changes in assets and liabilities: | |
| Receivables | |
| Receivables | |
| Receivables | Receivables | 164 | | | (138) | |
| Inventories | Inventories | (15) | | | (84) | |
| Accounts and wages payable | Accounts and wages payable | (77) | | | 62 | |
| Taxes accrued | Taxes accrued | 19 | | | 54 | |
| Regulatory assets and liabilities | Regulatory assets and liabilities | (45) | | | 147 | |
| Assets, other | Assets, other | (80) | | | (70) | |
| Liabilities, other | Liabilities, other | 74 | | | 25 | |
| Pension and other postretirement benefits | Pension and other postretirement benefits | (74) | | | (29) | |
| Counterparty collateral, net | Counterparty collateral, net | 55 | | | 5 | |
| | Net cash provided by operating activities | Net cash provided by operating activities | 1,026 | | | 835 | |
| Net cash provided by operating activities | |
| Net cash provided by operating activities | |
| Cash Flows From Investing Activities: | Cash Flows From Investing Activities: | | | |
| Capital expenditures | Capital expenditures | (1,226) | | | (1,145) | |
| Capital expenditures | |
| Capital expenditures | |
| | Other | |
| Other | |
| Other | Other | (3) | | | — | |
| Net cash used in investing activities | Net cash used in investing activities | (1,229) | | | (1,145) | |
| Cash Flows From Financing Activities: | Cash Flows From Financing Activities: | | | |
| | Dividends on preferred stock | (1) | | | (1) | |
| | Short-term debt, net | Short-term debt, net | (205) | | | 250 | |
| | Maturities of long-term debt | (100) | | | (400) | |
| Issuances of long-term debt | 498 | | | 499 | |
| Capital contributions from parent | 50 | | | — | |
| | Short-term debt, net | |
| | Short-term debt, net | |
| Money pool borrowings, net | |
| | Debt issuance costs | (5) | | | (5) | |
| | Net cash provided by financing activities | 237 | | | 343 | |
| | Net cash provided by (used in) financing activities | |
| | Net cash provided by (used in) financing activities | |
| | Net cash provided by (used in) financing activities | |
| Net change in cash, cash equivalents, and restricted cash | Net change in cash, cash equivalents, and restricted cash | 34 | | | 33 | |
| Cash, cash equivalents and restricted cash at beginning of year | Cash, cash equivalents and restricted cash at beginning of year | 191 | | | 133 | |
| Cash, cash equivalents, and restricted cash at end of period | Cash, cash equivalents, and restricted cash at end of period | $ | 225 | | | $ | 166 | |
The accompanying notes as they relate to Ameren Illinois are an integral part of these financial statements.
AMEREN ILLINOIS COMPANY (d/b/a AMEREN ILLINOIS)
STATEMENT OF SHAREHOLDERS’ EQUITY
(Unaudited) (In millions)
| | | |
| | | | Three Months Ended September 30, | | Nine Months Ended September 30, | | | Three Months Ended March 31, |
| | | 2023 | | 2022 | | 2023 | | 2022 | | | | | | 2024 | | 2023 |
| Common Stock | Common Stock | $ | — | | | $ | — | | | $ | — | | | $ | — | |
| | Other Paid-in Capital: | Other Paid-in Capital: | |
| Beginning of period | 2,929 | | | 2,914 | | | 2,929 | | | 2,914 | |
| Capital contributions from parent | 50 | | | — | | | 50 | | | — | |
| Other Paid-in Capital: | |
| Other Paid-in Capital: | |
| | Other paid-in capital, end of period | 2,979 | | | 2,914 | | | 2,979 | | | 2,914 | |
| | Preferred Stock | |
| | Preferred Stock | |
| | | | | Preferred Stock | Preferred Stock | 49 | | | 49 | | | 49 | | | 49 | |
| | | Retained Earnings: | Retained Earnings: | |
| Beginning of period | 3,517 | | | 2,949 | | | 3,190 | | | 2,677 | |
| | Retained Earnings: | |
| | Retained Earnings: | |
| Beginning of year | |
| Beginning of year | |
| Beginning of year | |
| Net income | Net income | 125 | | | 103 | | | 453 | | | 376 | |
| | Dividends on preferred stock | — | | | — | | | (1) | | | (1) | |
| | Retained earnings, end of period | |
| | Retained earnings, end of period | |
| | | Retained earnings, end of period | Retained earnings, end of period | 3,642 | | | 3,052 | | | 3,642 | | | 3,052 | |
| | | Total Shareholders’ Equity | Total Shareholders’ Equity | $ | 6,670 | | | $ | 6,015 | | | $ | 6,670 | | | $ | 6,015 | |
| | Total Shareholders’ Equity | |
| | Total Shareholders’ Equity | |
The accompanying notes as they relate to Ameren Illinois are an integral part of these financial statements.
AMEREN CORPORATION (Consolidated)
UNION ELECTRIC COMPANY (Consolidated) (d/b/a Ameren Missouri)
AMEREN ILLINOIS COMPANY (d/b/a Ameren Illinois)
COMBINED NOTES TO FINANCIAL STATEMENTS
(Unaudited)
September 30, 2023March 31, 2024
NOTE 1 – SUMMARY OF SIGNIFICANT ACCOUNTING POLICIES
General
Ameren, headquartered in St. Louis, Missouri, is a public utility holding company whose primary assets are its equity interests in its subsidiaries. Ameren’s subsidiaries are separate, independent legal entities with separate businesses, assets, and liabilities. Dividends on Ameren’s common stock and the payment of expenses by Ameren depend on distributions made to it by its subsidiaries. Ameren’s principal subsidiaries are listed below. Ameren also has other subsidiaries that conduct other activities, such as providing shared services.
•Union Electric Company, doing business as Ameren Missouri, operates a rate-regulated electric generation, transmission, and distribution business and a rate-regulated natural gas distribution business in Missouri.
•Ameren Illinois Company, doing business as Ameren Illinois, operates rate-regulated electric transmission, electric distribution, and natural gas distribution businesses in Illinois.
•ATXI operates a FERC rate-regulated electric transmission business in the MISO.
Ameren’s and Ameren Missouri’s financial statements are prepared on a consolidated basis and therefore include the accounts of their majority-owned subsidiaries. All intercompany transactions have been eliminated. Ameren Missouri’s subsidiaries were created for the acquisitionownership of renewable generation projects. Ameren Illinois has no subsidiaries. All tabular dollar amounts are in millions, unless otherwise indicated.
Our accounting policies conform to GAAP. Our financial statements reflect all adjustments (which include normal, recurring adjustments) that are necessary, in our opinion, for a fair presentation of our results. The preparation of financial statements in conformity with GAAP requires management to make certain estimates and assumptions. Such estimates and assumptions affect reported amounts of assets and liabilities, the disclosure of contingent assets and liabilities at the dates of financial statements, and the reported amounts of revenues and expenses during the reporting periods. Actual results could differ from those estimates. The results of operations for an interim period may not give a true indication of results that may be expected for a full year. These financial statements should be read in conjunction with the financial statements and accompanying notes included in the Form 10-K.
Variable Interest Entities
As of September 30, 2023,March 31, 2024, and December 31, 2022,2023, Ameren had unconsolidated variable interests in various equity method investments, primarily to advance clean and resilient energy technologies, totaling $73$74 million and $68$73 million, respectively, included in “Other assets” on Ameren’s consolidated balance sheet. Any earnings or losses related to these investments are included in “Other Income, Net” on Ameren’s consolidated statement of income and comprehensive income. Ameren is not the primary beneficiary of these investments because it does not have the power to direct matters that most significantly affect the activities of these variable interest entities. As of September 30, 2023,March 31, 2024, Ameren’s maximum exposure to loss related to these variable interests is limited to its investment of $73$74 million plus associated outstanding funding commitments of $14 million.
COLI
Ameren and Ameren Illinois have COLI, which is recorded at the net cash surrender value. The net cash surrender value is the amount that can be realized under the insurance policies at the balance sheet date. As of September 30, 2023,March 31, 2024, the cash surrender value of COLI at Ameren and Ameren Illinois was $250$255 million (December 31, 20222023 – $246$248 million) and $122$112 million (December 31, 20222023 – $118$111 million), respectively, while total borrowings against the policies were $116$104 million (December 31, 20222023 – $110$104 million) at both Ameren and Ameren Illinois. Ameren and Ameren Illinois have the right to offset the borrowings against the cash surrender value of the policies and, consequently, present the net asset in “Other assets” on their respective balance sheets. The net cash surrender value of Ameren’s COLI is affected by the investment performance of a separate account in which Ameren holds a beneficial interest.
NOTE 2 – RATE AND REGULATORY MATTERS
Below is a summary of updates to significant regulatory proceedings and related legal proceedings. See Note 2 – Rate and Regulatory Matters under Part II, Item 8, of the Form 10-K for additional information and a summary of our regulatory frameworks. We are unable to predict the ultimate outcome of these matters, the timing of final decisions of the various agencies and courts, or the impact on our results of operations, financial position, or liquidity.
Missouri
June 2023 MoPSC Electric Rate Order
In June 2023, the MoPSC issued an order in Ameren Missouri’s 2022 electric service regulatory rate review, approving a nonunanimous stipulation and agreement. The order resulted in an increase of $140 million to Ameren Missouri’s annual revenue requirement for electric retail service. The approved revenue requirement is based on infrastructure investments as of December 31, 2022, and included an extension of the depreciable lives of the Sioux Energy Center’s assets from 2028 to 2030. The order did not explicitly specify an ROE, capital structure, or rate base. The order provides for the continued use of the FAC and trackers for pension and postretirement benefits, uncertain income tax positions, certain excess deferred income taxes, and renewable energy standard compliance costs that the MoPSC previously authorized in earlier electric rate orders, as well as the use of an electric property tax tracker. It also includes a tracker for the utilization of production and investment tax credits or proceeds from the sale of certain tax credits allowed under the IRA. Production and investment tax credits produced by renewable energy centers that support compliance with the state of Missouri’s renewable energy standard, such as the High Prairie Renewable and Atchison Renewable energy centers, are not eligible for tracking under this mechanism as they are included in the RESRAM. For additional information regarding the property tax tracker and the IRA, see Note 2 – Rate and Regulatory Matters and Note 12 – Income Taxes under Part II, Item 8, in the Form 10-K. The order increased the annualized base level of net energy costs pursuant to the FAC by approximately $40 million from the base level established in the MoPSC’s December 2021 electric rate order. The order also changed annualized depreciation, regulatory asset and liability amortization amounts, and the base level of expenses for trackers. On an annualized basis, these changes reflect approximate increases in “Depreciation and amortization” of $90 million and “Other income, net”, of $100 million, related to non-service pension and postretirement benefit income, on Ameren’s and Ameren Missouri’s consolidated statements of income. The new rates became effective on July 9, 2023.
Solar Generation Facilities
During 2022 and 2023, Ameren Missouri, and certain subsidiaries of Ameren Missouri, entered into agreements to acquire and/or construct various solar generation facilities, which, if placed in-service, would be eligible for recovery under the PISA. The following table provides information with respect to each agreement:
| | | | | | | | | | | | | | | | | | | | |
| BoomtownHuck Finn
Solar Project(a)(b) | Huck FinnBoomtown
Solar Project(b)(c) | Split Rail Solar Project(d) | Cass County Solar Project(d)(c) | Vandalia Solar Project(b)(d) | Bowling Green Solar Project(b)(d) |
| Agreement type | Build-transfer | Build-transfer | Build-transfer | Build-transferDevelopment-transfer(e)
| Development-transferSelf-build(e)(f)
| Self-build(e)(g) | Self-build(e)(g)(f)
|
| Facility size | 150-MW200-MW | 200-MW150-MW | 300-MW | 150-MW | 50-MW | 50-MW |
| Status of MoPSC CCN | Approved February 2023 | Approved April 2023 | Approved February 2023March 2024 | Filed June 2023(h)(g) | Filed June 2023Approved March 2024(h)
| Filed June 2023Approved March 2024(h)
| Filed June 2023(h)
|
| Status of FERC approval of acquisition | Received OctoberMarch 2023 | Received MarchOctober 2023 | Expect to request by mid-2024 | Not applicable | Not applicable | Not applicable |
Earliest completion date(i)(h) | Fourth quarter 2024 | Fourth quarter 2024 | Mid-2026 | Fourth quarter 2024 | Fourth quarter 2025 | First quarter 2026 |
(a)The Boomtown Solar Project is expected to support Ameren Missouri’s transition to renewable energy generation and serve customers under the Renewable Solutions Program discussed below.
(b)These projects collectively represent approximately $0.65 billion of expected capital expenditures.
(c)The Huck Finn Solar Project is expected to support Ameren Missouri’s compliance with the state of Missouri’s renewable energy standard. Investments in the project will be eligible for recovery under the RESRAM.
(b)These projects collectively represent approximately $0.85 billion of expected capital expenditures.
(c)The Boomtown and Cass County solar projects are expected to support Ameren Missouri’s transition to renewable energy generation and serve customers under the Renewable Solutions Program.
(d)These solar projects are expected to support Ameren Missouri’s transition to renewable energy generation.
(e)These projects, and applicable agreements, are subject to the issuance of a CCN by the MoPSC.
(f)Ameren Missouri entered into an agreement to acquire the Cass County Solar Project, which includes project design, land rights, and engineering, procurement, and construction agreements for a solar generation facility. Ameren Missouri will constructtake over construction management of the Cass County facility after obtaining a CCN from the MoPSC and acquiring the project. Acquisition of the project is expected by mid-2024.
(g)(f)Ameren Missouri entered into engineering, procurement, and construction agreements to construct these solar projects.
(h)(g)In October 2023,Approval for the MoPSC staff filedCCN is conditioned upon full subscription of the project capacity under the Renewable Solutions Program, a recommendation that the MoPSC should not approve Ameren Missouri’s requests for CCNs for these solar projects, arguing Ameren Missouri did not adequately demonstrate the facilities are needed to continue providing service to customers.commercial, industrial, and governmental customer program. Ameren Missouri expects decisions on the CCNsa decision by the MoPSC inon the first quarter of 2024.Cass County Solar Project CCN once this project’s capacity under the Renewable Solutions Program is fully subscribed.
(i)(h)Expected completion dates are dependent on the timing of regulatory approvals, among other things.
Renewable Solutions Program
The April 2023 MoPSC order approving the CCN for the Boomtown Solar Project also approved Ameren Missouri’s Renewable Solutions Program and a tariff related to participation in the program. Collection under the tariff will not begin until the assets of the Boomtown Solar Project are placed in service. The program allows certain commercial, industrial, and governmental customers who enroll in the program to receive up to 100% of their energy from renewable resources.
MoPSC Staff Review of Planned Rush Island Energy Center RetirementCosts
In February 2022,November 2023, Ameren Missouri petitioned the MoPSC issued anfor a financing order directingto authorize the MoPSC staffissuance of securitized utility tariff bonds to review Ameren Missouri’sfinance $519 million of costs related to the planned accelerated retirement of the Rush Island Energy Center, as a resultwhich includes the expected remaining unrecovered net plant balance associated with the facility, among other costs. Ameren Missouri requested to collect the amounts necessary to repay the bonds over approximately 15 years from the date of bond issuance. In March 2024, the MoPSC staff filed an updated response to Ameren Missouri’s petition that stated Ameren Missouri’s decision to accelerate the retirement of the Rush Island Energy Center was prudent and recommended that $497 million of costs be financed through securitized utility tariff bonds. However, the MoPSC staff claimed Ameren Missouri’s prior actions that resulted in the adverse ruling in the NSR and Clean Air Act Litigation discussed in Note 9 – Commitments and Contingencies. The MoPSC staff’s review includes potential impactsContingencies were imprudent and recommended that the impact of those actions on customers be considered in future regulatory proceedings. In February 2024, the reliability and cost ofMoOPC filed a response to Ameren Missouri’s servicepetition that opposes the issuance of securitized utility tariff bonds. If Ameren Missouri is not allowed to its customers; Ameren Missouri’s plans to mitigate the customer impacts of the accelerated retirement; and the prudence of Ameren Missouri’s actions and decisions with regard to therecover Rush Island Energy Center among other things. In April 2022, the MoPSC staff filed an initial report with the MoPSCcosts through securitization or if future regulatory proceedings result in which the staff concluded early retirement of the Rush Island Energy Center may cause reliability concerns. The MoPSC staff is under no deadline to complete this review. Inrevenue reductions based on Ameren Missouri’s electric service regulatory rate review discussed above,prior actions that resulted in the MoPSC staff recommended a lower rate base foradverse ruling in the Rush Island Energy Center claiming imprudent actions by Ameren Missouri. While the nonunanimous stipulationNSR and agreement approved by the June 2023 MoPSC electric rate order did not specify any rate base disallowance,Clean Air Act litigation, it did not preclude parties to the agreement from raising issues regarding the prudence of Ameren Missouri’s actions and decisions with regard to the energy center in future proceedings. Ameren Missouri is unable to predict the results of this matter. Results of the review could be used in other MoPSC proceedings, which could have a material adverse effect on the results of operations, financial position, and liquidity of Ameren and Ameren Missouri. Ameren Missouri expects a decision by the MoPSC by the end of June 2024, but cannot predict the ultimate outcome of this regulatory proceeding.
MEEIA
In August 2023,January 2024, Ameren Missouri filed a proposed customer energy-efficiency plan with the MoPSC issued an order approvingunder the MEEIA. This filing proposed a nonunanimous stipulation and agreement to extend Ameren Missouri’s MEEIA 2019 program for an additional year through 2024. For the 2024 program year, the order approved the establishment ofthree-year plan, which includes a portfolio of customer energy-efficiency programs, along with the continued use of the MEEIA rider, which allows Ameren Missouri to collect from, or refund to, customers any difference in actual MEEIA program costs and related lost
electric revenues and the amounts collected from customers. If the plan is approved, Ameren Missouri intends to invest $123 million annually in the proposed customer energy-efficiency programs from 2025 to 2027. In addition, Ameren Missouri requested performance incentives that will provide Ameren Missouri an opportunityapplicable to each plan year to earn revenues including $12by achieving certain customer energy-efficiency savings and target spending goals. If 100% of the goals are achieved, Ameren Missouri would earn performance incentive revenues totaling $56 million over the three-year plan. Ameren Missouri also requested additional performance incentives applicable to each plan year totaling up to $14 million over the three-year plan, if Ameren Missouri achieves certain program spendingexceeds 100% of the goals. In 2024, Ameren Missouri expects to invest $76 million in energy-efficiency programs.a decision by the MoPSC by October 2024, but cannot predict the ultimate outcome of this regulatory proceeding.
Illinois
MYRP
In JanuaryDecember 2023, Ameren Illinois filed an MYRP with the ICC which was subsequently revisedissued an order in September 2023, to be used in setting electric distribution service rates for 2024 through 2027. Under theAmeren Illinois' MYRP the ICC would approveproceeding approving base rates for electric distribution serviceservices for 2024 through 2027 and rejecting Ameren Illinois' Grid Plan, which was addressed as part of the MYRP proceeding. Rate changes consistent with the order became effective in January 2024. The December 2023 order adopted an alternative methodology to be chargedestablish a rate base and revenue requirements for the years 2024 through 2027 using Ameren Illinois’ previously approved 2022 year-end rate base. The 2022 year-end rate base will remain in effect through 2027 unless subsequently changed by the ICC in the rehearing discussed below or if approval of a revised Grid Plan results in an update of each year’s revenue requirement. Pursuant to customersthe order, in March 2024, Ameren Illinois filed a revised Grid Plan and a revised MYRP to update the requested revenue requirements for 2024 through 2027. An ICC decision on the revised Grid Plan and updated revenue requirements is expected by December 2024 with rates effective in January 2025.
In January 2024, the ICC partially denied a rehearing requested by Ameren Illinois to revise the allowed ROE in the December 2023 order and granted Ameren Illinois’ rehearing request to consider whether it is appropriate to use the 2022 year-end rate base for each calendar year of the four-year period. RelatedMYRP and to this MYRP filing,include a base level of investments to maintain grid reliability in each year of the MYRP. Additionally, the scope of the rehearing includes a review of certain operations and maintenance expenses in each year of the MYRP. In February 2024, Ameren Illinois filed its request in the rehearing proceeding, and subsequently updated the request in April 2024, proposing an updated 2024 revenue requirement of $1,213 million, which is based on a $4.2 billion rate base, a capital structure composed of 50% common equity, and an allowed ROE of 8.72%. In April 2024, the ICC staff submittedfiled its recommendation in the rehearing proceeding. The ICC staff recommended a 2024 revenue requirement of $1,195 million, which is based on a $4.0 billion rate base, a capital structure composed of 50% common equity, and an allowed ROE of 8.72%. An ICC decision in the rehearing proceeding is expected by late June 2024, with new rates effective July 2024. Also, in January 2024, Ameren Illinois filed an appeal of the December 2023 ICC order and the administrative law judges issued a proposed order in September 2023 and October 2023, respectively. partial denial of Ameren Illinois’ request for rehearing, including the 8.72% ROE, to the Illinois Appellate Court for the Fifth Judicial District. The court is under no deadline to address the appeal. Ameren Illinois cannot predict the ultimate outcome of the revised Grid Plan filing, its request to update the associated MYRP revenue requirements for 2024 through 2027, the rehearing proceeding, or the appeal to the Illinois Appellate Court for the Fifth Judicial District.
The following table includespresents the forecastedapproved revenue requirement, therequirements, ROE, the capital structure common equity percentage, and the forecasted average annual rate base forin the ICC’s December 2023 order, as well as the proposed revenue requirements and annual rate base amounts in the March 2024 through 2027, as reflected in Ameren Illinois’ revised MYRP filing, the ICC staff’s filing, and the administrative law judges’ proposed order:MYRP:
| | | | | | | | | | | | | | | | | | | | | | | | | | | | | | | | | | | | | | |
| Ameren Illinois’
September 2023 Filing: | ICC Staff’s
September 2023 Filing: | Administrative Law Judges’
October 2023 Proposed Order: |
| Year | 2024 | 2025 | 2026 | 2027 | 2024 | 2025 | 2026 | 2027 | 2024 | 2025 | 2026 | 2027 |
Forecasted Revenue Requirement (in millions)(a) | $1,289 | $1,385 | $1,480 | $1,556 | $1,211 | $1,295 | $1,383 | $1,435 | $1,219 | $1,306 | $1,389 | $1,450 |
ROE(b)(c) | 10.5% | 10.5% | 10.5% | 10.5% | 8.9% | 8.9% | 8.9% | 8.9% | 9.24% | 9.24% | 9.24% | 9.24% |
Capital Structure Common Equity Percentage(c)(d) | 53.99% | 53.97% | 54.02% | 54.03% | 50% | 50% | 50% | 50% | 50% | 50% | 50% | 50% |
| Forecasted Average Annual Rate Base (in billions) | $4.3 | $4.6 | $4.9 | $5.2 | $4.1 | $4.4 | $4.6 | $4.8 | $4.1 | $4.4 | $4.6 | $4.8 |
| | | | | | | | | | | | | | |
| Year | Revenue Requirement (in millions) | ROE | Capital Structure Common Equity Percentage | Annual Rate Base (in billions) |
| ICC’s December 2023 MYRP Order: | | | | |
| 2024 | $1,162 | 8.72% | 50% | $3.9 |
| 2025 | $1,210 | 8.72% | 50% | $3.9 |
| 2026 | $1,242 | 8.72% | 50% | $3.9 |
| 2027 | $1,255 | 8.72% | 50% | $3.9 |
| Ameren Illinois’ March 2024 Revised MYRP: | | | | |
| 2024 | $1,207 | (a) | 50% | $4.2 |
| 2025 | $1,286 | (a) | 50% | $4.4 |
| 2026 | $1,371 | (a) | 50% | $4.7 |
| 2027 | $1,433 | (a) | 50% | $4.9 |
| | | | |
| | | | |
| | | | |
| | | | |
| | | | |
| | | | |
| | | | |
| | | | |
| | | | |
| | | | |
(a)IfBased on an initial rate increase phase-in provision, discussed below, is approved byallowed ROE of 8.72%. Ameren Illinois’ filing requests the ICC it would not affectto increase the annual revenue requirement, but would affect the timing of associated recovery from customers.allowed ROE to 9.24%.
(b)The ICC staff filing recommended an ROE based on the annual average of the monthly yields of the 30-year United States Treasury bonds plus 580 basis points, to be updated annually for each applicable calendar year of the MYRP. An estimated ROE of 8.9% was used to calculate the forecastedapproved revenue requirements in the ICC staff filing, which is based on the average monthly yieldsICC’s December 2023 order represent a cumulative four-year increase of the 30-year United States Treasury bonds for 2022. The ICC staff proposed that variances$142 million compared to a cumulative increase of $321 million in the revenue requirement resulting from a change in the ROE would be excluded from the reconciliation cap discussed below.
(c)In November 2023, Ameren Illinois updated its requested ROE and capital structure common equity percentage to 9.85% and 52% for all years, respectively.Illinois’ March 2024 revised MYRP.
(d)A2023 Electric Distribution Revenue Requirement Reconciliation Adjustment Request
In April 2024, Ameren Illinois filed for a reconciliation adjustment to its 2023 electric distribution service revenue requirement with the ICC, requesting recovery of $160 million. The reconciliation adjustment reflects a capital structure composed of up to and including 50% common equity is deemed prudent and reasonable by law. A higher equity ratio requires specific ICC approval. The administrative law judges’ October 2023 proposed order recommends a capital structure that is the lower of 50% or Ameren Illinois’ actual equity ratio, excluding goodwill.
Under an MYRP, the IETL permits any initial2023 recoverable costs and year-end rate increase to be phased in, with at least 50% of the first annual period’s approved rate increase reflected in rates in the first annual period, with the remaining portion deferred as a regulatory asset that earns a return at the applicable WACC and is collected from customers over a period not to exceed two years beginning within one year after the second annual period’s rates are effective. Ameren Illinois’ revised MYRP filing utilizes this phase-in provision and proposes to defer 50% of the requested 2024 rate increase of $177 million as a regulatory asset to be collected from customers in 2026. Ameren Illinois recognizes revenues that have been authorized for rate recovery when amounts are expected to be collected from customers within two years from the end of an applicable year. The ICC staff’s filing and the administrative law judges’ proposed order do not utilize a phase-in provision.base. An ICC decision in this proceeding is required by December 2023, with new rates effective starting in January 2024. Ameren Illinois cannot predict the level of any electric distribution service rate change the ICC may approve, or whether any rate change that may eventually be approved will be sufficient for Ameren Illinois to recover its costs to the extent those costs are subject to and exceed the reconciliation cap discussed below and earn a reasonable return on its investments when the rate change goes into effect.
The MYRP also allows Ameren Illinois to reconcile its actual revenue requirement, as adjusted for certain cost variations, to ICC-approved electric distribution service rates on an annual basis, subject to a reconciliation cap. The reconciliation cap limits the annual adjustment to 105% of the annual revenue requirement approved by the ICC. Certain variations from forecasted costs would be excluded from the reconciliation cap, including those associated with major storms; new business and facility relocations; changes in the timing of certain expenditures or investments into or out of the applicable calendar year; and changes in interest rates, income taxes, taxes other than income taxes, pension and other post-retirement benefits costs, and amortization of certain assets. The reconciliation cap also excludes costs recovered through riders outside of base rates, such as riders for electric energy-efficiency investments, power procurement and transmission services, renewable energy credits, zero emission credits, certain environmental costs, and bad debt write-offs, among others. Ameren Illinois’ existing riders will remain effective and electric distribution service revenues will continue to be decoupled from sales volumes under the MYRP. The actual revenue requirement for a particular year would incorporate Ameren Illinois’ year-end rate base and actual capital structure for such year, provided that the common equity ratio in such capital structure may not exceed that approved by the ICC in the MYRP. Excluding the proposed phase-in of the initial rate increase discussed above, and subject to the reconciliation cap, if a given year’s revenue amount collected from customers varies from the approved revenue requirement, an adjustment would be made to electric operating revenues with an offset to a regulatory asset or liability to reflect that year’s actual revenue requirement, independent of actual sales volumes. The regulatory balance would then be collected from, or refunded to, customers within two years from the end of the applicable annual period.
Under the MYRP, the ROE approved by the ICC will be subject to annual adjustments based on performance metrics. In 2022, the ICC issued an order approving total ROE incentives and penalties of 24 basis points, allocated among seven performance metrics. These performance metrics include improvements in service reliability in both the frequency and duration of outages, a reduction in peak loads, an increased percentage of spend with diverse suppliers, a reduction in disconnections for certain customers, and improved timeliness in response to customer requests for interconnection of distributed energy resources. These performance metrics will apply annually from 2024, through 2027 under the MYRP, and the impact of any incentives and penalties will be excluded from the reconciliation cap described above.
2022 Electric Distribution Revenue Requirement Reconciliation Adjustment Request
In April 2023, Ameren Illinois filed for a reconciliation adjustment to its 2022 electric distribution service revenue requirement with the ICC. In November 2023, Ameren Illinois filed a revised reconciliation adjustment, requesting recovery of $117 million. The reconciliation adjustment reflects Ameren Illinois’ actual 2022 recoverable costs, year-end rate base, and capital structure, which was composed of 52% common equity. In August 2023, the ICC staff submitted its calculation of the reconciliation adjustment, recommending recovery of $110 million, which is based on a capital structure composed of 50% common equity. In October 2023, the administrative law judges issued a proposed order consistent with the ICC staff’s recommendation. An ICC decision in this proceeding is required by December 2023, and any approved adjustment would be collected from customers in 2024.
Electric Customer Energy-Efficiency Investments
In May 2023, Ameren Illinois filed its annual electric energy-efficiency formula rate update to increase its rates by $27 million with2025. This is the ICC. In August 2023, the ICC staff submitted a calculation of thefinal revenue requirement included in Ameren Illinois’ filing, recommending a $24 million increase in rates. An ICC decision in this proceeding is required by December 2023, with new rates effective January 2024.reconciliation under the IEIMA formula framework.
2023 Natural Gas Delivery Service Regulatory Rate ReviewOrder
In JanuaryNovember 2023, Ameren Illinois filed a request with the ICC seeking approval to increase its annual revenues forissued an order in Ameren Illinois’ January 2023 natural gas delivery service. In October 2023, Ameren Illinois filed a revised request seeking to increase its annual revenues by $140 million,service regulatory rate review, which includes an estimated $77 million of annual revenues that would otherwise be recovered under riders. The revised request is based on a 10.22% allowed
ROE, a capital structure composed of 52% common equity, and a rate base of $2.9 billion. In an attempt to reduce regulatory lag, Ameren Illinois used a 2024 future test yearresulted in this proceeding. In October 2023, the ICC staff recommended an increase to its annual revenues for natural gas delivery service of $127$112 million which includes an estimated $77 million of annual revenues that would otherwise be recovered under riders. The recommendation is based on a 9.89%9.44% allowed ROE, a capital structure composed of 50% common equity, and a rate base of $2.9approximately $2.85 billion. The order reflected a reduction of approximately $93 million of planned distribution and transmission capital investments included in Ameren Illinois’ requested revenue increase, which used a 2024 future test year. The new rates became effective on November 28, 2023.
In JulyDecember 2023, other intervenors recommendedAmeren Illinois filed a request for rehearing of the ICC’s November 2023 order. The filing requested the ICC revise the order to include an increase to annual revenues ranging from $98 million to $106 million, which were based on varying rate base amounts, a 9.5%allowed ROE andof at least 9.89%, a capital structure composed of 52% common equity.equity, and the reversal of the approximately $93 million reduction of planned distribution and transmission capital investments included in the order, among other things. In September 2023, the administrative law judge issued a proposed order consistent withJanuary 2024, the ICC staff’s recommendation. In October 2023,denied Ameren Illinois’ rehearing request. Subsequently, in January 2024, Ameren Illinois filed an appeal of the other intervenors revised their recommendation to include a capital structure composed of 50% common equity, but did not revise their recommended revenue requirement. A decision by the ICC in this proceeding is required by late November 2023 with new rates expectedICC order and the January 2024 ICC denial of Ameren Illinois’ request for rehearing to be effective by early December 2023.the Illinois Appellate Court for the Fifth Judicial District. The court is under no deadline to address the appeal. Ameren Illinois cannot predict the levelultimate outcome of any delivery service rate change the ICC may approve, nor whether any rate change that may eventually be approved will be sufficient to enable Ameren Illinois to recover its costs and to earn a reasonable return on investments when the rate changes go into effect.
RTO Cost-Benefit Study
In July 2022, an Illinois law prohibiting the state’s oversight of certain electric utilities’ choice of RTO membership ceased to be effective. Given the change in law and the high prices resulting from MISO’s April 2022 capacity auction, the ICC issued an order requiring Ameren Illinois to perform a cost-benefit study of continued participation in the MISO compared to participation in PJM Interconnection LLC, another RTO. In July 2023, Ameren Illinois filed its cost-benefit study with the ICC. The cost-benefit study examined the impacts of participation in each RTO, including reliability, resiliency, affordability, and environmental impacts, among other things, for a period of five to 10 years, beginning June 2024. The study concluded that continued participation in the MISO was prudent and more cost-beneficial than participation in PJM Interconnection LLC. Intervenor comments on the study were filed in October 2023. The ICC is under no obligation to issue an order related to the cost-benefit study.this appeal.
QIP Reconciliation Hearing
In March 2021, Ameren Illinois filed a request with the ICC forto initiate a reconciliation hearingproceeding to determine the accuracy and prudence of natural gas capital investments recovered under the QIP rider during 2020. In October 2023, the Illinois Attorney General’s office challenged the recovery of capital investments that were made during 2020, alleging that the ICC should disallow approximately $53 million in natural gas capital investments as improper and imprudent, providing a potential over-recovery of approximately $3 million in 2020. In October 2023, the ICC staff filed testimony that supports the prudence and reasonableness of the capital investments made during 2020. Ameren Illinois’ 2020 QIP rate recovery request under review by the ICC iswas within the rate increase limitations allowed by law. The ICC is under no deadline to issue an order in this proceeding. Ameren Illinois cannot predict the ultimate outcome of this regulatory proceeding.
Federal
MISO Long-Range Transmission Rate IncentivesProjects CCN
In July 2022, the MISO approved the first tranche of projects related to a preliminary long-range transmission planning roadmap of projects through 2039. A portion of these projects were assigned to various utilities, including Ameren. In October 2023,February 2024, Ameren Illinois and ATXI filed a request for a CCN, among other things, with the FERC approved transmission rate incentives relatingICC related to the projects assigned to Ameren. The incentives will allow construction work in progress to be included in rate base for projects constructed by ATXI, thereby improving the timeliness of cash recovery, and would allow recovery of prudently incurred costs, subject to FERC approval, for any portion of the MISO long-range transmission projects if they are abandoned for reasons beyondthat will be constructed within the control of Ameren.ICC’s jurisdiction. A decision by the ICC is expected by mid-2025.
Federal
FERC Complaint Cases
Since November 2013, the allowed base ROE for FERC-regulated transmission rate base under the MISO tariff has been subject to customer complaint cases and has been changed by various FERC orders. In May 2020, the FERC issued an order, which set the allowed base ROE to 10.02%, and required refunds, with interest, for the periods November 2013 to February 2015 and from late September 2016 forward. Ameren and Ameren Illinois paid these refunds, including interest, by March 31, 2022. In June and July 2020, Ameren Missouri, Ameren Illinois, and ATXI, as well as various customers, petitioned the United States Court of Appeals for the District of Columbia Circuit for review of the May 2020 order, challenging certain aspects of the new ROE methodology established. The petition filed by Ameren Missouri, Ameren Illinois, and ATXI challenged the refunds required for the period from September 2016 to May 2020. In August 2022, the court issued a ruling that granted the customers’ petition for review, vacated the FERC’s previous MISO ROE-determining orders, and remanded the proceedings to the FERC. The court elected not to rule on the issues raised by Ameren Missouri, Ameren Illinois, and ATXI. The currently allowed base ROE of 10.02% will remain effective for customer billings, but the transmission rates charged during previous periods and the currently effective rates may be subject to refund if the base ROE is changed by the FERC in a future order. The FERC is under no deadline to issue an order related to these proceedings. A 50-basis-point change in the FERC-allowed ROE would affect Ameren’s and Ameren Illinois’ annual revenue by an estimated $19$21 million and $13$15 million, respectively, based on each company’s 20232024 projected rate base.
NOTE 3 – SHORT-TERM DEBT AND LIQUIDITY
The liquidity needs of the Ameren Companies are typically supported through the use of available cash, drawings under committed credit agreements, commercial paper issuances, and, in the case of Ameren Missouri and Ameren Illinois, short-term affiliate borrowings. See Note 4 – Short-term Debt and Liquidity under Part II, Item 8, in the Form 10-K for a description of our indebtedness provisions and other covenants as well as a description of money pool arrangements.agreements.
Short-term Borrowings
The Missouri Credit Agreement and the Illinois Credit Agreement are available to support issuances under Ameren (parent)’s, Ameren Missouri’s, and Ameren Illinois’ commercial paper programs, respectively, subject to borrowing sublimits, and the issuance of letters of credit. As of September 30, 2023,March 31, 2024, based on commercial paper outstanding and letters of credit issued under the Credit Agreements, along with cash and cash equivalents, the net liquidity available to Ameren (parent), Ameren Missouri, and Ameren Illinois, collectively, was $1.3$1.8 billion. The Ameren Companies were in compliance with the covenants in their Credit Agreements as of September 30, 2023.March 31, 2024. As of September 30, 2023,March 31, 2024, the ratios of consolidated indebtedness to consolidated total capitalization, calculated in accordance with the provisions of the Credit Agreements, were 59%60%, 49%51%, and 45% for Ameren, Ameren Missouri, and Ameren Illinois, respectively.
The following table presents commercial paper outstanding, net of issuance discounts, as of September 30, 2023,March 31, 2024, and December 31, 2022.2023. There were no borrowings outstanding under the Credit Agreements as of September 30, 2023,March 31, 2024, or December 31, 2022.2023.
| | September 30, 2023 | | December 31, 2022 |
| March 31, 2024 | | | March 31, 2024 | | | December 31, 2023 |
| Ameren (parent) | Ameren (parent) | $ | 1,124 | | | $ | 477 | |
| Ameren Missouri | Ameren Missouri | 157 | | | 329 | |
| Ameren Illinois | Ameren Illinois | 59 | | | 264 | |
| Ameren consolidated | Ameren consolidated | $ | 1,340 | | | $ | 1,070 | |
The following table summarizes the activity and relevant interest rates for Ameren (parent)’s, Ameren Missouri’s, and Ameren Illinois’ commercial paper issuances and borrowings under the Credit Agreements in the aggregate for the ninethree months ended September 30, 2023March 31, 2024 and 2022:2023:
| | Ameren
(parent) | | Ameren
Missouri | | Ameren
Illinois | | Ameren
Consolidated | |
| 2023 | |
| | Ameren
(parent) | |
| 2024 | |
| 2024 | |
| 2024 | |
| Average daily amount outstanding | |
| Average daily amount outstanding | |
| Average daily amount outstanding | Average daily amount outstanding | | $ | 687 | | | $ | 306 | | | $ | 181 | | | $ | 1,174 | | |
| | Weighted-average interest rate | Weighted-average interest rate | | 5.29 | % | | 5.15 | % | | 5.15 | % | | 5.24 | % | |
| | Weighted-average interest rate | |
| | Weighted-average interest rate | |
Peak amount outstanding during period(a) | |
Peak amount outstanding during period(a) | |
Peak amount outstanding during period(a) | Peak amount outstanding during period(a) | | $ | 1,127 | | | $ | 592 | | | $ | 450 | | | $ | 1,381 | | |
| Peak interest rate | Peak interest rate | | 5.60 | % | | 5.60 | % | | 5.60 | % | | 5.60 | % | |
| 2022 | |
| Peak interest rate | |
| Peak interest rate | |
| 2023 | |
| 2023 | |
| 2023 | |
| Average daily amount outstanding | |
| Average daily amount outstanding | |
| Average daily amount outstanding | Average daily amount outstanding | | $ | 439 | | | $ | 253 | | | $ | 99 | | | $ | 791 | | |
| | Weighted-average interest rate | Weighted-average interest rate | | 1.58 | % | | 1.16 | % | | 1.77 | % | | 1.47 | % | |
| | Weighted-average interest rate | |
| | Weighted-average interest rate | |
Peak amount outstanding during period(a) | |
Peak amount outstanding during period(a) | |
Peak amount outstanding during period(a) | Peak amount outstanding during period(a) | | $ | 690 | | | $ | 539 | | | $ | 354 | | | $ | 1,222 | | |
| Peak interest rate | Peak interest rate | | 3.55 | % | | 3.55 | % | | 3.60 | % | | 3.60 | % | |
| Peak interest rate | |
| Peak interest rate | |
(a)The timing of peak outstanding commercial paper issuances and borrowings under the Credit Agreements varies by company. Therefore, the sum of individual company peak amounts may not equal the Ameren consolidated peak amount for the period.
Money Pools
Ameren has money pool agreements with and among its subsidiaries to coordinate and provide for certain short-term cash and working capital requirements. The average interest rate for borrowings under the utility money pool for the three and nine months ended September 30, 2023,March 31, 2024, was 5.50% and 5.20%, respectively (20225.32% (2023 – 2.48% and 1.29%, respectively)4.80%). See Note 8 – Related-party Transactions for the amount of interest income and expense from the utility money pool arrangementsagreements recorded by Ameren Missouri and Ameren Illinois for the three and nine months ended September 30, 2023March 31, 2024 and 2022.2023.
NOTE 4 – LONG-TERM DEBT AND EQUITY FINANCINGS
Ameren
For the three and nine months ended September 30, 2023,March 31, 2024, Ameren issued a total of 0.2 million and 0.40.1 million shares of common stock, respectively, under its DRPlus and 401(k) plan, and received proceeds of $5 million and $28 million, respectively.$3 million. As of September 30, 2023,March 31, 2024, Ameren had a receivable of $7 million related to issuances of common stock under its DRPlus and 401(k) plan.DRPlus. In addition, in the first quarter of 2023,2024, Ameren issued 0.50.2 million shares of common stock valued at $37$16 million upon the settlement of stock-based compensation awards.
In May 2023, Ameren filed a Form S-3 registration statement with the SEC, registering the offering of 3 million additional shares of its common stock under the DRPlus, which expires in May 2026. Shares of common stock sold under the DRPlus are, at Ameren’s option, newly issued shares, treasury shares, or shares purchased in the open market or in privately negotiated contracts.
In October 2023, Ameren, Ameren Missouri, and Ameren Illinois filed a Form S-3 shelf registration statement with the SEC, registering the issuance of an unspecified amount of certain types of securities. This registration statement expires in October 2026.
There were no shares issued under the ATM program for the three and nine months ended September 30, 2023.March 31, 2024. As of September 30, 2023,March 31, 2024, Ameren had approximately $910$770 million of common stock available for sale under the ATM program, which takes into account the forward sale agreements in effect as of September 30, 2023,March 31, 2024, discussed below.
The forward sale agreements outstanding as of September 30, 2023,March 31, 2024, can be settled at Ameren’s discretion on or prior to dates ranging from January 10,October 3, 2024 to February 28, 2025. On a settlement date or dates, if Ameren elects to physically settle a forward sale agreement, Ameren will issue shares of common stock to the counterparties at the then-applicable forward sale price. The initial forward sale price for the agreements ranged from $81.83$76.69 to $94.63,$89.31, with an average initial forward sale price of $91.23.$80.45. Each initial forward sale price is subject to adjustment based on a floating interest rate factor equal to the overnight bank funding rate less a spread of 75 basis points, and will be subject to decrease on certain dates specified in the forward sale agreements by specified amounts related to expected dividends on shares of the common stock during the term of the forward sale agreements. If the overnight bank funding rate is less than the spread on any day, the interest rate factor will result in a reduction of the forward sale price. The forward sale agreements will be physically settled unless Ameren elects to settle in cash or to net share settle. At September 30, 2023,March 31, 2024, Ameren could have settled the forward sale agreements with physical delivery of 4.32.9 million shares of common stock to the respective counterparties in exchange for cash of $390$231 million. Alternatively, the forward sale agreements could have also been settled at September 30, 2023,March 31, 2024, with the counterparties delivering approximately $72$20 million of cash or approximately 1.00.3 million shares of common stock to Ameren. In connection with the forward sale agreements outstanding at September 30, 2023,March 31, 2024, the various counterparties, or their affiliates, borrowed from third parties and sold 4.32.9 million shares of common stock. The gross sales price of these shares totaled $392$232 million. Ameren has not received any proceeds from such sales of borrowed shares. The forward sale agreements have been classified as equity transactions.
Ameren Missouri
In January 2023, Ameren Missouri and Audrain County mutually agreed to terminate a financing obligation agreement related to the CT energy center in Audrain County, which was scheduled to expire in December 2023. No cash was exchanged in connection with the termination of the agreement as the $240 million principal amount of the financing obligation due from Ameren Missouri was equal to the amount of bond service payments due to Ameren Missouri. Ownership of the energy center was transferred to Ameren Missouri in January 2023, at which time the property, plant, and equipment became subject to the lien of the Ameren Missouri mortgage bond indenture.
In March 2023,2024, Ameren Missouri issued $500$350 million of 5.45%5.25% first mortgage bonds due March 2053,January 2054, with interest payable semiannually on MarchJanuary 15 and SeptemberJuly 15 of each year, beginning SeptemberJuly 15, 2023.2024. Net proceeds from this issuance were used for capital expenditures and to repay short-term debt.
In April 2024, Ameren Illinois
In May 2023, Ameren IllinoisMissouri issued $500 million of 4.95%5.20% first mortgage bonds due June 2033,April 2034, with interest payable semiannually on JuneApril 1 and DecemberOctober 1 of each year, beginning DecemberOctober 1, 2023.2024. Net proceeds from this issuance were used for capital expenditures and to repay $100short-term debt.
In April 2024, $350 million principal amount of its 0.375% first mortgage bonds thatAmeren Missouri’s 3.50% senior secured notes matured in June 2023 and short-term debt.were repaid with cash on hand.
In April 2024, Ameren IllinoisMissouri received capital contributions totaling $50$350 million from Ameren (parent) during the nine months ended September 30, 2023..
Indenture Provisions and Other Covenants
See Note 5 – Long-term Debt and Equity Financings under Part II, Item 8, in the Form 10-K for a description of our indenture provisions and other covenants, as well as restrictions on the payment of dividends. At September 30, 2023,March 31, 2024, the Ameren Companies were in compliance with the provisions and covenants contained in their indentures and articles of incorporation, as applicable, and ATXI was in compliance with the provisions and covenants contained in its note purchase agreements.
Off-balance-sheet Arrangements
At September 30, 2023,March 31, 2024, none of the Ameren Companies had any material off-balance-sheet financing arrangements, other than Ameren’stheir investment in variable interest entities and the multiple forward sale agreements under the ATM program relating to common stock. See Note 1 – Summary of Significant Accounting Policies for further detail concerning variable interest entities.
NOTE 5 – OTHER INCOME, NET
The following table presents the components of “Other Income, Net” in the Ameren Companies’ statements of income for the three and nine months ended September 30, 2023March 31, 2024 and 2022:2023:
| | Three Months | | Nine Months | |
| 2023 | | 2022 | | 2023 | | 2022 | |
| | | Three Months | |
| | | Three Months | |
| | | Three Months | |
| | | | | 2024 | |
| | | | | 2024 | |
| | | | | 2024 | |
| Ameren: | |
| Ameren: | |
| Ameren: | Ameren: | |
| | Allowance for equity funds used during construction | Allowance for equity funds used during construction | $ | 16 | | | $ | 12 | | | $ | 39 | | | $ | 31 | | |
| Interest income on industrial development revenue bonds | — | | | 6 | | | 1 | | | 18 | | |
| | Allowance for equity funds used during construction | |
| | Allowance for equity funds used during construction | |
| Other interest income | |
| Other interest income | |
| Other interest income | Other interest income | 6 | | | 2 | | | 23 | | | 6 | | |
| Non-service cost components of net periodic benefit income(a) | Non-service cost components of net periodic benefit income(a) | 84 | | | 45 | | | 211 | | | 138 | | |
| Non-service cost components of net periodic benefit income(a) | |
| Non-service cost components of net periodic benefit income(a) | |
| Miscellaneous income | Miscellaneous income | 1 | | | 3 | | | 4 | | | 8 | | |
| Earnings (losses) related to equity method investments | — | | | (3) | | | 2 | | | 1 | | |
| Miscellaneous income | |
| Miscellaneous income | |
| Earnings related to equity method investments | |
| Earnings related to equity method investments | |
| Earnings related to equity method investments | |
| Donations | |
| Donations | |
| Donations | Donations | (1) | | | (1) | | | (5) | | | (5) | | |
| Miscellaneous expense | Miscellaneous expense | (5) | | | (6) | | | (14) | | | (17) | | |
| Miscellaneous expense | |
| Miscellaneous expense | |
| Total Other Income, Net | Total Other Income, Net | $ | 101 | | | $ | 58 | | | $ | 261 | | | $ | 180 | | |
| Total Other Income, Net | |
| Total Other Income, Net | |
| Ameren Missouri: | |
| Ameren Missouri: | |
| Ameren Missouri: | Ameren Missouri: | |
| | Allowance for equity funds used during construction | Allowance for equity funds used during construction | $ | 8 | | | $ | 7 | | | $ | 20 | | | $ | 17 | | |
| Interest income on industrial development revenue bonds | — | | | 6 | | | 1 | | | 18 | | |
| | Allowance for equity funds used during construction | |
| | Allowance for equity funds used during construction | |
| Other interest income | |
| Other interest income | |
| Other interest income | Other interest income | 3 | | | 1 | | | 8 | | | 2 | | |
Non-service cost components of net periodic benefit income(a) | Non-service cost components of net periodic benefit income(a) | 34 | | | 13 | | | 62 | | | 41 | | |
Non-service cost components of net periodic benefit income(a) | |
Non-service cost components of net periodic benefit income(a) | |
| Miscellaneous income | |
| Miscellaneous income | |
| Miscellaneous income | Miscellaneous income | 1 | | | 1 | | | 3 | | | 3 | | |
| Donations | Donations | — | | | — | | | (2) | | | (2) | | |
| Donations | |
| Donations | |
| Miscellaneous expense | |
| Miscellaneous expense | |
| Miscellaneous expense | Miscellaneous expense | (2) | | | (3) | | | (7) | | | (7) | | |
| Total Other Income, Net | Total Other Income, Net | $ | 44 | | | $ | 25 | | | $ | 85 | | | $ | 72 | | |
| Total Other Income, Net | |
| Total Other Income, Net | |
| Ameren Illinois: | |
| Ameren Illinois: | |
| Ameren Illinois: | Ameren Illinois: | |
| | Allowance for equity funds used during construction | Allowance for equity funds used during construction | $ | 5 | | | $ | 5 | | | $ | 15 | | | $ | 14 | | |
| | Allowance for equity funds used during construction | |
| | Allowance for equity funds used during construction | |
| Interest income | |
| Interest income | |
| Interest income | Interest income | 4 | | | 1 | | | 14 | | | 4 | | |
| | Non-service cost components of net periodic benefit income | Non-service cost components of net periodic benefit income | 31 | | | 21 | | | 93 | | | 63 | | |
| | Non-service cost components of net periodic benefit income | |
| | Non-service cost components of net periodic benefit income | |
| Miscellaneous income | |
| Miscellaneous income | |
| Miscellaneous income | Miscellaneous income | — | | | 3 | | | 2 | | | 5 | | |
| Donations | Donations | (1) | | | (1) | | | (3) | | | (3) | | |
| Donations | |
| Donations | |
| Miscellaneous expense | |
| Miscellaneous expense | |
| Miscellaneous expense | Miscellaneous expense | (2) | | | (3) | | | (6) | | | (8) | | |
| Total Other Income, Net | Total Other Income, Net | $ | 37 | | | $ | 26 | | | $ | 115 | | | $ | 75 | | |
| Total Other Income, Net | |
| Total Other Income, Net | |
(a)For the three and nine months ended September 30,March 31, 2024 and 2023, the non-service cost components of net periodic benefit income were adjusted by amounts deferred of $(2)$(9) million and $32$17 million, respectively, due to a regulatory tracking mechanism for the difference between the level of such costs incurred by Ameren Missouri under GAAP and the level of such costs included in rates. The deferral was $5 million and $16 million, respectively, for the three and nine months ended September 30, 2022. See Note 11 – Retirement Benefits for additional information.
NOTE 6 – DERIVATIVE FINANCIAL INSTRUMENTS
We use derivatives to manage the risk of changes in market prices for natural gas, power, and uranium, as well as the risk of changes in rail transportation surcharges through fuel oil hedges. Such price fluctuations may cause the following:
•an unrealized appreciation or depreciation of our contracted commitments to purchase or sell when purchase or sale prices under the commitments are compared with current commodity prices;
•market values of natural gas and uranium inventories that differ from the cost of those commodities in inventory;
•actual cash outlays for the purchase of these commodities that differ from anticipated cash outlays; and
•actual off-system sales revenues that differ from anticipated revenues.
The derivatives that we use to hedge these risks are governed by our risk management policies for forward contracts, futures, options, and swaps. Our net positions are continually assessed within our structured hedging programs to determine whether new or offsetting transactions are required. The goal of the hedging program is generally to mitigate financial risks while ensuring that sufficient volumes are available to meet our requirements. Contracts we enter into as part of our risk management program may be settled financially, settled by physical delivery, or net settled with the counterparty.
All contracts considered to be derivative instruments are required to be recorded on the balance sheet at their fair values, unless the NPNS exception applies. Many of our physical contracts, such as our purchased power contracts, qualify for the NPNS exception to derivative accounting rules. The revenue or expense on NPNS contracts is recognized at the contract price upon physical delivery. The
following disclosures exclude NPNS contracts and other non-derivative commodity contracts that are accounted for under the accrual method of accounting.
If we determine that a contract meets the definition of a derivative and is not eligible for the NPNS exception, we review the contract to determine whether the resulting gains or losses qualify for regulatory deferral. Derivative contracts that qualify for regulatory deferral are recorded at fair value, with changes in fair value recorded as regulatory assets or liabilities in the period in which the change occurs. We believe derivative losses and gains deferred as regulatory assets and liabilities are probable of recovery, or refund, through future rates charged to customers. Regulatory assets and liabilities are amortized to operating income as related losses and gains are reflected in rates charged to customers. Therefore, gains and losses on these derivatives have no effect on operating income. As of September 30, 2023,March 31, 2024, and December 31, 2022,2023, all contracts that met the definition of a derivative and were not eligible for the NPNS exception received regulatory deferral. CashThe cash flows for allfrom our derivative financial instruments are classified infollow the cash flows from operating activities.flow classification of the hedged item.
The following table presents open gross commodity contract volumes by commodity type for derivative assets and liabilities as of September 30, 2023,March 31, 2024, and December 31, 2022.2023. As of September 30, 2023,March 31, 2024, these contracts extended through October 2026, October 2029 and May 2032 and March 2024 for fuel oils, natural gas power and uranium,power, respectively.
| | Quantity (in millions) |
| September 30, 2023 | December 31, 2022 |
| Quantity (in millions) | | | Quantity (in millions) |
| March 31, 2024 | | | March 31, 2024 | December 31, 2023 |
| Commodity | Commodity | Ameren Missouri | Ameren Illinois | Ameren | Ameren Missouri | Ameren Illinois | Ameren | Commodity | Ameren Missouri | Ameren Illinois | Ameren | Ameren Missouri | Ameren Illinois | Ameren |
| Fuel oils (in gallons) | Fuel oils (in gallons) | 19 | | — | | 19 | | 18 | | — | | 18 | |
| Natural gas (in mmbtu) | Natural gas (in mmbtu) | 52 | | 213 | | 265 | | 48 | | 157 | | 205 | |
| Power (in MWhs) | Power (in MWhs) | 1 | | 5 | | 6 | | 1 | | 6 | | 7 | |
| Uranium (pounds in thousands) | Uranium (pounds in thousands) | 186 | | — | | 186 | | 514 | | — | | 514 | |
The following table presents the carrying value and balance sheet location of all derivative commodity contracts, none of which were designated as hedging instruments, as of September 30, 2023,March 31, 2024, and December 31, 2022:2023:
| | | | March 31, 2024 | | | | | March 31, 2024 | December 31, 2023 |
| Balance Sheet Location | | | Balance Sheet Location | | Ameren
Missouri | | | Ameren
Illinois | | | Ameren | | | | Ameren
Missouri | | | Ameren
Illinois | | | Ameren |
| | | September 30, 2023 | December 31, 2022 |
| | Balance Sheet Location | | Ameren
Missouri | | Ameren
Illinois | | Ameren | | | | Ameren
Missouri | | Ameren
Illinois | | Ameren |
| | | Fuel oils | |
| | Fuel oils | |
| | | | Fuel oils | Fuel oils | Other current assets | | $ | 6 | | | $ | — | | | $ | 6 | | | | | $ | 13 | | | $ | — | | | $ | 13 | |
| | Other assets | | 2 | | | — | | | 2 | | | | | 3 | | | — | | | 3 | |
| | Natural gas | Natural gas | Other current assets | | 1 | | | 6 | | | 7 | | | | | 7 | | | 23 | | | 30 | |
| | Other assets | | 5 | | | 3 | | | 8 | | | | | 9 | | | 11 | | | 20 | |
| | Natural gas | |
| | Natural gas | |
| Other assets | |
| | Power | |
| | Power | |
| | Power | Power | Other current assets | | 7 | | | — | | | 7 | | | | | 14 | | | 2 | | | 16 | |
| | Other assets | | — | | | — | | | — | | | | | — | | | 4 | | | 4 | |
| | Uranium | Uranium | Other current assets | | 5 | | | — | | | 5 | | | | | 2 | | | — | | | 2 | |
| | Other assets | | — | | | — | | | — | | | | | 1 | | | — | | | 1 | |
| | Total assets | | $ | 26 | | | $ | 9 | | | $ | 35 | | | | | $ | 49 | | | $ | 40 | | | $ | 89 | |
| Uranium | |
| | Uranium | |
| | Total assets | |
| Total assets | |
| Total assets | |
| | Fuel oils | |
| | Fuel oils | |
| | Fuel oils | |
| Other deferred credits and liabilities | |
| | Natural gas | |
| | Natural gas | |
| | Natural gas | |
| Other deferred credits and liabilities | |
| | Power | |
| | Power | |
| | Power | |
| Other deferred credits and liabilities | |
| | Natural gas | Other current liabilities | | 7 | | | 25 | | | 32 | | | | | 7 | | | 20 | | | 27 | |
| Total liabilities | |
| | Other deferred credits and liabilities | | 6 | | | 16 | | | 22 | | | | | 2 | | | 9 | | | 11 | |
| | Power | Other current liabilities | | 7 | | | 8 | | | 15 | | | | | 59 | | | 2 | | | 61 | |
| Total liabilities | |
| | Other deferred credits and liabilities | | — | | | 56 | | | 56 | | | | | — | | | 37 | | | 37 | |
| | Total liabilities | | $ | 20 | | | $ | 105 | | | $ | 125 | | | | | $ | 68 | | | $ | 68 | | | $ | 136 | |
| Total liabilities | |
We believe that entering into master netting arrangements or similar agreements mitigates the level of financial loss that could result from default by allowing net settlement of derivative assets and liabilities. These master netting arrangements allow the counterparties to net settle sale and purchase transactions. Further, collateral requirements are calculated at the master netting arrangement or similar agreement level by counterparty.
The following table provides the recognized gross derivative balances and the net amounts of those derivatives subject to an enforceable master netting arrangement or similar agreement as of September 30, 2023,March 31, 2024, and December 31, 2022:2023:
| | Gross Amounts Not Offset in the Balance Sheet | |
| | | | Gross Amounts Not Offset in the Balance Sheet | |
| Commodity Contracts Eligible to be Offset | Commodity Contracts Eligible to be Offset | | Gross Amounts Recognized in the Balance Sheet | | Derivative Instruments | | Cash Collateral Received/Posted(a) | | Net Amount |
| September 30, 2023 | |
| Commodity Contracts Eligible to be Offset | |
| Commodity Contracts Eligible to be Offset | | | Gross Amounts Recognized in the Balance Sheet | | Derivative Instruments | | Cash Collateral Received/Posted(a) | | Net Amount |
| March 31, 2024 | |
| Assets: | Assets: | |
| Assets: | |
| Assets: | |
| Ameren Missouri | |
| Ameren Missouri | |
| Ameren Missouri | Ameren Missouri | | $ | 26 | | | $ | 6 | | | $ | — | | | $ | 20 | |
| Ameren Illinois | Ameren Illinois | | 9 | | | 5 | | | — | | | 4 | |
| Ameren | Ameren | | $ | 35 | | | $ | 11 | | | $ | — | | | $ | 24 | |
| Liabilities: | Liabilities: | |
| Ameren Missouri | Ameren Missouri | | $ | 20 | | | $ | 6 | | | $ | 5 | | | $ | 9 | |
| Ameren Missouri | |
| Ameren Missouri | |
| Ameren Illinois | Ameren Illinois | | 105 | | | 5 | | | — | | | 100 | |
| Ameren | Ameren | | $ | 125 | | | $ | 11 | | | $ | 5 | | | $ | 109 | |
| December 31, 2022 | |
| December 31, 2023 | |
| Assets: | Assets: | |
| Assets: | |
| Assets: | |
| Ameren Missouri | |
| Ameren Missouri | |
| Ameren Missouri | Ameren Missouri | | $ | 49 | | | $ | 9 | | | $ | — | | | $ | 40 | |
| Ameren Illinois | Ameren Illinois | | 40 | | | 20 | | | — | | | 20 | |
| Ameren | Ameren | | $ | 89 | | | $ | 29 | | | $ | — | | | $ | 60 | |
| Liabilities: | Liabilities: | |
| Ameren Missouri | |
| Ameren Missouri | |
| Ameren Missouri | Ameren Missouri | | $ | 68 | | | $ | 9 | | | $ | 56 | | | $ | 3 | |
| Ameren Illinois | Ameren Illinois | | 68 | | | 20 | | | — | | | 48 | |
| Ameren | Ameren | | $ | 136 | | | $ | 29 | | | $ | 56 | | | $ | 51 | |
| |
(a)Cash collateral received reduces gross asset balances and is included in “Other current liabilities” and “Other deferred credits and liabilities” on the balance sheet. Cash collateral posted reduces gross liability balances and is included in “Current collateral assets” and “Other assets” on the balance sheet for Ameren and Ameren Missouri and “Other current assets” and “Other assets” for Ameren Illinois.
Credit Risk
In determining our concentrations of credit risk related to derivative instruments, we review our individual counterparties and categorize each counterparty into groupings according to the primary business in which each engages. As of September 30, 2023,March 31, 2024, if counterparty groups were to fail completely to perform on contracts, the Ameren Companies’ maximum exposure related to derivative assets, predominantly from financial institutions, would have been immaterial with or without consideration of the application of master netting arrangements or similar agreements and collateral held.
Certain of our derivative instruments contain collateral provisions tied to the Ameren Companies’ credit ratings. If our credit ratings were downgraded below investment grade, or if a counterparty with reasonable grounds for uncertainty regarding our ability to satisfy an obligation requested adequate assurance of performance, additional collateral postings might be required. The additional collateral required is the net liability position allowed under master netting arrangements or similar agreements, assuming (1) the credit risk-related contingent features underlying these arrangements were triggered and (2) those counterparties with rights to do so requested collateral. The following table presents, as of September 30, 2023,March 31, 2024, the aggregate fair value of all derivative instruments with credit risk-related contingent features in a gross liability position, the cash collateral posted, and the aggregate amount of additional collateral that counterparties could require:
| | | Aggregate Fair Value of Derivative Liabilities(a) | | Cash
Collateral Posted | | Potential Aggregate Amount of Additional Collateral Required(b) |
| Aggregate Fair Value of Derivative Liabilities(a) | |
| Aggregate Fair Value of Derivative Liabilities(a) | |
| Aggregate Fair Value of Derivative Liabilities(a) | | | Cash
Collateral Posted | | Potential Aggregate Amount of Additional Collateral Required(b) |
| Ameren Missouri | Ameren Missouri | $ | 14 | | | $ | — | | | $ | 8 | |
| Ameren Illinois | Ameren Illinois | 41 | | | — | | | 35 | |
| Ameren | Ameren | $ | 55 | | | $ | — | | | $ | 43 | |
(a)Before consideration of master netting arrangements or similar agreements.
(b)As collateral requirements with certain counterparties are based on master netting arrangements or similar agreements, the aggregate amount of additional collateral required to be posted is determined after consideration of the effects of such arrangements.
NOTE 7 – FAIR VALUE MEASUREMENTS
Fair value is defined as the price that would be received for an asset or paid to transfer a liability (an exit price) in the principal or most advantageous market for the asset or liability in an orderly transaction between market participants on the measurement date. Fair value measurements are classified in three levels based on the fair value hierarchy as defined by GAAP. See Note 8 – Fair Value Measurements under Part II, Item 8, of the Form 10-K for information related to hierarchy levels and valuation techniques.
We consider nonperformance risk in our valuation of derivative instruments by analyzing our own credit standing and the credit standing of our counterparties, and by considering any credit enhancements (e.g., collateral). Included in our valuation, and based on current market conditions, is a valuation adjustment for counterparty default derived from market data such as the price of credit default swaps, bond yields, and credit ratings. No material gains or losses related to valuation adjustments for counterparty default risk were recorded at Ameren, Ameren Missouri, or Ameren Illinois in the three and nine months ended September 30, 2023March 31, 2024 or 2022.2023. At September 30, 2023,March 31, 2024, and December 31, 2022,2023, the counterparty default risk valuation adjustment related to derivative contracts was immaterial for Ameren, Ameren Missouri, and Ameren Illinois.
The following table sets forth, by level within the fair value hierarchy, our assets and liabilities measured at fair value on a recurring basis as of September 30, 2023,March 31, 2024, and December 31, 2022:2023:
| | | March 31, 2024 | |
| | Level 1 | |
| | Level 1 | |
| | Level 1 | |
| Assets: | |
| Assets: | |
| Assets: | |
| Ameren Missouri | |
| Ameren Missouri | |
| Ameren Missouri | |
| Derivative assets – commodity contracts: | |
| Derivative assets – commodity contracts: | |
| Derivative assets – commodity contracts: | |
| Fuel oils | |
| Fuel oils | |
| Fuel oils | |
| Natural gas | |
| Natural gas | |
| Natural gas | |
| Power | |
| Power | |
| Power | |
| Uranium | |
| Uranium | |
| Uranium | |
| Total derivative assets – commodity contracts | |
| Total derivative assets – commodity contracts | |
| Total derivative assets – commodity contracts | |
| Nuclear decommissioning trust fund: | |
| Nuclear decommissioning trust fund: | |
| Nuclear decommissioning trust fund: | |
| | Equity securities: | |
| | Equity securities: | |
| | Equity securities: | |
| U.S. large capitalization | |
| U.S. large capitalization | |
| U.S. large capitalization | |
| Debt securities: | |
| Debt securities: | |
| Debt securities: | |
| U.S. Treasury and agency securities | |
| U.S. Treasury and agency securities | |
| U.S. Treasury and agency securities | |
| Corporate bonds | |
| Corporate bonds | |
| Corporate bonds | |
| | | September 30, 2023 | | | December 31, 2022 | |
| Level 1 | Level 2 | Level 3 | Total | | | Level 1 | Level 2 | Level 3 | Total | |
| Assets: | | | |
| Ameren Missouri | | | |
| Other | |
| | Derivative assets – commodity contracts: | | | |
| | Fuel oils | $ | 8 | | $ | — | | $ | — | | $ | 8 | | | | $ | 16 | | $ | — | | $ | — | | $ | 16 | | |
| Other | |
| | Natural gas | — | | 6 | | — | | 6 | | | | 1 | | 15 | | — | | 16 | | |
| | Power | — | | — | | 7 | | 7 | | | | — | | — | | 14 | | 14 | | |
| Uranium | — | | — | | 5 | | 5 | | | | — | | — | | 3 | | 3 | | |
| Total derivative assets – commodity contracts | $ | 8 | | $ | 6 | | $ | 12 | | $ | 26 | | | | $ | 17 | | $ | 15 | | $ | 17 | | $ | 49 | | |
| Nuclear decommissioning trust fund: | | | |
| | Equity securities: | | | |
| U.S. large capitalization | $ | 703 | | $ | — | | $ | — | | $ | 703 | | | | $ | 618 | | $ | — | | $ | — | | $ | 618 | | |
| Debt securities: | | | |
| U.S. Treasury and agency securities | — | | 138 | | — | | 138 | | | | — | | 137 | | — | | 137 | | |
| Corporate bonds | — | | 126 | | — | | 126 | | | | — | | 122 | | — | | 122 | | |
| | Other | — | | 70 | | — | | 70 | | | | — | | 70 | | — | | 70 | | |
| Total nuclear decommissioning trust fund | $ | 703 | | $ | 334 | | $ | — | | $ | 1,037 | | (a) | | $ | 618 | | $ | 329 | | $ | — | | $ | 947 | | (a) |
| Total Ameren Missouri | $ | 711 | | $ | 340 | | $ | 12 | | $ | 1,063 | | | | $ | 635 | | $ | 344 | | $ | 17 | | $ | 996 | | |
| Other | |
| Total nuclear decommissioning trust fund | |
| Total nuclear decommissioning trust fund | |
| Total nuclear decommissioning trust fund | | $ | 868 | | $ | 356 | | $ | — | | $ | 1,224 | | (a) | | $ | 787 | | $ | 354 | | $ | — | | $ | 1,141 | | (a) |
| Total Ameren Missouri | |
| Ameren Illinois | Ameren Illinois | | | |
| Derivative assets – commodity contracts: | | | |
| Natural gas | $ | — | | $ | 6 | | $ | 3 | | $ | 9 | | | | $ | 1 | | $ | 28 | | $ | 5 | | $ | 34 | | |
| Power | — | | — | | — | | — | | | | — | | — | | 6 | | 6 | | |
| Total Ameren Illinois | $ | — | | $ | 6 | | $ | 3 | | $ | 9 | | | | $ | 1 | | $ | 28 | | $ | 11 | | $ | 40 | | |
| Ameren Illinois | |
| Ameren Illinois | |
| Derivative assets – commodity contracts: | |
| Derivative assets – commodity contracts: | |
| Derivative assets – commodity contracts: | |
| Natural gas | |
| Natural gas | |
| Natural gas | |
| Power | |
| Power | |
| Power | |
| Total Ameren Illinois | |
| Total Ameren Illinois | |
| Total Ameren Illinois | |
| Ameren | Ameren | | | |
| Derivative assets – commodity contracts(b) | $ | 8 | | $ | 12 | | $ | 15 | | $ | 35 | | | | $ | 18 | | $ | 43 | | $ | 28 | | $ | 89 | | |
| Nuclear decommissioning trust fund(c) | 703 | | 334 | | — | | 1,037 | | (a) | | 618 | | 329 | | — | | 947 | | (a) |
| Total Ameren | $ | 711 | | $ | 346 | | $ | 15 | | $ | 1,072 | | | | $ | 636 | | $ | 372 | | $ | 28 | | $ | 1,036 | | |
| Ameren | |
| Ameren | |
| Derivative assets – commodity contracts(b) | |
| Derivative assets – commodity contracts(b) | |
| Derivative assets – commodity contracts(b) | |
| Nuclear decommissioning trust fund(c) | |
| Nuclear decommissioning trust fund(c) | |
| Nuclear decommissioning trust fund(c) | | 868 | | 356 | | — | | 1,224 | | (a) | | 787 | | 354 | | — | | 1,141 | | (a) |
| Total Ameren | |
| Liabilities: | |
| Liabilities: | |
| Liabilities: | Liabilities: | | | |
| Ameren Missouri | Ameren Missouri | | | |
| Ameren Missouri | |
| Ameren Missouri | |
| Derivative liabilities – commodity contracts: | |
| Derivative liabilities – commodity contracts: | |
| Derivative liabilities – commodity contracts: | |
| Fuel oils | |
| Fuel oils | |
| Fuel oils | |
| Natural gas | |
| Natural gas | |
| Natural gas | |
| Power | |
| Power | |
| Power | |
| | Derivative liabilities – commodity contracts: | | | |
| Total Ameren Missouri | |
| | Total Ameren Missouri | |
| | Natural gas | — | | 11 | | 2 | | 13 | | | | — | | 6 | | 3 | | 9 | | |
| Power | 6 | | — | | 1 | | 7 | | | | 57 | | — | | 2 | | 59 | | |
| | Total Ameren Missouri | $ | 6 | | $ | 11 | | $ | 3 | | $ | 20 | | | | $ | 57 | | $ | 6 | | $ | 5 | | $ | 68 | | |
| Total Ameren Missouri | |
| Ameren Illinois | Ameren Illinois | | | |
| Derivative liabilities – commodity contracts: | | | |
| Natural gas | $ | 2 | | $ | 34 | | $ | 5 | | $ | 41 | | | | $ | — | | $ | 19 | | $ | 10 | | $ | 29 | | |
| Power | — | | — | | 64 | | 64 | | | | — | | — | | 39 | | 39 | | |
| Total Ameren Illinois | $ | 2 | | $ | 34 | | $ | 69 | | $ | 105 | | | | $ | — | | $ | 19 | | $ | 49 | | $ | 68 | | |
| Ameren Illinois | |
| Ameren Illinois | |
| Derivative liabilities – commodity contracts: | |
| Derivative liabilities – commodity contracts: | |
| Derivative liabilities – commodity contracts: | |
| Natural gas | |
| Natural gas | |
| Natural gas | |
| Power | |
| Power | |
| Power | |
| Total Ameren Illinois | |
| Total Ameren Illinois | |
| Total Ameren Illinois | |
| Ameren | Ameren | | | |
| Derivative liabilities – commodity contracts(b) | $ | 8 | | $ | 45 | | $ | 72 | | $ | 125 | | | | $ | 57 | | $ | 25 | | $ | 54 | | $ | 136 | | |
| Ameren | |
| Ameren | |
| Derivative liabilities – commodity contracts(b) | |
| Derivative liabilities – commodity contracts(b) | |
| Derivative liabilities – commodity contracts(b) | |
(a)Balance excludes $5$8 million and $11$9 million of cash and cash equivalents, receivables, payables, and accrued income, net, for September 30, 2023,March 31, 2024, and December 31, 2022,2023, respectively.
(b)See the Ameren Missouri and Ameren Illinois sections of the table for a breakout of the fair value of Ameren’s derivative assets and liabilities by type of commodity.
(c)See the Ameren Missouri section of the table for a breakout of the fair value of Ameren’s nuclear decommissioning trust fund by investment type.
Level 3 fuel oils, natural gas, and uranium derivative contract assets and liabilities measured at fair value on a recurring basis were immaterial for all periods presented. The following table presents the fair value reconciliation of Level 3 power derivative contract assets and liabilities measured at fair value on a recurring basis for the three and nine months ended September 30, 2023March 31, 2024 and 2022:2023:
| | | | | | | | | | | | | | | | | | | | | | | | | | | | |
| 2023 | | | 2022 |
| Ameren Missouri | Ameren Illinois | | | Ameren | | | Ameren Missouri | Ameren Illinois | Ameren |
| For the three months ended September 30: | | | | | | | | | | |
| Beginning balance at July 1 | $ | 14 | | $ | (68) | | | | $ | (54) | | | | $ | (36) | | $ | (44) | | $ | (80) | |
| Realized and unrealized gains/(losses) included in regulatory assets/liabilities | (5) | | 1 | | | | (4) | | | | (10) | | 30 | | 20 | |
| | | | | | | | | | |
| | | | | | | | | | |
| Settlements | (3) | | 3 | | | | — | | | | 38 | | (6) | | 32 | |
| | | | | | | | | | |
| | | | | | | | | | |
| Ending balance at September 30 | $ | 6 | | $ | (64) | | | | $ | (58) | | | | $ | (8) | | $ | (20) | | $ | (28) | |
| Change in unrealized gains/(losses) related to assets/liabilities held at September 30 | $ | (5) | | $ | 1 | | | | $ | (4) | | | | $ | (3) | | $ | 28 | | $ | 25 | |
| For the nine months ended September 30: | | | | | | | | | | |
| Beginning balance at January 1 | $ | 12 | | $ | (33) | | | | $ | (21) | | | | $ | (15) | | $ | (117) | | $ | (132) | |
| Realized and unrealized gains/(losses) included in regulatory assets/liabilities | 3 | | (40) | | | | (37) | | | | (56) | | 105 | | 49 | |
| | | | | | | | | | |
| | | | | | | | | | |
| Settlements | (9) | | 9 | | | | — | | | | 63 | | (8) | | 55 | |
| | | | | | | | | | |
| | | | | | | | | | |
| Ending balance at September 30 | $ | 6 | | $ | (64) | | | | $ | (58) | | | | $ | (8) | | $ | (20) | | $ | (28) | |
| Change in unrealized gains/(losses) related to assets/liabilities held at September 30 | $ | 6 | | $ | (31) | | | | $ | (25) | | | | $ | (39) | | $ | 100 | | $ | 61 | |
| | | | | | | | | | | | | | | | | | | | | | | | | | | | |
| 2024 | | | 2023 |
| Ameren Missouri | Ameren Illinois | | | Ameren | | | Ameren Missouri | Ameren Illinois | Ameren |
| For the three months ended March 31: | | | | | | | | | | |
| Beginning balance at January 1 | $ | 4 | | $ | (68) | | | | $ | (64) | | | | $ | 12 | | $ | (33) | | $ | (21) | |
| Realized and unrealized gains/(losses) included in regulatory assets/liabilities | (1) | | 10 | | | | 9 | | | | (6) | | (20) | | (26) | |
| | | | | | | | | | |
| | | | | | | | | | |
| Settlements | (1) | | 4 | | | | 3 | | | | (1) | | 1 | | — | |
| | | | | | | | | | |
| | | | | | | | | | |
| Ending balance at March 31 | $ | 2 | | $ | (54) | | | | $ | (52) | | | | $ | 5 | | $ | (52) | | $ | (47) | |
| Change in unrealized gains/(losses) related to assets/liabilities held at March 31 | $ | — | | $ | 11 | | | | $ | 11 | | | | $ | (2) | | $ | (18) | | $ | (20) | |
| | | | | | | | | | |
| | | | | | | | | | |
| | | | | | | | | | |
| | | | | | | | | | |
| | | | | | | | | | |
| | | | | | | | | | |
| | | | | | | | | | |
| | | | | | | | | | |
| | | | | | | | | | |
| | | | | | | | | | |
All gains or losses related to our Level 3 derivative commodity contracts are expected to be recovered or returned through customer rates; therefore, there is no impact to either net income or other comprehensive income resulting from changes in the fair value of these instruments.
The following table describes the valuation techniques and significant unobservable inputs utilized for the fair value of our Level 3 power derivative contract assets and liabilities as of September 30, 2023,March 31, 2024, and December 31, 2022:2023:
| | | | Fair Value | |
| | | Fair Value | |
| | | Fair Value | |
| Commodity | |
| Commodity | |
| Commodity | |
| 2024 | |
| 2024 | |
| 2024 | |
| | | | | | | | Nodal basis ($/MWh) | |
| | | | | | | | Nodal basis ($/MWh) | |
| | | | | | | | Nodal basis ($/MWh) | |
| | Fair Value | | Weighted Average(b) | |
| | Commodity | | Assets | | Liabilities | Valuation Technique(s) | Unobservable Input(a) | Range | |
| 2023 | 2023 | Power(c) | $ | 7 | $ | (65) | Discounted cash flow | Average forward peak and off-peak pricing – forwards/swaps ($/MWh) | 32 – 63 | 43 | |
| | | Nodal basis ($/MWh) | (10) – (1) | (5) | |
| 2023 | |
| | 2022 | Power(d) | $ | 20 | $ | (41) | Discounted cash flow | Average forward peak and off-peak pricing – forwards/swaps ($/MWh) | 38 – 89 | 51 | |
| 2023 | |
| | | | | | | | Nodal basis ($/MWh) | |
| | | | | | | | Nodal basis ($/MWh) | |
| | | | | | | | Nodal basis ($/MWh) | |
| | | Nodal basis ($/MWh) | (10) – (1) | (4) | |
| | | Trend rate (%) | 0 – 1 | 0 | |
|
(a)Generally, significant increases (decreases) in these inputs in isolation would result in a significantly higher (lower) fair value measurement.
(b)Unobservable inputs were weighted by relative fair value.
(c)Valuations use visible forward prices adjusted for nodal-to-hub basis differentials.
(d)Valuations through 2031 use visible forward prices adjusted for nodal-to-hub basis differentials. Valuations beyond 2031 use a trend rate factor and are similarly adjusted for nodal-to-hub basis differentials.
The following table sets forth the carrying amount and, by level within the fair value hierarchy, the fair value of financial assets and liabilitieslong-term debt (including current portion) disclosed, but not recorded, at fair value as of September 30, 2023,March 31, 2024, and December 31, 2022:2023:
| | | | | | | | | | | | | | | | | | | | | | | | | | | | | |
| Carrying
Amount | | Fair Value | | |
| | Level 1 | | Level 2 | | Level 3 | | Total |
| September 30, 2023 |
| Ameren: | | | | | | | | | |
| Cash, cash equivalents, and restricted cash | $ | 246 | | | $ | 246 | | | $ | — | | | $ | — | | | $ | 246 | |
| | | | | | | | | |
| Short-term debt | 1,340 | | | — | | | 1,340 | | | — | | | 1,340 | |
| Long-term debt (including current portion) | 14,678 | | (a) | — | | | 11,985 | | | 432 | | (b) | 12,417 | |
| Ameren Missouri: | | | | | | | | | |
| Cash, cash equivalents, and restricted cash | $ | 13 | | | $ | 13 | | | $ | — | | | $ | — | | | $ | 13 | |
| | | | | | | | | |
| | | | | | | | | |
| Short-term debt | 157 | | | — | | | 157 | | | — | | | 157 | |
| | | | | | | | | |
| Long-term debt (including current portion) | 6,341 | | (a) | — | | | 5,287 | | | — | | | 5,287 | |
| Ameren Illinois: | | | | | | | | | |
| Cash, cash equivalents, and restricted cash | $ | 225 | | | $ | 225 | | | $ | — | | | $ | — | | | $ | 225 | |
| | | | | | | | | |
| Short-term debt | 59 | | | — | | | 59 | | | — | | | 59 | |
| | | | | | | | | |
| Long-term debt (including current portion) | 5,231 | | (a) | — | | | 4,419 | | | — | | | 4,419 | |
| December 31, 2022 |
| Ameren: | | | | | | | | | |
| Cash, cash equivalents, and restricted cash | $ | 216 | | | $ | 216 | | | $ | — | | | $ | — | | | $ | 216 | |
Investment in industrial development revenue bonds(c) | 240 | | | — | | | 240 | | | — | | | 240 | |
| Short-term debt | 1,070 | | | — | | | 1,070 | | | — | | | 1,070 | |
Long-term debt (including current portion)(c) | 14,025 | | (a) | — | | | 11,989 | | | 464 | | (b) | 12,453 | |
| Ameren Missouri: | | | | | | | | | |
| Cash, cash equivalents, and restricted cash | $ | 13 | | | $ | 13 | | | $ | — | | | $ | — | | | $ | 13 | |
| | | | | | | | | |
Investment in industrial development revenue bonds(c) | 240 | | | — | | | 240 | | | — | | | 240 | |
| Short-term debt | 329 | | | — | | | 329 | | | — | | | 329 | |
Long-term debt (including current portion)(c) | 6,086 | | (a) | — | | | 5,365 | | | — | | | 5,365 | |
| Ameren Illinois: | | | | | | | | | |
| Cash, cash equivalents, and restricted cash | $ | 191 | | | $ | 191 | | | $ | — | | | $ | — | | | $ | 191 | |
| Short-term debt | 264 | | | — | | | 264 | | | — | | | 264 | |
| | | | | | | | | |
| Long-term debt (including current portion) | 4,835 | | (a) | — | | | 4,320 | | | — | | | 4,320 | |
| | | | | | | | | | | | | | | | | | | | | | | | | | | |
| Long-Term Debt (Including Current Portion): | Carrying Amount(a) | | | | Fair Value | | |
| | | Level 2 | | Level 3 | | Total |
| March 31, 2024 |
| | | | | | | | | |
| | | | | | | | | |
| | | | | | | | | |
| | | | | | | | | |
| Ameren | 16,316 | | | | | 14,258 | | | 453 | | (b) | 14,711 | |
| | | | | | | | | |
| | | | | | | | | |
| | | | | | | | | |
| | | | | | | | | |
| | | | | | | | | |
| | | | | | | | | |
| Ameren Missouri | 6,686 | | | | | 5,923 | | | — | | | 5,923 | |
| | | | | | | | | |
| | | | | | | | | |
| | | | | | | | | |
| | | | | | | | | |
| | | | | | | | | |
| Ameren Illinois | 5,233 | | | | | 4,668 | | | — | | | 4,668 | |
| December 31, 2023 |
| | | | | | | | | |
| | | | | | | | | |
| | | | | | | | | |
| Ameren | 15,970 | | | | | 14,366 | | | 467 | | (b) | 14,833 | |
| | | | | | | | | |
| | | | | | | | | |
| | | | | | | | | |
| | | | | | | | | |
| | | | | | | | | |
| | | | | | | | | |
| Ameren Missouri | 6,341 | | | | | 5,800 | | | — | | | 5,800 | |
| | | | | | | | | |
| | | | | | | | | |
| | | | | | | | | |
| | | | | | | | | |
| Ameren Illinois | 5,232 | | | | | 4,867 | | | — | | | 4,867 | |
(a)Included unamortized debt issuance costs, which were excluded from the fair value measurement, of $105$114 million, $45$48 million, and $48$46 million for Ameren, Ameren Missouri, and Ameren Illinois, respectively, as of September 30, 2023.March 31, 2024. Included unamortized debt issuance costs, which were excluded from the fair value measurement, of $99$111 million, $41$45 million, and $44$47 million for Ameren, Ameren Missouri, and Ameren Illinois, respectively, as of December 31, 2022.2023.
(b)The Level 3 fair value amount consists of ATXI’s senior unsecured notes.
(c)The Ameren Companies’ carrying amounts of cash, cash equivalents, and restricted cash approximate fair value and are considered Level 1 in the fair value hierarchy. The Ameren Missouri had an investment in industrial development revenue bonds, classified as held-to-maturity, that were equal to the finance obligation for the Audrain CT energy center. As of December 31, 2022, the carrying amountCompanies’ short-term borrowings approximate fair value because of the investmentshort-term nature of these instruments and are considered Level 2 in industrial development revenue bonds and the finance obligation approximated fair value.value hierarchy.
NOTE 8 – RELATED-PARTY TRANSACTIONS
In the ordinary course of business, Ameren Missouri and Ameren Illinois have engaged in, and may in the future engage in, affiliate transactions. These transactions primarily consist of natural gas and power purchases and sales, services received or rendered, and borrowings and lendings. Transactions between Ameren’s subsidiaries are reported as affiliate transactions on their individual financial statements, but those transactions are eliminated in consolidation for Ameren’s consolidated financial statements. For a discussion of
material related-party agreements and money pool arrangements,agreements, see Note 13 – Related-party Transactions and Note 4 – Short-term Debt and Liquidity under Part II, Item 8, of the Form 10-K.
Support Services Agreements
Ameren Missouri and Ameren Illinois had long-term receivables included in “Other assets” from Ameren Services of $28 million and $31 million, respectively, as of September 30, 2023,March 31, 2024, and $41$31 million and $43$34 million, respectively, as of December 31, 2022,2023, related to Ameren Services’ allocated portion of Ameren’s pension and postretirement benefit plans.
In December 2023, ATXI placed in service a transmission operations control center. Rental revenues received by ATXI from Ameren Services associated with this facility are affiliate transactions and are eliminated in consolidation for Ameren’s consolidated financial statements. Ameren Services’ rental expenses incurred are subsequently allocated to Ameren Missouri and Ameren Illinois as part of the Ameren Services support agreement.
Tax Allocation Agreement
See Note 1 – Summary of Significant Accounting Policies under Part II, Item 8, of the Form 10-K for a discussion of the tax allocation agreement. The following table presents the affiliate balances related to income taxes for Ameren Missouri and Ameren Illinois as of September 30, 2023,March 31, 2024, and December 31, 2022:2023:
| | September 30, 2023 | | | December 31, 2022 |
| Ameren Missouri | Ameren Illinois | | | Ameren Missouri | Ameren Illinois |
| March 31, 2024 | | | March 31, 2024 | | | December 31, 2023 |
| Ameren Missouri | | | Ameren Missouri | Ameren Illinois | | | Ameren Missouri | Ameren Illinois |
Income taxes payable to parent(a) | Income taxes payable to parent(a) | $ | 29 | $ | 81 | | | $ | — | $ | 50 | Income taxes payable to parent(a) | $ | — | $ | 43 | | | $ | — | $ | 2 |
Income taxes receivable from parent(b) | Income taxes receivable from parent(b) | — | | | 39 | — | Income taxes receivable from parent(b) | 32 | — | | | 56 | 22 |
(a)Included in “Accounts payable – affiliates” on the balance sheet.
(b)Included in “Accounts receivable – affiliates” on the balance sheet.
Effects of Related-party Transactions on the Statement of Income
The following table presents the impact on Ameren Missouri and Ameren Illinois of related-party transactions for the three and nine months ended September 30, 2023March 31, 2024 and 2022:2023:
| | Three Months | | Nine Months |
| | | | | | Three Months | |
| | | | | | Three Months | |
| | | | | | Three Months | |
| Agreement | Agreement | Income Statement
Line Item | | Ameren
Missouri | | Ameren
Illinois | | Ameren
Missouri | | Ameren
Illinois | Agreement | Income Statement
Line Item | | | | | | | Ameren
Missouri | | Ameren
Illinois |
| Ameren Missouri power supply | Ameren Missouri power supply | Operating Revenues | 2023 | $ | 2 | | $ | (a) | $ | 2 | | $ | (a) | Ameren Missouri power supply | Operating Revenues | 2024 | | | | | $ | (b) | $ | (a) |
| agreements with Ameren Illinois | agreements with Ameren Illinois | | 2022 | | 2 | | | (a) | | 7 | | | (a) | agreements with Ameren Illinois | | 2023 | | | | | | (b) | | (a) |
| Ameren Missouri and Ameren Illinois | Ameren Missouri and Ameren Illinois | Operating Revenues | 2023 | $ | 7 | | $ | (b) | $ | 25 | | $ | (b) | Ameren Missouri and Ameren Illinois | Operating Revenues | 2024 | | | | | $ | 7 | | $ | $ | (b) |
| rent and facility services | rent and facility services | | 2022 | | 6 | | | (b) | | 18 | | | (b) | rent and facility services | | 2023 | | | | | | 10 | | | (b) | | (b) |
| Ameren Missouri and Ameren Illinois miscellaneous | Ameren Missouri and Ameren Illinois miscellaneous | Operating Revenues | 2023 | $ | (b) | $ | 2 | | $ | (b) | $ | 2 | |
| support services | support services | | 2022 | | (b) | | (b) | | (b) | | 1 | | support services | | 2023 | | | | | | (b) | | (b) |
| Total Operating Revenues | Total Operating Revenues | | 2023 | $ | 9 | | $ | 2 | | $ | 27 | | $ | 2 | |
| 2022 | | 8 | | | (b) | | 25 | | | 1 | |
| | 2023 | | | | 2023 | | | | | | 10 | | | (b) |
| Ameren Illinois power supply | Ameren Illinois power supply | Purchased Power | 2023 | $ | (a) | $ | 2 | | $ | (a) | $ | 2 | | Ameren Illinois power supply | Purchased Power | 2024 | | | | | $ | (a) | $ | (b) |
| agreements with Ameren Missouri | agreements with Ameren Missouri | | 2022 | | (a) | | 2 | | | (a) | | 7 | | agreements with Ameren Missouri | | 2023 | | | | | | (a) | | (b) |
| Ameren Missouri and Ameren Illinois | Ameren Missouri and Ameren Illinois | Purchased Power | 2023 | $ | (b) | $ | 1 | | $ | 1 | | $ | 1 | | Ameren Missouri and Ameren Illinois | Purchased Power | 2024 | | | | | $ | 2 | | $ | $ | (b) |
| transmission services from ATXI | transmission services from ATXI | | 2022 | | 1 | | | (b) | | 1 | | | (b) | transmission services from ATXI | | 2023 | | | | | | (b) | | (b) |
| Total Purchased Power | Total Purchased Power | | 2023 | $ | (b) | $ | 3 | | $ | 1 | | $ | 3 | | Total Purchased Power | | 2024 | | | | | $ | 2 | | $ | $ | (b) |
| 2022 | | 1 | | | 2 | | | 1 | | | 7 | |
| | 2023 | | | | 2023 | | | | | | (b) | | (b) |
| Ameren Missouri and Ameren Illinois | Ameren Missouri and Ameren Illinois | Other Operations and Maintenance | 2023 | $ | (b) | $ | (b) | $ | (b) | $ | 2 | | Ameren Missouri and Ameren Illinois | Other Operations and Maintenance | 2024 | | | | | $ | (b) | $ | (b) |
| rent and facility services | rent and facility services | | 2022 | | (b) | | 1 | | | (b) | | 2 | |
| Ameren Services support services | Ameren Services support services | Other Operations and Maintenance | 2023 | $ | 36 | | $ | 33 | | $ | 106 | | $ | 101 | |
| agreement | agreement | | 2022 | | 38 | | | 36 | | | 109 | | | 103 | |
| Total Other Operations and | Total Other Operations and | | 2023 | $ | 36 | | $ | 33 | | $ | 106 | | $ | 103 | |
| Maintenance | Maintenance | | 2022 | | 38 | | | 37 | | | 109 | | | 105 | |
| Money pool borrowings (advances) | (Interest Charges)/Other Income, Net | 2023 | $ | (b) | $ | (b) | $ | (b) | $ | (b) |
| 2022 | | (b) | | (b) | | (b) | | (b) |
| Money pool interest | |
| | 2023 | | | | 2023 | | | | | | (b) | | (b) |
(a)Not applicable.
(b)Amount less than $1 million.
NOTE 9 – COMMITMENTS AND CONTINGENCIES
We are involved in legal, tax, and regulatory proceedings before various courts, regulatory commissions, authorities, and governmental agencies with respect to matters that arise in the ordinary course of business, some of which involve substantial amounts of money. We believe that the final disposition of these proceedings, except as otherwise disclosed in the notes to our financial statements in this report and in the Form 10-K, will not have a material adverse effect on our results of operations, financial position, or liquidity.
Reference is made to Note 1 – Summary of Significant Accounting Policies, Note 2 – Rate and Regulatory Matters, Note 9 – Callaway Energy Center, Note 13 – Related-party Transactions, and Note 14 – Commitments and Contingencies under Part II, Item 8, of the Form 10-K. See also Note 1 – Summary of Significant Accounting Policies, Note 2 – Rate and Regulatory Matters, Note 8 – Related-party Transactions, and Note 10 – Callaway Energy Center of this report.
Environmental Matters
Our electric generation, transmission, and distribution and natural gas distribution and storage operations must comply with a variety of statutes and regulations relating to the protection of the environment and human health and safety, including permitting programs implemented by federal, state, and local authorities. Such environmental laws address air emissions; discharges to water bodies; the storage, handling and disposal of hazardous substances and waste materials; siting and land use requirements; and potential ecological impacts. Complex and lengthy processes are required to obtain and renew approvals, permits, and licenses for new, existing, or modified energy-
relatedenergy-related facilities. Additionally, the use and handling of various chemicals or hazardous materials require release prevention plans and emergency response procedures. We employ dedicated personnel knowledgeable in environmental matters to oversee our business activities’ compliance with requirements of environmental laws.
Environmental regulations have a significant impact on the electric utility industry and compliance with these regulations could be costly for Ameren Missouri, which operates coal-fired power plants. Regulations under the Clean Air Act that apply to the electric utility industry include the NSPS, the CSAPR, the MATS, and the National Ambient Air Quality Standards, which are subject to periodic review for certain pollutants. Collectively, these regulations cover a variety of pollutants, such as SO2, particulate matter, NOx, mercury, toxic metals and acid gases, and CO2 emissions. Regulations implementing the Clean Water Act govern both intake and discharges of water, as well as evaluation of the ecological and biological impact of those operations, and could require modifications to water intake structures or more stringent limitations on wastewater discharges. Depending upon the scope of modifications ultimately required by state regulators, capital expenditures associated with these modifications could be significant. The management and disposal of coal ash is regulated under the Resource Conservation and Recovery Act and the CCR Rule, which require the closure of surface impoundments at Ameren Missouri’s coal-fired energy centers. The individual or combined effects of compliance with existing and new environmental regulations could result in significant capital expenditures, increased operating costs, or the closure or alteration of operations at some of Ameren Missouri’s energy centers. Ameren and Ameren Missouri expect that such compliance costs would be recoverable through rates, subject to MoPSC prudence review, but the timing of costs and their recovery could be subject to regulatory lag.
Additionally, Ameren Missouri’s wind generation facilities may be subject to operating restrictions to limit the impact on protected species. Since 2021, Ameren Missouri’s High Prairie Renewable Energy Center curtailed nighttime operations from April through October to limit impacts on protected species during the critical biological season. Seasonal nighttime curtailment began again in April 2023. Ameren Missouri resumed nighttime operations in November 2023,2024, but the extent and duration of future curtailments arethe curtailment is currently unknown at this time as assessment of mitigation technologies is ongoing. Ameren Missouri does not anticipate these operating curtailments will have a material impact on its results of operations, financial position, or liquidity.
Ameren and Ameren Missouri estimate that they will need to make capital expenditures of $90 million to $120 million from 20232024 through 20272028 in order to comply with existing environmental regulations.regulations in place prior to the EPA’s final rules on CO2 emissions, MATS, effluent limitations guidelines, and CCR management issued in April 2024 and discussed below. Additional capital expenditures for environmental controls beyond 20272028 could be required. This estimate of capital expenditures includes surface impoundment closure and corrective action measures required by the CCR Rule and potential modifications to cooling water intake structures at existing power plants under Clean Water Act rules, all of which are discussed below. In addition to planned retirements of coal-fired energy centers as set forth in the 2023 IRP filed with the MoPSC in September 2023 and as noted inbelow with respect to the NSR and Clean Air Act litigation discussed below and Illinois emissions standards discussed in Note 14 – Commitments and Contingencies under Part II, Item 8, of the Form 10-K, Ameren Missouri’s current plan for compliance with existing air emission regulations includes burning low-sulfur coal and installing new or optimizing existing air pollution control equipment. The actual amount of capital expenditures required to comply with existing environmental regulations may vary substantially from the above estimates because of uncertainty as to future permitting requirements by state regulators and the EPA, revisions to regulatory obligations, and varying cost of potential compliance strategies, among other things.
The following sections describe the more significant environmental lawsstatutes and rulesregulations and environmental enforcement and remediation matters that affect or could affect our operations. The EPA periodically amends and revises its regulations and proposes amendments to regulations and guidelines, which could ultimately result in the revision of all or part of such rules.regulations.
Clean Air Act
Federal and state laws, including the CSAPR, regulate emissions of SO2 and NOx through the reduction of emissions at their source and the use and retirement of emission allowances. In April 2022, the EPA proposed plans for additional NOx emission reductions from power plants in Missouri, Illinois, and other states through revisions to the CSAPR. In January 2023, the EPA issued its final disapproval of Missouri’s proposed state implementation plan for addressing the transport of ozone under the Good Neighbor Plan of the Clean Air Act. The disapproval of the state plan allows the EPA to implement revisions to the CSAPR through a federal implementation plan. In March 2023, the EPA announced federal implementation plan requirements, which were subsequently published to the Federal Register in June 2023, reducing the amount of NOx allowances available for state budgets and imposing NOx emission limits on electric generating units for Missouri, Illinois, and other states under the Good Neighbor Plan of the Clean Air Act. In April 2023, the Missouri Attorney General and Ameren Missouri separately filed lawsuits in the United States Court of Appeals for the Eighth Circuit challenging the EPA’s disapproval of the Missouri state plan and sought a stay of the EPA’s disapproval of the Missouri state plan. The United States Court of Appeals for the Eighth Circuit in May 2023 granted those stay motions thereby preventing the EPA from imposing the federal implementation plan until the court of appeals issues a ruling, which isruling. In December 2023, the United States Supreme Court agreed to hear challenges to the Good Neighbor Plan and heard oral argument in February 2024, with a decision expected inby June 2024. Ameren Missouri has compliedcomplies with the current CSAPR requirements by minimizing emissions through the use of low-sulfur coal, operation of two scrubbers at its Sioux Energy Center, and optimization of other existing NOx air pollution control equipment. Restrictions onReducing the useamount of state budget NOx allowances for compliance with NOx emission limits could result in additional controls being required on Ameren Missouri’s generating units and/or the reduction of operations. Any additional
costs for compliance are expected to be recovered from customers, subject to MoPSC prudence review, through the FAC or higher base rates.
CO2 Emissions Standards
In June 2022, the United States Supreme Court issued its decision in West Virginia v. EPA, clarifying that there are limits on how the EPA may regulate greenhouse gases absent further direction from the United States Congress. The court concluded that the EPA’s proposed rules were designed to shift generation from fossil-fuel-fired power plants to renewable energy facilities, which was improper absent specific congressional authorization. In May 2023,April 2024, the EPA issued a proposedfinal rule that would setsets CO2 emission standards for existing coal-fired and new and existing fossil-fuel-firednatural gas-fired power plants based onplants. The rule requires the adoption of carbon capture technology and/or natural gas co-firing for coal-fired power plants and co-firing hydrogen fuelcarbon capture technology for new natural gas-fired power plants as a means to reduce CO2emissions. If the proposed rule were adopted, theCertain affected fossil-fuel-fired power plants would beare required to comply with the rule through a phased-in approach or retire. Capacity restrictions for coal-fired units could apply as early as 2030. Larger natural gas-fired power plants would be required to co-fire with hydrogen by 2032, with additional requirements by 2038. The EPA expects to issue a final rule in 2024. Legal challenges to the final rule if adopted as proposed, are expected. Ameren and Ameren Missouri are assessing the impacts of the final rule and, at this time, cannot predict the results of any such challenges or potential impacts of any such regulations on their results of operations, financial position, and liquidity until final regulationsliquidity.
MATS
In April 2024, the EPA revised the MATS by establishing a more stringent standard for emissions of particulate matter, requiring the use of continuous emissions monitoring systems. Ameren and Ameren Missouri are adoptedassessing the impacts of the revised rule and, at this time, cannot predict the meritsimpacts on their results of such legal challenges are determined.operations, financial position, and liquidity.
NSR and Clean Air Act Litigation
In January 2011, the United States Department of Justice, on behalf of the EPA, filed a complaint against Ameren Missouri in the United States District Court for the Eastern District of Missouri alleging that projects performed in 2007 and 2010 at the coal-fired Rush Island Energy Center violated provisions of the Clean Air Act and Missouri law. In January 2017, the district court issued a liability ruling against Ameren Missouri and, in September 2019, entered a remedy order that required Ameren Missouri to install a flue gas desulfurization system at the Rush Island Energy Center and a dry sorbent injection system at the Labadie Energy Center. Following an appeal from Ameren Missouri, in August 2021, the United States Court of Appeals for the Eighth Circuit affirmed the liability ruling and the district court’s remedy order as it related to the installation of a flue gas desulfurization system at the Rush Island Energy Center, but reversed the order as it related to the installation of a dry sorbent injection system at the Labadie Energy Center. In November 2021, the court of appeals issued an order denying requests for re-consideration sought by both Ameren Missouri and the United States Department of Justice. In September 2023, the district court granted Ameren Missouri’s request to modify the remedy order to allow the retirement of the Rush Island Energy Center in advance of its previously expected useful liferetirement date of 2039 in lieu of installing a flue gas desulfurization system. In its amended remedy order, the district court established an October 15, 2024 retirement date to allow for the completion of various transmission reliability projects and, in the interim, authorized Ameren Missouri to operate the energy center only as needed and as directed by the MISO. The United States Department of Justice is seeking an order from the district court providing for additional mitigation relief.relief related to prior emissions. Ameren Missouri is challenging such mitigation claims, notingcontends that the scoperetirement of any such potentialthe Rush Island Energy Center, which eliminates all future emissions from the energy center, mitigates claims relating to prior emissions. In March 2024, the district court ordered Ameren Missouri and the United States Department of Justice to file proposed draft orders outlining additional mitigation relief should be limited byrelief. In May 2024, Ameren Missouri filed a proposed draft order that includes retiring the August 2021 courtRush Island Energy Center, a program to provide electric buses and charging stations to schools in the metro St. Louis area, a program to provide air filters to eligible Ameren Missouri electric residential customers, and the retirement of appeals decision and offset by emission reductions resulting fromSO2 allowances. Excluding the accelerated retirement of the Rush
Island Energy Center.Center, these programs are estimated to cost approximately $20 million. Also in May 2024, the United States Department of Justice filed a proposed draft order that includes a program to provide electric buses and charging stations to schools in the metro St. Louis area and a program to provide air filters to eligible Ameren Missouri electric residential customers. These programs include a significantly greater number of buses, charging stations, and air filters than Ameren Missouri’s proposal and the United States Department of Justice estimates these programs would cost approximately $120 million. As of March 31, 2024, Ameren and Ameren Missouri recorded a $20 million liability in “Other current liabilities” on its consolidated balance sheet related to the cost of potential additional mitigation, which represents the estimated minimum liability, as no other amount within the range was a better estimate. The district court is expected to hold a hearing in mid-2024 and an order is expected in the second half of 2024. Depending on the scope and basis of the order, Ameren Missouri or the United States Department of Justice could appeal any additional mitigation relief ordered.
The MISO designated the energy centerRush Island Energy Center as a system support resource in 2022 and concluded that certain reliability mitigation measures, including transmission upgrades, should occur before the energy center is retired. The Rush Island Energy Center began operating as a system support resource on September 1, 2022. In 2023, the MISO extended the system support resource designation through August 2024, and in September 2023, an agreement between Ameren Missouri and the MISO was approved by the FERC that results in the Rush Island Energy Center only operating during peak demand times and emergencies. The system support resource designation and the related agreement are subject to annual renewal and revision. Construction activities are underway for the transmission upgrades approved by the MISO, with the majority of the upgrades expected to be completed in the fall of 2024. Ameren Missouri expects to complete the last of the upgrades by mid-2025. In addition, in August 2023, the FERC approved a settlement agreement for Ameren Missouri’s request for recovery of non-energy costs under the related MISO tariff between Ameren Missouri and certain intervenors, which provided for recovery of substantially all of Ameren Missouri’s requested non-energy costs through August 2023. In October 2023, Ameren Missouri received FERC approval for the recovery of non-energy costs under the related MISO tariff for the period between September 2023 and August 2024. Revenues and costs under the MISO tariff are included in the FAC. Related to this matter, in February 2022, the MoPSC issued an order directing the MoPSC staff to review the planned accelerated retirement of the Rush Island Energy Center. See Note 2 – Rate and Regulatory Matters Part II, Item 8, of the Form 10-K for additional information.
In connection with the accelerated retirement of the Rush Island Energy Center, Ameren Missouri expects to seekis seeking approval from the MoPSC in 2023, to finance the costs associated with the retirement, including the remaining unrecovered net plant balance associated with the facility, through the issuance of securitized utility tariff bonds pursuant to Missouri’s securitization statute. Costs associated with the retirement would exclude any additional mitigation relief ordered in the NSR and Clean Air Act litigation discussed above. See Note 2 – Rate and Regulatory Matters for additional information. As of September 30, 2023,March 31, 2024, the Rush Island Energy Center had a net plant balance of approximately $550$520 million included in plant to be abandoned, net, within “Property, Plant, and Equipment, Net” and a rate base of approximately $0.5 billion.. See Note 1 – Summary of Significant Accounting Policies under Part II, Item 8, of the Form 10-K for additional information regarding plant to be abandoned, net.
Ameren Missouri is unable to predict the ultimate resolution of this matter; however, such resolution could have a material adverse effect on the results of operations, financial position, and liquidity of Ameren and Ameren Missouri.
Clean Water Act
The EPA’s regulations implementing Section 316(b) ofAmong other items, the Clean Water Act requirerequires power plant operators to evaluate cooling water intake structures and identify measures for reducing the number of aquatic organisms impinged on a power plant’s cooling water intake screens or entrained through the plant’s cooling water system. All of Ameren Missouri’s coal-fired and nuclear energy centers are subject to thethis cooling water intake structures rule. Requirements of the rule are implemented by state regulators through the permit renewal process of each power plant’s water discharge permit. Permits for Ameren Missouri’s coal-fired and nuclear energy centers have been issued or are in the process of renewal.
In 2015, the EPA issued a rule to revise the effluent limitation guidelines applicable to steam electric generating units. These guidelines established national standards for water discharges, prohibit effluent discharges of certain waste streams, and impose more stringent limitations on certain water discharges from power plants by 2025. To comply with these guidelines, Ameren Missouri installed dry ash handling systems and wastewater treatment facilities at its coal-fired energy centers. In April 2024, the EPA issued new effluent limitation guidelines that established a zero discharge limit for flue gas desulfurization wastewater, bottom ash transport water, and combustion residual leachate. Ameren and Ameren Missouri are assessing the impacts of these new guidelines and, at this time, cannot predict the impacts on their results of operations, financial position, and liquidity.
CCR Management
The EPA’s CCR Rule establishes requirements for the management and disposal of CCR from coal-fired power plants and has resulted in the closure of surface impoundments at Ameren Missouri’s energy centers, with closures of surface impoundments pendingin process at its Sioux Energy Center and retired Meramec Energy Center. Ameren Missouri plans to substantially complete the closures of remaining surface impoundments as required by the CCR Rule by the end of 2024.2026. Ameren Missouri’s CCR management compliance plan includes installation of groundwater monitoring equipment and groundwater treatment facilities. Ameren and Ameren Missouri have AROs of $40 million recorded on their respective balance sheets as of September 30, 2023,March 31, 2024, associated with CCR storage facilities. In April 2024, the EPA revised the CCR Rule to impose groundwater monitoring, and corrective action, closure, and post-closure requirements on certain active and inactive CCR surface
impoundments. Ameren and Ameren Missouri are assessing the impacts of this rule revision and, at this time, cannot predict the impacts on their results of operations, financial position, and liquidity.
Remediation
The Ameren Companies are involved in a number of remediation actions to clean up sites impacted by the use or disposal of materials containing hazardous substances. Federal and state laws can require responsible parties to fund remediation regardless of their degree of fault, the legality of original disposal, or the ownership of a disposal site.
As of September 30, 2023,March 31, 2024, Ameren Illinois has remediated the majority of the 44 former MGP sites in Illinois with an estimated remaining obligation primarily related to three of these former MGP sites at $60$46 million to $112$96 million. Ameren and Ameren Illinois recorded a liability of $60$46 million to represent the estimated minimum obligation for these sites, as no other amount within the range was a better estimate. About halfAmeren cannot estimate the completion date of the estimated remaining liability recorded relatesobligation due to remediation activities that are expected to be completed after 2023. The ICC allows Ameren Illinois to recover MGP remediation and related litigation costs from its electric and natural gas utility customers through environmental cost riders that are subject to annual prudence reviews by the ICC.site accessibility, among other things.
The scope of the remediation activities at these former MGP sites may increase as remediation efforts continue. Considerable uncertainty remains in these estimates because many site-specific factors can influence the actual costs, including unanticipated underground structures, the degree to which groundwater is encountered,impacted, regulatory changes, local ordinances, and site accessibility. The actual costs and timing of completion may vary substantially from these estimates.
The ICC allows Ameren Illinois to recover MGP remediation and related litigation costs from its electric and natural gas utility customers through environmental cost riders that are subject to annual prudence reviews by the ICC.
Our operations or those of our predecessor companies involve the use of, disposal of, and, in appropriate circumstances, the cleanup of substances regulated under environmental laws. We are unable to determine whether such historical practices will result in future environmental commitments, including additional or more stringent cleanup standards, or will affect our results of operations, financial position, or liquidity.
NOTE 10 – CALLAWAY ENERGY CENTER
See Note 9 – Callaway Energy Center under Part II, Item 8, of the Form 10-K for information regarding spent nuclear fuel recovery, recovery of decommissioning costs, and the nuclear decommissioning trust fund. The fair value of the trust fund for Ameren Missouri’s Callaway Energy Center is reported as “Nuclear decommissioning trust fund” in Ameren’s and Ameren Missouri’s balance sheets. This amount is legally restricted and may be used only to fund the costs of nuclear decommissioning. Changes in the fair value of the trust fund are recorded as an increase or decrease to the nuclear decommissioning trust fund, with an offsetting adjustment to the related regulatory liability. Ameren and Ameren Missouri have recorded an ARO for the Callaway Energy Center decommissioning costs at fair value, which represents the present value of estimated future cash outflows. Annual decommissioning costs of $7 million are included in the costs used to establish electric rates for Ameren Missouri’s customers. Every three years, the MoPSC requires Ameren Missouri to file an updated cost study and funding analysis for decommissioning its Callaway Energy Center. An updated cost study and funding analysis was last filed with the MoPSC in November 2020. Ameren Missouri expects to file an updated cost study with the MoPSC by December 2023 and hasis reflected within the 2023 updated cost study results in the related ARO at September 30, 2023. In February 2021, the MoPSC approvedARO. Ameren Missouri’s filing supported no change in electric service rates for decommissioning costs based on Ameren Missouri’s updated cost study funding analysis.costs. There is no deadline by which the MoPSC must issue an order regarding the filing. See Note 13 – Supplemental Information for more information on Ameren Missouri’s AROs.
Insurance
The following table presents insurance coverage at Ameren Missouri’s Callaway Energy Center at October 31, 2023:April 1, 2024:
| | Type and Source of Coverage | Type and Source of Coverage | Most Recent
Renewal Date | Maximum Coverages | | Maximum Assessments
for Single Incidents | |
| Public liability and nuclear worker liability: | Public liability and nuclear worker liability: | |
| Public liability and nuclear worker liability: | |
| Public liability and nuclear worker liability: | |
| American Nuclear Insurers | |
| American Nuclear Insurers | |
| American Nuclear Insurers | American Nuclear Insurers | January 1, 2023 | $ | 450 | | | $ | — | | |
| Pool participation | Pool participation | (a) | 16,095 | | (a) | 166 | | (b) |
| $ | 16,545 | | (c) | $ | 166 | | |
| Pool participation | |
| Pool participation | | (a) | 15,763 | | (a) | 166 | | (b) |
| | $ | |
| Property damage: | Property damage: | |
| Property damage: | |
| Property damage: | |
| NEIL and EMANI | |
| NEIL and EMANI | |
| NEIL and EMANI | NEIL and EMANI | April 1, 2023 | $ | 3,200 | | (d) | $ | 28 | | (e) | April 1, 2024 | $ | 3,200 | | (d) | (d) | $ | 28 | | (e) | (e) |
| Accidental outage: | Accidental outage: | |
| NEIL | NEIL | April 1, 2023 | $ | 490 | | (f) | $ | 9 | | (e) |
| NEIL | |
| NEIL | | April 1, 2024 | $ | 490 | | (f) | $ | 11 | | (e) |
(a)Provided through mandatory participation in an industrywide retrospective premium assessment program. The maximum coverage available is dependent on the number of United States commercial reactors participating in the program.
(b)Retrospective premium under the Price-Anderson Act. This is subject to retrospective assessment with respect to a covered loss in excess of $450$500 million in the event of an incident at any licensed United States commercial reactor, payable at $24.7 million per year.
(c)Limit of liability for each incident under the Price-Anderson liability provisions of the Atomic Energy Act of 1954, as amended. This limit is subject to change to account for the effects of inflation and changes in the number of licensed power reactors.
(d)NEIL provides $2.7 billion in property damage, stabilization, decontamination, and premature decommissioning insurance for radiation events and $2.3$0.7 billion in property damage insurance for nonradiation events. EMANI provides $490 million in property damage insurance for both radiation and nonradiation events.
(e)All NEIL-insured plants could be subject to assessments should losses exceed the accumulated funds from NEIL.
(f)Accidental outage insurance provides for lost sales in the event of a prolonged accidental outage. Weekly indemnity up to $4.5 million for 52 weeks, which commences after the first 12 weeks of an outage, plus up to $3.6 million per week for a minimum of 71 weeks thereafter for a total not exceeding the policy limit of $490 million. Nonradiation events are limited to $328$291 million.
The Price-Anderson Act is a federal law that limits the liability for claims from an incident involving any licensed United States commercial nuclear energy center. The limit is based on the number of licensed reactors. The limit of liability and the maximum potential annual payments are adjusted at least every five years for inflation to reflect changes in the Consumer Price Index. The most recent five-year inflationary adjustment became effective in October 2023. Owners of a nuclear reactor cover this exposure through a combination of private insurance and mandatory participation in a financial protection pool, as established by the Price-Anderson Act.
Losses resulting from terrorist attacks on nuclear facilities insured by NEIL are subject to industrywide aggregates, such that terrorist acts against one or more commercial nuclear power plants within a stated time period would be treated as a single event, and the owners of the nuclear power plants would share the limit of liability. NEIL policies have an aggregate limit of $3.2 billion within a 12-month period for radiation events, or $1.8 billion for events not involving radiation contamination, resulting from terrorist attacks. The EMANI policies are not subject to industrywide aggregates in the event of terrorist attacks on nuclear facilities.
If losses from a nuclear incident at the Callaway Energy Center exceed insurance limits, are not covered by insurance, or if coverage is unavailable, Ameren Missouri is at risk for any uninsured losses. If a serious nuclear incident were to occur, it could have a material adverse effect on Ameren’s and Ameren Missouri’s results of operations, financial position, or liquidity.
NOTE 11 – RETIREMENT BENEFITS
The following table presents the components of the net periodic benefit cost (income) incurred for Ameren’s pension and postretirement benefit plans for the three and nine months ended September 30, 2023March 31, 2024 and 2022:2023:
| | Pension Benefits | | | Postretirement Benefits |
| Three Months | | Nine Months | | | Three Months | | Nine Months |
| 2023 | | 2022 | | 2023 | | 2022 | | | 2023 | | 2022 | | 2023 | | 2022 |
| | | | | Pension Benefits | |
| | | | | Pension Benefits | |
| | | | | Pension Benefits | | | | | | | | Postretirement Benefits |
| | | Three Months | | | | | Three Months | | | | | Three Months |
| | | | | 2024 | | | | | | | 2024 | | 2023 | | | | | | | 2024 | | 2023 |
Service cost(a) | Service cost(a) | $ | 10 | | | $ | 31 | | | $ | 56 | | | $ | 95 | | | | $ | 3 | | | $ | 5 | | | $ | 9 | | | $ | 15 | |
| Non-service cost components: | Non-service cost components: | | | |
| Interest cost | |
| Interest cost | |
| Interest cost | Interest cost | 55 | | | 42 | | | 166 | | | 123 | | | | 11 | | | 8 | | | 34 | | | 25 | |
Expected return on plan assets(b) | Expected return on plan assets(b) | (84) | | | (80) | | | (251) | | | (240) | | | | (22) | | | (21) | | | (68) | | | (64) | |
Amortization of(b): | Amortization of(b): | | | |
| | Prior service benefit | Prior service benefit | — | | | — | | | — | | | — | | | | (1) | | | (1) | | | (3) | | | (3) | |
| Actuarial (gain) loss | (29) | | | 7 | | | (86) | | | 19 | | | | (12) | | | (5) | | | (35) | | | (14) | |
| | Prior service benefit | |
| | Prior service benefit | |
| Actuarial (gain) | |
Total non-service cost components(c) | Total non-service cost components(c) | $ | (58) | | | $ | (31) | | | $ | (171) | | | $ | (98) | | | | $ | (24) | | | $ | (19) | | | $ | (72) | | | $ | (56) | |
| Net periodic benefit income(d) | Net periodic benefit income(d) | $ | (48) | | | $ | — | | | $ | (115) | | | $ | (3) | | | | $ | (21) | | | $ | (14) | | | $ | (63) | | | $ | (41) | |
Net periodic benefit income(d) | |
Net periodic benefit income(d) | |
(a)Service cost, net of capitalization, is reflected in “Operating Expenses – Other operations and maintenance” on Ameren’s statement of income.
(b)Prior service benefit is amortized on a straight-line basis over the average future service of active participants benefiting under a plan amendment. Net actuarial gains or losses related to the net benefit obligation subject to amortization are amortized on a straight-line basis over 10 years. The difference between the actual and expected return on plan assets is amortized over 4 years.
(c)Non-service cost components are reflected in “Other Income, Net” on Ameren’s consolidated statement of income. See Note 5 – Other Income, Net for additional information.
(d)Does not include the impact of the tracker for the difference between the level of pension and postretirement benefit costs (income) incurred by Ameren Missouri under GAAP and the level of such costs included in rates.
Ameren Missouri and Ameren Illinois are responsible for their respective share of Ameren’s pension and other postretirement costs. The following table presents the respective share of net periodic pension and other postretirement benefit costs (income) incurred for the three and nine months ended September 30, 2023March 31, 2024 and 2022:2023:
| | Pension Benefits | | | Postretirement Benefits |
| Three Months | | Nine Months | | | Three Months | | Nine Months |
| 2023 | | 2022 | | 2023 | | 2022 | | | 2023 | | 2022 | | 2023 | | 2022 |
| | | | | Pension Benefits | |
| | | | | Pension Benefits | |
| | | | | Pension Benefits | | | | | | | | Postretirement Benefits |
| | | Three Months | | | | | Three Months | | | | | Three Months |
| | | | | 2024 | | | | | | | 2024 | | 2023 | | | | | | | 2024 | | 2023 |
Ameren Missouri(a) | Ameren Missouri(a) | $ | (24) | | | $ | — | | | $ | (59) | | | $ | (2) | | | | $ | (8) | | | $ | (3) | | | $ | (23) | | | $ | (10) | |
| Ameren Illinois | Ameren Illinois | (21) | | | 1 | | | (48) | | | 2 | | | | (13) | | | (11) | | | (40) | | | (31) | |
| Other | Other | (3) | | | (1) | | | (8) | | | (3) | | | | — | | | — | | | — | | | — | |
Ameren(a) | Ameren(a) | $ | (48) | | | $ | — | | | $ | (115) | | | $ | (3) | | | | $ | (21) | | | $ | (14) | | | $ | (63) | | | $ | (41) | |
(a)Does not include the impact of the tracker for the difference between the level of pension and postretirement benefit costs (income) incurred by Ameren Missouri under GAAP and the level of such costs included in rates.
NOTE 12 – INCOME TAXES
The following table presents a reconciliation of the federal statutory corporate income tax rate to the effective income tax rate for the three and nine months ended September 30, 2023March 31, 2024 and 2022:2023:
| | Ameren | |
| 2024 | |
| 2024 | |
| 2024 | |
| | Three Months | |
| | Three Months | |
| | | | Ameren | | Ameren Missouri | | Ameren Illinois | |
| | 2023 | | 2022 | | 2023 | | 2022 | | 2023 | | 2022 | |
| Three Months | Three Months | |
| Federal statutory corporate income tax rate | Federal statutory corporate income tax rate | 21 | % | | 21 | % | | 21 | % | | 21 | % | | 21 | % | | 21 | % | |
| Federal statutory corporate income tax rate | |
| Federal statutory corporate income tax rate | |
| Increases (decreases) from: | Increases (decreases) from: | |
| Amortization of deferred investment tax credit | — | | | — | | | (1) | | | (1) | | | — | | | — | | |
| Increases (decreases) from: | |
| Increases (decreases) from: | |
| Amortization of excess deferred taxes(a) | Amortization of excess deferred taxes(a) | (7) | | | (8) | |
| (15) | | | (15) | |
| (2) | | | (2) | | |
| Depreciation differences | (1) | | | — | | | — | | | — | | | — | | | — | | |
| Amortization of excess deferred taxes(a) | |
| Amortization of excess deferred taxes(a) | |
| Renewable and other tax credits(b) | |
| Renewable and other tax credits(b) | |
| Renewable and other tax credits(b) | Renewable and other tax credits(b) | (5) | | | (4) | | | (11) | | | (10) | | | (1) | | | — | | |
| State tax | State tax | 4 | | | 4 | | | 3 | | | 3 | | | 7 | | | 7 | | |
| State tax | |
| State tax | |
| Stock-based compensation | Stock-based compensation | — | | | 1 | | | — | | | — | | | — | | | — | | |
| Cash surrender value of COLI | — | | | 1 | | | — | | | — | | | — | | | — | | |
| Stock-based compensation | |
| Stock-based compensation | |
| Other depreciation differences | |
| Other depreciation differences | |
| Other depreciation differences | |
| Other permanent items | |
| Other permanent items | |
| Other permanent items | |
| Effective income tax rate | Effective income tax rate | 12 | % | | 15 | % | | (3) | % | | (2) | % | | 25 | % | | 26 | % | |
| Nine Months | |
| Federal statutory corporate income tax rate | 21 | % | | 21 | % | | 21 | % | | 21 | % | | 21 | % | | 21 | % | |
| Increases (decreases) from: | |
| Amortization of deferred investment tax credit | — | | | — | | | (1) | | | (1) | | | — | | | — | | |
Amortization of excess deferred taxes(a) | (8) | | | (8) | |
| (15) | | | (15) | |
| (2) | | | (2) | | |
| Depreciation differences | — | | | — | | | — | | | — | | | (1) | | | — | | |
Renewable and other tax credits(b) | (5) | | | (4) | | | (11) | | | (10) | | | — | | | — | | |
| State tax | 5 | | | 5 | | | 3 | | | 3 | | | 7 | | | 7 | | |
| | Effective income tax rate | Effective income tax rate | 13 | % | | 14 | % | | (3) | % | | (2) | % | | 25 | % | | 26 | % | |
| Effective income tax rate | |
(a)Reflects the amortization of amounts resulting from the revaluation of deferred income taxes subject to regulatory ratemaking, which are being refunded to customers. Deferred income taxes are revalued when federal or state income tax rates change, and the offset to the revaluation of deferred income taxes subject to regulatory ratemaking is recorded to a regulatory asset or liability.
(b)The benefit of the credits associated with Missouri renewable energy standard compliance is refunded to customers through the RESRAM.
NOTE 13 – SUPPLEMENTAL INFORMATION
Cash, Cash Equivalents, and Restricted Cash
The following table provides a reconciliation of cash, cash equivalents, and restricted cash reported within the balance sheets and the statements of cash flows at September 30, 2023,March 31, 2024, and December 31, 2022:2023:
| | September 30, 2023 | | | December 31, 2022 |
| Ameren | | Ameren
Missouri | | Ameren
Illinois | | | Ameren | | Ameren
Missouri | | Ameren
Illinois |
| March 31, 2024 | | | March 31, 2024 | | | December 31, 2023 |
| Ameren | | Ameren
Missouri | | Ameren
Illinois | | | Ameren | | Ameren
Missouri | | Ameren
Illinois |
| “Cash and cash equivalents” | “Cash and cash equivalents” | $ | 8 | | | $ | 3 | | | $ | — | | | | $ | 10 | | | $ | — | | | $ | — | |
| | Restricted cash included in “Other current assets” | |
| Restricted cash included in “Other current assets” | |
| Restricted cash included in “Other current assets” | Restricted cash included in “Other current assets” | 13 | | | 5 | | | 5 | | | | 13 | | | 5 | | | 6 | |
| Restricted cash included in “Other assets” | Restricted cash included in “Other assets” | 220 | | | — | | | 220 | | | | 185 | | | — | | | 185 | |
| Restricted cash included in “Nuclear decommissioning trust fund” | Restricted cash included in “Nuclear decommissioning trust fund” | 5 | | | 5 | | | — | | | | 8 | | | 8 | | | — | |
| Total cash, cash equivalents, and restricted cash | Total cash, cash equivalents, and restricted cash | $ | 246 | | | $ | 13 | | | $ | 225 | | | | $ | 216 | | | $ | 13 | | | $ | 191 | |
Restricted cash included in “Other current assets” primarily represents funds held by an irrevocable Voluntary Employee Beneficiary Association (VEBA) trust, which provides health care benefits for active employees. Restricted cash included in “Other assets” on Ameren’s and Ameren Illinois’ balance sheets primarily represents amounts collected under a cost recovery rider restricted for use in the procurement of renewable energy credits and amounts in a trust fund restricted for the use of funding certain asbestos-related claims.
Accounts Receivable
“Accounts receivable – trade” on Ameren’s and Ameren Illinois’ balance sheets include certain receivables purchased at a discount from alternative retail electric suppliers that elect to participate in the utility consolidated billing program. At September 30, 2023,March 31, 2024, and December 31, 2022,2023, “Other current liabilities” on Ameren’s and Ameren Illinois’ balance sheets included payables for purchased receivables of $50$43 million and $31$42 million, respectively.
The following table provides a reconciliation of the beginning and ending amount of the allowance for doubtful accounts for the three and nine months ended September 30, 2023March 31, 2024 and 2022:2023:
| | Three Months | | Nine Months |
| 2023 | | 2022 | | | 2023 | | 2022 | |
| | | Three Months | |
| | | Three Months | |
| | | Three Months | |
| | | | | | 2024 | |
| Ameren: | |
| Ameren: | |
| Ameren: | Ameren: | | | |
| Beginning of period | Beginning of period | $ | 39 | | | $ | 30 | | | | $ | 31 | | | $ | 29 | | |
| Beginning of period | |
| Beginning of period | |
| Bad debt expense | |
| Bad debt expense | |
| Bad debt expense | Bad debt expense | 18 | | | 14 | | | | 41 | | | 23 | | |
Charged to other accounts(a) | Charged to other accounts(a) | 2 | | | 1 | | | | 3 | | | 3 | | |
Charged to other accounts(a) | |
Charged to other accounts(a) | |
| Net write-offs | |
| Net write-offs | |
| Net write-offs | Net write-offs | (26) | | | (14) | | | | (42) | | | (24) | | |
| End of period | End of period | $ | 33 | | | $ | 31 | | | | $ | 33 | | | $ | 31 | | |
| End of period | |
| End of period | |
| Ameren Missouri: | |
| Ameren Missouri: | |
| Ameren Missouri: | Ameren Missouri: | | | |
| Beginning of period | Beginning of period | $ | 12 | | | $ | 12 | | | | $ | 13 | | | $ | 13 | | |
| Beginning of period | |
| Beginning of period | |
| Bad debt expense | |
| Bad debt expense | |
| Bad debt expense | Bad debt expense | 5 | | | 3 | | | | 9 | | | 6 | | |
| Net write-offs | Net write-offs | (5) | | | (3) | | | | (10) | | | (7) | | |
| Net write-offs | |
| Net write-offs | |
| End of period | |
| End of period | |
| End of period | End of period | $ | 12 | | | $ | 12 | | | | $ | 12 | | | $ | 12 | | |
Ameren Illinois:(b) | Ameren Illinois:(b) | | | |
Ameren Illinois:(b) | |
Ameren Illinois:(b) | |
| Beginning of period | |
| Beginning of period | |
| Beginning of period | Beginning of period | $ | 27 | | | $ | 18 | | | | $ | 18 | | | $ | 16 | | |
| Bad debt expense | Bad debt expense | 13 | |
| 11 | | | | 32 | | | 17 | | |
| Bad debt expense | |
| Bad debt expense | |
Charged to other accounts(a) | |
Charged to other accounts(a) | |
Charged to other accounts(a) | Charged to other accounts(a) | 2 | | | 1 | | | | 3 | | | 3 | | |
| Net write-offs | Net write-offs | (21) | | | (11) | | | | (32) | | | (17) | | |
| Net write-offs | |
| Net write-offs | |
| End of period | End of period | $ | 21 | | | $ | 19 | | | | $ | 21 | | | $ | 19 | | |
| End of period | |
| End of period | |
(a)Amounts associated with the allowance for doubtful accounts related to receivables purchased by Ameren Illinois from alternative retail electric suppliers, as required by the Illinois Public Utilities Act.
(b)Ameren Illinois has ridersrate-adjustment mechanisms that allow it to recover the difference between its actual net bad debt write-offs under GAAP, including those associated with receivables purchased from alternative retail electric suppliers, and the amount of net bad debt write-offs included in its base rates. The table above does not include the impact related to the riders.
As of September 30, 2023, accounts receivable balances that were 30 days or greater past due or that were a part of a deferred payment arrangement represented 17%, 8%, and 26%, or $106 million, $25 million, and $81 million, of Ameren’s, Ameren Missouri’s, and Ameren Illinois’ customer trade receivables before allowance for doubtful accounts, respectively. In comparison, as of September 30, 2022, these percentages were 17%, 12%, and 21%, or $117 million, $39 million, and $78 million, for Ameren, Ameren Missouri, and Ameren Illinois, respectively.
Supplemental Cash Flow Information
The following table provides noncash financing and investing activity excluded from the statements of cash flows for the ninethree months ended September 30, 2023March 31, 2024 and 2022:2023:
| | September 30, 2023 | | September 30, 2022 |
| Ameren | Ameren
Missouri | | Ameren
Illinois | Ameren | Ameren
Missouri | Ameren
Illinois |
| March 31, 2024 | |
| | March 31, 2024 | | | March 31, 2024 | | March 31, 2023 |
| Ameren | Ameren
Missouri | | Ameren
Illinois | Ameren | Ameren
Missouri | Ameren
Illinois |
| Investing: | Investing: | | | |
| Accrued capital expenditures, including nuclear fuel expenditures | Accrued capital expenditures, including nuclear fuel expenditures | $ | 518 | | $ | 246 | | | $ | 237 | | | $ | 367 | | $ | 187 | | $ | 180 | |
| Accrued capital expenditures, including nuclear fuel expenditures | |
| Accrued capital expenditures, including nuclear fuel expenditures | |
| | Net realized and unrealized gain/(loss) – nuclear decommissioning trust fund | 66 | | 66 | | | — | | | (262) | | (262) | | — | |
| Net realized and unrealized gain – nuclear decommissioning trust fund | |
| Net realized and unrealized gain – nuclear decommissioning trust fund | |
| Net realized and unrealized gain – nuclear decommissioning trust fund | |
Return of investment in industrial development revenue bonds(a) | Return of investment in industrial development revenue bonds(a) | 240 | | 240 | | | — | | | — | | — | | — | |
| Financing: | Financing: | | | |
| Issuance of common stock for stock-based compensation | Issuance of common stock for stock-based compensation | $ | 37 | | $ | — | | | $ | — | | | $ | 31 | | $ | — | | $ | — | |
| Issuance of common stock for stock-based compensation | |
| Issuance of common stock for stock-based compensation | |
| Issuance of common stock under the DRPlus | Issuance of common stock under the DRPlus | 7 | | — | | | — | | | 8 | | — | | — | |
Termination of a financing obligation(a) | Termination of a financing obligation(a) | 240 | | 240 | | | — | | | — | | — | | — | |
(a)In January 2023, Ameren Missouri and Audrain County mutually agreed to terminate a financing obligation agreement related to the CT energy center in Audrain County, which was scheduled to expire in December 2023. No cash was exchanged in connection with the termination of the agreement as the $240 million principal amount of the financing obligation due from Ameren Missouri was equal to the amount of bond service payments due to Ameren Missouri.
Asset Retirement Obligations
The following table provides a reconciliation of the beginning and ending carrying amount of AROs for the ninethree months ended September 30, 2023:March 31, 2024:
| | | | | | | | | | | | | | | | | | | | | | |
| Ameren
Missouri | | Ameren
Illinois | | | | Ameren | |
| Balance at December 31, 2022 | $ | 782 | | (a) | $ | 4 | | | | (b) | $ | 786 | | (a) |
| | | | | | | | |
| Liabilities settled | (9) | | | — | | | | | (9) | | |
| Accretion | 25 | | (c) | — | | | |
| 25 | | (c) |
| Change in estimates | (18) | | | — | | | | | (18) | | |
| Balance at September 30, 2023 | $ | 780 | | (a) | $ | 4 | | | | (b) | $ | 784 | | (a) |
| | | | | | | | | | | | | | | | | | | | | | |
| Ameren
Missouri | | Ameren
Illinois | | | | Ameren | |
| Balance at December 31, 2023 | $ | 787 | | (a) | $ | 4 | | | | (b) | $ | 791 | | (a) |
| | | | | | | | |
| Liabilities settled | — | | | (1) | | | | | (1) | | |
| Accretion | 8 | | (c) | — | | | |
| 8 | | (c) |
| | | | | | | | |
| Balance at March 31, 2024 | $ | 795 | | (a) | $ | 3 | | | | (b) | $ | 798 | | (a) |
(a)Balance included $23$19 million in “Other current liabilities” on the balance sheet as of both September 30, 2023,March 31, 2024, and December 31, 2022.2023.
(b)Included in “Other deferred credits and liabilities” on the balance sheet.
(c)Accretion expense attributable to Ameren Missouri was recorded as a decrease to regulatory liabilities.
Stock-based Compensation
In the first quarter of 2023,2024, Ameren granted 265,422359,133 performance share units with a grant date fair value of $24$21 million and 116,701153,887 restricted share units with a grant date fair value of $10$11 million. Awards vest approximately 3 years after the grant date based on continued employment or on a pro-rata basis upon death or eligible retirement. The performance share units vest based on the achievement of certain specified market performance measures (227,494(307,816 performance share units) or clean energy transition targets (37,928(51,317 performance share units). The exact number of shares issued pursuant to a performance share unit varies from 0% to 200% of the target award, depending on actual company performance relative to the performance goals.
For the ninethree months ended September 30,March 31, 2024 and 2023, and 2022, excess tax benefits (deficiencies) associated with the settlement of stock-based compensation awards increased income tax expense by $1 million and reduced income tax expense by $6 million, and $5 million, respectively.
Deferred Compensation
At September 30, 2023,March 31, 2024, and December 31, 2022,2023, the present value of benefits to be paid for deferred compensation obligations was $85$87 million and $87$85 million, respectively, which was primarily reflected in “Other deferred credits and liabilities” on Ameren’s consolidated balance sheet.
Operating Revenues
As of September 30,March 31, 2024 and 2023, and 2022, our remaining performance obligations for contracts with a term greater than one year were immaterial. The Ameren Companies elected not to disclose the aggregate amount of the transaction price allocated to the performance obligations that are unsatisfied as of the end of the reporting period for contracts with an initial expected term of one year or less.
See Note 14 – Segment Information for disaggregated revenue information.
Excise Taxes
Ameren Missouri and Ameren Illinois collect from their customers excise taxes, including municipal and state excise taxes and gross receipts taxes that are levied on the sale or distribution of natural gas and electricity. The following table presents the excise taxes recorded on a gross basis in “Operating Revenues – Electric,” “Operating Revenues – Natural gas” and “Operating Expenses – Taxes other than income taxes” on the statements of income for the three and nine months ended September 30, 2023March 31, 2024 and 2022:2023:
| | Three Months | | Nine Months |
| 2023 | | 2022 | | 2023 | | 2022 |
| | | Three Months | |
| | | Three Months | |
| | | Three Months | |
| | | | | 2024 | | | | | | | 2024 | | 2023 |
| Ameren Missouri | Ameren Missouri | $ | 60 | | | $ | 55 | | | $ | 133 | | | $ | 128 | |
| Ameren Illinois | Ameren Illinois | 27 | | | 28 | | | 90 | | | 101 | |
| Ameren | Ameren | $ | 87 | | | $ | 83 | | | $ | 223 | | | $ | 229 | |
Earnings per Share
The following table reconciles the basic weighted-average number of common shares outstanding to the diluted weighted-average number of common shares outstanding for the three and nine months ended September 30, 2023March 31, 2024 and 2022:2023:
| | Three Months | | Nine Months |
| 2023 | | 2022 | | 2023 | | 2022 |
| | | Three Months | |
| | | Three Months | |
| | | Three Months | |
| | | | | 2024 | | | | | | | 2024 | | 2023 |
| | Weighted-average Common Shares Outstanding – Basic | Weighted-average Common Shares Outstanding – Basic | 262.8 | | | 258.4 | | | 262.5 | | | 258.2 | |
| | Weighted-average Common Shares Outstanding – Basic | |
| | Weighted-average Common Shares Outstanding – Basic | |
| Assumed settlement of performance share units and restricted stock units | Assumed settlement of performance share units and restricted stock units | 0.6 | | | 0.9 | | | 0.7 | | | 1.0 | |
| Dilutive effect of forward sale agreements | — | | | 0.2 | | | — | | | 0.1 | |
| Weighted-average Common Shares Outstanding – Diluted(a) | |
Weighted-average Common Shares Outstanding – Diluted(a) | |
Weighted-average Common Shares Outstanding – Diluted(a) | Weighted-average Common Shares Outstanding – Diluted(a) | 263.4 | | | 259.5 | | | 263.2 | | | 259.3 | |
|
(a)There was an immaterial number of anti-dilutive performance share units excluded from the earnings per diluted share calculations for the three and nine months ended September 30, 2023March 31, 2024 and 2022.2023. The outstanding forward sale agreements as of September 30,March 31, 2024 and 2023, were anti-dilutive for the three and nine months ended September 30,March 31, 2024 and 2023, and were excluded from the earnings per diluted share calculation as calculated using the treasury stock method. For additional information about our outstanding forward sale agreements, see Note 4 – Long-term Debt and Equity Financings.
NOTE 14 – SEGMENT INFORMATION
The following tables present revenues, net income attributable to common shareholders, and capital expenditures by segment at Ameren and Ameren Illinois for the three and nine months ended September 30, 2023March 31, 2024 and 2022.2023. Ameren, Ameren Missouri, and Ameren Illinois management review segment capital expenditure information rather than any individual or total asset amount. For additional information about our segments, see Note 16 – Segment Information under Part II, Item 8, of the Form 10-K.
Ameren
| | Ameren Missouri | |
| | | Ameren Missouri | | Ameren Illinois Electric Distribution | | Ameren Illinois Natural Gas | | Ameren Transmission | | Other | | Intersegment Eliminations | | Ameren | |
| | Three Months 2024: | |
| | Three Months 2024: | |
| | Three Months 2024: | |
| External revenues | |
| External revenues | |
| External revenues | |
| Intersegment revenues | |
| Intersegment revenues | |
| Intersegment revenues | |
| Net income attributable to Ameren common shareholders | |
| Net income attributable to Ameren common shareholders | |
| Net income attributable to Ameren common shareholders | |
| Capital expenditures | |
| Capital expenditures | |
| Capital expenditures | |
| Three Months 2023: | |
| Three Months 2023: | |
| Three Months 2023: | Three Months 2023: | |
| External revenues | External revenues | $ | 1,228 | | | $ | 557 | | | $ | 121 | | | $ | 154 | | | $ | — | | | $ | — | | | $ | 2,060 | | |
| Intersegment revenues | 9 | | | 1 | | | 1 | | | 34 | | | — | | | (45) | | | — | | |
| Net income (loss) attributable to Ameren common shareholders | 411 | | | 66 | | | (5) | | | 86 | | (a) | (65) | | | — | | | 493 | | |
| Capital expenditures | 341 | | | 177 | | | 80 | | | 160 | | | 2 | | | (11) | | | 749 | | |
| Three Months 2022: | |
| External revenues | |
| External revenues | External revenues | $ | 1,351 | | | $ | 672 | | | $ | 146 | | | $ | 137 | | | $ | — | | | $ | — | | | $ | 2,306 | | |
| Intersegment revenues | Intersegment revenues | 8 | | | — | | | — | | | 32 | | | — | | | (40) | | | — | | |
| Net income (loss) attributable to Ameren common shareholders | 397 | | | 51 | | | (4) | | | 78 | | (a) | (70) | | | — | | | 452 | | |
| Intersegment revenues | |
| Intersegment revenues | |
| Net income attributable to Ameren common shareholders | |
| Net income attributable to Ameren common shareholders | |
| Net income attributable to Ameren common shareholders | |
| Capital expenditures | Capital expenditures | 431 | | | 163 | | | 114 | | | 187 | | | 1 | | | 3 | | | 899 | | |
| Nine Months 2023: | |
| External revenues | $ | 3,074 | | | $ | 1,721 | | | $ | 664 | | | $ | 423 | | | $ | — | | | $ | — | | | $ | 5,882 | | |
| Intersegment revenues | 27 | | | 1 | | | 1 | | | 89 | | | — | | | (118) | | | — | | |
| Net income (loss) attributable to Ameren common shareholders | 541 | | | 193 | | | 93 | | | 229 | | (a) | (62) | | | — | | | 994 | | |
| Capital expenditures | Capital expenditures | 1,255 | | | 527 | | | 221 | | | 570 | | | 7 | | | (9) | | | 2,571 | | |
| Nine Months 2022: | |
| External revenues | $ | 3,071 | | | $ | 1,640 | | | $ | 811 | | | $ | 389 | | | $ | — | | | $ | — | | | $ | 5,911 | | |
| Intersegment revenues | 25 | | | 1 | | | — | | | 76 | | | — | | | (102) | | | — | | |
| Net income (loss) attributable to Ameren common shareholders | 547 | | | 151 | | | 82 | | | 199 | | (a) | (68) | | | — | | | 911 | | |
| Capital expenditures | Capital expenditures | 1,237 | | | 444 | | | 232 | | | 519 | | | 4 | | | 1 | | | 2,437 | | |
(a)Ameren Transmission earnings reflect an allocation of financing costs from Ameren (parent).
Ameren Illinois
| | | | | | | | | | | | | | | | | | | | | | | | | | | | | |
| Ameren Illinois Electric Distribution | | Ameren Illinois Natural Gas | | Ameren Illinois Transmission | | Intersegment Eliminations | | Ameren Illinois |
| | | | | | | | | |
| | | | | | | | | |
| | | | | | | | | |
| | | | | | | | | |
| | | | | | | | | |
| | | | | | | | | |
| | | | | | | | | |
| | | | | | | | | |
| | | | | | | | | |
| | | | | | | | | |
| Three Months 2024: | | | | | | | | | |
| External revenues | $ | 506 | | | $ | 391 | | | $ | 103 | | | $ | — | | | $ | 1,000 | |
| Intersegment revenues | — | | | — | | | 28 | | | (28) | | | — | |
| Net income available to common shareholder | 56 | | | 106 | | | 53 | | | — | | | 215 | |
| Capital expenditures | 184 | | | 60 | | | 129 | | | — | | | 373 | |
| Three Months 2023: | | | | | | | | | |
| External revenues | $ | 624 | | | $ | 391 | | | $ | 86 | | | $ | — | | | $ | 1,101 | |
| Intersegment revenues | — | | | — | | | 28 | | | (28) | | | — | |
| Net income available to common shareholder | 61 | | | 87 | | | 50 | | | — | | | 198 | |
| Capital expenditures | 170 | | | 51 | | | 186 | | | — | | | 407 | |
Ameren Illinois
| | | | | | | | | | | | | | | | | | | | | | | | | | | | | |
| Ameren Illinois Electric Distribution | | Ameren Illinois Natural Gas | | Ameren Illinois Transmission | | Intersegment Eliminations | | Ameren Illinois |
| Three Months 2023: | | | | | | | | | |
| External revenues | $ | 558 | | | $ | 122 | | | $ | 103 | | | $ | — | | | $ | 783 | |
| Intersegment revenues | — | | | — | | | 33 | | | (33) | | | — | |
| Net income (loss) available to common shareholder | 66 | | | (5) | | | 64 | | | — | | | 125 | |
| Capital expenditures | 177 | | | 80 | | | 125 | | | — | | | 382 | |
| Three Months 2022: | | | | | | | | | |
| External revenues | $ | 672 | | | $ | 146 | | | $ | 86 | | | $ | — | | | $ | 904 | |
| Intersegment revenues | — | | | — | | | 31 | | | (31) | | | — | |
| Net income (loss) available to common shareholder | 51 | | | (4) | | | 56 | | | — | | | 103 | |
| Capital expenditures | 163 | | | 114 | | | 169 | | | — | | | 446 | |
| Nine Months 2023: | | | | | | | | | |
| External revenues | $ | 1,722 | | | $ | 665 | | | $ | 276 | | | $ | — | | | $ | 2,663 | |
| Intersegment revenues | — | | | — | | | 87 | | | (87) | | | — | |
| Net income available to common shareholder | 193 | | | 93 | | | 166 | | | — | | | 452 | |
| Capital expenditures | 527 | | | 221 | | | 478 | | | — | | | 1,226 | |
| Nine Months 2022: | | | | | | | | | |
| External revenues | $ | 1,641 | | | $ | 811 | | | $ | 245 | | | $ | — | | | $ | 2,697 | |
| Intersegment revenues | — | | | — | | | 75 | | | (75) | | | — | |
| Net income available to common shareholder | 151 | | | 82 | | | 142 | | | — | | | 375 | |
| Capital expenditures | 444 | | | 232 | | | 469 | | | — | | | 1,145 | |
The following tables present disaggregated revenues by segment at Ameren and Ameren Illinois for the three and nine months ended September 30, 2023March 31, 2024 and 2022.2023. Economic factors affect the nature, timing, amount, and uncertainty of revenues and cash flows in a similar manner across customer classes. Revenues from alternative revenue programs have a similar distribution among customer classes as revenues from contracts with customers. Other revenues not associated with contracts with customers are presented in the Other customer classification, along with electric transmission, off-system sales, and capacity revenues.
Ameren
| | | | | | | | | | | | | | | | | | | | | | | | | | | | | | | | | | | | | | | | |
| Ameren Missouri | | Ameren Illinois Electric Distribution | | Ameren Illinois Natural Gas | | Ameren Transmission | | | | Intersegment Eliminations | | Ameren | |
| Three Months 2023: | | | | | | | | | | | | | | |
| Residential | $ | 590 | | | $ | 330 | | | $ | — | | | $ | — | | | | | $ | — | | | $ | 920 | | |
| Commercial | 468 | | | 189 | | | — | | | — | | | | | — | | | 657 | | |
| Industrial | 107 | | | 40 | | | — | | | — | | | | | — | | | 147 | | |
| Other | 54 | | | (1) | | (a) | — | | | 188 | | | | | (44) | | | 197 | | |
| Total electric revenues | $ | 1,219 | | | $ | 558 | | | $ | — | | | $ | 188 | | | | | $ | (44) | | | $ | 1,921 | | |
| Residential | $ | 9 | | | $ | — | | | $ | 75 | | | $ | — | | | | | $ | — | | | $ | 84 | | |
| Commercial | 5 | | | — | | | 19 | | | — | | | | | — | | | 24 | | |
| Industrial | 1 | | | — | | | 1 | | | — | | | | | — | | | 2 | | |
| Other | 3 | | | — | | | 27 | |
| — | | | | | (1) | | | 29 | | |
| Total natural gas revenues | $ | 18 | | | $ | — | | | $ | 122 | | | $ | — | | | | | $ | (1) | | | $ | 139 | | |
Total revenues(b) | $ | 1,237 | | | $ | 558 | | | $ | 122 | | | $ | 188 | | | | | $ | (45) | | | $ | 2,060 | | |
| | | | | | | | | | | | | | | | | | | | | | | | | | | | | | | | | | | | | | | | |
| Ameren Missouri | | Ameren Illinois Electric Distribution | | Ameren Illinois Natural Gas | | Ameren Transmission | | | | Intersegment Eliminations | | Ameren | |
| Three Months 2022: | | | | | | | | | | | | | | |
| Residential | $ | 564 | | | $ | 407 | | | $ | — | | | $ | — | | | | | $ | — | | | $ | 971 | | |
| Commercial | 430 | | | 233 | | | — | | | — | | | | | — | | | 663 | | |
| Industrial | 99 | | | 47 | | | — | | | — | | | | | — | | | 146 | | |
| Other | 245 | |
| (15) | | (a) | — | | | 169 | | | | | (39) | | | 360 | |
|
| Total electric revenues | $ | 1,338 | | | $ | 672 | | | $ | — | | | $ | 169 | | | | | $ | (39) | | | $ | 2,140 | | |
| Residential | $ | 11 | | | $ | — | | | $ | 89 | | | $ | — | | | | | $ | — | | | $ | 100 | | |
| Commercial | 6 | | | — | | | 25 | | | — | | | | | — | | | 31 | | |
| Industrial | 1 | | | — | | | 5 | | | — | | | | | — | | | 6 | | |
| Other | 3 | | | — | | | 27 | | | — | | | | | (1) | | | 29 | | |
| Total natural gas revenues | $ | 21 | | | $ | — | | | $ | 146 | | | $ | — | | | | | $ | (1) | | | $ | 166 | | |
Total revenues(b) | $ | 1,359 | | | $ | 672 | | | $ | 146 | | | $ | 169 | | | | | $ | (40) | | | $ | 2,306 | | |
| Nine Months 2023: | | | | | | | | | | | | | | |
| Residential | $ | 1,274 | | | $ | 1,049 | | | $ | — | | | $ | — | | | | | $ | — | | | $ | 2,323 | | |
| Commercial | 1,026 | | | 582 | | | — | | | — | | | | | — | | | 1,608 | | |
| Industrial | 243 | | | 136 | | | — | | | — | | | | | — | | | 379 | | |
| Other | 435 | | | (45) | | (a) | — | | | 512 | | | | | (116) | | | 786 | | |
| Total electric revenues | $ | 2,978 | | | $ | 1,722 | | | $ | — | | | $ | 512 | | | | | $ | (116) | | | $ | 5,096 | | |
| Residential | $ | 74 | | | $ | — | | | $ | 469 | | | $ | — | | | | | $ | — | | | $ | 543 | | |
| Commercial | 34 | | | — | | | 121 | | | — | | | | | — | | | 155 | | |
| Industrial | 4 | | | — | | | 10 | | | — | | | | | — | | | 14 | | |
| Other | 11 | | | — | | | 65 | | | — | | | | | (2) | | | 74 | | |
| Total natural gas revenues | $ | 123 | | | $ | — | | | $ | 665 | | | $ | — | | | | | $ | (2) | | | $ | 786 | | |
Total revenues(b) | $ | 3,101 | | | $ | 1,722 | | | $ | 665 | | | $ | 512 | | | | | $ | (118) | | | $ | 5,882 | | |
| Nine Months 2022: | | | | | | | | | | | | | | |
| Residential | $ | 1,267 | | | $ | 954 | | | $ | — | | | $ | — | | | | | $ | — | | | $ | 2,221 | | |
| Commercial | 968 | | | 571 | | | — | | | — | | | | | — | | | 1,539 | | |
| Industrial | 229 | | | 145 | | | — | | | — | | | | | — | | | 374 | | |
| Other | 502 | | | (29) | | (a) | — | | | 465 | | | | | (101) | | | 837 | | |
| Total electric revenues | $ | 2,966 | | | $ | 1,641 | | | $ | — | | | $ | 465 | | | | | $ | (101) | | | $ | 4,971 | | |
| Residential | $ | 78 | | | $ | — | | | $ | 575 | | | $ | — | | | | | $ | — | | | $ | 653 | | |
| Commercial | 36 | | | — | | | 152 | | | — | | | | | — | | | 188 | | |
| Industrial | 4 | | | — | | | 33 | | | — | | | | | — | | | 37 | | |
| Other | 12 | | | — | | | 51 | | | — | | | | | (1) | | | 62 | | |
| Total natural gas revenues | $ | 130 | | | $ | — | | | $ | 811 | | | $ | — | | | | | $ | (1) | | | $ | 940 | | |
Total revenues(b) | $ | 3,096 | | | $ | 1,641 | | | $ | 811 | | | $ | 465 | | | | | $ | (102) | | | $ | 5,911 | | |
| | | | | | | | | | | | | | | | | | | | | | | | | | | | | | | | | | | | | | | | |
| Ameren Missouri | | Ameren Illinois Electric Distribution | | Ameren Illinois Natural Gas | | Ameren Transmission | | | | Intersegment Eliminations | | Ameren | |
| | | | | | | | | | | | | | |
| | | | | | | | | | | | | | |
| | | | | | | | | | | | | | |
| | | | | | | | | | | | | | |
| | | | | | | | | | | | | | |
| | | | | | | | | | | | | | |
| | | | | | | | | | | | | | |
| | | | | | | | | | | | | | |
| | | | | | | | | | | | | | |
| | | | | | | | | | | | | | |
| | | | | | | | | | | | | | |
| | | | | | | | | | | | | | |
| | | | | | | | | | | | | | |
| | | | | | | | | | | | | | |
| | | | | | | | | | | | | | |
| | | | | | | | | | | | | | |
| | | | | | | | | | | | | | |
| | | | | | | | | | | | | | |
| | | | | | | | | | | | | | |
| | | | | | | | | | | | | | |
| | | | | | | | | | | | | | |
| | | | | | | | | | | | | | |
| | | | | | | | | | | | | | |
| | | | | | | | | | | | | | |
| Three Months 2024: | | | | | | | | | | | | | | |
| Residential | $ | 341 | | | $ | 297 | | | $ | — | | | $ | — | | | | | $ | — | | | $ | 638 | | |
| Commercial | 259 | | | 165 | | | — | | | — | | | | | — | | | 424 | | |
| Industrial | 61 | | | 45 | | | — | | | — | | | | | — | | | 106 | | |
| Other | 53 | | | (1) | | (a) | — | | | 185 | | | | | (41) | | | 196 | | |
| Total electric revenues | $ | 714 | | | $ | 506 | | | $ | — | | | $ | 185 | | | | | $ | (41) | | | $ | 1,364 | | |
| Residential | $ | 40 | | | $ | — | | | $ | 287 | | | $ | — | | | | | $ | — | | | $ | 327 | | |
| Commercial | 16 | | | — | | | 68 | | | — | | | | | — | | | 84 | | |
| Industrial | 2 | | | — | | | 4 | | | — | | | | | — | | | 6 | | |
| Other | 3 | | | — | | | 32 | | | — | | | | | — | | | 35 | | |
| Total natural gas revenues | $ | 61 | | | $ | — | | | $ | 391 | | | $ | — | | | | | $ | — | | | $ | 452 | | |
Total revenues(b) | $ | 775 | | | $ | 506 | | | $ | 391 | | | $ | 185 | | | | | $ | (41) | | | $ | 1,816 | | |
| Three Months 2023: | | | | | | | | | | | | | | |
| Residential | $ | 324 | | | $ | 382 | | | $ | — | | | $ | — | | | | | $ | — | | | $ | 706 | | |
| Commercial | 247 | | | 200 | | | — | | | — | | | | | — | | | 447 | | |
| Industrial | 61 | | | 48 | | | — | | | — | | | | | — | | | 109 | | |
| Other | 209 | | | (6) | | (a) | — | | | 163 | | | | | (38) | | | 328 | | |
| Total electric revenues | $ | 841 | | | $ | 624 | | | $ | — | | | $ | 163 | | | | | $ | (38) | | | $ | 1,590 | | |
| Residential | $ | 52 | | | $ | — | | | $ | 296 | | | $ | — | | | | | $ | — | | | $ | 348 | | |
| Commercial | 23 | | | — | | | 77 | | | — | | | | | — | | | 100 | | |
| Industrial | 2 | | | — | | | 7 | | | — | | | | | — | | | 9 | | |
| Other | 5 | | | — | | | 11 | | | — | | | | | (1) | | | 15 | | |
| Total natural gas revenues | $ | 82 | | | $ | — | | | $ | 391 | | | $ | — | | | | | $ | (1) | | | $ | 472 | | |
Total revenues(b) | $ | 923 | | | $ | 624 | | | $ | 391 | | | $ | 163 | | | | | $ | (39) | | | $ | 2,062 | | |
(a)Includes over-recoveries of various riders.
(b)The following table presents increases/(decreases) in revenues from alternative revenue programs and other revenues not from contracts with customers for the three and nine months ended September 30, 2023March 31, 2024 and 2022:2023:
| | Ameren Missouri | |
| | | Ameren Missouri | | Ameren Illinois Electric Distribution | | Ameren Illinois Natural Gas | | Ameren Transmission | | Ameren | |
| | Three Months 2024: | |
| | Three Months 2024: | |
| | Three Months 2024: | |
| Revenues from alternative revenue programs | |
| Revenues from alternative revenue programs | |
| Revenues from alternative revenue programs | |
| Other revenues not from contracts with customers | |
| Other revenues not from contracts with customers | |
| Other revenues not from contracts with customers | |
| Three Months 2023: | |
| Three Months 2023: | |
| Three Months 2023: | Three Months 2023: | |
| Revenues from alternative revenue programs | Revenues from alternative revenue programs | $ | (9) | | | $ | (94) | | | $ | (1) | | | $ | (5) | | | $ | (109) | | |
| Other revenues not from contracts with customers | (1) | | (a) | 2 | | | — | | | — | | | 1 | | (a) |
| Three Months 2022: | |
| Revenues from alternative revenue programs | |
| Revenues from alternative revenue programs | Revenues from alternative revenue programs | $ | 14 | | | $ | (83) | | | $ | (3) | | | $ | (11) | | | $ | (83) | | |
| Other revenues not from contracts with customers | Other revenues not from contracts with customers | (45) | | (a) | 2 | | | — | | | — | | | (43) | | (a) |
| Nine Months 2023: | |
| Revenues from alternative revenue programs | $ | (11) | | | $ | 30 | | | $ | 36 | | | $ | 8 | | | $ | 63 | | |
| Other revenues not from contracts with customers | Other revenues not from contracts with customers | (9) | | (a) | 6 | | | 2 | | | — | | | (1) | | (a) |
| Nine Months 2022: | |
| Revenues from alternative revenue programs | $ | 8 | | | $ | 13 | | | $ | (5) | | | $ | (14) | | | $ | 2 | | |
| Other revenues not from contracts with customers | Other revenues not from contracts with customers | (81) | | (a), (b) | 5 | | | 2 | | | — | | | (74) | | (a), (b) | (6) | | (a) | (a) | 2 | | | 1 | | 1 | | | — | | — | | | (3) | | (3) | | (a) | (a) |
(a)Includes net realized losses on derivative power contracts.
(b)Includes insurance recoveries related to lost sales associated with the December 2020 Callaway Energy Center maintenance outage. See Note 9 – Callaway Energy Center under Part II, Item 8, of the Form 10-K for additional information.
Ameren Illinois
| | | | | | | | | | | | | | | | | | | | | | | | | | | | | | | | |
| Ameren Illinois Electric Distribution | | Ameren Illinois Natural Gas | | Ameren Illinois Transmission | | Intersegment Eliminations | | Ameren Illinois | |
| Three Months 2023: | | | | | | | | | | |
| Residential | $ | 330 | | | $ | 75 | | | $ | — | | | $ | — | | | $ | 405 | | |
| Commercial | 189 | | | 19 | | | — | | | — | | | 208 | | |
| Industrial | 40 | | | 1 | | | — | | | — | | | 41 | | |
| Other | (1) | | (a) | 27 | |
| 136 | | | (33) | | | 129 | | |
Total revenues(b) | $ | 558 | | | $ | 122 | | | $ | 136 | | | $ | (33) | | | $ | 783 | | |
| Three Months 2022: | | | | | | | | | | |
| Residential | $ | 407 | | | $ | 89 | | | $ | — | | | $ | — | | | $ | 496 | | |
| Commercial | 233 | | | 25 | | | — | | | — | | | 258 | | |
| Industrial | 47 | | | 5 | | | — | | | — | | | 52 | | |
| Other | (15) | | (a) | 27 | | | 117 | | | (31) | | | 98 | | |
Total revenues(b) | $ | 672 | | | $ | 146 | | | $ | 117 | | | $ | (31) | | | $ | 904 | | |
| Nine Months 2023: | | | | | | | | | | |
| Residential | $ | 1,049 | | | $ | 469 | | | $ | — | | | $ | — | | | $ | 1,518 | | |
| Commercial | 582 | | | 121 | | | — | | | — | | | 703 | | |
| Industrial | 136 | | | 10 | | | — | | | — | | | 146 | | |
| Other | (45) | | (a) | 65 | | | 363 | | | (87) | | | 296 | | |
Total revenues(b) | $ | 1,722 | | | $ | 665 | | | $ | 363 | | | $ | (87) | | | $ | 2,663 | | |
| Nine Months 2022: | | | | | | | | | | |
| Residential | $ | 954 | | | $ | 575 | | | $ | — | | | $ | — | | | $ | 1,529 | | |
| Commercial | 571 | | | 152 | | | — | | | — | | | 723 | | |
| Industrial | 145 | | | 33 | | | — | | | — | | | 178 | | |
| Other | (29) | | (a) | 51 | | | 320 | | | (75) | | | 267 | | |
Total revenues(b) | $ | 1,641 | | | $ | 811 | | | $ | 320 | | | $ | (75) | | | $ | 2,697 | | |
Ameren Illinois
| | | | | | | | | | | | | | | | | | | | | | | | | | | | | | | | |
| Ameren Illinois Electric Distribution | | Ameren Illinois Natural Gas | | Ameren Illinois Transmission | | Intersegment Eliminations | | Ameren Illinois | |
| | | | | | | | | | |
| | | | | | | | | | |
| | | | | | | | | | |
| | | | | | | | | | |
| | | | | | | | | | |
| | | | | | | | | | |
| | | | | | | | | | |
| | | | | | | | | | |
| | | | | | | | | | |
| | | | | | | | | | |
| | | | | | | | | | |
| | | | | | | | | | |
| Three Months 2024: | | | | | | | | | | |
| Residential | $ | 297 | | | $ | 287 | | | $ | — | | | $ | — | | | $ | 584 | | |
| Commercial | 165 | | | 68 | | | — | | | — | | | 233 | | |
| Industrial | 45 | | | 4 | | | — | | | — | | | 49 | | |
| Other | (1) | | (a) | 32 | | | 131 | | | (28) | | | 134 | | |
Total revenues(b) | $ | 506 | | | $ | 391 | | | $ | 131 | | | $ | (28) | | | $ | 1,000 | | |
| Three Months 2023: | | | | | | | | | | |
| Residential | $ | 382 | | | $ | 296 | | | $ | — | | | $ | — | | | $ | 678 | | |
| Commercial | 200 | | | 77 | | | — | | | — | | | 277 | | |
| Industrial | 48 | | | 7 | | | — | | | — | | | 55 | | |
| Other | (6) | | (a) | 11 | | | 114 | | | (28) | | | 91 | | |
Total revenues(b) | $ | 624 | | | $ | 391 | | | $ | 114 | | | $ | (28) | | | $ | 1,101 | | |
(a)Includes over-recoveries of various riders.
(b)The following table presents increases/(decreases) in revenues from alternative revenue programs and other revenues not from contracts with customers for the Ameren Illinois segments for the three and nine months ended September 30, 2023March 31, 2024 and 2022:2023:
| | Ameren Illinois Electric Distribution | | | Ameren Illinois Electric Distribution | | Ameren Illinois Natural Gas | | Ameren Illinois Transmission | | Ameren Illinois |
| | | Ameren Illinois Electric Distribution | | Ameren Illinois Natural Gas | | Ameren Illinois Transmission | | Ameren Illinois |
| Three Months 2023: | |
| | Three Months 2024: | |
| | Three Months 2024: | |
| | Three Months 2024: | |
| Revenues from alternative revenue programs | |
| Revenues from alternative revenue programs | |
| Revenues from alternative revenue programs | Revenues from alternative revenue programs | $ | (94) | | | $ | (1) | | | $ | (6) | | | $ | (101) | |
| Other revenues not from contracts with customers | Other revenues not from contracts with customers | 2 | | | — | | | — | | | 2 | |
| | Three Months 2022: | |
| Three Months 2023: | |
| Three Months 2023: | |
| Three Months 2023: | |
| Revenues from alternative revenue programs | |
| Revenues from alternative revenue programs | |
| Revenues from alternative revenue programs | Revenues from alternative revenue programs | $ | (83) | | | $ | (3) | | | $ | (10) | | | $ | (96) | |
| Other revenues not from contracts with customers | Other revenues not from contracts with customers | 2 | | | — | | | — | | | 2 | |
| | Nine Months 2023: | |
| Revenues from alternative revenue programs | $ | 30 | | | $ | 36 | | | $ | 4 | | | $ | 70 | |
| Other revenues not from contracts with customers | 6 | | | 2 | | | — | | | 8 | |
| | Nine Months 2022: | |
| Revenues from alternative revenue programs | $ | 13 | | | $ | (5) | | | $ | (12) | | | $ | (4) | |
| Other revenues not from contracts with customers | 5 | | | 2 | | | — | | | 7 | |
|
ITEM 2. MANAGEMENT’S DISCUSSION AND ANALYSIS OF FINANCIAL CONDITION AND RESULTS OF OPERATIONS.
The following discussion should be read in conjunction with the financial statements contained in this Form 10-Q, as well as Management’s Discussion and Analysis of Financial Condition and Results of Operations and Risk Factors contained in the Form 10-K. We intend for this discussion to provide the reader with information that will assist in understanding our financial statements, the changes in certain key items in those financial statements, and the primary factors that accounted for those changes, as well as how certain accounting principles affect our financial statements. The discussion also provides information about the financial results of our business segments to provide a better understanding of how those segments and their results affect the financial condition and results of operations of Ameren as a whole. Also see the Glossary of Terms and Abbreviations at the front of this report and in the Form 10-K.
Ameren, headquartered in St. Louis, Missouri, is a public utility holding company whose primary assets are its equity interests in its subsidiaries. Ameren’s subsidiaries are separate, independent legal entities with separate businesses, assets, and liabilities. Dividends on Ameren’s common stock and the payment of expenses by Ameren depend on distributions made to it by its subsidiaries. Ameren’s principal subsidiaries are listed below. Ameren also has other subsidiaries that conduct other activities, such as providing shared services.
•Ameren Missouri operates a rate-regulated electric generation, transmission, and distribution business and a rate-regulated natural gas distribution business in Missouri.
•Ameren Illinois operates rate-regulated electric transmission, electric distribution, and natural gas distribution businesses in Illinois.
•ATXI operates a FERC rate-regulated electric transmission business in the MISO.
Ameren’s and Ameren Missouri’s financial statements are prepared on a consolidated basis and therefore include the accounts of their majority-owned subsidiaries. All intercompany transactions have been eliminated. Ameren Missouri’s subsidiaries were created for the acquisitionownership of renewable generation projects. Ameren Illinois has no subsidiaries. All tabular dollar amounts are in millions, unless otherwise indicated.
In addition to presenting results of operations and earnings amounts in total, we present certain information in cents per share. These amounts reflect factors that directly affect Ameren’s earnings. We believe this per share information helps readers to understand the impact of these factors on Ameren’s earnings per share.
OVERVIEW
Net income attributable to Ameren common shareholders in the three months ended September 30, 2023,March 31, 2024, was $493$261 million, or $1.87$0.98 per diluted share, compared with $452$264 million, or $1.74 per diluted share, in the year-ago period. Net income attributable to Ameren common shareholders in the nine months ended September 30, 2023, was $994 million, or $3.78 per diluted share, compared with $911 million, or $3.51$1.00 per diluted share, in the year-ago period. Net income for the three and nine months ended September 30, 2023,March 31, 2024, was favorablyunfavorably affected by increased rate base investments across all segments, a higher recognized ROE at Ameren Illinois Electric Distribution due to a higher estimated annual average of the monthly yields of the 30-year United States Treasury bonds, and increased base rate revenues at Ameren Missouri pursuant to the June 2023 MoPSC electric rate order. Earnings for the three and nine months ended September 30, 2023, were also favorably affected by decreased income tax expense not subject to formula rates or riders. Net income for the nine months ended September 30, 2023, were favorably affected by decreased other operations and maintenance expenses not subject to formula rates, riders, or trackers, including an increasea charge recorded by Ameren Missouri related to a change in the cash surrender valueestimated minimum cost of COLI.additional mitigation relief associated with NSR and Clean Air Act litigation applicable to the Rush Island Energy Center. Earnings for the three and nine months ended September 30, 2023,
March 31, 2024, were also unfavorably affected by decreased electric retail sales at Ameren Missouri,increased income tax expense, primarily due to milder spring and early summer temperatures as well as warmer winter temperaturesa decrease in the nine months ended September 30, 2023, compared with the same periods in 2022, as well as lower electric sales volumes and increased financing costs, primarily dueincome tax benefits at Ameren (parent) related to higher interest rates and balances, partially offset by higher levels of allowance for funds used during construction, in both periods. Earnings per share for the three and nine months ended September 30, 2023, were unfavorably affected bystock-based compensation; an increase in the weighted-average basic common shares outstanding.outstanding; and a lower recognized ROE at Ameren Illinois Electric Distribution. Net income for the three months ended March 31, 2024, was favorably affected by increased base rate revenues pursuant to the ICC's November 2023 natural gas rate order and increased base rate revenues pursuant to the MoPSC's June 2023 electric rate order, which increased earnings at Ameren Illinois Natural Gas and Ameren Missouri, respectively. Earnings for the three months ended March 31, 2024, were also favorably affected by increased rate base investments at Ameren Transmission.
Ameren’s strategicstrategic plan includesincludes investing in rate-regulated energy infrastructure, enhancing regulatory frameworks and advocating for responsible policies, and optimizing operating performance to capitalize on opportunities to benefit our customers, communities, shareholders, and the environment. Ameren remains focused on disciplined cost management and strategic capital allocation. Ameren invested $2.6$0.9 billion in its rate-regulated businesses in the ninethree months ended September 30, 2023.March 31, 2024.
In June 2023,March 2024, the MoPSC issued an order that resulted in an increase of $140 million to Ameren Missouri’s annual revenue requirement for electric retail service. The approved revenue requirement is based on infrastructure investments as of December 31, 2022,approving a nonunanimous stipulation and included an extension of the depreciable lives of the Sioux Energy Center’s assets from 2028 to 2030. The order did not explicitly specify an ROE, capital structure, or rate base. The order provides for the continued use of the FAC and trackers for pension and postretirement benefits, uncertain income tax positions, certain excess deferred income taxes, and renewable energy standard compliance costs that the MoPSC previously authorized in earlier electric rate orders, as well as the use of an electric property tax tracker. It also includes a tracker for the utilization of production and investment tax credits or proceeds from the sale of certain tax credits allowed under the IRA. The order increased the annualized base level of net energy costs pursuant to the FAC by approximately $40 million from the base level established in the MoPSC’s December 2021 electric rate order. The order also changed annualized depreciation, regulatory asset and liability amortization amounts, and the base level of expenses for trackers. On an annualized basis, these changes reflect approximate increases in “Depreciation and amortization” of $90 million and “Other income, net”, of $100 million,agreement related to non-service pension and postretirement benefit income, on Ameren’s and Ameren Missouri’s consolidated statements of income. The new rates became effective on July 9, 2023.
In June 2023, Ameren Missouri filedrequested CCNs for CCNs with the MoPSC for four solar generation facilities, including the Split Rail, Solar Project (300-MW facility, build-transfer agreement),Vandalia, and Bowling Green solar projects. The stipulation and agreement also requested approval of a CCN for the Cass County Solar Project, (150-MW facility, development-transfer agreement),conditioned upon full subscription of the Vandalia Solar Project (50-MW facility, self-build),project capacity under the Renewable Solutions Program, a commercial, industrial, and the Bowling Green Solar Project (50-MW facility, self-build). In October 2023, the MoPSC staff filed a recommendation that the MoPSC should not approve Ameren Missouri’s requests for CCNs for these solar projects, arguing Ameren Missouri did not adequately demonstrate the facilities are needed to continue providing service to customers.governmental customer program. Ameren Missouri expects decisions on the CCNsa decision by the MoPSC inon the first quarter of 2024. The Cass County Solar Project CCN once this project’s capacity under the Renewable Solutions Program is expected to be located in central Illinois and the other three projects are expected to be located in central Missouri. Each project is expected to support Ameren Missouri’s transition to renewable generation.fully subscribed. In February and April 2023, the MoPSC issued orders approving requested CCNs for the Huck Finn and Boomtown solar projects, respectively.
In August 2023, the MoPSC issued an order approving a nonunanimous stipulation and agreement to extend Ameren Missouri’s MEEIA 2019 program for an additional year through 2024. For theFebruary 2024, program year, the order approved the establishment of a portfolio of customer energy-efficiency programs and performance incentives that will provide Ameren Missouri an opportunity to earn revenues, including $12 million if Ameren Missouri achieves certain program spending goals. In 2024, Ameren Missouri expects to invest $76 million in energy-efficiency programs.
In February 2023, Ameren Missouri filed an update to its Smart Energy Plan with the MoPSC, which includes a five-year capital investment overview with a detailed one-year plan for 2023.2024. The plan is designed to upgrade Ameren Missouri’s electric infrastructure and includes investments that will upgrade the grid and accommodate more renewable energy. Investments under the plan are expected to total approximately $9.9$12.4 billion over the five-year period from 20232024 through 2027,2028, with expenditures largely recoverable under the PISA and the RESRAM.PISA. Ameren Missouri’s Smart Energy Plan excludes investments in its natural gas distribution business, as well as removal costs, net of salvage.
In January 2024, Ameren Missouri filed a proposed customer energy-efficiency plan with the MoPSC under the MEEIA. This filing proposed a three-year plan, which includes a portfolio of customer energy-efficiency programs, along with the continued use of the MEEIA rider, which allows Ameren Missouri to collect from, or refund to, customers any difference in actual MEEIA program costs and related lost electric revenues and the amounts collected from customers. If the plan is approved, Ameren Missouri intends to invest $123 million annually in the proposed customer energy-efficiency programs from 2025 to 2027. In addition, Ameren Missouri requested performance incentives applicable to each plan year to earn revenues by achieving certain customer energy-efficiency savings and target spending goals. If 100% of the goals are achieved, Ameren Missouri would earn performance incentive revenues totaling $56 million over the three-year plan. Ameren Missouri also requested additional performance incentives applicable to each plan year totaling up to $14 million over the three-year plan, if Ameren Missouri exceeds 100% of the goals. Ameren Missouri expects a decision by the MoPSC by October 2024, but cannot predict the ultimate outcome of this regulatory proceeding.
In November 2023, Ameren Missouri petitioned the MoPSC for a financing order to authorize the issuance of securitized utility tariff bonds to finance $519 million of costs related to the planned accelerated retirement of the Rush Island Energy Center, which includes the expected remaining unrecovered net plant balance associated with the facility, among other costs. Ameren Missouri requested to collect the amounts necessary to repay the bonds over approximately 15 years from the date of bond issuance. In March 2024, the MoPSC staff filed an updated response to Ameren Missouri’s petition that stated Ameren Missouri’s decision to accelerate the retirement of the Rush Island Energy Center was prudent and recommended that $497 million of costs be financed through securitized utility tariff bonds. However, the MoPSC staff claimed Ameren Missouri’s prior actions that resulted in the adverse ruling in the NSR and Clean Air Act Litigation discussed in Note 9 – Commitments and Contingencies under Part I, Item 1, of this report, were imprudent and recommended that the impact of those actions on customers be considered in future regulatory proceedings. In February 2024, the MoOPC filed a response to Ameren Missouri’s petition that opposes the issuance of securitized utility tariff bonds. If Ameren Missouri is not allowed to recover Rush Island Energy Center costs through securitization or if future regulatory proceedings result in revenue reductions based on Ameren Missouri’s prior actions that resulted in the adverse ruling in the NSR and Clean Air Act litigation, it could have a material adverse effect on the results of operations, financial position, and liquidity of Ameren and Ameren Missouri. Ameren Missouri expects a decision by the MoPSC by the end of June 2024, but cannot predict the ultimate outcome of this regulatory proceeding.
In September 2023, the United States District Court for the Eastern District of Missouri granted Ameren Missouri’s request to modify a September 2019 remedy order issued by the district court in order to allow the retirement of the Rush Island Energy Center in advance of its previously expected retirement date of 2039, in lieu of installing a flue gas desulfurization system. In its amended remedy order, the district court established an October 15, 2024 retirement date to allow for the completion of various transmission reliability projects and, in the interim, authorized Ameren Missouri to operate the energy center only as needed and as directed by the MISO. The United States Department of Justice is seeking an order from the district court providing for additional mitigation relief related to prior emissions. Ameren Missouri contends that the retirement of the Rush Island Energy Center, which eliminates all future emissions from the energy center, mitigates claims relating to prior emissions. In March 2024, the district court ordered Ameren Missouri and the United States Department of Justice to file proposed draft orders outlining additional mitigation relief. In May 2024, Ameren Missouri filed a proposed draft order that includes retiring the Rush Island Energy Center, a program to provide electric buses and charging stations to schools in the metro St. Louis area, a program to provide air filters to eligible Ameren Missouri electric residential customers, and the retirement of SO2 allowances. Excluding the accelerated retirement of the Rush Island Energy Center, these programs are estimated to cost approximately $20 million. Also in May 2024, the United States Department of Justice filed a proposed draft order that includes a program to provide electric buses and charging stations to schools in the metro St. Louis area and a program to provide air filters to eligible Ameren Missouri electric residential customers. These programs include a significantly greater number of buses, charging stations, and air filters than Ameren Missouri’s proposal and the United States Department of Justice estimates these programs would cost approximately $120 million. As of March 31, 2024, Ameren and Ameren Missouri recorded a $20 million liability related to the cost of potential additional mitigation, which represents the estimated minimum liability, as no other amount within the range was a better estimate. The district court is expected to hold a hearing in mid-2024 and an order is expected in the second half of 2024. Depending on the scope and basis of the order, Ameren Missouri or the United States Department of Justice could appeal any additional mitigation relief ordered.
In April 2024, Ameren Illinois filed for a revised reconciliation adjustment to its 20222023 electric distribution service revenue requirement with the ICC, requesting recovery of $117$160 million. The reconciliation adjustment reflects a capital structure composed of 50% common equity and Ameren Illinois’ actual 20222023 recoverable costs and year-end rate base, and capital structure, which was composed of 52% common equity.base. An ICC decision in this proceeding is required by December 2023,2024, and any approved adjustment would be collected from customers in 2024.2025. This is the final revenue requirement reconciliation under the IEIMA formula framework.
In OctoberDecember 2023, the ICC issued an order in Ameren Illinois' MYRP proceeding approving base rates for electric distribution services for 2024 through 2027 and rejecting Ameren Illinois' Grid Plan, which was addressed as part of the MYRP proceeding. Rate changes consistent with the order became effective in January 2024. The December 2023 order adopted an alternative methodology to establish a rate base and revenue requirements for the years 2024 through 2027 using Ameren Illinois’ previously approved 2022 year-end rate base. The 2022 year-end rate base will remain in effect through 2027 unless subsequently changed by the ICC in the rehearing discussed below or if approval of a revised Grid Plan results in an update of each year’s revenue requirement. Pursuant to the order, in March 2024, Ameren Illinois filed a revised requestGrid Plan and a revised MYRP to update the requested revenue requirements for 2024 through 2027. An ICC decision on the revised Grid Plan and updated revenue requirements is expected by December 2024 with rates effective in January 2025.
In January 2024, the ICC seeking approvalpartially denied a rehearing requested by Ameren Illinois to revise the allowed ROE in the December 2023 order and granted Ameren Illinois’ rehearing request to consider whether it is appropriate to use the 2022 year-end rate base for each year of the MYRP and to include a base level of investments to maintain grid reliability in each year of the MYRP. Additionally, the scope of the rehearing includes a review of certain operations and maintenance expenses in each year of the MYRP. In February 2024, Ameren Illinois filed its request in the rehearing proceeding, and subsequently updated the request in April 2024, proposing an updated 2024 revenue requirement of $1,213 million, which is based on a $4.2 billion rate base, a capital structure composed of 50% common equity, and an allowed ROE of 8.72%. In April 2024, the ICC staff filed its recommendation in the rehearing proceeding. The ICC staff recommended a 2024 revenue requirement of $1,195 million, which is based on a $4.0 billion rate base, a capital structure composed of 50% common equity, and an allowed ROE of 8.72%. An ICC decision in the rehearing proceeding is expected by late June 2024, with new rates effective July 2024. Also, in January 2024, Ameren Illinois filed an appeal of the December 2023 ICC order and the partial denial of Ameren Illinois’ request for rehearing, including the 8.72% ROE, to the Illinois Appellate Court for the Fifth Judicial District. The court is under no deadline to address the appeal. Ameren Illinois cannot predict the ultimate outcome of the revised Grid Plan filing, its request to update the associated MYRP revenue requirements for 2024 through 2027, the rehearing proceeding, or the appeal to the Illinois Appellate Court for the Fifth Judicial District.
In November 2023, the ICC issued an order in Ameren Illinois’ January 2023 natural gas delivery service regulatory rate review, which resulted in an increase to its annual revenues for natural gas delivery service by $140of $112 million which includes an estimated $77 million of annual revenues that would otherwise be recovered under riders. The revised request is based on a 10.2%9.44% allowed ROE, a capital structure composed of 50% common equity, and a rate base of approximately $2.85 billion. The order reflected a reduction of approximately $93 million of planned distribution and transmission capital investments included in Ameren Illinois’ requested revenue increase, which used a 2024 future test year. The new rates became effective on November 28, 2023. In December 2023, Ameren Illinois filed a request for rehearing of the ICC’s November 2023 order. The filing requested the ICC revise the order to include an allowed ROE of at least 9.89%, a capital structure composed of 52% common equity, and a rate basethe reversal of $2.9 billion.the approximately $93 million reduction of planned distribution and transmission capital investments included in the order, among other things. In an attempt to reduce regulatory lag, Ameren Illinois used aJanuary 2024, future test year in this proceeding. A decision by the ICC in this proceeding is required by late November 2023, with new rates expected to be effective by early December 2023.
In September 2023,denied Ameren Illinois filed a revised MYRP with the ICC to be used in setting electric distribution service rates for 2024 through 2027. Under the MYRP, the ICC would approve base rates for electric distribution service to be charged to customers for eachIllinois’ rehearing
calendar yearrequest. Subsequently, in January 2024, Ameren Illinois filed an appeal of the four-year period. The following table includes the forecasted revenue requirement, the ROE, the capital structure common equity percentage,November 2023 ICC order and the forecasted average annual rate base forJanuary 2024 through 2027, as reflected inICC denial of Ameren Illinois’ revised MYRP filing:request for rehearing to the Illinois Appellate Court for the Fifth Judicial District. The court is under no deadline to address the appeal. Ameren Illinois cannot predict the ultimate outcome of this appeal.
| | | | | | | | | | | | | | |
| Year | Forecasted Revenue Requirement (in millions)(a) | Requested ROE(b) | Requested Capital Structure Common Equity Percentage(b)(c) | Forecasted Average Annual Rate Base (in billions) |
| 2024 | $1,289 | 10.5% | 53.99% | $4.3 |
| 2025 | $1,385 | 10.5% | 53.97% | $4.6 |
| 2026 | $1,480 | 10.5% | 54.02% | $4.9 |
| 2027 | $1,556 | 10.5% | 54.03% | $5.2 |
(a)IfIn 2021, the MISO issued a report outlining a preliminary long-range transmission planning roadmap of projects through 2039, which considers the rapidly changing generation mix within MISO resulting from significant additions of renewable generation, actual and expected generation plant closures, and state mandates or goals for clean energy or carbon emissions reductions. In July 2022, the MISO approved the first tranche of projects under the roadmap. A portion of these projects were assigned to various utilities, of which Ameren was awarded projects that are estimated to cost approximately $1.8 billion, based on the MISO’s cost estimate. Related to these projects, Ameren began substation upgrades in May 2024 in advance of transmission line construction, which is expected to begin in 2026, with forecasted completion dates near the end of this decade. In 2022 and 2023, the MISO initiated requests for proposals for first tranche competitive bid projects. In October and November 2023, two first tranche competitive bid projects were awarded to ATXI and represent a total estimated investment of approximately $0.1 billion. In April 2024, the remaining first tranche competitive-bid project was awarded to ATXI and represents an initial rate increase phase-in provision,estimated investment of approximately $0.3 billion. ATXI will own 51% of the assets associated with the projects awarded in October 2023 and April 2024, and the remaining 49% of the assets will be owned by an unaffiliated entity. In February 2024, Ameren Illinois and ATXI filed a request for a CCN, among other things, with the ICC related to the portion of the MISO long-range transmission projects discussed below, is approvedabove that will be constructed within the ICC’s jurisdiction. A decision by the ICC it would not affectis expected by mid-2025. In March 2024, the annual revenue requirement, but would affectMISO preliminarily identified a second tranche of projects with estimated costs of $17 billion to $23 billion based on MISO’s cost estimate. The MISO is expected to approve the timingsecond tranche of associated recovery from customers.
(b)In November 2023, Ameren Illinois updated its requested ROE and capital structure common equity percentage to 9.85% and 52% for all years, respectively.
(c)A capital structure of up to and including 50% common equity is deemed prudent and reasonable by law. A higher equity ratio requires specific ICC approval.
Under an MYRP, the IETL permits any initial rate increase to be phased in, with at least 50% of the first annual period’s approved rate increase reflected in ratesprojects in the first annual period, with the remaining portion deferred as a regulatory asset that earns a return at the applicable WACC and is collected from customers over a period not to exceed two years beginning within one year after the second annual period’s rates are effective. Ameren Illinois’ revised MYRP filing utilizes this phase-in provision and proposes to defer 50%third quarter of the requested 2024 rate increase of $177 million as a regulatory asset to be collected from customers in 2026. An ICC decision in this proceeding is required by December 2023, with new rates effective starting in January 2024.
In May 2023, Ameren Illinois filed its annual electric energy-efficiency formula rate update to increase its rates by $27 million with the ICC. An ICC decision in this proceeding is required by December 2023, with new rates effective January 2024.
For further information on the matters discussed above, see Note 2 – Rate and Regulatory Matters under Part I, Item I,1, of this report, and the Outlook section below.
RESULTS OF OPERATIONS
Our results of operations and financial position are affected by many factors. Economic conditions, energy-efficiency investments by our customers and by us, technological advances, distributed generation, and the actions of key customers can significantly affect the demand for our services. Ameren and Ameren Missouri results are also affected by seasonal fluctuations in winter heating and summer cooling demands and by weather conditions, such as storms, as well as by energy center maintenance outages. Additionally, fluctuations in interest rates and conditions in the capital and credit markets affect our cost of borrowing, our pension and postretirement benefits costs, the cash surrender value of COLI, and the asset value of Ameren Missouri’s nuclear decommissioning trust fund. Almost all of Ameren’s revenues are subject to state or federal regulation. This regulation has a material impact on the rates we charge customers for our services. Our results of operations, financial position, and liquidity are affected by our ability to align our overall spending, both operating and capital, with the frameworks established by our regulators. See Note 2 – Rate and Regulatory Matters under Part I, Item 1, of this report and Note 2 – Rate and Regulatory Matters under Part II, Item 8, of the Form 10-K for additional information regarding Ameren Missouri’s, Ameren Illinois’, and ATXI’s regulatory mechanisms.
We are observing inflationary pressures on the prices of labor, services, materials, and supplies, as well as increasinghigh interest rates. Ameren Missouri and Ameren Illinois are generally allowed to pass on to customers prudently incurred costs for fuel, purchased power, and natural gas supply. Additionally, for certain non-commodity cost changes, the use of trackers, riders, formula ratemaking, and future test years, as applicable, mitigates our exposure.
Ameren Missouri principally uses coal and enriched uranium for fuel in its electric operations and purchases natural gas for its customers. Ameren Illinois purchases power and natural gas for its customers. The prices for these commodities can fluctuate significantly because of the global economic and political environment, weather, supply, demand, and many other factors. We have natural gas cost recovery mechanisms for our Illinois and Missouri natural gas distribution businesses, a purchased power cost recovery mechanism for Ameren Illinois’ electric distribution business, and a FAC for Ameren Missouri’s electric business.
We employ various risk management strategies to reduce our exposure to commodity risk and other risks inherent in our business. The reliability of Ameren Missouri’s energy centers and our transmission and distribution systems, and the level and timing of operations and maintenance costs and capital investment, are key factors that we seek to manage in order to optimize our results of operations, financial position, and liquidity.
Earnings Summary
The following table presents a summary of Ameren’s earnings for the three and nine months ended September 30, 2023March 31, 2024 and 2022:2023:
| | Three Months | | Nine Months |
| 2023 | | 2022 | | 2023 | | 2022 |
| | | Three Months | |
| | | Three Months | |
| | | Three Months | |
| | | | | 2024 | | | | | | | 2024 | | 2023 |
| Net income attributable to Ameren common shareholders | Net income attributable to Ameren common shareholders | $ | 493 | | | $ | 452 | | | $ | 994 | | | $ | 911 | |
| Earnings per common share – diluted | Earnings per common share – diluted | 1.87 | | | 1.74 | | | 3.78 | | | 3.51 | |
Net income attributable to Ameren common shareholders increased $41decreased $3 million, or 132 cents per diluted share, in the three months ended September 30, 2023,March 31, 2024, compared with the year-ago period, primarilyperiod. The decrease was due to net income increasesdecreases of $15 million, $14 million, $8 million, $5 million, at Ameren Illinois Electric Distribution, Ameren Missouri, Ameren Transmission, and $3 million as activity not reported as part of a segment, primarily at Ameren (parent), respectively.
Net income attributable to Ameren common shareholders increased $83 million, or 27 cents per diluted share, in the nine months ended September 30, 2023, compared with the year-ago period. The increase was due toIllinois Electric Distribution, and Ameren Missouri, respectively. These decreases were partially offset by net income increases of $42 million, $30 million, $11$19 million and $6$1 million at Ameren Illinois Electric Distribution, Ameren Transmission, Ameren Illinois Natural Gas and activity not reported as part of a segment, primarily at Ameren (parent), respectively, partially offset by a $6 million net income decrease at Ameren Missouri.Transmission, respectively.
Earnings per diluted share were favorablyunfavorably affected in the three and nine months ended September 30, 2023,March 31, 2024, compared to the year-ago periods (except where a specific period, is referenced), by:
•increased rate base investments ata charge recorded by Ameren TransmissionMissouri, included in other operation and Ameren Illinois Electric Distributionmaintenance expenses, related to an increase in the estimated minimum cost of additional mitigation relief associated with NSR and a higher recognized ROE dueClean Air Act litigation applicable to a higher estimated annual averagethe Rush Island Energy Center, see Note 9 - Commitments and Contingencies under Part 1, Item 1, of the monthly yields of the 30-year United States Treasury bonds at Ameren Illinois Electric Distribution, which increased revenues at these segments (7 cents and 19this report for more information (4 cents per share, respectively)share);
•decreasedincreased income tax expense not subject to formula rates or riders, primarily due to a decrease in income tax benefits at Ameren (parent) related to stock-based compensation (4 cents per share);
•increased other operations and maintenance expenses not subject to formula rates, riders, or trackers, includingprimarily at Ameren Missouri, excluding a charge related to an increase in the cash surrender valueestimated minimum cost of COLI, primarily at Ameren Missouri and Ameren Illinois Natural Gas (12 cents per share for the nine months ended September 30, 2023);
•increased base rate revenues at Ameren Missouri effective July 9, 2023, pursuant to the June 2023 MoPSC electric rate order, partially offset by the amortization of previously deferred depreciation expense under the PISA and RESRAM, financing costs otherwise recoverable under the PISA and RESRAM, a lower base level of expenses, and the net recovery for amounts associated with the reduction in sales volumes resulting from MEEIA programs (10 cents per share for both periods);
•decreased income tax expense not subject to formula rates or riders due, in part, to decreased income tax expense recognized at Ameren (parent) because of changes in the state income taxes apportioned to Missouri and Illinois, reflecting changes in revenues, as well as the effect of favorable market returns on COLI, compared with unfavorable returns in the year-ago periods (5 cents and 7 cents per share, respectively);
•increased base rate revenues at Ameren Missouri for the inclusion of previously deferred interest charges pursuant to the December 2021 and June 2023 MoPSC electric rate orders effective February 28, 2022, and July 9, 2023, respectively, partially offset by increased interest charges resulting from lower deferrals related to infrastructure investments associated with the PISA and RESRAM (1 cent and 5 cents per share, respectively);
•decreased taxes other than income taxes, primarily at Ameren Missouri, largely resulting from employee retention tax credits received under the Coronavirus Aid, Relief, and Economic Security Act in the nine months ended September 30, 2023additional mitigation relief discussed above (3 cents per share for the nine months ended September 30, 2023);
•increased Ameren Illinois Natural Gas earnings from investments in qualifying infrastructure recovered under the QIP (1 cent and 2 cents per share, respectively);
•increased other income, net, largely due to increased non-service cost components of net periodic benefit income not subject to formula rates or trackers (2 cents per share for the nine months ended September 30, 2023); and
•recovery of previously incurred expenses at Ameren Illinois Electric Distribution (2 cents per share for the nine months ended September 30, 2023).
Earnings per diluted share were unfavorably affected in the three and nine months ended September 30, 2023, compared to the year-ago periods, by:
•decreased electric retail sales at Ameren Missouri, primarily due milder spring and early summer temperatures as well as warmer winter temperatures in the nine months ended September 30, 2023, compared with the same periods in 2022, and lower electric sales volumes in both periods (estimated at 1 cent and 17 cents per share, respectively)share);
•increased financing costs at Ameren (parent), Ameren Missouri and Ameren Illinois Natural Gas, primarily due to higher interest rates on increased levels of short-term borrowings at Ameren (parent), and higher long-termlong term debt balances and higher interest rates on short-(3 cents per share);
term borrowings and long-term debt, partially offset by higher levels of allowance for funds used during construction,lower revenue at Ameren Missouri and Ameren Illinois Natural Gas (3 cents and 10Electric Distribution due to a lower recognized ROE under the MYRP (2 cents per share, respectively)share);
•increased weighted-average basic common shares outstanding resulting from issuances of common shares as detailed in Note 4 – Long-term Debt and Equity Financings under Part I, Item 1, of this report, and Note 5 – Long-term Debt and Equity Financings under Part II, Item 8, of the Form 10-K (3 cents and 6(2 cents per share); and
•increased taxes other than income taxes, primarily at Ameren Missouri, largely resulting from the absence in 2024 of employee retention tax credits received under the Coronavirus Aid, Relief, and Economic Security Act (1 cent per share).
Earnings per diluted share respectively)were favorably affected in the three months ended March 31, 2024, compared to the year-ago period, by:
•increased base rate revenues at Ameren Illinois Natural Gas effective November 28, 2023, pursuant to the November 2023 ICC natural gas rate order, partially offset by increased depreciation and amortization expenses included in base rates (4 cents per share);
•increased depreciation and amortization expenses not recoverable under riders or trackersbase rate revenues at Ameren Missouri effective July 9, 2023, pursuant to the June 2023 MoPSC electric rate order, partially offset by the net effect of amortization of previously deferred depreciation expense under the PISA and Ameren Illinois Natural Gas, primarily due to additional property, plant,RESRAM, financing costs otherwise recoverable under the PISA and equipment investments (2 centsRESRAM, a lower base level of expenses included in trackers, and 4the net recovery for amounts associated with the reduction in sales volumes resulting from MEEIA programs (4 cents per share, respectively)share); and
•increased allowance for equity funds used during construction and increased base rate revenues for the inclusion of previously deferred PISA and RESRAM interest charges pursuant to the June 2023 MoPSC electric rate order effective July 9, 2023, partially offset by increased interest charges resulting from lower MEEIA 2019 performance incentives recognizeddeferrals related to infrastructure investments associated with the PISA and RESRAM, both at Ameren Missouri (3 cents per shareshare);
•a change in rate design at Ameren Illinois Natural Gas pursuant to the November 2023 ICC natural gas rate order that concentrates more revenues in the winter heating season due to an increase in volumetric rates, which increased earnings for both periods)the three months ended March 31, 2024, but is not expected to materially impact full year results (3 cents per share);
•increased rate base investments at Ameren Transmission, which increased earnings in this segment (3 cents per share); and
•increased retail electric sales volumes at Ameren Missouri, excluding the estimated effects of weather and customer energy-efficiency programs, partially offset by lower sales volumes due to milder winter temperatures in 2024 (estimated at 2 cents per share).
The cents per share variances above are presented based on the weighted-average basic common shares outstanding in the three and nine months ended September 30, 2022,March 31, 2023, and do not reflect the impact of dilution on earnings per share, unless otherwise noted. The amounts above other than variances related to income taxes have been presented net of income taxes using Ameren’s 20232024 blended federal and state statutory tax rate of 26%. For additional details regarding the Ameren Companies’ results of operations, including explanations of Operating Revenues for both Electric Revenues and Natural Gas Margins;Revenues; Fuel and Purchased Power Expenses; Other Operations and Maintenance Expenses; Depreciation and Amortization Expenses; Taxes Other Than Income Taxes; Other Income, Net; Interest Charges; and Income Taxes, see the major headings below.
Below is Ameren’s table of income statement components by segment for the three and nine months ended September 30, 2023March 31, 2024 and 2022:2023:
| | Ameren
Missouri | | | Ameren
Missouri | | Ameren
Illinois
Electric
Distribution | | Ameren
Illinois
Natural Gas | | Ameren Transmission | | Other /
Intersegment
Eliminations | | Ameren |
| | | Ameren
Missouri | | Ameren
Illinois
Electric
Distribution | | Ameren
Illinois
Natural Gas | | Ameren Transmission | | Other /
Intersegment
Eliminations | | Ameren |
| Three Months 2023: | |
| | Three Months 2024: | |
| | Three Months 2024: | |
| | Three Months 2024: | |
| Electric revenues | Electric revenues | $ | 1,219 | | | $ | 558 | | | $ | — | | | $ | 188 | | | $ | (44) | | | $ | 1,921 | |
| Fuel | (158) | | | — | | | — | | | — | | | — | | | (158) | |
| Purchased power | (75) | | | (233) | | | — | | | — | | | 36 | | | (272) | |
| Electric margins | 986 | | | 325 | | | — | | | 188 | | | (8) | | | 1,491 | |
| Electric revenues | |
| Electric revenues | |
| Natural gas revenues | Natural gas revenues | 18 | | | — | | | 122 | | | — | | | (1) | | | 139 | |
| Fuel and purchased power | |
| Natural gas purchased for resale | Natural gas purchased for resale | (4) | | | — | | | (26) | | | — | | | — | | | (30) | |
| Natural gas margins | 14 | | | — | | | 96 | | | — | | | (1) | | | 109 | |
| Other operations and maintenance expenses | Other operations and maintenance expenses | (256) | | | (132) | | | (56) | | | (15) | | | (11) | | | (470) | |
| Depreciation and amortization expenses | Depreciation and amortization expenses | (217) | | | (89) | | | (26) | | | (34) | | | (3) | | | (369) | |
| Taxes other than income taxes | Taxes other than income taxes | (108) | | | (21) | | | (12) | | | (2) | | | (4) | | | (147) | |
| Operating income (loss) | Operating income (loss) | 419 | | | 83 | | | 2 | | | 137 | | | (27) | | | 614 | |
| Other income, net | Other income, net | 44 | | | 24 | | | 8 | | | 7 | | | 18 | | | 101 | |
| Interest charges | Interest charges | (63) | | | (23) | | | (15) | | | (25) | | | (26) | | | (152) | |
| Income (taxes) benefit | Income (taxes) benefit | 12 | | | (18) | | | — | | | (33) | | | (30) | | | (69) | |
| Net income (loss) | 412 | | | 66 | | | (5) | | | 86 | | | (65) | | | 494 | |
| Net income | |
Noncontrolling interests – preferred stock dividends | Noncontrolling interests – preferred stock dividends | (1) | | | — | | | — | | | — | | | — | | | (1) | |
| Net income (loss) attributable to Ameren common shareholders | $ | 411 | | | $ | 66 | | | $ | (5) | | | $ | 86 | | | $ | (65) | | | $ | 493 | |
| Three Months 2022: | |
| Net income attributable to Ameren common shareholders | |
| Three Months 2023: | |
| Electric revenues | Electric revenues | $ | 1,338 | | | $ | 672 | | | $ | — | | | $ | 169 | | | $ | (39) | | | $ | 2,140 | |
| Fuel | (117) | | | — | | | — | | | — | | | — | | | (117) | |
| Purchased power | (247) | | | (350) | | | — | | | — | | | 34 | | | (563) | |
| Electric margins | 974 | | | 322 | | | — | | | 169 | | | (5) | | | 1,460 | |
| Electric revenues | |
| Electric revenues | |
| Natural gas revenues | Natural gas revenues | 21 | | | — | | | 146 | | | — | | | (1) | | | 166 | |
| Fuel and purchased power | |
| Natural gas purchased for resale | Natural gas purchased for resale | (7) | | | — | | | (51) | | | — | | | — | | | (58) | |
| Natural gas margins | 14 | | | — | | | 95 | | | — | | | (1) | | | 108 | |
| Other operations and maintenance expenses | Other operations and maintenance expenses | (252) | | | (145) | | | (59) | | | (14) | | | (5) | | | (475) | |
| Depreciation and amortization expenses | Depreciation and amortization expenses | (208) | | | (84) | | | (24) | | | (31) | | | (3) | | | (350) | |
| Taxes other than income taxes | Taxes other than income taxes | (106) | | | (21) | | | (12) | | | (3) | | | (2) | | | (144) | |
| Operating income (loss) | Operating income (loss) | 422 | | | 72 | | | — | | | 121 | | | (16) | | | 599 | |
| Other income, net | Other income, net | 25 | | | 15 | | | 6 | | | 5 | | | 7 | | | 58 | |
| Interest charges | Interest charges | (58) | | | (19) | | | (10) | | | (21) | | | (18) | | | (126) | |
| Income (taxes) benefit | Income (taxes) benefit | 9 | | | (17) | | | — | | | (27) | | | (43) | | | (78) | |
| Net income (loss) | 398 | | | 51 | | | (4) | | | 78 | | | (70) | | | 453 | |
| Net income | |
Noncontrolling interests – preferred stock dividends | Noncontrolling interests – preferred stock dividends | (1) | | | — | | | — | | | — | | | — | | | (1) | |
| Net income (loss) attributable to Ameren common shareholders | $ | 397 | | | $ | 51 | | | $ | (4) | | | $ | 78 | | | $ | (70) | | | $ | 452 | |
| Net income attributable to Ameren common shareholders | |
| | | | | | | | | | | | | | | | | | | | | | | | | | | | | | | | | | | |
| Ameren
Missouri | | Ameren
Illinois
Electric
Distribution | | Ameren
Illinois
Natural Gas | | Ameren Transmission | | Other /
Intersegment
Eliminations | | Ameren |
| Nine Months 2023: | | | | | | | | | | | |
| Electric revenues | $ | 2,978 | | | $ | 1,722 | | | $ | — | | | $ | 512 | | | $ | (116) | | | $ | 5,096 | |
| Fuel | (423) | | | — | | | — | | | — | | | — | | | (423) | |
| Purchased power | (420) | | | (766) | | | — | | | — | | | 91 | | | (1,095) | |
| Electric margins | 2,135 | | | 956 | | | — | | | 512 | | | (25) | | | 3,578 | |
| Natural gas revenues | 123 | | | — | | | 665 | | | — | | | (2) | | | 786 | |
| Natural gas purchased for resale | (60) | | | — | | | (220) | | | — | | | — | | | (280) | |
| Natural gas margins | 63 | | | — | | | 445 | | | — | | | (2) | | | 506 | |
| Other operations and maintenance expenses | (732) | | | (394) | | | (173) | | | (44) | | | (25) | | | (1,368) | |
| Depreciation and amortization expenses | (579) | | | (260) | | | (79) | | | (101) | | | (5) | | | (1,024) | |
| Taxes other than income taxes | (276) | | | (57) | | | (48) | | | (6) | | | (11) | | | (398) | |
| Operating income (loss) | 611 | | | 245 | | | 145 | | | 361 | | | (68) | | | 1,294 | |
| Other income, net | 85 | | | 74 | | | 24 | | | 21 | | | 57 | | | 261 | |
| Interest charges | (166) | | | (66) | | | (41) | | | (70) | | | (70) | | | (413) | |
| Income (taxes) benefit | 14 | | | (59) | | | (35) | | | (83) | | | 19 | | | (144) | |
| Net income (loss) | 544 | | | 194 | | | 93 | | | 229 | | | (62) | | | 998 | |
Noncontrolling interests – preferred stock dividends | (3) | | | (1) | | | — | | | — | | | — | | | (4) | |
| Net income (loss) attributable to Ameren common shareholders | $ | 541 | | | $ | 193 | | | $ | 93 | | | $ | 229 | | | $ | (62) | | | $ | 994 | |
| Nine Months 2022: | | | | | | | | | | | |
| Electric revenues | $ | 2,966 | | | $ | 1,641 | | | $ | — | | | $ | 465 | | | $ | (101) | | | $ | 4,971 | |
| Fuel | (376) | | | — | | | — | | | — | | | — | | | (376) | |
| Purchased power | (458) | | | (683) | | | — | | | — | | | 83 | | | (1,058) | |
| Electric margins | 2,132 | | | 958 | | | — | | | 465 | | | (18) | | | 3,537 | |
| Natural gas revenues | 130 | | | — | | | 811 | | | — | | | (1) | | | 940 | |
| Natural gas purchased for resale | (65) | | | — | | | (366) | | | — | | | — | | | (431) | |
| Natural gas margins | 65 | | | — | | | 445 | | | — | | | (1) | | | 509 | |
| Other operations and maintenance expenses | (744) | | | (440) | | | (185) | | | (46) | | | (12) | | | (1,427) | |
| Depreciation and amortization expenses | (550) | | | (247) | | | (72) | | | (91) | | | (5) | | | (965) | |
| Taxes other than income taxes | (281) | | | (60) | | | (59) | | | (7) | | | (8) | | | (415) | |
| Operating income (loss) | 622 | | | 211 | | | 129 | | | 321 | | | (44) | | | 1,239 | |
| Other income, net | 72 | | | 46 | | | 16 | | | 12 | | | 34 | | | 180 | |
| Interest charges | (157) | | | (55) | | | (32) | | | (63) | | | (49) | | | (356) | |
| Income (taxes) benefit | 13 | | | (50) | | | (31) | | | (71) | | | (9) | | | (148) | |
| Net income (loss) | 550 | | | 152 | | | 82 | | | 199 | | | (68) | | | 915 | |
Noncontrolling interests – preferred stock dividends | (3) | | | (1) | | | — | | | — | | | — | | | (4) | |
| Net income (loss) attributable to Ameren common shareholders | $ | 547 | | | $ | 151 | | | $ | 82 | | | $ | 199 | | | $ | (68) | | | $ | 911 | |
Below is Ameren Illinois’ table of income statement components by segment for the three and nine months ended September 30, 2023March 31, 2024 and 2022:2023:
| | Ameren
Illinois
Electric
Distribution | | | Ameren
Illinois
Electric
Distribution | | Ameren
Illinois
Natural Gas | | Ameren
Illinois Transmission | | Other /
Intersegment
Eliminations | | Ameren Illinois |
| | | Ameren
Illinois
Electric
Distribution | | Ameren
Illinois
Natural Gas | | Ameren
Illinois Transmission | | Other /
Intersegment
Eliminations | | Ameren Illinois |
| Three Months 2023: | |
| | Three Months 2024: | |
| | Three Months 2024: | |
| | Three Months 2024: | |
| Electric revenues | Electric revenues | $ | 558 | | | $ | — | | | $ | 136 | | | $ | (33) | | | 661 | |
| Electric revenues | |
| Electric revenues | |
| Natural gas revenues | |
| Purchased power | Purchased power | (233) | | | — | | | — | | | 33 | | | (200) | |
| Electric margins | 325 | | | — | | | 136 | | | — | | | 461 | |
| Natural gas revenues | — | | | 122 | | | — | | | — | | | 122 | |
| Natural gas purchased for resale | Natural gas purchased for resale | — | | | (26) | | | — | | | — | | | (26) | |
| Natural gas margins | — | | | 96 | | | — | | | — | | | 96 | |
| Other operations and maintenance expenses | Other operations and maintenance expenses | (132) | | | (56) | | | (12) | | | — | | | (200) | |
| Depreciation and amortization expenses | Depreciation and amortization expenses | (89) | | | (26) | | | (24) | | | — | | | (139) | |
| Taxes other than income taxes | Taxes other than income taxes | (21) | | | (12) | | | (1) | | | — | | | (34) | |
| Operating income | Operating income | 83 | | | 2 | | | 99 | | | — | | | 184 | |
| Other income, net | Other income, net | 24 | | | 8 | | | 5 | | | — | | | 37 | |
| Interest charges | Interest charges | (23) | | | (15) | | | (16) | | | — | | | (54) | |
| Income (taxes) benefit | (18) | | | — | | | (24) | | | — | | | (42) | |
| Income taxes | |
| | Net income (loss) attributable to Ameren common shareholders | $ | 66 | | | $ | (5) | | | $ | 64 | | | $ | — | | | $ | 125 | |
| Three Months 2022: | |
| Net income attributable to common shareholder | |
| | Net income attributable to common shareholder | |
| | Net income attributable to common shareholder | |
| Three Months 2023: | |
| Electric revenues | Electric revenues | 672 | | | $ | — | | | $ | 117 | | | $ | (31) | | | 758 | |
| Electric revenues | |
| Electric revenues | |
| Natural gas revenues | |
| Purchased power | Purchased power | (350) | | | — | | | — | | | 31 | | | (319) | |
| Electric margins | 322 | | | — | | | 117 | | | — | | | 439 | |
| Natural gas revenues | — | | | 146 | | | — | | | — | | | 146 | |
| Natural gas purchased for resale | Natural gas purchased for resale | — | | | (51) | | | — | | | — | | | (51) | |
| Natural gas margins | — | | | 95 | | | — | | | — | | | 95 | |
| Other operations and maintenance expenses | Other operations and maintenance expenses | (145) | | | (59) | | | (11) | | | — | | | (215) | |
| Depreciation and amortization expenses | Depreciation and amortization expenses | (84) | | | (24) | | | (22) | | | — | | | (130) | |
| Taxes other than income taxes | Taxes other than income taxes | (21) | | | (12) | | | (1) | | | — | | | (34) | |
| Operating income | Operating income | 72 | | | — | | | 83 | | | — | | | 155 | |
| Other income, net | Other income, net | 15 | | | 6 | | | 5 | | | — | | | 26 | |
| Interest charges | Interest charges | (19) | | | (10) | | | (13) | | | — | | | (42) | |
| Income (taxes) benefit | (17) | | | — | | | (19) | | | — | | | (36) | |
| Income taxes | |
| | Net income (loss) attributable to Ameren common shareholders | $ | 51 | | | $ | (4) | | | $ | 56 | | | $ | — | | | $ | 103 | |
| Net income attributable to common shareholder | |
| | Net income attributable to common shareholder | |
| | Net income attributable to common shareholder | |
| | | | | | | | | | | | | | | | | | | | | | | | | | | | | |
| Ameren
Illinois
Electric
Distribution | | Ameren
Illinois
Natural Gas | | Ameren
Illinois Transmission | | Other /
Intersegment
Eliminations | | Ameren Illinois |
| Nine Months 2023: | | | | | | | | | |
| Electric revenues | $ | 1,722 | | | $ | — | | | $ | 363 | | | $ | (87) | | | $ | 1,998 | |
| Purchased power | (766) | | | — | | | — | | | 87 | | | (679) | |
| Electric margins | 956 | | | — | | | 363 | | | — | | | 1,319 | |
| Natural gas revenues | — | | | 665 | | | — | | | — | | | 665 | |
| Natural gas purchased for resale | — | | | (220) | | | — | | | — | | | (220) | |
| Natural gas margins | — | | | 445 | | | — | | | — | | | 445 | |
| Other operations and maintenance expenses | (394) | | | (173) | | | (36) | | | — | | | (603) | |
| Depreciation and amortization expenses | (260) | | | (79) | | | (71) | | | — | | | (410) | |
| Taxes other than income taxes | (57) | | | (48) | | | (3) | | | — | | | (108) | |
| Operating income | 245 | | | 145 | | | 253 | | | — | | | 643 | |
| Other income, net | 74 | | | 24 | | | 17 | | | — | | | 115 | |
| Interest charges | (66) | | | (41) | | | (44) | | | — | | | (151) | |
| Income taxes | (59) | | | (35) | | | (60) | | | — | | | (154) | |
| Net income | 194 | | | 93 | | | 166 | | | — | | | 453 | |
| Preferred stock dividends | (1) | | | — | | | — | | | — | | | (1) | |
| Net income attributable to common shareholder | $ | 193 | | | $ | 93 | | | $ | 166 | | | $ | — | | | $ | 452 | |
| Nine Months 2022: | | | | | | | | | |
| Electric revenues | $ | 1,641 | | | $ | — | | | $ | 320 | | | $ | (75) | | | $ | 1,886 | |
| Purchased power | (683) | | | — | | | — | | | 75 | | | (608) | |
| Electric margins | 958 | | | — | | | 320 | | | — | | | 1,278 | |
| Natural gas revenues | — | | | 811 | | | — | | | — | | | 811 | |
| Natural gas purchased for resale | — | | | (366) | | | — | | | — | | | (366) | |
| Natural gas margins | — | | | 445 | | | — | | | — | | | 445 | |
| Other operations and maintenance expenses | (440) | | | (185) | | | (38) | | | — | | | (663) | |
| Depreciation and amortization expenses | (247) | | | (72) | | | (63) | | | — | | | (382) | |
| Taxes other than income taxes | (60) | | | (59) | | | (3) | | | — | | | (122) | |
| Operating income | 211 | | | 129 | | | 216 | | | — | | | 556 | |
| Other income, net | 46 | | | 16 | | | 13 | | | — | | | 75 | |
| Interest charges | (55) | | | (32) | | | (38) | | | — | | | (125) | |
| Income taxes | (50) | | | (31) | | | (49) | | | — | | | (130) | |
| Net income | 152 | | | 82 | | | 142 | | | — | | | 376 | |
| Preferred stock dividends | (1) | | | — | | | — | | | — | | | (1) | |
| Net income attributable to common shareholder | $ | 151 | | | $ | 82 | | | $ | 142 | | | $ | — | | | $ | 375 | |
Electric and Natural Gas Margins
Electric margins are defined as electric revenues less fuel and purchased power costs. Natural gas margins are defined as natural gas revenues less natural gas purchased for resale. We consider electric and natural gas margins useful measures to analyze the change in profitability of our electric and natural gas operations between periods. We have included the analysis below to complement the financial information we provide in accordance with GAAP. However, these margins may not be a presentation defined under GAAP, and they may not be comparable to other companies’ presentations or more useful than the GAAP information we provide elsewhere in this report.
Electric Margins | | | | | | | | | | | | | | | | | | | | |
| | | Increase (Decrease) by Segment | |
| | | Overall Ameren Increase of $31 Million (QTD YoY) | | Overall Ameren Increase of $41 Million (YTD YoY) | |
| Total by Segment(a)
| | | |
(a)Includes other/intersegment eliminations of $(8) million, $(5) million, $(25) million, and $(18) million in the three months ended September 30, 2023 and 2022, and nine months ended September 30, 2023, and 2022, respectively.
| | | | | | | | | | | | | | | | | | | | | | | | | | | | | | | | | | | | | | |
| | Ameren Missouri | | | Ameren Illinois Electric Distribution | | Ameren Transmission | | | Other/Intersegment Eliminations | |
Natural Gas Margins
| | | | | | | | | | | | | | | | | | | | |
| | | Increase (Decrease) by Segment | |
| | | Overall Ameren Increase of $1 Million (QTD YoY) | | Overall Ameren Decrease of $3 Million (YTD YoY) | |
| Total by Segment(a)
| | | |
(a) Includes $14 million and $14 million at Ameren Missouri in the three months ended September 30, 2023 and 2022, respectively. Includes other/intersegment eliminations of $(1) million, $(1) million, $(2) million, and $(1) million in the the three months ended September 30, 2023 and 2022, respectively, and in the nine months ended September 30, 2023and 2022, respectively. | | | | | | | | | | | | | | | | | | | | | | | | | | | | | |
| | Ameren Missouri | | | Ameren Illinois Natural Gas | | | Other/Intersegment Eliminations |
The following tables presenttable presents the favorable (unfavorable) variationsincreases (decreases) by Ameren segment for electric and natural gas marginsrevenues, for the three and nine months ended September 30, 2023,March 31, 2024, compared with the year-ago periods:period:
| | | | | | | | | | | | | | | | | | | | | | | | | | | | | | | | | | | | | | | | |
| Electric and Natural Gas Margins | | | | | |
| Three Months | Ameren Missouri | | Ameren Illinois
Electric Distribution | | Ameren Illinois
Natural Gas | | Ameren Transmission(a) | | Other /Intersegment Eliminations | | Ameren | | | | | |
| Electric revenue change: | | | | | | | | | | | | | | | | |
Base rates (estimate)(b) | $ | 47 | | | $ | 9 | | | $ | — | | | $ | 19 | | | $ | — | | | $ | 75 | | | | | | |
Effect of weather (estimate)(c) | 5 | | | — | | | — | | | — | | | — | | | 5 | | | | | | |
| Sales volumes and changes in customer usage patterns (excluding the estimated effects of weather and MEEIA) | (7) | | | — | | | — | | | — | | | — | | | (7) | | | | | | |
| | | | | | | | | | | | | | | | |
| MEEIA 2019 performance incentives | (12) | | | — | | | — | | | — | | | — | | | (12) | | | | | | |
| Off-system sales, capacity, and FAC revenues, net | (178) | | | — | | | — | | | — | | | — | | | (178) | | | | | | |
| Ameren Illinois energy-efficiency program investment revenues | — | | | 5 | | | — | | | — | | | — | | | 5 | | | | | | |
| | | | | | | | | | | | | | | | |
| Other | (3) | | | (2) | | | — | | | — | | | (3) | | | (8) | | | | | | |
Cost recovery mechanisms – offset in fuel and purchased power(d) | 42 | | | (117) | | | — | | | — | | | (2) | | | (77) | | | | | | |
Other cost recovery mechanisms(e) | (13) | | | (9) | | | — | | | — | | | — | | | (22) | | | | | | |
| Total electric revenue change | $ | (119) | | | $ | (114) | | | $ | — | | | $ | 19 | | | $ | (5) | | | $ | (219) | | | | | | |
| Fuel and purchased power change: | | | | | | | | | | | | | | | | |
| Energy costs (excluding the estimated effect of weather) | $ | 182 | | | $ | — | | | $ | — | | | $ | — | | | $ | — | | | $ | 182 | | | | | | |
Effect of weather (estimate)(c) | (1) | | | — | | | — | | | — | | | — | | | (1) | | | | | | |
| Effect of higher net energy costs included in base rates | (10) | | | — | | | — | | | — | | | — | | | (10) | | | | | | |
| Other | 2 | | | — | | | — | | | — | | | — | | | 2 | | | | | | |
Cost recovery mechanisms – offset in electric revenue(d) | (42) | | | 117 | | | — | | | — | | | 2 | | | 77 | | | | | | |
| Total fuel and purchased power change | $ | 131 | | | $ | 117 | | | $ | — | | | $ | — | | | $ | 2 | | | $ | 250 | | | | | | |
| Net change in electric margins | $ | 12 | | | $ | 3 | | | $ | — | | | $ | 19 | | | $ | (3) | | | $ | 31 | | | | | | |
| Natural gas revenue change: | | | | | | | | | | | | | | | | |
| | | | | | | | | | | | | | | | |
Effect of weather (estimate)(c) | $ | (1) | | | $ | — | | | $ | — | | | $ | — | | | $ | — | | | $ | (1) | | | | | | |
| Sales volumes (excluding the estimated effect of weather) | (1) | | | — | | | — | | | — | | | — | | | (1) | | | | | | |
| QIP | — | | | — | | | 5 | | | — | | | — | | | 5 | | | | | | |
| VBA | — | | | — | | | (2) | | | — | | | — | | | (2) | | | | | | |
| Other | — | | | — | | | (1) | | | — | | | — | | | (1) | | | | | | |
Cost recovery mechanisms – offset in natural gas purchased for resale(d) | (2) | | | — | | | (25) | | | — | | | — | | | (27) | | | | | | |
Other cost recovery mechanisms(e) | 1 | | | — | | | (1) | | | — | | | — | | | — | | | | | | |
| Total natural gas revenue change | $ | (3) | | | $ | — | | | $ | (24) | | | $ | — | | | $ | — | | | $ | (27) | | | | | | |
| Natural gas purchased for resale change: | | | | | | | | | | | | | | | | |
Effect of weather (estimate)(c) | $ | 1 | | | $ | — | | | $ | — | | | $ | — | | | $ | — | | | $ | 1 | | | | | | |
Cost recovery mechanisms – offset in natural gas revenue(d) | 2 | | | — | | | 25 | | | — | | | — | | | 27 | | | | | | |
| Total natural gas purchased for resale change | $ | 3 | | | $ | — | | | $ | 25 | | | $ | — | | | $ | — | | | $ | 28 | | | | | | |
| Net change in natural gas margins | $ | — | | | $ | — | | | $ | 1 | | | $ | — | | | $ | — | | | $ | 1 | | | | | | |
| | | | | | | | | | | | | | | | | | | | | | | | | | | | | | | | | | | | | | | | |
| Electric and Natural Gas Margins | | | | | |
| Nine Months | Ameren Missouri | | Ameren Illinois
Electric Distribution | | Ameren Illinois
Natural Gas | | Ameren Transmission(a) | | Other /Intersegment Eliminations | | Ameren | | | | | |
| Electric revenue change: | | | | | | | | | | | | | | | | |
Base rates (estimate)(b) | $ | 85 | | | $ | 7 | | | $ | — | | | $ | 47 | | | $ | — | | | $ | 139 | | | | | | |
Effect of weather (estimate)(c) | (50) | | | — | | | — | | | — | | | — | | | (50) | | | | | | |
| Sales volumes and changes in customer usage patterns (excluding the estimated effects of weather and MEEIA) | (20) | | | — | | | — | | | — | | | — | | | (20) | | | | | | |
| | | | | | | | | | | | | | | | |
| MEEIA 2019 performance incentives | (12) | | | — | | | — | | | — | | | — | | | (12) | | | | | | |
| Off-system sales, capacity, and FAC revenues, net | (60) | | | — | | | — | | | — | | | — | | | (60) | | | | | | |
| Ameren Illinois energy-efficiency program investment revenues | — | | | 14 | | | — | | | — | | | — | | | 14 | | | | | | |
| | | | | | | | | | | | | | | | |
| Other | (3) | | | 3 | | | — | | | — | | | (7) | | | (7) | | | | | | |
Cost recovery mechanisms – offset in fuel and purchased power(d) | 82 | | | 83 | | | — | | | — | | | (8) | | | 157 | | | | | | |
Other cost recovery mechanisms(e) | (10) | | | (26) | | | — | | | — | | | — | | | (36) | | | | | | |
| Total electric revenue change | $ | 12 | | | $ | 81 | | | $ | — | | | $ | 47 | | | $ | (15) | | | $ | 125 | | | | | | |
| Fuel and purchased power change: | | | | | | | | | | | | | | | | |
| Energy costs (excluding the estimated effect of weather) | $ | 70 | | | $ | — | | | $ | — | | | $ | — | | | $ | — | | | $ | 70 | | | | | | |
Effect of weather (estimate)(c) | 9 | | | — | | | — | | | — | | | — | | | 9 | | | | | | |
| Effect of higher net energy costs included in base rates | (11) | | | — | | | — | | | — | | | — | | | (11) | | | | | | |
| Other | 5 | | | — | | | — | | | — | | | — | | | 5 | | | | | | |
Cost recovery mechanisms – offset in electric revenue(d) | (82) | | | (83) | | | — | | | — | | | 8 | | | (157) | | | | | | |
| Total fuel and purchased power change | $ | (9) | | | $ | (83) | | | $ | — | | | $ | — | | | $ | 8 | | | $ | (84) | | | | | | |
| Net change in electric margins | $ | 3 | | | $ | (2) | | | $ | — | | | $ | 47 | | | $ | (7) | | | $ | 41 | | | | | | |
| Natural gas revenue change: | | | | | | | | | | | | | | | | |
| | | | | | | | | | | | | | | | |
Effect of weather (estimate)(c) | $ | (11) | | | $ | — | | | $ | — | | | $ | — | | | $ | — | | | $ | (11) | | | | | | |
| Sales volumes (excluding the estimated effect of weather) | (2) | | | — | | | (2) | | | — | | | — | | | (4) | | | | | | |
| QIP | — | | | — | | | 11 | | | — | | | — | | | 11 | | | | | | |
| Other | — | | | — | | | (2) | | | — | | | (1) | | | (3) | | | | | | |
Cost recovery mechanisms – offset in natural gas purchased for resale(d) | 5 | | | — | | | (146) | | | — | | | — | | | (141) | | | | | | |
Other cost recovery mechanisms(e) | 1 | | | — | | | (7) | | | — | | | — | | | (6) | | | | | | |
| Total natural gas revenue change | $ | (7) | | | $ | — | | | $ | (146) | | | $ | — | | | $ | (1) | | | $ | (154) | | | | | | |
| Natural gas purchased for resale change: | | | | | | | | | | | | | | | | |
Effect of weather (estimate)(c) | $ | 10 | | | $ | — | | | $ | — | | | $ | — | | | $ | — | | | $ | 10 | | | | | | |
Cost recovery mechanisms – offset in natural gas revenue(d) | (5) | | | — | | | 146 | | | — | | | — | | | 141 | | | | | | |
| Total natural gas purchased for resale change | $ | 5 | | | $ | — | | | $ | 146 | | | $ | — | | | $ | — | | | $ | 151 | | | | | | |
| Net change in natural gas margins | $ | (2) | | | $ | — | | | $ | — | | | $ | — | | | $ | (1) | | | $ | (3) | | | | | | |
| | | | | | | | | | | | | | | | | | | | | | | | | | | | | | | | | | | | | | | | |
| Three Months | Ameren Missouri | | Ameren Illinois
Electric Distribution | | Ameren Illinois
Natural Gas | | Ameren Transmission(a) | | Other /Intersegment Eliminations | | Ameren | | | | | |
| Electric revenue change: | | | | | | | | | | | | | | | | |
Base rates (estimate)(b) | $ | 29 | | | $ | 8 | | | $ | — | | | $ | 19 | | | $ | — | | | $ | 56 | | | | | | |
Effect of weather (estimate)(c) | (6) | | | — | | | — | | | — | | | — | | | (6) | | | | | | |
| Sales volumes and changes in customer usage patterns (excluding the estimated effects of weather and MEEIA) | 16 | | | — | | | — | | | — | | | — | | | 16 | | | | | | |
| | | | | | | | | | | | | | | | |
| | | | | | | | | | | | | | | | |
| Off-system sales, capacity, and FAC revenues, net | (151) | | | — | | | — | | | — | | | — | | | (151) | | | | | | |
| Ameren Illinois energy-efficiency program investment revenues | — | | | 4 | | | — | | | — | | | — | | | 4 | | | | | | |
Electric deferred income tax adjustment(d) | — | | | (5) | | | — | | | — | | | — | | | (5) | | | | | | |
| Other | (3) | | | (2) | | | — | | | 3 | | | (1) | | | (3) | | | | | | |
Cost recovery mechanisms – offset in fuel and purchased power(e) | (17) | | | (123) | | | — | | | — | | | (2) | | | (142) | | | | | | |
Other cost recovery mechanisms(f) | 5 | | | — | | | — | | | — | | | — | | | 5 | | | | | | |
| Total electric revenue change | $ | (127) | | | $ | (118) | | | $ | — | | | $ | 22 | | | $ | (3) | | | $ | (226) | | | | | | |
| Natural gas revenue change: | | | | | | | | | | | | | | | | |
| Base rates (estimate) | $ | — | | | $ | — | | | $ | 24 | | | $ | — | | | $ | — | | | $ | 24 | | | | | | |
| Change in rate design (estimate) | — | | | — | | | 11 | | | — | | | — | | | 11 | | | | | | |
Effect of weather (estimate)(c) | 1 | | | — | | | — | | | — | | | — | | | 1 | | | | | | |
| | | | | | | | | | | | | | | | |
| | | | | | | | | | | | | | | | |
| | | | | | | | | | | | | | | | |
| Other | — | | | — | | | 3 | | | — | | | 1 | | | 4 | | | | | | |
Cost recovery mechanisms – offset in natural gas purchased for resale(e) | (21) | | | — | | | (38) | | | — | | | — | | | (59) | | | | | | |
Other cost recovery mechanisms(f) | (1) | | | — | | | — | | | — | | | — | | | (1) | | | | | | |
| Total natural gas revenue change | $ | (21) | | | $ | — | | | $ | — | | | $ | — | | | $ | 1 | | | $ | (20) | | | | | | |
| | | | | | | | | | | | | | | | |
(a)Includes an increase in transmission marginsrevenues of $19 million and $43$17 million at Ameren Illinois for the three and nine months ended September 30, 2023,March 31, 2024, compared with the year-ago periods.period.
(b)For Ameren Illinois Electric Distribution and Ameren Transmission, base rates include increases or decreases toin operating revenues related to the revenue requirement reconciliation adjustment under formula rates. For Ameren Missouri, base rates exclude an increase for the recovery of lost electric marginsrevenue, less the associated fuel and purchased power expenses, resulting from the MEEIA customer energy-efficiency programs and a decrease in base rates for RESRAM. These changes in Ameren Missouri base rates are included in the “Sales volumes and changes in customer usage patterns (excluding the estimated effects of weather and MEEIA)” and “Cost recovery mechanisms - offset in fuel and purchased power” line items, respectively.
(c)Represents the estimated variation resulting primarily from changes in cooling and heating degree-days on electric and natural gas demand compared with the year-ago periods;period; this variation is based on temperature readings from the National Oceanic and Atmospheric Administration weather stations at local airports in our service territories.
(d)The electric deferred income tax adjustment relates to the remaining balance of certain excess deferred income taxes that will be amortized through 2025. Offsetting expense increases or decreases are reflected within the "Income Taxes" section of the statement of income. This item has no overall impact on earnings.
(e)Electric and natural gas revenue changes are offset by corresponding changes in “Fuel” “Purchased power,” and purchased power” and “Natural gas purchased for resale” on the statement of income, resulting in no change to electric and natural gas margins.income. Activity in Other/Intersegment Eliminations represents the elimination of related-party transactions between Ameren Missouri, Ameren Illinois, and ATXI, as well as Ameren Transmission revenue from transmission services provided to Ameren Illinois Electric Distribution. See Note 8 – Related-party Transactions and Note 14 – Segment Information under Part I, Item 1, of this report for additional information on intersegment eliminations. These items have no overall impact on earnings.
(e)(f)Offsetting expense increases or decreases are reflected in “Other operations and maintenance,” “Depreciation and amortization,” or in “Taxes other than income taxes,” within the “Operating Expenses” section and "Income Taxes" inof the statement of income. These items have no overall impact on earnings.
Electric Revenues
Ameren
Ameren’s electric margins increased $31revenues decreased $226 million, or 2%14%, for the three months ended September 30, 2023,March 31, 2024, compared with the year-ago period, primarily due to increased marginsdecreased revenues at Ameren Transmission, Ameren Missouri and Ameren Illinois Electric Distribution, as discussed below. Ameren’s electric marginspartially offset by increased $41 million, or 1%, for the nine months ended September 30, 2023, compared with the year-ago period, primarily due to increased marginsrevenues at Ameren Transmission, and Ameren Missouri, as discussed below. Ameren’s natural gas margins were comparable
Ameren Transmission
Ameren Transmission’s electric revenues increased $22 million, or 13%, for the three months ended September 30, 2023, and decreased $3 million, or 1%, for the nine months ended September 30, 2023, compared with the year-ago period, primarily due to decreased sales volumes at Ameren Missouri.
Ameren Transmission
Ameren Transmission’s margins increased $19 million, or 11%, and $47 million, or 10%, for the three and nine months ended September 30, 2023, respectively,March 31, 2024, compared with the year-ago periods. Base rate revenuesperiod. Revenues were favorably affected primarily by higher recoverable expenses (+$12 million and +$27 million, respectively) and10 million), increased capital investment (+
(+$7 million and +$20 million, respectively)9 million), as evidenced by a 10%14% increase in rate base used to calculate the revenue requirement.requirement, and increased facility rental revenues (+$3 million) related to ATXI’s transmission operations control center, which was placed in service in December 2023. ATXI provides affiliates with access to this facility. Rental revenues associated with this facility are affiliate transactions and eliminated in consolidation for Ameren’s consolidated financial statements. See Note 8 – Related-party Transactions under Part I, Item 1, of this report for additional information.
Ameren Missouri
Ameren Missouri’s electric margins increased $12revenues decreased $127 million, or 1%, and $3 million, or less than 1%15%, for the three and nine months ended September 30, 2023, respectively,March 31, 2024, compared with the year-ago periods. period.
The following items decreased Ameren Missouri’s electric revenues between periods:
•“Off-system sales, capacity and FAC revenues, net” decreased $151 million due to lower capacity prices, (-$156 million) which were set by the annual MISO auction in April 2023 and became effective June 2023, partially offset by higher off-system sales revenue
(+$5 million). Ameren Missouri’s 5% exposure to net energy cost variances under the FAC is included within “Off-system sales, capacity, and FAC revenues, net” and “Energy costs (excluding the estimated effect of weather)” in fuel and purchased power.
•Revenues associated with “Cost recovery mechanisms – offset in fuel and purchased power” increased $42decreased $17 million and $82 million for the three and nine months ended September 30, 2023, respectively, due to increaseddecreased revenue related to the amortization of costs previously deferred under the FAC that were reflected in customer rates, which also increased fuel expense.rates. The changes to “Cost recovery mechanisms - offset in fuel and purchased power” are fully offset by “Cost recovery mechanisms - offset in electric revenue,”revenue” in the table above,fuel and result in no impact to margins. Ameren Missouri’s 5% exposure to net energy cost variances under the FAC is reflected within “Off-system sales, capacity, and FACpurchased power.
•Winter temperatures were warmer as heating degree days decreased 4%, which decreased revenues net” and “Energy costs (excluding thean estimated effect of weather)”, as discussed below.$6 million.
The following items had a favorable effect onincreased Ameren Missouri’s electric margins for the three and nine months ended September 30, 2023, compared with the year-ago periods (except where a specific period is referenced):revenues between periods:
•Higher electric base rates, excluding the change in base rates for the MEEIA customer energy-efficiency programs and the RESRAM, resulting from the December 2021 MoPSC electric rate order effective February 28, 2022, partially offset by higher net energy costs included in base rates, increased margins an estimated $37 million for the nine months ended September 30, 2023. A similar effect resulting from the June 2023 MoPSC electric rate order effective July 9, 2023, increased marginsrevenues an estimated $37 million for the three and nine months ended September 30, 2023. The change in electric base rates from these two orders is the sum of the change in “Base rates (estimate)” (+$47 million and +$85 million, respectively) and the “Effect of higher net energy costs included in base rates”
(-$10 million and -$11 million, respectively) in the table above.
•Ameren Missouri’s 5% exposure to net energy cost variances under the FAC increased margins $4 million and $10 million for the three and nine months ended September 30, 2023, respectively. The change in net energy costs is the sum of “Off-system sales, capacity and FAC revenues, net” (-$178 million and -$60 million, respectively) and “Energy costs (excluding the estimated effect of weather)”
(+$182 million and +$70 million, respectively) in the table above. In the three and nine months ended September 30, 2023, these revenues and costs decreased primarily due to lower capacity prices, lower market prices for power, and the effect of decreased generation volumes. Ameren Missouri sells nearly all of its capacity to the MISO and purchases the capacity it needs to supply its native load sales from the MISO. For the three months ended September 30, 2023, capacity revenues decreased $154 million and capacity costs decreased $148$29 million. Capacity revenues and costs decreased due to a decrease in the price set by the annual MISO auction in April 2023, which became effective June 2023. For the nine months ended September 30, 2023, capacity revenues increased $54 million and capacity costs increased $53 million due to an increase in the price set by the annual MISO auction in April 2022, which became effective June 2022. These increases in capacity revenues and costs were partially offset by lower capacity prices set by the annual MISO auction in April 2023, which became effective June 2023, as well as the effect of lower market prices for power, which resulted in a decrease in off-system sales and related fuel costs. See Outlook for additional information related to the April 2022 and April 2023 MISO auctions.
•Other decreases in fuel and purchased power expenses increased margins $5 million for the nine months ended September 30, 2023, largely due to decreased transmission expense. The decrease relates to a reduction in charges associated with transmission network upgrades.
•For the three months ended September 30, 2023, temperatures were warmer as cooling degree days increased less than 1%. The aggregate effect of weather increased margins an estimated $4 million. The change in margins due to weather is the sum of the “Effect of weather (estimate)” on electric revenues (+$5 million) and the “Effect of weather (estimate)” on fuel and purchased power (-$1 million) in the table above.
The following items had an unfavorable effect on Ameren Missouri’s electric margins for the three and nine months ended September 30, 2023, compared with the year-ago periods (except where a specific period is referenced):
•Spring and early summer temperatures were milder as cooling degree days decreased 5% and winter temperatures were warmer as heating degree days decreased 20% for the nine months ended September 30, 2023. The aggregate effect of weather decreased margins an estimated $41 million for the nine months ended September 30, 2023. The change in margins due to weather is the sum of the “Effect of weather (estimate)” on electric revenues (-$50 million) and the “Effect of weather (estimate)” on fuel and purchased power (+$9 million) in the table above.
•Excluding the estimated effects of weather and the MEEIA customer energy-efficiency programs, electric revenues decreasedincreased an estimated $7$16 million, and $20 million for the three and nine months ended September 30, 2023, respectively. These decreases resulted from a decreasedue to an increase in retail sales volumes, due,which were, in part, to customer outages resulting from major storms experienced throughout the service territory in July and August 2023, partially offsetfavorably affected by an increaseadditional day in 2024 as a result of the average retail price per kilowatthour related to changes in customer usage patterns and an increase in customer demand charge revenues.
•The MEEIA 2019 performance incentives decreased revenues $12 million for the three and nine months ended September 30, 2023 due to the recognition in 2022 of performance incentives for program year 2021.leap year.
•Revenues associated with other cost recovery mechanisms decreased $13increased $5 million, and $10 million for the three and nine months ended September 30, 2023, respectively, primarily due to a decreasean increase in RESRAM revenues partially offset byand an increase in excise taxes due to an increase in retail sales revenue.
Ameren Illinois
Ameren Illinois’ electric revenues decreased $101 million, or 14%, for the three months ended March 31, 2024, compared with the year-ago period, driven by decreased revenues at Ameren Illinois Electric Distribution, partially offset by increased revenues at Ameren Illinois Transmission.
Ameren Illinois Electric Distribution
Ameren Illinois Electric Distribution’s revenues decreased $118 million, or 19%, for the three months ended March 31, 2024, compared with the year-ago period.
The following items decreased Ameren Illinois Electric Distribution’s revenues between periods:
•Revenues associated with “Cost recovery mechanisms – offset in fuel and purchased power” decreased $123 million due to decreased recovery of purchased power expenses. The decrease in electric revenues is fully offset by a decrease in purchased power expenses under cost recovery mechanisms for purchased power, as discussed below.
•Pursuant to an ICC order, revenues decreased $5 million due to changes in the amortization rate for certain excess deferred income taxes.
The following items increased Ameren Illinois Electric Distribution’s revenues between periods:
•Base rates increased revenues by $8 million due to higher recoverable MEEIAnon-purchased power expenses (+$13 million), partially offset by a lower recognized ROE (-$5 million). The MYRP utilizes a fixed ROE approved by the ICC of 8.72%, with adjustments for any performance incentives and penalties, while the IEIMA formula-based ROE was based on the annual average of the monthly yields of the 30-year United States Treasury bonds plus 580 basis points (estimated at 9.61% for the three months ended March 31, 2023).
•Revenues increased $4 million due to the recovery of and return on increased energy-efficiency program costs.investments under performance-based formula ratemaking.
Ameren Illinois Transmission
Ameren Illinois Transmission’s revenues increased $17 million, or 15%, for the three months ended March 31, 2024, compared with the year-ago period. Base rate revenues were favorably affected by higher recoverable expenses (+$11 million) and increased capital investment (+$6 million), as evidenced by a 15% increase in rate base used to calculate the revenue requirement.
Natural Gas Revenues
Ameren
Ameren’s natural gas revenues decreased $20 million, or 4%, for the three months ended March 31, 2024, compared with the year-ago period, primarily due to decreased revenues at Ameren Missouri, as discussed below.
Ameren Missouri
Ameren Missouri’s natural gas marginsrevenues were comparabledecreased $21 million, or 26%, for the three and nine months ended September 30, 2023,March 31, 2024, compared towith the year-ago periods. Purchasedperiod. Revenues associated with “Cost recovery mechanisms – offset in natural gas costs increased $5purchased for resale” decreased$21 million fordue to lower commodity prices and the nine months ended September 30, 2023, due toabsence of amortization of natural gas costs previously deferred under the PGA driven by an increaserelated to the extremely cold weather in natural gas prices in 2022.mid-February 2021. The increased purchased natural gas costs are fully offset by an increasedecrease in natural gas revenues under the PGA resulting in no impact to margin. The increase in purchased natural gas cost is reflected in “Cost recovery mechanisms –are fully offset by a decrease in natural gas revenue” and the associated recoverability from customers is reflected inpurchased for resale expenses.
Ameren Illinois Natural Gas
Ameren Illinois Natural Gas’ revenues were comparable between periods. “Cost recovery mechanisms – offset in natural gas purchased for resale” in the table above.
Ameren Illinois
Ameren Illinois’ electric margins increased $22 million, or 5%, and $41 million, or 3%, for the three and nine months ended September 30, 2023, respectively, compared with the year-ago periods, driven primarily by increased margins at Ameren Illinois Transmission. Ameren Illinois Natural Gas’ margins were comparable for the three and nine months ended September 30, 2023.
Ameren Illinois Electric Distribution
Compared with the respective year-ago periods, Ameren Illinois Electric Distribution’s margins increased $3decreased revenues $38 million for the three months ended September 30,March 31, 2024, due to lower collection of natural gas costs previously deferred under the PGA. The decrease in natural gas revenues under the PGA are fully offset by a decrease in natural gas purchased for resale expenses.
The following items increased Ameren Illinois Natural Gas’ revenues between periods:
•Revenues increased an estimated $24 million due to higher natural gas base rates as a result of the November 2023 natural gas rate order.
•Revenues increased an estimated $11 million due to a change in rate design as a result of the November 2023 natural gas rate order. This change in rate design concentrates more revenues in the winter heating season due to an increase in volumetric rates and were comparablea decrease in fixed customer rates. As such, the change is not expected to materially affect annual earnings comparisons.
Fuel and Purchased Power
The following table presents the increases (decreases) by Ameren segment for the nine months ended September 30, 2023. Purchasedfuel and purchased power costs decreased $117 million for the three months ended September 30, 2023,March 31, 2024, compared with the year-ago period:
| | | | | | | | | | | | | | | | | | | | | | | | | | | | | | | | | | | |
| Three Months | Ameren Missouri | | Ameren Illinois
Electric Distribution | | Ameren Illinois
Natural Gas | | Ameren Transmission | | Other /Intersegment Eliminations | | Ameren |
| | | | | | | | | | | | | | | | | | | | | | | | | | | | | | | | | | | | | | | | |
| Fuel and purchased power change: | | | | | | | | | | | | | | | | |
| Energy costs (excluding the estimated effect of weather) | $ | (148) | | | $ | — | | | $ | — | | | $ | — | | | $ | — | | | $ | (148) | | | | | | |
Effect of weather (estimate)(a) | (1) | | | — | | | — | | | — | | | — | | | (1) | | | | | | |
| Effect of higher net energy costs included in base rates | 11 | | | — | | | — | | | — | | | — | | | 11 | | | | | | |
| | | | | | | | | | | | | | | | |
Cost recovery mechanisms – offset in electric revenue(b) | (17) | | | (123) | | | — | | | — | | | (2) | | | (142) | | | | | | |
| Total fuel and purchased power change | $ | (155) | | | $ | (123) | | | $ | — | | | $ | — | | | $ | (2) | | | $ | (280) | | | | | | |
(a)Represents the estimated variation resulting primarily from changes in cooling and increased $83heating degree-days on electric demand compared with the year-ago period; this variation is based on temperature readings from the National Oceanic and Atmospheric Administration weather stations at local airports in our service territories.
(b)“Cost recovery mechanisms — offset in electric revenue” changes are offset by corresponding changes in “Cost recovery mechanisms — offset in fuel and purchased power” in electric revenues. Activity in Other/Intersegment Eliminations represents the elimination of related-party transactions between Ameren Missouri, Ameren Illinois, and ATXI, as well as Ameren Transmission revenue from transmission services provided to Ameren Illinois Electric Distribution. See Note 8 – Related-party Transactions and Note 14 – Segment Information under Part I, Item 1, of this report for additional information on intersegment eliminations. These items have no overall impact on earnings.
Ameren
Ameren Missouri and Ameren Illinois are generally allowed to pass on to customers prudently incurred costs for fuel and purchased power. Ameren’s electric fuel and purchased power expenses decreased $280 million, or 46%, for the nine months ended September 30, 2023. For the three months ended September 30, 2023, purchased power costs decreasedMarch 31, 2024, compared with the year-ago period, primarily due to lower energy prices (-$74 million)decreased fuel and purchased power expenses at Ameren Missouri and Ameren Illinois Electric Distribution, as discussed below.
Ameren Missouri
Ameren Missouri’s fuel and purchased power expenses decreased $155 million, or 48%, which largely reflectfor the results of IPA procurement events, lower volumesthree months ended March 31, 2024, compared with the year-ago period.
The following items decreased Ameren Missouri’s fuel and purchased power expense:
•Energy costs decreased $148 million due to decreased sales (-$28 million), and lower capacity prices (-$24149 million), which were set by the annual MISO auction in April 2023 and became effective June 2023. For2023, and lower fuel costs (-$7 million), partially offset by increased purchased power expense
(+$5 million) and decreased deferrals under the nineFAC (+$3 million). Ameren Missouri’s 5% exposure to net energy cost variances under the FAC is included within “Energy costs (excluding the estimated effect of weather)” and “Off-system sales, capacity, and FAC revenues, net” in electric revenues.
•“Cost recovery mechanisms — offset in electric revenue” decreased $17 million due to decreased amortization of costs previously deferred under the FAC. The changes to “Cost recovery mechanisms - offset in electric revenue” are fully offset by “Cost recovery mechanisms - offset in fuel and purchased power” in electric revenues.
Ameren Missouri’s fuel and purchased power expenses increased $11 million due to the effect of higher net energy costs included in base rates as a result of the June 2023 MoPSC electric rate order.
Ameren Illinois Electric Distribution
Ameren Illinois Electric Distribution’s purchased power expenses decreased $123 million, or 39%, for the three months ended September 30, 2023, purchased power costs increasedMarch 31, 2024, compared with the year-ago period, primarily due to higherdecreased energy prices (-$57 million), which largely reflect the results of IPA procurement events, decreased capacity prices (+(-$39 million), which were set by the annual MISO auction in April 20222023 and became effective in June 2022, partially2023, and lower volumes (-$28 million) primarily due to residential and small commercial customers switching from Ameren Illinois’ supplied power to alternative retail electric suppliers. The changes to “Cost recovery mechanisms - offset by the effect of lower capacity prices set by the April 2023 MISO auction, higher energy prices (+$23 million), which largely reflect the results of IPA procurement events, and increased revenues related to the amortization of costs previously deferred under riders (+$20 million), primarily the rider for transmission services, that were reflected in customer rates. See Outlook for additional information related to the April 2022 and April 2023 MISO auctions. The change in purchased power costselectric revenue” are fully offset by a change in electric revenues under the cost recovery mechanisms for purchased power, resulting in no impact to margin. The change in purchased power cost is reflected in "Cost recovery mechanisms – offset in electric revenue” and the associated recoverability from customers is reflected in “Cost recovery mechanisms –- offset in fuel and purchased power” in the table above.
The following items had a favorable effect on Ameren Illinois Electric Distribution’s margins for the three and nine months ended September 30, 2023, compared with the year-ago periods:electric revenues.
•The impact from base rates (+$9 million and +$7 million, respectively) increased due to a higher recognized ROE (+$8 million and
+$16 million, respectively), as evidenced by an increase of 96 basis points in the estimated annual average of the monthly yields of the 30-year United States Treasury bonds, and increased capital investment (+$5 million and +$11 million, respectively), as evidenced by a 9% increase in rate base used to calculate the revenue requirement, partially offset by lower recoverable non-purchased power expenses (-$4 million and -$20 million, respectively).
•Revenues increased $5 million and $14 million, respectively, due to the recovery of and return on increased energy-efficiency program investments under performance-based formula ratemaking.
ForNatural Gas Purchased for Resale
The following table presents the increases (decreases) by Ameren segment for natural gas purchased for resale, for the three and nine months ended September 30, 2023, revenues associatedMarch 31, 2024, compared with other cost recovery mechanismsthe year-ago period:
| | | | | | | | | | | | | | | | | | | | | | | | | | | | | | | | | | | | | | | | |
| Three Months | Ameren Missouri | | Ameren Illinois
Electric Distribution | | Ameren Illinois
Natural Gas | | Ameren Transmission | | Other /Intersegment Eliminations | | Ameren | | | | | |
| | | | | | | | | | | | | | | | | | | | | | | | | | | | | | | | | | | | | | | | |
| Natural gas purchased for resale change: | | | | | | | | | | | | | | | | |
Effect of weather (estimate)(a) | $ | 2 | | | $ | — | | | $ | — | | | $ | — | | | $ | — | | | $ | 2 | | | | | | |
Cost recovery mechanisms – offset in natural gas revenue(b) | (21) | | | — | | | (38) | | | — | | | — | | | (59) | | | | | | |
| Total natural gas purchased for resale change | $ | (19) | | | $ | — | | | $ | (38) | | | $ | — | | | $ | — | | | $ | (57) | | | | | | |
(a)Represents the estimated variation resulting primarily from changes in cooling and heating degree-days on natural gas demand compared with the year-ago period; this variation is based on temperature readings from the National Oceanic and Atmospheric Administration weather stations at local airports in our service territories.
(b)Natural gas purchased for resale changes are offset by corresponding changes in “Natural gas revenues” on the statement of income. These items have no overall impact on earnings.
Ameren
Ameren Missouri and Ameren Illinois are generally allowed to pass on to customers prudently incurred costs for natural gas purchased for resale. Ameren’s natural gas purchased for resale expenses decreased $9 million and $2657 million, respectively, primarilyor 27%, for the three months ended March 31, 2024, compared with the year-ago period, due to a decreased natural gas purchased for resale expenses at Ameren Illinois Natural Gas and Ameren Missouri, as discussed below.
Ameren Missouri
Ameren Missouri’s natural gas purchased for resale expenses decreased $19 million, or 40%, for the three months ended March 31, 2024, compared with the year-ago period. Expenses associated with “Cost recovery mechanisms – offset in natural gas revenue” decreased $21 million due to lower amountcommodity prices and the absence of bad debtamortization of natural gas costs included in customer rates pursuantdeferred under the PGA related to the associated rider.extremely cold weather in mid-February 2021. The decrease in natural gas purchased for resale expenses is fully offset by a decrease in natural gas revenues under the PGA.
Ameren Illinois Natural Gas
Ameren Illinois Natural Gas’ margins were comparablenatural gas purchased for resale expenses decreased $38 million, or 24%, for the three and nine months ended September 30, 2023. Purchased gas costs decreased $25 million and $146 million forMarch 31, 2024, compared with the three and nine months ended September 30, 2023, respectively,year-ago period, primarily due to lower amortization of natural gas costs that were previously deferred under the PGA and lower natural gas pricesprices. The decrease in 2023. Deferred natural gas costs related to the mid-February 2021 weather event were fully recovered from customers by the end of 2022. The decreased purchased natural gas costs arefor resale expenses is fully offset by a decrease in natural gas revenues under the PGA, resulting in no impact to margin. The decrease in purchased natural gas cost is reflected in “Cost recovery mechanisms – offset in natural gas revenue” and the associated recoverability from customers is reflected in “Cost recovery mechanisms – offset in natural gas purchased for resale” in the table above. For the three and nine months ended September 30, 2023, revenues increased $5 million and $11 million, respectively, due to additional investment in natural gas infrastructure under the QIP. Revenues associated with other cost recovery mechanisms were comparable for the three months ended September 30, 2023, and decreased revenues $7 million for the nine months ended September 30, 2023, primarily due to decreased revenues for excise taxes.
Ameren Illinois Transmission
Ameren Illinois Transmission’s margins increased $19 million, or 16%, and $43 million, or 13%, for the three and nine months ended September 30, 2023, respectively, compared with the year-ago periods. Base rate revenues were favorably affected primarily by increased capital investment (+$7 million and +$20 million, respectively), as evidenced by a 16% increase in rate base used to calculate the revenue requirement, and higher recoverable expenses (+$12 million and +$23 million, respectively).PGA.
Other Operations and Maintenance Expenses
| | | | | | | | | | | | | | | | | | | | |
| | | Increase (Decrease) by Segment | |
| | | Overall Ameren Decrease of $5 Million (QTD YoY) | | Overall Ameren Decrease of $59 Million (YTD YoY) | |
| Total by Segment(a) | | Overall Ameren Increase of $22 Million | | |
(a)Includes $15 million and $14 million at Ameren Transmission in the three months ended September 30, 2023 and 2022, respectively. Also, includes other/intersegment eliminations of $11$3 million and $5 million in the three months ended September 30, 2023 and 2022, respectively, and $25 million and $12 million in the nine months ended September 30, 2023March 31, 2024 and 2022,2023, respectively.
| | | | | | | | | | | | | | | | | | | | | | | | | | | | | |
| | Ameren Missouri | | | Ameren Illinois Natural Gas | | | Other/Intersegment Eliminations |
| | | | | | | | | |
| | Ameren Illinois Electric Distribution | | Ameren Transmission | | | | |
Ameren
Other operations and maintenance expenses decreased $5 million and $59increased $22 million in the three and nine months ended September 30, 2023, respectively,March 31, 2024, compared with the year-ago periods. In addition toperiod, because of changes by segments discussed below, otherbelow.
Ameren Transmission
Other operations and maintenance expenses increased $6 million and $13$3 million in the three and nine months ended September 30, 2023, respectively, for activity not reported as part of a segment, as reflected in “Other/Intersegment Eliminations” above,March 31, 2024, compared with the year-ago period, primarily because of increased costs related to ATXI’s operations control center, which was placed in service in December 2023. ATXI provides affiliates with access to this facility. The rental expense associated with this facility is an increaseaffiliate transaction and eliminated in the eliminationconsolidation for purposes of the non-service cost componentAmeren’s consolidated financial statements. See Note 8 – Related-party Transactions under Part I, Item 1, of net periodic benefit income at Ameren Services. The non-service cost component of net periodic benefit cost or income at Ameren Services is allocated to the segments and primarily included in the segments’ other operations and maintenance expenses. Other operations and maintenance expenses were comparable at Ameren Transmission between periods.this report for additional information.
Ameren Missouri
Other operations and maintenance expenses increased $4$15 million in the three months ended September 30, 2023,March 31, 2024, compared with the year-ago period. Other operationsperiod, primarily because of the following items:
•A $15 million charge related to an increase in the estimated minimum cost of additional mitigation relief associated with NSR and maintenance decreased $12Clean Air Act litigation related to the Rush Island Energy Center, see Note 9 - Commitments and Contingencies under Part 1, Item 1, of this report for more information.
•Individually insignificant increases of $8 million in the nine months ended September 30, 2023. The following items decreasedvarious other operations and maintenance in the threeexpenses, including legal costs, renewable development costs, cloud computing costs, and nine months ended September 30, 2023, compared with the year-ago periods (except where a specific period is referenced):
•The cash surrender value of COLI increased $20 million in the nine months ended September 30, 2023. In the nine months ended September 30, 2023, the effect of changes in the cash surrender value of COLI resulted in gains of $2 million, compared with losses of $18 million in the year-ago period.
•The recognitionamortization of regulatory assets forassociated with previously expensed costs approved for recovery pursuant to the June 2023 MoPSC rate order decreased other operations and maintenance expenses $15 million fororder.
The above increases were partially offset by the nine months ended September 30, 2023.
•Renewable development costs decreased $8 million in the nine months ended September 30, 2023 as the MoPSC order approving CCNs for the Boomtown and Huck Finn solar projects in the first half of 2023 led to increased capitalization of renewable development costs pursuant to anticipated recovery from customers.following items:
•LaborPension and benefit costs decreased $5$11 million, in the three months ended September 30, 2023, primarily because of a lower base level of expenses, reflectedsubject to a tracker, included in electric servicecustomer rates pursuant to the June 2023 MoPSC electric rate order, which became effective July 9, 2023.order. See Note 11 - Retirement Benefits under Part 1, Item 1 of this report for more information.
•Transmission and distribution expenditures, excluding stormEnergy center costs decreased $4$5 million, primarily because of lower Callaway Energy Center refueling and maintenance costs during the fall 2023 outage, compared to the spring 2022 outage.
Ameren Illinois
Other operations and maintenance expenses increased $8 million in the three months ended September 30, 2023, primarily because of a shift from operations and maintenance to capital activity resulting from major storms experienced throughout the service territory in July and August 2023 and timing of vegetation management expenditures.
The following items increased other operations and maintenance expenses in the three and nine months ended September 30, 2023,March 31, 2024, compared with the year-ago periods (except where a specific period is referenced):
•Labor and benefit costs increased $6 million in the nine months ended September 30, 2023, primarily because of increased medical and retirement benefits.
•, Transmission and distribution storm related-costs increased $9 million and $8 million, respectively, due to the major storms activity discussed above.
•Energy center operating and maintenance costs increased $4 million in both periods due, in part, to increased activity in the three months ended September 30, 2023, based on the maintenance outage schedule, as well as the effect of amortization of increased costs related to the spring 2022 Callaway Energy Center refueling and maintenance outage, which began amortizing in June 2022, in the nine months ended September 30, 2023.
•MEEIA customer energy-efficiency program spend increased $4 million in the nine months ended September 30, 2023, as approved by the MoPSC.
•Bad debt expense increased $3 million in the nine months ended September 30, 2023, primarily because of an increase in write-off activity.
•Costs for injuries and damages increased $3 million in the nine months ended September 30, 2023, primarily because of an increase in claims.
Ameren Illinois
Other operations and maintenance expenses decreased $15 million and $60 million in the three and nine months ended September 30, 2023, respectively, compared with the year-ago periods, as discussed below. Other operations and maintenance expenses were comparable at Ameren Illinois Transmission between periods.
Ameren Illinois Electric Distribution
Other operations and maintenance expenses decreased $13 million and $46increased $7 million in the three and nine months ended September 30, 2023, respectively,March 31, 2024, compared with the year-ago periods. Theperiod primarily due to the following items decreased other operations and maintenance expenses in the three and nine months ended September 30, 2023, compared with the year-ago periods (except where a specific period is referenced):items:
•Bad debt costs decreased $11increased $6 million, and $34 million, respectively,primarily because of a lower amounthigher base level of costsexpenses included in customer rates pursuant to the associated rider.
•The cash surrender value of COLI increased $10 million in the nine months ended September 30, 2023, primarily because of favorable market returns in 2023, compared with unfavorable market returns in the year-ago period.
•Pension and benefit costs decreased $5 million and $9 million, primarily related to decreased pension service costs.
•Costs for injuries and damages decreased $4 million in the nine months ended September 30, 2023, primarily because of a decrease in claims.
•Distribution system expenditures decreased $4 million in the nine months ended September 30, 2023, primarily because of a shift from operations and maintenance to capital activity resulting from major storms in late June, July, and August 2023 and timing of vegetation management expenditures.
The above decreases in the three and nine months ended September 30, 2023, compared with the year-ago periods, were partially offset by the below items (except where a specific period is referenced):
•Storm-related costs, net of deferred costs and including related amortizations of deferred balances in accordance with IEIMA, increased $5 million in the nine months ended September 30, 2023, due to the 2023 major storm activity discussed above.
•Amortization of regulatory assets associated with customer energy-efficiency investments under formula ratemaking increased $3 million and $7 million, respectively.million.
•Environmental remediation costs increasedThe above increases were partially offset by a decrease of $4 million because of a reduction in the nine months ended September 30, 2023, primarily due to increased prices of contractor services.
environmental remediation rider costs. Ameren Illinois Natural Gas
Other operations and maintenance expenses decreased $3 million in the three months ended September 30, 2023, compared to the year-ago period, primarily because of a decrease in pension service costs. Other operations and maintenance costs decreased $12 million in the nine months ended September 30, 2023, compared with the year-ago period, in part, because of a $5 million increase in the cash surrender value of COLI. In the nine months ended September 30, 2023, the effect of changes in the cash surrender value of COLI resulted in a gain of $1 million, compared with a loss of $4 million, in the year-ago period. Other operations and maintenance expenses also decreased $5 million in the nine months ended September 30, 2023, because of decreased distribution system expenditures, primarily because of the timing of inspections, as well as higher capitalization of labor costs resulting from more capital activity. Additionally, other operations and maintenance expenses decreased $3 million because of reduced need for environmental remediation. The decreases in the nine months ended September 30, 2023 were partially offset by a $4 million increase in energy efficiency rider costs, consistent with the amounts allowed by the ICC.comparable between periods.
Depreciation and Amortization Expenses
| | | | | | | | | | | | | | | | | | | | |
| | | Increase by Segment | |
| | | Overall Ameren Increase of $19 Million (QTD YoY) | | Overall Ameren Increase of $59 Million (YTD YoY) | |
| Total by Segment(a) | | Overall Ameren Increase of $41 Million | | |
(a)Includes $34 million and $31 million at Ameren Transmission in the three months ended September 30, 2023 and 2022, respectively. Also, includes other/intersegment eliminations of $3$1 million and $3$1 million in the three months ended September 30, 2023 and 2022, respectively, and $5 million and $5 million in the nine months ended September 30, 2023March 31, 2024 and 2022,2023, respectively.
| | | | | | | | | | | | | | | | | | | | | | | | | | | | | |
| | Ameren Missouri | | | Ameren Illinois Natural Gas | | | Other/Intersegment Eliminations |
| | | | | | | | | |
| | Ameren Illinois Electric Distribution | | Ameren Transmission | | | | |
Depreciation and amortization expenses increased $19$41 million, $9$20 million, and $9$19 million in the three months ended September 30, 2023, and $59 million, $29 million, and $28 million in the nine months ended September 30, 2023,March 31, 2024, compared with the year-ago periods,period, at Ameren, Ameren Missouri,Illinois, and Ameren Illinois,Missouri, respectively, primarily because of additional property, plant, and equipment investments across their respective segments. Ameren’s and Ameren Missouri’s depreciation and amortization expenses for the three and nine months ended September 30, 2023,March 31, 2024, compared with the year-ago periods,period, were affected by the following, (except where a specific period is referenced), which include the effect of the additional investments at Ameren Missouri:
•Increased depreciation and amortization of $20 million and $31 million, respectively, due to the inclusion in base rates of amounts previously deferred under the PISA and RESRAM effective February 28, 2022, and July 9, 2023, pursuant to the December 2021 and June 2023 MoPSC electric rate orders, respectively.order.
•The lower net under-recovery of RESRAM eligible expenses and increased amortization of prior deferrals increased depreciation and amortization expenses by $7 million.
•Depreciation and amortization rate changes pursuant to the electric rate orders noted above, which increased depreciation and amortization expenses by $2 million and $13 million, respectively.million.
•Depreciation and amortization expenses at Ameren and Ameren Missouri reflected a deferral to a regulatory asset of depreciation associated with investments in eligible property, plant, and amortization expensesequipment not yet included in base rates, pursuant to PISA and RESRAM. The amount of depreciationBase rates were updated to include the eligible property, plant, and amortization expenses included in base rates for PISA and RESRAM deferrals was updatedequipment in-service through December 31, 2022, when new customer rates became effective on February 28, 2022, pursuant to the December 2021 MoPSC electric rate order, which incorporated deferrals through September 30, 2021; and when new customer rates became effective July 9, 2023, pursuant to the June 2023 MoPSC electric rate order, which incorporated deferrals through December 31, 2022.order. The effect of lowerrebasing PISA and RESRAM, partially offset by increased amortization of prior PISA deferrals, and increased depreciation and amortization expenses, primarily because of electric system capital additions, increased depreciation $9 million in the nine months ended September 30, 2023.
•The higher net under-recovery of RESRAM eligible expenses decreased depreciation and amortization expenses by $2 million and $13 million, respectively.$9 million.
•The higher net deferral pursuant to a tracker related to certain excess deferred income taxes, which decreased depreciation and amortization expenses by $9 million and $11 million, respectively.
•The impact of the retirement of the Meramec Energy Center in December 2022 resulted in a $3 million decrease to depreciation and amortization expenses in the nine months ended September 30, 2023, primarily due to the deferral in 2022 of the energy center’s depreciation and amortization expenses and resulting amortization of that deferral pursuant to the December 2021 MoPSC electric rate order, which established a five-year recovery period for certain Meramec Energy Center costs beginning February 28, 2022.$2 million.
Taxes Other Than Income Taxes
| | | | | | | | | | | | | | | | | | | | |
| | | Increase (Decrease) by Segment | |
| | | Overall Ameren Increase of $3 Million (QTD YoY) | | Overall Ameren Decrease of $17 Million (YTD YoY) | |
| Total by Segment(a) | | Overall Ameren Increase of $8 Million | | |
(a)Includes $2 million $3 million, $6 million, and $7$2 million at Ameren Transmission in the three months ended September 30,March 31, 2024 and 2023, respectively, and 2022, and in the nine months ended September 30, 2023 and 2022, respectively. Also includes other/intersegment eliminations of $4 million, $2 million, $11$3 million and $8$4 million in the three months ended September 30,March 31, 2024 and 2023, and 2022, and in the nine months ended September 30, 2023 and 2022, respectively.
| | | | | | | | | | | | | | | | | | | | | | | | | | | | | |
| | Ameren Missouri | | | Ameren Illinois Natural Gas | | | Other/Intersegment Eliminations |
| | | | | | | | | |
| | Ameren Illinois Electric Distribution | | Ameren Transmission | | | | |
Taxes other than income taxes increased $3$8 million in the three months ended September 30, 2023,March 31, 2024, compared with the year-ago period, primarily because of athe absence in 2024 of $5 million increase in excise taxes at Ameren Missouri, primarily related to increased retail electric rates pursuant to the June 2023 MoPSC electric rate order. Taxes other than income taxes decreased $17 million in the nine months ended September 30, 2023, compared with the year-ago period, largely because of a $10 million decrease in excise taxes at Ameren Illinois Natural Gas, primarily resulting from decreased sales revenues. Taxes other than income taxes also decreased $7 million and $2 million in the nine months ended September 30, 2023, at Ameren Missouri and Ameren Illinois, respectively, because of employee retention tax credits received in 2023 at Ameren Missouri under the Coronavirus Aid, Relief, and Economic Security Act. The decreases in taxesTaxes other than income taxes in the nine months ended September 30, 2023, were partially offset by a $5increased $2 million at Ameren Illinois Natural Gas due to an increase in excise taxes at Ameren Missouri, primarily related to increased retail electric rates pursuant to the June 2023 MoPSC electric rate order.resulting from higher invested capital taxes.
Other Income, Net
| | | | | | | | | | | | | | | | | | | | |
| | | Increase (Decrease) by Segment | |
| Total by Segment | | | Overall Ameren Increase of $43$11 Million (QTD YoY) | | Overall Ameren Increase of $81 Million (YTD YoY) | |
| Total by Segment(a)
| | | |
(a)Includes $7 million and $5 million at Ameren Transmission in the three months ended September 30, 2023 and 2022, respectively.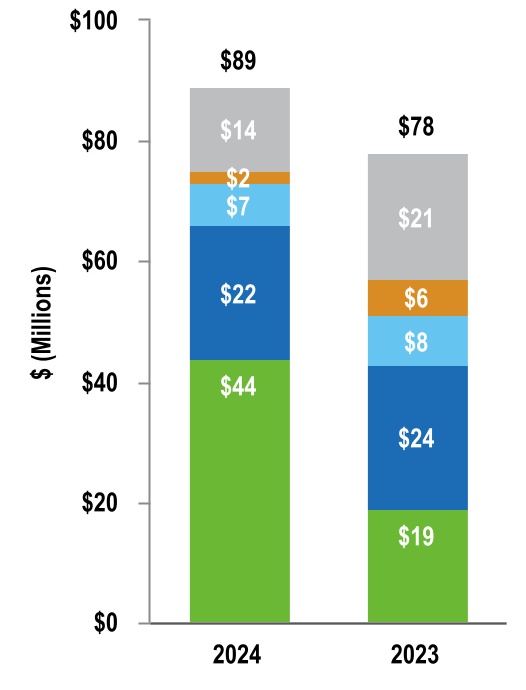
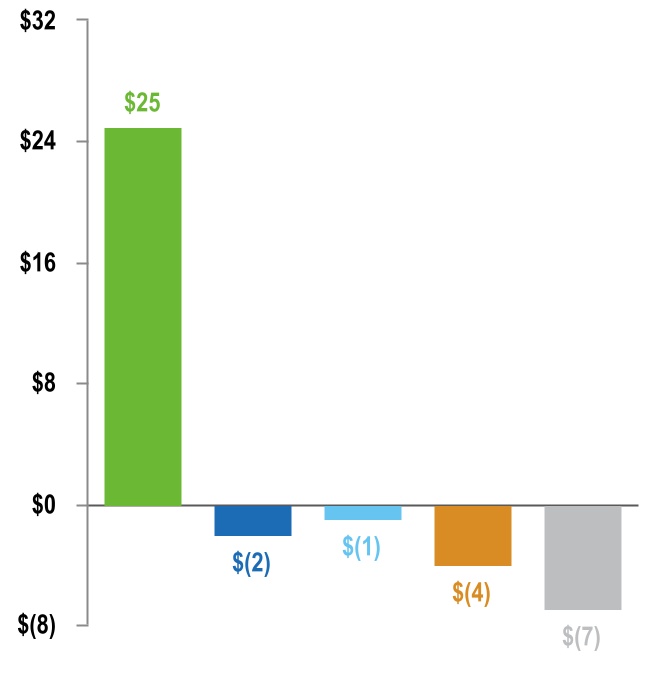
| | | | | | | | | | | | | | | | | | | | | | | | | | | | | |
| | Ameren Missouri | | | Ameren Illinois Natural Gas | | | Other/Intersegment Eliminations |
| | | | | | | | | |
| | Ameren Illinois Electric Distribution | | Ameren Transmission | | | | |
See Note 5 – Other Income, Net, under Part I, Item 1, of this report for additional information. See Note 11 – Retirement Benefits under Part I, Item 1, of this report for more information on the non-service cost components of net periodic benefit income.
Ameren
Other income, net, increased $43 million and $81$11 million in the three and nine months ended September 30, 2023, respectively,March 31, 2024, compared with the year-ago periods.period. In addition to changes discussed below, other income, net, increased $8decreased $5 million, and $22 million, respectively, because of increases in the non-service cost component of net periodic benefit income for activity not reported as part of a segment. Additionally, other income, net, increased $3decreased $2 million, in the three months ended September 30, 2023, compared with the year-ago period, for activity not reported as part of a segment, because of a prior-period lossdecreased income from equity method investments, primarily associated with investments to advance clean and resilient energy technologies.
Ameren Transmission
Other income, net, was comparable at Ameren Transmission betweendecreased $4 million in the three months ended September 30, 2023 and 2022. Other income, net, increased $9 million in the nine months ended September 30, 2023,March 31, 2024, compared with the year-ago period, largelyprimarily because of a $4 million increasedecrease in the allowance for equity funds used during construction, primarily resulting from a higher average monthly equity-to-debt ratio at ATXI, and higherrelated to lower average construction work in progress balances. balances and an increased level of short-term borrowings included in the calculation.
Ameren Missouri
Other income, net, also increased $2$25 million in the three months ended March 31, 2024, compared with the year-ago period, primarily because of ana $21 million increase in the non-service cost component of net periodic benefit income.
Ameren Missouri
Other income, net, increased $19 million and $13 million in the three and nine months ended September 30, 2023, respectively, compared with the year-ago periods, primarily because of a $21 million increase in both periodschanges in the non-service cost componentbase level of net periodic benefit incomepension and postretirement costs pursuant to the June 2023 MoPSC electric rate order, which reflected the effect of such increase in electric service rates effective July 9, 2023.order. Other income, net, also increased $3$5 million in the nine months ended September 30, 2023, compared with the year-ago period, because of a higher allowance for equity funds used during construction, resulting from higher average construction work in progress balances. These increases in other income, net, were partially offset by decreases of $6 million and $17 million, respectively, in
interest income on industrial development revenue bonds, as these bonds were settled in December 2022 and January 2023.
Ameren Illinois
Other income, net, increased $11decreased $6 million in the three months ended September 30, 2023,March 31, 2024, compared with the year-ago period, primarily because of increasesa $3 million decrease in the non-service cost component of net periodic benefit income of $6 million and $3 million at Ameren Illinois Electric Distribution and Ameren Illinois Natural Gas, respectively. Other income, net, also increaseda $3 million because of higher interest income on under-recovered balances associated with regulatory recovery mechanismsdecrease in the allowance for equity funds used during construction at Ameren Illinois Electric Distribution. Other income, net, increased $40 million in the nine months ended September 30, 2023, compared with the year-ago period,Transmission, primarily because of increaseslower average construction work in progress balances and an increased level of short-term borrowings included in the non-service cost componentcalculation.
Interest Charges
| | | | | | | | | | | | | | | | | | | | |
| | | Increase by Segment | |
| | | Overall Ameren Increase of $26 Million (QTD YoY) | | Overall Ameren Increase of $57 Million (YTD YoY) | |
| Total by Segment | | Overall Ameren Increase of $27 Million | | |
| | | | | | | | | | | | | | | | | | | | | | | | | | | | | |
| | Ameren Missouri | | | Ameren Illinois Natural Gas | | | Other/Intersegment Eliminations |
| | | | | | | | | |
| | Ameren Illinois Electric Distribution | | Ameren Transmission | | | | |
See Note 3 – Short-term Debt and Liquidity under Part I, Item 1, of this report and the Long-term Debt and Equity section below for additional information on short-term borrowings and long-term debt, respectively, discussed below. See Note 4 – Long-term Debt and Equity Financings under Part I, Item 1, of this report for additional information on the termination of the financing obligation agreement discussed below.
Ameren
Interest charges increased $26 million and $57$27 million in the three and nine months ended September 30, 2023, respectively,March 31, 2024, compared with the year-ago periods.period. In addition to changes by segments discussed below, interest charges increased $8$6 million and $22 million, respectively, at Ameren (parent) because of higher interest rates on increased levels of short-term borrowings.
Ameren Transmission
Interest charges increased $4 million and $7 million in the three and nine months ended September 30, 2023, respectively, compared with the year-ago periods, primarily because of issuances of long-term debt in AugustNovember and November 2022 and MayDecember of 2023, which collectively increased interest charges by $5$17 million. The net proceeds from these issuances were used to repay short-term borrowings, which decreased short-term interest expense by $12 million and $14compared with the year-ago period.
Ameren Transmission
Interest charges increased $7 million respectively. The increases in the ninethree months ended September 30, 2023, were
partially offset by a $7 million reduction to interest chargesMarch 31, 2024, compared with the year-ago period, because of ana $3 million increase in the borrowed funds capitalized as part of the allowance for funds used during construction, primarily due to increased average construction work in progress balanceslevels of intercompany borrowings and a $3 million increase due to higher applicable borrowing rate.long-term debt balances. Additionally, interest charges increased because of a higher interest rate on an increased level of short-term borrowings.
Ameren Missouri
Interest charges increased $5 million and $9$11 million in the three and nine months ended September 30, 2023, respectively,March 31, 2024, compared with the year-ago periods. Theperiod, because of the following items increased interest charges in the three and nine months ended September 30, 2023, compared with the year-ago periods (except where a specific period is referenced):items:
•Issuances of long-term debt in April 2022March 2023 and March 2023January 2024 collectively increased interest charges by $7 million and $20 million, respectively.
•Interest charges increased $2 million and $10 million, respectively, because of higher interest rates on increased levels of short-term borrowings.$9 million.
•Interest charges reflected a deferral to a regulatory asset of interest chargesassociated with investments in eligible property, plant, and equipment not yet included in base rates, pursuant to PISA and RESRAM. The amount of interest charges included in baseBase rates for PISAwere updated to include the eligible property, plant, and RESRAM deferrals was updatedequipment in-service through December 31, 2022, when new customer rates became effective on February 28, 2022, pursuant to the December 2021 MoPSC electric rate order, which incorporated deferrals through September 30, 2021, and when new customer rates became effective July 9, 2023, pursuant to the June 2023 MoPSC electric rate order, which incorporated deferrals through December 31, 2022. Lower deferrals in 2023, dueorder. This update to the inclusion in base rates resulted in a lower deferral of interest associated with certain property, plant, and equipment previously deferred under thein 2024 pursuant to PISA and RESRAM that increased interest charges by $4 million and $6 million, respectively.million.
The following items decreased interest charges in the three and nine months ended September 30, 2023 (except whereabove increases were partially offset by a specific period is referenced):
•Interest charges decreased $6$5 million and $17 million, respectively, primarily due to the termination of a financing obligation agreementdecrease related to the CT energy center in Audrain County. The decreases in interest charges associated with this agreement are offset by decreases in interest income on related industrial development revenue bonds, as discussed above.
•Interest charges decreased $3 million and $12 million, respectively, becauselower levels of an increase in the borrowed funds capitalized as part of the allowance for funds used during construction, primarily due to higher average construction work in process balances and a higher applicable borrowing rate.short-term borrowings.
Ameren Illinois
Interest charges increased $12 million and $26$8 million in the three and nine months ended September 30, 2023, respectively,March 31, 2024, compared with the year-ago periods,period, primarily because of the issuances of long-term debt in 2022 and 2023. Issuances of long-term debt at Ameren Illinois in August and November 2022 and May 2023 collectivelywhich increased interest charges by $6$2 million and $14 million, respectively, at both Ameren Illinois Electric Distribution by $5 million and $11 million, respectively, at Ameren Illinois Transmission, and $5 million and $9 million, respectively, at Ameren Illinois Natural Gas. The increases in the nine months ended September 30, 2023 were partially offset by a $4 million reduction torespectively. Additionally, interest charges increased at Ameren Illinois Transmission because of an increase in the borrowed funds capitalized as part of the allowance for funds used during construction, primarily due to higher average construction work in process balances and a higher applicable borrowing rate.interest rate on an increased level of short-term borrowings.
Income Taxes
The following table presents effective income tax rates for the three and nine months ended September 30, 2023March 31, 2024 and 2022:2023:
| | Three Months(a) | | Nine Months(a) |
| 2023 | | 2022 | | 2023 | | 2022 |
| | | | Three Months(a) | |
| | | | Three Months(a) | |
| | | | Three Months(a) | |
| | | | | | 2024 | | | | | | | | 2024 | | 2023 |
| Ameren | Ameren | | 12 | % | | 15 | % | | 13 | % | | 14 | % | Ameren | | | | | | 14 | % | | 12 | % |
| Ameren Missouri | Ameren Missouri | | (3) | % | | (2) | % | | (3) | % | | (2) | % | Ameren Missouri | | | | | | 4 | % | | (4) | % |
| Ameren Illinois | Ameren Illinois | | 25 | % | | 26 | % | | 25 | % | | 26 | % | Ameren Illinois | | | | | | 24 | % | | 25 | % |
| Ameren Illinois Electric Distribution | Ameren Illinois Electric Distribution | | 21 | % | | 25 | % | | 24 | % | | 25 | % | Ameren Illinois Electric Distribution | | | | | | 17 | % | | 24 | % |
| Ameren Illinois Natural Gas | Ameren Illinois Natural Gas | | (b) | | (b) | | 27 | % | | 27 | % | Ameren Illinois Natural Gas | | | | | | 26 | % | | 26 | % |
| Ameren Illinois Transmission | Ameren Illinois Transmission | | 27 | % | | 26 | % | | 26 | % | | 26 | % | Ameren Illinois Transmission | | | | | | 25 | % | | 26 | % |
| Ameren Transmission | Ameren Transmission | | 27 | % | | 25 | % | | 26 | % | | 26 | % | Ameren Transmission | | | | | | 26 | % | | 26 | % |
|
(a)Estimate of the annual effective income tax rate adjusted to reflect the tax effect of items discrete to the three and nine months ended September 30, 2023March 31, 2024 and 2022.
(b)Not meaningful because of the insignificant amount of income/(loss) before income taxes.2023.
See Note 12 – Income Taxes under Part I, Item 1, of this report for a reconciliation of the federal statutory corporate income tax rate to
the effective income tax rate for the Ameren Companies.
The effective tax rate was lower at Ameren Illinois Electric Distribution in the three months ended September 30, 2023,March 31, 2024, compared with the year-ago period, primarily because of the timing of excess deferred tax amortization and an increase in excess deferred tax amortization pursuant to an ICC order andwhich was offset by a corresponding decrease in revenues. The effective tax rate was higher at Ameren Transmission in the three months ended September 30, 2023, compared with the year-ago period, primarily because of the timing of excess deferred tax amortization.
LIQUIDITY AND CAPITAL RESOURCES
Collections from our tariff-based revenues are our principal source of cash provided by operating activities. A diversified retail customer mix, primarily consisting of rate-regulated residential, commercial, and industrial customers, provides us with a reasonably predictable source of cash. In addition to using cash provided by operating activities, we use available cash, drawings under committed credit agreements, commercial paper issuances, and/or, in the case of Ameren Missouri and Ameren Illinois, short-term affiliate borrowings to support normal operations and temporary capital requirements. We may reduce our short-term borrowings with cash provided by operations or, at our discretion, with long-term borrowings, or, in the case of Ameren Missouri and Ameren Illinois, with capital contributions from Ameren (parent). As of September 30, 2023,March 31, 2024, there have been no material changes other than in the ordinary course of business related to cash requirements arising from these long-term commitments provided in Item 7 of the Form 10-K.
We expect to make significant capital expenditures over the next five years, supported by a combination of long-term debt and equity, as we invest in our electric and natural gas utility infrastructure to support overall system reliability, grid modernization, renewable energy target requirements, environmental compliance, and other improvements. For additional information about our long-term debt outstanding, including maturities due within one year, and the applicable interest rates, see Note 5 – Long-term Debt and Equity Financings under Part II, Item 8 of the Form 10-K and Note 4 – Long-term Debt and Equity Financings under Part I, Item 1, of this report. As part of its funding plan for capital expenditures, Ameren is using newly issued shares of common stock to satisfy requirements under the DRPlus and employee benefit plans and expects to continue to do so through at least 2027. Ameren expects these equity issuances to total about $100 million annually.2028. Additionally, Ameren has an ATM program under which Ameren may offer and sell from time to time common stock, which includes the ability to enter into forward sales agreements, subject to market conditions and other factors. There were no shares issued under the ATM program forduring the ninethree months ended September 30, 2023.March 31, 2024. As of September 30, 2023,March 31, 2024, Ameren has entered intohad multiple forward sale agreements that could be settled under the ATM program with various counterparties relating to 4.32.9 million shares of common stock. Ameren expects to settle approximately $300$230 million of the forward sale agreements with physical delivery of 3.22.9 million shares of common stock by December 31, 2023. In addition to2024. Including issuances under the DRPlus and employee benefit plans, Ameren plans to issue approximately $500$300 million of equity in 2024 and approximately $600 million of equity each year from 20242025 to 2027.2028. As of September 30, 2023,March 31, 2024, Ameren had approximately $910$770 million of common stock available for sale under the ATM program, which takes into account the forward sale agreements in effect as of September 30, 2023. In the long-term,March 31, 2024. Ameren expects its equity to total capitalization to be about 45%, with the intent to support solid investment-grade credit ratings. See Long-term Debt and Equity below and Note 4 – Long-term Debt and Equity Financings under Part I, Item 1, of this report for additional information on the ATM program, including the forward sale agreements under the ATM program.program relating to common stock.
The following table presents net cash provided by (used in) operating, investing, and financing activities for the ninethree months ended September 30, 2023March 31, 2024 and 2022:2023:
| | Net Cash Provided By
Operating Activities | | Net Cash Used In
Investing Activities | | Net Cash Provided By
Financing Activities |
| 2023 | | 2022 | | Variance | | 2023 | | 2022 | | Variance | | 2023 | | 2022 | | Variance |
| Net Cash Provided By
Operating Activities | | | Net Cash Provided By
Operating Activities | | Net Cash Used In
Investing Activities | | Net Cash Provided By (Used In)
Financing Activities |
| 2024 | | | 2024 | | 2023 | | Variance | | 2024 | | 2023 | | Variance | | 2024 | | 2023 | | Variance |
| Ameren | Ameren | $ | 2,031 | | (a) | $ | 1,599 | | (a) | $ | 432 | | | $ | (2,656) | | | $ | (2,458) | | | $ | (198) | | | $ | 655 | | | $ | 884 | | | $ | (229) | |
| | Ameren Missouri | Ameren Missouri | 1,031 | | | 726 | | | 305 | | | (1,338) | | | (1,255) | | | (83) | | | 307 | | | 528 | | | (221) | |
| Ameren Missouri | |
| Ameren Missouri | |
| Ameren Illinois | Ameren Illinois | 1,026 | | (a) | 835 | | (a) | 191 | | | (1,229) | | | (1,145) | | | (84) | | | 237 | | | 343 | | | (106) | |
(a)Both Ameren and Ameren Illinois’ cash provided by operating activities included cash outflows of $84$24 million and $61$25 million for the FEJA electric energy-efficiency rider and $6 million and $4$2 million for the customer generation rebate program for the ninethree months ended September 30,March 31, 2024 and 2023, and 2022, respectively.
Cash Flows from Operating Activities
Our cash provided by operating activities is affected by fluctuations of trade accounts receivable, inventories, and accounts and wages payable, among other things, as well as the unique regulatory environment for each of our businesses. Substantially all expenditures related to fuel, purchased power, and natural gas purchased for resale are recovered from customers through rate adjustment mechanisms, which may be adjusted without a traditional regulatory rate review, subject to prudence reviews. Similar regulatory mechanisms exist for certain other operating expenses that can also affect the timing of cash provided by operating activities. The timing of cash payments for costs recoverable under our regulatory mechanisms differs from the recovery period of those costs. Additionally, the seasonality of our electric and natural gas businesses, primarily caused by seasonal customer rates and changes in customer demand due to weather, significantly affects the amount and timing of our cash provided by operating activities.
As a result of the significant increase in customer demand and prices for natural gas and electricity experienced in mid-February 2021 due to extremely cold weather, Ameren Missouri and Ameren Illinois had under-recovered costs for the month of February 2021 under their PGA clauses and, for Ameren Missouri, under the FAC (Ameren Missouri – PGA $53 million, FAC $50 million; Ameren Illinois – PGA $221 million). Ameren Missouri’s PGA under-recovery is being collected from customers over 36 months beginning November 2021, pursuant to an October 2021 MoPSC order, and the FAC under-recovery was collected over eight months beginning October 2021. Ameren Illinois collected the PGA under-recovery over 18 months beginning April 2021.
Ameren
Ameren’s cash provided by operating activities increased $432decreased $4 million in the first ninethree months of 2023,2024, compared with the year-ago period. The following items contributed to the increase:decrease:
•A $282$104 million increase resulting from increased customer collections, primarily from base rate increases effective February 28, 2022, and July 9, 2023, pursuant to Ameren Missouri’s December 2021 and June 2023 MoPSC electric rate orders, respectively, electric transmission rate base growth, and an increase attributable to non-PGA regulatory mechanisms, partially offset by a decrease under Ameren Illinois’ PGA resulting from the recovery in 2022 of costs for the mid-February 2021 weather event discussed above.
•A $212 million decrease in net collateral posted with counterparties, primarily due to changes in the market prices of power, natural gas, and other fuels.
•A $78$39 million decreaseincrease in the cost of natural gas held in storage, primarily at Ameren Illinois, because of higher volumes, partially offset by lower commodity prices.
•A $42 million decrease in payments for nuclear refueling and maintenance outages at Ameren Missouri’s Callaway Energy Center, primarily due to the spring 2022 outage. The most recent refueling and maintenance outage at the Callaway Energy Center began in October 2023 and was completed in November 2023.
The following items partially offset the increasedecrease in Ameren’s cash from operating activities between periods:
•A $67$32 million increase in interest payments, primarily due to an increase in the average outstanding debttiming of payments for accounts payable and an increase in interest rates.prepaid expenses.
•A $57$28 million increase in coal inventory levels at Ameren Missouri, primarily due to fewer transportation delayshigher purchases of materials and less coal burnedsupplies inventories in 2023the year-ago period to support operations as a result of decreased generation volumes, whichlevels were affected by lower market power prices and decreased retail load because of both milder spring and early summer temperatures and warmer winter temperatures.increased to mitigate against potential supply disruptions.
•A $9$23 million increase due to higher coal deliveries in property taxthe year-ago period to bring coal inventories back to targeted levels after transportation delays experienced in 2022.
•A $22 million increase due to insurance proceeds received related to workers’ compensation payments made in 2023.
•An $18 million increase resulting from increased customer collections primarily from base rate increases effective July 1, 2023, at Ameren Missouri primarilypursuant to the June 2023 electric rate order and base rate increases effective November 28, 2023, at Ameren Illinois pursuant to the November 2023 natural gas rate order and electric transmission rate base growth, partially offset by lower customer collections under cost recovery mechanisms at Ameren Missouri and Ameren Illinois.
•An $8 million increase due to higher assessed property tax values.the timing of payments received from the DOE for reimbursement of spent nuclear fuel storage and related costs.
Ameren Missouri
Ameren Missouri’s cash provided by operating activities increased $305$24 million in the first ninethree months of 2023,2024, compared with the year-ago period. The following items contributed to the increase:
•A $201$47 million increase resultingincome tax refund from increased customer collections, primarily from base rate increases effective February 28, 2022, and July 9, 2023,Ameren (parent), pursuant to the December 2021 and June 2023 MoPSC electric rate orders, respectively, and an increase attributabletax allocation agreement, primarily due to regulatory mechanisms.lower taxable income compared the year-ago period.
•A $161$27 million decreaseincrease due to higher purchases of materials and supplies inventories in the year-ago period to support operations as levels were increased to mitigate against potential supply disruptions.
•A $23 million increase due to higher coal deliveries in the year-ago period to bring coal inventories back to targeted levels after transportation delays experienced in 2022.
•A $10 million increase due to the timing of payments for accounts payable and prepaid expenses.
•An $8 million increase due to the timing of payments received from the DOE for reimbursement of spent nuclear fuel storage and related costs.
The following items partially offset the increase in Ameren Missouri’s cash from operating activities between periods:
•A $72 million increase in net collateral posted with counterparties, primarily due to changes in the market prices of power, natural gas, and other fuels.
•A $42$16 million decrease in payments for nuclear refueling and maintenance outages at the Callaway Energy Center,resulting from lower customer collections under cost recovery mechanisms partially offset by increased customer collections primarily duefrom base rate increases effective July 1, 2023, pursuant to the spring 2022 outage. The most recent refueling and maintenance outage at the Callaway Energy Center began in OctoberJune 2023 and was completed in November 2023.electric rate order.
The following items partially offset the increase in Ameren Missouri’s cash from operating activities between periods:
•A $57 million increase in coal inventory levels, primarily due to fewer transportation delays and less coal burned in 2023 as a result of decreased generation volumes, which were affected by lower market power prices and decreased retail load because of both milder spring and early summer temperatures and warmer winter temperatures.
•A $21 million increase in interest payments, primarily due to an increase in the average outstanding debt and an increase in interest rates.
•A $9 million increase in property tax payments, primarily due to higher assessed property tax values.
Ameren Illinois
Ameren Illinois’ cash provided by operating activities increased $191$42 million in the first ninethree months of 2023,2024, compared with the year-ago period. The following items contributed to the increase:
•An $92A $29 million increase resulting from increased customer collections primarily from base rate increases effective November 28, 2023, pursuant to the November 2023 natural gas rate order and electric transmission rate base growth, and an increase attributable to non-PGA regulatory mechanisms, partially offset by a decreaselower customer collections under the PGA resulting from thecost recovery in 2022 of costs for the mid-February 2021 weather event discussed above.mechanisms.
•A $73$26 million decrease inincrease due to the costtiming of natural gas held in storage because of lower commodity prices.payments for accounts payable and prepaid expenses
•A $50$22 million decrease in net collateral posted with counterparties,income tax refund from Ameren (parent), pursuant to the tax allocation agreement, primarily due to changeslower taxable income compared to the year-ago period.
•A $22 million increase due to insurance proceeds received related to workers’ compensation payments made in 2023.
•A $5 million increase due to higher purchases of materials and supplies inventories in the market prices of power and natural gas.year-ago period to support operations as levels were increased to mitigate against potential supply disruptions.
The following items partially offset the increase in Ameren Illinois’ cash from operating activities between periods:
•A $23$36 million decreaseincrease in income tax refunds from Ameren (parent), pursuant to the tax allocation agreement, primarily due to decreased refundscost of income tax extension payment. Income tax extension payments are a true-up to cash paid to Ameren (parent) based on income taxes for the preceding year’s taxable income compared to the related estimated payments.natural gas held in storage because of higher volumes, partially offset by lower commodity prices.
•A $21$32 million increase in interest payments,net collateral posted with counterparties, primarily due to an increasechanges in the average outstanding debt and an increase in interest rates.market prices of natural gas.
Cash Flows from Investing Activities
Ameren’s cash used in investing activities increased $198decreased $58 million during the first ninethree months of 2023,2024, compared with the year-ago period, primarily as a result of a $134$41 million increasedecrease in capital expenditures, largely resulting from increased storm-relateddecreased expenditures for electric transmission infrastructure upgrades at Ameren Illinois and Ameren Missouri, and software projects at Ameren Missouri, partially offset by a $10 million increase in capital expenditures at ATXI. In addition, cash used in investing activities decreased $8 million due to the timing of nuclear fuel expenditures at Ameren Missouri and Ameren Illinois and electric transmission upgrades at ATXI. ATXI’s capital expenditures increased $43 million during the first nine months of 2023, compared with the year-ago period. Also, at Ameren Missouri, a $41 million increase in nuclear fuel expenditures during the ninethree months ended September 30, 2023, was partially offset by the receipt in 2022 of $17 million in insurance proceeds.March 31, 2024.
Ameren Missouri’s cash used in investing activities increased $83decreased $31 million during the first ninethree months of 2023,2024, compared with the year-ago period, primarily due to nuclear fuel expenditures of $63 million compared to $22 million in the year-ago period, largely due to timing resulting from refuel purchases in 2021 for the Callaway Energy Center spring 2022 refuel. Also, cash used in investing activities increased $18 million as a result of increaseda $15 million decrease in capital expenditures, during the first nine months of 2023, compared with the year-ago period, largely resulting from decreased expenditures for electric transmission infrastructure upgrades and software projects, and an increase in storm-related expenditures$8 million decrease due to the timing of $27 million. In addition, in 2022, Ameren Missouri received $17 million in insurance proceeds for the Callaway Energy Center’s generator.nuclear fuel expenditures.
Ameren Illinois’ cash used in investing activities increased $84decreased $35 million during the first ninethree months of 2023,2024, compared with the year-ago period, as a result of a $81$34 million increasedecrease in capital expenditures, largely resulting from increased storm-relateddecreased expenditures of $70 million.for electric transmission infrastructure upgrades.
Cash Flows from Financing Activities
Cash provided by, or used in, financing activities is a result of our financing needs, which depend on the level of cash provided by operating activities, the level of cash used in investing activities, the level of dividends, and our long-term debt maturities, among other things.
Ameren’s cash provided by consolidated financing activities decreased $229increased $8 million during the first ninethree months of 2023,2024, compared with the year-ago period. During the first ninethree months of 2023,2024, Ameren utilized net proceeds from the issuance of long-term debt of $1 billion$347 million for capital expenditures and to repay then-outstanding short-term debt, and to repay $100 million of long-term debt maturities.debt. In addition, during the first ninethree months of 2023,2024, Ameren utilized proceeds from net commercial paper issuances of $272$332 million along with cash provided by operating activities to fund, in part, capital expenditures. In comparison, during the first ninethree months of 2022,2023, Ameren utilized net proceeds from the issuance of long-term debt of $1.1 billion$499 million for capital expenditures and to repay then-outstanding short-term debt, to repay $450 million of long-term debt maturities, and for capital expenditures.debt. In addition, during the first ninethree months of 2022,2023, Ameren utilized proceeds from net commercial paper issuances of $675$179 million along with cash provided by operating activities to fund, in part, capital expenditures. During the first ninethree months of 2023,2024, Ameren paid common stock dividends of $496$178 million, compared with $457$165 million in the year-ago period, as a result of an increase in both the dividend rate and the number of common shares outstanding.
Ameren Missouri’s cash provided by financing activities decreased $221$47 million during the first ninethree months of 2023,2024, compared with the year-ago period. During the first ninethree months of 2024, Ameren Missouri utilized net proceeds from the issuance of long-term debt of $347 million for capital expenditures and to repay then-outstanding short-term debt. Additionally, during the first three months of 2024, Ameren Missouri utilized net commercial paper issuances totaling $274 million and cash provided by operating activities to fund, in part, capital expenditures, and repaid $306 million of money pool borrowings. In comparison, during the first three months of 2023, Ameren Missouri utilized net proceeds from the issuance of long-term debt of $499 million for capital expenditures and to repay then-outstanding short-term debt. DuringIn addition, during the first ninethree months of 2023, Ameren Missouri repaid net commercial paper borrowings totaling $172$132 million. In comparison,
Ameren Illinois’ financing activities used cash of $23 million during the first ninethree months of 2022, Ameren Missouri utilized net proceeds from the issuance2024, compared to providing cash of long-term debt of $524$60 million to repay then-outstanding short-term debt and for capital expenditures. In
addition, during the year-ago period. During the first ninethree months of 2022,2024, Ameren MissouriIllinois utilized proceeds from net commercial paper issuances of $13$58 million and cash provided by operating activities to fund, in part, capital expenditures.
Ameren Illinois’ cash provided by financing activities decreased $106 million during the first nine months of 2023, compared with the year-ago period. During the first nine months of 2023, Ameren Illinois utilized net proceeds from the issuance of long-term debt of $498 millionexpenditures, and to repay then-outstanding short-term debt and $100$81 million of long-term debt maturities. In addition, during the first nine months of 2023, Ameren Illinois repaid net commercial paper borrowings totaling $205 million. Ameren Illinois also received a $50 million capital contribution from Ameren (parent) during the nine months ended September 30, 2023.money pool borrowings. In comparison, during the first ninethree months of 2022, Ameren Illinois utilized net proceeds from the issuance of long-term debt of $499 million to repay $400 million of maturities of long-term debt and to repay a portion of the then-outstanding short-term debt. Additionally,2024, Ameren Illinois utilized proceeds from net commercial paper issuances of $250$60 million and cash provided by operating activities to fund, in part, capital expenditures.
See Long-term Debt and Equity in this section for additional information on issuances of long-term debt, issuances of common stock, and noncash settlement of a financing obligation.
Credit Facility Borrowings and Liquidity
The following table presents Ameren’s consolidated liquidity as of September 30, 2023:March 31, 2024:
| | | | | | | | | |
| | | | | Available at September 30, 2023March 31, 2024 |
Ameren (parent)and Ameren Missouri: | | | | | |
Missouri Credit Agreement – borrowing capacity | | | | | $ | 1,400 | |
| | | | | |
| Less: Ameren (parent) commercial paper outstanding | | | | | 661 |
| Less: Ameren Missouri commercial paper outstanding | | | | | 157444 | |
| | | | | |
| Less: Letters of credit | | | | | 25 | |
| Missouri Credit Agreement – subtotal | | | | | 580951 | |
| Ameren (parent) and Ameren Illinois: | | | | | |
Illinois Credit Agreement – borrowing capacity | | | | | 1,200 | |
| | | | | |
| Less: Ameren (parent) commercial paper outstanding | | | | | 463 |
| Less: Ameren Illinois commercial paper outstanding | | | | | 59424 | |
| | | | | |
| | | | | |
Illinois Credit Agreement – subtotal | | | | | 678776 | |
| Subtotal | | | | | $ | 1,2581,727 | |
| Add: Cash and cash equivalents | | | | | 885 | |
Net Available Liquidity(a) | | | | | $ | 1,2661,812 | |
(a)Does not include Ameren’s forward equity sale agreements. See Note 4 – Long-term Debt and Equity Financings under Part I, Item 1, of this report for additional information.
The Credit Agreements, among other things, provide $2.6 billion of credit until maturity in December 2027. See Note 3 – Short-term Debt and Liquidity under Part I, Item 1, of this report for additional information on the Credit Agreements. During the ninethree months ended September 30, 2023, Ameren (parent),March 31, 2024, Ameren Missouri and Ameren Illinois each issued commercial paper. Borrowings under the Credit Agreements and commercial paper issuances are based upon available interest rates at the time of the borrowing or issuance.
Ameren has a money pool agreement with and among its utility subsidiaries to coordinate and to provide for certain short-term cash and working capital requirements. As short-term capital needs arise, and based on availability of funding sources, Ameren Missouri and Ameren Illinois will access funds from the utility money pool, the Credit Agreements, or the commercial paper programs depending on which option has the lowest interest rates.
See Note 3 – Short-term Debt and Liquidity under Part I, Item 1, of this report for additional information on credit agreements, commercial paper issuances, Ameren’s money pool arrangementsagreements and related borrowings, and relevant interest rates.
The issuance of short-term debt securities by Ameren’s utility subsidiaries is subject to FERC approval under the Federal Power Act. In January 2023, the FERC issued orders authorizing Ameren Missouri, Ameren Illinois, and ATXI to issue up to $1 billion, $1 billion, and $300 million, respectively, of short-term debt securities through January 2025.
The Ameren Companies continually evaluate the adequacy and appropriateness of their liquidity arrangements for changing business conditions. When business conditions warrant, changes may be made to existing credit agreements or to other borrowing arrangements, or other arrangements may be made.
Long-term Debt and Equity
The following table presents issuances (net of any issuance premiums or discounts) of long-term debt and equity, as well as maturities of long-term debt for the ninethree months ended September 30, 2023March 31, 2024 and 2022:2023:
| | | | | | | | | | | | | | | | | | | | |
| Month Issued, Redeemed, or Matured | | 2023 | | 2022 | |
| Issuances of Long-term Debt | | | | | | |
| | | | | | |
| | | | | | |
| | | | | | |
| Ameren Missouri: | | | | | | |
| 5.45% First mortgage bonds due 2053 | March | | 499 | | | — | | |
3.90% First mortgage bonds due 2052(a) | April | | — | | | 524 | | |
| Ameren Illinois: | | | | | | |
| 4.95% First mortgage bonds due 2033 | May | | 498 | | | — | | |
| 3.85% First mortgage bonds due 2032 | August | | — | | | 499 | | |
| | | | | | |
| ATXI: | | | | | | |
| 2.96% Senior unsecured notes due 2052 | August | | — | | | 95 | | |
| Total Ameren long-term debt issuances | | | $ | 997 | | | $ | 1,118 | | |
| Issuances of Common Stock | | | | | | |
| Ameren: | | | | | | |
DRPlus and 401(k)(b)(c) | Various | | $ | 28 | | | $ | 29 | | |
| | | | | | |
| | | | | | |
Total Ameren common stock issuances(d) | | | $ | 28 | | | $ | 29 | | |
| | | | | | |
| Maturities of Long-term Debt | | | | | | |
| Ameren Missouri: | | | | | | |
| Audrain County agreement (Audrain County CT) due 2023 | January | | $ | 240 | | (e) | $ | — | | |
| | | | | | |
| | | | | | |
| Ameren Illinois: | | | | | | |
| 0.375% First mortgage bonds due 2023 | June | | 100 | | | | |
| 2.70% Senior secured notes due 2022 | September | | — | | | 400 | |
| ATXI: | | | | | | |
| 3.43% Senior unsecured notes due 2050 | August | | — | | | 50 | |
| Total Ameren long-term debt maturities | | | $ | 340 | | | $ | 450 | | |
| | | | | | |
| | | | | | |
| | | | | | |
| | | | | | |
| | | | | | |
| | | | | | |
| | | | | | | | | | | | | | | | | | | | |
| Month Issued, Redeemed, or Matured | | 2024 | | 2023 | |
| Issuances of Long-term Debt | | | | | | |
| | | | | | |
| | | | | | |
| | | | | | |
| Ameren Missouri: | | | | | | |
| 5.25% First mortgage bonds due 2054 | January | | $ | 347 | | | $ | — | | |
| 5.45% First mortgage bonds due 2053 | March | | — | | | 499 | | |
| | | | | | |
| | | | | | |
| | | | | | |
| | | | | | |
| | | | | | |
| | | | | | |
| Total Ameren long-term debt issuances | | | $ | 347 | | | $ | 499 | | |
| Issuances of Common Stock | | | | | | |
| Ameren: | | | | | | |
DRPlus and 401(k)(a)(b) | Various | | $ | 10 | | | $ | 5 | | |
| | | | | | |
| | | | | | |
Total Ameren common stock issuances(c) | | | $ | 10 | | | $ | 5 | | |
| | | | | | |
| Maturities of Long-term Debt | | | | | | |
| Ameren Missouri: | | | | | | |
| Audrain County agreement (Audrain County CT) due 2023 | January | | $ | — | | | $ | 240 | | (d) |
| | | | | | |
| | | | | | |
| | | | | | |
| | | | | | |
| | | | | | |
| | | | | | |
| | | | | | |
| Total Ameren long-term debt maturities | | | $ | — | | | $ | 240 | | |
| | | | | | |
| | | | | | |
| | | | | | |
| | | | | | |
| | | | | | |
| | | | | | |
(a)Ameren Missouri intends to allocate an amount equal to the net proceeds to sustainability projects meeting certain eligible criteria.
(b)Ameren issued a total of 0.40.1 million and 0.40.1 million shares of common stock under its DRPlus and 401(k) plan for the ninethree months ended September 30,March 31, 2024 and 2023, and 2022, respectively.
(c)(b)Excludes a $7 million and $8$7 million receivable at September 30,March 31, 2024 and 2023, and 2022, respectively.
(d)(c)Excludes 0.50.2 million and 0.40.5 million shares of common stock valued at $37$16 million and $31$37 million issued for no cash consideration in connection with stock-based compensation for the ninethree months ended September 30,March 31, 2024 and 2023, and 2022, respectively.
(e)(d)In January 2023, Ameren Missouri and Audrain County mutually agreed to terminate a financing obligation agreement related to the CT energy center in Audrain County, which was scheduled to expire in December 2023. No cash was exchanged in connection with the termination of the agreement as the $240 million principal amount of the financing obligation due from Ameren Missouri was equal to the amount of bond service payments due to Ameren Missouri.
In April 2024, Ameren Missouri issued $500 million of 5.20% first mortgage bonds due April 2034, with interest payable semiannually on April 1 and October 1 of each year, beginning October 1, 2024. Net proceeds from this issuance were used for capital expenditures and to repay short-term debt.
In April 2024, $350 million principal amount of Ameren Missouri’s 3.50% senior secured notes matured and were repaid with cash on hand.
In April 2024, Ameren Missouri received capital contributions totaling $350 million from Ameren (parent).
See Note 4 – Long-term Debt and Equity Financings under Part I, Item 1, of this report for additional information, including proceeds from issuances of long-term debt, the use of those proceeds, Ameren’s forward equity sale agreements, and the ATM program.
Indebtedness Provisions and Other Covenants
At September 30, 2023,March 31, 2024, the Ameren Companies were in compliance with the provisions and covenants contained in their credit agreements, indentures, and articles of incorporation, as applicable, and ATXI was in compliance with the provisions and covenants contained in its note purchase agreements. See Note 3 – Short-term Debt and Liquidity under Part I, Item 1, of this report and Note 4 – Short-term Debt and Liquidity and Note 5 – Long-term Debt and Equity Financings under Part II, Item 8, of the Form 10-K for a discussion of provisions, applicable cross-default provisions, and covenants contained in our credit agreements, in ATXI’s note purchase agreements, and in certain of the Ameren Companies’ indentures and articles of incorporation.
We consider access to short-term and long-term capital and credit markets to be a significant source of funding for capital requirements not satisfied by cash provided by our operating activities. Inability to raise capital on reasonable terms, particularly during times of uncertainty in the capital and credit markets, could negatively affect our ability to maintain and expand our businesses. After assessing their respective current operating performance, liquidity, and credit ratings (see Credit Ratings below), Ameren, Ameren Missouri, and Ameren Illinois each believes that it will continue to have access to the capital and credit markets on reasonable terms. However, events beyond Ameren’s, Ameren Missouri’s, and Ameren Illinois’ control may create uncertainty in the capital and credit markets or make access to the capital and credit markets uncertain or limited. Such events could increase our cost of capital and adversely affect our ability to access the capital and credit markets.
Dividends
The amount and timing of dividends payable on Ameren’s common stock are within the sole discretion of Ameren’s board of directors. Ameren’s board of directors has not set specific targets or payout parameters when declaring common stock dividends, but it considers various factors, including Ameren’s overall payout ratio, payout ratios of our peers, projected cash flow and potential future cash flow requirements, historical earnings and cash flow, projected earnings, impacts of regulatory orders or legislation, and other key business considerations. Ameren expects its dividend payout ratio to be between 55% and 70%65% of annual earnings over the next few years.
See Note 4 – Short-term Debt and Liquidity and Note 5 – Long-term Debt and Equity Financings under Part II, Item 8, of the Form 10-K for additional discussion of covenants and provisions contained in certain of the Ameren Companies’ financial agreements and articles of incorporation that would restrict the Ameren Companies’ payment of dividends in certain circumstances. At September 30, 2023,March 31, 2024, none of these circumstances existed at Ameren, Ameren Missouri, or Ameren Illinois and, as a result, these companies were not restricted from paying dividends.
The following table presents common stock dividends declared and paid by Ameren Corporation to its common shareholders and by Ameren subsidiaries to their parent, Ameren Corporation, for the ninethree months ended September 30, 2023March 31, 2024 and 2022:2023:
| | Nine Months |
| 2023 | | 2022 |
| Three Months | | | Three Months |
| 2024 | | | 2024 | | 2023 |
| Ameren | Ameren | $ | 496 | | | $ | 457 | |
| | ATXI | ATXI | 95 | | | — | |
| | ATXI | |
| | ATXI | |
Credit Ratings
Our credit ratings affect our liquidity, our access to the capital and credit markets, our cost of borrowing under our credit facilities and our commercial paper programs, and our collateral posting requirements under commodity contracts.
The following table presents the principal credit ratings by Moody’s and S&P, as applicable, effective on the date of this report:
| | | | | | | | | | | | | | |
| | Moody’s | | S&P |
| Ameren: | | | | |
| Issuer/corporate credit rating | | Baa1 | | BBB+ |
| Senior unsecured debt | | Baa1 | | BBB |
| Commercial paper | | P-2 | | A-2 |
| Ameren Missouri: | | | | |
| Issuer/corporate credit rating | | Baa1 | | BBB+ |
| Secured debt | | A2 | | A |
| Senior unsecured debt | | Baa1 | | Not Rated |
| Commercial paper | | P-2 | | A-2 |
| Ameren Illinois: | | | | |
| Issuer/corporate credit rating | | A3 | | BBB+ |
| Secured debt | | A1 | | A |
| Senior unsecured debt | | A3 | | BBB+ |
| Commercial paper | | P-2 | | A-2 |
| ATXI: | | | | |
| Issuer credit rating | | A2 | | Not Rated |
| Senior unsecured debt | | A2 | | Not Rated |
A credit rating is not a recommendation to buy, sell, or hold securities. It should be evaluated independently of any other rating. Ratings are subject to revision or withdrawal at any time by the rating organization.
Collateral Postings
Any weakening of our credit ratings may reduce access to capital and trigger additional collateral postings and prepayments. Such changes may also increase the cost of borrowing, resulting in an adverse effect on earnings. Cash collateral postings and prepayments made with external parties, including postings related to exchange-traded contracts were immaterial and cash collateral posted by external parties were $48$55 million for Ameren and Ameren Illinois at September 30, 2023.March 31, 2024. A sub-investment-grade issuer or senior unsecured debt rating (below “Baa3” from Moody’s or below “BBB-” from S&P) at September 30, 2023,March 31, 2024, could have resulted in Ameren, Ameren Missouri, or Ameren Illinois being required to post additional collateral or other assurances for certain trade and contractual obligations amounting to $573$610 million, $515$532 million, and $58$78 million, respectively.
Changes in commodity prices could trigger additional collateral postings and prepayments. Based on credit ratings at September 30, 2023,March 31, 2024, if market prices were 15% higher or lower than September 30, 2023March 31, 2024 levels in the next 12 months and 20% higher or lower thereafter through the end of the term of the commodity contracts, then Ameren, Ameren Missouri, and Ameren Illinois could be required to post an immaterial amount, compared to each company’s liquidity, of collateral or provide other assurances for certain trade and contractual obligations.
OUTLOOK
Below are some key trends, events, and uncertainties that may reasonably affect our results of operations, financial condition, or liquidity, as well as our ability to achieve strategic and financial objectives, for 20232024 and beyond. For additional information regarding recent rate orders, lawsuits, and pending requests filed with state and federal regulatory commissions, including those discussed below, see Note 2 – Rate and Regulatory Matters under Part I, Item 1, of this report and Note 2 – Rate and Regulatory Matters under Part II, Item 8, of the Form 10-K.
Operations
•We are observing inflationary pressures on the prices of labor, services, materials, and supplies, as well as increasinghigh interest rates. Ameren Missouri and Ameren Illinois are generally allowed to pass on to customers prudently incurred costs for fuel, purchased power, and natural gas supply. Additionally, for certain non-commodity cost changes, the use of trackers, riders, formula ratemaking, and future test years, as applicable, mitigates our exposure. The inflationary pressures and increasinghigh interest rates could impact our ability to control costs and/or make substantial investments in our businesses, including our ability to recover costs and investments, and to earn our allowed ROEs within frameworks established by our regulators, while maintaining rates that are affordable to our customers. In addition, these inflationary pressures and increasinghigh interest rates could adversely affect our customers’ usage of, or payment for, our services.
•The PISA permits Ameren Missouri to defer and recover 85% of the depreciation expense for investments in qualifying property, plant, and equipment placed in service and not included in base rates. Investments not eligible for recovery under the PISA include amounts related to new nuclear and natural gas generating units and service to new customer premises. Additionally, the PISA permits Ameren Missouri to earn a return at the applicable WACC on rate base that incorporates those qualifying investments, as well as changes in total accumulated depreciation excluding retirements and plant-related deferred income taxes since the previous regulatory rate review. The regulatory asset for accumulated PISA deferrals also earns a return at the applicable WACC until added to rate base prospectively. Ameren Missouri recognizes an offset to interest charges“Interest Charges” on its consolidated statement of income for its carrying cost of debt relating to each return allowed under the PISA, with the difference between the applicable WACC and its carrying cost of debt recognized in revenues when recovery of PISA deferrals is reflected in customer rates. Approved PISA deferrals are recovered over a period of 20 years following a regulatory rate review. Additionally, under the RESRAM, Ameren Missouri is permitted to recover the 15% of depreciation expense not recovered under the PISA, and earn a return at the applicable WACC for investments in renewable generation plant placed in service to comply with Missouri’s renewable energy standard. Accumulated RESRAM deferrals earn carrying costs at short-term interest rates. The PISA and the RESRAM mitigate the effects of regulatory lag between regulatory rate reviews. Those investments not eligible for recovery under the PISA and the remaining 15% of certain property, plant, and equipment placed in service, unless eligible for recovery under the RESRAM, remain subject to regulatory lag. As a result of the PISA election, additional provisions of the law apply to Ameren Missouri, including limitations on electric customer rate increases. The rate increase approved by the June 2023 MoPSC electric rate order did not exceed the rate increase limitation applicable through 2023.Pursuant to a Missouri Senate Bill 745, whichlaw that became effective onin August 28, 2022, extended Ameren Missouri’s PISA election was extended through December 2028 and allows for an additional extension through December 2033 is allowed if requested by Ameren Missouri and approved by the MoPSC, among other things. This law also established a 2.5% annual limit on increases to the electric service revenue requirement used to set customer rates, compared to the revenue requirement established in the immediately preceding rate order, due to the inclusion of incremental PISA deferrals in the revenue requirement. The limitation will be effective for revenue requirements approved by the MoPSC after January 1, 2024, and will be based on the revenue requirement established in the immediately preceding rate order.2024.
•In June 2023, the MoPSC issued an order that resulted in an increase of $140 million to Ameren Missouri’s annual revenue requirement for electric retail service. The order increased the annualized base level of net energy costs pursuant to the FAC by approximately $40 million from the base level established in the MoPSC’s December 2021 electric rate order. The order also changed annualized depreciation, regulatory asset and liability amortization amounts, and the base level of expenses for trackers. On an annualized basis, these changes reflect approximate increases in “Depreciation and amortization” of $90 million and “Other income, net”, of $100 million, related to non-service pension and postretirement benefit income, on Ameren’s and Ameren Missouri’s consolidated statements of income. The new rates became effective on July 9, 2023. As a result of this order, Ameren Missouri expects a year-over-year increase to 2023 earnings, compared to 2022, of approximately $46 million ($11 million realized in the second quarter, $26 million realized in the third quarter, and $9 million expected in the fourth quarter) and a year-over-year increase to 2024 earnings, compared to 2023, of approximately $19$21 million ($1110 million expectedrealized in the first quarter and $8 million and $3 million expected in the second quarter)and third quarter, respectively).
Table•Ameren Missouri expects to file for an electric service regulatory rate review by the end of ContentsJuly 2024. Ameren Missouri expects key drivers of the electric service regulatory rate review to include increased infrastructure investments and other costs of service.•In 2018, the MoPSC issued an order approving Ameren Missouri’s MEEIA 2019 plan. The plan includes a portfolio of customer energy-efficiency and demand response programs through December 2024. Ameren Missouri intends to invest approximately $425$420 million over
the life of the plan, including $75 million in 2023 and $76 million in 2024. The plan includes the continued use of the MEEIA rider, which allows Ameren Missouri to collect from, or refund to, customers any difference in actual MEEIA program costs and related lost electric marginsrevenues and the amounts collected from customers. In addition, the plan includes a performance incentivesincentive that provideprovides Ameren Missouri an opportunity to earn additional revenues by achieving certain customer energy-efficiency goals. If the target program spending goals aregoal is achieved for 2023 and 2024, the performance incentivesincentive would result in revenues of $12 million in both 20232024.
•In January 2024, Ameren Missouri filed a proposed customer energy-efficiency plan with the MoPSC under the MEEIA. This filing proposed a three-year plan, which includes a portfolio of customer energy-efficiency programs, along with the continued use of the MEEIA rider discussed above. If the plan is approved, Ameren Missouri intends to invest $123 million annually in the proposed customer energy-efficiency programs from 2025 to 2027. In addition, Ameren Missouri requested performance incentives applicable to each plan year to earn revenues by achieving certain customer energy-efficiency savings and 2024.target spending goals. If 100% of the goals are achieved, Ameren Missouri would earn performance incentive revenues totaling $56 million over the three-year plan. Ameren Missouri also requested additional performance incentives applicable to each plan year totaling up to $14 million over the three-year plan, if Ameren Missouri exceeds 100% of the goals. Ameren Missouri expects a decision by the MoPSC by October 2024, but cannot predict the ultimate outcome of this regulatory proceeding.
•Ameren Illinois and ATXI use a forward-looking rate calculation with an annual revenue requirement reconciliation for each company’s electric transmission business. Based on expected rate base and the currently allowed 10.52% ROE, which includes a 50-basis-point incentive adder for participation in an RTO, the revenue requirements that will be included in 2024 rates for Ameren Illinois’ and ATXI’s electric transmission businesses are $549 million and $219$223 million, respectively. These revenue requirements represent increases in Ameren Illinois’ and ATXI’s revenue requirements of $73 million and $25$29 million, respectively, from the revenue requirements reflected in 2023 rates, primarily due to higher expected rate base. These rates will affect Ameren Illinois’ and ATXI’s cash receipts during 2024, but will not determine their respective electric transmission service operating revenues, which will instead be based on 2024 actual recoverable costs, rate base, and a return on rate base at the applicable WACC as calculated under the FERC formula ratemaking framework.
•The allowed base ROE for FERC-regulated transmission rates previously charged under the MISO tariff has been the subject of pending proceedings since 2013. Depending on the outcome of the proceedings, the transmission rates charged during previous periods and the currently effective rates may be subject to change and refund. In March 2020, the FERC issued a Notice of Proposed Rulemaking on its transmission incentives policy, which increased the incentive ROE for participation in an RTO to 100 basis points from the current 50 basis points and revised the parameters for awarding incentives, while limiting the overall incentives to a cap of 250 basis points, among other things. In April 2021, the FERC issued a Supplemental Notice of Proposed Rulemaking, which proposesproposed to modify the Notice of Proposed Rulemaking’s incentive for participation in an RTO by limiting this incentive for utilities that join an RTO to 50 basis points and only allowing them to earn the incentive for three years, among other things. If this proposal is included in a final rule, Ameren Illinois and ATXI would no longer be eligible for the 50 basis point RTO incentive adder, prospectively. The FERC is under no deadline to issue a final rule on this matter. Ameren is unable to predict the ultimate impact of any changes to the FERC’s incentives policy, or any further order on base ROE. A 50-basis-point change in the FERC-allowed ROE would affect Ameren’s and Ameren Illinois’ annual net income by an estimated $14$16 million and $10$11 million, respectively, based on each company’s 20232024 projected rate base.
•Ameren Illinois’ electric distribution service performance-based formula ratemaking framework under the IEIMA allows Ameren Illinois to reconcile electric distribution service rates to its actual revenue requirement on an annual basis to reflect actual recoverable costs incurred and a return at the applicable WACC on year-end rate base through 2023. If a given year’s revenue requirement varies from the amount collected from customers, an adjustment is made to electric operating revenues with an offset to a regulatory asset or liability to reflect that year’s actual revenue requirement, independent of actual sales volumes. The regulatory balance is then collected from, or refunded to, customers within two years from the end of the year. Pursuant to December 2022 and March 2021 ICC orders, Ameren Illinois used the current IEIMA formula framework to establish annual customerelectric distribution service rates effective through 2023, and will reconcilereconciled the related revenue requirement for customer rates established for 2023. As such, Ameren Illinois’ 2023 revenues will reflectreflected actual recoverable costs, year-end rate base, and a return at the applicable WACC, with the ROE component based on the annual average of the monthly yields of the 30-year United States Treasury bonds plus 580 basis points. By law, the decoupling provisions extend beyond the end of existing performance-based formula ratemaking,2023, which ensures that Ameren Illinois’ electric distribution revenues authorized in a regulatory rate review are not affected by changes in sales volumes. In April 2023,2024, Ameren Illinois filed for a reconciliation adjustment to its 20222023 electric distribution service revenue requirement with the ICC. In November 2023, Ameren Illinois filed a revised reconciliation adjustment,ICC, requesting recovery of $117$160 million. An ICC decision in this proceeding is required by December 2023,2024, and any approved adjustment would be collected from customers in 2024.2025. This is the final revenue requirement reconciliation under the IEIMA formula framework.
•Pursuant to the IETL,CEJA, which was enacted in September 2021, Ameren Illinois may file an MYRP with the ICC to establish base rates for electric distribution service to be charged to customers for each calendar year of a four-year period. The base rates for a particular calendar year are based on forecasted recoverable costs and an ICC-determined ROE applied to Ameren Illinois’ forecasted average annual rate base using a forecasted capital structure, with a common equity ratio of up to 50% being deemed prudent and reasonable by law and a higher equity ratio requiring specific ICC approval. The ROE determined by the ICC for each calendar year of the four-year period is subject to annual adjustments based on certain performance incentives and penalties. An MYRP allows Ameren Illinois to reconcile electric distribution service rates to its actual revenue requirement on an annual basis, subject to a reconciliation cap and adjustments to the ROE. Under the MYRP discussed below, Ameren Illinois’ 2024 electric distribution service revenues will be based on its 2024 actual recoverable costs, 2024 year-end rate base, and an ROE of 8.72%, as adjusted for any performance incentives or penalties, provided the actual revenue requirement does not exceed the reconciliation cap. If a given year’s revenue amount collected
from customers varies from the approved revenue requirement, an adjustment would beis made to electric operating revenues with an offset to a regulatory asset or liability to reflect that year’s actual revenue requirement, independent of actual sales volumes. The regulatory balance wouldis then be collected from, or refunded to, customers within two years from the end of the applicable annual period. Ameren Illinois’ existing riders will remain effective under the MYRP discussed below, and will continue to remain effective beyond 2027 whether it elects to file an MYRP or a traditional regulatory
rate review. Additionally, electric distribution service revenues continue to be decoupled from sales volumes under either election.
•In JanuaryDecember 2023, the ICC issued an order in Ameren Illinois filed anIllinois' MYRP with the ICC. In September 2023, Ameren Illinois filed a revised MYRP requesting approval of forecastedproceeding, approving revenue requirements for electric distribution service for 2024, 2025, 2026, and 2027 of $1,289$1,162 million, $1,385$1,210 million, $1,480$1,242 million, and $1,556$1,255 million, respectively. PursuantThese revenue requirements were established under an alternative methodology which used Ameren Illinois’ previously approved 2022 year-end rate base since the order rejected the Grid Plan that was filed by Ameren Illinois as a part of the MYRP proceeding. In March 2024, pursuant to the order, Ameren Illinois filed a revised Grid Plan and a request to update the associated MYRP revenue requirements for 2024, 2025, 2026, and 2027 of $1,207 million, $1,286 million, $1,371 million, and $1,433 million, respectively. An ICC decision on the revised Grid Plan and updated revenue requirements is expected by December 2024 with rates effective in January 2025. The 2022 year-end rate base will remain in effect through 2027 unless subsequently changed by the ICC in the rehearing discussed below or if approval of a revised Grid Plan results in an update of each year’s revenue requirement. The approved revenue requirements in the ICC’s December 2023 order represent a cumulative four-year increase of $142 million compared to a provision undercumulative increase of $321 million requested by Ameren Illinois in its March 2024 revised MYRP. In January 2024, the IETL that permits initial rate increases under an MYRPICC partially denied a rehearing requested by Ameren Illinois to be phasedrevise the allowed ROE in the December 2023 order and granted Ameren Illinois’ filing proposesrehearing request to defer 50%consider whether it is appropriate to use the 2022 year-end rate base for each year of the requestedMYRP and to include a base level of investments to maintain grid reliability in each year of the MYRP. Additionally, the scope of the rehearing includes a review of certain operations and maintenance expenses in each year of the MYRP. In February 2024, rate increaseAmeren Illinois filed its request in the rehearing proceeding, and subsequently updated the request in April 2024, proposing an updated 2024 revenue requirement of $177 million as a regulatory asset to be collected from customers in 2026. That regulatory asset would earn a return at the applicable WACC.$1,213 million. An ICC decision in thisthe rehearing proceeding is requiredexpected by December 2023,late June 2024, with new rates effective startingJuly 2024. Also, in January 2024.2024, Ameren Illinois filed an appeal of the December 2023 ICC order and the partial denial of Ameren Illinois’ request for rehearing to the Illinois Appellate Court for the Fifth Judicial District. The court is under no deadline to address the appeal. Ameren Illinois cannot predict the levelultimate outcome of any electric distribution service rate changethe revised Grid Plan filing, its request to update the associated MYRP revenue requirements for 2024 through 2027, the rehearing proceeding, or the appeal to the Illinois Appellate Court for the Fifth Judicial District. Ameren Illinois has taken prudent steps to align its 2024 operations with the ICC may approve, or whether any rate change that may eventually be approved will be sufficient for Ameren Illinoisorder, while continuing to recover its costsensure safe and adequate service is maintained. This includes reductions to the extent those costs are subject to and exceed the MYRP reconciliation cap and earn a reasonable return on its investments when the rate change goes into effect. If the rates approved by the ICC are materially different from its forecasted spend, Ameren Illinois may adjust its overall spending, both operating and capital.
•In December 2022, the ICC issued an order in Ameren Illinois’ annual update filing that approved a $61 million increase in Ameren Illinois’ electric distribution service rates beginning in January 2023. Ameren Illinois’ 2023 electric distribution service revenues will be based on its 2023 actual recoverable costs, 2023 year-end rate base,capital expenditure and a return at the applicable WACC, with the ROE component based on the annual average of the monthly yields of the 30-year United States Treasury bonds plus 580 basis points. As of September 30, 2023, Ameren Illinois expects its 2023 electric distribution year-end rate base to be $4.2 billion. The 2023 revenue requirement reconciliation adjustment will be collected from, or refunded to, customers in 2025. A 50-basis-point change in the annual average of the monthly yields of the 30-year United States Treasury bonds would result in an estimated $12 million change in Ameren’soperations and Ameren Illinois’ annual net income, based on Ameren Illinois’ 2023 projected year-end rate base, including electric energy-efficiency investments. Ameren Illinois’ recognized ROE for the first nine months of 2023 was based on an annual average of the monthly yields of the 30-year United States Treasury bonds of 4.05%.maintenance expense plans.
•Pursuant to Illinois law, Ameren Illinois’ electric energy-efficiency investments are deferred as a regulatory asset and earn a return at the applicable WACC, with the ROE component based on the annual average of the monthly yields of the 30-year United States Treasury bonds plus 580 basis points. The allowed ROE on electric energy-efficiency investments can be increased or decreased by up to 200 basis points, depending on the achievement of annual energy savings goals. While the ICC has approved a plan for Ameren Illinois to invest approximately $120 million per year in electric energy-efficiency programs through 2025, the ICC has the ability to reduce the amount of electric energy-efficiency savings goals in future program years if there are insufficient cost-effective programs available, which could reduce the investments in electric energy-efficiency programs. The electric energy-efficiency program investments and the return on those investments are collected from customers through a rider and are not recovered through the electric distribution service performance-based formula ratemaking framework.rider.
•In November 2023, the ICC issued an order in Ameren Illinois’ January 2023 Ameren Illinois filed a request with the ICC seeking approvalnatural gas delivery service regulatory rate review, which resulted in an increase to increase its annual revenues for natural gas delivery service.service of $112 million. The new rates became effective on November 28, 2023. In OctoberDecember 2023, Ameren Illinois filed a revised request seekingfor rehearing with the ICC to increase its annual revenues by $140revise the approved ROE and capital structure common equity percentage, and reverse an approximately $93 million which includes an estimated $77 millionreduction of annual revenues that would otherwise be recovered under riders.planned distribution and transmission capital investments included in the order, among other things. In an attempt to reduce regulatory lag,January 2024, the ICC denied Ameren Illinois’ rehearing request. Subsequently, in January 2024, Ameren Illinois used a 2024 future test year in this proceeding. A decision byfiled an appeal of the ICC in this proceeding is required by late November 2023 with new rates expectedICC order and the January 2024 ICC denial of Ameren Illinois’ request for rehearing to be effective by early December 2023.the Illinois Appellate Court for the Fifth Judicial District. The court is under no deadline to address the appeal. Ameren Illinois cannot predict the levelultimate outcome of any delivery service rate changethis appeal. Ameren Illinois has taken prudent steps to align its 2024 operations with the ICC may approve, nor whether any rate change that may eventually be approved will be sufficientorder, while continuing to enableensure safe and adequate service is maintained. This includes reductions to Ameren Illinois to recover its costsIllinois’ capital expenditure and to earn a reasonable return on investments when the rate changes go into effect. Without legislative action, the QIP will expire after December 2023.operations and maintenance expense plans.
•In May 2023, the MISO released the results of its April 2023 capacity auction, which included capacity price decreases in the central region of the MISO footprint, where Ameren Missouri’s and Ameren Illinois’ service territories are located. Capacity prices decreased from $237 per MW-day for June 2022 through May 2023 pursuant to the April 2022 capacity auction to seasonal prices ranging from $2 to $15 per MW-day for June 2023 through May 2024. Based on estimated power prices and customer demand as of September 30, 2023, the capacity prices set by the April 2023 MISO auction, and the amounts of energy and capacity hedged through IPA procurement events, Ameren Illinois estimates a decrease to purchased power costs for calendar year 2023, compared to 2022, of approximately $100 million. The actual decrease to purchased power costs will vary due to differences between estimated and realized power prices as well as customer demand satisfied by Ameren Illinois, which will be affected by changes in customers’ elections to use Ameren Illinois or an alternative retail electric supplier for their energy needs. Because of the power procurement riders, the difference between actual purchased power costs and costs billed to customers in a given period is deferred as a regulatory asset or liability. These pass-through costs do not affect Ameren Illinois’ net income, as any change in costs are offset by a corresponding change in revenues. Also, largely due to the capacity price set by the April 2023 MISO auction, Ameren Missouri estimates decreases to capacity revenues and purchased power costs for the calendar year 2023, compared to 2022, of approximately $100 million. Ameren Missouri sells nearly all of its capacity to the MISO and purchases the capacity it needs to supply its native load sales from the MISO. Capacity revenues and purchased power costs are a part of the net energy costs recoverable under the FAC, with 95% of the variance between net energy costs and the amount set in base rates recovered or refunded through the FAC.
•The fall 2023next refueling and maintenance outage at Ameren Missouri’sits Callaway Energy Center was completed in November. The next refueling and maintenance outageenergy center is scheduled for the spring of 2025. During a scheduled refueling, which occurs every 18 months, maintenance expenses are deferred as a regulatory asset and amortized until the completion of the next refueling and maintenance outage. During an outage, depending on the availability of its other generation sources and the market prices for power, Ameren Missouri’s purchased power costs may increase and the amount of excess power available for sale may decrease versus non-outage years. Changes in purchased power costs and excess power available for sale are included in the FAC, which results in limited impacts to earnings. In addition, Ameren Missouri may incur increased non-nuclear energy center maintenance costs in non-outage years.
•In September 2023, the United States District Court for the Eastern District of Missouri granted Ameren Missouri’s request to modify a September 2019 remedy order issued by the district court in order to allow the retirement of the Rush Island Energy Center in advance of its previously expected useful liferetirement date of 2039, in lieu of installing a flue gas desulfurization system. In its amended remedy order, the district court established an October 15, 2024 retirement date to allow for the completion of various transmission reliability projects and, in the interim, authorized Ameren Missouri to operate the energy center only as needed and as directed by the MISO. The MISO designated the energy centerRush Island Energy Center as a system support resource in 2022 and concluded that certain reliability mitigation measures, including transmission upgrades, should occur before the energy center is retired. The Rush Island Energy Center began operating as a system support resource on September 1, 2022. In 2023, the MISO extended the system support resource designation through August 2024, and in September 2023, an agreement between Ameren Missouri and the MISO was approved by the FERC that results in the Rush Island Energy Center only operating during peak demand times and emergencies. The system support resource designation and the related agreement are subject to annual renewal and revision. Construction activities are underway for the transmission upgrades approved by the MISO, with the majority of the upgrades expected to be completed in the fall of 2024. Ameren Missouri expects to complete the last of the upgrades by mid-2025. The United States Department of Justice is seeking an order from the district court providing for additional mitigation relief related to prior emissions. Ameren Missouri contends that the retirement of the Rush Island Energy Center, which eliminates all future emissions from the energy center, mitigates claims relating to prior emissions. In March 2024, the district court ordered Ameren Missouri and the United States Department of Justice to file proposed draft orders outlining additional mitigation relief. In May 2024, Ameren Missouri filed a proposed draft order that includes retiring the Rush Island Energy Center, a program to provide electric buses and charging stations to schools in the metro St. Louis area, a program to provide air filters to eligible Ameren Missouri electric residential customers, and the retirement of SO2 allowances. Excluding the accelerated retirement of the Rush Island Energy Center, these programs are estimated to cost approximately $20 million . Also in May 2024, the United States Department of Justice filed a proposed draft order that includes a program to provide electric buses and charging stations to schools in the metro St. Louis area and a program to provide air filters to eligible Ameren Missouri electric residential customers. These programs include a significantly greater number of buses, charging stations, and air filters than Ameren Missouri’s proposal and the United States Department of Justice estimates these programs would cost approximately $120 million. As of March 31, 2024, Ameren and Ameren Missouri recorded a $20 million liability related to the cost of potential additional mitigation, which represents the estimated minimum liability, as no other amount within the range was a better estimate. The district court is expected to hold a hearing in mid-2024 and an order is expected in the second half of 2024. Depending on the scope and basis of the order, Ameren Missouri or the United States Department of Justice could appeal any additional mitigation relief ordered. For additional information on the NSR and Clean Air Act litigation, see Note 9 – Commitments and Contingencies under Part I, Item 1, of this report. In February 2022, the MoPSC issued an order directing the MoPSC staff to review Ameren Missouri’s planned accelerated retirement of the Rush Island Energy Center. In Ameren Missouri’s last electric service regulatory rate review, the MoPSC staff recommended a lower rate base for the Rush Island Energy Center claiming imprudent actions by Ameren Missouri. While the nonunanimous stipulation and agreement approved in that regulatory rate review by the June 2023 MoPSC electric rate order did not specify any rate base disallowance, it did not preclude parties to the agreement from raising issues regarding the prudence of Ameren Missouri’s actions and decisions with regard to the energy center in future proceedings. As part of the assessment of any potential future abandonment loss, consideration will be given to rate and securitization orders issued by the MoPSC to Ameren Missouri and to orders issued to other Missouri utilities with similar facts. See below for information regarding Ameren Missouri’s petition filed with the MoPSC requesting the securitization of costs associated with the planned accelerated retirement of the Rush Island Energy Center.
•Pursuant to Illinois law, Ameren Missouri’sMissouri's natural gas-fired energy centers in Illinois are subject to annual limits on emissions, including CO2 and NOx, equal to their unit-specific average annual emissions from 2018 through 2020, for any rolling twelve-month period through 2029.. Further reductions to emissions limits will become effective between 2030 and 2040, resulting in the closure of the Venice Energy Center by the end of 2029. The reductions could also limit the operations of Ameren Missouri’sMissouri's four other four natural gas-fired energy centers located in the state of Illinois, and will result in their closure by 2040. These energy centers are utilized to support peak loads. Subject to certain conditions in the CEJA, these energy centers may be allowed to exceed the emissions limits in order to maintain reliability of electric utility service.
•Ameren Missouri and Ameren Illinois continue to make infrastructure investments and expect to seek increases to electric and natural gas rates to recover the cost of investments and earn an adequate return. Ameren Missouri and Ameren Illinois will also seek new, or to maintain existing, regulatory and legislative solutions to address regulatory lag and to support investment in their utility infrastructure for the benefit of their customers. Ameren Missouri and Ameren Illinois continue to face cost recovery pressures, including limited economic growth in their service territories, increasing inflation, higher cost of debt, customer conservation efforts, the impacts of additional customer energy-efficiency programs, and increased customer use of increasingly cost-effective advancements in innovative energy technologies, including private generation and energy storage. However, over the long-term, we expect the decreased demand to be partially offset by increased demand resulting from increased electrification of the economy, including in the transportation sector, and as a means to address economy-wide CO2 emission concerns. In addition, several entities are considering either locating or expanding their operations within our service territories. We expect that increased investments, including expected future investments for environmental compliance, system reliability improvements, and new generation sources, will result in rate base and revenue growth but also higher depreciation and financing costs.
Liquidity and Capital Resources
•In September 2023, Ameren Missouri filed its 2023 IRP with the MoPSC. The 2023 IRPMoPSC, which includes Ameren Missouri’s preferred plan for meeting customers’ projected long-term energy needs in a manner that maintains system reliability and customer affordability while transitioning to clean energy generation in an environmentally responsible manner. In connection with this plan, Ameren is continuing to target net-zeronet-
zero carbon emissions by 2045, as well as a 60% reduction by 2030 and an 85% reduction by 2040 based on 2005 levels. Ameren’s goals include both reduction of direct emissions from operations (scope 1), as well as electricity usage at Ameren buildings (scope 2), including other greenhouse gas emissions of methane, nitrous oxide, and sulfur hexafluoride. Achieving these goals will be dependent on a variety of factors, including cost-effective advancements in innovative clean energy technologies and constructive federal and state energy and economic policies. The 2023 IRPpreferred plan includes, among other things, the following:
•adding an 800-MW natural gas-fired simple-cycle energy center by 2027 and an additional 1,200-MW natural gas-fired combined-cycle energy center by 2033;
•adding 2,800 MWs of renewable generation by 2030, which includes the solar generation projectsfacilities discussed below, and an additional 1,900 MWs by 2036;
•adding 400 MWs of battery storage by 2030 and an additional 400 MWs by 2035;
•adding 1,200 MWs of other clean dispatchable generation resources by 2040 and an additional 1,200 MWs by 2043;
•retiring all of Ameren Missouri’s coal-fired energy centers by 2042;
•accelerating the retirement date of the Rush Island coal-fired energy center from 2025 to 2024;
•extending the retirement date of the Sioux coal-fired energy center from 2030 to 2032 to ensure reliability during the transition to clean energy generation, which is subject to the approval of a change in depreciable lives of the energy center’s assets by the MoPSC;
•retiring all1,800 MWs of Ameren Missouri’s coal-fired energy centers by 2042 and 1,800 MWs of natural gas-fired energy centers by 2040;2040 to comply with Illinois law;
•the continued implementation of customer energy-efficiency and demand response programs; and
•the expectation that Ameren Missouri will seek and receive NRC approval for an extension of the operating license for the Callaway Energy Center beyond its current 2044 expiration date.
Expected capital expenditures through 2028 related to the facilities discussed above are included in Ameren’s and Ameren Missouri’s expected capital investments discussed below. Ameren Missouri’s plan could be affected by, among other factors: Ameren Missouri’s ability to obtain CCNs from the MoPSC, and any other required approvals for the addition of renewable resources or natural gas-fired simple- or combined- cycle generation, retirement of energy centers, and new or continued customer energy-efficiency programs; the ability to enter into agreements for renewable or natural gas-fired simple- or combined-cycle generation and acquire or construct that generation at a reasonable cost; the ability of suppliers, contractors, and developers to meet contractual commitments and timely complete projects, which is dependent upon the availability of necessary labor, materials, and equipment, geopolitical conflict, or government actions, among other things; changes in the scope and timing of projects; the ability to qualify for, and use or transfer, federal production or investment tax credits; the cost of wind, solar, and other renewable generation and battery storage technologies; the cost of natural gas or hydrogen CT technologies; the ability to maintain system reliability during and after the transition to clean energy generation; new and/or changes in environmental regulations, including those related to CO2 and other greenhouse gas emissions; energy prices and demand; Ameren Missouri’s ability to obtain necessary rights-of-way, easements, and transmission interconnection agreements at an acceptable cost and in a timely fashion; the inabilityability to earn an adequate return on invested capital; and the ability to raise capital on reasonable terms. The next integrated resource plan is expected to be filed in September 2026.
•Pursuant to Missouri law, allowsin November 2023, Ameren Missouri electric utility companies to petitionpetitioned the MoPSC for a financing order to authorize the issuance of securitized utility tariff bonds to finance $519 million of costs related to the cost of retiring electric generation facilities before the end of their useful lives. In connection with theplanned accelerated retirement of the Rush Island Energy Center, due towhich includes the NSR and Clean Air Act Litigation discussed above, Ameren Missouri expects to seek approval from the MoPSC in 2023, to finance the costs associated with the retirement, including theexpected remaining unrecovered net plant balance associated with the facility, among other costs. Ameren Missouri requested to collect the amounts necessary to repay the bonds over approximately 15 years from the date of bond issuance. In March 2024, the MoPSC staff filed an updated response to Ameren Missouri’s petition that stated Ameren Missouri’s decision to accelerate the retirement of the Rush Island Energy Center was prudent and recommended that $497 million of costs be financed through securitized utility tariff bonds. However, the MoPSC staff claimed Ameren Missouri’s prior actions that resulted in the adverse ruling in the NSR and Clean Air Act Litigation discussed in Note 9 – Commitments and Contingencies under Part I, Item 1, of this report, were imprudent and recommended that the impact of those actions on customers be considered in future regulatory proceedings. In February 2024, the MoOPC filed a response to Ameren Missouri’s petition that opposes the issuance of securitized utility tariff bonds. If Ameren Missouri is not allowed to recover Rush Island Energy Center costs through securitization or if future regulatory proceedings result in revenue reductions based on Ameren Missouri’s prior actions that resulted in the adverse ruling in the NSR and Clean Air Act litigation, it could have a material adverse effect on the results of operations, financial position, and liquidity of Ameren and Ameren Missouri. Ameren Missouri expects a decision by the MoPSC by the end of June 2024, but cannot predict the ultimate outcome of this regulatory proceeding.
•During 2022 and 2023, Ameren Missouri, and certain subsidiaries of Ameren Missouri, entered into agreements to acquire and/or construct various solar generation facilities, with various regulatory approvals pending. All of the solar generation facilities are aligned with the 2023 IRP discussed above, and expected capital expenditures related to these facilities are included in Ameren’s and Ameren Missouri’s expected capital investments discussed below.
•Ameren Missouri’sMissouri's 2023 IRP targets cleaner and more diverse sources of energy generation, including solar generation. While rights to
acquire build-transfer solar facilities and supplies for development-transfer and self-build solar facilities discussed above were secured through agreements, supply chain disruptions, including solar panel shortages and increasing material costs as a result of government tariffs and other factors, could affect the costs, as well as the timing, of these projects and other solar generation projects. The supply of solar panel components to the United States was significantly disrupted as a result of an investigation conducted by the United States Department of Commerce that concluded in August 2023 and could result in significant tariffs on solar panel components imported from four Southeast Asian countries. The investigation was in response to a petition, which allegedfound that Chinese solar manufacturers shifted solar panel component manufacturing to these countries to avoid tariffs imposed on imports from China. In August 2023, the United States Department of Commerce issued a final determination, finding that all exporters and producers of solar panel components from the four Southeast Asian countries, with a fewseveral exceptions, have been circumventing tariffs imposed on imports from China. As a result of the final determination,investigation, importers and exporters may avoid the imposition of increased tariffs by certifyingsubmit certain certifications to the United States Department of Commerce thatto avoid the entryimposition of solar panel components into the United States are not subject to the investigation or that they fall within the scope of the 24-month waiver of tariffs discussed below.increased tariffs. Failure to submit the applicable certifications, or denial of the submitted certifications by the United States Department of Commerce, could result in increased tariffs on solar panel components that were subject to the investigation and entered the United States on or after April 1, 2022. Additionally, certain solar panel components from China have been subject to detention by the United States Customs and Border Protection Agency as a result of the Uyghur Forced Labor Prevention Act that became effective in June 2022. Also, in June 2022, President Biden authorized the United States Department of Energy to use the Defense Production Act to rapidly expand American manufacturing of five critical clean energy technologies, including solar panel components. President Biden also took executive action to temporarily lift certain tariffs on solar
panel components imported from the four Southeast Asian countries investigated by the United States Department of Commerce for 24 months in order to allow the United States access to a sufficient supply of solar panel components to meet electricity generation needs while domestic manufacturing scales up.components. Any future tariffs or actions by the United States Customs and Border Protection Agency could affect the cost and the availability of solar panel components and the timing and amount of Ameren Missouri’sMissouri's estimated capital expenditures associated with solar generation investments.
•Through 2027,2028, we expect to make significant capital expenditures to improve our electric and natural gas utility infrastructure, with a major portion directed to our transmission and distribution systems. We estimate that we will invest up to $20.5$22.8 billion (Ameren Missouri – up to $10.8$13.5 billion; Ameren Illinois – up to $9.5$7.6 billion; ATXI – up to $0.2$1.7 billion) of capital expenditures during the period from 20232024 through 2027. These planned investments are based on the assumption of continued constructive regulatory frameworks.2028. Ameren’s and Ameren Missouri’s estimates include $2.5$3.3 billion of renewable generation investments and $2.7 billion of dispatchable generation investments through 20272028, consistent with investments outlined in Ameren Missouri’s 2023 IRP. Ameren’s estimate also includes $0.8 billionand Ameren Illinois’ estimates include investments necessary to meet compliance requirements of capital expenditures through 2027the CEJA, while continuing to ensure safe and adequate service is maintained. Ameren Illinois’ estimates may be revised as a result of future ICC orders related to projects assigned to Ameren pursuant to the first tranche of projects under the MISO’s long-range transmission planning roadmap discussed below.its current MYRP.
•In 2021, the MISO issued a report outlining a preliminary long-range transmission planning roadmap of projects through 2039, which considers the rapidly changing generation mix within MISO resulting from significant additions of renewable generation, actual and expected generation plant closures, and state mandates or goals for clean energy or carbon emissions reductions. In July 2022, the MISO approved the first tranche of projects under the first phase of the roadmap. A portion of these projects were assigned to various utilities, of which Ameren was awarded projects that are estimated to cost approximately $1.8 billion, based on the MISO’s cost estimate. Related to these projects, Ameren expects to beginbegan substation upgrades in May 2024 in advance of transmission line construction, which is expected to begin in 2026, with forecasted completion dates near the end of this decade. In October2022 and 2023, the FERC approved transmission rate incentives relating to the projects assigned to Ameren. The incentives will allow construction work in progress to be included in rate base for projects constructed by ATXI, thereby improving the timeliness of cash recovery, and would allow recovery of prudently incurred costs, subject to FERC approval, for any portion of the projects if they are abandoned for reasons beyond the control of Ameren. The MISO initiated requests for proposals for additionalfirst tranche competitive bid projects. In October and November 2023, two first tranche competitive bid projects in December 2022, June 2023,were awarded to ATXI and July 2023, with proposals due in May 2023, November 2023, and October 2023, respectively.represent a total estimated investment of approximately $0.1 billion. In October 2023, one ofApril 2024, the competitive bid projectsremaining first tranche competitive-bid project was awarded to ATXI and represents an estimated investment of approximately $0.1$0.3 billion. TheATXI will own 51% of the assets associated with the projects awarded in October 2023 and April 2024, and the remaining competitive-bid49% of the assets will be owned by an unaffiliated entity. In February 2024, Ameren Illinois and ATXI filed a request for a CCN, among other things, with the ICC related to the portion of the MISO long-range transmission projects are estimateddiscussed above that will be constructed within the ICC’s jurisdiction. A decision by the MISO to cost approximately $0.6 billion and areICC is expected to be awarded by mid-2024.mid-2025. In November 2022,March 2024, the MISO released plans forpreliminarily identified a second tranche of projects and began the processwith estimated costs of identifying a list of projects for consideration under this tranche. Ameren expects$17 billion to $23 billion based on MISO’s cost estimate. The MISO is expected to approve the second tranche of projects to be approved in the first halfthird quarter of 2024. In July 2022, a group of industrial customers filed a complaint with the FERC, challenging provisions of a MISO tariff that exclude regional transmission projects from the MISO’s competitive bid process based on state laws related to the right of first refusal, which provide an incumbent utility the right to build, maintain, and own transmission lines located within its service territory. The complaint seeks to require MISO to revise its tariff to prohibit the application of state laws related to the right of first refusal in the MISO’s long-range transmission planning and require projects to be bid on a competitive basis, to the maximum extent possible. It also is asking for refunds related to any costs under the tariff that would not comply with the sought-after revisions. The FERC is under no deadline to issue an order in this proceeding.
•In July 2022, an Illinois law prohibiting the state’s oversight of certain electric utilities’ choice of RTO membership ceased to be effective. Given the change in law and the high prices resulting from MISO’s April 2022 capacity auction, the ICC issued an order requiring Ameren Illinois to perform a cost-benefit study of continued participation in the MISO compared to participation in PJM Interconnection LLC, another RTO. In July 2023, Ameren Illinois filed its cost-benefit study with the ICC. The cost-benefit study examined the impacts of participation in each RTO, including reliability, resiliency, affordability, and environmental impacts, among other things, for a period of five to 10 years, beginning June 2024. The study concluded that continued participation in the MISO was prudent and more cost-beneficial than participation in PJM Interconnection LLC. The ICC is under no obligation to issue an order related to the cost-benefit study.
•Environmental regulations, including those related to CO2 emissions, or other actions taken by the EPA or state regulators, or requirements that may result from the NSR and Clean Air Act Litigation, could result in significant increases in capital expenditures and operating costs. Regulations can be reviewed and repealed, and replacement or alternative regulations can be proposed or adopted by the current federal administration, including the EPA. See Note 9 – Commitments and Contingencies under Part I, Item 1, of this report, for additional information on environmental matters, including the NSR and Clean Air Act litigation. The ultimate implementation of any of these new regulations, as well as the timing of any such implementation, is uncertain. However, the individual or combined effects of existing and new environmental regulations could result in significant capital expenditures, increased operating costs, or the closure or alteration of some of Ameren Missouri’s coal and natural gas-fired energy centers. Ameren Missouri’s operating costs and capital expenditures are subject to MoPSC prudence reviews, which could result in cost disallowances, as well as regulatory lag. The cost of Ameren Illinois’ purchased power and natural gas purchased for resale could increase. However, Ameren Illinois expects that these costs would be recovered from customers with no material adverse effect on its results of operations, financial position, or liquidity. Ameren’s and Ameren Missouri’s
earnings could benefit from increased investment to comply with environmental regulations if those investments are reflected and recovered on a timely basis in customer rates.
•The Ameren Companies have multiyear credit agreements that cumulatively provide $2.6 billion of credit through December 2027, subject to a 364-day repayment term for Ameren Missouri and Ameren Illinois, with the option to seek incremental commitments to increase the cumulative credit provided to $3.2 billion. See Note 3 – Short-term Debt and Liquidity under Part I, Item 1, of this report and
Note 4 – Short-term Debt and Liquidity under Part II, Item 8, in the Form 10-K for additional information regarding the Credit Agreements. See Note 5 – Long-term Debt and Equity Financings under Part II, Item 8, in the Form 10-K for long-term debt maturities from 20232024 to 20272028 and beyond at Ameren (parent), Ameren Missouri, Ameren Illinois, and ATXI. See Note 4 – Long-term Debt and Equity Financings under Part I, Item 1, of this report for outstanding forward sale agreements under the ATM and issuances and maturities of long-term debt in 20232024 through the date of this report. The use of cash provided by operating activities and short-term borrowings to fund capital expenditures and other long-term investments at the Ameren Companies frequently results in a working capital deficit, defined as current liabilities exceeding current assets, as was the case at September 30, 2023,March 31, 2024, for Ameren, Ameren Missouri, and Ameren Illinois. Ameren, Ameren Missouri, and Ameren Illinois each believe that their liquidity is adequate given their respective expected operating cash flows, capital expenditures, and financing plans, and expect to continue to have access to the capital and credit markets on reasonable terms when needed. However, there can be no assurance that significant changes in economic conditions, disruptions in the capital and credit markets, or other unforeseen events will not materially affect their ability to execute their expected operating, capital, or financing plans.
•Ameren expects its cash used for currently planned capital expenditures and dividends to exceed cash provided by operating activities over the next several years. As part of its funding plan for capital expenditures, Ameren is using newly issued shares of common stock to satisfy requirements under the DRPlus and employee benefit plans and expects to continue to do so through at least 2027. Ameren expects these equity issuances to total about $100 million annually.2028. Additionally, Ameren has an ATM program under which Ameren may offer and sell from time to time common stock, which includes the ability to enter into forward sales agreements, subject to market conditions and other factors. As of September 30, 2023,March 31, 2024, Ameren had multiple forward sale agreements that could be settled under the ATM program with various counterparties relating to 4.32.9 million shares of common stock. Ameren expects to settle approximately $300$230 million of the forward sale agreements with physical delivery of 3.22.9 million shares of common stock by December 31, 2023. In addition to2024. Including issuances under the DRPlus and employee benefit plans, Ameren plans to issue approximately $500$300 million of equity in 2024 and approximately $600 million of equity each year from 20242025 to 2027.2028. As of September 30, 2023,March 31, 2024, Ameren had approximately $910$770 million of common stock available for sale under the ATM program, which takes into account the forward sale agreements in effect as of September 30, 2023. In the long-term,March 31, 2024. Ameren expects its equity to total capitalization to be about 45%, with the intent to support solid investment-grade credit ratings. Ameren Missouri and Ameren Illinois expect to fund cash flow needs through debt issuances, adjustments of dividends to Ameren (parent), and/or capital contributions from Ameren (parent).
•The IRA was enacted in August 2022, and includes various income tax provisions, among other things. The law extends federal production and investment tax credits for projects beginning construction through 2024 and allows for a 10% adder to the production and investment tax credits for siting projects at existing energy communities as defined in the law, which includes sites previously used for coal-fired generation. The law also creates clean energy tax credits for projects placed in service after 2024. The clean energy tax credits will apply to renewable energy production and investments, along with certain nuclear energy production, and will be phased out beginning in 2033, at the earliest. The phase-out is triggered when greenhouse gas emissions from the electric generation industry are reduced by at least 75% from the annual 2022 emission rate or at the beginning of 2033, whichever is later. The law allows for transferability to an unrelated party for cash of up to 100% of certain tax credits generated after 2022. In addition, the new law imposes a 15% minimum tax on adjusted financial statement income, as defined in the law, for corporations whose average annual adjusted financial statement income exceeds $1 billion for three consecutive preceding tax years effective for tax years beginning after December 31, 2022. Once a corporation exceeds this three-year average annual adjusted financial statement income threshold, it will be subject to the minimum tax for all future tax years. Additional regulations, interpretations, amendments, or technical corrections to or in connection with the IRA have been and are expected to be issued by the IRS or United States Department of Treasury, which may impact the timing of when the 15% minimum tax becomes applicable for Ameren as discussed below.
•Pursuant to the IRA discussed above, Ameren expects to transfer production tax credits generated by Ameren Missouri’s High Prairie Renewable and Atchison Renewable energy centers, as well as the solar facilities included in Ameren Missouri’s 2023 IRP discussed above, to unrelated parties from 2024 to 2028.
•In April 2023, the IRS issued guidance providing a safe harbor method of accounting for the capitalization or deduction of certain expenditures to maintain, repair, replace, or improve natural gas distribution property. The safe harbor method of accounting may be implemented in the first, second, or third taxable year ending after May 1, 2023. Ameren is currently evaluating the potential impact of this guidance, including the timing of adoption.
•As of September 30, 2023,March 31, 2024, Ameren had $193$180 million in tax benefits from federal and state income tax credit carryforwards, and $35$42 million in tax benefits from federal and state net operating loss carryforwards, and $39 million in tax overpayments, refunds, and receivables, which will be utilized in future periods. Future expected income tax payments are based on expected taxable income, available income tax credit and net operating loss carryforwards, and current tax law. Expected taxable income is affected by expected capital expenditures, when property, plant, and equipment is placed in-service or retired, and the timing of regulatory reviews, among other things. Ameren expects federal income tax payments at
the required minimum levels from 2023 to 2027 resulting from the anticipated use of existing production tax credits generated by Ameren Missouri’s High Prairie Renewable and Atchison Renewable energy centers, existing income tax credit and net operating loss carryforwards, and outstanding refunds. Based on its preliminary calculations, Ameren does not expect to be subject to the 15% minimum tax on adjusted financial statement income imposed by the IRA in 2023 and 2024.through 2028. Ameren expects annual federal income tax payments including payments related to the 15% minimum tax pursuant to the IRA, to be immaterial through 2027.2028.
The above items could have a material impact on our results of operations, financial position, and liquidity. Additionally, in the ordinary course of business, we evaluate strategies to enhance our results of operations, financial position, and liquidity. These strategies may include acquisitions, divestitures, opportunities to reduce costs or increase revenues, and other strategic initiatives to increase Ameren’s shareholder value. We are unable to predict which, if any, of these initiatives will be executed. The execution of these initiatives may have a material impact on our future results of operations, financial position, or liquidity.
REGULATORY MATTERS
See Note 2 – Rate and Regulatory Matters under Part I, Item 1, of this report.
ITEM 3. QUANTITATIVE AND QUALITATIVE DISCLOSURES ABOUT MARKET RISK.
There have been no material changes to the quantitative and qualitative disclosures about interest rate risk, credit risk, commodity price risk, investment price risk, and commodity supplier risk included in the Form 10-K, except as discussed below. See Item 7A under Part II of the Form 10-K for a more detailed discussion of our market risk.
Ameren Missouri received a planned delivery of enriched uranium from a Russian supplier in the spring of 2023. The planned delivery concluded the nuclear fuel supply agreement with this Russian supplier with no future deliveries planned with any Russian suppliers. Ameren Missouri has sufficient inventory and supply contracts with non-Russian suppliers that adequately meet all of the nuclear fuel needs of the Callaway Energy Center through the 2026 refueling reload.
ITEM 4. CONTROLS AND PROCEDURES.
(a)Evaluation of Disclosure Controls and Procedures
As of September 30, 2023,March 31, 2024, evaluations were performed under the supervision and with the participation of management, including the principal executive officer and the principal financial officer of each of the Ameren Companies, of the effectiveness of the design and operation of such registrant’s disclosure controls and procedures (as defined in Rules 13a-15(e) and 15d-15(e) of the Exchange Act). Based on those evaluations, as of September 30, 2023,March 31, 2024, the principal executive officer and the principal financial officer of each of the Ameren Companies concluded that such disclosure controls and procedures are effective to provide assurance that information required to be disclosed in such registrant’s reports filed or submitted under the Exchange Act is recorded, processed, summarized, and reported within the time periods specified in the SEC’s rules and forms and such information is accumulated and communicated to its management, including its principal executive officer and its principal financial officer, to allow timely decisions regarding required disclosure.
(b)Changes in Internal Controls over Financial Reporting
During the third quarterThere has been no change in any of 2023, the Ameren Companies implemented new financial systems, including an enterprise resource planning system and an enterprise performance management system. The systems replaced existing systems and are primarily used for financial reporting processes and certain operational activities. In connection with the implementations, we modified the design and implementation of certain internal control processes and procedures. We will continue to evaluate and monitor the internal controls over our financial reporting process, including monitoring the operating effectiveness of related key controls.
Other than with respect to the implementations noted above, there were no other changes in the Ameren Companies'Companies’ internal control over financial reporting during their most recent fiscal quarter that havehas materially affected, or areis reasonably likely to materially affect, each of their internal controlscontrol over financial reporting.
PART II. OTHER INFORMATION
ITEM 1. LEGAL PROCEEDINGS.
We are involved in legal and administrative proceedings before various courts and agencies with respect to matters that arise in the ordinary course of business, some of which involve substantial amounts of money. We believe that the final disposition of these proceedings, except as otherwise disclosed in this report, will not have a material adverse effect on our results of operations, financial position, or liquidity.
Risk of loss is mitigated, in some cases, by insurance or contractual or statutory indemnification. We believe that we have established appropriate reserves for potential losses. For additional information on material legal and administrative proceedings, see Note 2 – Rate and Regulatory Matters, Note 9 – Commitments and Contingencies, and Note 10 – Callaway Energy Center, under Part I, Item 1, of this report. Pursuant to Item 103(c)(3)(iii) of Regulation S-K, our policy is to disclose environmental proceedings to which a governmental entity is a party if we reasonably believe such proceedings will result in monetary sanctions of $1 million or more. ITEM 1A. RISK FACTORS.
There have been no material changes to the risk factors disclosed in Part I, Item 1A, Risk Factors in the Form 10-K.
ITEM 2. UNREGISTERED SALES OF EQUITY SECURITIES AND USE OF PROCEEDS, AND ISSUER PURCHASES OF EQUITY SECURITIES.PROCEEDS.
Ameren Corporation, Ameren Missouri, and Ameren Illinois did not purchase equity securities reportable under Item 703 of Regulation S-K during the period from JulyJanuary 1, 2023,2024, to September 30, 2023.March 31, 2024.
ITEM 5. OTHER INFORMATION.
Insider Adoption or Termination of Trading Arrangements
During the fiscal quarter ended September 30, 2023,March 31, 2024, none of our directors or officers informed us of the adoption or termination of a “Rule 10b5-1 trading arrangement” or “non-Rule 10b5-1 trading arrangement,” as those terms are defined in Regulation S-K, Item 408, except as follows:
On August 23, 2023, Martin J. Lyons, Jr., then President and Chief Executive Officer of Ameren, adopted a Rule 10b5-1 trading arrangement. Mr. Lyons' Rule 10b5-1 trading arrangement provides for the sale of 50% of any net shares of Ameren common stock received, after tax withholding, in connection with certain previously awarded restricted stock units and performance share units that will vest upon payment in March 2024 and March 2025. The estimated maximum number of shares to be sold pursuant to the Rule 10b5-1 trading arrangement is 40,775 shares. The actual number of shares sold pursuant to the Rule 10b5-1 trading arrangement will depend on the actual number of shares earned pursuant to the awards, which is generally dependent on the Company's achievement of certain performance measures, the actual dividends paid by the Company during the applicable vesting periods, and Mr. Lyons' continued employment and individual performance during the applicable vesting periods. Mr. Lyons' Rule 10b5-1 trading arrangement will terminate on the earlier of: (i) March 31, 2025; (ii) execution of all trades or expiration of all orders relating to such trades under the Rule 10b5-1 trading arrangement; or (iii) such date as the Rule 10b5-1 trading arrangement is otherwise terminated according to its terms.408.
ITEM 6. EXHIBITS.
The documents listed below are being filed or have previously been filed on behalf of the Ameren Companies and are incorporated herein by reference from the documents indicated and made a part hereof. Exhibits not identified as previously filed are filed herewith.
| | | | | | | | | | | | | | | | | | | | |
Exhibit
Designation | | Registrant(s) | | Nature of Exhibit | | Previously Filed as Exhibit to: |
|
| | | | | | |
| Instruments Defining Rights of Security Holders, Including Indentures |
| 4.1 | | Ameren Ameren Missouri | | | | January 9, 2024 Form 8-K, Exhibit 4.2, File No. 1-14756 |
| 4.2 | | Ameren Ameren Missouri | | | | April 4, 2024 Form 8-K, Exhibit 4.2, File No. 1-14756 |
| Rule 13a-14(a) / 15d-14(a) Certifications |
| 31.1 | | Ameren | | | | |
| 31.2 | | Ameren | | | | |
| 31.3 | | Ameren Missouri | | | | |
| 31.4 | | Ameren Missouri | | | | |
| 31.5 | | Ameren Illinois | | | | |
| 31.6 | | Ameren Illinois | | | | |
| Section 1350 Certifications |
| 32.1 | | Ameren | | | | |
| 32.2 | | Ameren Missouri | | | | |
| 32.3 | | Ameren Illinois | | | | |
| Interactive Data Files |
| 101.INS | | Ameren Companies | | Inline XBRL Instance Document - the instance document does not appear in the Interactive Data File because its XBRL tags are embedded within the Inline XBRL document | | |
| 101.SCH | | Ameren Companies | | Inline XBRL Taxonomy Extension Schema Document | | |
| 101.CAL | | Ameren Companies | | Inline XBRL Taxonomy Extension Calculation Linkbase Document | | |
| 101.LAB | | Ameren Companies | | Inline XBRL Taxonomy Extension Label Linkbase Document | | |
| 101.PRE | | Ameren Companies | | Inline XBRL Taxonomy Extension Presentation Linkbase Document | | |
| 101.DEF | | Ameren Companies | | Inline XBRL Taxonomy Extension Definition Document | | |
| 104 | | Ameren Companies | | Cover Page Interactive Data File (formatted as Inline XBRL and contained in Exhibit 101) | | |
The file number references for the Ameren Companies’ filings with the SEC are: Ameren, 1-14756; Ameren Missouri, 1-2967; and Ameren Illinois, 1-3672.
Each registrant hereby undertakes to furnish to the SEC upon request a copy of any long-term debt instrument not listed above that such registrant has not filed as an exhibit pursuant to the exemption provided by Item 601(b)(4)(iii)(A) of Regulation S-K.
SIGNATURES
Pursuant to the requirements of the Exchange Act, each registrant has duly caused this report to be signed on its behalf by the undersigned thereunto duly authorized. The signature for each undersigned company shall be deemed to relate only to matters having reference to such company or its subsidiaries.
| | |
|
AMEREN CORPORATION
(Registrant) |
|
| /s/ Michael L. Moehn |
Michael L. Moehn
Senior Executive Vice President and Chief Financial Officer
(Principal Financial Officer)
|
|
|
UNION ELECTRIC COMPANY
(Registrant) |
|
| /s/ Michael L. Moehn |
Michael L. Moehn
Senior Executive Vice President and Chief Financial Officer
(Principal Financial Officer)
|
|
|
AMEREN ILLINOIS COMPANY
(Registrant) |
|
| /s/ Michael L. Moehn |
Michael L. Moehn
Senior Executive Vice President and Chief Financial Officer
(Principal Financial Officer)
|
Date: November 9, 2023May 6, 2024